United States
Securities and Exchange Commission
Washington, D.C. 20549
Form N-CSR
Certified Shareholder Report of Registered Management Investment Companies
811-4017
(Investment Company Act File Number)
Federated Equity Funds
_______________________________________________________________
(Exact Name of Registrant as Specified in Charter)
Federated Investors Funds
4000 Ericsson Drive
Warrendale, Pennsylvania 15086-7561
(Address of Principal Executive Offices)
(412) 288-1900
(Registrant's Telephone Number)
John W. McGonigle, Esquire
Federated Investors Tower
1001 Liberty Avenue
Pittsburgh, Pennsylvania 15222-3779
(Name and Address of Agent for Service)
(Notices should be sent to the Agent for Service)
Date of Fiscal Year End: 11/30/15
Date of Reporting Period: 11/30/15
Item 1. Reports to Stockholders

Annual Shareholder Report
November 30, 2015
| Share Class | Ticker |
| Institutional | FGLEX |
Federated Emerging Markets Equity Fund
A Portfolio of Federated Equity Funds
Not FDIC Insured • May Lose Value • No Bank Guarantee
CONTENTS
| 1 |
| 7 |
| 9 |
| 16 |
| 17 |
| 18 |
| 19 |
| 20 |
| 31 |
| 32 |
| 33 |
| 39 |
| 45 |
| 45 |
Management's Discussion of Fund Performance (unaudited)
The total return of the Federated Emerging Markets Equity Fund (the “Fund”), based on net asset value for the 12-month reporting period ended November 30, 2015, was -18.66% for the Institutional Shares. The return of the Fund's benchmark, the Morgan Stanley Capital International Emerging Markets Index (MSCI EM),1 a broad-based securities market index, was -16.99% for the same period. The Fund's total return for the most recently completed fiscal year reflected actual cash flows, transaction costs and other expenses which were not reflected in the total return of the MSCI EM Index.
During the reporting period, the Fund's investment strategy focused on: (a) country allocation; (b) stock selection; and (c) currency allocation. These were the most significant factors affecting the performance relative to the MSCI EM Index.
The following discussion will focus on the performance of the Fund's Institutional Shares.
MARKET OVERVIEW
Global equity markets2 performance was mixed over the reporting period as regional divergence caused large currency moves which impacted overall performance for investors. Outside the U.S., central banks in Canada, Europe and Japan maintained aggressively loose monetary policies in an effort to fight deflation and support economic growth. Meanwhile in the U.S., a stronger economy increased expectations for the first Federal Reserve interest rate hike in almost a decade. The anticipated divergence in global monetary policy drove up the value of the U.S. dollar relative to other major world currencies. Over the reporting period, developed markets, as measured by MSCI EAFE Index,3 rose 6.74% in local terms, but fell for U.S. dollar-based investors -2.94% due to the strong U.S. dollar. Emerging markets4 declined over the reporting period as China's slowing economy and a decline in commodity prices negatively impacted the outlook for global growth. As measured by MSCI EM, emerging markets returned -7.11% in local terms and -16.99% for U.S. dollar-based investors.
The European equity market, as measured by MSCI AC Europe Index,5 returned 6.42% in local terms and -5.26% for U.S. dollar-based investors. Throughout the reporting period, aggressively loose monetary policy by the European Central Bank (ECB) and a weaker euro improved the outlook for economic growth for 2015 and 2016. Despite the mid-year political crisis in Greece, the sovereign debt crisis in the euro area continued to recede as the major economies of Spain and Italy returned to higher growth and lower unemployment. Furthermore, as government budgets have improved and bond yields declined, the impact of fiscal austerity has diminished. As the reporting period ended, the ECB cut deposit rates to a record low -0.30% and extended
Annual Shareholder Report
its 1.1 trillion euro asset purchase program into 2017. Despite geopolitical turmoil (tragic acts of terrorism and a massive influx of refugees), domestic demand in Europe continued to improve, helped by record low interest rates, lower energy costs and a relatively weaker currency.
While the major developed markets were growing modestly, there were signs of a deceleration and slowing trade in several emerging markets. After a decade of double-digit growth driven by fixed asset investment and a mercantilist dependence on global trade, the Chinese government's decision to transform to a more consumption-based economy has slowed the pace of growth. While in the long-term, this economic rebalancing is positive, in the near-term, it has resulted in slower Chinese economic activity and reduced the global demand for fixed assets and commodities. Countries whose economies benefitted from commodity exports to China, such as Russia and Brazil, are now expecting recessions. The volatility of the local Chinese A-share market and the government's sudden weakening of the Chinese yuan in August has fueled worries about economic stability. After a strong start to the reporting period, Chinese equities, as measured by MSCI China,6 returned -5.53%. As with most developed economies, many emerging market central banks continue to ease monetary conditions by cutting interest rates and adding liquidity. For example, the People's Bank of China continues to ease monetary policy using multiple measures to stimulate the economy such as cutting the benchmark one-year lending rate the fifth time since November 2014 and lowering the reserve requirement for banks by 0.50%.
China economic weakness impacted South Korea, which experienced an overall drop in total exports for the first time in six years. In Taiwan, weaker exports to China were offset by stronger domestic demand amid a stable job market and rising household incomes. During the reporting period, the MSCI Taiwan and MSCI South Korea returned -12.96% and -7.21%, respectively, in U.S. dollar terms.7 An economic bright spot for the emerging markets was South East Asia. Solid domestic demand drove recoveries in India, Indonesia, and Thailand, which were also boosted by more responsible monetary and fiscal policies, and renewed political stability. Despite positive economic and reform progress, the stock markets and currencies declined during the reporting period amid a broad sell-off in emerging market assets.
In Latin America, the outlook for Brazil and Mexico remained divergent. Brazil continued to be mired in an environment of stagflation, where growth is declining while inflation is rising. For 2015, GDP expectations for Brazil have declined from 0.8% a year ago to -3.0% currently. In contrast, Mexico's economy remained stable with an improving domestic economy bolstered by foreign direct investment (FDI) and solid exports to the U.S. Mexican real GDP is expected to be 2.3% for 2015 and improve to 2.8% next year. As measured by MSCI Brazil and MSCI Mexico, stocks in Brazil and Mexico fell -45.10% and -16.75%, respectively.7
Annual Shareholder Report
For the reporting period, the MSCI USA Index (2.10%) outperformed both the MSCI EAFE Index (-2.94%) and MSCI Emerging Markets Index (-16.99%). Broadly across the world, there was a wide divergence amongst country returns. Within emerging markets, the depreciation of currencies was a major contributor to returns and no major market had positive returns. The top performers were the ones with the strongest currencies: MSCI China (-5.53%), MSCI South Korea (-7.21%) and MSCI Philippines (-7.41%). Laggards in the emerging markets were MSCI Brazil (-45.10%), MSCI Colombia (-46.42%) and MSCI Greece (-67.93%).
FUND PERFORMANCE
Country allocation remained a key driver of performance for the reporting period, as it consistently has in the past. The Fund maintained exposure to select healthy, high-sovereign-quality, emerging markets.
Fund performance was positively impacted by positioning in Latin America. Brazil, as earlier noted, was one of the worst performing equity markets during the period. The Fund's underweight in Brazilian companies' positively impacted relative returns. In Mexico, consumer demand was supported by strong labor market growth, a pick-up in export manufacturing and stable inflation. During the period, retailer Wal-Mart de Mexico SAB (29.32%) and restaurant group Alsea SAB de CV (24.58%) added positively to Fund performance. In addition, the Fund's zero allocation to Colombia helped performance as the market was down -46.42% as measured by MSCI Colombia.7
In Central & Eastern Europe, results were mixed. In Austria and Hungary, stocks benefitted from an improvement in the regional economy. The Fund's investments in the region that had the biggest impact on performance were building materials company Wienerberger AG (11.53%) and regional bank Erste Group Bank AG (18.92%). Elsewhere in Eastern Europe, the Fund's small allocation to Poland detracted from performance as the market broadly sold off after elections in October. While cheaper energy prices helped several economies in Western and Central Europe, energy exporter Russia was negatively impacted by a fall in oil prices. In addition, continued tensions between Russia and Ukraine added to economic instability. Russia's equity market rose 12.77% in local terms but returned -10.86% for U.S. investors as the ruble continued to weaken. Despite the asset price volatility in Russia, the Fund's underweight to Russian equities detracted from performance. In Turkey, the reporting period began with an improvement in the economic outlook as inflation stabilized and the central bank cut rates. However, over the summer, with a failed election, political instability weighed on the market. The Fund's overweight position to Turkey contributed negatively to performance.
Across Asia, contributions from the Fund's positioning were also mixed. The Fund's zero allocation to Malaysia contributed positively to performance, as the country was the worst performing market in the region, as measured by MSCI Malaysia (-25.50%). Overall, the contribution to returns from China was
Annual Shareholder Report
negative as the Fund's underweight during the reporting period hurt performance. However, stock picking in China yielded several of the top contributors as Internet companies Netease Com Inc. (59.85%) and Tencent Holdings Ltd. (24.76%) rallied despite the economic slowdown. In South Korea and Taiwan, the markets outperformed despite the slowdown in China and in overall exports. The Fund had a positive impact due to overweight positioning in Taiwan, but a negative impact due to an underweight positioning in South Korea. Despite the tailwinds of a fast growing economy, cheaper oil and structural reforms, stock picking in India contributed negatively to performance during the reporting period as holdings in Tata Motors Ltd. (-30.86%) and ICICI Bank Ltd. (-28.30%) underperformed.
During the reporting period, the Fund invested in currency forwards for hedging purposes.8 The overall net returns of the currency forward positions contributed positively to performance. Positive contribution came from our short euro (versus the U.S. dollar) and short South African rand (versus the U.S. dollar) while a long position in the Russian ruble (versus the. U.S. dollar) contributed negatively.
| 1 | Please see the footnotes to the line graphs under “Fund Performance and Growth of a $10,000 Investment” below for the definition of, and more information about, the MSCI EM. |
| 2 | International investing involves special risks including currency risk, increased volatility of foreign securities, political risks and differences in auditing and other financial standards. International small company stocks may be less liquid and subject to greater price volatility than international large company stocks. |
| 3 | The MSCI EAFE Index is an equity index which captures large-and mid-cap representation across developed markets countries around the world, excluding the United States and Canada. With 906 constituents, the index covers approximately 85% of the free float-adjusted market capitalization in each country. The index is unmanaged, and it is not possible to invest directly in an index. |
| 4 | Prices of emerging markets securities can be significantly more volatile than the prices of securities in developed countries, and currency risk and political risks are accentuated in emerging markets. |
| 5 | The MSCI AC Europe Index captures large- and mid-cap representation across 15 developed market countries and 6 emerging market countries in Europe. The index covers approximately 85% of the free float-adjusted market capitalization in each country. The index is unmanaged, and it is not possible to invest directly in an index. |
| 6 | The MSCI China Index captures large- and mid-cap representation across China H shares, B shares, Red chips and P chips. The index covers about 85% of this China equity universe. The index is unmanaged, and it is not possible to invest directly in an index. |
| 7 | The MSCI country indexes are designed to measure the performance of the large- and mid-cap segments of the respective country's market. The index covers approximately 85% of the free float-adjusted market capitalization in each country. The index is unmanaged, and it is not possible to invest directly in an index. |
| 8 | The Fund's use of derivative instruments, such as currency forwards, involves risks different from, or possibly greater than, the risks associated with investing directly in securities or other traditional instruments. |
Annual Shareholder Report
FUND PERFORMANCE AND GROWTH OF A $10,000 INVESTMENT
The graph below illustrates the hypothetical investment of $10,0001 in the Federated Emerging Markets Equity Fund (Institutional Shares) from December 3, 2010 (start of performance) to November 30, 2015, as compared to the MSCI Emerging Markets Index (MSCI EM).2 The Average Annual Total Return table below shows returns for Institutional Shares over the stated periods.
Growth of a $10,000 Investment
Growth of $10,000 as of November 30, 2015
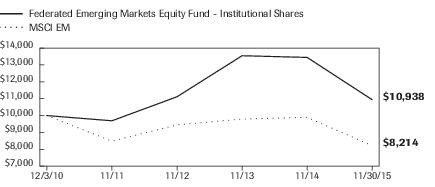
| Federated Emerging Markets Equity Fund - | Institutional Shares | NA | MSCI EM |
| F | NA | I |
| 12/3/2010 | 10,000 | | 10,000 |
| 11/30/2011 | 9,691 | | 8,483 |
| 11/30/2012 | 11,115 | | 9,446 |
| 11/30/2013 | 13,549 | | 9,792 |
| 11/30/2014 | 13,448 | | 9,895 |
| 11/30/2015 | 10,938 | | 8,214 |
41 graphic description end -->
Average Annual Total Returns for the Period Ended 11/30/2015
| | 1 Year | Start of
Performance* |
| Institutional Shares | -18.66% | 1.81% |
| MSCI EM | -16.99% | -3.87% |
| * | The Fund's Institutional Shares commenced operations on 12/3/2010. |
| | |
Performance data quoted represents past performance which is no guarantee of future results. Investment return and principal value will fluctuate so that an investor's shares, when redeemed, may be worth more or less than their original cost. Mutual fund performance changes over time and current performance may be lower or higher than what is stated. For current to the most recent month-end performance and after-tax returns, visit FederatedInvestors.com or call 1-800-341-7400. Returns shown do not reflect the deduction of taxes that a shareholder would pay on Fund distributions or the redemption of Fund shares. Mutual funds are not obligations of or guaranteed by any bank and are not federally insured.
Annual Shareholder Report
| 1 | Represents a hypothetical investment of $10,000 in the Fund. The Fund's performance assumes the reinvestment of all dividends and distributions. The MSCI EM and the MSCI ACWI have been adjusted to reflect reinvestment of dividends on securities in the indexes. |
| 2 | The MSCI EM Index captures large- and mid-cap representation across 23 emerging markets countries. The index covers approximately 85% of the free float-adjusted market capitalization in each country. The index is not adjusted to reflect sales loads, expenses and other fees that the Securities and Exchange Commission (SEC) requires to be reflected in the Fund's performance. The index is unmanaged and, unlike the Fund, is not affected by cash flows. It is not possible to invest directly in an index. |
Annual Shareholder Report
Portfolio of Investments Summary Tables (unaudited)
At November 30, 2015, the Fund's portfolio composition1 was as follows:
| Country | Percentage of
Total Net Assets |
| China | 15.7% |
| India | 11.4% |
| Thailand | 7.9% |
| Mexico | 6.8% |
| Philippines | 6.2% |
| Brazil | 6.1% |
| Austria | 5.3% |
| South Korea | 4.4% |
| Russia | 4.1% |
| South Africa | 3.8% |
| Taiwan | 3.3% |
| United Arab Emirates | 3.1% |
| Other2 | 4.5% |
| Other Security Types3 | 1.5% |
| Cash Equivalents4 | 14.6% |
| Derivative Contracts5 | 0.0%6 |
| Other Assets and Liabilities—Net7 | 1.3% |
| TOTAL | 100.0% |
| 1 | Country allocations are based primarily on the country in which a company is incorporated. However, the Fund's Adviser may allocate a company to a country based on other factors such as location of the company's principal office, the location of the principal trading market for the company's securities or the country where a majority of the company's revenues are derived. |
| 2 | For purposes of this table, country classification constitute 78.1% of the Fund's total net assets. Remaining countries have been aggregated under the designation “Other.” |
| 3 | Other Security Types consists of a Warrant and Exchange-Traded Funds. |
| 4 | Cash Equivalents include any investments in money market mutual funds and/or overnight repurchase agreements. |
| 5 | Based upon net unrealized appreciation (depreciation) or value of the derivative contracts as applicable. Derivative contracts may consist of futures, forwards, options and swaps. The impact of a derivative contract on the Fund's performance may be larger than its unrealized appreciation (depreciation) or value may indicate. In many cases, the notional value or amount of a derivative contract may provide a better indication of the contract's significance to the portfolio. More complete information regarding the Fund's direct investments in derivative contracts, including unrealized appreciation (depreciation), value and notional values or amounts of such contracts, can be found in the table at the end of the Portfolio of Investments included in this Report. |
| 6 | Represents less than 0.1%. |
| 7 | Assets, other than investments in securities and derivative contracts, less liabilities. See Statement of Assets and Liabilities. |
Annual Shareholder Report
At November 30, 2015, the Fund's sector classification composition8 was as follows:
| Sector Classification | Percentage of
Total Net Assets |
| Financials | 31.3% |
| Information Technology | 11.9% |
| Consumer Staples | 8.7% |
| Industrials | 6.9% |
| Consumer Discretionary | 6.5% |
| Energy | 5.7% |
| Health Care | 3.4% |
| Telecommunication Services | 2.8% |
| Materials | 2.7% |
| Utilities | 2.7% |
| Other Security Types3 | 1.5% |
| Cash Equivalents4 | 14.6% |
| Derivative Contracts5 | 0.0%6 |
| Other Assets and Liabilities—Net7 | 1.3% |
| TOTAL | 100.0% |
| 8 | Except for Derivative Contracts, Cash Equivalents and Other Assets and Liabilities, sector classifications are based upon, and individual securities are assigned to, the classifications of the Global Industry Classification Standard (GICS) except that the Adviser assigns a classification to securities not classified by the GICS and to securities for which the Adviser does not have access to the classification made by the GICS. |
Annual Shareholder Report
Portfolio of Investments
November 30, 2015
| Shares | | | Value in
U.S. Dollars |
| | | COMMON STOCKS—82.6% | |
| | | Austria—5.3% | |
| 8,450 | | Erste Group Bank AG | $259,071 |
| 3,300 | | OMV AG | 94,150 |
| 14,300 | | UNIQA Versicherungen AG | 126,893 |
| 3,600 | | Va Stahl AG | 117,055 |
| 10,000 | | Wienerberger Baustoffindustrie AG | 175,532 |
| | | TOTAL | 772,701 |
| | | Brazil—6.1% | |
| 36,200 | | AMBEV SA, ADR | 172,674 |
| 20,720 | | Banco Bradesco SA, ADR | 111,059 |
| 14,800 | | BB Seguridade Participacoes SA | 99,343 |
| 4,600 | 1 | BRF-Brasil Foods SA | 65,439 |
| 9,000 | | CETIP SA-Mercados Organizado | 85,604 |
| 3,840 | | Cielo S.A. | 34,847 |
| 17,277 | | Itau Unibanco Holding SA, ADR | 122,321 |
| 16,500 | | Kroton Educacional SA | 39,448 |
| 18,000 | | Lojas Renner SA | 81,416 |
| 6,900 | | Petroleo Brasileiro SA, ADR | 26,703 |
| 5,000 | | Raia Drogasil SA | 51,241 |
| | | TOTAL | 890,095 |
| | | China—15.7% | |
| 3,000 | 1 | 21Vianet Group, Inc., ADR | 62,490 |
| 500 | 1 | Alibaba Group Holding Ltd., ADR | 42,040 |
| 800 | 1 | Baidu, Inc., ADR | 174,376 |
| 133,000 | | Beijing Capital International Airport Co. Ltd. | 147,889 |
| 46,000 | | Brilliance China Automotive Holdings Ltd. | 58,364 |
| 340,000 | | China Construction Bank Corp. | 233,178 |
| 40,000 | | China Merchants Bank Co. Ltd. | 93,766 |
| 2,100 | | China Mobile Ltd., ADR | 120,687 |
| 40,000 | | China Overseas Land & Investment Ltd. | 132,453 |
| 13,333 | 1 | China Overseas Property Holdings Ltd. | 2,562 |
| 475 | | CNOOC Ltd., ADR | 52,654 |
| 71,700 | | Great Wall Motor Company Ltd. | 89,437 |
| 90,000 | | Huaneng Power International, Inc. | 77,866 |
| 1,400 | | NetEase, Inc., ADR | 233,324 |
Annual Shareholder Report
| Shares | | | Value in
U.S. Dollars |
| | | COMMON STOCKS—continued | |
| | | China—continued | |
| 14,500 | | New China Life Insurance Co. Ltd. | $60,426 |
| 600 | | PetroChina Co. Ltd., ADR | 42,726 |
| 20,000 | | Ping An Insurance (Group) Co. of China Ltd. | 109,115 |
| 58,400 | | Sinopharm Group Co. Ltd. | 244,719 |
| 14,700 | | Tencent Holdings Ltd. | 292,622 |
| | | TOTAL | 2,270,694 |
| | | Czech Republic—2.1% | |
| 1,700 | | CEZ AS | 30,886 |
| 1,320 | | Komercni Banka A.S. | 267,985 |
| | | TOTAL | 298,871 |
| | | Hungary—2.1% | |
| 2,000 | | MOL Magyar Olaj-es Gazipari RT | 91,635 |
| 10,100 | | OTP Bank RT | 208,269 |
| | | TOTAL | 299,904 |
| | | India—11.4% | |
| 5,000 | 2 | Axis Bank Ltd., GDR | 176,072 |
| 2,700 | | Dr. Reddy's Laboratories Ltd., ADR | 126,468 |
| 2,500 | 2 | Gail India Ltd., GDR | 81,898 |
| 25,500 | | ICICI Bank Ltd., ADR | 211,905 |
| 17,050 | | Infosys Ltd., ADR | 284,394 |
| 7,450 | 2 | Larsen & Toubro Ltd., GDR | 152,604 |
| 7,100 | 2,3 | Reliance Industries Ltd., GDR | 202,324 |
| 4,000 | 1,2 | State Bank of India, GDR | 148,475 |
| 5,169 | | Tata Motors Ltd., ADR | 163,185 |
| 3,500 | 1 | WNS Holdings Ltd., ADR | 107,625 |
| | | TOTAL | 1,654,950 |
| | | Mexico—6.8% | |
| 41,000 | 1 | Alsea de Mexico SAB de CV | 146,211 |
| 13,700 | | Fibra Uno Administracion SA | 31,940 |
| 1,300 | | Fomento Economico Mexicano, SA de CV, ADR | 125,294 |
| 900 | | Grupo Aeroportuario del Sureste SAB de CV, Class B, ADR | 135,918 |
| 25,400 | | Grupo Financiero Banorte SA de CV | 136,206 |
| 40,000 | | Grupo LaLa Sab De CV | 96,005 |
| 12,000 | | Infraestructura Energetica Nova, S.A.B. de C.V | 52,572 |
| 20,000 | | Nuevo Grupo Mexico SA, Class B | 43,660 |
| 80,000 | | Wal-Mart de Mexico SAB de CV | 212,616 |
| | | TOTAL | 980,422 |
Annual Shareholder Report
| Shares | | | Value in
U.S. Dollars |
| | | COMMON STOCKS—continued | |
| | | Philippines—6.2% | |
| 11,000 | | Ayala Corp. | $173,189 |
| 125,000 | | Ayala Land, Inc. | 89,640 |
| 1,600 | | Globe Telecom, Inc. | 67,762 |
| 102,000 | | JG Summit Holdings, Inc. | 152,984 |
| 10,000 | | Jollibee Foods Corp. | 42,611 |
| 60,000 | | Metro Bank and Trust Co. | 102,425 |
| 400,000 | | Metro Pacific Corp. | 44,408 |
| 325,000 | | SM Prime Holdings, Inc. | 147,965 |
| 19,000 | | Universal Robina Corp. | 81,275 |
| | | TOTAL | 902,259 |
| | | Poland—0.3% | |
| 500 | 1 | Bank Rozwoju Eksportu S.A. | 37,115 |
| | | Russia—4.1% | |
| 18,000 | | Gazprom OAO, ADR | 74,089 |
| 3,800 | | JSC MMC Norilsk Nickel, ADR | 51,110 |
| 1,200 | | LUKOIL, ADR | 45,936 |
| 1,200 | 2 | Magnit, GDR | 57,758 |
| 600 | 2 | NovaTek OAO, GDR | 56,028 |
| 1,200 | 1 | QIWI PLC, ADR | 22,908 |
| 15,000 | 2 | Rosneft Oil Co., GDR | 60,162 |
| 21,000 | | Sberbank of Russia, ADR | 140,910 |
| 17,500 | 2 | VTB Bank OJSC, GDR | 37,264 |
| 1,900 | 1,2 | X5 Retail Group NV, GDR | 42,943 |
| | | TOTAL | 589,108 |
| | | South Africa—3.8% | |
| 1,500 | | Aspen Pharmacare Holdings Ltd. | 32,421 |
| 14,500 | | AVI Ltd. | 82,468 |
| 40,000 | | FirstRand Ltd. | 130,042 |
| 4,200 | | Mr. Price Group Ltd. | 58,324 |
| 500 | | Naspers Ltd., Class N | 74,473 |
| 2,000 | | Nedbank Group Ltd. | 29,174 |
| 25,300 | | RMB Holdings Ltd. | 106,796 |
| 6,000 | 4 | Steinhoff International Holdings NV | 35,130 |
| | | TOTAL | 548,828 |
| | | South Korea—4.4% | |
| 375 | | Hyundai Motor Co. | 47,544 |
| 923 | | Kia Motors Corp. | 41,703 |
Annual Shareholder Report
| Shares | | | Value in
U.S. Dollars |
| | | COMMON STOCKS—continued | |
| | | South Korea—continued | |
| 3,350 | | Korea Electric Power Corp. | $141,679 |
| 179 | | Samsung Electronics Co. Ltd. | 198,170 |
| 1,800 | | Shinhan Financial Group Co. Ltd., ADR | 64,980 |
| 1,200 | | SK Hynix, Inc. | 32,753 |
| 4,700 | | SK Telecom Co. Ltd., ADR | 104,716 |
| | | TOTAL | 631,545 |
| | | Taiwan—3.3% | |
| 3,000 | | Catcher Technology Co. Ltd. | 28,954 |
| 13,000 | | Chunghwa Telecom Co. Ltd. | 39,751 |
| 127,165 | | First Financial Holding Co. Ltd. | 59,172 |
| 23,820 | | Hon Hai Precision Industry Co. Ltd. | 61,182 |
| 25,000 | | Nan Ya Plastics Corp. | 44,807 |
| 10,000 | | Pegatron Corp. | 26,295 |
| 14,000 | | Pou Chen Corp. | 18,591 |
| 28,000 | | Taiwan Semiconductor Manufacturing Co. Ltd. | 120,223 |
| 23,200 | | Uni-President Enterprises Corp. | 38,247 |
| 48,000 | | United Microelectronics Corp. | 17,390 |
| 59,180 | | Yuanta Financial Holding Co. Ltd. | 22,355 |
| | | TOTAL | 476,967 |
| | | Thailand—7.9% | |
| 12,900 | | Advanced Info Service Public Co. Ltd., GDR | 71,722 |
| 12,800 | | Airports of Thailand Public Co. Ltd., GDR | 110,974 |
| 167,200 | | Bangkok Dusit Medical Services Public Co. Ltd., GDR | 94,812 |
| 78,400 | | Central Pattana PCL, GDR | 101,073 |
| 50,800 | | CP ALL PCL, GDR | 66,537 |
| 37,600 | | Kasikornbank Public Co. Ltd., GDR | 179,241 |
| 184,140 | | Minor International PCL, GDR | 188,472 |
| 10,800 | | PTT Public Co. Ltd., GDR | 76,900 |
| 11,200 | | Siam Cement Co. Ltd., GDR | 140,363 |
| 30,800 | | Siam Commercial Bank PLC, GDR | 112,678 |
| | | TOTAL | 1,142,772 |
| | | United Arab Emirates—3.1% | |
| 32,800 | | Abu Dhabi Commercial Bank PJSC | 55,800 |
| 90,000 | | Air Arabia PJSC | 29,522 |
| 47,000 | | Aldar Properties PJSC | 29,857 |
| 4,700 | | DP World Ltd | 87,774 |
| 16,500 | | Dubai Islamic Bank | 28,675 |
| 40,000 | 1 | Emaar Malls Group PJSC | 31,138 |
Annual Shareholder Report
| Shares | | | Value in
U.S. Dollars |
| | | COMMON STOCKS—continued | |
| | | United Arab Emirates—continued | |
| 40,500 | | Emaar Properties PJSC | $63,485 |
| 28,500 | | First Gulf Bank PJSC | 92,968 |
| 12,000 | | National Bank of Abu Dhabi | 24,985 |
| | | TOTAL | 444,204 |
| | | TOTAL COMMON STOCKS
(IDENTIFIED COST $12,669,086) | 11,940,435 |
| | | EXCHANGE-TRADED FUND—1.5% | |
| | | United States—1.5% | |
| 25,700 | | Global X FTSE Greece 20 ETF
(IDENTIFIED COST $263,788) | 223,847 |
| | | TOTAL | 223,847 |
| | | WARRANTS—0.0% | |
| | | Thailand—0.0% | |
| 4,800 | 1 | Minor International PCL, Expiration Date 11/3/2017
(IDENTIFIED COST $0) | 710 |
| | | INVESTMENT COMPANY—14.6% | |
| | | United States—14.6% | |
| 2,113,723 | 5 | Federated Prime Value Obligations Fund, Institutional Shares, 0.17%6
(AT NET ASSET VALUE) | 2,113,723 |
| | | TOTAL INVESTMENTS—98.7%
(IDENTIFIED COST $15,046,597)7 | 14,278,715 |
| | | OTHER ASSETS AND LIABILITIES - NET—1.3%8 | 184,147 |
| | | TOTAL NET ASSETS—100% | $14,462,862 |
Annual Shareholder Report
At November 30, 2015, the Fund had the following outstanding future contracts:
| Description | Number of
Contracts | Notional
Value | Expiration
Date | Unrealized
Appreciation
(Depreciation) |
| 1BIST 30, Long Futures | 88 | $282,736 | December 2015 | $(16,294) |
| 1SET50 Index, Long Futures | 30 | $145,212 | December 2015 | $(831) |
| 1SGX NIFTY 50, Long Futures | 43 | $686,237 | December 2015 | $10,266 |
| 1WIG20 Index, Long Futures | 80 | $762,970 | December 2015 | $(95,599) |
| NET UNREALIZED DEPRECIATION ON FUTURES CONTRACTS | $(102,458) |
At November 30, 2015, the Fund had the following outstanding foreign exchange contracts:
| Settlement Date | Counterparty | Foreign Currency
Units to
Receive/Deliver | In
Exchange
For | Unrealized
Appreciation
(Depreciation) |
| Contracts Purchased: |
| 1/13/2016 | JPMorgan | 7,918,400,000 IDR | $560,000 | $6,253 |
| 1/13/2016 | JPMorgan | 36,820,000 INR | $560,000 | $(11,959) |
| Contracts Sold: |
| 12/15/2015 | Citibank | 1,375,000 EUR | $1,557,428 | $103,878 |
| 1/13/2016 | JPMorgan | 7,918,400,000 IDR | $571,437 | $5,184 |
| NET UNREALIZED APPRECIATION ON FOREIGN EXCHANGE CONTRACTS | $103,356 |
Net Unrealized Appreciation(Depreciation) on Futures Contracts and Foreign Exchange Contracts is included in “Other Assets and Liabilities—Net.”
| 1 | Non-income-producing security. |
| 2 | Denotes a restricted security that either: (a) cannot be offered for public sale without first being registered, or being able to take advantage of an exemption from registration, under the Securities Act of 1933; or (b) is subject to a contractual restriction on public sales. At November 30, 2015, these restricted securities amounted to $1,015,528, which represented 7.0% of total net assets. |
| 3 | Denotes a restricted security that may be resold without restriction to “qualified institutional buyers” as defined in Rule 144A under the Securities Act of 1933 and that the Fund has determined to be liquid under criteria established by the Fund's Board of Trustees (the “Trustees”). At November 30, 2015, these liquid restricted securities amounted to $202,324, which represented 1.4% of total net assets. |
| 4 | Market quotations and price evaluations are not available. Fair value determined in accordance with procedures established by and under the general supervision of the Trustees. |
| 5 | Affiliated holding. |
| 6 | 7-day net yield. |
| 7 | The cost of investments for federal tax purposes amounts to $15,046,597. |
| 8 | Assets, other than investments in securities, less liabilities. See Statement of Assets and Liabilities. |
Note: The categories of investments are shown as a percentage of total net assets at November 30, 2015.
Annual Shareholder Report
Various inputs are used in determining the value of the Fund's investments. These inputs are summarized in the three broad levels listed below:
Level 1—quoted prices in active markets for identical securities.
Level 2—other significant observable inputs (including quoted prices for similar securities, interest rates, prepayment speeds, credit risk, etc.). Also includes securities valued at amortized cost.
Level 3—significant unobservable inputs (including the Fund's own assumptions in determining the fair value of investments).
The inputs or methodology used for valuing securities are not an indication of the risk associated with investing in those securities.
The following is a summary of the inputs used, as of November 30, 2015, in valuing the Fund's assets carried at fair value:
| Valuation Inputs | | | | |
| | Level 1—
Quoted
Prices | Level 2—
Other
Significant
Observable
Inputs | Level 3—
Significant
Unobservable
Inputs | Total |
| Equity Securities: | | | | |
| Common Stock | | | | |
| International | $3,922,951 | $7,982,3541 | $35,130 | $11,940,435 |
| Warrants | 710 | — | — | 710 |
| Exchange Traded Fund | 223,847 | — | — | 223,847 |
| Investment Company | 2,113,723 | — | — | 2,113,723 |
| TOTAL SECURITIES | $6,261,231 | $7,982,354 | $35,130 | $14,278,715 |
| Other Financial Instruments:2 | | | | |
| Assets | $10,266 | $115,315 | $— | $125,581 |
| Liabilities | (112,724) | (11,959) | — | (124,683) |
| TOTAL OTHER FINANCIAL INSTRUMENTS | $(102,458) | $103,356 | $— | $898 |
| 1 | Includes $4,640,883 of securities transferred from Level 1 to Level 2 because fair value factors were applied to equity securities traded principally in foreign markets to account for significant post market close activity. Transfers shown represent the value of the securities at the beginning of the period. |
| 2 | Other Financial Instruments include futures contracts and foreign exchange contracts. |
The following acronyms are used throughout this portfolio:
| ADR | —American Depositary Receipt |
| ETF | —Exchange-Traded Fund |
| EUR | —Euro |
| GDR | —Global Depositary Receipt |
| IDR | —Indonesian Rupiah |
| INR | —Indian Rupee |
| PJSC | —Public Joint Stock Company |
See Notes which are an integral part of the Financial Statements
Annual Shareholder Report
Financial Highlights–Institutional Shares
(For a Share Outstanding Throughout Each Period)
| | Year Ended November 30, | Period
Ended
11/30/20111 |
| 2015 | 2014 | 2013 | 2012 |
| Net Asset Value, Beginning of Period | $12.61 | $13.30 | $11.05 | $9.67 | $10.00 |
| Income From Investment Operations: | | | | | |
| Net investment income | 0.08 | 0.14 | 0.15 | 0.14 | 0.12 |
| Net realized and unrealized gain (loss) on investments, futures contracts and foreign currency transactions | (2.05) | (0.23) | 2.24 | 1.27 | (0.43) |
| TOTAL FROM INVESTMENT OPERATIONS | (1.97) | (0.09) | 2.39 | 1.41 | (0.31) |
| Less Distributions: | | | | | |
| Distributions from net investment income | (0.09) | (0.13) | (0.13) | (0.03) | (0.02) |
| Distributions from net realized gain on investments | (2.47) | (0.47) | (0.01) | — | — |
| TOTAL DISTRIBUTIONS | (2.56) | (0.60) | (0.14) | (0.03) | (0.02) |
| Net Asset Value, End of Period | $8.08 | $12.61 | $13.30 | $11.05 | $9.67 |
| Total Return2 | (18.66)% | (0.67)% | 21.81% | 14.69% | (3.09)% |
| Ratios to Average Net Assets: | | | | | |
| Net expenses | 1.15% | 1.15% | 1.15% | 1.15% | 1.15%3 |
| Net investment income | 1.04% | 1.11% | 1.22% | 1.31% | 1.14%3 |
| Expense waiver/reimbursement4 | 1.74% | 2.22% | 1.63% | 2.99% | 3.13%3 |
| Supplemental Data: | | | | | |
| Net assets, end of period (000 omitted) | $14,463 | $10,335 | $13,638 | $11,155 | $9,695 |
| Portfolio turnover | 64% | 118% | 48% | 51% | 49% |
| 1 | Reflects operations for the period from December 3, 2010 (date of initial investment) to November 30, 2011. |
| 2 | Based on net asset value. Total returns for periods less than one year are not annualized. |
| 3 | Computed on an annualized basis. |
| 4 | This expense decrease is reflected in both the net expense and net investment income ratios shown above. |
See Notes which are an integral part of the Financial Statements
Annual Shareholder Report
Statement of Assets and Liabilities
November 30, 2015
| Assets: | | |
| Total investments in securities, at value including $2,113,723 of investment in an affiliated holding (Note 5) (identified cost $15,046,597) | | $14,278,715 |
| Restricted cash (Note 2) | | 154,253 |
| Cash denominated in foreign currencies (identified cost $19,558) | | 19,518 |
| Cash | | 692 |
| Unrealized appreciation on foreign exchange contracts | | 115,315 |
| Income receivable | | 8,495 |
| Receivable for investments sold | | 3,614 |
| Receivable for shares sold | | 1,500 |
| TOTAL ASSETS | | 14,582,102 |
| Liabilities: | | |
| Unrealized depreciation on foreign exchange contracts | $11,959 | |
| Payable for capital gains taxes withheld | 4,060 | |
| Payable for investments purchased | 3,614 | |
| Payable for portfolio accounting fees | 42,923 | |
| Payable for auditing fees | 26,746 | |
| Payable for custodian fees | 13,644 | |
| Payable for insurance premiums | 4,300 | |
| Payable for share registration costs | 4,237 | |
| Payable for daily variation margin on futures | 1,894 | |
| Payable to adviser (Note 5) | 1,326 | |
| Accrued expenses (Note 5) | 4,537 | |
| TOTAL LIABILITIES | | 119,240 |
| Net assets for 1,790,100 shares outstanding | | $14,462,862 |
| Net Assets Consists of: | | |
| Paid-in capital | | $16,826,384 |
| Net unrealized depreciation of investments, futures contracts and translation of assets and liabilities in foreign currency | | (768,626) |
| Accumulated net realized loss on investments, futures contracts and foreign currency transactions | | (1,714,144) |
| Undistributed net investment income | | 119,248 |
| TOTAL NET ASSETS | | $14,462,862 |
| Net Asset Value, Offering Price and Redemption Proceeds Per Share: | | |
| $14,462,862 ÷ 1,790,100 shares outstanding, no par value, unlimited shares authorized | | $8.08 |
See Notes which are an integral part of the Financial Statements
Annual Shareholder Report
Statement of Operations
Year Ended November 30, 2015
| Investment Income: | | | |
| Dividends (including $2,225 received from an affiliated holding (Note 5) and net of foreign taxes withheld of $47,394) | | | $301,864 |
| Expenses: | | | |
| Investment adviser fee (Note 5) | | $123,571 | |
| Administrative fee (Note 5) | | 10,745 | |
| Custodian fees | | 36,168 | |
| Transfer agent fees | | 6,825 | |
| Directors'/Trustees' fees (Note 5) | | 604 | |
| Auditing fees | | 27,430 | |
| Legal fees | | 8,708 | |
| Portfolio accounting fees | | 129,895 | |
| Share registration costs | | 23,020 | |
| Printing and postage | | 16,394 | |
| Miscellaneous (Note 5) | | 14,145 | |
| TOTAL EXPENSES | | 397,505 | |
| Waiver and Reimbursements (Note 5): | | | |
| Waiver/reimbursement of investment adviser fee | $(123,571) | | |
| Reimbursement of other operating expenses | (115,365) | | |
| TOTAL WAIVER AND REIMBURSEMENTS | | (238,936) | |
| Net expenses | | | 158,569 |
| Net investment income | | | 143,295 |
| Realized and Unrealized Gain (Loss) on Investments, Futures Contracts and Foreign Currency Transactions: | | | |
| Net realized loss on investments and foreign currency transactions | | | (1,267,081) |
| Net realized loss on futures contracts | | | (463,585) |
| Net change in unrealized appreciation of investments and translation of assets and liabilities in foreign currency | | | (1,115,568) |
| Net change in unrealized appreciation of futures contracts | | | (103,284) |
| Net realized and unrealized loss on investments, futures contracts and foreign currency transactions | | | (2,949,518) |
| Change in net assets resulting from operations | | | $(2,806,223) |
See Notes which are an integral part of the Financial Statements
Annual Shareholder Report
Statement of Changes in Net Assets
| Year Ended November 30 | 2015 | 2014 |
| Increase (Decrease) in Net Assets | | |
| Operations: | | |
| Net investment income | $143,295 | $124,180 |
| Net realized gain (loss) on investments, futures contracts and foreign currency transactions | (1,730,666) | 2,115,308 |
| Net change in unrealized appreciation/depreciation of investments, futures contracts and translation of assets and liabilities in foreign currency | (1,218,852) | (2,344,086) |
| CHANGE IN NET ASSETS RESULTING FROM OPERATIONS | (2,806,223) | (104,598) |
| Distributions to Shareholders: | | |
| Distributions from net investment income | (77,600) | (136,382) |
| Distributions from net realized gain on investments | (2,114,310) | (485,138) |
| CHANGE IN NET ASSETS RESULTING FROM DISTRIBUTIONS TO SHAREHOLDERS | (2,191,910) | (621,520) |
| Share Transactions: | | |
| Proceeds from sale of shares | 12,272,565 | 365,991 |
| Net asset value of shares issued to shareholders in payment of distributions declared | 2,186,130 | 621,487 |
| Cost of shares redeemed | (5,332,470) | (3,564,984) |
| CHANGE IN NET ASSETS RESULTING FROM SHARE TRANSACTIONS | 9,126,225 | (2,577,506) |
| Change in net assets | 4,128,092 | (3,303,624) |
| Net Assets: | | |
| Beginning of period | 10,334,770 | 13,638,394 |
| End of period (including undistributed net investment income of $119,248 and $77,552, respectively) | $14,462,862 | $10,334,770 |
See Notes which are an integral part of the Financial Statements
Annual Shareholder Report
Notes to Financial Statements
November 30, 2015
1. ORGANIZATION
Federated Equity Funds (the “Trust”) is registered under the Investment Company Act of 1940, as amended, (the “Act”), as an open-end management investment company. The Trust consists of 14 portfolios. The financial statements included herein are only those of Federated Emerging Markets Equity Fund (the “Fund”). The financial statements of the other portfolios are presented separately. The assets of each portfolio are segregated and a shareholder's interest is limited to the portfolio in which shares are held. Each portfolio pays its own expenses. The investment objective of the Fund is to provide long term capital appreciation.
2. SIGNIFICANT ACCOUNTING POLICIES
The following is a summary of significant accounting policies consistently followed by the Fund in the preparation of its financial statements. These policies are in conformity with U.S. generally accepted accounting principles (GAAP).
Investment Valuation
In calculating its net asset value (NAV), the Fund generally values investments as follows:
| ■ | Equity securities listed on an exchange or traded through a regulated market system are valued at their last reported sale price or official closing price in their principal exchange or market. |
| ■ | Shares of other mutual funds or non-exchange-traded investment companies are valued based upon their reported NAVs. |
| ■ | Fixed-income securities acquired with remaining maturities greater than 60 days are fair valued using price evaluations provided by a pricing service approved by the Fund's Trustees. |
| ■ | Fixed-income securities and repurchase agreements acquired with remaining maturities of 60 days or less are valued at their cost (adjusted for the accretion of any discount or amortization of any premium) unless the issuer's creditworthiness is impaired or other factors indicate that amortized cost is not an accurate estimate of the investment's fair value, in which case it would be valued in the same manner as a longer-term security. |
| ■ | Derivative contracts listed on exchanges are valued at their reported settlement or closing price, except that options are valued at the mean of closing bid and asked quotations. |
| ■ | Over-the-counter (OTC) derivative contracts are fair valued using price evaluations provided by a pricing service approved by the Trustees. |
| ■ | For securities that are fair valued in accordance with procedures established by and under the general supervision of the Trustees, certain factors may be considered such as: the last traded or purchase price of the security, information obtained by contacting the issuer or dealers, analysis of the issuer's financial statements or other available documents, fundamental analytical data, the nature and duration of restrictions on disposition, the movement of the market in which the security is normally traded, public trading in similar securities or derivative contracts of the issuer or comparable issuers, movement of a relevant index, or other factors including but not limited to industry changes and relevant government actions. |
Annual Shareholder Report
If any price, quotation, price evaluation or other pricing source is not readily available when the NAV is calculated, or if the Fund cannot obtain price evaluations from a pricing service or from more than one dealer for an investment within a reasonable period of time as set forth in the Fund's valuation policies and procedures, the Fund uses the fair value of the investment determined in accordance with the procedures described below. There can be no assurance that the Fund could obtain the fair value assigned to an investment if it sold the investment at approximately the time at which the Fund determines its NAV per share.
Fair Valuation and Significant Events Procedures
The Trustees have ultimate responsibility for determining the fair value of investments for which market quotations are not readily available. The Trustees have appointed a valuation committee (“Valuation Committee”) comprised of officers of the Fund, Federated Global Investment Management Corp. (“Adviser”) and certain of the Adviser's affiliated companies to assist in determining fair value and in overseeing the calculation of the NAV. The Trustees have also authorized the use of pricing services recommended by the Valuation Committee to provide fair value evaluations of the current value of certain investments for purposes of calculating the NAV. The Valuation Committee employs various methods for reviewing third-party pricing-service evaluations including periodic reviews of third-party pricing services' policies, procedures and valuation methods (including key inputs, methods, models and assumptions), transactional back-testing, comparisons of evaluations of different pricing services and review of price challenges by the Adviser based on recent market activity. In the event that market quotations and price evaluations are not available for an investment, the Valuation Committee determines the fair value of the investment in accordance with procedures adopted by the Trustees. The Trustees periodically review and approve the fair valuations made by the Valuation Committee and any changes made to the procedures.
Factors considered by pricing services in evaluating an investment include the yields or prices of investments of comparable quality, coupon, maturity, call rights and other potential prepayments, terms and type, reported transactions, indications as to values from dealers and general market conditions. Some pricing services provide a single price evaluation reflecting the bid-side of the market for an investment (a “bid” evaluation). Other pricing services offer both bid evaluations and price evaluations indicative of a price between the prices bid and asked for the investment (a “mid” evaluation). The Fund normally uses bid evaluations for any U.S. Treasury and Agency securities, mortgage-backed securities and municipal securities. The Fund normally uses mid evaluations for any other types of fixed-income securities and any OTC derivative contracts. In the event that market quotations and price evaluations are not available for an investment, the fair value of the investment is determined in accordance with procedures adopted by the Trustees.
Annual Shareholder Report
The Trustees also have adopted procedures requiring an investment to be priced at its fair value whenever the Adviser determines that a significant event affecting the value of the investment has occurred between the time as of which the price of the investment would otherwise be determined and the time as of which the NAV is computed. An event is considered significant if there is both an affirmative expectation that the investment's value will change in response to the event and a reasonable basis for quantifying the resulting change in value. Examples of significant events that may occur after the close of the principal market on which a security is traded, or after the time of a price evaluation provided by a pricing service or a dealer, include:
| ■ | With respect to securities traded principally in foreign markets, significant trends in U.S. equity markets or in the trading of foreign securities index futures contracts; |
| ■ | Political or other developments affecting the economy or markets in which an issuer conducts its operations or its securities are traded; |
| ■��� | Announcements concerning matters such as acquisitions, recapitalizations, litigation developments, or a natural disaster affecting the issuer's operations or regulatory changes or market developments affecting the issuer's industry. |
The Trustees have adopted procedures whereby the Valuation Committee uses a pricing service to determine the fair value of equity securities traded principally in foreign markets when the Adviser determines that there has been a significant trend in the U.S. equity markets or in index futures trading. For other significant events, the Fund may seek to obtain more current quotations or price evaluations from alternative pricing sources. If a reliable alternative pricing source is not available, the Fund will determine the fair value of the investment in accordance with the fair valuation procedures approved by the Trustees. The Trustees have ultimate responsibility for any fair valuations made in response to a significant event.
Repurchase Agreements
The Fund may invest in repurchase agreements for short-term liquidity purposes. It is the policy of the Fund to require the other party to a repurchase agreement to transfer to the Fund's custodian or sub-custodian eligible securities or cash with a market value (after transaction costs) at least equal to the repurchase price to be paid under the repurchase agreement. The eligible securities are transferred to accounts with the custodian or sub-custodian in which the Fund holds a “securities entitlement” and exercises “control” as those terms are defined in the Uniform Commercial Code. The Fund has established procedures for monitoring the market value of the transferred securities and requiring the transfer of additional eligible securities if necessary to equal at least the repurchase price. These procedures also allow the other party to require securities to be transferred from the account to the extent that their market value exceeds the repurchase price or in exchange for other eligible securities of equivalent market value.
The insolvency of the other party or other failure to repurchase the securities may delay the disposition of the underlying securities or cause the Fund to receive less than the full repurchase price. Under the terms of the repurchase agreement, any amounts received by the Fund in excess of the repurchase price and related transaction costs must be remitted to the other party.
Annual Shareholder Report
The Fund may enter into repurchase agreements in which eligible securities are transferred into joint trading accounts maintained by the custodian or sub-custodian for investment companies and other clients advised by the Fund's Adviser and its affiliates. The Fund will participate on a pro rata basis with the other investment companies and clients in its share of the securities transferred under such repurchase agreements and in its share of proceeds from any repurchase or other disposition of such securities.
Investment Income, Gains and Losses, Expenses and Distributions
Investment transactions are accounted for on a trade-date basis. Realized gains and losses from investment transactions are recorded on an identified-cost basis. Interest income and expenses are accrued daily. Dividend income and distributions to shareholders are recorded on the ex-dividend date. Foreign dividends are recorded on the ex-dividend date or when the Fund is informed of the ex-dividend date. Distributions of net investment income are declared and paid annually. Non-cash dividends included in dividend income, if any, are recorded at fair value.
Premium and Discount Amortization
All premiums and discounts on fixed-income securities are amortized/accreted using the effective-interest-rate method.
Federal Taxes
It is the Fund's policy to comply with the Subchapter M provision of the Internal Revenue Code and to distribute to shareholders each year substantially all of its income. Accordingly, no provision for federal income tax is necessary. As of and during the year ended November 30, 2015, the Fund did not have a liability for any uncertain tax positions. The Fund recognizes interest and penalties, if any, related to tax liabilities as income tax expense in the Statement of Operations. As of November 30, 2015, tax years 2012 through 2015 remain subject to examination by the Fund's major tax jurisdictions, which include the United States of America and the Commonwealth of Massachusetts.
The Fund may be subject to taxes imposed by governments of countries in which it invests. Such taxes are generally based on either income or gains earned or repatriated. The Fund accrues and applies such taxes to net investment income, net realized gains and net unrealized gains as income and/or gains are earned.
When-Issued and Delayed-Delivery Transactions
The Fund may engage in when-issued or delayed-delivery transactions. The Fund records when-issued securities on the trade date and maintains security positions such that sufficient liquid assets will be available to make payment for the securities purchased. Securities purchased on a when-issued or delayed-delivery basis are marked to market daily and begin earning interest on the settlement date. Losses may occur on these transactions due to changes in market conditions or the failure of counterparties to perform under the contract.
Futures Contracts
The Fund purchases and sells financial futures contracts to manage country and market risk. Upon entering into a financial futures contract with a broker, the Fund is required to deposit in a segregated account a specified amount of cash or U.S. government securities which is shown as Restricted cash in the Statement of Assets and Liabilities. Futures contracts are valued daily and unrealized gains or losses are recorded in a “variation margin” account. Daily, the Fund receives from or pays to the broker a specified amount of cash based upon changes in the variation margin account. When a contract is closed, the Fund recognizes a realized gain
Annual Shareholder Report
or loss. Futures contracts have market risks, including the risk that the change in the value of the contract may not correlate with the changes in the value of the underlying securities. There is minimal counterparty risk to the Fund since futures are exchange traded and the exchange's clearing house, as counterparty to all exchange traded futures, guarantees the futures against default.
Futures contracts outstanding at period end are listed after the Fund's Portfolio of Investments.
The average notional value of long futures contracts held by the Fund throughout the period was $1,695,735. This is based on amounts held as of each month-end throughout the fiscal year.
Foreign Exchange Contracts
The Fund may enter into foreign exchange contracts to manage currency and market risk. Purchased contracts are used to acquire exposure to foreign currencies, whereas, contracts to sell are used to hedge the Fund's securities against currency fluctuations. Risks may arise upon entering into these transactions from the potential inability of counterparties to meet the terms of their commitments and from unanticipated movements in security prices or foreign exchange rates. The foreign exchange contracts are adjusted by the daily exchange rate of the underlying currency and any gains or losses are recorded for financial statement purposes as unrealized until the settlement date.
Foreign exchange contracts are subject to Master Netting Agreements which are agreements between the Fund and its counterparties that provide for the net settlement of all transactions and collateral with the Fund, through a single payment, in the event of default or termination. Amounts presented on the Portfolio of Investments and Statement of Assets and Liabilities are not net settlement amounts but gross.
Foreign exchange contracts outstanding at period end, including net unrealized appreciation/depreciation or net settlement amounts, are listed after the Fund's Portfolio of Investments.
The average value at settlement date payable and receivable of foreign exchange contracts purchased and sold by the Fund throughout the fiscal period was $34,966 and $42,941, respectively. This is based on amounts held as of each month-end throughout the fiscal year.
Foreign Currency Translation
The accounting records of the Fund are maintained in U.S. dollars. All assets and liabilities denominated in foreign currencies (FCs) are translated into U.S. dollars based on the rates of exchange of such currencies against U.S. dollars on the date of valuation. Purchases and sales of securities, income and expenses are translated at the rate of exchange quoted on the respective date that such transactions are recorded. The Fund does not isolate that portion of the results of operations resulting from changes in foreign exchange rates on investments from the fluctuations arising from changes in market prices of securities held. Such fluctuations are included with the net realized and unrealized gain or loss from investments.
Annual Shareholder Report
Reported net realized foreign exchange gains or losses arise from sales of portfolio securities, sales and maturities of short-term securities, sales of FCs, currency gains or losses realized between the trade and settlement dates on securities transactions, the difference between the amounts of dividends, interest and foreign withholding taxes recorded on the Fund's books and the U.S. dollar equivalent of the amounts actually received or paid. Net unrealized foreign exchange gains and losses arise from changes in the value of assets and liabilities other than investments in securities at period end, resulting from changes in the exchange rate.
Restricted Securities
The Fund may purchase securities which are considered restricted. Restricted securities are securities that either: (a) cannot be offered for public sale without first being registered, or being able to take advantage of an exemption from registration, under the Securities Act of 1933; or (b) are subject to contractual restrictions on public sales. In some cases, when a security cannot be offered for public sale without first being registered, the issuer of the restricted security has agreed to register such securities for resale, at the issuer's expense, either upon demand by the Fund or in connection with another registered offering of the securities. Many such restricted securities may be resold in the secondary market in transactions exempt from registration. Restricted securities may be determined to be liquid under criteria established by the Trustees. The Fund will not incur any registration costs upon such resales. The Fund's restricted securities, like other securities, are priced in accordance with procedures established by and under the general supervision of the Trustees.
Additional information on restricted securities, excluding securities purchased under Rule 144A that have been deemed liquid by the Trustees, if applicable, held at November 30, 2015, is as follows:
| | Acquisition
Date | Cost | Market
Value |
| Axis Bank Ltd., GDR | 4/29/2014-2/20/2015 | $170,356 | $176,072 |
| Gail India Ltd., GDR | 4/28/2014-8/12/2015 | $86,296 | $81,898 |
| Larsen & Toubro Ltd., GDR | 4/28/2014-2/20/2015 | $179,770 | $152,604 |
| Magnit., GDR | 8/11/2015 | $62,135 | $57,758 |
| NovaTek OAO, GDR | 8/12/2015 | $57,607 | $56,028 |
| Rosneft Oil Co., GDR | 8/12/2015 | $54,330 | $60,162 |
| State Bank of India, GDR | 10/12/2015 | $151,613 | $148,475 |
| VTB Bank OJSC, GDR | 8/12/2015 | $37,376 | $37,264 |
| X5 Retail Group NV, GDR | 8/11/2015 | $34,637 | $42,943 |
Annual Shareholder Report
Additional Disclosure Related to Derivative Instruments
| Fair Value of Derivative Instruments |
| | Asset | Liability |
| | Statement of
Assets and
Liabilities
Location | Fair Value | Statement of
Assets and
Liabilities
Location | Fair Value |
| Derivatives not accounted for as hedging instruments under ASC Topic 815 | | | | |
| Foreign exchange contracts | Unrealized
appreciation
on foreign
exchange
contracts | $115,315 | Unrealized
depreciation
on foreign
exchange
contracts | $11,959 |
| Equity contracts | | — | Payable for
daily
variation
margin on futures | 102,458* |
| Total derivatives not accounted for as hedging instruments under ASC Topic 815 | | $115,315 | | $114,417 |
| * | Includes cumulative unrealized depreciation of futures contracts as reported in the footnotes to the Portfolio of Investments. Only the current day's variation margin is reported within the Statement of Assets and Liabilities. |
The Effect of Derivative Instruments on the Statement of Operations for the Year Ended November 30, 2015
| Amount of Realized Gain or (Loss) on Derivatives Recognized in Income |
| | Futures
Contracts | Forward
Exchange
Contracts |
| Foreign exchange contracts | $— | $57,334 |
| Equity contracts | (463,585) | — |
| TOTAL | $(463,585) | $57,334 |
| Change in Unrealized Appreciation or (Depreciation) on Derivatives Recognized in Income |
| | Futures
Contracts | Forward
Exchange
Contracts |
| Foreign exchange contracts | $— | $95,879 |
| Equity contracts | (103,284) | — |
| TOTAL | $(103,284) | $95,879 |
Annual Shareholder Report
Other
The preparation of financial statements in conformity with GAAP requires management to make estimates and assumptions that affect the amounts of assets, liabilities, expenses and revenues reported in the financial statements. Actual results could differ from those estimated. The Fund applies Investment Company accounting and reporting guidance.
3. SHARES OF BENEFICIAL INTEREST
The following table summarizes share activity:
| Year Ended November 30 | 2015 | 2014 |
| Shares sold | 1,311,930 | 28,195 |
| Shares issued to shareholders in payment of distributions declared | 230,361 | 48,898 |
| Shares redeemed | (571,483) | (283,232) |
| NET CHANGE RESULTING FROM FUND SHARE TRANSACTIONS | 970,808 | (206,139) |
4. FEDERAL TAX INFORMATION
The timing and character of income and capital gain distributions are determined in accordance with income tax regulations, which may differ from GAAP. These differences are due to differing treatments for foreign currency transactions.
For the year ended November 30, 2015, permanent differences identified and reclassified among the components of net assets were as follows:
| Increase (Decrease) |
Undistributed
Net Investment
Income (Loss) | Accumulated
Net Realized
Gain (Loss) |
| $(23,999) | $23,999 |
Net investment income (loss), net realized gains (losses) and net assets were not affected by the reclassification.
The tax character of distributions as reported on the Statement of Changes in Net Assets for the years ended November 30, 2015 and 2014, was as follows:
| | 2015 | 2014 |
| Ordinary income | $77,600 | $237,772 |
| Long-term capital gains | $2,114,310 | $383,748 |
As of November 30, 2015, the components of distributable earnings on a tax-basis were as follows:
| Undistributed ordinary income | $119,248 |
| Capital loss carryforwards | $(1,622,225) |
| Net unrealized depreciation | $(860,545) |
At November 30, 2015, the cost of investments for federal tax purposes was $15,046,597. The net unrealized depreciation of investments for federal tax purposes excluding any, unrealized appreciation/depreciation resulting from: (a) the translation from FCs to U.S. dollars of assets and liabilities other than investment in securities; (b) futures contracts; and (c) outstanding
Annual Shareholder Report
foreign currency commitments was $767,882. This consists of net unrealized appreciation from investments for those securities having an excess of value over cost of $728,113 and net unrealized depreciation from investments for those securities having an excess of cost over value of $1,495,995.
At November 30, 2015, the Fund had a capital loss carryforward of $1,622,225 which will reduce the Fund's taxable income arising from future net realized gains on investments, if any, to the extent permitted by the Code, thereby reducing the amount of distributions to shareholders which would otherwise be necessary to relieve the Fund of any liability for federal income tax. Pursuant to the Code, a net capital loss incurred in taxable years beginning after December 22, 2010, retains its character as either short-term or long-term, and does not expire. All of the Fund's capital loss carryforwards were incurred in taxable years beginning after December 22, 2010.
The following schedule summarizes the Fund's capital loss carryforwards:
| Short-Term | Long-Term | Total |
| $1,427,994 | $194,231 | $1,622,225 |
5. INVESTMENT ADVISER FEE AND OTHER TRANSACTIONS WITH AFFILIATES
Investment Adviser Fee
The advisory agreement between the Fund and the Adviser provides for an annual fee equal to 0.90% of the Fund's average daily net assets. Subject to the terms described in the Expense Limitation note, the Adviser may voluntarily choose to waive any portion of its fee and/or reimburse certain operating expenses of the Fund. For the year ended November 30, 2015, the Adviser voluntarily waived $121,390 of its fee and voluntarily reimbursed $115,365 of other operating expenses.
Administrative Fee
Federated Administrative Services (FAS), under the Administrative Services Agreement, provides the Fund with administrative personnel and services. For purposes of determining the appropriate rate breakpoint, “Investment Complex” is defined as all of the Federated Funds subject to a fee under the Administrative Services Agreement. The fee paid to FAS is based on the average daily net assets of the Investment Complex as specified below, plus certain out-of-pocket expenses:
| Administrative Fee | Average Daily Net Assets
of the Investment Complex |
| 0.150% | on the first $5 billion |
| 0.125% | on the next $5 billion |
| 0.100% | on the next $10 billion |
| 0.075% | on assets in excess of $20 billion |
Subject to the terms described in the Expense Limitation note, FAS may voluntarily choose to waive any portion of its fee. For the year ended November 30, 2015, the annualized fee paid to FAS was 0.078% of average daily net assets of the Fund.
Annual Shareholder Report
Expense Limitation
The Adviser and certain of its affiliates (which may include FAS) on their own initiative have agreed to waive certain amounts of their respective fees and/or reimburse expenses. Total annual fund operating expenses (as shown in the financial highlights, excluding expenses allocated from affiliated partnerships, interest expense, extraordinary expenses and proxy-related expenses paid by the Fund, if any) paid by the Fund's Institutional Shares (after the voluntary waivers and/or reimbursements) will not exceed 1.15% (the “Fee Limit”), up to but not including the later of (the “Termination Date”): (a) February 1, 2017; or (b) the date of the Fund's next effective Prospectus. While the Adviser and its applicable affiliates currently do not anticipate terminating or increasing these arrangements prior to the Termination Date, these arrangements may only be terminated or the Fee Limit increased prior to the Termination Date with the agreement of the Trustees.
General
Certain Officers and Trustees of the Fund are Officers and Directors or Trustees of certain of the above companies. To efficiently facilitate payment, Directors'/Trustees' fees and certain expenses related to conducting meetings of the Directors/Trustees and other miscellaneous expenses are paid by an affiliate of the Adviser which in due course are reimbursed by the Fund. Such expenses may be included in Accrued and Miscellaneous Expenses on the Statement of Assets and Liabilities and the Statement of Operations, respectively.
Transactions Involving Affiliated Holdings
Affiliated holdings are investment companies which are managed by the Adviser or an affiliate of the Adviser. The Adviser has agreed to reimburse the Fund for certain investment adviser fees as a result of transactions in other affiliated investment companies. For the year ended November 30, 2015, the Adviser reimbursed $2,181. Transactions involving the affiliated holding during the year ended November 30, 2015, were as follows:
| | Federated
Prime Value
Obligations Fund,
Institutional Shares |
| Balance of Shares Held 11/30/2014 | 223,038 |
| Purchases/Additions | 16,000,068 |
| Sales/Reductions | (14,109,383) |
| Balance of Shares Held 11/30/2015 | 2,113,723 |
| Value | $2,113,723 |
| Dividend Income | $2,225 |
Affiliated Shares of Beneficial Interest
As of November 30, 2015, a majority of the shares of beneficial interest outstanding are owned by an affiliate of the Adviser.
Annual Shareholder Report
6. Investment TRANSACTIONS
Purchases and sales of investments, excluding long-term U.S. government securities and short-term obligations, for the year ended November 30, 2015, were as follows:
| Purchases | $12,031,234 |
| Sales | $7,516,437 |
7. CONCENTRATION OF RISK
The Fund invests in securities of non-U.S. issuers. Political or economic developments may have an effect on the liquidity and volatility of portfolio securities and currency holdings.
8. LINE OF CREDIT
The Fund participates in a $100,000,000 unsecured, uncommitted revolving line of credit (LOC) agreement with PNC Bank. The LOC was made available for extraordinary or emergency purposes, primarily for financing redemption payments. Borrowings are charged interest at a rate offered to the Fund by PNC Bank at the time of the borrowing. As of November 30, 2015, there were no outstanding loans. During the year ended November 30, 2015, the Fund did not utilize the LOC.
9. INTERFUND LENDING
Pursuant to an Exemptive Order issued by the Securities and Exchange Commission, the Fund, along with other funds advised by subsidiaries of Federated Investors, Inc., may participate in an interfund lending program. This program provides an alternative credit facility allowing the Fund to borrow from other participating affiliated funds. As of November 30, 2015, there were no outstanding loans. During the year ended November 30, 2015, the program was not utilized.
10. FEDERAL TAX INFORMATION (UNAUDITED)
For the year ended November 30, 2015, the amount of long-term capital gains designated by the Fund was $2,114,310.
For the fiscal year ended November 30, 2015, 100% of total ordinary income distributions made by the Fund are qualifying dividends which may be subject to a maximum tax rate of 15%, as provided for by the Jobs and Growth Tax Relief Act of 2003. Complete information is reported in conjunction with the reporting of your distributions on Form 1099-DIV.
Of the ordinary income distributions made by the Fund during the year ended November 30, 2015, 41.04% qualify for the dividend received deduction available to corporate shareholders.
If the Fund meets the requirements of Section 853 of the Code, the Fund will pass through to its shareholders credits for foreign taxes paid. For the fiscal year ended November 30, 2015, the Fund derived $346,451 of gross income from foreign sources and paid foreign taxes of $47,436.
Annual Shareholder Report
Report of Independent Registered Public Accounting Firm
TO THE BOARD OF trustees of federated equity funds and shareholders OF Federated EMERGING MARKETS EQUITY fund:
We have audited the accompanying statement of assets and liabilities, including the portfolio of investments, of the Federated Emerging Markets Equity Fund (the “Fund”), a portfolio of Federated Equity Funds, as of November 30, 2015, and the related statement of operations for the year then ended, the statement of changes in net assets for each of the years in the two-year period then ended, and financial highlights for each of the years or periods in the five-year period then ended. These financial statements and financial highlights are the responsibility of the Fund's management. Our responsibility is to express an opinion on these financial statements and financial highlights based on our audits.
We conducted our audits in accordance with the standards of the Public Company Accounting Oversight Board (United States). Those standards require that we plan and perform the audit to obtain reasonable assurance about whether the financial statements and financial highlights are free of material misstatement. An audit includes examining, on a test basis, evidence supporting the amounts and disclosures in the financial statements. Our procedures included confirmation of securities owned as of November 30, 2015, by correspondence with the custodian, transfer agent and brokers or by other appropriate auditing procedures. An audit also includes assessing the accounting principles used and significant estimates made by management, as well as evaluating the overall financial statement presentation. We believe that our audits provide a reasonable basis for our opinion.
In our opinion, the financial statements and financial highlights referred to above present fairly, in all material respects, the financial position of the Federated Emerging Markets Equity Fund as of November 30, 2015, the results of its operations for the year then ended, the changes in its net assets for each of the years in the two-year period then ended, and the financial highlights for each of the years or periods in the five-year period then ended, in conformity with U.S. generally accepted accounting principles.
Boston, Massachusetts
January 25, 2016
Annual Shareholder Report
Shareholder Expense Example (unaudited)
As a shareholder of the Fund, you incur ongoing costs, including management fees and to the extent applicable, distribution (12b-1) fees and/or other service fees and other Fund expenses. This Example is intended to help you to understand your ongoing costs (in dollars) of investing in the Fund and to compare these costs with the ongoing costs of investing in other mutual funds. It is based on an investment of $1,000 invested at the beginning of the period and held for the entire period from June 1, 2015 to November 30, 2015.
ACTUAL EXPENSES
The first section of the table below provides information about actual account values and actual expenses. You may use the information in this section, together with the amount you invested, to estimate the expenses that you incurred over the period. Simply divide your account value by $1,000 (for example, an $8,600 account value divided by $1,000 = 8.6), then multiply the result by the number in the first section under the heading entitled “Expenses Paid During Period” to estimate the expenses attributable to your investment during this period.
HYPOTHETICAL EXAMPLE FOR COMPARISON PURPOSES
The second section of the table below provides information about hypothetical account values and hypothetical expenses based on the Fund's actual expense ratio and an assumed rate of return of 5% per year before expenses, which is not the Fund's actual return. Thus, you should not use the hypothetical account values and expenses to estimate the actual ending account balance or your expenses for the period. Rather, these figures are required to be provided to enable you to compare the ongoing costs of investing in the Fund with other funds. To do so, compare this 5% hypothetical example with the 5% hypothetical examples that appear in the shareholder reports of the other funds.
Please note that the expenses shown in the table are meant to highlight your ongoing costs only. Therefore, the second section of the table is useful in comparing ongoing costs only, and will not help you determine the relative total costs of owning different funds.
| | Beginning
Account Value
6/1/2015 | Ending
Account Value
11/30/2015 | Expenses Paid
During Period1 |
| Actual | $1,000 | $839.90 | $5.30 |
Hypothetical (assuming a 5% return
before expenses) | $1,000 | $1,019.30 | $5.82 |
| 1 | Expenses are equal to the Fund's annualized net expense ratio of 1.15%, multiplied by the average account value over the period, multiplied by 183/365 (to reflect the one-half-year period). |
Annual Shareholder Report
Board of Trustees and Trust Officers
The Board of Trustees is responsible for managing the Corporation's business affairs and for exercising all the Corporation's powers except those reserved for the shareholders. The following tables give information about each Trustee and the senior officers of the Fund. Where required, the tables separately list Trustees who are “interested persons” of the Fund (i.e., “Interested” Trustees) and those who are not (i.e., “Independent” Trustees). Unless otherwise noted, the address of each person listed is Federated Investors Tower, 1001 Liberty Avenue, Pittsburgh, PA 15222. The address of all Independent Trustees listed is 4000 Ericsson Drive, Warrendale, PA 15086-7561; Attention: Mutual Fund Board. As of December 31, 2015, the Trust comprised 14 portfolio(s), and the Federated Fund Family consisted of 38 investment companies (comprising 122 portfolios). Unless otherwise noted, each Officer is elected annually. Unless otherwise noted, each Trustee oversees all portfolios in the Federated Fund Family and serves for an indefinite term. The Fund's Statement of Additional Information includes additional information about Trust Trustees and is available, without charge and upon request, by calling 1-800-341-7400.
Interested Trustees Background
Name
Birth Date
Positions Held with Trust
Date Service Began | Principal Occupation(s) for Past Five Years,
Other Directorships Held and Previous Position(s) |
John F. Donahue*
Birth Date: July 28, 1924
Trustee
Indefinite Term
Began serving: April 1984 | Principal Occupations: Director or Trustee of the Federated Fund Family; Chairman and Director, Federated Investors, Inc.; Chairman of the Federated Fund Family's Executive Committee.
Previous Positions: Chairman of the Federated Fund Family; Trustee, Federated Investment Management Company; Chairman and Director, Federated Investment Counseling. |
J. Christopher Donahue*
Birth Date: April 11, 1949
President and Trustee
Indefinite Term
Began serving: January 2000 | Principal Occupations: Principal Executive Officer and President of certain of the Funds in the Federated Fund Family; Director or Trustee of the Funds in the Federated Fund Family; President, Chief Executive Officer and Director, Federated Investors, Inc.; Chairman and Trustee, Federated Investment Management Company; Trustee, Federated Investment Counseling; Chairman and Director, Federated Global Investment Management Corp.; Chairman, Federated Equity Management Company of Pennsylvania and Passport Research, Ltd. (investment advisory subsidiary of Federated); Trustee, Federated Shareholder Services Company; Director, Federated Services Company.
Previous Positions: President, Federated Investment Counseling; President and Chief Executive Officer, Federated Investment Management Company, Federated Global Investment Management Corp. and Passport Research, Ltd. |
| * | Family relationships and reasons for “interested” status: John F. Donahue is the father of J. Christopher Donahue; both are “interested” due to their beneficial ownership of shares of Federated Investors, Inc. and the positions they hold with Federated and its subsidiaries. |
Annual Shareholder Report
INDEPENDENT Trustees Background
Name
Birth Date
Positions Held with Trust
Date Service Began | Principal Occupation(s) for Past Five Years,
Other Directorships Held, Previous Position(s) and Qualifications |
John T. Collins
Birth Date: January 24, 1947
Trustee
Indefinite Term
Began serving: October 2013 | Principal Occupations: Director or Trustee of the Federated Fund Family; Retired.
Other Directorships Held: Director, Chair of the Compensation Committee, Audit Committee member, KLX Corp.
Qualifications: Mr. Collins has served in several business and financial management roles and directorship positions throughout his career. Mr. Collins previously served as Chairman and CEO, The Collins Group, Inc. (a private equity firm). Mr. Collins serves as Chairman Emeriti, Bentley University. Mr. Collins previously served as Director, FleetBoston Financial Corp.; Director and Audit Committee Member, Bank of America Corp. and Director, Beth Israel Deaconess Medical Center (Harvard University Affiliate Hospital). |
G. Thomas Hough
Birth Date: February 28, 1955
Trustee
Indefinite Term
Began serving: August 2015 | Principal Occupations: Director or Trustee of the Federated Fund Family; Retired.
Other Directorships Held: Director, Chair of the Audit Committee, Governance Committee, Publix Super Markets, Inc.
Qualifications: Mr. Hough has served in accounting, business management and directorship positions throughout his career. Mr. Hough most recently held the position of Americas Vice Chair of Assurance with Ernst & Young LLP. Mr. Hough is an Executive Committee member of the United States Golf Association, he serves on the President's Cabinet and Business School Board of Visitors for the University of Alabama and is on the Business School Board of Visitors for Wake Forest University. |
Maureen Lally-Green
Birth Date: July 5, 1949
Trustee
Indefinite Term
Began serving: August 2009 | Principal Occupations: Director or Trustee of the Federated Fund Family; Adjunct Professor of Law, Duquesne University School of Law.
Other Directorships Held: Director, CONSOL Energy Inc.
Qualifications: Judge Lally-Green has served in various legal and business roles and directorship positions throughout her career. Judge Lally-Green previously served as: Associate General Secretary, Diocese of Pittsburgh; a member of the Superior Court of Pennsylvania; and as a Professor of Law, Duquesne University School of Law. Judge Lally-Green also holds the positions on either a public or not for profit Board of Directors as follows: Member, Pennsylvania State Board of Education (public); Director and Chair, UPMC Mercy Hospital; Regent, St. Vincent Seminary; Director, Epilepsy Foundation of Western and Central Pennsylvania; Director and Vice Chair, Our Campaign for the Church Alive!, Inc.; Director, Saint Vincent College; Director, Pennsylvania Bar Institute; and Director and Chair, Cardinal Wuerl North Catholic High School, Inc. Judge Lally-Green has held the positions of: Director, Auberle; Director, Ireland Institute of Pittsburgh; Director, Saint Thomas More Society; and Director, Catholic High Schools of the Diocese of Pittsburgh, Inc. |
Annual Shareholder Report
Name
Birth Date
Positions Held with Trust
Date Service Began | Principal Occupation(s) for Past Five Years,
Other Directorships Held, Previous Position(s) and Qualifications |
Peter E. Madden
Birth Date: March 16, 1942
Trustee
Indefinite Term
Began serving: November 1991 | Principal Occupation: Director or Trustee, and Chair of the Board of Directors or Trustees, of the Federated Fund Family; Retired.
Other Directorships Held: None.
Qualifications: Mr. Madden has served in several business management, mutual fund services and directorship positions throughout his career. Mr. Madden previously served as President, Chief Operating Officer and Director, State Street Bank and Trust Company (custodian bank) and State Street Corporation (financial services). He was Director, VISA USA and VISA International and Chairman and Director, Massachusetts Bankers Association. Mr. Madden served as Director, Depository Trust Corporation and Director, The Boston Stock Exchange. Mr. Madden also served as a Representative to the Commonwealth of Massachusetts General Court. |
Charles F. Mansfield, Jr.
Birth Date: April 10, 1945
Trustee
Indefinite Term
Began serving: January 1999 | Principal Occupations: Director or Trustee of the Federated Fund Family; Management Consultant.
Other Directorships Held: None.
Qualifications: Mr. Mansfield has served in several banking, business management and educational roles and directorship positions throughout his career. Mr. Mansfield previously served as Chief Executive Officer, PBTC International Bank; Partner, Arthur Young & Company (now Ernst & Young LLP); Chief Financial Officer of Retail Banking Sector, Chase Manhattan Bank; Senior Vice President, HSBC Bank USA (formerly, Marine Midland Bank); Vice President, Citibank; Assistant Professor of Banking and Finance, Frank G. Zarb School of Business, Hofstra University; Executive Vice President DVC Group, Inc. (marketing, communications and technology). |
Thomas M. O'Neill
Birth Date: June 14, 1951
Trustee
Indefinite Term
Began serving: October 2006 | Principal Occupations: Director or Trustee, Chair of the Audit Committee of the Federated Fund Family; Sole Proprietor, Navigator Management Company (investment and strategic consulting).
Other Directorships Held: None.
Qualifications: Mr. O'Neill has served in several business, mutual fund and financial management roles and directorship positions throughout his career. Mr. O'Neill serves as Director, Medicines for Humanity and Director, The Golisano Children's Museum of Naples, Florida. Mr. O'Neill previously served as Chief Executive Officer and President, Managing Director and Chief Investment Officer, Fleet Investment Advisors; President and Chief Executive Officer, Aeltus Investment Management, Inc.; General Partner, Hellman, Jordan Management Co., Boston, MA; Chief Investment Officer, The Putnam Companies, Boston, MA; Credit Analyst and Lending Officer, Fleet Bank; Director and Consultant, EZE Castle Software (investment order management software); and Director, Midway Pacific (lumber). |
Annual Shareholder Report
Name
Birth Date
Positions Held with Trust
Date Service Began | Principal Occupation(s) for Past Five Years,
Other Directorships Held, Previous Position(s) and Qualifications |
P. Jerome Richey
Birth Date: February 23, 1949
Trustee
Indefinite Term
Began serving: October 2013 | Principal Occupations: Director or Trustee of the Federated Fund Family; Management Consultant.
Other Directorships Held: None.
Qualifications: Mr. Richey has served in several business and legal management roles and directorship positions throughout his career. Mr. Richey most recently held the positions of Senior Vice Chancellor and Chief Legal Officer, University of Pittsburgh. Mr. Richey serves as Board Member, Epilepsy Foundation of Western Pennsylvania and Board member, World Affairs Council of Pittsburgh. Mr. Richey previously served as Chief Legal Officer and Executive Vice President, CONSOL Energy Inc. and Shareholder, Buchanan Ingersoll & Rooney PC (a law firm). |
John S. Walsh
Birth Date: November 28, 1957
Trustee
Indefinite Term
Began serving: January 1999 | Principal Occupations: Director or Trustee of the Federated Fund Family; President and Director, Heat Wagon, Inc. (manufacturer of construction temporary heaters); President and Director, Manufacturers Products, Inc. (distributor of portable construction heaters); President, Portable Heater Parts, a division of Manufacturers Products, Inc.
Other Directorships Held: None.
Qualifications: Mr. Walsh has served in several business management roles and directorship positions throughout his career. Mr. Walsh previously served as Vice President, Walsh & Kelly, Inc. (paving contractors). |
OFFICERS
Name
Birth Date
Address
Positions Held with Trust
Date Service Began | Principal Occupation(s) for Past Five Years
and Previous Position(s) |
John W. McGonigle
Birth Date: October 26, 1938
EXECUTIVE VICE PRESIDENT AND SECRETARY
Officer since: April 1984 | Principal Occupations: Executive Vice President and Secretary of the Federated Fund Family; Vice Chairman, Executive Vice President, Secretary and Director, Federated Investors, Inc.
Previous Positions: Trustee, Federated Investment Management Company and Federated Investment Counseling; Director, Federated Global Investment Management Corp., Federated Services Company and Federated Securities Corp. |
Annual Shareholder Report
Name
Birth Date
Address
Positions Held with Trust
Date Service Began | Principal Occupation(s) for Past Five Years
and Previous Position(s) |
Lori A. Hensler
Birth Date: January 6, 1967
TREASURER
Officer since: April 2013 | Principal Occupations: Principal Financial Officer and Treasurer of the Federated Fund Family; Senior Vice President, Federated Administrative Services; Financial and Operations Principal for Federated Securities Corp. and Edgewood Services, Inc.; and Assistant Treasurer, Federated Investors Trust Company. Ms. Hensler has received the Certified Public Accountant designation.
Previous Positions: Controller of Federated Investors, Inc.; Senior Vice President and Assistant Treasurer, Federated Investors Management Company; Treasurer, Federated Investors Trust Company; Assistant Treasurer, Federated Administrative Services, Federated Administrative Services, Inc., Federated Securities Corp., Edgewood Services, Inc., Federated Advisory Services Company, Federated Equity Management Company of Pennsylvania, Federated Global Investment Management Corp., Federated Investment Counseling, Federated Investment Management Company, Passport Research, Ltd., and Federated MDTA, LLC; Financial and Operations Principal for Federated Securities Corp., Edgewood Services, Inc. and Southpointe Distribution Services, Inc. |
Peter J. Germain
Birth Date: September 3, 1959
CHIEF LEGAL OFFICER
Officer since: January 2005 | Principal Occupations: Mr. Germain is Chief Legal Officer of the Federated Fund Family. He is General Counsel and Vice President, Federated Investors, Inc.; President, Federated Administrative Services and Federated Administrative Services, Inc.; Vice President, Federated Securities Corp.; Secretary, Federated Private Asset Management, Inc.; and Secretary, Retirement Plan Service Company of America. Mr. Germain joined Federated in 1984 and is a member of the Pennsylvania Bar Association.
Previous Positions: Deputy General Counsel, Special Counsel, Managing Director of Mutual Fund Services, Federated Investors, Inc.; Senior Vice President, Federated Services Company; and Senior Corporate Counsel, Federated Investors, Inc. |
Richard B. Fisher
Birth Date: May 17, 1923
VICE PRESIDENT
Officer since: April 1987 | Principal Occupations: Vice Chairman or Vice President of some of the Funds in the Federated Fund Family; Vice Chairman, Federated Investors, Inc.; Chairman, Federated Securities Corp.
Previous Positions: President and Director or Trustee of some of the Funds in the Federated Fund Family; Executive Vice President, Federated Investors, Inc.; Director and Chief Executive Officer, Federated Securities Corp. |
Stephen Van Meter
Birth Date: June 5, 1975
CHIEF COMPLIANCE OFFICER AND SENIOR VICE PRESIDENT
Officer since: July 2015 | Principal Occupations: Senior Vice President and Chief Compliance Officer of the Federated Fund Family; Vice President and Chief Compliance Officer of Federated Investors, Inc. and Chief Compliance Officer of certain of its subsidiaries. Mr. Van Meter joined Federated in October 2011. He holds FINRA licenses under Series 3, 7, 24 and 66.
Previous Positions: Mr. Van Meter previously held the position of Compliance Operating Officer, Federated Investors, Inc. Prior to joining Federated, Mr. Van Meter served at the United States Securities and Exchange Commission in the positions of Senior Counsel, Office of Chief Counsel, Division of Investment Management and Senior Counsel, Division of Enforcement. |
Annual Shareholder Report
Name
Birth Date
Address
Positions Held with Trust
Date Service Began | Principal Occupation(s) for Past Five Years
and Previous Position(s) |
Stephen F. Auth
Birth Date: September 3, 1956
101 Park Avenue
41st Floor
New York, NY 10178
CHIEF INVESTMENT OFFICER
Officer since: November 2002 | Principal Occupations: Stephen F. Auth is Chief Investment Officer of various Funds in the Federated Fund Family; Executive Vice President, Federated Investment Counseling, Federated Global Investment Management Corp. and Federated Equity Management Company of Pennsylvania.
Previous Positions: Executive Vice President, Federated Investment Management Company and Passport Research, Ltd. (investment advisory subsidiary of Federated); Senior Vice President, Global Portfolio Management Services Division; Senior Vice President, Federated Investment Management Company and Passport Research, Ltd.; Senior Managing Director and Portfolio Manager, Prudential Investments. |
Annual Shareholder Report
Evaluation and Approval of Advisory Contract–May 2015
Federated Emerging Markets Equity Fund (the “Fund”)
Following a review and recommendation of approval by the Fund's independent trustees, the Fund's Board reviewed and approved at its May 2015 meetings the Fund's investment advisory contract for an additional one-year term. The Board's decision regarding the contract reflects the exercise of its business judgment on whether to continue the existing arrangements.
In this connection, the Federated Funds' Board had previously appointed a Senior Officer, whose duties include specified responsibilities relating to the process by which advisory fees are to be charged to a Federated fund. The Senior Officer has the authority to retain consultants, experts, or staff as may be reasonably necessary to assist in the performance of his duties, reports directly to the Board, and may be terminated only with the approval of a majority of the independent members of the Board. The Senior Officer prepared and furnished to the Board an independent, written evaluation that covered topics discussed below (the “Evaluation”). The Board considered that Evaluation, along with other information, in deciding to approve the advisory contract.
The Board is also familiar with and considered judicial decisions concerning allegedly excessive investment advisory fees, which have indicated that the following factors may be relevant to an Adviser's fiduciary duty with respect to its receipt of compensation from a fund: the nature and quality of the services provided by the Adviser to a fund and its shareholders, including the performance and expenses of the fund and of comparable funds; the Adviser's cost of providing the services, including the profitability to the Adviser of providing advisory services to a fund; the extent to which the Adviser may realize “economies of scale” as a fund grows larger and, if such economies of scale exist, whether they have been shared with a fund and its shareholders or the family of funds; any “fall-out financial benefits” that accrue to the Adviser because of its relationship with a fund (including research services received from brokers that execute fund trades and any fees paid to affiliates of the Adviser for services rendered to a fund); comparative fee structures, including a comparison of fees paid to the Adviser with those paid by similar funds; and the extent of care, conscientiousness and independence with which the Board members perform their duties and their expertise, including whether they are fully informed about all facts the Board deems relevant to its consideration of the Adviser's services and fees. The Board noted that SEC disclosure requirements regarding the basis for the Board's approval of the Fund's advisory contract generally track the factors listed above. Consistent with these judicial decisions and SEC disclosure requirements, the Board also considered management fees
Annual Shareholder Report
charged to institutional and other clients of the Adviser for what might be viewed as like services. The Board was aware of these factors and was guided by them in its review of the Fund's advisory contract to the extent it considered them to be appropriate and relevant, as discussed further below.
The Board considered and weighed these circumstances in light of its substantial accumulated experience in governing the Fund and working with Federated on matters relating to the Federated funds, and was assisted in its deliberations by independent legal counsel. Throughout the year, and in connection with its May meetings, the Board requested and received substantial and detailed information about the Fund and the Federated organization that was in addition to the extensive materials that comprise and accompany the Senior Officer's Evaluation. Federated provided much of this information at each regular meeting of the Board, and furnished additional substantial information in connection with the May meeting at which the Board's formal review of the advisory contract occurred. At this May meeting, senior management of the Adviser also met with the independent trustees and their counsel to discuss the materials presented and any other matters thought relevant by the Adviser or the trustees. Between regularly scheduled meetings, the Board also received information on particular matters as the need arose. Thus, the Board's consideration of the advisory contract included review of the Senior Officer's Evaluation, accompanying data and additional information covering such matters as: the Adviser's investment philosophy, revenue, profitability, personnel and processes; investment and operating strategies; the Fund's short- and long-term performance (in absolute terms, both on a gross basis and net of expenses, as well as in relationship to its particular investment program and certain competitor or “peer group” funds and/or other benchmarks, as appropriate), and comments on the reasons for performance; the Fund's investment objectives; the Fund's expenses (including the advisory fee itself and the overall expense structure of the Fund, both in absolute terms and relative to similar and/or competing funds, with due regard for contractual or voluntary expense limitations); the use and allocation of brokerage commissions derived from trading the Fund's portfolio securities (if any); and the nature, quality and extent of the advisory and other services provided to the Fund by the Adviser and its affiliates. The Board also considered the preferences and expectations of Fund shareholders; the entrepreneurial risk assumed by the Adviser in sponsoring the funds; the continuing state of competition in the mutual fund industry and market practices; the range of comparable fees for similar funds in the mutual fund industry; the Fund's relationship to the Federated family of funds which include a comprehensive array of funds with different investment objectives, policies and strategies which are available for exchange without the incurrence of additional sales charges; compliance and audit reports concerning the Federated funds and the Federated companies that service them (including communications from regulatory agencies), as well as Federated's responses to any issues raised therein; and relevant developments in
Annual Shareholder Report
the mutual fund industry and how the Federated funds and/or Federated are responding to them. The Board's evaluation process is evolutionary. The criteria considered and the emphasis placed on relevant criteria change in recognition of changing circumstances in the mutual fund marketplace.
While mindful that courts have cautioned against giving such comparisons too much weight, the Board has found the use of comparisons of the Fund's fees and expenses to other mutual funds with comparable investment programs to be relevant. In this regard, the Board was presented with, and considered, information regarding the contractual advisory fee rates, net advisory fee rates and total expense ratios relative to a fund's peers. The Board focused on comparisons with other similar mutual funds more heavily than non-mutual fund products or services because it is believed that they are more relevant. For example, other mutual funds are the products most like the Fund, they are readily available to Fund shareholders as alternative investment vehicles, and they are the type of investment vehicle in fact chosen and maintained by the Fund's investors. The range of their fees and expenses therefore appears to be a relevant indicator of what consumers have found to be reasonable in the precise marketplace in which the Fund competes.
It was noted in the materials for the Board meeting that for the period covered by the Evaluation, the Fund's investment advisory fee was waived in its entirety. The Board reviewed the contractual advisory fee rate, net advisory fee rate and other expenses of the Fund with the Adviser and noted the position of the Fund's fee rates relative to its peers. In this regard, the Board noted that the contractual advisory fee rate was below the median of the relevant peer group, and that it was satisfied that the overall expense structure of the Fund remained competitive.
By contrast, the Senior Officer has reviewed Federated's fees for providing advisory services to products outside the Federated family of funds (e.g., institutional and separate accounts and sub-adviser services). He concluded that mutual funds and institutional accounts are inherently different products. Those differences include, but are not limited to, different types of targeted investors; being subject to different laws and regulations; different legal structures; different average account sizes and portfolio management techniques made necessary by different cash flows and different associated costs; and the time spent by portfolio managers and their teams, funds financial services, legal, compliance and risk management in reviewing securities pricing, addressing different administrative responsibilities, addressing different degrees of risk associated with management and a variety of different costs. The Senior Officer did not consider these fee schedules to be determinative in judging the appropriateness of mutual fund advisory fees.
Annual Shareholder Report
The Fund's ability to deliver competitive performance when compared to its peer group was also deemed to be relevant by the Board as a useful indicator of how the Adviser is executing the Fund's investment program, which in turn was one of the Board's considerations in reaching a conclusion that the nature, extent, and quality of the Adviser's investment management services were such as to warrant continuation of the advisory contract.
The Senior Officer reviewed information compiled by Federated, using data supplied by independent fund ranking organizations, regarding the performance of, and fees charged by, other mutual funds, noting his view that comparisons to fund peer groups may be helpful, though not conclusive, in judging the reasonableness of the proposed fees. The Board considered, in evaluating such comparisons, that in some cases individual funds may exhibit significant and unique differences in their objectives and management techniques when compared to other funds within an industry peer group.
For the periods covered by the Evaluation, the Fund's performance for the three-year period was above the median of the relevant peer group, and the Fund's performance fell below the median of the relevant peer group for the one-year period. The Board discussed the Fund's performance with the Adviser and recognized the efforts being undertaken by the Adviser. The Board will continue to monitor these efforts and the performance of the Fund in the context of the other factors considered relevant by the Board.
The Board also received financial information about Federated, including information regarding the compensation and benefits Federated derived from its relationships with the Federated funds. This information covered not only the fees under the advisory contracts, but also fees received by Federated's subsidiaries for providing other services to the Federated funds under separate contracts (e.g., for serving as the Federated funds' administrator). The information also detailed any indirect benefit Federated may derive from its receipt of research services from brokers who execute Federated fund trades. In addition, the Board considered the fact that, in order for a fund to be competitive in the marketplace, Federated and its affiliates frequently waived fees and/or reimbursed expenses and have disclosed to fund investors and/or indicated to the Board their intention to do so in the future, where appropriate. Moreover, the Board receives regular reporting as to the institution, adjustment or elimination of these voluntary waivers.
In addition, over the past two years, following discussions regarding the Senior Officer's recommendations, Federated made meaningful reductions to the contractual advisory fees for several Funds. At the Board meeting in May 2015, following previous recommendations of the Senior Officer, Federated proposed, and the Board approved, reductions in the contractual advisory fees of certain other Funds.
Annual Shareholder Report
Federated furnished information, requested by the Senior Officer, that reported revenues on a fund-by-fund basis and made estimates of the allocation of expenses on a fund-by-fund basis, using allocation methodologies specified by the Senior Officer. The Senior Officer noted that, while these cost allocation reports apply consistent allocation processes, the inherent difficulties in allocating costs continues to cause the Senior Officer to question the precision of the process and to conclude that such reports may be unreliable, since a single change in an allocation estimate may dramatically alter the resulting estimate of cost and/or profitability of a fund and may produce unintended consequences. The allocation information, including the Senior Officer's view that fund-by-fund estimations may be unreliable, was considered in the analysis by the Board.
The Board and the Senior Officer also reviewed information compiled by Federated comparing profitability information for Federated to other publicly held fund management companies. In this regard, the Senior Officer concluded that Federated's profit margins did not appear to be excessive. The Senior Officer also noted that Federated appeared financially sound, with the resources to fulfill its obligations under its contracts with the Funds.
The Senior Officer's Evaluation also discussed the notion of possible realization of “economies of scale” as a fund grows larger. The Board considered in this regard that the Adviser has made significant and long-term investments in areas that support all of the Federated family of funds, such as personnel and processes for the portfolio management, shareholder services, compliance, internal audit, and risk management functions; and systems technology; and that the benefits of these efforts (as well as any economies of scale, should they exist) were likely to be enjoyed by the fund family as a whole. Federated, as it does throughout the year, and again in connection with the Board's review, furnished information relative to revenue sharing or adviser paid fees. Federated and the Senior Officer noted that this information should be viewed to determine if there was an incentive to either not apply breakpoints or to apply breakpoints at higher levels and should not be viewed to determining the appropriateness of advisory fees, because it would represent marketing and distribution expenses. Finally, the Board also noted the absence of any applicable regulatory or industry guidelines on this subject, which (as discussed in the Senior Officer's Evaluation) is compounded by the lack of any common industry practice or general pattern with respect to structuring fund advisory fees with “breakpoints” that serve to reduce the fee as the fund attains a certain size.
The Senior Officer noted that, subject to the comments and recommendations made within his Evaluation, his observations and the information accompanying the Evaluation supported a finding by the Board that the management fees for each of the funds were reasonable. Under these circumstances, no changes were recommended to, and no objection was raised to, the continuation of the Fund's advisory contract.
Annual Shareholder Report
In its decision to continue an existing investment advisory contract, the Board was mindful of the potential disruptions of the Fund's operations and various risks, uncertainties and other effects that could occur as a result of a decision to terminate or not renew an advisory contract. In particular, the Board recognized that many shareholders have invested in the Fund on the strength of the Adviser's industry standing and reputation and with the expectation that the Adviser will have a continuing role in providing advisory services to the Fund. Thus, the Board's approval of the advisory contract reflected the fact that it is the shareholders who have effectively selected the Adviser by virtue of having invested in the Fund. The Board concluded that, in light of the factors discussed above, including the nature, quality and scope of the services provided to the Fund by the Adviser and its affiliates, continuation of the advisory contract was appropriate.
The Board based its decision to approve the advisory contract on the totality of the circumstances and relevant factors and with a view to past and future long-term considerations. Not all of the factors and considerations identified above were necessarily relevant to the Fund, nor did the Board consider any one of them to be determinative. With respect to the factors that were relevant, the Board's decision to approve the contract reflects its determination that Federated's performance and actions provided a satisfactory basis to support the decision to continue the existing arrangements.
Annual Shareholder Report
Voting Proxies on Fund Portfolio Securities
A description of the policies and procedures that the Fund uses to determine how to vote proxies, if any, relating to securities held in the Fund's portfolio is available, without charge and upon request, by calling 1-800-341-7400. A report on “Form N-PX” of how the Fund voted any such proxies during the most recent 12-month period ended June 30 is available via the Proxy Voting Record (Form N-PX) link associated with the Fund and share class name at www.FederatedInvestors.com/FundInformation. Form N-PX filings are also available at the SEC's website at www.sec.gov.
Quarterly Portfolio Schedule
The Fund files with the SEC a complete schedule of its portfolio holdings, as of the close of the first and third quarters of its fiscal year, on “Form N-Q.” These filings are available on the SEC's website at www.sec.gov and may be reviewed and copied at the SEC's Public Reference Room in Washington, DC. (Call 1-800-SEC-0330 for information on the operation of the Public Reference Room.) You may also access this information via the link to the Fund and share class name at www.FederatedInvestors.com/FundInformation.
Annual Shareholder Report
Mutual funds are not bank deposits or obligations, are not guaranteed by any bank and are not insured or guaranteed by the U.S. government, the Federal Deposit Insurance Corporation, the Federal Reserve Board or any other government agency. Investment in mutual funds involves investment risk, including the possible loss of principal.
This Report is authorized for distribution to prospective investors only when preceded or accompanied by the Fund's Prospectus, which contains facts concerning its objective and policies, management fees, expenses and other information.
Federated Emerging Markets Equity Fund
Federated Investors Funds
4000 Ericsson Drive
Warrendale, PA 15086-7561
Contact us at FederatedInvestors.com
or call 1-800-341-7400.
Federated Securities Corp., Distributor
CUSIP 314172180
Q450778 (1/16)
Federated is a registered trademark of Federated Investors, Inc.
2016 ©Federated Investors, Inc.
Annual Shareholder Report
November 30, 2015
| Share Class | Ticker |
| A | RIMAX |
| B | ICFBX |
| C | ICFFX |
| R | ICFKX |
| Institutional | ICFIX |
| R6 | ICRSX |
Federated InterContinental Fund
Successor to the Rochdale Atlas Portfolio Established 1998
A Portfolio of Federated Equity Funds
Dear Valued Shareholder,
I am pleased to present the Annual Shareholder Report for your fund covering the period from December 1, 2014 through November 30, 2015. This report includes Management's Discussion of Fund Performance, a complete listing of your fund's holdings, performance information and financial statements along with other important fund information.
In addition, our website, FederatedInvestors.com, offers easy access to Federated resources that include timely fund updates, economic and market insights from our investment strategists, and financial planning tools. We invite you to register to take full advantage of its capabilities.
Thank you for investing with Federated. I hope you find this information useful and look forward to keeping you informed.
Sincerely,
J. Christopher Donahue, President
Not FDIC Insured • May Lose Value • No Bank Guarantee
CONTENTS
| 1 |
| 8 |
| 10 |
| 16 |
| 22 |
| 24 |
| 25 |
| 26 |
| 41 |
| 42 |
| 44 |
| 50 |
| 56 |
| 56 |
Management's Discussion of Fund Performance (unaudited)
The total return of Federated InterContinental Fund (the “Fund”), based on net asset value for the 12-month reporting period ended November 30, 2015 (the “reporting period”), was -2.08%, -2.87%, -2.86%, -1.75%, -2.20% and -1.76% for the Class A Shares, Class B Shares, Class C Shares, Institutional Shares, Class R Shares and Class R6 Shares, respectively. The return of the Fund's benchmark, the Morgan Stanley Capital International All Country World ex USA Index1 (MSCI ACWI ex USA), a broad-based securities market index, was -7.32% for the same period. The Fund's total return for the most recently completed fiscal year reflected actual cash flows, transaction costs and other expenses which were not reflected in the total return of the MSCI ACWI ex USA Index.
During the reporting period, the Fund's investment strategy focused on: (a) country allocation; (b) stock selection; and (c) currency allocation. These were the most significant factors affecting the performance relative to the MSCI ACWI ex USA Index.
The following discussion will focus on the performance of the Fund's Institutional Shares.
Market Overview
Global equity markets2 performance was mixed over the reporting period as regional divergence caused large currency moves which impacted overall performance for investors. Outside the U.S., central banks in Canada, Europe and Japan maintained aggressively loose monetary policies in an effort to fight deflation and support economic growth. Meanwhile in the U.S., a stronger economy increased expectations for the first Federal Reserve interest rate hike in almost a decade. The anticipated divergence in global monetary policy drove up the value of the U.S. dollar relative to other major world currencies. Over the reporting period, developed markets, as measured by MSCI EAFE Index,3 rose 6.74% in local terms, but fell for U.S. dollar-based investors -2.94% due to the strong U.S. dollar. Emerging markets4 declined over the reporting period as China's slowing economy and a decline in commodity prices negatively impacted the outlook for global growth. As measured by MSCI Emerging Markets Index,5 emerging markets returned -7.11% in local terms and -16.99% for U.S. dollar-based investors.
The European equity market, as measured by MSCI AC Europe Index,6 returned 6.42% in local terms and -5.26% for U.S. dollar-based investors. Throughout the reporting period, aggressively loose monetary policy by the European Central Bank (ECB) and a weaker euro improved the outlook for economic growth for 2015 and 2016. Despite the mid-year political crisis in Greece, the sovereign debt crisis in the euro area continued to recede as the major economies of Spain and Italy returned to higher growth and lower
Annual Shareholder Report
unemployment. Furthermore, as government budgets have improved and bond yields declined, the impact of fiscal austerity has diminished. As the reporting period ended, the ECB cut deposit rates to a record low -0.30% and extended its 1.1 trillion euro asset purchase program into 2017. Despite geopolitical turmoil (tragic acts of terrorism and a massive influx of refugees), domestic demand in Europe continued to improve, helped by record low interest rates, lower energy costs and a relatively weaker currency.
The Japanese equity market, as measured by MSCI Japan Index,7 returned 11.82% in local terms and 7.65% for U.S. dollar-based investors due to the strong U.S. dollar. Japan's equity market led the major Developed Markets and all Asian markets. Japanese corporate data has been very strong with ongoing earnings acceleration due to the sustained weakness of the yen, lower energy prices and higher consumption driven by a tourist boom. Japanese retail sales increased during the year, Small business confidence rose and the service sector Purchasing Managers' Index (PMI) peaked at 53.7 during the third quarter, its highest level in nearly two years. Japanese structural reforms under the “three arrows” of Abenomics were slowly changing the economic landscape; however, persistent zero-to-low real economic growth continued to trouble policy makers. The Bank of Japan remained accommodative with an open commitment to maintain asset purchases of 80 trillion yen per month. Abenomics 2.0 is expected to be released in 2016.
While the major developed markets were growing modestly, there were signs of a deceleration and slowing trade in several emerging markets. After a decade of double-digit growth driven by fixed asset investment and a mercantilist dependence on global trade, the Chinese government's decision to transform to a more consumption-based economy has slowed the pace of growth. While in the long-term, this economic rebalancing is positive, in the near-term, it has resulted in slower Chinese economic activity and reduced the global demand for fixed assets and commodities. Countries whose economies benefited from commodity exports to China, such as Russia and Brazil, are now expecting recessions. The volatility of the local Chinese A-share market and the government's sudden weakening of the Chinese yuan in August has fueled worries about economic stability. After a strong start to the reporting period, Chinese equities, as measured by MSCI China,8 returned -5.53%. As with most developed economies, many emerging market central banks continue to ease monetary conditions by cutting interest rates and adding liquidity. For example, the People's Bank of China continues to ease monetary policy using multiple measures to stimulate the economy such as cutting the benchmark one-year lending rate the fifth time since November 2014 and lowering the reserve requirement for banks by 0.50%.
Chinese economic weakness impacted South Korea, which experienced an overall drop in total exports for the first time in six years. In Taiwan, weaker exports to China were offset by stronger domestic demand amid a stable job market and rising household incomes. During the reporting period, the MSCI
Annual Shareholder Report
Taiwan and MSCI South Korea returned -12.96% and -7.21%, respectively, in U.S. dollar terms.7 An economic bright spot for the emerging markets was South East Asia. Solid domestic demand drove recoveries in India, Indonesia, and Thailand, which were also boosted by more responsible monetary and fiscal policies, and renewed political stability. Despite positive economic and reform progress, the stock markets and currencies declined during the reporting period amid a broad sell-off in emerging market assets.
For the reporting period, the MSCI USA Index7 (2.10%) outperformed both the MSCI EAFE Index (-2.94%) and MSCI Emerging Markets Index (-16.99%). Broadly across the world, there was a wide divergence amongst country returns as measured by the respective MSCI country indices.7 Within developed markets, the best performing major economy was MSCI Japan (7.65%), which was less impacted by currency depreciation. Within the euro area (and euro pegged currencies), the depreciation of the euro by 15.3% versus the U.S. dollar was a major contributor to returns. Within the region, only MSCI Ireland (12.90%), MSCI Denmark (12.80%) and MSCI Belgium (10.01%) had positive returns.7 The major developed economies which underperformed the most were the ones most exposed to commodities and emerging markets: MSCI Canada (-20.02%), MSCI Singapore (-18.71%), MSCI Spain (-17.04%) and MSCI Norway (-15.52%). Within emerging markets, no major market had positive returns. The top performers were the ones with the strongest currencies: MSCI China (-5.53%), MSCI South Korea (-7.21%) and MSCI Philippines (-7.41%). Laggards in the emerging markets were MSCI Brazil (-45.10%), MSCI Colombia (-46.42%) and MSCI Greece (-67.93%).
FUND PERFORMANCE
Country allocation remained a key driver of performance for the reporting period, as it consistently has been in the past. The Fund maintained exposure to select healthy, high sovereign quality, developed and emerging markets.
In Japan, positive performance was driven by the combination of the Fund's overweight allocation to Japanese equities and underweight currency exposure through a short of the yen versus the U.S. dollar. Japanese pharmaceuticals developer Shionogi & Co. (79.0%) was the Fund's top contributor. Broadly, exporters were the primary beneficiaries of the weaker yen. For example, the Fund's holdings in Fuji Heavy Industries (16.1%) benefited from strong demand for its Subaru brand of cars while Murata Manufacturing Company (45.0%), an electronic component producer, saw strong demand from global smart phone and tablet manufacturers. Domestic retail and travel related stocks also turned in strong performance as a growing Chinese middle class took advantage of the weaker yen and looser visa requirements to visit Japan. Internet travel booking company Ikyu Corporation (59.1%) and hotel group Resorttrust Inc. (31.5%) were among the Fund's top performers.
Annual Shareholder Report
Contributions from Europe were mixed during the reporting period. Danish companies sensitive to the improvement in regional economic growth and lower fuel costs such as transportation company DSV A/S (24.5%) outperformed. Danish pharmaceutical company Novo Nordisk A/S also outperformed due to continued global demand for its diabetes medications. Ireland and Germany also benefited from an improving European domestic growth outlook. Irish construction equipment company, CRH PLC (26.6%), and German broadcaster, Prosiebensat 1 Media SE (17.5%), rose during the period. Elsewhere in Europe, the Fund's positioning in Austria and Sweden contributed negatively to results. Austrian bank Erste Group Bank AG (-12.4%) and steel maker Voestalpine AG (-25.1%) underperformed. Swedish industrials Volvo AB (-3.71%) and SKF AB (-28.9%) hurt Fund performance. In Turkey, the reporting period began with an improvement in the economic outlook as inflation stabilized and the central bank cut rates. However, over the summer, with a failed election, political instability weighed on the market. The Fund's overweight position to Turkey contributed negatively to performance. Finally, an overweight position in Italy led by banking service company Cerved Information Solutions SpA (45.8%) and Luxottica Group SpA (27.0%) contributed positively to Fund performance, while an underweight position in France contributed negatively.
The Fund's underweight allocation to major commodity producing countries helped performance. The Fund maintained underweights to Australia, Canada, Russia and South Africa. Overcapacity and slowing global growth drove commodity prices broadly lower as Brent crude oil and copper slumped, -40.9% and -27.8%, respectively. The Fund was overweight to Norway, which is a large oil and gas producing country; however, stock selection and currency hedging benefited performance. Royal Caribbean Cruises Ltd. (27.6%) outperformed on rising demand and lower operating costs.
The Fund maintained its largest underweight to emerging market countries in many years, which generally helped performance as emerging markets broadly underperformed developed markets. The biggest positive contribution came from our zero weight in Brazil which declined -45.1%, as measured by MSCI Brazil. In China and Thailand, poor timing and asset selection hurt performance.
During the reporting period, the Fund hedged some currencies using currency forwards.9 The overall net returns of the currency forward positions contributed positively to Fund performance. Positive contribution from a short position in the Canadian dollar (versus the U.S. dollar), a short position in the Japanese yen (versus the U.S. dollar), a short position in the Norwegian krone (versus the U.S. dollar) and a short position in the euro (versus the U.S. dollar) aided performance while a long position in the Swiss franc (versus the euro) was a drag on performance.
Annual Shareholder Report
| 1 | Please see the footnotes to the line graphs under “Fund Performance and Growth of a $10,000 Investment” below for the definition of, and more information about, the MSCI ACWI ex USA. |
| 2 | International investing involves special risks including currency risk, increased volatility of foreign securities, political risks and differences in auditing and other financial standards. International small company stocks may be less liquid and subject to greater price volatility than international large company stocks. |
| 3 | The MSCI EAFE Index is an equity index which captures large-and mid-cap representation across developed markets countries around the world, excluding the United States and Canada. With 906 constituents, the index covers approximately 85% of the free float-adjusted market capitalization in each country. The index is unmanaged, and it is not possible to invest directly in an index. |
| 4 | Prices of emerging markets securities can be significantly more volatile than the prices of securities in developed countries, and currency risk and political risks are accentuated in emerging markets. |
| 5 | The MSCI Emerging Markets Index captures large- and mid-cap representation across 23 emerging market countries. The index covers approximately 85% of the free float-adjusted market capitalization in each country. The index is unmanaged, and it is not possible to invest directly in an index. |
| 6 | The MSCI AC Europe Index captures large- and mid-cap representation across 15 developed market countries and six emerging market countries in Europe. The index covers approximately 85% of the free float-adjusted market capitalization in each country. The index is unmanaged, and it is not possible to invest directly in an index. |
| 7 | The MSCI country indexes are designed to measure the performance of the large- and mid-cap segments of the respective country's market. The index covers approximately 85% of the free float-adjusted market capitalization in each country. The index is unmanaged, and it is not possible to invest directly in an index. |
| 8 | The MSCI China Index captures large- and mid-cap representation across China H shares, B shares, Red chips and P chips. The index covers about 85% of this China equity universe. The index is unmanaged, and it is not possible to invest directly in an index. |
| 9 | The Fund's use of derivative instruments, such as currency forwards, involves risks different from, or possibly greater than, the risks associated with investing directly in securities or other traditional instruments. |
Annual Shareholder Report
FUND PERFORMANCE AND GROWTH OF A $10,000 INVESTMENT1
The graph below illustrates the hypothetical investment of $10,0002 in the Federated InterContinental Fund from November 30, 2005 to November 30, 2015, compared to the MSCI ACWI ex USA.3 The Average Annual Total Return table below shows returns for each class averaged over the stated periods.
Growth of a $10,000 Investment
Growth of $10,000 as of November 30, 2015
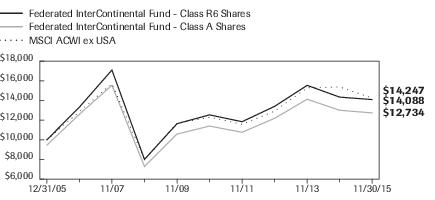
| Federated InterContinental Fund - | Class R6 Shares | Class A Shares | MSCI ACWI ex USA |
| F | F | I |
| 12/31/2005 | 10,000 | 9,450 | 10,000 |
| 12/31/2006 | 13,322 | 12,593 | 12,873 |
| 11/30/2007 | 17,093 | 15,541 | 15,712 |
| 11/30/2008 | 8,008 | 7,281 | 7,980 |
| 11/30/2009 | 11,639 | 10,582 | 11,684 |
| 11/30/2010 | 12,534 | 11,396 | 12,298 |
| 11/30/2011 | 11,840 | 10,765 | 11,573 |
| 11/30/2012 | 13,403 | 12,186 | 12,922 |
| 11/30/2013 | 15,535 | 14,124 | 15,279 |
| 11/30/2014 | 14,340 | 13,004 | 15,372 |
| 11/30/2015 | 14,088 | 12,734 | 14,247 |
41 graphic description end -->
| ■ | Total returns shown for Class A Shares include the maximum sales charge of 5.50% ($10,000 investment minus $550 sales charge = $9,450). |
The Fund offers multiple share classes whose performance may be greater than or less than its other share class(es) due to differences in sales charges and expenses. See the Average Annual Return table below for the returns of additional classes not shown in the line graph above.
Average Annual Total Returns for the Period Ended 11/30/2015
(returns reflect all applicable sales charges and contingent deferred sales charges as specified below in footnote #2)
| | 1 Year | 5 Years | 10 Years |
| Class A Shares | -7.46% | 1.09% | 2.84% |
| Class B Shares | -8.21% | 1.05% | 2.81% |
| Class C Shares | -3.83% | 1.44% | 2.66% |
| Class R Shares | -2.20% | 2.10% | 3.16% |
| Institutional Shares | -1.75% | 2.57% | 3.70% |
| Class R6 Shares4 | -1.76% | 2.36% | 3.49% |
| MSCI ACWI ex USA | -7.32% | 2.99% | 3.60% |
Annual Shareholder Report
Performance data quoted represents past performance which is no guarantee of future results. Investment return and principal value will fluctuate so that an investor's shares, when redeemed, may be worth more or less than their original cost. Mutual fund performance changes over time and current performance may be lower or higher than what is stated. For current to the most recent month-end performance and after-tax returns, visit FederatedInvestors.com or call 1-800-341-7400. Returns shown do not reflect the deduction of taxes that a shareholder would pay on Fund distributions or the redemption of Fund shares. Mutual funds are not obligations of or guaranteed by any bank and are not federally insured.
| 1 | Federated InterContinental Fund is the successor to Rochdale Atlas Portfolio pursuant to a reorganization that took place on August 24, 2007. Shareholders of the Rochdale Atlas Portfolio received Class A Shares of the Fund as a result of the reorganization. The information presented above, for the periods prior to August 24, 2007, is historical information for Rochdale Atlas Portfolio. The fiscal year end of Rochdale Atlas Portfolio was December 31. The Fund's Class B, Class C, Class R and Institutional Shares commenced operations on August 25, 2007. For the period prior to the commencement of operations of the Fund's Class B Shares, Class C Shares and Class R Shares, the performance information shown is for the Fund's Class A Shares, adjusted to reflect the expenses of each new share class. For the period prior to the commencement of operations of Institutional Shares, the performance information shown is for the Fund's Class A Shares. The performance of the Class A Shares has not been adjusted to reflect the expenses of the Institutional Shares since the Institutional Shares have a lower expense ratio than the expense ratio of the Class A Shares. The performance of the Class A Shares has been adjusted to remove any voluntary waiver of Fund expenses related to the Class A Shares that may have occurred during the period prior to the commencement of operations of the Institutional Shares. The Fund's Class R6 Shares commenced operations on August 5, 2013. For the period prior to commencement of operations of the Class R6 Shares, the performance information shown is for Class A Shares. The performance of the Class A Shares has not been adjusted to reflect the expenses of the Class R6 Shares since the Class R6 Shares have a lower expense ratio than the expense ratio of the Class A Shares. Additionally, the performance information shown has been adjusted to reflect the absence of sales charges applicable to Class A Shares. |
| 2 | Represents a hypothetical investment of $10,000 in the Fund after deducting applicable sales charges: For Class A Shares, the maximum sales charge of 5.50% ($10,000 investment minus $550 sales charge = $9,450); For Class B Shares, the maximum contingent deferred sales charge is 5.50% on any redemption less than one year from purchase date; For Class C Shares, the maximum contingent deferred sales charge is 1.00% on any redemption less than one year from purchase date. The Fund's performance assumes the reinvestment of all dividends and distributions. The MSCI ACWI ex USA has been adjusted to reflect reinvestment of dividends on securities in the index. |
| 3 | The MSCI ACWI ex USA captures large- and mid-cap representation across 22 of 23 developed markets countries (excluding the United States) and 21 emerging markets countries. The index covers approximately 85% of the global equity opportunity set outside the United States. The index is not adjusted to reflect sales loads, expenses or other fees that the Securities and Exchange Commission (SEC) requires to be reflected in the Fund's performance. The index is unmanaged and, unlike the Fund, is not affected by cash flows. It is not possible to invest directly in an index. |
| 4 | The Fund's Class R6 Shares commenced operations on August 5, 2013. For the period prior to commencement of operations of the Class R6 Shares, the performance information shown is for Class A Shares. The performance of the Class A Shares has not been adjusted to reflect the expenses of the Class R6 Shares since the Class R6 Shares have a lower expense ratio than the expense ratio of the Class A Shares. Additionally, the performance information shown has been adjusted to reflect the absence of sales charges applicable to Class A Shares. |
Annual Shareholder Report
Portfolio of Investments Summary Tables (unaudited)
At November 30, 2015, the Fund's portfolio composition1 was as follows:
| Country | Percentage of
Total Net Assets |
| Japan | 33.1% |
| Germany | 13.0% |
| Denmark | 9.9% |
| Sweden | 9.2% |
| Netherlands | 7.4% |
| Ireland | 6.2% |
| Mexico | 5.4% |
| Norway | 5.3% |
| Austria | 3.3% |
| Italy | 3.0% |
| Czech Republic | 1.1% |
| Hungary | 0.8% |
| Taiwan | 0.0%2 |
| Securities Lending Collateral3 | 0.6% |
| Cash Equivalents4 | 0.9% |
| Derivative Contracts5 | 1.1% |
| Other Assets and Liabilities—Net6 | (0.3)% |
| TOTAL | 100.0% |
| 1 | Country allocations are based primarily on the country in which a company is incorporated. However, the Fund's Adviser may allocate a company to a country based on other factors such as location of the company's principal office, the location of the principal trading market for the company's securities or the country where a majority of the company's revenues are derived. |
| 2 | Represents less than 0.1%. |
| 3 | Represents cash collateral received from portfolio securities on loan which are invested in short-term investments such as repurchase agreements or money market funds. |
| 4 | Cash Equivalents include any investments in money market mutual funds and/or overnight repurchase agreements. |
| 5 | Based upon net unrealized appreciation (depreciation) or value of the derivative contracts as applicable. Derivative contracts may consist of futures, forwards, options and swaps. The impact of a derivative contract on the Fund's performance may be larger than its unrealized appreciation (depreciation) or value may indicate. In many cases, the notional value or amount of a derivative contract may provide a better indication of the contract's significance to the portfolio. More complete information regarding the Fund's direct investments in derivative contracts, including unrealized appreciation (depreciation), value and notional values or amounts of such contracts, can be found in the table at the end of the Portfolio of Investments included in this Report. |
| 6 | Assets, other than investments in securities and derivative contracts, less liabilities. See Statement of Assets and Liabilities. |
Annual Shareholder Report
At November 30, 2015, the Fund's sector classification composition7 was as follows:
| Sector Classification | Percentage of
Total Net Assets |
| Consumer Discretionary | 24.1% |
| Financials | 22.2% |
| Industrials | 13.9% |
| Information Technology | 8.8% |
| Health Care | 8.1% |
| Materials | 7.0% |
| Consumer Staples | 6.7% |
| Energy | 3.6% |
| Utilities | 1.8% |
| Telecommunication Services | 1.5% |
| Securities Lending Collateral3 | 0.6% |
| Cash Equivalents4 | 0.9% |
| Derivative Contracts5 | 1.1% |
| Other Assets and Liabilities—Net6 | (0.3)% |
| TOTAL | 100.0% |
| 7 | Except for, Derivative Contracts and Other Assets and Liabilities, sector classifications are based upon, and individual securities assigned to, the classifications of the Global Industry Classification Standard (GICS) except that the Adviser assigns a classification to securities not classified by the GICS and to securities for which the Adviser does not have access to the classification made by the GICS. |
Annual Shareholder Report
Portfolio of Investments
November 30, 2015
| Shares | | | Value in
U.S. Dollars |
| | | COMMON STOCKS—97.7% | |
| | | Austria—3.3% | |
| 74,000 | 1 | Erste Group Bank AG | $2,268,789 |
| 24,000 | | OMV AG | 684,727 |
| 107,700 | | UNIQA Insurance Group AG | 955,687 |
| 39,300 | | Voestalpine AG | 1,277,849 |
| 71,484 | | Wienerberger AG | 1,254,777 |
| | | TOTAL | 6,441,829 |
| | | Czech Republic—1.1% | |
| 48,000 | | CEZ AS | 872,067 |
| 6,100 | | Komercni Banka AS | 1,238,417 |
| | | TOTAL | 2,110,484 |
| | | Denmark—9.9% | |
| 1,108 | | A.P. Moeller - Maersk A/S, Class B | 1,689,304 |
| 152,200 | | Danske Bank A/S | 4,078,033 |
| 97,432 | | DSV, De Sammensluttede Vognmad A/S | 3,783,150 |
| 30,000 | | ISS A/S | 1,045,081 |
| 18,129 | | NKT Holding A/S | 894,153 |
| 97,100 | | Novo Nordisk A/S, ADR | 5,337,587 |
| 24,050 | | Sydbank A/S | 788,490 |
| 26,600 | | Vestas Wind Systems A/S | 1,732,566 |
| | | TOTAL | 19,348,364 |
| | | Germany—13.0% | |
| 16,600 | | Allianz SE | 2,939,743 |
| 15,300 | | BASF SE | 1,266,333 |
| 23,200 | | Bayer AG | 3,095,816 |
| 37,700 | | Daimler AG | 3,373,227 |
| 60,703 | 1,2,3 | Deutsche Pfandbriefbank AG | 702,076 |
| 157,500 | | Deutsche Telekom AG, Class REG | 2,905,338 |
| 49,800 | 1 | Dialog Semiconductor PLC | 1,856,153 |
| 10,000 | | HeidelbergCement AG | 796,025 |
| 6,400 | | Henkel AG & Co. KGaA | 726,738 |
| 61,000 | | ProSiebenSat.1 Media SE | 3,202,683 |
| 27,000 | | SAP SE | 2,126,419 |
| 10,100 | | Siemens AG | 1,046,379 |
Annual Shareholder Report
| Shares | | | Value in
U.S. Dollars |
| | | COMMON STOCKS—continued | |
| | | Germany—continued | |
| 20,500 | | Symrise AG | $1,387,573 |
| | | TOTAL | 25,424,503 |
| | | Hungary—0.8% | |
| 9,900 | | MOL Hungarian Oil & Gas PLC | 453,595 |
| 56,300 | | OTP Bank PLC | 1,160,943 |
| | | TOTAL | 1,614,538 |
| | | Ireland—6.2% | |
| 8,337,000 | 1 | Bank of Ireland PLC | 3,107,235 |
| 148,759 | | CRH PLC | 4,364,762 |
| 40,500 | | Kerry Group PLC, Class A | 3,266,937 |
| 52,000 | | Smurfit Kappa Group PLC | 1,419,969 |
| | | TOTAL | 12,158,903 |
| | | Italy—3.0% | |
| 30,400 | | Azimut Holding SpA | 775,284 |
| 189,100 | | Cerved Information Solutions SpA | 1,426,130 |
| 90,943 | 1 | Fiat Chrysler Automobiles NV | 1,296,855 |
| 16,000 | | Luxottica Group SpA | 1,068,834 |
| 216,630 | | UniCredit SpA | 1,269,941 |
| | | TOTAL | 5,837,044 |
| | | Japan—33.1% | |
| 105,300 | | Aisin Seiki Co. Ltd. | 4,221,274 |
| 51,800 | | Alps Electric Co. Ltd. | 1,631,126 |
| 260,000 | | ANA Holdings, Inc. | 732,563 |
| 76,300 | | Chugai Pharmaceutical Co. Ltd. | 2,667,204 |
| 26,000 | | Disco Corp. | 2,496,764 |
| 30,000 | | Don Quijote Holdings Co. Ltd. | 1,189,555 |
| 37,000 | | Doutor Nichires Holdings Co. Ltd. | 576,550 |
| 103,100 | | Fuji Heavy Industries Ltd. | 4,268,868 |
| 33,600 | | H.I.S. Co. Ltd. | 1,091,686 |
| 518,000 | | Hitachi Ltd. | 3,060,978 |
| 151,500 | | Honda Motor Co. Ltd. | 4,950,599 |
| 173 | | Hoshino Resorts REIT, Inc. | 1,705,789 |
| 61,800 | 4 | Ikyu Corp. | 1,221,517 |
| 20,600 | | Japan Airlines Co. Ltd. | 705,259 |
| 3,100 | | Japan Hotel REIT Investment Corp. | 2,260,302 |
| 307,000 | | Kawasaki Heavy Industries Ltd. | 1,220,922 |
| 291,000 | | Kubota Corp. | 4,860,669 |
Annual Shareholder Report
| Shares | | | Value in
U.S. Dollars |
| | | COMMON STOCKS—continued | |
| | | Japan—continued | |
| 57,000 | | Kyowa Hakko Kirin Co. Ltd. | $1,005,212 |
| 25,600 | | Murata Manufacturing Co. Ltd. | 3,978,716 |
| 383,000 | | Nippon Express Co. Ltd. | 1,731,551 |
| 31,200 | | Oriental Land Co. Ltd. | 1,775,663 |
| 510,000 | | Osaka Gas Co. Ltd. | 1,895,005 |
| 69,500 | | Resorttrust, Inc. | 1,856,648 |
| 263,600 | | Sekisui House Ltd. | 4,462,976 |
| 87,300 | | Shionogi and Co. Ltd. | 3,851,167 |
| 91,400 | | Sumitomo Mitsui Financial Group, Inc. | 3,491,030 |
| 77,300 | | Yamaha Motor Co. Ltd. | 1,890,278 |
| | | TOTAL | 64,799,871 |
| | | Mexico—5.4% | |
| 330,000 | | Alpek SAB de CV | 524,513 |
| 375,000 | | Alsea SAB de CV | 1,337,294 |
| 323,900 | | Fibra Uno Administracion SA de CV | 755,130 |
| 10,500 | | Fomento Economico Mexicano SAB de CV, ADR | 1,011,990 |
| 46,000 | | Gruma SAB de CV, Class B | 669,374 |
| 6,900 | | Grupo Aeroportuario del Sureste SAB de CV, Class B, ADR | 1,042,038 |
| 355,000 | | Grupo Financiero Banorte SAB de CV | 1,903,669 |
| 435,000 | | Grupo Lala SAB de CV | 1,044,058 |
| 152,000 | | Infraestructura Energetica Nova SAB de CV | 665,918 |
| 85,000 | | Nuevo Grupo Mexico SAB de CV, Class B | 185,553 |
| 575,000 | | Wal-Mart de Mexico SAB de CV | 1,528,177 |
| | | TOTAL | 10,667,714 |
| | | Netherlands—7.4% | |
| 27,400 | 1,2,3 | ABN AMRO Group NV, GDR | 575,513 |
| 5,931 | | Akzo Nobel NV | 421,453 |
| 9,300 | | ASML Holding NV | 862,296 |
| 35,000 | | BG Group PLC | 543,737 |
| 18,000 | 2,3 | Grandvision NV | 489,383 |
| 25,500 | | Heineken NV | 2,265,571 |
| 181,000 | | ING Groep NV | 2,482,478 |
| 50,106 | 1,2,3 | Intertrust NV | 947,614 |
| 35,600 | | Koninklijke Philips NV | 972,656 |
| 20,000 | | NN Group NV | 682,784 |
| 9,700 | | Randstad Holdings NV | 606,010 |
| 46,500 | | Royal Dutch Shell PLC, Class A, ADR | 2,313,840 |
Annual Shareholder Report
| Shares | | | Value in
U.S. Dollars |
| | | COMMON STOCKS—continued | |
| | | Netherlands—continued | |
| 31,500 | | Unilever NV | $1,380,583 |
| | | TOTAL | 14,543,918 |
| | | Norway—5.3% | |
| 112,377 | | DNB Bank ASA | 1,478,406 |
| 41,900 | | Royal Caribbean Cruises Ltd. | 3,880,359 |
| 196,043 | | Statoil ASA | 3,022,069 |
| 43,242 | | Yara International ASA | 2,000,547 |
| | | TOTAL | 10,381,381 |
| | | Sweden—9.2% | |
| 94,600 | | Hennes & Mauritz AB, Class B | 3,506,423 |
| 240,200 | | Husqvarna AB, Class B | 1,564,618 |
| 50,000 | | JM AB, Class B | 1,458,184 |
| 163,067 | 1,2,3 | Nordax Group AB | 904,684 |
| 233,000 | | Nordea Bank AB | 2,580,057 |
| 192,600 | | Peab AB | 1,469,726 |
| 150,400 | | Skandinaviska Enskilda Banken AB, Class A | 1,598,211 |
| 45,000 | | SKF AB, Class B | 784,063 |
| 67,043 | | Swedbank AB, Class A | 1,483,467 |
| 111,000 | | Telefonaktiebolaget LM Ericsson, Class B | 1,080,189 |
| 162,200 | | Volvo AB, Class B | 1,675,959 |
| | | TOTAL | 18,105,581 |
| | | Taiwan—0.0% | |
| 27,725 | | Hon Hai Precision Industry Co. Ltd. | 71,212 |
| | | TOTAL COMMON STOCKS
(IDENTIFIED COST $171,164,190) | 191,505,342 |
| | | INVESTMENT COMPANIES—1.5%5 | |
| 1,272,586 | 6 | Federated Money Market Management, Institutional Shares, 0.20%7 | 1,272,586 |
| 1,678,225 | | Federated Prime Value Obligations Fund, Institutional Shares, 0.17%7 | 1,678,225 |
| | |
TOTAL INVESTMENT COMPANIES
(AT NET ASSET VALUE) | 2,950,811 |
| | | TOTAL INVESTMENTS—99.2%
(IDENTIFIED COST $174,115,001)8 | 194,456,153 |
| | | OTHER ASSETS AND LIABILITIES - NET—0.8%9 | 1,605,646 |
| | | TOTAL NET ASSETS—100% | $196,061,799 |
Annual Shareholder Report
At November 30, 2015, the Fund had the following open futures contracts:
| Description | Number of
Contracts | Notional
Value | Expiration
Date | Unrealized
(Depreciation) |
| 1BIST30 Index, Long Futures | 584 | $1,876,337 | December 2015 | $(108,138) |
At November 30, 2015, the Fund had the following outstanding foreign exchange contracts:
| Settlement Date | Counterparty | Foreign Currency
Units to
Receive/Deliver | In
Exchange
For | Unrealized
Appreciation
(Depreciation) |
| Contracts Purchased: | | | | |
| 12/15/2015 | Citibank | 9,928,000 EUR | $10,637,000 | $(141,839) |
| 1/27/2016 | Goldman Sachs | 12,851,053 CHF | $13,270,000 | $(728,895) |
| Contracts Sold: | | | | |
| 12/15/2015 | Citibank | 22,709,000 EUR | $25,721,917 | $1,715,609 |
| 12/15/2015 | Citibank | 9,928,000 EUR | $11,051,750 | $556,589 |
| 12/15/2015 | HSBC | 4,309,414,000 JPY | $35,994,872 | $964,731 |
| NET UNREALIZED APPRECIATION ON FOREIGN EXCHANGE CONTRACTS | $2,366,195 |
Net Unrealized Appreciation on Futures Contracts and Foreign Exchange Contracts is included in “Other Assets and Liabilities—Net.”
| 1 | Non-income-producing security. |
| 2 | Denotes a restricted security that either: (a) cannot be offered for public sale without first being registered, or being able to take advantage of an exemption from registration, under the Securities Act of 1933; or (b) is subject to a contractual restriction on public sales. At November 30, 2015, these restricted securities amounted to $3,619,270, which represented 1.8% of total net assets. |
| 3 | Denotes a restricted security that may be resold without restriction to “qualified institutional buyers” as defined in Rule 144A under the Securities Act of 1933 and that the Fund has determined to be liquid under criteria established by the Fund's Board of Trustees (the “Trustees”). At November 30, 2015, these liquid restricted securities amounted to $3,619,270, which represented 1.8% of total net assets. |
| 4 | All or a portion of this security is temporarily on loan to unaffiliated broker/dealers. |
| 5 | Affiliated holdings. |
| 6 | All of a portion of this security is held as collateral for securities lending. |
| 7 | 7-day net yield. |
| 8 | The cost of investments for federal tax purposes amounts to $174,631,333. |
| 9 | Assets, other than investments in securities, less liabilities. See Statement of Assets and Liabilities. |
Note: The categories of investments are shown as a percentage of total net assets at November 30, 2015.
Annual Shareholder Report
Various inputs are used in determining the value of the Fund's investments. These inputs are summarized in the three broad levels listed below:
Level 1—quoted prices in active markets for identical securities.
Level 2—other significant observable inputs (including quoted prices for similar securities, interest rates, prepayment speeds, credit risk, etc.). Also includes securities valued at amortized cost.
Level 3—significant unobservable inputs (including the Fund's own assumptions in determining the fair value of investments).
The inputs or methodology used for valuing securities are not an indication of the risk associated with investing in those securities.
The following is a summary of the inputs used, as of November 30, 2015, in valuing the Fund's assets carried at fair value:
| Valuation Inputs |
| | Level 1—
Quoted
Prices | Level 2—
Other
Significant
Observable
Inputs | Level 3—
Significant
Unobservable
Inputs | Total |
| Equity Securities: | | | | |
| Common Stocks | | | | |
| International | $23,061,796 | $168,443,5461 | $— | $191,505,342 |
| Investment Companies | 2,950,811 | — | — | 2,950,811 |
| TOTAL SECURITIES | $26,012,607 | $168,443,546 | $— | $194,456,153 |
| Other Financial Instruments:2 | | | | |
| Assets | $— | $3,236,929 | $— | $3,236,929 |
| Liabilities | (108,138) | (870,734) | — | (978,872) |
| TOTAL OTHER FINANCIAL INSTRUMENTS | $(108,138) | $2,366,195 | $— | $2,258,057 |
| 1 | Includes $110,463,667 of securities transferred from Level 1 to Level 2 because fair value factors were applied to equity securities traded principally in foreign markets to account for significant post market close activity. Transfers shown represent the value of the securities at the beginning of the period. |
| 2 | Other financial instruments include futures contracts and foreign exchange contracts. |
The following acronyms are used throughout this portfolio:
| ADR | —American Depositary Receipt |
| CHF | —Swiss Franc |
| EUR | —Euro |
| GDR | —Global Depositary Receipt |
| JPY | —Japanese Yen |
| REIT | —Real Estate Investment Trust |
See Notes which are an integral part of the Financial Statements
Annual Shareholder Report
Financial Highlights–Class A Shares
(For a Share Outstanding Throughout Each Period)
| Year Ended November 30 | 2015 | 2014 | 2013 | 2012 | 2011 |
| Net Asset Value, Beginning of Period | $50.08 | $55.05 | $48.01 | $42.91 | $45.68 |
| Income From Investment Operations: | | | | | |
| Net investment income1 | 0.60 | 0.55 | 0.56 | 0.68 | 0.60 |
| Net realized and unrealized gain (loss) on investments, futures contracts and foreign currency transactions | (1.64) | (4.87) | 7.02 | 4.89 | (3.09) |
| TOTAL FROM INVESTMENT OPERATIONS | (1.04) | (4.32) | 7.58 | 5.57 | (2.49) |
| Less Distributions: | | | | | |
| Distributions from net investment income | (0.20) | (0.65) | (0.54) | (0.47) | (0.28) |
| Net Asset Value, End of Period | $48.84 | $50.08 | $55.05 | $48.01 | $42.91 |
| Total Return2 | (2.08 )% | (7.93 )% | 15.91% | 13.20% | (5.54)% |
| Ratios to Average Net Assets: | | | | | |
| Net expenses | 1.30%3 | 1.29% | 1.40% | 1.48% | 1.48%3 |
| Net investment income | 1.19% | 1.03% | 1.11% | 1.52% | 1.21% |
| Expense waiver/reimbursement4 | 0.30% | 0.21% | 0.11% | 0.07% | 0.07% |
| Supplemental Data: | | | | | |
| Net assets, end of period (000 omitted) | $79,404 | $112,358 | $296,381 | $262,870 | $290,181 |
| Portfolio turnover | 49% | 64% | 58% | 54% | 53% |
| 1 | Per share numbers have been calculated using the average shares method. |
| 2 | Based on net asset value, which does not reflect the sales charge, redemption fee or contingent deferred sales charge, if applicable. |
| 3 | The net expense ratio is calculated without reduction for expense offset arrangements. The net expense ratios are 1.30% and 1.48% for the years ended November 30, 2015 and 2011, respectively, after taking into account these expense reductions. |
| 4 | This expense decrease is reflected in both the net expense and net investment income ratios shown above. |
See Notes which are an integral part of the Financial Statements
Annual Shareholder Report
Financial Highlights–Class B Shares
(For a Share Outstanding Throughout Each Period)
| Year Ended November 30 | 2015 | 2014 | 2013 | 2012 | 2011 |
| Net Asset Value, Beginning of Period | $49.85 | $54.75 | $47.72 | $42.59 | $45.45 |
| Income From Investment Operations: | | | | | |
| Net investment income1 | 0.23 | 0.19 | 0.18 | 0.31 | 0.15 |
| Net realized and unrealized gain (loss) on investments, futures contracts, and foreign currency transactions | (1.66) | (4.91) | 6.95 | 4.93 | (3.01) |
| TOTAL FROM INVESTMENT OPERATIONS | (1.43) | (4.72) | 7.13 | 5.24 | (2.86) |
| Less Distributions: | | | | | |
| Distributions from net investment income | — | (0.18) | (0.10) | (0.11) | — |
| Net Asset Value, End of Period | $48.42 | $49.85 | $54.75 | $47.72 | $42.59 |
| Total Return2 | (2.87)% | (8.65)% | 14.97% | 12.34% | (6.29)% |
| Ratios to Average Net Assets: | | | | | |
| Net expenses | 2.09%3 | 2.09% | 2.20% | 2.27% | 2.27%3 |
| Net investment income | 0.46% | 0.35% | 0.35% | 0.69% | 0.30% |
| Expense waiver/reimbursement4 | 0.37% | 0.29% | 0.23% | 0.23% | 0.17% |
| Supplemental Data: | | | | | |
| Net assets, end of period (000 omitted) | $5,003 | $6,927 | $9,482 | $10,583 | $12,734 |
| Portfolio turnover | 49% | 64% | 58% | 54% | 53% |
| 1 | Per share numbers have been calculated using the average shares method. |
| 2 | Based on net asset value, which does not reflect the sales charge, redemption fee or contingent deferred sales charge, if applicable. |
| 3 | The net expense ratio is calculated without reduction for expense offset arrangements. The net expense ratios are 2.09% and 2.27% for the years ended November 30, 2015 and 2011, respectively, after taking into account these expense reductions. |
| 4 | This expense decrease is reflected in both the net expense and net investment income ratios shown above. |
See Notes which are an integral part of the Financial Statements
Annual Shareholder Report
Financial Highlights–Class C Shares
(For a Share Outstanding Throughout Each Period)
| Year Ended November 30 | 2015 | 2014 | 2013 | 2012 | 2011 |
| Net Asset Value, Beginning of Period | $49.65 | $54.58 | $47.61 | $42.49 | $45.34 |
| Income From Investment Operations: | | | | | |
| Net investment income1 | 0.22 | 0.19 | 0.17 | 0.30 | 0.14 |
| Net realized and unrealized gain (loss) on investments, futures contracts and foreign currency transactions | (1.64) | (4.89) | 6.95 | 4.93 | (2.99) |
| TOTAL FROM INVESTMENT OPERATIONS | (1.42) | (4.70) | 7.12 | 5.23 | (2.85) |
| Less Distributions: | | | | | |
| Distributions from net investment income | — | (0.23) | (0.15) | (0.11) | — |
| Net Asset Value, End of Period | $48.23 | $49.65 | $54.58 | $47.61 | $42.49 |
| Total Return2 | (2.86)% | (8.65)% | 14.98% | 12.34% | (6.29)% |
| Ratios to Average Net Assets: | | | | | |
| Net expenses | 2.07%3 | 2.07% | 2.19% | 2.27% | 2.27%3 |
| Net investment income | 0.43% | 0.36% | 0.33% | 0.67% | 0.29% |
| Expense waiver/reimbursement4 | 0.27% | 0.20% | 0.11% | 0.06% | 0.08% |
| Supplemental Data: | | | | | |
| Net assets, end of period (000 omitted) | $26,696 | $32,783 | $44,764 | $43,430 | $47,097 |
| Portfolio turnover | 49% | 64% | 58% | 54% | 53% |
| 1 | Per share numbers have been calculated using the average shares method. |
| 2 | Based on net asset value, which does not reflect the sales charge, redemption fee or contingent deferred sales charge, if applicable. |
| 3 | The net expense ratio is calculated without reduction for expense offset arrangements. The net expense ratios are 2.07% and 2.27% for the years ended November 30, 2015 and 2011, respectively, after taking into account these expense reductions. |
| 4 | This expense decrease is reflected in both the net expense and net investment income (loss) ratios shown above. |
See Notes which are an integral part of the Financial Statements
Annual Shareholder Report
Financial Highlights–Class R Shares
(For a Share Outstanding Throughout Each Period)
| Year Ended November 30 | 2015 | 2014 | 2013 | 2012 | 2011 |
| Net Asset Value, Beginning of Period | $49.47 | $54.03 | $47.18 | $42.28 | $45.02 |
| Income From Investment Operations: | | | | | |
| Net investment income1 | 0.57 | 0.62 | 0.67 | 0.55 | 0.43 |
| Net realized and unrealized gain (loss) on investments, futures contracts and foreign currency transactions | (1.66) | (4.89) | 6.65 | 4.85 | (2.97) |
| TOTAL FROM INVESTMENT OPERATIONS | (1.09) | (4.27) | 7.32 | 5.40 | (2.54) |
| Less Distributions: | | | | | |
| Distributions from net investment income | — | (0.29) | (0.47) | (0.50) | (0.20) |
| Net Asset Value, End of Period | $48.38 | $49.47 | $54.03 | $47.18 | $42.28 |
| Total Return2 | (2.20)% | (7.94)% | 15.64% | 13.00% | (5.71)% |
| Ratios to Average Net Assets: | | | | | |
| Net expenses | 1.34%3 | 1.30% | 1.64% | 1.67% | 1.67%3 |
| Net investment income | 1.14% | 1.18% | 1.34% | 1.24% | 0.92% |
| Expense waiver/reimbursement4 | 0.61% | 0.45% | 0.41% | 0.29% | 0.31% |
| Supplemental Data: | | | | | |
| Net assets, end of period (000 omitted) | $1,683 | $2,110 | $5,643 | $37,967 | $33,219 |
| Portfolio turnover | 49% | 64% | 58% | 54% | 53% |
| 1 | Per share numbers have been calculated using the average shares method. |
| 2 | Based on net asset value. |
| 3 | The net expense ratio is calculated without reduction for expense offset arrangements. The net expense ratios are 1.34% and 1.67% for the years ended November 30, 2015 and 2011, respectively, after taking into account these expense reductions. |
| 4 | This expense decrease is reflected in both the net expense and net investment income ratios shown above. |
See Notes which are an integral part of the Financial Statements
Annual Shareholder Report
Financial Highlights–Institutional Shares
(For a Share Outstanding Throughout Each Period)
| Year Ended November 30 | 2015 | 2014 | 2013 | 2012 | 2011 |
| Net Asset Value, Beginning of Period | $50.05 | $55.01 | $47.98 | $43.00 | $45.76 |
| Income From Investment Operations: | | | | | |
| Net investment income1 | 0.80 | 0.79 | 0.73 | 0.78 | 0.67 |
| Net realized and unrealized gain (loss) on investments, futures contracts and foreign currency transactions | (1.67) | (4.94) | 6.99 | 4.92 | (3.01) |
| TOTAL FROM INVESTMENT OPERATIONS | (0.87) | (4.15) | 7.72 | 5.70 | (2.34) |
| Less Distributions: | | | | | |
| Distributions from net investment income | (0.46) | (0.81) | (0.69) | (0.72) | (0.42) |
| Net Asset Value, End of Period | $48.72 | $50.05 | $55.01 | $47.98 | $43.00 |
| Total Return2 | (1.75)% | (7.64)% | 16.27% | 13.56% | (5.24)% |
| Ratios to Average Net Assets: | | | | | |
| Net expenses | 0.99%3 | 0.99% | 1.09% | 1.17% | 1.17%3 |
| Net investment income | 1.59% | 1.50% | 1.49% | 1.73% | 1.38% |
| Expense waiver/reimbursement4 | 0.27% | 0.20% | 0.13% | 0.09% | 0.09% |
| Supplemental Data: | | | | | |
| Net assets, end of period (000 omitted) | $77,569 | $152,673 | $275,579 | $193,171 | $164,416 |
| Portfolio turnover | 49% | 64% | 58% | 54% | 53% |
| 1 | Per share numbers have been calculated using the average shares method. |
| 2 | Based on net asset value. |
| 3 | The net expense ratio is calculated without reduction for expense offset arrangements. The net expense ratios are 0.99% and 1.17% for the years ended November 30, 2015 and 2011, respectively, after taking into account these expense reductions. |
| 4 | The expense decrease is reflected in both the net expense and net investment income ratios shown above. |
See Notes which are an integral part of the Financial Statements
Annual Shareholder Report
Financial Highlights–Class R6 Shares
(For a Share Outstanding Throughout Each Period)
| | Year Ended
November 30, | Period
Ended
11/30/20131 |
| | 2015 | 2014 |
| Net Asset Value, Beginning of Period | $50.21 | $55.05 | $51.01 |
| Income From Investment Operations: | | | |
| Net investment income (loss)2 | 0.79 | 1.07 | (0.06) |
| Net realized and unrealized gain (loss) on investments, futures contracts and foreign currency transactions | (1.67) | (5.26) | 4.10 |
| TOTAL FROM INVESTMENT OPERATIONS | (0.88) | (4.19) | 4.04 |
| Less Distributions: | | | |
| Distributions from net investment income | (0.48) | (0.65) | — |
| Net Asset Value, End of Period | $48.85 | $50.21 | $55.05 |
| Total Return3 | (1.76)% | (7.69)% | 7.92% |
| Ratios to Average Net Assets: | | | |
| Net expenses | 0.95%4 | 0.95% | 0.94%5 |
| Net investment income (loss) | 1.58% | 2.04% | (0.36)%5 |
| Expense waiver/reimbursement6 | 0.27% | 0.21% | —%5 |
| Supplemental Data: | | | |
| Net assets, end of period (000 omitted) | $5,707 | $6,287 | $07 |
| Portfolio turnover | 49% | 64% | 58%8 |
| 1 | Reflects operations for the period from August 5, 2013 (date of initial investment) to November 30, 2013. |
| 2 | Per share numbers have been calculated using the average shares method. |
| 3 | Based on net asset value. Total returns for periods of less than one year are not annualized. |
| 4 | The net expense ratio is calculated without reduction for expense offset arrangements. The net expense ratio is 0.95% for the year ended November 30, 2015, after taking into account these expense reductions. |
| 5. | Computed on an annualized basis. |
| 6 | This expense decrease is reflected in both the net expense and net investment income ratios (loss) shown above. |
| 7 | Represents less than $1,000. |
| 8 | Portfolio turnover is calculated at the Fund level. Percentage indicated was calculated for the fiscal year ended November 30, 2013. |
See Notes which are an integral part of the Financial Statements
Annual Shareholder Report
Statement of Assets and Liabilities
November 30, 2015
| Assets: | | |
| Total investments in securities, at value including $1,209,302 of securities loaned and $2,950,811 of investment in affiliated holdings (Note 5) (identified cost $174,115,001) | | $194,456,153 |
| Restricted cash (Note 2) | | 179,832 |
| Cash denominated in foreign currencies (identified cost $70,320) | | 70,309 |
| Cash | | 6,728 |
| Unrealized appreciation on foreign exchange contracts | | 3,236,929 |
| Income receivable | | 562,658 |
| Receivable for shares sold | | 23,776 |
| Other assets | | 3,605 |
| TOTAL ASSETS | | 198,539,990 |
| Liabilities: | | |
| Payable for collateral due to broker for securities lending | $1,272,586 | |
| Unrealized depreciation on foreign exchange contracts | 870,734 | |
| Payable for shares redeemed | 77,456 | |
| Payable for transfer agent fee (Notes 2 and 5) | 72,567 | |
| Payable for portfolio accounting fees | 50,685 | |
| Payable for distribution services fee (Note 5) | 19,910 | |
| Payable for other service fees (Notes 2 and 5) | 18,162 | |
| Payable for investment adviser fee (Note 5) | 3,446 | |
| Payable for daily variation margin on futures | 1,211 | |
| Payable for administrative fee (Note 5) | 420 | |
| Payable for Directors'/Trustees' fees (Note 5) | 175 | |
| Accrued expenses (Note 5) | 90,839 | |
| TOTAL LIABILITIES | | 2,478,191 |
| Net assets for 4,026,368 shares outstanding | | $196,061,799 |
| Net Assets Consists of: | | |
| Paid-in capital | | $431,471,212 |
| Net unrealized appreciation of investments, futures contracts and translation of assets and liabilities in foreign currency | | 22,552,013 |
| Accumulated net realized loss on investments, futures contracts and foreign currency transactions | | (261,215,320) |
| Undistributed net investment income | | 3,253,894 |
| TOTAL NET ASSETS | | $196,061,799 |
Annual Shareholder Report
Statement of Assets and Liabilities–continued
| Net Asset Value, Offering Price and Redemption Proceeds Per Share: | | |
| Class A Shares: | | |
| Net asset value per share ($79,403,962 ÷ 1,625,694 shares outstanding), no par value, unlimited shares authorized | | $48.84 |
| Offering price per share (100/94.50 of $48.84) | | $51.68 |
| Redemption proceeds per share | | $48.84 |
| Class B Shares: | | |
| Net asset value per share ($5,002,715 ÷ 103,326 shares outstanding), no par value, unlimited shares authorized | | $48.42 |
| Offering price per share | | $48.42 |
| Redemption proceeds per share (94.50/100 of $48.42) | | $45.76 |
| Class C Shares: | | |
| Net asset value per share ($26,695,880 ÷ 553,531 shares outstanding), no par value, unlimited shares authorized | | $48.23 |
| Offering price per share | | $48.23 |
| Redemption proceeds per share (99.00/100 of $48.23) | | $47.75 |
| Class R Shares: | | |
| Net asset value per share ($1,683,358 ÷ 34,795 shares outstanding), no par value, unlimited shares authorized | | $48.38 |
| Offering price per share | | $48.38 |
| Redemption proceeds per share | | $48.38 |
| Institutional Shares: | | |
| Net asset value per share ($77,568,713 ÷ 1,592,196 shares outstanding), no par value, unlimited shares authorized | | $48.72 |
| Offering price per share | | $48.72 |
| Redemption proceeds per share | | $48.72 |
| Class R6 Shares: | | |
| Net asset value per share ($5,707,171 ÷ 116,826 shares outstanding), no par value, unlimited shares authorized | | $48.85 |
| Offering price per share | | $48.85 |
| Redemption proceeds per share | | $48.85 |
See Notes which are an integral part of the Financial Statements
Annual Shareholder Report
Statement of Operations
Year Ended November 30, 2015
| Investment Income: | | | |
| Dividends (including $10,054 received from affiliated holdings (Note 5) and net of foreign taxes withheld of $580,493) | | | $3,982,242 |
| Interest (including income on securities loaned of $2,266,909) | | | 2,286,870 |
| TOTAL INCOME | | | 6,269,112 |
| Expenses: | | | |
| Investment adviser fee (Note 5) | | $2,230,066 | |
| Administrative fee (Note 5) | | 193,882 | |
| Custodian fees | | 112,151 | |
| Transfer agent fees (Notes 2 and 5) | | 368,858 | |
| Directors'/Trustees' fees (Note 5) | | 2,006 | |
| Auditing fees | | 28,580 | |
| Legal fees | | 8,983 | |
| Distribution services fee (Note 5) | | 279,429 | |
| Other service fees (Notes 2 and 5) | | 317,621 | |
| Portfolio accounting fees | | 153,602 | |
| Share registration costs | | 70,634 | |
| Printing and postage | | 38,839 | |
| Tax expenses | | 5.000 | |
| Miscellaneous (Note 5) | | 17,425 | |
| TOTAL EXPENSES | | 3,827,076 | |
| Waivers, Reimbursements and Reduction: | | | |
| Waiver/reimbursement of investment adviser fee (Note 5) | $(654,187) | | |
| Waivers and reimbursement of other operating expenses (Notes 2 and 5) | (48,622) | | |
| Fees paid indirectly from directed brokerage arrangements (Note 6) | (3,605) | | |
| TOTAL WAIVERS, REIMBURSEMENTS AND REDUCTION | | (706,414) | |
| Net expenses | | | 3,120,662 |
| Net investment income | | | 3,148,450 |
| Realized and Unrealized Gain (Loss) on Investments, Futures Contracts and Foreign Currency Transactions: | | | |
| Net realized loss on investments and foreign currency transactions | | | (111,692) |
| Net realized loss on futures contracts | | | (3,073,476) |
| Net change in unrealized appreciation of investments and translation of assets and liabilities in foreign currency | | | (1,538,430) |
| Net change in unrealized appreciation of futures contracts | | | (129,711) |
| Net realized and unrealized loss on investments, futures contracts and foreign currency transactions | | | (4,853,309) |
| Change in net assets resulting from operations | | | $(1,704,859) |
See Notes which are an integral part of the Financial Statements
Annual Shareholder Report
Statement of Changes in Net Assets
| Year Ended November 30 | 2015 | 2014 |
| Increase (Decrease) in Net Assets | | |
| Operations: | | |
| Net investment income | $3,148,450 | $5,683,732 |
| Net realized gain (loss) on investments, futures contracts and foreign currency transactions | (3,185,168) | 70,502,992 |
| Net change in unrealized appreciation/depreciation of investments, futures contracts and translation of assets and liabilities in foreign currency | (1,668,141) | (115,739,060) |
| CHANGE IN NET ASSETS RESULTING FROM OPERATIONS | (1,704,859) | (39,552,336) |
| Distributions to Shareholders: | | |
| Distributions from net investment income | | |
| Class A Shares | (425,762) | (3,435,563) |
| Class B Shares | — | (30,219) |
| Class C Shares | — | (184,334) |
| Class R Shares | — | (30,795) |
| Institutional Shares | (1,325,640) | (3,992,794) |
| Class R6 Shares | (59,967) | (1) |
| CHANGE IN NET ASSETS RESULTING FROM DISTRIBUTIONS TO SHAREHOLDERS | (1,811,369) | (7,673,706) |
| Share Transactions: | | |
| Proceeds from sale of shares | 33,457,714 | 96,363,304 |
| Net asset value of shares issued to shareholders in payment of distributions declared | 1,196,167 | 5,715,934 |
| Cost of shares redeemed | (148,213,162) | (373,565,096) |
| CHANGE IN NET ASSETS RESULTING FROM SHARE TRANSACTIONS | (113,559,281) | (271,485,858) |
| Change in net assets | (117,075,509) | (318,711,900) |
| Net Assets: | | |
| Beginning of period | 313,137,308 | 631,849,208 |
| End of period (including undistributed net investment income of $3,253,894 and $1,461,393, respectively) | $196,061,799 | $313,137,308 |
See Notes which are an integral part of the Financial Statements
Annual Shareholder Report
Notes to Financial Statements
November 30, 2015
1. ORGANIZATION
Federated Equity Funds (the “Trust”) is registered under the Investment Company Act of 1940, as amended (the “Act”), as an open-end management investment company. The Trust consists of 14 portfolios. The financial statements included herein are only those of Federated InterContinental Fund (the “Fund”). The financial statements of the other portfolios are presented separately. The assets of each portfolio are segregated and a shareholder's interest is limited to the portfolio in which shares are held. Each portfolio pays its own expenses. The Fund offers six classes of shares: Class A Shares, Class B Shares, Class C Shares, Class R Shares, Institutional Shares and Class R6 Shares. All shares of the Fund have equal rights with respect to voting, except on class-specific matters. On June 1, 2015, Class B Shares were closed to new accounts/investors and to new purchases/exchanges by existing shareholders on August 1, 2015. The investment objective of the Fund is to seek long-term capital appreciation.
2. SIGNIFICANT ACCOUNTING POLICIES
The following is a summary of significant accounting policies consistently followed by the Fund in the preparation of its financial statements. These policies are in conformity with U.S. generally accepted accounting principles (GAAP).
Investment Valuation
In calculating its net asset value (NAV), the Fund generally values investments as follows:
| ■ | Equity securities listed on an exchange or traded through a regulated market system are valued at their last reported sale price or official closing price in their principal exchange or market. |
| ■ | Shares of other mutual funds or non-exchange-traded investment companies are valued based upon their reported NAVs. |
| ■ | Fixed-income securities acquired with remaining maturities greater than 60 days are fair valued using price evaluations provided by a pricing service approved by the Trustees. |
| ■ | Fixed-income securities and repurchase agreements acquired with remaining maturities of 60 days or less are valued at their cost (adjusted for the accretion of any discount or amortization of any premium) unless the issuer's creditworthiness is impaired or other factors indicate that amortized cost is not an accurate estimate of the investment's fair value, in which case it would be valued in the same manner as a longer-term security. |
| ■ | Derivative contracts listed on exchanges are valued at their reported settlement or closing price, except that options are valued at the mean of closing bid and asked quotations. |
| ■ | Over-the-counter (OTC) derivative contracts are fair valued using price evaluations provided by a pricing service approved by the Trustees. |
| ■ | For securities that are fair valued in accordance with procedures established by and under the general supervision of the Trustees, certain factors may be considered such as: the last traded or purchase price of the security, information obtained by contacting the issuer or dealers, analysis of the issuer's financial statements or other available documents, fundamental analytical data, the nature and duration of restrictions on disposition, the movement of the market in which the security is normally traded, public trading in similar securities or derivative contracts of the issuer or comparable issuers, movement of a relevant index, or other factors including but not limited to industry changes and relevant government actions. |
Annual Shareholder Report
If any price, quotation, price evaluation or other pricing source is not readily available when the NAV is calculated, or if the Fund cannot obtain price evaluations from a pricing service or from more than one dealer for an investment within a reasonable period of time as set forth in the Fund's valuation policies and procedures, the Fund uses the fair value of the investment determined in accordance with the procedures described below. There can be no assurance that the Fund could obtain the fair value assigned to an investment if it sold the investment at approximately the time at which the Fund determines its NAV per share.
Fair Valuation and Significant Events Procedures
The Trustees have ultimate responsibility for determining the fair value of investments for which market quotations are not readily available. The Trustees have appointed a valuation committee (“Valuation Committee”) comprised of officers of the Fund, Federated Global Investment Management Corp. (“Adviser”) and certain of the Adviser's affiliated companies to assist in determining fair value and in overseeing the calculation of the NAV. The Trustees have also authorized the use of pricing services recommended by the Valuation Committee to provide fair value evaluations of the current value of certain investments for purposes of calculating the NAV. The Valuation Committee employs various methods for reviewing third-party pricing-service evaluations including periodic reviews of third-party pricing services' policies, procedures and valuation methods (including key inputs, methods, models and assumptions), transactional back-testing, comparisons of evaluations of different pricing services and review of price challenges by the Adviser based on recent market activity. In the event that market quotations and price evaluations are not available for an investment, the Valuation Committee determines the fair value of the investment in accordance with procedures adopted by the Trustees. The Trustees periodically review and approve the fair valuations made by the Valuation Committee and any changes made to the procedures.
Factors considered by pricing services in evaluating an investment include the yields or prices of investments of comparable quality, coupon, maturity, call rights and other potential prepayments, terms and type, reported transactions, indications as to values from dealers and general market conditions. Some pricing services provide a single price evaluation reflecting the bid-side of the market for an investment (a “bid” evaluation). Other pricing services offer both bid evaluations and price evaluations indicative of a price between the prices bid and asked for the investment (a “mid” evaluation). The Fund normally uses bid evaluations for any U.S. Treasury and Agency securities, mortgage-backed securities and municipal securities. The Fund normally uses mid evaluations for any other types of fixed-income securities and any OTC derivative contracts. In the event that market quotations and price evaluations are not available for an investment, the fair value of the investment is determined in accordance with procedures adopted by the Trustees.
Annual Shareholder Report
The Trustees also have adopted procedures requiring an investment to be priced at its fair value whenever the Adviser determines that a significant event affecting the value of the investment has occurred between the time as of which the price of the investment would otherwise be determined and the time as of which the NAV is computed. An event is considered significant if there is both an affirmative expectation that the investment's value will change in response to the event and a reasonable basis for quantifying the resulting change in value. Examples of significant events that may occur after the close of the principal market on which a security is traded, or after the time of a price evaluation provided by a pricing service or a dealer, include:
| ■ | With respect to securities traded principally in foreign markets, significant trends in U.S. equity markets or in the trading of foreign securities index futures contracts; |
| ■ | Political or other developments affecting the economy or markets in which an issuer conducts its operations or its securities are traded; |
| ■ | Announcements concerning matters such as acquisitions, recapitalizations, litigation developments, or a natural disaster affecting the issuer's operations or regulatory changes or market developments affecting the issuer's industry. |
The Trustees have adopted procedures whereby the Valuation Committee uses a pricing service to determine the fair value of equity securities traded principally in foreign markets when the Adviser determines that there has been a significant trend in the U.S. equity markets or in index futures trading. For other significant events, the Fund may seek to obtain more current quotations or price evaluations from alternative pricing sources. If a reliable alternative pricing source is not available, the Fund will determine the fair value of the investment in accordance with the fair valuation procedures approved by the Trustees. The Trustees have ultimate responsibility for any fair valuations made in response to a significant event.
Repurchase Agreements
The Fund may invest in repurchase agreements for short-term liquidity purposes. It is the policy of the Fund to require the other party to a repurchase agreement to transfer to the Fund's custodian or sub-custodian eligible securities or cash with a market value (after transaction costs) at least equal to the repurchase price to be paid under the repurchase agreement. The eligible securities are transferred to accounts with the custodian or sub-custodian in which the Fund holds a “securities entitlement” and exercises “control” as those terms are defined in the Uniform Commercial Code. The Fund has established procedures for monitoring the market value of the transferred securities and requiring the transfer of additional eligible securities if necessary to equal at least the repurchase price. These procedures also allow the other party to require securities to be transferred from the account to the extent that their market value exceeds the repurchase price or in exchange for other eligible securities of equivalent market value.
The insolvency of the other party or other failure to repurchase the securities may delay the disposition of the underlying securities or cause the Fund to receive less than the full repurchase price. Under the terms of the repurchase agreement, any amounts received by the Fund in excess of the repurchase price and related transaction costs must be remitted to the other party.
The Fund may enter into repurchase agreements in which eligible securities are transferred into joint trading accounts maintained by the custodian or sub-custodian for investment companies and other clients advised by the Fund's Adviser and its affiliates. The Fund will participate on a pro rata basis with the other investment companies and clients in its share of the securities transferred under such repurchase agreements and in its share of proceeds from any repurchase or other disposition of such securities.
Annual Shareholder Report
Investment Income, Gains and Losses, Expenses and Distributions
Investment transactions are accounted for on a trade-date basis. Realized gains and losses from investment transactions are recorded on an identified-cost basis. Interest income and expenses are accrued daily. Dividend income and distributions to shareholders are recorded on the ex-dividend date. Foreign dividends are recorded on the ex-dividend date or when the Fund is informed of the ex-dividend date. Distributions of net investment income are declared and paid annually. Non-cash dividends included in dividend income, if any, are recorded at fair value. Investment income, realized and unrealized gains and losses, and certain fund-level expenses are allocated to each class based on relative average daily net assets, except that Class A Shares, Class B Shares, Class C Shares, Class R Shares, Institutional Shares and Class R6 Shares may bear distribution services fees, other service fees and transfer agent fees unique to those classes.
Dividends are declared separately for each class. No class has preferential dividend rights; differences in per share dividend rates are generally due to differences in separate class expenses.
For the year ended November 30, 2015, transfer agent fees for the Fund were as follows:
| | Transfer
Agent Fees
Incurred | Transfer
Agent Fees
Reimbursed |
| Class A Shares | $176,479 | $(30,673) |
| Class B Shares | 18,071 | (6,226) |
| Class C Shares | 53,292 | — |
| Class R Shares | 5,715 | (1,836) |
| Institutional Shares | 111,894 | (4,931) |
| Class R6 Shares | 3,407 | — |
| TOTAL | $368,858 | $(43,666) |
Other Service Fees
The Fund may pay other service fees up to 0.25% of the average daily net assets of the Fund's Class A Shares, Class B Shares and Class C Shares to unaffiliated financial intermediaries or to Federated Shareholder Services Company (FSSC) for providing services to shareholders and maintaining shareholder accounts. Financial intermediaries may include a company affiliated with management of Federated Investors, Inc. Subject to the terms described in the Expense Limitation note, FSSC may voluntarily reimburse the Fund for other service fees. For the year ended November 30, 2015, other service fees for the Fund were as follows:
| | Other
Service Fees
Incurred |
| Class A Shares | $227,782 |
| Class B Shares | 15,132 |
| Class C Shares | 74,707 |
| TOTAL | $317,621 |
Annual Shareholder Report
Premium and Discount Amortization
All premiums and discounts on fixed-income securities are amortized/accreted using the effective-interest-rate method.
Federal Taxes
It is the Fund's policy to comply with the Subchapter M provision of the Internal Revenue Code (the “Code”) and to distribute to shareholders each year substantially all of its income. Accordingly, no provision for federal income tax is necessary. As of and during the year ended November 30, 2015, the Fund did not have a liability for any uncertain tax positions. The Fund recognizes interest and penalties, if any, related to tax liabilities as income tax expense in the Statement of Operations. As of November 30, 2015, tax years 2012 through 2015 remain subject to examination by the Fund's major tax jurisdictions, which include the United States of America and the Commonwealth of Massachusetts.
The Fund may be subject to taxes imposed by governments of countries in which it invests. Such Taxes are generally based on either income or gains earned or repatriated. The Fund accrues and applies such taxes to net investment income, net realized gains and net unrealized gains as income and/or gains are earned.
When-Issued and Delayed-Delivery Transactions
The Fund may engage in when-issued or delayed-delivery transactions. The Fund records when-issued securities on the trade date and maintains security positions such that sufficient liquid assets will be available to make payment for the securities purchased. Securities purchased on a when-issued or delayed-delivery basis are marked to market daily and begin earning interest on the settlement date. Losses may occur on these transactions due to changes in market conditions or the failure of counterparties to perform under the contract.
Foreign Exchange Contracts
The Fund may enter into foreign exchange contracts to manage currency risk and market risk. Purchased contracts are used to acquire exposure to foreign currencies, whereas, contracts to sell are used to hedge the Fund's securities against currency fluctuations. Risks may arise upon entering into these transactions from the potential inability of counterparties to meet the terms of their commitments and from unanticipated movements in security prices or foreign exchange rates. The foreign exchange contracts are adjusted by the daily exchange rate of the underlying currency and any gains or losses are recorded for financial statement purposes as unrealized until the settlement date.
Foreign exchange contracts are subject to Master Netting Agreements which are agreements between the Fund and its counterparties that provide for the net settlement of all transactions and collateral with the Fund, through a single payment, in the event of default or termination. Amounts presented on the Portfolio of Investments and Statement of Assets and Liabilities are not net settlement amounts but gross.
Foreign exchange contracts outstanding at period end, including net unrealized appreciation/depreciation or net settlement amount, are listed after the Fund's Portfolio of Investments.
The average value at settlement date payable and receivable of foreign exchange contracts purchased and sold by the Fund throughout the period was $1,159,568 and $2,345,152, respectively. This is based on the amounts held as of each month-end throughout the fiscal year.
Annual Shareholder Report
Foreign Currency Translation
The accounting records of the Fund are maintained in U.S. dollars. All assets and liabilities denominated in foreign currencies (FCs) are translated into U.S. dollars based on the rates of exchange of such currencies against U.S. dollars on the date of valuation. Purchases and sales of securities, income and expenses are translated at the rate of exchange quoted on the respective date that such transactions are recorded. The Fund does not isolate that portion of the results of operations resulting from changes in foreign exchange rates on investments from the fluctuations arising from changes in market prices of securities held. Such fluctuations are included with the net realized and unrealized gain or loss from investments.
Reported net realized foreign exchange gains or losses arise from sales of portfolio securities, sales and maturities of short-term securities, sales of FCs, currency gains or losses realized between the trade and settlement dates on securities transactions, the difference between the amounts of dividends, interest and foreign withholding taxes recorded on the Fund's books and the U.S. dollar equivalent of the amounts actually received or paid. Net unrealized foreign exchange gains and losses arise from changes in the value of assets and liabilities other than investments in securities at period end, resulting from changes in the exchange rate.
Futures Contracts
The Fund purchases and sells financial futures contracts to manage country risk and market risk. Upon entering into a financial futures contract with a broker, the Fund is required to deposit in a segregated account a specified amount of cash or U.S. government securities which is shown as Restricted Cash in the Statement of Assets and Liabilities. Futures contracts are valued daily and unrealized gains or losses are recorded in a “variation margin” account. Daily, the Fund receives from or pays to the broker a specified amount of cash based upon changes in the variation margin account. When a contract is closed, the Fund recognizes a realized gain or loss. Futures contracts have market risks, including the risk that the change in the value of the contract may not correlate with the changes in the value of the underlying securities. There is minimal counterparty risk to the Fund since futures are exchange-traded and the exchange's clearing house, as counterparty to all exchange-traded futures, guarantees the futures against default.
Futures contracts outstanding at period end are listed after the Fund's Portfolio of Investments.
The average notional value of long futures contracts held by the Fund throughout the period was $13,910,822. This is based on amounts held as of each month-end throughout the fiscal year.
Securities Lending
The Fund participates in a securities lending program providing for the lending of equity securities to qualified brokers. The Fund normally receives cash collateral for securities loaned that is invested in short-term securities including repurchase agreements. Collateral is maintained at a minimum level of 100% of the market value of investments loaned, plus interest, if applicable. Earnings on collateral are allocated between the securities lending agent, as a fee for its services under the program, and the Fund, according to agreed-upon rates.
Annual Shareholder Report
The securities lending agreement permits the net settlement of all transactions and collateral with the Fund, through a single payment, in the event of default or termination. Amounts presented on the Portfolio of Investments and Statement of Assets and Liabilities are not net settlement amounts but gross. The cash collateral received by the Fund exceeds the market value of the securities loaned reducing the net settlement amount to zero. Additionally, the securities lending agreement executed by the Fund includes an indemnification clause. This clause stipulates that the borrower will reimburse the Fund for any losses as a result of any failure of the borrower to return equivalent securities to the Fund. As of November 30, 2015, securities subject to this type of arrangement and related collateral was as follows:
Market Value of
Securities Loaned | Market Value
of Collateral |
| $1,209,302 | $1,272,586 |
Restricted Securities
The Fund may purchase securities which are considered restricted. Restricted securities are securities that either: (a) cannot be offered for public sale without first being registered, or being able to take advantage of an exemption from registration, under the Securities Act of 1933; or (b) are subject to contractual restrictions on public sales. In some cases, when a security cannot be offered for public sale without first being registered, the issuer of the restricted security has agreed to register such securities for resale, at the issuer's expense, either upon demand by the Fund or in connection with another registered offering of the securities. Many such restricted securities may be resold in the secondary market in transactions exempt from registration. Restricted securities may be determined to be liquid under criteria established by the Trustees. The Fund will not incur any registration costs upon such resale. The Fund's restricted securities, like other securities, are priced in accordance with procedures established by and under the general supervision of the Trustees.
Annual Shareholder Report
Additional Disclosure Related to Derivative Instruments
| Fair Value of Derivative Instruments |
| | Asset | Liability |
| | Statement of
Assets and
Liabilities
Location | Fair
Value | Statement of
Assets and
Liabilities
Location | Fair
Value |
Derivatives not accounted for as
hedging instruments under ASC Topic 815 | | | | |
| Foreign exchange contracts | Unrealized
appreciation
on foreign
exchange
contracts | $ 3,236,929 | Unrealized
depreciation
on foreign
exchange
contracts | $ 870,734 |
| Equity contracts | | — | Payable for
daily variation
margin on futures | 108,138* |
| Total derivatives not accounted for as hedging instruments under ASC Topic 815 | | $ 3,236,929 | | $ 978,872 |
| * | Includes cumulative depreciation of futures contracts as reported in the footnotes to the Portfolio of Investments. Only the current day's variation margin is reported within the Statement of Assets and Liabilities. |
The Effect of Derivative Instruments on the Statement of Operations for the Year Ended November 30, 2015
| Amount of Realized Gain or (Loss) on Derivatives Recognized in Income |
| | Futures
Contracts | Foreign
Exchange
Contracts | Total |
| Equity contracts | $(3,073,476) | $— | $(3,073,476) |
| Foreign exchange contracts | — | 11,864,833 | 11,864,833 |
| TOTAL | $(3,073,476) | $11,864,833 | $8,791,357 |
| Change in Unrealized Appreciation or (Depreciation) on Derivatives Recognized in Income |
| | Futures
Contracts | Foreign
Exchange
Contracts | Total |
| Equity contracts | $(129,711) | $— | $(129,711) |
| Foreign exchange contracts | — | (3,861,084) | (3,861,084) |
| TOTAL | $ (129,711) | $(3,861,084) | $(3,990,795) |
Annual Shareholder Report
Other
The preparation of financial statements in conformity with GAAP requires management to make estimates and assumptions that affect the amounts of assets, liabilities, expenses and revenues reported in the financial statements. Actual results could differ from those estimated. The Fund applies Investment Company accounting and reporting guidance.
3. SHARES OF BENEFICIAL INTEREST
The following tables summarize share activity:
| Year Ended November 30 | 2015 | 2014 |
| Class A Shares: | Shares | Amount | Shares | Amount |
| Shares sold | 265,314 | $13,430,095 | 466,917 | $24,761,050 |
| Shares issued to shareholders in payment of distributions declared | 8,230 | 404,490 | 57,384 | 3,093,594 |
| Shares redeemed | (891,306) | (44,247,443) | (3,664,850) | (191,505,725) |
NET CHANGE RESULTING FROM
CLASS A SHARE TRANSACTIONS | (617,762) | $(30,412,858) | (3,140,549) | $(163,651,081) |
| Year Ended November 30 | 2015 | 2014 |
| Class B Shares: | Shares | Amount | Shares | Amount |
| Shares sold | 3,679 | $184,734 | 9,354 | $497,904 |
| Shares issued to shareholders in payment of distributions declared | — | — | 525 | 28,357 |
| Shares redeemed | (39,292) | (1,970,906) | (44,121) | (2,329,016) |
NET CHANGE RESULTING FROM
CLASS B SHARE TRANSACTIONS | (35,613) | $(1,786,172) | (34,242) | $(1,802,755) |
| Year Ended November 30 | 2015 | 2014 |
| Class C Shares: | Shares | Amount | Shares | Amount |
| Shares sold | 71,830 | $3,600,178 | 70,060 | $3,659,262 |
| Shares issued to shareholders in payment of distributions declared | — | — | 2,964 | 159,530 |
| Shares redeemed | (178,540) | (8,870,514) | (232,953) | (12,172,637) |
NET CHANGE RESULTING FROM
CLASS C SHARE TRANSACTIONS | (106,710) | $(5,270,336) | (159,929) | $(8,353,845) |
| Year Ended November 30 | 2015 | 2014 |
| Class R Shares: | Shares | Amount | Shares | Amount |
| Shares sold | 7,125 | $357,742 | 27,037 | $1,419,490 |
| Shares issued to shareholders in payment of distributions declared | — | — | 572 | 30,483 |
| Shares redeemed | (14,981) | (745,305) | (89,405) | (4,599,046) |
NET CHANGE RESULTING FROM
CLASS R SHARE TRANSACTIONS | (7,856) | $(387,563) | (61,796) | $(3,149,073) |
Annual Shareholder Report
| Year Ended November 30 | 2015 | 2014 |
| Institutional Shares: | Shares | Amount | Shares | Amount |
| Shares sold | 297,940 | $14,906,210 | 1,086,796 | $57,031,031 |
| Shares issued to shareholders in payment of distributions declared | 14,973 | 731,710 | 44,750 | 2,403,970 |
| Shares redeemed | (1,771,159) | (90,910,633) | (3,091,139) | (160,592,362) |
| NET CHANGE RESULTING FROM INSTITUTIONAL SHARE TRANSACTIONS | (1,458,246) | $(75,272,713) | (1,959,593) | $(101,157,361) |
| Year Ended November 30 | 2015 | 2014 |
| Class R6 Shares: | Shares | Amount | Shares | Amount |
| Shares sold | 19,499 | $978,755 | 170,006 | $8,994,567 |
| Shares issued to shareholders in payment of distributions declared | 1,223 | 59,967 | — | — |
| Shares redeemed | (29,101) | (1,468,361) | (44,803) | (2,366,310) |
NET CHANGE RESULTING FROM
CLASS R6 SHARE TRANSACTIONS | (8,379) | $(429,639) | 125,203 | $6,628,257 |
NET CHANGE RESULTING FROM
TOTAL FUND SHARE TRANSACTIONS | (2,234,566) | $(113,559,281) | (5,230,906) | $(271,485,858) |
4. FEDERAL TAX INFORMATION
The timing and character of income and capital gain distributions are determined in accordance with income tax regulations, which may differ from GAAP. These differences are due to differing treatments for foreign currency transactions, realized capital gains tax and passive foreign investment companies.
For the year ended November 30, 2015, permanent differences identified and reclassified among the components of net assets were as follows:
| Increase (Decrease) |
Undistributed
Net Investment
Income (Loss) | Accumulated
Net Realized
Gain (Loss) |
| $455,420 | $(455,420) |
Net investment income (loss), net realized gains (losses) and net assets were not affected by the reclassification.
The tax character of distributions as reported on the Statement of Changes in Net Assets for the years ended November 30, 2015 and 2014, was as follows:
| | 2015 | 2014 |
| Ordinary income | $1,811,369 | $7,673,706 |
Annual Shareholder Report
As of November 30, 2015, the components of distributable earnings on a tax basis were as follows:
| Undistributed ordinary income | $ 3,770,226 |
| Net unrealized appreciation | $19,669,486 |
| Capital loss carryforwards | $(258,849,125) |
The difference between book-basis and tax-basis net unrealized appreciation/depreciation is attributable to differing treatments for the realization for tax purposes of unrealized gains on investments in passive foreign investment companies.
At November 30, 2015, the cost of investments for federal tax purposes was $174,631,333. The net unrealized appreciation of investments for federal tax purposes, excluding: (a) any unrealized appreciation/depreciation resulting from the translation of FCs to U.S. dollars of assets and liabilities other than investments in securities; (b) outstanding foreign currency commitments; and (c) futures contracts, was $19,824,820. This consists of net unrealized appreciation from investments for those securities having an excess of value over cost of $27,781,053 and net unrealized depreciation from investments for those securities having an excess of cost over value of $7,956,233.
At November 30, 2015, the Fund had a capital loss carryforward of $258,849,125 which will reduce the Fund's taxable income arising from future net realized gains on investments, if any, to the extent permitted by the Code, thereby reducing the amount of distributions to shareholders which would otherwise be necessary to relieve the Fund of any liability for federal income tax. Pursuant to the Code, a net capital loss incurred in taxable years beginning on or before December 22, 2010, is characterized as short-term and may be carried forward for a maximum of eight tax years (“Carryforward Limit”), whereas a net capital loss incurred in taxable years beginning after December 22, 2010, retains its character as either short-term or long-term, does not expire and is required to be utilized prior to the losses which have a Carryforward Limit.
The following schedule summarizes the Fund's capital loss carryforwards and expiration years:
| Expiration Year | Short-Term | Long-Term | Total |
| No expiration | $7,520,530 | $— | $7,520,530 |
| 2016 | $845,950 | NA | $ 845,950 |
| 2017 | $250,482,645 | NA | $ 250,482,645 |
5. INVESTMENT ADVISER FEE AND OTHER TRANSACTIONS WITH AFFILIATES
Investment Adviser Fee
The advisory agreement between the Fund and the Adviser provides for an annual fee equal to 0.90% of the Fund's average daily net assets. Subject to the terms described in the Expense Limitation note, the Adviser may voluntarily choose to waive and/or reimburse any portion of its fee. For the year ended November 30, 2015, the Adviser voluntarily waived $647,503 of its fee and reimbursed $43,666 of transfer agent fees.
Annual Shareholder Report
Administrative Fee
Federated Administrative Services (FAS), under the Administrative Services Agreement, provides the Fund with administrative personnel and services. For purposes of determining the appropriate rate breakpoint, “Investment Complex” is defined as all of the Federated Funds subject to a fee under the Administrative Services Agreement. The fee paid to FAS is based on the average daily net assets of the Investment Complex as specified below, plus certain out-of-pocket expenses:
| Administrative Fee | Average Daily Net Assets
of the Investment Complex |
| 0.150% | on the first $5 billion |
| 0.125% | on the next $5 billion |
| 0.100% | on the next $10 billion |
| 0.075% | on assets in excess of $20 billion |
Subject to the terms described in the Expense Limitation note, FAS may voluntarily choose to waive any portion of its fee. For the year ended November 30, 2015, the fee paid to FAS was 0.078% of the average daily net assets of the Fund.
Distribution Services Fee
The Fund has adopted a Distribution Plan (the “Plan”) pursuant to Rule 12b-1 under the Act. Under the terms of the Plan, the Fund will compensate Federated Securities Corp. (FSC), the principal distributor, from the daily net assets of the Fund's Class A Shares, Class B Shares, Class C Shares and Class R Shares to finance activities intended to result in the sale of these shares. The Plan provides that the Fund may incur distribution expenses at the following percentages of average daily net assets annually, to compensate FSC:
| Share Class Name | Percentage of Average Daily
Net Assets of Class |
| Class A Shares | 0.05% |
| Class B Shares | 0.75% |
| Class C Shares | 0.75% |
| Class R Shares | 0.50% |
Subject to the terms described in the Expense Limitation note, FSC may voluntarily choose to waive any portion of its fee. For the year ended November 30, 2015, distribution services fees for the Fund were as follows:
| | Distribution
Services Fees
Incurred | Distribution
Services Fees
Waived |
| Class B Shares | $45,397 | $— |
| Class C Shares | 224,121 | — |
| Class R Shares | 9,911 | (4,956) |
| TOTAL | $279,429 | $(4,956) |
For the year ended November 30, 2015, the Fund's Class A Shares did not incur a distribution services fee; however, it may begin to incur this fee upon approval of the Trustees.
Annual Shareholder Report
When FSC receives fees, it may pay some or all of them to financial intermediaries whose customers purchase shares. For the year ended November 30, 2015, FSC retained $34,807 of fees paid by the Fund.
Sales Charges
Front-end sales charges and contingent deferred sales charges (CDSC) do not represent expenses of the Fund. They are deducted from the proceeds of sales of Fund shares prior to investment or from redemption proceeds prior to remittance, as applicable. For the year ended November 30, 2015, FSC retained $6,381 in sales charges from the sale of Class A Shares. FSC also retained $6,642 and $459 of CDSC relating to redemptions of Class B and Class C Shares, respectively.
Expense Limitation
The Adviser and certain of its affiliates (which may include FSC, FAS and FSSC) on their own initiative have agreed to waive certain amounts of their respective fees and/or reimburse expenses. Total annual fund operating expenses (as shown in the financial highlights, excluding tax reclaim recovery expenses, expenses allocated from affiliated partnerships, interest expense, extraordinary expenses and proxy-related expenses paid by the fund, if any) paid by the Fund's Class A Shares, Class B Shares, Class C Shares, Class R Shares, Institutional Shares and Class R6 Shares (after the voluntary waivers and reimbursements) will not exceed 1.29%, 2.08%, 2.08%, 1.45%, 0.98% and 0.94% (the “Fee Limit”), respectively, up to but not including the later of (the “Termination Date”): (a) February 1, 2017; or (b) the date of the Fund's next effective Prospectus. While the Adviser and its applicable affiliates currently do not anticipate terminating or increasing these arrangements prior to the Termination Date, these arrangements may only be terminated or the Fee Limit increased prior to the Termination Date with the agreement of the Trustees.
Other Service Fees
For the year ended November 30, 2015, FSSC received $16,113 of the other service fees disclosed in Note 2.
General
Certain Officers and Trustees of the Fund are Officers and Directors or Trustees of certain of the above companies. To efficiently facilitate payment, Directors'/Trustees' fees and certain expenses related to conducting meetings of the Directors/Trustees and other miscellaneous expenses are paid by an affiliate of the Adviser which in due course are reimbursed by the Fund. Such expenses may be included in Accrued and Miscellaneous Expenses on the Statement of Assets and Liabilities and Statement of Operations, respectively.
Annual Shareholder Report
Transactions Involving Affiliated Holdings
Affiliated holdings are investment companies which are managed by the Adviser or an affiliate of the Adviser. The Adviser has agreed to reimburse the Fund for certain investment adviser fees as a result of transactions in other affiliated investment companies. For the year ended November 30, 2015, the Adviser reimbursed $6,684. Transactions with the affiliated holding during the year ended November 30, 2015, were as follows:
| | Federated
Money Market
Management,
Institutional Shares | Federated
Prime Value
Obligations Fund,
Institutional Shares | Total |
| Balance of Shares Held 11/30/2014 | — | 6,162,024 | 6,162,024 |
| Purchases/Additions | 1,272.586 | 120,085,462 | 121,358,048 |
| Sales/Reductions | — | (124,569,261) | (124,569,261) |
| Balance of Shares Held 11/30/2015 | 1,272,586 | 1,678,225 | 2,950,811 |
| Value | $1,272,586 | $1,678,225 | $2,950,811 |
| Dividend Income | $5,210 | $4,844 | $10,054 |
6. EXPENSE REDUCTION
The Fund directs portfolio trades to a broker that in turn pays a portion of the Fund's operating expenses. For the year ended November 30, 2015, the Fund's expenses were reduced by $3,605 under these arrangements.
7. Investment TRANSACTIONS
Purchases and sales of investments, excluding long-term U.S. government securities and short-term obligations, for the year ended November 30, 2015, are as follows:
| Purchases | $ 117,810,167 |
| Sales | $ 217,181,468 |
8. CONCENTRATION OF RISK
The Fund invests in securities of non-U.S. issuers. Political or economic developments may have an effect on the liquidity and volatility of portfolio securities and currency holdings.
9. LINE OF CREDIT
The Fund participates in a $100,000,000 unsecured, uncommitted revolving line of credit (LOC) agreement with PNC Bank. The LOC was made available for extraordinary or emergency purposes, primarily for financing redemption payments. Borrowings are charged interest at a rate offered to the Fund by PNC Bank at the time of the borrowing. As of November 30, 2015, there were no outstanding loans. During the year ended November 30, 2015, the Fund did not utilize the LOC.
10. INTERFUND LENDING
Pursuant to an Exemptive Order issued by the Securities and Exchange Commission, the Fund, along with other funds advised by subsidiaries of Federated Investors, Inc., may participate in an interfund lending program. This program provides an alternative credit facility allowing the Fund to borrow from other participating affiliated funds. As of November 30, 2015, there were no outstanding loans. During the year ended November 30, 2015, the program was not utilized.
Annual Shareholder Report
11. FEDERAL TAX INFORMATION (UNAUDITED)
For the fiscal year ended November 30, 2015, 100% of total income distributions made by the Fund are qualifying dividends which may be subject to a maximum tax rate of 15%, as provided for by the Jobs and Growth Tax Relief Act of 2003. Complete information is reported in conjunction with the reporting of your distributions on Form 1099-DIV.
Of the ordinary income distributions made by the Fund during the year ended November 30, 2015, 0.41% qualify for the dividend received deduction available to corporate shareholders.
To the extent the Fund meets the requirements of Section 853 of the Internal Revenue Code of 1986, as amended, the Fund will pass through to its shareholders credits for foreign taxes paid. For the fiscal year ended November 30, 2015, the Fund derived $7,175,431 of gross income from foreign sources and paid foreign taxes of $573,936.
Annual Shareholder Report
Report of Independent Registered Public Accounting Firm
TO THE BOARD OF TRUSTEES OF THE FEDERATED EQUITY FUNDS AND SHAREHOLDERS OF Federated Intercontinental fund:
We have audited the accompanying statement of assets and liabilities, including the portfolio of investments, of the Federated InterContinental Fund (the “Fund”), a portfolio of Federated Equity Funds, as of November 30, 2015, and the related statement of operations for the year then ended, the statements of changes in net assets for each of the years in the two-year period then ended, and the financial highlights for each of the years or periods in the five-year period then ended. These financial statements and financial highlights are the responsibility of the Fund's management. Our responsibility is to express an opinion on these financial statements and financial highlights based on our audits.
We conducted our audits in accordance with the standards of the Public Company Accounting Oversight Board (United States). Those standards require that we plan and perform the audit to obtain reasonable assurance about whether the financial statements and financial highlights are free of material misstatement. An audit includes examining, on a test basis, evidence supporting the amounts and disclosures in the financial statements. Our procedures included confirmation of securities owned as of November 30, 2015, by correspondence with the custodian, transfer agent and brokers or by other appropriate auditing procedures. An audit also includes assessing the accounting principles used and significant estimates made by management, as well as evaluating the overall financial statement presentation. We believe that our audits provide a reasonable basis for our opinion.
In our opinion, the financial statements and financial highlights referred to above present fairly, in all material respects, the financial position of the Federated InterContinental Fund as of November 30, 2015, and the results of its operations for the year then ended, the changes in its net assets for each of the years in the two-year period then ended, and the financial highlights for each of the years or periods in the five-year period then ended, in conformity with U.S. generally accepted accounting principles.
Boston, Massachusetts
January 26, 2016
Annual Shareholder Report
Shareholder Expense Example (unaudited)
As a shareholder of the Fund, you incur two types of costs: (1) transaction costs, including sales charges (“loads”) on purchase or redemption payments and (2) ongoing costs, including management fees and to the extent applicable, distribution (12b-1) fees and/or other service fees and other Fund expenses. This Example is intended to help you to understand your ongoing costs (in dollars) of investing in the Fund and to compare these costs with the ongoing costs of investing in other mutual funds. It is based on an investment of $1,000 invested at the beginning of the period and held for the entire period from June 1, 2015 to November 30, 2015.
ACTUAL EXPENSES
The first section of the table below provides information about actual account values and actual expenses. You may use the information in this section, together with the amount you invested, to estimate the expenses that you incurred over the period. Simply divide your account value by $1,000 (for example, an $8,600 account value divided by $1,000 = 8.6), then multiply the result by the number in the first section under the heading entitled “Expenses Paid During Period” to estimate the expenses attributable to your investment during this period.
HYPOTHETICAL EXAMPLE FOR COMPARISON PURPOSES
The second section of the table below provides information about hypothetical account values and hypothetical expenses based on the Fund's actual expense ratio and an assumed rate of return of 5% per year before expenses, which is not the Fund's actual return. Thus, you should not use the hypothetical account values and expenses to estimate the actual ending account balance or your expenses for the period. Rather, these figures are required to be provided to enable you to compare the ongoing costs of investing in the Fund with other funds. To do so, compare this 5% hypothetical example with the 5% hypothetical examples that appear in the shareholder reports of the other funds.
Annual Shareholder Report
Please note that the expenses shown in the table are meant to highlight your ongoing costs only and do not reflect any transaction costs, such as sales charges (loads) on purchase or redemption payments. Therefore, the second section of the table is useful in comparing ongoing costs only, and will not help you determine the relative total costs of owning different funds. In addition, if these transaction costs were included, your costs would have been higher.
| | Beginning
Account Value
6/1/2015 | Ending
Account Value
11/30/2015 | Expenses Paid
During Period1 |
| Actual: | | | |
| Class A Shares | $1,000 | $920.80 | $6.21 |
| Class B Shares | $1,000 | $917.00 | $10.00 |
| Class C Shares | $1,000 | $917.10 | $9.90 |
| Class R Shares | $1,000 | $920.50 | $5.782 |
| Institutional Shares | $1,000 | $922.60 | $4.72 |
| Class R6 Shares | $1,000 | $922.20 | $4.53 |
Hypothetical (assuming a 5% return
before expenses): | | | |
| Class A Shares | $1,000 | $1,018.60 | $6.53 |
| Class B Shares | $1,000 | $1,014.64 | $10.50 |
| Class C Shares | $1,000 | $1,014.74 | $10.40 |
| Class R Shares | $1,000 | $1,019.05 | $6.072 |
| Institutional Shares | $1,000 | $1,020.16 | $4.96 |
| Class R6 Shares | $1,000 | $1,020.36 | $4.76 |
| 1 | Expenses are equal to the Fund's annualized net expense ratios, multiplied by the average account value over the period, multiplied by 183/365 (to reflect the one-half-year period). The annualized net expense ratios are as follows: |
| | |
| Class A Shares | 1.29% |
| Class B Shares | 2.08% |
| Class C Shares | 2.06% |
| Class R Shares | 1.20% |
| Institutional Shares | 0.98% |
| Class R6 Shares | 0.94% |
| 2 | Actual and Hypothetical expenses paid during the period utilizing the Fund's Class R Shares current Fee Limit of 1.45% (as reflected in the Notes to Financial Statements, Note 5 under Expense Limitation), multiplied by the average account value over the period, multiplied by 183/365 (to reflect expenses paid as if they had been in effect throughout the most recent one-half-year period) would be $6.98 and $7.33, respectively. |
Annual Shareholder Report
Board of Trustees and Trust Officers
The Board of Trustees is responsible for managing the Trust business affairs and for exercising all the Trust powers except those reserved for the shareholders. The following tables give information about each Trustee and the senior officers of the Fund. Where required, the tables separately list Trustees who are “interested persons” of the Fund (i.e., “Interested” Trustees) and those who are not (i.e., “Independent” Trustees). Unless otherwise noted, the address of each person listed is Federated Investors Tower, 1001 Liberty Avenue, Pittsburgh, PA 15222. The address of all Independent Trustees listed is 4000 Ericsson Drive, Warrendale, PA 15086-7561; Attention: Mutual Fund Board. As of December 31, 2015, the Trust comprised 14 portfolio(s), and the Federated Fund Family consisted of 38 investment companies (comprising 122 portfolios). Unless otherwise noted, each Officer is elected annually. Unless otherwise noted, each Trustee oversees all portfolios in the Federated Fund Family and serves for an indefinite term. The Fund's Statement of Additional Information includes additional information about Trust Trustees and is available, without charge and upon request, by calling 1-800-341-7400.
Interested Trustees Background
Name
Birth Date
Positions Held with Trust
Date Service Began | Principal Occupation(s) for Past Five Years,
Other Directorships Held and Previous Position(s) |
John F. Donahue*
Birth Date: July 28, 1924
Trustee
Indefinite Term
Began serving: April 1984 | Principal Occupations: Director or Trustee of the Federated Fund Family; Chairman and Director, Federated Investors, Inc.; Chairman of the Federated Fund Family's Executive Committee.
Previous Positions: Chairman of the Federated Fund Family; Trustee, Federated Investment Management Company; Chairman and Director, Federated Investment Counseling. |
J. Christopher Donahue*
Birth Date: April 11, 1949
President and Trustee
Indefinite Term
Began serving: January 2000 | Principal Occupations: Principal Executive Officer and President of certain of the Funds in the Federated Fund Family; Director or Trustee of the Funds in the Federated Fund Family; President, Chief Executive Officer and Director, Federated Investors, Inc.; Chairman and Trustee, Federated Investment Management Company; Trustee, Federated Investment Counseling; Chairman and Director, Federated Global Investment Management Corp.; Chairman, Federated Equity Management Company of Pennsylvania and Passport Research, Ltd. (investment advisory subsidiary of Federated); Trustee, Federated Shareholder Services Company; Director, Federated Services Company.
Previous Positions: President, Federated Investment Counseling; President and Chief Executive Officer, Federated Investment Management Company, Federated Global Investment Management Corp. and Passport Research, Ltd. |
| * | Family relationships and reasons for “interested” status: John F. Donahue is the father of J. Christopher Donahue; both are “interested” due to their beneficial ownership of shares of Federated Investors, Inc. and the positions they hold with Federated and its subsidiaries. |
Annual Shareholder Report
INDEPENDENT Trustees Background
Name
Birth Date
Positions Held with Trust
Date Service Began | Principal Occupation(s) for Past Five Years,
Other Directorships Held, Previous Position(s) and Qualifications |
John T. Collins
Birth Date: January 24, 1947
Trustee
Indefinite Term
Began serving: October 2013 | Principal Occupations: Director or Trustee of the Federated Fund Family; Retired.
Other Directorships Held: Director, Chair of the Compensation Committee, Audit Committee member, KLX Corp.
Qualifications: Mr. Collins has served in several business and financial management roles and directorship positions throughout his career. Mr. Collins previously served as Chairman and CEO, The Collins Group, Inc. (a private equity firm). Mr. Collins serves as Chairman Emeriti, Bentley University. Mr. Collins previously served as Director, FleetBoston Financial Corp.; Director and Audit Committee Member, Bank of America Corp. and Director, Beth Israel Deaconess Medical Center (Harvard University Affiliate Hospital). |
G. Thomas Hough
Birth Date: February 28, 1955
Trustee
Indefinite Term
Began serving: August 2015 | Principal Occupations: Director or Trustee of the Federated Fund Family; Retired.
Other Directorships Held: Director, Chair of the Audit Committee, Governance Committee, Publix Super Markets, Inc.
Qualifications: Mr. Hough has served in accounting, business management and directorship positions throughout his career. Mr. Hough most recently held the position of Americas Vice Chair of Assurance with Ernst & Young LLP. Mr. Hough is an Executive Committee member of the United States Golf Association, he serves on the President's Cabinet and Business School Board of Visitors for the University of Alabama and is on the Business School Board of Visitors for Wake Forest University. |
Maureen Lally-Green
Birth Date: July 5, 1949
Trustee
Indefinite Term
Began serving: August 2009 | Principal Occupations: Director or Trustee of the Federated Fund Family; Adjunct Professor of Law, Duquesne University School of Law.
Other Directorships Held: Director, CONSOL Energy Inc.
Qualifications: Judge Lally-Green has served in various legal and business roles and directorship positions throughout her career. Judge Lally-Green previously served as: Associate General Secretary, Diocese of Pittsburgh; a member of the Superior Court of Pennsylvania; and as a Professor of Law, Duquesne University School of Law. Judge Lally-Green also holds the positions on either a public or not for profit Board of Directors as follows: Member, Pennsylvania State Board of Education (public); Director and Chair, UPMC Mercy Hospital; Regent, St. Vincent Seminary; Director, Epilepsy Foundation of Western and Central Pennsylvania; Director and Vice Chair, Our Campaign for the Church Alive!, Inc.; Director, Saint Vincent College; Director, Pennsylvania Bar Institute; and Director and Chair, Cardinal Wuerl North Catholic High School, Inc. Judge Lally-Green has held the positions of: Director, Auberle; Director, Ireland Institute of Pittsburgh; Director, Saint Thomas More Society; and Director, Catholic High Schools of the Diocese of Pittsburgh, Inc. |
Annual Shareholder Report
Name
Birth Date
Positions Held with Trust
Date Service Began | Principal Occupation(s) for Past Five Years,
Other Directorships Held, Previous Position(s) and Qualifications |
Peter E. Madden
Birth Date: March 16, 1942
Trustee
Indefinite Term
Began serving: November 1991 | Principal Occupation: Director or Trustee, and Chair of the Board of Directors or Trustees, of the Federated Fund Family; Retired.
Other Directorships Held: None.
Qualifications: Mr. Madden has served in several business management, mutual fund services and directorship positions throughout his career. Mr. Madden previously served as President, Chief Operating Officer and Director, State Street Bank and Trust Company (custodian bank) and State Street Corporation (financial services). He was Director, VISA USA and VISA International and Chairman and Director, Massachusetts Bankers Association. Mr. Madden served as Director, Depository Trust Corporation and Director, The Boston Stock Exchange. Mr. Madden also served as a Representative to the Commonwealth of Massachusetts General Court. |
Charles F. Mansfield, Jr.
Birth Date: April 10, 1945
Trustee
Indefinite Term
Began serving: January 1999 | Principal Occupations: Director or Trustee of the Federated Fund Family; Management Consultant.
Other Directorships Held: None.
Qualifications: Mr. Mansfield has served in several banking, business management and educational roles and directorship positions throughout his career. Mr. Mansfield previously served as Chief Executive Officer, PBTC International Bank; Partner, Arthur Young & Company (now Ernst & Young LLP); Chief Financial Officer of Retail Banking Sector, Chase Manhattan Bank; Senior Vice President, HSBC Bank USA (formerly, Marine Midland Bank); Vice President, Citibank; Assistant Professor of Banking and Finance, Frank G. Zarb School of Business, Hofstra University; Executive Vice President DVC Group, Inc. (marketing, communications and technology). |
Thomas M. O'Neill
Birth Date: June 14, 1951
Trustee
Indefinite Term
Began serving: October 2006 | Principal Occupations: Director or Trustee, Chair of the Audit Committee of the Federated Fund Family; Sole Proprietor, Navigator Management Company (investment and strategic consulting).
Other Directorships Held: None.
Qualifications: Mr. O'Neill has served in several business, mutual fund and financial management roles and directorship positions throughout his career. Mr. O'Neill serves as Director, Medicines for Humanity and Director, The Golisano Children's Museum of Naples, Florida. Mr. O'Neill previously served as Chief Executive Officer and President, Managing Director and Chief Investment Officer, Fleet Investment Advisors; President and Chief Executive Officer, Aeltus Investment Management, Inc.; General Partner, Hellman, Jordan Management Co., Boston, MA; Chief Investment Officer, The Putnam Companies, Boston, MA; Credit Analyst and Lending Officer, Fleet Bank; Director and Consultant, EZE Castle Software (investment order management software); and Director, Midway Pacific (lumber). |
Annual Shareholder Report
Name
Birth Date
Positions Held with Trust
Date Service Began | Principal Occupation(s) for Past Five Years,
Other Directorships Held, Previous Position(s) and Qualifications |
P. Jerome Richey
Birth Date: February 23, 1949
Trustee
Indefinite Term
Began serving: October 2013 | Principal Occupations: Director or Trustee of the Federated Fund Family; Management Consultant.
Other Directorships Held: None.
Qualifications: Mr. Richey has served in several business and legal management roles and directorship positions throughout his career. Mr. Richey most recently held the positions of Senior Vice Chancellor and Chief Legal Officer, University of Pittsburgh. Mr. Richey serves as Board Member, Epilepsy Foundation of Western Pennsylvania and Board member, World Affairs Council of Pittsburgh. Mr. Richey previously served as Chief Legal Officer and Executive Vice President, CONSOL Energy Inc. and Shareholder, Buchanan Ingersoll & Rooney PC (a law firm). |
John S. Walsh
Birth Date: November 28, 1957
Trustee
Indefinite Term
Began serving: January 1999 | Principal Occupations: Director or Trustee of the Federated Fund Family; President and Director, Heat Wagon, Inc. (manufacturer of construction temporary heaters); President and Director, Manufacturers Products, Inc. (distributor of portable construction heaters); President, Portable Heater Parts, a division of Manufacturers Products, Inc.
Other Directorships Held: None.
Qualifications: Mr. Walsh has served in several business management roles and directorship positions throughout his career. Mr. Walsh previously served as Vice President, Walsh & Kelly, Inc. (paving contractors). |
OFFICERS
Name
Birth Date
Address
Positions Held with Trust
Date Service Began | Principal Occupation(s) for Past Five Years
and Previous Position(s) |
John W. McGonigle
Birth Date: October 26, 1938
EXECUTIVE VICE PRESIDENT AND SECRETARY
Officer since: April 1984 | Principal Occupations: Executive Vice President and Secretary of the Federated Fund Family; Vice Chairman, Executive Vice President, Secretary and Director, Federated Investors, Inc.
Previous Positions: Trustee, Federated Investment Management Company and Federated Investment Counseling; Director, Federated Global Investment Management Corp., Federated Services Company and Federated Securities Corp. |
Annual Shareholder Report
Name
Birth Date
Address
Positions Held with Trust
Date Service Began | Principal Occupation(s) for Past Five Years
and Previous Position(s) |
Lori A. Hensler
Birth Date: January 6, 1967
TREASURER
Officer since: April 2013 | Principal Occupations: Principal Financial Officer and Treasurer of the Federated Fund Family; Senior Vice President, Federated Administrative Services; Financial and Operations Principal for Federated Securities Corp. and Edgewood Services, Inc.; and Assistant Treasurer, Federated Investors Trust Company. Ms. Hensler has received the Certified Public Accountant designation.
Previous Positions: Controller of Federated Investors, Inc.; Senior Vice President and Assistant Treasurer, Federated Investors Management Company; Treasurer, Federated Investors Trust Company; Assistant Treasurer, Federated Administrative Services, Federated Administrative Services, Inc., Federated Securities Corp., Edgewood Services, Inc., Federated Advisory Services Company, Federated Equity Management Company of Pennsylvania, Federated Global Investment Management Corp., Federated Investment Counseling, Federated Investment Management Company, Passport Research, Ltd., and Federated MDTA, LLC; Financial and Operations Principal for Federated Securities Corp., Edgewood Services, Inc. and Southpointe Distribution Services, Inc. |
Peter J. Germain
Birth Date: September 3, 1959
CHIEF LEGAL OFFICER
Officer since: January 2005 | Principal Occupations: Mr. Germain is Chief Legal Officer of the Federated Fund Family. He is General Counsel and Vice President, Federated Investors, Inc.; President, Federated Administrative Services and Federated Administrative Services, Inc.; Vice President, Federated Securities Corp.; Secretary, Federated Private Asset Management, Inc.; and Secretary, Retirement Plan Service Company of America. Mr. Germain joined Federated in 1984 and is a member of the Pennsylvania Bar Association.
Previous Positions: Deputy General Counsel, Special Counsel, Managing Director of Mutual Fund Services, Federated Investors, Inc.; Senior Vice President, Federated Services Company; and Senior Corporate Counsel, Federated Investors, Inc. |
Richard B. Fisher
Birth Date: May 17, 1923
VICE PRESIDENT
Officer since: April 1987 | Principal Occupations: Vice Chairman or Vice President of some of the Funds in the Federated Fund Family; Vice Chairman, Federated Investors, Inc.; Chairman, Federated Securities Corp.
Previous Positions: President and Director or Trustee of some of the Funds in the Federated Fund Family; Executive Vice President, Federated Investors, Inc.; Director and Chief Executive Officer, Federated Securities Corp. |
Stephen Van Meter
Birth Date: June 5, 1975
CHIEF COMPLIANCE OFFICER AND SENIOR VICE PRESIDENT
Officer since: July 2015 | Principal Occupations: Senior Vice President and Chief Compliance Officer of the Federated Fund Family; Vice President and Chief Compliance Officer of Federated Investors, Inc. and Chief Compliance Officer of certain of its subsidiaries. Mr. Van Meter joined Federated in October 2011. He holds FINRA licenses under Series 3, 7, 24 and 66.
Previous Positions: Mr. Van Meter previously held the position of Compliance Operating Officer, Federated Investors, Inc. Prior to joining Federated, Mr. Van Meter served at the United States Securities and Exchange Commission in the positions of Senior Counsel, Office of Chief Counsel, Division of Investment Management and Senior Counsel, Division of Enforcement. |
Annual Shareholder Report
Name
Birth Date
Address
Positions Held with Trust
Date Service Began | Principal Occupation(s) for Past Five Years
and Previous Position(s) |
Stephen F. Auth
Birth Date: September 3, 1956
101 Park Avenue
41st Floor
New York, NY 10178
CHIEF INVESTMENT OFFICER
Officer since: November 2002 | Principal Occupations: Stephen F. Auth is Chief Investment Officer of various Funds in the Federated Fund Family; Executive Vice President, Federated Investment Counseling, Federated Global Investment Management Corp. and Federated Equity Management Company of Pennsylvania.
Previous Positions: Executive Vice President, Federated Investment Management Company and Passport Research, Ltd. (investment advisory subsidiary of Federated); Senior Vice President, Global Portfolio Management Services Division; Senior Vice President, Federated Investment Management Company and Passport Research, Ltd.; Senior Managing Director and Portfolio Manager, Prudential Investments. |
Annual Shareholder Report
Evaluation and Approval of Advisory Contract–May 2015
Federated InterContinental Fund (the “Fund”)
Following a review and recommendation of approval by the Fund's independent trustees, the Fund's Board reviewed and approved at its May 2015 meetings the Fund's investment advisory contract for an additional one-year term. The Board's decision regarding the contract reflects the exercise of its business judgment on whether to continue the existing arrangements.
In this connection, the Federated Funds' Board had previously appointed a Senior Officer, whose duties include specified responsibilities relating to the process by which advisory fees are to be charged to a Federated fund. The Senior Officer has the authority to retain consultants, experts, or staff as may be reasonably necessary to assist in the performance of his duties, reports directly to the Board, and may be terminated only with the approval of a majority of the independent members of the Board. The Senior Officer prepared and furnished to the Board an independent, written evaluation that covered topics discussed below (the “Evaluation”). The Board considered that Evaluation, along with other information, in deciding to approve the advisory contract.
The Board is also familiar with and considered judicial decisions concerning allegedly excessive investment advisory fees, which have indicated that the following factors may be relevant to an Adviser's fiduciary duty with respect to its receipt of compensation from a fund: the nature and quality of the services provided by the Adviser to a fund and its shareholders, including the performance and expenses of the fund and of comparable funds; the Adviser's cost of providing the services, including the profitability to the Adviser of providing advisory services to a fund; the extent to which the Adviser may realize “economies of scale” as a fund grows larger and, if such economies of scale exist, whether they have been shared with a fund and its shareholders or the family of funds; any “fall-out financial benefits” that accrue to the Adviser because of its relationship with a fund (including research services received from brokers that execute fund trades and any fees paid to affiliates of the Adviser for services rendered to a fund); comparative fee structures, including a comparison of fees paid to the Adviser with those paid by similar funds; and the extent of care, conscientiousness and independence with which the Board members perform their duties and their expertise, including whether they are fully informed about all facts the Board deems relevant to its consideration of the Adviser's services and fees. The Board noted that SEC disclosure requirements regarding the basis for the Board's approval of the Fund's advisory contract generally track the factors listed above. Consistent with these judicial decisions and SEC disclosure requirements, the Board also considered management fees
Annual Shareholder Report
charged to institutional and other clients of the Adviser for what might be viewed as like services. The Board was aware of these factors and was guided by them in its review of the Fund's advisory contract to the extent it considered them to be appropriate and relevant, as discussed further below.
The Board considered and weighed these circumstances in light of its substantial accumulated experience in governing the Fund and working with Federated on matters relating to the Federated funds, and was assisted in its deliberations by independent legal counsel. Throughout the year, and in connection with its May meetings, the Board requested and received substantial and detailed information about the Fund and the Federated organization that was in addition to the extensive materials that comprise and accompany the Senior Officer's Evaluation. Federated provided much of this information at each regular meeting of the Board, and furnished additional substantial information in connection with the May meeting at which the Board's formal review of the advisory contract occurred. At this May meeting, senior management of the Adviser also met with the independent trustees and their counsel to discuss the materials presented and any other matters thought relevant by the Adviser or the trustees. Between regularly scheduled meetings, the Board also received information on particular matters as the need arose. Thus, the Board's consideration of the advisory contract included review of the Senior Officer's Evaluation, accompanying data and additional information covering such matters as: the Adviser's investment philosophy, revenue, profitability, personnel and processes; investment and operating strategies; the Fund's short- and long-term performance (in absolute terms, both on a gross basis and net of expenses, as well as in relationship to its particular investment program and certain competitor or “peer group” funds and/or other benchmarks, as appropriate), and comments on the reasons for performance; the Fund's investment objectives; the Fund's expenses (including the advisory fee itself and the overall expense structure of the Fund, both in absolute terms and relative to similar and/or competing funds, with due regard for contractual or voluntary expense limitations); the use and allocation of brokerage commissions derived from trading the Fund's portfolio securities (if any); and the nature, quality and extent of the advisory and other services provided to the Fund by the Adviser and its affiliates. The Board also considered the preferences and expectations of Fund shareholders; the entrepreneurial risk assumed by the Adviser in sponsoring the funds; the continuing state of competition in the mutual fund industry and market practices; the range of comparable fees for similar funds in the mutual fund industry; the Fund's relationship to the Federated family of funds which include a comprehensive array of funds with different investment objectives, policies and strategies which are available for exchange without the incurrence of additional sales charges; compliance and audit reports concerning the Federated funds and the Federated companies that service them (including communications from regulatory agencies), as well as Federated's responses to any issues raised therein; and relevant developments in
Annual Shareholder Report
the mutual fund industry and how the Federated funds and/or Federated are responding to them. The Board's evaluation process is evolutionary. The criteria considered and the emphasis placed on relevant criteria change in recognition of changing circumstances in the mutual fund marketplace.
While mindful that courts have cautioned against giving such comparisons too much weight, the Board has found the use of comparisons of the Fund's fees and expenses to other mutual funds with comparable investment programs to be relevant. In this regard, the Board was presented with, and considered, information regarding the contractual advisory fee rates, net advisory fee rates and total expense ratios relative to a fund's peers. The Board focused on comparisons with other similar mutual funds more heavily than non-mutual fund products or services because it is believed that they are more relevant. For example, other mutual funds are the products most like the Fund, they are readily available to Fund shareholders as alternative investment vehicles, and they are the type of investment vehicle in fact chosen and maintained by the Fund's investors. The range of their fees and expenses therefore appears to be a relevant indicator of what consumers have found to be reasonable in the precise marketplace in which the Fund competes.
The Board reviewed the contractual advisory fee rate, net advisory fee rate where partially waived and other expenses of the Fund and noted the position of the Fund's fee rates relative to its peers. In this regard, the Board noted that the contractual advisory fee rate was above the median of the relevant peer group, but the Board noted the applicable waivers and reimbursements and that the overall expense structure of the Fund remained competitive. The Board will continue to monitor advisory fees and other expenses borne by the Fund in the context of the other factors considered relevant by the Board.
By contrast, the Senior Officer has reviewed Federated's fees for providing advisory services to products outside the Federated family of funds (e.g., institutional and separate accounts and sub-adviser services). He concluded that mutual funds and institutional accounts are inherently different products. Those differences include, but are not limited to, different types of targeted investors; being subject to different laws and regulations; different legal structures; different average account sizes and portfolio management techniques made necessary by different cash flows and different associated costs; and the time spent by portfolio managers and their teams, funds financial services, legal, compliance and risk management in reviewing securities pricing, addressing different administrative responsibilities, addressing different degrees of risk associated with management and a variety of different costs. The Senior Officer did not consider these fee schedules to be determinative in judging the appropriateness of mutual fund advisory fees.
The Senior Officer noted that the services, administrative responsibilities and risks associated with such relationships are quite different than serving as a primary adviser to a fund.
Annual Shareholder Report
The Fund's ability to deliver competitive performance when compared to its peer group was also deemed to be relevant by the Board as a useful indicator of how the Adviser is executing the Fund's investment program, which in turn was one of the Board's considerations in reaching a conclusion that the nature, extent, and quality of the Adviser's investment management services were such as to warrant continuation of the advisory contract.
The Senior Officer reviewed information compiled by Federated, using data supplied by independent fund ranking organizations, regarding the performance of, and fees charged by, other mutual funds, noting his view that comparisons to fund peer groups may be helpful, though not conclusive, in judging the reasonableness of the proposed fees. The Board considered, in evaluating such comparisons, that in some cases individual funds may exhibit significant and unique differences in their objectives and management techniques when compared to other funds within an industry peer group.
The Fund's performance fell below the median of the relevant peer group for the one-year, three-year and five-year periods covered by the Evaluation. The Board discussed the Fund's performance with the Adviser and recognized the efforts being undertaken by the Adviser. The Board will continue to monitor these efforts and the performance of the Fund in the context of the other factors considered relevant by the Board.
The Board also received financial information about Federated, including information regarding the compensation and benefits Federated derived from its relationships with the Federated funds. This information covered not only the fees under the advisory contracts, but also fees received by Federated's subsidiaries for providing other services to the Federated funds under separate contracts (e.g., for serving as the Federated funds' administrator). The information also detailed any indirect benefit Federated may derive from its receipt of research services from brokers who execute Federated fund trades. In addition, the Board considered the fact that, in order for a fund to be competitive in the marketplace, Federated and its affiliates frequently waived fees and/or reimbursed expenses and have disclosed to fund investors and/or indicated to the Board their intention to do so in the future, where appropriate. Moreover, the Board receives regular reporting as to the institution, adjustment or elimination of these voluntary waivers.
In addition, over the past two years, following discussions regarding the Senior Officer's recommendations, Federated made meaningful reductions to the contractual advisory fees for several Funds. At the Board meeting in May 2015, following previous recommendations of the Senior Officer, Federated proposed, and the Board approved, reductions in the contractual advisory fees of certain other Funds.
Federated furnished information, requested by the Senior Officer, that reported revenues on a fund-by-fund basis and made estimates of the allocation of expenses on a fund-by-fund basis, using allocation methodologies specified by the Senior Officer. The Senior Officer noted that, while these cost allocation
Annual Shareholder Report
reports apply consistent allocation processes, the inherent difficulties in allocating costs continues to cause the Senior Officer to question the precision of the process and to conclude that such reports may be unreliable, since a single change in an allocation estimate may dramatically alter the resulting estimate of cost and/or profitability of a fund and may produce unintended consequences. The allocation information, including the Senior Officer's view that fund-by-fund estimations may be unreliable, was considered in the analysis by the Board.
The Board and the Senior Officer also reviewed information compiled by Federated comparing profitability information for Federated to other publicly held fund management companies. In this regard, the Senior Officer concluded that Federated's profit margins did not appear to be excessive. The Senior Officer also noted that Federated appeared financially sound, with the resources to fulfill its obligations under its contracts with the Funds.
The Senior Officer's Evaluation also discussed the notion of possible realization of “economies of scale” as a fund grows larger. The Board considered in this regard that the Adviser has made significant and long-term investments in areas that support all of the Federated family of funds, such as personnel and processes for the portfolio management, shareholder services, compliance, internal audit, and risk management functions; and systems technology; and that the benefits of these efforts (as well as any economies of scale, should they exist) were likely to be enjoyed by the fund family as a whole. Federated, as it does throughout the year, and again in connection with the Board's review, furnished information relative to revenue sharing or adviser paid fees. Federated and the Senior Officer noted that this information should be viewed to determine if there was an incentive to either not apply breakpoints or to apply breakpoints at higher levels and should not be viewed to determining the appropriateness of advisory fees, because it would represent marketing and distribution expenses. Finally, the Board also noted the absence of any applicable regulatory or industry guidelines on this subject, which (as discussed in the Senior Officer's Evaluation) is compounded by the lack of any common industry practice or general pattern with respect to structuring fund advisory fees with “breakpoints” that serve to reduce the fee as the fund attains a certain size.
The Senior Officer noted that, subject to the comments and recommendations made within his Evaluation, his observations and the information accompanying the Evaluation supported a finding by the Board that the management fees for each of the funds were reasonable. Under these circumstances, no changes were recommended to, and no objection was raised to, the continuation of the Fund's advisory contract.
In its decision to continue an existing investment advisory contract, the Board was mindful of the potential disruptions of the Fund's operations and various risks, uncertainties and other effects that could occur as a result of a decision to terminate or not renew an advisory contract. In particular, the Board recognized that many shareholders have invested in the Fund on the strength of the Adviser's industry standing and reputation and with the expectation that the
Annual Shareholder Report
Adviser will have a continuing role in providing advisory services to the Fund. Thus, the Board's approval of the advisory contract reflected the fact that it is the shareholders who have effectively selected the Adviser by virtue of having invested in the Fund. The Board concluded that, in light of the factors discussed above, including the nature, quality and scope of the services provided to the Fund by the Adviser and its affiliates, continuation of the advisory contract was appropriate.
The Board based its decision to approve the advisory contract on the totality of the circumstances and relevant factors and with a view to past and future long-term considerations. Not all of the factors and considerations identified above were necessarily relevant to the Fund, nor did the Board consider any one of them to be determinative. With respect to the factors that were relevant, the Board's decision to approve the contract reflects its determination that Federated's performance and actions provided a satisfactory basis to support the decision to continue the existing arrangements.
Annual Shareholder Report
Voting Proxies on Fund Portfolio Securities
A description of the policies and procedures that the Fund uses to determine how to vote proxies, if any, relating to securities held in the Fund's portfolio is available, without charge and upon request, by calling 1-800-341-7400. A report on “Form N-PX” of how the Fund voted any such proxies during the most recent 12-month period ended June 30 is available via the Proxy Voting Record (Form N-PX) link associated with the Fund and share class name at www.FederatedInvestors.com/FundInformation. Form N-PX filings are also available at the SEC's website at www.sec.gov.
Quarterly Portfolio Schedule
The Fund files with the SEC a complete schedule of its portfolio holdings, as of the close of the first and third quarters of its fiscal year, on “Form N-Q.” These filings are available on the SEC's website at www.sec.gov and may be reviewed and copied at the SEC's Public Reference Room in Washington, DC. (Call 1-800-SEC-0330 for information on the operation of the Public Reference Room.) You may also access this information via the link to the Fund and share class name at www.FederatedInvestors.com/FundInformation.
Annual Shareholder Report
Mutual funds are not bank deposits or obligations, are not guaranteed by any bank and are not insured or guaranteed by the U.S. government, the Federal Deposit Insurance Corporation, the Federal Reserve Board or any other government agency. Investment in mutual funds involves investment risk, including the possible loss of principal.
This Report is authorized for distribution to prospective investors only when preceded or accompanied by the Fund's Prospectus, which contains facts concerning its objective and policies, management fees, expenses and other information.
Federated InterContinental Fund
Federated Investors Funds
4000 Ericsson Drive
Warrendale, PA 15086-7561
Contact us at FederatedInvestors.com
or call 1-800-341-7400.
Federated Securities Corp., Distributor
CUSIP 314172511
CUSIP 314172495
CUSIP 314172487
CUSIP 314172479
CUSIP 314172461
CUSIP 314172164
37865 (1/16)
Federated is a registered trademark of Federated Investors, Inc.
2016 ©Federated Investors, Inc.
Annual Shareholder Report
November 30, 2015
| Share Class | Ticker |
| A | IVFAX |
| C | IVFCX |
| Institutional | IVFIX |
Federated International Strategic Value Dividend Fund
Fund Established 2008
A Portfolio of Federated Equity Funds
Dear Valued Shareholder,
I am pleased to present the Annual Shareholder Report for your fund covering the period from December 1, 2014 through November 30, 2015. This report includes Management's Discussion of Fund Performance, a complete listing of your fund's holdings, performance information and financial statements along with other important fund information.
In addition, our website, FederatedInvestors.com, offers easy access to Federated resources that include timely fund updates, economic and market insights from our investment strategists, and financial planning tools. We invite you to register to take full advantage of its capabilities.
Thank you for investing with Federated. I hope you find this information useful and look forward to keeping you informed.
Sincerely,
J. Christopher Donahue, President
Not FDIC Insured • May Lose Value • No Bank Guarantee
CONTENTS
| 1 |
| 8 |
| 10 |
| 14 |
| 17 |
| 19 |
| 20 |
| 21 |
| 33 |
| 34 |
| 36 |
| 42 |
| 48 |
| 48 |
Management's Discussion of Fund Performance (unaudited)
The total return of Federated International Strategic Value Dividend Fund (the “Fund”), based on net asset value for the 12-month reporting period ended November 30, 2015, was -9.67% for the Class A Shares, -10.33% for the Class C Shares and -9.67% for the Institutional Shares. The total return of the MSCI World ex US High Dividend Yield Index (MWXUSHDYI),1 a representation of the international dividend-paying universe,2 was -10.66% for the reporting period, while the total return of the MSCI World ex US Index (MWXUSI)3 was -4.55% for the same period. The total return of the MSCI EAFE High Dividend Yield Index and the MSCI EAFE, the Fund's previous indexes, were -8.19% and -2.94%, respectively. The Fund's total return for the most recently completed fiscal year reflected actual cash flows, transaction costs and other expenses which are not reflected in the total return of any index.
The following discussion will focus on the performance of the Fund's Institutional Shares.
MARKET OVERVIEW
The reporting period began on a note of caution, with global equity markets being forced to digest a mounting set of challenges. Oil prices were tumbling toward levels not seen since 2009, weighing heavily on shares within the Energy sector. Europe and Japan were struggling to return to growth, and potential deflation added to the uncertainty. And the debate over whether China would experience a hard or soft landing started anew, increasing the level of uncertainty surrounding the outlook for global growth.
As the year progressed, several of these fears were laid to rest while others persisted. In August, global equity markets pulled back sharply amid fears that a rapidly slowing Chinese economy may drag down much of the rest of the world with it. As these concerns mounted, the Fed elected to continue its cautious path forward, choosing to wait for more confirmation that the economy was on solid footing before entering a rate tightening cycle.
The reporting period ended with the major indexes eventually shrugging off the China worries, softening economic data and mediocre quarterly earnings. Expectations that the worst may be over on the earnings front–combined with typical end-of-the-year seasonal forces and additional commitments for even more stimulus from European and Japanese monetary authorities–helped feed a final surge in the markets.
DIVIDEND-BASED4 PERFORMANCE
The Fund ended the reporting period with a 30-day SEC yield of 3.86%5 and a gross weighted-average dividend yield of 4.6% (excluding the positive yield contribution realized from special dividends received in the period). The Fund's gross yield was greater than the yield of the 10-Year U.S. Treasury Note (2.2%), the yield of the broad-market MWXUSI (3.0%) and modestly lower than the
Annual Shareholder Report
yield provided by the MWXUSHDYI (4.9%). In addition to its higher-than-market yield, the Fund seeks to own high-quality companies with the ability and willingness to raise their dividends over time. In the reporting period, 30 companies within the Fund raised their dividend, accounting for 35 increases overall and one dividend reduction. Some of the most generous increases in the reporting period came from holdings such as Swedbank (12.4%), Canadian Imperial Bank of Commerce (12.0%), Imperial Tobacco (10.1%), Diageo (9.1%) and Shaw Communications (7.7%). Svenska Handelsbanken, a Swedish holding in the Financials sector, also paid a special dividend in 2015, in the amount of 1.67 Swedish kronor per share. In total, special distributions added about 0.1% to the overall yield of the Fund for the reporting period. The impact of such one-time special dividends is not included in the Fund's weighted-average dividend yield of 4.6%, quoted above. Additionally, the portfolio experienced its first dividend reduction in two years when Italian Integrated Energy holding Eni lowered its payment by 30% as part of a 3-year capital plan announced by the company's new CEO. The Fund's investment in Eni was sold following the dividend reduction announcement.
The Fund continues to focus on its goal of providing a substantially higher-than-market yield and long-term dividend growth. It pursues these income-based objectives by taking a long-term approach to its investments and by owning primarily high-yielding, mature companies with defensive cash flow profiles. Accordingly, the Fund tends to exhibit a lower level of volatility than the broad market, with a Beta6 of 0.94 at the end of the reporting period (Wilshire 3-year beta versus the MWXUSI calculated using monthly return). In spite of the Fund's overarching defensive properties, the Fund declined in the reporting period, producing a total return of -9.67% in the measurement period. Foreign currency depreciation represented a substantial performance headwind throughout most of the reporting period, with currency translation accounting for a -10.53% drag on the Fund's trailing twelve-month return.
Consistent with its dividend-focused strategy, the Fund's holdings remained concentrated in mature markets that have consistently offered a broad selection of high-dividend-paying stocks–especially the United Kingdom, Switzerland, Canada and Australia. The Fund's investments in these dividend-rich countries resulted in weighted-average total returns of -1.55%, -4.83%, -16.59% and -20.29%, respectively, over the reporting period. Outside of the portfolio's “core” markets, the Fund's Brazilian investments posted the sharpest declines in 2015, with a weighted average return of -31.50% for the period (which includes the Brazilian real's -34.27% slide against the U.S. Dollar).
Annual Shareholder Report
Within the Fund, Consumer Staples represented the portfolio's most stable holdings in 2015, contributing a positive weighted average total return of 0.36% for the twelve-month period. During the reporting period, Consumer Staples represented an average weight of 27.64%, a reflection of the sector's exceptional offering of companies that pay high and rising dividends over time. Performance in the Staples segment was led by holdings such as Imperial Tobacco (24.25%), Wal-Mart de Mexico (10.10%) and Philip Morris International (9.54%).
Among the portfolio's weakest-performing sectors in 2015 was the Energy sector, where a 35.66% decline in Brent crude oil prices weighed on the Fund's Integrated Energy holdings. Laggards from the Energy sector included TransCanada, Royal Dutch Shell and Eni, which returned -30.16%, -23.24% and -19.53% in the reporting period. The Consumer Discretionary and Financials sectors also made negative performance contributions in 2015, with weighted average total returns of -23.86% and -13.64%, respectively. The Fund's two Consumer Discretionary holdings–Shaw Communications and Pearson–returned -20.34% and -32.69%, respectively, in the reporting period. Within Financials, share performance in 2015 was more dependent on country of domicile than quality of operating results (which, in spite of macro headwinds, remained largely resilient in the period). The Fund's Canadian and Australian bank holdings recorded the Financials sector's weakest returns in 2015. Negative contributors included Australia & New Zealand Bank (-23.60%), Bank of Montreal (-18.39), CIBC (-16.21%) and National Australia Bank (-15.21%).
Due to its focus on high dividend income and growth in that income stream over time, the Fund will tend to perform best when the markets prefer high-yield, high-quality, low-beta, large-cap stocks. Often times, the Fund may also outperform in flat markets or periods of modest market distress. Conversely, the Fund may lag the broad market when investors prefer low-yield, low-quality, high-risk, small-cap stocks. Over the past year, the Fund faced a significant performance headwind as low yielding stocks outperformed high-yielding investments. Within the MWXUSI, the lowest yielding quintile outperformed high yield by 8.5% over the trailing one-year period. There was also a distinct preference for small-cap holdings in the twelve-month period, as the lowest cap quintile of the MWXUSI outperformed large-cap by 11.3%. This preference for small-cap, low-yielding securities represented an additional short-term drag on performance for the Fund's dividend-focused investment style in 2015.
At year end, the Fund remained positioned to pursue its goals of high current income, long-term dividend growth and lower downside risk in a variety of market environments.
Annual Shareholder Report
| 1 | At the end of the reporting period, the Fund's adviser elected to change the benchmark from the MSCI EAFE High Dividend Yield Index to the MSCI World ex US High Dividend Yield Index, a representation of the international dividend-paying universe. The MSCI World ex US High Dividend Yield Index is more representative of the securities in which the Fund invests. Please see the footnotes to the line graphs below for definitions of, and further information about, the MSCI EAFE High Dividend Yield Index and the MSCI World ex US High Dividend Yield Index. |
| 2 | International investing involves special risks including currency risk, increased volatility of foreign securities, political risks and differences in auditing and other financial standards. |
| 3 | At the end of the reporting period, the Fund's adviser elected to change the broad-based securities market index from the MSCI EAFE to the MSCI World ex US Index. The MSCI World ex US Index is more representative of the securities in which the Fund invests. Please see the footnotes to the line graphs below for definitions of, and further information about, the MSCI EAFE and the MSCI World ex US Index. |
| 4 | There are no guarantees that dividend-paying stocks will continue to pay dividends. In addition, dividend-paying stocks may not experience the same capital appreciation potential as non-dividend-paying stocks. |
| 5 | Represents the 30-day SEC yield for the Fund's Institutional Shares. In the absence of temporary expense waivers or reimbursements the 30-day SEC yield would have been 3.70% for the Fund's Institutional shares. The dividend yield represents the average yield of the underlying securities within the portfolio. |
| 6 | Beta analyzes the market risk of a fund by showing how responsive the fund is to the market. The beta of the market is 1.00. Accordingly, a fund with a 1.10 beta is expected to perform 10% better than the market in up markets and 10% worse in down markets. Usually the higher betas represent riskier investments. |
Annual Shareholder Report
FUND PERFORMANCE AND GROWTH OF A $10,000 INVESTMENT
The graph below illustrates the hypothetical investment of $10,0001 in the Federated International Strategic Value Dividend Fund from June 4, 2008 (start of performance) to November 30, 2015, compared to the MSCI EAFE High Dividend Yield Index (MSCI HDY)2 the MSCI EAFE Index (MSCI EAFE),3 the MSCI World ex US Index (MWXUSI)4 and the MSCI World ex US High Dividend Yield Index (MWXUSHDYI).5 The Average Annual Total Return table below shows returns for each class averaged over the stated periods.
Growth of a $10,000 Investment
Growth of $10,000 as of November 30, 2015
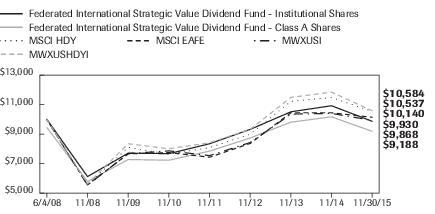
| Federated International Strategic Value Dividend Fund - | Institutional Shares | Class A Shares | MSCI HDY | MSCI EAFE | MWXUSI | MWXUSHDYI |
| F | F | I | I | I | I |
| 6/4/2008 | 10,000 | 9,450 | 10,000 | 10,000 | 10,000 | 10,000 |
| 11/30/2008 | 6,123 | 5,785 | 5,580 | 5,567 | 5,544 | 5,638 |
| 11/30/2009 | 7,713 | 7,281 | 8,104 | 7,667 | 7,679 | 8,351 |
| 11/30/2010 | 7,677 | 7,232 | 7,641 | 7,753 | 7,866 | 8,008 |
| 11/30/2011 | 8,349 | 7,848 | 8,092 | 7,433 | 7,544 | 8,417 |
| 11/30/2012 | 9,322 | 8,740 | 8,993 | 8,370 | 8,431 | 9,325 |
| 11/30/2013 | 10,513 | 9,811 | 11,226 | 10,449 | 10,356 | 11,489 |
| 11/30/2014 | 10,925 | 10,172 | 11,477 | 10,448 | 10,404 | 11,847 |
| 11/30/2015 | 9,868 | 9,188 | 10,537 | 10,140 | 9,930 | 10,584 |
41 graphic description end -->
| ■ | Total returns shown for Class A Shares include the maximum sales charge of 5.50% ($10,000 investment minus $550 sales charge = $9,450). |
The Fund offers multiple share classes whose performance may be greater than or less than its other share class(es) due to differences in sales charges and expenses. See the Average Annual Return table below for the returns of additional classes not shown in the line graph above.
Average Annual Total Returns for the Period Ended 11/30/2015
(returns reflect all applicable sales charges and contingent deferred sales charges as specified below in footnote #1)
| | 1 Year | 5 Year | Start of
Performance6 |
| Class A Shares | -14.58% | 3.74% | -1.12% |
| Class C Shares | -11.20% | 4.14% | -1.12% |
| Institutional Shares | -9.67% | 5.15% | -0.18% |
| MSCI HDY | -8.19% | 6.64% | 0.70% |
| MSCI EAFE | -2.94% | 5.52% | 0.19% |
| MWXUSI | -4.55% | 4.77% | -0.09% |
| MWXUSHDYI | -10.66% | 5.74% | 0.76% |
Annual Shareholder Report
Performance data quoted represents past performance which is no guarantee of future results. Investment return and principal value will fluctuate so that an investor's shares, when redeemed, may be worth more or less than their original cost. Mutual fund performance changes over time and current performance may be lower or higher than what is stated. For current to the most recent month-end performance and after-tax returns, visit FederatedInvestors.com or call 1-800-341-7400. Returns shown do not reflect the deduction of taxes that a shareholder would pay on Fund distributions or the redemption of Fund shares. Mutual funds are not obligations of or guaranteed by any bank and are not federally insured.
| 1 | Represents a hypothetical investment of $10,000 in the Fund after deducting applicable sales charges: for Class A Shares, the maximum sales charge of 5.50% ($10,000 investment minus $550 sales charge = $9,450); for Class C Shares, the maximum contingent deferred sales charge is 1.00% on any redemption less than one year from the purchase date. The Fund's performance assumes the reinvestment of all dividends and distributions. The MSCI HDY, the MSCI EAFE, the MWXUSI and the MWXUSHDYI have been adjusted to reflect reinvestment of dividends on securities in the indexes. |
| 2 | The MSCI HDY is based on MSCI EAFE, its parent index, and includes large-and mid-cap representation across developed markets countries around the world, excluding the United States and Canada. The index is designed to reflect the performance of equities in the parent index (excluding REITs) with higher dividend income and quality characteristics than average dividend yields that are both sustainable and persistent. The index also applies quality screens and reviews 12-month past performance to omit stocks with potentially deteriorating fundamentals that could force them to cut or reduce dividends. The index is not adjusted to reflect sales loads, expenses or other fees that the Securities and Exchange Commission (SEC) requires to be reflected in the Fund's performance. The index is unmanaged and, unlike the Fund, is not affected by cash flows. It is not possible to invest directly in an index. |
| 3 | The MSCI EAFE Index is an equity index which captures large-and mid-cap representation across developed markets countries around the world, excluding the United States and Canada. With 906 constituents, the index covers approximately 85% of the free float-adjusted market capitalization in each country. The index is not adjusted to reflect sales loads, expenses or other fees that the SEC requires to be reflected in the Fund's performance. The index is unmanaged and, unlike the Fund, is not affected by cash flows. It is not possible to invest directly in an index. |
Annual Shareholder Report
| 4 | At the end of the reporting period, the Fund's adviser elected to change the broad-based securities market index from the MSCI EAFE to the MSCI World ex US Index. The MSCI World ex US Index is more representative of the securities in which the Fund invests. The MWXUSI captures large- and mid-cap representation across 22 of 23 Developed Markets (DM) countries—excluding the United States. With 1,005 constituents, the index covers approximately 85% of the free float-adjusted market capitalization in each country. The MWXUSI is not adjusted to reflect sales charges, expenses or other fees that the SEC requires to be reflected in the Fund's performance. The index is unmanaged and unlike the Fund, is not affected by cash flows. It is not possible to invest directly in an index. |
| 5 | At the end of the reporting period, the Fund's adviser elected to change the benchmark from the MSCI EAFE High Dividend Yield Index to the MSCI World ex US High Dividend Yield Index, a representation of the international dividend-paying universe. The MWXUSHDYI is based on the MSCI World ex US Index, its parent index, and includes large- and mid-cap stocks across 22 of 23 Developed Markets (DM) countries. The index is designed to reflect the performance of equities in the parent index (excluding REITs) with higher dividend income and quality characteristics than average dividend yields that are both sustainable and persistent. The index also applies quality screens and reviews 12-month past performance to omit stocks with potentially deteriorating fundamentals that could force them to cut or reduce dividends. The MWXUSHDYI is not adjusted to reflect sales charges, expenses or other fees that the SEC requires to be reflected in the Fund's performance. The index is unmanaged and unlike the Fund, is not affected by cash flows. It is not possible to invest directly in an index. |
| 6 | The Fund's Class A Shares, Class C Shares and Institutional Shares commenced operations on June 4, 2008. |
Annual Shareholder Report
Portfolio of Investments Summary Tables (unaudited)
At November 30, 2015, the Fund's portfolio composition1 was as follows:
| Country | Percentage of
Total Net Assets |
| United Kingdom | 44.0% |
| Canada | 16.9% |
| Switzerland | 8.0% |
| Australia | 5.9% |
| United States | 4.9% |
| Brazil | 4.4% |
| France | 3.2% |
| Mexico | 2.8% |
| Sweden | 2.7% |
| Singapore | 2.4% |
| Germany | 1.5% |
| Norway | 1.5% |
| Cash Equivalents2 | 1.0% |
| Other Assets and Liabilities—Net3 | 0.8% |
| TOTAL | 100.0% |
| 1 | Country allocations are based primarily on the country in which a company is incorporated. However, the Fund's Adviser may allocate a company to a country based on other factors such as location of the company's principal office, the location of the principal trading market for the company's securities or the country where a majority of the company's revenues are derived. |
| 2 | Cash Equivalents include any investments in money market mutual funds and/or overnight repurchase agreements. |
| 3 | Assets, other than investments in securities, less liabilities. See Statement of Assets and Liabilities. |
Annual Shareholder Report
At November 30, 2015, the Fund's sector classification composition4 was as follows:
| Sector Classification | Percentage of
Total Net Assets |
| Consumer Staples | 31.3% |
| Telecommunication Services | 21.3% |
| Utilities | 12.7% |
| Health Care | 11.3% |
| Financials | 10.1% |
| Energy | 9.6% |
| Consumer Discretionary | 1.9% |
| Cash Equivalents2 | 1.0% |
| Other Assets and Liabilities—Net3 | 0.8% |
| TOTAL | 100.0% |
| 4 | Except for Cash Equivalents and Other Assets and Liabilities, sector classifications are based upon, and individual securities assigned to, the classifications of the Global Industry Classification Standard (GICS) except that the Adviser assigns a classification to securities not classified by the GICS and to securities for which the Adviser does not have access to the classification made by the GICS. |
Annual Shareholder Report
Portfolio of Investments
November 30, 2015
| Shares | | | Value in
U.S. Dollars |
| | | COMMON STOCKS—98.2% | |
| | | Banks—8.6% | |
| 244,100 | | Bank of Montreal | $14,094,538 |
| 195,000 | | Canadian Imperial Bank of Commerce | 14,642,705 |
| 290,000 | | National Australia Bank Ltd., Melbourne | 6,146,718 |
| 295,000 | | Svenska Handelsbanken AB, Class A | 3,967,904 |
| 755,100 | | Swedbank AB, Class A | 16,708,116 |
| 409,000 | | Westpac Banking Corp. Ltd., Sydney | 9,484,889 |
| | | TOTAL | 65,044,870 |
| | | Consumer Staples—10.2% | |
| 534,115 | | British American Tobacco PLC | 31,115,213 |
| 426,200 | | Philip Morris International, Inc. | 37,245,618 |
| 3,385,000 | | Wal-Mart de Mexico SAB de CV | 8,996,312 |
| | | TOTAL | 77,357,143 |
| | | Energy—9.6% | |
| 5,919,000 | | BP PLC | 34,343,340 |
| 742,545 | | Royal Dutch Shell PLC, Class B | 18,474,997 |
| 230,894 | | Total SA | 11,454,538 |
| 275,000 | | TransCanada Corp. | 8,677,599 |
| | | TOTAL | 72,950,474 |
| | | Food Beverage & Tobacco—21.1% | |
| 6,961,900 | | Ambev SA, ADR | 33,208,263 |
| 847,000 | | Diageo PLC | 24,314,184 |
| 583,155 | | Imperial Tobacco Group PLC | 31,512,872 |
| 5,035,000 | | Kimberly-Clark de Mexico SAB de CV, ADR | 11,899,404 |
| 368,527 | | Nestle SA | 27,308,473 |
| 746,849 | | Unilever PLC | 31,887,122 |
| | | TOTAL | 160,130,318 |
| | | Health Care—1.6% | |
| 180,000 | | AstraZeneca PLC | 12,217,878 |
| | | Insurance—1.5% | |
| 57,296 | | Muenchener Rueckversicherungs-Gesellschaft AG | 11,544,563 |
| | | Media—1.9% | |
| 678,400 | | Shaw Communications, Inc., Class B | 14,081,582 |
| | | Pharmaceuticals Biotechnology & Life Sciences—9.7% | |
| 1,904,643 | | GlaxoSmithKline PLC | 38,696,097 |
Annual Shareholder Report
| Shares | | | Value in
U.S. Dollars |
| | | COMMON STOCKS—continued | |
| | | Pharmaceuticals Biotechnology & Life Sciences—continued | |
| 99,100 | | Novartis AG | $8,454,645 |
| 53,100 | | Roche Holding AG | 14,196,044 |
| 141,186 | | Sanofi | 12,542,709 |
| | | TOTAL | 73,889,495 |
| | | Technology Hardware Storage & Peripherals—21.3% | |
| 688,000 | | BCE, Inc. | 29,612,670 |
| 335,500 | | Rogers Communications, Inc., Class B | 12,940,660 |
| 6,851,385 | | Singapore Telecom Ltd. | 18,573,311 |
| 22,420 | | Swisscom AG | 11,030,434 |
| 639,000 | | Telenor ASA | 11,120,688 |
| 7,503,515 | | Telstra Corp. Ltd. | 29,150,675 |
| 397,700 | | TELUS Corp. | 12,638,727 |
| 10,863,818 | | Vodafone Group PLC | 36,691,585 |
| | | TOTAL | 161,758,750 |
| | | Utilities—12.7% | |
| 572,000 | | Emera, Inc. | 18,250,717 |
| 135,000 | | Fortis, Inc. | 3,728,182 |
| 2,845,222 | | National Grid PLC | 39,672,071 |
| 1,628,450 | | SSE PLC | 35,170,223 |
| | | TOTAL | 96,821,193 |
| | | TOTAL COMMON STOCKS
(IDENTIFIED COST $771,429,086) | 745,796,266 |
| | | INVESTMENT COMPANY—1.0% | |
| 7,885,673 | 1 | Federated Prime Value Obligations Fund, Institutional Shares, 0.17%2
(AT NET ASSET VALUE) | 7,885,673 |
| | | TOTAL INVESTMENTS—99.2%
(IDENTIFIED COST $779,314,759)3 | 753,681,939 |
| | | OTHER ASSETS AND LIABILITIES - NET—0.8%4 | 5,956,757 |
| | | TOTAL NET ASSETS—100% | $759,638,696 |
Annual Shareholder Report
At November 30, 2015, the Fund had the following outstanding foreign exchange contracts:
| Settlement Date | Counterparty | Foreign Currency
Units to
Receive/Deliver | In
Exchange
For | Unrealized
Depreciation |
| Contracts Sold: |
| 12/2/2015 | BNY Mellon | 43,031 CAD | $32,171 | $(51) |
Unrealized Depreciation on Foreign Exchange Contracts is included in “Other Assets and Liabilities—Net.”
| 1 | Affiliated holding. |
| 2 | 7-day net yield. |
| 3 | Also represents cost for federal tax purposes. |
| 4 | Assets, other than investments in securities, less liabilities. See Statement of Assets and Liabilities. |
Note: The categories of investments are shown as a percentage of total net assets at November 30, 2015.
Various inputs are used in determining the value of the Fund's investments. These inputs are summarized in the three broad levels listed below:
Level 1—quoted prices in active markets for identical securities.
Level 2—other significant observable inputs (including quoted prices for similar securities, interest rates, prepayment speeds, credit risk, etc.). Also includes securities valued at amortized cost.
Level 3—significant unobservable inputs (including the Fund's own assumptions in determining the fair value of investments).
The inputs or methodology used for valuing securities are not an indication of the risk associated with investing in those securities.
Annual Shareholder Report
The following is a summary of the inputs used, as of November 30, 2015, in valuing the Fund's assets carried at fair value:
| Valuation Inputs |
| | Level 1—
Quoted
Prices | Level 2—
Other
Significant
Observable
Inputs | Level 3—
Significant
Unobservable
Inputs | Total |
| Equity Securities: | | | | |
| Common Stocks | | | | |
| Domestic | $37,245,618 | $— | $— | $37,245,618 |
| International | 182,771,359 | 525,779,2891 | $— | 708,550,648 |
| Investment Company | 7,885,673 | — | — | 7,885,673 |
| TOTAL SECURITIES | $227,902,650 | $525,779,289 | $— | $753,681,939 |
| Other Financial Instruments:2 | | | | |
| Assets | $— | $— | $— | $— |
| Liabilities | (51) | — | — | (51) |
| TOTAL OTHER FINANCIAL INSTRUMENTS | $(51) | $— | $— | $(51) |
| 1 | Includes $536,396,449 of securities transferred from Level 1 to Level 2 because fair value factors were applied to equity securities traded principally in foreign markets to account for significant post market close activity. Transfers shown represent the value of the securities at the beginning of the period. |
| 2 | Other financial instruments include foreign exchange contracts. |
The following acronyms are used throughout this portfolio:
| ADR | —American Depositary Receipt |
| CAD | —Canadian Dollar |
See Notes which are an integral part of the Financial Statements
Annual Shareholder Report
Financial Highlights–Class A Shares
(For a Share Outstanding Throughout Each Period)
| Year Ended November 30 | 2015 | 2014 | 2013 | 2012 | 2011 |
| Net Asset Value, Beginning of Period | $4.17 | $4.21 | $3.88 | $3.61 | $3.47 |
| Income From Investment Operations: | | | | | |
| Net investment income1 | 0.13 | 0.19 | 0.15 | 0.16 | 0.17 |
| Net realized and unrealized gain (loss) on investments and foreign currency transactions | (0.52) | (0.03) | 0.32 | 0.24 | 0.12 |
| TOTAL FROM INVESTMENT OPERATIONS | (0.39) | 0.16 | 0.47 | 0.40 | 0.29 |
| Less Distributions: | | | | | |
| Distributions from net investment income | (0.13) | (0.20) | (0.14) | (0.13) | (0.15) |
| Distributions from net realized gain on investments and foreign currency transactions | (0.02) | (0.00)2 | (0.00)2 | — | (0.00)2 |
| TOTAL DISTRIBUTIONS | (0.15) | (0.20) | (0.14) | (0.13) | (0.15) |
| Net Asset Value, End of Period | $3.63 | $4.17 | $4.21 | $3.88 | $3.61 |
| Total Return3 | (9.67)% | 3.68% | 12.25% | 11.37% | 8.52% |
| Ratios to Average Net Assets: | | | | | |
| Net expenses | 1.10%4 | 1.11% | 1.10% | 1.04% | 1.00%4 |
| Net investment income | 3.28% | 4.48% | 3.70% | 4.34% | 4.55% |
| Expense waiver/reimbursement5 | 0.14% | 0.14% | 0.18% | 0.38% | 1.25% |
| Supplemental Data: | | | | | |
| Net assets, end of period (000 omitted) | $229,755 | $311,840 | $263,210 | $110,082 | $38,968 |
| Portfolio turnover | 39% | 11% | 14% | 26% | 38% |
| 1 | Per share numbers have been calculated using the average shares method. |
| 2 | Represents less than $0.01. |
| 3 | Based on net asset value, which does not reflect the sales charge, redemption fee or contingent deferred sales charge, if applicable. |
| 4 | The net expense ratio is calculated without reduction for fees paid indirectly for expense offset arrangements. The net expense ratios are 1.10% and 1.00% for the years ended November 30, 2015 and 2011, respectively, after taking into account these expense reductions. |
| 5 | This expense decrease is reflected in both the net expense and net investment income ratios shown above. |
See Notes which are an integral part of the Financial Statements
Annual Shareholder Report
Financial Highlights–Class C Shares
(For a Share Outstanding Throughout Each Period)
| Year Ended November 30 | 2015 | 2014 | 2013 | 2012 | 2011 |
| Net Asset Value, Beginning of Period | $4.15 | $4.19 | $3.86 | $3.60 | $3.46 |
| Income From Investment Operations: | | | | | |
| Net investment income1 | 0.10 | 0.15 | 0.12 | 0.13 | 0.15 |
Net realized and unrealized gain (loss) on
investments and foreign currency transactions | (0.52) | (0.02) | 0.32 | 0.23 | 0.12 |
| TOTAL FROM INVESTMENT OPERATIONS | (0.42) | 0.13 | 0.44 | 0.36 | 0.27 |
| Less Distributions: | | | | | |
| Distributions from net investment income | (0.10) | (0.17) | (0.11) | (0.10) | (0.13) |
| Distributions from net realized gain on investments and foreign currency transactions | (0.02) | (0.00)2 | (0.00)2 | — | (0.00)2 |
| TOTAL DISTRIBUTIONS | (0.12) | (0.17) | (0.11) | (0.10) | (0.13) |
| Net Asset Value, End of Period | $3.61 | $4.15 | $4.19 | $3.86 | $3.60 |
| Total Return3 | (10.33)% | 3.01% | 11.57% | 10.29% | 7.76% |
| Ratios to Average Net Assets: | | | | | |
| Net expenses | 1.85%4 | 1.86% | 1.85% | 1.79% | 1.75%4 |
| Net investment income | 2.54% | 3.60% | 3.00% | 3.56% | 3.94% |
| Expense waiver/reimbursement5 | 0.14% | 0.14% | 0.18% | 0.37% | 1.25% |
| Supplemental Data: | | | | | |
| Net assets, end of period (000 omitted) | $114,801 | $123,868 | $77,421 | $23,155 | $6,130 |
| Portfolio turnover | 39% | 11% | 14% | 26% | 38% |
| 1 | Per share numbers have been calculated using the average shares method. |
| 2 | Represents less than $0.01. |
| 3 | Based on net asset value, which does not reflect the sales charge, redemption fee or contingent deferred sales charge, if applicable. |
| 4 | The net expense ratio is calculated without reduction for fees paid indirectly for expense offset arrangements. The net expense ratios are 1.85% and 1.75% for the years ended November 30, 2015 and 2011, respectively, after taking into account these expense reductions. |
| 5 | This expense decrease is reflected in both the net expense and net investment income ratios shown above. |
See Notes which are an integral part of the Financial Statements
Annual Shareholder Report
Financial Highlights–Institutional Shares
(For a Share Outstanding Throughout Each Period)
| Year Ended November 30 | 2015 | 2014 | 2013 | 2012 | 2011 |
| Net Asset Value, Beginning of Period | $4.18 | $4.22 | $3.88 | $3.61 | $3.47 |
| Income From Investment Operations: | | | | | |
| Net investment income1 | 0.14 | 0.19 | 0.16 | 0.17 | 0.17 |
| Net realized and unrealized gain (loss) on investments and foreign currency transactions | (0.53) | (0.02) | 0.33 | 0.24 | 0.13 |
| TOTAL FROM INVESTMENT OPERATIONS | (0.39) | 0.17 | 0.49 | 0.41 | 0.30 |
| Less Distributions: | | | | | |
| Distributions from net investment income | (0.14) | (0.21) | (0.15) | (0.14) | (0.16) |
| Distributions from net realized gain on investments and foreign currency transactions | (0.02) | (0.00)2 | (0.00)2 | — | (0.00)2 |
| TOTAL DISTRIBUTIONS | (0.16) | (0.21) | (0.15) | (0.14) | (0.16) |
| Net Asset Value, End of Period | $3.63 | $4.18 | $4.22 | $3.88 | $3.61 |
| Total Return3 | (9.67)% | 3.91% | 12.78% | 11.66% | 8.75% |
| Ratios to Average Net Assets: | | | | | |
| Net expenses | 0.85%4 | 0.86% | 0.85% | 0.79% | 0.75%4 |
| Net investment income | 3.56% | 4.52% | 4.02% | 4.55% | 4.80% |
| Expense waiver/reimbursement5 | 0.14% | 0.14% | 0.18% | 0.37% | 1.23% |
| Supplemental Data: | | | | | |
| Net assets, end of period (000 omitted) | $415,083 | $522,221 | $323,386 | $134,463 | $37,527 |
| Portfolio turnover | 39% | 11% | 14% | 26% | 38% |
| 1 | Per share numbers have been calculated using the average shares method. |
| 2 | Represents less than $0.01. |
| 3 | Based on net asset value. |
| 4 | The net expense ratio is calculated without reduction for fees paid indirectly for expense offset arrangements. The net expense ratios are 0.85% and 0.75% for the years ended November 30, 2015 and 2011, respectively, after taking into account these expense reductions. |
| 5 | This expense decrease is reflected in both the net expense and net investment income ratios shown above. |
See Notes which are an integral part of the Financial Statements
Annual Shareholder Report
Statement of Assets and Liabilities
November 30, 2015
| Assets: | | |
| Total investments in securities, at value including $7,885,673 of investment in an affiliated holding (Note 5) (identified cost $779,314,759) | | $753,681,939 |
| Cash denominated in foreign currencies (identified cost $1,855,936) | | 1,849,423 |
| Income receivable | | 6,482,959 |
| Receivable for shares sold | | 802,170 |
| Other assets | | 4,853 |
| TOTAL ASSETS | | 762,821,344 |
| Liabilities: | | |
| Payable for shares redeemed | $2,753,531 | |
| Bank overdraft | 1,915 | |
| Unrealized depreciation on foreign exchange contracts | 51 | |
| Payable for transfer agent fees | 122,828 | |
| Payable for distribution services fee (Note 5) | 71,871 | |
| Payable for other service fees (Notes 2 and 5) | 70,194 | |
| Payable for investment adviser fee (Note 5) | 12,299 | |
| Payable for administrative fee (Note 5) | 1,639 | |
| Payable for Directors'/Trustees' fees (Note 5) | 605 | |
| Accrued expenses (Note 5) | 147,715 | |
| TOTAL LIABILITIES | | 3,182,648 |
| Net assets for 209,432,856 shares outstanding | | $759,638,696 |
| Net Assets Consists of: | | |
| Paid-in capital | | $863,750,308 |
| Net unrealized depreciation of investments and translation of assets and liabilities in foreign currency | | (25,839,489) |
| Accumulated net realized loss on investments | | (80,350,232) |
| Undistributed net investment income | | 2,078,109 |
| TOTAL NET ASSETS | | $759,638,696 |
Annual Shareholder Report
Statement of Assets and Liabilities–continued
| Net Asset Value, Offering Price and Redemption Proceeds Per Share: | | |
| Class A Shares: | | |
| Net asset value per share ($229,754,479 ÷ 63,328,857 shares outstanding), no par value, unlimited shares authorized | | $3.63 |
| Offering price per share (100/94.50 of $3.63) | | $3.84 |
| Redemption proceeds per share | | $3.63 |
| Class C Shares: | | |
| Net asset value per share ($114,800,989 ÷ 31,839,924 shares outstanding), no par value, unlimited shares authorized | | $3.61 |
| Offering price per share | | $3.61 |
| Redemption proceeds per share (99.00/100 of $3.61) | | $3.57 |
| Institutional Shares: | | |
| Net asset value per share ($415,083,228 ÷ 114,264,075 shares outstanding), no par value, unlimited shares authorized | | $3.63 |
| Offering price per share | | $3.63 |
| Redemption proceeds per share | | $3.63 |
See Notes which are an integral part of the Financial Statements
Annual Shareholder Report
Statement of Operations
Year Ended November 30, 2015
| Investment Income: | | | |
| Dividends (including $8,621 received from an affiliated holding (Note 5) and net of foreign taxes withheld of $2,417,090) | | | $40,278,361 |
| Expenses: | | | |
| Investment adviser fee (Note 5) | | $6,866,022 | |
| Administrative fee (Note 5) | | 716,355 | |
| Custodian fees | | 149,335 | |
| Transfer agent fees | | 977,002 | |
| Directors'/Trustees' fees (Note 5) | | 7,894 | |
| Auditing fees | | 32,480 | |
| Legal fees | | 8,649 | |
| Distribution services fee (Note 5) | | 949,371 | |
| Other service fees (Notes 2 and 5) | | 1,023,184 | |
| Portfolio accounting fees | | 163,590 | |
| Share registration costs | | 98,606 | |
| Printing and postage | | 68,049 | |
| Miscellaneous (Note 5) | | 11,435 | |
| TOTAL EXPENSES | | 11,071,972 | |
| Waiver, Reimbursement and Reduction: | | | |
| Waiver/reimbursement of investment adviser fee (Note 5) | $(1,273,069) | | |
| Fees paid indirectly from directed brokerage arrangements (Note 6) | (5,078) | | |
| TOTAL WAIVER, REIMBURSEMENT AND REDUCTION | | (1,278,147) | |
| Net expenses | | | 9,793,825 |
| Net investment income | | | 30,484,536 |
| Realized and Unrealized Loss on Investments and Foreign Currency Transactions: | | | |
| Net realized loss on investments and foreign currency transactions | | | (80,531,935) |
| Net change in unrealized appreciation of investments and translation of assets and liabilities in foreign currency | | | (47,226,183) |
| Net realized and unrealized loss on investments and foreign currency transactions | | | (127,758,118) |
| Change in net assets resulting from operations | | | $(97,273,582) |
See Notes which are an integral part of the Financial Statements
Annual Shareholder Report
Statement of Changes in Net Assets
| Year Ended November 30 | 2015 | 2014 |
| Increase (Decrease) in Net Assets | | |
| Operations: | | |
| Net investment income | $30,484,536 | $35,101,845 |
| Net realized gain (loss) on investments and foreign currency transactions | (80,531,935) | 4,196,484 |
| Net change in unrealized appreciation/depreciation of investments and translation of assets and liabilities in foreign currency | (47,226,183) | (24,567,264) |
| CHANGE IN NET ASSETS RESULTING FROM OPERATIONS | (97,273,582) | 14,731,065 |
| Distributions to Shareholders: | | |
| Distributions from net investment income | | |
| Class A Shares | (9,304,984) | (13,362,159) |
| Class C Shares | (3,338,736) | (3,800,656) |
| Institutional Shares | (17,831,289) | (18,021,192) |
| Distributions from net realized gain on investments | | |
| Class A Shares | (1,220,633) | (123,999) |
| Class C Shares | (496,600) | (37,818) |
| Institutional Shares | (2,038,239) | (153,024) |
| CHANGE IN NET ASSETS RESULTING FROM DISTRIBUTIONS TO SHAREHOLDERS | (34,230,481) | (35,498,848) |
| Share Transactions: | | |
| Proceeds from sale of shares | 406,993,698 | 538,866,802 |
| Net asset value of shares issued to shareholders in payment of distributions declared | 31,030,652 | 31,747,376 |
| Cost of shares redeemed | (504,809,771) | (255,935,508) |
| CHANGE IN NET ASSETS RESULTING FROM SHARE TRANSACTIONS | (66,785,421) | 314,678,670 |
| Change in net assets | (198,289,484) | 293,910,887 |
| Net Assets: | | |
| Beginning of period | 957,928,180 | 664,017,293 |
| End of period (including undistributed net investment income of $2,078,109 and $2,250,285, respectively) | $759,638,696 | $957,928,180 |
See Notes which are an integral part of the Financial Statements
Annual Shareholder Report
Notes to Financial Statements
November 30, 2015 (unaudited)
1. ORGANIZATION
Federated Equity Funds (the “Trust”) is registered under the Investment Company Act of 1940, as amended (the “Act”), as an open-end management investment company. The Trust consists of 14 portfolios. The financial statements included herein are only those of Federated International Strategic Value Dividend Fund (the “Fund”), a diversified portfolio. The financial statements of the other portfolios are presented separately. The assets of each portfolio are segregated and a shareholder's interest is limited to the portfolio in which shares are held. Each portfolio pays its own expenses. The Fund offers three classes of shares: Class A Shares, Class C Shares and Institutional Shares. All shares of the Fund have equal rights with respect to voting, except on class-specific matters. The investment objective of the Fund is to provide income and long-term capital appreciation.
2. SIGNIFICANT ACCOUNTING POLICIES
The following is a summary of significant accounting policies consistently followed by the Fund in the preparation of its financial statements. These policies are in conformity with U.S. generally accepted accounting principles (GAAP).
Investment Valuation
In calculating its net asset value (NAV), the Fund generally values investments as follows:
| ■ | Equity securities listed on an exchange or traded through a regulated market system are valued at their last reported sale price or official closing price in their principal exchange or market. |
| ■ | Shares of other mutual funds or non-exchange-traded investment companies are valued based upon their reported NAVs. |
| ■ | Fixed-income securities acquired with remaining maturities greater than 60 days are fair valued using price evaluations provided by a pricing service approved by the Fund's Board of Trustees (the “Trustees”). |
| ■ | Fixed-income securities and repurchase agreements acquired with remaining maturities of 60 days or less are valued at their cost (adjusted for the accretion of any discount or amortization of any premium) unless the issuer's creditworthiness is impaired or other factors indicate that amortized cost is not an accurate estimate of the investment's fair value, in which case it would be valued in the same manner as a longer-term security. |
| ■ | Derivative contracts listed on exchanges are valued at their reported settlement or closing price, except that options are valued at the mean of closing bid and asked quotations. |
| ■ | Over-the-counter (OTC) derivative contracts are fair valued using price evaluations provided by a pricing service approved by the Trustees. |
| ■ | For securities that are fair valued in accordance with procedures established by and under the general supervision of the Trustees, certain factors may be considered such as: the last traded or purchase price of the security, information obtained by contacting the issuer or dealers, analysis of the issuer's financial statements or other available documents, fundamental analytical data, the nature and duration of restrictions on disposition, the movement of the market in which the security is normally traded, public trading in similar securities or derivative contracts of the issuer or comparable issuers, movement of a relevant index, or other factors including but not limited to industry changes and relevant government actions. |
Annual Shareholder Report
If any price, quotation, price evaluation or other pricing source is not readily available when the NAV is calculated, or if the Fund cannot obtain price evaluations from a pricing service or from more than one dealer for an investment within a reasonable period of time as set forth in the Fund's valuation policies and procedures, the Fund uses the fair value of the investment determined in accordance with the procedures described below. There can be no assurance that the Fund could obtain the fair value assigned to an investment if it sold the investment at approximately the time at which the Fund determines its NAV per share.
Fair Valuation and Significant Events Procedures
The Trustees have ultimate responsibility for determining the fair value of investments for which market quotations are not readily available. The Trustees have appointed a valuation committee (“Valuation Committee”) comprised of officers of the Fund, Federated Equity Management Company of Pennsylvania (“Adviser”) and certain of the Adviser's affiliated companies to assist in determining fair value and in overseeing the calculation of the NAV. The Trustees have also authorized the use of pricing services recommended by the Valuation Committee to provide fair value evaluations of the current value of certain investments for purposes of calculating the NAV. The Valuation Committee employs various methods for reviewing third-party pricing-service evaluations including periodic reviews of third-party pricing services' policies, procedures and valuation methods (including key inputs, methods, models and assumptions), transactional back-testing, comparisons of evaluations of different pricing services and review of price challenges by the Adviser based on recent market activity. In the event that market quotations and price evaluations are not available for an investment, the Valuation Committee determines the fair value of the investment in accordance with procedures adopted by the Trustees. The Trustees periodically review and approve the fair valuations made by the Valuation Committee and any changes made to the procedures.
Factors considered by pricing services in evaluating an investment include the yields or prices of investments of comparable quality, coupon, maturity, call rights and other potential prepayments, terms and type, reported transactions, indications as to values from dealers and general market conditions. Some pricing services provide a single price evaluation reflecting the bid-side of the market for an investment (a “bid” evaluation). Other pricing services offer both bid evaluations and price evaluations indicative of a price between the prices bid and asked for the investment (a “mid” evaluation). The Fund normally uses bid evaluations for any U.S. Treasury and Agency securities, mortgage-backed securities and municipal securities. The Fund normally uses mid evaluations for any other types of fixed-income securities and any OTC derivative contracts. In the event that market quotations and price evaluations are not available for an investment, the fair value of the investment is determined in accordance with procedures adopted by the Trustees.
The Trustees also have adopted procedures requiring an investment to be priced at its fair value whenever the Adviser determines that a significant event affecting the value of the investment has occurred between the time as of which the price of the investment would otherwise be determined and the time as of which the NAV is computed. An event is considered significant if there is both an affirmative expectation that the investment's value will change in response to the event and a reasonable basis for quantifying the resulting change in value. Examples of significant events that may occur after the close of the principal market on which a security is traded, or after the time of a price evaluation provided by a pricing service or a dealer, include:
| ■ | With respect to securities traded principally in foreign markets, significant trends in U.S. equity markets or in the trading of foreign securities index futures contracts; |
Annual Shareholder Report
| ■ | Political or other developments affecting the economy or markets in which an issuer conducts its operations or its securities are traded; |
| ■ | Announcements concerning matters such as acquisitions, recapitalizations, litigation developments, or a natural disaster affecting the issuer's operations or regulatory changes or market developments affecting the issuer's industry. |
The Trustees have adopted procedures whereby the Valuation Committee uses a pricing service to determine the fair value of equity securities traded principally in foreign markets when the Adviser determines that there has been a significant trend in the U.S. equity markets or in index futures trading. For other significant events, the Fund may seek to obtain more current quotations or price evaluations from alternative pricing sources. If a reliable alternative pricing source is not available, the Fund will determine the fair value of the investment in accordance with the fair valuation procedures approved by the Trustees. The Trustees have ultimate responsibility for any fair valuations made in response to a significant event.
Repurchase Agreements
The Fund may invest in repurchase agreements for short-term liquidity purposes. It is the policy of the Fund to require the other party to a repurchase agreement to transfer to the Fund's custodian or sub-custodian eligible securities or cash with a market value (after transaction costs) at least equal to the repurchase price to be paid under the repurchase agreement. The eligible securities are transferred to accounts with the custodian or sub-custodian in which the Fund holds a “securities entitlement” and exercises “control” as those terms are defined in the Uniform Commercial Code. The Fund has established procedures for monitoring the market value of the transferred securities and requiring the transfer of additional eligible securities if necessary to equal at least the repurchase price. These procedures also allow the other party to require securities to be transferred from the account to the extent that their market value exceeds the repurchase price or in exchange for other eligible securities of equivalent market value.
The insolvency of the other party or other failure to repurchase the securities may delay the disposition of the underlying securities or cause the Fund to receive less than the full repurchase price. Under the terms of the repurchase agreement, any amounts received by the Fund in excess of the repurchase price and related transaction costs must be remitted to the other party.
The Fund may enter into repurchase agreements in which eligible securities are transferred into joint trading accounts maintained by the custodian or sub-custodian for investment companies and other clients advised by the Fund's Adviser and its affiliates. The Fund will participate on a pro rata basis with the other investment companies and clients in its share of the securities transferred under such repurchase agreements and in its share of proceeds from any repurchase or other disposition of such securities.
Investment Income, Gains and Losses, Expenses and Distributions
Investment transactions are accounted for on a trade-date basis. Realized gains and losses from investment transactions are recorded on an identified-cost basis. Interest income and expenses are accrued daily. Dividend income and distributions to shareholders are recorded on the ex-dividend date. Foreign dividends are recorded on the ex-dividend date or when the Fund is informed of the ex-dividend date. Distributions of net investment income are declared and paid monthly. Non-cash dividends included in dividend income, if any, are recorded at fair
Annual Shareholder Report
value. Investment income, realized and unrealized gains and losses, and certain fund-level expenses are allocated to each class based on relative average daily net assets, except that Class A Shares and Class C Shares may bear distribution services fees and other service fees unique to those classes.
Dividends are declared separately for each class. No class has preferential dividend rights; differences in per share dividend rates are generally due to differences in separate class expenses.
Other Service Fees
The Fund may pay other service fees up to 0.25% of the average daily net assets of the Fund's Class A Shares and Class C Shares to unaffiliated financial intermediaries or to Federated Shareholder Services Company (FSSC) for providing services to shareholders and maintaining shareholder accounts. Subject to the terms described in the Expense Limitation note, FSSC may voluntarily reimburse the Fund for other service fees. In addition, unaffiliated third-party financial intermediaries may waive other service fees. This waiver may be modified or terminated at any time. For the year ended November 30, 2015, other service fees for the Fund were as follows:
| | Other
Service Fees
Incurred |
| Class A Shares | $707,652 |
| Class C Shares | 315,532 |
| TOTAL | $1,023,184 |
Premium and Discount Amortization
All premiums and discounts on fixed-income securities are amortized/accreted using the effective-interest-rate method.
Federal Taxes
It is the Fund's policy to comply with the Subchapter M provision of the Internal Revenue Code and to distribute to shareholders each year substantially all of its income. Accordingly, no provision for federal income tax is necessary. As of and during the year ended November 30, 2015, the Fund did not have a liability for any uncertain tax positions. The Fund recognizes interest and penalties, if any, related to tax liabilities as income tax expense in the Statement of Operations. As of November 30, 2015, tax years 2012 through 2015 remain subject to examination by the Fund's major tax jurisdictions, which include the United States of America and the Commonwealth of Massachusetts.
The Fund may be subject to taxes imposed by governments of countries in which it invests. Such taxes are generally based on either income or gains earned or repatriated. The Fund accrues and applies such taxes to net investment income, net realized gains and net unrealized gains as income and/or gains are earned.
Annual Shareholder Report
When-Issued and Delayed-Delivery Transactions
The Fund may engage in when-issued or delayed-delivery transactions. The Fund records when-issued securities on the trade date and maintains security positions such that sufficient liquid assets will be available to make payment for the securities purchased. Securities purchased on a when-issued or delayed-delivery basis are marked to market daily and begin earning interest on the settlement date. Losses may occur on these transactions due to changes in market conditions or the failure of counterparties to perform under the contract.
Foreign Exchange Contracts
The Fund may enter into foreign exchange contracts to manage country risk and currency risk. Purchased contracts are used to acquire exposure to foreign currencies, whereas, contracts to sell are used to hedge the Fund's securities against currency fluctuations. Risks may arise upon entering into these transactions from the potential inability of counterparties to meet the terms of their commitments and from unanticipated movements in security prices or foreign exchange rates. The foreign exchange contracts are adjusted by the daily exchange rate of the underlying currency and any gains or losses are recorded for financial statement purposes as unrealized until the settlement date.
Foreign exchange contracts are subject to Master Netting Agreements which are agreements between the Fund and its counterparties that provide for the net settlement of all transactions and collateral with the Fund, through a single payment, in the event of defaults or terminations. Amounts presented on the Portfolio of Investments and Statement of Assets and Liabilities are not net settlement amounts but gross.
Foreign exchange contracts outstanding at period end, including net unrealized appreciation/depreciation or net settlement amounts, are listed after the Fund's Portfolio of Investments.
The average value at settlement date payable and receivable of foreign exchange contracts purchased and sold by the Fund throughout the period was $8,638 and $3,842 respectively. This is based on the amounts held as of each month-end throughout the fiscal year.
Foreign Currency Translation
The accounting records of the Fund are maintained in U.S. dollars. All assets and liabilities denominated in foreign currencies (FCs) are translated into U.S. dollars based on the rates of exchange of such currencies against U.S. dollars on the date of valuation. Purchases and sales of securities, income and expenses are translated at the rate of exchange quoted on the respective date that such transactions are recorded. The Fund does not isolate that portion of the results of operations resulting from changes in foreign exchange rates on investments from the fluctuations arising from changes in market prices of securities held. Such fluctuations are included with the net realized and unrealized gain or loss from investments.
Reported net realized foreign exchange gains or losses arise from sales of portfolio securities, sales and maturities of short-term securities, sales of FCs, currency gains or losses realized between the trade and settlement dates on securities transactions, the difference between the amounts of dividends, interest and foreign withholding taxes recorded on the Fund's books and the U.S. dollar equivalent of the amounts actually received or paid. Net unrealized foreign exchange gains and losses arise from changes in the value of assets and liabilities other than investments in securities at fiscal period end, resulting from changes in the exchange rate.
Annual Shareholder Report
Additional Disclosure Related to Derivative Instruments
| Fair Value of Derivative Instruments |
| | Liability |
| | Statement of
Assets and
Liabilities
Location | Fair
Value |
Derivatives not
accounted for as
hedging instruments
under ASC Topic 815 | | |
Foreign exchange
contracts | Unrealized
depreciation
on foreign
exchange
contracts | $51 |
The Effect of Derivative Instruments on the Statement of Operations for the Year Ended November 30, 2015
| Amount of Realized Gain or (Loss) on Derivatives Recognized in Income |
| | Forward
Exchange
Contracts |
| Foreign exchange contracts | $(1,348,920) |
| Change in Unrealized Appreciation or (Depreciation) on Derivatives Recognized in Income |
| | Forward
Exchange
Contracts |
| Foreign exchange contracts | $(51) |
Other
The preparation of financial statements in conformity with GAAP requires management to make estimates and assumptions that affect the amounts of assets, liabilities, expenses and revenues reported in the financial statements. Actual results could differ from those estimated. The Fund applies Investment Company accounting and reporting guidance.
Annual Shareholder Report
3. SHARES OF BENEFICIAL INTEREST
The following tables summarize share activity:
| Year Ended November 30 | 2015 | 2014 |
| Class A Shares: | Shares | Amount | Shares | Amount |
| Shares sold | 24,592,860 | $96,326,926 | 35,306,667 | $152,314,128 |
| Shares issued to shareholders in payment of distributions declared | 2,620,518 | 10,130,635 | 2,986,142 | 12,936,627 |
| Shares redeemed | (38,632,025) | (148,324,682) | (26,032,408) | (112,311,513) |
| NET CHANGE RESULTING FROM CLASS A SHARE TRANSACTIONS | (11,418,647) | $(41,867,121) | 12,260,401 | $52,939,242 |
| Year Ended November 30 | 2015 | 2014 |
| Class C Shares: | Shares | Amount | Shares | Amount |
| Shares sold | 11,499,241 | $44,980,635 | 13,783,177 | $ 59,377,292 |
| Shares issued to shareholders in payment of distributions declared | 916,708 | 3,517,562 | 796,322 | 3,434,846 |
| Shares redeemed | (10,425,916) | (39,702,267) | (3,188,016) | (13,575,915) |
| NET CHANGE RESULTING FROM CLASS C SHARE TRANSACTIONS | 1,990,033 | $8,795,930 | 11,391,483 | $49,236,223 |
| Year Ended November 30 | 2015 | 2014 |
| Institutional Shares: | Shares | Amount | Shares | Amount |
| Shares sold | 67,708,659 | $265,686,137 | 75,726,367 | $327,175,382 |
| Shares issued to shareholders in payment of distributions declared | 4,497,899 | 17,382,455 | 3,548,550 | 15,375,903 |
| Shares redeemed | (82,992,753) | (316,782,822) | (30,938,133) | (130,048,080) |
| NET CHANGE RESULTING FROM INSTITUTIONAL SHARE TRANSACTIONS | (10,786,195) | $(33,714,230) | 48,336,784 | $212,503,205 |
| NET CHANGE RESULTING FROM TOTAL FUND SHARE TRANSACTIONS | (20,214,809) | $(66,785,421) | 71,988,668 | $314,678,670 |
4. FEDERAL TAX INFORMATION
The timing and character of income and capital gain distributions are determined in accordance with income tax regulations, which may differ from GAAP. These differences are due to differing treatments for foreign currency transactions.
For the year ended November 30, 2015, permanent differences identified and reclassified among the components of net assets were as follows:
| Increase (Decrease) |
Undistributed
Net Investment
Income (Loss) | Accumulated
Net Realized
Gain (Loss) |
| $(181,703) | $181,703 |
Net investment income (loss), net realized gains (losses) and net assets were not affected by the reclassification.
Annual Shareholder Report
The tax character of distributions as reported on the Statement of Changes in Net Assets for the years ended November 30, 2015 and 2014, was as follows:
| | 2015 | 2014 |
| Ordinary income1 | $31,295,535 | $35,415,440 |
| Long-term capital gains | $2,934,946 | $83,408 |
| 1 | For tax purposes, short-term capital gain distributions are considered ordinary income distributions. |
As of November 30, 2015, the components of distributable earnings on a tax basis were as follows:
| Undistributed ordinary income | $2,078,109 |
| Net unrealized depreciation | $(25,839,489) |
| Capital loss carryforwards | $(80,350,232) |
At November, 2015, the cost of investments for federal tax purposes was $779,314,759. The net unrealized depreciation of investments for federal tax purposes, excluding any unrealized depreciation resulting from the translation from FCs to U.S. dollars of assets and liabilities other than investments in securities, was $25,632,820. This consists of net unrealized appreciation from investments for those securities having an excess of value over cost of $39,290,727 and net unrealized depreciation from investments for those securities having an excess of cost over value of $64,923,547.
At November 30, 2015, the Fund had a capital loss carryforward of $80,350,232 which will reduce the Fund's taxable income arising from future net realized gains on investments, if any, to the extent permitted by the Code, thereby reducing the amount of distributions to shareholders which would otherwise be necessary to relieve the Fund of any liability for federal income tax. Pursuant to the Code, a net capital loss incurred in taxable years beginning after December 22, 2010, retains its character as either short-term or long-term and does not expire. All of the Fund's capital loss carryforwards were incurred in taxable years beginning after December 22, 2010.
The following schedule summarizes the Fund's capital loss carryforwards:
| Short-Term | Long-Term | Total |
| $27,522,964 | $52,827,268 | $ 80,350,232 |
5. INVESTMENT ADVISER FEE AND OTHER TRANSACTIONS WITH AFFILIATES
Investment Adviser Fee
The advisory agreement between the Fund and the Adviser provides for an annual fee equal to 0.75% of the Fund's average daily net assets. Subject to the terms described in the Expense Limitation note, the Adviser may voluntarily choose to waive any portion of its fee. For the year ended November 30, 2015, the Adviser voluntarily waived $1,263,024 of its fee.
Annual Shareholder Report
Administrative Fee
Federated Administrative Services (FAS), under the Administrative Services Agreement, provides the Fund with administrative personnel and services. For purposes of determining the appropriate rate breakpoint, “Investment Complex” is defined as all of the Federated Funds subject to a fee under the Administrative Services Agreement. The fee paid to FAS is based on the average daily net assets of the Investment Complex as specified below, plus certain out-of-pocket expenses:
| Administrative Fee | Average Daily Net Assets
of the Investment Complex |
| 0.150% | on the first $5 billion |
| 0.125% | on the next $5 billion |
| 0.100% | on the next $10 billion |
| 0.075% | on assets in excess of $20 billion |
Subject to the terms described in the Expense Limitation note, FAS may voluntarily choose to waive any portion of its fee. For the year ended November 30, 2015, the annualized fee paid to FAS was 0.078% of average daily net assets of the Fund.
Distribution Services Fee
The Fund has adopted a Distribution Plan (the “Plan”) pursuant to Rule 12b-1 under the Act. Under the terms of the Plan, the Fund will compensate Federated Securities Corp. (FSC), the principal distributor, from the daily net assets of the Fund's Class A Shares and Class C Shares to finance activities intended to result in the sale of these shares. The Plan provides that the Fund may incur distribution expenses at the following percentages of average daily net assets annually, to compensate FSC:
| Share Class Name | Percentage of Average Daily
Net Assets of Class |
| Class A Shares | 0.05% |
| Class C Shares | 0.75% |
Subject to the terms described in the Expense Limitation note, FSC may voluntarily choose to waive any portion of its fee. For the year ended November 30, 2015, distribution services fees for the Fund were as follows:
| | Distribution
Services Fees
Incurred |
| Class C Shares | $949,371 |
When FSC receives fees, it may pay some or all of them to financial intermediaries whose customers purchase shares. For the year ended November 30, 2015, FSC retained $376,032 of fees paid by the Fund. For the year ended November 30, 2015, the Fund's Class A Shares did not incur a distribution services fee; however, it may begin to incur this fee upon approval of the Trustees.
Annual Shareholder Report
Sales Charges
Front-end sales charges and contingent deferred sales charges (CDSC) do not represent expenses of the Fund. They are deducted from the proceeds of sales of Fund shares prior to investment or from redemption proceeds prior to remittance, as applicable. For the year ended November 30, 2015, FSC retained $124,617 in sales charges from the sale of Class A Shares. FSC also retained $4,964 and $30,415 of CDSC relating to redemptions of Class A Shares and Class C Shares, respectively.
Other Service Fees
For the year ended November 30, 2015. FSSC received $7,482 of other service fees disclosed in Note 2.
Expense Limitation
The Adviser and certain of its affiliates (which may include FSC, FAS and FSSC) on their own initiative have agreed to waive certain amounts of their respective fees and/or reimburse expenses. Total annual fund operating expenses (as shown in the financial highlights, excluding tax reclaim recovery expenses, expenses allocated from affiliated partnerships, interest expense, extraordinary expenses and proxy-related expenses paid by the Fund, if any) paid by the Fund's Class A Shares, Class C Shares and Institutional Shares (after the voluntary waivers and reimbursements) will not exceed 1.10%, 1.85% and 0.85% (the “Fee Limit”), respectively, up to but not including the later of (the “Termination Date”): (a) February 1, 2017; or (b) the date of the Fund's next effective Prospectus. While the Adviser and its applicable affiliates currently do not anticipate terminating or increasing these arrangements prior to the Termination Date, these arrangements may only be terminated or the Fee Limit increased prior to the Termination Date with the agreement of the Trustees.
General
Certain Officers and Trustees of the Fund are Officers and Directors or Trustees of certain of the above companies. To efficiently facilitate payment, Directors'/Trustees' fees and certain expenses related to conducting meetings of the Directors/Trustees and other miscellaneous expenses are paid by an affiliate of the Adviser which in due course are reimbursed by the Fund. Such expenses may be included in Accrued and Miscellaneous Expenses on the Statements of Assets and Liabilities and Statements of Operations, respectively.
Annual Shareholder Report
Transactions with Affiliated Holdings
Affiliated holdings are investment companies which are managed by the Adviser or an affiliate of the Adviser. The Adviser has agreed to reimburse the Fund for certain investment adviser fees as a result of transactions in other affiliated investment companies. For the year ended November 30, 2015, the Adviser reimbursed $10,045. Transactions involving the affiliated holding during the year ended November 30, 2015, were as follows:
| | Federated
Prime Value
Obligations Fund,
Institutional Shares |
| Balance of Shares Held 11/30/2014 | 4,797,699 |
| Purchases/Additions | 301,030,880 |
| Sales/Reductions | (297,942,906) |
| Balance of Shares Held 11/30/2015 | 7,885,673 |
| Value | $7,885,673 |
| Dividend Income | $8,621 |
6. EXPENSE REDUCTION
The Fund directs portfolio trades to a broker that in turn pays a portion of the Fund's operating expenses. For the year ended November 30, 2015, the Fund's expenses were reduced by $5,078 under these arrangements.
7. Investment TRANSACTIONS
Purchases and sales of investments, excluding long-term U.S. government securities and short-term obligations, for the year ended November 30, 2015, were as follows:
| Purchases | $346,390,731 |
| Sales | $415,635,530 |
8. CONCENTRATION OF RISK
The Fund invests in securities of non-U.S. issuers. Political or economic developments may have an effect on the liquidity and volatility of portfolio securities and currency holdings.
9. LINE OF CREDIT
The Fund participates in a $100,000,000 unsecured, uncommitted revolving line of credit (LOC) agreement with PNC Bank. The LOC was made available for extraordinary or emergency purposes, primarily for financing redemption payments. Borrowings are charged interest at a rate offered to the Fund by PNC Bank at the time of the borrowing. As of November 30, 2015, there were no outstanding loans. During the year ended November 30, 2015, the Fund did not utilize the LOC.
Annual Shareholder Report
10. INTERFUND LENDING
Pursuant to an Exemptive Order issued by the Securities and Exchange Commission, the Fund, along with other funds advised by subsidiaries of Federated Investors, Inc., may participate in an interfund lending program. This program provides an alternative credit facility allowing the Fund to borrow from other participating affiliated funds. As of November 30, 2015, there were no outstanding loans. During the year ended November 30, 2015, the program was not utilized.
11. Federal TAX Information (UNAUDITED)
For the fiscal year ended November 30, 2015, 100.00% of the total ordinary income (including short-term capital gain) distributions made by the Fund are qualifying dividends which may be subject to a maximum tax rate of 15%, as provided for in the Jobs and Growth Tax Relief Act of 2003. Complete information is reported in conjunction with the reporting of your distribution on Form 1099-DIV.
Of the ordinary income (including short-term capital gain) distributions made by the Fund during the year ended November 30, 2015, 1.27% qualify for the dividend received deduction available to corporate shareholders.
If the Fund meets the requirements of Section 853 of the code, the Fund will pass through to its shareholders credits of foreign taxes paid. For the year ended November 30, 2015, the Fund derived $42,224,769 of gross income from foreign sources and paid foreign taxes of $2,417,090.
For the year ended November 30, 2015, the amount of long-term capital gains designated by the Fund was $2,934,946.
Annual Shareholder Report
Report of Independent Registered Public Accounting Firm
TO THE BOARD OF TRUSTEES OF THE FEDERATED EQUITY FUNDS AND SHAREHOLDERS OF Federated InternATIONAL STRATEGIC VALUE Dividend fund:
We have audited the accompanying statement of assets and liabilities, including the portfolio of investments, of the Federated International Strategic Value Dividend Fund (the “Fund”), a portfolio of Federated Equity Funds, as of November 30, 2015, and the related statement of operations for the year then ended, the statements of changes in net assets for each of the years in the two-year period then ended and the financial highlights for each of the years in the five-year period then ended. These financial statements and financial highlights are the responsibility of the Fund's management. Our responsibility is to express an opinion on these financial statements and financial highlights based on our audits.
We conducted our audits in accordance with the standards of the Public Company Accounting Oversight Board (United States). Those standards require that we plan and perform the audit to obtain reasonable assurance about whether the financial statements and financial highlights are free of material misstatement. An audit includes examining, on a test basis, evidence supporting the amounts and disclosures in the financial statements. Our procedures included confirmation of securities owned as of November 30, 2015, by correspondence with the custodian, transfer agent and brokers or by other appropriate auditing procedures. An audit also includes assessing the accounting principles used and significant estimates made by management, as well as evaluating the overall financial statement presentation. We believe that our audits provide a reasonable basis for our opinion.
In our opinion, the financial statements and financial highlights referred to above present fairly, in all material respects, the financial position of the Federated International Strategic Value Dividend Fund as of November 30, 2015, and the results of its operations for the year then ended, the changes in its net assets for each of the years in the two-year period then ended and the financial highlights for each of the years in the five-year period then ended, in conformity with U.S. generally accepted accounting principles.
Boston, Massachusetts
January 25, 2016
Annual Shareholder Report
Shareholder Expense Example (unaudited)
As a shareholder of the Fund, you incur two types of costs: (1) transaction costs, including sales charges (loads) on purchase or redemption payments and redemption/exchange fees; and (2) ongoing costs, including management fees and to the extent applicable, distribution (12b-1) fees and/or other service fees and other Fund expenses. This Example is intended to help you to understand your ongoing costs (in dollars) of investing in the Fund and to compare these costs with the ongoing costs of investing in other mutual funds. It is based on an investment of $1,000 invested at the beginning of the period and held for the entire period from June 1, 2015 to November 30, 2015.
ACTUAL EXPENSES
The first section of the table below provides information about actual account values and actual expenses. You may use the information in this section, together with the amount you invested, to estimate the expenses that you incurred over the period. Simply divide your account value by $1,000 (for example, an $8,600 account value divided by $1,000 = 8.6), then multiply the result by the number in the first section under the heading entitled “Expenses Paid During Period” to estimate the expenses attributable to your investment during this period.
HYPOTHETICAL EXAMPLE FOR COMPARISON PURPOSES
The second section of the table below provides information about hypothetical account values and hypothetical expenses based on the Fund's actual expense ratio and an assumed rate of return of 5% per year before expenses, which is not the Fund's actual return. Thus, you should not use the hypothetical account values and expenses to estimate the actual ending account balance or your expenses for the period. Rather, these figures are required to be provided to enable you to compare the ongoing costs of investing in the Fund with other funds. To do so, compare this 5% hypothetical example with the 5% hypothetical examples that appear in the shareholder reports of the other funds.
Annual Shareholder Report
Please note that the expenses shown in the table are meant to highlight your ongoing costs only and do not reflect any transaction costs, such as sales charges (loads) on purchase or redemption payments, or redemption/exchange fees. Therefore, the second section of the table is useful in comparing ongoing costs only, and will not help you determine the relative total costs of owning different funds. In addition, if these transaction costs were included, your costs would have been higher.
| | Beginning
Account Value
6/1/2015 | Ending
Account Value
11/30/2015 | Expenses Paid
During Period1 |
| Actual: | | | |
| Class A Shares | $1,000 | $935.00 | $5.34 |
| Class C Shares | $1,000 | $934.10 | $8.97 |
| Institutional Shares | $1,000 | $936.00 | $4.13 |
Hypothetical (assuming a 5% return
before expenses): | | | |
| Class A Shares | $1,000 | $1,019.55 | $5.57 |
| Class C Shares | $1,000 | $1,015.79 | $9.35 |
| Institutional Shares | $1,000 | $1,020.81 | $4.31 |
| 1 | Expenses are equal to the Fund's annualized net expense ratios, multiplied by the average account value over the period, multiplied by 183/365 (to reflect the one-half-year period). The annualized net expense ratios are as follows: |
| | |
| Class A Shares | 1.10% |
| Class C Shares | 1.85% |
| Institutional Shares | 0.85% |
Annual Shareholder Report
Board of Trustees and Trust Officers
The Board of Trustees is responsible for managing the Trust's business affairs and for exercising all the Trust's powers except those reserved for the shareholders. The following tables give information about each Trustee and the senior officers of the Fund. Where required, the tables separately list Trustees who are “interested persons” of the Fund (i.e., “Interested” Trustees) and those who are not (i.e., “Independent” Trustees). Unless otherwise noted, the address of each person listed is Federated Investors Tower, 1001 Liberty Avenue, Pittsburgh, PA 15222. The address of all Independent Trustees listed is 4000 Ericsson Drive, Warrendale, PA 15086-7561; Attention: Mutual Fund Board. As of December 31, 2015, the Trust comprised 14 portfolio(s), and the Federated Fund Family consisted of 38 investment companies (comprising 122 portfolios). Unless otherwise noted, each Officer is elected annually. Unless otherwise noted, each Trustee oversees all portfolios in the Federated Fund Family and serves for an indefinite term. The Fund's Statement of Additional Information includes additional information about Trust Trustees and is available, without charge and upon request, by calling 1-800-341-7400.
Interested Trustees Background
Name
Birth Date
Positions Held with Trust
Date Service Began | Principal Occupation(s) for Past Five Years,
Other Directorships Held and Previous Position(s) |
John F. Donahue*
Birth Date: July 28, 1924
Trustee
Indefinite Term
Began serving: April 1984 | Principal Occupations: Director or Trustee of the Federated Fund Family; Chairman and Director, Federated Investors, Inc.; Chairman of the Federated Fund Family's Executive Committee.
Previous Positions: Chairman of the Federated Fund Family; Trustee, Federated Investment Management Company; Chairman and Director, Federated Investment Counseling. |
J. Christopher Donahue*
Birth Date: April 11, 1949
President and Trustee
Indefinite Term
Began serving: January 2000 | Principal Occupations: Principal Executive Officer and President of certain of the Funds in the Federated Fund Family; Director or Trustee of the Funds in the Federated Fund Family; President, Chief Executive Officer and Director, Federated Investors, Inc.; Chairman and Trustee, Federated Investment Management Company; Trustee, Federated Investment Counseling; Chairman and Director, Federated Global Investment Management Corp.; Chairman, Federated Equity Management Company of Pennsylvania and Passport Research, Ltd. (investment advisory subsidiary of Federated); Trustee, Federated Shareholder Services Company; Director, Federated Services Company.
Previous Positions: President, Federated Investment Counseling; President and Chief Executive Officer, Federated Investment Management Company, Federated Global Investment Management Corp. and Passport Research, Ltd. |
| * | Family relationships and reasons for “interested” status: John F. Donahue is the father of J. Christopher Donahue; both are “interested” due to their beneficial ownership of shares of Federated Investors, Inc. and the positions they hold with Federated and its subsidiaries. |
Annual Shareholder Report
INDEPENDENT Trustees Background
Name
Birth Date
Positions Held with Trust
Date Service Began | Principal Occupation(s) for Past Five Years,
Other Directorships Held, Previous Position(s) and Qualifications |
John T. Collins
Birth Date: January 24, 1947
Trustee
Indefinite Term
Began serving: October 2013 | Principal Occupations: Director or Trustee of the Federated Fund Family; Retired.
Other Directorships Held: Director, Chair of the Compensation Committee, Audit Committee member, KLX Corp.
Qualifications: Mr. Collins has served in several business and financial management roles and directorship positions throughout his career. Mr. Collins previously served as Chairman and CEO, The Collins Group, Inc. (a private equity firm). Mr. Collins serves as Chairman Emeriti, Bentley University. Mr. Collins previously served as Director, FleetBoston Financial Corp.; Director and Audit Committee Member, Bank of America Corp. and Director, Beth Israel Deaconess Medical Center (Harvard University Affiliate Hospital). |
G. Thomas Hough
Birth Date: February 28, 1955
Trustee
Indefinite Term
Began serving: August 2015 | Principal Occupations: Director or Trustee of the Federated Fund Family; Retired.
Other Directorships Held: Director, Chair of the Audit Committee, Governance Committee, Publix Super Markets, Inc.
Qualifications: Mr. Hough has served in accounting, business management and directorship positions throughout his career. Mr. Hough most recently held the position of Americas Vice Chair of Assurance with Ernst & Young LLP. Mr. Hough is an Executive Committee member of the United States Golf Association, he serves on the President's Cabinet and Business School Board of Visitors for the University of Alabama and is on the Business School Board of Visitors for Wake Forest University. |
Maureen Lally-Green
Birth Date: July 5, 1949
Trustee
Indefinite Term
Began serving: August 2009 | Principal Occupations: Director or Trustee of the Federated Fund Family; Adjunct Professor of Law, Duquesne University School of Law.
Other Directorships Held: Director, CONSOL Energy Inc.
Qualifications: Judge Lally-Green has served in various legal and business roles and directorship positions throughout her career. Judge Lally-Green previously served as: Associate General Secretary, Diocese of Pittsburgh; a member of the Superior Court of Pennsylvania; and as a Professor of Law, Duquesne University School of Law. Judge Lally-Green also holds the positions on either a public or not for profit Board of Directors as follows: Member, Pennsylvania State Board of Education (public); Director and Chair, UPMC Mercy Hospital; Regent, St. Vincent Seminary; Director, Epilepsy Foundation of Western and Central Pennsylvania; Director and Vice Chair, Our Campaign for the Church Alive!, Inc.; Director, Saint Vincent College; Director, Pennsylvania Bar Institute; and Director and Chair, Cardinal Wuerl North Catholic High School, Inc. Judge Lally-Green has held the positions of: Director, Auberle; Director, Ireland Institute of Pittsburgh; Director, Saint Thomas More Society; and Director, Catholic High Schools of the Diocese of Pittsburgh, Inc. |
Annual Shareholder Report
Name
Birth Date
Positions Held with Trust
Date Service Began | Principal Occupation(s) for Past Five Years,
Other Directorships Held, Previous Position(s) and Qualifications |
Peter E. Madden
Birth Date: March 16, 1942
Trustee
Indefinite Term
Began serving: November 1991 | Principal Occupation: Director or Trustee, and Chair of the Board of Directors or Trustees, of the Federated Fund Family; Retired.
Other Directorships Held: None.
Qualifications: Mr. Madden has served in several business management, mutual fund services and directorship positions throughout his career. Mr. Madden previously served as President, Chief Operating Officer and Director, State Street Bank and Trust Company (custodian bank) and State Street Corporation (financial services). He was Director, VISA USA and VISA International and Chairman and Director, Massachusetts Bankers Association. Mr. Madden served as Director, Depository Trust Corporation and Director, The Boston Stock Exchange. Mr. Madden also served as a Representative to the Commonwealth of Massachusetts General Court. |
Charles F. Mansfield, Jr.
Birth Date: April 10, 1945
Trustee
Indefinite Term
Began serving: January 1999 | Principal Occupations: Director or Trustee of the Federated Fund Family; Management Consultant.
Other Directorships Held: None.
Qualifications: Mr. Mansfield has served in several banking, business management and educational roles and directorship positions throughout his career. Mr. Mansfield previously served as Chief Executive Officer, PBTC International Bank; Partner, Arthur Young & Company (now Ernst & Young LLP); Chief Financial Officer of Retail Banking Sector, Chase Manhattan Bank; Senior Vice President, HSBC Bank USA (formerly, Marine Midland Bank); Vice President, Citibank; Assistant Professor of Banking and Finance, Frank G. Zarb School of Business, Hofstra University; Executive Vice President DVC Group, Inc. (marketing, communications and technology). |
Thomas M. O'Neill
Birth Date: June 14, 1951
Trustee
Indefinite Term
Began serving: October 2006 | Principal Occupations: Director or Trustee, Chair of the Audit Committee of the Federated Fund Family; Sole Proprietor, Navigator Management Company (investment and strategic consulting).
Other Directorships Held: None.
Qualifications: Mr. O'Neill has served in several business, mutual fund and financial management roles and directorship positions throughout his career. Mr. O'Neill serves as Director, Medicines for Humanity and Director, The Golisano Children's Museum of Naples, Florida. Mr. O'Neill previously served as Chief Executive Officer and President, Managing Director and Chief Investment Officer, Fleet Investment Advisors; President and Chief Executive Officer, Aeltus Investment Management, Inc.; General Partner, Hellman, Jordan Management Co., Boston, MA; Chief Investment Officer, The Putnam Companies, Boston, MA; Credit Analyst and Lending Officer, Fleet Bank; Director and Consultant, EZE Castle Software (investment order management software); and Director, Midway Pacific (lumber). |
Annual Shareholder Report
Name
Birth Date
Positions Held with Trust
Date Service Began | Principal Occupation(s) for Past Five Years,
Other Directorships Held, Previous Position(s) and Qualifications |
P. Jerome Richey
Birth Date: February 23, 1949
Trustee
Indefinite Term
Began serving: October 2013 | Principal Occupations: Director or Trustee of the Federated Fund Family; Management Consultant.
Other Directorships Held: None.
Qualifications: Mr. Richey has served in several business and legal management roles and directorship positions throughout his career. Mr. Richey most recently held the positions of Senior Vice Chancellor and Chief Legal Officer, University of Pittsburgh. Mr. Richey serves as Board Member, Epilepsy Foundation of Western Pennsylvania and Board member, World Affairs Council of Pittsburgh. Mr. Richey previously served as Chief Legal Officer and Executive Vice President, CONSOL Energy Inc. and Shareholder, Buchanan Ingersoll & Rooney PC (a law firm). |
John S. Walsh
Birth Date: November 28, 1957
Trustee
Indefinite Term
Began serving: January 1999 | Principal Occupations: Director or Trustee of the Federated Fund Family; President and Director, Heat Wagon, Inc. (manufacturer of construction temporary heaters); President and Director, Manufacturers Products, Inc. (distributor of portable construction heaters); President, Portable Heater Parts, a division of Manufacturers Products, Inc.
Other Directorships Held: None.
Qualifications: Mr. Walsh has served in several business management roles and directorship positions throughout his career. Mr. Walsh previously served as Vice President, Walsh & Kelly, Inc. (paving contractors). |
OFFICERS
Name
Birth Date
Address
Positions Held with Trust
Date Service Began | Principal Occupation(s) for Past Five Years
and Previous Position(s) |
John W. McGonigle
Birth Date: October 26, 1938
EXECUTIVE VICE PRESIDENT AND SECRETARY
Officer since: April 1984 | Principal Occupations: Executive Vice President and Secretary of the Federated Fund Family; Vice Chairman, Executive Vice President, Secretary and Director, Federated Investors, Inc.
Previous Positions: Trustee, Federated Investment Management Company and Federated Investment Counseling; Director, Federated Global Investment Management Corp., Federated Services Company and Federated Securities Corp. |
Annual Shareholder Report
Name
Birth Date
Address
Positions Held with Trust
Date Service Began | Principal Occupation(s) for Past Five Years
and Previous Position(s) |
Lori A. Hensler
Birth Date: January 6, 1967
TREASURER
Officer since: April 2013 | Principal Occupations: Principal Financial Officer and Treasurer of the Federated Fund Family; Senior Vice President, Federated Administrative Services; Financial and Operations Principal for Federated Securities Corp. and Edgewood Services, Inc.; and Assistant Treasurer, Federated Investors Trust Company. Ms. Hensler has received the Certified Public Accountant designation.
Previous Positions: Controller of Federated Investors, Inc.; Senior Vice President and Assistant Treasurer, Federated Investors Management Company; Treasurer, Federated Investors Trust Company; Assistant Treasurer, Federated Administrative Services, Federated Administrative Services, Inc., Federated Securities Corp., Edgewood Services, Inc., Federated Advisory Services Company, Federated Equity Management Company of Pennsylvania, Federated Global Investment Management Corp., Federated Investment Counseling, Federated Investment Management Company, Passport Research, Ltd., and Federated MDTA, LLC; Financial and Operations Principal for Federated Securities Corp., Edgewood Services, Inc. and Southpointe Distribution Services, Inc. |
Peter J. Germain
Birth Date: September 3, 1959
CHIEF LEGAL OFFICER
Officer since: January 2005 | Principal Occupations: Mr. Germain is Chief Legal Officer of the Federated Fund Family. He is General Counsel and Vice President, Federated Investors, Inc.; President, Federated Administrative Services and Federated Administrative Services, Inc.; Vice President, Federated Securities Corp.; Secretary, Federated Private Asset Management, Inc.; and Secretary, Retirement Plan Service Company of America. Mr. Germain joined Federated in 1984 and is a member of the Pennsylvania Bar Association.
Previous Positions: Deputy General Counsel, Special Counsel, Managing Director of Mutual Fund Services, Federated Investors, Inc.; Senior Vice President, Federated Services Company; and Senior Corporate Counsel, Federated Investors, Inc. |
Richard B. Fisher
Birth Date: May 17, 1923
Vice President
Officer since: April 1987 | Principal Occupations: Vice Chairman or Vice President of some of the Funds in the Federated Fund Family; Vice Chairman, Federated Investors, Inc.; Chairman, Federated Securities Corp.
Previous Positions: President and Director or Trustee of some of the Funds in the Federated Fund Family; Executive Vice President, Federated Investors, Inc.; Director and Chief Executive Officer, Federated Securities Corp. |
Stephen Van Meter
Birth Date: June 5, 1975
CHIEF COMPLIANCE OFFICER AND SENIOR VICE PRESIDENT
Officer since: July 2015 | Principal Occupations: Senior Vice President and Chief Compliance Officer of the Federated Fund Family; Vice President and Chief Compliance Officer of Federated Investors, Inc. and Chief Compliance Officer of certain of its subsidiaries. Mr. Van Meter joined Federated in October 2011. He holds FINRA licenses under Series 3, 7, 24 and 66.
Previous Positions: Mr. Van Meter previously held the position of Compliance Operating Officer, Federated Investors, Inc. Prior to joining Federated, Mr. Van Meter served at the United States Securities and Exchange Commission in the positions of Senior Counsel, Office of Chief Counsel, Division of Investment Management and Senior Counsel, Division of Enforcement. |
Annual Shareholder Report
Name
Birth Date
Address
Positions Held with Trust
Date Service Began | Principal Occupation(s) for Past Five Years
and Previous Position(s) |
Stephen F. Auth
Birth Date: September 3, 1956
101 Park Avenue
41st Floor
New York, NY 10178
CHIEF INVESTMENT OFFICER
Officer since: November 2002 | Principal Occupations: Stephen F. Auth is Chief Investment Officer of various Funds in the Federated Fund Family; Executive Vice President, Federated Investment Counseling, Federated Global Investment Management Corp. and Federated Equity Management Company of Pennsylvania.
Previous Positions: Executive Vice President, Federated Investment Management Company and Passport Research, Ltd. (investment advisory subsidiary of Federated); Senior Vice President, Global Portfolio Management Services Division; Senior Vice President, Federated Investment Management Company and Passport Research, Ltd.; Senior Managing Director and Portfolio Manager, Prudential Investments. |
Annual Shareholder Report
Evaluation and Approval of Advisory Contract–May 2015
Federated International Strategic Value Dividend Fund (the “Fund”)
Following a review and recommendation of approval by the Fund's independent trustees, the Fund's Board reviewed and approved at its May 2015 meetings the Fund's investment advisory contract for an additional one-year term. The Board's decision regarding the contract reflects the exercise of its business judgment on whether to continue the existing arrangements.
In this connection, the Federated Funds' Board had previously appointed a Senior Officer, whose duties include specified responsibilities relating to the process by which advisory fees are to be charged to a Federated fund. The Senior Officer has the authority to retain consultants, experts, or staff as may be reasonably necessary to assist in the performance of his duties, reports directly to the Board, and may be terminated only with the approval of a majority of the independent members of the Board. The Senior Officer prepared and furnished to the Board an independent, written evaluation that covered topics discussed below (the “Evaluation”). The Board considered that Evaluation, along with other information, in deciding to approve the advisory contract.
The Board is also familiar with and considered judicial decisions concerning allegedly excessive investment advisory fees, which have indicated that the following factors may be relevant to an Adviser's fiduciary duty with respect to its receipt of compensation from a fund: the nature and quality of the services provided by the Adviser to a fund and its shareholders, including the performance and expenses of the fund and of comparable funds; the Adviser's cost of providing the services, including the profitability to the Adviser of providing advisory services to a fund; the extent to which the Adviser may realize “economies of scale” as a fund grows larger and, if such economies of scale exist, whether they have been shared with a fund and its shareholders or the family of funds; any “fall-out financial benefits” that accrue to the Adviser because of its relationship with a fund (including research services received from brokers that execute fund trades and any fees paid to affiliates of the Adviser for services rendered to a fund); comparative fee structures, including a comparison of fees paid to the Adviser with those paid by similar funds; and the extent of care, conscientiousness and independence with which the Board members perform their duties and their expertise, including whether they are fully informed about all facts the Board deems relevant to its consideration of the Adviser's services and fees. The Board noted that SEC disclosure requirements regarding the basis for the Board's approval of the Fund's advisory contract generally track the factors listed above. Consistent with these judicial decisions and SEC disclosure requirements, the Board also considered management fees
Annual Shareholder Report
charged to institutional and other clients of the Adviser for what might be viewed as like services. The Board was aware of these factors and was guided by them in its review of the Fund's advisory contract to the extent it considered them to be appropriate and relevant, as discussed further below.
The Board considered and weighed these circumstances in light of its substantial accumulated experience in governing the Fund and working with Federated on matters relating to the Federated funds, and was assisted in its deliberations by independent legal counsel. Throughout the year, and in connection with its May meetings, the Board requested and received substantial and detailed information about the Fund and the Federated organization that was in addition to the extensive materials that comprise and accompany the Senior Officer's Evaluation. Federated provided much of this information at each regular meeting of the Board, and furnished additional substantial information in connection with the May meeting at which the Board's formal review of the advisory contract occurred. At this May meeting, senior management of the Adviser also met with the independent trustees and their counsel to discuss the materials presented and any other matters thought relevant by the Adviser or the trustees. Between regularly scheduled meetings, the Board also received information on particular matters as the need arose. Thus, the Board's consideration of the advisory contract included review of the Senior Officer's Evaluation, accompanying data and additional information covering such matters as: the Adviser's investment philosophy, revenue, profitability, personnel and processes; investment and operating strategies; the Fund's short- and long-term performance (in absolute terms, both on a gross basis and net of expenses, as well as in relationship to its particular investment program and certain competitor or “peer group” funds and/or other benchmarks, as appropriate), and comments on the reasons for performance; the Fund's investment objectives; the Fund's expenses (including the advisory fee itself and the overall expense structure of the Fund, both in absolute terms and relative to similar and/or competing funds, with due regard for contractual or voluntary expense limitations); the use and allocation of brokerage commissions derived from trading the Fund's portfolio securities (if any); and the nature, quality and extent of the advisory and other services provided to the Fund by the Adviser and its affiliates. The Board also considered the preferences and expectations of Fund shareholders; the entrepreneurial risk assumed by the Adviser in sponsoring the funds; the continuing state of competition in the mutual fund industry and market practices; the range of comparable fees for similar funds in the mutual fund industry; the Fund's relationship to the Federated family of funds which include a comprehensive array of funds with different investment objectives, policies and strategies which are available for exchange without the incurrence of additional sales charges; compliance and audit reports concerning the Federated funds and the Federated companies that service them (including communications from regulatory agencies), as well as Federated's responses to any issues raised therein; and relevant developments in
Annual Shareholder Report
the mutual fund industry and how the Federated funds and/or Federated are responding to them. The Board's evaluation process is evolutionary. The criteria considered and the emphasis placed on relevant criteria change in recognition of changing circumstances in the mutual fund marketplace.
While mindful that courts have cautioned against giving such comparisons too much weight, the Board has found the use of comparisons of the Fund's fees and expenses to other mutual funds with comparable investment programs to be relevant. In this regard, the Board was presented with, and considered, information regarding the contractual advisory fee rates, net advisory fee rates and total expense ratios relative to a fund's peers. The Board focused on comparisons with other similar mutual funds more heavily than non-mutual fund products or services because it is believed that they are more relevant. For example, other mutual funds are the products most like the Fund, they are readily available to Fund shareholders as alternative investment vehicles, and they are the type of investment vehicle in fact chosen and maintained by the Fund's investors. The range of their fees and expenses therefore appears to be a relevant indicator of what consumers have found to be reasonable in the precise marketplace in which the Fund competes.
The Board reviewed the contractual advisory fee rate, net advisory fee rate where partially waived and other expenses of the Fund and noted the position of the Fund's fee rates relative to its peers. In this regard, the Board noted that the contractual advisory fee rate was below the median of the relevant peer group and that it was satisfied that the overall expense structure of the Fund remained competitive.
By contrast, the Senior Officer has reviewed Federated's fees for providing advisory services to products outside the Federated family of funds (e.g., institutional and separate accounts and sub-adviser services). He concluded that mutual funds and institutional accounts are inherently different products. Those differences include, but are not limited to, different types of targeted investors; being subject to different laws and regulations; different legal structures; different average account sizes and portfolio management techniques made necessary by different cash flows and different associated costs; and the time spent by portfolio managers and their teams, funds financial services, legal, compliance and risk management in reviewing securities pricing, addressing different administrative responsibilities, addressing different degrees of risk associated with management and a variety of different costs. The Senior Officer did not consider these fee schedules to be determinative in judging the appropriateness of mutual fund advisory fees.
The Senior Officer noted that the services, administrative responsibilities and risks associated with such relationships are quite different than serving as a primary adviser to a fund.
Annual Shareholder Report
The Fund's ability to deliver competitive performance when compared to its peer group was also deemed to be relevant by the Board as a useful indicator of how the Adviser is executing the Fund's investment program, which in turn was one of the Board's considerations in reaching a conclusion that the nature, extent, and quality of the Adviser's investment management services were such as to warrant continuation of the advisory contract.
The Senior Officer reviewed information compiled by Federated, using data supplied by independent fund ranking organizations, regarding the performance of, and fees charged by, other mutual funds, noting his view that comparisons to fund peer groups may be helpful, though not conclusive, in judging the reasonableness of the proposed fees. The Board considered, in evaluating such comparisons, that in some cases individual funds may exhibit significant and unique differences in their objectives and management techniques when compared to other funds within an industry peer group.
For the periods covered by the Evaluation, the Fund's performance for the one-year and five-year periods was above the median of the relevant peer group, and the Fund's performance fell below the median of the relevant peer group for the three-year period. The Board discussed the Fund's performance with the Adviser and recognized the efforts being undertaken by the Adviser. The Board will continue to monitor these efforts and the performance of the Fund in the context of the other factors considered relevant by the Board.
The Board also received financial information about Federated, including information regarding the compensation and benefits Federated derived from its relationships with the Federated funds. This information covered not only the fees under the advisory contracts, but also fees received by Federated's subsidiaries for providing other services to the Federated funds under separate contracts (e.g., for serving as the Federated funds' administrator). The information also detailed any indirect benefit Federated may derive from its receipt of research services from brokers who execute Federated fund trades. In addition, the Board considered the fact that, in order for a fund to be competitive in the marketplace, Federated and its affiliates frequently waived fees and/or reimbursed expenses and have disclosed to fund investors and/or indicated to the Board their intention to do so in the future, where appropriate. Moreover, the Board receives regular reporting as to the institution, adjustment or elimination of these voluntary waivers.
In addition, over the past two years, following discussions regarding the Senior Officer's recommendations, Federated made meaningful reductions to the contractual advisory fees for several Funds. At the Board meeting in May 2015, following previous recommendations of the Senior Officer, Federated proposed, and the Board approved, reductions in the contractual advisory fees of certain other Funds.
Annual Shareholder Report
Federated furnished information, requested by the Senior Officer, that reported revenues on a fund-by-fund basis and made estimates of the allocation of expenses on a fund-by-fund basis, using allocation methodologies specified by the Senior Officer. The Senior Officer noted that, while these cost allocation reports apply consistent allocation processes, the inherent difficulties in allocating costs continues to cause the Senior Officer to question the precision of the process and to conclude that such reports may be unreliable, since a single change in an allocation estimate may dramatically alter the resulting estimate of cost and/or profitability of a fund and may produce unintended consequences. The allocation information, including the Senior Officer's view that fund-by-fund estimations may be unreliable, was considered in the analysis by the Board.
The Board and the Senior Officer also reviewed information compiled by Federated comparing profitability information for Federated to other publicly held fund management companies. In this regard, the Senior Officer concluded that Federated's profit margins did not appear to be excessive. The Senior Officer also noted that Federated appeared financially sound, with the resources to fulfill its obligations under its contracts with the Funds.
The Senior Officer's Evaluation also discussed the notion of possible realization of “economies of scale” as a fund grows larger. The Board considered in this regard that the Adviser has made significant and long-term investments in areas that support all of the Federated family of funds, such as personnel and processes for the portfolio management, shareholder services, compliance, internal audit, and risk management functions; and systems technology; and that the benefits of these efforts (as well as any economies of scale, should they exist) were likely to be enjoyed by the fund family as a whole. Federated, as it does throughout the year, and again in connection with the Board's review, furnished information relative to revenue sharing or adviser paid fees. Federated and the Senior Officer noted that this information should be viewed to determine if there was an incentive to either not apply breakpoints or to apply breakpoints at higher levels and should not be viewed to determining the appropriateness of advisory fees, because it would represent marketing and distribution expenses. Finally, the Board also noted the absence of any applicable regulatory or industry guidelines on this subject, which (as discussed in the Senior Officer's Evaluation) is compounded by the lack of any common industry practice or general pattern with respect to structuring fund advisory fees with “breakpoints” that serve to reduce the fee as the fund attains a certain size.
The Senior Officer noted that, subject to the comments and recommendations made within his Evaluation, his observations and the information accompanying the Evaluation supported a finding by the Board that the management fees for each of the funds were reasonable. Under these circumstances, no changes were recommended to, and no objection was raised to, the continuation of the Fund's advisory contract.
Annual Shareholder Report
In its decision to continue an existing investment advisory contract, the Board was mindful of the potential disruptions of the Fund's operations and various risks, uncertainties and other effects that could occur as a result of a decision to terminate or not renew an advisory contract. In particular, the Board recognized that many shareholders have invested in the Fund on the strength of the Adviser's industry standing and reputation and with the expectation that the Adviser will have a continuing role in providing advisory services to the Fund. Thus, the Board's approval of the advisory contract reflected the fact that it is the shareholders who have effectively selected the Adviser by virtue of having invested in the Fund. The Board concluded that, in light of the factors discussed above, including the nature, quality and scope of the services provided to the Fund by the Adviser and its affiliates, continuation of the advisory contract was appropriate.
The Board based its decision to approve the advisory contract on the totality of the circumstances and relevant factors and with a view to past and future long-term considerations. Not all of the factors and considerations identified above were necessarily relevant to the Fund, nor did the Board consider any one of them to be determinative. With respect to the factors that were relevant, the Board's decision to approve the contract reflects its determination that Federated's performance and actions provided a satisfactory basis to support the decision to continue the existing arrangements.
Annual Shareholder Report
Voting Proxies on Fund Portfolio Securities
A description of the policies and procedures that the Fund uses to determine how to vote proxies, if any, relating to securities held in the Fund's portfolio is available, without charge and upon request, by calling 1-800-341-7400. A report on “Form N-PX” of how the Fund voted any such proxies during the most recent 12-month period ended June 30 is available via the Proxy Voting Record (Form N-PX) link associated with the Fund and share class name at www.FederatedInvestors.com/FundInformation. Form N-PX filings are also available at the SEC's website at www.sec.gov.
Quarterly Portfolio Schedule
The Fund files with the SEC a complete schedule of its portfolio holdings, as of the close of the first and third quarters of its fiscal year, on “Form N-Q.” These filings are available on the SEC's website at www.sec.gov and may be reviewed and copied at the SEC's Public Reference Room in Washington, DC. (Call 1-800-SEC-0330 for information on the operation of the Public Reference Room.) You may also access this information via the link to the Fund and share class name at www.FederatedInvestors.com/FundInformation.
Annual Shareholder Report
Mutual funds are not bank deposits or obligations, are not guaranteed by any bank and are not insured or guaranteed by the U.S. government, the Federal Deposit Insurance Corporation, the Federal Reserve Board or any other government agency. Investment in mutual funds involves investment risk, including the possible loss of principal.
This Report is authorized for distribution to prospective investors only when preceded or accompanied by the Fund's Prospectus, which contains facts concerning its objective and policies, management fees, expenses and other information.
Federated International Strategic Value Dividend Fund
Federated Investors Funds
4000 Ericsson Drive
Warrendale, PA 15086-7561
Contact us at FederatedInvestors.com
or call 1-800-341-7400.
Federated Securities Corp., Distributor
CUSIP 314172388
CUSIP 314172370
CUSIP 314172362
39834 (1/16)
Federated is a registered trademark of Federated Investors, Inc.
2016 ©Federated Investors, Inc.
Annual Shareholder Report
November 30, 2015
| Share Class | Ticker |
| A | FVOAX |
| C | FVOCX |
| Institutional | FVOIX |
Federated Managed Volatility Fund
Fund Established 2014
A Portfolio of Federated Equity Funds
Dear Valued Shareholder,
I am pleased to present the Annual Shareholder Report for your fund covering the period from December 15, 2014 through November 30, 2015. This report includes Management's Discussion of Fund Performance, a complete listing of your fund's holdings, performance information and financial statements along with other important fund information.
In addition, our website, FederatedInvestors.com, offers easy access to Federated resources that include timely fund updates, economic and market insights from our investment strategists, and financial planning tools. We invite you to register to take full advantage of its capabilities.
Thank you for investing with Federated. I hope you find this information useful and look forward to keeping you informed.
Sincerely,
J. Christopher Donahue, President
Not FDIC Insured • May Lose Value • No Bank Guarantee
CONTENTS
| 1 |
| 6 |
| 8 |
| 14 |
| 17 |
| 19 |
| 21 |
| 22 |
| 35 |
| 36 |
| 38 |
| 44 |
| 50 |
| 50 |
Management's Discussion of Fund Performance (unaudited)
The total return of Federated Managed Volatility Fund (the “Fund”), based on net asset value for the since-inception reporting period starting December 15, 2014 and ending November 30, 2015, was -3.15% for the Class A Shares, -3.63% for the Class C Shares and -3.12% for the Institutional Shares. The total returns of the Russell 1000® Value Index (R1000V), the Barclays Emerging Markets USD Aggregate Index (BEMAI), the Barclays US Corporate High Yield 2% Issuer Capped Index (BHY2%ICI) and the Barclays Mortgage-Backed Securities Index (BMB) were 2.40%, 4.40%, 0.14% and 1.71%, respectively. Weighting these benchmarks (40% R1000V, 20% BEMAI, 20% BHY2%ICI and 20% BMB), the total return of the blended benchmark (Blended Index)1,2 was 2.34%. The Morningstar Conservative Allocation Funds Average (MCAFA)3 had a total return of 0.48% for the same period. The Fund's and the MCAFA's total returns reflected actual cash flows, transaction costs and other expenses, which were not reflected in the total return of the Blended Index.
During this period, the Fund's investment strategy was most affected by: (a) the Fund's tactical volatility4 overlay; (b) the value tilt of the Fund's equity portfolio; and (c) the security selection within the equity sleeve.
The following discussion will focus on the performance of the Fund's Institutional Shares.
MARKET OVERVIEW
The reporting period was best categorized as an oscillating market environment caused by multiple macro-economic headlines. The most notable were world growth fears sparked by a surprise devaluation of the yuan by the People's Bank of China and uncertainty as to the timing of the Federal Reserve's (the “Fed”) target interest rate hike, which caused the S&P 500 to decline -10.18% in just four short trading days ending August 25th. Despite the potential rate-hike, U.S. yields5 fell during the reporting period, boosting bond returns and favoring longer-duration6 bonds. U.S. equities continued to outperform those of the rest of the world, with growth stocks strongly outperforming value stocks, as illustrated by the 10.65% return of the Russell 1000® Growth Index (R1000G)7 over the reporting period.
Annual Shareholder Report
Market volatility started and ended the reporting period at about the same level, with the Chicago Board Options Exchange (CBOE) Volatility Index (VIX),8 a measure of implied forward volatility of the S&P 500, moving from 14.03 to 15.07. This slight rise in the VIX belied the large swings of volatility during the year, with geopolitical fears escalating in late December 2014, the Greek debt crisis in June 2015, and China growth concerns and Fed rate hike fears in August 2015. In the first instance, the closing VIX peaked at 23.57 on December 16, 2014, before dropping down as low as 14.37 on December 24, 2014; another peak occurred in June at 18.85, following Greek debt fears; however, both of these were dwarfed by the 40.74 peak on August 24, 2015, the highest level since August 2011.
By the end of the reporting period, the VIX had decreased to below five-year median levels; however, many headline risks remained.
Volatility Overlay
For the reporting period, the volatility targeting overlay was the largest negative contributor to Fund performance. The Fund uses an S&P 500 futures and options9 overlay to manage the Fund's volatility to a 10% target, increasing volatility in calm markets and decreasing volatility in turbulent markets. The Fund's annualized daily volatility over the reporting period was 10.7%, slightly above the targeted 10% volatility.
Due to the high market volatility in the beginning of the month of December 2014, the Fund began the since-inception period with virtually no futures overlay. As the reporting period progressed, relative market conditions persisted and the overlay slowly increased in order to keep the projected annualized volatility of the Fund within its 8% to 12% range. However, in August market volatility spiked and the overlay was quickly reduced to lower projected Fund volatility. Market exposure was increased in both October and November as extreme market returns dissipated; but, nevertheless, the Fund did not participate fully in the quick market rebound.
Value tilt
The equity portfolio is composed of higher income value stocks. Value underperformed Growth during the reporting period, with the R1000V returning 2.40% compared to the 10.65% return of the R1000G. The underperformance of Value had a moderating effect on Fund performance.
Annual Shareholder Report
SECURITY SELECTION
Security selection in the equity sleeve detracted from Fund performance, with positive contributions from stocks such as Newmont Mining, Valero Energy and Reynolds American offset by negative contributions from Centurylink and US Steel.
| 1 | Please see the footnotes to the line graphs under “Fund Performance and Growth of a $10,000 Investment” below for the definition of, and more information about, the Blended Index. |
| 2 | The Fund's broad-based securities market index is the S&P 500 Index (S&P 500). Please see the footnotes to the line graphs under “Fund Performance and Growth of a $10,000 Investment” below for the definition of, and more information about, the S&P 500. The S&P 500's return for the since-inception reporting period was 6.67%. The Blended Index is being used for comparison purposes because, although it is not the Fund's broad-based securities market index, the Fund's Adviser believes it more closely reflects the market sectors in which the Fund invests. |
| 3 | Please see the footnotes to the line graphs under “Fund Performance and Growth of a $10,000 Investment” below for the definition of, and more information about, the MCAFA. |
| 4 | Volatility is a statistical measurement of the frequency and level of changes in the value of an asset, index or instrument without regard to the direction of those changes. Volatility may result from rapid and dramatic price swings. There can be no guarantee that the Fund will maintain its target annualized volatility. Furthermore, while the volatility management portion of the strategy seeks enhanced returns with more consistent volatility levels over time, attaining and maintaining the target volatility does not ensure that the Fund will deliver enhanced returns. |
| 5 | Bond prices are sensitive to changes in interest rates, and a rise in interest rates can cause a decline in their prices. |
| 6 | Duration is a measure of a security's price sensitivity to changes in interest rates. Securities with longer durations are more sensitive to changes in interest rates than securities of shorter durations. |
| 7 | The Russell 1000® Growth Index measures the performance of the large-cap growth segment of the U.S. equity universe. It includes those Russell 1000® Index companies with higher price-to-book ratios and higher forecasted growth values. The index is constructed to provide a comprehensive and unbiased barometer for the large-cap growth segment. The index is completely reconstituted annually to ensure new and growing equities are included and that the represented companies continue to reflect growth characteristics. The index is unmanaged, and it is not possible to invest directly in an index. |
| 8 | The CBOE Volatility Index (VIX) is a key measure of market expectations of near-term volatility conveyed by S&P 500 stock index option prices. The index is unmanaged, and it is not possible to invest directly in an index. |
| 9 | The Fund's use of derivative instruments involves risks different from, or possibly greater than, the risks associated with investing directly in securities and other traditional instruments. |
Annual Shareholder Report
FUND PERFORMANCE AND GROWTH OF A $10,000 INVESTMENT
The graph below illustrates the hypothetical investment of $10,0001 in the Federated Managed Volatility Fund (the “Fund”) from December 15, 2014 (start of performance) to November 30, 2015, compared to the Standard & Poor's Index (S&P 500),2 40% Russell 1000® Value Index (R1000V)/20%, Barclays Emerging Markets USD Aggregate Index (BEMAI)/20%, Barclays High Yield 2% Issuer Capped Index (BHY2%ICI)/20%, Barclays Mortgage-Backed Securities Index (BMB) (the “Blended Index”)2,3 and Morningstar Conservative Allocation Funds Average (MCAFA).4 The Average Annual Total Return table below shows returns for each class averaged over the stated periods.
Growth of a $10,000 InvestmenT
Growth of $10,000 as of November 30, 2015
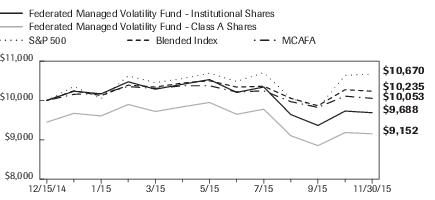
| Federated Managed Volatility Fund - | Institutional Shares | Class A Shares | S&P 500 | Blended Index | MCAFA |
| F | F | I | I | I |
| 12/15/2014 | 10,000 | 9,450 | 10,000 | 10,000 | 10,000 |
| 12/31/2014 | 10,235 | 9,672 | 10,356 | 10,245 | 10,156 |
| 1/31/2015 | 10,167 | 9,607 | 10,045 | 10,123 | 10,177 |
| 2/28/2015 | 10,474 | 9,898 | 10,623 | 10,388 | 10,353 |
| 3/31/2015 | 10,286 | 9,720 | 10,455 | 10,341 | 10,305 |
| 4/30/2015 | 10,411 | 9,838 | 10,555 | 10,443 | 10,373 |
| 5/31/2015 | 10,531 | 9,949 | 10,692 | 10,500 | 10,373 |
| 6/30/2015 | 10,204 | 9,649 | 10,484 | 10,340 | 10,217 |
| 7/31/2015 | 10,342 | 9,777 | 10,704 | 10,361 | 10,244 |
| 8/31/2015 | 9,640 | 9,103 | 10,059 | 10,054 | 9,969 |
| 9/30/2015 | 9,366 | 8,851 | 9,810 | 9,867 | 9,825 |
| 10/31/2015 | 9,730 | 9,184 | 10,638 | 10,273 | 10,109 |
| 11/30/2015 | 9,688 | 9,152 | 10,670 | 10,235 | 10,053 |
41 graphic description end -->
| ■ | Total returns shown for the Class A Shares include the maximum sales charge of 5.50% ($10,000 investment minus $550 sales charge = $9,450). |
The Fund offers multiple share classes whose performance may be greater than or less than its other share class(es) due to differences in sales charges and expenses. See the Average Annual Return table below for the returns of additional classes not shown in the line graph above.
Annual Shareholder Report
Average Annual Total Returns for the Period Ended 11/30/2015
(returns reflect all applicable sales charges and contingent sales charges as specified below in footnote #1)
| | Start of
Performance* |
| Class A Shares | -8.46% |
| Class C Shares | -4.57% |
| Institutional Shares | -3.12% |
| S&P 500 | 6.67% |
| Blended Index | 2.34% |
| MCAFA | 0.48% |
| * | The Fund's start of performance date was December 15, 2014. |
Performance data quoted represents past performance which is no guarantee of future results. Investment return and principal value will fluctuate so that an investor's shares, when redeemed, may be worth more or less than their original cost. Mutual fund performance changes over time and current performance may be lower or higher than what is stated. For current to the most recent month-end performance and after-tax returns, visit FederatedInvestors.com or call 1-800-341-7400. Returns shown do not reflect the deduction of taxes that a shareholder would pay on Fund distributions or the redemption of Fund shares. Mutual funds are not obligations of or guaranteed by any bank and are not federally insured.
| 1 | Represents a hypothetical investment of $10,000 in the Fund after deducting applicable sales charges: For Class A Shares, the maximum sales charge of 5.50% ($10,000 investment minus $550 sales charge = $9,450); for Class C Shares, a 1.00% contingent deferred sales charge would be applied on any redemption less than one year from the purchase date. The Fund's performance assumes the reinvestment of all dividends and distributions. The S&P 500 and Blended Index have been adjusted to reflect reinvestment of dividends on securities in the indexes. |
| 2 | The S&P 500 and Blended Index are not adjusted to reflect sales loads, expenses or other fees that the Securities and Exchange Commission requires to be reflected in the Fund's performance. The indexes are unmanaged and, unlike the Fund, are not affected by cash flows. It is not possible to invest directly in an index. |
| 3 | The S&P 500 is a capitalization-weighted index of 500 stocks designed to measure performance of the broad domestic economy through changes in the aggregate market value of 500 stocks representing all major industries. The R1000V measures the performance of the large-cap value segment of the U.S. equity universe. It includes those Russell 1000® Index companies with lower price-to-book ratios and lower expected growth values. The R1000V is constructed to provide a comprehensive and unbiased barometer for the large-cap value segment. The R1000V is completely reconstituted annually to ensure new and growing equities are included and that the represented companies continue to reflect value characteristics. The BEMAI tracks total returns for external-currency-denominated debt instruments of the emerging markets. The BHY2%ICI is an issuer-constrained version of the Barclays U.S. Corporate High-Yield Index that measures the market of USD-denominated, noninvestment-grade, fixed-rate, taxable corporate bonds. The index follows the same rules as the uncapped index but limits the exposure of each issuer to 2% of the total market value and redistributes any excess market value index-wide on a pro-rata basis. The BMB covers agency mortgage-backed pass-through securities (both fixed-rate and hybrid ARM) issued by Ginnie Mae (GNMA), Fannie Mae (FNMA) and Freddie Mac (FHLMC). |
| 4 | Morningstar figures represent the average of the total returns reported by all the mutual funds designated by Morningstar as falling into the respective category indicated. They do not reflect sales charges. |
Annual Shareholder Report
Portfolio of Investments Summary Tables (unaudited)
At November 30, 2015, the Fund's portfolio composition1 was as follows:
| Security Type | Percentage of
Total Net Assets |
| Domestic Equity Securities | 34.6% |
| Domestic Fixed-Income Securities | 22.9% |
| International Fixed-Income Securities | 13.1% |
| U.S. Government Agency Mortgage-Backed Securities | 8.4% |
| Foreign Governments/Agencies | 6.7% |
| International Equity Securities | 4.0% |
| Non-Agency Mortgage-Backed Securities | 1.3% |
| Asset-Backed Securities | 0.6% |
| U.S. Treasury | 0.1% |
| Floating Rate Loan2 | 0.0% |
| Derivative Contracts3 | 0.3% |
| Other Security Type4 | 0.4% |
| Cash Equivalents5 | 8.6% |
| Other Assets and Liabilities—Net6 | (1.0)% |
| TOTAL | 100.0% |
| 1 | See the Fund's Prospectus for a description of the principal types of securities in which the Fund invests. As of the date specified above, the Fund owned shares of one or more affiliated investment companies. For purposes of this table, the affiliated investment company (other than an affiliated money market mutual fund) is not treated as a single portfolio security, but rather the Fund is treated as owning a pro rata portion of each security and each other asset and liability owned by the affiliated investment company. Accordingly, the percentages of total net assets shown in the table will differ from those presented on the Portfolio of Investments. |
| 2 | Represents less than 0.1%. |
| 3 | Based upon net unrealized appreciation (depreciation) or value of the derivative contracts as applicable. Derivative contracts may consist of futures, forwards, options and swaps. The impact of a derivative contract on the Fund's performance may be larger than its unrealized appreciation (depreciation) or value may indicate. In many cases, the notional value or amount of a derivative contract may provide a better indication of the contract's significance to the portfolio. More complete information regarding the Fund's direct investments in derivative contracts, including unrealized appreciation (depreciation), value, and notional values or amounts of such contracts, can be found in the table at the end of the Portfolio of Investments included in this Report. |
| 4 | Other Security Type consists of purchased call options. |
| 5 | Cash Equivalents include any investments in money market mutual funds and/or overnight repurchase agreements. |
| 6 | Assets, other than investments in securities and derivative contracts, less liabilities. See Statement of Assets and Liabilities. |
Annual Shareholder Report
At November 30, 2015, the Fund's sector composition7 for its equity securities was as follows:
| Sector Composition | Percentage of
Equity Securities |
| Financials | 29.1% |
| Information Technology | 13.6% |
| Health Care | 12.7% |
| Industrials | 11.9% |
| Energy | 11.0% |
| Consumer Discretionary | 6.9% |
| Consumer Staples | 6.0% |
| Telecommunication Services | 3.0% |
| Utilities | 3.0% |
| Materials | 2.8% |
| TOTAL | 100.0% |
| 7 | Sector classifications are based upon, and individual portfolio securities are assigned to, the classifications of the Global Industry Classification Standard (GICS) except that the Adviser assigns a classification to securities not classified by the GICS and to securities for which the Adviser does not have access to the classification made by the GICS. |
Annual Shareholder Report
Portfolio of Investments
November 30, 2015
Shares or
Contracts | | | Value |
| | | COMMON STOCKS—37.7% | |
| | | Consumer Discretionary—2.7% | |
| 604 | | Best Buy Co., Inc. | $19,195 |
| 214 | | Big Lots, Inc. | 9,628 |
| 391 | | Darden Restaurants, Inc. | 21,962 |
| 232 | | Delphi Automotive PLC | 20,388 |
| 244 | | Foot Locker, Inc. | 15,860 |
| 224 | | Home Depot, Inc. | 29,989 |
| 212 | | Kohl's Corp. | 9,992 |
| 390 | | Lowe's Cos., Inc. | 29,874 |
| 778 | | M.D.C. Holdings, Inc. | 20,407 |
| 462 | | Pulte Group, Inc. | 9,000 |
| 554 | | TJX Cos., Inc. | 39,112 |
| 136 | | Target Corp. | 9,860 |
| 80 | | Walt Disney Co. | 9,078 |
| | | TOTAL | 244,345 |
| | | Consumer Staples—2.3% | |
| 821 | | Altria Group, Inc. | 47,290 |
| 641 | | Archer-Daniels-Midland Co. | 23,390 |
| 2,322 | | Koninklijke Ahold N.V., ADR | 50,248 |
| 472 | | PepsiCo, Inc. | 47,275 |
| 502 | | Philip Morris International, Inc. | 43,870 |
| | | TOTAL | 212,073 |
| | | Energy—4.3% | |
| 185 | | Apache Corp. | 9,098 |
| 566 | | Baker Hughes, Inc. | 30,604 |
| 528 | | Ensco PLC | 9,039 |
| 798 | | Marathon Petroleum Corp. | 46,611 |
| 710 | | Noble Corp. PLC | 9,422 |
| 739 | | Schlumberger Ltd. | 57,014 |
| 5,654 | | Technip SA | 73,333 |
| 748 | | Tesoro Petroleum Corp. | 86,147 |
| 950 | | Valero Energy Corp. | 68,267 |
| | | TOTAL | 389,535 |
| | | Financials—11.2% | |
| 372 | | American Financial Group, Inc. Ohio | 27,528 |
Annual Shareholder Report
Shares or
Contracts | | | Value |
| | | COMMON STOCKS—continued | |
| | | Financials—continued | |
| 2,064 | | American International Group, Inc. | $131,229 |
| 457 | | Assurant, Inc. | 39,083 |
| 5,301 | | Bank of America Corp. | 92,396 |
| 98 | | CME Group, Inc. | 9,570 |
| 153 | | Capital One Financial Corp. | 12,012 |
| 405 | | Comerica, Inc. | 18,772 |
| 841 | | Corporate Office Properties Trust | 18,746 |
| 415 | | Digital Realty Trust, Inc. | 29,926 |
| 332 | | Discover Financial Services | 18,844 |
| 1,009 | | Duke Realty Corp. | 20,533 |
| 155 | | Goldman Sachs Group, Inc. | 29,453 |
| 2,452 | | Hartford Financial Services Group, Inc. | 111,909 |
| 2,452 | | Hospitality Properties Trust | 68,092 |
| 1,742 | | JPMorgan Chase & Co. | 116,157 |
| 782 | | Lincoln National Corp. | 43,002 |
| 2,564 | | Morgan Stanley | 87,945 |
| 528 | | Old Republic International Corp. | 10,011 |
| 412 | | PNC Financial Services Group | 39,350 |
| 45 | | Public Storage | 10,803 |
| 1,124 | | Retail Properties of America, Inc. | 17,197 |
| 448 | | STORE Capital Corp. | 10,196 |
| 890 | | The Bank of New York Mellon Corp. | 39,018 |
| 510 | | Wells Fargo & Co. | 28,101 |
| | | TOTAL | 1,029,873 |
| | | Health Care—4.8% | |
| 231 | | Amegen, Inc. | 37,214 |
| 574 | | Aetna, Inc. | 58,978 |
| 214 | | Anthem, Inc. | 27,901 |
| 576 | | Cardinal Health, Inc. | 50,026 |
| 612 | | Gilead Sciences, Inc. | 64,848 |
| 233 | | GlaxoSmithKline PLC, ADR | 9,439 |
| 553 | | Johnson & Johnson | 55,986 |
| 696 | | Merck & Co., Inc. | 36,895 |
| 299 | | Pfizer, Inc. | 9,798 |
| 135 | | St. Jude Medical, Inc. | 8,518 |
| 1,204 | | Teva Pharmaceutical Industries, Ltd., ADR | 75,768 |
| | | TOTAL | 435,371 |
Annual Shareholder Report
Shares or
Contracts | | | Value |
| | | COMMON STOCKS—continued | |
| | | Industrials—4.3% | |
| 495 | | Alaska Air Group, Inc. | $39,466 |
| 490 | | Boeing Co. | 71,270 |
| 134 | | Caterpillar, Inc. | 9,735 |
| 402 | | Delta Air Lines, Inc. | 18,677 |
| 325 | | Deluxe Corp. | 19,061 |
| 505 | | Eaton Corp PLC | 29,371 |
| 483 | | General Dynamics Corp. | 70,740 |
| 308 | | General Electric Co. | 9,222 |
| 166 | | Lockheed Martin Corp. | 36,381 |
| 309 | | Manpower Group, Inc. | 27,897 |
| 634 | | Masco Corp. | 18,963 |
| 403 | | Nielsen Holdings PLC | 18,812 |
| 101 | | Northrop Grumman Corp. | 18,822 |
| 92 | | Parker-Hannifin Corp. | 9,629 |
| | | TOTAL | 398,046 |
| | | Information Technology—4.7% | |
| 537 | | Apple, Inc. | 63,527 |
| 1,035 | | Avnet, Inc. | 46,906 |
| 330 | | CA, Inc. | 9,276 |
| 958 | 1 | CSRA, Inc. | 30,186 |
| 3,288 | | Cisco Systems, Inc. | 89,598 |
| 907 | | Computer Sciences Corp. | 28,416 |
| 2,058 | | EMC Corp. Mass | 52,150 |
| 642 | 1 | HP, Inc. | 8,051 |
| 642 | | Hewlett Packard Enterprise Co. | 9,540 |
| 343 | | Intel Corp. | 11,926 |
| 61 | | International Business Machines Corp. | 8,505 |
| 243 | | Lam Research Corp. | 19,003 |
| 970 | | Maxim Integrated Products, Inc. | 37,607 |
| 175 | | Microsoft Corp. | 9,511 |
| 871 | | Xerox Corp. | 9,189 |
| | | TOTAL | 433,391 |
| | | Materials—1.1% | |
| 340 | | Ashland, Inc. | 38,301 |
| 636 | | Avery Dennison Corp. | 41,951 |
| 373 | | Dow Chemical Co. | 19,444 |
| | | TOTAL | 99,696 |
Annual Shareholder Report
Shares or
Contracts | | | Value |
| | | COMMON STOCKS—continued | |
| | | Telecommunication Services—1.2% | |
| 449 | | BCE, Inc. | $19,334 |
| 750 | | CenturyLink, Inc. | 20,197 |
| 1,448 | | Verizon Communications | 65,812 |
| | | TOTAL | 105,343 |
| | | Utilities—1.1% | |
| 425 | | Duke Energy Corp. | 28,798 |
| 438 | | Entergy Corp. | 29,184 |
| 736 | | NRG Energy, Inc. | 9,097 |
| 956 | | Public Service Enterprises Group, Inc. | 37,379 |
| | | TOTAL | 104,458 |
| | | TOTAL COMMON STOCKS
(IDENTIFIED COST $3,365,207) | 3,452,131 |
| | | STRUCTURED SECURITIES—1.0% | |
| | | Health Care—0.2% | |
| 55 | 1,2 | BIIB, Issued by Credit Suisse AG, ELN, 10.00%, 12/2/2015 | 15,778 |
| | | Industrials—0.3% | |
| 521 | 1,2 | DAL, Issued By Royal Bank of Canada, ELN, 10.00%, 12/3/2015 | 24,393 |
| | | Information Technology—0.5% | |
| 410 | 1,2 | AAPL, Issued by JPMorgan Chase Bank N.A., ELN, 8.20%, 2/23/2016 | 48,958 |
| | | TOTAL STRUCTURED SECURITIES
(IDENTIFIED COST $95,397) | 89,129 |
| | | PURCHASED CALL OPTIONS—0.4% | |
| 10 | | SPDR S&P 500 ETF Trust Strike Price $200.00, Expiration Date 17/6/2016 | 15,020 |
| 38 | | SPDR S&P 500 ETF Trust Strike Price $210.00, Expiration Date 18/3/2016 | 21,641 |
| | | TOTAL PURCHASED CALL OPTIONS
(IDENTIFIED COST $23,756) | 36,661 |
| | | INVESTMENT COMPANIES—60.5%3 | |
| 51,228 | | Emerging Markets Fixed Income Core Fund | 1,762,031 |
| 96,147 | | Federated Mortgage Core Portfolio | 950,891 |
| 430,947 | | Federated Prime Value Obligations Fund, Institutional Shares, 0.17%4 | 430,947 |
| 401,290 | | High Yield Bond Portfolio | 2,403,726 |
| | | TOTAL INVESTMENT COMPANIES
(IDENTIFIED COST $5,675,415) | 5,547,595 |
| | | TOTAL INVESTMENTS—99.6%
(IDENTIFIED COST $9,159,775)5 | 9,125,516 |
| | | OTHER ASSETS AND LIABILITIES - NET—0.4%6 | 43,740 |
| | | TOTAL NET ASSETS—100% | $9,169,256 |
Annual Shareholder Report
At November 30, 2015, the Fund had the following outstanding futures contracts:
| Description | Number of
Contracts | Notional
Value | Expiration
Date | Unrealized
Appreciation
(Depreciation) |
| 7S&P 500 E-Mini Index Long Futures | 18 | $1,871,820 | December 2015 | $27,020 |
| 7United States Treasury Ultra Bond Long Futures | 1 | $158,438 | March 2016 | $560 |
| 7United States Treasury Notes 10-Year Short Futures | 2 | $252,875 | March 2016 | $(770) |
| NET UNREALIZED APPRECIATION ON FUTURES CONTRACTS | $26,810 |
Net Unrealized Appreciation on Futures Contracts is included in “Other Assets and Liabilities—Net.”
| 1 | Denotes a restricted security that either: (a) cannot be offered for public sale without first being registered, or being able to take advantage of an exemption from registration, under the Securities Act of 1933; or (b) is subject to a contractual restriction on public sales. At November 30, 2015, these restricted securities amounted to $89,129, which represented 1.0% of total net assets. |
| 2 | Denotes a restricted security that may be resold without restriction to “qualified institutional buyers” as defined in Rule 144A under the Securities Act of 1933 and that the Fund has determined to be liquid under criteria established by the Fund's Board of Trustees (the “Trustees”). At November 30, 2015, these liquid restricted securities amounted to $89,129, which represented 1.0% of total net assets. |
| 3 | Affiliated holdings. |
| 4 | 7-day net yield. |
| 5 | The cost of investments for federal tax purposes amounts to $9,251,532. |
| 6 | Assets, other than investments in securities, less liabilities. See Statement of Assets and Liabilities. |
| 7 | Non-income-producing security. |
Note: The categories of investments are shown as a percentage of total net assets at November 30, 2015.
Various inputs are used in determining the value of the Fund's investments. These inputs are summarized in the three broad levels listed below:
Level 1—quoted prices in active markets for identical securities.
Level 2—other significant observable inputs (including quoted prices for similar securities, interest rates, prepayment speeds, credit risk, etc.). Also includes securities valued at amortized cost.
Level 3—significant unobservable inputs (including the Fund's own assumptions in determining the fair value of investments).
The inputs or methodology used for valuing securities are not an indication of the risk associated with investing in those securities.
Annual Shareholder Report
The following is a summary of the inputs used, as of November 30, 2015, in valuing the Fund's assets carried at fair value:
| Valuation Inputs |
| | Level 1—
Quoted
Prices | Level 2—
Other
Significant
Observable
Inputs | Level 3—
Significant
Unobservable
Inputs | Total |
| Equity Securities: | | | | |
| Common Stocks | | | | |
| Domestic | $3,079,964 | $— | $— | $3,079,964 |
| International | 372,167 | — | — | 372,167 |
| Structured Securities | — | 89,129 | — | 89,129 |
| Purchased Call Options | 36,661 | — | — | 36,661 |
| Investment Companies1 | 430,947 | 5,116,648 | — | 5,547,595 |
| TOTAL SECURITIES | $3,919,739 | $5,205,777 | $— | $9,125,516 |
| Other Financial Instruments2 | | | | |
| Assets | $27,580 | $— | $— | $27,580 |
| Liabilities | (770) | — | — | (770) |
TOTAL OTHER
FINANCIAL INSTRUMENTS | $26,810 | $— | $— | $26,810 |
| 1 | Emerging Markets Fixed Income Core Fund, Federated Mortgage Core Portfolio and High Yield Bond Portfolio are affiliated holdings offered only to registered investment companies and other accredited investors. Investments in these funds are deemed Level 2 due to the fact that the net asset value (the NAV) is not publicly available. |
| 2 | Other financial instruments include futures contracts. |
The following acronyms are used throughout this portfolio:
| ADR | —American Depositary Receipt |
| ELN | —Equity-Linked Notes |
See Notes which are an integral part of the Financial Statements
Annual Shareholder Report
Financial Highlights–Class A Shares
(For a Share Outstanding Throughout the Period)
| | Period
Ended
11/30/20151 |
| Net Asset Value, Beginning of Period | $10.00 |
| Income From Investment Operations: | |
| Net investment income | 0.382 |
| Net realized and unrealized loss on investments, futures contracts and foreign currency transactions | (0.68) |
| TOTAL FROM INVESTMENT OPERATIONS | (0.30) |
| Less Distributions: | |
| Distributions from net investment income | (0.35) |
| Net Asset Value, End of Period | $9.35 |
| Total Return3 | (3.15)% |
| Ratios to Average Net Assets: | |
| Net expenses | 1.04%4,5 |
| Net investment income | 4.12%4 |
| Expense waiver/reimbursement6 | 3.68%4 |
| Supplemental Data: | |
| Net assets, end of period (000 omitted) | $89 |
| Portfolio turnover | 85% |
| 1 | Reflects operations for the period from December 15, 2014 (date of initial investment) to November 30, 2015. |
| 2 | Per share number has been calculated using the average shares method. |
| 3 | Based on net asset value, which does not reflect the sales charge, redemption fee or contingent deferred sales charge, if applicable. Total return for less than one year is not annualized. |
| 4 | Computed on an annualized basis. |
| 5 | The net expense ratio is calculated without reduction for expense offset arrangements. The net expense ratio is 1.04% for the period ended November 30, 2015, after taking into account this expense reduction. |
| 6 | This expense decrease is reflected in both the net expense and the net investment income ratios shown above. |
See Notes which are an integral part of the Financial Statements
Annual Shareholder Report
Financial Highlights–Class C Shares
(For a Share Outstanding Throughout the Period)
| | Period
Ended
11/30/20151 |
| Net Asset Value, Beginning of Period | $10.00 |
| Income From Investment Operations: | |
| Net investment income | 0.302 |
| Net realized and unrealized loss on investments, futures contracts and foreign currency transactions | (0.65) |
| TOTAL FROM INVESTMENT OPERATIONS | (0.35) |
| Less Distributions: | |
| Distributions from net investment income | (0.30) |
| Net Asset Value, End of Period | $9.35 |
| Total Return3 | (3.63)% |
| Ratios to Average Net Assets: | |
| Net expenses | 1.79%4,5 |
| Net investment income | 3.26%4 |
| Expense waiver/reimbursement6 | 3.41% |
| Supplemental Data: | |
| Net assets, end of period (000 omitted) | $581 |
| Portfolio turnover | 85% |
| 1 | Reflects operations for the period from December 15, 2014 (date of initial investment) to November 30, 2015. |
| 2 | Per share number has been calculated using the average shares method. |
| 3 | Based on net asset value, which does not reflect the sales charge, redemption fee or contingent deferred sales charge, if applicable. Total return for less than one year is not annualized. |
| 4 | Computed on an annualized basis. |
| 5 | The net expense ratio is calculated without reduction for expense offset arrangements. The net expense ratio is 1.79% for the period ended November 30, 2015, after taking into account this expense reduction. |
| 6 | This expense decrease is reflected in both the net expense and the net investment income ratios shown above. |
See Notes which are an integral part of the Financial Statements
Annual Shareholder Report
Financial Highlights–Institutional Shares
(For a Share Outstanding Throughout the Period)
| | Period
Ended
11/30/20151 |
| Net Asset Value, Beginning of Period | $10.00 |
| Income From Investment Operations: | |
| Net investment income | 0.402 |
| Net realized and unrealized loss on investments, futures contracts and foreign currency transactions | (0.70) |
| TOTAL FROM INVESTMENT OPERATIONS | (0.30) |
| Less Distributions: | |
| Distributions from net investment income | (0.36) |
| Net Asset Value, End of Period | $9.34 |
| Total Return3 | (3.12)% |
| Ratios to Average Net Assets: | |
| Net expenses | 0.79%4,5 |
| Net investment income | 4.20%4 |
| Expense waiver/reimbursement6 | 5.20%4 |
| Supplemental Data: | |
| Net assets, end of period (000 omitted) | $8,499 |
| Portfolio turnover | 85% |
| 1 | Reflects operations for the period from December 15, 2014 (date of initial investment) to November 30, 2015. |
| 2 | Per share number has been calculated using the average shares method. |
| 3 | Based on net asset value. Total return for less than one year is not annualized. |
| 4 | Computed on an annualized basis. |
| 5 | The net expense ratio is calculated without reduction for expense offset arrangements. The net expense ratio is 0.79% for the period ended November 30, 2015, after taking into account this expense reduction. |
| 6 | This expense decrease is reflected in both the net expense and the net investment income ratios shown above. |
See Notes which are an integral part of the Financial Statements
Annual Shareholder Report
Statement of Assets and Liabilities
November 30, 2015
| Assets: | | |
| Total investment in securities, at value including $5,547,595 of investment in affiliated holdings (Note 5) (identified cost $9,159,775) | | $9,125,516 |
| Cash denominated in foreign currencies (identified cost $73,945) | | 73,441 |
| Restricted cash (Note 2) | | 84,875 |
| Income receivable | | 8,805 |
| Receivable for investments sold | | 45,944 |
| Receivable for shares sold | | 1,500 |
| TOTAL ASSETS | | 9,340,081 |
| Liabilities: | | |
| Payable for investments purchased | $41,322 | |
| Payable for shares redeemed | 35,000 | |
| Bank overdraft | 19,678 | |
| Payable for daily variation margin on futures | 8,621 | |
| Payable to adviser (Note 5) | 177 | |
| Payable for auditing fees | 30,300 | |
| Payable for portfolio accounting fees | 10,841 | |
| Payable for distribution services fee (Note 5) | 358 | |
| Payable for other service fees (Notes 2 and 5) | 126 | |
| Payable for share registration costs | 14,635 | |
| Payable for insurance premiums | 4,294 | |
| Accrued expenses (Note 5) | 5,473 | |
| TOTAL LIABILITIES | | 170,825 |
| Net assets for 981,186 shares outstanding | | $9,169,256 |
| Net Assets Consist of: | | |
| Paid-in capital | | $9,905,418 |
| Net unrealized depreciation of investments, futures contracts and translation of assets and liabilities in foreign currency | | (7,953) |
| Accumulated net realized loss on investments, futures contracts, swap contracts and foreign currency transactions | | (753,661) |
| Undistributed net investment income | | 25,452 |
| TOTAL NET ASSETS | | $9,169,256 |
Annual Shareholder Report
Statement of Assets and Liabilities–continued
| Net Asset Value, Offering Price and Redemption Proceeds Per Share | | |
| Class A Shares: | | |
| Net asset value per share ($89,437 ÷ 9,566 shares outstanding), no par value, unlimited shares authorized | | $9.35 |
| Offering price per share (100/94.50 of $9.35) | | $9.89 |
| Redemption proceeds per share | | $9.35 |
| Class C Shares: | | |
| Net asset value per share ($581,032 ÷ 62,172 shares outstanding), no par value, unlimited shares authorized | | $9.35 |
| Offering price per share | | $9.35 |
| Redemption proceeds per share (99.00/100 of $9.35) | | $9.26 |
| Institutional Shares: | | |
| Net asset value per share ($8,498,787 ÷ 909,448 shares outstanding), no par value, unlimited shares authorized | | $9.34 |
| Offering price per share | | $9.34 |
| Redemption proceeds per share | | $9.34 |
See Notes which are an integral part of the Financial Statements
Annual Shareholder Report
Statement of Operations
Period Ended November 30, 20151
| Investment Income: | | | |
| Dividends (including $132,874 received from affiliated holdings (Note 5) and net of foreign taxes withheld of $2,345) | | | $261,523 |
| Investment income allocated from affiliated partnership (Note 5) | | | 69,910 |
| TOTAL INCOME | | | 331,433 |
| Expenses: | | | |
| Investment adviser fee (Note 5) | | $49,901 | |
| Administrative fee (Note 5) | | 125,414 | |
| Custodian fees | | 9,952 | |
| Transfer agent fee | | 7,131 | |
| Auditing fees | | 30,300 | |
| Legal fees | | 13,591 | |
| Portfolio accounting fees | | 42,432 | |
| Distribution services fee (Note 5) | | 2,097 | |
| Other service fees (Notes 2 and 5) | | 813 | |
| Share registration costs | | 91,587 | |
| Printing and postage | | 13,149 | |
| Miscellaneous (Note 5) | | 7,112 | |
| EXPENSES BEFORE ALLOCATION | | 393,479 | |
| Expenses allocated from affiliated partnership (Note 5) | | 786 | |
| TOTAL EXPENSES | | 394,265 | |
Annual Shareholder Report
Statement of Operations–continued
| Waiver, Reimbursements and Reduction: | | | |
| Waiver/reimbursement of investment adviser fee (Note 5) | $(49,901) | | |
| Reimbursement of other operating expenses (Note 5) | (289,123) | | |
| Fees paid indirectly from directed brokerage arrangements (Note 6) | (13) | | |
| TOTAL WAIVER, REIMBURSEMENTS AND REDUCTION | | $(339,037) | |
| Net expenses | | | $55,228 |
| Net investment income | | | 276,205 |
| Realized and Unrealized Loss on Investments, Futures Contracts, Swap Contracts and Foreign Currency Transactions: | | | |
| Net realized loss on investments and foreign currency transactions | | | (305,734) |
| Net realized loss on futures contracts | | | (372,321) |
| Net realized loss on swap contracts | | | (261) |
| Net realized loss on investments and foreign currency transactions allocated from affiliated partnership (Note 5) | | | (75,487) |
Realized gain distribution from affiliated investment company
shares (Note 5) | | | 2,290 |
| Net change in unrealized appreciation/depreciation of investments and translation of assets and liabilities in foreign currency | | | (34,763) |
| Net change in unrealized depreciation of futures contracts | | | 26,810 |
| Net realized and unrealized loss on investments, futures contracts, swap contracts and foreign currency transactions | | | (759,466) |
| Change in net assets resulting from operations | | | $(483,261) |
| 1 | Reflects operations for the period from December 15, 2014 (date of initial investment) to November 30, 2015. |
See Notes which are an integral part of the Financial Statements
Annual Shareholder Report
Statement of Changes in Net Assets
| | Period Ended
11/30/20151 |
| Increase (Decrease) in Net Assets | |
| Operations: | |
| Net investment income | $276,205 |
| Net realized loss on investments, futures contracts, swap contracts and foreign currency transactions | (751,513) |
| Net change in unrealized appreciation/depreciation of investments, futures contracts and translation of assets and liabilities in foreign currency | (7,953) |
| CHANGE IN NET ASSETS RESULTING FROM OPERATIONS | (483,261) |
| Distributions to Shareholders: | |
| Distributions from net investment income | |
| Class A Shares | (1,672) |
| Class C Shares | (8,186) |
| Institutional Shares | (243,043) |
| CHANGE IN NET ASSETS RESULTING FROM DISTRIBUTIONS TO SHAREHOLDERS | (252,901) |
| Share Transactions: | |
| Proceeds from sale of shares | 9,923,596 |
| Net asset value of shares issued to shareholders in payment of distributions declared | 198,183 |
| Cost of shares redeemed | (216,361) |
| CHANGE IN NET ASSETS RESULTING FROM SHARE TRANSACTIONS | 9,905,418 |
| Change in net assets | 9,169,256 |
| Net Assets: | |
| Beginning of period | — |
| End of period (including undistributed net investment income of $25,452) | $9,169,256 |
| 1 | Reflects operations for the period from December 15, 2014 (date of initial investment) to November 30, 2015. |
See Notes which are an integral part of the Financial Statements
Annual Shareholder Report
Notes to Financial Statements
November 30, 2015
1. ORGANIZATION
Federated Equity Funds (the “Trust”) is registered under the Investment Company Act of 1940, as amended (the “Act”), as a diversified, open-end management investment company. Federated Global Investment Management Corp., Federated Investment Management Company and Federated Equity Management Company of Pennsylvania (collectively, the “Co-Advisers”) each are registered as a “commodity pool operator” with respect to operation of the Fund. The Trust consists of 14 diversified portfolios. The financial statements included herein are only those of Federated Managed Volatility Fund (the “Fund”). The financial statements of the other portfolios are presented separately. The assets of each portfolio are segregated and a shareholder's interest is limited to the portfolio in which shares are held. Each portfolio pays its own expenses. The Fund offers three classes of shares: Class A Shares, Class C Shares and Institutional Shares. All shares of the Fund have equal rights with respect to voting, except on class-specific matters. The investment objective of the Fund is to provide total return while managing the Fund's annualized volatility.
The Fund commenced operations on December 15, 2014.
2. SIGNIFICANT ACCOUNTING POLICIES
The following is a summary of significant accounting policies consistently followed by the Fund in the preparation of its financial statements. These policies are in conformity with U.S. generally accepted accounting principles (GAAP).
Investment Valuation
In calculating its (NAV), the Fund generally values investments as follows:
| ■ | Equity securities listed on an exchange or traded through a regulated market system are valued at their last reported sale price or official closing price in their principal exchange or market. |
| ■ | Fixed-income securities acquired with remaining maturities greater than 60 days are fair valued using price evaluations provided by a pricing service approved by the Trustees. |
| ■ | Fixed-income securities and repurchase agreements acquired with remaining maturities of 60 days or less are valued at their cost (adjusted for the accretion of any discount or amortization of any premium), unless the issuer's creditworthiness is impaired or other factors indicate that amortized cost is not an accurate estimate of the investment's fair value, in which case it would be valued in the same manner as a longer-term security. |
| ■ | Derivative contracts listed on exchanges are valued at their reported settlement or closing price, except that options are valued at the mean of closing bid and asked quotations. |
| ■ | Over-the-counter (OTC) derivative contracts are fair valued using price evaluations provided by a pricing service approved by the Trustees. |
| ■ | For securities that are fair valued in accordance with procedures established by and under the general supervision of the Trustees, certain factors may be considered such as: the last traded or purchase price of the security, information obtained by contacting the issuer or dealers, analysis of the issuer's financial statements or other available documents, fundamental analytical data, the nature and duration of restrictions on disposition, the movement of the market in which the security is normally traded, public trading in similar securities or derivative contracts of the issuer or comparable issuers, movement of a relevant index, or other factors including but not limited to industry changes and relevant government actions. |
Annual Shareholder Report
If any price, quotation, price evaluation or other pricing source is not readily available when the NAV is calculated, or if the Fund cannot obtain price evaluations from a pricing service or from more than one dealer for an investment within a reasonable period of time as set forth in the Fund's valuation policies and procedures, the Fund uses the fair value of the investment determined in accordance with the procedures described below. There can be no assurance that the Fund could obtain the fair value assigned to an investment if it sold the investment at approximately the time at which the Fund determines its NAV per share.
Fair Valuation and Significant Events Procedures
The Trustees have ultimate responsibility for determining the fair value of investments for which market quotations are not readily available. The Trustees have appointed a valuation committee (“Valuation Committee”) comprised of officers of the Fund, the Co-Advisers and certain of the Co-Adviser's affiliated companies to assist in determining fair value and in overseeing the calculation of the NAV. The Trustees have also authorized the use of pricing services recommended by the Valuation Committee to provide fair value evaluations of the current value of certain investments for purposes of calculating the NAV. The Valuation Committee employs various methods for reviewing third-party pricing-service evaluations including periodic reviews of third-party pricing services' policies, procedures and valuation methods (including key inputs, methods, models and assumptions), transactional back-testing, comparisons of evaluations of different pricing services, and review of price challenges by the Co-Advisers based on recent market activity. In the event that market quotations and price evaluations are not available for an investment, the Valuation Committee determines the fair value of the investment in accordance with procedures adopted by the Trustees. The Trustees periodically review and approve the fair valuations made by the Valuation Committee and any changes made to the procedures.
Factors considered by pricing services in evaluating an investment include the yields or prices of investments of comparable quality, coupon, maturity, call rights and other potential prepayments, terms and type, reported transactions, indications as to values from dealers and general market conditions. Some pricing services provide a single price evaluation reflecting the bid-side of the market for an investment (a “bid” evaluation). Other pricing services offer both bid evaluations and price evaluations indicative of a price between the prices bid and asked for the investment (a “mid” evaluation). The Fund normally uses bid evaluations for any U.S. Treasury and Agency securities, mortgage-backed securities and municipal securities. The Fund normally uses mid evaluations for any other types of fixed-income securities and any OTC derivative contracts. In the event that market quotations and price evaluations are not available for an investment, the fair value of the investment is determined in accordance with procedures adopted by the Trustees.
The Trustees also have adopted procedures requiring an investment to be priced at its fair value whenever the Co-Advisers determine that a significant event affecting the value of the investment has occurred between the time as of which the price of the investment would otherwise be determined and the time as of which the NAV is computed. An event is considered significant if there is both an affirmative expectation that the investment's value will change in response to the event and a reasonable basis for quantifying the resulting change in value. Examples of significant events that may occur after the close of the principal market on which a security is traded, or after the time of a price evaluation provided by a pricing service or a dealer, include:
| ■ | With respect to securities traded principally in foreign markets, significant trends in U.S. equity markets or in the trading of foreign securities index futures contracts; |
Annual Shareholder Report
| ■ | Political or other developments affecting the economy or markets in which an issuer conducts its operations or its securities are traded; |
| ■ | Announcements concerning matters such as acquisitions, recapitalizations, litigation developments, or a natural disaster affecting the issuer's operations or regulatory changes or market developments affecting the issuer's industry. |
The Trustees have adopted procedures whereby the Valuation Committee uses a pricing service to determine the fair value of equity securities traded principally in foreign markets when the Co-Advisers determine that there has been a significant trend in the U.S. equity markets or in index futures trading. For other significant events, the Fund may seek to obtain more current quotations or price evaluations from alternative pricing sources. If a reliable alternative pricing source is not available, the Fund will determine the fair value of the investment in accordance with the fair valuation procedures approved by the Trustees. The Trustees have ultimate responsibility for any fair valuations made in response to a significant event.
Repurchase Agreements
The Fund may invest in repurchase agreements for short-term liquidity purposes. It is the policy of the Fund to require the other party to a repurchase agreement to transfer to the Fund's custodian or sub-custodian eligible securities or cash with a market value (after transaction costs) at least equal to the repurchase price to be paid under the repurchase agreement. The eligible securities are transferred to accounts with the custodian or sub-custodian in which the Fund holds a “securities entitlement” and exercises “control” as those terms are defined in the Uniform Commercial Code. The Fund has established procedures for monitoring the market value of the transferred securities and requiring the transfer of additional eligible securities if necessary to equal at least the repurchase price. These procedures also allow the other party to require securities to be transferred from the account to the extent that their market value exceeds the repurchase price or in exchange for other eligible securities of equivalent market value.
The insolvency of the other party or other failure to repurchase the securities may delay the disposition of the underlying securities or cause the Fund to receive less than the full repurchase price. Under the terms of the repurchase agreement, any amounts received by the Fund in excess of the repurchase price and related transaction costs must be remitted to the other party.
The Fund may enter into repurchase agreements in which eligible securities are transferred into joint trading accounts maintained by the custodian or sub-custodian for investment companies and other clients advised by the Fund's Co-Advisers and their affiliates. The Fund will participate on a pro rata basis with the other investment companies and clients in its share of the securities transferred under such repurchase agreements and in its share of proceeds from any repurchase or other disposition of such securities.
Investment Income, Gains and Losses, Expenses and Distributions
Investment transactions are accounted for on a trade-date basis. Realized gains and losses from investment transactions are recorded on an identified-cost basis. Interest income and expenses are accrued daily. Dividend income and distributions to shareholders are recorded on the ex-dividend date. Foreign dividends are recorded on the ex-dividend date or when the Fund is informed of the ex-dividend date. Distributions of net investment income are declared and paid annually. Non-cash dividends included in dividend income, if any, are recorded at fair value. The Fund invests in Emerging Markets Fixed Income Core Fund (EMCORE), a portfolio of Federated Core Trust II, L.P., which is a limited partnership established under the laws of the
Annual Shareholder Report
state of Delaware. The Fund records daily its proportionate share of income, expenses, realized and unrealized gains and losses from EMCORE. Investment income, realized and unrealized gains and losses, and certain fund-level expenses are allocated to each class based on relative average daily net assets, except that Class A Shares and Class C Shares may bear distribution services fees and other service fees unique to those classes.
Dividends are declared separately for each class. No class has preferential dividend rights; differences in per share dividend rates are generally due to differences in separate class expenses.
Other Service Fees
The Fund may pay other service fees up to 0.25% of the average daily net assets of the Fund's Class A Shares and Class C Shares to financial intermediaries or to Federated Shareholder Services Company (FSSC) for providing services to shareholders and maintaining shareholder accounts. Subject to the terms described in the Expense Limitation note, FSSC may voluntarily reimburse the Fund for other service fees. For the period ended November 30, 2015, other service fees for the Fund were as follows:
| | Other Service
Fees
Incurred |
| Class A Shares | $114 |
| Class C Shares | 699 |
| TOTAL | $813 |
Premium and Discount Amortization/ Paydown Gains and Losses
All premiums and discounts on fixed-income securities, other than mortgage-backed securities, are amortized/accreted using the effective-interest-rate method. Gains and losses realized on principal payment of mortgage-backed securities (paydown gains and losses) are classified as part of investment income.
Federal Taxes
It is the Fund's policy to comply with the Subchapter M provision of the Internal Revenue Code (the “Code”) and to distribute to shareholders each year substantially all of its income. Accordingly, no provision for federal income tax is necessary. As of and during the period ended November 30, 2015, the Fund did not have a liability for any uncertain tax positions. The Fund recognizes interest and penalties, if any, related to tax liabilities as income tax expense in the Statement of Operations. As of November 30, 2015, tax year 2015 remains subject to examination by the Fund's major tax jurisdictions, which include the United States of America and the Commonwealth of Massachusetts.
The Fund may be subject to taxes imposed by governments of countries in which it invests. Such taxes are generally based on either income or gains earned or repatriated. The Fund accrues and applies such taxes to net investment income, net realized gains and net unrealized gains as income and/or gains are earned.
Annual Shareholder Report
When-Issued and Delayed-Delivery Transactions
The Fund may engage in when-issued or delayed-delivery transactions. The Fund records when-issued securities on the trade date and maintains security positions such that sufficient liquid assets will be available to make payment for the securities purchased. Securities purchased on a when-issued or delayed-delivery basis are marked to market daily and begin earning interest on the settlement date. Losses may occur on these transactions due to changes in market conditions or the failure of counterparties to perform under the contract.
Futures Contracts
The Fund purchases and sells financial futures contracts to manage duration, market and yield curve risks. Upon entering into a financial futures contract with a broker, the Fund is required to deposit in a segregated account a specified amount of cash or U.S. government securities which is shown as Restricted Cash in the Statement of Assets and Liabilities. Futures contracts are valued daily and unrealized gains or losses are recorded in a “variation margin” account. Daily, the Fund receives from or pays to the broker a specified amount of cash based upon changes in the variation margin account. When a contract is closed, the Fund recognizes a realized gain or loss. Futures contracts have market risks, including the risk that the change in the value of the contract may not correlate with the changes in the value of the underlying securities. There is minimal counterparty risk to the Fund since futures are exchange traded and the exchange's clearinghouse, as counterparty to all exchange traded futures, guarantees the futures against default.
Futures contracts outstanding at period end are listed after the Fund's Portfolio of Investments.
The average notional value of long and short futures contracts held by the Fund throughout the period was $1,825,181 and $217,878, respectively. This is based on amounts held as of each month-end since the date of initial investment (December 15, 2014) through the period ended November 30, 2015.
Foreign Exchange Contracts
The Fund enters into foreign exchange contracts to manage currency risk. Purchased contracts are used to acquire exposure to foreign currencies, whereas, contracts to sell are used to hedge the Fund's securities against currency fluctuations. Risks may arise upon entering into these transactions from the potential inability of counterparties to meet the terms of their commitments and from unanticipated movements in security prices or foreign exchange rates. The foreign exchange contracts are adjusted by the daily exchange rate of the underlying currency and any gains or losses are recorded for financial statement purposes as unrealized until the settlement date.
At November 30, 2015, the Fund had no outstanding foreign exchange contracts.
The average value at settlement date payable and receivable of foreign exchange contracts purchased and sold by the Fund throughout the period was $1,487 and $1,359, respectively. This is based on the contracts held as of each month-end since the date of initial investment (December 15, 2014) through the period ended November 30, 2015.
Foreign Currency Translation
The accounting records of the Fund are maintained in U.S. dollars. All assets and liabilities denominated in foreign currencies (FCs) are translated into U.S. dollars based on the rates of exchange of such currencies against U.S. dollars on the date of valuation. Purchases and sales of securities, income and expenses are translated at the rate of exchange quoted on the
Annual Shareholder Report
respective date that such transactions are recorded. The Fund does not isolate that portion of the results of operations resulting from changes in foreign exchange rates on investments from the fluctuations arising from changes in market prices of securities held. Such fluctuations are included with the net realized and unrealized gain or loss from investments.
Reported net realized foreign exchange gains or losses arise from sales of portfolio securities, sales and maturities of short-term securities, sales of FCs, currency gains or losses realized between the trade and settlement dates on securities transactions, the difference between the amounts of dividends, interest and foreign withholding taxes recorded on the Fund's books and the U.S. dollar equivalent of the amounts actually received or paid. Net unrealized foreign exchange gains and losses arise from changes in the value of assets and liabilities other than investments in securities at period end, resulting from changes in the exchange rate.
Option Contracts
The Fund buys or sells put and call options to increase yield and income and to manage currency, market and individual security risks. The seller (“writer”) of an option receives a payment or premium, from the buyer, which the writer keeps regardless of whether the buyer exercises the option. When the Fund writes a put or call option, an amount equal to the premium received is recorded as a liability and subsequently marked to market to reflect the current value of the option written. Premiums received from writing options which expire are treated as realized gains. The Fund, as a writer of an option, bears the market risk of an unfavorable change in the price of the underlying reference instrument. When the Fund purchases a put or call option, an amount equal to the premium paid is recorded as an increase to the cost of the investment and subsequently marked to market to reflect the current value of the option purchased. Premiums paid for purchasing options which expire are treated as realized losses. Premiums received/paid for writing/purchasing options which are exercised or closed are added to the proceeds or offset against amounts paid on the underlying reference instrument to determine the realized gain or loss. The risk associated with purchasing put and call options is limited to the premium paid. Options can trade on securities or commodities exchanges. In this case, the exchange sets all the terms of the contract except for the price. Most exchanges require investors to maintain margin accounts through their brokers to cover their potential obligations to the exchange. This protects investors against potential defaults by the counterparty.
At November 30, 2015, the Fund had no outstanding written option contracts.
The average notional amount of purchased put and call options held by the Fund throughout the period was $9,844. This is based on the contracts held as of each month-end since the date of initial investment (December 15, 2014) through the period ended November 30, 2015.
Restricted Securities
The Fund may purchase securities which are considered restricted. Restricted securities are securities that either: (a) cannot be offered for public sale without first being registered, or being able to take advantage of an exemption from registration, under the Securities Act of 1933; or (b) are subject to contractual restrictions on public sales. In some cases, when a security cannot be offered for public sale without first being registered, the issuer of the restricted security has agreed to register such securities for resale, at the issuer's expense, either upon demand by the Fund or in connection with another registered offering of the securities. Many such restricted securities may be resold in the secondary market in
Annual Shareholder Report
transactions exempt from registration. Restricted securities may be determined to be liquid under criteria established by the Trustees. The Fund will not incur any registration costs upon such resales. The Fund's restricted securities, like other securities, are priced in accordance with procedures established by and under the general supervision of the Trustees.
Additional Disclosure Related to Derivative Instruments
| Fair Value of Derivative Instruments |
| | Liability |
| | Statement of
Assets and
Liabilities
Location | Fair
Value |
Derivatives not accounted for as hedging instruments
under ASC Topic 815 | | |
| Interest rate contracts | Payable for daily
variation margin on futures | $210* |
| Equity contracts | Payable for daily
variation margin on futures | (27,020)* |
| Total derivatives not accounted for as hedging instruments under ASC Topic 815 | | $(26,810) |
| * | Includes cumulative appreciation of futures contracts as reported in the footnotes to the Portfolio of Investments. Only the current day's variation margin is reported within the Statement of Assets and Liabilities. |
The Effect of Derivative Instruments on the Statement of Operations for the Period Ended November 30, 2015
| Amount of Realized Gain or (Loss) on Derivatives Recognized in Income |
| | Futures Contracts |
| Equity contracts | $(365,602) |
| Interest rate contracts | $(6,719) |
| TOTAL | $(372,321) |
| Change in Unrealized Appreciation or (Depreciation) on Derivatives Recognized in Income |
| | Futures Contracts |
| Equity contracts | $27,020 |
| Interest rate contracts | $(210) |
| TOTAL | $26,810 |
Annual Shareholder Report
Other
The preparation of financial statements in conformity with GAAP requires management to make estimates and assumptions that affect the amounts of assets, liabilities, expenses and revenues reported in the financial statements. Actual results could differ from those estimated. The Fund applies Investment Company accounting and reporting guidance.
3. SHARES OF BENEFICIAL INTEREST
The following tables summarize share activity:
| | Period Ended
11/30/20151 |
| Class A Shares: | Shares | Amount |
| Shares sold | 9,501 | $97,451 |
| Shares issued to shareholders in payment of distributions declared | 79 | 746 |
| Shares redeemed | (14) | (132) |
| NET CHANGE RESULTING FROM CLASS A SHARE TRANSACTIONS | 9,566 | $98,065 |
| | Period Ended
11/30/20151 |
| Class C Shares: | Shares | Amount |
| Shares sold | 61,929 | $632,328 |
| Shares issued to shareholders in payment of distributions declared | 841 | 8,002 |
| Shares redeemed | (598) | (5,910) |
| NET CHANGE RESULTING FROM CLASS C SHARE TRANSACTIONS | 62,172 | $634,420 |
| | Period Ended
11/30/20151 |
| Institutional Shares: | Shares | Amount |
| Shares sold | 912,418 | $9,193,817 |
| Shares issued to shareholders in payment of distributions declared | 19,157 | 189,435 |
| Shares redeemed | (22,127) | (210,319) |
| NET CHANGE RESULTING FROM INSTITUTIONAL SHARE TRANSACTIONS | 909,448 | $9,172,933 |
| NET CHANGE RESULTING FROM TOTAL FUND SHARE TRANSACTIONS | 981,186 | $9,905,418 |
| 1 | Reflects operations for the period from December 15, 2014 (date of initial investment) to November 30, 2015. |
4. FEDERAL TAX INFORMATION
The timing and character of income and capital gain distributions are determined in accordance with income tax regulations, which may differ from GAAP. These differences are due in part to differing treatments for foreign currency transactions, discount accretion/premium amortization on debt securities, swap income, partnership income and short-term capital gain distributions from registered investment companies.
Annual Shareholder Report
For the period ended November 30, 2015, permanent differences identified and reclassified among the components of net assets were as follows:
| Increase (Decrease) |
Undistributed
Net Investment
Income (Loss) | Accumulated
Net Realized
Gain (Loss) |
| $2,148 | $(2,148) |
Net investment income (loss), net realized gains (losses) and net assets were not affected by this reclassification.
The tax character of distributions as reported on the Statement of Changes in Net Assets for the period ended November 30, 2015, was as follows:
| | 2015 |
| Ordinary income | $252,901 |
As of November 30, 2015, the components of distributable earnings on a tax basis were as follows:
| Undistributed ordinary income | $25,895 |
| Net unrealized depreciation | $(126,963) |
| Capital loss carryforwards and deferrals | $(635,094) |
The difference between book-basis and tax-basis net unrealized appreciation/depreciation is attributable in part to differing treatments for the deferral of losses on wash sales, discount accretion/premium amortization on debt securities and partnership adjustments.
At November 30, 2015, the cost of investments for federal tax purposes was $9,251,532. The net unrealized depreciation of investments for federal tax purposes excluding: (a) any unrealized appreciation\depreciation resulting from the translation from FCs to U.S. dollars of assets and liabilities other than investments in securities; and (b) futures contracts was $126,016. This consists of net unrealized appreciation from investments for those securities having an excess of value over cost of $167,389 and net unrealized depreciation from investments for those securities having an excess of cost over value of $293,405.
At November 30, 2015, the Fund had a capital loss carryforward of $622,189 which will reduce the Fund's taxable income arising from future net realized gains on investments, if any, to the extent permitted by the Code, thereby reducing the amount of distributions to shareholders which would otherwise be necessary to relieve the Fund of any liability for federal income tax. Pursuant to the Code, a net capital loss incurred in taxable years beginning after December 22, 2010, retains its character as either short-term or long-term and does not expire.
The following schedule summarizes the Fund's capital loss carryforwards:
| Short-Term | Long-Term | Total |
| $413,399 | $208,790 | $622,189 |
As of November 30, 2015, for federal income tax purposes, the Fund had $12,905 in straddle loss deferrals.
Annual Shareholder Report
5. INVESTMENT ADVISER FEE AND OTHER TRANSACTIONS WITH AFFILIATES
Investment Adviser Fee
The co-advisory agreement between the Fund and the Co-Advisers provides for an annual fee equal to 0.75% of the Fund's average daily net assets. Subject to the terms described in the Expense Limitation note, the Co-Advisers may voluntarily choose to waive any portion of their fee and/or reimburse certain operating expenses of the Fund. For the period ended November 30, 2015, the Co-Advisers voluntarily waived $49,385 of their fee and voluntarily reimbursed $289,123 of other operating expenses.
Administrative Fee
Federated Administrative Services (FAS), under the Administrative Services Agreement, provides the Fund with administrative personnel and services. For purposes of determining the appropriate rate breakpoint, “Investment Complex” is defined as all of the Federated Funds subject to a fee under the Administrative Services Agreement. The fee paid to FAS is based on the average daily net assets of the Investment Complex as specified below, plus certain out-of-pocket expenses:
| Administrative Fee | Average Daily Net Assets
of the Investment Complex |
| 0.150% | on the first $5 billion |
| 0.125% | on the next $5 billion |
| 0.100% | on the next $10 billion |
| 0.075% | on assets in excess of $20 billion |
In addition to the fees described, the Fund agrees to pay FAS an annual Administrative Service Charge of $125,000 for administrative and compliance services related to Commodities Futures Trading Commission Rule 4.5. Subject to the terms described in the Expense Limitation note, FAS may voluntarily choose to waive any portion of its fee. For the period ended November 30, 2015, the fee paid to FAS was 1.885% of average daily net assets of the Fund.
Distribution Services Fee
The Fund has adopted a Distribution Plan (the “Plan”) pursuant to Rule 12b-1 under the Act. Under the terms of the Plan, the Fund will compensate Federated Securities Corp. (FSC), the principal distributor, from the daily net assets of the Fund's Class A Shares and Class C Shares to finance activities intended to result in the sale of these shares. The Plan provides that the Fund may incur distribution expenses at the following percentages of average daily net assets annually, to compensate FSC:
| Share Class Name | Percentage of Average Daily
Net Assets of Class |
| Class A Shares | 0.05% |
| Class C Shares | 0.75% |
Annual Shareholder Report
Subject to the terms described in the Expense Limitation note, FSC may voluntarily choose to waive any portion of its fee. For the period ended November 30, 2015, distribution services fees for the Fund were as follows:
| | Distribution Services
Fees Incurred |
| Class C Shares | $2,097 |
When FSC receives fees, it may pay some or all of them to financial intermediaries whose customers purchase shares. For the period ended November 30, 2015, the Fund's Class A Shares did not incur a distribution services fee; however it may begin to incur this fee upon approval of the Trustees. For the period ended November 30, 2015, FSC retained $1,825 of fees paid by the Fund.
Sales Charges
Front-end sales charges and contingent deferred sales charges (CDSC) do not represent expenses of the Fund. They are deducted from the proceeds of sales of Fund shares prior to investment or from redemption proceeds prior to remittance, as applicable.
Other Service Fees
For the period ended November 30, 2015, FSSC did not receive any of the other service fees disclosed in Note 2.
Expense Limitation
The Co-Advisers and certain of their affiliates (which may include FAS, FSC and FSSC) on their own initiative have agreed to waive certain amounts of their respective fees and/or reimburse expenses. Total annual fund operating expenses (as shown in the financial highlights, excluding expenses allocated from affiliated partnerships, interest expense, extraordinary expenses, and proxy-related expenses paid by the Fund, if any) paid by the Fund's Class A Shares, Class C Shares and Institutional Shares (after the voluntary waivers and/or reimbursements) will not exceed 1.02%, 1.77% and 0.77% (the “Fee Limit”), respectively, up to but not including the later of (the “Termination Date”): (a) February 1, 2017; or (b) the date of the Fund's next effective Prospectus. While the Co-Advisers and their applicable affiliates currently do not anticipate terminating or increasing these arrangements prior to the Termination Date, these arrangements may only be terminated or the Fee Limit increased prior to the Termination Date with the agreement of the Trustees.
General
Certain Officers and Trustees of the Fund are Officers and Directors or Trustees of certain of the above companies. To efficiently facilitate payment, Directors'/Trustees' fees and certain expenses related to conducting meetings of the Directors/Trustees and other miscellaneous expenses are paid by an affiliate of the Co-Adviser which in due course are reimbursed by the Fund. Such expenses may be included in Accrued and Miscellaneous Expenses on the Statement of Assets and Liabilities and Statement of Operations, respectively.
Annual Shareholder Report
Transactions Involving Affiliated Holdings
Affiliated holdings are investment companies which are managed by the Co-Advisers or an affiliate of the Co-Advisers. The Co-Advisers have agreed to reimburse the Fund for certain investment adviser fees as a result of transactions in other affiliated investment companies. For the period ended November 30, 2015, the Co-Advisers reimbursed $516. Transactions involving the affiliated holdings during the period ended November 30, 2015, were as follows:
| | Emerging
Markets
Fixed
Income
Core Fund | Federated
Mortgage
Core
Portfolio | Federated
Prime Value
Obligations
Fund,
Institutional
Shares | High
Yield
Bond
Portfolio | Total of
Affiliated
Transactions |
| Balance of Shares Held 11/30/2014 | — | — | — | — | — |
| Purchases/Additions | 60,487 | 110,492 | 11,957,878 | 442,120 | 12,570,977 |
| Sales/Reductions | (9,259) | (14,345) | (11,526,931) | (40,830) | (11,591,365) |
| Balance of Shares Held 11/30/2015 | 51,228 | 96,147 | 430,947 | 401,290 | 979,612 |
| Value | $1,762,031 | $950,891 | $430,947 | $2,403,726 | $5,547,595 |
| Dividend Income/Allocated Investment Income | $69,910 | $19,027 | $485 | $113,362 | $202,784 |
| Realized Gain Distribution/Allocated Net Realized Gain (Loss) | $(75,487) | $— | $— | $2,290 | $(73,197) |
Affiliated Shares of Beneficial Interest
As of November 30, 2015, a majority of the shares of beneficial interest outstanding are owned by an affiliate of the Co-Advisers.
6. expense reduction
The Fund directs portfolio trades to a broker that in turn pays a portion of the Fund's operating expenses. For the period ended November 30, 2015, the Fund's expenses were reduced by $13 under these arrangements.
7. Investment TRANSACTIONS
Purchases and sales of investments, excluding long-term U.S. government securities and short-term obligations, for the period ended November 30, 2015, were as follows:
| Purchases | $14,540,919 |
| Sales | $5,525,782 |
Annual Shareholder Report
8. LINE OF CREDIT
The Fund participates in a $100,000,000 unsecured, uncommitted revolving line of credit (LOC) agreement with PNC Bank. The LOC was made available for extraordinary or emergency purposes, primarily for financing redemption payments. Borrowings are charged interest at a rate offered to the Fund by PNC Bank at the time of the borrowing. As of November 30, 2015, there were no outstanding loans. During the period ended November 30, 2015, the Fund did not utilize the LOC.
9. INTERFUND LENDING
Pursuant to an Exemptive Order issued by the Securities and Exchange Commission, the Fund, along with other funds advised by subsidiaries of Federated Investors, Inc., may participate in an interfund lending program. This program provides an alternative credit facility allowing the Fund to borrow from other participating affiliated funds. As of November 30, 2015, there were no outstanding loans. During the period ended November 30, 2015, the program was not utilized.
10. FEDERAL TAX INFORMATION (UNAUDITED)
For the period ended November 30, 2015, 31.3% of total ordinary income distributions made by the Fund are qualifying dividends which may be subject to a maximum tax rate of 15%, as provided for by the Jobs and Growth Tax Relief Act of 2003. Complete information is reported in conjunction with the reporting of your distributions on Form 1099-DIV.
Of the ordinary income distributions made by the Fund during the period ended November 30, 2015, 25.6% qualify for the dividend received deduction available to corporate shareholders.
Annual Shareholder Report
Report of Independent Registered Public Accounting Firm
TO THE BOARD OF TRUSTEES OF THE FEDERATED EQUITY FUNDS AND SHAREHOLDERS OF FEDERATED MANAGED VOLATILITY FUND:
We have audited the accompanying statement of assets and liabilities, including the portfolio of investments, of the Federated Managed Volatility Fund (the “Fund”), a portfolio of Federated Equity Funds, as of November 30, 2015, and the related statement of operations, the statements of changes in net assets, and the financial highlights for the period December 15, 2014 (date of initial investment) to November 30, 2015. These financial statements and financial highlights are the responsibility of the Fund's management. Our responsibility is to express an opinion on these financial statements and financial highlights based on our audit.
We conducted our audit in accordance with the standards of the Public Company Accounting Oversight Board (United States). Those standards require that we plan and perform the audit to obtain reasonable assurance about whether the financial statements and financial highlights are free of material misstatement. An audit includes examining, on a test basis, evidence supporting the amounts and disclosures in the financial statements. Our procedures included confirmation of securities owned as of November 30, 2015, by correspondence with the custodian, transfer agent and brokers or by other appropriate auditing procedures. An audit also includes assessing the accounting principles used and significant estimates made by management, as well as evaluating the overall financial statement presentation. We believe that our audit provides a reasonable basis for our opinion.
In our opinion, the financial statements and financial highlights referred to above present fairly, in all material respects, the financial position of the Federated Managed Volatility Fund as of November 30, 2015, the results of its operations, the changes in its net assets, and the financial highlights for the period December 15, 2014 (date of initial investment) to November 30, 2015, in conformity with U.S. generally accepted accounting principles.
Boston, Massachusetts
January 25, 2016
Annual Shareholder Report
Shareholder Expense Example (unaudited)
As a shareholder of the Fund, you incur two types of costs: (1) transaction costs, including sales charges (loads) on purchase or redemption payments; and (2) ongoing costs, including management fees and to the extent applicable, distribution (12b-1) fees and/or other service fees and other Fund expenses. This Example is intended to help you to understand your ongoing costs (in dollars) of investing in the Fund and to compare these costs with the ongoing costs of investing in other mutual funds. It is based on an investment of $1,000 invested at the beginning of the period and held for the entire period from June 1, 2015 to November 30, 2015.
ACTUAL EXPENSES
The first section of the table below provides information about actual account values and actual expenses. You may use the information in this section, together with the amount you invested, to estimate the expenses that you incurred over the period. Simply divide your account value by $1,000 (for example, an $8,600 account value divided by $1,000 = 8.6), then multiply the result by the number in the first section under the heading entitled “Expenses Paid During Period” to estimate the expenses attributable to your investment during this period.
HYPOTHETICAL EXAMPLE FOR COMPARISON PURPOSES
The second section of the table below provides information about hypothetical account values and hypothetical expenses based on the Fund's actual expense ratio and an assumed rate of return of 5% per year before expenses, which is not the Fund's actual return. Thus, you should not use the hypothetical account values and expenses to estimate the actual ending account balance or your expenses for the period. Rather, these figures are required to be provided to enable you to compare the ongoing costs of investing in the Fund with other funds. To do so, compare this 5% hypothetical example with the 5% hypothetical examples that appear in the shareholder reports of the other funds.
Annual Shareholder Report
Please note that the expenses shown in the table are meant to highlight your ongoing costs only and do not reflect any transaction costs, such as sales charges (loads) on purchase or redemption payments. Therefore, the second section of the table is useful in comparing ongoing costs only, and will not help you determine the relative total costs of owning different funds. In addition, if these transaction costs were included, your costs would have been higher.
| | Beginning
Account Value
6/1/2015 | Ending
Account Value
11/30/2015 | Expenses Paid
During Period1 |
| Actual: | | | |
| Class A Shares | $1,000 | $919.90 | $4.91 |
| Class C Shares | $1,000 | $916.60 | $8.50 |
| Institutional Shares | $1,000 | $920.00 | $3.71 |
Hypothetical (assuming a 5% return
before expenses): | | | |
| Class A Shares | $1,000 | $1,019.95 | $5.16 |
| Class C Shares | $1,000 | $1,016.19 | $8.95 |
| Institutional Shares | $1,000 | $1,021.21 | $3.90 |
| 1 | Expenses are equal to the Fund's annualized net expense ratios, multiplied by the average account value over the period, multiplied by 183/365 (to reflect the one-half-year period). The annualized net expense ratios are as follows: |
| | |
| Class A Shares | 1.02% |
| Class C Shares | 1.77% |
| Institutional Shares | 0.77% |
Annual Shareholder Report
Board of Trustees and Trust Officers
The Board of Trustees is responsible for managing the Trust's business affairs and for exercising all the Trust's powers except those reserved for the shareholders. The following tables give information about each Trustee and the senior officers of the Fund. Where required, the tables separately list Trustees who are “interested persons” of the Fund (i.e., “Interested” Trustees) and those who are not (i.e., “Independent” Trustees). Unless otherwise noted, the address of each person listed is Federated Investors Tower, 1001 Liberty Avenue, Pittsburgh, PA 15222. The address of all Independent Trustees listed is 4000 Ericsson Drive, Warrendale, PA 15086-7561; Attention: Mutual Fund Board. As of December 31, 2015, the Trust comprised 13 portfolio(s), and the Federated Fund Family consisted of 38 investment companies (comprising 122 portfolios). Unless otherwise noted, each Officer is elected annually. Unless otherwise noted, each Trustee oversees all portfolios in the Federated Fund Family and serves for an indefinite term. The Fund's Statement of Additional Information includes additional information about Trust Trustees and is available, without charge and upon request, by calling 1-800-341-7400.
Interested TRUSTEES Background
Name
Birth Date
Positions Held with Trust
Date Service Began | Principal Occupation(s) for Past Five Years,
Other Directorships Held and Previous Position(s) |
John F. Donahue*
Birth Date: July 28, 1924
Trustee
Indefinite Term
Began serving: April 1984 | Principal Occupations: Director or Trustee of the Federated Fund Family; Chairman and Director, Federated Investors, Inc.; Chairman of the Federated Fund Family's Executive Committee.
Previous Positions: Chairman of the Federated Fund Family; Trustee, Federated Investment Management Company; Chairman and Director, Federated Investment Counseling. |
J. Christopher Donahue*
Birth Date: April 11, 1949
President and Trustee
Indefinite Term
Began serving: January 2000 | Principal Occupations: Principal Executive Officer and President of certain of the Funds in the Federated Fund Family; Director or Trustee of the Funds in the Federated Fund Family; President, Chief Executive Officer and Director, Federated Investors, Inc.; Chairman and Trustee, Federated Investment Management Company; Trustee, Federated Investment Counseling; Chairman and Director, Federated Global Investment Management Corp.; Chairman, Federated Equity Management Company of Pennsylvania and Passport Research, Ltd. (investment advisory subsidiary of Federated); Trustee, Federated Shareholder Services Company; Director, Federated Services Company.
Previous Positions: President, Federated Investment Counseling; President and Chief Executive Officer, Federated Investment Management Company, Federated Global Investment Management Corp. and Passport Research, Ltd. |
| * | Family relationships and reasons for “interested” status: John F. Donahue is the father of J. Christopher Donahue; both are “interested” due to their beneficial ownership of shares of Federated Investors, Inc. and the positions they hold with Federated and its subsidiaries. |
Annual Shareholder Report
INDEPENDENT TRUSTEES Background
Name
Birth Date
Positions Held with Trust
Date Service Began | Principal Occupation(s) for Past Five Years,
Other Directorships Held, Previous Position(s) and Qualifications |
John T. Collins
Birth Date: January 24, 1947
Trustee
Indefinite Term
Began serving: October 2013 | Principal Occupations: Director or Trustee of the Federated Fund Family; Retired.
Other Directorships Held: Director, Chair of the Compensation Committee, Audit Committee member, KLX Corp.
Qualifications: Mr. Collins has served in several business and financial management roles and directorship positions throughout his career. Mr. Collins previously served as Chairman and CEO, The Collins Group, Inc. (a private equity firm). Mr. Collins serves as Chairman Emeriti, Bentley University. Mr. Collins previously served as Director, FleetBoston Financial Corp.; Director and Audit Committee Member, Bank of America Corp. and Director, Beth Israel Deaconess Medical Center (Harvard University Affiliate Hospital). |
G. Thomas Hough
Birth Date: February 28, 1955
Trustee
Indefinite Term
Began serving: August 2015 | Principal Occupations: Director or Trustee of the Federated Fund Family; Retired.
Other Directorships Held: Director, Chair of the Audit Committee, Governance Committee, Publix Super Markets, Inc.
Qualifications: Mr. Hough has served in accounting, business management and directorship positions throughout his career. Mr. Hough most recently held the position of Americas Vice Chair of Assurance with Ernst & Young LLP. Mr. Hough is an Executive Committee member of the United States Golf Association, he serves on the President's Cabinet and Business School Board of Visitors for the University of Alabama and is on the Business School Board of Visitors for Wake Forest University. |
Maureen Lally-Green
Birth Date: July 5, 1949
Trustee
Indefinite Term
Began serving: August 2009 | Principal Occupations: Director or Trustee of the Federated Fund Family; Adjunct Professor of Law, Duquesne University School of Law.
Other Directorships Held: Director, CONSOL Energy Inc.
Qualifications: Judge Lally-Green has served in various legal and business roles and directorship positions throughout her career. Judge Lally-Green previously served as: Associate General Secretary, Diocese of Pittsburgh; a member of the Superior Court of Pennsylvania; and as a Professor of Law, Duquesne University School of Law. Judge Lally-Green also holds the positions on either a public or not for profit Board of Directors as follows: Member, Pennsylvania State Board of Education (public); Director and Chair, UPMC Mercy Hospital; Regent, St. Vincent Seminary; Director, Epilepsy Foundation of Western and Central Pennsylvania; Director and Vice Chair, Our Campaign for the Church Alive!, Inc.; Director, Saint Vincent College; Director, Pennsylvania Bar Institute; and Director and Chair, Cardinal Wuerl North Catholic High School, Inc. Judge Lally-Green has held the positions of: Director, Auberle; Director, Ireland Institute of Pittsburgh; Director, Saint Thomas More Society; and Director, Catholic High Schools of the Diocese of Pittsburgh, Inc. |
Annual Shareholder Report
Name
Birth Date
Positions Held with Trust
Date Service Began | Principal Occupation(s) for Past Five Years,
Other Directorships Held, Previous Position(s) and Qualifications |
Peter E. Madden
Birth Date: March 16, 1942
Trustee
Indefinite Term
Began serving: November 1991 | Principal Occupation: Director or Trustee, and Chair of the Board of Directors or Trustees, of the Federated Fund Family; Retired.
Other Directorships Held: None.
Qualifications: Mr. Madden has served in several business management, mutual fund services and directorship positions throughout his career. Mr. Madden previously served as President, Chief Operating Officer and Director, State Street Bank and Trust Company (custodian bank) and State Street Corporation (financial services). He was Director, VISA USA and VISA International and Chairman and Director, Massachusetts Bankers Association. Mr. Madden served as Director, Depository Trust Corporation and Director, The Boston Stock Exchange. Mr. Madden also served as a Representative to the Commonwealth of Massachusetts General Court. |
Charles F. Mansfield, Jr.
Birth Date: April 10, 1945
Trustee
Indefinite Term
Began serving: January 1999 | Principal Occupations: Director or Trustee of the Federated Fund Family; Management Consultant.
Other Directorships Held: None.
Qualifications: Mr. Mansfield has served in several banking, business management and educational roles and directorship positions throughout his career. Mr. Mansfield previously served as Chief Executive Officer, PBTC International Bank; Partner, Arthur Young & Company (now Ernst & Young LLP); Chief Financial Officer of Retail Banking Sector, Chase Manhattan Bank; Senior Vice President, HSBC Bank USA (formerly, Marine Midland Bank); Vice President, Citibank; Assistant Professor of Banking and Finance, Frank G. Zarb School of Business, Hofstra University; Executive Vice President DVC Group, Inc. (marketing, communications and technology). |
Thomas M. O'Neill
Birth Date: June 14, 1951
Trustee
Indefinite Term
Began serving: October 2006 | Principal Occupations: Director or Trustee, Chair of the Audit Committee of the Federated Fund Family; Sole Proprietor, Navigator Management Company (investment and strategic consulting).
Other Directorships Held: None.
Qualifications: Mr. O'Neill has served in several business, mutual fund and financial management roles and directorship positions throughout his career. Mr. O'Neill serves as Director, Medicines for Humanity and Director, The Golisano Children's Museum of Naples, Florida. Mr. O'Neill previously served as Chief Executive Officer and President, Managing Director and Chief Investment Officer, Fleet Investment Advisors; President and Chief Executive Officer, Aeltus Investment Management, Inc.; General Partner, Hellman, Jordan Management Co., Boston, MA; Chief Investment Officer, The Putnam Companies, Boston, MA; Credit Analyst and Lending Officer, Fleet Bank; Director and Consultant, EZE Castle Software (investment order management software); and Director, Midway Pacific (lumber). |
Annual Shareholder Report
Name
Birth Date
Positions Held with Trust
Date Service Began | Principal Occupation(s) for Past Five Years,
Other Directorships Held, Previous Position(s) and Qualifications |
P. Jerome Richey
Birth Date: February 23, 1949
Trustee
Indefinite Term
Began serving: October 2013 | Principal Occupations: Director or Trustee of the Federated Fund Family; Management Consultant.
Other Directorships Held: None.
Qualifications: Mr. Richey has served in several business and legal management roles and directorship positions throughout his career. Mr. Richey most recently held the positions of Senior Vice Chancellor and Chief Legal Officer, University of Pittsburgh. Mr. Richey serves as Board Member, Epilepsy Foundation of Western Pennsylvania and Board member, World Affairs Council of Pittsburgh. Mr. Richey previously served as Chief Legal Officer and Executive Vice President, CONSOL Energy Inc. and Shareholder, Buchanan Ingersoll & Rooney PC (a law firm). |
John S. Walsh
Birth Date: November 28, 1957
Trustee
Indefinite Term
Began serving: January 1999 | Principal Occupations: Director or Trustee of the Federated Fund Family; President and Director, Heat Wagon, Inc. (manufacturer of construction temporary heaters); President and Director, Manufacturers Products, Inc. (distributor of portable construction heaters); President, Portable Heater Parts, a division of Manufacturers Products, Inc.
Other Directorships Held: None.
Qualifications: Mr. Walsh has served in several business management roles and directorship positions throughout his career. Mr. Walsh previously served as Vice President, Walsh & Kelly, Inc. (paving contractors). |
OFFICERS
Name
Birth Date
Address
Positions Held with Trust
Date Service Began | Principal Occupation(s) for Past Five Years
and Previous Position(s) |
John W. McGonigle
Birth Date: October 26, 1938
EXECUTIVE VICE PRESIDENT AND SECRETARY
Officer since: April 1984 | Principal Occupations: Executive Vice President and Secretary of the Federated Fund Family; Vice Chairman, Executive Vice President, Secretary and Director, Federated Investors, Inc.
Previous Positions: Trustee, Federated Investment Management Company and Federated Investment Counseling; Director, Federated Global Investment Management Corp., Federated Services Company and Federated Securities Corp. |
Annual Shareholder Report
Name
Birth Date
Address
Positions Held with Trust
Date Service Began | Principal Occupation(s) for Past Five Years
and Previous Position(s) |
Lori A. Hensler
Birth Date: January 6, 1967
TREASURER
Officer since: April 2013 | Principal Occupations: Principal Financial Officer and Treasurer of the Federated Fund Family; Senior Vice President, Federated Administrative Services; Financial and Operations Principal for Federated Securities Corp. and Edgewood Services, Inc.; and Assistant Treasurer, Federated Investors Trust Company. Ms. Hensler has received the Certified Public Accountant designation.
Previous Positions: Controller of Federated Investors, Inc.; Senior Vice President and Assistant Treasurer, Federated Investors Management Company; Treasurer, Federated Investors Trust Company; Assistant Treasurer, Federated Administrative Services, Federated Administrative Services, Inc., Federated Securities Corp., Edgewood Services, Inc., Federated Advisory Services Company, Federated Equity Management Company of Pennsylvania, Federated Global Investment Management Corp., Federated Investment Counseling, Federated Investment Management Company, Passport Research, Ltd., and Federated MDTA, LLC; Financial and Operations Principal for Federated Securities Corp., Edgewood Services, Inc. and Southpointe Distribution Services, Inc. |
Richard B. Fisher
Birth Date: May 17, 1923
VICE PRESIDENT
Officer since: April 1987 | Principal Occupations: Vice Chairman or Vice President of some of the Funds in the Federated Fund Family; Vice Chairman, Federated Investors, Inc.; Chairman, Federated Securities Corp.
Previous Positions: President and Director or Trustee of some of the Funds in the Federated Fund Family; Executive Vice President, Federated Investors, Inc.; Director and Chief Executive Officer, Federated Securities Corp. |
Peter J. Germain
Birth Date: September 3, 1959
CHIEF LEGAL OFFICER
Officer since: January 2005 | Principal Occupations: Mr. Germain is Chief Legal Officer of the Federated Fund Family. He is General Counsel and Vice President, Federated Investors, Inc.; President, Federated Administrative Services and Federated Administrative Services, Inc.; Vice President, Federated Securities Corp.; Secretary, Federated Private Asset Management, Inc.; and Secretary, Retirement Plan Service Company of America. Mr. Germain joined Federated in 1984 and is a member of the Pennsylvania Bar Association.
Previous Positions: Deputy General Counsel, Special Counsel, Managing Director of Mutual Fund Services, Federated Investors, Inc.; Senior Vice President, Federated Services Company; and Senior Corporate Counsel, Federated Investors, Inc. |
Stephen Van Meter
Birth Date: June 5, 1975
CHIEF COMPLIANCE OFFICER AND SENIOR VICE PRESIDENT
Officer since: July 2015 | Principal Occupations: Senior Vice President and Chief Compliance Officer of the Federated Fund Family; Vice President and Chief Compliance Officer of Federated Investors, Inc. and Chief Compliance Officer of certain of its subsidiaries. Mr. Van Meter joined Federated in October 2011. He holds FINRA licenses under Series 3, 7, 24 and 66.
Previous Positions: Mr. Van Meter previously held the position of Compliance Operating Officer, Federated Investors, Inc. Prior to joining Federated, Mr. Van Meter served at the United States Securities and Exchange Commission in the positions of Senior Counsel, Office of Chief Counsel, Division of Investment Management and Senior Counsel, Division of Enforcement. |
Annual Shareholder Report
Name
Birth Date
Address
Positions Held with Trust
Date Service Began | Principal Occupation(s) for Past Five Years
and Previous Position(s) |
Stephen F. Auth
Birth Date: September 3, 1956
101 Park Avenue
41st Floor
New York, NY 10178
CHIEF INVESTMENT OFFICER
Officer since: November 2002 | Principal Occupations: Stephen F. Auth is Chief Investment Officer of various Funds in the Federated Fund Family; Executive Vice President, Federated Investment Counseling, Federated Global Investment Management Corp. and Federated Equity Management Company of Pennsylvania.
Previous Positions: Executive Vice President, Federated Investment Management Company and Passport Research, Ltd. (investment advisory subsidiary of Federated); Senior Vice President, Global Portfolio Management Services Division; Senior Vice President, Federated Investment Management Company and Passport Research, Ltd.; Senior Managing Director and Portfolio Manager, Prudential Investments. |
Annual Shareholder Report
Evaluation and Approval of Advisory Contract–May 2015
Federated Managed Volatility Fund (the “Fund”)
Following a review and recommendation of approval by the Fund's independent trustees, the Fund's Board reviewed and approved at its May 2015 meetings the Fund's investment advisory contract, under which three Federated entities will serve as co-advisers to the Fund (“Co-Advisers”) for an additional one-year term. Because the Fund did not yet have a meaningful operating history, the Board's decision to approve the contract reflects the exercise of its business judgment primarily on whether to authorize the continued offering of this new investment vehicle, as originally proposed by, and based on information previously requested by the Board and provided by, the Federated organization, and based on Federated's recommendation to go forward with the Fund.
In this connection, the Federated Funds' Board had previously appointed a Senior Officer, whose duties include specified responsibilities relating to the process by which advisory fees are to be charged to a Federated fund. The Senior Officer has the authority to retain consultants, experts, or staff as may be reasonably necessary to assist in the performance of his duties, reports directly to the Board, and may be terminated only with the approval of a majority of the independent members of the Board. The Senior Officer prepared and furnished to the Board an independent, written evaluation that covered topics discussed below (the “Evaluation”). The Board considered that Evaluation, along with other information, in deciding to approve the advisory contract.
The Board is also familiar with and considered judicial decisions concerning allegedly excessive investment advisory fees, which have indicated that the following factors may be relevant to an adviser's fiduciary duty with respect to its receipt of compensation from a fund: the nature and quality of the services provided by an adviser to a fund and its shareholders, including the performance and expenses of the fund and of comparable funds; an adviser's cost of providing the services, including the profitability to an adviser of providing advisory services to a fund; the extent to which an adviser may realize “economies of scale” as a fund grows larger and, if such economies of scale exist, whether they have been shared with a fund and its shareholders or the family of funds; any “fall-out financial benefits” that accrue to an adviser because of its relationship with a fund (including research services received from brokers that execute fund trades and any fees paid to affiliates of the adviser for services rendered to a fund); comparative fee structures, including a comparison of fees paid to the adviser with those paid by similar funds; and the extent of care, conscientiousness and independence with which the Board members perform their duties and their expertise, including whether they are fully informed about all facts the Board deems relevant to its consideration of an adviser's services and fees. The Board noted that SEC disclosure requirements regarding the basis for the Board's approval of the Fund's advisory contract generally track the factors
Annual Shareholder Report
listed above. Consistent with these judicial decisions and SEC disclosure requirements, the Board also considered management fees charged to institutional and other clients of the Co-Advisers for what might be viewed as like services. The Board was aware of these factors and was guided by them in its review of the Fund's advisory contract to the extent it considered them to be appropriate and relevant, as discussed further below. Also, in weighing these factors, the Board considered the aggregate advisory fee paid by the fund for the services of all Co-Advisers but also considered the allocation of that aggregate fee among the Co-Advisers and the rational for that allocation.
The Board considered and weighed these circumstances in light of its substantial accumulated experience in working with Federated on matters relating to other Federated funds, and was assisted in its deliberations by independent legal counsel.
Since the inception of the Fund and in connection with its May meetings, the Board requested and received substantial and detailed information about the Fund and the Federated organization that was in addition to the extensive materials that comprise and accompany the Senior Officer's Evaluation. Federated provided much of this information at each regular meeting of the Board occurring since the Fund's inception, and furnished additional substantial information in connection with the May meeting at which the Board's formal review of the advisory contract initially occurred. At this May meeting, senior management of the Co-Advisers also met with the independent trustees and their counsel to discuss the materials presented and any other matters thought relevant by the Co-Advisers or the trustees. Between regularly scheduled meetings, the Board also received information on particular matters as the need arose.
Thus, the Board's consideration of the advisory contract included review of the Senior Officer's Evaluation, accompanying data and additional information covering such matters as: the Co-Advisers' investment philosophy, revenue, profitability, personnel and processes; investment and operating strategies; the Fund's short- and long-term performance (in absolute terms, both on a gross basis and net of expenses, as well as in relationship to its particular investment program and certain competitor or “peer group” funds and/or other benchmarks, as appropriate), and comments on the reasons for performance; the Fund's investment objectives; the Fund's expenses (including the advisory fee itself and the overall expense structure of the Fund, both in absolute terms and relative to similar and/or competing funds, with due regard for contractual or voluntary expense limitations); the use and allocation of brokerage commissions derived from trading the Fund's portfolio securities (if any); and the nature, quality and extent of the advisory and other services provided to the Fund by the Co-Advisers and their affiliates. In particular, the Board considered the services provided by the Co-Advisers in the aggregate, to the extent that the Co-Advisers collaborate with respect to the implementation of the Fund's strategy, as well as separately, to the extent that specific services provided by a
Annual Shareholder Report
Co-Adviser are distinguishable and subject to meaningful assessment. The Board also considered the preferences and expectations of Fund shareholders; the entrepreneurial risk assumed by the Co-Advisers in sponsoring the funds; the continuing state of competition in the mutual fund industry and market practices; the range of comparable fees for similar funds in the mutual fund industry; the Fund's relationship to the Federated family of funds which include a comprehensive array of funds with different investment objectives, policies and strategies which are available for exchange without the incurrence of additional sales charges; compliance and audit reports concerning the Federated funds and the Federated companies that service them (including communications from regulatory agencies), as well as Federated's responses to any issues raised therein; and relevant developments in the mutual fund industry and how the Federated funds and/or Federated are responding to them. The Board's evaluation process is evolutionary. The criteria considered and the emphasis placed on relevant criteria change in recognition of changing circumstances in the mutual fund marketplace.
While mindful that courts have cautioned against giving such comparisons too much weight, the Board has found the use of comparisons of the Fund's fees and expenses to other mutual funds with comparable investment programs to be relevant. In this regard, the Board was presented with, and considered, information regarding the contractual advisory fee rates, net advisory fee rates and total expense ratios relative to a fund's peers. The Board focused on comparisons with other similar mutual funds more heavily than non-mutual fund products or services because it is believed that they are more relevant. For example, other mutual funds are the products most like the Fund, they are readily available to Fund shareholders as alternative investment vehicles, and they are the type of investment vehicle in fact chosen and maintained by the Fund's anticipated investors. The range of their fees and expenses therefore appears to be a relevant indicator of what consumers have found to be reasonable in the precise marketplace in which the Fund will compete.
The advisory contract between the Fund and the Co-Advisers provides for payment of a single advisory fee by the Fund for all services provided by the Co-Advisers. The advisory contract permits the Co-Advisers to allocate the advisory fee in a manner commensurate with the services they provide to the Fund. The Board considered the fee allocation and analyzed whether the allocation of fees among the Co-Advisers continued to be a reasonable proxy for and measurement of, the level of resources and services provided by each Co-Adviser toward the management of the Fund.
It was noted in the materials for the Board meeting that for the period covered by the Evaluation, the Fund's investment advisory fee was waived in its entirely. The Board reviewed the contractual advisory fee rate, net advisory fee rate and other expenses of the Fund with the Co-Adviser and noted the position of the Fund's fee rates relative to its peers. In this regard, the Board
Annual Shareholder Report
noted that the contractual advisory fee rate was above the median of the relevant peer group, but the Board noted that the investment advisory fee was waived in its entirely and that the overall expense structure of the Fund remained competitive.
By contrast, the Senior Officer also reviewed Federated's fees for providing advisory services to products outside the Federated family of funds (e.g., institutional and separate accounts and sub-adviser services). He concluded that mutual funds and institutional accounts are inherently different products. Those differences include, but are not limited to, different types of targeted investors; being subject to different laws and regulations; different legal structures; different average account sizes and portfolio management techniques made necessary by different cash flows and different associated costs; and the time spent by portfolio managers and their teams, funds financial services, legal, compliance and risk management in reviewing securities pricing, addressing different administrative responsibilities, addressing different degrees of risk associated with management and a variety of different costs. The Senior Officer did not consider these fee schedules to be determinative in judging the appropriateness of mutual fund advisory fees.
The Senior Officer reviewed information compiled by Federated, using data supplied by independent fund ranking organizations, regarding the performance of, and fees charged by other mutual funds, noting his view that comparisons to fund peer groups may be helpful, though not conclusive, in judging the reasonableness of the proposed fees. The Board considered, in evaluating such comparisons, that in some cases individual funds may exhibit significant and unique differences in their objectives and management techniques when compared to other funds within an industry peer group.
It was recognized that the factors mentioned above relating to such matters as fund performance and any indirect benefits that may accrue to the Co-Advisers and their affiliates as a result of the Co-Advisers' relationship with the Fund, are essentially impossible to apply before the Fund has experienced any meaningful operating history. Nevertheless, the Board monitors the Fund's performance quarterly as information becomes available. Moreover, in connection with the Board's governance of other Federated funds, it should be noted that the Board regularly receives financial information about Federated, including information regarding the compensation and benefits Federated derived from its relationships with the other Federated funds. This information covered not only the fees under the advisory contracts, but also fees received by Federated's subsidiaries for providing other services to the Federated funds under separate contracts (e.g., for serving as the Federated funds' administrator). The information also details any indirect benefit Federated may derive from its receipt of research services from brokers who execute Federated fund trades. In addition, the Board considered the fact that, in order for a fund to be competitive in the marketplace, Federated and its affiliates frequently waived fees and/or reimbursed expenses and have disclosed to fund investors and/or indicated to
Annual Shareholder Report
the Board their intention to do so in the future, where appropriate. Moreover, the Board receives regular reporting as to the institution, adjustment or elimination of these voluntary waivers. In addition, over the past two years, following discussions regarding the Senior Officer's recommendations, Federated made meaningful reductions to the contractual advisory fees for several Funds. At the Board meeting in May 2015, following previous recommendations of the Senior Officer, Federated proposed, and the Board approved, reductions in the contractual advisory fees of certain other Funds.
Federated had previously furnished information, requested by the Senior Officer, that made estimates of the allocation of expenses, using allocation methodologies specified by the Senior Officer. The Senior Officer noted that, while cost allocation reports apply consistent allocation processes, the inherent difficulties in allocating costs continues to cause the Senior Officer to question the precision of the process and to conclude that such reports are unreliable, since a single change in an allocation estimate may dramatically alter the resulting estimate of cost and/or profitability of a fund and may produce unintended consequences. The allocation information, including the Senior Officer's view that fund-by-fund estimations may be unreliable, was considered in the analysis by the Board.
The Board and the Senior Officer also reviewed information compiled by Federated comparing profitability information for Federated to other publicly held fund management companies. In this regard, the Senior Officer concluded that Federated's profit margins did not appear to be excessive. The Senior Officer also noted that Federated appeared financially sound, with the resources to fulfill its obligations under its contracts with the Funds.
The Senior Officer's Evaluation also discussed the notion of possible realization of “economies of scale” as a fund grows larger. The Board considered in this regard that the Co-Advisers have made significant and long-term investments in areas that support all of the Federated family of funds, such as personnel and processes for the portfolio management, shareholder services, compliance, internal audit, and risk management functions; and systems technology; and that the benefits of these efforts (as well as any economies of scale, should they exist) were likely to be enjoyed by the fund family as a whole. Federated, as it does throughout the year, and again in connection with the Board's review, furnished information relative to revenue sharing or adviser paid fees. Federated and the Senior Officer noted that this information should be viewed to determine if there was an incentive to either not apply breakpoints or to apply breakpoints at higher levels and should not be viewed to determining the appropriateness of advisory fees, because it would represent marketing and distribution expenses. Finally, the Board also noted the absence of any applicable
Annual Shareholder Report
regulatory or industry guidelines on this subject, which (as discussed in the Senior Officer's Evaluation) is compounded by the lack of any common industry practice or general pattern with respect to structuring fund advisory fees with “breakpoints” that serve to reduce the fee as the fund attains a certain size.
The Senior Officer noted that, subject to the comments and recommendations made within his Evaluation, his observations and the information accompanying the Evaluation supported a finding by the Board that the management fees for each of the funds was reasonable. With due regard for the fact that the Fund did not yet have a meaningful operating history, the Board concluded that the nature, quality and scope of services provided the Fund by the Co-Advisers and their affiliates were satisfactory. Under these circumstances, no changes were recommended to, and no objection was raised to the continuation of, the Fund's advisory contract.
In its decision to continue an existing investment advisory contract, the Board was mindful of the potential disruptions of the Fund's operations and various risks, uncertainties and other effects that could occur as a result of a decision to terminate or not renew an advisory contract. In particular, the Board recognized that many of the shareholders that have invested in the Fund since its inception may have done so on the strength of the Co-Advisers' industry standing and reputation and with the expectation that the Co-Advisers will have a continuing role in providing advisory services to the Fund. Thus, the Board's approval of the advisory contract reflected the fact that it is the shareholders who have effectively selected the Co-Advisers by virtue of having invested in the Fund.
The Board based its decision to approve the advisory contract on the totality of the circumstances and relevant factors, and with a view to past and future long-term considerations. Not all of the factors and considerations identified above were necessarily relevant to the Fund, nor did the Board consider any one of them to be determinative. With respect to the factors that are relevant, the Board's decision to approve the contract reflects its determination that, performance and actions provided a satisfactory basis to support the decision to continue the existing arrangements.
Annual Shareholder Report
Voting Proxies on Fund Portfolio Securities
A description of the policies and procedures that the Fund uses to determine how to vote proxies, if any, relating to securities held in the Fund's portfolio is available, without charge and upon request, by calling 1-800-341-7400. A report on “Form N-PX” of how the Fund voted any such proxies during the most recent 12-month period ended June 30 is available via the Proxy Voting Record (Form N-PX) link associated with the Fund and share class name at www.FederatedInvestors.com/FundInformation. Form N-PX filings are also available at the SEC's website at www.sec.gov.
Quarterly Portfolio Schedule
The Fund files with the SEC a complete schedule of its portfolio holdings, as of the close of the first and third quarters of its fiscal year, on “Form N-Q.” These filings are available on the SEC's website at www.sec.gov and may be reviewed and copied at the SEC's Public Reference Room in Washington, DC. (Call 1-800-SEC-0330 for information on the operation of the Public Reference Room.) You may also access this information via the link to the Fund and share class name at www.FederatedInvestors.com/FundInformation.
Annual Shareholder Report
Mutual funds are not bank deposits or obligations, are not guaranteed by any bank and are not insured or guaranteed by the U.S. government, the Federal Deposit Insurance Corporation, the Federal Reserve Board or any other government agency. Investment in mutual funds involves investment risk, including the possible loss of principal.
This Report is authorized for distribution to prospective investors only when preceded or accompanied by the Fund's Prospectus, which contains facts concerning its objective and policies, management fees, expenses and other information.
Federated Managed Volatility Fund
Federated Investors Funds
4000 Ericsson Drive
Warrendale, PA 15086-7561
Contact us at FederatedInvestors.com
or call 1-800-341-7400.
Federated Securities Corp., Distributor
CUSIP 31421N105
CUSIP 31421N204
CUSIP 31421N303
Q452384 (1/16)
Federated is a registered trademark of Federated Investors, Inc.
2016 ©Federated Investors, Inc.
Item 2. Code of Ethics
(a) As of the end of the period covered by this report, the registrant has adopted a code of ethics (the "Section 406 Standards for Investment Companies - Ethical Standards for Principal Executive and Financial Officers") that applies to the registrant's Principal Executive Officer and Principal Financial Officer; the registrant's Principal Financial Officer also serves as the Principal Accounting Officer.
(c) There was no amendment to the registrant’s code of ethics described in Item 2(a) above during the period covered by the report.
(d) There was no waiver granted, either actual or implicit, from a provision to the registrant’s code of ethics described in Item 2(a) above during the period covered by the report.
(e) Not Applicable
(f)(3) The registrant hereby undertakes to provide any person, without charge, upon request, a copy of the code of ethics. To request a copy of the code of ethics, contact the registrant at 1-800-341-7400, and ask for a copy of the Section 406 Standards for Investment Companies - Ethical Standards for Principal Executive and Financial Officers.
Item 3. Audit Committee Financial Expert
The registrant's Board has determined that each of the following members of the Board's Audit Committee is an “audit committee financial expert,” and is "independent," for purposes of this Item: John T. Collins and Thomas M. O'Neill.
Item 4. Principal Accountant Fees and Services
(a) Audit Fees billed to the registrant for the two most recent fiscal years:
Fiscal year ended 2015 - $446,445
Fiscal year ended 2014 - $404,900
(b) Audit-Related Fees billed to the registrant for the two most recent fiscal years:
Fiscal year ended 2015 - $174
Fiscal year ended 2014 - $60
Fiscal year ended 2015- Travel to Audit Committee Meeting.
Fiscal year ended 2014- Travel to Audit Committee Meeting.
Amount requiring approval of the registrant’s audit committee pursuant to paragraph (c)(7)(ii) of Rule 2-01 of Regulation S-X, $0 and $3,743 respectively. Fiscal year ended 2014- Audit consent fee for N-1A filing.
(c) Tax Fees billed to the registrant for the two most recent fiscal years:
Fiscal year ended 2015 - $5,000
Fiscal year ended 2014 - $34,300
Fiscal year ended 2015- Service fee for tax reclaim recovery filings.
Fiscal year ended 2014- Service fee for tax reclaim recovery filings.
Amount requiring approval of the registrant’s audit committee pursuant to paragraph (c)(7)(ii) of Rule 2-01 of Regulation S-X, $0 and $6,162 respectively. Fiscal year ended 2014- Service fee for transfer pricing analysis of co-advisory services.
(d) All Other Fees billed to the registrant for the two most recent fiscal years:
Fiscal year ended 2015 - $0
Fiscal year ended 2014 - $0
Amount requiring approval of the registrant’s audit committee pursuant to paragraph (c)(7)(ii) of Rule 2-01 of Regulation S-X, $43,184 and $30,002 respectively. Fiscal year ended 2015- Service fee for analysis of potential Passive Foreign Investment Company holdings. Fiscal year ended 2014- Service fee for analysis of potential Passive Foreign Investment Company holdings.
(e)(1) Audit Committee Policies regarding Pre-approval of Services.
The Audit Committee is required to pre-approve audit and non-audit services performed by the independent auditor in order to assure that the provision of such services do not impair the auditor’s independence. Unless a type of service to be provided by the independent auditor has received general pre-approval, it will require specific pre-approval by the Audit Committee. Any proposed services exceeding pre-approved cost levels will require specific pre-approval by the Audit Committee.
Certain services have the general pre-approval of the Audit Committee. The term of the general pre-approval is 12 months from the date of pre-approval, unless the Audit Committee specifically provides for a different period. The Audit Committee will annually review the services that may be provided by the independent auditor without obtaining specific pre-approval from the Audit Committee and may grant general pre-approval for such services. The Audit Committee will revise the list of general pre-approved services from time to time, based on subsequent determinations. The Audit Committee will not delegate its responsibilities to pre-approve services performed by the independent auditor to management.
The Audit Committee has delegated pre-approval authority to its Chairman. The Chairman will report any pre-approval decisions to the Audit Committee at its next scheduled meeting. The Committee will designate another member with such pre-approval authority when the Chairman is unavailable.
AUDIT SERVICES
The annual Audit services engagement terms and fees will be subject to the specific pre-approval of the Audit Committee. The Audit Committee must approve any changes in terms, conditions and fees resulting from changes in audit scope, registered investment company (RIC) structure or other matters.
In addition to the annual Audit services engagement specifically approved by the Audit Committee, the Audit Committee may grant general pre-approval for other Audit Services, which are those services that only the independent auditor reasonably can provide. The Audit Committee has pre-approved certain Audit services, all other Audit services must be specifically pre-approved by the Audit Committee.
AUDIT-RELATED SERVICES
Audit-related services are assurance and related services that are reasonably related to the performance of the audit or review of the Company’s financial statements or that are traditionally performed by the independent auditor. The Audit Committee believes that the provision of Audit-related services does not impair the independence of the auditor, and has pre-approved certain Audit-related services, all other Audit-related services must be specifically pre-approved by the Audit Committee.
TAX SERVICES
The Audit Committee believes that the independent auditor can provide Tax services to the Company such as tax compliance, tax planning and tax advice without impairing the auditor’s independence. However, the Audit Committee will not permit the retention of the independent auditor in connection with a transaction initially recommended by the independent auditor, the purpose of which may be tax avoidance and the tax treatment of which may not be supported in the Internal Revenue Code and related regulations. The Audit Committee has pre-approved certain Tax services, all Tax services involving large and complex transactions must be specifically pre-approved by the Audit Committee.
ALL OTHER SERVICES
With respect to the provision of services other than audit, review or attest services the pre-approval requirement is waived if:
| (1) | The aggregate amount of all such services provided constitutes no more than five percent of the total amount of revenues paid by the registrant, the registrant’s adviser (not including any sub-adviser whose role is primarily portfolio management and is subcontracted with or overseen by another investment adviser), and any entity controlling, controlled by, or under common control with the investment adviser that provides ongoing services to the registrant to its accountant during the fiscal year in which the services are provided; |
| (2) | Such services were not recognized by the registrant, the registrant’s adviser (not including any sub-adviser whose role is primarily portfolio management and is subcontracted with or overseen by another investment adviser), and any entity controlling, controlled by, or under common control with the investment adviser that provides ongoing services to the registrant at the time of the engagement to be non-audit services; and |
| (3) | Such services are promptly brought to the attention of the Audit Committee of the issuer and approved prior to the completion of the audit by the Audit Committee or by one or more members of the Audit Committee who are members of the board of directors to whom authority to grant such approvals has been delegated by the Audit Committee. |
The Audit Committee may grant general pre-approval to those permissible non-audit services classified as All Other services that it believes are routine and recurring services, and would not impair the independence of the auditor.
The SEC’s rules and relevant guidance should be consulted to determine the precise definitions of prohibited non-audit services and the applicability of exceptions to certain of the prohibitions.
PRE-APPROVAL FEE LEVELS
Pre-approval fee levels for all services to be provided by the independent auditor will be established annually by the Audit Committee. Any proposed services exceeding these levels will require specific pre-approval by the Audit Committee.
PROCEDURES
Requests or applications to provide services that require specific approval by the Audit Committee will be submitted to the Audit Committee by both the independent auditor and the Principal Accounting Officer and/or Internal Auditor, and must include a joint statement as to whether, in their view, the request or application is consistent with the SEC’s rules on auditor independence.
(e)(2) Percentage of services identified in items 4(b) through 4(d) that were approved by the registrants audit committee pursuant to paragraph (c)(7)(i)(C) of Rule 2-01 of Regulation S-X:
4(b)
Fiscal year ended 2015 – 0%
Fiscal year ended 2014 - 0%
Percentage of services provided to the registrants investment adviser and any entity controlling, controlled by, or under common control with the investment adviser that provides ongoing services to the registrant that were approved by the registrants audit committee pursuant to paragraph (c)(7)(i)(C) of Rule 2-01 of Regulation S-X, 0% and 0% respectively.
4(c)
Fiscal year ended 2015 – 0%
Fiscal year ended 2014 – 0%
Percentage of services provided to the registrants investment adviser and any entity controlling, controlled by, or under common control with the investment adviser that provides ongoing services to the registrant that were approved by the registrants audit committee pursuant to paragraph (c)(7)(i)(C) of Rule 2-01 of Regulation S-X, 0% and 0% respectively.
4(d)
Fiscal year ended 2015 – 0%
Fiscal year ended 2014 – 0%
Percentage of services provided to the registrants investment adviser and any entity controlling, controlled by, or under common control with the investment adviser that provides ongoing services to the registrant that were approved by the registrants audit committee pursuant to paragraph (c)(7)(i)(C) of Rule 2-01 of Regulation S-X, 0% and 0% respectively.
| (g) | Non-Audit Fees billed to the registrant, the registrant’s investment adviser, and certain entities controlling, controlled by or under common control with the investment adviser: |
Fiscal year ended 2015 - $75,336
Fiscal year ended 2014 - $173,125
(h) The registrant’s Audit Committee has considered that the provision of non-audit services that were rendered to the registrant’s adviser (not including any sub-adviser whose role is primarily portfolio management and is subcontracted with or overseen by another investment adviser), and any entity controlling, controlled by, or under common control with the investment adviser that provides ongoing services to the registrant that were not pre-approved pursuant to paragraph (c)(7)(ii) of Rule 2-01 of Regulation S-X is compatible with maintaining the principal accountant’s independence.
Item 5. Audit Committee of Listed Registrants
Not Applicable
Item 6. Schedule of Investments
(a) The registrant’s Schedule of Investments is included as part of the Report to Stockholders filed under Item 1 of this form.
(b) Not Applicable; Fund had no divestments during the reporting period covered since the previous Form N-CSR filing.
Item 7. Disclosure of Proxy Voting Policies and Procedures for Closed-End Management Investment Companies
Item 8. Portfolio Managers of Closed-End Management Investment Companies
Item 9. Purchases of Equity Securities by Closed-End Management Investment Company and Affiliated Purchasers
Item 10. Submission of Matters to a Vote of Security Holders
No Changes to Report
Item 11. Controls and Procedures
(a) The registrant’s President and Treasurer have concluded that the
registrant’s disclosure controls and procedures (as defined in rule 30a-3(c) under the Act) are effective in design and operation and are sufficient to form the basis of the certifications required by Rule 30a-(2) under the Act, based on their evaluation of these disclosure controls and procedures within 90 days of the filing date of this report on Form N-CSR.
(b) There were no changes in the registrant’s internal control over financial reporting (as defined in rule 30a-3(d) under the Act) during the second fiscal quarter of the period covered by this report that have materially affected, or are reasonably likely to materially affect, the registrant’s internal control over financial reporting.
Item 12. Exhibits
(a)(1) Code of Ethics- Not Applicable to this Report.
(a)(2) Certifications of Principal Executive Officer and Principal Financial Officer.
(a)(3) Not Applicable.
(b) Certifications pursuant to 18 U.S.C. Section 1350.
SIGNATURES
Pursuant to the requirements of the Securities Exchange Act of 1934 and the Investment Company Act of 1940, the registrant has duly caused this report to be signed on its behalf by the undersigned, thereunto duly authorized.
Registrant Federated Equity Funds
By /S/ Lori A. Hensler
Lori A. Hensler, Principal Financial Officer
Date January 25, 2016
Pursuant to the requirements of the Securities Exchange Act of 1934 and the Investment Company Act of 1940, this report has been signed below by the following persons on behalf of the registrant and in the capacities and on the dates indicated.
By /S/ J. Christopher Donahue
J. Christopher Donahue, Principal Executive Officer
Date January 25, 2016
By /S/ Lori A. Hensler
Lori A. Hensler, Principal Financial Officer
Date January 25, 2016