United States
Securities and Exchange Commission
Washington, D.C. 20549
Form N-CSR
Certified Shareholder Report of Registered Management Investment Companies
811-4017
(Investment Company Act File Number)
Federated Equity Funds
_______________________________________________________________
(Exact Name of Registrant as Specified in Charter)
Federated Investors Funds
4000 Ericsson Drive
Warrendale, Pennsylvania 15086-7561
(Address of Principal Executive Offices)
(412) 288-1900
(Registrant's Telephone Number)
John W. McGonigle, Esquire
Federated Investors Tower
1001 Liberty Avenue
Pittsburgh, Pennsylvania 15222-3779
(Name and Address of Agent for Service)
(Notices should be sent to the Agent for Service)
Date of Fiscal Year End: 09/30/16
Date of Reporting Period: 09/30/16
Item 1. Reports to Stockholders

Annual Shareholder Report
September 30, 2016
| Share Class | Ticker |
| A | VSFAX |
| C | VSFCX |
| R | VSFRX |
| Institutional | VSFIX |
| R6 | VSFSX |
Federated Clover Small Value Fund
Successor to the Touchstone Diversified Small Cap Value Fund Established 1996
A Portfolio of Federated Equity Funds
Dear Valued Shareholder,
I am pleased to present the Annual Shareholder Report for your fund covering the period from October 1, 2015 through September 30, 2016. This report includes Management's Discussion of Fund Performance, a complete listing of your fund's holdings, performance information and financial statements along with other important fund information.
In addition, our website, FederatedInvestors.com, offers easy access to Federated resources that include timely fund updates, economic and market insights from our investment strategists, and financial planning tools. We invite you to register to take full advantage of its capabilities.
Thank you for investing with Federated. I hope you find this information useful and look forward to keeping you informed.
Sincerely,
J. Christopher Donahue, President
Not FDIC Insured • May Lose Value • No Bank Guarantee
CONTENTS
| 1 |
| 6 |
| 7 |
| 11 |
| 16 |
| 18 |
| 19 |
| 20 |
| 31 |
| 32 |
| 34 |
| 40 |
| 46 |
| 46 |
Management's Discussion of Fund Performance (unaudited)
The total return of Federated Clover Small Value Fund (the “Fund”), based on net asset value for the 12-month reporting period ended September 30, 2016, was 9.27% for Class A Shares, 8.47% for Class C Shares, 9.23% for Class R Shares, 9.36% for Class R6 Shares1, and 9.54% for Institutional Shares. The Russell 2000® Value Index (R2000V)2 a broad-based securities market index, returned 18.81% during the same period. The total return for the Morningstar Small Value Funds Average (MSVFA)3 a peer group average for the Fund, was 14.51% during the same period. The Fund's and the MSVFA's total return for the most recent fiscal year reflected actual cash flows, transaction costs and other expenses which were not reflected in the total return of the R2000V.
The Fund's investment strategy seeks to achieve capital appreciation through careful analysis and selection of individual stocks. For the reporting period, stock selection was the most significant factor affecting the Fund's performance relative to the R2000V.
The following discussion will focus on the performance of the Fund's Institutional Shares.
MARKET OVERVIEW
While stock prices generally trended higher during the period, the year was characterized by several sharp declines which interrupted this trend, most notably during the first six weeks of 2016, and then again after the United Kingdom's historic vote in June to exit the European Union (“Brexit”). Both times, the dramatic sell-off was followed by an equally impressive rally to bring the market averages back into positive territory. Global headlines continued to contribute to the volatility. Whether it was the political tensions in Europe, ongoing terrorist attacks around the globe, record-low (and in some cases, negative) interest rates being set by the world's central banks or even the contentious presidential campaign in the U.S., it was surprising that stocks had risen to record levels. The U.S. economy continued to muddle through, with generally positive data (e.g., low unemployment, wage increases and improved housing figures) which seemed enough to allay investor fears but not enough to ignite investor enthusiasm. Adding unease to this “slow growth” environment was the sense that the world's central banks were running out of tools to boost growth (interest rates cannot go much lower) and that these attempts had not been overwhelmingly successful in the first place. The negative rate experiments in Europe and Japan had lackluster results, and while China recently announced a new monetary and fiscal stimulus package, its economy showed signs of slowing. For years, China and the U.S. were the twin-engines propelling the global economy. With one engine sputtering, the focus began to shift toward the U.S., and its new President, to stay aloft.
Annual Shareholder Report
STOCK SELECTION4
Stock selection in the Energy sector had the greatest positive impact on the Fund's benchmark-relative performance for the reporting period. Among the standout performers in this sector were WPX Energy, Inc., an independent oil and gas exploration and production company, and U.S. Silica Holdings, Inc., which produces silica for the oil and gas industries. Discerning stock selection in the Telecommunication Services sector was another source of strength for the Fund. The Fund's only holding in this sector during the reporting period, commercial internet provider Cogent Communications Holdings Inc., delivered notable performance. Outside of these two sectors, notable contributions to performance were delivered by gas utility Atmos Energy Corporation, a gas utility, EPR Properties, a Real Estate Investment Trust (REIT), and Mueller Water Products, Inc., a manufacturer and marketer of products and services used in municipal water and gas systems. Detracting from relative performance over the reporting period was stock selection in the Information Technology sector. Within this area, digital marketing software firm Marketo, Inc. had a negative impact on Fund performance. The Materials sector was also among the weaker performing sectors for the Fund relative to the R2000V. In particular, containerboard producer KapStone Paper and Packaging Corporation posted disappointing results that negatively affected the Fund's return.
| 1 | The Fund's R6 Class commenced operations on March 29, 2016. For the period prior to the commencement of operations of the R6 class, the R6 class performance information shown is for the Institutional Share class, adjusted to reflect the expenses of the Fund's R6 class for each period for which the Fund's R6 class gross expenses would have exceeded the actual expense paid by the Fund's Institutional Share class. |
| 2 | Please see the footnotes to the line graphs under “Fund Performance and Growth of a $10,000 Investment” below for the definition of, and more information about, the R2000V. |
| 3 | Please see the footnotes to the line graphs under “Fund Performance and Growth of a $10,000 Investment” below for the definition of, and more information about, the MSVFA. |
| 4 | Because the Fund invests in smaller companies, it may be more volatile, and subject to greater short-term risk, than funds that invest in larger companies. Smaller companies may have limited resources, product lines and markets and their securities may trade less frequently and in more limited volumes than securities of larger companies. Value stocks tend to have higher dividends and thus have a higher income-related component in their total return than growth stocks. Value stocks also may lag growth stocks in performance at times, particularly in late stages of a market advance. |
Annual Shareholder Report
FUND PERFORMANCE AND GROWTH OF A $10,000 INVESTMENT
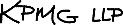
The graph below illustrates the hypothetical investment of $10,0001 in the Federated Clover Small Value Fund2 from September 30, 2006 to September 30, 2016, compared to the Russell 2000® Value Index (R2000V)3 and the Morningstar Small Value Funds Average (MSVFA).4 The Average Annual Total Return table below shows returns for each class averaged over the stated periods.
GROWTH OF A $10,000 INVESTMENT
Growth of $10,000 as of September 30, 2016
| Federated Clover Small Value Fund - | Institutional Shares | Class C Shares | Class A Shares | R2000V | MSVFA |
| F | F | F | I | I |
| 9/30/2006 | 10,000 | 10,000 | 9,450 | 10,000 | 10000 |
| 9/30/2007 | 10,917 | 10,864 | 10,317 | 10,609 | $10,899 |
| 9/30/2008 | 9,951 | 9,825 | 9,404 | 9,309 | $9,178 |
| 9/30/2009 | 9,617 | 9,467 | 9,083 | 8,135 | $8,565 |
| 9/30/2010 | 11,005 | 10,724 | 10,369 | 9,098 | $9,714 |
| 9/30/2011 | 10,338 | 9,975 | 9,715 | 8,553 | $9,257 |
| 9/30/2012 | 13,287 | 12,694 | 12,452 | 11,344 | $11,990 |
| 9/30/2013 | 16,299 | 15,418 | 15,237 | 14,411 | $15,510 |
| 9/30/2014 | 18,200 | 17,043 | 16,974 | 15,005 | $16,469 |
| 9/30/2015 | 17,971 | 16,661 | 16,717 | 14,765 | $15,960 |
| 9/30/2016 | 19,686 | 18,072 | 18,268 | 17,542 | $18,248 |
41 graphic description end -->
| ■ | Total returns shown for Class C Shares include the maximum contingent deferred sales charge of 1.00% as applicable. |
| ■ | Total returns shown for Class A include the maximum sales charge of 5.50% ($10,000 investment minus $550 sales charge = $9,450). |
The Fund offers multiple share classes whose performance may be greater than or less than its other share class(es) due to differences in sales charges and expenses. See the Average Annual Return table below for the returns of additional classes not shown in the line graph above.
Annual Shareholder Report
Average Annual Total Returns for the Period Ended 9/30/2016
(returns reflect all applicable sales charges and contingent deferred sales charges as specified below in footnote #1)
| | 1 Year | 5 Years | 10 Years |
| Class A Shares | 3.26% | 12.19% | 6.21% |
| Class C Shares | 7.47% | 12.62% | 6.10% |
| Class R Shares5 | 9.23% | 13.28% | 6.55% |
| Institutional Shares5 | 9.54% | 13.75% | 7.01% |
| Class R6 Shares5 | 9.36% | 13.48% | 6.81% |
| R2000V | 18.81% | 15.45% | 5.78% |
| MSVFA | 14.51% | 14.56% | 6.43% |
Performance data quoted represents past performance which is no guarantee of future results. Investment return and principal value will fluctuate so that an investor's shares, when redeemed, may be worth more or less than their original cost. Mutual fund performance changes over time and current performance may be lower or higher than what is stated. For current to the most recent month-end performance and after-tax returns, visit FederatedInvestors.com or call 1-800-341-7400. Returns shown do not reflect the deduction of taxes that a shareholder would pay on Fund distributions or the redemption of Fund shares. Mutual funds are not obligations of or guaranteed by any bank and are not federally insured.
Annual Shareholder Report
| 1 | Represents a hypothetical investment of $10,000 in the Fund after deducting applicable sales charges: For Class A Shares, the maximum sales charge of 5.50% ($10,000 investment minus $550 sales charges = $9,450); for Class C Shares, the maximum contingent deferred sales charge is 1.00% on any redemption less than one year from the purchase date. The Fund's performance assumes the reinvestment of all dividends and distributions. The R2000V and MSVFA have been adjusted to reflect reinvestment of dividends on securities in the index and average. |
| 2 | The Fund is the successor to Touchstone Diversified Small Cap Value Fund, a portfolio of Touchstone Funds Group Trust, pursuant to a reorganization that took place as of the close of business on August 28, 2009. The information presented above, for the periods prior to August 28, 2009, is historical information for Touchstone Diversified Small Cap Value Fund. |
| 3 | The R2000V measures the performance of the small-cap value segment of the U.S. equity universe. It includes those Russell 2000® companies with lower price-to-book ratios and lower forecasted growth values. The R2000V is not adjusted to reflect sales charges, expenses or other fees that the Securities and Exchange Commission requires to be reflected in the Fund's performance. The index is unmanaged, and unlike the Fund, is not affected by cash flows. It is not possible to invest directly in an index. |
| 4 | Morningstar figures represent the average of the total returns reported by all the mutual funds designated by Morningstar as falling into the respective category indicated. They do not reflect sales charges. |
| 5 | The Fund's Class R Shares commenced operations on December 1, 2010. The Fund's Institutional Shares commenced operations on August 29, 2009. The Fund's Class R6 Shares commenced operations on March 29, 2016. For the period prior to the commencement of operations of Class R Shares, Institutional Shares and Class R6 Shares, the performance information shown is for the Fund's Class A Shares. In relation to Class R Shares, the performance of Class A Shares has been adjusted to reflect the expenses applicable to Class R Shares. In relation to the Institutional Shares and Class R6 Shares, the performance of Class A Shares has not been adjusted to reflect expenses of Institutional Shares or Class R6 Shares since Institutional Shares and Class R6 Shares have a lower expense ratio than the expense ratio of the Class A Shares. The performance of Class A Shares has been adjusted to remove any voluntary waiver of Fund expenses related to the Class A Shares that may have occurred during the period prior to the commencement of operations of Institutional Shares and Class R6 Shares. Additionally, for the Class R Shares, Institutional Shares and Class R6 Shares, the performance information shown above has been adjusted to reflect the absence of sales charges applicable to Class A Shares. |
Annual Shareholder Report
Portfolio of Investments Summary Table (unaudited)
At September 30, 2016, the Fund's portfolio composition1 was follows:
| Sector Composition | Percentage of
Total Net Assets |
| Financials | 31.0% |
| Industrials | 16.3% |
| Information Technology | 11.5% |
| Consumer Discretionary | 6.9% |
| Real Estate | 6.8% |
| Health Care | 6.6% |
| Energy | 5.5% |
| Materials | 5.1% |
| Utilities | 4.7% |
| Consumer Staples | 3.1% |
| Cash Equivalents2 | 3.6% |
| Other Assets and Liabilities—Net3 | (1.1) % |
| TOTAL | 100.0% |
| 1 | Except for Cash Equivalents and Other Assets and Liabilities, sector classifications are based upon, and individual portfolio securities are assigned to, the classifications of the Global Industry Classification Standard (GICS) except that the Adviser assigns a classification to securities not classified by the GICS and to securities for which the Adviser does not have access to the classification made by the GICS. |
| 2 | Cash Equivalents include any investments in money market mutual funds and/or overnight repurchase agreements. |
| 3 | Assets, other than investments in securities, less liabilities. See Statement of Assets and Liabilities. |
Annual Shareholder Report
Portfolio of Investments
September 30, 2016
| Shares | | | Value |
| | | COMMON STOCKS—97.5% | |
| | | Consumer Discretionary—6.9% | |
| 103,575 | 1 | Asbury Automotive Group, Inc. | $5,766,020 |
| 357,050 | 1 | Houghton Mifflin Harcourt Co. | 4,788,041 |
| 138,975 | | Nexstar Broadcasting Group, Inc., Class A | 8,020,247 |
| 202,525 | | Sinclair Broadcast Group, Inc. | 5,848,922 |
| 110,075 | 1 | Skechers USA, Inc., Class A | 2,520,718 |
| 112,050 | 1 | Tenneco, Inc. | 6,529,153 |
| 182,775 | | Tribune Media Co. | 6,674,943 |
| 168,054 | 1 | WCI Communities, Inc. | 3,986,241 |
| | | TOTAL | 44,134,285 |
| | | Consumer Staples—3.1% | |
| 103,175 | | Energizer Holdings, Inc. | 5,154,623 |
| 231,700 | | Snyders-Lance, Inc. | 7,780,486 |
| 28,200 | 1 | TreeHouse Foods, Inc. | 2,458,758 |
| 200,544 | | Vector Group Ltd. | 4,317,706 |
| | | TOTAL | 19,711,573 |
| | | Energy—5.5% | |
| 263,700 | | Golar LNG Ltd. | 5,590,440 |
| 1,158,700 | 1 | McDermott International, Inc. | 5,805,087 |
| 243,275 | | PBF Energy, Inc. | 5,507,746 |
| 189,800 | | SemGroup Corp. | 6,711,328 |
| 125,450 | | US Silica Holdings, Inc. | 5,840,952 |
| 407,050 | 1 | WPX Energy, Inc. | 5,368,990 |
| | | TOTAL | 34,824,543 |
| | | Financials—31.0% | |
| 182,223 | | Argo Group International Holdings Ltd. | 10,281,022 |
| 635,850 | | BGC Partners, Inc., Class A | 5,563,688 |
| 520,975 | | CNO Financial Group, Inc. | 7,955,288 |
| 255,339 | | Chemical Financial Corp. | 11,268,110 |
| 399,275 | | Colony Capital, Inc., Class A | 7,278,783 |
| 819,725 | | FNB Corp. (PA) | 10,082,617 |
| 154,475 | | First American Financial Corp. | 6,067,778 |
| 132,525 | 1 | Flagstar Bancorp, Inc. | 3,677,569 |
| 193,088 | | Flushing Financial Corp. | 4,580,047 |
| 208,275 | | Great Western Bancorp, Inc. | 6,939,723 |
| 437,975 | 1 | Hilltop Holdings, Inc. | 9,836,918 |
Annual Shareholder Report
| Shares | | | Value |
| | | COMMON STOCKS—continued | |
| | | Financials—continued | |
| 84,750 | | Iberiabank Corp. | $5,688,420 |
| 503,900 | | Invesco Mortgage Capital, Inc. | 7,674,397 |
| 235,875 | | MB Financial, Inc. | 8,972,685 |
| 612,520 | | Maiden Holdings Ltd. | 7,772,879 |
| 663,550 | | New Residential Investment Corp. | 9,163,626 |
| 290,075 | | Popular, Inc. | 11,086,666 |
| 802,050 | | Radian Group, Inc. | 10,867,777 |
| 361,478 | | Synovus Financial Corp. | 11,758,879 |
| 116,725 | | Validus Holdings Ltd. | 5,815,240 |
| 268,750 | | WSFS Financial Corp. | 9,806,688 |
| 184,550 | | Webster Financial Corp. Waterbury | 7,014,746 |
| 251,900 | 1 | Western Alliance Bancorp | 9,456,326 |
| 156,025 | | Wintrust Financial Corp. | 8,670,309 |
| | | TOTAL | 197,280,181 |
| | | Health Care—6.6% | |
| 47,725 | 1 | Amsurg Corp. | 3,199,961 |
| 213,025 | 1 | Capital Senior Living Corp. | 3,578,820 |
| 139,625 | 1 | Emergent Biosolutions, Inc. | 4,402,376 |
| 59,875 | 1 | Integra Lifesciences Holdings Corp. | 4,942,681 |
| 120,875 | 1 | Medicines Co. | 4,561,823 |
| 75,300 | 1 | Molina Healthcare, Inc. | 4,391,496 |
| 164,600 | | Owens & Minor, Inc. | 5,716,558 |
| 33,300 | 1 | Wellcare Health Plans, Inc. | 3,899,097 |
| 285,891 | 1 | Wright Medical Group, Inc. | 7,012,906 |
| | | TOTAL | 41,705,718 |
| | | Industrials—16.3% | |
| 194,850 | | Actuant Corp. | 4,528,314 |
| 213,045 | | Barnes Group, Inc. | 8,638,975 |
| 234,475 | 1 | Colfax Corp. | 7,369,549 |
| 71,950 | | Curtiss Wright Corp. | 6,555,364 |
| 512,100 | | Donnelley (R.R.) & Sons Co. | 8,050,212 |
| 35,900 | | Dun & Bradstreet Corp. | 4,904,658 |
| 182,275 | | Kennametal, Inc. | 5,289,620 |
| 320,425 | 1 | Manitowoc Foodservice, Inc. | 5,197,294 |
| 374,025 | 1 | MRC Global, Inc. | 6,145,231 |
| 418,625 | | Mueller Water Products, Inc. | 5,253,744 |
| 249,075 | 1 | Now, Inc. | 5,337,677 |
| 126,175 | 1 | SPX Flow, Inc. | 3,901,331 |
Annual Shareholder Report
| Shares | | | Value |
| | | COMMON STOCKS—continued | |
| | | Industrials—continued | |
| 66,109 | | Unifirst Corp. | $8,717,133 |
| 289,725 | | Werner Enterprises, Inc. | 6,741,901 |
| 154,450 | | 1WESCO International, Inc. | 9,497,130 |
| 76,400 | | Woodward, Inc. | 4,773,472 |
| 72,625 | 1 | XPO Logistics, Inc. | 2,663,159 |
| | | TOTAL | 103,564,764 |
| | | Information Technology—11.5% | |
| 183,025 | 1 | Arris International PLC | 5,185,098 |
| 413,425 | 1 | Benchmark Electronics, Inc. | 10,314,954 |
| 308,150 | 1 | CIENA Corp. | 6,717,670 |
| 418,675 | | Cypress Semiconductor Corp. | 5,091,088 |
| 75,375 | 1 | ePlus, Inc. | 7,116,154 |
| 368,875 | | Evertec, Inc. | 6,189,722 |
| 328,450 | 1 | II-VI, Inc. | 7,991,188 |
| 181,675 | | MKS Instruments, Inc. | 9,034,698 |
| 257,400 | 1 | MaxLinear, Inc. | 5,217,498 |
| 130,200 | 1 | Q2 Holdings, Inc. | 3,731,532 |
| 203,125 | 1 | Rubicon Project, Inc./The | 1,681,875 |
| 42,900 | | Synnex Corp. | 4,895,319 |
| | | TOTAL | 73,166,796 |
| | | Materials—5.1% | |
| 330,700 | | Commercial Metals Corp. | 5,354,033 |
| 404,775 | | Huntsman Corp. | 6,585,689 |
| 375,875 | | Olin Corp. | 7,712,955 |
| 265,075 | 1 | Owens-Illinois, Inc. | 4,874,729 |
| 41,650 | | Scotts Miracle-Gro Co. | 3,468,196 |
| 240,621 | 1 | Summit Materials, Inc. | 4,463,520 |
| | | TOTAL | 32,459,122 |
| | | Real Estate—6.8% | |
| 165,875 | 1 | Colony Starwood Homes | 4,760,612 |
| 282,800 | | Healthcare Realty Trust, Inc. | 9,632,168 |
| 176,575 | | Highwoods Properties, Inc. | 9,203,089 |
| 399,425 | | Kite Realty Group Trust | 11,072,061 |
| 162,650 | | LaSalle Hotel Properties | 3,882,456 |
| 483,950 | | Lexington Realty Trust | 4,984,685 |
| | | TOTAL | 43,535,071 |
| | | Utilities—4.7% | |
| 227,800 | | Aqua America, Inc. | 6,943,344 |
Annual Shareholder Report
| Shares | | | Value |
| | | COMMON STOCKS—continued | |
| | | Utilities—continued | |
| 303,125 | 1 | Dynegy, Inc. | $3,755,719 |
| 228,775 | | Portland General Electric Co. | 9,743,527 |
| 148,225 | 1 | Spire, Inc. | 9,447,862 |
| | | TOTAL | 29,890,452 |
| | | TOTAL COMMON STOCKS
(IDENTIFIED COST $537,620,564) | 620,272,505 |
| | | INVESTMENT COMPANY—3.6% | |
| 22,922,475 | 2 | Federated Institutional Prime Value Obligations Fund, Institutional Shares, 0.36%3
(AT NET ASSET VALUE) | 22,922,475 |
| | | TOTAL INVESTMENTS—101.1%
(IDENTIFIED COST $560,543,039)4 | 643,194,980 |
| | | OTHER ASSETS AND LIABILITIES - NET—(1.1)%5 | (6,983,082) |
| | | TOTAL NET ASSETS—100% | $636,211,898 |
| 1 | Non-income-producing security. |
| 2 | Affiliated holding. |
| 3 | 7-day net yield. |
| 4 | The cost of investments for federal tax purposes amounts to $563,435,587. |
| 5 | Assets, other than investments in securities, less liabilities. See Statement of Assets and Liabilities. |
Note: The categories of investments are shown as a percentage of total net assets at September 30, 2016.
Various inputs are used in determining the value of the Fund's investments. These inputs are summarized in the three broad levels listed below:
Level 1—quoted prices in active markets for identical securities.
Level 2—other significant observable inputs (including quoted prices for similar securities, interest rates, prepayment speeds, credit risk, etc.). Also includes securities valued at amortized cost.
Level 3—significant unobservable inputs (including the Fund's own assumptions in determining the fair value of investments).The inputs or methodology used for valuing securities are not an indication of the risk associated with investing in those securities.
As of September 30, 2016, all investments of the Fund utilized Level 1 inputs, in valuing the Fund's assets carried at fair value.
See Notes which are an integral part of the Financial Statements
Annual Shareholder Report
Financial Highlights–Class A Shares
(For a Share Outstanding Throughout Each Period)
| Year Ended September 30 | 2016 | 2015 | 2014 | 2013 | 2012 |
| Net Asset Value, Beginning of Period | $23.20 | $26.29 | $24.91 | $21.50 | $17.01 |
| Income From Investment Operations: | | | | | |
| Net investment income (loss) | 0.161 | (0.03)1 | 0.231 | 0.371 | 0.091 |
| Net realized and unrealized gain (loss) on investments | 1.96 | (0.19) | 2.55 | 4.17 | 4.66 |
| TOTAL FROM INVESTMENT OPERATIONS | 2.12 | (0.22) | 2.78 | 4.54 | 4.75 |
| Less Distributions: | | | | | |
| Distributions from net investment income | (0.06) | (0.14) | (0.26) | (0.13) | (0.03) |
| Distributions from net realized gain on investments | (0.44) | (2.73) | (1.14) | (1.00) | (0.23) |
| TOTAL DISTRIBUTIONS | (0.50) | (2.87) | (1.40) | (1.13) | (0.26) |
| Net Asset Value, End of Period | $24.82 | $23.20 | $26.29 | $24.91 | $21.50 |
| Total Return2 | 9.27% | (1.51)% | 11.40% | 22.37% | 28.17% |
| Ratios to Average Net Assets: | | | | | |
| Net expenses | 1.26% | 1.26% | 1.26% | 1.26% | 1.26%3 |
| Net investment income (loss) | 0.70% | (0.13)% | 0.87% | 1.60% | 0.42% |
| Expense waiver/reimbursement4 | 0.15% | 0.18% | 0.17% | 0.24% | 0.29% |
| Supplemental Data: | | | | | |
| Net assets, end of period (000 omitted) | $126,015 | $149,579 | $159,674 | $150,854 | $148,687 |
| Portfolio turnover | 89% | 83% | 73% | 99% | 72% |
| 1 | Per share numbers have been calculated using the average shares method. |
| 2 | Based on net asset value, which does not reflect the sales charge, redemption fee or contingent deferred sales charge, if applicable. |
| 3 | The net expense ratio is calculated without reduction for fees paid indirectly for expense offset arrangements. The net expense ratio was 1.26% for the year ended September 30, 2012, after taking into account these expense reductions. |
| 4 | This expense decrease is reflected in both the net expense and the net investment income (loss) ratios shown above. |
See Notes which are an integral part of the Financial Statements
Annual Shareholder Report
Financial Highlights–Class C Shares
(For a Share Outstanding Throughout Each Period)
| Year Ended September 30 | 2016 | 2015 | 2014 | 2013 | 2012 |
| Net Asset Value, Beginning of Period | $22.40 | $25.55 | $24.29 | $21.01 | $16.72 |
| Income From Investment Operations: | | | | | |
| Net investment income (loss) | (0.01)1 | (0.21)1 | 0.031 | 0.181 | (0.06)1 |
| Net realized and unrealized gain (loss) on investments | 1.88 | (0.18) | 2.48 | 4.10 | 4.58 |
| TOTAL FROM INVESTMENT OPERATIONS | 1.87 | (0.39) | 2.51 | 4.28 | 4.52 |
| Less Distributions: | | | | | |
| Distributions from net investment income | (0.00)2 | (0.03) | (0.11) | — | — |
| Distributions from net realized gain on investments | (0.44) | (2.73) | (1.14) | (1.00) | (0.23) |
| TOTAL DISTRIBUTIONS | (0.44) | (2.76) | (1.25) | (1.00) | (0.23) |
| Net Asset Value, End of Period | $23.83 | $22.40 | $25.55 | $24.29 | $21.01 |
| Total Return3 | 8.47% | (2.24)% | 10.54% | 21.46% | 27.25% |
| Ratios to Average Net Assets: | | | | | |
| Net expenses | 2.01% | 2.01% | 2.01% | 2.01% | 2.01%4 |
| Net investment income (loss) | (0.05)% | (0.85)% | 0.12% | 0.80% | (0.33)% |
| Expense waiver/reimbursement5 | 0.18% | 0.17% | 0.18% | 0.26% | 0.31% |
| Supplemental Data: | | | | | |
| Net assets, end of period (000 omitted) | $21,253 | $23,961 | $24,664 | $21,624 | $16,088 |
| Portfolio turnover | 89% | 83% | 73% | 99% | 72% |
| 1 | Per share numbers have been calculated using the average shares method. |
| 2 | Represents less than $0.01. |
| 3 | Based on net asset value, which does not reflect the sales charge, redemption fee or contingent deferred sales charge, if applicable. |
| 4 | The net expense ratio is calculated without reduction for fees paid indirectly for expense offset arrangements. The net expense ratio was 2.01% for the year ended September 30, 2012, after taking into account these expense reductions. |
| 5 | This expense decrease is reflected in both the net expense and the net investment income (loss) ratios shown above. |
See Notes which are an integral part of the Financial Statements
Annual Shareholder Report
Financial Highlights–Class R Shares
(For a Share Outstanding Throughout Each Period)
| Year Ended September 30 | 2016 | 2015 | 2014 | 2013 | 2012 |
| Net Asset Value, Beginning of Period | $22.91 | $25.99 | $24.68 | $21.39 | $16.99 |
| Income From Investment Operations: | | | | | |
| Net investment income (loss) | 0.151 | (0.05)1 | 0.241 | 0.351 | 0.031 |
| Net realized and unrealized gain (loss) on investments | 1.93 | (0.20) | 2.46 | 4.11 | 4.66 |
| TOTAL FROM INVESTMENT OPERATIONS | 2.08 | (0.25) | 2.70 | 4.46 | 4.69 |
| Less Distributions: | | | | | |
| Distributions from net investment income | (0.04) | (0.10) | (0.25) | (0.17) | (0.06) |
| Distributions from net realized gain on investments | (0.44) | (2.73) | (1.14) | (1.00) | (0.23) |
| TOTAL DISTRIBUTIONS | (0.48) | (2.83) | (1.39) | (1.17) | (0.29) |
| Net Asset Value, End of Period | $24.51 | $22.91 | $25.99 | $24.68 | $21.39 |
| Total Return2 | 9.23% | (1.63)% | 11.20% | 22.10% | 27.86% |
| Ratios to Average Net Assets: | | | | | |
| Net expenses | 1.32% | 1.38% | 1.47% | 1.46% | 1.51%3 |
| Net investment income (loss) | 0.67% | (0.19)% | 0.93% | 1.54% | 0.17% |
| Expense waiver/reimbursement4 | 0.33% | 0.28% | 0.29% | 0.34% | 0.40% |
| Supplemental Data: | | | | | |
| Net assets, end of period (000 omitted) | $13,010 | $9,721 | $7,864 | $8,431 | $319 |
| Portfolio turnover | 89% | 83% | 73% | 99% | 72% |
| 1 | Per share numbers have been calculated using the average shares method. |
| 2 | Based on net asset value. |
| 3 | The net expense ratio is calculated without reduction for fees paid indirectly for expense offset arrangements. The net expense ratio was 1.51% for the year ended September 30, 2012, after taking into account these expense reductions. |
| 4 | This expense decrease is reflected in both the net expense and the net investment income (loss) ratios shown above. |
See Notes which are an integral part of the Financial Statements
Annual Shareholder Report
Financial Highlights–Institutional Shares
(For a Share Outstanding Throughout Each Period)
| Year Ended September 30 | 2016 | 2015 | 2014 | 2013 | 2012 |
| Net Asset Value, Beginning of Period | $23.31 | $26.40 | $25.01 | $21.58 | $17.07 |
| Income From Investment Operations: | | | | | |
| Net investment income | 0.221 | 0.031 | 0.301 | 0.431 | 0.141 |
| Net realized and unrealized gain (loss) on investments | 1.96 | (0.19) | 2.55 | 4.18 | 4.68 |
| TOTAL FROM INVESTMENT OPERATIONS | 2.18 | (0.16) | 2.85 | 4.61 | 4.82 |
| Less Distributions: | | | | | |
| Distributions from net investment income | (0.12) | (0.20) | (0.32) | (0.18) | (0.08) |
| Distributions from net realized gain on investments | (0.44) | (2.73) | (1.14) | (1.00) | (0.23) |
| TOTAL DISTRIBUTIONS | (0.56) | (2.93) | (1.46) | (1.18) | (0.31) |
| Net Asset Value, End of Period | $24.93 | $23.31 | $26.40 | $25.01 | $21.58 |
| Total Return2 | 9.54% | (1.26)% | 11.66% | 22.67% | 28.52% |
| Ratios to Average Net Assets: | | | | | |
| Net expenses | 1.01% | 1.01% | 1.01% | 1.01% | 1.01%3 |
| Net investment income | 0.95% | 0.14% | 1.13% | 1.86% | 0.66% |
| Expense waiver/reimbursement4 | 0.12% | 0.11% | 0.11% | 0.15% | 0.22% |
| Supplemental Data: | | | | | |
| Net assets, end of period (000 omitted) | $468,727 | $498,468 | $480,796 | $353,785 | $145,893 |
| Portfolio turnover | 89% | 83% | 73% | 99% | 72% |
| 1 | Per share numbers have been calculated using the average shares method. |
| 2 | Based on net asset value. |
| 3 | The net expense ratio is calculated without reduction for fees paid indirectly for expense offset arrangements. The net expense ratio was 1.01% for the year ended September 30, 2012, after taking into account these expense reductions. |
| 4 | This expense decrease is reflected in both the net expense and the net investment income ratios shown above. |
See Notes which are an integral part of the Financial Statements
Annual Shareholder Report
Financial Highlights–R6 Shares
(For a Share Outstanding Throughout the Period)
| Period Ended September 30 | 20161 |
| Net Asset Value, Beginning of Period | $21.94 |
| Income From Investment Operations: | |
| Net investment income | 0.132 |
| Net realized and unrealized gain on investments | 2.77 |
| TOTAL FROM INVESTMENT OPERATIONS | 2.90 |
| Net Asset Value, End of Period | $24.84 |
| Total Return3 | 13.22% |
| Ratios to Average Net Assets: | |
| Net expenses | 0.94%4 |
| Net investment income | 1.07%4 |
| Expense waiver/reimbursement5 | 0.11%4 |
| Supplemental Data: | |
| Net assets, end of period (000 omitted) | $7,207 |
| Portfolio turnover | 89%6 |
| 1 | Reflects operations for the period from March 29, 2016 (date of initial investment) to September 30, 2016. |
| 2 | Per share numbers have been calculated using the average shares method. |
| 3 | Based on net asset value. Total returns for periods of less than one year are not annualized. |
| 4 | Computed on an annualized basis. |
| 5 | This expense decrease is reflected in both the net expense and the net investment income ratios shown above. |
| 6 | Portfolio turnover is calculated at the Fund level. Percentage indicated was calculated for the year ended September 30, 2016. |
See Notes which are an integral part of the Financial Statements
Annual Shareholder Report
Statement of Assets and Liabilities
September 30, 2016
| Assets: | | |
| Total investment in securities, at value including $22,922,475 of investment in an affiliated holding (Note 5) (identified cost $560,543,039) | | $643,194,980 |
| Income receivable | | 1,112,546 |
| Receivable for investments sold | | 1,288,183 |
| Receivable for shares sold | | 568,873 |
| TOTAL ASSETS | | 646,164,582 |
| Liabilities: | | |
| Payable for investments purchased | $9,335,890 | |
| Payable for shares redeemed | 412,708 | |
| Payable to adviser (Note 5) | 13,441 | |
| Payable for administrative fee (Note 5) | 1,344 | |
| Payable for distribution services fee (Note 5) | 15,731 | |
| Payable for other service fees (Notes 2 and 5) | 46,559 | |
| Accrued expenses (Note 5) | 127,011 | |
| TOTAL LIABILITIES | | 9,952,684 |
| Net assets for 25,590,934 shares outstanding | | $636,211,898 |
| Net Assets Consist of: | | |
| Paid-in capital | | $551,096,334 |
| Net unrealized appreciation of investments | | 82,651,941 |
| Accumulated net realized loss on investments | | (641,995) |
| Undistributed net investment income | | 3,105,618 |
| TOTAL NET ASSETS | | $636,211,898 |
Annual Shareholder Report
Statement of Assets and Liabilities–continued
| Net Asset Value, Offering Price and Redemption Proceeds Per Share | | |
| Class A Shares: | | |
| Net asset value per share ($126,015,322 ÷ 5,076,729 shares outstanding), no par value, unlimited shares authorized | | $24.82 |
| Offering price per share (100/94.50 of $24.82) | | $26.26 |
| Redemption proceeds per share | | $24.82 |
| Class C Shares: | | |
| Net asset value per share ($21,252,684 ÷ 891,934 shares outstanding), no par value, unlimited shares authorized | | $23.83 |
| Offering price per share | | $23.83 |
| Redemption proceeds per share (99.00/100 of $23.83) | | $23.59 |
| Class R Shares: | | |
| Net asset value per share ($13,009,939 ÷ 530,819 shares outstanding), no par value, unlimited shares authorized | | $24.51 |
| Offering price per share | | $24.51 |
| Redemption proceeds per share | | $24.51 |
| Institutional Shares: | | |
| Net asset value per share ($468,727,005 ÷ 18,801,262 shares outstanding), no par value, unlimited shares authorized | | $24.93 |
| Offering price per share | | $24.93 |
| Redemption proceeds per share | | $24.93 |
| Class R6 Shares: | | |
| Net asset value per share ($7,206,948 ÷ 290,190 shares outstanding), no par value, unlimited shares authorizedd | | $24.84 |
| Offering price per share | | $24.84 |
| Redemption proceeds per share | | $24.84 |
See Notes which are an integral part of the Financial Statements
Annual Shareholder Report
Statement of Operations
Year Ended September 30, 2016
| Investment Income: | | | |
| Dividends (including $79,108 received from an affiliated holding (Note 5) and net of foreign taxes withheld of $22,176) | | | $12,857,956 |
| Expenses: | | | |
| Investment adviser fee (Note 5) | | $5,884,749 | |
| Administrative fee (Note 5) | | 511,379 | |
| Custodian fees | | 37,034 | |
| Transfer agent fee (Note 2) | | 674,858 | |
| Directors'/Trustees' fees (Note 5) | | 6,182 | |
| Auditing fees | | 33,295 | |
| Legal fees | | 8,171 | |
| Portfolio accounting fees | | 138,425 | |
| Distribution services fee (Note 5) | | 222,075 | |
| Other service fees (Notes 2 and 5) | | 393,921 | |
| Share registration costs | | 78,157 | |
| Printing and postage | | 55,472 | |
| Miscellaneous (Note 5) | | 13,771 | |
| TOTAL EXPENSES | | 8,057,489 | |
| Waivers and Reimbursements: | | | |
| Waiver/reimbursement of investment adviser fee (Note 5) | $(484,102) | | |
| Waiver/reimbursement of other operating expenses (Notes 2 and 5) | (360,741) | | |
| TOTAL WAIVERS AND REIMBURSEMENTS | | (844,843) | |
| Net expenses | | | 7,212,646 |
| Net investment income | | | 5,645,310 |
| Realized and Unrealized Gain on Investments: | | | |
| Net realized gain on investments | | | 1,603,136 |
| Net change in unrealized appreciation of investments | | | 49,648,812 |
| Net realized and unrealized gain on investments | | | 51,251,948 |
| Change in net assets resulting from operations | | | $56,897,258 |
See Notes which are an integral part of the Financial Statements
Annual Shareholder Report
Statement of Changes in Net Assets
| Year Ended September 30 | 2016 | 2015 | |
| Increase (Decrease) in Net Assets | | |
| Operations: | | |
| Net investment income | $5,645,310 | $302,626 |
| Net realized gain on investments | 1,603,136 | 22,762,537 |
| Net change in unrealized appreciation/depreciation of investments | 49,648,812 | (31,350,635) |
| CHANGE IN NET ASSETS RESULTING FROM OPERATIONS | 56,897,258 | (8,285,472) |
| Distributions to Shareholders: | | |
| Distributions from net investment income | | |
| Class A Shares | (366,741) | (823,287) |
| Class C Shares | — | (25,797) |
| Class R Shares | (18,140) | (35,853) |
| Institutional Shares | (2,712,924) | (4,011,463) |
| Distributions from net realized gain on investments | | |
| Class A Shares | (2,782,748) | (15,623,818) |
| Class C Shares | (471,114) | (2,632,397) |
| Class R Shares | (188,784) | (918,602) |
| Institutional Shares | (9,403,423) | (50,885,817) |
| CHANGE IN NET ASSETS RESULTING FROM DISTRIBUTIONS TO SHAREHOLDERS | (15,943,874) | (74,957,034) |
| Share Transactions: | | |
| Proceeds from sale of shares | 132,492,428 | 224,267,584 |
| Net asset value of shares issued to shareholders in payment of distributions declared | 15,042,494 | 70,444,332 |
| Cost of shares redeemed | (234,005,694) | (202,738,927) |
| CHANGE IN NET ASSETS RESULTING FROM SHARE TRANSACTIONS | (86,470,772) | 91,972,989 |
| Change in net assets | (45,517,388) | 8,730,483 |
| Net Assets: | | |
| Beginning of period | 681,729,286 | 672,998,803 |
| End of period (including undistributed net investment income of $3,105,618 and $558,113, respectively) | $636,211,898 | $681,729,286 |
See Notes which are an integral part of the Financial Statements
Annual Shareholder Report
Notes to Financial Statements
September 30, 2016
1. ORGANIZATION
Federated Equity Funds (the “Trust”) is registered under the Investment Company Act of 1940, as amended (the “Act”), as an open-end management investment company. The Trust consists of 14 diversified portfolios. The financial statements included herein are only those of Federated Clover Small Value Fund (the “Fund”). The financial statements of the other portfolios are presented separately. The assets of each portfolio are segregated and a shareholder's interest is limited to the portfolio in which shares are held. Each portfolio pays its own expenses. The Fund offers five classes of shares: Class A Shares, Class C Shares, Class R Shares, Institutional Shares and Class R6 Shares. All shares of the Fund have equal rights with respect to voting, except on class-specific matters. The investment objective of the Fund is to seek capital appreciation.
The Fund commenced offering Class R6 Shares on March 29, 2016.
2. SIGNIFICANT ACCOUNTING POLICIES
The following is a summary of significant accounting policies consistently followed by the Fund in the preparation of its financial statements. These policies are in conformity with U.S. generally accepted accounting principles (GAAP).
Investment Valuation
In calculating its net asset value (NAV), the Fund generally values investments as follows:
| ■ | Equity securities listed on an exchange or traded through a regulated market system are valued at their last reported sale price or official closing price in their principal exchange or market. |
| ■ | Shares of other mutual funds or non-exchange-traded investment companies are valued based upon their reported NAVs. |
| ■ | Fixed-income securities acquired with remaining maturities greater than 60 days are fair valued using price evaluations provided by a pricing service approved by the Fund's Board of Trustees (the “Trustees”). |
| ■ | Fixed-income securities and repurchase agreements acquired with remaining maturities of 60 days or less are valued at their cost (adjusted for the accretion of any discount or amortization of any premium), unless the issuer's creditworthiness is impaired or other factors indicate that amortized cost is not an accurate estimate of the investment's fair value, in which case it would be valued in the same manner as a longer-term security. |
| ■ | Derivative contracts listed on exchanges are valued at their reported settlement or closing price, except that options are valued at the mean of closing bid and asked quotations. |
| ■ | Over-the-counter (OTC) derivative contracts are fair valued using price evaluations provided by a pricing service approved by the Trustees. |
| ■ | For securities that are fair valued in accordance with procedures established by and under the general supervision of the Trustees, certain factors may be considered such as: the last traded or purchase price of the security, information obtained by contacting the issuer or dealers, analysis of the issuer's financial statements or other available documents, fundamental analytical data, the nature and duration of restrictions on disposition, the movement of the market in which the security is normally traded public trading in similar securities or derivative contracts of the issuer or comparable issuers, movement of a relevant index, or other factors including but not limited to industry changes and relevant government actions. |
Annual Shareholder Report
If any price, quotation, price evaluation or other pricing source is not readily available when the NAV is calculated, or if the Fund cannot obtain price evaluations from a pricing service or from more than one dealer for an investment within a reasonable period of time as set forth in the Fund's valuation policies and procedures, the Fund uses the fair value of the investment determined in accordance with the procedures described below. There can be no assurance that the Fund could obtain the fair value assigned to an investment if it sold the investment at approximately the time at which the Fund determines its NAV per share.
Fair Valuation and Significant Events Procedures
The Trustees have ultimate responsibility for determining the fair value of investments for which market quotations are not readily available. The Trustees have appointed a valuation committee (“Valuation Committee”) comprised of officers of the Fund, Federated Global Investment Management Corp. (“Adviser”) and certain of the Adviser's affiliated companies to assist in determining fair value and in overseeing the calculation of the NAV. The Trustees have also authorized the use of pricing services recommended by the Valuation Committee to provide fair value evaluations of the current value of certain investments for purposes of calculating the NAV. The Valuation Committee employs various methods for reviewing third-party pricing-service evaluations including periodic reviews of third-party pricing services' policies, procedures and valuation methods (including key inputs, methods, models and assumptions), transactional back-testing, comparisons of evaluations of different pricing services, and review of price challenges by the Adviser based on recent market activity. In the event that market quotations and price evaluations are not available for an investment, the Valuation Committee determines the fair value of the investment in accordance with procedures adopted by the Trustees. The Trustees periodically review and approve the fair valuations made by the Valuation Committee and any changes made to the procedures.
Factors considered by pricing services in evaluating an investment include the yields or prices of investments of comparable quality, coupon, maturity, call rights and other potential prepayments, terms and type, reported transactions, indications as to values from dealers and general market conditions. Some pricing services provide a single price evaluation reflecting the bid-side of the market for an investment (a “bid” evaluation). Other pricing services offer both bid evaluations and price evaluations indicative of a price between the prices bid and asked for the investment (a “mid” evaluation). The Fund normally uses bid evaluations for any U.S. Treasury and Agency securities, mortgage-backed securities and municipal securities. The Fund normally uses mid evaluations for any other types of fixed-income securities and any OTC derivative contracts. In the event that market quotations and price evaluations are not available for an investment, the fair value of the investment is determined in accordance with procedures adopted by the Trustees.
The Trustees also have adopted procedures requiring an investment to be priced at its fair value whenever the Adviser determines that a significant event affecting the value of the investment has occurred between the time as of which the price of the investment would otherwise be determined and the time as of which the NAV is computed. An event is considered significant if there is both an affirmative expectation that the investment's value will change in response to the event and a reasonable basis for quantifying the resulting change in value. Examples of significant events that may occur after the close of the principal market on which a security is traded, or after the time of a price evaluation provided by a pricing service or a dealer, include:
| ■ | With respect to securities traded principally in foreign markets, significant trends in U.S. equity markets or in the trading of foreign securities index futures contracts; |
Annual Shareholder Report
| ■ | Political or other developments affecting the economy or markets in which an issuer conducts its operations or its securities are traded; |
| ■ | Announcements concerning matters such as acquisitions, recapitalizations, litigation developments, or a natural disaster affecting the issuer's operations or regulatory changes or market developments affecting the issuer's industry. |
The Trustees have adopted procedures whereby the Valuation Committee uses a pricing service to determine the fair value of equity securities traded principally in foreign markets when the Adviser determines that there has been a significant trend in the U.S. equity markets or in index futures trading. For other significant events, the Fund may seek to obtain more current quotations or price evaluations from alternative pricing sources. If a reliable alternative pricing source is not available, the Fund will determine the fair value of the investment in accordance with the fair valuation procedures approved by the Trustees. The Trustees have ultimate responsibility for any fair valuations made in response to a significant event.
Repurchase Agreements
The Fund may invest in repurchase agreements for short-term liquidity purposes. It is the policy of the Fund to require the other party to a repurchase agreement to transfer to the Fund's custodian or sub-custodian eligible securities or cash with a market value (after transaction costs) at least equal to the repurchase price to be paid under the repurchase agreement. The eligible securities are transferred to accounts with the custodian or sub-custodian in which the Fund holds a “securities entitlement” and exercises “control” as those terms are defined in the Uniform Commercial Code. The Fund has established procedures for monitoring the market value of the transferred securities and requiring the transfer of additional eligible securities if necessary to equal at least the repurchase price. These procedures also allow the other party to require securities to be transferred from the account to the extent that their market value exceeds the repurchase price or in exchange for other eligible securities of equivalent market value.
The insolvency of the other party or other failure to repurchase the securities may delay the disposition of the underlying securities or cause the Fund to receive less than the full repurchase price. Under the terms of the repurchase agreement, any amounts received by the Fund in excess of the repurchase price and related transaction costs must be remitted to the other party.
The Fund may enter into repurchase agreements in which eligible securities are transferred into joint trading accounts maintained by the custodian or sub-custodian for investment companies and other clients advised by the Fund's Adviser and its affiliates. The Fund will participate on a pro rata basis with the other investment companies and clients in its share of the securities transferred under such repurchase agreements and in its share of proceeds from any repurchase or other disposition of such securities.
Investment Income, Gains and Losses, Expenses and Distributions
Investment transactions are accounted for on a trade-date basis. Realized gains and losses from investment transactions are recorded on an identified-cost basis. Interest income and expenses are accrued daily. Dividend income and distributions to shareholders are recorded on the ex-dividend date. Foreign dividends are recorded on the ex-dividend date or when the Fund is informed of the ex-dividend date. Distributions of net investment income are declared and paid annually. Non-cash dividends included in dividend income, if any, are recorded at fair value. Amortization/accretion of premium and discount is included in investment income. Investment income, realized and unrealized gains and losses, and certain fund-level expenses are allocated to each class based on relative average daily net assets, except that Class A
Annual Shareholder Report
Shares, Class C Shares, Class R Shares, Institutional Shares and Class R6 Shares may bear distribution services fees, other service fees and transfer agent fees unique to those classes. The detail of the total fund expense waivers and reimbursements of $844,843 is disclosed in various locations in this Note 2 and Note 5. For the year ended September 30, 2016, transfer agent fees for the Fund were as follows:
| | Transfer
Agent Fees
Incurred | Transfer
Agent Fees
Reimbursed |
| Class A Shares | $164,910 | $(98,636) |
| Class C Shares | 36,835 | (24,831) |
| Class R Shares | 12,141 | — |
| Institutional Shares | 460,706 | (210,143) |
| Class R6 Shares | 266 | — |
| TOTAL | $674,858 | $(333,610) |
Dividends are declared separately for each class. No class has preferential dividend rights; differences in per share dividend rates are generally due to differences in separate class expenses.
Other Service Fees
The Fund may pay other service fees up to 0.25% of the average daily net assets of the Fund's Class A Shares and Class C Shares to Federated Shareholder Services Company (FSSC) for providing services to shareholders and maintaining shareholder accounts. Subject to the terms described in the Expense Limitation note, FSSC may voluntarily reimburse the Fund for other service fees. In addition, unaffiliated third-party financial intermediaries may waive other service fees. This waiver can be modified or terminated at any time. For the year ended September 30, 2016, other service fees for the Fund were as follows:
| | Other Service
Fees Incurred |
| Class A Shares | $338,009 |
| Class C Shares | 55,912 |
| TOTAL | $393,921 |
Federal Taxes
It is the Fund's policy to comply with the Subchapter M provision of the Internal Revenue Code (the “Code”) and to distribute to shareholders each year substantially all of its income. Accordingly, no provision for federal income tax is necessary. As of and during the year ended September 30, 2016, the Fund did not have a liability for any uncertain tax positions. The Fund recognizes interest and penalties, if any, related to tax liabilities as income tax expense in the Statement of Operations. As of September 30, 2016, tax years 2013 through 2016 remain subject to examination by the Fund's major tax jurisdictions, which include the United States of America and the Commonwealth of Massachusetts.
The Fund may be subject to taxes imposed by governments of countries in which it invests. Such taxes are generally based on either income or gains earned or repatriated. The Fund accrues and applies such taxes to net investment income, net realized gains and net unrealized gains as income and/or gains are earned.
Annual Shareholder Report
When-Issued and Delayed-Delivery Transactions
The Fund may engage in when-issued or delayed-delivery transactions. The Fund records when-issued securities on the trade date and maintains security positions such that sufficient liquid assets will be available to make payment for the securities purchased. Securities purchased on a when-issued or delayed-delivery basis are marked to market daily and begin earning interest on the settlement date. Losses may occur on these transactions due to changes in market conditions or the failure of counterparties to perform under the contract.
Foreign Currency Translation
The accounting records of the Fund are maintained in U.S. dollars. All assets and liabilities denominated in foreign currencies (FCs) are translated into U.S. dollars based on the rates of exchange of such currencies against U.S. dollars on the date of valuation. Purchases and sales of securities, income and expenses are translated at the rate of exchange quoted on the respective date that such transactions are recorded. The Fund does not isolate that portion of the results of operations resulting from changes in foreign exchange rates on investments from the fluctuations arising from changes in market prices of securities held. Such fluctuations are included with the net realized and unrealized gain or loss from investments.
Reported net realized foreign exchange gains or losses arise from sales of portfolio securities, sales and maturities of short-term securities, sales of FCs, currency gains or losses realized between the trade and settlement dates on securities transactions, the difference between the amounts of dividends, interest and foreign withholding taxes recorded on the Fund's books, and the U.S. dollar equivalent of the amounts actually received or paid. Net unrealized foreign exchange gains and losses arise from changes in the value of assets and liabilities other than investments in securities at fiscal year end, resulting from changes in the exchange rate.
Other
The preparation of financial statements in conformity with GAAP requires management to make estimates and assumptions that affect the amounts of assets, liabilities, expenses and revenues reported in the financial statements. Actual results could differ from those estimated. The Fund applies Investment Company accounting and reporting guidance.
3. SHARES OF BENEFICIAL INTEREST
The following tables summarize share activity:
| Year Ended September 30 | 2016 | 2015 |
| Class A Shares: | Shares | Amount | Shares | Amount |
| Shares sold | 860,569 | $19,715,940 | 1,905,631 | $47,215,436 |
| Shares issued to shareholders in payment of distributions declared | 132,236 | 3,089,432 | 629,362 | 15,603,435 |
| Shares redeemed | (2,362,476) | (53,958,118) | (2,161,576) | (54,659,666) |
| NET CHANGE RESULTING FROM CLASS A SHARE TRANSACTIONS | (1,369,671) | $(31,152,746) | 373,417 | $8,159,205 |
Annual Shareholder Report
| Year Ended September 30 | 2016 | 2015 |
| Class C Shares: | Shares | Amount | Shares | Amount |
| Shares sold | 164,943 | $3,621,602 | 283,175 | $6,830,212 |
| Shares issued to shareholders in payment of distributions declared | 20,186 | 455,387 | 106,336 | 2,548,878 |
| Shares redeemed | (362,806) | (7,993,021) | (285,164) | (6,884,248) |
| NET CHANGE RESULTING FROM CLASS C SHARE TRANSACTIONS | (177,677) | $(3,916,032) | 104,347 | $2,494,842 |
| Year Ended September 30 | 2016 | 2015 |
| Class R Shares: | Shares | Amount | Shares | Amount |
| Shares sold | 194,260 | $4,379,804 | 191,836 | $4,798,835 |
| Shares issued to shareholders in payment of distributions declared | 8,548 | 197,195 | 37,833 | 925,743 |
| Shares redeemed | (96,277) | (2,202,596) | (107,958) | (2,646,811) |
| NET CHANGE RESULTING FROM CLASS R SHARE TRANSACTIONS | 106,531 | $2,374,403 | 121,711 | $3,077,767 |
| Year Ended September 30 | 2016 | 2015 |
| Institutional Shares: | Shares | Amount | Shares | Amount |
| Shares sold | 4,283,904 | $97,835,090 | 6,639,453 | $165,423,101 |
| Shares issued to shareholders in payment of distributions declared | 482,581 | 11,300,480 | 2,060,765 | 51,366,276 |
| Shares redeemed | (7,348,420) | (169,730,935) | (5,527,910) | (138,548,202) |
| NET CHANGE RESULTING FROM INSTITUTIONAL SHARE TRANSACTIONS | (2,581,935) | $(60,595,365) | 3,172,308 | $78,241,175 |
| | Period Ended
9/30/20161 | Year ended 9/30/2015 |
| Class R6 Shares: | Shares | Amount | Shares | Amount |
| Shares sold | 295,150 | $6,939,992 | — | — |
| Shares issued to shareholders in payment of distributions declared | — | — | — | — |
| Shares redeemed | (4,960) | (121,024) | — | — |
| NET CHANGE RESULTING FROM CLASS R6 SHARE TRANSACTIONS | 290,190 | $6,818,968 | — | — |
| NET CHANGE RESULTING FROM TOTAL FUND SHARE TRANSACTIONS | (3,732,562) | $(86,470,772) | 3,771,783 | $91,972,989 |
| 1 | Reflects operations for the period from March 29, 2016 (date of initial investment) to September 30, 2016. |
Annual Shareholder Report
4. FEDERAL TAX INFORMATION
The tax character of distributions as reported on the Statement of Changes in Net Assets for the years ended September 30, 2016 and 2015 was as follows:
| | 2016 | 2015 |
| Ordinary income1 | $3,097,805 | $22,391,180 |
| Long-term capital gains | $12,846,069 | $52,565,854 |
| 1 | For tax purposes, short-term capital gain distributions are considered ordinary income distributions. |
| | |
As of September 30, 2016, the components of distributable earnings on a tax basis were as follows:
| Undistributed income | $3,105,618 |
| Undistributed long-term capital gains | $2,250,553 |
| Net unrealized appreciation | $79,759,393 |
The difference between book-basis and tax-basis net unrealized appreciation/depreciation is attributable to differing treatments for the deferral of losses on wash sales.
At September 30, 2016, the cost of investments for federal tax purposes was $563,435,587. The net unrealized appreciation of investments for federal tax was $79,759,393. This consists of net unrealized appreciation from investments for those securities having an excess of value over cost of $92,201,795 and net unrealized depreciation from investments for those securities having an excess of cost over value of $12,442,402.
5. INVESTMENT ADVISER FEE AND OTHER TRANSACTIONS WITH AFFILIATES
Investment Adviser Fee
The advisory agreement between the Fund and the Adviser provides for an annual fee equal to 0.90% of the Fund's average daily net assets. Subject to the terms described in the Expense Limitation note, the Adviser may voluntarily choose to waive any portion of its fee. For the year ended September 30, 2016, the Adviser voluntarily waived $457,236 of its fee. In addition, for the year ended September 30, 2016, an affiliate of the Adviser reimbursed $333,610 of transfer agent fees.
Annual Shareholder Report
Administrative Fee
Federated Administrative Services (FAS), under the Administrative Services Agreement, provides the Fund with administrative personnel and services. For purposes of determining the appropriate rate breakpoint, “Investment Complex” is defined as all of the Federated Funds subject to a fee under the Administrative Services Agreement. The fee paid to FAS is based on the average daily net assets of the Investment Complex as specified below, plus certain out-of-pocket expenses:
| Administrative Fee | Average Daily Net Assets
of the Investment Complex |
| 0.150% | on the first $5 billion |
| 0.125% | on the next $5 billion |
| 0.100% | on the next $10 billion |
| 0.075% | on assets in excess of $20 billion |
Subject to the terms described in the Expense Limitation note, FAS may voluntarily choose to waive any portion of its fee. For the year ended September 30, 2016, the annualized fee paid to FAS was 0.078% of average daily net assets of the Fund.
Distribution Services Fee
The Fund has adopted a Distribution Plan (the “Plan”) pursuant to Rule 12b-1 under the Act. Under the terms of the Plan, the Fund will compensate Federated Securities Corp. (FSC), the principal distributor, from the daily net assets of the Fund's Class A Shares, Class C Shares and Class R Shares to finance activities intended to result in the sale of these shares. The Plan provides that the Fund may incur distribution expenses at the following percentages of average daily net assets annually, to compensate FSC:
| Share Class Name | Percentage of Average Daily
Net Assets of Class |
| Class A Shares | 0.05% |
| Class C Shares | 0.75% |
| Class R Shares | 0.50% |
Subject to the terms described in the Expense Limitation note, FSC may voluntarily choose to waive any portion of its fee. For the year ended September 30, 2016, distribution services fees for the Fund were as follows:
| | Distribution
Services Fees
Incurred | Distribution
Services Fees
Waived |
| Class C Shares | $167,813 | $— |
| Class R Shares | $54,262 | $(27,131) |
| TOTAL | $222,075 | $(27,131) |
Annual Shareholder Report
When FSC receives fees, it may pay some or all of them to financial intermediaries whose customers purchase shares. For the year ended September 30, 2016, FSC retained $20,168 of fees paid by the Fund. For the year ended September 30, 2016, the Fund's Class A Shares did not incur a distribution services fee; however, it may begin to incur this fee upon approval of the Trustees.
Sales Charges
Front-end sales charges and contingent deferred sales charges (CDSC) do not represent expenses of the Fund. They are deducted from the proceeds of sales of Fund shares prior to investment or from redemption proceeds prior to remittance, as applicable. For the year ended September 30, 2016, FSC retained $5,790 in sales charges from the sale of Class A Shares. FSC also retained $1,055 of CDSC relating to redemptions of Class A Shares and $3,025 of CDSC relating to redemptions of Class C Shares.
Other Service Fees
For the year ended September 30, 2016, FSSC received $14,025 of the other service fees disclosed in Note 2.
Expense Limitation
The Adviser and certain of its affiliates (which may include FSC, FAS and FSSC) on their own initiative have agreed to waive certain amounts of their respective fees and/or reimburse expense. Total annual fund operating expenses (as shown in the financial highlights, excluding interest expense, extraordinary expenses, line of credit expenses and proxy-related expenses paid by the Fund, if any) paid by the Fund's Class A Shares, Class C Shares, Class R Shares, Institutional Shares and Class R6 Shares (after the voluntary waivers and/or reimbursements) will not exceed 1.26%, 2.01%, 1.40%, 1.01% and 0.94% (the “Fee Limit”), respectively, up to but not including the later of (the “Termination Date”): (a) December 1, 2017; or (b) the date of the Fund's next effective Prospectus. While the Adviser and its applicable affiliates currently do not anticipate terminating or increasing these arrangements prior to the Termination Date, these arrangements may only be terminated or the Fee Limit increased prior to the Termination Date with the agreement of the Trustees.
Interfund Transactions
During the year ended September 30, 2016, the Fund engaged in purchase transactions with funds that have a common investment adviser (or affiliated investment advisers), common Directors/Trustees, and/or common Officers. These purchase transactions complied with Rule 17a-7 under the Act and amounted to $ $3,057,359.
General
Certain Officers and Trustees of the Fund are Officers and Directors or Trustees of certain of the above companies. To efficiently facilitate payment, Directors'/Trustees' fees and certain expenses related to conducting meetings of the Directors/Trustees and other miscellaneous expenses are paid by an affiliate of the Adviser which in due course are reimbursed by the Fund. Such expenses may be included in Accrued and Miscellaneous Expenses on the Statement of Assets and Liabilities and Statement of Operations, respectively.
Annual Shareholder Report
Transactions Involving Affiliated Holdings
Affiliated holdings are investment companies which are managed by the Adviser or an affiliate of the Adviser. The Adviser has agreed to reimburse the Fund for certain investment adviser fees as a result of transactions in other affiliated investment companies. For the year ended September 30, 2016, the Adviser reimbursed $26,866. Transactions involving the affiliated holding during the year ended September 30, 2016, were as follows:
| | Federated Institutional
Prime Value
Obligations Fund,
Institutional Shares |
| Balance of Shares Held 9/30/2015 | 18,212,953 |
| Purchases/Additions | 297,614,985 |
| Sales/Reductions | (292,905,463) |
| Balance of Shares Held 9/30/2016 | 22,922,475 |
| Value | $22,922,475 |
| Dividend Income | $79,108 |
6. Investment TRANSACTIONS
Purchases and sales of investments, excluding long-term U.S. government securities and short-term obligations, for the year ended September 30, 2016, were as follows:
| Purchases | $561,894,549 |
| Sales | $645,176,519 |
7. LINE OF CREDIT
The Fund participates with certain other Federated Funds, on a several basis, in an up to $500,000,000 unsecured, 364-day, committed, revolving line of credit (LOC) agreement. The LOC was made available to finance temporarily the repurchase or redemption of shares of the Fund, failed trades, payment of dividends, settlement of trades and for other short-term, temporary or emergency general business purposes. The Fund cannot borrow under the LOC if an inter-fund loan is outstanding. The Fund's ability to borrow under the LOC also is subject to the limitations of the Act and various conditions precedent that must be satisfied before the Fund can borrow. Loans under the LOC are charged interest at a fluctuating rate per annum equal to the highest, on any day, of (a) (i) the federal funds effective rate, (ii) the one month London Interbank Offer Rate (LIBOR), and (iii) 0.0%, plus (b) a margin. The LOC also requires the Fund to pay, quarterly in arrears and at maturity, its pro rata share of a commitment fee based on the amount of the lenders' commitment that has not been utilized. As of September 30, 2016, the Fund had no outstanding loans. During the year ended September 30, 2016, the Fund did not utilize the LOC.
Annual Shareholder Report
8. INTERFUND LENDING
Pursuant to an Exemptive Order issued by the Securities and Exchange Commission (SEC), the Fund, along with other funds advised by subsidiaries of Federated Investors, Inc., may participate in an interfund lending program. This program provides an alternative credit facility allowing the Fund to borrow from other participating affiliated funds.
As of September 30, 2016, there were no outstanding loans. During the year ended September 30, 2016, the program was not utilized.
9. SPIN-OFF DISTRIBUTION
As presented in the Fund's September 30, 2014 Annual Report, Starwood Property Trust, Inc. (STWD), a REIT owned by the Fund, completed a spinoff of Starwood Waypoint Residential Trust (SWAY). The company's public disclosure related to this spin-off indicated that the taxability of the distribution of SWAY common stock, as well as the remainder of its distributions for its tax year, and the corresponding effect on the investor's tax basis of STWD common stock would not be known until early in 2015. Accordingly, the additional income from the spin-off of $3,312,995, as well as income from STWD's normal quarterly distributions was not distributed by the Fund until December, 2014 when a dividend was required to be paid in order for the Fund to avoid a calendar-year-based excise tax. As this dividend needed to be paid prior to STWD's disclosure of the taxability of its distributions, it was necessary to estimate the taxable portion in calculating the amount that the Fund would pay. In early 2015, STWD disclosed that 70.6% of its distributions were deemed a return of capital (ROC) for tax purposes. Therefore, during the year ended September 30, 2015, the applicable ROC amount was reclassified from dividend income to identified cost for financial statement purposes.
10. REGULATORY MATTERS
On October 13, 2016, the SEC amended existing rules intended to modernize reporting and disclosure of information. These amendments relate to Regulation S-X which sets forth the form and content of financial statements. At this time, management is evaluating the implications of adopting these amendments and their impact on the financial statements and accompanying notes.
11. FEDERAL TAX INFORMATION (UNAUDITED)
For the year ended September 30, 2016, the amount of long-term capital gains designated by the Fund was $12,846,069.
For the fiscal year ended September 30, 2016, 100% of total ordinary income distributions made by the Fund are qualifying dividends which may be subject to a maximum tax rate of 15%, as provided for by the Jobs and Growth Tax Relief Act of 2003. Complete information is reported in conjunction with the reporting of your distributions on Form 1099-DIV.
Of the ordinary income distributions made by the Fund during the year ended September 30, 2016, 100% qualify for the dividend received deduction available to corporate shareholders.
Annual Shareholder Report
Report of Independent Registered Public Accounting Firm
TO THE BOARD OF TRUSTEES OF the federated Equity Funds AND SHAREHOLDERS OF FEDERATED Clover small value fund:
We have audited the accompanying statement of assets and liabilities, including the portfolio of investments, of the Federated Clover Small Value Fund (the “Fund”), a portfolio of Federated Equity Funds as of September 30, 2016, and the related statement of operations for the year then ended, the statements of changes in net assets for each of the years in the two-year period then ended, and the financial highlights for each of the years or periods in the five-year period then ended. These financial statements and financial highlights are the responsibility of the Fund's management. Our responsibility is to express an opinion on these financial statements and financial highlights based on our audits.
We conducted our audits in accordance with the standards of the Public Company Accounting Oversight Board (United States). Those standards require that we plan and perform the audit to obtain reasonable assurance about whether the financial statements and financial highlights are free of material misstatement. An audit includes examining, on a test basis, evidence supporting the amounts and disclosures in the financial statements. Our procedures included confirmation of securities owned as of September 30, 2016, by correspondence with the custodian or brokers or by other appropriate auditing procedures. An audit also includes assessing the accounting principles used and significant estimates made by management, as well as evaluating the overall financial statement presentation. We believe that our audits provide a reasonable basis for our opinion.
In our opinion, the financial statements and financial highlights referred to above present fairly, in all material respects, the financial position of the Federated Clover Small Value Fund as of September 30, 2016, and the results of its operations for the year then ended, the changes in its net assets for each of the years in the two-year period then ended, and the financial highlights for each of the years or period in the five-year period then ended, in conformity with U.S. generally accepted accounting principles.
Boston, Massachusetts
November 22, 2016
Annual Shareholder Report
Shareholder Expense Example (unaudited)
As a shareholder of the Fund, you incur two types of costs: (1) transaction costs, including sales charges (loads) on purchase or redemption payments; and (2) ongoing costs, including management fees and to the extent applicable, distribution (12b-1) fees and/or other service fees and other Fund expenses. This Example is intended to help you to understand your ongoing costs (in dollars) of investing in the Fund and to compare these costs with the ongoing costs of investing in other mutual funds. It is based on an investment of $1,000 invested at the beginning of the period and held for the entire period from April 1, 2016 to September 30, 2016.
ACTUAL EXPENSES
The first section of the table below provides information about actual account values and actual expenses. You may use the information in this section, together with the amount you invested, to estimate the expenses that you incurred over the period. Simply divide your account value by $1,000 (for example, an $8,600 account value divided by $1,000 = 8.6), then multiply the result by the number in the first section under the heading entitled “Expenses Paid During Period” to estimate the expenses attributable to your investment during this period.
HYPOTHETICAL EXAMPLE FOR COMPARISON PURPOSES
The second section of the table below provides information about hypothetical account values and hypothetical expenses based on the Fund's actual expense ratio and an assumed rate of return of 5% per year before expenses, which is not the Fund's actual return. Thus, you should not use the hypothetical account values and expenses to estimate the actual ending account balance or your expenses for the period. Rather, these figures are required to be provided to enable you to compare the ongoing costs of investing in the Fund with other funds. To do so, compare this 5% hypothetical example with the 5% hypothetical examples that appear in the shareholder reports of the other funds.
Annual Shareholder Report
Please note that the expenses shown in the table are meant to highlight your ongoing costs only and do not reflect any transaction costs, such as sales charges (loads) on purchase or redemption payments. Therefore, the second section of the table is useful in comparing ongoing costs only, and will not help you determine the relative total costs of owning different funds. In addition, if these transaction costs were included, your costs would have been higher.
| | Beginning
Account Value
4/1/2016 | Ending
Account Value
9/30/2016 | Expenses Paid
During Period1 |
| Actual: | | | |
| Class A Shares | $1,000 | $1,106.10 | $6.63 |
| Class C Shares | $1,000 | $1,102.20 | $10.56 |
| Class R Shares | $1,000 | $1,106.50 | $6.742 |
| Institutional Shares | $1,000 | $1,107.50 | $5.32 |
| Class R6 Shares | $1,000 | $1,107.00 | $4.95 |
Hypothetical (assuming a 5% return
before expenses): | | | |
| Class A Shares | $1,000 | $1,018.70 | $6.36 |
| Class C Shares | $1,000 | $1,014.95 | $10.13 |
| Class R Shares | $1,000 | $1,018.60 | $6.462 |
| Institutional Shares | $1,000 | $1,019.95 | $5.10 |
| Class R6 Shares | $1,000 | $1,020.30 | $4.75 |
| 1 | Expenses are equal to the Fund's annualized net expense ratios, multiplied by the average account value over the period, multiplied by 183/366 (to reflect the one-half-year period). The annualized net expense ratios are as follows: |
| | |
| Class A Shares | 1.26% |
| Class C Shares | 2.01% |
| Class R Shares | 1.28% |
| Institutional Shares | 1.01% |
| Class R6 Shares | 0.94% |
| 2 | Actual and Hypothetical expenses paid during the period utilizing the Fund's Class R Shares current Fee Limit of 1.51% (as reflected in the Notes to Financial Statements, Note 5 under Expense Limitation), multiplied by the average account value over the period, multiplied by 183/366 (to reflect expenses paid as if they had been in effect throughout the most recent one-half-year period) would be $7.95 and $7.62, respectively. |
Annual Shareholder Report
Board of Trustees and Trust Officers
The Board of Trustees is responsible for managing the Trust's business affairs and for exercising all the Trust's powers except those reserved for the shareholders. The following tables give information about each Trustee and the senior officers of the Fund. Where required, the tables separately list Trustees who are “interested persons” of the Fund (i.e., “Interested” Trustees) and those who are not (i.e., “Independent” Trustees). Unless otherwise noted, the address of each person listed is Federated Investors Tower, 1001 Liberty Avenue, Pittsburgh, PA 15222. The address of all Independent Trustees listed is 4000 Ericsson Drive, Warrendale, PA 15086-7561; Attention: Mutual Fund Board. As of December 31, 2015, the Trust comprised 14 portfolio(s), and the Federated Fund Family consisted of 38 investment companies (comprising 122 portfolios). Unless otherwise noted, each Officer is elected annually. Unless otherwise noted, each Trustee oversees all portfolios in the Federated Fund Family and serves for an indefinite term. The Fund's Statement of Additional Information includes additional information about Trust Trustees and is available, without charge and upon request, by calling 1-800-341-7400.
Interested TRUSTEES Background
Name
Birth Date
Positions Held with Trust
Date Service Began | Principal Occupation(s) for Past Five Years,
Other Directorships Held and Previous Position(s) |
J. Christopher Donahue*
Birth Date: April 11, 1949
President and Trustee
Indefinite Term
Began serving: September 1999 | Principal Occupations: Principal Executive Officer and President of certain of the Funds in the Federated Fund Family; Director or Trustee of the Funds in the Federated Fund Family; President, Chief Executive Officer and Director, Federated Investors, Inc.; Chairman and Trustee, Federated Investment Management Company; Trustee, Federated Investment Counseling; Chairman and Director, Federated Global Investment Management Corp.; Chairman, Federated Equity Management Company of Pennsylvania and Passport Research, Ltd. (investment advisory subsidiary of Federated); Trustee, Federated Shareholder Services Company; Director, Federated Services Company.
Previous Positions: President, Federated Investment Counseling; President and Chief Executive Officer, Federated Investment Management Company, Federated Global Investment Management Corp. and Passport Research, Ltd. |
Annual Shareholder Report
Name
Birth Date
Positions Held with Trust
Date Service Began | Principal Occupation(s) for Past Five Years,
Other Directorships Held and Previous Position(s) |
John B. Fisher*
Birth Date: May 16, 1956
Trustee
Indefinite Term
Began serving: May 2016 | Principal Occupations: Principal Executive Officer and President of certain of the Funds in the Federated Fund Family; Director or Trustee of certain of the Funds in the Federated Fund Family; Vice President, Federated Investors, Inc.; President, Director/Trustee and CEO, Federated Advisory Services Company, Federated Equity Management Company of Pennsylvania, Federated Global Investment Management Corp., Federated Investment Counseling, Federated Investment Management Company; President and CEO of Passport Research, Ltd.; President of some of the Funds in the Federated Fund Complex and Director, Federated Investors Trust Company.
Previous Positions: President and Director of the Institutional Sales Division of Federated Securities Corp.; President and Director of Federated Investment Counseling; Director, Edgewood Securities Corp.; Director, Federated Services Company; Director, Federated Investors, Inc.; Chairman and Director, Southpointe Distribution Services, Inc. and President, Technology, Federated Services Company. |
| * | Reasons for “interested” status: J. Christopher Donahue and John B. Fisher are interested due to their beneficial ownership of shares of Federated Investors, Inc. and due to positions they hold with Federated and its subsidiaries. J. Christopher Donahue is the son of John F. Donahue, Chairman Emeritus of the Federated Funds. |
INDEPENDENT TRUSTEES Background
Name
Birth Date
Positions Held with Trust
Date Service Began | Principal Occupation(s) for Past Five Years,
Other Directorships Held, Previous Position(s) and Qualifications |
John T. Collins
Birth Date: January 24, 1947
Trustee
Indefinite Term
Began serving: October 2013 | Principal Occupations: Director or Trustee of the Federated Fund Family; Retired.
Other Directorships Held: Director, Chair of the Compensation Committee, Audit Committee member, KLX Corp.
Qualifications: Mr. Collins has served in several business and financial management roles and directorship positions throughout his career. Mr. Collins previously served as Chairman and CEO, The Collins Group, Inc. (a private equity firm). Mr. Collins serves as Chairman Emeriti, Bentley University. Mr. Collins previously served as Director, FleetBoston Financial Corp.; Director and Audit Committee Member, Bank of America Corp. and Director, Beth Israel Deaconess Medical Center (Harvard University Affiliate Hospital). |
Annual Shareholder Report
Name
Birth Date
Positions Held with Trust
Date Service Began | Principal Occupation(s) for Past Five Years,
Other Directorships Held, Previous Position(s) and Qualifications |
G. Thomas Hough
Birth Date: February 28, 1955
Trustee
Indefinite Term
Began serving: August 2015 | Principal Occupations: Director or Trustee of the Federated Fund Family; Retired.
Other Directorships Held: Director, Chair of the Audit Committee, Governance Committee, Publix Super Markets, Inc.; Director, Equifax, Inc.
Qualifications: Mr. Hough has served in accounting, business management and directorship positions throughout his career. Mr. Hough most recently held the position of Americas Vice Chair of Assurance with Ernst & Young LLP. Mr. Hough is an Executive Committee member of the United States Golf Association, he serves on the President's Cabinet and Business School Board of Visitors for the University of Alabama and is on the Business School Board of Visitors for Wake Forest University. |
Maureen Lally-Green
Birth Date: July 5, 1949
Trustee
Indefinite Term
Began serving: August 2009 | Principal Occupations: Director or Trustee of the Federated Fund Family; Interim Dean of the Duquesne University School of Law; Adjunct Professor of Law, Duquesne University School of Law.
Other Directorships Held: Director, CONSOL Energy Inc.
Qualifications: Judge Lally-Green has served in various legal and business roles and directorship positions throughout her career. Judge Lally-Green previously served as: Associate General Secretary, Diocese of Pittsburgh; a member of the Superior Court of Pennsylvania; and as a Professor of Law, Duquesne University School of Law. Judge Lally-Green also holds the positions on either a public or not for profit Board of Directors as follows: Member, Pennsylvania State Board of Education (public); Director and Chair, UPMC Mercy Hospital; Regent, St. Vincent Seminary; Director and Vice Chair, Our Campaign for the Church Alive!, Inc.; Director, Saint Vincent College; and Director and Chair, Cardinal Wuerl North Catholic High School, Inc. Judge Lally-Green has held the positions of: Director, Auberle; Director, Ireland Institute of Pittsburgh; Director, Saint Thomas More Society; and Director, Catholic High Schools of the Diocese of Pittsburgh, Inc. |
Peter E. Madden
Birth Date: March 16, 1942
Trustee
Indefinite Term
Began serving: November 1991 | Principal Occupation: Director or Trustee, and Chair of the Board of Directors or Trustees, of the Federated Fund Family; Retired.
Other Directorships Held: None.
Qualifications: Mr. Madden has served in several business management, mutual fund services and directorship positions throughout his career. Mr. Madden previously served as President, Chief Operating Officer and Director, State Street Bank and Trust Company (custodian bank) and State Street Corporation (financial services). He was Director, VISA USA and VISA International and Chairman and Director, Massachusetts Bankers Association. Mr. Madden served as Director, Depository Trust Corporation and Director, The Boston Stock Exchange. Mr. Madden also served as a Representative to the Commonwealth of Massachusetts General Court. |
Annual Shareholder Report
Name
Birth Date
Positions Held with Trust
Date Service Began | Principal Occupation(s) for Past Five Years,
Other Directorships Held, Previous Position(s) and Qualifications |
Charles F. Mansfield, Jr.
Birth Date: April 10, 1945
Trustee
Indefinite Term
Began serving: January 1999 | Principal Occupations: Director or Trustee of the Federated Fund Family; Management Consultant.
Other Directorships Held: None.
Qualifications: Mr. Mansfield has served in several banking, business management and educational roles and directorship positions throughout his career. Mr. Mansfield previously served as Chief Executive Officer, PBTC International Bank; Partner, Arthur Young & Company (now Ernst & Young LLP); Chief Financial Officer of Retail Banking Sector, Chase Manhattan Bank; Senior Vice President, HSBC Bank USA (formerly, Marine Midland Bank); Vice President, Citibank; Assistant Professor of Banking and Finance, Frank G. Zarb School of Business, Hofstra University; Executive Vice President DVC Group, Inc. (marketing, communications and technology). |
Thomas M. O'Neill
Birth Date: June 14, 1951
Trustee
Indefinite Term
Began serving: August 2006 | Principal Occupations: Director or Trustee, Chair of the Audit Committee of the Federated Fund Family; Sole Proprietor, Navigator Management Company (investment and strategic consulting).
Other Directorships Held: None.
Qualifications: Mr. O'Neill has served in several business, mutual fund and financial management roles and directorship positions throughout his career. Mr. O'Neill serves as Director, Medicines for Humanity and Director, The Golisano Children's Museum of Naples, Florida. Mr. O'Neill previously served as Chief Executive Officer and President, Managing Director and Chief Investment Officer, Fleet Investment Advisors; President and Chief Executive Officer, Aeltus Investment Management, Inc.; General Partner, Hellman, Jordan Management Co., Boston, MA; Chief Investment Officer, The Putnam Companies, Boston, MA; Credit Analyst and Lending Officer, Fleet Bank; Director and Consultant, EZE Castle Software (investment order management software); and Director, Midway Pacific (lumber). |
P. Jerome Richey
Birth Date: February 23, 1949
Trustee
Indefinite Term
Began serving: October 2013 | Principal Occupations: Director or Trustee of the Federated Fund Family; Management Consultant.
Other Directorships Held: None.
Qualifications: Mr. Richey has served in several business and legal management roles and directorship positions throughout his career. Mr. Richey most recently held the positions of Senior Vice Chancellor and Chief Legal Officer, University of Pittsburgh. Mr. Richey serves as Board Member, Epilepsy Foundation of Western Pennsylvania and Board member, World Affairs Council of Pittsburgh. Mr. Richey previously served as Chief Legal Officer and Executive Vice President, CONSOL Energy Inc. and Shareholder, Buchanan Ingersoll & Rooney PC (a law firm). |
Annual Shareholder Report
Name
Birth Date
Positions Held with Trust
Date Service Began | Principal Occupation(s) for Past Five Years,
Other Directorships Held, Previous Position(s) and Qualifications |
John S. Walsh
Birth Date: November 28, 1957
Trustee
Indefinite Term
Began serving: January 1999 | Principal Occupations: Director or Trustee of the Federated Fund Family; President and Director, Heat Wagon, Inc. (manufacturer of construction temporary heaters); President and Director, Manufacturers Products, Inc. (distributor of portable construction heaters); President, Portable Heater Parts, a division of Manufacturers Products, Inc.
Other Directorships Held: None.
Qualifications: Mr. Walsh has served in several business management roles and directorship positions throughout his career. Mr. Walsh previously served as Vice President, Walsh & Kelly, Inc. (paving contractors). |
OFFICERS
Name
Birth Date
Address
Positions Held with Trust
Date Service Began | Principal Occupation(s) for Past Five Years
and Previous Position(s) |
John W. McGonigle
Birth Date: October 26, 1938
EXECUTIVE VICE PRESIDENT AND SECRETARY
Officer since: April 1984 | Principal Occupations: Executive Vice President and Secretary of the Federated Fund Family; Vice Chairman, Executive Vice President, Secretary and Director, Federated Investors, Inc.
Previous Positions: Trustee, Federated Investment Management Company and Federated Investment Counseling; Director, Federated Global Investment Management Corp., Federated Services Company and Federated Securities Corp. |
Lori A. Hensler
Birth Date: January 6, 1967
TREASURER
Officer since: April 2013 | Principal Occupations: Principal Financial Officer and Treasurer of the Federated Fund Family; Senior Vice President, Federated Administrative Services; Financial and Operations Principal for Federated Securities Corp. and Edgewood Services, Inc.; and Assistant Treasurer, Federated Investors Trust Company. Ms. Hensler has received the Certified Public Accountant designation.
Previous Positions: Controller of Federated Investors, Inc.; Senior Vice President and Assistant Treasurer, Federated Investors Management Company; Treasurer, Federated Investors Trust Company; Assistant Treasurer, Federated Administrative Services, Federated Administrative Services, Inc., Federated Securities Corp., Edgewood Services, Inc., Federated Advisory Services Company, Federated Equity Management Company of Pennsylvania, Federated Global Investment Management Corp., Federated Investment Counseling, Federated Investment Management Company, Passport Research, Ltd., and Federated MDTA, LLC; Financial and Operations Principal for Federated Securities Corp., Edgewood Services, Inc. and Southpointe Distribution Services, Inc. |
Annual Shareholder Report
Name
Birth Date
Address
Positions Held with Trust
Date Service Began | Principal Occupation(s) for Past Five Years
and Previous Position(s) |
Peter J. Germain
Birth Date: September 3, 1959
CHIEF LEGAL OFFICER
Officer since: January 2005 | Principal Occupations: Mr. Germain is Chief Legal Officer of the Federated Fund Family. He is General Counsel and Vice President, Federated Investors, Inc.; President, Federated Administrative Services and Federated Administrative Services, Inc.; Vice President, Federated Securities Corp.; Secretary, Federated Private Asset Management, Inc.; and Secretary, Retirement Plan Service Company of America. Mr. Germain joined Federated in 1984 and is a member of the Pennsylvania Bar Association.
Previous Positions: Deputy General Counsel, Special Counsel, Managing Director of Mutual Fund Services, Federated Investors, Inc.; Senior Vice President, Federated Services Company; and Senior Corporate Counsel, Federated Investors, Inc. |
Stephen Van Meter
Birth Date: June 5, 1975
CHIEF COMPLIANCE OFFICER AND SENIOR VICE PRESIDENT
Officer since: July 2015 | Principal Occupations: Senior Vice President and Chief Compliance Officer of the Federated Fund Family; Vice President and Chief Compliance Officer of Federated Investors, Inc. and Chief Compliance Officer of certain of its subsidiaries. Mr. Van Meter joined Federated in October 2011. He holds FINRA licenses under Series 3, 7, 24 and 66.
Previous Positions: Mr. Van Meter previously held the position of Compliance Operating Officer, Federated Investors, Inc. Prior to joining Federated, Mr. Van Meter served at the United States Securities and Exchange Commission in the positions of Senior Counsel, Office of Chief Counsel, Division of Investment Management and Senior Counsel, Division of Enforcement. |
Stephen F. Auth
Birth Date: September 13, 1956
101 Park Avenue
41st Floor
New York, NY 10178
CHIEF INVESTMENT OFFICER
Officer since: November 2002 | Principal Occupations: Stephen F. Auth is Chief Investment Officer of various Funds in the Federated Fund Family; Executive Vice President, Federated Investment Counseling, Federated Global Investment Management Corp. and Federated Equity Management Company of Pennsylvania.
Previous Positions: Executive Vice President, Federated Investment Management Company and Passport Research, Ltd. (investment advisory subsidiary of Federated); Senior Vice President, Global Portfolio Management Services Division; Senior Vice President, Federated Investment Management Company and Passport Research, Ltd.; Senior Managing Director and Portfolio Manager, Prudential Investments. |
Richard B. Fisher
Birth Date: May 17, 1923
VICE PRESIDENT
Officer since: April 1987 | Principal Occupations: Vice Chairman or Vice President of some of the Funds in the Federated Fund Family; Vice Chairman, Federated Investors, Inc.; Chairman, Federated Securities Corp.
Previous Positions: President and Director or Trustee of some of the Funds in the Federated Fund Family; Executive Vice President, Federated Investors, Inc.; Director and Chief Executive Officer, Federated Securities Corp. |
Annual Shareholder Report
Evaluation and Approval of Advisory Contract–May 2016
Federated Clover Small Value Fund (the “Fund”)
Following a review and recommendation of approval by the Fund's independent trustees, the Fund's Board of Trustees (the “Board”) reviewed and unanimously approved at its May 2016 meetings the continuation of the Fund's investment advisory contract for an additional one-year term. The Board's decision regarding the contract reflects the exercise of its business judgment after consideration of all of the information received on whether to continue the existing arrangements.
The Board had previously appointed a Senior Officer, whose duties include specified responsibilities relating to the process by which advisory fees are to be charged to a Federated fund. The Senior Officer has the authority to retain consultants, experts, or staff as may be reasonably necessary to assist in the performance of his duties, reports directly to the Board, and may be terminated only with the approval of a majority of the independent members of the Board. The Senior Officer prepared and furnished to the Board an independent, written evaluation that covered topics discussed below (the “Senior Officer's Evaluation”). The Board considered the Senior Officer's Evaluation, along with other information, in deciding to approve the investment advisory contract.
The Board is also familiar with and considered judicial decisions concerning allegedly excessive investment advisory fees, which have indicated that the following factors may be relevant to an adviser's fiduciary duty with respect to its receipt of compensation from a fund: the nature and quality of the services provided by an adviser to a fund and its shareholders, including the performance and fees and expenses of the fund and of comparable funds; an adviser's cost of providing the services, including the profitability to an adviser of providing advisory services to a fund; the extent to which an adviser may realize “economies of scale” as a fund grows larger and, if such economies of scale exist, whether they have been shared with a fund and its shareholders or the family of funds; any “fall-out financial benefits” that accrue to an adviser because of its relationship with a fund (including research services received from brokers that execute fund trades and any fees paid to affiliates of an adviser for services rendered to a fund); comparative fee and expense structures, including a comparison of fees paid to an adviser with those paid by similar funds; and the extent of care, conscientiousness and independence with which board members perform their duties and their expertise, including whether they are fully informed about all facts the board deems relevant to its consideration of an adviser's services and fees. The Board noted that the Securities and Exchange Commission (“SEC”) disclosure requirements regarding the basis for the Board's approval of the Fund's investment advisory contract generally track the factors listed above. Consistent with these judicial decisions and SEC disclosure requirements, the Board also considered management fees charged to
Annual Shareholder Report
institutional and other clients of Federated Global Investment Management Corp. (the “Adviser”) for what might be viewed as like services. The Board was aware of these factors and was guided by them in its review of the Fund's investment advisory contract to the extent it considered them to be appropriate and relevant, as discussed further below.
The Board considered and weighed these circumstances in light of its substantial accumulated experience in governing the Fund and working with Federated Investors, Inc. and its affiliates (“Federated”) on matters relating to the Federated funds, and was assisted in its deliberations by independent legal counsel. Throughout the year, and in connection with its May meetings, the Board requested and received substantial and detailed information about the Fund and the Federated organization that was in addition to the extensive materials that comprise and accompany the Senior Officer's Evaluation. Federated provided much of this information at each regular meeting of the Board, and furnished additional substantial information in connection with the May meetings at which the Board's formal review of the investment advisory contract occurred. At the May meetings in addition to meeting in separate sessions of the independent trustees without management present, senior management of the Adviser also met with the independent trustees and their counsel to discuss the materials presented and any other matters thought relevant by the Adviser or the trustees. Between regularly scheduled meetings, the Board also received information on particular matters as the need arose. Thus, the Board's consideration of the investment advisory contract included review of the Senior Officer's Evaluation, accompanying data and additional information covering such matters as: the Adviser's investment philosophy, revenue, profitability, personnel and processes; investment and operating strategies; the Fund's short- and long-term performance (in absolute terms, both on a gross basis and net of expenses, as well as in relationship to its particular investment program and certain competitor or “peer group” funds and/or other benchmarks, as appropriate), and comments on the reasons for performance; the Fund's investment objectives; the Fund's expenses (including the advisory fee itself and the overall expense structure of the Fund, both in absolute terms and relative to similar and/or competing funds, with due regard for contractual or voluntary expense limitations); the use and allocation of brokerage commissions derived from trading the Fund's portfolio securities (if any); and the nature, quality and extent of the advisory and other services provided to the Fund by the Adviser and its affiliates. The Board also considered the preferences and expectations of Fund shareholders; the entrepreneurial risk assumed by the Adviser in sponsoring the Fund; the continuing state of competition in the mutual fund industry and market practices; the range of comparable fees for similar funds in the mutual fund industry; the Fund's relationship to the Federated funds which include a comprehensive array of funds with different investment objectives, policies and strategies which are generally available for exchange without the incurrence of additional sales charges; compliance and
Annual Shareholder Report
audit reports concerning the Federated funds and the Federated companies that service them (including communications from regulatory agencies), as well as Federated's responses to any issues raised therein; and relevant developments in the mutual fund industry and how the Federated funds and/or Federated are responding to them. The Board's evaluation process is evolutionary. The criteria considered and the emphasis placed on relevant criteria change in recognition of changing circumstances in the mutual fund marketplace.
While mindful that courts have cautioned against giving such comparisons too much weight, the Board has found the use of comparisons of the Fund's fees and expenses to other mutual funds with comparable investment programs to be relevant to its deliberations. In this regard, the Board was presented with, and considered, information regarding the contractual advisory fee rates, net advisory fee rates, total expense ratios and each element of the Fund's total expense ratio (i.e., gross and net advisory fees, custody fees, portfolio accounting fees and transfer agency fees) relative to the Fund's peers. The Board focused on comparisons with other similar mutual funds more heavily than non-mutual fund products or services because it is believed that they are more relevant. For example, other mutual funds are the products most like the Fund, they are readily available to Fund shareholders as alternative investment vehicles, and they are the type of investment vehicle in fact chosen and maintained by the Fund's investors. The range of their fees and expenses therefore appears to be a relevant indicator of what consumers have found to be reasonable in the precise marketplace in which the Fund competes.
The Board reviewed the contractual advisory fee rate, net advisory fee rate where partially waived and other expenses of the Fund and noted the position of the Fund's fee rates relative to its peers. In this regard, the Board noted that the contractual advisory fee rate was above the median of the relevant peer group, but the Board noted the applicable waivers and reimbursements, and that the overall expense structure of the Fund remained competitive in the context of other factors considered by the Board.
By contrast, the Senior Officer has reviewed Federated's fees for providing advisory services to products outside the Federated funds (e.g., institutional and separate accounts and sub-adviser services). He concluded that mutual funds and institutional accounts are inherently different products. Those differences include, but are not limited to, different types of targeted investors; being subject to different laws and regulations; different legal structures; different average account sizes and portfolio management techniques made necessary by different cash flows and different associated costs; and the time spent by portfolio managers and their teams, funds financial services, legal, compliance and risk management in reviewing securities pricing, addressing different administrative responsibilities, addressing different degrees of risk associated with management and a variety of different costs. The Senior Officer did not consider the fees for providing advisory services to these outside products to be determinative in judging the appropriateness of mutual fund advisory fees.
Annual Shareholder Report
The Senior Officer noted that the services, administrative responsibilities and risks associated with such relationships are quite different than serving as a primary adviser to a fund.
Following such evaluation, the Board concluded, within the context of its full deliberations, that the expenses of the Fund are reasonable and supported renewal of the investment advisory contract with respect to the Fund.
The Board considered the nature, extent and quality of the services provided to the Fund by the Adviser and the resources of the Adviser and its affiliates dedicated to the Fund. In this regard, the Board evaluated, among other things, the Adviser's personnel, experience, track record, overall reputation and willingness to invest in personnel and infrastructure that benefit the Fund. In addition, the Board reviewed the qualifications, backgrounds and responsibilities of the portfolio management team primarily responsible for the day-to-day management of the Fund. The Board noted the compliance programs of and the compliance-related resources provided to the Fund by the Adviser. The Fund's ability to deliver competitive performance when compared to its peer group was also deemed to be relevant by the Board as a useful indicator of how the Adviser is executing the Fund's investment program, which in turn was one of the Board's considerations in reaching a conclusion that the nature, extent, and quality of the Adviser's investment management services were such as to warrant continuation of the investment advisory contract.
In evaluating the Fund's investment performance, the Board considered performance results in light of the Fund's investment objective, strategies and risks, as disclosed in the Fund's prospectus. The Board particularly considered detailed investment reports on the Fund's performance provided to the Board throughout the year and in connection with the May meetings. The Senior Officer also reviewed information compiled by Federated, using data supplied by independent fund ranking organizations, regarding the performance of, and fees charged by, other mutual funds, noting his view that comparisons to fund peer groups may be helpful, though not conclusive, in judging the reasonableness of the proposed fees. The Board considered, in evaluating such comparisons, that in some cases individual funds may exhibit significant and unique differences in their objectives and management techniques when compared to other funds within an industry peer group.
The Fund's performance fell below the median of the relevant peer group for the one-year, three-year and five-year periods covered by the Senior Officer's Evaluation. The Board discussed the Fund's performance with the Adviser and recognized the efforts being taken by the Adviser in the context of the other factors considered relevant by the Board.
Following such evaluation, the Board concluded, within the context of its full deliberations, that the performance of the Fund supported renewal of the investment advisory contract with respect to the Fund.
Annual Shareholder Report
The Board also received financial information about Federated, including information regarding the compensation and ancillary (or “fall-out”) benefits Federated derived from its relationships with the Federated funds. This information covered not only the fees under the investment advisory contracts, but also fees received by Federated's subsidiaries for providing other services to the Federated funds under separate contracts (e.g., for serving as the Federated funds' administrator). The information also detailed any indirect benefit Federated may derive from its receipt of research services from brokers who execute Federated fund trades. In addition, the Board considered the fact that, in order for a fund to be competitive in the marketplace, Federated and its affiliates frequently waived fees and/or reimbursed expenses and have disclosed to fund investors and/or indicated to the Board their intention to do so in the future, where appropriate. Moreover, the Board receives regular reporting as to the institution, adjustment or elimination of these voluntary waivers. The Board considered Federated's previous reductions in contractual management fees to certain funds in response to the Senior Officer's recommendations.
Federated furnished information, requested by the Senior Officer, that reported revenues on a fund-by-fund basis and made estimates of the allocation of expenses on a fund-by-fund basis, using allocation methodologies specified by the Senior Officer. The Senior Officer noted that, while these cost allocation reports apply consistent allocation processes, the inherent difficulties in allocating costs continues to cause the Senior Officer to question the precision of the process and to conclude that such reports may be unreliable, since a single change in an allocation estimate may dramatically alter the resulting estimate of cost and/or profitability of a fund and may produce unintended consequences. The allocation information, including the Senior Officer's view that fund-by-fund estimations may be unreliable, was considered in the analysis by the Board.
The Board and the Senior Officer also reviewed information compiled by Federated comparing profitability information for Federated to other publicly held fund management companies. In this regard, the Senior Officer concluded that Federated's profit margins did not appear to be excessive. The Senior Officer also noted that Federated appeared financially sound, with the resources to fulfill its obligations under its contracts with the Fund.
The Senior Officer's Evaluation also discussed the notion of possible realization of “economies of scale” as a fund grows larger. The Board considered in this regard that the Adviser has made significant and long-term investments in areas that support all of the Federated funds, such as personnel and processes for the portfolio management, shareholder services, compliance, internal audit, and risk management functions, as well as systems technology (including technology relating to cybersecurity), and that the benefits of these efforts (as well as any economies of scale, should they exist) were likely to be enjoyed by the fund family as a whole. The Board noted that the Adviser's investments in these areas are extensive. In addition, the Board considered that Federated and its affiliates have frequently waived fees and/or reimbursed expenses and that this has
Annual Shareholder Report
allowed fund shareholders to share potential economies of scale from a fund's inception. Federated, as it does throughout the year, and again in connection with the Board's review, furnished information relative to revenue sharing or adviser paid fees. Federated and the Senior Officer noted that this information should be viewed to determine if there was an incentive to either not apply breakpoints or to apply breakpoints at higher levels and should not be viewed to determine the appropriateness of advisory fees, because it would represent marketing and distribution expenses. Finally, the Board also noted the absence of any applicable regulatory or industry guidelines on this subject, which (as discussed in the Senior Officer's Evaluation) is compounded by the lack of any common industry practice or general pattern with respect to structuring fund advisory fees with “breakpoints” that serve to reduce the fee as a fund attains a certain size.
The Senior Officer noted that, subject to the comments and recommendations made within the Senior Officer's Evaluation, his observations and the information accompanying the Senior Officer's Evaluation supported a finding by the Board that the management fee for the fund was reasonable. Under these circumstances, no changes were recommended to, and no objection was raised to, the continuation of the Fund's investment advisory contract.
In its decision to continue an existing investment advisory contract, the Board was mindful of the potential disruptions of the Fund's operations and various risks, uncertainties and other effects that could occur as a result of a decision to terminate or not renew an investment advisory contract. In particular, the Board recognized that many shareholders have invested in the Fund on the strength of the Adviser's industry standing and reputation and with the expectation that the Adviser will have a continuing role in providing advisory services to the Fund. Thus, the Board's approval of the investment advisory contract reflected the fact that it is the shareholders who have effectively selected the Adviser by virtue of having invested in the Fund. The Board concluded that, in light of the factors discussed above, including the nature, quality and scope of the services provided to the Fund by the Adviser and its affiliates, continuation of the investment advisory contract was appropriate.
The Board based its decision to approve the investment advisory contract on the totality of the circumstances and relevant factors and with a view to past and future long-term considerations. Not all of the factors and considerations identified above were necessarily relevant to the Fund, nor did the Board consider any one of them to be determinative. With respect to the factors that were relevant, the Board's decision to approve the continuation of the contract reflects its determination that Federated's performance and actions provided a satisfactory basis to support the decision to continue the existing arrangement.
Annual Shareholder Report
Voting Proxies on Fund Portfolio Securities
A description of the policies and procedures that the Fund uses to determine how to vote proxies, if any, relating to securities held in the Fund's portfolio is available, without charge and upon request, by calling 1-800-341-7400. A report on “Form N-PX” of how the Fund voted any such proxies during the most recent 12-month period ended June 30 is available via the Proxy Voting Record (Form N-PX) link associated with the Fund and share class name at www.FederatedInvestors.com/FundInformation. Form N-PX filings are also available at the SEC's website at www.sec.gov.
Quarterly Portfolio Schedule
The Fund files with the SEC a complete schedule of its portfolio holdings, as of the close of the first and third quarters of its fiscal year, on “Form N-Q.” These filings are available on the SEC's website at www.sec.gov and may be reviewed and copied at the SEC's Public Reference Room in Washington, DC. (Call 1-800-SEC-0330 for information on the operation of the Public Reference Room.) You may also access this information via the link to the Fund and share class name at www.FederatedInvestors.com/FundInformation.
Annual Shareholder Report
Mutual funds are not bank deposits or obligations, are not guaranteed by any bank and are not insured or guaranteed by the U.S. government, the Federal Deposit Insurance Corporation, the Federal Reserve Board or any other government agency. Investment in mutual funds involves investment risk, including the possible loss of principal.
This Report is authorized for distribution to prospective investors only when preceded or accompanied by the Fund's Prospectus, which contains facts concerning its objective and policies, management fees, expenses and other information.
Federated Clover Small Value Fund
Federated Investors Funds
4000 Ericsson Drive
Warrendale, PA 15086-7561
Contact us at FederatedInvestors.com
or call 1-800-341-7400.
Federated Securities Corp., Distributor
CUSIP 314172289
CUSIP 314172271
CUSIP 314172172
CUSIP 314172263
CUSIP 31421N808
41198 (11/16)
Federated is a registered trademark of Federated Investors, Inc.
2016 ©Federated Investors, Inc.
Annual Shareholder Report
September 30, 2016
| Share Class | Ticker |
| A | VFCAX |
| B | VFCBX |
| C | VFCCX |
| R | VFCKX |
| Institutional | VFCIX |
Federated Clover Value Fund
Successor to the Touchstone Value Opportunities Fund Established 1991
A Portfolio of Federated Equity Funds
Dear Valued Shareholder,
I am pleased to present the Annual Shareholder Report for your fund covering the period from October 1, 2015 through September 30, 2016. This report includes Management's Discussion of Fund Performance, a complete listing of your fund's holdings, performance information and financial statements along with other important fund information.
In addition, our website, FederatedInvestors.com, offers easy access to Federated resources that include timely fund updates, economic and market insights from our investment strategists, and financial planning tools. We invite you to register to take full advantage of its capabilities.
Thank you for investing with Federated. I hope you find this information useful and look forward to keeping you informed.
Sincerely,
J. Christopher Donahue, President
Not FDIC Insured • May Lose Value • No Bank Guarantee
Management's Discussion of Fund Performance (unaudited)
The total return of Federated Clover Value Fund (the “Fund”), based on net asset value for the 12-month reporting period ended September 30, 2016, was 6.96% for Class A Shares, 6.16% for Class B Shares, 6.17% for Class C Shares, 6.73% for Class R Shares and 7.22% for Institutional Shares. The Russell 1000® Value Index (R1000V),1 a broad-based securities market index, returned 16.20% during the same period. The total return for the Morningstar Large Value Funds Average (MLVFA),2 a peer group average for the Fund, was 13.08% during the same period. The Fund's and the MLVFA's total return for the most recent fiscal year reflected actual cash flows, transaction costs and other expenses which were not reflected in the total return of the R1000V.
The Fund's investment strategy seeks to achieve capital appreciation through careful analysis and selection of individual stocks. For the reporting period, stock selection was the most significant factor affecting the Fund's performance relative to the R1000V.
The following discussion will focus on the performance of the Fund's Institutional Shares.
MARKET OVERVIEW
While stock prices generally trended higher during the period, the year was characterized by several sharp declines which interrupted this trend, most notably during the first six weeks of 2016, and then again after the United Kingdom's historic vote in June to exit the European Union (“Brexit”). Both times, the dramatic sell-off was followed by an equally impressive rally to bring the market averages back into positive territory. Global headlines continued to contribute to the volatility. Whether it was the political tensions in Europe, ongoing terrorist attacks around the globe, record-low (and in some cases, negative) interest rates being set by the world's central banks or even the contentious presidential campaign in the U.S., it was surprising that stocks had risen to record levels. The U.S. economy continued to muddle through, with generally positive data (e.g., low unemployment, wage increases and improved housing figures) which seemed enough to allay investor fears, but not enough to ignite investor enthusiasm. Adding unease to this “slow growth” environment was the sense that the world's central banks were running out of tools to boost growth (interest rates cannot go much lower) and that these attempts had not been overwhelmingly successful in the first place. The negative rate experiments in Europe and Japan had lackluster results, and while China recently announced a new monetary and fiscal stimulus package, its economy showed signs of slowing. For years, China and the U.S. were the twin-engines propelling the global economy. With one engine sputtering, the focus began to shift toward the U.S., and its new President, to stay aloft.
Annual Shareholder Report
STOCK SELECTION
Stock selection in the Information Technology sector had the greatest positive impact on the Fund's benchmark-relative performance during the reporting period. Among the standout performers in this sector were security software provider Symantec Corporation and hardware producer Hewlett Packard Enterprise Company. Discerning stock selection in the Industrials sector was another source of strength for the Fund. The Fund's performance in this sector was led by Ingersoll-Rand PLC, a manufacturer of industrial machinery. Stock selection in the Consumer Discretionary sector detracted from relative Fund performance over the reporting period. Within this area, Liberty Interactive Group, an internet and video commerce retailer, had a negative impact on Fund performance, as did live event media company Live Nation Entertainment, Inc. The Health Care sector was also among the weaker performing sectors for the Fund from a benchmark-relative perspective. In particular, generic drug manufacturer Teva Pharmaceutical Industries Limited and retirement community operator Brookdale Senior Living Inc. posted disappointing results that negatively affected the Fund's return.
| 1 | Please see the footnotes to the line graphs under “Fund Performance and Growth of a $10,000 Investment” below for the definition of, and more information about, the R1000V. |
| 2 | Please see the footnotes to the line graphs under “Fund Performance and Growth of a $10,000 Investment” below for the definition of, and more information about, the MLVFA. |
Annual Shareholder Report
FUND PERFORMANCE AND GROWTH OF A $10,000 INVESTMENT
The graph below illustrates the hypothetical investment of $10,0001 in the Federated Clover Value Fund (the “Fund”)2 from September 30, 2006 to September 30, 2016, compared to the Russell 1000® Value Index (R1000V)3 and Morningstar Large Value Funds Average (MLVFA).4 The Average Annual Total Return table below shows returns for each class averaged over the stated periods.
Growth of a $10,000 Investment
Growth of $10,000 as of September 30, 2016
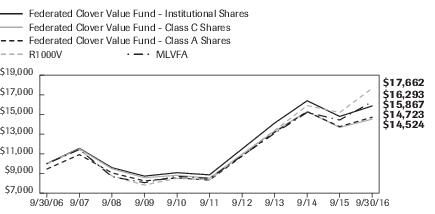
| Federated Clover Value Fund - | Institutional Shares | Class C Shares | Class A Shares | R1000V | MLVFA |
| F | F | F | I | I |
| 9/30/2006 | 10,000 | 10,000 | 9,450 | 10,000 | 10,000 |
| 9/30/2007 | 11,557 | 11,509 | 10,922 | 11,445 | 11,439 |
| 9/30/2008 | 9,592 | 9,482 | 9,064 | 8,749 | 8,674 |
| 9/30/2009 | 8,733 | 8,565 | 8,246 | 7,820 | 8,066 |
| 9/30/2010 | 9,082 | 8,817 | 8,552 | 8,515 | 8,712 |
| 9/30/2011 | 8,863 | 8,527 | 8,330 | 8,355 | 8,502 |
| 9/30/2012 | 11,492 | 10,944 | 10,769 | 10,938 | 10,800 |
| 9/30/2013 | 14,124 | 13,309 | 13,198 | 13,377 | 13,086 |
| 9/30/2014 | 16,392 | 15,297 | 15,282 | 15,904 | 15,209 |
| 9/30/2015 | 14,798 | 13,680 | 13,765 | 15,200 | 14,437 |
| 9/30/2016 | 15,867 | 14,524 | 14,723 | 17,662 | 16,293 |
41 graphic description end -->
| ■ | Total returns shown for Class C Shares include the maximum contingent deferred sales charge of 1.00% as applicable. |
| ■ | Total returns shown for Class A Shares include the maximum sales charge of 5.50% ($10,000 investment minus $550 sales charge = $9,450). |
The Fund offers multiple share classes whose performance may be greater than or less than its other share class(es) due to differences in sales charges and expenses. See the Average Annual Return table below for the returns of additional classes not shown in the line graph above.
Average Annual Total Returns for the Period Ended 9/30/2016
(returns reflect all applicable sales charges and contingent deferred sales charges as specified below in footnote #1)
| | 1 Year | 5 Years | 10 Years |
| Class A Shares | 1.08% | 10.80% | 3.94% |
| Class B Shares5 | 0.66% | 10.98% | 3.92% |
| Class C Shares | 5.17% | 11.24% | 3.80% |
| Class R Shares5 | 6.73% | 11.84% | 4.19% |
| Institutional Shares5 | 7.22% | 12.35% | 4.72% |
| R1000V | 16.20% | 16.15% | 5.85% |
| MLVFA | 13.08% | 14.02% | 5.00% |
Annual Shareholder Report
Performance data quoted represents past performance which is no guarantee of future results. Investment return and principal value will fluctuate so that an investor's shares, when redeemed, may be worth more or less than their original cost. Mutual fund performance changes over time and current performance may be lower or higher than what is stated. For current to the most recent month-end performance and after-tax returns, visit FederatedInvestors.com or call 1-800-341-7400. Returns shown do not reflect the deduction of taxes that a shareholder would pay on Fund distributions or the redemption of Fund shares. Mutual funds are not obligations of or guaranteed by any bank and are not federally insured.
| 1 | Represents a hypothetical investment of $10,000 in the Fund after deducting applicable sales charges: for Class A Shares, the maximum sales charge of 5.50% ($10,000 investment minus $550 sales charge = $9,450); for Class B Shares, the maximum contingent deferred sales charge is 5.50% on any redemption less than one year from the purchase date; for Class C Shares, the maximum contingent deferred sales charge is 1.00% on any redemption less than one year from the purchase date. The Fund's performance assumes the reinvestment of all dividends and distributions. The R1000V and MLVFA have been adjusted to reflect reinvestment of dividends on securities in the index and average. |
| 2 | The Fund is the successor to Touchstone Value Opportunities Fund, a portfolio of Touchstone Funds Group Trust, pursuant to a reorganization that took place as of the close of business on August 28, 2009. The Fund commenced operations on March 16, 2009, when the Fund became the successor to Clover Capital Multi Cap Value Equity Common Fund, LLC, organized as a Delaware limited liability company only available to accredited investors. The Fund assumed the performance of the predecessor common fund. As a result of the reorganization on August 28, 2009, the Touchstone Value Opportunities Fund became the accounting survivor. The information presented above, for the periods prior to August 28, 2009, is historical information of Touchstone Value Opportunities Fund. |
| 3 | The R1000V measures the performance of the large-cap value segment of the U.S. equity universe. It includes those Russell 1000 Index companies with lower price-to-book ratios and lower expected growth values. The R1000V constructed to provide a comprehensive and unbiased barometer for the large-cap value segment and is completely reconstituted annually to ensure new and growing equities are included and that the represented companies continue to reflect value characteristics. The R1000V is not adjusted to reflect sales charges, expenses or other fees that the Securities and Exchange Commission requires to be reflected in the Fund's performance. The index is unmanaged and, unlike the Fund, is not affected by cash flows. It is not possible to invest directly in an index. |
| 4 | Morningstar figures represent the average of the total returns reported by all the mutual funds designated by Morningstar as falling into the respective category indicated. They do not reflect sales charges. |
| 5 | The Fund's Class B Shares, Class R Shares and Institutional Shares commenced operations on August 29, 2009. For the period prior to the commencement of operations of Class B Shares, Class R Shares and Institutional Shares, the performance information shown is for the Fund's Class A Shares. In relation to Class B Shares and Class R Shares, the performance of Class A Shares has been adjusted to reflect the expenses applicable to each of those classes. In relation to Institutional Shares, the performance of Class A Shares has not been adjusted to reflect the expenses of Institutional Shares since the Institutional Shares have a lower expense ratio than the expense ratio of Class A Shares; however, the performance of Class A Shares has been adjusted to remove any voluntary waiver of Fund expenses related to the Class A Shares that may have occurred during the period prior to the commencement of Institutional Shares. Additionally, for both the Class R Shares and Institutional Shares, the performance information shown above has been adjusted to reflect the absence of sales charges applicable to Class A Shares. |
Annual Shareholder Report
Portfolio of Investments Summary Table (unaudited)
At September 30, 2016, the Fund's sector composition1 was as follows:
| Sector Composition | Percentage of
Total Net Assets |
| Financials | 16.8% |
| Industrials | 14.7% |
| Energy | 11.3% |
| Consumer Discretionary | 9.8% |
| Information Technology | 8.4% |
| Health Care | 7.3% |
| Materials | 6.4% |
| Consumer Staples | 4.3% |
| Telecommunication Services | 2.2% |
| Other Security Type2 | 9.1% |
| Cash Equivalents3 | 9.8% |
| Other Assets and Liabilities—Net4 | (0.1)% |
| TOTAL | 100.0% |
| 1 | Except for Cash Equivalents and Other Assets and Liabilities, sector classifications are based upon, and individual portfolio securities are assigned to, the classifications of the Global Industry Classification System (GICS), except that the Adviser assigns a classification to securities not classified by the GICS and to securities for which the Adviser does not have access to the classification made by the GICS. |
| 2 | Other Security Type consists of exchange-traded funds. |
| 3 | Cash Equivalents include any investments in money market mutual funds and/or overnight repurchase agreements. |
| 4 | Assets, other than investments in securities, less liabilities. See Statement of Assets and Liabilities. |
Annual Shareholder Report
Portfolio of Investments
September 30, 2016
| Shares | | | Value |
| | | COMMON STOCKS—81.2% | |
| | | Consumer Discretionary—9.8% | |
| 394,500 | | Liberty Global, Inc. | $11,065,725 |
| 637,600 | 1 | Toll Brothers, Inc. | 19,038,736 |
| 540,600 | | Viacom, Inc., Class B | 20,596,860 |
| 94,900 | | Whirlpool Corp. | 15,388,984 |
| | | TOTAL | 66,090,305 |
| | | Consumer Staples—4.3% | |
| 321,400 | | Procter & Gamble Co. | 28,845,650 |
| | | Energy—11.3% | |
| 951,600 | | BP PLC, ADR | 33,458,256 |
| 348,000 | 1 | Newfield Exploration Co. | 15,124,080 |
| 536,700 | | Suncor Energy, Inc. | 14,909,526 |
| 210,000 | | Technip SA | 12,896,837 |
| | | TOTAL | 76,388,699 |
| | | Financials—16.8% | |
| 248,300 | | American International Group, Inc. | 14,734,122 |
| 1,412,200 | | Bank of America Corp. | 22,100,930 |
| 645,600 | | Bank of New York Mellon Corp. | 25,746,528 |
| 391,100 | | Discover Financial Services | 22,116,705 |
| 278,000 | | JPMorgan Chase & Co. | 18,512,020 |
| 812,800 | | KeyCorp | 9,891,776 |
| | | TOTAL | 113,102,081 |
| | | Health Care—7.3% | |
| 648,800 | | Pfizer, Inc. | 21,974,856 |
| 196,000 | | UnitedHealth Group, Inc. | 27,440,000 |
| | | TOTAL | 49,414,856 |
| | | Industrials—14.7% | |
| 1,065,600 | | CSX Corp. | 32,500,800 |
| 321,400 | | Caterpillar, Inc. | 28,530,678 |
| 363,600 | | Eaton Corp. PLC | 23,892,156 |
| 211,200 | | Ingersoll-Rand PLC, Class A | 14,348,928 |
| | | TOTAL | 99,272,562 |
| | | Information Technology—8.4% | |
| 451,800 | | Cisco Systems, Inc. | 14,331,096 |
| 510,200 | | Hewlett-Packard Enterprise Co. | 11,607,050 |
| 413,600 | 1 | PayPal Holdings, Inc. | 16,945,192 |
Annual Shareholder Report
| Shares | | | Value |
| | | COMMON STOCKS—continued | |
| | | Information Technology—continued | |
| 550,800 | | Symantec Corp. | $13,825,080 |
| | | TOTAL | 56,708,418 |
| | | Materials—6.4% | |
| 596,000 | | International Paper Co. | 28,596,080 |
| 799,500 | 1 | Owens-Illinois, Inc. | 14,702,805 |
| | | TOTAL | 43,298,885 |
| | | Telecommunication Services—2.2% | |
| 358,200 | | AT&T, Inc. | 14,546,502 |
| | | TOTAL COMMON STOCKS
(IDENTIFIED COST $502,396,683) | 547,667,958 |
| | | EXCHANGE-TRADED FUNDS—9.1% | |
| 108,300 | | iShares Nasdaq Biotechnology ETF | 31,348,518 |
| 286,900 | | iShares Russell 1000 Value Index Fund | 30,302,378 |
| | | TOTAL EXCHANGE-TRADED FUNDS
(IDENTIFIED COST $58,125,606) | 61,650,896 |
| | | INVESTMENT COMPANY—9.8% | |
| 66,337,101 | 2 | Federated Institutional Prime Value Obligations Fund, Institutional Shares 0.36%3
(AT NET ASSET VALUE) | 66,337,101 |
| | | TOTAL INVESTMENTS—100.1%
(IDENTIFIED COST $626,859,390)4 | 675,655,955 |
| | | OTHER ASSETS AND LIABILITIES - NET—(0.1)%5 | (692,678) |
| | | TOTAL NET ASSETS—100% | $674,963,277 |
| 1 | Non-income-producing security. |
| 2 | Affiliated holding. |
| 3 | 7-day net yield. |
| 4 | The cost of investments for federal tax purposes amounts to $626,891,730. |
| 5 | Assets, other than investments in securities, less liabilities. See Statement of Assets and Liabilities. |
Note: The categories of investments are shown as a percentage of total net assets at September 30, 2016.
Various inputs are used in determining the value of the Fund's investments. These inputs are summarized in the three broad levels listed below:
Level 1—quoted prices in active markets for identical securities.
Level 2—other significant observable inputs (including quoted prices for similar securities, interest rates, prepayment speeds, credit risk, etc.). Also includes securities valued at amortized cost.
Level 3—significant unobservable inputs (including the Fund's own assumptions in determining the fair value of investments).
The inputs or methodology used for valuing securities are not an indication of the risk associated with investing in those securities.
Annual Shareholder Report
As of September 30, 2016, all investments of the Fund utilized Level 1 inputs, in valuing the Fund's assets carried at fair value.
The following acronym is used throughout this portfolio:
| ADR | —American Depositary Receipt |
See Notes which are an integral part of the Financial Statements
Annual Shareholder Report
Financial Highlights–Class A Shares
(For a Share Outstanding Throughout Each Period)
| Year Ended September 30 | 2016 | 2015 | 2014 | 2013 | 2012 |
| Net Asset Value, Beginning of Period | $20.09 | $22.54 | $19.57 | $16.10 | $12.57 |
| Income From Investment Operations: | | | | | |
| Net investment income | 0.401 | 0.071 | 0.281 | 0.141 | 0.141 |
| Net realized and unrealized gain (loss) on investments and foreign currency transactions | 0.98 | (2.28) | 2.81 | 3.47 | 3.44 |
| TOTAL FROM INVESTMENT OPERATIONS | 1.38 | (2.21) | 3.09 | 3.61 | 3.58 |
| Less Distributions: | | | | | |
| Distributions from net investment income | (0.43) | (0.24) | (0.12) | (0.15) | (0.14) |
| Return of capital | — | — | — | (0.00)2,3 | — |
| TOTAL DISTRIBUTIONS | (0.43) | (0.24) | (0.12) | (0.15) | (0.14) |
| Regulatory Settlement Proceeds | — | — | — | 0.014 | 0.094 |
| Net Asset Value, End of Period | $21.04 | $20.09 | $22.54 | $19.57 | $16.10 |
| Total Return5 | 6.96% | (9.93)% | 15.79% | 22.55%4 | 29.28%4 |
| Ratios to Average Net Assets: | | | | | |
| Net expenses | 1.19% | 1.19% | 1.19% | 1.19% | 1.19%6 |
| Net investment income | 1.96% | 0.31% | 1.26% | 0.81% | 0.93% |
| Expense waiver/reimbursement7 | 0.11% | 0.08% | 0.08% | 0.11% | 0.14% |
| Supplemental Data: | | | | | |
| Net assets, end of period (000 omitted) | $506,552 | $578,048 | $709,502 | $664,588 | $614,914 |
| Portfolio turnover | 78% | 102% | 98% | 81% | 63% |
| 1 | Per share numbers have been calculated using the average shares method. |
| 2 | Represents less than $0.01. |
| 3 | Represents a return of capital for federal income tax purposes. |
| 4 | On September 9, 2013 and June 12, 2012, the Fund received a residual distribution from a regulatory settlement which had a total return impact of less than 0.00% and 0.40%, respectively. During the year ended September 30, 2012, the Fund received a regulatory settlement from an unaffiliated third party, which had an impact of 0.24% on the total return. |
| 5 | Based on net asset value, which does not reflect the sales charge, redemption fee or contingent deferred sales charge, if applicable. |
| 6 | The net expense ratio is calculated without reduction for fees paid indirectly for expense offset arrangements. The net expense ratio is 1.19% for the year ended September 30, 2012 after taking into account these expense reductions. |
| 7 | This expense decrease is reflected in both the net expense and the net investment income ratios shown above. |
See Notes which are an integral part of the Financial Statements
Annual Shareholder Report
Financial Highlights–Class B Shares
(For a Share Outstanding Throughout Each Period)
| Year Ended September 30 | 2016 | 2015 | 2014 | 2013 | 2012 |
| Net Asset Value, Beginning of Period | $19.94 | $22.38 | $19.48 | $16.03 | $12.52 |
| Income From Investment Operations: | | | | | |
| Net investment income (loss) | 0.251 | (0.10)1 | 0.121 | 0.011 | 0.031 |
| Net realized and unrealized gain (loss) on investments and foreign currency transactions | 0.97 | (2.24) | 2.78 | 3.45 | 3.42 |
| TOTAL FROM INVESTMENT OPERATIONS | 1.22 | (2.34) | 2.90 | 3.46 | 3.45 |
| Less Distributions: | | | | | |
| Distributions from net investment income | (0.29) | (0.10) | (0.00)2 | (0.02) | (0.03) |
| Return of capital | — | — | — | (0.00)2,3 | — |
| TOTAL DISTRIBUTIONS | (0.29) | (0.10) | (0.00)2 | (0.02) | (0.03) |
| Regulatory Settlement Proceeds | — | — | — | 0.014 | 0.094 |
| Net Asset Value, End of Period | $20.87 | $19.94 | $22.38 | $19.48 | $16.03 |
| Total Return5 | 6.16% | (10.54)% | 14.90% | 21.70%4 | 28.29%4 |
| Ratios to Average Net Assets: | | | | | |
| Net expenses | 1.92% | 1.92% | 1.92% | 1.92% | 1.92%6 |
| Net investment income (loss) | 1.25% | (0.44)% | 0.53% | 0.08% | 0.19% |
| Expense waiver/reimbursement7 | 0.21% | 0.15% | 0.17% | 0.26% | 0.30% |
| Supplemental Data: | | | | | |
| Net assets, end of period (000 omitted) | $20,983 | $24,426 | $31,788 | $33,452 | $33,658 |
| Portfolio turnover | 78% | 102% | 98% | 81% | 63% |
| 1 | Per share numbers have been calculated using the average shares method. |
| 2 | Represents less than $0.01. |
| 3 | Represents a return of capital for federal income tax purposes. |
| 4 | On September 9, 2013 and June 12, 2012, the Fund received a residual distribution from a regulatory settlement which had a total return impact of 0.06% and 0.40%, respectively. During the year ended September 30, 2012, the Fund received a regulatory settlement from an unaffiliated third party, which had an impact of 0.32% on the total return. |
| 5 | Based on net asset value, which does not reflect the sales charge, redemption fee or contingent deferred sales charge, if applicable. |
| 6 | The net expense ratio is calculated without reduction for fees paid indirectly for expense offset arrangements. The net expense ratio is 1.92% for the year ended September 30, 2012 after taking into account these expense reductions. |
| 7 | This expense decrease is reflected in both the net expense and the net investment income (loss) ratios shown above. |
See Notes which are an integral part of the Financial Statements
Annual Shareholder Report
Financial Highlights–Class C Shares
(For a Share Outstanding Throughout Each Period)
| Year Ended September 30 | 2016 | 2015 | 2014 | 2013 | 2012 |
| Net Asset Value, Beginning of Period | $19.96 | $22.41 | $19.50 | $16.06 | $12.54 |
| Income From Investment Operations: | | | | | |
| Net investment income (loss) | 0.251 | (0.10)1 | 0.121 | 0.011 | 0.031 |
| Net realized and unrealized gain (loss) on investments and foreign currency transactions | 0.97 | (2.26) | 2.79 | 3.45 | 3.43 |
| TOTAL FROM INVESTMENT OPERATIONS | 1.22 | (2.36) | 2.91 | 3.46 | 3.46 |
| Less Distributions: | | | | | |
| Distributions from net investment income | (0.28) | (0.09) | (0.00)2 | (0.03) | (0.03) |
| Return of capital | — | — | — | (0.00)2,3 | — |
| TOTAL DISTRIBUTIONS | (0.28) | (0.09) | (0.00)2 | (0.03) | (0.03) |
| Regulatory Settlement Proceeds | — | — | — | 0.014 | 0.094 |
| Net Asset Value, End of Period | $20.90 | $19.96 | $22.41 | $19.50 | $16.06 |
| Total Return5 | 6.17% | (10.57)% | 14.94% | 21.61%4 | 28.34%4 |
| Ratios to Average Net Assets: | | | | | |
| Net expenses | 1.92% | 1.92% | 1.92% | 1.92% | 1.92%6 |
| Net investment income (loss) | 1.24% | (0.42)% | 0.53% | 0.08% | 0.19% |
| Expense waiver/reimbursement7 | 0.17% | 0.13% | 0.13% | 0.16% | 0.19% |
| Supplemental Data: | | | | | |
| Net assets, end of period (000 omitted) | $32,263 | $36,916 | $46,022 | $41,237 | $37,331 |
| Portfolio turnover | 78% | 102% | 98% | 81% | 63% |
| 1 | Per share numbers have been calculated using the average shares method. |
| 2 | Represents less than $0.01. |
| 3 | Represents a return of capital for federal income tax purposes. |
| 4 | On September 9, 2013 and June 12, 2012, the Fund received a residual distribution from a regulatory settlement which had a total return impact of less than 0.00% and 0.40%, respectively. During the year ended September 30, 2012, the Fund received a regulatory settlement from an unaffiliated third party, which had an impact of 0.32% on the total return. |
| 5 | Based on net asset value, which does not reflect the sales charge, redemption fee or contingent deferred sales charge, if applicable. |
| 6 | The net expense ratio is calculated without reduction for fees paid indirectly for expense offset arrangements. The net expense ratio is 1.92% for the year ended September 30, 2012 after taking into account these expense reductions. |
| 7 | This expense decrease is reflected in both the net expense and the net investment income (loss) ratios shown above. |
See Notes which are an integral part of the Financial Statements
Annual Shareholder Report
Financial Highlights–Class R Shares
(For a Share Outstanding Throughout Each Period)
| Year Ended September 30 | 2016 | 2015 | 2014 | 2013 | 2012 |
| Net Asset Value, Beginning of Period | $20.10 | $22.54 | $19.58 | $16.11 | $12.57 |
| Income From Investment Operations: | | | | | |
| Net investment income | 0.351 | 0.021 | 0.241 | 0.111 | 0.101 |
| Net realized and unrealized gain (loss) on investments and foreign currency transactions | 0.99 | (2.28) | 2.80 | 3.46 | 3.46 |
| TOTAL FROM INVESTMENT OPERATIONS | 1.34 | (2.26) | 3.04 | 3.57 | 3.56 |
| Less Distributions: | | | | | |
| Distributions from net investment income | (0.39) | (0.18) | (0.08) | (0.11) | (0.11) |
| Return of capital | — | — | — | (0.00)2,3 | — |
| TOTAL DISTRIBUTIONS | (0.39) | (0.18) | (0.08) | (0.11) | (0.11) |
| Regulatory Settlement Proceeds | — | — | — | 0.014 | 0.094 |
| Net Asset Value, End of Period | $21.05 | $20.10 | $22.54 | $19.58 | $16.11 |
| Total Return5 | 6.73% | (10.13)% | 15.52% | 22.32%4 | 29.07%4 |
| Ratios to Average Net Assets: | | | | | |
| Net expenses | 1.41% | 1.42% | 1.38% | 1.38% | 1.42%6 |
| Net investment income | 1.73% | 0.08% | 1.06% | 0.62% | 0.70% |
| Expense waiver/reimbursement7 | 0.30% | 0.27% | 0.28% | 0.29% | 0.31% |
| Supplemental Data: | | | | | |
| Net assets, end of period (000 omitted) | $22,123 | $21,968 | $27,505 | $24,706 | $20,830 |
| Portfolio turnover | 78% | 102% | 98% | 81% | 63% |
| 1 | Per share numbers have been calculated using the average shares method. |
| 2 | Represents less than $0.01. |
| 3 | Represents a return of capital for federal income tax purposes. |
| 4 | On September 9, 2013 and June 12, 2012, the Fund received a residual distribution from a regulatory settlement which had a total return impact of 0.06% and 0.40%, respectively. During the year ended September 30, 2012, the Fund received a regulatory settlement from an unaffiliated third party, which had an impact of 0.24% on the total return. |
| 5 | Based on net asset value. |
| 6 | The net expense ratio is calculated without reduction for fees paid indirectly for expense offset arrangements. The net expense ratio is 1.42% for the year ended September 30, 2012 after taking into account these expense reductions. |
| 7 | This expense decrease is reflected in both the net expense and the net investment income ratios shown above. |
See Notes which are an integral part of the Financial Statements
Annual Shareholder Report
Financial Highlights–Institutional Shares
(For a Share Outstanding Throughout Each Period)
| Year Ended September 30 | 2016 | 2015 | 2014 | 2013 | 2012 |
| Net Asset Value, Beginning of Period | $20.11 | $22.57 | $19.60 | $16.12 | $12.58 |
| Income From Investment Operations: | | | | | |
| Net investment income | 0.451 | 0.121 | 0.341 | 0.191 | 0.181 |
| Net realized and unrealized gain (loss) on investments and foreign currency transactions | 0.98 | (2.28) | 2.81 | 3.47 | 3.45 |
| TOTAL FROM INVESTMENT OPERATIONS | 1.43 | (2.16) | 3.15 | 3.66 | 3.63 |
| Less Distributions: | | | | | |
| Distributions from net investment income | (0.48) | (0.30) | (0.18) | (0.18) | (0.18) |
| Return of capital | — | — | — | (0.01)2 | — |
| TOTAL DISTRIBUTIONS | (0.48) | (0.30) | (0.18) | (0.19) | (0.18) |
| Regulatory Settlement Proceeds | — | — | — | 0.013 | 0.093 |
| Net Asset Value, End of Period | $21.06 | $20.11 | $22.57 | $19.60 | $16.12 |
| Total Return4 | 7.22% | (9.72)% | 16.06% | 22.90%3 | 29.66%3 |
| Ratios to Average Net Assets: | | | | | |
| Net expenses | 0.94% | 0.94% | 0.94% | 0.94% | 0.94%5 |
| Net investment income | 2.19% | 0.54% | 1.54% | 1.06% | 1.18% |
| Expense waiver/reimbursement6 | 0.06% | 0.03% | 0.03% | 0.04% | 0.06% |
| Supplemental Data: | | | | | |
| Net assets, end of period (000 omitted) | $93,042 | $131,623 | $173,598 | $204,251 | $174,998 |
| Portfolio turnover | 78% | 102% | 98% | 81% | 63% |
| 1 | Per share numbers have been calculated using the average shares method. |
| 2 | Represents a return of capital for federal income tax purposes. |
| 3 | On September 9, 2013 and June 12, 2012, the Fund received a residual distribution from a regulatory settlement which had a total return impact of 0.06% and 0.40%, respectively. During the year ended September 30, 2012, the Fund received a regulatory settlement from an unaffiliated third party, which had an impact of 0.24% on the total return. |
| 4 | Based on net asset value. |
| 5 | The net expense ratio is calculated without reduction for fees paid indirectly for expense offset arrangements. The net expense ratio is 0.93% for the year ended September 30, 2012 after taking into account these expense reductions. |
| 6 | This expense decrease is reflected in both the net expense and the net investment income ratios shown above. |
See Notes which are an integral part of the Financial Statements
Annual Shareholder Report
Statement of Assets and Liabilities
September 30, 2016
| Assets: | | |
| Total investment in securities, at value including $66,337,101 of investment in an affiliated holding (Note 5) (identified cost $626,859,390) | | $675,655,955 |
| Income receivable | | 191,868 |
| Receivable for shares sold | | 215,827 |
| TOTAL ASSETS | | 676,063,650 |
| Liabilities: | | |
| Payable for shares redeemed | $641,677 | |
| Income distribution payable | 80 | |
| Payable to adviser (Note 5) | 12,941 | |
| Payable for administrative fee (Note 5) | 1,427 | |
| Payable for transfer agent fee | 156,172 | |
| Payable for portfolio accounting fees | 30,069 | |
| Payable for distribution services fee (Note 5) | 37,386 | |
| Payable for other service fees (Notes 2 and 5) | 189,812 | |
| Accrued expenses (Note 5) | 30,809 | |
| TOTAL LIABILITIES | | 1,100,373 |
| Net assets for 32,096,566 shares outstanding | | $674,963,277 |
| Net Assets Consist of: | | |
| Paid-in capital | | $696,447,719 |
| Net unrealized appreciation of investments and translation of assets and liabilities in foreign currency | | 48,794,966 |
| Accumulated net realized loss on investments and foreign currency transactions | | (70,250,752) |
| Distributions in excess of net investment income | | (28,656) |
| TOTAL NET ASSETS | | $674,963,277 |
Annual Shareholder Report
Statement of Assets and Liabilities–continued
| Net Asset Value, Offering Price and Redemption Proceeds Per Share | | |
| Class A Shares: | | |
| Net asset value per share ($506,551,956 ÷ 24,078,568 shares outstanding), no par value, unlimited shares authorized | | $21.04 |
| Offering price per share (100/94.50 of $21.04) | | $22.26 |
| Redemption proceeds per share | | $21.04 |
| Class B Shares: | | |
| Net asset value per share ($20,982,732 ÷ 1,005,565 shares outstanding), no par value, unlimited shares authorized | | $20.87 |
| Offering price per share | | $20.87 |
| Redemption proceeds per share (94.50/100 of $20.87) | | $19.72 |
| Class C Shares: | | |
| Net asset value per share ($32,262,949 ÷ 1,543,687 shares outstanding), no par value, unlimited shares authorized | | $20.90 |
| Offering price per share | | $20.90 |
| Redemption proceeds per share (99.00/100 of $20.90) | | $20.69 |
| Class R Shares: | | |
| Net asset value per share ($22,123,142 ÷ 1,051,013 shares outstanding), no par value, unlimited shares authorized | | $21.05 |
| Offering price per share | | $21.05 |
| Redemption proceeds per share | | $21.05 |
| Institutional Shares: | | |
| Net asset value per share ($93,042,498 ÷ 4,417,733 shares outstanding), no par value, unlimited shares authorized | | $21.06 |
| Offering price per share | | $21.06 |
| Redemption proceeds per share | | $21.06 |
See Notes which are an integral part of the Financial Statements
Annual Shareholder Report
Statement of Operations
Year Ended September 30, 2016
| Investment Income: | | | |
| Dividends (including $86,321 received from an affiliated holding (Note 5) and net of foreign taxes withheld of $195,619) | | | $22,768,575 |
| Expenses: | | | |
| Investment adviser fee (Note 5) | | $5,411,943 | |
| Administrative fee (Note 5) | | 564,355 | |
| Custodian fees | | 28,165 | |
| Transfer agent fee (Note 2) | | 1,241,923 | |
| Directors'/Trustees' fees (Note 5) | | 6,447 | |
| Auditing fees | | 29,020 | |
| Legal fees | | 8,169 | |
| Portfolio accounting fees | | 152,423 | |
| Distribution services fee (Note 5) | | 537,017 | |
| Other service fees (Notes 2 and 5) | | 1,479,548 | |
| Share registration costs | | 66,997 | |
| Printing and postage | | 102,516 | |
| Miscellaneous (Note 5) | | 15,020 | |
| TOTAL EXPENSES | | 9,643,543 | |
| Waiver and Reimbursements: | | | |
| Waiver/reimbursement of investment adviser fee (Note 5) | $(326,598) | | |
| Reimbursements of other operating expenses (Notes 2 and 5) | (497,181) | | |
| TOTAL WAIVER AND REIMBURSEMENTS | | (823,779) | |
| Net expenses | | | 8,819,764 |
| Net investment income | | | 13,948,811 |
| Realized and Unrealized Gain (Loss) on Investments and Foreign Currency Transactions: | | | |
| Net realized loss on investments and foreign currency transactions | | | (24,984,918) |
| Net change in unrealized depreciation of investments and translation of assets and liabilities in foreign currency | | | 58,564,252 |
| Net realized and unrealized gain on investments and foreign currency transactions | | | 33,579,334 |
| Change in net assets resulting from operations | | | $47,528,145 |
See Notes which are an integral part of the Financial Statements
Annual Shareholder Report
Statement of Changes in Net Assets
| Year Ended September 30 | 2016 | 2015 |
| Increase (Decrease) in Net Assets | | |
| Operations: | | |
| Net investment income | $13,948,811 | $2,769,151 |
| Net realized gain (loss) on investments and foreign currency transactions | (24,984,918) | 44,619,687 |
| Net change in unrealized appreciation/depreciation of investments and translation of assets and liabilities in foreign currency | 58,564,252 | (131,868,450) |
| CHANGE IN NET ASSETS RESULTING FROM OPERATIONS | 47,528,145 | (84,479,612) |
| Distributions to Shareholders: | | |
| Distributions from net investment income | | |
| Class A Shares | (11,110,874) | (7,180,894) |
| Class B Shares | (318,833) | (131,594) |
| Class C Shares | (471,736) | (187,077) |
| Class R Shares | (409,023) | (210,295) |
| Institutional Shares | (2,442,065) | (2,194,353) |
| CHANGE IN NET ASSETS RESULTING FROM DISTRIBUTIONS TO SHAREHOLDERS | (14,752,531) | (9,904,213) |
| Share Transactions: | | |
| Proceeds from sale of shares | 33,245,882 | 54,952,437 |
| Net asset value of shares issued to shareholders in payment of distributions declared | 13,329,649 | 8,723,247 |
| Cost of shares redeemed | (197,368,130) | (164,726,278) |
| CHANGE IN NET ASSETS RESULTING FROM SHARE TRANSACTIONS | (150,792,599) | (101,050,594) |
| Change in net assets | (118,016,985) | (195,434,419) |
| Net Assets: | | |
| Beginning of period | 792,980,262 | 988,414,681 |
| End of period (including undistributed (distribution in excess of) net investment income of $(28,656) and $626,355, respectively) | $674,963,277 | $792,980,262 |
See Notes which are an integral part of the Financial Statements
Annual Shareholder Report
Notes to Financial Statements
September 30, 2016
1. organization
Federated Equity Funds (the “Trust”) is registered under the Investment Company Act of 1940, as amended (the “Act”), as an open-end management investment company. The Trust consists of 14 diversified portfolios. The financial statements included herein are only those of Federated Clover Value Fund (the “Fund”). The financial statements of the other portfolios are presented separately. The assets of each portfolio are segregated and a shareholder's interest is limited to the portfolio in which shares are held. Each portfolio pays its own expenses. The Fund offers five classes of shares: Class A Shares, Class B Shares, Class C Shares, Class R Shares and Institutional Shares. All shares of the Fund have equal rights with respect to voting, except on class-specific matters. The investment objective of the Fund is to seek capital appreciation.
2. SIGNIFICANT ACCOUNTING POLICIES
The following is a summary of significant accounting policies consistently followed by the Fund in the preparation of its financial statements. These policies are in conformity with U.S. generally accepted accounting principles (GAAP).
Investment Valuation
In calculating its net asset value (NAV), the Fund generally values investments as follows:
| ■ | Equity securities listed on an exchange or traded through a regulated market system are valued at their last reported sale price or official closing price in their principal exchange or market. |
| ■ | Fixed-income securities acquired with remaining maturities greater than 60 days are fair valued using price evaluations provided by a pricing service approved by the Fund's Board of Trustees (the “Trustees”). |
| ■ | Fixed-income securities and repurchase agreements acquired with remaining maturities of 60 days or less are valued at their cost (adjusted for the accretion of any discount or amortization of any premium), unless the issuer's creditworthiness is impaired or other factors indicate that amortized cost is not an accurate estimate of the investment's fair value, in which case it would be valued in the same manner as a longer-term security. |
| ■ | Shares of other mutual funds or non-exchange-traded investment companies are valued based upon their reported NAVs. |
| ■ | Derivative contracts listed on exchanges are valued at their reported settlement or closing price, except that options are valued at the mean of closing bid and asked quotations. |
| ■ | Over-the-counter (OTC) derivative contracts are fair valued using price evaluations provided by a pricing service approved by the Trustees. |
| ■ | For securities that are fair valued in accordance with procedures established by and under the general supervision of the Trustees, certain factors may be considered such as: the last traded or purchase price of the security, information obtained by contacting the issuer or dealers, analysis of the issuer's financial statements or other available documents, fundamental analytical data, the nature and duration of restrictions on disposition, the movement of the market in which the security is normally traded, public trading in similar securities or derivative contracts of the issuer or comparable issuers, movement of a relevant index, or other factors including but not limited to industry changes and relevant government actions. |
Annual Shareholder Report
If any price, quotation, price evaluation or other pricing source is not readily available when the NAV is calculated, or if the Fund cannot obtain price evaluations from a pricing service or from more than one dealer for an investment within a reasonable period of time as set forth in the Fund's valuation policies and procedures, the Fund uses the fair value of the investment determined in accordance with the procedures described below. There can be no assurance that the Fund could obtain the fair value assigned to an investment if it sold the investment at approximately the time at which the Fund determines its NAV per share.
Fair Valuation and Significant Events Procedures
The Trustees have ultimate responsibility for determining the fair value of investments for which market quotations are not readily available. The Trustees have appointed a valuation committee (“Valuation Committee”) comprised of officers of the Fund, Federated Global Investment Management Corp. (“Adviser”) and certain of the Adviser's affiliated companies to assist in determining fair value and in overseeing the calculation of the NAV. The Trustees have also authorized the use of pricing services recommended by the Valuation Committee to provide fair value evaluations of the current value of certain investments for purposes of calculating the NAV. The Valuation Committee employs various methods for reviewing third-party pricing-service evaluations including periodic reviews of third-party pricing services' policies, procedures and valuation methods (including key inputs, methods, models and assumptions), transactional back-testing, comparisons of evaluations of different pricing services, and review of price challenges by the Adviser based on recent market activity. In the event that market quotations and price evaluations are not available for an investment, the Valuation Committee determines the fair value of the investment in accordance with procedures adopted by the Trustees. The Trustees periodically review and approve the fair valuations made by the Valuation Committee and any changes made to the procedures.
Factors considered by pricing services in evaluating an investment include the yields or prices of investments of comparable quality, coupon, maturity, call rights and other potential prepayments, terms and type, reported transactions, indications as to values from dealers and general market conditions. Some pricing services provide a single price evaluation reflecting the bid-side of the market for an investment (a “bid” evaluation). Other pricing services offer both bid evaluations and price evaluations indicative of a price between the prices bid and asked for the investment (a “mid” evaluation). The Fund normally uses bid evaluations for any U.S. Treasury and Agency securities, mortgage-backed securities and municipal securities. The Fund normally uses mid evaluations for any other types of fixed-income securities and any OTC derivative contracts. In the event that market quotations and price evaluations are not available for an investment, the fair value of the investment is determined in accordance with procedures adopted by the Trustees.
The Trustees also have adopted procedures requiring an investment to be priced at its fair value whenever the Adviser determines that a significant event affecting the value of the investment has occurred between the time as of which the price of the investment would otherwise be determined and the time as of which the NAV is computed. An event is considered significant if there is both an affirmative expectation that the investment's value will change in response to the event and a reasonable basis for quantifying the resulting change in value. Examples of significant events that may occur after the close of the principal market on which a security is traded, or after the time of a price evaluation provided by a pricing service or a dealer, include:
| ■ | With respect to securities traded principally in foreign markets, significant trends in U.S. equity markets or in the trading of foreign securities index futures contracts; |
Annual Shareholder Report
| ■ | Political or other developments affecting the economy or markets in which an issuer conducts its operations or its securities are traded; |
| ■ | Announcements concerning matters such as acquisitions, recapitalizations, litigation developments, or a natural disaster affecting the issuer's operations or regulatory changes or market developments affecting the issuer's industry. |
The Trustees have adopted procedures whereby the Valuation Committee uses a pricing service to determine the fair value of equity securities traded principally in foreign markets when the Adviser determines that there has been a significant trend in the U.S. equity markets or in index futures trading. For other significant events, the Fund may seek to obtain more current quotations or price evaluations from alternative pricing sources. If a reliable alternative pricing source is not available, the Fund will determine the fair value of the investment in accordance with the fair valuation procedures approved by the Trustees. The Trustees have ultimate responsibility for any fair valuations made in response to a significant event.
Repurchase Agreements
The Fund may invest in repurchase agreements for short-term liquidity purposes. It is the policy of the Fund to require the other party to a repurchase agreement to transfer to the Fund's custodian or sub-custodian eligible securities or cash with a market value (after transaction costs) at least equal to the repurchase price to be paid under the repurchase agreement. The eligible securities are transferred to accounts with the custodian or sub-custodian in which the Fund holds a “securities entitlement” and exercises “control” as those terms are defined in the Uniform Commercial Code. The Fund has established procedures for monitoring the market value of the transferred securities and requiring the transfer of additional eligible securities if necessary to equal at least the repurchase price. These procedures also allow the other party to require securities to be transferred from the account to the extent that their market value exceeds the repurchase price or in exchange for other eligible securities of equivalent market value.
The insolvency of the other party or other failure to repurchase the securities may delay the disposition of the underlying securities or cause the Fund to receive less than the full repurchase price. Under the terms of the repurchase agreement, any amounts received by the Fund in excess of the repurchase price and related transaction costs must be remitted to the other party.
The Fund may enter into repurchase agreements in which eligible securities are transferred into joint trading accounts maintained by the custodian or sub-custodian for investment companies and other clients advised by the Fund's Adviser and its affiliates. The Fund will participate on a pro rata basis with the other investment companies and clients in its share of the securities transferred under such repurchase agreements and in its share of proceeds from any repurchase or other disposition of such securities.
Investment Income, Gains and Losses, Expenses and Distributions
Investment transactions are accounted for on a trade-date basis. Realized gains and losses from investment transactions are recorded on an identified-cost basis. Interest income and expenses are accrued daily. Dividend income and distributions to shareholders are recorded on the ex-dividend date. Foreign dividends are recorded on the ex-dividend date or when the Fund is informed of the ex-dividend date. Distributions of net investment income are declared and paid quarterly. Non-cash dividends included in dividend income, if any, are recorded at fair value. Amortization/accretion of premium and discount is included in investment income. GAAP requires that distributions in excess of tax basis earnings and profits be reported in these financial statements as a return of capital (ROC). Investment income, realized and
Annual Shareholder Report
unrealized gains and losses, and certain fund-level expenses are allocated to each class based on relative average daily net assets, except that Class A Shares, Class B Shares, Class C Shares, Class R Shares and Institutional Shares may bear distribution services fees, other service fees and transfer agent fees unique to those classes. The detail of the total fund expense waivers and reimbursements of $823,779 is disclosed in various locations in this Note 2 and Note 5. For the year ended September 30, 2016, transfer agent fees for the Fund were as follows:
| | Transfer
Agent Fees
Incurred | Transfer
Agent Fees
Reimbursed |
| Class A Shares | $919,415 | $(351,473) |
| Class B Shares | 55,991 | (36,667) |
| Class C Shares | 71,111 | (41,688) |
| Class R Shares | 69,854 | — |
| Institutional Shares | 125,552 | (13,074) |
| TOTAL | $1,241,923 | $(442,902) |
Dividends are declared separately for each class. No class has preferential dividend rights; differences in per share dividend rates are generally due to differences in separate class expenses.
Other Service Fees
The Fund may pay other service fees up to 0.25% of the average daily net assets of the Fund's Class A Shares, Class B Shares and Class C Shares to unaffiliated financial intermediaries or to Federated Shareholder Services Company (FSSC) for providing services to shareholders and maintaining shareholder accounts. Subject to the terms described in the Expense Limitation note, FSSC may voluntarily reimburse the Fund for other service fees. For the year ended September 30, 2016, other service fees for the Fund were as follows:
| | Other
Service Fees
Incurred | Other
Service Fees
Reimbursed |
| Class A Shares | $1,336,683 | $— |
| Class B Shares | 56,623 | (35) |
| Class C Shares | 86,242 | — |
| TOTAL | $1,479,548 | $(35) |
Federal Taxes
It is the Fund's policy to comply with the Subchapter M provision of the Internal Revenue Code (the “Code”) and to distribute to shareholders each year substantially all of its income. Accordingly, no provision for federal income tax is necessary. As of and during the year ended September 30, 2016, the Fund did not have a liability for any uncertain tax positions. The Fund recognizes interest and penalties, if any, related to tax liabilities as income tax expense in the Statement of Operations. As of September 30, 2016, tax years 2013 through 2016 remain subject to examination by the Fund's major tax jurisdictions, which include the United States of America and the Commonwealth of Massachusetts.
Annual Shareholder Report
The Fund may be subject to taxes imposed by governments of countries in which it invests. Such taxes are generally based on either income or gains earned or repatriated. The Fund accrues and applies such taxes to net investment income, net realized gains and net unrealized gains as income and/or gains are earned.
When-Issued and Delayed-Delivery Transactions
The Fund may engage in when-issued or delayed-delivery transactions. The Fund records when-issued securities on the trade date and maintains security positions such that sufficient liquid assets will be available to make payment for the securities purchased. Securities purchased on a when-issued or delayed-delivery basis are marked to market daily and begin earning interest on the settlement date. Losses may occur on these transactions due to changes in market conditions or the failure of counterparties to perform under the contract.
Foreign Exchange Contracts
The Fund enters into foreign exchange contracts to manage currency and market risks. Purchased contracts are used to acquire exposure to foreign currencies, whereas, contracts to sell are used to hedge the Fund's securities against currency fluctuations. Risks may arise upon entering into these transactions from the potential inability of counterparties to meet the terms of their commitments and from unanticipated movements in security prices or foreign exchange rates. The foreign exchange contracts are adjusted by the daily exchange rate of the underlying currency and any gains or losses are recorded for financial statement purposes as unrealized until the settlement date.
The average value at settlement date payable of foreign exchange contracts purchased by the Fund throughout the period was $504. This is based on the contracts held as of each month-end throughout the fiscal period.
Foreign Currency Translation
The accounting records of the Fund are maintained in U.S. dollars. All assets and liabilities denominated in foreign currencies (FCs) are translated into U.S. dollars based on the rates of exchange of such currencies against U.S. dollars on the date of valuation. Purchases and sales of securities, income and expenses are translated at the rate of exchange quoted on the respective date that such transactions are recorded. The Fund does not isolate that portion of the results of operations resulting from changes in foreign exchange rates on investments from the fluctuations arising from changes in market prices of securities held. Such fluctuations are included with the net realized and unrealized gain or loss from investments.
Reported net realized foreign exchange gains or losses arise from sales of portfolio securities, sales and maturities of short-term securities, sales of FCs, currency gains or losses realized between the trade and settlement dates on securities transactions, the difference between the amounts of dividends, interest and foreign withholding taxes recorded on the Fund's books, and the U.S. dollar equivalent of the amounts actually received or paid. Net unrealized foreign exchange gains and losses arise from changes in the value of assets and liabilities other than investments in securities at fiscal year end, resulting from changes in the exchange rate.
Annual Shareholder Report
Additional Disclosure Related to Derivative Instruments
The Effect of Derivative Instruments on the Statement of Operations for the Year Ended September 30, 2016
| | Foreign
exchange
contracts |
| Foreign exchange contracts | $1,236 |
Other
The preparation of financial statements in conformity with GAAP requires management to make estimates and assumptions that affect the amounts of assets, liabilities, expenses and revenues reported in the financial statements. Actual results could differ from those estimated. The Fund applies Investment Company accounting and reporting guidance.
3. SHARES OF BENEFICIAL INTEREST
The following tables summarize share activity:
| Year Ended September 30 | 2016 | 2015 |
| Class A Shares: | Shares | Amount | Shares | Amount |
| Shares sold | 630,023 | $12,847,162 | 1,058,411 | $24,321,278 |
| Shares issued to shareholders in payment of distributions declared | 491,293 | 10,031,836 | 287,422 | 6,506,093 |
| Shares redeemed | (5,815,744) | (119,677,144) | (4,052,588) | (93,160,829) |
| NET CHANGE RESULTING FROM CLASS A SHARE TRANSACTIONS | (4,694,428) | $(96,798,146) | (2,706,755) | $(62,333,458) |
| Year Ended September 30 | 2016 | 2015 |
| Class B Shares: | Shares | Amount | Shares | Amount |
| Shares sold | 71,921 | $1,449,775 | 128,723 | $2,930,245 |
| Shares issued to shareholders in payment of distributions declared | 15,295 | 308,857 | 5,477 | 127,023 |
| Shares redeemed | (306,898) | (6,214,579) | (329,056) | (7,528,134) |
| NET CHANGE RESULTING FROM CLASS B SHARE TRANSACTIONS | (219,682) | $(4,455,947) | (194,856) | $(4,470,866) |
| Year Ended September 30 | 2016 | 2015 |
| Class C Shares: | Shares | Amount | Shares | Amount |
| Shares sold | 156,377 | $3,182,145 | 209,783 | $4,798,366 |
| Shares issued to shareholders in payment of distributions declared | 20,875 | 422,359 | 7,224 | 167,737 |
| Shares redeemed | (483,028) | (9,780,937) | (421,081) | (9,583,833) |
| NET CHANGE RESULTING FROM CLASS C SHARE TRANSACTIONS | (305,776) | $(6,176,433) | (204,074) | $(4,617,730) |
Annual Shareholder Report
| Year Ended September 30 | 2016 | 2015 |
| Class R Shares: | Shares | Amount | Shares | Amount |
| Shares sold | 228,278 | $4,639,917 | 223,947 | $5,146,584 |
| Shares issued to shareholders in payment of distributions declared | 19,721 | 402,748 | 9,115 | 207,761 |
| Shares redeemed | (289,812) | (5,864,613) | (360,406) | (8,291,010) |
| NET CHANGE RESULTING FROM CLASS R SHARE TRANSACTIONS | (41,813) | $(821,948) | (127,344) | $(2,936,665) |
| Year Ended September 30 | 2016 | 2015 |
| Institutional Shares: | Shares | Amount | Shares | Amount |
| Shares sold | 538,801 | $11,126,883 | 770,737 | $17,755,964 |
| Shares issued to shareholders in payment of distributions declared | 105,801 | 2,163,849 | 75,739 | 1,714,633 |
| Shares redeemed | (2,771,015) | (55,830,857) | (1,995,186) | (46,162,472) |
| NET CHANGE RESULTING FROM INSTITUTIONAL SHARE TRANSACTIONS | (2,126,413) | $(42,540,125) | (1,148,710) | $(26,691,875) |
| NET CHANGE RESULTING FROM TOTAL FUND SHARE TRANSACTIONS | (7,388,112) | $(150,792,599) | (4,381,739) | $(101,050,594) |
4. FEDERAL TAX INFORMATION
The timing and character of income and capital gain distributions are determined in accordance with income tax regulations, which may differ from GAAP. These differences are due to differing treatments for foreign currency transactions, fair funds settlements and over-distributions for excise tax requirements.
For the year ended September 30, 2016, permanent differences identified and reclassified among the components of net assets were as follows:
| Increase (Decrease) |
Undistributed Net
Investment Income (Loss) | Paid-in Capital | Accumulated
Net Realized
Gain (Loss) |
| $148,709 | $(1,629,648) | $1,480,939 |
Net investment income (loss), net realized gains (losses), and net assets were not affected by this reclassification.
The tax character of distributions as reported on the Statement of Changes in Net Assets for the years ended September 30, 2016 and 2015 was as follows:
| | 2016 | 2015 |
| Ordinary income | $14,752,531 | $9,904,213 |
Annual Shareholder Report
As of September 30, 2016, the components of distributable earnings on a tax basis were as follows:
| Distributions in excess of ordinary income | $(80) |
| Net unrealized appreciation | $48,762,626 |
| Capital loss carryforwards and deferrals | $(70,246,988) |
The difference between book-basis and tax-basis net unrealized appreciation/depreciation is attributable to differing treatments for the deferral of losses on wash sales.
At September 30, 2016, the cost of investments for federal tax purposes was $626,891,730. The net unrealized depreciation of investments for federal tax purposes excluding any unrealized appreciation resulting from the translation from FCs to U.S. dollars of assets and liabilities other than investments in securities was $48,764,225. This consists of net unrealized appreciation from investments for those securities having an excess of value over cost of $62,184,521 and net unrealized depreciation from investments for those securities having an excess of cost over value of $13,420,296.
At September 30, 2016, the Fund had a capital loss carryforward of $70,218,412 which will reduce the Fund's taxable income arising from future net realized gains on investments, if any, to the extent permitted by the Code, thereby reducing the amount of distributions to shareholders which would otherwise be necessary to relieve the Fund of any liability for federal income tax. Pursuant to the Code, a net capital loss incurred in taxable years beginning on or before December 22, 2010, is characterized as short-term and may be carried forward for a maximum of eight tax years (“Carryforward Limit”), whereas a net capital loss incurred in taxable years beginning after December 22, 2010, retains its character as either short-term or long-term, does not expire and is required to be utilized prior to the losses which have a Carryforward Limit.
The following schedule summarizes the Fund's capital loss carryforwards and expiration years:
| Expiration Year | Short-Term | Long-Term | Total |
| No Expiration | $57,816,931 | — | $57,816,931 |
| 2018 | $12,401,481 | NA | $12,401,481 |
Under current tax rules, a late-year ordinary loss may be deferred, in whole or in part, and treated as occurring on the first day of the following fiscal year. As of September 30, 2016, for federal income tax purposes, a late year ordinary loss of $28,576 was deferred to October 1, 2016.
5. INVESTMENT ADVISER FEE AND OTHER TRANSACTIONS WITH AFFILIATES
Investment Adviser Fee
The advisory agreement between the Fund and the Adviser provides for an annual fee equal to 0.75% of the Fund's average daily net assets. Subject to the terms described in the Expense Limitation note, the Adviser may voluntarily choose to waive any portion of its fee. For the year ended September 30, 2016, the Adviser voluntarily waived $299,866 of its fee. In addition, for the year ended September 30, 2016, an affiliate of the Adviser reimbursed $442,902 of transfer agent fees.
Annual Shareholder Report
Administrative Fee
Federated Administrative Services (FAS), under the Administrative Services Agreement, provides the Fund with administrative personnel and services. For purposes of determining the appropriate rate breakpoint, “Investment Complex” is defined as all of the Federated Funds subject to a fee under the Administrative Services Agreement. The fee paid to FAS is based on the average daily net assets of the Investment Complex as specified below, plus certain out-of-pocket expenses:
| Administrative Fee | Average Daily Net Assets
of the Investment Complex |
| 0.150% | on the first $5 billion |
| 0.125% | on the next $5 billion |
| 0.100% | on the next $10 billion |
| 0.075% | on assets in excess of $20 billion |
Subject to the terms described in the Expense Limitation note, FAS may voluntarily choose to waive any portion of its fee. For the year ended September 30, 2016, the annualized fee paid to FAS was 0.078% of average daily net assets of the Fund.
Distribution Services Fee
The Fund has adopted a Distribution Plan (the “Plan”) pursuant to Rule 12b-1 under the Act. Under the terms of the Plan, the Fund will compensate Federated Securities Corp. (FSC), the principal distributor, from the daily net assets of the Fund's Class A Shares, Class B Shares, Class C Shares and Class R Shares to finance activities intended to result in the sale of these shares. The Plan provides that the Fund may incur distribution expenses at the following percentages of average daily net assets annually, to compensate FSC:
| Share Class Name | Percentage of Average Daily
Net Assets of Class |
| Class A Shares | 0.05% |
| Class B Shares | 0.75% |
| Class C Shares | 0.75% |
| Class R Shares | 0.50% |
Subject to the terms described in the Expense Limitation note, FSC may voluntarily choose to waive any portion of its fee. For the year ended September 30, 2016, distribution services fees for the Fund were as follows:
| | Distribution
Services Fees
Incurred | Distribution
Services Fees
Waived |
| Class B Shares | $169,869 | $— |
| Class C Shares | 258,725 | (32) |
| Class R Shares | 108,423 | (54,212) |
| TOTAL | $537,017 | $(54,244) |
Annual Shareholder Report
When FSC receives fees, it may pay some or all of them to financial intermediaries whose customers purchase shares. For the year ended September 30, 2016, FSC retained $143,058 of fees paid by the Fund. For the year ended September 30, 2016, the Fund's Class A Shares did not incur a distribution services fee; however, it may begin to incur this fee upon approval of the Trustees.
Sales Charges
Front-end sales charges and contingent deferred sales charges (CDSC) do not represent expenses of the Fund. They are deducted from the proceeds of sales of Fund shares prior to investment or from redemption proceeds prior to remittance, as applicable. For the year ended September 30, 2016, FSC retained $18,475 in sales charges from the sale of Class A Shares. FSC also retained $118 of CDSC relating to redemptions of Class A Shares, $39,045 relating to redemptions of Class B Shares and $811 relating to redemptions of Class C Shares.
Other Service Fees
For the year ended September 30, 2016, FSSC received $314,430 and reimbursed $35 of the other service fees disclosed in Note 2.
Expense Limitation
The Adviser and certain of its affiliates (which may include FSC, FAS and FSSC) on their own initiative have agreed to waive certain amounts of their respective fees and/or reimburse expenses. Total annual fund operating expenses (as shown in the financial highlights, excluding interest expense, extraordinary expenses, line of credit expenses and proxy-related expenses paid by the Fund, if any) paid by the Fund's Class A Shares, Class B Shares, Class C Shares, Class R Shares and Institutional Shares (after the voluntary waivers and/or reimbursements) will not exceed 1.19%, 1.92%, 1.92%, 1.42% and 0.94% (the “Fee Limit”), respectively, up to but not including the later of (the “Termination Date”): (a) December 1, 2017; or (b) the date of the Fund's next effective Prospectus. While the Adviser and its applicable affiliates currently do not anticipate terminating or increasing these arrangements prior to the Termination Date, these arrangements may only be terminated or the Fee Limit increased prior to the Termination Date with the agreement of the Trustees.
Interfund Transactions
During the year ended September 30, 2016, the Fund engaged in sale transactions with funds that have a common investment adviser (or affiliated investment advisers), common Directors/Trustees, and/or common Officers. These sale transactions complied with Rule 17a-7 under the Act and amounted to $2,029,701.
General
Certain Officers and Trustees of the Fund are Officers and Directors or Trustees of certain of the above companies. To efficiently facilitate payment, Directors'/Trustees' fees and certain expenses related to conducting meetings of the Directors/Trustees and other miscellaneous expenses are paid by an affiliate of the Adviser which in due course are reimbursed by the Fund. Such expenses may be included in Accrued and Miscellaneous Expenses on the Statement of Assets and Liabilities and Statement of Operations, respectively.
Annual Shareholder Report
Transactions Involving Affiliated Holdings
Affiliated holdings are investment companies which are managed by the Adviser or an affiliate of the Adviser. The Adviser has agreed to reimburse the Fund for certain investment adviser fees as a result of transactions in other affiliated investment companies. For the year ended September 30, 2016, the Adviser reimbursed $26,732. Transactions involving the affiliated holding during the year ended September 30, 2016, were as follows:
| | Federated
Institutional
Prime Value
Obligations Fund,
Institutional Shares |
| Balance of Shares Held 9/30/2015 | 27,502,100 |
| Purchases/Additions | 357,316,550 |
| Sales/Reductions | (318,481,549) |
| Balance of Shares Held 9/30/2016 | 66,337,101 |
| Value | $66,337,101 |
| Dividend Income | $86,321 |
6. Investment TRANSACTIONS
Purchases and sales of investments, excluding long-term U.S. government securities and short-term obligations, for the year ended September 30, 2016, were as follows:
| Purchases | $546,310,009 |
| Sales | $735,099,387 |
7. LINE OF CREDIT
The Fund participates with certain other Federated Funds, on a several basis, in an up to $500,000,000 unsecured, 364-day, committed, revolving line of credit (LOC) agreement. The LOC was made available to finance temporarily the repurchase or redemption of shares of the Fund, failed trades, payment of dividends, settlement of trades and for other short-term, temporary or emergency general business purposes. The Fund cannot borrow under the LOC if an inter-fund loan is outstanding. The Fund's ability to borrow under the LOC also is subject to the limitations of the Act and various conditions precedent that must be satisfied before the Fund can borrow. Loans under the LOC are charged interest at a fluctuating rate per annum equal to the highest, on any day, of (a) (i) the federal funds effective rate, (ii) the one month London Interbank Offer Rate (LIBOR), and (iii) 0.0%, plus (b) a margin. The LOC also requires the Fund to pay, quarterly in arrears and at maturity, its pro rata share of a commitment fee based on the amount of the lenders' commitment that has not been utilized. As of September 30, 2016, the Fund had no outstanding loans. During the year ended September 30, 2016, the Fund did not utilize the LOC.
Annual Shareholder Report
8. INTERFUND LENDING
Pursuant to an Exemptive Order issued by the Securities and Exchange Commission (SEC), the Fund, along with other funds advised by subsidiaries of Federated Investors, Inc., may participate in an interfund lending program. This program provides an alternative credit facility allowing the Fund to borrow from other participating affiliated funds. As of September 30, 2016, there were no outstanding loans. During the year ended September 30, 2016, the program was not utilized.
9. SPIN-OFF DISTRIBUTION
As presented in the Fund's September 30, 2014 Annual Report, Starwood Property Trust, Inc. (STWD), a real estate investment trust (REIT) owned by the Fund, completed a spinoff of Starwood Waypoint Residential Trust (SWAY). The company's public disclosure related to this spin-off indicated that the taxability of the distribution of SWAY common stock, as well as the remainder of its distributions for its tax year, and the corresponding effect on the investor's tax basis of STWD common stock would not be known until early in 2015. Accordingly, the additional income from the spin-off of $6,283,082, as well as income from STWD's normal quarterly distributions was not distributed by the Fund until December, 2014 when a dividend was required to be paid in order for the Fund to avoid a calendar-year-based excise tax. As this dividend needed to be paid prior to STWD's disclosure of the taxability of its distributions, it was necessary to estimate the taxable portion in calculating the amount that the Fund would pay. In early 2015, STWD disclosed that 70.6% of its distributions were deemed a return of capital (ROC) for tax purposes. Therefore, during the year ended September 30, 2015, the applicable ROC amount was reclassified from dividend income to identified cost for financial statement purposes.
10. REGULATORY MATTERS
On October 13, 2016, the SEC amended existing rules intended to modernize reporting and disclosure of information. These amendments relate to Regulation S-X which sets forth the form and content of financial statements. At this time, management is evaluating the implications of adopting these amendments and their impact on the financial statements and accompanying notes.
11. FEDERAL TAX INFORMATION (UNAUDITED)
For the fiscal year ended September 30, 2016, 100% of total income distributions made by the Fund are qualifying dividends which may be subject to a maximum tax rate of 15%, as provided for by the Jobs and Growth Tax Relief Act of 2003. Complete information is reported in conjunction with the reporting of your distributions on Form 1099-DIV.
Of the ordinary income distributions made by the Fund during the year ended September 30, 2016, 100% qualify for the dividend received deduction available to corporate shareholders.
Annual Shareholder Report
Report of Independent Registered Public Accounting Firm
TO THE BOARD OF TRUSTEES OF the federated Equity Funds AND THE SHAREHOLDERS OF FEDERATED Clover value fund:
We have audited the accompanying statement of assets and liabilities, including the portfolio of investments, of the Federated Clover Value Fund (the “Fund”), a portfolio of Federated Equity Funds as of September 30, 2016, and the related statement of operations for the year then ended, the statements of changes in net assets for each of the years in the two-year period then ended, and the financial highlights for each of the years in the five-year period then ended. These financial statements and financial highlights are the responsibility of the Fund's management. Our responsibility is to express an opinion on these financial statements and financial highlights based on our audits.
We conducted our audits in accordance with the standards of the Public Company Accounting Oversight Board (United States). Those standards require that we plan and perform the audit to obtain reasonable assurance about whether the financial statements and financial highlights are free of material misstatement. An audit includes examining, on a test basis, evidence supporting the amounts and disclosures in the financial statements. Our procedures included confirmation of securities owned as of September 30, 2016, by correspondence with the custodian or brokers or by other appropriate auditing procedures. An audit also includes assessing the accounting principles used and significant estimates made by management, as well as evaluating the overall financial statement presentation. We believe that our audits provide a reasonable basis for our opinion.
In our opinion, the financial statements and financial highlights referred to above present fairly, in all material respects, the financial position of the Federated Clover Value Fund as of September 30, 2016, and the results of its operations for the year then ended, the changes in its net assets for each of the years in the two-year period then ended, and the financial highlights for each of the years in the five-year period then ended, in conformity with U.S. generally accepted accounting principles.
Boston, Massachusetts
November 22, 2016
Annual Shareholder Report
Shareholder Expense Example (unaudited)
As a shareholder of the Fund, you incur two types of costs: (1) transaction costs, including sales charges (loads) on purchase or redemption payments; and (2) ongoing costs, including management fees and to the extent applicable, distribution (12b-1) fees and/or other service fees and other Fund expenses. This Example is intended to help you to understand your ongoing costs (in dollars) of investing in the Fund and to compare these costs with the ongoing costs of investing in other mutual funds. It is based on an investment of $1,000 invested at the beginning of the period and held for the entire period from April 1, 2016 to September 30, 2016.
ACTUAL EXPENSES
The first section of the table below provides information about actual account values and actual expenses. You may use the information in this section, together with the amount you invested, to estimate the expenses that you incurred over the period. Simply divide your account value by $1,000 (for example, an $8,600 account value divided by $1,000 = 8.6), then multiply the result by the number in the first section under the heading entitled “Expenses Paid During Period” to estimate the expenses attributable to your investment during this period.
HYPOTHETICAL EXAMPLE FOR COMPARISON PURPOSES
The second section of the table below provides information about hypothetical account values and hypothetical expenses based on the Fund's actual expense ratio and an assumed rate of return of 5% per year before expenses, which is not the Fund's actual return. Thus, you should not use the hypothetical account values and expenses to estimate the actual ending account balance or your expenses for the period. Rather, these figures are required to be provided to enable you to compare the ongoing costs of investing in the Fund with other funds. To do so, compare this 5% hypothetical example with the 5% hypothetical examples that appear in the shareholder reports of the other funds.
Annual Shareholder Report
Please note that the expenses shown in the table are meant to highlight your ongoing costs only and do not reflect any transaction costs, such as sales charges (loads) on purchase or redemption payments. Therefore, the second section of the table is useful in comparing ongoing costs only, and will not help you determine the relative total costs of owning different funds. In addition, if these transaction costs were included, your costs would have been higher.
| | Beginning
Account Value
4/1/2016 | Ending
Account Value
9/30/2016 | Expenses Paid
During Period1 |
| Actual: | | | |
| Class A Shares | $1,000 | $1,052.60 | $6.11 |
| Class B Shares | $1,000 | $1,048.50 | $9.83 |
| Class C Shares | $1,000 | $1,048.50 | $9.83 |
| Class R Shares | $1,000 | $1,051.50 | $7.18 |
| Institutional Shares | $1,000 | $1,053.40 | $4.83 |
Hypothetical (assuming a 5% return
before expenses): | | | |
| Class A Shares | $1,000 | $1,019.05 | $6.01 |
| Class B Shares | $1,000 | $1,015.40 | $9.67 |
| Class C Shares | $1,000 | $1,015.40 | $9.67 |
| Class R Shares | $1,000 | $1,018.00 | $7.06 |
| Institutional Shares | $1,000 | $1,020.30 | $4.75 |
| 1 | Expenses are equal to the Fund's annualized net expense ratios, multiplied by the average account value over the period, multiplied by 183/366 (to reflect the one-half-year period). The annualized net expense ratios are as follows: |
| | |
| Class A Shares | 1.19% |
| Class B Shares | 1.92% |
| Class C Shares | 1.92% |
| Class R Shares | 1.40% |
| Institutional Shares | 0.94% |
Annual Shareholder Report
Board of Trustees and Trust Officers
The Board of Trustees is responsible for managing the Trust's business affairs and for exercising all the Trust's powers except those reserved for the shareholders. The following tables give information about each Trustee and the senior officers of the Fund. Where required, the tables separately list Trustees who are “interested persons” of the Fund (i.e., “Interested” Trustees) and those who are not (i.e., “Independent” Trustees). Unless otherwise noted, the address of each person listed is Federated Investors Tower, 1001 Liberty Avenue, Pittsburgh, PA 15222. The address of all Independent Trustees listed is 4000 Ericsson Drive, Warrendale, PA 15086-7561; Attention: Mutual Fund Board. As of December 31, 2015, the Trust comprised 14 portfolio(s), and the Federated Fund Family consisted of 38 investment companies (comprising 122 portfolios). Unless otherwise noted, each Officer is elected annually. Unless otherwise noted, each Trustee oversees all portfolios in the Federated Fund Family and serves for an indefinite term. The Fund's Statement of Additional Information includes additional information about Trust Trustees and is available, without charge and upon request, by calling 1-800-341-7400.
Interested TRUSTEES Background
Name
Birth Date
Positions Held with Trust
Date Service Began | Principal Occupation(s) for Past Five Years,
Other Directorships Held and Previous Position(s) |
J. Christopher Donahue*
Birth Date: April 11, 1949
President and Trustee
Indefinite Term
Began serving: September 1999 | Principal Occupations: Principal Executive Officer and President of certain of the Funds in the Federated Fund Family; Director or Trustee of the Funds in the Federated Fund Family; President, Chief Executive Officer and Director, Federated Investors, Inc.; Chairman and Trustee, Federated Investment Management Company; Trustee, Federated Investment Counseling; Chairman and Director, Federated Global Investment Management Corp.; Chairman, Federated Equity Management Company of Pennsylvania and Passport Research, Ltd. (investment advisory subsidiary of Federated); Trustee, Federated Shareholder Services Company; Director, Federated Services Company.
Previous Positions: President, Federated Investment Counseling; President and Chief Executive Officer, Federated Investment Management Company, Federated Global Investment Management Corp. and Passport Research, Ltd. |
Annual Shareholder Report
Name
Birth Date
Positions Held with Trust
Date Service Began | Principal Occupation(s) for Past Five Years,
Other Directorships Held and Previous Position(s) |
John B. Fisher*
Birth Date: May 16, 1956
Trustee
Indefinite Term
Began serving: May 2016 | Principal Occupations: Principal Executive Officer and President of certain of the Funds in the Federated Fund Family; Director or Trustee of certain of the Funds in the Federated Fund Family; Vice President, Federated Investors, Inc.; President, Director/Trustee and CEO, Federated Advisory Services Company, Federated Equity Management Company of Pennsylvania, Federated Global Investment Management Corp., Federated Investment Counseling, Federated Investment Management Company; President and CEO of Passport Research, Ltd.; President of some of the Funds in the Federated Fund Complex and Director, Federated Investors Trust Company.
Previous Positions: President and Director of the Institutional Sales Division of Federated Securities Corp.; President and Director of Federated Investment Counseling; Director, Edgewood Securities Corp.; Director, Federated Services Company; Director, Federated Investors, Inc.; Chairman and Director, Southpointe Distribution Services, Inc. and President, Technology, Federated Services Company. |
| * | Reasons for “interested” status: J. Christopher Donahue and John B. Fisher are interested due to their beneficial ownership of shares of Federated Investors, Inc. and due to positions they hold with Federated and its subsidiaries. J. Christopher Donahue is the son of John F. Donahue, Chairman Emeritus of the Federated Funds. |
INDEPENDENT TRUSTEES Background
Name
Birth Date
Positions Held with Trust
Date Service Began | Principal Occupation(s) for Past Five Years,
Other Directorships Held, Previous Position(s) and Qualifications |
John T. Collins
Birth Date: January 24, 1947
Trustee
Indefinite Term
Began serving: October 2013 | Principal Occupations: Director or Trustee of the Federated Fund Family; Retired.
Other Directorships Held: Director, Chair of the Compensation Committee, Audit Committee member, KLX Corp.
Qualifications: Mr. Collins has served in several business and financial management roles and directorship positions throughout his career. Mr. Collins previously served as Chairman and CEO, The Collins Group, Inc. (a private equity firm). Mr. Collins serves as Chairman Emeriti, Bentley University. Mr. Collins previously served as Director, FleetBoston Financial Corp.; Director and Audit Committee Member, Bank of America Corp. and Director, Beth Israel Deaconess Medical Center (Harvard University Affiliate Hospital). |
Annual Shareholder Report
Name
Birth Date
Positions Held with Trust
Date Service Began | Principal Occupation(s) for Past Five Years,
Other Directorships Held, Previous Position(s) and Qualifications |
G. Thomas Hough
Birth Date: February 28, 1955
Trustee
Indefinite Term
Began serving: August 2015 | Principal Occupations: Director or Trustee of the Federated Fund Family; Retired.
Other Directorships Held: Director, Chair of the Audit Committee, Governance Committee, Publix Super Markets, Inc.; Director, Equifax, Inc.
Qualifications: Mr. Hough has served in accounting, business management and directorship positions throughout his career. Mr. Hough most recently held the position of Americas Vice Chair of Assurance with Ernst & Young LLP. Mr. Hough is an Executive Committee member of the United States Golf Association, he serves on the President's Cabinet and Business School Board of Visitors for the University of Alabama and is on the Business School Board of Visitors for Wake Forest University. |
Maureen Lally-Green
Birth Date: July 5, 1949
Trustee
Indefinite Term
Began serving: August 2009 | Principal Occupations: Director or Trustee of the Federated Fund Family; Interim Dean of the Duquesne University School of Law; Adjunct Professor of Law, Duquesne University School of Law.
Other Directorships Held: Director, CONSOL Energy Inc.
Qualifications: Judge Lally-Green has served in various legal and business roles and directorship positions throughout her career. Judge Lally-Green previously served as: Associate General Secretary, Diocese of Pittsburgh; a member of the Superior Court of Pennsylvania; and as a Professor of Law, Duquesne University School of Law. Judge Lally-Green also holds the positions on either a public or not for profit Board of Directors as follows: Member, Pennsylvania State Board of Education (public); Director and Chair, UPMC Mercy Hospital; Regent, St. Vincent Seminary; Director and Vice Chair, Our Campaign for the Church Alive!, Inc.; Director, Saint Vincent College; and Director and Chair, Cardinal Wuerl North Catholic High School, Inc. Judge Lally-Green has held the positions of: Director, Auberle; Director, Ireland Institute of Pittsburgh; Director, Saint Thomas More Society; and Director, Catholic High Schools of the Diocese of Pittsburgh, Inc. |
Peter E. Madden
Birth Date: March 16, 1942
Trustee
Indefinite Term
Began serving: November 1991 | Principal Occupation: Director or Trustee, and Chair of the Board of Directors or Trustees, of the Federated Fund Family; Retired.
Other Directorships Held: None.
Qualifications: Mr. Madden has served in several business management, mutual fund services and directorship positions throughout his career. Mr. Madden previously served as President, Chief Operating Officer and Director, State Street Bank and Trust Company (custodian bank) and State Street Corporation (financial services). He was Director, VISA USA and VISA International and Chairman and Director, Massachusetts Bankers Association. Mr. Madden served as Director, Depository Trust Corporation and Director, The Boston Stock Exchange. Mr. Madden also served as a Representative to the Commonwealth of Massachusetts General Court. |
Annual Shareholder Report
Name
Birth Date
Positions Held with Trust
Date Service Began | Principal Occupation(s) for Past Five Years,
Other Directorships Held, Previous Position(s) and Qualifications |
Charles F. Mansfield, Jr.
Birth Date: April 10, 1945
Trustee
Indefinite Term
Began serving: January 1999 | Principal Occupations: Director or Trustee of the Federated Fund Family; Management Consultant.
Other Directorships Held: None.
Qualifications: Mr. Mansfield has served in several banking, business management and educational roles and directorship positions throughout his career. Mr. Mansfield previously served as Chief Executive Officer, PBTC International Bank; Partner, Arthur Young & Company (now Ernst & Young LLP); Chief Financial Officer of Retail Banking Sector, Chase Manhattan Bank; Senior Vice President, HSBC Bank USA (formerly, Marine Midland Bank); Vice President, Citibank; Assistant Professor of Banking and Finance, Frank G. Zarb School of Business, Hofstra University; Executive Vice President DVC Group, Inc. (marketing, communications and technology). |
Thomas M. O'Neill
Birth Date: June 14, 1951
Trustee
Indefinite Term
Began serving: August 2006 | Principal Occupations: Director or Trustee, Chair of the Audit Committee of the Federated Fund Family; Sole Proprietor, Navigator Management Company (investment and strategic consulting).
Other Directorships Held: None.
Qualifications: Mr. O'Neill has served in several business, mutual fund and financial management roles and directorship positions throughout his career. Mr. O'Neill serves as Director, Medicines for Humanity and Director, The Golisano Children's Museum of Naples, Florida. Mr. O'Neill previously served as Chief Executive Officer and President, Managing Director and Chief Investment Officer, Fleet Investment Advisors; President and Chief Executive Officer, Aeltus Investment Management, Inc.; General Partner, Hellman, Jordan Management Co., Boston, MA; Chief Investment Officer, The Putnam Companies, Boston, MA; Credit Analyst and Lending Officer, Fleet Bank; Director and Consultant, EZE Castle Software (investment order management software); and Director, Midway Pacific (lumber). |
P. Jerome Richey
Birth Date: February 23, 1949
Trustee
Indefinite Term
Began serving: October 2013 | Principal Occupations: Director or Trustee of the Federated Fund Family; Management Consultant.
Other Directorships Held: None.
Qualifications: Mr. Richey has served in several business and legal management roles and directorship positions throughout his career. Mr. Richey most recently held the positions of Senior Vice Chancellor and Chief Legal Officer, University of Pittsburgh. Mr. Richey serves as Board Member, Epilepsy Foundation of Western Pennsylvania and Board member, World Affairs Council of Pittsburgh. Mr. Richey previously served as Chief Legal Officer and Executive Vice President, CONSOL Energy Inc. and Shareholder, Buchanan Ingersoll & Rooney PC (a law firm). |
Annual Shareholder Report
Name
Birth Date
Positions Held with Trust
Date Service Began | Principal Occupation(s) for Past Five Years,
Other Directorships Held, Previous Position(s) and Qualifications |
John S. Walsh
Birth Date: November 28, 1957
Trustee
Indefinite Term
Began serving: January 1999 | Principal Occupations: Director or Trustee of the Federated Fund Family; President and Director, Heat Wagon, Inc. (manufacturer of construction temporary heaters); President and Director, Manufacturers Products, Inc. (distributor of portable construction heaters); President, Portable Heater Parts, a division of Manufacturers Products, Inc.
Other Directorships Held: None.
Qualifications: Mr. Walsh has served in several business management roles and directorship positions throughout his career. Mr. Walsh previously served as Vice President, Walsh & Kelly, Inc. (paving contractors). |
OFFICERS
Name
Birth Date
Address
Positions Held with Trust
Date Service Began | Principal Occupation(s) for Past Five Years
and Previous Position(s) |
John W. McGonigle
Birth Date: October 26, 1938
EXECUTIVE VICE PRESIDENT AND SECRETARY
Officer since: April 1984 | Principal Occupations: Executive Vice President and Secretary of the Federated Fund Family; Vice Chairman, Executive Vice President, Secretary and Director, Federated Investors, Inc.
Previous Positions: Trustee, Federated Investment Management Company and Federated Investment Counseling; Director, Federated Global Investment Management Corp., Federated Services Company and Federated Securities Corp. |
Lori A. Hensler
Birth Date: January 6, 1967
TREASURER
Officer since: April 2013 | Principal Occupations: Principal Financial Officer and Treasurer of the Federated Fund Family; Senior Vice President, Federated Administrative Services; Financial and Operations Principal for Federated Securities Corp. and Edgewood Services, Inc.; and Assistant Treasurer, Federated Investors Trust Company. Ms. Hensler has received the Certified Public Accountant designation.
Previous Positions: Controller of Federated Investors, Inc.; Senior Vice President and Assistant Treasurer, Federated Investors Management Company; Treasurer, Federated Investors Trust Company; Assistant Treasurer, Federated Administrative Services, Federated Administrative Services, Inc., Federated Securities Corp., Edgewood Services, Inc., Federated Advisory Services Company, Federated Equity Management Company of Pennsylvania, Federated Global Investment Management Corp., Federated Investment Counseling, Federated Investment Management Company, Passport Research, Ltd., and Federated MDTA, LLC; Financial and Operations Principal for Federated Securities Corp., Edgewood Services, Inc. and Southpointe Distribution Services, Inc. |
Annual Shareholder Report
Name
Birth Date
Address
Positions Held with Trust
Date Service Began | Principal Occupation(s) for Past Five Years
and Previous Position(s) |
Richard B. Fisher
Birth Date: May 17, 1923
VICE PRESIDENT
Officer since: April 1987 | Principal Occupations: Vice Chairman or Vice President of some of the Funds in the Federated Fund Family; Vice Chairman, Federated Investors, Inc.; Chairman, Federated Securities Corp.
Previous Positions: President and Director or Trustee of some of the Funds in the Federated Fund Family; Executive Vice President, Federated Investors, Inc.; Director and Chief Executive Officer, Federated Securities Corp. |
Peter J. Germain
Birth Date: September 3, 1959
CHIEF LEGAL OFFICER
Officer since: January 2005 | Principal Occupations: Mr. Germain is Chief Legal Officer of the Federated Fund Family. He is General Counsel and Vice President, Federated Investors, Inc.; President, Federated Administrative Services and Federated Administrative Services, Inc.; Vice President, Federated Securities Corp.; Secretary, Federated Private Asset Management, Inc.; and Secretary, Retirement Plan Service Company of America. Mr. Germain joined Federated in 1984 and is a member of the Pennsylvania Bar Association.
Previous Positions: Deputy General Counsel, Special Counsel, Managing Director of Mutual Fund Services, Federated Investors, Inc.; Senior Vice President, Federated Services Company; and Senior Corporate Counsel, Federated Investors, Inc. |
Stephen Van Meter
Birth Date: June 5, 1975
CHIEF COMPLIANCE OFFICER AND SENIOR VICE PRESIDENT
Officer since: July 2015 | Principal Occupations: Senior Vice President and Chief Compliance Officer of the Federated Fund Family; Vice President and Chief Compliance Officer of Federated Investors, Inc. and Chief Compliance Officer of certain of its subsidiaries. Mr. Van Meter joined Federated in October 2011. He holds FINRA licenses under Series 3, 7, 24 and 66.
Previous Positions: Mr. Van Meter previously held the position of Compliance Operating Officer, Federated Investors, Inc. Prior to joining Federated, Mr. Van Meter served at the United States Securities and Exchange Commission in the positions of Senior Counsel, Office of Chief Counsel, Division of Investment Management and Senior Counsel, Division of Enforcement. |
Stephen F. Auth
Birth Date: September 13, 1956
101 Park Avenue
41st Floor
New York, NY 10178
CHIEF INVESTMENT OFFICER
Officer since: November 2002 | Principal Occupations: Stephen F. Auth is Chief Investment Officer of various Funds in the Federated Fund Family; Executive Vice President, Federated Investment Counseling, Federated Global Investment Management Corp. and Federated Equity Management Company of Pennsylvania.
Previous Positions: Executive Vice President, Federated Investment Management Company and Passport Research, Ltd. (investment advisory subsidiary of Federated); Senior Vice President, Global Portfolio Management Services Division; Senior Vice President, Federated Investment Management Company and Passport Research, Ltd.; Senior Managing Director and Portfolio Manager, Prudential Investments. |
Annual Shareholder Report
Evaluation and Approval of Advisory Contract–May 2016
Federated Clover Value Fund (the “Fund”)
Following a review and recommendation of approval by the Fund's independent trustees, the Fund's Board of Trustees (the “Board”) reviewed and unanimously approved at its May 2016 meetings the continuation of the Fund's investment advisory contract for an additional one-year term. The Board's decision regarding the contract reflects the exercise of its business judgment after consideration of all of the information received on whether to continue the existing arrangements.
The Board had previously appointed a Senior Officer, whose duties include specified responsibilities relating to the process by which advisory fees are to be charged to a Federated fund. The Senior Officer has the authority to retain consultants, experts, or staff as may be reasonably necessary to assist in the performance of his duties, reports directly to the Board, and may be terminated only with the approval of a majority of the independent members of the Board. The Senior Officer prepared and furnished to the Board an independent, written evaluation that covered topics discussed below (the “Senior Officer's Evaluation”). The Board considered the Senior Officer's Evaluation, along with other information, in deciding to approve the investment advisory contract.
The Board is also familiar with and considered judicial decisions concerning allegedly excessive investment advisory fees, which have indicated that the following factors may be relevant to an adviser's fiduciary duty with respect to its receipt of compensation from a fund: the nature and quality of the services provided by an adviser to a fund and its shareholders, including the performance and fees and expenses of the fund and of comparable funds; an adviser's cost of providing the services, including the profitability to an adviser of providing advisory services to a fund; the extent to which an adviser may realize “economies of scale” as a fund grows larger and, if such economies of scale exist, whether they have been shared with a fund and its shareholders or the family of funds; any “fall-out financial benefits” that accrue to an adviser because of its relationship with a fund (including research services received from brokers that execute fund trades and any fees paid to affiliates of an adviser for services rendered to a fund); comparative fee and expense structures, including a comparison of fees paid to an adviser with those paid by similar funds; and the extent of care, conscientiousness and independence with which board members perform their duties and their expertise, including whether they are fully informed about all facts the board deems relevant to its consideration of an adviser's services and fees. The Board noted that the Securities and Exchange Commission (“SEC”) disclosure requirements regarding the basis for the Board's approval of the Fund's investment advisory contract generally track the factors listed above. Consistent with these judicial decisions and SEC disclosure requirements, the Board also considered management fees charged to
Annual Shareholder Report
institutional and other clients of Federated Global Investment Management Corp. (the “Adviser”) for what might be viewed as like services. The Board was aware of these factors and was guided by them in its review of the Fund's investment advisory contract to the extent it considered them to be appropriate and relevant, as discussed further below.
The Board considered and weighed these circumstances in light of its substantial accumulated experience in governing the Fund and working with Federated Investors, Inc. and its affiliates (“Federated”) on matters relating to the Federated funds, and was assisted in its deliberations by independent legal counsel. Throughout the year, and in connection with its May meetings, the Board requested and received substantial and detailed information about the Fund and the Federated organization that was in addition to the extensive materials that comprise and accompany the Senior Officer's Evaluation. Federated provided much of this information at each regular meeting of the Board, and furnished additional substantial information in connection with the May meetings at which the Board's formal review of the investment advisory contract occurred. At the May meetings in addition to meeting in separate sessions of the independent trustees without management present, senior management of the Adviser also met with the independent trustees and their counsel to discuss the materials presented and any other matters thought relevant by the Adviser or the trustees. Between regularly scheduled meetings, the Board also received information on particular matters as the need arose. Thus, the Board's consideration of the investment advisory contract included review of the Senior Officer's Evaluation, accompanying data and additional information covering such matters as: the Adviser's investment philosophy, revenue, profitability, personnel and processes; investment and operating strategies; the Fund's short- and long-term performance (in absolute terms, both on a gross basis and net of expenses, as well as in relationship to its particular investment program and certain competitor or “peer group” funds and/or other benchmarks, as appropriate), and comments on the reasons for performance; the Fund's investment objectives; the Fund's expenses (including the advisory fee itself and the overall expense structure of the Fund, both in absolute terms and relative to similar and/or competing funds, with due regard for contractual or voluntary expense limitations); the use and allocation of brokerage commissions derived from trading the Fund's portfolio securities (if any); and the nature, quality and extent of the advisory and other services provided to the Fund by the Adviser and its affiliates. The Board also considered the preferences and expectations of Fund shareholders; the entrepreneurial risk assumed by the Adviser in sponsoring the Fund; the continuing state of competition in the mutual fund industry and market practices; the range of comparable fees for similar funds in the mutual fund industry; the Fund's relationship to the Federated funds which include a comprehensive array of funds with different investment objectives, policies and strategies which are generally available for exchange without the incurrence of additional sales charges; compliance and
Annual Shareholder Report
audit reports concerning the Federated funds and the Federated companies that service them (including communications from regulatory agencies), as well as Federated's responses to any issues raised therein; and relevant developments in the mutual fund industry and how the Federated funds and/or Federated are responding to them. The Board's evaluation process is evolutionary. The criteria considered and the emphasis placed on relevant criteria change in recognition of changing circumstances in the mutual fund marketplace.
While mindful that courts have cautioned against giving such comparisons too much weight, the Board has found the use of comparisons of the Fund's fees and expenses to other mutual funds with comparable investment programs to be relevant to its deliberations. In this regard, the Board was presented with, and considered, information regarding the contractual advisory fee rates, net advisory fee rates, total expense ratios and each element of the Fund's total expense ratio (i.e., gross and net advisory fees, custody fees, portfolio accounting fees and transfer agency fees) relative to the Fund's peers. The Board focused on comparisons with other similar mutual funds more heavily than non-mutual fund products or services because it is believed that they are more relevant. For example, other mutual funds are the products most like the Fund, they are readily available to Fund shareholders as alternative investment vehicles, and they are the type of investment vehicle in fact chosen and maintained by the Fund's investors. The range of their fees and expenses therefore appears to be a relevant indicator of what consumers have found to be reasonable in the precise marketplace in which the Fund competes.
The Board reviewed the contractual advisory fee rate, net advisory fee rate where partially waived and other expenses of the Fund and noted the position of the Fund's fee rates relative to its peers. In this regard, the Board noted that the contractual advisory fee rate was above the median of the relevant peer group, but the Board noted the applicable waivers and reimbursements, and that the overall expense structure of the Fund remained competitive in the context of other factors considered by the Board.
By contrast, the Senior Officer has reviewed Federated's fees for providing advisory services to products outside the Federated funds (e.g., institutional and separate accounts and sub-adviser services). He concluded that mutual funds and institutional accounts are inherently different products. Those differences include, but are not limited to, different types of targeted investors; being subject to different laws and regulations; different legal structures; different average account sizes and portfolio management techniques made necessary by different cash flows and different associated costs; and the time spent by portfolio managers and their teams, funds financial services, legal, compliance and risk management in reviewing securities pricing, addressing different administrative responsibilities, addressing different degrees of risk associated with management and a variety of different costs. The Senior Officer did not consider the fees for providing advisory services to these outside products to be determinative in judging the appropriateness of mutual fund advisory fees.
Annual Shareholder Report
The Senior Officer noted that the services, administrative responsibilities and risks associated with such relationships are quite different than serving as a primary adviser to a fund.
Following such evaluation, the Board concluded, within the context of its full deliberations, that the expenses of the Fund are reasonable and supported renewal of the investment advisory contract with respect to the Fund.
The Board considered the nature, extent and quality of the services provided to the Fund by the Adviser and the resources of the Adviser and its affiliates dedicated to the Fund. In this regard, the Board evaluated, among other things, the Adviser's personnel, experience, track record, overall reputation and willingness to invest in personnel and infrastructure that benefit the Fund. In addition, the Board reviewed the qualifications, backgrounds and responsibilities of the portfolio management team primarily responsible for the day-to-day management of the Fund. The Board noted the compliance programs of and the compliance-related resources provided to the Fund by the Adviser. The Fund's ability to deliver competitive performance when compared to its peer group was also deemed to be relevant by the Board as a useful indicator of how the Adviser is executing the Fund's investment program, which in turn was one of the Board's considerations in reaching a conclusion that the nature, extent, and quality of the Adviser's investment management services were such as to warrant continuation of the investment advisory contract.
In evaluating the Fund's investment performance, the Board considered performance results in light of the Fund's investment objective, strategies and risks, as disclosed in the Fund's prospectus. The Board particularly considered detailed investment reports on the Fund's performance provided to the Board throughout the year and in connection with the May meetings. The Senior Officer also reviewed information compiled by Federated, using data supplied by independent fund ranking organizations, regarding the performance of, and fees charged by, other mutual funds, noting his view that comparisons to fund peer groups may be helpful, though not conclusive, in judging the reasonableness of the proposed fees. The Board considered, in evaluating such comparisons, that in some cases individual funds may exhibit significant and unique differences in their objectives and management techniques when compared to other funds within an industry peer group.
The Fund's performance fell below the median of the relevant peer group for the one-year, three-year and five-year periods covered by the Senior Officer's Evaluation. The Board discussed the Fund's performance with the Adviser and recognized the efforts being taken by the Adviser in the context of the other factors considered relevant by the Board.
Following such evaluation, the Board concluded, within the context of its full deliberations, that the performance of the Fund supported renewal of the investment advisory contract with respect to the Fund.
Annual Shareholder Report
The Board also received financial information about Federated, including information regarding the compensation and ancillary (or “fall-out”) benefits Federated derived from its relationships with the Federated funds. This information covered not only the fees under the investment advisory contracts, but also fees received by Federated's subsidiaries for providing other services to the Federated funds under separate contracts (e.g., for serving as the Federated funds' administrator). The information also detailed any indirect benefit Federated may derive from its receipt of research services from brokers who execute Federated fund trades. In addition, the Board considered the fact that, in order for a fund to be competitive in the marketplace, Federated and its affiliates frequently waived fees and/or reimbursed expenses and have disclosed to fund investors and/or indicated to the Board their intention to do so in the future, where appropriate. Moreover, the Board receives regular reporting as to the institution, adjustment or elimination of these voluntary waivers. The Board considered Federated's previous reductions in contractual management fees to certain funds in response to the Senior Officer's recommendations.
Federated furnished information, requested by the Senior Officer, that reported revenues on a fund-by-fund basis and made estimates of the allocation of expenses on a fund-by-fund basis, using allocation methodologies specified by the Senior Officer. The Senior Officer noted that, while these cost allocation reports apply consistent allocation processes, the inherent difficulties in allocating costs continues to cause the Senior Officer to question the precision of the process and to conclude that such reports may be unreliable, since a single change in an allocation estimate may dramatically alter the resulting estimate of cost and/or profitability of a fund and may produce unintended consequences. The allocation information, including the Senior Officer's view that fund-by-fund estimations may be unreliable, was considered in the analysis by the Board.
The Board and the Senior Officer also reviewed information compiled by Federated comparing profitability information for Federated to other publicly held fund management companies. In this regard, the Senior Officer concluded that Federated's profit margins did not appear to be excessive. The Senior Officer also noted that Federated appeared financially sound, with the resources to fulfill its obligations under its contracts with the Fund.
The Senior Officer's Evaluation also discussed the notion of possible realization of “economies of scale” as a fund grows larger. The Board considered in this regard that the Adviser has made significant and long-term investments in areas that support all of the Federated funds, such as personnel and processes for the portfolio management, shareholder services, compliance, internal audit, and risk management functions, as well as systems technology (including technology relating to cybersecurity), and that the benefits of these efforts (as well as any economies of scale, should they exist) were likely to be enjoyed by the fund family as a whole. The Board noted that the Adviser's investments in these areas are extensive. In addition, the Board considered that Federated and its affiliates have frequently waived fees and/or reimbursed expenses and that this has
Annual Shareholder Report
allowed fund shareholders to share potential economies of scale from a fund's inception. Federated, as it does throughout the year, and again in connection with the Board's review, furnished information relative to revenue sharing or adviser paid fees. Federated and the Senior Officer noted that this information should be viewed to determine if there was an incentive to either not apply breakpoints or to apply breakpoints at higher levels and should not be viewed to determine the appropriateness of advisory fees, because it would represent marketing and distribution expenses. Finally, the Board also noted the absence of any applicable regulatory or industry guidelines on this subject, which (as discussed in the Senior Officer's Evaluation) is compounded by the lack of any common industry practice or general pattern with respect to structuring fund advisory fees with “breakpoints” that serve to reduce the fee as a fund attains a certain size.
The Senior Officer noted that, subject to the comments and recommendations made within the Senior Officer's Evaluation, his observations and the information accompanying the Senior Officer's Evaluation supported a finding by the Board that the management fee for the fund was reasonable. Under these circumstances, no changes were recommended to, and no objection was raised to, the continuation of the Fund's investment advisory contract.
In its decision to continue an existing investment advisory contract, the Board was mindful of the potential disruptions of the Fund's operations and various risks, uncertainties and other effects that could occur as a result of a decision to terminate or not renew an investment advisory contract. In particular, the Board recognized that many shareholders have invested in the Fund on the strength of the Adviser's industry standing and reputation and with the expectation that the Adviser will have a continuing role in providing advisory services to the Fund. Thus, the Board's approval of the investment advisory contract reflected the fact that it is the shareholders who have effectively selected the Adviser by virtue of having invested in the Fund. The Board concluded that, in light of the factors discussed above, including the nature, quality and scope of the services provided to the Fund by the Adviser and its affiliates, continuation of the investment advisory contract was appropriate.
The Board based its decision to approve the investment advisory contract on the totality of the circumstances and relevant factors and with a view to past and future long-term considerations. Not all of the factors and considerations identified above were necessarily relevant to the Fund, nor did the Board consider any one of them to be determinative. With respect to the factors that were relevant, the Board's decision to approve the continuation of the contract reflects its determination that Federated's performance and actions provided a satisfactory basis to support the decision to continue the existing arrangement.
Annual Shareholder Report
Voting Proxies on Fund Portfolio Securities
A description of the policies and procedures that the Fund uses to determine how to vote proxies, if any, relating to securities held in the Fund's portfolio is available, without charge and upon request, by calling 1-800-341-7400. A report on “Form N-PX” of how the Fund voted any such proxies during the most recent 12-month period ended June 30 is available via the Proxy Voting Record (Form N-PX) link associated with the Fund and share class name at www.FederatedInvestors.com/FundInformation. Form N-PX filings are also available at the SEC's website at www.sec.gov.
Quarterly Portfolio Schedule
The Fund files with the SEC a complete schedule of its portfolio holdings, as of the close of the first and third quarters of its fiscal year, on “Form N-Q.” These filings are available on the SEC's website at www.sec.gov and may be reviewed and copied at the SEC's Public Reference Room in Washington, DC. (Call 1-800-SEC-0330 for information on the operation of the Public Reference Room.) You may also access this information via the link to the Fund and share class name at www.FederatedInvestors.com/FundInformation.
Annual Shareholder Report
Mutual funds are not bank deposits or obligations, are not guaranteed by any bank and are not insured or guaranteed by the U.S. government, the Federal Deposit Insurance Corporation, the Federal Reserve Board or any other government agency. Investment in mutual funds involves investment risk, including the possible loss of principal.
This Report is authorized for distribution to prospective investors only when preceded or accompanied by the Fund's Prospectus, which contains facts concerning its objective and policies, management fees, expenses and other information.
Federated Clover Value Fund
Federated Investors Funds
4000 Ericsson Drive
Warrendale, PA 15086-7561
Contact us at FederatedInvestors.com
or call 1-800-341-7400.
Federated Securities Corp., Distributor
CUSIP 314172255
CUSIP 314172248
CUSIP 314172230
CUSIP 314172222
CUSIP 314172214
41200 (11/16)
Federated is a registered trademark of Federated Investors, Inc.
2016 ©Federated Investors, Inc.
Annual Shareholder Report
September 30, 2016
| Share Class | Ticker |
| A | BEARX |
| C | PBRCX |
| Institutional | PBRIX |
Federated Prudent Bear Fund
Successor to the Prudent Bear Fund Established 1995
A Portfolio of Federated Equity Funds
Dear Valued Shareholder,
I am pleased to present the Annual Shareholder Report for your fund covering the period from October 1, 2015 through September 30, 2016. This report includes Management's Discussion of Fund Performance, a complete listing of your fund's holdings, performance information and financial statements along with other important fund information.
In addition, our website, FederatedInvestors.com, offers easy access to Federated resources that include timely fund updates, economic and market insights from our investment strategists, and financial planning tools. We invite you to register to take full advantage of its capabilities.
Thank you for investing with Federated. I hope you find this information useful and look forward to keeping you informed.
Sincerely,
J. Christopher Donahue, President
Not FDIC Insured • May Lose Value • No Bank Guarantee
CONTENTS
| 1 |
| 6 |
| 7 |
| 14 |
| 17 |
| 19 |
| 21 |
| 22 |
| 35 |
| 36 |
| 38 |
| 44 |
| 50 |
| 50 |
Management's Discussion of Fund Performance (unaudited)
The total return of Federated Prudent Bear Fund (the “Fund”), based on net asset value for the 12-month reporting period ended September 30, 2016, was -14.10% for Class A Shares, -14.66% for Class C Shares and -13.57% for Institutional Shares. The total return of the Standard & Poor's 500 Index (S&P 500),1 a broad-based securities market index, was 15.43% for the same period. The total return for the Fund's market benchmark, the S&P 500 Inverse Daily Index (S&P 500 Inverse),2 was -14.58% for the same period. The total return of the Morningstar Bear Market Funds Average (MBMFA),3 a peer group average for the Fund, was -24.39%. The Fund's and MBMFA's total returns for the most recently completed fiscal year reflected actual cash flows, transaction costs and other expenses, which were not reflected in the total return of the S&P 500 or S&P 500 Inverse.
During the reporting period, the Fund's performance relative to the S&P 500 Inverse was most affected by the positioning and strategy4 of the Fund.
The following discussion will focus on the performance of the Fund's Institutional Shares.
MARKET OVERVIEW
During the reporting period, global equity markets continued to be supported by accommodative monetary policy. The Federal Reserve raised interest rates just one time during the reporting period, in December 2015. Concern about commodity prices in early 2016 and the United Kingdom (UK) vote to exit the European Union (EU) in mid-2016 caused heightened market volatility for those specific timeframes. However, in spite of these factors, the S&P 500 reached an all-time high in August 2016.
U.S. 10-year Treasury bond yields were a key area of focus for investors in the reporting period. U.S. 10-year Treasury bond yields ended lower, declining from 2.04% at the start of the reporting period to 1.59% at the end of the reporting period. Weaker than anticipated inflation and economic activity caused the Fed to move very cautiously when considering increases to the federal funds target rate.
The U.S. dollar was little changed during the reporting period as the U.S. Dollar Index5 fell 0.9%. Commodities and commodity stocks were volatile throughout the reporting period. For the year ended September 30, 2016, Brent crude oil increased 1%, natural gas increased 15%, copper declined 6% and gold increased sharply, up 18%.
Volatility in equity prices was relatively low for most of the reporting period, with the exception of higher volatility in the first quarter of 2016 due to commodity price weakness and again in June with the UK vote to leave the EU. The CBOE Volatility Index® (VIX® Index)6 spiked in February to a level of 28 and in June to a level of 26, yet ended the reporting period at 13.
Annual Shareholder Report
POSITIONING AND STRATEGY
The outperformance of the Fund versus the S&P 500 Inverse (the inverse of the total return of the S&P 500) for the reporting period was primarily due to the Fund's less than 100% net short position.
Total net short exposure varied between 50% and 70% throughout much of the reporting period. The Fund commenced the reporting period with net short exposure at approximately 60%. This was comprised of gross short equity exposure of 120% and gross long equity exposure of 60%. Throughout the reporting period the Fund increased both gross short equity exposure and gross long equity exposure. The Fund increased gross long equity exposure by 12% to 72% in the period, and increased gross short equity exposure by 15% to 135% in the period, resulting in period ending net short exposure of approximately 63%. For the reporting period, the volatility of the Fund's long positions was significantly lower than the volatility of the Fund's short positions.
Throughout the reporting period, the Fund purchased and owned shares in equities that Fund management believed were trading below their intrinsic value. Fund management focused on purchasing equities that had lower volatility than the overall market, a robust history of dividend payments and that were associated with stable business models. Additionally, Fund management focused on purchasing equities associated with natural resources. At the beginning of the reporting period, the Fund had gross long equity exposure of 60% and at the end of the reporting period, the Fund had gross long equity exposure of 72%.
Fund management also increased their gross short position throughout the reporting period. At the beginning of the reporting period, the Fund had short positions in equities and ETFs of approximately 63% and short positions of S&P 500 futures7 and the S&P 500 ETF (SPY) of 56%. At the end of the reporting period, the Fund had short positions in equities and ETFs of approximately 63% and short positions of S&P 500 futures and the S&P 500 ETF (SPY) of 72%.
| 1 | Please see the footnote to the line graphs under “Fund Performance and Growth of a $10,000 Investment” below for the definition of, and more information about, the S&P 500. |
| 2 | Please see the footnote to the line graphs under “Fund Performance and Growth of a $10,000 Investment” below for the definition of, and more information about, the S&P 500 Inverse. |
| 3 | Please see the footnote to the line graphs under “Fund Performance and Growth of a $10,000 Investment” below for the definition of, and more information about, the MBMFA. |
| 4 | The Fund regularly makes short sales of securities, which involves unlimited risk including the possibility that losses may exceed the original amount invested. The Fund may also use options and futures contracts, which have risks associated with unlimited losses of the underlying holdings due to unanticipated market movements and failure to correctly predict the direction of securities prices, interest rates and currency exchange rates. However, a mutual fund investor's risk is limited to the amount of investment in a mutual fund. The Fund may also hold restricted securities purchased through private placements. Such securities may be difficult to sell without experiencing delays or additional costs. Please see the Prospectus for further details. Considering the increased risks, the Fund may not be suitable for all investors. |
Annual Shareholder Report
| 5 | The U.S. Dollar Index indicates the general international value of the U.S. dollar by averaging the exchange rates between the U.S. dollar and six major world currencies. The index is unmanaged, and it is not possible to invest directly in an index. |
| 6 | The CBOE Volatility Index® (VIX® Index) is a leading measure of market expectations of near-term volatility conveyed by S&P 500 Index (SPX) option prices. The index is unmanaged, and it is not possible to invest directly in an index. |
| 7 | The Fund's use of derivative instruments involves risks different from, or possibly greater than, the risks associated with investing directly in securities and other traditional instruments. |
Annual Shareholder Report
FUND PERFORMANCE AND GROWTH OF A $10,000 INVESTMENT1
The graph below illustrates the hypothetical investment of $10,0002 in the Federated Prudent Bear Fund from September 30, 2006 to September 30, 2016, compared to the Standard & Poor's 500 Index (S&P 500),3 S&P 500 Inverse Daily Index (S&P 500 Inverse)4 and the Morningstar Bear Market Funds Average (MBMFA).5 The Average Annual Total Return table below shows returns for each class averaged over the stated periods.
Growth of $10,000 as of September 30, 2016
| Federated Prudent Bear Fund - | Institutional Shares | Class C Shares | Class A Shares | S&P 500 | S&P 500 Inverse | MBMFA |
| F | F | F | I | I | I |
| 9/30/2006 | 10,000 | 10,000 | 10,000 | 10,000 | 10,000 | 10,000 |
| 9/30/2007 | 10,549 | 10,461 | 9,968 | 11,644 | 9,400 | 8,433 |
| 9/30/2008 | 12,446 | 12,253 | 11,761 | 9,085 | 12,092 | 10,245 |
| 9/30/2009 | 12,497 | 12,173 | 11,769 | 8,458 | 10,908 | 7,377 |
| 9/30/2010 | 11,087 | 10,708 | 10,436 | 9,317 | 9,597 | 5,775 |
| 9/30/2011 | 10,870 | 10,392 | 10,210 | 9,424 | 9,152 | 5,326 |
| 9/30/2012 | 8,179 | 7,755 | 7,668 | 12,270 | 6,840 | 3,738 |
| 9/30/2013 | 6,444 | 6,041 | 6,007 | 14,643 | 5,671 | 2,685 |
| 9/30/2014 | 5,272 | 4,892 | 4,900 | 17,533 | 4,695 | 2,101 |
| 9/30/2015 | 4,990 | 4,599 | 4,654 | 17,425 | 4,626 | 2,016 |
| 9/30/2016 | 4,313 | 3,925 | 3,998 | 20,114 | 3,951 | 1,526 |
41 graphic description end -->
| ■ | Total returns shown for Class C Shares include the maximum contingent deferred sales charge of 1.00% as applicable. |
| ■ | Total returns shown for Class A Shares include the maximum sales charge of 5.50% ($10,000 investment minus $550 sales charge = $9,450). |
The Fund offers multiple share classes whose performance may be greater than or less than its other share class(es) due to differences in sales charges and expenses.
Average Annual Total Returns for the Period Ended 9/30/2016
(returns reflect all applicable sales charges and contingent deferred sales charges as specified below in footnote #2)
| | 1 Year | 5 Years | 10 Years |
| Class A Shares | -18.82% | -18.03% | -8.76% |
| Class C Shares | -15.51% | -17.70% | -8.93% |
| Institutional Shares | -13.57% | -16.88% | -8.07% |
| S&P 500 | 15.43% | 16.37% | 7.24% |
| S&P 500 Inverse | -14.58% | -15.45% | -8.86% |
| MBMFA | -24.39% | -23.54% | -18.32% |
Annual Shareholder Report
Performance data quoted represents past performance which is no guarantee of future results. Investment return and principal value will fluctuate so that an investor's shares, when redeemed, may be worth more or less than their original cost. Mutual fund performance changes over time and current performance may be lower or higher than what is stated. For current to the most recent month-end performance and after-tax returns, visit FederatedInvestors.com or call 1-800-341-7400. Returns shown do not reflect the deduction of taxes that a shareholder would pay on Fund distributions or the redemption of Fund shares. Mutual funds are not obligations of or guaranteed by any bank and are not federally insured.
| 1 | Federated Prudent Bear Fund is the successor to Prudent Bear Fund pursuant to a reorganization that took place on December 5, 2008. The information presented above for periods prior to December 5, 2008, for Class A Shares and Institutional Shares is historical information for the No Load Shares of Prudent Bear Fund. The information presented above for periods prior to December 5, 2008, for Class C Shares is historical information for the Class C Shares of Prudent Bear Fund. Effective December 8, 2008, a maximum sales charge of 5.50% for newly purchased Class A Shares was implemented. The line graphs above reflect any front-end sales charges, as applicable, as of the date of the initial investment. The Average Annual Total Returns reflect the current sales charges applicable to each class. |
| 2 | Represents a hypothetical investment of $10,000 in the Fund after deducting applicable sales charges: For Class A Shares, the maximum sales charge of 5.50% is effective for newly purchased shares beginning on December 8, 2008; for Class C Shares, the maximum contingent deferred sales charge is 1.00% on any redemption less than one year from the purchase date. The Fund's performance assumes the reinvestment of all dividends and distributions. The S&P 500 and the S&P 500 Inverse have been adjusted to reflect reinvestment of dividends on securities in the indexes. |
| 3 | The S&P 500 is an unmanaged capitalization-weighted index of 500 stocks designed to measure performance of the broad domestic economy through changes in the aggregate market value of 500 stocks representing all major industries. The S&P 500 is not adjusted to reflect taxes, sales charges, expenses or other fees that the Securities and Exchange Commission requires to be reflected in the Fund's performance. The S&P 500 is unmanaged and, unlike the Fund, are not affected by cash flows. It is not possible to invest directly in an index. |
| 4 | The S&P 500 Inverse is designed to provide the inverse performance of the S&P 500, representing a short position in the index. The S&P 500 Inverse is not adjusted to reflect taxes, sales charges, expenses or other fees that the Securities and Exchange Commission requires to be reflected in the Fund's performance. The S&P 500 Inverse is unmanaged and, unlike the Fund, are not affected by cash flows. It is not possible to invest directly in an index. |
| 5 | Morningstar figures represent the average of the total returns reported by all the mutual funds designated by Morningstar as falling into the respective category indicated. They do not reflect sales charges. |
Annual Shareholder Report
Portfolio of Investments Summary Tables (unaudited)
At September 30, 2016, the Fund's portfolio composition was as follows:
| | Percentage of
Total Net Assets |
| Securities Sold Short | (65.9)% |
| Derivative Contracts—Short (notional value)1 | (69.4)% |
| Common Stocks | 72.2% |
| U.S. Treasury Securities | 21.2% |
| Cash Equivalents2 | 4.9% |
| Adjustment for Derivative Contracts (notional value)1 | 69.9% |
| Collateral on Deposit for Securities Sold Short | 64.5% |
| Other Assets and Liabilities—Net3 | 2.6% |
| TOTAL | 100.0% |
| 1 | Derivative contracts may consist of futures, forwards, options and swaps. More complete information regarding the Fund's direct investments in derivative contracts, including unrealized appreciation (depreciation), value and notional values or amounts of such contracts, can be found in the table at the end of the Portfolio of Investments included in this Report. |
| 2 | Cash Equivalents include any investments in money market mutual funds and/or overnight repurchase agreements. |
| 3 | Assets, other than investments in securities, securities sold short, derivative contracts and collateral on deposit for securities sold short, less liabilities. See Statement of Assets and Liabilities. |
| | |
At September 30, 2016, the Fund's sector composition4 for its short positions was as follows:
| Sector Composition | Percentage of Total
Securities Sold Short5 |
| Information Technology | 18.1% |
| Health Care | 14.3% |
| Industrials | 12.1% |
| Consumer Staples | 11.9% |
| Consumer Discretionary | 11.2% |
| Financials | 10.4% |
| Energy | 6.9% |
| Materials | 5.3% |
| Real Estate | 3.2% |
| Telecommunication Services | 2.9% |
| Broad Equity Index | 2.0% |
| Utilities | 1.7% |
| TOTAL | 100.0% |
| 4 | Sector classifications are based upon, and individual portfolio securities are assigned to, the classifications of the Global Industry Classification Standard (GICS) except that the Adviser assigns a classification to securities not classified by the GICS and to securities for which the Adviser does not have access to the classification made by the GICS. |
| 5 | Includes any short positions on futures contracts. |
Annual Shareholder Report
Portfolio of Investments
September 30, 2016
Shares or Principal
Amount | | | Value |
| | | COMMON STOCKS—72.2% | |
| | | Consumer Discretionary—2.1% | |
| $360,000 | | Shaw Communications, Inc., Class B | $7,367,659 |
| | | Consumer Staples—4.3% | |
| 126,000 | | Nestle S.A. | 9,927,997 |
| 11,000 | | Philip Morris International, Inc. | 1,069,420 |
| 15,000 | | Procter & Gamble Co. | 1,346,250 |
| 39,000 | | Wal-Mart Stores, Inc. | 2,812,680 |
| | | TOTAL | 15,156,347 |
| | | Energy—2.5% | |
| 11,000 | 1 | Concho Resources, Inc. | 1,510,850 |
| 14,000 | 1 | Diamondback Energy, Inc. | 1,351,560 |
| 12,000 | | EOG Resources, Inc. | 1,160,520 |
| 20,000 | | EQT Midstream Partners LP | 1,523,800 |
| 65,000 | | Enterprise Products Partners LP | 1,795,950 |
| 12,000 | | PBF Energy, Inc. | 271,680 |
| 6,000 | | Pioneer Natural Resources, Inc. | 1,113,900 |
| | | TOTAL | 8,728,260 |
| | | Financials—4.4% | |
| 66,000 | 1 | Berkshire Hathaway, Inc. | 9,535,020 |
| 10,500 | | JPMorgan Chase & Co. | 699,195 |
| 10,000 | | Northern Trust Corp. | 679,900 |
| 50,000 | | State Street Corp. | 3,481,500 |
| 16,000 | | U.S. Bancorp | 686,240 |
| 9,000 | | Wells Fargo & Co. | 398,520 |
| | | TOTAL | 15,480,375 |
| | | Health Care—14.1% | |
| 51,500 | | Amgen, Inc. | 8,590,715 |
| 125,500 | | Eli Lilly & Co. | 10,072,630 |
| 89,000 | | Gilead Sciences, Inc. | 7,041,680 |
| 476,000 | | GlaxoSmithKline PLC | 10,143,764 |
| 29,000 | | Merck & Co., Inc. | 1,809,890 |
| 100,000 | | Pfizer, Inc. | 3,387,000 |
| 232,000 | | Sanofi, ADR | 8,860,080 |
| | | TOTAL | 49,905,759 |
Annual Shareholder Report
Shares or Principal
Amount | | | Value |
| | | COMMON STOCKS—continued | |
| | | Industrials—13.4% | |
| $34,254 | | BBA Group PLC | $110,965 |
| 77,500 | | Boeing Co. | 10,209,850 |
| 118,500 | | CSX Corp. | 3,614,250 |
| 70,000 | | Emerson Electric Co. | 3,815,700 |
| 110,500 | | Norfolk Southern Corp. | 10,725,130 |
| 190,000 | | Transurban Group | 1,656,882 |
| 77,000 | | Union Pacific Corp. | 7,509,810 |
| 99,000 | | United Technologies Corp. | 10,058,400 |
| | | TOTAL | 47,700,987 |
| | | Information Technology—7.0% | |
| 93,000 | | Apple, Inc. | 10,513,650 |
| 180,000 | | Microsoft Corporation | 10,368,000 |
| 58,000 | | Qualcomm, Inc. | 3,973,000 |
| | | TOTAL | 24,854,650 |
| | | Materials—1.8% | |
| 29,000 | | Agnico Eagle Mines Ltd. | 1,571,220 |
| 50,000 | | Alamos Gold, Inc. | 410,000 |
| 70,000 | 1 | Detour Gold Corp. | 1,522,771 |
| 75,000 | 1 | Lundin Mining Corp. | 296,696 |
| 19,000 | | Newmont Mining Corp. | 746,510 |
| 25,000 | | Northern Star Resources Ltd. | 87,075 |
| 47,000 | | Rio Tinto PLC, ADR | 1,569,800 |
| 25,000 | 1 | Stillwater Mining Co. | 334,000 |
| | | TOTAL | 6,538,072 |
| | | Real Estate—5.0% | |
| 26,000 | | American Campus Communities, Inc. | 1,322,620 |
| 9,000 | | American Tower Corp. | 1,019,970 |
| 21,000 | | Crown Castle International Corp. | 1,978,410 |
| 30,000 | | DCT Industrial Trust, Inc. | 1,456,500 |
| 28,000 | | Education Realty Trust, Inc. | 1,207,920 |
| 83,000 | | Empire State Realty Trust, Inc. | 1,738,850 |
| 105,000 | | Lexington Realty Trust | 1,081,500 |
| 80,000 | | Physicians Realty Trust | 1,723,200 |
| 55,000 | | Rayonier, Inc. | 1,459,700 |
| 25,000 | | Sun Communities, Inc. | 1,962,000 |
| 68,000 | | Terreno Realty Corp. | 1,870,680 |
Annual Shareholder Report
Shares or Principal
Amount | | | Value |
| | | COMMON STOCKS—continued | |
| | | Real Estate—continued | |
| $30,000 | | Weyerhaeuser Co. | $958,200 |
| | | TOTAL | 17,779,550 |
| | | Telecommunication Services—6.2% | |
| 28,000 | | AT&T, Inc. | 1,137,080 |
| 2,320,000 | | Telstra Corp. Ltd. | 9,214,224 |
| 34,500 | | Verizon Communications, Inc. | 1,793,310 |
| 3,460,000 | | Vodafone Group PLC | 9,921,119 |
| | | TOTAL | 22,065,733 |
| | | Utilities—11.4% | |
| 10,000 | | American Water Works Co., Inc. | 748,400 |
| 33,000 | | Aqua America, Inc. | 1,005,840 |
| 25,000 | | California Water Service Group | 802,250 |
| 93,000 | | Consolidated Edison Co. | 7,002,900 |
| 23,500 | | Dominion Resources, Inc. | 1,745,345 |
| 124,000 | | Duke Energy Corp. | 9,924,960 |
| 204,500 | | Emera, Inc. | 7,374,439 |
| 298,500 | | FirstEnergy Corp. | 9,874,380 |
| 30,000 | | PPL Corp. | 1,037,100 |
| 71,530 | | Pennon Group PLC | 826,243 |
| | | TOTAL | 40,341,857 |
| | | TOTAL COMMON STOCKS
(IDENTIFIED COST $252,825,442) | 255,919,249 |
| | | U.S. TREASURY—21.2% | |
| | | U.S. Treasury Note—21.2% | |
| 75,000,000 | 2 | United States Treasury Note, 0.500%, 1/31/2017
(IDENTIFIED COST $75,012,862) | 75,025,530 |
| | | INVESTMENT COMPANY—4.9% | |
| 17,242,277 | 3 | Federated Government Obligations Fund, Premier Shares, 0.31%4
(AT NET ASSET VALUE) | 17,242,277 |
| | | TOTAL INVESTMENTS—98.3%
(IDENTIFIED COST $345,080,581)5 | 348,187,056 |
| | | OTHER ASSETS AND LIABILITIES - NET—1.7%6 | 6,145,335 |
| | | TOTAL NET ASSETS—100% | $354,332,391 |
Annual Shareholder Report
SECURITIES SOLD SHORT
| Shares | | | Value |
| 16,000 | | Akamai Technologies, Inc. | $847,840 |
| 6,500 | | Alliance Data Systems Corp. | 1,394,445 |
| 43,500 | | Analog Devices, Inc. | 2,803,575 |
| 13,500 | | Anheuser-Busch InBev NV, ADR | 1,774,035 |
| 39,500 | | Arrow Electronics, Inc. | 2,526,815 |
| 20,000 | | Automatic Data Processing, Inc. | 1,764,000 |
| 14,500 | | AutoNation, Inc. | 706,295 |
| 14,000 | | Avalonbay Communities, Inc. | 2,489,760 |
| 12,000 | | ASML Holding N.V. | 1,314,960 |
| 31,000 | | Baker Hughes, Inc. | 1,564,570 |
| 13,000 | | Bard (C.R.), Inc. | 2,915,640 |
| 68,000 | | Brown-Forman Corp., Class B | 3,225,920 |
| 52,000 | | Campbell Soup Co. | 2,844,400 |
| 19,000 | | Cardinal Health, Inc. | 1,476,300 |
| 24,000 | | CarMax, Inc. | 1,280,400 |
| 7,000 | | Carter's, Inc. | 606,970 |
| 39,000 | | Charles Schwab Corp. | 1,231,230 |
| 86,000 | | Cisco Systems, Inc. | 2,727,920 |
| 18,000 | | Cognizant Technology Solutions Corp. | 858,780 |
| 293,844 | | Consumer Staples Select Sector SPDR Fund | 15,635,439 |
| 23,500 | | Costco Wholesale Corp. | 3,583,985 |
| 150,000 | | Credit Suisse Group AG, ADR | 1,971,000 |
| 5,000 | | Cummins, Inc. | 640,750 |
| 22,500 | | Darden Restaurants, Inc. | 1,379,700 |
| 19,400 | | Dave & Buster's Entertainment, Inc. | 760,092 |
| 9,000 | | Dollar Tree, Inc. | 710,370 |
| 5,000 | | Domino's Pizza, Inc. | 759,250 |
| 150,000 | | Energy Select Sector SPDR | 10,591,500 |
| 36,000 | | Estee Lauder Cos., Inc., Class A | 3,188,160 |
| 18,000 | | F5 Networks, Inc. | 2,243,520 |
| 543,000 | | Financial Select Sector SPDR Fund | 10,479,900 |
| 27,000 | | Fossil, Inc. | 749,790 |
| 30,000 | | Genuine Parts Co. | 3,013,500 |
| 23,000 | | Global Payments, Inc. | 1,765,480 |
| 11,000 | | Grainger (W.W.), Inc. | 2,473,240 |
| 30,000 | | Halliburton Co. | 1,346,400 |
| 302,636 | | Health Care Select Sector SPDR Fund | 21,823,082 |
| 25,000 | | Henry Jack & Associates, Inc. | 2,138,750 |
| 368,000 | | Industrial Select Sector SPDR | 21,483,840 |
Annual Shareholder Report
| Shares | | | Value |
| 49,500 | | Interactive Brokers Group, Inc., Class A | $1,745,865 |
| 53,000 | | iShares 20+ Year Treasury Bond ETF | 7,288,030 |
| 114,000 | | iShares Dow Jones U.S. Telecommunications Sector Index Fund | 3,673,080 |
| 6,000 | | iShares Nasdaq Biotechnology Index Fund | 1,736,760 |
| 200,000 | | iShares U.S. Home Construction ETF | 5,510,000 |
| 21,000 | | IBM Corp. | 3,335,850 |
| 7,000 | | Lear Corp. | 848,540 |
| 47,000 | | Level 3 Communications, Inc. | 2,179,860 |
| 21,000 | | Lululemon Athletica, Inc. | 1,280,580 |
| 330,000 | | Materials Select Sector SPDR Trust | 15,757,500 |
| 35,000 | | Michael Kors Holdings Ltd. | 1,637,650 |
| 88,000 | | Mylan NV | 3,354,560 |
| 33,000 | | Nike, Inc., Class B | 1,737,450 |
| 58,000 | | Oracle Corp. | 2,278,240 |
| 34,000 | | Paychex, Inc. | 1,967,580 |
| 44,000 | | PACCAR, Inc. | 2,586,320 |
| 20,000 | | Rockwell Automation, Inc. | 2,446,800 |
| 7,500 | | Salesforce.com, Inc. | 534,975 |
| 15,000 | | Schlumberger Ltd. | 1,179,600 |
| 15,000 | | Simon Property Group, Inc. | 3,105,150 |
| 17,000 | | Snap-On, Inc. | 2,583,320 |
| 13,500 | | Sonoco Products Co. | 713,205 |
| 65,500 | | Steel Dynamics, Inc. | 1,636,845 |
| 43,000 | | SPDR S&P 500 ETF Trust | 9,300,900 |
| 37,000 | | Total System Services, Inc. | 1,744,550 |
| 25,000 | | T-Mobile USA, Inc. | 1,168,000 |
| 27,500 | | Under Armour, Inc., Class A | 1,063,700 |
| 15,000 | | United Rentals, Inc. | 1,177,350 |
| 145,000 | | UBS Group AG | 1,974,900 |
| 58,000 | | UDR, Inc. | 2,087,420 |
| 40,000 | | VanEck Vectors Semiconductor ETF | 2,778,800 |
| 72,000 | | Whole Foods Market, Inc. | 2,041,200 |
| | | TOTAL SECURITIES SOLD SHORT
(PROCEEDS $230,932,833) | $233,546,183 |
At September 30, 2016, the Fund had the following outstanding futures contracts:
| Description | Number of
Contracts | Notional
Value | Expiration
Date | Unrealized
Appreciation |
| 1S&P 500 Index Short Futures | 455 | $245,745,500 | December 2016 | $1,812,584 |
Annual Shareholder Report
At September 30, 2016, the Fund had the following outstanding foreign exchange contracts:
| Settlement Date | Counterparty | Foreign Currency
Units to
Deliver/Receive | In
Exchange
For | Unrealized
Appreciation
(Depreciation) |
| Contracts Sold: |
| 10/13/2016 | Barclays Bank PLC | 13,805,546 CAD | $10,600,000 | $76,204 |
| 10/14/2016 | Bank of America, N.A. | 11,908,058 GBP | $15,700,000 | $261,866 |
| 10/14/2016 | JPMorgan Chase Bank N.A. | 3,724,100 GBP | $4,800,000 | $(28,089) |
| 12/21/2016 | Barclays Bank PLC | 13,500,000 AUD | $10,183,847 | $(130,372) |
| NET UNREALIZED APPRECIATION ON FOREIGN EXCHANGE CONTRACTS | $179,609 |
Net Unrealized Appreciation/Depreciation on, Future Contracts and Foreign Exchange Contracts and the Value of Securities Sold Short is included in “Other Assets and Liabilities—Net.”
| 1 | Non-income-producing security. |
| 2 | All or a portion of this security is pledged as collateral to ensure the Fund is able to satisfy the obligations of its outstanding futures contracts. |
| 3 | Affiliated holding. |
| 4 | 7-day net yield. |
| 5 | The cost of investments for federal tax purposes amounts to $359,987,176. |
| 6 | Assets, other than investments in securities, less liabilities. See Statement of Assets and Liabilities. |
Note: The categories of investments are shown as a percentage of total net assets at September 30, 2016.
Various inputs are used in determining the value of the Fund's investments. These inputs are summarized in the three broad levels listed below:
Level 1—quoted prices in active markets for identical securities.
Level 2—other significant observable inputs (including quoted prices for similar securities, interest rates, prepayment speeds, credit risk, etc.). Also includes securities valued at amortized cost.
Level 3—significant unobservable inputs (including the Fund's own assumptions in determining the fair value of investments).
The inputs or methodology used for valuing securities are not an indication of the risk associated with investing in those securities.
Annual Shareholder Report
The following is a summary of the inputs used, as of September 30, 2016, in valuing the Fund's assets carried at fair value:
| Valuation Inputs | | | | |
| | Level 1—
Quoted
Prices | Level 2—
Other
Significant
Observable
Inputs | Level 3—
Significant
Unobservable
Inputs | Total |
| Equity Securities: | | | | |
| Common Stocks | | | | |
| Domestic | $185,058,315 | $— | $— | $185,058,315 |
| International | 28,972,665 | 41,888,269 | — | 70,860,934 |
| Debt Securities: | | | | |
| U.S. Treasury | — | 75,025,530 | — | 75,025,530 |
| Investment Company | 17,242,277 | — | — | 17,242,277 |
| TOTAL SECURITIES | $231,273,257 | $116,913,799 | $— | $348,187,056 |
| Other Financial Instruments1 | | | | |
| Assets | $1,812,584 | $338,070 | $— | $2,150,654 |
| Liabilities | (233,546,183) | (158,461) | — | (233,704,644) |
| TOTAL OTHER FINANCIAL INSTRUMENTS | $(231,733,599) | $179,609 | $— | $(231,553,990) |
| 1 | Other financial instruments include securities sold short, futures contracts and foreign exchange contracts. |
The following acronyms are used throughout this portfolio:
| ADR | —American Depositary Receipt |
| AUD | —Australian Dollar |
| CAD | —Canadian Dollar |
| ETF | —Exchange-Traded Fund |
| GBP | —Great British Pound |
| SPDR | —Standard & Poor's Depositary Receipt |
See Notes which are an integral part of the Financial Statements
Annual Shareholder Report
Financial Highlights–Class A Shares
(For a Share Outstanding Throughout Each Period)1
| Year Ended September 30 | 2016 | 2015 | 2014 | 2013 | 2012 |
| Net Asset Value, Beginning of Period | $22.70 | $23.90 | $29.30 | $37.40 | $49.80 |
| Income From Investment Operations: | | | | | |
| Net investment income (loss)2 | (0.26) | (0.50) | (0.80) | (0.90) | (1.00) |
| Net realized and unrealized gain (loss) on investments, short sales, futures contracts and foreign currency transactions | (2.94) | (0.70) | (4.60) | (7.20) | (11.40) |
| TOTAL FROM INVESTMENT OPERATIONS | (3.20) | (1.20) | (5.40) | (8.10) | (12.40) |
| Net Asset Value, End of Period | $19.50 | $22.70 | $23.90 | $29.30 | $37.40 |
| Total Return3 | (14.10)% | (5.02)% | (18.43)% | (21.66)% | (24.90)% |
| Ratios to Average Net Assets: | | | | | |
| Net expenses | 3.23%4 | 3.23%4 | 2.99% | 2.75%4 | 2.47%4 |
| Net expenses excluding dividends and other expenses related to short sales | 1.76%4 | 1.76%4 | 1.76% | 1.75%4 | 1.74%4 |
| Net investment income (loss) | (1.22)% | (2.10)% | (2.90)% | (2.60)% | (2.37)% |
| Expense waiver/reimbursement5 | 0.04% | 0.05% | 0.03% | 0.00%6 | 0.00%6 |
| Supplemental Data: | | | | | |
| Net assets, end of period (000 omitted) | $151,943 | $176,614 | $203,644 | $321,969 | $547,426 |
| Portfolio turnover | 430% | 394% | 465% | 498% | 480% |
| 1 | On February 5, 2016, the Fund effected a 1 for 10 reverse share split. As a result of the reverse share split: (1) the number of outstanding Shares of the Fund decreased by a factor of 10; and (2) since the Fund's total number of shares outstanding decreased, the net asset value per Fund Share (NAV/Share) increased. The reverse share split did not affect the value of the Fund's net assets or each shareholders proportional ownership interest in those assets. Per share data has been restated where applicable. |
| 2 | Per share numbers have been calculated using the average shares method. |
| 3 | Based on net asset value, which does not reflect the sales charge, redemption fee or contingent deferred sales charge, if applicable. |
| 4 | The net expense ratios are calculated without reduction for fees paid indirectly for expense offset arrangements. The net expense ratios are 3.23%, 3.23%, 2.74% and 2.47%, after taking into account these expense reductions for the years ended September 30, 2016, 2015, 2013 and 2012, respectively. The net expense ratios excluding dividends and other expenses related to short sales are also calculated without reduction for these fees paid indirectly for expense offset arrangements. |
| 5 | This expense decrease is reflected in both the net expense and the net investment income (loss) ratios shown above. |
| 6 | Represents less than 0.01%. |
See Notes which are an integral part of the Financial Statements
Annual Shareholder Report
Financial Highlights–Class C Shares
(For a Share Outstanding Throughout Each Period)1
| Year Ended September 30 | 2016 | 2015 | 2014 | 2013 | 2012 |
| Net Asset Value, Beginning of Period | $20.40 | $21.70 | $26.80 | $34.40 | $46.10 |
| Income From Investment Operations: | | | | | |
| Net investment income (loss)2 | (0.37) | (0.60) | (0.90) | (1.00) | (1.20) |
| Net realized and unrealized gain (loss) on investments, short sales, futures contracts and foreign currency transactions | (2.62) | (0.70) | (4.20) | (6.60) | (10.50) |
| TOTAL FROM INVESTMENT OPERATIONS | (2.99) | (1.30) | (5.10) | (7.60) | (11.70) |
| Net Asset Value, End of Period | $17.41 | $20.40 | $21.70 | $26.80 | $34.40 |
| Total Return3 | (14.66)% | (5.99)% | (19.03)% | (22.09)% | (25.38)% |
| Ratios to Average Net Assets: | | | | | |
| Net expenses | 3.98%4 | 3.98%4 | 3.74% | 3.50%4 | 3.22%4 |
| Net expenses excluding dividends and other expenses related to short sales | 2.51%4 | 2.51%4 | 2.51% | 2.50%4 | 2.49%4 |
| Net investment income (loss) | (1.98)% | (2.84)% | (3.65)% | (3.35)% | (3.12)% |
| Expense waiver/reimbursement5 | 0.04% | 0.05% | 0.03% | 0.00%6 | 0.00%6 |
| Supplemental Data: | | | | | |
| Net assets, end of period (000 omitted) | $29,624 | $35,556 | $44,321 | $66,494 | $111,926 |
| Portfolio turnover | 430% | 394% | 465% | 498% | 480% |
| 1 | On February 5, 2016, the Fund effected a 1 for 10 reverse share split. As a result of the reverse share split: (1) the number of outstanding Shares of the Fund decreased by a factor of 10; and (2) since the Fund's total number of shares outstanding decreased, the net asset value per Fund Share (NAV/Share) increased. The reverse share split did not affect the value of the Fund's net assets or each shareholders proportional ownership interest in those assets. Per share data has been restated where applicable. |
| 2 | Per share numbers have been calculated using the average shares method. |
| 3 | Based on net asset value, which does not reflect the sales charge, redemption fee or contingent deferred sales charge, if applicable. |
| 4 | The net expense ratios are calculated without reduction for fees paid indirectly for expense offset arrangements. The net expense ratios are 3.98%, 3.98%, 3.50%, and 3.22%, after taking into account these expense reductions for the years ended September 30, 2016, 2015, 2013 and 2012, respectively. The net expense ratios excluding dividends and other expenses related to short sales are also calculated without reduction for these fees paid indirectly for expense offset arrangements. |
| 5 | This expense decrease is reflected in both the net expense and the net investment income (loss) ratios shown above. |
| 6 | Represents less than 0.01%. |
See Notes which are an integral part of the Financial Statements
Annual Shareholder Report
Financial Highlights–Institutional Shares
(For a Share Outstanding Throughout Each Period)1
| Year Ended September 30 | 2016 | 2015 | 2014 | 2013 | 2012 |
| Net Asset Value, Beginning of Period | $23.00 | $24.30 | $29.70 | $37.70 | $50.10 |
| Income From Investment Operations: | | | | | |
| Net investment income (loss)2 | (0.20) | (0.40) | (0.70) | (0.80) | (0.90) |
| Net realized and unrealized gain (loss) on investments, short sales, futures contracts and foreign currency transactions | (2.92) | (0.90) | (4.70) | (7.20) | (11.50) |
| TOTAL FROM INVESTMENT OPERATIONS | (3.12) | (1.30) | (5.40) | (8.00) | (12.40) |
| Net Asset Value, End of Period | $19.88 | $23.00 | $24.30 | $29.70 | $37.70 |
| Total Return3 | (13.57)% | (5.35)% | (18.18)% | (21.22)% | (24.75)% |
| Ratios to Average Net Assets: | | | | | |
| Net expenses | 2.93%4 | 2.97%4 | 2.72% | 2.53%4 | 2.22%4 |
| Net expenses excluding dividends and other expenses related to short sales | 1.51%4 | 1.51%4 | 1.51% | 1.50%4 | 1.49%4 |
| Net investment income (loss) | (0.92)% | (1.85)% | (2.64)% | (2.38)% | (2.12)% |
| Expense waiver/reimbursement5 | 0.04% | 0.05% | 0.03% | 0.00%6 | 0.00%6 |
| Supplemental Data: | | | | | |
| Net assets, end of period (000 omitted) | $172,765 | $181,811 | $202,690 | $299,975 | $402,670 |
| Portfolio turnover | 430% | 394% | 465% | 498% | 480% |
| 1 | On February 5, 2016, the Fund effected a 1 for 10 reverse share split. As a result of the reverse share split: (1) the number of outstanding Shares of the Fund decreased by a factor of 10; and (2) since the Fund's total number of shares outstanding decreased, the net asset value per Fund Share (NAV/Share) increased. The reverse share split did not affect the value of the Fund's net assets or each shareholders proportional ownership interest in those assets. Per share data has been restated where applicable. |
| 2 | Per share numbers have been calculated using the average shares method. |
| 3 | Based on net asset value, which does not reflect the sales charge, redemption fee or contingent deferred sales charge, if applicable. |
| 4 | The net expense ratios are calculated without reduction for fees paid indirectly for expense offset arrangements. The net expense ratios are 2.93%, 2.97%, 2.52%, and 2.22% after taking into account these expense reductions for the years ended September 30, 2016, 2015, 2013 and 2012, respectively. The net expense ratios excluding dividends and other expenses related to short sales are also calculated without reduction for these fees paid indirectly for expense offset arrangements. |
| 5 | This expense decrease is reflected in both the net expense and the net investment income (loss) ratios shown above. |
| 6 | Represents less than 0.01%. |
See Notes which are an integral part of the Financial Statements
Annual Shareholder Report
Statement of Assets and Liabilities
September 30, 2016
| Assets: | | |
| Total investment in securities, at value including $17,242,277 of investment in an affiliated holding (Note 5) (identified cost $345,080,581) | | $348,187,056 |
| Cash denominated in foreign currencies (identified cost $1,384) | | 1,393 |
| Restricted cash (Note 2) | | 677,565 |
| Deposit at broker for short sales | | 228,489,288 |
| Income receivable | | 305,545 |
| Receivable for investments sold | | 36,700,960 |
| Receivable for shares sold | | 2,406,162 |
| Unrealized appreciation on foreign exchange contracts | | 338,070 |
| TOTAL ASSETS | | 617,106,039 |
| Liabilities: | | |
| Securities sold short, at value (proceeds $230,932,833) | $233,546,183 | |
| Dividends payable on short positions | 200,949 | |
| Payable for investments purchased | 23,753,297 | |
| Payable for shares redeemed | 2,850,535 | |
| Unrealized depreciation on foreign exchange contracts | 158,461 | |
| Bank overdraft | 13,750 | |
| Payable for daily variation margin on futures contracts | 2,030,818 | |
| Payable to adviser (Note 5) | 11,291 | |
| Payable for administrative fees (Note 5) | 765 | |
| Payable for distribution services fee (Note 5) | 18,479 | |
| Payable for other service fees (Notes 2 and 5) | 64,936 | |
| Accrued expenses (Note 5) | 124,184 | |
| TOTAL LIABILITIES | | 262,773,648 |
| Net assets for 18,182,320 shares outstanding | | $354,332,391 |
| Net Assets Consist of: | | |
| Paid-in capital | | $1,513,065,695 |
| Net unrealized appreciation of investments, short sales, futures contracts and translation of assets and liabilities in foreign currency | | 2,486,002 |
| Accumulated net realized loss on investments, short sales, futures contracts and foreign currency transactions | | (1,158,440,858) |
| Accumulated net investment income (loss) | | (2,778,448) |
| TOTAL NET ASSETS | | $354,332,391 |
Annual Shareholder Report
Statement of Assets and Liabilities–continued
| Net Asset Value, Offering Price and Redemption Proceeds Per Share | | |
| Class A Shares: | | |
| Net asset value per share ($151,942,928 ÷ 7,790,158 shares outstanding), no par value, unlimited shares authorized | | $19.50 |
| Offering price per share (100/94.50 of $19.50) | | $20.63 |
| Redemption proceeds per share | | $19.50 |
| Class C Shares: | | |
| Net asset value per share ($29,624,159 ÷ 1,701,401 shares outstanding), no par value, unlimited shares authorized | | $17.41 |
| Offering price per share | | $17.41 |
| Redemption proceeds per share (99.00/100 of $17.41) | | $17.24 |
| Institutional Shares: | | |
| Net asset value per share ($172,765,304 ÷ 8,690,761 shares outstanding), no par value, unlimited shares authorized | | $19.88 |
| Offering price per share | | $19.88 |
| Redemption proceeds per share | | $19.88 |
See Notes which are an integral part of the Financial Statements
Annual Shareholder Report
Statement of Operations
Year Ended September 30, 2016
| Investment Income: | | | |
| Dividends (including $46,191 received from an affiliated holding (Note 5) and net of foreign taxes withheld of $109,253) | | | $7,583,138 |
| Interest | | | 470,070 |
| TOTAL INCOME | | | 8,053,208 |
| Expenses: | | | |
| Investment adviser fee (Note 5) | | $5,020,679 | |
| Administrative fee (Note 5) | | 314,125 | |
| Custodian fees | | 63,585 | |
| Transfer agent fee | | 545,239 | |
| Directors'/Trustees' fees (Note 5) | | 2,875 | |
| Auditing fees | | 32,770 | |
| Legal fees | | 8,172 | |
| Portfolio accounting fees | | 119,125 | |
| Distribution services fee (Note 5) | | 245,468 | |
| Other service fees (Notes 2 and 5) | | 488,510 | |
| Share registration costs | | 76,782 | |
| Printing and postage | | 43,589 | |
| Miscellaneous (Note 5) | | 21,026 | |
| Expenses related to short positions | | 5,772,741 | |
| TOTAL EXPENSES | | 12,754,686 | |
Annual Shareholder Report
Statement of Operations–continued
| Waiver, Reimbursement and Reduction: | | | |
| Waiver/reimbursement of investment adviser fee (Note 5) | $(165,926) | | |
| Fees paid indirectly from directed brokerage arrangements (Note 6) | (360) | | |
| TOTAL WAIVER, REIMBURSEMENT AND REDUCTION | | $(166,286) | |
| Net expenses | | | $12,588,400 |
| Net investment income (loss) | | | (4,535,192) |
| Realized and Unrealized Gain (Loss) on Investments, Short Sales, Futures Contracts and Foreign Currency Transactions: | | | |
| Net realized gain on investments and foreign currency transactions | | | $18,782,780 |
| Net realized loss on futures contracts | | | (32,972,329) |
| Net realized loss on short sales | | | (53,984,998) |
| Net change in unrealized depreciation of investments and translation of assets and liabilities in foreign currency | | | 14,975,640 |
| Net change in unrealized appreciation of futures contracts | | | (1,803,434) |
| Net change in unrealized appreciation of securities sold short | | | (17,153,299) |
| Net realized and unrealized loss on investments, short sales, futures contracts and foreign currency transactions | | | (72,155,640) |
| Change in net assets resulting from operations | | | $(76,690,832) |
See Notes which are an integral part of the Financial Statements
Annual Shareholder Report
Statement of Changes in Net Assets
| Year Ended September 30 | 2016 | 2015 | |
| Increase (Decrease) in Net Assets | | |
| Operations: | | |
| Net investment income (loss) | $(4,535,192) | $(6,974,882) |
| Net realized loss on investments, short sales, futures contracts and foreign currency transactions | (68,174,547) | (36,090,755) |
| Net change in unrealized appreciation/depreciation of investments, short sales, futures contracts and translation of assets and liabilities in foreign currency | (3,981,093) | 14,850,669 |
| CHANGE IN NET ASSETS RESULTING FROM OPERATIONS | (76,690,832) | (28,214,968) |
| Share Transactions: | | |
| Proceeds from sale of shares | 570,612,703 | 371,947,597 |
| Cost of shares redeemed | (533,570,583) | (400,406,842) |
| CHANGE IN NET ASSETS RESULTING FROM SHARE TRANSACTIONS | 37,042,120 | (28,459,245) |
| Change in net assets | (39,648,712) | (56,674,213) |
| Net Assets: | | |
| Beginning of period | 393,981,103 | 450,655,316 |
| End of period (including accumulated net investment income (loss) of $(2,778,448) and $(4,190,392), respectively) | $354,332,391 | $393,981,103 |
See Notes which are an integral part of the Financial Statements
Annual Shareholder Report
Notes to Financial Statements
September 30, 2016
1. ORGANIZATION
Federated Equity Funds (the “Trust”), is registered under the Investment Company Act of 1940, as amended (the “Act”), as a diversified, open-end management investment company. The Trust consists of 14 portfolios. The financial statements included herein are only those of the Federated Prudent Bear Fund (the “Fund”), diversified portfolio. The financial statements of the other portfolios are presented separately. The assets of each portfolio are segregated and a shareholder's interest is limited to the portfolio in which shares are held. Each portfolio pays its own expenses. The Fund offers three classes of shares: Class A Shares, Class C Shares and Institutional Shares. All shares of the Fund have equal rights with respect to voting, except on class-specific matters. The investment objective of the Fund is to seek capital appreciation.
2. SIGNIFICANT ACCOUNTING POLICIES
The following is a summary of significant accounting policies consistently followed by the Fund in the preparation of its financial statements. These policies are in conformity with U.S. generally accepted accounting principles (GAAP).
Investment Valuation
In calculating its net asset value (NAV), the Fund generally values investments as follows:
| ■ | Equity securities including shares of exchange traded funds listed on an exchange or traded through a regulated market system are valued at their last reported sale price or official closing price in their principal exchange or market. |
| ■ | Fixed-income securities acquired with remaining maturities greater than 60 days are fair valued using price evaluations provided by a pricing service approved by the Fund's Board of Trustees (the “Trustees”). |
| ■ | Fixed-income securities and repurchase agreements acquired with remaining maturities of 60 days or less are valued at their cost (adjusted for the accretion of any discount or amortization of any premium), unless the issuer's creditworthiness is impaired or other factors indicate that amortized cost is not an accurate estimate of the investment's fair value, in which case it would be valued in the same manner as a longer-term security. |
| ■ | Shares of other mutual funds or non-exchange-traded investment companies are valued based upon their reported NAVs. |
| ■ | Derivative contracts listed on exchanges are valued at their reported settlement or closing price, except that options are valued at the mean of closing bid and asked quotations. |
| ■ | Over-the-counter (OTC) derivative contracts are fair valued using price evaluations provided by a pricing service approved by the Trustees. |
| ■ | For securities that are fair valued in accordance with procedures established by and under the general supervision of the Trustees, certain factors may be considered such as: the last traded or purchase price of the security, information obtained by contacting the issuer or dealers, analysis of the issuer's financial statements or other available documents, fundamental analytical data, the nature and duration of restrictions on disposition, the movement of the market in which the security is normally traded, public trading in similar securities or derivative contracts of the issuer or comparable issuers, movement of a relevant index, or other factors including but not limited to industry changes and relevant government actions. |
Annual Shareholder Report
If any price, quotation, price evaluation or other pricing source is not readily available when the NAV is calculated, or if the Fund cannot obtain price evaluations from a pricing service or from more than one dealer for an investment within a reasonable period of time as set forth in the Fund's valuation policies and procedures, the Fund uses the fair value of the investment determined in accordance with the procedures described below. There can be no assurance that the Fund could obtain the fair value assigned to an investment if it sold the investment at approximately the time at which the Fund determines its NAV per share.
Fair Valuation and Significant Events Procedures
The Trustees have ultimate responsibility for determining the fair value of investments for which market quotations are not readily available. The Trustees have appointed a valuation committee (“Valuation Committee”) comprised of officers of the Fund, Federated Equity Management Company of Pennsylvania (“Adviser”) and certain of the Adviser's affiliated companies to assist in determining fair value and in overseeing the calculation of the NAV. The Trustees have also authorized the use of pricing services recommended by the Valuation Committee to provide fair value evaluations of the current value of certain investments for purposes of calculating the NAV. The Valuation Committee employs various methods for reviewing third-party pricing-service evaluations including periodic reviews of third-party pricing services' policies, procedures and valuation methods (including key inputs, methods, models and assumptions), transactional back-testing, comparisons of evaluations of different pricing services, and review of price challenges by the Adviser based on recent market activity. In the event that market quotations and price evaluations are not available for an investment, the Valuation Committee determines the fair value of the investment in accordance with procedures adopted by the Trustees. The Trustees periodically review and approve the fair valuations made by the Valuation Committee and any changes made to the procedures.
Factors considered by pricing services in evaluating an investment include the yields or prices of investments of comparable quality, coupon, maturity, call rights and other potential prepayments, terms and type, reported transactions, indications as to values from dealers and general market conditions. Some pricing services provide a single price evaluation reflecting the bid-side of the market for an investment (a “bid” evaluation). Other pricing services offer both bid evaluations and price evaluations indicative of a price between the prices bid and asked for the investment (a “mid” evaluation). The Fund normally uses bid evaluations for any U.S. Treasury and Agency securities, mortgage-backed securities and municipal securities. The Fund normally uses mid evaluations for any other types of fixed-income securities and any OTC derivative contracts. In the event that market quotations and price evaluations are not available for an investment, the fair value of the investment is determined in accordance with procedures adopted by the Trustees.
The Trustees also have adopted procedures requiring an investment to be priced at its fair value whenever the Adviser determines that a significant event affecting the value of the investment has occurred between the time as of which the price of the investment would otherwise be determined and the time as of which the NAV is computed. An event is considered significant if there is both an affirmative expectation that the investment's value will change in response to the event and a reasonable basis for quantifying the resulting change in value. Examples of significant events that may occur after the close of the principal market on which a security is traded, or after the time of a price evaluation provided by a pricing service or a dealer, include:
| ■ | With respect to securities traded principally in foreign markets, significant trends in U.S. equity markets or in the trading of foreign securities index futures contracts; |
Annual Shareholder Report
| ■ | Political or other developments affecting the economy or markets in which an issuer conducts its operations or its securities are traded; |
| ■ | Announcements concerning matters such as acquisitions, recapitalizations, litigation developments, or a natural disaster affecting the issuer's operations or regulatory changes or market developments affecting the issuer's industry. |
The Trustees have adopted procedures whereby the Valuation Committee uses a pricing service to determine the fair value of equity securities traded principally in foreign markets when the Adviser determines that there has been a significant trend in the U.S. equity markets or in index futures trading. For other significant events, the Fund may seek to obtain more current quotations or price evaluations from alternative pricing sources. If a reliable alternative pricing source is not available, the Fund will determine the fair value of the investment in accordance with the fair valuation procedures approved by the Trustees. The Trustees have ultimate responsibility for any fair valuations made in response to a significant event.
Repurchase Agreements
The Fund may invest in repurchase agreements for short-term liquidity purposes. It is the policy of the Fund to require the other party to a repurchase agreement to transfer to the Fund's custodian or sub-custodian eligible securities or cash with a market value (after transaction costs) at least equal to the repurchase price to be paid under the repurchase agreement. The eligible securities are transferred to accounts with the custodian or sub-custodian in which the Fund holds a “securities entitlement” and exercises “control” as those terms are defined in the Uniform Commercial Code. The Fund has established procedures for monitoring the market value of the transferred securities and requiring the transfer of additional eligible securities if necessary to equal at least the repurchase price. These procedures also allow the other party to require securities to be transferred from the account to the extent that their market value exceeds the repurchase price or in exchange for other eligible securities of equivalent market value.
The insolvency of the other party or other failure to repurchase the securities may delay the disposition of the underlying securities or cause the Fund to receive less than the full repurchase price. Under the terms of the repurchase agreement, any amounts received by the Fund in excess of the repurchase price and related transaction costs must be remitted to the other party.
The Fund may enter into repurchase agreements in which eligible securities are transferred into joint trading accounts maintained by the custodian or sub-custodian for investment companies and other clients advised by the Fund's Adviser and its affiliates. The Fund will participate on a pro rata basis with the other investment companies and clients in its share of the securities transferred under such repurchase agreements and in its share of proceeds from any repurchase or other disposition of such securities.
Investment Income, Gains and Losses, Expenses and Distributions
Investment transactions are accounted for on a trade-date basis. Realized gains and losses from investment transactions are recorded on an identified-cost basis. Interest income and expenses are accrued daily. Dividend income and distributions to shareholders are recorded on the ex-dividend date. Foreign dividends are recorded on the ex-dividend date or when the Fund is informed of the ex-dividend date. Distributions of net investment income, if any, are declared and paid annually. Non-cash dividends included in dividend income, if any, are recorded at fair value. Amortization/accretion of premium and discount is included in investment income. Investment income, realized and unrealized gains and losses, and certain fund-level expenses are allocated to each class based on relative average daily net assets,
Annual Shareholder Report
except that Class A Shares, Class C Shares and Institutional Shares may bear distribution services fees and other service fees unique to those classes. The detail of the total fund expense waiver, reimbursement and reduction of $166,286 is disclosed in various locations in Note 5 and Note 6.
Dividends are declared separately for each class. No class has preferential dividend rights; differences in per share dividend rates are generally due to differences in separate class expenses.
Other Service Fees
The Fund may pay other service fees up to 0.25% of the average daily net assets of the Fund's Class A Shares and Class C Shares to unaffiliated financial intermediaries or to Federated Shareholder Services Company (FSSC) for providing services to shareholders and maintaining shareholder accounts. FSSC may voluntarily reimburse the Fund for other service fees. This voluntary reimbursement can be modified or terminated at any time. For the year ended September 30, 2016, other service fees for the Fund were as follows:
| | Other
Service Fees
Incurred |
| Class A Shares | $407,428 |
| Class C Shares | 81,082 |
| TOTAL | $488,510 |
Federal Taxes
It is the Fund's policy to comply with the Subchapter M provision of the Internal Revenue Code (the “Code”) and to distribute to shareholders each year substantially all of its income. Accordingly, no provision for federal income tax is necessary. As of and during the year ended September 30, 2016, the Fund did not have a liability for any uncertain tax positions. The Fund recognizes interest and penalties, if any, related to tax liabilities as income tax expense in the Statement of Operations. As of September 30, 2016, tax years 2013 through 2016 remain subject to examination by the Fund's major tax jurisdictions, which include the United States of America and the Commonwealth of Massachusetts.
The Fund may be subject to taxes imposed by governments of countries in which it invests. Such taxes are generally based on either income or gains earned or repatriated. The Fund accrues and applies such taxes to net investment income, net realized gains and net unrealized gains as income and/or gains are earned.
When-Issued and Delayed-Delivery Transactions
The Fund may engage in when-issued or delayed-delivery transactions. The Fund records when-issued securities on the trade date and maintains security positions such that sufficient liquid assets will be available to make payment for the securities purchased. Securities purchased on a when-issued or delayed-delivery basis are marked to market daily and begin earning interest on the settlement date. Losses may occur on these transactions due to changes in market conditions or the failure of counterparties to perform under the contract.
Annual Shareholder Report
Futures Contracts
The Fund purchases and sells financial futures contracts to manage market risk and sector/asset class risk. Upon entering into a financial futures contract with a broker, the Fund is required to deposit in a segregated account U.S. government securities or a specified amount of cash which is shown as Restricted cash in the Statement of Assets and Liabilities. Futures contracts are valued daily and unrealized gains or losses are recorded in a “variation margin” account. Daily, the Fund receives from or pays to the broker a specified amount of cash based upon changes in the variation margin account. When a contract is closed, the Fund recognizes a realized gain or loss. Futures contracts have market risks, including the risk that the change in the value of the contract may not correlate with the changes in the value of the underlying securities. There is minimal counterparty risk to the Fund since futures contracts are exchange traded and the exchange's clearinghouse, as counterparty to all exchange traded futures contracts, guarantees the futures contracts against default.
Futures contracts outstanding at period end are listed after the Fund's Portfolio of Investments.
The average notional value of short futures contracts held by the Fund throughout the period was $174,719,904. This is based on amounts held as of each month-end throughout the fiscal period.
Foreign Exchange Contracts
The Fund enters into foreign exchange contracts to manage currency risk and market risk. Purchased contracts are used to acquire exposure to foreign currencies, whereas, contracts to sell are used to hedge the Fund's securities against currency fluctuations. Risks may arise upon entering into these transactions from the potential inability of counterparties to meet the terms of their commitments and from unanticipated movements in security prices or foreign exchange rates. The foreign exchange contracts are adjusted by the daily exchange rate of the underlying currency and any gains or losses are recorded for financial statement purposes as unrealized until the settlement date.
Foreign exchange contracts are subject to Master Netting Agreements. Amounts presented on the Portfolio of Investments and Statement of Assets and Liabilities are not net settlement amounts but gross. Foreign exchange contracts outstanding at period end, including net unrealized appreciation/depreciation or net settlement amount, are listed after the Fund's Portfolio of Investments.
The average value at settlement date payable and receivable of foreign exchange contracts purchased and sold by the Fund throughout the period was $12,398,757 and $12,398,757, respectively. This is based on the contracts held as of each month-end throughout the fiscal period.
Foreign Currency Translation
The accounting records of the Fund are maintained in U.S. dollars. All assets and liabilities denominated in foreign currencies (FCs) are translated into U.S. dollars based on the rates of exchange of such currencies against U.S. dollars on the date of valuation. Purchases and sales of securities, income and expenses are translated at the rate of exchange quoted on the respective date that such transactions are recorded. The Fund does not isolate that portion of the results of operations resulting from changes in foreign exchange rates on investments from the fluctuations arising from changes in market prices of securities held. Such fluctuations are included with the net realized and unrealized gain or loss from investments.
Annual Shareholder Report
Reported net realized foreign exchange gains or losses arise from sales of portfolio securities, sales and maturities of short-term securities, sales of FCs, currency gains or losses realized between the trade and settlement dates on securities transactions, the difference between the amounts of dividends, interest and foreign withholding taxes recorded on the Fund's books, and the U.S. dollar equivalent of the amounts actually received or paid. Net unrealized foreign exchange gains and losses arise from changes in the value of assets and liabilities other than investments in securities at fiscal year end, resulting from changes in the exchange rate.
Option Contracts
The Fund buys or sells put and call options to manage individual security risk, market risk and sector/asset class risk. The seller (“writer”) of an option receives a payment or premium, from the buyer, which the writer keeps regardless of whether the buyer exercises the option. When the Fund writes a put or call option, an amount equal to the premium received is recorded as a liability and subsequently marked to market to reflect the current value of the option written. Premiums received from writing options which expire are treated as realized gains. The Fund, as a writer of an option, bears the market risk of an unfavorable change in the price of the underlying reference instrument. When the Fund purchases a put or call option, an amount equal to the premium paid is recorded as an increase to the cost of the investment and subsequently marked to market to reflect the current value of the option purchased. Premiums paid for purchasing options which expire are treated as realized losses. Premiums received/paid for writing/purchasing options which are exercised or closed are added to the proceeds or offset against amounts paid on the underlying reference instrument to determine the realized gain or loss. The risk associated with purchasing put and call options is limited to the premium paid. Options can trade on securities or commodities exchanges. In this case, the exchange sets all the terms of the contract except for the price. Most exchanges require investors to maintain margin accounts through their brokers to cover their potential obligations to the exchange. This protects investors against potential defaults by the counterparty.
The average notional amount of purchased put options held by the Fund throughout the period was $30,596. This is based on amounts held as of each month-end throughout the fiscal period.
At September 30, 2016, the Fund had no outstanding purchased put options.
Short Sales
In a short sale, the Fund sells a security it does not own in anticipation of a decline in the fair market value of the security. When the Fund sells a security short, it must borrow the security in order to deliver it at the completion of the sale. A gain, limited to the price at which the Fund sold the security short, or a loss, unlimited in size, will be recognized upon the termination of the short sale.
The Fund has an obligation to replace the borrowed security (e.g., to purchase the security at a future date and deliver it to the lender of the security). While the security is borrowed, the proceeds from the sale are deposited with the lender (“Prime Broker”). The Fund may incur two types of expenses from short sales: borrowing expenses and dividend expenses. Borrowing expenses may occur because the Fund may be obligated to pay fees to the Prime Broker on borrowed securities. This fee is normally based upon the market value of the borrowed security and is dependent upon the availability of the security. Dividend expenses may occur because the Fund has to pay the Prime Broker the equivalent of any dividends earned on the borrowed security.
Annual Shareholder Report
For the year ended September 30, 2016, the net realized gain (loss) on the short sales was $(53,984,998).
Restricted Securities
The Fund may purchase securities which are considered restricted. Restricted securities are securities that either: (a) cannot be offered for public sale without first being registered, or being able to take advantage of an exemption from registration, under the Securities Act of 1933; or (b) are subject to contractual restrictions on public sales. In some cases, when a security cannot be offered for public sale without first being registered, the issuer of the restricted security has agreed to register such securities for resale, at the issuer's expense, either upon demand by the Fund or in connection with another registered offering of the securities. Many such restricted securities may be resold in the secondary market in transactions exempt from registration. Restricted securities may be determined to be liquid under criteria established by the Trustees. The Fund will not incur any registration costs upon such resales. The Fund's restricted securities, like other securities, are priced in accordance with procedures established by and under the general supervision of the Trustees.
Additional Disclosure Related to Derivative Instruments
| Fair Value of Derivative Instruments |
| | Asset | Liability |
| | Statement of
Assets and
Liabilities
Location | Fair
Value | Statement of
Assets and
Liabilities
Location | Fair
Value |
| Derivatives not accounted for as hedging instruments under ASC Topic 815 | | | | |
| Equity contracts | | | Payable for daily
variation margin on
futures contracts | $(1,812,584)* |
| Foreign exchange contracts | Unrealized
appreciation
on foreign
exchange
contracts | $338,070 | Unrealized
depreciation
on foreign
exchange
contracts | $158,461 |
| Total derivatives not accounted for as hedging instruments under ASC Topic 815 | | $338,070 | | $(1,654,123) |
| * | Includes cumulative appreciation of futures contracts as reported in the footnotes to the Portfolio of Investments. Only the current day's variation margin is reported within the Statement of Assets and Liabilities. |
| | |
Annual Shareholder Report
The Effect of Derivative Instruments on the Statement of Operations for the Year Ended September 30, 2016
| Amount of Realized Gain or (Loss) on Derivatives Recognized in Income |
| | Futures
Contracts | Foreign
Exchange
Contracts | Purchased
Option
Contracts | Total |
| Foreign exchange contracts | $— | $691,877 | $— | $691,877 |
| Equity contracts | (32,972,329) | — | (652,176) | (33,624,505) |
| TOTAL | $(32,972,329) | $691,877 | $(652,176) | $($32,932,628) |
| Change in Unrealized Appreciation or (Depreciation) on Derivatives Recognized in Income |
| | Futures
Contracts | Foreign
Exchange
Contracts | Total |
| Equity contracts | $(1,803,434) | $193,344 | $($1,610,090) |
Other
The preparation of financial statements in conformity with GAAP requires management to make estimates and assumptions that affect the amounts of assets, liabilities, expenses and revenues reported in the financial statements. Actual results could differ from those estimated. The Fund applies Investment Company accounting and reporting guidance.
3. SHARES OF BENEFICIAL INTEREST
The following tables summarize share activity:
| Year Ended September 30 | 2016 | 2015 |
| Class A Shares: | Shares1 | Amount | Shares1 | Amount |
| Shares sold | 4,434,625 | $96,151,305 | 4,029,993 | $90,365,386 |
| Shares issued to shareholders in payment of distributions declared | — | — | — | — |
| Shares redeemed | (4,441,385) | (94,586,039) | (4,739,161) | (106,038,026) |
NET CHANGE RESULTING FROM
CLASS A SHARE TRANSACTIONS | (6,760) | $1,565,266 | (709,168) | $(15,672,640) |
| Year Ended September 30 | 2016 | 2015 |
| Class C Shares: | Shares1 | Amount | Shares1 | Amount |
| Shares sold | 519,241 | $10,155,970 | 406,542 | $8,415,731 |
| Shares issued to shareholders in payment of distributions declared | — | — | — | — |
| Shares redeemed | (563,062) | (10,725,609) | (703,572) | (14,220,637) |
NET CHANGE RESULTING FROM
CLASS C SHARE TRANSACTIONS | (43,821) | $(569,639) | (297,030) | $(5,804,906) |
Annual Shareholder Report
| Year Ended September 30 | 2016 | 2015 |
| Institutional Shares: | Shares1 | Amount | Shares1 | Amount |
| Shares sold | 21,041,513 | $464,305,428 | 11,777,615 | $273,166,480 |
| Shares redeemed | (20,246,137) | (428,258,935) | (12,224,905) | (280,148,179) |
| NET CHANGE RESULTING FROM INSTITUTIONAL SHARE TRANSACTIONS | 795,376 | $36,046,493 | (447,290) | $(6,981,699) |
NET CHANGE RESULTING FROM
TOTAL FUND SHARE TRANSACTIONS | 744,795 | $37,042,120 | (1,453,488) | $(28,459,245) |
| 1 | Shares purchased/redeemed prior to February 5, 2016 have been adjusted to reflect a 1-for-10 reverse share split. |
4. FEDERAL TAX INFORMATION
The timing and character of income and capital gain distributions are determined in accordance with income tax regulations, which may differ from GAAP. These differences are due to differing treatments for foreign currency transactions, dividends paid on short positions, partnership income, passive foreign investment company adjustments and net operating loss.
For the year ended September 30, 2016, permanent differences identified and reclassified among the components of net assets were as follows:
| Increase (Decrease) |
| Paid-In Capital | Undistributed
Net Investment
Income (Loss) | Accumulated
Net Realized
Gain (Loss) |
| $(4,770,683) | $5,947,136 | $(1,176,453) |
Net investment income (loss), net realized gains (losses), and net assets were not affected by this reclassification.
As of September 30, 2016, the components of distributable earnings on a tax-basis were as follows:
| Net unrealized depreciation | $(14,894,062) |
| Capital loss carryforwards and deferrals | $(1,143,839,242) |
The difference between book-basis and tax-basis net unrealized appreciation/depreciation is attributable in part to differing treatments for the deferral of losses on wash sales, real estate investment trust dividends reclassed from income to capital gains and partnership adjustments.
At September 30, 2016, the cost of investments for federal tax purposes was $359,987,176. The net unrealized depreciation of investments for federal tax purposes excluding any unrealized appreciation/depreciation resulting from: (a) the translation from FCs to U.S. dollars of assets and liabilities other than investments in securities; (b) outstanding foreign currency commitments; (c) futures contracts; and (d) short sales was $11,800,120. This consists of net unrealized appreciation from investments for those securities having an excess of value over cost of $9,495,052 and net unrealized depreciation from investments for those securities having an excess of cost over value of $21,295,172.
Annual Shareholder Report
At September 30, 2016, the Fund had a capital loss carryforward of $1,141,233,322 which will reduce the Fund's taxable income arising from future net realized gains on investments, if any, to the extent permitted by the Code, thereby reducing the amount of distributions to shareholders which would otherwise be necessary to relieve the Fund of any liability for federal income tax. Pursuant to the Code, a net capital loss incurred in taxable years beginning on or before December 22, 2010, is characterized as short-term and may be carried forward for a maximum of eight tax years (“Carryforward Limit”), whereas a net capital loss incurred in taxable years beginning after December 22, 2010, retains its character as either short-term or long-term, does not expire and is required to be utilized prior to the losses which have a Carryforward Limit.
The following schedule summarizes the Fund's capital loss carryforwards and expiration years:
| Expiration Year | Short-Term | Long-Term | Total |
| No Expiration | $550,811,774 | $165,475,038 | $716,286,812 |
| 2018 | $68,635,173 | NA | $68,635,173 |
| 2019 | $356,311,337 | NA | $356,311,337 |
Under current tax rules, a late-year ordinary loss may be deferred, in whole or in part, and treated as occurring on the first day of the following fiscal year. As of September 30, 2016, for federal income tax purposes, a late year ordinary loss of $2,605,920 were deferred to October 1, 2016.
5. INVESTMENT ADVISER FEE AND OTHER TRANSACTIONS WITH AFFILIATES
Investment Adviser Fee
The advisory agreement between the Fund and the Adviser provides for an annual fee equal to 1.25% of the Fund's average daily net assets. The Adviser may voluntarily choose to waive any portion of its fee. The Adviser can modify or terminate this voluntary waiver at any time at its sole discretion. For the year ended September 30, 2016, the Adviser voluntarily waived $159,217 of its fee.
Administrative Fee
Federated Administrative Services (FAS), under the Administrative Services Agreement, provides the Fund with administrative personnel and services. For purposes of determining the appropriate rate breakpoint, “Investment Complex” is defined as all of the Federated Funds subject to a fee under the Administrative Services Agreement. The fee paid to FAS is based on the average daily net assets of the Investment Complex as specified below, plus certain out-of-pocket expenses:
| Administrative Fee | Average Daily Net Assets
of the Investment Complex |
| 0.150% | on the first $5 billion |
| 0.125% | on the next $5 billion |
| 0.100% | on the next $10 billion |
| 0.075% | on assets in excess of $20 billion |
Annual Shareholder Report
FAS may voluntarily choose to waive any portion of its fee. FAS can modify or terminate this voluntary waiver at any time at its sole discretion. For the year ended September 30, 2016, the annualized fee paid to FAS was 0.078% of average daily net assets of the Fund.
Distribution Services Fee
The Fund has adopted a Distribution Plan (the “Plan”) pursuant to Rule 12b-1 under the Act. Under the terms of the Plan, the Fund will compensate Federated Securities Corp. (FSC), the principal distributor, from the daily net assets of the Fund's Class A Shares and Class C Shares to finance activities intended to result in the sale of these shares. The Plan provides that the Fund may incur distribution expenses at the following percentages of average daily net assets annually, to compensate FSC:
| Share Class Name | Percentage of Average Daily
Net Assets of Class |
| Class A Shares | 0.05% |
| Class C Shares | 0.75% |
FSC may voluntarily choose to waive any portion of its fee. FAS can modify or terminate this voluntary waiver at any time at its sole discretion. For the year ended September 30, 2016, distribution services fees for the Fund were as follows:
| | Distribution
Services Fees
Incurred |
| Class C Shares | $245,468 |
When FSC receives fees, it may pay some or all of them to financial intermediaries whose customers purchase shares. For the year ended September 30, 2016, FSC retained $40,593 of fees paid by the Fund. For the year ended September 30, 2016, the Fund's Class A Shares did not incur a distribution services fee; however, it may begin to incur this fee upon approval of the Trustees.
Sales Charges
Front-end sales charges and contingent deferred sales charges (CDSC) do not represent expenses of the Fund. They are deducted from the proceeds of sales of Fund shares prior to investment or from redemption proceeds prior to remittance, as applicable. For the year ended September 30, 2016, FSC retained $32,118 in sales charges from the sale of Class A Shares. FSC also retained $10,004 of CDSC relating to redemptions of Class C Shares.
Other Service Fees
For the year ended September 30, 2016, FSSC received $42,193 of the other service fees disclosed in Note 2.
Expense Limitation
The Adviser and certain of its affiliates (which may include FSC, FAS and FSSC) on their own initiative have agreed to waive certain amounts of their respective fees and/or reimburse expenses. Effective January 1, 2017, total annual fund operating expenses (as shown in the financial highlights, excluding dividends and other expenses related to short sales, interest expense, extraordinary expenses, line of credit expenses and proxy-related expenses paid by the Fund, if any) paid by the Fund's Class A Shares, Class C Shares and Institutional Shares (after the voluntary waivers and/or reimbursements) will not exceed 1.77%, 2.52% and 1.52%
Annual Shareholder Report
(the “Fee Limit”), respectively, up to but not including the later of (the “Termination Date”): (a) December 1, 2017; or (b) the date of the Fund's next effective Prospectus. While the Adviser and its applicable affiliates currently do not anticipate terminating or increasing these arrangements prior to the Termination Date, these arrangements may only be terminated or the Fee Limit increased prior to the Termination Date with the agreement of the Trustees.
Interfund Transactions
During the year ended September 30, 2016, the Fund engaged in sale transactions with funds that have a common investment adviser (or affiliated investment advisers), common Directors/Trustees and/or common Officers. These sale transactions complied with Rule 17a-7 under the Act and amounted to $57,372,427.
General
Certain Officers and Trustees of the Fund are Officers and Directors or Trustees of certain of the above companies. To efficiently facilitate payment, Directors'/Trustees' fees and certain expenses related to conducting meetings of the Directors/Trustees and other miscellaneous expenses are paid by an affiliate of the Adviser which in due course are reimbursed by the Fund. Such expenses may be included in Accrued and Miscellaneous Expenses on the Statement of Assets and Liabilities and Statement of Operations, respectively.
Transactions Involving Affiliated Holdings
Affiliated holdings are investment companies which are managed by the Adviser or an affiliate of the Adviser. The Adviser has agreed to reimburse the Fund for certain investment adviser fees as a result of transactions in other affiliated investment companies. For the year ended September 30, 2016, the Adviser reimbursed $6,709. Transactions involving the affiliated holding during the year ended September 30, 2016, were as follows:
| | Federated
U.S. Treasury
Cash Reserves Fund,
Institutional Shares | Federated
Government
Obligations Fund,
Premier Shares | Total of
Affiliated
Transactions | |
| Balance of Shares Held 9/30/2015 | 72,819,466 | — | 72,819,466 |
| Purchases/Additions | 436,784,066 | 485,404,773 | 922,188,839 |
| Sales/Reductions | (509,603,532) | (468,162,496) | (977,766,028) |
| Balance of Shares Held 9/30/2016 | — | 17,242,277 | 17,242,277 |
| Value | $— | $17,242,277 | $17,242,277 |
| Dividend Income | $18,320 | $27,871 | $46,191 |
6. EXPENSE Reduction
The Fund directs portfolio trades to a broker that in turn pays a portion of the Fund's operating expenses. For the year ended September 30, 2016, the Fund's expenses were reduced by $360 under these arrangements.
Annual Shareholder Report
7. Investment TRANSACTIONS
Purchases and sales of investments, excluding long-term U.S. government securities and short-term obligations, for the year ended September 30, 2016, were as follows:
| Purchases | $2,495,187,833 |
| Sales | $2,308,650,094 |
8. LINE OF CREDIT
The Fund participates with certain other Federated Funds, on a several basis, in an up to $500,000,000 unsecured, 364-day, committed, revolving line of credit (LOC) agreement. The LOC was made available to finance temporarily the repurchase or redemption of shares of the Fund, failed trades, payment of dividends, settlement of trades and for other short-term, temporary or emergency general business purposes. The Fund cannot borrow under the LOC if an inter-fund loan is outstanding. The Fund's ability to borrow under the LOC also is subject to the limitations of the Act and various conditions precedent that must be satisfied before the Fund can borrow. Loans under the LOC are charged interest at a fluctuating rate per annum equal to the highest, on any day, of (a) (i) the federal funds effective rate, (ii) the one month London Interbank Offer Rate (LIBOR), and (iii) 0.0%, plus (b) a margin. The LOC also requires the Fund to pay, quarterly in arrears and at maturity, its pro rata share of a commitment fee based on the amount of the lenders' commitment that has not been utilized. As of September 30, 2016, the Fund had no outstanding loans. During the year ended September 30, 2016, the Fund did not utilize the LOC.
9. INTERFUND LENDING
Pursuant to an Exemptive Order issued by the Securities and Exchange Commission (SEC), the Fund, along with other funds advised by subsidiaries of Federated Investors, Inc., may participate in an interfund lending program. This program provides an alternative credit facility allowing the Fund to borrow from other participating affiliated funds.
10. REGULATORY MATTERS
On October 13, 2016, the SEC amended existing rules intended to modernize reporting and disclosure of information. These amendments relate to Regulation S-X which sets forth the form and content of financial statements. At this time, management is evaluating the implications of adopting these amendments and their impact on the financial statements and accompanying notes.
Annual Shareholder Report
Report of Independent Registered Public Accounting Firm
TO THE BOARD OF TRUSTEES OF the federated Equity Funds AND THE SHAREHOLDERS OF FEDERATED Prudent bear fund:
We have audited the accompanying statement of assets and liabilities, including the portfolio of investments, of the Federated Prudent Bear Fund (the “Fund”), a portfolio of Federated Equity Funds as of September 30, 2016, and the related statement of operations for the year then ended, the statements of changes in net assets for each of the years in the two-year period then ended, and the financial highlights for each of the years in the five-year period then ended. These financial statements and financial highlights are the responsibility of the Fund's management. Our responsibility is to express an opinion on these financial statements and financial highlights based on our audits.
We conducted our audits in accordance with the standards of the Public Company Accounting Oversight Board (United States). Those standards require that we plan and perform the audit to obtain reasonable assurance about whether the financial statements and financial highlights are free of material misstatement. An audit includes examining, on a test basis, evidence supporting the amounts and disclosures in the financial statements. Our procedures included confirmation of securities owned as of September 30, 2016, by correspondence with the custodian and brokers or by other appropriate audit procedures. An audit also includes assessing the accounting principles used and significant estimates made by management, as well as evaluating the overall financial statement presentation. We believe that our audits provide a reasonable basis for our opinion.
In our opinion, the financial statements and financial highlights referred to above present fairly, in all material respects, the financial position of the Federated Prudent Bear Fund as of September 30, 2016, and the results of its operations for the year then ended, the changes in its net assets for each of the years in the two-year period then ended, and the financial highlights for each of the years in the five-year period then ended, in conformity with U.S. generally accepted accounting principles.
Boston, Massachusetts
November 22, 2016
Annual Shareholder Report
Shareholder Expense Example (unaudited)
As a shareholder of the Fund, you incur two types of costs: (1) transaction costs, including sales charges (loads) on purchase or redemption payments; and (2) ongoing costs, including management fees and to the extent applicable, distribution (12b-1) fees and/or other service fees and other Fund expenses. This Example is intended to help you to understand your ongoing costs (in dollars) of investing in the Fund and to compare these costs with the ongoing costs of investing in other mutual funds. It is based on an investment of $1,000 invested at the beginning of the period and held for the entire period from April 1, 2016 to September 30, 2016.
ACTUAL EXPENSES
The first section of the table below provides information about actual account values and actual expenses. You may use the information in this section, together with the amount you invested, to estimate the expenses that you incurred over the period. Simply divide your account value by $1,000 (for example, an $8,600 account value divided by $1,000 = 8.6), then multiply the result by the number in the first section under the heading entitled “Expenses Paid During Period” to estimate the expenses attributable to your investment during this period.
HYPOTHETICAL EXAMPLE FOR COMPARISON PURPOSES
The second section of the table below provides information about hypothetical account values and hypothetical expenses based on the Fund's actual expense ratio and an assumed rate of return of 5% per year before expenses, which is not the Fund's actual return. Thus, you should not use the hypothetical account values and expenses to estimate the actual ending account balance or your expenses for the period. Rather, these figures are required to be provided to enable you to compare the ongoing costs of investing in the Fund with other funds. To do so, compare this 5% hypothetical example with the 5% hypothetical examples that appear in the shareholder reports of the other funds.
Annual Shareholder Report
Please note that the expenses shown in the table are meant to highlight your ongoing costs only and do not reflect any transaction costs, such as sales charges (loads) on purchase or redemption payments. Therefore, the second section of the table is useful in comparing ongoing costs only, and will not help you determine the relative total costs of owning different funds. In addition, if these transaction costs were included, your costs would have been higher.
| | Beginning
Account Value
4/1/2016 | Ending
Account Value
9/30/2016 | Expenses Paid
During Period1 |
| Actual: | | | |
| Class A Shares | $1,000 | $924.20 | $15.01 |
| Class C Shares | $1,000 | $921.20 | $18.59 |
| Institutional Shares | $1,000 | $925.50 | $13.53 |
Hypothetical (assuming a 5% return
before expenses): | | | |
| Class A Shares | $1,000 | $1,009.40 | $15.67 |
| Class C Shares | $1,000 | $1,005.65 | $19.40 |
| Institutional Shares | $1,000 | $1,010.95 | $14.13 |
| 1 | Expenses are equal to the Fund's annualized net expense ratios, multiplied by the average account value over the period, multiplied by 183/366 (to reflect the one-half-year period). The annualized net expense ratios are as follows: |
| | |
| Class A Shares | 3.12% |
| Class C Shares | 3.87% |
| Institutional Shares | 2.81% |
Annual Shareholder Report
Board of Trustees and Trust Officers
The Board of Trustees is responsible for managing the Trust's business affairs and for exercising all the Trust's powers except those reserved for the shareholders. The following tables give information about each Trustee and the senior officers of the Fund. Where required, the tables separately list Trustees who are “interested persons” of the Fund (i.e., “Interested” Trustees) and those who are not (i.e., “Independent” Trustees). Unless otherwise noted, the address of each person listed is Federated Investors Tower, 1001 Liberty Avenue, Pittsburgh, PA 15222. The address of all Independent Trustees listed is 4000 Ericsson Drive, Warrendale, PA 15086-7561; Attention: Mutual Fund Board. As of December 31, 2015, the Trust comprised 14 portfolio(s), and the Federated Fund Family consisted of 38 investment companies (comprising 122 portfolios). Unless otherwise noted, each Officer is elected annually. Unless otherwise noted, each Trustee oversees all portfolios in the Federated Fund Family and serves for an indefinite term. The Fund's Statement of Additional Information includes additional information about Trust Trustees and is available, without charge and upon request, by calling 1-800-341-7400.
Interested TRUSTEES Background
Name
Birth Date
Positions Held with Trust
Date Service Began | Principal Occupation(s) for Past Five Years,
Other Directorships Held and Previous Position(s) |
J. Christopher Donahue*
Birth Date: April 11, 1949
President and Trustee
Indefinite Term
Began serving: January 2000 | Principal Occupations: Principal Executive Officer and President of certain of the Funds in the Federated Fund Family; Director or Trustee of the Funds in the Federated Fund Family; President, Chief Executive Officer and Director, Federated Investors, Inc.; Chairman and Trustee, Federated Investment Management Company; Trustee, Federated Investment Counseling; Chairman and Director, Federated Global Investment Management Corp.; Chairman, Federated Equity Management Company of Pennsylvania and Passport Research, Ltd. (investment advisory subsidiary of Federated); Trustee, Federated Shareholder Services Company; Director, Federated Services Company.
Previous Positions: President, Federated Investment Counseling; President and Chief Executive Officer, Federated Investment Management Company, Federated Global Investment Management Corp. and Passport Research, Ltd. |
Annual Shareholder Report
Name
Birth Date
Positions Held with Trust
Date Service Began | Principal Occupation(s) for Past Five Years,
Other Directorships Held and Previous Position(s) |
John B. Fisher*
Birth Date: May 16, 1956
Trustee
Indefinite Term
Began serving: May 2016 | Principal Occupations: Principal Executive Officer and President of certain of the Funds in the Federated Fund Family; Director or Trustee of certain of the Funds in the Federated Fund Family; Vice President, Federated Investors, Inc.; President, Director/Trustee and CEO, Federated Advisory Services Company, Federated Equity Management Company of Pennsylvania, Federated Global Investment Management Corp., Federated Investment Counseling, Federated Investment Management Company; President and CEO of Passport Research, Ltd.; President of some of the Funds in the Federated Fund Complex and Director, Federated Investors Trust Company.
Previous Positions: President and Director of the Institutional Sales Division of Federated Securities Corp.; President and Director of Federated Investment Counseling; Director, Edgewood Securities Corp.; Director, Federated Services Company; Director, Federated Investors, Inc.; Chairman and Director, Southpointe Distribution Services, Inc. and President, Technology, Federated Services Company. |
| * | Reasons for “interested” status: J. Christopher Donahue and John B. Fisher are interested due to their beneficial ownership of shares of Federated Investors, Inc. and due to positions they hold with Federated and its subsidiaries. J. Christopher Donahue is the son of John F. Donahue, Chairman Emeritus of the Federated Funds. |
INDEPENDENT TRUSTEES Background
Name
Birth Date
Positions Held with Trust
Date Service Began | Principal Occupation(s) for Past Five Years,
Other Directorships Held, Previous Position(s) and Qualifications |
John T. Collins
Birth Date: January 24, 1947
Trustee
Indefinite Term
Began serving: October 2013 | Principal Occupations: Director or Trustee of the Federated Fund Family; Retired.
Other Directorships Held: Director, Chair of the Compensation Committee, Audit Committee member, KLX Corp.
Qualifications: Mr. Collins has served in several business and financial management roles and directorship positions throughout his career. Mr. Collins previously served as Chairman and CEO, The Collins Group, Inc. (a private equity firm). Mr. Collins serves as Chairman Emeriti, Bentley University. Mr. Collins previously served as Director, FleetBoston Financial Corp.; Director and Audit Committee Member, Bank of America Corp. and Director, Beth Israel Deaconess Medical Center (Harvard University Affiliate Hospital). |
Annual Shareholder Report
Name
Birth Date
Positions Held with Trust
Date Service Began | Principal Occupation(s) for Past Five Years,
Other Directorships Held, Previous Position(s) and Qualifications |
G. Thomas Hough
Birth Date: February 28, 1955
Trustee
Indefinite Term
Began serving: August 2015 | Principal Occupations: Director or Trustee of the Federated Fund Family; Retired.
Other Directorships Held: Director, Chair of the Audit Committee, Governance Committee, Publix Super Markets, Inc.; Director, Equifax, Inc.
Qualifications: Mr. Hough has served in accounting, business management and directorship positions throughout his career. Mr. Hough most recently held the position of Americas Vice Chair of Assurance with Ernst & Young LLP. Mr. Hough is an Executive Committee member of the United States Golf Association, he serves on the President's Cabinet and Business School Board of Visitors for the University of Alabama and is on the Business School Board of Visitors for Wake Forest University. |
Maureen Lally-Green
Birth Date: July 5, 1949
Trustee
Indefinite Term
Began serving: August 2009 | Principal Occupations: Director or Trustee of the Federated Fund Family; Interim Dean of the Duquesne University School of Law; Adjunct Professor of Law, Duquesne University School of Law.
Other Directorships Held: Director, CONSOL Energy Inc.
Qualifications: Judge Lally-Green has served in various legal and business roles and directorship positions throughout her career. Judge Lally-Green previously served as: Associate General Secretary, Diocese of Pittsburgh; a member of the Superior Court of Pennsylvania; and as a Professor of Law, Duquesne University School of Law. Judge Lally-Green also holds the positions on either a public or not for profit Board of Directors as follows: Member, Pennsylvania State Board of Education (public); Director and Chair, UPMC Mercy Hospital; Regent, St. Vincent Seminary; Director and Vice Chair, Our Campaign for the Church Alive!, Inc.; Director, Saint Vincent College; and Director and Chair, Cardinal Wuerl North Catholic High School, Inc. Judge Lally-Green has held the positions of: Director, Auberle; Director, Ireland Institute of Pittsburgh; Director, Saint Thomas More Society; and Director, Catholic High Schools of the Diocese of Pittsburgh, Inc. |
Peter E. Madden
Birth Date: March 16, 1942
Trustee
Indefinite Term
Began serving: November 1991 | Principal Occupation: Director or Trustee, and Chair of the Board of Directors or Trustees, of the Federated Fund Family; Retired.
Other Directorships Held: None.
Qualifications: Mr. Madden has served in several business management, mutual fund services and directorship positions throughout his career. Mr. Madden previously served as President, Chief Operating Officer and Director, State Street Bank and Trust Company (custodian bank) and State Street Corporation (financial services). He was Director, VISA USA and VISA International and Chairman and Director, Massachusetts Bankers Association. Mr. Madden served as Director, Depository Trust Corporation and Director, The Boston Stock Exchange. Mr. Madden also served as a Representative to the Commonwealth of Massachusetts General Court. |
Annual Shareholder Report
Name
Birth Date
Positions Held with Trust
Date Service Began | Principal Occupation(s) for Past Five Years,
Other Directorships Held, Previous Position(s) and Qualifications |
Charles F. Mansfield, Jr.
Birth Date: April 10, 1945
Trustee
Indefinite Term
Began serving: January 1999 | Principal Occupations: Director or Trustee of the Federated Fund Family; Management Consultant.
Other Directorships Held: None.
Qualifications: Mr. Mansfield has served in several banking, business management and educational roles and directorship positions throughout his career. Mr. Mansfield previously served as Chief Executive Officer, PBTC International Bank; Partner, Arthur Young & Company (now Ernst & Young LLP); Chief Financial Officer of Retail Banking Sector, Chase Manhattan Bank; Senior Vice President, HSBC Bank USA (formerly, Marine Midland Bank); Vice President, Citibank; Assistant Professor of Banking and Finance, Frank G. Zarb School of Business, Hofstra University; Executive Vice President DVC Group, Inc. (marketing, communications and technology). |
Thomas M. O'Neill
Birth Date: June 14, 1951
Trustee
Indefinite Term
Began serving: October 2006 | Principal Occupations: Director or Trustee, Chair of the Audit Committee of the Federated Fund Family; Sole Proprietor, Navigator Management Company (investment and strategic consulting).
Other Directorships Held: None.
Qualifications: Mr. O'Neill has served in several business, mutual fund and financial management roles and directorship positions throughout his career. Mr. O'Neill serves as Director, Medicines for Humanity and Director, The Golisano Children's Museum of Naples, Florida. Mr. O'Neill previously served as Chief Executive Officer and President, Managing Director and Chief Investment Officer, Fleet Investment Advisors; President and Chief Executive Officer, Aeltus Investment Management, Inc.; General Partner, Hellman, Jordan Management Co., Boston, MA; Chief Investment Officer, The Putnam Companies, Boston, MA; Credit Analyst and Lending Officer, Fleet Bank; Director and Consultant, EZE Castle Software (investment order management software); and Director, Midway Pacific (lumber). |
P. Jerome Richey
Birth Date: February 23, 1949
Trustee
Indefinite Term
Began serving: October 2013 | Principal Occupations: Director or Trustee of the Federated Fund Family; Management Consultant.
Other Directorships Held: None.
Qualifications: Mr. Richey has served in several business and legal management roles and directorship positions throughout his career. Mr. Richey most recently held the positions of Senior Vice Chancellor and Chief Legal Officer, University of Pittsburgh. Mr. Richey serves as Board Member, Epilepsy Foundation of Western Pennsylvania and Board member, World Affairs Council of Pittsburgh. Mr. Richey previously served as Chief Legal Officer and Executive Vice President, CONSOL Energy Inc. and Shareholder, Buchanan Ingersoll & Rooney PC (a law firm). |
Annual Shareholder Report
Name
Birth Date
Positions Held with Trust
Date Service Began | Principal Occupation(s) for Past Five Years,
Other Directorships Held, Previous Position(s) and Qualifications |
John S. Walsh
Birth Date: November 28, 1957
Trustee
Indefinite Term
Began serving: January 1999 | Principal Occupations: Director or Trustee of the Federated Fund Family; President and Director, Heat Wagon, Inc. (manufacturer of construction temporary heaters); President and Director, Manufacturers Products, Inc. (distributor of portable construction heaters); President, Portable Heater Parts, a division of Manufacturers Products, Inc.
Other Directorships Held: None.
Qualifications: Mr. Walsh has served in several business management roles and directorship positions throughout his career. Mr. Walsh previously served as Vice President, Walsh & Kelly, Inc. (paving contractors). |
OFFICERS
Name
Birth Date
Address
Positions Held with Trust
Date Service Began | Principal Occupation(s) for Past Five Years
and Previous Position(s) |
John W. McGonigle
Birth Date: October 26, 1938
EXECUTIVE VICE PRESIDENT AND SECRETARY
Officer since: April 1984 | Principal Occupations: Executive Vice President and Secretary of the Federated Fund Family; Vice Chairman, Executive Vice President, Secretary and Director, Federated Investors, Inc.
Previous Positions: Trustee, Federated Investment Management Company and Federated Investment Counseling; Director, Federated Global Investment Management Corp., Federated Services Company and Federated Securities Corp. |
Lori A. Hensler
Birth Date: January 6, 1967
TREASURER
Officer since: April 2013 | Principal Occupations: Principal Financial Officer and Treasurer of the Federated Fund Family; Senior Vice President, Federated Administrative Services; Financial and Operations Principal for Federated Securities Corp. and Edgewood Services, Inc.; and Assistant Treasurer, Federated Investors Trust Company. Ms. Hensler has received the Certified Public Accountant designation.
Previous Positions: Controller of Federated Investors, Inc.; Senior Vice President and Assistant Treasurer, Federated Investors Management Company; Treasurer, Federated Investors Trust Company; Assistant Treasurer, Federated Administrative Services, Federated Administrative Services, Inc., Federated Securities Corp., Edgewood Services, Inc., Federated Advisory Services Company, Federated Equity Management Company of Pennsylvania, Federated Global Investment Management Corp., Federated Investment Counseling, Federated Investment Management Company, Passport Research, Ltd., and Federated MDTA, LLC; Financial and Operations Principal for Federated Securities Corp., Edgewood Services, Inc. and Southpointe Distribution Services, Inc. |
Annual Shareholder Report
Name
Birth Date
Address
Positions Held with Trust
Date Service Began | Principal Occupation(s) for Past Five Years
and Previous Position(s) |
Peter J. Germain
Birth Date: September 3, 1959
CHIEF LEGAL OFFICER
Officer since: January 2005 | Principal Occupations: Mr. Germain is Chief Legal Officer of the Federated Fund Family. He is General Counsel and Vice President, Federated Investors, Inc.; President, Federated Administrative Services and Federated Administrative Services, Inc.; Vice President, Federated Securities Corp.; Secretary, Federated Private Asset Management, Inc.; and Secretary, Retirement Plan Service Company of America. Mr. Germain joined Federated in 1984 and is a member of the Pennsylvania Bar Association.
Previous Positions: Deputy General Counsel, Special Counsel, Managing Director of Mutual Fund Services, Federated Investors, Inc.; Senior Vice President, Federated Services Company; and Senior Corporate Counsel, Federated Investors, Inc. |
Stephen Van Meter
Birth Date: June 5, 1975
CHIEF COMPLIANCE OFFICER AND SENIOR VICE PRESIDENT
Officer since: July 2015 | Principal Occupations: Senior Vice President and Chief Compliance Officer of the Federated Fund Family; Vice President and Chief Compliance Officer of Federated Investors, Inc. and Chief Compliance Officer of certain of its subsidiaries. Mr. Van Meter joined Federated in October 2011. He holds FINRA licenses under Series 3, 7, 24 and 66.
Previous Positions: Mr. Van Meter previously held the position of Compliance Operating Officer, Federated Investors, Inc. Prior to joining Federated, Mr. Van Meter served at the United States Securities and Exchange Commission in the positions of Senior Counsel, Office of Chief Counsel, Division of Investment Management and Senior Counsel, Division of Enforcement. |
Stephen F. Auth
Birth Date: September 13, 1956
101 Park Avenue
41st Floor
New York, NY 10178
CHIEF INVESTMENT OFFICER
Officer since: November 2002 | Principal Occupations: Stephen F. Auth is Chief Investment Officer of various Funds in the Federated Fund Family; Executive Vice President, Federated Investment Counseling, Federated Global Investment Management Corp. and Federated Equity Management Company of Pennsylvania.
Previous Positions: Executive Vice President, Federated Investment Management Company and Passport Research, Ltd. (investment advisory subsidiary of Federated); Senior Vice President, Global Portfolio Management Services Division; Senior Vice President, Federated Investment Management Company and Passport Research, Ltd.; Senior Managing Director and Portfolio Manager, Prudential Investments. |
Richard B. Fisher
Birth Date: May 17, 1923
Vice President
Officer since: April 1987 | Principal Occupations: Vice Chairman or Vice President of some of the Funds in the Federated Fund Family; Vice Chairman, Federated Investors, Inc.; Chairman, Federated Securities Corp.
Previous Positions: President and Director or Trustee of some of the Funds in the Federated Fund Family; Executive Vice President, Federated Investors, Inc.; Director and Chief Executive Officer, Federated Securities Corp. |
Annual Shareholder Report
Evaluation and Approval of Advisory Contract–May 2016
Federated Prudent Bear Fund (the “Fund”)
Following a review and recommendation of approval by the Fund's independent trustees, the Fund's Board of Trustees (the “Board”) reviewed and unanimously approved at its May 2016 meetings the continuation of the Fund's investment advisory contract for an additional one-year term. The Board's decision regarding the contract reflects the exercise of its business judgment after consideration of all of the information received on whether to continue the existing arrangements.
The Board had previously appointed a Senior Officer, whose duties include specified responsibilities relating to the process by which advisory fees are to be charged to a Federated fund. The Senior Officer has the authority to retain consultants, experts, or staff as may be reasonably necessary to assist in the performance of his duties, reports directly to the Board, and may be terminated only with the approval of a majority of the independent members of the Board. The Senior Officer prepared and furnished to the Board an independent, written evaluation that covered topics discussed below (the “Senior Officer's Evaluation”). The Board considered the Senior Officer's Evaluation, along with other information, in deciding to approve the investment advisory contract.
The Board is also familiar with and considered judicial decisions concerning allegedly excessive investment advisory fees, which have indicated that the following factors may be relevant to an adviser's fiduciary duty with respect to its receipt of compensation from a fund: the nature and quality of the services provided by an adviser to a fund and its shareholders, including the performance and fees and expenses of the fund and of comparable funds; an adviser's cost of providing the services, including the profitability to an adviser of providing advisory services to a fund; the extent to which an adviser may realize “economies of scale” as a fund grows larger and, if such economies of scale exist, whether they have been shared with a fund and its shareholders or the family of funds; any “fall-out financial benefits” that accrue to an adviser because of its relationship with a fund (including research services received from brokers that execute fund trades and any fees paid to affiliates of an adviser for services rendered to a fund); comparative fee and expense structures, including a comparison of fees paid to an adviser with those paid by similar funds; and the extent of care, conscientiousness and independence with which board members perform their duties and their expertise, including whether they are fully informed about all facts the board deems relevant to its consideration of an adviser's services and fees. The Board noted that the Securities and Exchange Commission (“SEC”) disclosure requirements regarding the basis for the Board's approval of the Fund's investment advisory contract generally track the factors listed above. Consistent with these judicial decisions and SEC disclosure requirements, the Board also considered management fees charged to
Annual Shareholder Report
institutional and other clients of Federated Equity Management Company of Pennsylvania (the “Adviser”) for what might be viewed as like services. The Board was aware of these factors and was guided by them in its review of the Fund's investment advisory contract to the extent it considered them to be appropriate and relevant, as discussed further below.
The Board considered and weighed these circumstances in light of its substantial accumulated experience in governing the Fund and working with Federated Investors, Inc. and its affiliates (“Federated”) on matters relating to the Federated funds, and was assisted in its deliberations by independent legal counsel. Throughout the year, and in connection with its May meetings, the Board requested and received substantial and detailed information about the Fund and the Federated organization that was in addition to the extensive materials that comprise and accompany the Senior Officer's Evaluation. Federated provided much of this information at each regular meeting of the Board, and furnished additional substantial information in connection with the May meetings at which the Board's formal review of the investment advisory contract occurred. At the May meetings in addition to meeting in separate sessions of the independent trustees without management present, senior management of the Adviser also met with the independent trustees and their counsel to discuss the materials presented and any other matters thought relevant by the Adviser or the trustees. Between regularly scheduled meetings, the Board also received information on particular matters as the need arose. Thus, the Board's consideration of the investment advisory contract included review of the Senior Officer's Evaluation, accompanying data and additional information covering such matters as: the Adviser's investment philosophy, revenue, profitability, personnel and processes; investment and operating strategies; the Fund's short- and long-term performance (in absolute terms, both on a gross basis and net of expenses, as well as in relationship to its particular investment program and certain competitor or “peer group” funds and/or other benchmarks, as appropriate), and comments on the reasons for performance; the Fund's investment objectives; the Fund's expenses (including the advisory fee itself and the overall expense structure of the Fund, both in absolute terms and relative to similar and/or competing funds, with due regard for contractual or voluntary expense limitations); the use and allocation of brokerage commissions derived from trading the Fund's portfolio securities (if any); and the nature, quality and extent of the advisory and other services provided to the Fund by the Adviser and its affiliates. The Board also considered the preferences and expectations of Fund shareholders; the entrepreneurial risk assumed by the Adviser in sponsoring the Fund; the continuing state of competition in the mutual fund industry and market practices; the range of comparable fees for similar funds in the mutual fund industry; the Fund's relationship to the Federated funds which include a comprehensive array of funds with different investment objectives, policies and strategies which are generally available for exchange without the incurrence of additional sales charges; compliance and
Annual Shareholder Report
audit reports concerning the Federated funds and the Federated companies that service them (including communications from regulatory agencies), as well as Federated's responses to any issues raised therein; and relevant developments in the mutual fund industry and how the Federated funds and/or Federated are responding to them. The Board's evaluation process is evolutionary. The criteria considered and the emphasis placed on relevant criteria change in recognition of changing circumstances in the mutual fund marketplace.
While mindful that courts have cautioned against giving such comparisons too much weight, the Board has found the use of comparisons of the Fund's fees and expenses to other mutual funds with comparable investment programs to be relevant to its deliberations. In this regard, the Board was presented with, and considered, information regarding the contractual advisory fee rates, net advisory fee rates, total expense ratios and each element of the Fund's total expense ratio (i.e., gross and net advisory fees, custody fees, portfolio accounting fees and transfer agency fees) relative to the Fund's peers. The Board focused on comparisons with other similar mutual funds more heavily than non-mutual fund products or services because it is believed that they are more relevant. For example, other mutual funds are the products most like the Fund, they are readily available to Fund shareholders as alternative investment vehicles, and they are the type of investment vehicle in fact chosen and maintained by the Fund's investors. The range of their fees and expenses therefore appears to be a relevant indicator of what consumers have found to be reasonable in the precise marketplace in which the Fund competes.
The Board reviewed the contractual advisory fee rate, net advisory fee rate where partially waived and other expenses of the Fund and noted the position of the Fund's fee rates relative to its peers. In this regard, the Board noted that the contractual advisory fee rate was above the median of the relevant peer group, but the Board noted the applicable waivers and reimbursements, and that the overall expense structure of the Fund remained competitive in the context of other factors considered by the Board.
By contrast, the Senior Officer has reviewed Federated's fees for providing advisory services to products outside the Federated funds (e.g., institutional and separate accounts and sub-adviser services). He concluded that mutual funds and institutional accounts are inherently different products. Those differences include, but are not limited to, different types of targeted investors; being subject to different laws and regulations; different legal structures; different average account sizes and portfolio management techniques made necessary by different cash flows and different associated costs; and the time spent by portfolio managers and their teams, funds financial services, legal, compliance and risk management in reviewing securities pricing, addressing different administrative responsibilities, addressing different degrees of risk associated with management and a variety of different costs. The Senior Officer did not consider the fees for providing advisory services to these outside products to be determinative in judging the appropriateness of mutual fund advisory fees.
Annual Shareholder Report
Following such evaluation, the Board concluded, within the context of its full deliberations, that the expenses of the Fund are reasonable and supported renewal of the investment advisory contract with respect to the Fund.
The Board considered the nature, extent and quality of the services provided to the Fund by the Adviser and the resources of the Adviser and its affiliates dedicated to the Fund. In this regard, the Board evaluated, among other things, the Adviser's personnel, experience, track record, overall reputation and willingness to invest in personnel and infrastructure that benefit the Fund. In addition, the Board reviewed the qualifications, backgrounds and responsibilities of the portfolio management team primarily responsible for the day-to-day management of the Fund. The Board noted the compliance programs of and the compliance-related resources provided to the Fund by the Adviser. The Fund's ability to deliver competitive performance when compared to its peer group was also deemed to be relevant by the Board as a useful indicator of how the Adviser is executing the Fund's investment program, which in turn was one of the Board's considerations in reaching a conclusion that the nature, extent, and quality of the Adviser's investment management services were such as to warrant continuation of the investment advisory contract.
In evaluating the Fund's investment performance, the Board considered performance results in light of the Fund's investment objective, strategies and risks, as disclosed in the Fund's prospectus. The Board particularly considered detailed investment reports on the Fund's performance provided to the Board throughout the year and in connection with the May meetings. The Senior Officer also reviewed information compiled by Federated, using data supplied by independent fund ranking organizations, regarding the performance of, and fees charged by, other mutual funds, noting his view that comparisons to fund peer groups may be helpful, though not conclusive, in judging the reasonableness of the proposed fees. The Board considered, in evaluating such comparisons, that in some cases individual funds may exhibit significant and unique differences in their objectives and management techniques when compared to other funds within an industry peer group.
For the periods covered by the Senior Officer's Evaluation, the Fund's performance for the one-year period was above the median of the relevant peer group, and the Fund's performance fell below the median of the relevant peer group for the three-year and five-year periods. The Board discussed the Fund's performance with the Adviser and recognized the efforts being taken by the Adviser in the context of the other factors considered relevant by the Board.
Following such evaluation, the Board concluded, within the context of its full deliberations, that the performance of the Fund supported renewal of the investment advisory contract with respect to the Fund.
The Board also received financial information about Federated, including information regarding the compensation and ancillary (or “fall-out”) benefits Federated derived from its relationships with the Federated funds. This information covered not only the fees under the investment advisory contracts,
Annual Shareholder Report
but also fees received by Federated's subsidiaries for providing other services to the Federated funds under separate contracts (e.g., for serving as the Federated funds' administrator). The information also detailed any indirect benefit Federated may derive from its receipt of research services from brokers who execute Federated fund trades. In addition, the Board considered the fact that, in order for a fund to be competitive in the marketplace, Federated and its affiliates frequently waived fees and/or reimbursed expenses and have disclosed to fund investors and/or indicated to the Board their intention to do so in the future, where appropriate. Moreover, the Board receives regular reporting as to the institution, adjustment or elimination of these voluntary waivers. The Board considered Federated's previous reductions in contractual management fees to certain funds in response to the Senior Officer's recommendations.
Federated furnished information, requested by the Senior Officer, that reported revenues on a fund-by-fund basis and made estimates of the allocation of expenses on a fund-by-fund basis, using allocation methodologies specified by the Senior Officer. The Senior Officer noted that, while these cost allocation reports apply consistent allocation processes, the inherent difficulties in allocating costs continues to cause the Senior Officer to question the precision of the process and to conclude that such reports may be unreliable, since a single change in an allocation estimate may dramatically alter the resulting estimate of cost and/or profitability of a fund and may produce unintended consequences. The allocation information, including the Senior Officer's view that fund-by-fund estimations may be unreliable, was considered in the analysis by the Board.
The Board and the Senior Officer also reviewed information compiled by Federated comparing profitability information for Federated to other publicly held fund management companies. In this regard, the Senior Officer concluded that Federated's profit margins did not appear to be excessive. The Senior Officer also noted that Federated appeared financially sound, with the resources to fulfill its obligations under its contracts with the Fund.
The Senior Officer's Evaluation also discussed the notion of possible realization of “economies of scale” as a fund grows larger. The Board considered in this regard that the Adviser has made significant and long-term investments in areas that support all of the Federated funds, such as personnel and processes for the portfolio management, shareholder services, compliance, internal audit, and risk management functions, as well as systems technology (including technology relating to cybersecurity), and that the benefits of these efforts (as well as any economies of scale, should they exist) were likely to be enjoyed by the fund family as a whole. The Board noted that the Adviser's investments in these areas are extensive. In addition, the Board considered that Federated and its affiliates have frequently waived fees and/or reimbursed expenses and that this has allowed fund shareholders to share potential economies of scale from a fund's inception. Federated, as it does throughout the year, and again in connection with the Board's review, furnished information relative to revenue sharing or adviser paid fees. Federated and the Senior Officer noted that this information
Annual Shareholder Report
should be viewed to determine if there was an incentive to either not apply breakpoints or to apply breakpoints at higher levels and should not be viewed to determine the appropriateness of advisory fees, because it would represent marketing and distribution expenses. Finally, the Board also noted the absence of any applicable regulatory or industry guidelines on this subject, which (as discussed in the Senior Officer's Evaluation) is compounded by the lack of any common industry practice or general pattern with respect to structuring fund advisory fees with “breakpoints” that serve to reduce the fee as a fund attains a certain size.
The Senior Officer noted that, subject to the comments and recommendations made within the Senior Officer's Evaluation, his observations and the information accompanying the Senior Officer's Evaluation supported a finding by the Board that the management fee for the fund was reasonable. Under these circumstances, no changes were recommended to, and no objection was raised to, the continuation of the Fund's investment advisory contract.
In its decision to continue an existing investment advisory contract, the Board was mindful of the potential disruptions of the Fund's operations and various risks, uncertainties and other effects that could occur as a result of a decision to terminate or not renew an investment advisory contract. In particular, the Board recognized that many shareholders have invested in the Fund on the strength of the Adviser's industry standing and reputation and with the expectation that the Adviser will have a continuing role in providing advisory services to the Fund. Thus, the Board's approval of the investment advisory contract reflected the fact that it is the shareholders who have effectively selected the Adviser by virtue of having invested in the Fund. The Board concluded that, in light of the factors discussed above, including the nature, quality and scope of the services provided to the Fund by the Adviser and its affiliates, continuation of the investment advisory contract was appropriate.
The Board based its decision to approve the investment advisory contract on the totality of the circumstances and relevant factors and with a view to past and future long-term considerations. Not all of the factors and considerations identified above were necessarily relevant to the Fund, nor did the Board consider any one of them to be determinative. With respect to the factors that were relevant, the Board's decision to approve the continuation of the contract reflects its determination that Federated's performance and actions provided a satisfactory basis to support the decision to continue the existing arrangement.
Annual Shareholder Report
Voting Proxies on Fund Portfolio Securities
A description of the policies and procedures that the Fund uses to determine how to vote proxies, if any, relating to securities held in the Fund's portfolio is available, without charge and upon request, by calling 1-800-341-7400. A report on “Form N-PX” of how the Fund voted any such proxies during the most recent 12-month period ended June 30 is available via the Proxy Voting Record (Form N-PX) link associated with the Fund and share class name at www.FederatedInvestors.com/FundInformation. Form N-PX filings are also available at the SEC's website at www.sec.gov.
Quarterly Portfolio Schedule
The Fund files with the SEC a complete schedule of its portfolio holdings, as of the close of the first and third quarters of its fiscal year, on “Form N-Q.” These filings are available on the SEC's website at www.sec.gov and may be reviewed and copied at the SEC's Public Reference Room in Washington, DC. (Call 1-800-SEC-0330 for information on the operation of the Public Reference Room.) You may also access this information via the link to the Fund and share class name at www.FederatedInvestors.com/FundInformation.
Annual Shareholder Report
Mutual funds are not bank deposits or obligations, are not guaranteed by any bank and are not insured or guaranteed by the U.S. government, the Federal Deposit Insurance Corporation, the Federal Reserve Board or any other government agency. Investment in mutual funds involves investment risk, including the possible loss of principal.
This Report is authorized for distribution to prospective investors only when preceded or accompanied by the Fund's Prospectus, which contains facts concerning its objective and policies, management fees, expenses and other information.
Federated Prudent Bear Fund
Federated Investors Funds
4000 Ericsson Drive
Warrendale, PA 15086-7561
Contact us at FederatedInvestors.com
or call 1-800-341-7400.
Federated Securities Corp., Distributor
CUSIP 31421N709
CUSIP 31421N600
CUSIP 31421N501
41202 (11/16)
Federated is a registered trademark of Federated Investors, Inc.
2016 ©Federated Investors, Inc.
Item 2. Code of Ethics
(a) As of the end of the period covered by this report, the registrant has adopted a code of ethics (the "Section 406 Standards for Investment Companies - Ethical Standards for Principal Executive and Financial Officers") that applies to the registrant's Principal Executive Officer and Principal Financial Officer; the registrant's Principal Financial Officer also serves as the Principal Accounting Officer.
(c) There was no amendment to the registrant’s code of ethics described in Item 2(a) above during the period covered by the report.
(d) There was no waiver granted, either actual or implicit, from a provision to the registrant’s code of ethics described in Item 2(a) above during the period covered by the report.
(e) Not Applicable
(f)(3) The registrant hereby undertakes to provide any person, without charge, upon request, a copy of the code of ethics. To request a copy of the code of ethics, contact the registrant at 1-800-341-7400, and ask for a copy of the Section 406 Standards for Investment Companies - Ethical Standards for Principal Executive and Financial Officers.
Item 3. Audit Committee Financial Expert
The registrant's Board has determined that each of the following members of the Board's Audit Committee is an “audit committee financial expert,” and is "independent," for purposes of this Item: John T. Collins, G. Thomas Hough and Thomas M. O'Neill.
Item 4. Principal Accountant Fees and Services
(a) Audit Fees billed to the registrant for the two most recent fiscal years:
Fiscal year ended 2016 - $450,308
Fiscal year ended 2015 - $407,460
(b) Audit-Related Fees billed to the registrant for the two most recent fiscal years:
Fiscal year ended 2016 - $7,775
Fiscal year ended 2015 - $174
Fiscal year ended 2016- Audit consents for N-1A filings.
Fiscal year ended 2015- Travel expenses for attendance at Audit Committee meeting.
Amount requiring approval of the registrant’s audit committee pursuant to paragraph (c)(7)(ii) of Rule 2-01 of Regulation S-X, $0 and $121 respectively. Fiscal year ended 2015- Travel expenses for attendance at Audit Committee meeting.
(c) Tax Fees billed to the registrant for the two most recent fiscal years:
Fiscal year ended 2016 - $23,000
Fiscal year ended 2015 - $15,300
Fiscal year ended 2016- Service fee for tax reclaim recovery filings.
Fiscal year ended 2015- Service fee for tax reclaim recovery filings.
Amount requiring approval of the registrant’s audit committee pursuant to paragraph (c)(7)(ii) of Rule 2-01 of Regulation S-X, $0 and $0 respectively.
(d) All Other Fees billed to the registrant for the two most recent fiscal years:
Fiscal year ended 2016 - $0
Fiscal year ended 2015 - $0
Amount requiring approval of the registrant’s audit committee pursuant to paragraph (c)(7)(ii) of Rule 2-01 of Regulation S-X, $41,616 and $43,184 respectively. Fiscal year ended 2016- Service fees for analysis of potential Passive Foreign Investment Company holdings. Fiscal year ended 2015- Service fees for analysis of potential Passive Foreign Investment Company holdings.
(e)(1) Audit Committee Policies regarding Pre-approval of Services.
The Audit Committee is required to pre-approve audit and non-audit services performed by the independent auditor in order to assure that the provision of such services do not impair the auditor’s independence. Unless a type of service to be provided by the independent auditor has received general pre-approval, it will require specific pre-approval by the Audit Committee. Any proposed services exceeding pre-approved cost levels will require specific pre-approval by the Audit Committee.
Certain services have the general pre-approval of the Audit Committee. The term of the general pre-approval is 12 months from the date of pre-approval, unless the Audit Committee specifically provides for a different period. The Audit Committee will annually review the services that may be provided by the independent auditor without obtaining specific pre-approval from the Audit Committee and may grant general pre-approval for such services. The Audit Committee will revise the list of general pre-approved services from time to time, based on subsequent determinations. The Audit Committee will not delegate its responsibilities to pre-approve services performed by the independent auditor to management.
The Audit Committee has delegated pre-approval authority to its Chairman. The Chairman will report any pre-approval decisions to the Audit Committee at its next scheduled meeting. The Committee will designate another member with such pre-approval authority when the Chairman is unavailable.
AUDIT SERVICES
The annual Audit services engagement terms and fees will be subject to the specific pre-approval of the Audit Committee. The Audit Committee must approve any changes in terms, conditions and fees resulting from changes in audit scope, registered investment company (RIC) structure or other matters.
In addition to the annual Audit services engagement specifically approved by the Audit Committee, the Audit Committee may grant general pre-approval for other Audit Services, which are those services that only the independent auditor reasonably can provide. The Audit Committee has pre-approved certain Audit services, all other Audit services must be specifically pre-approved by the Audit Committee.
AUDIT-RELATED SERVICES
Audit-related services are assurance and related services that are reasonably related to the performance of the audit or review of the Company’s financial statements or that are traditionally performed by the independent auditor. The Audit Committee believes that the provision of Audit-related services does not impair the independence of the auditor, and has pre-approved certain Audit-related services, all other Audit-related services must be specifically pre-approved by the Audit Committee.
TAX SERVICES
The Audit Committee believes that the independent auditor can provide Tax services to the Company such as tax compliance, tax planning and tax advice without impairing the auditor’s independence. However, the Audit Committee will not permit the retention of the independent auditor in connection with a transaction initially recommended by the independent auditor, the purpose of which may be tax avoidance and the tax treatment of which may not be supported in the Internal Revenue Code and related regulations. The Audit Committee has pre-approved certain Tax services, all Tax services involving large and complex transactions must be specifically pre-approved by the Audit Committee.
ALL OTHER SERVICES
With respect to the provision of services other than audit, review or attest services the pre-approval requirement is waived if:
| (1) | The aggregate amount of all such services provided constitutes no more than five percent of the total amount of revenues paid by the registrant, the registrant’s adviser (not including any sub-adviser whose role is primarily portfolio management and is subcontracted with or overseen by another investment adviser), and any entity controlling, controlled by, or under common control with the investment adviser that provides ongoing services to the registrant to its accountant during the fiscal year in which the services are provided; |
| (2) | Such services were not recognized by the registrant, the registrant’s adviser (not including any sub-adviser whose role is primarily portfolio management and is subcontracted with or overseen by another investment adviser), and any entity controlling, controlled by, or under common control with the investment adviser that provides ongoing services to the registrant at the time of the engagement to be non-audit services; and |
| (3) | Such services are promptly brought to the attention of the Audit Committee of the issuer and approved prior to the completion of the audit by the Audit Committee or by one or more members of the Audit Committee who are members of the board of directors to whom authority to grant such approvals has been delegated by the Audit Committee. |
The Audit Committee may grant general pre-approval to those permissible non-audit services classified as All Other services that it believes are routine and recurring services, and would not impair the independence of the auditor.
The SEC’s rules and relevant guidance should be consulted to determine the precise definitions of prohibited non-audit services and the applicability of exceptions to certain of the prohibitions.
PRE-APPROVAL FEE LEVELS
Pre-approval fee levels for all services to be provided by the independent auditor will be established annually by the Audit Committee. Any proposed services exceeding these levels will require specific pre-approval by the Audit Committee.
PROCEDURES
Requests or applications to provide services that require specific approval by the Audit Committee will be submitted to the Audit Committee by both the independent auditor and the Principal Accounting Officer and/or Internal Auditor, and must include a joint statement as to whether, in their view, the request or application is consistent with the SEC’s rules on auditor independence.
(e)(2) Percentage of services identified in items 4(b) through 4(d) that were approved by the registrants audit committee pursuant to paragraph (c)(7)(i)(C) of Rule 2-01 of Regulation S-X:
4(b)
Fiscal year ended 2016 – 0%
Fiscal year ended 2015 - 0%
Percentage of services provided to the registrants investment adviser and any entity controlling, controlled by, or under common control with the investment adviser that provides ongoing services to the registrant that were approved by the registrants audit committee pursuant to paragraph (c)(7)(i)(C) of Rule 2-01 of Regulation S-X, 0% and 0% respectively.
4(c)
Fiscal year ended 2016 – 0%
Fiscal year ended 2015 – 0%
Percentage of services provided to the registrants investment adviser and any entity controlling, controlled by, or under common control with the investment adviser that provides ongoing services to the registrant that were approved by the registrants audit committee pursuant to paragraph (c)(7)(i)(C) of Rule 2-01 of Regulation S-X, 0% and 0% respectively.
4(d)
Fiscal year ended 2016 – 0%
Fiscal year ended 2015 – 0%
Percentage of services provided to the registrants investment adviser and any entity controlling, controlled by, or under common control with the investment adviser that provides ongoing services to the registrant that were approved by the registrants audit committee pursuant to paragraph (c)(7)(i)(C) of Rule 2-01 of Regulation S-X, 0% and 0% respectively.
| (g) | Non-Audit Fees billed to the registrant, the registrant’s investment adviser, and certain entities controlling, controlled by or under common control with the investment adviser: |
Fiscal year ended 2016 - $307,978
Fiscal year ended 2015 - $92,504
| (h) | The registrant’s Audit Committee has considered that the provision of non-audit services that were rendered to the registrant’s adviser (not including any sub-adviser whose role is primarily portfolio management and is subcontracted with or overseen by another investment adviser), and any entity controlling, controlled by, or under common control with the investment adviser that provides ongoing services to the registrant that were not pre-approved pursuant to paragraph (c)(7)(ii) of Rule 2-01 of Regulation S-X is compatible with maintaining the principal accountant’s independence. |
In their respective required communications to the Audit Committee of the registrant’s Board, Ernst & Young LLP (“EY”) and KPMG LLP (“KPMG”) (as applicable, “EY/KPMG”), the registrant’s independent public accountants, informed the Audit Committee that EY/KPMG and/or covered person professionals within EY/KPMG maintain lending relationships with certain owners of greater than 10% of the shares of the registrant and/or certain investment companies within the “investment company complex” as defined under Rule 2-01(f)(14) of Regulation S-X, which are affiliates of the registrant. EY/KPMG has advised the Audit Committee that these lending relationships implicate Rule 2-01(c)(1)(ii)(A) of Regulation S-X (referred to as the “Loan Rule”). The Loan Rule prohibits an independent public accountant, or covered person professionals at such firm, from having a financial relationship (such as a loan) with a lender that is a record or beneficial owner of more than 10% of an audit client’s equity securities. For purposes of the Loan Rule, audit clients include the registrant, as well as all registered investment companies advised by advisory subsidiaries of Federated Investors, Inc., the Adviser (for which EY serves as independent public accountant), and their respective affiliates (collectively, the “Federated Fund Complex”).
EY/KPMG informed the Audit Committee that EY/KPMG believes that these lending relationships described above do not and will not impair EY/KPMG’s ability to exercise objective and impartial judgment in connection with financial statement audits of their respective funds of the registrant and a reasonable investor with knowledge of all relevant facts and circumstances would conclude that EY/KPMG has been and is capable of objective and impartial judgment on all issues encompassed within EY/KPMG’s audits.
On June 20, 2016, the Division of Investment Management of the Securities and Exchange Commission (“SEC”) issued a no-action letter to another mutual fund complex (see Fidelity Management & Research Company et al., No-Action Letter) related to similar Loan Rule matters as those described above. In that letter, the SEC Staff confirmed that it would not recommend enforcement action against an investment company that relied on the audit services performed by an independent public accountant where the Loan Rule was implicated in certain specified circumstances. In that letter, the SEC staff indicated that it would not recommend enforcement action against the investment company complex if the Loan Rule is implicated provided that: (1) the auditor has complied with PCAOB Rule 3526(b)(1) and 3526(b)(2); (2) the Loan Rule is implicated because of lending relationships; and (3) notwithstanding such lending relationships that implicate the Loan Rule, the auditor has concluded that it is objective and impartial with respect to the issues encompassed within its engagement as auditor of the funds. The circumstances described in the no-action letter are substantially similar to the circumstances that implicated the Loan Rule with respect to EY/KPMG and the registrant. The relief provided in the SEC no-action letter is effective for 18 months from its June 20, 2016 issuance date.
If it were to be determined that the relief available under the no-action letter was improperly relied upon, or that the independence requirements under the federal securities laws were not otherwise complied with regarding the registrant, for certain periods, any of the registrant’s filings with the SEC which contain financial statements of the registrant for such periods may not comply with applicable federal securities laws, the registrant’s ability to offer shares under its current registration statement may be impacted, and certain financial reporting and/or other covenants with, and representations and warranties to, the registrant’s lender under its committed line of credit may be impacted. Such events could have a material adverse effect on the registrant and the Federated Fund Complex.
Item 5. Audit Committee of Listed Registrants
Not Applicable
Item 6. Schedule of Investments
(a) The registrant’s Schedule of Investments is included as part of the Report to Stockholders filed under Item 1 of this form.
(b) Not Applicable; Fund had no divestments during the reporting period covered since the previous Form N-CSR filing.
Item 7. Disclosure of Proxy Voting Policies and Procedures for Closed-End Management Investment Companies
Not Applicable
Item 8. Portfolio Managers of Closed-End Management Investment Companies
Not Applicable
Item 9. Purchases of Equity Securities by Closed-End Management Investment Company and Affiliated Purchasers
Not Applicable
Item 10. Submission of Matters to a Vote of Security Holders
No Changes to Report
Item 11. Controls and Procedures
(a) The registrant’s President and Treasurer have concluded that the
registrant’s disclosure controls and procedures (as defined in rule 30a-3(c) under the Act) are effective in design and operation and are sufficient to form the basis of the certifications required by Rule 30a-(2) under the Act, based on their evaluation of these disclosure controls and procedures within 90 days of the filing date of this report on Form N-CSR.
(b) There were no changes in the registrant’s internal control over financial reporting (as defined in rule 30a-3(d) under the Act) during the second fiscal quarter of the period covered by this report that have materially affected, or are reasonably likely to materially affect, the registrant’s internal control over financial reporting.
Item 12. Exhibits
(a)(1) Code of Ethics- Not Applicable to this Report.
(a)(2) Certifications of Principal Executive Officer and Principal Financial Officer.
(a)(3) Not Applicable.
(b) Certifications pursuant to 18 U.S.C. Section 1350.
SIGNATURES
Pursuant to the requirements of the Securities Exchange Act of 1934 and the Investment Company Act of 1940, the registrant has duly caused this report to be signed on its behalf by the undersigned, thereunto duly authorized.
Registrant Federated Equity Funds
By /S/ Lori A. Hensler
Lori A. Hensler, Principal Financial Officer
Date November 22, 2016
Pursuant to the requirements of the Securities Exchange Act of 1934 and the Investment Company Act of 1940, this report has been signed below by the following persons on behalf of the registrant and in the capacities and on the dates indicated.
By /S/ J. Christopher Donahue
J. Christopher Donahue, Principal Executive Officer
Date November 22, 2016
By /S/ Lori A. Hensler
Lori A. Hensler, Principal Financial Officer
Date November 22, 2016