United States
Securities and Exchange Commission
Washington, D.C. 20549
Form N-CSR
Certified Shareholder Report of Registered Management Investment Companies
811-4017
(Investment Company Act File Number)
Federated Equity Funds
_______________________________________________________________
(Exact Name of Registrant as Specified in Charter)
Federated Investors Funds
4000 Ericsson Drive
Warrendale, Pennsylvania 15086-7561
(Address of Principal Executive Offices)
(412) 288-1900
(Registrant's Telephone Number)
John W. McGonigle, Esquire
Federated Investors Tower
1001 Liberty Avenue
Pittsburgh, Pennsylvania 15222-3779
(Name and Address of Agent for Service)
(Notices should be sent to the Agent for Service)
Date of Fiscal Year End: 10/31/15
Date of Reporting Period: 10/31/15
Item 1. Reports to Stockholders

Annual Shareholder Report
October 31, 2015
| Share Class | Ticker |
| A | KAUAX |
| B | KAUBX |
| C | KAUCX |
Federated Kaufmann Fund
Successor to the Kaufmann Fund, Inc., with performance history since February 21, 1986
A Portfolio of Federated Equity Funds
Not FDIC Insured • May Lose Value • No Bank Guarantee
CONTENTS
| 1 |
| 6 |
| 7 |
| 14 |
| 17 |
| 19 |
| 20 |
| 21 |
| 38 |
| 39 |
| 41 |
| 47 |
| 53 |
| 53 |
Management's Discussion of Fund Performance (unaudited)
The total return of Federated Kaufmann Fund (the “Fund”), based on net asset value for the 12-month reporting period ended October 31, 2015, was 6.29% for the Class A Shares, 5.83% for the Class B Shares and 5.86% for the Class C Shares. The total return of the Russell Midcap® Growth Index (RMCGI),1 the Fund's broad-based securities market index, was 4.94% for the same period. The total return of the Morningstar Mid-Cap Growth Funds Average (MMCGFA),2 a peer group average for the Fund, was 3.00% for the same period. The Fund's and MMCGFA's total returns for the most recently completed fiscal year reflected actual cash flows, transaction costs and other expenses, which were not reflected in the total return of the RMCGI.
During the reporting period, the Fund's investment strategy focused on stock selection, sector exposure, international exposure3 and the effect of cash holdings. These were the most significant factors affecting the Fund's performance relative to the RMCGI.
The following discussion will focus on the performance of the Fund's Class A Shares.
Market Overview
During the reporting period, the equity markets globally performed well with the European stock markets leading the way. Most central banks around the world continued their monetary easing while the United States looked to enter a tightening period throughout most of the reporting period. The U.S. Federal Reserve (the “Fed”) postponed its first rate raise in nearly a decade multiple times despite positive economic data. Concern about global growth kept the Fed static. Worries about global growth pressured markets during the summer months particularly as China's economy slowed further, causing deflationary worries. Despite persistent geopolitical headwinds, e.g., Syria and the Middle East, global economies continued to grow, albeit slowly. Policymakers around the world continued to lean towards stimulus. Meanwhile, the U.S. pursued the opposite approach, a tightening strategy, which drove the strength in the U.S. Dollar Index.4 Despite these uncertainties, the equity markets performed well, and corporate earnings remained strong during the reporting period.
Annual Shareholder Report
Stock Selection
The key factor affecting performance from a macroeconomic standpoint was the improving U.S. economic fundamentals, as well as accommodating monetary policies by the Fed and other central banks around the world. The monetary easing policies allowed a slow but gradual recovery of the major world economies. Profitability of many of the companies in which the Fund invested remained strong throughout the reporting period. Fund management continued to find attractive mid-cap growth investment opportunities–companies that are dominant competitors and that have strengthening fundamentals potentially delivering both near-term and long-term growth in sales and earnings.
The majority of the Fund outperformance on a gross return basis versus the RMCGI was due to stock selection and sector weighting particularly in the Health Care and Information Technology sectors. Individual companies that most contributed to Fund performance during the reporting period were: Dyax Corp., Dexcom Inc., Alkermes Plc., Pharmacyclics and Starbucks. Laggard companies that hurt relative Fund performance were: BioDelivery Sciences, Spirit Airlines, Ilumina Inc., Examworks Group Inc. and Ocular Therapeutix Inc.
Sector Exposure
At the end of the reporting period, approximately 75% of the portfolio was invested in four large sectors: Health Care, Financials, Information Technology and Consumer Discretionary. These sectors have historically provided good opportunities for bottom-up growth investors. Overweighting the Health Care and underweighting Energy sectors benefited relative performance versus the RMCGI. Underweighting in the Consumer Discretionary and Consumer Staples hurt relative Fund performance.
International Exposure
Stock selection of companies domiciled outside the U.S. was a positive contributor to Fund performance. Approximately 10% of the Fund's assets were invested in such companies during the reporting period.
Annual Shareholder Report
Effect of Cash Holdings
The Fund had significant cash outflows during the reporting period which resulted in an average cash position of 6%. In a rising market, the cash holdings resulted in a modest drag on relative Fund performance.
| 1 | Please see the footnotes to the line graphs below for definitions of, and further information about, the RMCGI. |
| 2 | Please see the footnotes to the line graphs below for definitions of, and further information about, the MMCGFA. |
| 3 | International investing involves special risks including currency risk, increased volatility, political risks and differences in auditing and other financial standards. |
| 4 | The U.S. Dollar Index indicates the general international value of the U.S. dollar by averaging the exchange rates between the U.S. dollar and six major world currencies. The index is unmanaged, and it is not possible to invest directly in an index. |
Annual Shareholder Report
FUND PERFORMANCE AND GROWTH OF A $10,000 INVESTMENT
The graph below illustrates the hypothetical investment of $10,0001 in the Federated Kaufmann Fund (the “Fund”) from October 31, 2005 to October 31, 2015, compared to the Russell Midcap® Growth Index (RMCGI)2 and the Morningstar Mid-Cap Growth Funds Average (MMCGFA).3 The Average Annual Total Return table below shows returns for each class averaged over the stated periods.
Growth of a $10,000 Investment
Growth of $10,000 as of October 31, 2015
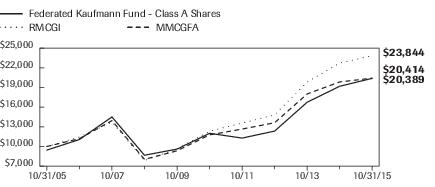
| Federated Kaufmann Fund - | Class A Shares | NA | RMCGI | MMCGFA |
| F | NA | I | I |
| 10/31/2005 | 9,450 | | 10,000 | 10,000 |
| 10/31/2006 | 11,062 | | 11,451 | 11,194 |
| 10/31/2007 | 14,499 | | 13,709 | 13,938 |
| 10/31/2008 | 8,667 | | 7,862 | 8,039 |
| 10/31/2009 | 9,600 | | 9,630 | 9,344 |
| 10/31/2010 | 12,010 | | 12,329 | 11,768 |
| 10/31/2011 | 11,282 | | 13,572 | 12,655 |
| 10/31/2012 | 12,348 | | 14,806 | 13,616 |
| 10/31/2013 | 16,747 | | 19,830 | 18,009 |
| 10/31/2014 | 19,182 | | 22,723 | 19,843 |
| 10/31/2015 | 20,389 | | 23,844 | 20,414 |
41 graphic description end -->
| ■ | Total returns shown include the maximum sales charge of 5.50% ($10,000 investment minus $550 sales charge = $9,450). |
The Fund offers multiple share classes whose performance may be greater than or less than its other share class(es) due to differences in sales charges and expenses. See the Average Annual Return table below for the returns of additional classes not shown in the line graph above.
Average Annual Total Returns for the Period Ended 10/31/2015
(returns reflect all applicable sales charges and contingent deferred sales charges as specified below in footnote #1)
| | 1 Year | 5 Years | 10 Years |
| Class A Shares | 0.44% | 9.91% | 7.38% |
| Class B Shares | 0.92% | 10.33% | 7.52% |
| Class C Shares | 4.97% | 10.57% | 7.42% |
| RMCGI | 4.94% | 14.10% | 9.08% |
| MMCGFA | 3.00% | 12.00% | 7.98% |
Annual Shareholder Report
Performance data quoted represents past performance which is no guarantee of future results. Investment return and principal value will fluctuate so that an investor's shares, when redeemed, may be worth more or less than their original cost. Mutual fund performance changes over time and current performance may be lower or higher than what is stated. For current to the most recent month-end performance and after-tax returns, visit FederatedInvestors.com or call 1-800-341-7400. Returns shown do not reflect the deduction of taxes that a shareholder would pay on Fund distributions or the redemption of Fund shares. Mutual funds are not obligations of or guaranteed by any bank and are not federally insured.
| 1 | Represents a hypothetical investment of $10,000 in the Fund after deducting applicable sales charges: For Class A Shares, the maximum sales charge of 5.50% ($10,000 investment minus $550 sales charge = $9,450); for Class B Shares, the maximum contingent deferred sales charge is 5.50% on any redemption less than one year from the purchase date; for Class C Shares, the maximum contingent deferred sales charge is 1.00% on any redemption less than one year from the purchase date. The Fund's performance assumes the reinvestment of all dividends and distributions. The RMCGI and MMCGFA have been adjusted to reflect reinvestment of all dividends on securities in the index and the average. |
| 2 | The Russell Midcap® Growth Index measures the performance of the mid-cap growth segment of the U.S. equity universe. It includes those Russell Midcap® Growth Index companies with higher price-to-book ratios and higher forecasted growth values. The RMCGI is constructed to provide a comprehensive and unbiased barometer of the mid-cap growth market. The RMCGI is completely reconstituted annually to ensure larger stocks do not distort the performance and characteristics of the true mid-cap growth market. The RMCGI is not adjusted to reflect sales charges, expenses or other fees that the Securities and Exchange Commission requires to be reflected in the Fund's performance. The index is unmanaged and unlike the Fund, is not affected by cash flows. It is not possible to invest directly in an index. |
| 3 | Morningstar figures represent the average of the total returns reported by all the mutual funds designated by Morningstar as falling into the respective category indicated. They do not reflect sales charges. |
Annual Shareholder Report
Portfolio of Investments Summary Table (unaudited)
At October 31, 2015, the Fund's sector composition1 was as follows:
| Sector Composition | | Percentage of
Total Net Assets |
| Health Care | | 31.5% |
| Information Technology | | 20.9% |
| Consumer Discretionary | | 11.2% |
| Financials | | 10.3% |
| Industrials | | 7.0% |
| Materials | | 4.5% |
| Consumer Staples | | 2.3% |
| Energy2 | | 0.0% |
| Telecommunication Services | | 0.4% |
| Securities Lending Collateral3 | | 21.8% |
| Cash Equivalents4 | | 11.8% |
| Other Assets and Liabilities—Net5 | | (21.7)% |
| TOTAL | | 100.0% |
| 1 | Except for Securities Lending Collateral, Cash Equivalents and Other Assets and Liabilities, sector classifications are based upon, and individual portfolio securities are assigned to, the classifications of the Global Industry Classification System (GICS), except that the Adviser assigns a classification to securities not classified by the GICS and to securities for which the Adviser does not have access to the classification made by the GICS. |
| 2 | Represents less than 0.1%. |
| 3 | Cash collateral received from lending portfolio securities, which is invested in short-term investments such as repurchase agreements or money market mutual funds. |
| 4 | Cash Equivalents include any investments in money market mutual funds and/or overnight repurchase agreements other than those representing securities lending collateral. |
| 5 | Assets, other than investments in securities, less liabilities. See Statement of Assets and Liabilities. |
Annual Shareholder Report
Portfolio of Investments
October 31, 2015
Shares or
Principal
Amount | | | Value |
| | | COMMON STOCKS—87.8% | |
| | | Consumer Discretionary—11.2% | |
| 90,000 | 1,2 | Amazon.com, Inc. | $56,331,000 |
| 1,177,000 | 2 | Clubcorp Holdings, Inc. | 24,057,880 |
| 187,400 | 2 | Cracker Barrel Old Country Store, Inc. | 25,760,004 |
| 821,600 | 2 | D.R. Horton, Inc. | 24,187,904 |
| 1,090,000 | 1 | Dave & Buster's Entertainment, Inc. | 42,052,200 |
| 1,050,000 | 2 | Hanesbrands, Inc. | 33,537,000 |
| 2,200,000 | | Hilton Worldwide Holdings, Inc. | 54,978,000 |
| 1,600,000 | 1,2 | La Quinta Holdings, Inc. | 24,240,000 |
| 400,000 | 2 | Las Vegas Sands Corp. | 19,804,000 |
| 343,441 | 2 | Metaldyne Performance Group, Inc. | 7,493,883 |
| 245,633 | 1,2 | Mohawk Industries, Inc. | 48,021,251 |
| 756,700 | | Moncler S.p.A | 12,197,926 |
| 27,091,412 | | NagaCorp Limited | 19,092,217 |
| 980,000 | 1 | One Group Hospitality, Inc./The | 3,067,400 |
| 16,700 | 1 | Priceline.com, Inc. | 24,285,808 |
| 19,260,000 | | Samsonite International SA | 56,814,903 |
| 1,400,000 | | Starbucks Corp. | 87,598,000 |
| 140,000 | 2 | Tractor Supply Co. | 12,934,600 |
| 88,500 | | Whirlpool Corp. | 14,172,390 |
| 1,000,000 | 1 | Yoox Net-A-Porter Group | 33,851,647 |
| | | TOTAL | 624,478,013 |
| | | Consumer Staples—2.3% | |
| 900,000 | 1,2 | Blue Buffalo Pet Products, Inc. | 16,146,000 |
| 196,154 | | CVS Health Corp. | 19,376,092 |
| 600,000 | 1,2 | Hain Celestial Group, Inc. | 29,910,000 |
| 359,059 | 2 | Smucker (J.M.) Co. | 42,149,936 |
| 1,000,000 | 1,2 | Sprouts Farmers Market, Inc. | 20,380,000 |
| | | TOTAL | 127,962,028 |
| | | Energy—0.0% | |
| 50,000 | 1,2 | Cheniere Energy, Inc. | 2,476,000 |
| | | Financials—10.3% | |
| 3,100,000 | | American International Group, Inc. | 195,486,000 |
| 255,000 | 2 | BlackRock, Inc. | 89,752,350 |
| 1,450,000 | 1,2 | CBRE Group, Inc. | 54,056,000 |
Annual Shareholder Report
Shares or
Principal
Amount | | | Value |
| | | COMMON STOCKS—continued | |
| | | Financials—continued | |
| 750,000 | | Chimera Investment Corp. | $10,560,000 |
| 530,000 | 2 | Crown Castle International Corp. | 45,293,800 |
| 3,100,000 | 2 | EverBank Financial Corp. | 53,506,000 |
| 1 | 1,3,4 | FA Private Equity Fund IV LP | 584,562 |
| 330,000 | | Housing Development Finance Corp. Ltd. | 6,322,174 |
| 1 | 1,3,4 | Infrastructure Fund | 0 |
| 435,000 | | JPMorgan Chase & Co. | 27,948,750 |
| 1 | 1,3,4 | Peachtree Leadscope LLC | 0 |
| 595,700 | 2 | Ryman Hospitality Properties | 31,333,820 |
| 1,000,000 | | Wells Fargo & Co. | 54,140,000 |
| | | TOTAL | 568,983,456 |
| | | Health Care—31.2% | |
| 671,600 | 1,2 | Acadia Pharmaceuticals, Inc. | 23,385,112 |
| 1,925,204 | 1,2 | Alkermes, Inc. | 138,460,672 |
| 129,774 | 1 | Allergan PLC | 40,031,386 |
| 1,100,000 | 1 | Amphastar Pharmaceuticals, Inc. | 13,024,000 |
| 235,000 | 1,2 | Amsurg Corp. | 16,471,150 |
| 1 | 3,4 | Apollo Investment Fund V | 374,619 |
| 1,000,000 | 1,2 | Arena Pharmaceuticals, Inc. | 1,890,000 |
| 140,000 | 1,2 | aTyr Pharma, Inc. | 1,744,400 |
| 2,425,000 | 1,2,5 | BioDelivery Sciences International, Inc. | 13,046,500 |
| 3,000,000 | 1,5 | Catalyst Pharmaceutical Partners, Inc. | 9,480,000 |
| 170,000 | 1 | Cerner Corp. | 11,269,300 |
| 237,000 | 1,2 | Coherus Biosciences, Inc. | 6,600,450 |
| 12,439,968 | 1,5 | Corcept Therapeutics, Inc. | 45,903,482 |
| 1 | 3,4 | Denovo Ventures I LP | 82,218 |
| 1,880,000 | 1 | Dexcom, Inc. | 156,641,600 |
| 126,065 | 1 | Dexcom, Inc. | 10,503,736 |
| 660,000 | 1 | Diplomat Pharmacy, Inc. | 18,552,600 |
| 9,000,000 | 1,2,5 | Dyax Corp. | 247,770,000 |
| 1,816,759 | 1,5 | Dynavax Technologies Corp. | 41,258,597 |
| 1,540,000 | 1,2,5 | Egalet Corp. | 12,782,000 |
| 2,100,000 | 1,2,5 | ExamWorks Group, Inc. | 59,304,000 |
| 535,000 | 1,2 | GW Pharmaceuticals PLC, ADR | 42,313,150 |
| 1,240,000 | 1,2,5 | Galapagos NV | 59,830,909 |
| 956,807 | 1,2,5 | Galapagos NV, ADR | 45,926,736 |
| 100,000 | 1,2 | Genfit | 4,487,225 |
Annual Shareholder Report
Shares or
Principal
Amount | | | Value |
| | | COMMON STOCKS—continued | |
| | | Health Care—continued | |
| 550,000 | 2 | Gilead Sciences, Inc. | $59,471,500 |
| 900,000 | 1,2 | HealthEquity, Inc. | 29,439,000 |
| 500,000 | 1,2 | IDEXX Laboratories, Inc. | 34,310,000 |
| 75,000 | 1,2 | Illumina, Inc. | 10,746,000 |
| 948,832 | 1,2 | Intersect ENT, Inc. | 18,179,621 |
| 1 | 3,4 | Latin Healthcare Fund | 458,699 |
| 500,000 | 1,2 | MacroGenics, Inc. | 15,535,000 |
| 436,000 | | Medtronic PLC | 32,229,120 |
| 2,120,000 | 1,3,5 | Minerva Neurosciences, Inc. | 11,108,800 |
| 3,500,000 | 1,2 | Nektar Therapeutics | 41,545,000 |
| 800,000 | 1 | Neovasc, Inc. | 4,472,000 |
| 1,291,427 | 1,2,5 | Ocular Therapeutix, Inc. | 11,145,015 |
| 902,467 | 1,2,5 | Otonomy, Inc. | 19,529,386 |
| 409,890 | 1,5 | Otonomy, Inc. | 8,870,020 |
| 392,000 | 1 | Poxel SA | 3,916,690 |
| 1,391,627 | 1,2,5 | Premier, Inc. | 47,050,909 |
| 11,301,600 | 1,5 | Progenics Pharmaceuticals, Inc. | 82,953,744 |
| 450,000 | 1,2 | Repligen Corp. | 14,958,000 |
| 200,000 | 1,2 | SAGE Therapeutics, Inc. | 10,046,000 |
| 750,000 | 1,5 | SCYNEXIS, Inc. | 4,792,500 |
| 600,000 | 1,2 | Seres Therapeutics, Inc. | 17,784,000 |
| 350,000 | | Shire Ltd. | 26,503,084 |
| 124,400 | | Shire Ltd., ADR | 28,245,020 |
| 959,018 | 1,4,5 | Soteira, Inc. | 0 |
| 511,300 | 1,2 | Spark Therapeutics, Inc. | 27,559,070 |
| 1,200,000 | 1,5 | SteadyMed Ltd. | 3,384,000 |
| 117,816 | 1,3,5 | SteadyMed Ltd. | 332,241 |
| 3,461,045 | 1,2,5 | Threshold Pharmaceuticals, Inc., Class THL | 13,186,581 |
| 328,600 | 1,2 | Ultragenyx Pharmaceutical, Inc. | 32,646,410 |
| 2,850,000 | 1,2 | Veeva Systems, Inc. | 72,304,500 |
| 700,000 | 1,2 | Versartis, Inc. | 7,231,000 |
| 1,738,998 | 1,5 | Zogenix, Inc. | 20,502,786 |
| 254,900 | 1,2,5 | Zynerba Pharmaceuticals, Inc. | 3,209,191 |
| | | TOTAL | 1,734,778,729 |
| | | Industrials—7.0% | |
| 1,500,000 | 2 | Air Lease Corp. | 50,565,000 |
| 424,500 | 1,2 | Caesar Stone SDOT Yam Ltd. | 15,073,995 |
Annual Shareholder Report
Shares or
Principal
Amount | | | Value |
| | | COMMON STOCKS—continued | |
| | | Industrials—continued | |
| 300,000 | | Danaher Corp. | $27,993,000 |
| 700,000 | 2 | Hexcel Corp. | 32,424,000 |
| 785,000 | | KAR Auction Services, Inc. | 30,144,000 |
| 667,400 | 1,2 | Kirby Corp. | 43,574,546 |
| 350,000 | 1,2 | Middleby Corp. | 40,929,000 |
| 456,850 | 1 | Milacron Holdings Corp. | 7,798,429 |
| 1,250,000 | 1 | RPX Corp. | 17,800,000 |
| 378,200 | | Safran SA | 28,700,930 |
| 744,626 | 1,2 | Spirit Airlines, Inc. | 27,640,517 |
| 140,000 | | Stanley Black & Decker, Inc. | 14,837,200 |
| 400,000 | 1 | Verisk Analytics, Inc. | 28,644,000 |
| 265,000 | 2 | Wabtec Corp. | 21,960,550 |
| | | TOTAL | 388,085,167 |
| | | Information Technology—20.9% | |
| 130,000 | 1 | Adobe Systems, Inc. | 11,525,800 |
| 600,000 | 1,2 | Alibaba Group Holding Ltd., ADR | 50,298,000 |
| 1,235,000 | | Amadeus IT Holding SA | 52,551,655 |
| 560,000 | 2 | Avago Technologies Ltd. | 68,952,800 |
| 1,200,000 | 1,2,5 | ChannelAdvisor Corp. | 10,464,000 |
| 346,300 | 1 | Check Point Software Technologies Ltd. | 29,414,722 |
| 332,000 | 1,2 | CoStar Group, Inc. | 67,419,240 |
| 631,400 | 1,2 | Cvent, Inc. | 19,958,554 |
| 503,919 | 1,2 | Demandware, Inc. | 28,572,207 |
| 1,059,322 | 1,3,4 | Expand Networks Ltd. | 0 |
| 1,466,475 | 1,2 | Fitbit, Inc. | 59,450,897 |
| 1,100,000 | 1,2 | Fleetmatics Group PLC | 61,226,000 |
| 430,000 | 1,2 | GoDaddy, Inc. | 11,816,400 |
| 1,539,700 | 1 | Microsemi Corp. | 55,444,597 |
| 570,000 | 1,2 | Mobileye NV | 25,946,400 |
| 1,175,000 | 1,2 | NIC, Inc. | 22,289,750 |
| 1,050,000 | 1 | NXP Semiconductors NV | 82,267,500 |
| 475,000 | 1,2 | NetSuite, Inc. | 40,408,250 |
| 1 | 1,3,4 | Peachtree Open Networks | 0 |
| 429,059 | 1,2 | Qorvo, Inc. | 18,848,562 |
| 1,423,600 | 1,2 | RADWARE Ltd. | 21,225,876 |
| 500,000 | 1,2 | Salesforce.com, Inc. | 38,855,000 |
| 3,751 | 1,3,4 | Sensable Technologies, Inc. | 0 |
Annual Shareholder Report
Shares or
Principal
Amount | | | Value |
| | | COMMON STOCKS—continued | |
| | | Information Technology—continued | |
| 825,000 | 1,2 | ServiceNow, Inc. | $67,361,250 |
| 2,700,000 | 1,2,5 | Textura Corp. | 79,272,000 |
| 622,900 | 1,2 | Tyler Technologies, Inc. | 106,117,244 |
| 1,100,000 | 1,2 | Vantiv, Inc. | 55,165,000 |
| 765,000 | 1,2 | Workday, Inc. | 60,412,050 |
| 500,000 | 1,2 | Zillow Group, Inc. | 13,845,000 |
| | | TOTAL | 1,159,108,754 |
| | | Materials—4.5% | |
| 707,000 | | Eagle Materials, Inc. | 46,683,210 |
| 720,000 | | Martin Marietta Materials | 111,708,000 |
| 341,400 | 2 | Sherwin-Williams Co. | 91,095,762 |
| | | TOTAL | 249,486,972 |
| | | Telecommunication Services—0.4% | |
| 838,700 | 1 | Zayo Group Holdings, Inc. | 22,250,711 |
| | | TOTAL COMMON STOCKS
(IDENTIFIED COST $3,193,936,234) | 4,877,609,830 |
| | | CORPORATE BOND—0.1% | |
| | | Health Care—0.1% | |
| $4,600,000 | 3,6 | Protalix Biotherapeutics, Inc., Conv. Bond, Series 144A,
4.50%, 9/15/2018
(IDENTIFIED COST $4,600,000) | 3,380,066 |
| | | PREFERRED STOCKS—0.1% | |
| | | Health Care—0.1% | |
| 185,997 | 1,3,4 | aTyr Pharma, Inc., Pfd., Series E | 2,244,752 |
| 6,978,566 | 1,3,4 | BioNano Genomics, Inc., Pfd., Series C | 1,960,000 |
| | | TOTAL | 4,204,752 |
| | | Information Technology—0.0% | |
| 679,348 | 1,3,4 | Multiplex, Inc., Pfd., Series C | 0 |
| | | TOTAL PREFERRED STOCKS
(IDENTIFIED COST $16,815,000) | 4,204,752 |
| | | WARRANTS—0.1% | |
| | | Health Care—0.1% | |
| 382,897 | 1 | Alexza Pharmaceuticals, Inc., 10/5/2016 | 6,548 |
| 2,907,735 | 1,3,4 | BioNano Genomics, Inc., 3/31/2016 | 582 |
| 2,120,000 | 1,5 | Minerva Neurosciences, Inc., 3/18/2017 | 2,212,432 |
| 7,425,000 | 1,5 | Zogenix, Inc., 7/27/2017 | 5,585,827 |
| | | TOTAL WARRANTS
(IDENTIFIED COST $315,770) | 7,805,389 |
Annual Shareholder Report
Shares or
Principal
Amount | | | Value |
| | | INVESTMENT COMPANIES—33.6% | |
| 1,211,126,225 | 5,8 | Federated Money Market Management, Institutional Shares, 0.16%7 | $1,211,126,225 |
| 652,093,317 | 5 | Federated Prime Value Obligations Fund, Institutional Shares, 0.16%7 | 652,093,317 |
| | | TOTAL INVESTMENT COMPANIES
(AT NET ASSET VALUE) | 1,863,219,542 |
| | | TOTAL INVESTMENTS—121.7%
(IDENTIFIED COST $5,078,886,546)9 | 6,756,219,579 |
| | | OTHER ASSETS AND LIABILITIES - NET—(21.7)%10 | (1,202,418,387) |
| | | TOTAL NET ASSETS—100% | $5,553,801,192 |
| 1 | Non-income-producing security. |
| 2 | All or a portion of these securities are temporarily on loan to unaffiliated broker/dealers. |
| 3 | Denotes a restricted security that either: (a) cannot be offered for public sale without first being registered, or being able to take advantage of an exemption from registration, under the Securities Act of 1933; or (b) is subject to a contractual restriction on public sales. At October 31, 2015, these restricted securities amounted to $20,526,539, which represented 0.4% of total net assets. |
| 4 | Market quotations and price evaluations are not available. Fair value determined in accordance with procedures established by and under the general supervision of the Fund's Board of Trustees (the “Trustees”). |
| 5 | Affiliated companies and holdings. |
| 6 | Denotes a restricted security that may be resold without restriction to “qualified institutional buyers” as defined in Rule 144A under the Securities Act of 1933 and that the Fund has determined to be liquid under criteria established by the Fund's Trustees. At October 31, 2015, these liquid restricted securities amounted to $3,380,066, which represented 0.1% of total net assets. |
| 7 | 7-day net yield. |
| 8 | All or a portion of this security is held as collateral for securities lending. |
| 9 | The cost of investments for federal tax purposes amounts to $5,111,833,052. |
| 10 | Assets, other than investments in securities, less liabilities. See Statement of Assets and Liabilities. A significant portion of this balance represents loans to unaffiliated qualified brokers for securities lending. The Fund receives cash from the broker as collateral for the loaned securities and reinvests the collateral in certain short-term securities such as repurchase agreements or money market mutual funds. |
Note: The categories of investments are shown as a percentage of total net assets at October 31, 2015.
Various inputs are used in determining the value of the Fund's investments. These inputs are summarized in the three broad levels listed below:
Level 1—quoted prices in active markets for identical securities.
Level 2—other significant observable inputs (including quoted prices for similar securities, interest rates, prepayment speeds, credit risk, etc.). Also includes securities valued at amortized cost.
Level 3—significant unobservable inputs (including the Fund's own assumptions in determining the fair value of investments).
The inputs or methodology used for valuing securities are not an indication of the risk associated with investing in those securities.
Annual Shareholder Report
The following is a summary of the inputs used, as of October 31, 2015, in valuing the Fund's assets carried at fair value:
| Valuation Inputs |
| | Level 1—
Quoted
Prices | Level 2—
Other
Significant
Observable
Inputs | Level 3—
Significant
Unobservable
Inputs | Total |
| Equity Securities: | | | | |
| Common Stocks | | | | |
| Domestic | $4,092,761,9321 | $— | $1,500,098 | $4,094,262,030 |
| International | 479,078,440 | 304,269,360 | — | 783,347,800 |
| Preferred Stocks | | | | |
| Domestic | — | — | 4,204,752 | 4,204,752 |
| Debt Securities: | | | | |
| Corporate Bond | — | 3,380,066 | — | 3,380,066 |
| Warrants | — | 7,804,807 | 582 | 7,805,389 |
| Investment Companies | 1,863,219,542 | — | — | 1,863,219,542 |
| TOTAL SECURITIES | $6,435,059,914 | $315,454,233 | $5,705,432 | $6,756,219,579 |
| 1 | Includes $9,720,541 of a domestic common stock security transferred from Level 3 to Level 1 because observable market data was obtained for the security. Transfer shown represents the value of the security at the beginning of the period. |
The following acronym is used throughout this portfolio:
| ADR | —American Depositary Receipt |
See Notes which are an integral part of the Financial Statements
Annual Shareholder Report
Financial Highlights–Class A Shares
(For a Share Outstanding Throughout Each Period)
| Year Ended October 31 | 2015 | 2014 | 2013 | 2012 | 2011 |
| Net Asset Value, Beginning of Period | $6.60 | $6.59 | $5.28 | $4.92 | $5.27 |
| Income From Investment Operations: | | | | | |
| Net investment income (loss) | (0.08)1 | (0.09)1 | (0.05)1 | (0.05)1 | (0.05)1 |
| Net realized and unrealized gain (loss) on investments, futures contracts and foreign currency transactions | 0.46 | 0.98 | 1.78 | 0.50 | (0.27) |
| TOTAL FROM INVESTMENT OPERATIONS | 0.38 | 0.89 | 1.73 | 0.45 | (0.32) |
| Less Distributions: | | | | | |
| Distributions from net investment income | — | — | — | — | (0.03) |
| Distributions from net realized gain on investments, futures contracts and foreign currency transactions | (0.96) | (0.88) | (0.42) | (0.09) | (0.00)2 |
| TOTAL DISTRIBUTIONS | (0.96) | (0.88) | (0.42) | (0.09) | (0.03) |
| Net Asset Value, End of Period | $6.02 | $6.60 | $6.59 | $5.28 | $4.92 |
| Total Return3 | 6.29% | 14.54% | 35.63% | 9.45% | (6.07)% |
| Ratios to Average Net Assets: | | | | | |
| Net expenses | 1.95%4 | 1.95%4 | 1.95%4 | 1.95%4 | 1.95%4 |
| Net expenses excluding dividends and other expenses related to short sales | — | — | — | 1.95%4 | 1.95%4 |
| Net investment income (loss) | (1.22)% | (1.27)% | (0.82)% | (0.97)% | (0.99)% |
| Expense waiver/reimbursement5 | 0.05% | 0.15% | 0.25% | 0.28% | 0.29% |
| Supplemental Data: | | | | | |
| Net assets, end of period (000 omitted) | $1,582,916 | $1,550,663 | $1,508,534 | $1,898,465 | $1,999,940 |
| Portfolio turnover | 51% | 52% | 63% | 61% | 64% |
| 1 | Per share numbers have been calculated using the average shares method. |
| 2 | Represents less than $0.01. |
| 3 | Based on net asset value, which does not reflect the sales charge, redemption fee or contingent deferred sales charge, if applicable. |
| 4 | The net expense ratios are calculated without reduction for fees paid indirectly for expense offset arrangements. The net expense ratios are 1.95%, 1.95%, 1.95%, 1.95% and 1.95%, for the years ended October 31, 2015, 2014, 2013, 2012 and 2011, respectively, after taking into account these expense reductions. |
| 5 | This expense decrease is reflected in both the net expense and the net investment income (loss) ratios shown above. |
See Notes which are an integral part of the Financial Statements
Annual Shareholder Report
Financial Highlights–Class B Shares
(For a Share Outstanding Throughout Each Period)
| Year Ended October 31 | 2015 | 2014 | 2013 | 2012 | 2011 |
| Net Asset Value, Beginning of Period | $6.00 | $6.10 | $4.94 | $4.64 | $4.96 |
| Income From Investment Operations: | | | | | |
| Net investment income (loss) | (0.10)1 | (0.11)1 | (0.07)1 | (0.07)1 | (0.08)1 |
| Net realized and unrealized gain (loss) on investments, futures contracts and foreign currency transactions | 0.42 | 0.89 | 1.65 | 0.46 | (0.24) |
| TOTAL FROM INVESTMENT OPERATIONS | 0.32 | 0.78 | 1.58 | 0.39 | (0.32) |
| Less Distributions: | | | | | |
| Distributions from net investment income | — | — | — | — | (0.00)2 |
| Distributions from net realized gain on investments, futures contracts and foreign currency transactions | (0.96) | (0.88) | (0.42) | (0.09) | (0.00)2 |
| TOTAL DISTRIBUTIONS | (0.96) | (0.88) | (0.42) | (0.09) | (0.00)2 |
| Net Asset Value, End of Period | $5.36 | $6.00 | $6.10 | $4.94 | $4.64 |
| Total Return3 | 5.83% | 13.83% | 34.99% | 8.72% | (6.40)% |
| Ratios to Average Net Assets: | | | | | |
| Net expenses | 2.48%4 | 2.50%4 | 2.50%4 | 2.50%4 | 2.50%4 |
| Net expenses excluding dividends and other expenses related to short sales | — | — | — | 2.50%4 | 2.50%4 |
| Net investment income (loss) | (1.74)% | (1.81)% | (1.35)% | (1.52)% | (1.53)% |
| Expense waiver/reimbursement5 | 0.03% | 0.11% | 0.20% | 0.23% | 0.24% |
| Supplemental Data: | | | | | |
| Net assets, end of period (000 omitted) | $99,777 | $123,679 | $159,846 | $184,726 | $301,469 |
| Portfolio turnover | 51% | 52% | 63% | 61% | 64% |
| 1 | Per share numbers have been calculated using the average shares method. |
| 2 | Represents less than $0.01. |
| 3 | Based on net asset value, which does not reflect the sales charge, redemption fee or contingent deferred sales charge, if applicable. |
| 4 | The net expense ratio is calculated without reduction for fees paid indirectly for expense offset arrangements. The net expense ratios are 2.48%, 2.50%, 2.50%, 2.50% and 2.50%, for the years ended October 31, 2015, 2014, 2013, 2012 and 2011, respectively, after taking into account these expense reductions. |
| 5 | This expense decrease is reflected in both the net expense and the net investment income (loss) ratios shown above. |
See Notes which are an integral part of the Financial Statements
Annual Shareholder Report
Financial Highlights–Class C Shares
(For a Share Outstanding Throughout Each Period)
| Year Ended October 31 | 2015 | 2014 | 2013 | 2012 | 2011 |
| Net Asset Value, Beginning of Period | $6.00 | $6.10 | $4.94 | $4.64 | $4.94 |
| Income From Investment Operations: | | | | | |
| Net investment income (loss) | (0.10)1 | (0.11)1 | (0.07)1 | (0.07)1 | (0.08)1 |
| Net realized and unrealized gain (loss) on investments, futures contracts and foreign currency transactions | 0.42 | 0.89 | 1.65 | 0.46 | (0.24) |
| TOTAL FROM INVESTMENT OPERATIONS | 0.32 | 0.78 | 1.58 | 0.39 | (0.32) |
| Less Distributions: | | | | | |
| Distributions from net investment income | — | — | — | — | (0.01) |
| Distributions from net realized gain on investments, futures contracts and foreign currency transactions | (0.96) | (0.88) | (0.42) | (0.09) | (0.00)2 |
| TOTAL DISTRIBUTIONS | (0.96) | (0.88) | (0.42) | (0.09) | (0.01) |
| Net Asset Value, End of Period | $5.36 | $6.00 | $6.10 | $4.94 | $4.64 |
| Total Return3 | 5.86% | 13.83% | 34.99% | 8.72% | (6.53)% |
| Ratios to Average Net Assets: | | | | | |
| Net expenses | 2.48%4 | 2.50%4 | 2.50%4 | 2.50%4 | 2.50%4 |
| Net expenses excluding dividends and other expenses related to short sales | — | — | — | 2.50%4 | 2.50%4 |
| Net investment income (loss) | (1.75)% | (1.81)% | (1.39)% | (1.52)% | (1.53)% |
| Expense waiver/reimbursement5 | 0.03% | 0.11% | 0.20% | 0.23% | 0.24% |
| Supplemental Data: | | | | | |
| Net assets, end of period (000 omitted) | $418,926 | $427,755 | $431,327 | $392,886 | $494,457 |
| Portfolio turnover | 51% | 52% | 63% | 61% | 64% |
| 1 | Per share numbers have been calculated using the average shares method. |
| 2 | Represents less than $0.01. |
| 3 | Based on net asset value, which does not reflect the sales charge, redemption fee or contingent deferred sales charge, if applicable. |
| 4 | The net expense ratio is calculated without reduction for fees paid indirectly for expense offset arrangements. The net expense ratios are 2.48%, 2.50%, 2.50%, 2.50% and 2.50%, for the years ended October 31, 2015, 2014, 2013, 2012 and 2011, respectively, after taking into account these expense reductions. |
| 5 | This expense decrease is reflected in both the net expense and the net investment income (loss) ratios shown above. |
See Notes which are an integral part of the Financial Statements
Annual Shareholder Report
Statement of Assets and Liabilities
October 31, 2015
| Assets: | | |
| Total investment in securities, at value including $1,176,859,702 of securities loaned, $1,863,219,542 of investment in affiliated holdings and $858,901,656 of investment in affiliated companies (Note 5) (identified cost $5,078,886,546) | | $6,756,219,579 |
| Cash | | 3,783,178 |
| Cash denominated in foreign currencies (identified cost $9,758) | | 9,581 |
| Income receivable | | 642,445 |
| Receivable for investments sold | | 21,994,812 |
| Receivable for shares sold | | 2,690,215 |
| TOTAL ASSETS | | 6,785,339,810 |
| Liabilities: | | |
| Payable for investments purchased | $10,759,184 | |
| Payable for shares redeemed | 3,620,429 | |
| Payable for collateral due to broker for securities lending | 1,211,126,225 | |
| Payable to adviser (Note 5) | 387,240 | |
| Payable for distribution services fee (Note 5) | 1,300,177 | |
| Payable for other service fees (Notes 2 and 5) | 2,913,726 | |
| Accrued expenses (Note 5) | 1,431,637 | |
| TOTAL LIABILITIES | | 1,231,538,618 |
| Net assets for 932,366,326 shares outstanding | | $5,553,801,192 |
| Net Assets Consist of: | | |
| Paid-in capital | | $3,176,790,179 |
| Net unrealized appreciation of investments and translation of assets and liabilities in foreign currency | | 1,677,332,856 |
| Accumulated net realized gain on investments and foreign currency transactions | | 772,865,508 |
| Distributions in excess of net investment income | | (73,187,351) |
| TOTAL NET ASSETS | | $5,553,801,192 |
Annual Shareholder Report
Statement of Assets and Liabilities–continued
Net Asset Value, Offering Price and Redemption
Proceeds Per Share | | |
| Class A Shares: | | |
| Net asset value per share ($1,582,916,302 ÷ 262,956,171 shares outstanding), no par value, unlimited shares authorized | | $6.02 |
| Offering price per share (100/94.50 of $6.02) | | $6.37 |
| Redemption proceeds per share | | $6.02 |
| Class B Shares: | | |
| Net asset value per share ($99,776,886 ÷ 18,611,295 shares outstanding), no par value, unlimited shares authorized | | $5.36 |
| Offering price per share | | $5.36 |
| Redemption proceeds per share (94.50/100 of $5.36) | | $5.07 |
| Class C Shares: | | |
| Net asset value per share ($418,925,805 ÷ 78,201,549 shares outstanding), no par value, unlimited shares authorized | | $5.36 |
| Offering price per share | | $5.36 |
| Redemption proceeds per share (99.00/100 of $5.36) | | $5.31 |
| Class R Shares: | | |
| Net asset value per share ($3,452,182,199 ÷ 572,597,311 shares outstanding), no par value, unlimited shares authorized | | $6.03 |
| Offering price per share | | $6.03 |
| Redemption proceeds per share | | $6.03 |
See Notes which are an integral part of the Financial Statements
Annual Shareholder Report
Statement of Operations
Year Ended October 31, 2015
| Investment Income: | | | |
| Dividends (including $1,500,715 received from affiliated holdings (Note 5) and net of foreign taxes withheld of $253,603) | | | $33,610,694 |
| Interest (including income on securities loaned of $8,622,303) | | | 8,830,722 |
| TOTAL INCOME | | | 42,441,416 |
| Expenses: | | | |
| Investment adviser fee (Note 5) | | $75,550,788 | |
| Administrative fee (Note 5) | | 4,548,097 | |
| Custodian fees | | 389,325 | |
| Transfer agent fee (Note 2) | | 5,908,208 | |
| Directors'/Trustees' fees (Note 5) | | 43,651 | |
| Auditing fees | | 39,699 | |
| Legal fees | | 9,612 | |
| Portfolio accounting fees | | 205,088 | |
| Distribution services fee (Note 5) | | 26,366,600 | |
| Other service fees (Notes 2 and 5) | | 14,490,347 | |
| Share registration costs | | 142,101 | |
| Printing and postage | | 255,771 | |
| Miscellaneous (Note 5) | | 33,116 | |
| TOTAL EXPENSES | | 127,982,403 | |
| Waivers, Reimbursement and Reduction: | | | |
| Waiver/reimbursement of investment adviser fee (Note 5) | $(1,455,224) | | |
| Waiver of other operating expenses (Note 5) | (10,012,679) | | |
Fees paid indirectly from directed brokerage
arrangements (Note 6) | (40,154) | | |
| TOTAL WAIVERS, REIMBURSEMENT AND REDUCTION | | (11,508,057) | |
| Net expenses | | | 116,474,346 |
| Net investment income (loss) | | | (74,032,930) |
| Realized and Unrealized Gain (Loss) on Investments and Foreign Currency Transactions: | | | |
| Net realized gain on investments and foreign currency transactions (including realized gain of $63,754,900 on sales of investments in affiliated companies (Note 5)) | | | 795,735,526 |
| Net change in unrealized appreciation of investments and translation of assets and liabilities in foreign currency | | | (370,097,703) |
| Net realized and unrealized gain on investments and foreign currency transactions | | | 425,637,823 |
| Change in net assets resulting from operations | | | $351,604,893 |
See Notes which are an integral part of the Financial Statements
Annual Shareholder Report
Statement of Changes in Net Assets
| Year Ended October 31 | 2015 | 2014 |
| Increase (Decrease) in Net Assets | | |
| Operations: | | |
| Net investment income (loss) | $(74,032,930) | $(73,880,016) |
| Net realized gain on investments, futures contracts and foreign currency transactions | 795,735,526 | 894,185,898 |
| Net change in unrealized appreciation/depreciation of investments and translation of assets and liabilities in foreign currency | (370,097,703) | (70,384,858) |
| CHANGE IN NET ASSETS RESULTING FROM OPERATIONS | 351,604,893 | 749,921,024 |
| Distributions to Shareholders: | | |
| Distributions from net realized gain on investments, futures contracts and foreign currency transactions | | |
| Class A Shares | (223,114,494) | (198,779,147) |
| Class B Shares | (18,974,403) | (21,904,125) |
| Class C Shares | (67,412,650) | (61,119,850) |
| Class R Shares | (503,565,538) | (439,822,561) |
| CHANGE IN NET ASSETS RESULTING FROM DISTRIBUTIONS TO SHAREHOLDERS | (813,067,085) | (721,625,683) |
| Share Transactions: | | |
| Proceeds from sale of shares | 379,428,833 | 298,150,900 |
| Net asset value of shares issued to shareholders in payment of distributions declared | 757,424,298 | 676,099,177 |
| Cost of shares redeemed | (721,145,444) | (861,353,432) |
| CHANGE IN NET ASSETS RESULTING FROM SHARE TRANSACTIONS | 415,707,687 | 112,896,645 |
| Change in net assets | (45,754,505) | 141,191,986 |
| Net Assets: | | |
| Beginning of period | 5,599,555,697 | 5,458,363,711 |
| End of period (including undistributed (distributions in excess of) net investment income of $(73,187,351) and $0, respectively) | $5,553,801,192 | $5,599,555,697 |
See Notes which are an integral part of the Financial Statements
Annual Shareholder Report
Notes to Financial Statements
October 31, 2015
1. ORGANIZATION
Federated Equity Funds (the “Trust”) is registered under the Investment Company Act of 1940, as amended (the “Act”), as an open-end management investment company. The Trust consists of 14 diversified portfolios. The financial statements included herein are only those of Federated Kaufmann Fund (the “Fund”), a diversified portfolio. The financial statements of the other portfolios are presented separately. The assets of each portfolio are segregated and a shareholder's interest is limited to the portfolio in which shares are held. Each portfolio pays its own expenses. The Fund offers four classes of shares: Class A Shares, Class B Shares, Class C Shares and Class R Shares. All shares of the Fund have equal rights with respect to voting, except on class-specific matters. The financial highlights of the Class R Shares are presented separately. The investment objective of the Fund is to provide capital appreciation.
2. SIGNIFICANT ACCOUNTING POLICIES
The following is a summary of significant accounting policies consistently followed by the Fund in the preparation of its financial statements. These policies are in conformity with U.S. generally accepted accounting principles (GAAP).
Investment Valuation
In calculating its net asset value (NAV), the Fund generally values investments as follows:
| ■ | Equity securities listed on an exchange or traded through a regulated market system are valued at their last reported sale price or official closing price in their principal exchange or market. |
| ■ | Shares of other mutual funds or non-exchange-traded investment companies are valued based upon their reported NAVs. |
| ■ | Fixed-income securities acquired with remaining maturities greater than 60 days are fair valued using price evaluations provided by a pricing service approved by the Trustees. |
| ■ | Fixed-income securities and repurchase agreements acquired with remaining maturities of 60 days or less are valued at their cost (adjusted for the accretion of any discount or amortization of any premium), unless the issuer's creditworthiness is impaired or other factors indicate that amortized cost is not an accurate estimate of the investment's fair value, in which case it would be valued in the same manner as a longer-term security. |
| ■ | Derivative contracts listed on exchanges are valued at their reported settlement or closing price, except that options are valued at the mean of closing bid and asked quotations. |
| ■ | Over-the-counter (OTC) derivative contracts are fair valued using price evaluations provided by a pricing service approved by the Trustees. |
| ■ | For securities that are fair valued in accordance with procedures established by and under the general supervision of the Trustees, certain factors may be considered such as: the last traded or purchase price of the security, information obtained by contacting the issuer or dealers, analysis of the issuer's financial statements or other available documents, fundamental analytical data, the nature and duration of restrictions on disposition, the movement of the market in which the security is normally traded, public trading in similar securities or derivative contracts of the issuer or comparable issuers, movement of a relevant index, or other factors including but not limited to industry changes and relevant government actions. |
Annual Shareholder Report
If any price, quotation, price evaluation or other pricing source is not readily available when the NAV is calculated, or if the Fund cannot obtain price evaluations from a pricing service or from more than one dealer for an investment within a reasonable period of time as set forth in the Fund's valuation policies and procedures, the Fund uses the fair value of the investment determined in accordance with the procedures described below. There can be no assurance that the Fund could obtain the fair value assigned to an investment if it sold the investment at approximately the time at which the Fund determines its NAV per share.
Fair Valuation and Significant Events Procedures
The Trustees have ultimate responsibility for determining the fair value of investments for which market quotations are not readily available. The Trustees have appointed a valuation committee (“Valuation Committee”) comprised of officers of the Fund, Federated Equity Management Company of Pennsylvania (“Adviser”) and certain of the Adviser's affiliated companies to assist in determining fair value and in overseeing the calculation of the NAV. The Trustees have also authorized the use of pricing services recommended by the Valuation Committee to provide fair value evaluations of the current value of certain investments for purposes of calculating the NAV. The Valuation Committee employs various methods for reviewing third-party pricing-service evaluations including periodic reviews of third-party pricing services' policies, procedures and valuation methods (including key inputs, methods, models and assumptions), transactional back-testing, comparisons of evaluations of different pricing services, and review of price challenges by the Adviser based on recent market activity. In the event that market quotations and price evaluations are not available for an investment, the Valuation Committee determines the fair value of the investment in accordance with procedures adopted by the Trustees. The Trustees periodically review and approve the fair valuations made by the Valuation Committee and any changes made to the procedures.
Factors considered by pricing services in evaluating an investment include the yields or prices of investments of comparable quality, coupon, maturity, call rights and other potential prepayments, terms and type, reported transactions, indications as to values from dealers and general market conditions. Some pricing services provide a single price evaluation reflecting the bid-side of the market for an investment (a “bid” evaluation). Other pricing services offer both bid evaluations and price evaluations indicative of a price between the prices bid and asked for the investment (a “mid” evaluation). The Fund normally uses bid evaluations for any U.S. Treasury and Agency securities, mortgage-backed securities and municipal securities. The Fund normally uses mid evaluations for any other types of fixed-income securities and any OTC derivative contracts. In the event that market quotations and price evaluations are not available for an investment, the fair value of the investment is determined in accordance with procedures adopted by the Trustees.
The Trustees also have adopted procedures requiring an investment to be priced at its fair value whenever the Adviser determines that a significant event affecting the value of the investment has occurred between the time as of which the price of the investment would otherwise be determined and the time as of which the NAV is computed. An event is considered significant if there is both an affirmative expectation that the investment's value will change in response to the event and a reasonable basis for quantifying the resulting change in value. Examples of significant events that may occur after the close of the principal market on which a security is traded, or after the time of a price evaluation provided by a pricing service or a dealer, include:
| ■ | With respect to securities traded principally in foreign markets, significant trends in U.S. equity markets or in the trading of foreign securities index futures contracts; |
Annual Shareholder Report
| ■ | Political or other developments affecting the economy or markets in which an issuer conducts its operations or its securities are traded; |
| ■ | Announcements concerning matters such as acquisitions, recapitalizations, litigation developments, or a natural disaster affecting the issuer's operations or regulatory changes or market developments affecting the issuer's industry. |
The Trustees have adopted procedures whereby the Valuation Committee uses a pricing service to determine the fair value of equity securities traded principally in foreign markets when the Adviser determines that there has been a significant trend in the U.S. equity markets or in index futures trading. For other significant events, the Fund may seek to obtain more current quotations or price evaluations from alternative pricing sources. If a reliable alternative pricing source is not available, the Fund will determine the fair value of the investment in accordance with the fair valuation procedures approved by the Trustees. The Trustees have ultimate responsibility for any fair valuations made in response to a significant event.
Repurchase Agreements
The Fund may invest in repurchase agreements for short-term liquidity purposes. It is the policy of the Fund to require the other party to a repurchase agreement to transfer to the Fund's custodian or sub-custodian eligible securities or cash with a market value (after transaction costs) at least equal to the repurchase price to be paid under the repurchase agreement. The eligible securities are transferred to accounts with the custodian or sub-custodian in which the Fund holds a “securities entitlement” and exercises “control” as those terms are defined in the Uniform Commercial Code. The Fund has established procedures for monitoring the market value of the transferred securities and requiring the transfer of additional eligible securities if necessary to equal at least the repurchase price. These procedures also allow the other party to require securities to be transferred from the account to the extent that their market value exceeds the repurchase price or in exchange for other eligible securities of equivalent market value.
The insolvency of the other party or other failure to repurchase the securities may delay the disposition of the underlying securities or cause the Fund to receive less than the full repurchase price. Under the terms of the repurchase agreement, any amounts received by the Fund in excess of the repurchase price and related transaction costs must be remitted to the other party.
The Fund may enter into repurchase agreements in which eligible securities are transferred into joint trading accounts maintained by the custodian or sub-custodian for investment companies and other clients advised by the Fund's Adviser and its affiliates. The Fund will participate on a pro rata basis with the other investment companies and clients in its share of the securities transferred under such repurchase agreements and in its share of proceeds from any repurchase or other disposition of such securities.
Annual Shareholder Report
Investment Income, Gains and Losses, Expenses and Distributions
Investment transactions are accounted for on a trade-date basis. Realized gains and losses from investment transactions are recorded on an identified-cost basis. Interest income and expenses are accrued daily. Dividend income and distributions to shareholders are recorded on the ex-dividend date. Foreign dividends are recorded on the ex-dividend date or when the Fund is informed of the ex-dividend date. Distributions of net investment income, if any, are declared and paid annually. Non-cash dividends included in dividend income, if any, are recorded at fair value. Investment income, realized and unrealized gains and losses, and certain fund-level expenses are allocated to each class based on relative average daily net assets, except that Class A Shares, Class B Shares, Class C Shares and Class R Shares may bear distribution services fees, other service fees and transfer agent fees unique to those classes. For the year ended October 31, 2015, transfer agent fees for the Fund were as follows:
| | Transfer
Agent Fees
Incurred |
| Class A Shares | $1,775,593 |
| Class B Shares | 125,658 |
| Class C Shares | 476,277 |
| Class R Shares | 3,530,680 |
| TOTAL | $5,908,208 |
Dividends are declared separately for each class. No class has preferential dividend rights; differences in per share dividend rates are generally due to differences in separate class expenses.
Other Service Fees
The Fund may pay other service fees up to 0.25% of the average daily net assets of the Fund's Class A Shares, Class B Shares, Class C Shares and Class R Shares to financial intermediaries or to Federated Shareholder Services Company (FSSC) for providing services to shareholders and maintaining shareholder accounts. Financial intermediaries may include a company affiliated with management of Federated Investors, Inc. A financial intermediary affiliated with management of Federated Investors, Inc. received $23,119 of other services for the year ended October 31, 2015. Subject to the terms described in the Expense Limitation note, FSSC may voluntarily reimburse the Fund for other service fees. For the year ended October 31, 2015, other service fees for the Fund were as follows:
| | Other Service
Fees
Incurred |
| Class A Shares | $4,058,361 |
| Class B Shares | 287,928 |
| Class C Shares | 1,091,724 |
| Class R Shares | 9,052,334 |
| TOTAL | $14,490,347 |
Annual Shareholder Report
Premium and Discount Amortization
All premiums and discounts on fixed-income securities are amortized/accreted using the effective-interest-rate method.
Federal Taxes
It is the Fund's policy to comply with the Subchapter M provision of the Internal Revenue Code (the “Code”) and to distribute to shareholders each year substantially all of its income. Accordingly, no provision for federal income tax is necessary. As of and during the year ended October 31, 2015, the Fund did not have a liability for any uncertain tax positions. The Fund recognizes interest and penalties, if any, related to tax liabilities as income tax expense in the Statement of Operations. As of October 31, 2015, tax years 2012 through 2015 remain subject to examination by the Fund's major tax jurisdictions, which include the United States of America and the Commonwealth of Massachusetts.
The Fund may be subject to taxes imposed by governments of countries in which it invests. Such taxes are generally based on either income or gains earned or repatriated. The Fund accrues and applies such taxes to net investment income, net realized gains and net unrealized gains as income and/or gains are earned.
When-Issued and Delayed-Delivery Transactions
The Fund may engage in when-issued or delayed-delivery transactions. The Fund records when-issued securities on the trade date and maintains security positions such that sufficient liquid assets will be available to make payment for the securities purchased. Securities purchased on a when-issued or delayed-delivery basis are marked to market daily and begin earning interest on the settlement date. Losses may occur on these transactions due to changes in market conditions or the failure of counterparties to perform under the contract.
Futures Contracts
The Fund purchases and sells financial futures contracts to manage cash flows and duration, enhance yield and to potentially reduce transaction costs. Upon entering into a financial futures contract with a broker, the Fund is required to deposit in a segregated account a specified amount of cash or U.S. government securities. Futures contracts are valued daily and unrealized gains or losses are recorded in a “variation margin” account. Daily, the Fund receives from or pays to the broker a specified amount of cash based upon changes in the variation margin account. When a contract is closed, the Fund recognizes a realized gain or loss. Futures contracts have market risks, including the risk that the change in the value of the contract may not correlate with the changes in the value of the underlying securities. There is minimal counterparty risk to the Fund since futures are exchange traded and the exchange's clearing house, as counterparty to all exchange traded futures, guarantees the futures against default.
At October 31, 2015, the Fund had no outstanding futures contracts.
Foreign Exchange Contracts
The Fund enters into foreign exchange contracts for the delayed delivery of securities or foreign currency exchange transactions. The Fund enters into foreign exchange contracts to protect assets against adverse changes in foreign currency exchange rates or exchange control regulations. Purchased contracts are used to acquire exposure to foreign currencies, whereas, contracts to sell are used to hedge the Fund's securities against currency fluctuations. Risks may arise upon entering into these transactions from the potential inability
Annual Shareholder Report
of counterparties to meet the terms of their commitments and from unanticipated movements in security prices or foreign exchange rates. The foreign exchange contracts are adjusted by the daily exchange rate of the underlying currency and any gains or losses are recorded for financial statement purposes as unrealized until the settlement date.
At October 31, 2015, the Fund had no outstanding foreign exchange contracts.
The average value at settlement date payable and receivable of foreign exchange contracts purchased and sold by the Fund throughout the period was $131 and $1,982, respectively. This is based on the contracts held as of each month-end throughout the fiscal period.
Foreign Currency Translation
The accounting records of the Fund are maintained in U.S. dollars. All assets and liabilities denominated in foreign currencies (FCs) are translated into U.S. dollars based on the rates of exchange of such currencies against U.S. dollars on the date of valuation. Purchases and sales of securities, income and expenses are translated at the rate of exchange quoted on the respective date that such transactions are recorded. The Fund does not isolate that portion of the results of operations resulting from changes in foreign exchange rates on investments from the fluctuations arising from changes in market prices of securities held. Such fluctuations are included with the net realized and unrealized gain or loss from investments.
Reported net realized foreign exchange gains or losses arise from sales of portfolio securities, sales and maturities of short-term securities, sales of FCs, currency gains or losses realized between the trade and settlement dates on securities transactions, the difference between the amounts of dividends, interest and foreign withholding taxes recorded on the Fund's books, and the U.S. dollar equivalent of the amounts actually received or paid. Net unrealized foreign exchange gains and losses arise from changes in the value of assets and liabilities other than investments in securities at fiscal year end, resulting from changes in the exchange rate.
Additional Disclosure Related to Derivative Instruments
The Effect of Derivative Instruments on the Statement of Operations for the Year Ended October 31, 2015
| Amount of Realized Gain or (Loss) on Derivatives Recognized in Income |
| | Forward
Currency
Contracts |
| Foreign exchange contracts | $5,036 |
Securities Lending
The Fund participates in a securities lending program providing for the lending of equity securities to qualified brokers. The Fund normally receives cash collateral for securities loaned that is invested in an affiliated money market fund or in short-term securities including repurchase agreements. Collateral is maintained at a minimum level of 100% of the market value of investments loaned, plus interest, if applicable. Earnings on collateral are allocated between the borrower of the security, the securities lending agent, as a fee for its services under the program and the Fund, according to agreed-upon rates.
Annual Shareholder Report
Securities lending transactions are subject to Master Netting Agreements which are agreements between the Fund and its counterparties that provide for the net settlement of all transactions and collateral with the Fund, through a single payment, in the event of default or termination. Amounts presented on the Portfolio of Investments and Statement of Assets and Liabilities are not net settlement amount but gross. As indicated below, the cash collateral received by the Fund exceeds the market value of the securities loaned reducing the net settlement amount to zero. The chart below identifies the amount of collateral received as well as the market value of securities on loan. Additionally, the securities lending agreement executed by the Fund includes an indemnification clause. This clause stipulates that the borrower will reimburse the Fund for any losses as a result of any failure of the borrower to return equivalent securities to the Fund.
As of October 31, 2015, securities subject to this type of arrangement and related collateral were as follows:
Market Value of
Securities Loaned | Market Value
of Collateral |
| $1,176,859,702 | $1,211,126,225 |
Restricted Securities
The Fund may purchase securities which are considered restricted. Restricted securities are securities that either: (a) cannot be offered for public sale without first being registered, or being able to take advantage of an exemption from registration, under the Securities Act of 1933; or (b) are subject to contractual restrictions on public sales. In some cases, when a security cannot be offered for public sale without first being registered, the issuer of the restricted security has agreed to register such securities for resale, at the issuer's expense, either upon demand by the Fund or in connection with another registered offering of the securities. Many such restricted securities may be resold in the secondary market in transactions exempt from registration. Restricted securities may be determined to be liquid under criteria established by the Trustees. The Fund will not incur any registration costs upon such resales. The Fund's restricted securities, like other securities, are priced in accordance with procedures established by and under the general supervision of the Trustees.
Annual Shareholder Report
Additional information on restricted securities, excluding securities purchased under Rule 144A that have been deemed liquid by the Trustees, if applicable, held at October 31, 2015, is as follows:
| Security | Acquisition Date | Cost | Market Value |
| Apollo Investment Fund V | 5/18/2001 | $0 | $374,619 |
| aTyr Pharma, Inc., Pfd., Series E | 3/31/2015 | $2,014,999 | $2,244,752 |
| BioNano Genomics, Inc., 3/31/2016 | 11/12/2014 | $2,908 | $582 |
| BioNano Genomics, Inc., Pfd., Series C | 11/12/2014 | $9,800,000 | $1,960,000 |
| Denovo Ventures I LP | 3/9/2000 | $2,210,578 | $82,218 |
| Expand Networks Ltd. | 9/22/2000 | $2,500,000 | $0 |
| FA Private Equity Fund IV LP | 3/4/2002 | $71,148 | $584,562 |
| Infrastructure Fund | 8/11/2000 | $404,496 | $0 |
| Latin Healthcare Fund | 11/28/2000 | $0 | $458,699 |
| Minerva Neurosciences, Inc. | 3/13/2015 | $10,197,200 | $11,108,800 |
| Multiplex, Inc., Pfd., Series C | 2/22/2001 | $5,000,001 | $0 |
| Peachtree Leadscope LLC | 6/30/2000 | $674,115 | $0 |
| Peachtree Open Networks | 10/5/2000 | $892,599 | $0 |
| Sensable Technologies, Inc. | 10/15/2004 | $0 | $0 |
| SteadyMed Ltd. | 1/26/2015 | $1,000,000 | $332,241 |
Other
The preparation of financial statements in conformity with GAAP requires management to make estimates and assumptions that affect the amounts of assets, liabilities, expenses and revenues reported in the financial statements. Actual results could differ from those estimated. The Fund applies Investment Company accounting and reporting guidance.
3. SHARES OF BENEFICIAL INTEREST
The following tables summarize share activity:
| Year Ended October 31 | 2015 | 2014 |
| Class A Shares: | Shares | Amount | Shares | Amount |
| Shares sold | 38,018,099 | $237,109,705 | 29,164,062 | $184,853,054 |
| Shares issued to shareholders in payment of distributions declared | 35,592,545 | 207,148,613 | 30,042,638 | 184,161,373 |
| Shares redeemed | (45,711,838) | (285,100,238) | (53,075,292) | (336,676,934) |
| NET CHANGE RESULTING FROM CLASS A SHARE TRANSACTIONS | 27,898,806 | $159,158,080 | 6,131,408 | $32,337,493 |
Annual Shareholder Report
| Year Ended October 31 | 2015 | 2014 |
| Class B Shares: | Shares | Amount | Shares | Amount |
| Shares sold | 2,230,689 | $12,510,599 | 1,885,469 | $10,967,974 |
| Shares issued to shareholders in payment of distributions declared | 3,499,669 | 18,233,272 | 3,744,894 | 20,971,407 |
| Shares redeemed | (7,717,708) | (43,126,207) | (11,229,301) | (64,984,855) |
| NET CHANGE RESULTING FROM CLASS B SHARE TRANSACTIONS | (1,987,350) | $(12,382,336) | (5,598,938) | $(33,045,474) |
| Year Ended October 31 | 2015 | 2014 |
| Class C Shares: | Shares | Amount | Shares | Amount |
| Shares sold | 9,311,606 | $51,326,976 | 6,214,246 | $35,647,153 |
| Shares issued to shareholders in payment of distributions declared | 10,764,151 | 55,973,588 | 8,988,817 | 50,337,374 |
| Shares redeemed | (13,148,648) | (73,097,107) | (14,649,164) | (84,954,471) |
| NET CHANGE RESULTING FROM CLASS C SHARE TRANSACTIONS | 6,927,109 | $34,203,457 | 553,899 | $1,030,056 |
| Year Ended October 31 | 2015 | 2014 |
| Class R Shares: | Shares | Amount | Shares | Amount |
| Shares sold | 12,561,731 | $78,481,553 | 10,541,810 | $66,682,719 |
| Shares issued to shareholders in payment of distributions declared | 81,658,916 | 476,068,825 | 68,506,356 | 420,629,023 |
| Shares redeemed | (51,098,433) | (319,821,892) | (58,705,702) | (374,737,172) |
| NET CHANGE RESULTING FROM CLASS R SHARE TRANSACTIONS | 43,122,214 | $234,728,486 | 20,342,464 | $112,574,570 |
| NET CHANGE RESULTING FROM TOTAL FUND SHARE TRANSACTIONS | 75,960,779 | $415,707,687 | 21,428,833 | $112,896,645 |
Redemption Fee
The Fund's Class R Shares imposes a redemption fee of 0.20% on the redemption price of the Fund's Class R Shares redeemed, if such shares were purchased after February 1, 1985. The redemption fee is applied to the Fund's Class R Shares expenses for providing redemption services, including, but not limited to: transfer agent fees, postage, printing, telephone and related employment costs. Any excess fee proceeds are added to the Fund's assets. Excess fee proceeds, if any, are added to the Fund's assets. Shares acquired through employer-sponsored retirement plans will not be subject to the redemption fee. However, if shares are purchased for a retirement plan account through a broker, financial institution or other intermediary maintaining an omnibus account for the shares, the waiver may not apply. In addition, this waiver does not apply to individual retirement accounts, such as Traditional, Roth and SEP-IRAs. For the year ended October 31, 2015 and October 31, 2014, redemption fees of $496,244 and $508,175, respectively, were allocated to cover the cost of redemptions.
Annual Shareholder Report
4. FEDERAL TAX INFORMATION
The timing and character of income and capital gain distributions are determined in accordance with income tax regulations, which may differ from GAAP. These differences are primarily due to differing treatments for foreign currency transactions, partnership adjustments, passive foreign investment company gains and losses and equalization.
For the year ended October 31, 2015, permanent differences identified and reclassified among the components of net assets were as follows:
| Increase (Decrease) |
| Paid-In Capital | Undistributed
Net Investment
Income (Loss) | Accumulated
Net Realized
Gain (Loss) |
| $1,948 | $845,579 | $(847,527) |
Net investment income (loss), net realized gains (losses), and net assets were not affected by this reclassification.
The tax character of distributions as reported on the Statement of Changes in Net Assets for the years ended October 31, 2015 and 2014, was as follows:
| | 2015 | 2014 |
| Ordinary income1 | $1,624,286 | $— |
| Long-term capital gains | $811,442,799 | $721,625,683 |
| 1 | For tax purposes, short-term capital gain distributions are considered ordinary income distributions. |
As of October 31, 2015, the components of distributable earnings on a tax basis were as follows:
| Undistributed long-term capital gains | $796,272,871 |
| Net unrealized appreciation | $1,644,386,350 |
| Capital loss carryforwards and deferrals | $(63,648,208) |
The difference between book-basis and tax-basis net unrealized appreciation/depreciation is attributable to differing treatments for passive foreign investment company gains and losses, the deferral of losses on wash sales and partnership adjustments.
At October 31, 2015, the cost of investments for federal tax purposes was $5,111,833,052. The net unrealized appreciation of investments for federal tax purposes excluding any unrealized depreciation resulting from the translation from FCs to U.S. dollars of assets and liabilities other than investments in securities was $1,644,386,527. This consists of net unrealized appreciation from investments for those securities having an excess of value over cost of $1,812,538,176 and net unrealized depreciation from investments for those securities having an excess of cost over value of $168,151,649.
Under current tax rules, a late-year ordinary loss may be deferred, in whole or in part, and treated as occurring on the first day of the following fiscal year. As of October 31, 2015, for federal income tax purposes, a late year ordinary loss of $63,648,208 was deferred to November 1, 2015.
Annual Shareholder Report
5. INVESTMENT ADVISER FEE AND OTHER TRANSACTIONS WITH AFFILIATES
Investment Adviser Fee
The advisory agreement between the Fund and the Adviser provides for an annual fee equal to 1.30% of the Fund's average daily net assets. Prior to June 27, 2014, the annual advisory fee was 1.425% of the Fund's average daily net assets. Pursuant to the settlement of certain litigation, the Adviser has agreed, for a period continuing through June 30, 2022, to waive its investment advisory fee so that such fee will not exceed 1.275%. Also, as part of the settlement agreement, effective July 1, 2012 and continuing through June 30, 2022, the Adviser has agreed to further waive the advisory fee by an additional 0.02%, 0.04%, 0.06% or 0.07% if the Fund's net assets exceed eight, nine, ten or twelve billion dollars, respectively. Subject to the terms described in the Expense Limitation note, the Adviser may voluntarily choose to waive any portion of its fee. For the year ended October 31, 2015, the Adviser voluntarily waived $480,222 of its fee.
Certain of the Fund's assets are managed by Federated Global Investment Management Corp. (the “Sub-Adviser”). Under the terms of a sub-advisory agreement between the Adviser and the Sub-Adviser, the Sub-Adviser receives an allocable portion of the Fund's adviser fee. The fee is paid by the Adviser out of its resources and is not an incremental Fund expense. For the year ended October 31, 2015, the Sub-Adviser earned a fee of $62,007,200.
Administrative Fee
Federated Administrative Services (FAS), under the Administrative Services Agreement, provides the Fund with administrative personnel and services. For purposes of determining the appropriate rate breakpoint, “Investment Complex” is defined as all of the Federated Funds subject to a fee under the Administrative Services Agreement. The fee paid to FAS is based on the average daily net assets of the Investment Complex as specified below, plus certain out-of-pocket expenses:
| Administrative Fee | Average Daily Net Assets
of the Investment Complex |
| 0.150% | on the first $5 billion |
| 0.125% | on the next $5 billion |
| 0.100% | on the next $10 billion |
| 0.075% | on assets in excess of $20 billion |
Subject to the terms described in the Expense Limitation note, FAS may voluntarily choose to waive any portion of its fee. For the year ended October 31, 2015, the annualized fee paid to FAS was 0.078% of average daily net assets of the Fund.
Annual Shareholder Report
Distribution Services Fee
The Fund has adopted a Distribution Plan (the “Plan”) pursuant to Rule 12b-1 under the Act. Under the terms of the Plan, the Fund will compensate Federated Securities Corp. (FSC), the principal distributor, from the daily net assets of the Fund's Class A Shares, Class B Shares, Class C Shares and Class R Shares to finance activities intended to result in the sale of these shares. The Plan provides that the Fund may incur distribution expenses at the following percentages of average daily net assets annually, to compensate FSC:
| Share Class Name | Percentage of Average Daily
Net Assets of Class |
| Class A Shares | 0.25% |
| Class B Shares | 0.75% |
| Class C Shares | 0.75% |
| Class R Shares | 0.50% |
Subject to the terms described in the Expense Limitation note, FSC may voluntarily choose to waive any portion of its fee. For the year ended October 31, 2015, distribution services fees for the Fund were as follows:
| | Distribution Services
Fees Incurred | Distribution Services
Fees Waived |
| Class A Shares | $4,071,048 | $(422,477) |
| Class B Shares | 863,784 | — |
| Class C Shares | 3,275,172 | — |
| Class R Shares | 18,156,596 | (9,590,202) |
| TOTAL | $26,366,600 | $(10,012,679) |
When FSC receives fees, it may pay some or all of them to financial intermediaries whose customers purchase shares. For the year ended October 31, 2015, FSC retained $12,409,450 of fees paid by the Fund.
Sales Charges
Front-end sales charges and contingent deferred sales charges (CDSC) do not represent expenses of the Fund. They are deducted from the proceeds of sales of Fund shares prior to investment or from redemption proceeds prior to remittance, as applicable. For the year ended October 31, 2015, FSC retained $147,882 in sales charges from the sale of Class A Shares. FSC also retained $2,828 of CDSC relating to redemptions of Class A Shares, $103,014 relating to redemptions of Class B Shares and $10,383 relating to redemptions of Class C Shares.
Other Service Fees
For the year ended October 31, 2015 FSSC received $6,538,712 of other service fees disclosed in Note 2.
Annual Shareholder Report
Commitments and Contingencies
In the course of pursuing its investment objective, the Fund sometimes invests in limited partnerships and limited liability companies. These entities often require the Fund to commit to a total dollar amount to be invested. The actual investments are usually made in installments over a period of time. At October 31, 2015, the Fund had total commitments to limited partnerships and limited liability companies of $41,000,000; of this amount, $40,299,969 was actually invested by the Fund leaving the Fund contingently liable for additional investments of $700,031.
Expense Limitation
The Adviser and certain of its affiliates (which may include FSC, FAS and FSSC) on their own initiative have agreed to waive certain amounts of their respective fees and/or reimburse expenses. Total annual fund operating expenses (as shown in the financial highlights, excluding expenses allocated from affiliated partnerships, extraordinary expenses and proxy-related expenses paid by the Fund, if any) paid by the Fund's Class A Shares, Class B Shares, Class C Shares and Class R Shares (after the voluntary waivers and/or reimbursements) will not exceed 1.95%, 2.50%, 2.50% and 1.95% (the “Fee Limit”), respectively, up to but not including the later of (the “Termination Date”): (a) January 1, 2017; or (b) the date of the Fund's next effective Prospectus. While the Adviser and its applicable affiliates currently do not anticipate terminating or increasing these arrangements prior to the Termination Date, these arrangements may only be terminated or the Fee Limit increased prior to the Termination Date with the agreement of the Trustees.
Interfund Transactions
During the year ended October 31, 2015, the Fund engaged in purchase and sale transactions with funds that have a common investment adviser (or affiliated investment advisers), common Directors/Trustees, and/or common Officers. These purchase and sale transactions complied with Rule 17a-7 under the Act and amounted to $40,385,519 and $77,383,414, respectively.
General
Certain Officers and Trustees of the Fund are Officers and Directors or Trustees of certain of the above companies. To efficiently facilitate payment, Directors'/Trustees' fees and certain expenses related to conducting meetings of the Directors/Trustees and other miscellaneous expenses are paid by an affiliate of the Adviser which in due course are reimbursed by the Fund. Such expenses may be included in Accrued and Miscellaneous Expenses on the Statement of Assets and Liabilities and Statement of Operations, respectively.
Annual Shareholder Report
Transactions Involving Affiliated Companies and Affiliated Holdings
An affiliated company is a company in which the Fund, alone or in combination with other affiliated funds, has ownership of at least 5% of the voting shares. Transactions with affiliated companies during the year ended October 31, 2015, were as follows:
| Affiliates | Balance of
Shares Held
10/31/2014 | Purchases/
Additions | Sales/
Reductions | Balance of
Shares Held
10/31/2015 | Value | Dividend/
Interest
Income |
| BioDelivery Sciences International, Inc. | 3,857,147 | 728,853 | (2,161,000) | 2,425,000 | $13,046,500 | $— |
| Catalyst Pharmaceutical Partners, Inc. | — | 3,000,000 | — | 3,000,000 | 9,480,000 | — |
| ChannelAdvisor Corp. | 1,526,423 | 192,157 | (518,580) | 1,200,000 | 10,464,000 | — |
Corcept
Therapeutics, Inc. | 11,152,915 | 1,287,053 | — | 12,439,968 | 45,903,482 | — |
**Corcept
Therapeutics, Inc., 3/29/2015 | 797,358 | — | (797,358) | — | — | — |
| *Dexcom, Inc. | 3,389,253 | — | (1,509,253) | 1,880,000 | 156,641,600 | — |
| *Dexcom, Inc. | 126,065 | — | — | 126,065 | 10,503,736 | — |
| Dyax Corp. | 12,850,000 | — | (3,850,000) | 9,000,000 | 247,770,000 | — |
| Dynavax Technologies Corp. | — | 1,816,759 | — | 1,816,759 | 41,258,597 | — |
| **Dynavax Technologies Corp. | 11,744,600 | — | (11,744,600) | — | — | — |
| **Dynavax Technologies Corp., 4/16/2015 | 2,750,000 | — | (2,750,000) | — | — | — |
| Egalet Corp. | 973,774 | 596,726 | (30,500) | 1,540,000 | 12,782,000 | — |
| ExamWorks Group, Inc. | 2,300,783 | — | (200,783) | 2,100,000 | 59,304,000 | — |
| Galapagos NV | 637,932 | 602,068 | — | 1,240,000 | 59,830,909 | — |
| Galapagos NV, ADR | — | 956,807 | — | 956,807 | 45,926,736 | — |
| Ocular Therapeutix, Inc. | — | 1,400,000 | (108,573) | 1,291,427 | 11,145,015 | — |
| Otonomy, Inc. | 244,800 | 820,559 | (162,892) | 902,467 | 19,529,386 | — |
| Otonomy, Inc. | 409,891 | — | (1) | 409,890 | 8,870,020 | — |
| Minerva Neurosciences, Inc. | — | 2,120,000 | — | 2,120,000 | 11,108,800 | — |
| Minerva Neurosciences, Inc., 3/18/2017 | — | 2,120,000 | — | 2,120,000 | 2,212,432 | — |
| Premier, Inc. | 1,500,000 | 500,000 | (608,373) | 1,391,627 | 47,050,909 | — |
| Progenics Pharmaceuticals, Inc. | 10,604,711 | 696,889 | — | 11,301,600 | 82,953,744 | — |
Annual Shareholder Report
| Affiliates | Balance of
Shares Held
10/31/2014 | Purchases/
Additions | Sales/
Reductions | Balance of
Shares Held
10/31/2015 | Value | Dividend/
Interest
Income |
| **Protalix Biotherapeutics, Inc. | 8,014,125 | 344,600 | (8,358,725) | — | — | — |
*Protalix Biotherapeutics, Inc., Conv.Bond, Series 144A
4.50%, 9/15/2018 | 4,600,000 | — | — | 4,600,000 | 3,380,066 | 207,000 |
| *RPX Corp. | 2,650,000 | — | (1,400,000) | 1,250,000 | 17,800,000 | — |
| Soteira, Inc. | 959,018 | — | — | 959,018 | 0 | — |
| SCYNEXIS, Inc. | — | 750,000 | — | 750,000 | 4,792,500 | — |
| SteadyMed Ltd. | — | 1,200,000 | — | 1,200,000 | 3,384,000 | — |
| SteadyMed Ltd. | — | 117,816 | — | 117,816 | 332,241 | — |
| Textura Corp. | 2,950,000 | 103,500 | (353,500) | 2,700,000 | 79,272,000 | — |
| Threshold Pharmaceuticals, Inc., Class THL | 3,480,798 | — | (19,753) | 3,461,045 | 13,186,581 | — |
| Zogenix, Inc. | — | 1,739,000 | (2) | 1,738,998 | 20,502,786 | |
| **Zogenix, Inc. | 20,720,476 | 1,005,800 | (21,726,276) | — | — | — |
| Zogenix, Inc., 7/27/2017 | 7,425,000 | — | — | 7,425,000 | 5,585,827 | — |
| Zynerba Pharmaceuticals, Inc. | — | 254,900 | | 254,900 | 3,209,191 | — |
TOTAL OF AFFILIATED
COMPANIES | 115,665,069 | 22,353,487 | (56,300,169) | 81,718,387 | $1,047,227,058 | $207,000 |
| * | At October 31, 2015, the Fund no longer has ownership of at least 5% of the voting shares. |
| ** | At October 31, 2015, the security is no longer held in the Fund's portfolio of investments. |
| | |
Affiliated holdings are investment companies which are managed by the Adviser or an affiliate of the Adviser. The Adviser has agreed to reimburse the Fund for certain investment adviser fees as a result of transactions in other affiliated investment companies. For the year ended October 31, 2015, the Adviser reimbursed $975,002. Transactions involving the affiliated holdings during the six months ended October 31, 2015, were as follows:
| | Federated
Money Market
Management,
Institutional
Shares | Federated
Prime Value
Obligations
Fund,
Institutional
Shares | Total of
Affiliated
Transactions |
| Balance of Shares Held 10/31/2014 | 925,547,146 | 239,264,481 | 1,164,811,627 |
| Purchases/Additions | 4,312,030,665 | 2,151,079,142 | 6,463,109,807 |
| Sales/Reductions | (4,026,451,586) | (1,738,250,306) | (5,764,701,892) |
Annual Shareholder Report
| | Federated
Money Market
Management,
Institutional
Shares | Federated
Prime Value
Obligations
Fund,
Institutional
Shares | Total of
Affiliated
Transactions |
| Balance of Shares Held 10/31/2015 | 1,211,126,225 | 652,093,317 | 1,863,219,542 |
| Value | $1,211,126,225 | $652,093,317 | $1,863,219,542 |
| Dividend Income | $1,134,708 | $366,007 | $1,500,715 |
6. EXPENSE Reduction
The Fund directs portfolio trades to a broker that in turn pays a portion of the Fund's operating expenses. For the year ended October 31, 2015, the Fund's expenses were reduced by $40,154 under these arrangements.
7. Investment TRANSACTIONS
Purchases and sales of investments, excluding long-term U.S. government securities and short-term obligations, for the year ended October 31, 2015, were as follows:
| Purchases | $2,743,302,745 |
| Sales | $3,564,622,443 |
8. CONCENTRATION OF RISK
The Fund invests in securities of non-U.S. issuers. Political or economic developments may have an effect on the liquidity and volatility of portfolio securities and currency holdings.
At October 31, 2015, the diversification of countries was as follows:
| Country | Percentage of
Net Assets |
| United States | 74.0% |
| Netherlands | 2.0% |
| Belgium | 1.9% |
| United Kingdom | 1.8% |
| Israel | 1.2% |
| Singapore | 1.2% |
| Ireland | 1.1% |
| Luxembourg | 1.0% |
| Spain | 1.0% |
| China | 0.9% |
| Italy | 0.8% |
| France | 0.7% |
| Cayman Islands | 0.3% |
| Canada | 0.1% |
| India | 0.1% |
Annual Shareholder Report
9. LINE OF CREDIT
The Fund participates in a $100,000,000 unsecured, uncommitted revolving line of credit (LOC) agreement with PNC Bank. The LOC was made available for extraordinary or emergency purposes, primarily for financing redemption payments. Borrowings are charged interest at a rate offered to the Fund by PNC Bank at the time of the borrowing. As of October 31, 2015, there were no outstanding loans. During the year ended October 31, 2015, the Fund did not utilize the LOC.
10. INTERFUND LENDING
Pursuant to an Exemptive Order issued by the Securities and Exchange Commission (SEC), the Fund, along with other funds advised by subsidiaries of Federated Investors, Inc., may participate in an interfund lending program. This program provides an alternative credit facility allowing the Fund to borrow from other participating affiliated funds. As of October 31, 2015, there were no outstanding loans. During the year ended October 31, 2015, the program was not utilized.
11. FEDERAL TAX INFORMATION (UNAUDITED)
For the year ended October 31, 2015, the amount of long-term capital gains designated by the Fund was $811,442,799.
For the fiscal year ended October 31, 2015, 100.00% of total ordinary income (including short-term capital gain) distributions made by the Fund are qualifying dividends which may be subject to a maximum tax rate of 15%, as provided for by the Jobs and Growth Tax Relief Act of 2003. Complete information is reported in conjunction with the reporting of your distributions on Form 1099-DIV.
Of the ordinary income (including short-term capital gain) distributions made by the Fund during the year ended October 31, 2015, 100.00% qualify for the dividend received deduction available to corporate shareholders.
Annual Shareholder Report
Report of Independent Registered Public Accounting Firm
TO THE BOARD OF Trustees OF Federated Equity Funds AND SHAREHOLDERS OF Federated Kaufmann Fund, Class A, B and C Shares:
We have audited the accompanying statement of assets and liabilities of Federated Kaufmann Fund (the “Fund”) (one of the portfolios constituting Federated Equity Funds), including the portfolio of investments, as of October 31, 2015, and the related statement of operations for the year then ended, the statement of changes in net assets for each of the two years in the period then ended, and the financial highlights of Class A, B and C Shares for each of the five years in the period then ended. These financial statements and financial highlights are the responsibility of the Fund's management. Our responsibility is to express an opinion on these financial statements and financial highlights based on our audits.
We conducted our audits in accordance with standards of the Public Company Accounting Oversight Board (United States). Those standards require that we plan and perform the audit to obtain reasonable assurance about whether the financial statements and financial highlights are free of material misstatement. We were not engaged to perform an audit of the Fund's internal control over financial reporting. Our audits included consideration of internal control over financial reporting as a basis for designing audit procedures that are appropriate in the circumstances, but not for the purpose of expressing an opinion on the effectiveness of the Fund's internal control over financial reporting. Accordingly, we express no such opinion. An audit also includes examining, on a test basis, evidence supporting the amounts and disclosures in the financial statements and financial highlights, assessing the accounting principles used and significant estimates made by management, and evaluating the overall financial statement presentation. Our procedures included confirmation of securities owned as of October 31, 2015, by correspondence with the custodian and others or by other appropriate auditing procedures where replies from others were not received. We believe that our audits provide a reasonable basis for our opinion.
In our opinion, the financial statements and financial highlights referred to above present fairly, in all material respects, the financial position of the Federated Kaufmann Fund, a portfolio of Federated Equity Funds, at October 31, 2015, the results of its operations for the year then ended, the changes in its net assets for each of the two years in the period then ended, and the financial highlights of Classes A, B and C Shares for each of the five years in the period then ended, in conformity with U.S. generally accepted accounting principles.
Boston, Massachusetts
December 23, 2015
Annual Shareholder Report
Shareholder Expense Example (unaudited)
As a shareholder of the Fund, you incur two types of costs: (1) transaction costs, including sales charges (loads) on purchase or redemption payments; and (2) ongoing costs, including management fees and to the extent applicable, distribution (12b-1) fees and/or other service fees and other Fund expenses. This Example is intended to help you to understand your ongoing costs (in dollars) of investing in the Fund and to compare these costs with the ongoing costs of investing in other mutual funds. It is based on an investment of $1,000 invested at the beginning of the period and held for the entire period from May 1, 2015 to October 31, 2015.
ACTUAL EXPENSES
The first section of the table below provides information about actual account values and actual expenses. You may use the information in this section, together with the amount you invested, to estimate the expenses that you incurred over the period. Simply divide your account value by $1,000 (for example, an $8,600 account value divided by $1,000 = 8.6), then multiply the result by the number in the first section under the heading entitled “Expenses Paid During Period” to estimate the expenses attributable to your investment during this period.
HYPOTHETICAL EXAMPLE FOR COMPARISON PURPOSES
The second section of the table below provides information about hypothetical account values and hypothetical expenses based on the Fund's actual expense ratio and an assumed rate of return of 5% per year before expenses, which is not the Fund's actual return. Thus, you should not use the hypothetical account values and expenses to estimate the actual ending account balance or your expenses for the period. Rather, these figures are required to be provided to enable you to compare the ongoing costs of investing in the Fund with other funds. To do so, compare this 5% hypothetical example with the 5% hypothetical examples that appear in the shareholder reports of the other funds.
Annual Shareholder Report
Please note that the expenses shown in the table are meant to highlight your ongoing costs only and do not reflect any transaction costs, such as sales charges (loads) on purchase or redemption payments. Therefore, the second section of the table is useful in comparing ongoing costs only, and will not help you determine the relative total costs of owning different funds. In addition, if these transaction costs were included, your costs would have been higher.
| | Beginning
Account Value
5/1/2015 | Ending
Account Value
10/31/2015 | Expenses Paid
During Period1 |
| Actual: | | | |
| Class A Shares | $1,000 | $969.40 | $9.68 |
| Class B Shares | $1,000 | $965.80 | $12.29 |
| Class C Shares | $1,000 | $967.50 | $12.30 |
Hypothetical (assuming a 5% return
before expenses): | | | |
| Class A Shares | $1,000 | $1,015.38 | $9.91 |
| Class B Shares | $1,000 | $1,012.70 | $12.58 |
| Class C Shares | $1,000 | $1,012.70 | $12.58 |
| 1 | Expenses are equal to the Fund's annualized net expense ratios, multiplied by the average account value over the period, multiplied by 184/365 (to reflect the one-half-year period). The annualized net expense ratios are as follows: |
| | |
| Class A Shares | 1.95% |
| Class B Shares | 2.48% |
| Class C Shares | 2.48% |
Annual Shareholder Report
Board of Trustees and Trust Officers
The Board of Trustees is responsible for managing the Trust business affairs and for exercising all the Trust powers except those reserved for the shareholders. The following tables give information about each Trustee and the senior officers of the Fund. Where required, the tables separately list Trustees who are “interested persons” of the Fund (i.e., “Interested” Trustees) and those who are not (i.e., “Independent” Trustees). Unless otherwise noted, the address of each person listed is Federated Investors Tower, 1001 Liberty Avenue, Pittsburgh, PA 15222. The address of all Independent Trustees listed is 4000 Ericsson Drive, Warrendale, PA 15086-7561; Attention: Mutual Fund Board. As of December 31, 2014, the Trust comprised 14 portfolio(s), and the Federated Fund Family consisted of 40 investment companies (comprising 131 portfolios). Unless otherwise noted, each Officer is elected annually. Unless otherwise noted, each Trustee oversees all portfolios in the Federated Fund Family and serves for an indefinite term. The Fund's Statement of Additional Information includes additional information about Trust Trustees and is available, without charge and upon request, by calling 1-800-341-7400.
Interested TRUSTEES Background
Name
Birth Date
Positions Held with Trust
Date Service Began | Principal Occupation(s) for Past Five Years,
Other Directorships Held and Previous Position(s) |
John F. Donahue*
Birth Date: July 28, 1924
Trustee
Indefinite Term
Began serving: April 1984 | Principal Occupations: Director or Trustee of the Federated Fund Family; Chairman and Director, Federated Investors, Inc.; Chairman of the Federated Fund Family's Executive Committee.
Previous Positions: Chairman of the Federated Fund Family; Trustee, Federated Investment Management Company; Chairman and Director, Federated Investment Counseling. |
J. Christopher Donahue*
Birth Date: April 11, 1949
President and Trustee
Indefinite Term
Began serving: January 2000 | Principal Occupations: Principal Executive Officer and President of certain of the Funds in the Federated Fund Family; Director or Trustee of the Funds in the Federated Fund Family; President, Chief Executive Officer and Director, Federated Investors, Inc.; Chairman and Trustee, Federated Investment Management Company; Trustee, Federated Investment Counseling; Chairman and Director, Federated Global Investment Management Corp.; Chairman, Federated Equity Management Company of Pennsylvania and Passport Research, Ltd. (investment advisory subsidiary of Federated); Trustee, Federated Shareholder Services Company; Director, Federated Services Company.
Previous Positions: President, Federated Investment Counseling; President and Chief Executive Officer, Federated Investment Management Company, Federated Global Investment Management Corp. and Passport Research, Ltd. |
| * | Family relationships and reasons for “interested” status: John F. Donahue is the father of J. Christopher Donahue; both are “interested” due to their beneficial ownership of shares of Federated Investors, Inc. and the positions they hold with Federated and its subsidiaries. |
Annual Shareholder Report
INDEPENDENT TRUSTEES Background
Name
Birth Date
Positions Held with Trust
Date Service Began | Principal Occupation(s) for Past Five Years,
Other Directorships Held, Previous Position(s) and Qualifications |
John T. Collins
Birth Date: January 24, 1947
Trustee
Indefinite Term
Began serving: October 2013 | Principal Occupations: Director or Trustee of the Federated Fund Family; Chairman and CEO, The Collins Group, Inc. (a private equity firm).
Other Directorships Held: Director, Chair of the Compensation Committee, Audit Committee member, KLX Corp.
Qualifications: Mr. Collins has served in several business and financial management roles and directorship positions throughout his career. Mr. Collins serves as Chairman Emeriti, Bentley University. Mr. Collins previously served as Director, FleetBoston Financial Corp.; Director and Audit Committee Member, Bank of America Corp. and Director, Beth Israel Deaconess Medical Center (Harvard University Affiliate Hospital). |
G. Thomas Hough
Birth Date: February 28, 1955
Trustee
Indefinite Term
Began serving: August 2015 | Principal Occupations: Director or Trustee of the Federated Fund Family; Retired.
Other Directorships Held: Director, Chair of the Audit Committee, Governance Committee, Publix Super Markets, Inc.
Qualifications: Mr. Hough has served in accounting, business management and directorship positions throughout his career. Mr. Hough most recently held the position of Americas Vice Chair of Assurance with Ernst & Young LLP. Mr. Hough is an Executive Committee member of the United States Golf Association, he serves on the President's Cabinet and Business School Board of Visitors for the University of Alabama and is on the Business School Board of Visitors for Wake Forest University. |
Maureen Lally-Green
Birth Date: July 5, 1949
Trustee
Indefinite Term
Began serving: August 2009 | Principal Occupations: Director or Trustee of the Federated Fund Family; Adjunct Professor of Law, Duquesne University School of Law.
Other Directorships Held: Director, CONSOL Energy Inc.
Qualifications: Judge Lally-Green has served in various legal and business roles and directorship positions throughout her career. Judge Lally-Green previously served as: Associate General Secretary, Diocese of Pittsburgh; Professor of Law, Duquesne University School of Law and was a member of the Superior Court of Pennsylvania. Judge Lally-Green also holds the positions of: Member, Pennsylvania State Board of Education; Director, Saint Vincent College; Director and Chair, UPMC Mercy Hospital; Regent, St. Vincent Seminary; Director, Epilepsy Foundation of Western and Central Pennsylvania; Director, Our Campaign for the Church Alive!, Inc.; Director, Pennsylvania Bar Institute; and Director, Cardinal Wuerl North Catholic High School, Inc. Judge Lally-Green has held the positions of: Director, Auberle; Director, Ireland Institute of Pittsburgh; Director, Saint Thomas More Society; and Director, Catholic High Schools of the Diocese of Pittsburgh, Inc. |
Annual Shareholder Report
Name
Birth Date
Positions Held with Trust
Date Service Began | Principal Occupation(s) for Past Five Years,
Other Directorships Held, Previous Position(s) and Qualifications |
Peter E. Madden
Birth Date: March 16, 1942
Trustee
Indefinite Term
Began serving: November 1991 | Principal Occupation: Director or Trustee, and Chair of the Board of Directors or Trustees, of the Federated Fund Family; Retired.
Other Directorships Held: None.
Qualifications: Mr. Madden has served in several business management, mutual fund services and directorship positions throughout his career. Mr. Madden previously served as President, Chief Operating Officer and Director, State Street Bank and Trust Company (custodian bank) and State Street Corporation (financial services). He was Director, VISA USA and VISA International and Chairman and Director, Massachusetts Bankers Association. Mr. Madden served as Director, Depository Trust Corporation and Director, The Boston Stock Exchange. Mr. Madden also served as a Representative to the Commonwealth of Massachusetts General Court. |
Charles F. Mansfield, Jr.
Birth Date: April 10, 1945
Trustee
Indefinite Term
Began serving: January 1999 | Principal Occupations: Director or Trustee of the Federated Fund Family; Management Consultant.
Other Directorships Held: None.
Qualifications: Mr. Mansfield has served in several banking, business management and educational roles and directorship positions throughout his career. Mr. Mansfield previously served as Chief Executive Officer, PBTC International Bank; Partner, Arthur Young & Company (now Ernst & Young LLP); Chief Financial Officer of Retail Banking Sector, Chase Manhattan Bank; Senior Vice President, HSBC Bank USA (formerly, Marine Midland Bank); Vice President, Citibank; Assistant Professor of Banking and Finance, Frank G. Zarb School of Business, Hofstra University; Executive Vice President DVC Group, Inc. (marketing, communications and technology). |
Thomas M. O'Neill
Birth Date: June 14, 1951
Trustee
Indefinite Term
Began serving: October 2006 | Principal Occupations: Director or Trustee, Vice Chair of the Audit Committee of the Federated Fund Family; Sole Proprietor, Navigator Management Company (investment and strategic consulting).
Other Directorships Held: None.
Qualifications: Mr. O'Neill has served in several business, mutual fund and financial management roles and directorship positions throughout his career. Mr. O'Neill serves as Director, Medicines for Humanity and Director, The Golisano Children's Museum of Naples, Florida. Mr. O'Neill previously served as Chief Executive Officer and President, Managing Director and Chief Investment Officer, Fleet Investment Advisors; President and Chief Executive Officer, Aeltus Investment Management, Inc.; General Partner, Hellman, Jordan Management Co., Boston, MA; Chief Investment Officer, The Putnam Companies, Boston, MA; Credit Analyst and Lending Officer, Fleet Bank; Director and Consultant, EZE Castle Software (investment order management software); and Director, Midway Pacific (lumber). |
Annual Shareholder Report
Name
Birth Date
Positions Held with Trust
Date Service Began | Principal Occupation(s) for Past Five Years,
Other Directorships Held, Previous Position(s) and Qualifications |
P. Jerome Richey
Birth Date: February 23, 1949
Trustee
Indefinite Term
Began serving: October 2013 | Principal Occupations: Director or Trustee of the Federated Fund Family; Management Consultant.
Other Directorships Held: None.
Qualifications: Mr. Richey has served in several business and legal management roles and directorship positions throughout his career. Mr. Richey most recently held the positions of Senior Vice Chancellor and Chief Legal Officer, University of Pittsburgh. Mr. Richey serves as Board Member, Epilepsy Foundation of Western Pennsylvania and Board member, World Affairs Council of Pittsburgh. Mr. Richey previously served as Chief Legal Officer and Executive Vice President, CONSOL Energy Inc. and Shareholder, Buchanan Ingersoll & Rooney PC (a law firm). |
John S. Walsh
Birth Date: November 28, 1957
Trustee
Indefinite Term
Began serving: January 1999 | Principal Occupations: Director or Trustee, Chair of the Audit Committee of the Federated Fund Family; President and Director, Heat Wagon, Inc. (manufacturer of construction temporary heaters); President and Director, Manufacturers Products, Inc. (distributor of portable construction heaters); President, Portable Heater Parts, a division of Manufacturers Products, Inc.
Other Directorships Held: None.
Qualifications: Mr. Walsh has served in several business management roles and directorship positions throughout his career. Mr. Walsh previously served as Vice President, Walsh & Kelly, Inc. (paving contractors). |
OFFICERS
Name
Birth Date
Address
Positions Held with Trust
Date Service Began | Principal Occupation(s) for Past Five Years
and Previous Position(s) |
John W. McGonigle
Birth Date: October 26, 1938
EXECUTIVE VICE PRESIDENT AND SECRETARY
Officer since: April 1984 | Principal Occupations: Executive Vice President and Secretary of the Federated Fund Family; Vice Chairman, Executive Vice President, Secretary and Director, Federated Investors, Inc.
Previous Positions: Trustee, Federated Investment Management Company and Federated Investment Counseling; Director, Federated Global Investment Management Corp., Federated Services Company and Federated Securities Corp. |
Annual Shareholder Report
Name
Birth Date
Address
Positions Held with Trust
Date Service Began | Principal Occupation(s) for Past Five Years
and Previous Position(s) |
Lori A. Hensler
Birth Date: January 6, 1967
TREASURER
Officer since: April 2013 | Principal Occupations: Principal Financial Officer and Treasurer of the Federated Fund Family; Senior Vice President, Federated Administrative Services; Financial and Operations Principal for Federated Securities Corp. and Edgewood Services, Inc.; and Assistant Treasurer, Federated Investors Trust Company. Ms. Hensler has received the Certified Public Accountant designation.
Previous Positions: Controller of Federated Investors, Inc.; Senior Vice President and Assistant Treasurer, Federated Investors Management Company; Treasurer, Federated Investors Trust Company; Assistant Treasurer, Federated Administrative Services, Federated Administrative Services, Inc., Federated Securities Corp., Edgewood Services, Inc., Federated Advisory Services Company, Federated Equity Management Company of Pennsylvania, Federated Global Investment Management Corp., Federated Investment Counseling, Federated Investment Management Company, Passport Research, Ltd., and Federated MDTA, LLC; Financial and Operations Principal for Federated Securities Corp., Edgewood Services, Inc. and Southpointe Distribution Services, Inc. |
Richard B. Fisher
Birth Date: May 17, 1923
Vice President
Officer since: April 1984 | Principal Occupations: Vice Chairman or Vice President of some of the Funds in the Federated Fund Family; Vice Chairman, Federated Investors, Inc.; Chairman, Federated Securities Corp.
Previous Positions: President and Director or Trustee of some of the Funds in the Federated Fund Family; Executive Vice President, Federated Investors, Inc.; Director and Chief Executive Officer, Federated Securities Corp. |
Peter J. Germain
Birth Date: September 3, 1959
CHIEF LEGAL OFFICER
Officer since: January 2005
| Principal Occupations: Mr. Germain is Chief Legal Officer of the Federated Fund Family. He is General Counsel and Vice President, Federated Investors, Inc.; President, Federated Administrative Services and Federated Administrative Services, Inc.; Vice President, Federated Securities Corp.; Secretary, Federated Private Asset Management, Inc.; and Secretary, Retirement Plan Service Company of America. Mr. Germain joined Federated in 1984 and is a member of the Pennsylvania Bar Association.
Previous Positions: Deputy General Counsel, Special Counsel, Managing Director of Mutual Fund Services, Federated Investors, Inc.; Senior Vice President, Federated Services Company; and Senior Corporate Counsel, Federated Investors, Inc. |
Stephen Van Meter
Birth Date: June 5, 1975
CHIEF COMPLIANCE OFFICER AND SENIOR VICE PRESIDENT
Officer since: July 2015 | Principal Occupations: Senior Vice President and Chief Compliance Officer of the Federated Fund Family; Vice President and Chief Compliance Officer of Federated Investors, Inc. and Chief Compliance Officer of certain of its subsidiaries. Mr. Van Meter joined Federated in October 2011. He holds FINRA licenses under Series 3, 7, 24 and 66.
Previous Positions: Mr. Van Meter previously held the position of Compliance Operating Officer, Federated Investors, Inc. Prior to joining Federated, Mr. Van Meter served at the United States Securities and Exchange Commission in the positions of Senior Counsel, Office of Chief Counsel, Division of Investment Management and Senior Counsel, Division of Enforcement. |
Annual Shareholder Report
Name
Birth Date
Address
Positions Held with Trust
Date Service Began | Principal Occupation(s) for Past Five Years
and Previous Position(s) |
Stephen F. Auth
Birth Date: September 3, 1956
101 Park Avenue
41st Floor
New York, NY 10178
CHIEF INVESTMENT OFFICER
Officer since: November 2002 | Principal Occupations: Stephen F. Auth is Chief Investment Officer of various Funds in the Federated Fund Family; Executive Vice President, Federated Investment Counseling, Federated Global Investment Management Corp. and Federated Equity Management Company of Pennsylvania.
Previous Positions: Executive Vice President, Federated Investment Management Company and Passport Research, Ltd. (investment advisory subsidiary of Federated); Senior Vice President, Global Portfolio Management Services Division; Senior Vice President, Federated Investment Management Company and Passport Research, Ltd.; Senior Managing Director and Portfolio Manager, Prudential Investments. |
Annual Shareholder Report
Evaluation and Approval of Advisory Contract–May 2015
Federated Kaufmann Fund (the “Fund”)
Following a review and recommendation of approval by the Fund's independent trustees, the Fund's Board reviewed and approved at its May 2015 meetings the Fund's investment advisory and subadvisory contracts for an additional one-year term. The Board's decision regarding these contracts reflects the exercise of its business judgment on whether to continue the existing arrangements.
In this connection, the Federated Funds' Board had previously appointed a Senior Officer, whose duties include specified responsibilities relating to the process by which advisory fees are to be charged to a Federated fund. The Senior Officer has the authority to retain consultants, experts, or staff as may be reasonably necessary to assist in the performance of his duties, reports directly to the Board, and may be terminated only with the approval of a majority of the independent members of the Board. The Senior Officer prepared and furnished to the Board an independent, written evaluation that covered topics discussed below (the “Evaluation”). The Board considered that Evaluation, along with other information, in deciding to approve the advisory and subadvisory contracts.
The Board is also familiar with and considered judicial decisions concerning allegedly excessive investment advisory fees, which have indicated that the following factors may be relevant to an Adviser's fiduciary duty with respect to its receipt of compensation from a fund: the nature and quality of the services provided by the Adviser to a fund and its shareholders, including the performance and expenses of the fund and of comparable funds; the Adviser's cost of providing the services, including the profitability to the Adviser of providing advisory services to a fund; the extent to which the Adviser may realize “economies of scale” as a fund grows larger and, if such economies of scale exist, whether they have been shared with a fund and its shareholders or the family of funds; any “fall-out financial benefits” that accrue to the Adviser because of its relationship with a fund (including research services received from brokers that execute fund trades and any fees paid to affiliates of the Adviser for services rendered to a fund); comparative fee structures, including a comparison of fees paid to the Adviser with those paid by similar funds; and the extent of care, conscientiousness and independence with which the Board members perform their duties and their expertise, including whether they are fully informed about all facts the Board deems relevant to its consideration of the Adviser's services and fees. The Board noted that SEC disclosure requirements regarding the basis for the Board's approval of the Fund's advisory contract generally track the factors listed above. Consistent with these judicial decisions and SEC disclosure requirements, the Board also considered management fees charged to institutional and other clients of the Adviser and subadviser for what
Annual Shareholder Report
might be viewed as like services. The Board was aware of these factors and was guided by them in its review of the Fund's advisory and subadvisory contracts to the extent it considered them to be appropriate and relevant, as discussed further below.
The Board considered and weighed these circumstances in light of its substantial accumulated experience in governing the Fund and working with Federated on matters relating to the Federated funds, and was assisted in its deliberations by independent legal counsel. Throughout the year, and in connection with its May meetings, the Board requested and received substantial and detailed information about the Fund and the Federated organization that was in addition to the extensive materials that comprise and accompany the Senior Officer's Evaluation. Federated provided much of this information at each regular meeting of the Board, and furnished additional substantial information in connection with the May meeting at which the Board's formal review of the advisory and subadvisory contracts occurred. At this May meeting, senior management of the Adviser also met with the independent trustees and their counsel to discuss the materials presented and any other matters thought relevant by the Adviser or the trustees. Between regularly scheduled meetings, the Board also received information on particular matters as the need arose. Thus, the Board's consideration of the advisory and subadvisory contracts included review of the Senior Officer's Evaluation, accompanying data and additional information covering such matters as: the Adviser's and subadviser's investment philosophy, revenue, profitability, personnel and processes; investment and operating strategies; the Fund's short- and long-term performance (in absolute terms, both on a gross basis and net of expenses, as well as in relationship to its particular investment program and certain competitor or “peer group” funds and/or other benchmarks, as appropriate), and comments on the reasons for performance; the Fund's investment objectives; the Fund's expenses (including the advisory fee itself and the overall expense structure of the Fund, both in absolute terms and relative to similar and/or competing funds, with due regard for contractual or voluntary expense limitations); the use and allocation of brokerage commissions derived from trading the Fund's portfolio securities (if any); and the nature, quality and extent of the advisory and other services provided to the Fund by the Adviser and its affiliates. The Board also considered the preferences and expectations of Fund shareholders; the entrepreneurial risk assumed by the Adviser in sponsoring the funds; the continuing state of competition in the mutual fund industry and market practices; the range of comparable fees for similar funds in the mutual fund industry; the Fund's relationship to the Federated family of funds which include a comprehensive array of funds with different investment objectives, policies and strategies which are available for exchange without the incurrence of additional sales charges; compliance and audit reports concerning the Federated funds and the Federated companies that service them (including communications from regulatory agencies), as well as Federated's responses to any issues raised therein;
Annual Shareholder Report
and relevant developments in the mutual fund industry and how the Federated funds and/or Federated are responding to them. The Board also considered that the longevity and experience of the Fund's portfolio management team and their unique approach to investing may limit the utility of comparisons to other equity mutual funds. The Board's evaluation process is evolutionary. The criteria considered and the emphasis placed on relevant criteria change in recognition of changing circumstances in the mutual fund marketplace.
While mindful that courts have cautioned against giving such comparisons too much weight, the Board has found the use of comparisons of the Fund's fees and expenses to other mutual funds with comparable investment programs to be relevant. In this regard, the Board was presented with, and considered, information regarding the contractual advisory fee rates, net advisory fee rates and total expense ratios relative to a fund's peers. The Board focused on comparisons with other similar mutual funds more heavily than non-mutual fund products or services because it is believed that they are more relevant. For example, other mutual funds are the products most like the Fund, they are readily available to Fund shareholders as alternative investment vehicles, and they are the type of investment vehicle in fact chosen and maintained by the Fund's investors. The range of their fees and expenses therefore appears to be a relevant indicator of what consumers have found to be reasonable in the precise marketplace in which the Fund competes.
The Board reviewed the contractual advisory fee rate, net advisory fee rate where partially waived and other expenses of the Fund and noted the position of the Fund's fee rates relative to its peers. In this regard, the Board noted that the contractual advisory fee rate was above the median of the relevant peer group, but the Board noted the applicable waivers and reimbursements and that the overall expense structure of the Fund remained competitive. The Board will continue to monitor advisory fees and other expenses borne by the Fund in the context of the other factors considered relevant by the Board.
By contrast, the Senior Officer has reviewed Federated's fees for providing advisory services to products outside the Federated family of funds (e.g., institutional and separate accounts and sub-adviser services). He concluded that mutual funds and institutional accounts are inherently different products. Those differences include, but are not limited to, different types of targeted investors; being subject to different laws and regulations; different legal structures; different average account sizes and portfolio management techniques made necessary by different cash flows and different associated costs; and the time spent by portfolio managers and their teams, funds financial services, legal, compliance and risk management in reviewing securities pricing, addressing different administrative responsibilities, addressing different degrees of risk associated with management and a variety of different costs. The Senior Officer did not consider these fee schedules to be determinative in judging the appropriateness of mutual fund advisory fees.
Annual Shareholder Report
The Senior Officer noted that while this was particularly true in the case of the Federated Kaufmann Fund, since Federated manages no institutional or separate accounts in the style of the Fund, he did note that the same group that manages the Federated Kaufmann Small Cap Fund did manage a similarly managed sub-advised fund for a lesser fee. However, the Senior Officer noted that the relationship with this similarly managed sub-advised fund was terminated during the fourth quarter of 2014.
The Fund's ability to deliver competitive performance when compared to its peer group was also deemed to be relevant by the Board as a useful indicator of how the Adviser is executing the Fund's investment program, which in turn was one of the Board's considerations in reaching a conclusion that the nature, extent, and quality of the Adviser's investment management services were such as to warrant continuation of the advisory and subadvisory contracts.
The Senior Officer reviewed information compiled by Federated, using data supplied by independent fund ranking organizations, regarding the performance of, and fees charged by, other mutual funds, noting his view that comparisons to fund peer groups may be helpful, though not conclusive, in judging the reasonableness of the proposed fees. The Board considered, in evaluating such comparisons, that in some cases individual funds may exhibit significant and unique differences in their objectives and management techniques when compared to other funds within an industry peer group.
For the periods covered by the Evaluation, the Fund's performance for the one- and three-year periods was above the median of the relevant peer group, and the Fund's performance fell below the median of the relevant peer group for the five-year period. The Board discussed the Fund's performance with the adviser and recognized the efforts being undertaken by the Adviser. The Board will continue to monitor these efforts and the performance of the Fund in the context of the other factors considered relevant by the Board.
The Board also received financial information about Federated, including information regarding the compensation and benefits Federated derived from its relationships with the Federated funds. This information covered not only the fees under the advisory contracts, but also fees received by Federated's subsidiaries for providing other services to the Federated funds under separate contracts (e.g., for serving as the Federated funds' administrator). The information also detailed any indirect benefit Federated may derive from its receipt of research services from brokers who execute Federated fund trades. In addition, the Board considered the fact that, in order for a fund to be competitive in the marketplace, Federated and its affiliates frequently waived fees and/or reimbursed expenses and have disclosed to fund investors and/or indicated to the Board their intention to do so in the future, where appropriate. Moreover, the Board receives regular reporting as to the institution, adjustment or elimination of these voluntary waivers.
Annual Shareholder Report
In addition, over the past two years, following discussions regarding the Senior Officer's recommendations, Federated made meaningful reductions to the contractual advisory fees for several Funds.
The Board noted that in May 2014, the Senior Officer proposed, and the Board subsequently approved, a reduction in the contractual advisory fee to more closely align the contractual fee with the net fee actually charged after the imposition of applicable voluntary waivers which was believed by both the Senior Officer and the Board to improve the market competitiveness of the Fund. At the May 2015 Meetings, Federated proposed and the Board approved reductions to the subadvisory fees under the subadvisory contract for the Fund, effective as of the date of the previous contractual advisory fee reduction. Formerly, the contractual subadvisory fee was 1.175% of average daily net assets (ADNA) for the Fund. The new subadvisory fee will be 1.066%. This subadvisory fee represents 82% of the current gross advisory fee of 1.30%.
Federated furnished information, requested by the Senior Officer, that reported revenues on a fund-by-fund basis and made estimates of the allocation of expenses on a fund-by-fund basis, using allocation methodologies specified by the Senior Officer. The Senior Officer noted that, while these cost allocation reports apply consistent allocation processes, the inherent difficulties in allocating costs continues to cause the Senior Officer to question the precision of the process and to conclude that such reports may be unreliable, since a single change in an allocation estimate may dramatically alter the resulting estimate of cost and/or profitability of a fund and may produce unintended consequences. The allocation information, including the Senior Officer's view that fund-by-fund estimations may be unreliable, was considered in the analysis by the Board.
The Board and the Senior Officer also reviewed information compiled by Federated comparing profitability information for Federated to other publicly held fund management companies. In this regard, the Senior Officer concluded that Federated's profit margins did not appear to be excessive. The Senior Officer also noted that Federated appeared financially sound, with the resources to fulfill its obligations under its contracts with the Funds.
The Senior Officer's Evaluation also discussed the notion of possible realization of “economies of scale” as a fund grows larger. The Board considered in this regard that the Adviser has made significant and long-term investments in areas that support all of the Federated family of funds, such as personnel and processes for the portfolio management, shareholder services, compliance, internal audit, and risk management functions; and systems technology; and that the benefits of these efforts (as well as any economies of scale, should they exist) were likely to be enjoyed by the fund family as a whole. Federated, as it does throughout the year, and again in connection with the Board's review, furnished information relative to revenue sharing or adviser paid fees. Federated and the Senior Officer noted that this information should be viewed to determine if there was an incentive to either not apply breakpoints or to apply breakpoints at higher levels and should not be viewed to determining the appropriateness of
Annual Shareholder Report
advisory fees, because it would represent marketing and distribution expenses. Finally, the Board also noted the absence of any applicable regulatory or industry guidelines on this subject, which (as discussed in the Senior Officer's Evaluation) is compounded by the lack of any common industry practice or general pattern with respect to structuring fund advisory fees with “breakpoints” that serve to reduce the fee as the fund attains a certain size.
In this regard, the Senior Officer's Evaluation noted that the Board is aware that the Fund is a relatively more expensive fund for the Adviser to manage than other Federated equity funds. The Senior Officer's Evaluation also noted that the Board is aware of the provisions agreed upon in the settlement of the Kaufmann Fund fee litigation under which, starting July 1, 2012 and for a period of ten years thereafter, a cap on the net investment advisory fee is imposed and under which additional breakpoints are required upon the fund reaching $8 billion, $9 billion, $10 billion and $12 billion in size.
The Senior Officer noted that, subject to the comments and recommendations made within his Evaluation, his observations and the information accompanying the Evaluation supported a finding by the Board that the management fees for each of the funds were reasonable. Under these circumstances, other than the reduction in the subadvisory fee noted above, no changes were recommended to, and no objection was raised to, the continuation of the Fund's advisory and subadvisory contracts.
In its decision to continue an existing investment advisory contract, the Board was mindful of the potential disruptions of the Fund's operations and various risks, uncertainties and other effects that could occur as a result of a decision to terminate or not renew an advisory contract. In particular, the Board recognized that many shareholders have invested in the Fund on the strength of the Adviser's industry standing and reputation and with the expectation that the Adviser will have a continuing role in providing advisory services to the Fund. Thus, the Board's approval of the advisory and subadvisory contracts reflected the fact that it is the shareholders who have effectively selected the Adviser by virtue of having invested in the Fund. The Board concluded that, in light of the factors discussed above, including the nature, quality and scope of the services provided to the Fund by the Adviser and its affiliates, continuation of the advisory contract was appropriate.
The Board based its decision to approve the advisory and subadvisory contracts on the totality of the circumstances and relevant factors and with a view to past and future long-term considerations. Not all of the factors and considerations identified above were necessarily relevant to the Fund, nor did the Board consider any one of them to be determinative. With respect to the factors that were relevant, the Board's decision to approve the contract reflects its determination that Federated's performance and actions provided a satisfactory basis to support the decision to continue the existing arrangements.
Annual Shareholder Report
Voting Proxies on Fund Portfolio Securities
A description of the policies and procedures that the Fund uses to determine how to vote proxies, if any, relating to securities held in the Fund's portfolio is available, without charge and upon request, by calling 1-800-341-7400. A report on “Form N-PX” of how the Fund voted any such proxies during the most recent 12-month period ended June 30 is available via the Proxy Voting Record (Form N-PX) link associated with the Fund and share class name at www.FederatedInvestors.com/FundInformation. Form N-PX filings are also available at the SEC's website at www.sec.gov.
Quarterly Portfolio Schedule
The Fund files with the SEC a complete schedule of its portfolio holdings, as of the close of the first and third quarters of its fiscal year, on “Form N-Q.” These filings are available on the SEC's website at www.sec.gov and may be reviewed and copied at the SEC's Public Reference Room in Washington, DC. (Call 1-800-SEC-0330 for information on the operation of the Public Reference Room.) You may also access this information via the link to the Fund and share class name at www.FederatedInvestors.com/FundInformation.
Annual Shareholder Report
Mutual funds are not bank deposits or obligations, are not guaranteed by any bank and are not insured or guaranteed by the U.S. government, the Federal Deposit Insurance Corporation, the Federal Reserve Board or any other government agency. Investment in mutual funds involves investment risk, including the possible loss of principal.
This Report is authorized for distribution to prospective investors only when preceded or accompanied by the Fund's Prospectus, which contains facts concerning its objective and policies, management fees, expenses and other information.
Federated Kaufmann Fund
Federated Investors Funds
4000 Ericsson Drive
Warrendale, PA 15086-7561
Contact us at FederatedInvestors.com
or call 1-800-341-7400.
Federated Securities Corp., Distributor
CUSIP 314172677
CUSIP 314172669
CUSIP 314172651
26396 (12/15)
Federated is a registered trademark of Federated Investors, Inc.
2015 ©Federated Investors, Inc.
Annual Shareholder Report
October 31, 2015
Federated Kaufmann Fund
Successor to the Kaufmann Fund, Inc., with performance history since February 21, 1986
A Portfolio of Federated Equity Funds
Not FDIC Insured • May Lose Value • No Bank Guarantee
CONTENTS
| 1 |
| 5 |
| 6 |
| 13 |
| 14 |
| 16 |
| 17 |
| 18 |
| 35 |
| 36 |
| 38 |
| 44 |
| 50 |
| 50 |
Management's Discussion of Fund Performance (unaudited)
The total return of Federated Kaufmann Fund (the “Fund”), based on net asset value for the 12-month reporting period ended October 31, 2015, was 6.28% for the Class R Shares. The total return of the Russell Midcap® Growth Index (RMCGI),1 the Fund's broad-based securities market index, was 4.94% for the same period. The total return of the Morningstar Mid-Cap Growth Funds Average (MMCGFA),2 a peer group average for the Fund, was 3.00% for the same period. The Fund's and MMCGFA's total returns for the most recently completed fiscal year reflected actual cash flows, transaction costs and other expenses, which were not reflected in the total return of the RMCGI.
During the reporting period, the Fund's investment strategy focused on stock selection, sector exposure, international exposure3 and the effect of cash holdings. These were the most significant factors affecting the Fund's performance relative to the RMCGI.
Market Overview
During the reporting period, the equity markets globally performed well with the European stock markets leading the way. Most central banks around the world continued their monetary easing while the United States looked to enter a tightening period throughout most of the reporting period. The U.S. Federal Reserve (the “Fed”) postponed its first rate raise in nearly a decade multiple times despite positive economic data. Concern about global growth kept the Fed static. Worries about global growth pressured markets during the summer months particularly as China's economy slowed further, causing deflationary worries. Despite persistent geopolitical headwinds, e.g., Syria and the Middle East, global economies continued to grow, albeit slowly. Policymakers around the world continued to lean towards stimulus. Meanwhile, the U.S. pursued the opposite approach, a tightening strategy, which drove the strength in the U.S. Dollar Index.4 Despite these uncertainties, the equity markets performed well, and corporate earnings remained strong during the reporting period.
Stock Selection
The key factor affecting performance from a macroeconomic standpoint was the improving U.S. economic fundamentals, as well as accommodating monetary policies by the Fed and other central banks around the world. The monetary easing policies allowed a slow but gradual recovery of the major world economies. Profitability of many of the companies in which the Fund invested remained strong throughout the reporting period. Fund management continued to find attractive mid-cap growth investment opportunities–companies that are dominant competitors and that have strengthening fundamentals potentially delivering both near-term and long-term growth in sales and earnings.
Annual Shareholder Report
The majority of the Fund outperformance on a gross return basis versus the RMCGI was due to stock selection and sector weighting particularly in the Health Care and Information Technology sectors. Individual companies that most contributed to Fund performance during the reporting period were: Dyax Corp., Dexcom Inc., Alkermes Plc., Pharmacyclics and Starbucks. Laggard companies that hurt relative Fund performance were: BioDelivery Sciences, Spirit Airlines, Ilumina Inc., Examworks Group Inc. and Ocular Therapeutix Inc.
Sector Exposure
At the end of the reporting period, approximately 75% of the portfolio was invested in four large sectors: Health Care, Financials, Information Technology and Consumer Discretionary. These sectors have historically provided good opportunities for bottom-up growth investors. Overweighting the Health Care and underweighting Energy sectors benefited relative performance versus the RMCGI. Underweighting in the Consumer Discretionary and Consumer Staples hurt relative Fund performance.
International Exposure
Stock selection of companies domiciled outside the U.S. was a positive contributor to Fund performance. Approximately 10% of the Fund's assets were invested in such companies during the reporting period.
Effect of Cash Holdings
The Fund had significant cash outflows during the reporting period which resulted in an average cash position of 6%. In a rising market, the cash holdings resulted in a modest drag on relative Fund performance.
| 1 | Please see the footnotes to the line graphs below for definitions of, and further information about, the RMCGI. |
| 2 | Please see the footnotes to the line graphs below for definitions of, and further information about, the MMCGFA. |
| 3 | International investing involves special risks including currency risk, increased volatility, political risks and differences in auditing and other financial standards. |
| 4 | The U.S. Dollar Index indicates the general international value of the U.S. dollar by averaging the exchange rates between the U.S. dollar and six major world currencies. The index is unmanaged, and it is not possible to invest directly in an index. |
Annual Shareholder Report
FUND PERFORMANCE AND GROWTH OF A $10,000 INVESTMENT
The graph below illustrates the hypothetical investment of $10,0001 in the Federated Kaufmann Fund from October 31, 2005 to October 31, 2015, compared to the Russell Midcap® Growth Index (RMCGI)2 and the Morningstar Mid-Cap Growth Funds Average (MMCGFA).3 The Average Annual Total Return table below shows returns for each class averaged over the stated periods.
Growth of a $10,000 Investment
Growth of $10,000 as of October 31, 2015

| Federated Kaufmann Fund - | Class R Shares | NA | RMCGI | MMCGFA |
| F | NA | I | I |
| 10/31/2005 | 10,000 | | 10,000 | 10,000 |
| 10/31/2006 | 11,685 | | 11,451 | 11,194 |
| 10/31/2007 | 15,316 | | 13,709 | 13,938 |
| 10/31/2008 | 9,154 | | 7,862 | 8,039 |
| 10/31/2009 | 10,163 | | 9,630 | 9,344 |
| 10/31/2010 | 12,684 | | 12,329 | 11,768 |
| 10/31/2011 | 11,939 | | 13,572 | 12,655 |
| 10/31/2012 | 13,040 | | 14,806 | 13,616 |
| 10/31/2013 | 17,711 | | 19,830 | 18,009 |
| 10/31/2014 | 20,282 | | 22,723 | 19,843 |
| 10/31/2015 | 21,512 | | 23,844 | 20,414 |
41 graphic description end -->
Average Annual Total Returns for the Period Ended 10/31/2015
| | 1 Year | 5 Years | 10 Years |
| Class R Shares | 6.07% | 11.14% | 7.96% |
| RMCGI | 4.94% | 14.10% | 9.08% |
| MMCGFA | 3.00% | 12.00% | 7.98% |
Annual Shareholder Report
Performance data quoted represents past performance which is no guarantee of future results. Investment return and principal value will fluctuate so that an investor's shares, when redeemed, may be worth more or less than their original cost. Mutual fund performance changes over time and current performance may be lower or higher than what is stated. For current to the most recent month-end performance and after-tax returns, visit FederatedInvestors.com or call 1-800-341-7400. Returns shown do not reflect the deduction of taxes that a shareholder would pay on Fund distributions or the redemption of Fund shares. Mutual funds are not obligations of or guaranteed by any bank and are not federally insured.
| 1 | Represents a hypothetical investment of $10,000 in the Fund. The ending value of the Fund reflects a 0.20% redemption fee. The Fund's performance assumes the reinvestment of all dividends and distributions. The RMCGI and MMCGFA have been adjusted to reflect reinvestment of all dividends on securities in the index and average. |
| 2 | The Russell Midcap® Growth Index measures the performance of the mid-cap growth segment of the U.S. equity universe. It includes those Russell Midcap® Growth Index companies with higher price-to-book ratios and higher forecasted growth values. The RMCGI is constructed to provide a comprehensive and unbiased barometer of the mid-cap growth market. The RMCGI is completely reconstituted annually to ensure larger stocks do not distort the performance and characteristics of the true mid-cap growth market. The RMCGI is not adjusted to reflect sales charges, expenses or other fees that the Securities and Exchange Commission requires to be reflected in the Fund's performance. The index is unmanaged and unlike the Fund, is not affected by cash flows. It is not possible to invest directly in an index. |
| 3 | Morningstar figures represent the average of the total returns reported by all the mutual funds designated by Morningstar as falling into the respective category indicated. They do not reflect sales charges. |
Annual Shareholder Report
Portfolio of Investments Summary Table (unaudited)
At October 31, 2015, the Fund's sector composition1 was as follows:
| Sector Composition | | Percentage of
Total Net Assets |
| Health Care | | 31.5% |
| Information Technology | | 20.9% |
| Consumer Discretionary | | 11.2% |
| Financials | | 10.3% |
| Industrials | | 7.0% |
| Materials | | 4.5% |
| Consumer Staples | | 2.3% |
| Energy2 | | 0.0% |
| Telecommunication Services | | 0.4% |
| Securities Lending Collateral3 | | 21.8% |
| Cash Equivalents4 | | 11.8% |
| Other Assets and Liabilities—Net5 | | (21.7)% |
| TOTAL | | 100.0% |
| 1 | Except for Securities Lending Collateral, Cash Equivalents and Other Assets and Liabilities, sector classifications are based upon, and individual portfolio securities are assigned to, the classifications of the Global Industry Classification System (GICS), except that the Adviser assigns a classification to securities not classified by the GICS and to securities for which the Adviser does not have access to the classification made by the GICS. |
| 2 | Represents less than 0.1%. |
| 3 | Cash collateral received from lending portfolio securities, which is invested in short-term investments such as repurchase agreements or money market mutual funds. |
| 4 | Cash Equivalents include any investments in money market mutual funds and/or overnight repurchase agreements other than those representing securities lending collateral. |
| 5 | Assets, other than investments in securities, less liabilities. See Statement of Assets and Liabilities. |
Annual Shareholder Report
Portfolio of Investments
October 31, 2015
Shares or
Principal
Amount | | | Value |
| | | COMMON STOCKS—87.8% | |
| | | Consumer Discretionary—11.2% | |
| 90,000 | 1,2 | Amazon.com, Inc. | $56,331,000 |
| 1,177,000 | 2 | Clubcorp Holdings, Inc. | 24,057,880 |
| 187,400 | 2 | Cracker Barrel Old Country Store, Inc. | 25,760,004 |
| 821,600 | 2 | D.R. Horton, Inc. | 24,187,904 |
| 1,090,000 | 1 | Dave & Buster's Entertainment, Inc. | 42,052,200 |
| 1,050,000 | 2 | Hanesbrands, Inc. | 33,537,000 |
| 2,200,000 | | Hilton Worldwide Holdings, Inc. | 54,978,000 |
| 1,600,000 | 1,2 | La Quinta Holdings, Inc. | 24,240,000 |
| 400,000 | 2 | Las Vegas Sands Corp. | 19,804,000 |
| 343,441 | 2 | Metaldyne Performance Group, Inc. | 7,493,883 |
| 245,633 | 1,2 | Mohawk Industries, Inc. | 48,021,251 |
| 756,700 | | Moncler S.p.A | 12,197,926 |
| 27,091,412 | | NagaCorp Limited | 19,092,217 |
| 980,000 | 1 | One Group Hospitality, Inc./The | 3,067,400 |
| 16,700 | 1 | Priceline.com, Inc. | 24,285,808 |
| 19,260,000 | | Samsonite International SA | 56,814,903 |
| 1,400,000 | | Starbucks Corp. | 87,598,000 |
| 140,000 | 2 | Tractor Supply Co. | 12,934,600 |
| 88,500 | | Whirlpool Corp. | 14,172,390 |
| 1,000,000 | 1 | Yoox Net-A-Porter Group | 33,851,647 |
| | | TOTAL | 624,478,013 |
| | | Consumer Staples—2.3% | |
| 900,000 | 1,2 | Blue Buffalo Pet Products, Inc. | 16,146,000 |
| 196,154 | | CVS Health Corp. | 19,376,092 |
| 600,000 | 1,2 | Hain Celestial Group, Inc. | 29,910,000 |
| 359,059 | 2 | Smucker (J.M.) Co. | 42,149,936 |
| 1,000,000 | 1,2 | Sprouts Farmers Market, Inc. | 20,380,000 |
| | | TOTAL | 127,962,028 |
| | | Energy—0.0% | |
| 50,000 | 1,2 | Cheniere Energy, Inc. | 2,476,000 |
| | | Financials—10.3% | |
| 3,100,000 | | American International Group, Inc. | 195,486,000 |
| 255,000 | 2 | BlackRock, Inc. | 89,752,350 |
| 1,450,000 | 1,2 | CBRE Group, Inc. | 54,056,000 |
Annual Shareholder Report
Shares or
Principal
Amount | | | Value |
| | | COMMON STOCKS—continued | |
| | | Financials—continued | |
| 750,000 | | Chimera Investment Corp. | $10,560,000 |
| 530,000 | 2 | Crown Castle International Corp. | 45,293,800 |
| 3,100,000 | 2 | EverBank Financial Corp. | 53,506,000 |
| 1 | 1,3,4 | FA Private Equity Fund IV LP | 584,562 |
| 330,000 | | Housing Development Finance Corp. Ltd. | 6,322,174 |
| 1 | 1,3,4 | Infrastructure Fund | 0 |
| 435,000 | | JPMorgan Chase & Co. | 27,948,750 |
| 1 | 1,3,4 | Peachtree Leadscope LLC | 0 |
| 595,700 | 2 | Ryman Hospitality Properties | 31,333,820 |
| 1,000,000 | | Wells Fargo & Co. | 54,140,000 |
| | | TOTAL | 568,983,456 |
| | | Health Care—31.2% | |
| 671,600 | 1,2 | Acadia Pharmaceuticals, Inc. | 23,385,112 |
| 1,925,204 | 1,2 | Alkermes, Inc. | 138,460,672 |
| 129,774 | 1 | Allergan PLC | 40,031,386 |
| 1,100,000 | 1 | Amphastar Pharmaceuticals, Inc. | 13,024,000 |
| 235,000 | 1,2 | Amsurg Corp. | 16,471,150 |
| 1 | 3,4 | Apollo Investment Fund V | 374,619 |
| 1,000,000 | 1,2 | Arena Pharmaceuticals, Inc. | 1,890,000 |
| 140,000 | 1,2 | aTyr Pharma, Inc. | 1,744,400 |
| 2,425,000 | 1,2,5 | BioDelivery Sciences International, Inc. | 13,046,500 |
| 3,000,000 | 1,5 | Catalyst Pharmaceutical Partners, Inc. | 9,480,000 |
| 170,000 | 1 | Cerner Corp. | 11,269,300 |
| 237,000 | 1,2 | Coherus Biosciences, Inc. | 6,600,450 |
| 12,439,968 | 1,5 | Corcept Therapeutics, Inc. | 45,903,482 |
| 1 | 3,4 | Denovo Ventures I LP | 82,218 |
| 1,880,000 | 1 | Dexcom, Inc. | 156,641,600 |
| 126,065 | 1 | Dexcom, Inc. | 10,503,736 |
| 660,000 | 1 | Diplomat Pharmacy, Inc. | 18,552,600 |
| 9,000,000 | 1,2,5 | Dyax Corp. | 247,770,000 |
| 1,816,759 | 1,5 | Dynavax Technologies Corp. | 41,258,597 |
| 1,540,000 | 1,2,5 | Egalet Corp. | 12,782,000 |
| 2,100,000 | 1,2,5 | ExamWorks Group, Inc. | 59,304,000 |
| 535,000 | 1,2 | GW Pharmaceuticals PLC, ADR | 42,313,150 |
| 1,240,000 | 1,2,5 | Galapagos NV | 59,830,909 |
| 956,807 | 1,2,5 | Galapagos NV, ADR | 45,926,736 |
| 100,000 | 1,2 | Genfit | 4,487,225 |
Annual Shareholder Report
Shares or
Principal
Amount | | | Value |
| | | COMMON STOCKS—continued | |
| | | Health Care—continued | |
| 550,000 | 2 | Gilead Sciences, Inc. | $59,471,500 |
| 900,000 | 1,2 | HealthEquity, Inc. | 29,439,000 |
| 500,000 | 1,2 | IDEXX Laboratories, Inc. | 34,310,000 |
| 75,000 | 1,2 | Illumina, Inc. | 10,746,000 |
| 948,832 | 1,2 | Intersect ENT, Inc. | 18,179,621 |
| 1 | 3,4 | Latin Healthcare Fund | 458,699 |
| 500,000 | 1,2 | MacroGenics, Inc. | 15,535,000 |
| 436,000 | | Medtronic PLC | 32,229,120 |
| 2,120,000 | 1,3,5 | Minerva Neurosciences, Inc. | 11,108,800 |
| 3,500,000 | 1,2 | Nektar Therapeutics | 41,545,000 |
| 800,000 | 1 | Neovasc, Inc. | 4,472,000 |
| 1,291,427 | 1,2,5 | Ocular Therapeutix, Inc. | 11,145,015 |
| 902,467 | 1,2,5 | Otonomy, Inc. | 19,529,386 |
| 409,890 | 1,5 | Otonomy, Inc. | 8,870,020 |
| 392,000 | 1 | Poxel SA | 3,916,690 |
| 1,391,627 | 1,2,5 | Premier, Inc. | 47,050,909 |
| 11,301,600 | 1,5 | Progenics Pharmaceuticals, Inc. | 82,953,744 |
| 450,000 | 1,2 | Repligen Corp. | 14,958,000 |
| 200,000 | 1,2 | SAGE Therapeutics, Inc. | 10,046,000 |
| 750,000 | 1,5 | SCYNEXIS, Inc. | 4,792,500 |
| 600,000 | 1,2 | Seres Therapeutics, Inc. | 17,784,000 |
| 350,000 | | Shire Ltd. | 26,503,084 |
| 124,400 | | Shire Ltd., ADR | 28,245,020 |
| 959,018 | 1,4,5 | Soteira, Inc. | 0 |
| 511,300 | 1,2 | Spark Therapeutics, Inc. | 27,559,070 |
| 1,200,000 | 1,5 | SteadyMed Ltd. | 3,384,000 |
| 117,816 | 1,3,5 | SteadyMed Ltd. | 332,241 |
| 3,461,045 | 1,2,5 | Threshold Pharmaceuticals, Inc., Class THL | 13,186,581 |
| 328,600 | 1,2 | Ultragenyx Pharmaceutical, Inc. | 32,646,410 |
| 2,850,000 | 1,2 | Veeva Systems, Inc. | 72,304,500 |
| 700,000 | 1,2 | Versartis, Inc. | 7,231,000 |
| 1,738,998 | 1,5 | Zogenix, Inc. | 20,502,786 |
| 254,900 | 1,2,5 | Zynerba Pharmaceuticals, Inc. | 3,209,191 |
| | | TOTAL | 1,734,778,729 |
| | | Industrials—7.0% | |
| 1,500,000 | 2 | Air Lease Corp. | 50,565,000 |
| 424,500 | 1,2 | Caesar Stone SDOT Yam Ltd. | 15,073,995 |
Annual Shareholder Report
Shares or
Principal
Amount | | | Value |
| | | COMMON STOCKS—continued | |
| | | Industrials—continued | |
| 300,000 | | Danaher Corp. | $27,993,000 |
| 700,000 | 2 | Hexcel Corp. | 32,424,000 |
| 785,000 | | KAR Auction Services, Inc. | 30,144,000 |
| 667,400 | 1,2 | Kirby Corp. | 43,574,546 |
| 350,000 | 1,2 | Middleby Corp. | 40,929,000 |
| 456,850 | 1 | Milacron Holdings Corp. | 7,798,429 |
| 1,250,000 | 1 | RPX Corp. | 17,800,000 |
| 378,200 | | Safran SA | 28,700,930 |
| 744,626 | 1,2 | Spirit Airlines, Inc. | 27,640,517 |
| 140,000 | | Stanley Black & Decker, Inc. | 14,837,200 |
| 400,000 | 1 | Verisk Analytics, Inc. | 28,644,000 |
| 265,000 | 2 | Wabtec Corp. | 21,960,550 |
| | | TOTAL | 388,085,167 |
| | | Information Technology—20.9% | |
| 130,000 | 1 | Adobe Systems, Inc. | 11,525,800 |
| 600,000 | 1,2 | Alibaba Group Holding Ltd., ADR | 50,298,000 |
| 1,235,000 | | Amadeus IT Holding SA | 52,551,655 |
| 560,000 | 2 | Avago Technologies Ltd. | 68,952,800 |
| 1,200,000 | 1,2,5 | ChannelAdvisor Corp. | 10,464,000 |
| 346,300 | 1 | Check Point Software Technologies Ltd. | 29,414,722 |
| 332,000 | 1,2 | CoStar Group, Inc. | 67,419,240 |
| 631,400 | 1,2 | Cvent, Inc. | 19,958,554 |
| 503,919 | 1,2 | Demandware, Inc. | 28,572,207 |
| 1,059,322 | 1,3,4 | Expand Networks Ltd. | 0 |
| 1,466,475 | 1,2 | Fitbit, Inc. | 59,450,897 |
| 1,100,000 | 1,2 | Fleetmatics Group PLC | 61,226,000 |
| 430,000 | 1,2 | GoDaddy, Inc. | 11,816,400 |
| 1,539,700 | 1 | Microsemi Corp. | 55,444,597 |
| 570,000 | 1,2 | Mobileye NV | 25,946,400 |
| 1,175,000 | 1,2 | NIC, Inc. | 22,289,750 |
| 1,050,000 | 1 | NXP Semiconductors NV | 82,267,500 |
| 475,000 | 1,2 | NetSuite, Inc. | 40,408,250 |
| 1 | 1,3,4 | Peachtree Open Networks | 0 |
| 429,059 | 1,2 | Qorvo, Inc. | 18,848,562 |
| 1,423,600 | 1,2 | RADWARE Ltd. | 21,225,876 |
| 500,000 | 1,2 | Salesforce.com, Inc. | 38,855,000 |
| 3,751 | 1,3,4 | Sensable Technologies, Inc. | 0 |
Annual Shareholder Report
Shares or
Principal
Amount | | | Value |
| | | COMMON STOCKS—continued | |
| | | Information Technology—continued | |
| 825,000 | 1,2 | ServiceNow, Inc. | $67,361,250 |
| 2,700,000 | 1,2,5 | Textura Corp. | 79,272,000 |
| 622,900 | 1,2 | Tyler Technologies, Inc. | 106,117,244 |
| 1,100,000 | 1,2 | Vantiv, Inc. | 55,165,000 |
| 765,000 | 1,2 | Workday, Inc. | 60,412,050 |
| 500,000 | 1,2 | Zillow Group, Inc. | 13,845,000 |
| | | TOTAL | 1,159,108,754 |
| | | Materials—4.5% | |
| 707,000 | | Eagle Materials, Inc. | 46,683,210 |
| 720,000 | | Martin Marietta Materials | 111,708,000 |
| 341,400 | 2 | Sherwin-Williams Co. | 91,095,762 |
| | | TOTAL | 249,486,972 |
| | | Telecommunication Services—0.4% | |
| 838,700 | 1 | Zayo Group Holdings, Inc. | 22,250,711 |
| | | TOTAL COMMON STOCKS
(IDENTIFIED COST $3,193,936,234) | 4,877,609,830 |
| | | CORPORATE BOND—0.1% | |
| | | Health Care—0.1% | |
| $4,600,000 | 3,6 | Protalix Biotherapeutics, Inc., Conv. Bond, Series 144A,
4.50%, 9/15/2018
(IDENTIFIED COST $4,600,000) | 3,380,066 |
| | | PREFERRED STOCKS—0.1% | |
| | | Health Care—0.1% | |
| 185,997 | 1,3,4 | aTyr Pharma, Inc., Pfd., Series E | 2,244,752 |
| 6,978,566 | 1,3,4 | BioNano Genomics, Inc., Pfd., Series C | 1,960,000 |
| | | TOTAL | 4,204,752 |
| | | Information Technology—0.0% | |
| 679,348 | 1,3,4 | Multiplex, Inc., Pfd., Series C | 0 |
| | | TOTAL PREFERRED STOCKS
(IDENTIFIED COST $16,815,000) | 4,204,752 |
| | | WARRANTS—0.1% | |
| | | Health Care—0.1% | |
| 382,897 | 1 | Alexza Pharmaceuticals, Inc., 10/5/2016 | 6,548 |
| 2,907,735 | 1,3,4 | BioNano Genomics, Inc., 3/31/2016 | 582 |
| 2,120,000 | 1,5 | Minerva Neurosciences, Inc., 3/18/2017 | 2,212,432 |
| 7,425,000 | 1,5 | Zogenix, Inc., 7/27/2017 | 5,585,827 |
| | | TOTAL WARRANTS
(IDENTIFIED COST $315,770) | 7,805,389 |
Annual Shareholder Report
Shares or
Principal
Amount | | | Value |
| | | INVESTMENT COMPANIES—33.6% | |
| 1,211,126,225 | 5,8 | Federated Money Market Management, Institutional Shares, 0.16%7 | $1,211,126,225 |
| 652,093,317 | 5 | Federated Prime Value Obligations Fund, Institutional Shares, 0.16%7 | 652,093,317 |
| | | TOTAL INVESTMENT COMPANIES
(AT NET ASSET VALUE) | 1,863,219,542 |
| | | TOTAL INVESTMENTS—121.7%
(IDENTIFIED COST $5,078,886,546)9 | 6,756,219,579 |
| | | OTHER ASSETS AND LIABILITIES - NET—(21.7)%10 | (1,202,418,387) |
| | | TOTAL NET ASSETS—100% | $5,553,801,192 |
| 1 | Non-income-producing security. |
| 2 | All or a portion of these securities are temporarily on loan to unaffiliated broker/dealers. |
| 3 | Denotes a restricted security that either: (a) cannot be offered for public sale without first being registered, or being able to take advantage of an exemption from registration, under the Securities Act of 1933; or (b) is subject to a contractual restriction on public sales. At October 31, 2015, these restricted securities amounted to $20,526,539, which represented 0.4% of total net assets. |
| 4 | Market quotations and price evaluations are not available. Fair value determined in accordance with procedures established by and under the general supervision of the Fund's Board of Trustees (the “Trustees”). |
| 5 | Affiliated companies and holdings. |
| 6 | Denotes a restricted security that may be resold without restriction to “qualified institutional buyers” as defined in Rule 144A under the Securities Act of 1933 and that the Fund has determined to be liquid under criteria established by the Fund's Trustees. At October 31, 2015, these liquid restricted securities amounted to $3,380,066, which represented 0.1% of total net assets. |
| 7 | 7-day net yield. |
| 8 | All or a portion of this security is held as collateral for securities lending. |
| 9 | The cost of investments for federal tax purposes amounts to $5,111,833,052. |
| 10 | Assets, other than investments in securities, less liabilities. See Statement of Assets and Liabilities. A significant portion of this balance represents loans to unaffiliated qualified brokers for securities lending. The Fund receives cash from the broker as collateral for the loaned securities and reinvests the collateral in certain short-term securities such as repurchase agreements or money market mutual funds. |
Note: The categories of investments are shown as a percentage of total net assets at October 31, 2015.
Various inputs are used in determining the value of the Fund's investments. These inputs are summarized in the three broad levels listed below:
Level 1—quoted prices in active markets for identical securities.
Level 2—other significant observable inputs (including quoted prices for similar securities, interest rates, prepayment speeds, credit risk, etc.). Also includes securities valued at amortized cost.
Level 3—significant unobservable inputs (including the Fund's own assumptions in determining the fair value of investments).
The inputs or methodology used for valuing securities are not an indication of the risk associated with investing in those securities.
Annual Shareholder Report
The following is a summary of the inputs used, as of October 31, 2015, in valuing the Fund's assets carried at fair value:
| Valuation Inputs |
| | Level 1—
Quoted
Prices | Level 2—
Other
Significant
Observable
Inputs | Level 3—
Significant
Unobservable
Inputs | Total |
| Equity Securities: | | | | |
| Common Stocks | | | | |
| Domestic | $4,092,761,9321 | $— | $1,500,098 | $4,094,262,030 |
| International | 479,078,440 | 304,269,360 | — | 783,347,800 |
| Preferred Stocks | | | | |
| Domestic | — | — | 4,204,752 | 4,204,752 |
| Debt Securities: | | | | |
| Corporate Bond | — | 3,380,066 | — | 3,380,066 |
| Warrants | — | 7,804,807 | 582 | 7,805,389 |
| Investment Companies | 1,863,219,542 | — | — | 1,863,219,542 |
| TOTAL SECURITIES | $6,435,059,914 | $315,454,233 | $5,705,432 | $6,756,219,579 |
| 1 | Includes $9,720,541 of a domestic common stock security transferred from Level 3 to Level 1 because observable market data was obtained for the security. Transfer shown represents the value of the security at the beginning of the period. |
The following acronym is used throughout this portfolio:
| ADR | —American Depositary Receipt |
See Notes which are an integral part of the Financial Statements
Annual Shareholder Report
Financial Highlights–Class R Shares
(For a Share Outstanding Throughout Each Period)
| Year Ended October 31 | 2015 | 2014 | 2013 | 2012 | 2011 |
Net Asset Value,
Beginning of Period | $6.61 | $6.60 | $5.28 | $4.93 | $5.27 |
Income From
Investment Operations: | | | | | |
| Net investment income (loss) | (0.08)1 | (0.08)1 | (0.05)1 | (0.05)1 | (0.05)1 |
| Net realized and unrealized gain (loss) on investments, futures contracts and foreign currency transactions | 0.46 | 0.97 | 1.79 | 0.49 | (0.26) |
| TOTAL FROM INVESTMENT OPERATIONS | 0.38 | 0.89 | 1.74 | 0.44 | (0.31) |
| Less Distributions: | | | | | |
| Distributions from net investment income | — | — | — | — | (0.03) |
| Distributions from net realized gain on investments, futures contracts and foreign currency transactions | (0.96) | (0.88) | (0.42) | (0.09) | (0.00)2 |
| TOTAL DISTRIBUTIONS | (0.96) | (0.88) | (0.42) | (0.09) | (0.03) |
| Net Asset Value, End of Period | $6.03 | $6.61 | $6.60 | $5.28 | $4.93 |
| Total Return3 | 6.28% | 14.52% | 35.81% | 9.23% | (5.88)% |
| Ratios to Average Net Assets: | | | | | |
| Net expenses | 1.95%4 | 1.95%4 | 1.95%4 | 1.95%4 | 1.95%4 |
| Net expenses excluding dividends and other expenses related to short sales | — | — | — | 1.95%4 | 1.95%4 |
| Net investment income (loss) | (1.22)% | (1.27)% | (0.85)% | (0.97)% | (0.99)% |
| Expense waiver/reimbursement5 | 0.29% | 0.38% | 0.48% | 0.52% | 0.54% |
| Supplemental Data: | | | | | |
| Net assets, end of period (000 omitted) | $3,452,182 | $3,497,459 | $3,358,658 | $2,878,476 | $3,001,225 |
| Portfolio turnover | 51% | 52% | 63% | 61% | 64% |
| 1 | Per share numbers have been calculated using the average shares method. |
| 2 | Represents less than $0.01. |
| 3 | Based on net asset value, which does not reflect the sales charge, redemption fee or contingent deferred sales charge, if applicable. |
| 4 | The net expense ratio is calculated without reduction for fees paid indirectly for expense offset arrangements. The net expense ratios are 1.95%, 1.95%, 1.95%, 1.95% and 1.95%, for the years ended October 31, 2015, 2014, 2013, 2012 and 2011, respectively, after taking into account these expense reductions. |
| 5 | This expense decrease is reflected in both the net expense and the net investment income (loss) ratios shown above. |
See Notes which are an integral part of the Financial Statements
Annual Shareholder Report
Statement of Assets and Liabilities
October 31, 2015
| Assets: | | |
| Total investment in securities, at value including $1,176,859,702 of securities loaned, $1,863,219,542 of investment in affiliated holdings and $858,901,656 of investment in affiliated companies (Note 5) (identified cost $5,078,886,546) | | $6,756,219,579 |
| Cash | | 3,783,178 |
| Cash denominated in foreign currencies (identified cost $9,758) | | 9,581 |
| Income receivable | | 642,445 |
| Receivable for investments sold | | 21,994,812 |
| Receivable for shares sold | | 2,690,215 |
| TOTAL ASSETS | | 6,785,339,810 |
| Liabilities: | | |
| Payable for investments purchased | $10,759,184 | |
| Payable for shares redeemed | 3,620,429 | |
| Payable for collateral due to broker for securities lending | 1,211,126,225 | |
| Payable to adviser (Note 5) | 387,240 | |
| Payable for distribution services fee (Note 5) | 1,300,177 | |
| Payable for other service fees (Notes 2 and 5) | 2,913,726 | |
| Accrued expenses (Note 5) | 1,431,637 | |
| TOTAL LIABILITIES | | 1,231,538,618 |
| Net assets for 932,366,326 shares outstanding | | $5,553,801,192 |
| Net Assets Consist of: | | |
| Paid-in capital | | $3,176,790,179 |
| Net unrealized appreciation of investments and translation of assets and liabilities in foreign currency | | 1,677,332,856 |
| Accumulated net realized gain on investments and foreign currency transactions | | 772,865,508 |
| Distributions in excess of net investment income | | (73,187,351) |
| TOTAL NET ASSETS | | $5,553,801,192 |
Annual Shareholder Report
Statement of Assets and Liabilities–continued
Net Asset Value, Offering Price and Redemption
Proceeds Per Share | | |
| Class A Shares: | | |
| Net asset value per share ($1,582,916,302 ÷ 262,956,171 shares outstanding), no par value, unlimited shares authorized | | $6.02 |
| Offering price per share (100/94.50 of $6.02) | | $6.37 |
| Redemption proceeds per share | | $6.02 |
| Class B Shares: | | |
| Net asset value per share ($99,776,886 ÷ 18,611,295 shares outstanding), no par value, unlimited shares authorized | | $5.36 |
| Offering price per share | | $5.36 |
| Redemption proceeds per share (94.50/100 of $5.36) | | $5.07 |
| Class C Shares: | | |
| Net asset value per share ($418,925,805 ÷ 78,201,549 shares outstanding), no par value, unlimited shares authorized | | $5.36 |
| Offering price per share | | $5.36 |
| Redemption proceeds per share (99.00/100 of $5.36) | | $5.31 |
| Class R Shares: | | |
| Net asset value per share ($3,452,182,199 ÷ 572,597,311 shares outstanding), no par value, unlimited shares authorized | | $6.03 |
| Offering price per share | | $6.03 |
| Redemption proceeds per share | | $6.03 |
See Notes which are an integral part of the Financial Statements
Annual Shareholder Report
Statement of Operations
Year Ended October 31, 2015
| Investment Income: | | | |
| Dividends (including $1,500,715 received from affiliated holdings (Note 5) and net of foreign taxes withheld of $253,603) | | | $33,610,694 |
| Interest (including income on securities loaned of $8,622,303) | | | 8,830,722 |
| TOTAL INCOME | | | 42,441,416 |
| Expenses: | | | |
| Investment adviser fee (Note 5) | | $75,550,788 | |
| Administrative fee (Note 5) | | 4,548,097 | |
| Custodian fees | | 389,325 | |
| Transfer agent fee (Note 2) | | 5,908,208 | |
| Directors'/Trustees' fees (Note 5) | | 43,651 | |
| Auditing fees | | 39,699 | |
| Legal fees | | 9,612 | |
| Portfolio accounting fees | | 205,088 | |
| Distribution services fee (Note 5) | | 26,366,600 | |
| Other service fees (Notes 2 and 5) | | 14,490,347 | |
| Share registration costs | | 142,101 | |
| Printing and postage | | 255,771 | |
| Miscellaneous (Note 5) | | 33,116 | |
| TOTAL EXPENSES | | 127,982,403 | |
| Waivers, Reimbursement and Reduction: | | | |
| Waiver/reimbursement of investment adviser fee (Note 5) | $(1,455,224) | | |
| Waiver of other operating expenses (Note 5) | (10,012,679) | | |
Fees paid indirectly from directed brokerage
arrangements (Note 6) | (40,154) | | |
| TOTAL WAIVERS, REIMBURSEMENT AND REDUCTION | | (11,508,057) | |
| Net expenses | | | 116,474,346 |
| Net investment income (loss) | | | (74,032,930) |
| Realized and Unrealized Gain (Loss) on Investments and Foreign Currency Transactions: | | | |
| Net realized gain on investments and foreign currency transactions (including realized gain of $63,754,900 on sales of investments in affiliated companies (Note 5)) | | | 795,735,526 |
| Net change in unrealized appreciation of investments and translation of assets and liabilities in foreign currency | | | (370,097,703) |
| Net realized and unrealized gain on investments and foreign currency transactions | | | 425,637,823 |
| Change in net assets resulting from operations | | | $351,604,893 |
See Notes which are an integral part of the Financial Statements
Annual Shareholder Report
Statement of Changes in Net Assets
| Year Ended October 31 | 2015 | 2014 |
| Increase (Decrease) in Net Assets | | |
| Operations: | | |
| Net investment income (loss) | $(74,032,930) | $(73,880,016) |
| Net realized gain on investments, futures contracts and foreign currency transactions | 795,735,526 | 894,185,898 |
| Net change in unrealized appreciation/depreciation of investments and translation of assets and liabilities in foreign currency | (370,097,703) | (70,384,858) |
| CHANGE IN NET ASSETS RESULTING FROM OPERATIONS | 351,604,893 | 749,921,024 |
| Distributions to Shareholders: | | |
| Distributions from net realized gain on investments, futures contracts and foreign currency transactions | | |
| Class A Shares | (223,114,494) | (198,779,147) |
| Class B Shares | (18,974,403) | (21,904,125) |
| Class C Shares | (67,412,650) | (61,119,850) |
| Class R Shares | (503,565,538) | (439,822,561) |
| CHANGE IN NET ASSETS RESULTING FROM DISTRIBUTIONS TO SHAREHOLDERS | (813,067,085) | (721,625,683) |
| Share Transactions: | | |
| Proceeds from sale of shares | 379,428,833 | 298,150,900 |
| Net asset value of shares issued to shareholders in payment of distributions declared | 757,424,298 | 676,099,177 |
| Cost of shares redeemed | (721,145,444) | (861,353,432) |
| CHANGE IN NET ASSETS RESULTING FROM SHARE TRANSACTIONS | 415,707,687 | 112,896,645 |
| Change in net assets | (45,754,505) | 141,191,986 |
| Net Assets: | | |
| Beginning of period | 5,599,555,697 | 5,458,363,711 |
| End of period (including undistributed (distributions in excess of) net investment income of $(73,187,351) and $0, respectively) | $5,553,801,192 | $5,599,555,697 |
See Notes which are an integral part of the Financial Statements
Annual Shareholder Report
Notes to Financial Statements
October 31, 2015
1. ORGANIZATION
Federated Equity Funds (the “Trust”) is registered under the Investment Company Act of 1940, as amended (the “Act”), as an open-end management investment company. The Trust consists of 14 diversified portfolios. The financial statements included herein are only those of Federated Kaufmann Fund (the “Fund”), a diversified portfolio. The financial statements of the other portfolios are presented separately. The assets of each portfolio are segregated and a shareholder's interest is limited to the portfolio in which shares are held. Each portfolio pays its own expenses. The Fund offers four classes of shares: Class A Shares, Class B Shares, Class C Shares and Class R Shares. All shares of the Fund have equal rights with respect to voting, except on class-specific matters. The financial highlights of Class A Shares, Class B Shares and Class C Shares are presented separately. The investment objective of the Fund is to provide capital appreciation.
2. SIGNIFICANT ACCOUNTING POLICIES
The following is a summary of significant accounting policies consistently followed by the Fund in the preparation of its financial statements. These policies are in conformity with U.S. generally accepted accounting principles (GAAP).
Investment Valuation
In calculating its net asset value (NAV), the Fund generally values investments as follows:
| ■ | Equity securities listed on an exchange or traded through a regulated market system are valued at their last reported sale price or official closing price in their principal exchange or market. |
| ■ | Shares of other mutual funds or non-exchange-traded investment companies are valued based upon their reported NAVs. |
| ■ | Fixed-income securities acquired with remaining maturities greater than 60 days are fair valued using price evaluations provided by a pricing service approved by the Trustees. |
| ■ | Fixed-income securities and repurchase agreements acquired with remaining maturities of 60 days or less are valued at their cost (adjusted for the accretion of any discount or amortization of any premium), unless the issuer's creditworthiness is impaired or other factors indicate that amortized cost is not an accurate estimate of the investment's fair value, in which case it would be valued in the same manner as a longer-term security. |
| ■ | Derivative contracts listed on exchanges are valued at their reported settlement or closing price, except that options are valued at the mean of closing bid and asked quotations. |
| ■ | Over-the-counter (OTC) derivative contracts are fair valued using price evaluations provided by a pricing service approved by the Trustees. |
| ■ | For securities that are fair valued in accordance with procedures established by and under the general supervision of the Trustees, certain factors may be considered such as: the last traded or purchase price of the security, information obtained by contacting the issuer or dealers, analysis of the issuer's financial statements or other available documents, fundamental analytical data, the nature and duration of restrictions on disposition, the movement of the market in which the security is normally traded, public trading in similar securities or derivative contracts of the issuer or comparable issuers, movement of a relevant index, or other factors including but not limited to industry changes and relevant government actions. |
Annual Shareholder Report
If any price, quotation, price evaluation or other pricing source is not readily available when the NAV is calculated, or if the Fund cannot obtain price evaluations from a pricing service or from more than one dealer for an investment within a reasonable period of time as set forth in the Fund's valuation policies and procedures, the Fund uses the fair value of the investment determined in accordance with the procedures described below. There can be no assurance that the Fund could obtain the fair value assigned to an investment if it sold the investment at approximately the time at which the Fund determines its NAV per share.
Fair Valuation and Significant Events Procedures
The Trustees have ultimate responsibility for determining the fair value of investments for which market quotations are not readily available. The Trustees have appointed a valuation committee (“Valuation Committee”) comprised of officers of the Fund, Federated Equity Management Company of Pennsylvania (“Adviser”) and certain of the Adviser's affiliated companies to assist in determining fair value and in overseeing the calculation of the NAV. The Trustees have also authorized the use of pricing services recommended by the Valuation Committee to provide fair value evaluations of the current value of certain investments for purposes of calculating the NAV. The Valuation Committee employs various methods for reviewing third-party pricing-service evaluations including periodic reviews of third-party pricing services' policies, procedures and valuation methods (including key inputs, methods, models and assumptions), transactional back-testing, comparisons of evaluations of different pricing services, and review of price challenges by the Adviser based on recent market activity. In the event that market quotations and price evaluations are not available for an investment, the Valuation Committee determines the fair value of the investment in accordance with procedures adopted by the Trustees. The Trustees periodically review and approve the fair valuations made by the Valuation Committee and any changes made to the procedures.
Factors considered by pricing services in evaluating an investment include the yields or prices of investments of comparable quality, coupon, maturity, call rights and other potential prepayments, terms and type, reported transactions, indications as to values from dealers and general market conditions. Some pricing services provide a single price evaluation reflecting the bid-side of the market for an investment (a “bid” evaluation). Other pricing services offer both bid evaluations and price evaluations indicative of a price between the prices bid and asked for the investment (a “mid” evaluation). The Fund normally uses bid evaluations for any U.S. Treasury and Agency securities, mortgage-backed securities and municipal securities. The Fund normally uses mid evaluations for any other types of fixed-income securities and any OTC derivative contracts. In the event that market quotations and price evaluations are not available for an investment, the fair value of the investment is determined in accordance with procedures adopted by the Trustees.
The Trustees also have adopted procedures requiring an investment to be priced at its fair value whenever the Adviser determines that a significant event affecting the value of the investment has occurred between the time as of which the price of the investment would otherwise be determined and the time as of which the NAV is computed. An event is considered significant if there is both an affirmative expectation that the investment's value will change in response to the event and a reasonable basis for quantifying the resulting change in value. Examples of significant events that may occur after the close of the principal market on which a security is traded, or after the time of a price evaluation provided by a pricing service or a dealer, include:
| ■ | With respect to securities traded principally in foreign markets, significant trends in U.S. equity markets or in the trading of foreign securities index futures contracts; |
Annual Shareholder Report
| ■ | Political or other developments affecting the economy or markets in which an issuer conducts its operations or its securities are traded; |
| ■ | Announcements concerning matters such as acquisitions, recapitalizations, litigation developments, or a natural disaster affecting the issuer's operations or regulatory changes or market developments affecting the issuer's industry. |
The Trustees have adopted procedures whereby the Valuation Committee uses a pricing service to determine the fair value of equity securities traded principally in foreign markets when the Adviser determines that there has been a significant trend in the U.S. equity markets or in index futures trading. For other significant events, the Fund may seek to obtain more current quotations or price evaluations from alternative pricing sources. If a reliable alternative pricing source is not available, the Fund will determine the fair value of the investment in accordance with the fair valuation procedures approved by the Trustees. The Trustees have ultimate responsibility for any fair valuations made in response to a significant event.
Repurchase Agreements
The Fund may invest in repurchase agreements for short-term liquidity purposes. It is the policy of the Fund to require the other party to a repurchase agreement to transfer to the Fund's custodian or sub-custodian eligible securities or cash with a market value (after transaction costs) at least equal to the repurchase price to be paid under the repurchase agreement. The eligible securities are transferred to accounts with the custodian or sub-custodian in which the Fund holds a “securities entitlement” and exercises “control” as those terms are defined in the Uniform Commercial Code. The Fund has established procedures for monitoring the market value of the transferred securities and requiring the transfer of additional eligible securities if necessary to equal at least the repurchase price. These procedures also allow the other party to require securities to be transferred from the account to the extent that their market value exceeds the repurchase price or in exchange for other eligible securities of equivalent market value.
The insolvency of the other party or other failure to repurchase the securities may delay the disposition of the underlying securities or cause the Fund to receive less than the full repurchase price. Under the terms of the repurchase agreement, any amounts received by the Fund in excess of the repurchase price and related transaction costs must be remitted to the other party.
The Fund may enter into repurchase agreements in which eligible securities are transferred into joint trading accounts maintained by the custodian or sub-custodian for investment companies and other clients advised by the Fund's Adviser and its affiliates. The Fund will participate on a pro rata basis with the other investment companies and clients in its share of the securities transferred under such repurchase agreements and in its share of proceeds from any repurchase or other disposition of such securities.
Annual Shareholder Report
Investment Income, Gains and Losses, Expenses and Distributions
Investment transactions are accounted for on a trade-date basis. Realized gains and losses from investment transactions are recorded on an identified-cost basis. Interest income and expenses are accrued daily. Dividend income and distributions to shareholders are recorded on the ex-dividend date. Foreign dividends are recorded on the ex-dividend date or when the Fund is informed of the ex-dividend date. Distributions of net investment income, if any, are declared and paid annually. Non-cash dividends included in dividend income, if any, are recorded at fair value. Investment income, realized and unrealized gains and losses, and certain fund-level expenses are allocated to each class based on relative average daily net assets, except that Class A Shares, Class B Shares, Class C Shares and Class R Shares may bear distribution services fees, other service fees and transfer agent fees unique to those classes. For the year ended October 31, 2015, transfer agent fees for the Fund were as follows:
| | Transfer
Agent Fees
Incurred |
| Class A Shares | $1,775,593 |
| Class B Shares | 125,658 |
| Class C Shares | 476,277 |
| Class R Shares | 3,530,680 |
| TOTAL | $5,908,208 |
Dividends are declared separately for each class. No class has preferential dividend rights; differences in per share dividend rates are generally due to differences in separate class expenses.
Other Service Fees
The Fund may pay other service fees up to 0.25% of the average daily net assets of the Fund's Class A Shares, Class B Shares, Class C Shares and Class R Shares to financial intermediaries or to Federated Shareholder Services Company (FSSC) for providing services to shareholders and maintaining shareholder accounts. Financial intermediaries may include a company affiliated with management of Federated Investors, Inc. A financial intermediary affiliated with management of Federated Investors, Inc. received $23,119 of other services for the year ended October 31, 2015. Subject to the terms described in the Expense Limitation note, FSSC may voluntarily reimburse the Fund for other service fees. For the year ended October 31, 2015, other service fees for the Fund were as follows:
| | Other Service
Fees
Incurred |
| Class A Shares | $4,058,361 |
| Class B Shares | 287,928 |
| Class C Shares | 1,091,724 |
| Class R Shares | 9,052,334 |
| TOTAL | $14,490,347 |
Annual Shareholder Report
Premium and Discount Amortization
All premiums and discounts on fixed-income securities are amortized/accreted using the effective-interest-rate method.
Federal Taxes
It is the Fund's policy to comply with the Subchapter M provision of the Internal Revenue Code (the “Code”) and to distribute to shareholders each year substantially all of its income. Accordingly, no provision for federal income tax is necessary. As of and during the year ended October 31, 2015, the Fund did not have a liability for any uncertain tax positions. The Fund recognizes interest and penalties, if any, related to tax liabilities as income tax expense in the Statement of Operations. As of October 31, 2015, tax years 2012 through 2015 remain subject to examination by the Fund's major tax jurisdictions, which include the United States of America and the Commonwealth of Massachusetts.
The Fund may be subject to taxes imposed by governments of countries in which it invests. Such taxes are generally based on either income or gains earned or repatriated. The Fund accrues and applies such taxes to net investment income, net realized gains and net unrealized gains as income and/or gains are earned.
When-Issued and Delayed-Delivery Transactions
The Fund may engage in when-issued or delayed-delivery transactions. The Fund records when-issued securities on the trade date and maintains security positions such that sufficient liquid assets will be available to make payment for the securities purchased. Securities purchased on a when-issued or delayed-delivery basis are marked to market daily and begin earning interest on the settlement date. Losses may occur on these transactions due to changes in market conditions or the failure of counterparties to perform under the contract.
Futures Contracts
The Fund purchases and sells financial futures contracts to manage cash flows and duration, enhance yield and to potentially reduce transaction costs. Upon entering into a financial futures contract with a broker, the Fund is required to deposit in a segregated account a specified amount of cash or U.S. government securities. Futures contracts are valued daily and unrealized gains or losses are recorded in a “variation margin” account. Daily, the Fund receives from or pays to the broker a specified amount of cash based upon changes in the variation margin account. When a contract is closed, the Fund recognizes a realized gain or loss. Futures contracts have market risks, including the risk that the change in the value of the contract may not correlate with the changes in the value of the underlying securities. There is minimal counterparty risk to the Fund since futures are exchange traded and the exchange's clearing house, as counterparty to all exchange traded futures, guarantees the futures against default.
At October 31, 2015, the Fund had no outstanding futures contracts.
Foreign Exchange Contracts
The Fund enters into foreign exchange contracts for the delayed delivery of securities or foreign currency exchange transactions. The Fund enters into foreign exchange contracts to protect assets against adverse changes in foreign currency exchange rates or exchange control regulations. Purchased contracts are used to acquire exposure to foreign currencies, whereas, contracts to sell are used to hedge the Fund's securities against currency fluctuations. Risks may arise upon entering into these transactions from the potential inability
Annual Shareholder Report
of counterparties to meet the terms of their commitments and from unanticipated movements in security prices or foreign exchange rates. The foreign exchange contracts are adjusted by the daily exchange rate of the underlying currency and any gains or losses are recorded for financial statement purposes as unrealized until the settlement date.
At October 31, 2015, the Fund had no outstanding foreign exchange contracts.
The average value at settlement date payable and receivable of foreign exchange contracts purchased and sold by the Fund throughout the period was $131 and $1,982, respectively. This is based on the contracts held as of each month-end throughout the fiscal period.
Foreign Currency Translation
The accounting records of the Fund are maintained in U.S. dollars. All assets and liabilities denominated in foreign currencies (FCs) are translated into U.S. dollars based on the rates of exchange of such currencies against U.S. dollars on the date of valuation. Purchases and sales of securities, income and expenses are translated at the rate of exchange quoted on the respective date that such transactions are recorded. The Fund does not isolate that portion of the results of operations resulting from changes in foreign exchange rates on investments from the fluctuations arising from changes in market prices of securities held. Such fluctuations are included with the net realized and unrealized gain or loss from investments.
Reported net realized foreign exchange gains or losses arise from sales of portfolio securities, sales and maturities of short-term securities, sales of FCs, currency gains or losses realized between the trade and settlement dates on securities transactions, the difference between the amounts of dividends, interest and foreign withholding taxes recorded on the Fund's books, and the U.S. dollar equivalent of the amounts actually received or paid. Net unrealized foreign exchange gains and losses arise from changes in the value of assets and liabilities other than investments in securities at fiscal year end, resulting from changes in the exchange rate.
Additional Disclosure Related to Derivative Instruments
The Effect of Derivative Instruments on the Statement of Operations for the Year Ended October 31, 2015
| Amount of Realized Gain or (Loss) on Derivatives Recognized in Income |
| | Forward
Currency
Contracts |
| Foreign exchange contracts | $5,036 |
Securities Lending
The Fund participates in a securities lending program providing for the lending of equity securities to qualified brokers. The Fund normally receives cash collateral for securities loaned that is invested in an affiliated money market fund or in short-term securities including repurchase agreements. Collateral is maintained at a minimum level of 100% of the market value of investments loaned, plus interest, if applicable. Earnings on collateral are allocated between the borrower of the security, the securities lending agent, as a fee for its services under the program and the Fund, according to agreed-upon rates.
Annual Shareholder Report
Securities lending transactions are subject to Master Netting Agreements which are agreements between the Fund and its counterparties that provide for the net settlement of all transactions and collateral with the Fund, through a single payment, in the event of default or termination. Amounts presented on the Portfolio of Investments and Statement of Assets and Liabilities are not net settlement amount but gross. As indicated below, the cash collateral received by the Fund exceeds the market value of the securities loaned reducing the net settlement amount to zero. The chart below identifies the amount of collateral received as well as the market value of securities on loan. Additionally, the securities lending agreement executed by the Fund includes an indemnification clause. This clause stipulates that the borrower will reimburse the Fund for any losses as a result of any failure of the borrower to return equivalent securities to the Fund.
As of October 31, 2015, securities subject to this type of arrangement and related collateral were as follows:
Market Value of
Securities Loaned | Market Value
of Collateral |
| $1,176,859,702 | $1,211,126,225 |
Restricted Securities
The Fund may purchase securities which are considered restricted. Restricted securities are securities that either: (a) cannot be offered for public sale without first being registered, or being able to take advantage of an exemption from registration, under the Securities Act of 1933; or (b) are subject to contractual restrictions on public sales. In some cases, when a security cannot be offered for public sale without first being registered, the issuer of the restricted security has agreed to register such securities for resale, at the issuer's expense, either upon demand by the Fund or in connection with another registered offering of the securities. Many such restricted securities may be resold in the secondary market in transactions exempt from registration. Restricted securities may be determined to be liquid under criteria established by the Trustees. The Fund will not incur any registration costs upon such resales. The Fund's restricted securities, like other securities, are priced in accordance with procedures established by and under the general supervision of the Trustees.
Annual Shareholder Report
Additional information on restricted securities, excluding securities purchased under Rule 144A that have been deemed liquid by the Trustees, if applicable, held at October 31, 2015, is as follows:
| Security | Acquisition Date | Cost | Market Value |
| Apollo Investment Fund V | 5/18/2001 | $0 | $374,619 |
| aTyr Pharma, Inc., Pfd., Series E | 3/31/2015 | $2,014,999 | $2,244,752 |
| BioNano Genomics, Inc., 3/31/2016 | 11/12/2014 | $2,908 | $582 |
| BioNano Genomics, Inc., Pfd., Series C | 11/12/2014 | $9,800,000 | $1,960,000 |
| Denovo Ventures I LP | 3/9/2000 | $2,210,578 | $82,218 |
| Expand Networks Ltd. | 9/22/2000 | $2,500,000 | $0 |
| FA Private Equity Fund IV LP | 3/4/2002 | $71,148 | $584,562 |
| Infrastructure Fund | 8/11/2000 | $404,496 | $0 |
| Latin Healthcare Fund | 11/28/2000 | $0 | $458,699 |
| Minerva Neurosciences, Inc. | 3/13/2015 | $10,197,200 | $11,108,800 |
| Multiplex, Inc., Pfd., Series C | 2/22/2001 | $5,000,001 | $0 |
| Peachtree Leadscope LLC | 6/30/2000 | $674,115 | $0 |
| Peachtree Open Networks | 10/5/2000 | $892,599 | $0 |
| Sensable Technologies, Inc. | 10/15/2004 | $0 | $0 |
| SteadyMed Ltd. | 1/26/2015 | $1,000,000 | $332,241 |
Other
The preparation of financial statements in conformity with GAAP requires management to make estimates and assumptions that affect the amounts of assets, liabilities, expenses and revenues reported in the financial statements. Actual results could differ from those estimated. The Fund applies Investment Company accounting and reporting guidance.
3. SHARES OF BENEFICIAL INTEREST
The following tables summarize share activity:
| Year Ended October 31 | 2015 | 2014 |
| Class A Shares: | Shares | Amount | Shares | Amount |
| Shares sold | 38,018,099 | $237,109,705 | 29,164,062 | $184,853,054 |
| Shares issued to shareholders in payment of distributions declared | 35,592,545 | 207,148,613 | 30,042,638 | 184,161,373 |
| Shares redeemed | (45,711,838) | (285,100,238) | (53,075,292) | (336,676,934) |
| NET CHANGE RESULTING FROM CLASS A SHARE TRANSACTIONS | 27,898,806 | $159,158,080 | 6,131,408 | $32,337,493 |
Annual Shareholder Report
| Year Ended October 31 | 2015 | 2014 |
| Class B Shares: | Shares | Amount | Shares | Amount |
| Shares sold | 2,230,689 | $12,510,599 | 1,885,469 | $10,967,974 |
| Shares issued to shareholders in payment of distributions declared | 3,499,669 | 18,233,272 | 3,744,894 | 20,971,407 |
| Shares redeemed | (7,717,708) | (43,126,207) | (11,229,301) | (64,984,855) |
| NET CHANGE RESULTING FROM CLASS B SHARE TRANSACTIONS | (1,987,350) | $(12,382,336) | (5,598,938) | $(33,045,474) |
| Year Ended October 31 | 2015 | 2014 |
| Class C Shares: | Shares | Amount | Shares | Amount |
| Shares sold | 9,311,606 | $51,326,976 | 6,214,246 | $35,647,153 |
| Shares issued to shareholders in payment of distributions declared | 10,764,151 | 55,973,588 | 8,988,817 | 50,337,374 |
| Shares redeemed | (13,148,648) | (73,097,107) | (14,649,164) | (84,954,471) |
| NET CHANGE RESULTING FROM CLASS C SHARE TRANSACTIONS | 6,927,109 | $34,203,457 | 553,899 | $1,030,056 |
| Year Ended October 31 | 2015 | 2014 |
| Class R Shares: | Shares | Amount | Shares | Amount |
| Shares sold | 12,561,731 | $78,481,553 | 10,541,810 | $66,682,719 |
| Shares issued to shareholders in payment of distributions declared | 81,658,916 | 476,068,825 | 68,506,356 | 420,629,023 |
| Shares redeemed | (51,098,433) | (319,821,892) | (58,705,702) | (374,737,172) |
| NET CHANGE RESULTING FROM CLASS R SHARE TRANSACTIONS | 43,122,214 | $234,728,486 | 20,342,464 | $112,574,570 |
| NET CHANGE RESULTING FROM TOTAL FUND SHARE TRANSACTIONS | 75,960,779 | $415,707,687 | 21,428,833 | $112,896,645 |
Redemption Fee
The Fund's Class R Shares imposes a redemption fee of 0.20% on the redemption price of the Fund's Class R Shares redeemed, if such shares were purchased after February 1, 1985. The redemption fee is applied to the Fund's Class R Shares expenses for providing redemption services, including, but not limited to: transfer agent fees, postage, printing, telephone and related employment costs. Any excess fee proceeds are added to the Fund's assets. Excess fee proceeds, if any, are added to the Fund's assets. Shares acquired through employer-sponsored retirement plans will not be subject to the redemption fee. However, if shares are purchased for a retirement plan account through a broker, financial institution or other intermediary maintaining an omnibus account for the shares, the waiver may not apply. In addition, this waiver does not apply to individual retirement accounts, such as Traditional, Roth and SEP-IRAs. For the year ended October 31, 2015 and October 31, 2014, redemption fees of $496,244 and $508,175, respectively, were allocated to cover the cost of redemptions.
Annual Shareholder Report
4. FEDERAL TAX INFORMATION
The timing and character of income and capital gain distributions are determined in accordance with income tax regulations, which may differ from GAAP. These differences are primarily due to differing treatments for foreign currency transactions, partnership adjustments, passive foreign investment company gains and losses and equalization.
For the year ended October 31, 2015, permanent differences identified and reclassified among the components of net assets were as follows:
| Increase (Decrease) |
| Paid-In Capital | Undistributed
Net Investment
Income (Loss) | Accumulated
Net Realized
Gain (Loss) |
| $1,948 | $845,579 | $(847,527) |
Net investment income (loss), net realized gains (losses), and net assets were not affected by this reclassification.
The tax character of distributions as reported on the Statement of Changes in Net Assets for the years ended October 31, 2015 and 2014, was as follows:
| | 2015 | 2014 |
| Ordinary income1 | $1,624,286 | $— |
| Long-term capital gains | $811,442,799 | $721,625,683 |
| 1 | For tax purposes, short-term capital gain distributions are considered ordinary income distributions. |
As of October 31, 2015, the components of distributable earnings on a tax basis were as follows:
| Undistributed long-term capital gains | $796,272,871 |
| Net unrealized appreciation | $1,644,386,350 |
| Capital loss carryforwards and deferrals | $(63,648,208) |
The difference between book-basis and tax-basis net unrealized appreciation/depreciation is attributable to differing treatments for passive foreign investment company gains and losses, the deferral of losses on wash sales and partnership adjustments.
At October 31, 2015, the cost of investments for federal tax purposes was $5,111,833,052. The net unrealized appreciation of investments for federal tax purposes excluding any unrealized depreciation resulting from the translation from FCs to U.S. dollars of assets and liabilities other than investments in securities was $1,644,386,527. This consists of net unrealized appreciation from investments for those securities having an excess of value over cost of $1,812,538,176 and net unrealized depreciation from investments for those securities having an excess of cost over value of $168,151,649.
Under current tax rules, a late-year ordinary loss may be deferred, in whole or in part, and treated as occurring on the first day of the following fiscal year. As of October 31, 2015, for federal income tax purposes, a late year ordinary loss of $63,648,208 was deferred to November 1, 2015.
Annual Shareholder Report
5. INVESTMENT ADVISER FEE AND OTHER TRANSACTIONS WITH AFFILIATES
Investment Adviser Fee
The advisory agreement between the Fund and the Adviser provides for an annual fee equal to 1.30% of the Fund's average daily net assets. Prior to June 27, 2014, the annual advisory fee was 1.425% of the Fund's average daily net assets. Pursuant to the settlement of certain litigation, the Adviser has agreed, for a period continuing through June 30, 2022, to waive its investment advisory fee so that such fee will not exceed 1.275%. Also, as part of the settlement agreement, effective July 1, 2012 and continuing through June 30, 2022, the Adviser has agreed to further waive the advisory fee by an additional 0.02%, 0.04%, 0.06% or 0.07% if the Fund's net assets exceed eight, nine, ten or twelve billion dollars, respectively. Subject to the terms described in the Expense Limitation note, the Adviser may voluntarily choose to waive any portion of its fee. For the year ended October 31, 2015, the Adviser voluntarily waived $480,222 of its fee.
Certain of the Fund's assets are managed by Federated Global Investment Management Corp. (the “Sub-Adviser”). Under the terms of a sub-advisory agreement between the Adviser and the Sub-Adviser, the Sub-Adviser receives an allocable portion of the Fund's adviser fee. The fee is paid by the Adviser out of its resources and is not an incremental Fund expense. For the year ended October 31, 2015, the Sub-Adviser earned a fee of $62,007,200.
Administrative Fee
Federated Administrative Services (FAS), under the Administrative Services Agreement, provides the Fund with administrative personnel and services. For purposes of determining the appropriate rate breakpoint, “Investment Complex” is defined as all of the Federated Funds subject to a fee under the Administrative Services Agreement. The fee paid to FAS is based on the average daily net assets of the Investment Complex as specified below, plus certain out-of-pocket expenses:
| Administrative Fee | Average Daily Net Assets
of the Investment Complex |
| 0.150% | on the first $5 billion |
| 0.125% | on the next $5 billion |
| 0.100% | on the next $10 billion |
| 0.075% | on assets in excess of $20 billion |
Subject to the terms described in the Expense Limitation note, FAS may voluntarily choose to waive any portion of its fee. For the year ended October 31, 2015, the annualized fee paid to FAS was 0.078% of average daily net assets of the Fund.
Annual Shareholder Report
Distribution Services Fee
The Fund has adopted a Distribution Plan (the “Plan”) pursuant to Rule 12b-1 under the Act. Under the terms of the Plan, the Fund will compensate Federated Securities Corp. (FSC), the principal distributor, from the daily net assets of the Fund's Class A Shares, Class B Shares, Class C Shares and Class R Shares to finance activities intended to result in the sale of these shares. The Plan provides that the Fund may incur distribution expenses at the following percentages of average daily net assets annually, to compensate FSC:
| Share Class Name | Percentage of Average Daily
Net Assets of Class |
| Class A Shares | 0.25% |
| Class B Shares | 0.75% |
| Class C Shares | 0.75% |
| Class R Shares | 0.50% |
Subject to the terms described in the Expense Limitation note, FSC may voluntarily choose to waive any portion of its fee. For the year ended October 31, 2015, distribution services fees for the Fund were as follows:
| | Distribution Services
Fees Incurred | Distribution Services
Fees Waived |
| Class A Shares | $4,071,048 | $(422,477) |
| Class B Shares | 863,784 | — |
| Class C Shares | 3,275,172 | — |
| Class R Shares | 18,156,596 | (9,590,202) |
| TOTAL | $26,366,600 | $(10,012,679) |
When FSC receives fees, it may pay some or all of them to financial intermediaries whose customers purchase shares. For the year ended October 31, 2015, FSC retained $12,409,450 of fees paid by the Fund.
Sales Charges
Front-end sales charges and contingent deferred sales charges (CDSC) do not represent expenses of the Fund. They are deducted from the proceeds of sales of Fund shares prior to investment or from redemption proceeds prior to remittance, as applicable. For the year ended October 31, 2015, FSC retained $147,882 in sales charges from the sale of Class A Shares. FSC also retained $2,828 of CDSC relating to redemptions of Class A Shares, $103,014 relating to redemptions of Class B Shares and $10,383 relating to redemptions of Class C Shares.
Other Service Fees
For the year ended October 31, 2015 FSSC received $6,538,712 of other service fees disclosed in Note 2.
Annual Shareholder Report
Commitments and Contingencies
In the course of pursuing its investment objective, the Fund sometimes invests in limited partnerships and limited liability companies. These entities often require the Fund to commit to a total dollar amount to be invested. The actual investments are usually made in installments over a period of time. At October 31, 2015, the Fund had total commitments to limited partnerships and limited liability companies of $41,000,000; of this amount, $40,299,969 was actually invested by the Fund leaving the Fund contingently liable for additional investments of $700,031.
Expense Limitation
The Adviser and certain of its affiliates (which may include FSC, FAS and FSSC) on their own initiative have agreed to waive certain amounts of their respective fees and/or reimburse expenses. Total annual fund operating expenses (as shown in the financial highlights, excluding expenses allocated from affiliated partnerships, extraordinary expenses and proxy-related expenses paid by the Fund, if any) paid by the Fund's Class A Shares, Class B Shares, Class C Shares and Class R Shares (after the voluntary waivers and/or reimbursements) will not exceed 1.95%, 2.50%, 2.50% and 1.95% (the “Fee Limit”), respectively, up to but not including the later of (the “Termination Date”): (a) January 1, 2017; or (b) the date of the Fund's next effective Prospectus. While the Adviser and its applicable affiliates currently do not anticipate terminating or increasing these arrangements prior to the Termination Date, these arrangements may only be terminated or the Fee Limit increased prior to the Termination Date with the agreement of the Trustees.
Interfund Transactions
During the year ended October 31, 2015, the Fund engaged in purchase and sale transactions with funds that have a common investment adviser (or affiliated investment advisers), common Directors/Trustees, and/or common Officers. These purchase and sale transactions complied with Rule 17a-7 under the Act and amounted to $40,385,519 and $77,383,414, respectively.
General
Certain Officers and Trustees of the Fund are Officers and Directors or Trustees of certain of the above companies. To efficiently facilitate payment, Directors'/Trustees' fees and certain expenses related to conducting meetings of the Directors/Trustees and other miscellaneous expenses are paid by an affiliate of the Adviser which in due course are reimbursed by the Fund. Such expenses may be included in Accrued and Miscellaneous Expenses on the Statement of Assets and Liabilities and Statement of Operations, respectively.
Annual Shareholder Report
Transactions Involving Affiliated Companies and Affiliated Holdings
An affiliated company is a company in which the Fund, alone or in combination with other affiliated funds, has ownership of at least 5% of the voting shares. Transactions with affiliated companies during the year ended October 31, 2015, were as follows:
| Affiliates | Balance of
Shares Held
10/31/2014 | Purchases/
Additions | Sales/
Reductions | Balance of
Shares Held
10/31/2015 | Value | Dividend/
Interest
Income |
| BioDelivery Sciences International, Inc. | 3,857,147 | 728,853 | (2,161,000) | 2,425,000 | $13,046,500 | $— |
| Catalyst Pharmaceutical Partners, Inc. | — | 3,000,000 | — | 3,000,000 | 9,480,000 | — |
| ChannelAdvisor Corp. | 1,526,423 | 192,157 | (518,580) | 1,200,000 | 10,464,000 | — |
Corcept
Therapeutics, Inc. | 11,152,915 | 1,287,053 | — | 12,439,968 | 45,903,482 | — |
**Corcept
Therapeutics, Inc., 3/29/2015 | 797,358 | — | (797,358) | — | — | — |
| *Dexcom, Inc. | 3,389,253 | — | (1,509,253) | 1,880,000 | 156,641,600 | — |
| *Dexcom, Inc. | 126,065 | — | — | 126,065 | 10,503,736 | — |
| Dyax Corp. | 12,850,000 | — | (3,850,000) | 9,000,000 | 247,770,000 | — |
| Dynavax Technologies Corp. | — | 1,816,759 | — | 1,816,759 | 41,258,597 | — |
| **Dynavax Technologies Corp. | 11,744,600 | — | (11,744,600) | — | — | — |
| **Dynavax Technologies Corp., 4/16/2015 | 2,750,000 | — | (2,750,000) | — | — | — |
| Egalet Corp. | 973,774 | 596,726 | (30,500) | 1,540,000 | 12,782,000 | — |
| ExamWorks Group, Inc. | 2,300,783 | — | (200,783) | 2,100,000 | 59,304,000 | — |
| Galapagos NV | 637,932 | 602,068 | — | 1,240,000 | 59,830,909 | — |
| Galapagos NV, ADR | — | 956,807 | — | 956,807 | 45,926,736 | — |
| Ocular Therapeutix, Inc. | — | 1,400,000 | (108,573) | 1,291,427 | 11,145,015 | — |
| Otonomy, Inc. | 244,800 | 820,559 | (162,892) | 902,467 | 19,529,386 | — |
| Otonomy, Inc. | 409,891 | — | (1) | 409,890 | 8,870,020 | — |
| Minerva Neurosciences, Inc. | — | 2,120,000 | — | 2,120,000 | 11,108,800 | — |
| Minerva Neurosciences, Inc., 3/18/2017 | — | 2,120,000 | — | 2,120,000 | 2,212,432 | — |
| Premier, Inc. | 1,500,000 | 500,000 | (608,373) | 1,391,627 | 47,050,909 | — |
| Progenics Pharmaceuticals, Inc. | 10,604,711 | 696,889 | — | 11,301,600 | 82,953,744 | — |
Annual Shareholder Report
| Affiliates | Balance of
Shares Held
10/31/2014 | Purchases/
Additions | Sales/
Reductions | Balance of
Shares Held
10/31/2015 | Value | Dividend/
Interest
Income |
| **Protalix Biotherapeutics, Inc. | 8,014,125 | 344,600 | (8,358,725) | — | — | — |
*Protalix Biotherapeutics, Inc., Conv.Bond, Series 144A
4.50%, 9/15/2018 | 4,600,000 | — | — | 4,600,000 | 3,380,066 | 207,000 |
| *RPX Corp. | 2,650,000 | — | (1,400,000) | 1,250,000 | 17,800,000 | — |
| Soteira, Inc. | 959,018 | — | — | 959,018 | 0 | — |
| SCYNEXIS, Inc. | — | 750,000 | — | 750,000 | 4,792,500 | — |
| SteadyMed Ltd. | — | 1,200,000 | — | 1,200,000 | 3,384,000 | — |
| SteadyMed Ltd. | — | 117,816 | — | 117,816 | 332,241 | — |
| Textura Corp. | 2,950,000 | 103,500 | (353,500) | 2,700,000 | 79,272,000 | — |
| Threshold Pharmaceuticals, Inc., Class THL | 3,480,798 | — | (19,753) | 3,461,045 | 13,186,581 | — |
| Zogenix, Inc. | — | 1,739,000 | (2) | 1,738,998 | 20,502,786 | |
| **Zogenix, Inc. | 20,720,476 | 1,005,800 | (21,726,276) | — | — | — |
| Zogenix, Inc., 7/27/2017 | 7,425,000 | — | — | 7,425,000 | 5,585,827 | — |
| Zynerba Pharmaceuticals, Inc. | — | 254,900 | | 254,900 | 3,209,191 | — |
TOTAL OF AFFILIATED
COMPANIES | 115,665,069 | 22,353,487 | (56,300,169) | 81,718,387 | $1,047,227,058 | $207,000 |
| * | At October 31, 2015, the Fund no longer has ownership of at least 5% of the voting shares. |
| ** | At October 31, 2015, the security is no longer held in the Fund's portfolio of investments. |
| | |
Affiliated holdings are investment companies which are managed by the Adviser or an affiliate of the Adviser. The Adviser has agreed to reimburse the Fund for certain investment adviser fees as a result of transactions in other affiliated investment companies. For the year ended October 31, 2015, the Adviser reimbursed $975,002. Transactions involving the affiliated holdings during the six months ended October 31, 2015, were as follows:
| | Federated
Money Market
Management,
Institutional
Shares | Federated
Prime Value
Obligations
Fund,
Institutional
Shares | Total of
Affiliated
Transactions |
| Balance of Shares Held 10/31/2014 | 925,547,146 | 239,264,481 | 1,164,811,627 |
| Purchases/Additions | 4,312,030,665 | 2,151,079,142 | 6,463,109,807 |
| Sales/Reductions | (4,026,451,586) | (1,738,250,306) | (5,764,701,892) |
Annual Shareholder Report
| | Federated
Money Market
Management,
Institutional
Shares | Federated
Prime Value
Obligations
Fund,
Institutional
Shares | Total of
Affiliated
Transactions |
| Balance of Shares Held 10/31/2015 | 1,211,126,225 | 652,093,317 | 1,863,219,542 |
| Value | $1,211,126,225 | $652,093,317 | $1,863,219,542 |
| Dividend Income | $1,134,708 | $366,007 | $1,500,715 |
6. EXPENSE Reduction
The Fund directs portfolio trades to a broker that in turn pays a portion of the Fund's operating expenses. For the year ended October 31, 2015, the Fund's expenses were reduced by $40,154 under these arrangements.
7. Investment TRANSACTIONS
Purchases and sales of investments, excluding long-term U.S. government securities and short-term obligations, for the year ended October 31, 2015, were as follows:
| Purchases | $2,743,302,745 |
| Sales | $3,564,622,443 |
8. CONCENTRATION OF RISK
The Fund invests in securities of non-U.S. issuers. Political or economic developments may have an effect on the liquidity and volatility of portfolio securities and currency holdings.
At October 31, 2015, the diversification of countries was as follows:
| Country | Percentage of
Net Assets |
| United States | 74.0% |
| Netherlands | 2.0% |
| Belgium | 1.9% |
| United Kingdom | 1.8% |
| Israel | 1.2% |
| Singapore | 1.2% |
| Ireland | 1.1% |
| Luxembourg | 1.0% |
| Spain | 1.0% |
| China | 0.9% |
| Italy | 0.8% |
| France | 0.7% |
| Cayman Islands | 0.3% |
| Canada | 0.1% |
| India | 0.1% |
Annual Shareholder Report
9. LINE OF CREDIT
The Fund participates in a $100,000,000 unsecured, uncommitted revolving line of credit (LOC) agreement with PNC Bank. The LOC was made available for extraordinary or emergency purposes, primarily for financing redemption payments. Borrowings are charged interest at a rate offered to the Fund by PNC Bank at the time of the borrowing. As of October 31, 2015, there were no outstanding loans. During the year ended October 31, 2015, the Fund did not utilize the LOC.
10. INTERFUND LENDING
Pursuant to an Exemptive Order issued by the Securities and Exchange Commission (SEC), the Fund, along with other funds advised by subsidiaries of Federated Investors, Inc., may participate in an interfund lending program. This program provides an alternative credit facility allowing the Fund to borrow from other participating affiliated funds. As of October 31, 2015, there were no outstanding loans. During the year ended October 31, 2015, the program was not utilized.
11. FEDERAL TAX INFORMATION (UNAUDITED)
For the year ended October 31, 2015, the amount of long-term capital gains designated by the Fund was $811,442,799.
For the fiscal year ended October 31, 2015, 100.00% of total ordinary income (including short-term capital gain) distributions made by the Fund are qualifying dividends which may be subject to a maximum tax rate of 15%, as provided for by the Jobs and Growth Tax Relief Act of 2003. Complete information is reported in conjunction with the reporting of your distributions on Form 1099-DIV.
Of the ordinary income (including short-term capital gain) distributions made by the Fund during the year ended October 31, 2015, 100.00% qualify for the dividend received deduction available to corporate shareholders.
Annual Shareholder Report
Report of Independent Registered Public Accounting Firm
TO THE BOARD OF Trustees OF Federated Equity Funds AND SHAREHOLDERS OF Federated Kaufmann Fund, Class R Shares:
We have audited the accompanying statement of assets and liabilities of Federated Kaufmann Fund (the “Fund”) (one of the portfolios constituting Federated Equity Funds), including the portfolio of investments, as of October 31, 2015, and the related statement of operations for the year then ended, the statement of changes in net assets for each of the two years in the period then ended, and the financial highlights of the Class R Shares for each of the five years in the period then ended. These financial statements and financial highlights are the responsibility of the Fund's management. Our responsibility is to express an opinion on these financial statements and financial highlights based on our audits.
We conducted our audits in accordance with standards of the Public Company Accounting Oversight Board (United States). Those standards require that we plan and perform the audit to obtain reasonable assurance about whether the financial statements and financial highlights are free of material misstatement. We were not engaged to perform an audit of the Fund's internal control over financial reporting. Our audits included consideration of internal control over financial reporting as a basis for designing audit procedures that are appropriate in the circumstances, but not for the purpose of expressing an opinion on the effectiveness of the Fund's internal control over financial reporting. Accordingly, we express no such opinion. An audit also includes examining, on a test basis, evidence supporting the amounts and disclosures in the financial statements and financial highlights, assessing the accounting principles used and significant estimates made by management, and evaluating the overall financial statement presentation. Our procedures included confirmation of securities owned as of October 31, 2015, by correspondence with the custodian and others or by other appropriate auditing procedures where replies from others were not received. We believe that our audits provide a reasonable basis for our opinion.
In our opinion, the financial statements and financial highlights referred to above present fairly, in all material respects, the financial position of the Federated Kaufmann Fund, a portfolio of Federated Equity Funds, at October 31, 2015, the results of its operations for the year then ended, the changes in its net assets for each of the two years in the period then ended, and the financial highlights of the Class R Shares for each of the five years in the period then ended, in conformity with U.S. generally accepted accounting principles.
Boston, Massachusetts
December 23, 2015
Annual Shareholder Report
Shareholder Expense Example (unaudited)
As a shareholder of the Fund, you incur two types of costs: (1) transaction costs, including sales charges (loads) on purchase or redemption payments and redemption/exchange fees; and (2) ongoing costs, including management fees and to the extent applicable, distribution (12b-1) fees and/or other service fees and other Fund expenses. This Example is intended to help you to understand your ongoing costs (in dollars) of investing in the Fund and to compare these costs with the ongoing costs of investing in other mutual funds. It is based on an investment of $1,000 invested at the beginning of the period and held for the entire period from May 1, 2015 to October 31, 2015.
ACTUAL EXPENSES
The first section of the table below provides information about actual account values and actual expenses. You may use the information in this section, together with the amount you invested, to estimate the expenses that you incurred over the period. Simply divide your account value by $1,000 (for example, an $8,600 account value divided by $1,000 = 8.6), then multiply the result by the number in the first section under the heading entitled “Expenses Paid During Period” to estimate the expenses attributable to your investment during this period.
HYPOTHETICAL EXAMPLE FOR COMPARISON PURPOSES
The second section of the table below provides information about hypothetical account values and hypothetical expenses based on the Fund's actual expense ratio and an assumed rate of return of 5% per year before expenses, which is not the Fund's actual return. Thus, you should not use the hypothetical account values and expenses to estimate the actual ending account balance or your expenses for the period. Rather, these figures are required to be provided to enable you to compare the ongoing costs of investing in the Fund with other funds. To do so, compare this 5% hypothetical example with the 5% hypothetical examples that appear in the shareholder reports of the other funds.
Annual Shareholder Report
Please note that the expenses shown in the table are meant to highlight your ongoing costs only and do not reflect any transaction costs, such as sales charges (loads) on purchase or redemption payments, or redemption/exchange fees. Therefore, the second section of the table is useful in comparing ongoing costs only, and will not help you determine the relative total costs of owning different funds. In addition, if these transaction costs were included, your costs would have been higher.
| | Beginning
Account Value
5/1/2015 | Ending
Account Value
10/31/2015 | Expenses Paid
During Period1 |
| Actual | $1,000 | $969.50 | $9.68 |
Hypothetical (assuming a 5% return
before expenses) | $1,000 | $1,015.38 | $9.91 |
| 1 | Expenses are equal to the Fund's annualized net expense ratio of 1.95%, multiplied by the average account value over the period, multiplied by 184/365 (to reflect the one-half-year period). |
Annual Shareholder Report
Board of Trustees and Trust Officers
The Board of Trustees is responsible for managing the Trust business affairs and for exercising all the Trust powers except those reserved for the shareholders. The following tables give information about each Trustee and the senior officers of the Fund. Where required, the tables separately list Trustees who are “interested persons” of the Fund (i.e., “Interested” Trustees) and those who are not (i.e., “Independent” Trustees). Unless otherwise noted, the address of each person listed is Federated Investors Tower, 1001 Liberty Avenue, Pittsburgh, PA 15222. The address of all Independent Trustees listed is 4000 Ericsson Drive, Warrendale, PA 15086-7561; Attention: Mutual Fund Board. As of December 31, 2014, the Trust comprised 14 portfolio(s), and the Federated Fund Family consisted of 40 investment companies (comprising 131 portfolios). Unless otherwise noted, each Officer is elected annually. Unless otherwise noted, each Trustee oversees all portfolios in the Federated Fund Family and serves for an indefinite term. The Fund's Statement of Additional Information includes additional information about Trust Trustees and is available, without charge and upon request, by calling 1-800-341-7400.
Interested TRUSTEES Background
Name
Birth Date
Positions Held with Trust
Date Service Began | Principal Occupation(s) for Past Five Years,
Other Directorships Held and Previous Position(s) |
John F. Donahue*
Birth Date: July 28, 1924
Trustee
Indefinite Term
Began serving: April 1984 | Principal Occupations: Director or Trustee of the Federated Fund Family; Chairman and Director, Federated Investors, Inc.; Chairman of the Federated Fund Family's Executive Committee.
Previous Positions: Chairman of the Federated Fund Family; Trustee, Federated Investment Management Company; Chairman and Director, Federated Investment Counseling. |
J. Christopher Donahue*
Birth Date: April 11, 1949
President and Trustee
Indefinite Term
Began serving: January 2000 | Principal Occupations: Principal Executive Officer and President of certain of the Funds in the Federated Fund Family; Director or Trustee of the Funds in the Federated Fund Family; President, Chief Executive Officer and Director, Federated Investors, Inc.; Chairman and Trustee, Federated Investment Management Company; Trustee, Federated Investment Counseling; Chairman and Director, Federated Global Investment Management Corp.; Chairman, Federated Equity Management Company of Pennsylvania and Passport Research, Ltd. (investment advisory subsidiary of Federated); Trustee, Federated Shareholder Services Company; Director, Federated Services Company.
Previous Positions: President, Federated Investment Counseling; President and Chief Executive Officer, Federated Investment Management Company, Federated Global Investment Management Corp. and Passport Research, Ltd. |
| * | Family relationships and reasons for “interested” status: John F. Donahue is the father of J. Christopher Donahue; both are “interested” due to their beneficial ownership of shares of Federated Investors, Inc. and the positions they hold with Federated and its subsidiaries. |
Annual Shareholder Report
INDEPENDENT TRUSTEES Background
Name
Birth Date
Positions Held with Trust
Date Service Began | Principal Occupation(s) for Past Five Years,
Other Directorships Held, Previous Position(s) and Qualifications |
John T. Collins
Birth Date: January 24, 1947
Trustee
Indefinite Term
Began serving: October 2013 | Principal Occupations: Director or Trustee of the Federated Fund Family; Chairman and CEO, The Collins Group, Inc. (a private equity firm).
Other Directorships Held: Director, Chair of the Compensation Committee, Audit Committee member, KLX Corp.
Qualifications: Mr. Collins has served in several business and financial management roles and directorship positions throughout his career. Mr. Collins serves as Chairman Emeriti, Bentley University. Mr. Collins previously served as Director, FleetBoston Financial Corp.; Director and Audit Committee Member, Bank of America Corp. and Director, Beth Israel Deaconess Medical Center (Harvard University Affiliate Hospital). |
G. Thomas Hough
Birth Date: February 28, 1955
Trustee
Indefinite Term
Began serving: August 2015 | Principal Occupations: Director or Trustee of the Federated Fund Family; Retired.
Other Directorships Held: Director, Chair of the Audit Committee, Governance Committee, Publix Super Markets, Inc.
Qualifications: Mr. Hough has served in accounting, business management and directorship positions throughout his career. Mr. Hough most recently held the position of Americas Vice Chair of Assurance with Ernst & Young LLP. Mr. Hough is an Executive Committee member of the United States Golf Association, he serves on the President's Cabinet and Business School Board of Visitors for the University of Alabama and is on the Business School Board of Visitors for Wake Forest University. |
Maureen Lally-Green
Birth Date: July 5, 1949
Trustee
Indefinite Term
Began serving: August 2009 | Principal Occupations: Director or Trustee of the Federated Fund Family; Adjunct Professor of Law, Duquesne University School of Law.
Other Directorships Held: Director, CONSOL Energy Inc.
Qualifications: Judge Lally-Green has served in various legal and business roles and directorship positions throughout her career. Judge Lally-Green previously served as: Associate General Secretary, Diocese of Pittsburgh; Professor of Law, Duquesne University School of Law and was a member of the Superior Court of Pennsylvania. Judge Lally-Green also holds the positions of: Member, Pennsylvania State Board of Education; Director, Saint Vincent College; Director and Chair, UPMC Mercy Hospital; Regent, St. Vincent Seminary; Director, Epilepsy Foundation of Western and Central Pennsylvania; Director, Our Campaign for the Church Alive!, Inc.; Director, Pennsylvania Bar Institute; and Director, Cardinal Wuerl North Catholic High School, Inc. Judge Lally-Green has held the positions of: Director, Auberle; Director, Ireland Institute of Pittsburgh; Director, Saint Thomas More Society; and Director, Catholic High Schools of the Diocese of Pittsburgh, Inc. |
Annual Shareholder Report
Name
Birth Date
Positions Held with Trust
Date Service Began | Principal Occupation(s) for Past Five Years,
Other Directorships Held, Previous Position(s) and Qualifications |
Peter E. Madden
Birth Date: March 16, 1942
Trustee
Indefinite Term
Began serving: November 1991 | Principal Occupation: Director or Trustee, and Chair of the Board of Directors or Trustees, of the Federated Fund Family; Retired.
Other Directorships Held: None.
Qualifications: Mr. Madden has served in several business management, mutual fund services and directorship positions throughout his career. Mr. Madden previously served as President, Chief Operating Officer and Director, State Street Bank and Trust Company (custodian bank) and State Street Corporation (financial services). He was Director, VISA USA and VISA International and Chairman and Director, Massachusetts Bankers Association. Mr. Madden served as Director, Depository Trust Corporation and Director, The Boston Stock Exchange. Mr. Madden also served as a Representative to the Commonwealth of Massachusetts General Court. |
Charles F. Mansfield, Jr.
Birth Date: April 10, 1945
Trustee
Indefinite Term
Began serving: January 1999 | Principal Occupations: Director or Trustee of the Federated Fund Family; Management Consultant.
Other Directorships Held: None.
Qualifications: Mr. Mansfield has served in several banking, business management and educational roles and directorship positions throughout his career. Mr. Mansfield previously served as Chief Executive Officer, PBTC International Bank; Partner, Arthur Young & Company (now Ernst & Young LLP); Chief Financial Officer of Retail Banking Sector, Chase Manhattan Bank; Senior Vice President, HSBC Bank USA (formerly, Marine Midland Bank); Vice President, Citibank; Assistant Professor of Banking and Finance, Frank G. Zarb School of Business, Hofstra University; Executive Vice President DVC Group, Inc. (marketing, communications and technology). |
Thomas M. O'Neill
Birth Date: June 14, 1951
Trustee
Indefinite Term
Began serving: October 2006 | Principal Occupations: Director or Trustee, Vice Chair of the Audit Committee of the Federated Fund Family; Sole Proprietor, Navigator Management Company (investment and strategic consulting).
Other Directorships Held: None.
Qualifications: Mr. O'Neill has served in several business, mutual fund and financial management roles and directorship positions throughout his career. Mr. O'Neill serves as Director, Medicines for Humanity and Director, The Golisano Children's Museum of Naples, Florida. Mr. O'Neill previously served as Chief Executive Officer and President, Managing Director and Chief Investment Officer, Fleet Investment Advisors; President and Chief Executive Officer, Aeltus Investment Management, Inc.; General Partner, Hellman, Jordan Management Co., Boston, MA; Chief Investment Officer, The Putnam Companies, Boston, MA; Credit Analyst and Lending Officer, Fleet Bank; Director and Consultant, EZE Castle Software (investment order management software); and Director, Midway Pacific (lumber). |
Annual Shareholder Report
Name
Birth Date
Positions Held with Trust
Date Service Began | Principal Occupation(s) for Past Five Years,
Other Directorships Held, Previous Position(s) and Qualifications |
P. Jerome Richey
Birth Date: February 23, 1949
Trustee
Indefinite Term
Began serving: October 2013 | Principal Occupations: Director or Trustee of the Federated Fund Family; Management Consultant.
Other Directorships Held: None.
Qualifications: Mr. Richey has served in several business and legal management roles and directorship positions throughout his career. Mr. Richey most recently held the positions of Senior Vice Chancellor and Chief Legal Officer, University of Pittsburgh. Mr. Richey serves as Board Member, Epilepsy Foundation of Western Pennsylvania and Board member, World Affairs Council of Pittsburgh. Mr. Richey previously served as Chief Legal Officer and Executive Vice President, CONSOL Energy Inc. and Shareholder, Buchanan Ingersoll & Rooney PC (a law firm). |
John S. Walsh
Birth Date: November 28, 1957
Trustee
Indefinite Term
Began serving: January 1999 | Principal Occupations: Director or Trustee, Chair of the Audit Committee of the Federated Fund Family; President and Director, Heat Wagon, Inc. (manufacturer of construction temporary heaters); President and Director, Manufacturers Products, Inc. (distributor of portable construction heaters); President, Portable Heater Parts, a division of Manufacturers Products, Inc.
Other Directorships Held: None.
Qualifications: Mr. Walsh has served in several business management roles and directorship positions throughout his career. Mr. Walsh previously served as Vice President, Walsh & Kelly, Inc. (paving contractors). |
OFFICERS
Name
Birth Date
Address
Positions Held with Trust
Date Service Began | Principal Occupation(s) for Past Five Years
and Previous Position(s) |
John W. McGonigle
Birth Date: October 26, 1938
EXECUTIVE VICE PRESIDENT AND SECRETARY
Officer since: April 1984 | Principal Occupations: Executive Vice President and Secretary of the Federated Fund Family; Vice Chairman, Executive Vice President, Secretary and Director, Federated Investors, Inc.
Previous Positions: Trustee, Federated Investment Management Company and Federated Investment Counseling; Director, Federated Global Investment Management Corp., Federated Services Company and Federated Securities Corp. |
Annual Shareholder Report
Name
Birth Date
Address
Positions Held with Trust
Date Service Began | Principal Occupation(s) for Past Five Years
and Previous Position(s) |
Lori A. Hensler
Birth Date: January 6, 1967
TREASURER
Officer since: April 2013 | Principal Occupations: Principal Financial Officer and Treasurer of the Federated Fund Family; Senior Vice President, Federated Administrative Services; Financial and Operations Principal for Federated Securities Corp. and Edgewood Services, Inc.; and Assistant Treasurer, Federated Investors Trust Company. Ms. Hensler has received the Certified Public Accountant designation.
Previous Positions: Controller of Federated Investors, Inc.; Senior Vice President and Assistant Treasurer, Federated Investors Management Company; Treasurer, Federated Investors Trust Company; Assistant Treasurer, Federated Administrative Services, Federated Administrative Services, Inc., Federated Securities Corp., Edgewood Services, Inc., Federated Advisory Services Company, Federated Equity Management Company of Pennsylvania, Federated Global Investment Management Corp., Federated Investment Counseling, Federated Investment Management Company, Passport Research, Ltd., and Federated MDTA, LLC; Financial and Operations Principal for Federated Securities Corp., Edgewood Services, Inc. and Southpointe Distribution Services, Inc. |
Richard B. Fisher
Birth Date: May 17, 1923
Vice President
Officer since: April 1984 | Principal Occupations: Vice Chairman or Vice President of some of the Funds in the Federated Fund Family; Vice Chairman, Federated Investors, Inc.; Chairman, Federated Securities Corp.
Previous Positions: President and Director or Trustee of some of the Funds in the Federated Fund Family; Executive Vice President, Federated Investors, Inc.; Director and Chief Executive Officer, Federated Securities Corp. |
Peter J. Germain
Birth Date: September 3, 1959
CHIEF LEGAL OFFICER
Officer since: January 2005 | Principal Occupations: Mr. Germain is Chief Legal Officer of the Federated Fund Family. He is General Counsel and Vice President, Federated Investors, Inc.; President, Federated Administrative Services and Federated Administrative Services, Inc.; Vice President, Federated Securities Corp.; Secretary, Federated Private Asset Management, Inc.; and Secretary, Retirement Plan Service Company of America. Mr. Germain joined Federated in 1984 and is a member of the Pennsylvania Bar Association.
Previous Positions: Deputy General Counsel, Special Counsel, Managing Director of Mutual Fund Services, Federated Investors, Inc.; Senior Vice President, Federated Services Company; and Senior Corporate Counsel, Federated Investors, Inc. |
Stephen Van Meter
Birth Date: June 5, 1975
CHIEF COMPLIANCE OFFICER AND SENIOR VICE PRESIDENT
Officer since: July 2015 | Principal Occupations: Senior Vice President and Chief Compliance Officer of the Federated Fund Family; Vice President and Chief Compliance Officer of Federated Investors, Inc. and Chief Compliance Officer of certain of its subsidiaries. Mr. Van Meter joined Federated in October 2011. He holds FINRA licenses under Series 3, 7, 24 and 66.
Previous Positions: Mr. Van Meter previously held the position of Compliance Operating Officer, Federated Investors, Inc. Prior to joining Federated, Mr. Van Meter served at the United States Securities and Exchange Commission in the positions of Senior Counsel, Office of Chief Counsel, Division of Investment Management and Senior Counsel, Division of Enforcement. |
Annual Shareholder Report
Name
Birth Date
Address
Positions Held with Trust
Date Service Began | Principal Occupation(s) for Past Five Years
and Previous Position(s) |
Stephen F. Auth
Birth Date: September 3, 1956
101 Park Avenue
41st Floor
New York, NY 10178
CHIEF INVESTMENT OFFICER
Officer since: November 2002 | Principal Occupations: Stephen F. Auth is Chief Investment Officer of various Funds in the Federated Fund Family; Executive Vice President, Federated Investment Counseling, Federated Global Investment Management Corp. and Federated Equity Management Company of Pennsylvania.
Previous Positions: Executive Vice President, Federated Investment Management Company and Passport Research, Ltd. (investment advisory subsidiary of Federated); Senior Vice President, Global Portfolio Management Services Division; Senior Vice President, Federated Investment Management Company and Passport Research, Ltd.; Senior Managing Director and Portfolio Manager, Prudential Investments. |
Annual Shareholder Report
Evaluation and Approval of Advisory Contract–May 2015
Federated Kaufmann Fund (the “Fund”)
Following a review and recommendation of approval by the Fund's independent trustees, the Fund's Board reviewed and approved at its May 2015 meetings the Fund's investment advisory and subadvisory contracts for an additional one-year term. The Board's decision regarding these contracts reflects the exercise of its business judgment on whether to continue the existing arrangements.
In this connection, the Federated Funds' Board had previously appointed a Senior Officer, whose duties include specified responsibilities relating to the process by which advisory fees are to be charged to a Federated fund. The Senior Officer has the authority to retain consultants, experts, or staff as may be reasonably necessary to assist in the performance of his duties, reports directly to the Board, and may be terminated only with the approval of a majority of the independent members of the Board. The Senior Officer prepared and furnished to the Board an independent, written evaluation that covered topics discussed below (the “Evaluation”). The Board considered that Evaluation, along with other information, in deciding to approve the advisory and subadvisory contracts.
The Board is also familiar with and considered judicial decisions concerning allegedly excessive investment advisory fees, which have indicated that the following factors may be relevant to an Adviser's fiduciary duty with respect to its receipt of compensation from a fund: the nature and quality of the services provided by the Adviser to a fund and its shareholders, including the performance and expenses of the fund and of comparable funds; the Adviser's cost of providing the services, including the profitability to the Adviser of providing advisory services to a fund; the extent to which the Adviser may realize “economies of scale” as a fund grows larger and, if such economies of scale exist, whether they have been shared with a fund and its shareholders or the family of funds; any “fall-out financial benefits” that accrue to the Adviser because of its relationship with a fund (including research services received from brokers that execute fund trades and any fees paid to affiliates of the Adviser for services rendered to a fund); comparative fee structures, including a comparison of fees paid to the Adviser with those paid by similar funds; and the extent of care, conscientiousness and independence with which the Board members perform their duties and their expertise, including whether they are fully informed about all facts the Board deems relevant to its consideration of the Adviser's services and fees. The Board noted that SEC disclosure requirements regarding the basis for the Board's approval of the Fund's advisory contract generally track the factors listed above. Consistent with these judicial decisions and SEC disclosure requirements, the Board also considered management fees charged to institutional and other clients of the Adviser and subadviser for what
Annual Shareholder Report
might be viewed as like services. The Board was aware of these factors and was guided by them in its review of the Fund's advisory and subadvisory contracts to the extent it considered them to be appropriate and relevant, as discussed further below.
The Board considered and weighed these circumstances in light of its substantial accumulated experience in governing the Fund and working with Federated on matters relating to the Federated funds, and was assisted in its deliberations by independent legal counsel. Throughout the year, and in connection with its May meetings, the Board requested and received substantial and detailed information about the Fund and the Federated organization that was in addition to the extensive materials that comprise and accompany the Senior Officer's Evaluation. Federated provided much of this information at each regular meeting of the Board, and furnished additional substantial information in connection with the May meeting at which the Board's formal review of the advisory and subadvisory contracts occurred. At this May meeting, senior management of the Adviser also met with the independent trustees and their counsel to discuss the materials presented and any other matters thought relevant by the Adviser or the trustees. Between regularly scheduled meetings, the Board also received information on particular matters as the need arose. Thus, the Board's consideration of the advisory and subadvisory contracts included review of the Senior Officer's Evaluation, accompanying data and additional information covering such matters as: the Adviser's and subadviser's investment philosophy, revenue, profitability, personnel and processes; investment and operating strategies; the Fund's short- and long-term performance (in absolute terms, both on a gross basis and net of expenses, as well as in relationship to its particular investment program and certain competitor or “peer group” funds and/or other benchmarks, as appropriate), and comments on the reasons for performance; the Fund's investment objectives; the Fund's expenses (including the advisory fee itself and the overall expense structure of the Fund, both in absolute terms and relative to similar and/or competing funds, with due regard for contractual or voluntary expense limitations); the use and allocation of brokerage commissions derived from trading the Fund's portfolio securities (if any); and the nature, quality and extent of the advisory and other services provided to the Fund by the Adviser and its affiliates. The Board also considered the preferences and expectations of Fund shareholders; the entrepreneurial risk assumed by the Adviser in sponsoring the funds; the continuing state of competition in the mutual fund industry and market practices; the range of comparable fees for similar funds in the mutual fund industry; the Fund's relationship to the Federated family of funds which include a comprehensive array of funds with different investment objectives, policies and strategies which are available for exchange without the incurrence of additional sales charges; compliance and audit reports concerning the Federated funds and the Federated companies that service them (including communications from regulatory agencies), as well as Federated's responses to any issues raised therein;
Annual Shareholder Report
and relevant developments in the mutual fund industry and how the Federated funds and/or Federated are responding to them. The Board also considered that the longevity and experience of the Fund's portfolio management team and their unique approach to investing may limit the utility of comparisons to other equity mutual funds. The Board's evaluation process is evolutionary. The criteria considered and the emphasis placed on relevant criteria change in recognition of changing circumstances in the mutual fund marketplace.
While mindful that courts have cautioned against giving such comparisons too much weight, the Board has found the use of comparisons of the Fund's fees and expenses to other mutual funds with comparable investment programs to be relevant. In this regard, the Board was presented with, and considered, information regarding the contractual advisory fee rates, net advisory fee rates and total expense ratios relative to a fund's peers. The Board focused on comparisons with other similar mutual funds more heavily than non-mutual fund products or services because it is believed that they are more relevant. For example, other mutual funds are the products most like the Fund, they are readily available to Fund shareholders as alternative investment vehicles, and they are the type of investment vehicle in fact chosen and maintained by the Fund's investors. The range of their fees and expenses therefore appears to be a relevant indicator of what consumers have found to be reasonable in the precise marketplace in which the Fund competes.
The Board reviewed the contractual advisory fee rate, net advisory fee rate where partially waived and other expenses of the Fund and noted the position of the Fund's fee rates relative to its peers. In this regard, the Board noted that the contractual advisory fee rate was above the median of the relevant peer group, but the Board noted the applicable waivers and reimbursements and that the overall expense structure of the Fund remained competitive. The Board will continue to monitor advisory fees and other expenses borne by the Fund in the context of the other factors considered relevant by the Board.
By contrast, the Senior Officer has reviewed Federated's fees for providing advisory services to products outside the Federated family of funds (e.g., institutional and separate accounts and sub-adviser services). He concluded that mutual funds and institutional accounts are inherently different products. Those differences include, but are not limited to, different types of targeted investors; being subject to different laws and regulations; different legal structures; different average account sizes and portfolio management techniques made necessary by different cash flows and different associated costs; and the time spent by portfolio managers and their teams, funds financial services, legal, compliance and risk management in reviewing securities pricing, addressing different administrative responsibilities, addressing different degrees of risk associated with management and a variety of different costs. The Senior Officer did not consider these fee schedules to be determinative in judging the appropriateness of mutual fund advisory fees.
Annual Shareholder Report
The Senior Officer noted that while this was particularly true in the case of the Federated Kaufmann Fund, since Federated manages no institutional or separate accounts in the style of the Fund, he did note that the same group that manages the Federated Kaufmann Small Cap Fund did manage a similarly managed sub-advised fund for a lesser fee. However, the Senior Officer noted that the relationship with this similarly managed sub-advised fund was terminated during the fourth quarter of 2014.
The Fund's ability to deliver competitive performance when compared to its peer group was also deemed to be relevant by the Board as a useful indicator of how the Adviser is executing the Fund's investment program, which in turn was one of the Board's considerations in reaching a conclusion that the nature, extent, and quality of the Adviser's investment management services were such as to warrant continuation of the advisory and subadvisory contracts.
The Senior Officer reviewed information compiled by Federated, using data supplied by independent fund ranking organizations, regarding the performance of, and fees charged by, other mutual funds, noting his view that comparisons to fund peer groups may be helpful, though not conclusive, in judging the reasonableness of the proposed fees. The Board considered, in evaluating such comparisons, that in some cases individual funds may exhibit significant and unique differences in their objectives and management techniques when compared to other funds within an industry peer group.
For the periods covered by the Evaluation, the Fund's performance for the one- and three-year periods was above the median of the relevant peer group, and the Fund's performance fell below the median of the relevant peer group for the five-year period. The Board discussed the Fund's performance with the adviser and recognized the efforts being undertaken by the Adviser. The Board will continue to monitor these efforts and the performance of the Fund in the context of the other factors considered relevant by the Board.
The Board also received financial information about Federated, including information regarding the compensation and benefits Federated derived from its relationships with the Federated funds. This information covered not only the fees under the advisory contracts, but also fees received by Federated's subsidiaries for providing other services to the Federated funds under separate contracts (e.g., for serving as the Federated funds' administrator). The information also detailed any indirect benefit Federated may derive from its receipt of research services from brokers who execute Federated fund trades. In addition, the Board considered the fact that, in order for a fund to be competitive in the marketplace, Federated and its affiliates frequently waived fees and/or reimbursed expenses and have disclosed to fund investors and/or indicated to the Board their intention to do so in the future, where appropriate. Moreover, the Board receives regular reporting as to the institution, adjustment or elimination of these voluntary waivers.
Annual Shareholder Report
In addition, over the past two years, following discussions regarding the Senior Officer's recommendations, Federated made meaningful reductions to the contractual advisory fees for several Funds.
The Board noted that in May 2014, the Senior Officer proposed, and the Board subsequently approved, a reduction in the contractual advisory fee to more closely align the contractual fee with the net fee actually charged after the imposition of applicable voluntary waivers which was believed by both the Senior Officer and the Board to improve the market competitiveness of the Fund. At the May 2015 Meetings, Federated proposed and the Board approved reductions to the subadvisory fees under the subadvisory contract for the Fund, effective as of the date of the previous contractual advisory fee reduction. Formerly, the contractual subadvisory fee was 1.175% of average daily net assets (ADNA) for the Fund. The new subadvisory fee will be 1.066%. This subadvisory fee represents 82% of the current gross advisory fee of 1.30%.
Federated furnished information, requested by the Senior Officer, that reported revenues on a fund-by-fund basis and made estimates of the allocation of expenses on a fund-by-fund basis, using allocation methodologies specified by the Senior Officer. The Senior Officer noted that, while these cost allocation reports apply consistent allocation processes, the inherent difficulties in allocating costs continues to cause the Senior Officer to question the precision of the process and to conclude that such reports may be unreliable, since a single change in an allocation estimate may dramatically alter the resulting estimate of cost and/or profitability of a fund and may produce unintended consequences. The allocation information, including the Senior Officer's view that fund-by-fund estimations may be unreliable, was considered in the analysis by the Board.
The Board and the Senior Officer also reviewed information compiled by Federated comparing profitability information for Federated to other publicly held fund management companies. In this regard, the Senior Officer concluded that Federated's profit margins did not appear to be excessive. The Senior Officer also noted that Federated appeared financially sound, with the resources to fulfill its obligations under its contracts with the Funds.
The Senior Officer's Evaluation also discussed the notion of possible realization of “economies of scale” as a fund grows larger. The Board considered in this regard that the Adviser has made significant and long-term investments in areas that support all of the Federated family of funds, such as personnel and processes for the portfolio management, shareholder services, compliance, internal audit, and risk management functions; and systems technology; and that the benefits of these efforts (as well as any economies of scale, should they exist) were likely to be enjoyed by the fund family as a whole. Federated, as it does throughout the year, and again in connection with the Board's review, furnished information relative to revenue sharing or adviser paid fees. Federated and the Senior Officer noted that this information should be viewed to determine if there was an incentive to either not apply breakpoints or to apply breakpoints at higher levels and should not be viewed to determining the appropriateness of
Annual Shareholder Report
advisory fees, because it would represent marketing and distribution expenses. Finally, the Board also noted the absence of any applicable regulatory or industry guidelines on this subject, which (as discussed in the Senior Officer's Evaluation) is compounded by the lack of any common industry practice or general pattern with respect to structuring fund advisory fees with “breakpoints” that serve to reduce the fee as the fund attains a certain size.
In this regard, the Senior Officer's Evaluation noted that the Board is aware that the Fund is a relatively more expensive fund for the Adviser to manage than other Federated equity funds. The Senior Officer's Evaluation also noted that the Board is aware of the provisions agreed upon in the settlement of the Kaufmann Fund fee litigation under which, starting July 1, 2012 and for a period of ten years thereafter, a cap on the net investment advisory fee is imposed and under which additional breakpoints are required upon the fund reaching $8 billion, $9 billion, $10 billion and $12 billion in size.
The Senior Officer noted that, subject to the comments and recommendations made within his Evaluation, his observations and the information accompanying the Evaluation supported a finding by the Board that the management fees for each of the funds were reasonable. Under these circumstances, other than the reduction in the subadvisory fee noted above, no changes were recommended to, and no objection was raised to, the continuation of the Fund's advisory and subadvisory contracts.
In its decision to continue an existing investment advisory contract, the Board was mindful of the potential disruptions of the Fund's operations and various risks, uncertainties and other effects that could occur as a result of a decision to terminate or not renew an advisory contract. In particular, the Board recognized that many shareholders have invested in the Fund on the strength of the Adviser's industry standing and reputation and with the expectation that the Adviser will have a continuing role in providing advisory services to the Fund. Thus, the Board's approval of the advisory and subadvisory contracts reflected the fact that it is the shareholders who have effectively selected the Adviser by virtue of having invested in the Fund. The Board concluded that, in light of the factors discussed above, including the nature, quality and scope of the services provided to the Fund by the Adviser and its affiliates, continuation of the advisory contract was appropriate.
The Board based its decision to approve the advisory and subadvisory contracts on the totality of the circumstances and relevant factors and with a view to past and future long-term considerations. Not all of the factors and considerations identified above were necessarily relevant to the Fund, nor did the Board consider any one of them to be determinative. With respect to the factors that were relevant, the Board's decision to approve the contract reflects its determination that Federated's performance and actions provided a satisfactory basis to support the decision to continue the existing arrangements.
Annual Shareholder Report
Voting Proxies on Fund Portfolio Securities
A description of the policies and procedures that the Fund uses to determine how to vote proxies, if any, relating to securities held in the Fund's portfolio is available, without charge and upon request, by calling 1-800-341-7400. A report on “Form N-PX” of how the Fund voted any such proxies during the most recent 12-month period ended June 30 is available via the Proxy Voting Record (Form N-PX) link associated with the Fund and share class name at www.FederatedInvestors.com/FundInformation. Form N-PX filings are also available at the SEC's website at www.sec.gov.
Quarterly Portfolio Schedule
The Fund files with the SEC a complete schedule of its portfolio holdings, as of the close of the first and third quarters of its fiscal year, on “Form N-Q.” These filings are available on the SEC's website at www.sec.gov and may be reviewed and copied at the SEC's Public Reference Room in Washington, DC. (Call 1-800-SEC-0330 for information on the operation of the Public Reference Room.) You may also access this information via the link to the Fund and share class name at www.FederatedInvestors.com/FundInformation.
Annual Shareholder Report
Mutual funds are not bank deposits or obligations, are not guaranteed by any bank and are not insured or guaranteed by the U.S. government, the Federal Deposit Insurance Corporation, the Federal Reserve Board or any other government agency. Investment in mutual funds involves investment risk, including the possible loss of principal.
This Report is authorized for distribution to prospective investors only when preceded or accompanied by the Fund's Prospectus, which contains facts concerning its objective and policies, management fees, expenses and other information.
Federated Kaufmann Fund
Federated Investors Funds
4000 Ericsson Drive
Warrendale, PA 15086-7561
Contact us at FederatedInvestors.com
or call 1-800-341-7400.
Federated Securities Corp., Distributor
CUSIP 314172644
26851 (12/15)
Federated is a registered trademark of Federated Investors, Inc.
2015 ©Federated Investors, Inc.
Annual Shareholder Report
October 31, 2015
| Share Class | Ticker |
| A | KLCAX |
| C | KLCCX |
| R | KLCKX |
| Institutional | KLCIX |
| R6 | KLCSX |
Federated Kaufmann Large Cap Fund
Fund Established 2007
A Portfolio of Federated Equity Funds
Not FDIC Insured • May Lose Value • No Bank Guarantee
CONTENTS
| 1 |
| 6 |
| 7 |
| 11 |
| 16 |
| 18 |
| 19 |
| 20 |
| 34 |
| 35 |
| 37 |
| 43 |
| 49 |
| 49 |
Management's Discussion of Fund Performance (unaudited)
The total return of Federated Kaufmann Large Cap Fund (the “Fund”), based on net asset value for the 12-month reporting period ended October 31, 2015, was 6.14% for the Class A Shares, 5.34% for the Class C Shares, 5.74% for the Class R Shares, 6.38% for the Institutional Shares and 6.43% for the Class R6 Shares. The total return of the Russell 1000® Growth Index (R1000G),1 the Fund's broad-based securities market index, was 9.18% for the same period. The total return of the Morningstar Large Growth Funds Average (MLGFA),2 a peer group average for the Fund, was 6.59% for the same period. The Fund's and the MLGFA's total returns for the most recently completed fiscal year reflected actual cash flows, transaction costs and other expenses, which were not reflected in the total return of the R1000G.
During the reporting period, the Fund's investment strategy focused on stock selection, sector exposure, international exposure3 and the effect of cash holdings. These were the most significant factors affecting the Fund's performance relative to the R1000G.
The following discussion will focus on the performance of the Fund's R6 Shares.
Market Overview
During the reporting period, the equity markets globally performed well with the European stock markets leading the way. Most central banks around the world continued their monetary easing while the United States looked to enter a tightening period throughout most of the reporting period. The U.S. Federal Reserve (the “Fed”) postponed its first rate raise in nearly a decade multiple times despite positive economic data. Concern about global growth kept the Fed static. Worries about global growth pressured markets during the summer months particularly as China's economy slowed further, causing deflationary worries. Despite persistent geopolitical headwinds, e.g., Syria and the Middle East, global economies continued to grow, albeit slowly. Policymakers around the world continued to lean towards stimulus. Meanwhile, the U.S. pursued the opposite approach, a tightening strategy, which drove the strength in the U.S. Dollar Index.4 Despite these uncertainties, the equity markets performed well, and corporate earnings remained strong during the reporting period.
Annual Shareholder Report
Stock Selection
The key factor affecting Fund performance from a macroeconomic standpoint was improving U.S. economic fundamentals, as well as accommodating monetary policies by the Fed and other central banks. The monetary easing policies allowed a slow but gradual recovery of the major world economies. Profitability of many of the companies in which the Fund invested remained strong throughout the reporting period. Fund management continued to find attractive large-cap growth investment opportunities–companies that are dominant competitors and that have strengthening fundamentals potentially delivering both near-term and long-term growth in sales and earnings.
The Fund underperformed the R1000G. The majority of the underperformance versus the R1000G on a gross return basis was due to stock selection and weightings versus the index particularly in the Information Technology, Industrials and Consumer Staples sectors. Individual companies that most contributed to Fund performance during the reporting period were: Pharmacyclics, Incyte Pharamaceuticals, Amazon, Starbucks and Vantiv Inc. Laggard companies that hurt relative Fund performance were: Valeant Pharmaceuticals, Micron Technology, Pioneer Natural Resources, Eaton Corp. and Kansas City Southern.
Sector Exposure
At the end of the reporting period, approximately 74% of the Fund was invested in four large sectors: Consumer Discretionary, Health Care, Financials and Information Technology. These sectors have historically provided good opportunities for bottom-up growth investors. The largest detractors from relative performance were the Consumer Staples and Industrials sectors. The largest contributors to relative performance were the Health Care and Telecom Services sectors. Underweighting Consumer Staples and Information Technology negatively affected the Funds relative performance versus the R1000G.
Annual Shareholder Report
International Exposure
Stock selection of companies domiciled outside the U.S. was a significant positive contributor to the return of the Fund. Approximately 6.4% of the Fund's assets were invested in such companies during the reporting period.
Effect of Cash Holdings
The Fund had significant new cash inflows during the reporting period which resulted in an average cash position of 5.72%. In a rising market, the cash holdings resulted in a modest drag on relative performance versus the R1000G.
| 1 | Please see the footnotes to the line graph below for definitions of, and further information about, the R1000G. |
| 2 | Please see the footnotes to the line graph below for definitions of, and further information about, the MLGFA. |
| 3 | International investing involves special risks including currency risk, increased volatility, political risks and differences in auditing and other financial standards. |
| 4 | The U.S. Dollar Index indicates the general international value of the U.S. dollar by averaging the exchange rates between the U.S. dollar and six major world currencies. The index is unmanaged, and it is not possible to invest directly in an index. |
Annual Shareholder Report
FUND PERFORMANCE AND GROWTH OF A $10,000 INVESTMENT
The graph below illustrates the hypothetical investment of $10,0001 in the Federated Kaufmann Large Cap Fund from December 5, 2007 (start of performance) to October 31, 2015, compared to the Russell 1000® Growth Index (R1000G)2 and the Morningstar Large Growth Funds Average (MLGFA).3 The Average Annual Total Return table below shows returns for each class averaged over the stated periods.
Growth of a $10,000 Investment
Growth of $10,000 as of October 31, 2015
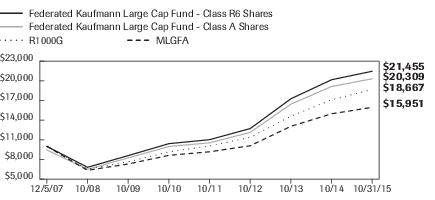
| Federated Kaufmann Large Cap Fund - | Class R6 Shares | Class A Shares | R1000G | MLGFA |
| F | F | I | I |
| 12/5/2007 | 10,000 | 9,450 | 10,000 | 10,000 |
| 10/31/2008 | 6,809 | 6,502 | 6,516 | 6,352 |
| 10/31/2009 | 8,596 | 8,246 | 7,656 | 7,315 |
| 10/31/2010 | 10,413 | 9,981 | 9,161 | 8,636 |
| 10/31/2011 | 11,021 | 10,543 | 10,069 | 9,177 |
| 10/31/2012 | 12,715 | 12,134 | 11,380 | 10,094 |
| 10/31/2013 | 17,258 | 16,433 | 14,600 | 13,057 |
| 10/31/2014 | 20,158 | 19,131 | 17,098 | 14,967 |
| 10/31/2015 | 21,455 | 20,309 | 18,667 | 15,951 |
41 graphic description end -->
| ■ | Total returns shown for Class A shares include the maximum sales charge of 5.50% ($10,000 investment minus $550 sales charge = $9,450). |
The Fund offers multiple share classes whose performance may be greater than or less than its other share class(es) due to differences in sales charges and expenses. See the Average Annual Total Return table below for the returns of additional classes not shown in the line graph above.
Annual Shareholder Report
Average Annual Total Returns for the Period Ended 10/31/2015
(returns reflect all applicable sales charges and contingent deferred sales charges as specified below in footnote #1)
| | 1 Year | 5 Years | Start of
Performance* |
| Class A Shares | 0.30% | 13.97% | 9.37% |
| Class C Shares | 4.34% | 14.34% | 9.29% |
| Class R Shares | 5.74% | 14.78% | 9.71% |
| Institutional Shares | 6.38% | 15.54% | 10.44% |
| Class R6 Shares4 | 6.43% | 15.55% | 10.14% |
| R1000G | 9.18% | 15.30% | 8.22% |
| MLGFA | 6.59% | 13.06% | 6.10% |
| * | The Fund's Class A Shares, Class C Shares, Class R Shares and Institutional Shares start of performance date was December 5, 2007. Class R6 Shares commenced operations on December 30, 2013. |
| | |
Performance data quoted represents past performance which is no guarantee of future results. Investment return and principal value will fluctuate so that an investor's shares, when redeemed, may be worth more or less than their original cost. Mutual fund performance changes over time and current performance may be lower or higher than what is stated. For current to the most recent month-end performance and after-tax returns, visit FederatedInvestors.com or call 1-800-341-7400. Returns shown do not reflect the deduction of taxes that a shareholder would pay on Fund distributions or the redemption of Fund shares. Mutual funds are not obligations of or guaranteed by any bank and are not federally insured.
| 1 | Represents a hypothetical investment of $10,000 in the Fund after deducting applicable sales charges: For Class A Shares, the maximum sales charge of 5.50% ($10,000 investment minus $550 sales charge = $9,450); for Class C Shares, a 1.00% contingent deferred sales charge would be applied to any redemption less than one year from the purchase date. The Fund's performance assumes the reinvestment of all dividends and distributions. The R1000G and the MLGFA have been adjusted to reflect the reinvestment of dividends on securities in the index and average. |
| 2 | The Russell 1000® Growth Index measures the performance of the large-cap growth segment of the U.S. equity universe. It includes those Russell 1000® Index companies with higher price-to-book ratios and higher forecasted growth values. The R1000G is constructed to provide a comprehensive and unbiased barometer for the large-cap growth segment. The R1000G is completely reconstituted annually to ensure new and growing equities are included and that the represented companies continue to reflect growth characteristics. The R1000G is not adjusted to reflect sales charges, expenses or other fees that the Securities and Exchange Commission requires to be reflected in the Fund's performance. The index is unmanaged and unlike the Fund, is not affected by cash flows. It is not possible to invest directly in an index. |
| 3 | Morningstar figures represent the average of the total returns reported by all the mutual funds designated by Morningstar as falling into the respective category indicated. They do not reflect sales charges. |
| 4 | The Fund's Class R6 Shares commenced operations on December 30, 2013. For the period prior to the commencement of operations of Class R6 Shares, the performance information shown is for the Fund's Institutional Shares adjusted to reflect expenses of the Class R6 Shares for each year for which the expenses of Class R6 Shares would have exceeded the actual expenses paid by Institutional Shares. |
Annual Shareholder Report
Portfolio of Investments Summary Table (unaudited)
At October 31, 2015, the Fund's sector composition1 was as follows:
| Sector Composition | Percentage of
Total Net Assets |
| Health Care | 23.8% |
| Information Technology | 20.2% |
| Consumer Discretionary | 18.6% |
| Financials | 11.3% |
| Materials | 6.1% |
| Industrials | 5.0% |
| Telecommunication Services | 1.9% |
| Consumer Staples | 1.8% |
| Energy | 0.8% |
| Derivative Contracts2,3 | (0.0)% |
| Securities Lending Collateral4 | 2.4% |
| Cash Equivalents5 | 9.4% |
| Other Assets and Liabilities—Net6 | (1.3)% |
| TOTAL | 100% |
| 1 | Except for Securities Lending Collateral, Cash Equivalents and Other Assets and Liabilities, sector classifications are based upon, and individual portfolio securities are assigned to, the classifications of the Global Industry Classification Standard (GICS) except that the Adviser assigns a classification to securities not classified by the GICS and to securities for which the Adviser does not have access to the classification made by the GICS. |
| 2 | Based upon net unrealized appreciation (depreciation) or value of the derivative contracts as applicable. Derivative contracts may consist of futures, forwards, options and swaps. The impact of a derivative contract on the Fund's performance may be larger than its unrealized appreciation (depreciation) or value may indicate. In many cases, the notional value or amount of a derivative contract may provide a better indication of the contract's significance to the portfolio. More complete information regarding the Fund's direct investments in derivative contracts, including unrealized appreciation (depreciation), value and notional values or amounts of such contracts, can be found in the table at the end of the Portfolio of Investments included in this Report. |
| 3 | Represents less than 0.1%. |
| 4 | Cash collateral received from lending portfolio securities which is invested in short-term investments such as repurchase agreements or money market mutual funds. |
| 5 | Cash Equivalents include any investments in money market mutual funds and/or overnight repurchase agreements, other than those representing securities lending collateral. |
| 6 | Assets, other than investments in securities and derivative contracts, less liabilities. See Statement of Assets and Liabilities. |
Annual Shareholder Report
Portfolio of Investments
October 31, 2015
| Shares | | | Value |
| | | COMMON STOCKS—89.4% | |
| | | Consumer Discretionary—18.5% | |
| 110,400 | 1 | Amazon.com, Inc. | $69,099,360 |
| 71,000 | 1 | Chipotle Mexican Grill, Inc. | 45,456,330 |
| 811,700 | | Delphi Automotive PLC | 67,525,323 |
| 500,000 | | Dollar General Corp. | 33,885,000 |
| 2,701,400 | | Hilton Worldwide Holdings, Inc. | 67,507,986 |
| 20 | 1,2 | New Cotai LLC/Capital | 310,641 |
| 31,100 | 1 | Priceline.com, Inc. | 45,226,864 |
| 1,100,000 | | Starbucks Corp. | 68,827,000 |
| 870,000 | | TJX Cos., Inc. | 63,675,300 |
| 715,000 | | Tractor Supply Co. | 66,058,850 |
| 409,800 | | Walt Disney Co. | 46,610,652 |
| 220,000 | | Whirlpool Corp. | 35,230,800 |
| | | TOTAL | 609,414,106 |
| | | Consumer Staples—1.8% | |
| 610,000 | | CVS Health Corp. | 60,255,800 |
| | | Energy—0.8% | |
| 657,000 | | Halliburton Co. | 25,215,660 |
| | | Financials—11.3% | |
| 1,070,000 | | American International Group, Inc. | 67,474,200 |
| 208,800 | | BlackRock, Inc. | 73,491,336 |
| 710,000 | 1 | CBRE Group, Inc. | 26,468,800 |
| 833,100 | | Crown Castle International Corp. | 71,196,726 |
| 1,000,000 | | JPMorgan Chase & Co. | 64,250,000 |
| 250,000 | 1,2 | Japan Post Holdings Co. Ltd. | 2,900,472 |
| 1,183,000 | | Wells Fargo & Co. | 64,047,620 |
| | | TOTAL | 369,829,154 |
| | | Health Care—23.8% | |
| 422,600 | 1 | Alexion Pharmaceuticals, Inc. | 74,377,600 |
| 248,100 | 1 | Allergan PLC | 76,531,407 |
| 825,000 | 1 | Cerner Corp. | 54,689,250 |
| 718,000 | 1 | Dexcom, Inc. | 59,823,760 |
| 678,200 | 1 | Genmab A/S | 66,679,602 |
| 650,000 | | Gilead Sciences, Inc. | 70,284,500 |
| 825,000 | 1 | IDEXX Laboratories, Inc. | 56,611,500 |
| 647,500 | 1,3 | Incyte Genomics, Inc. | 76,100,675 |
Annual Shareholder Report
| Shares | | | Value |
| | | COMMON STOCKS—continued | |
| | | Health Care—continued | |
| 830,000 | | Medtronic PLC | $61,353,600 |
| 1,264,659 | 1,4 | Premier, Inc. | 42,758,121 |
| 918,600 | | Shire Ltd. | 69,559,238 |
| 576,800 | 1 | Vertex Pharmaceuticals, Inc. | 71,950,032 |
| | | TOTAL | 780,719,285 |
| | | Industrials—5.0% | |
| 1,590,000 | 1 | AerCap Holdings NV | 65,985,000 |
| 640,000 | | Expeditors International Washington, Inc. | 31,865,600 |
| 580,000 | | Ingersoll-Rand PLC, Class A | 34,370,800 |
| 540,000 | | Osram Licht AG | 31,761,713 |
| | | TOTAL | 163,983,113 |
| | | Information Technology—20.2% | |
| 492,300 | 1,3 | Alibaba Group Holding Ltd., ADR | 41,269,509 |
| 95,000 | 1 | Alphabet, Inc. | 70,052,050 |
| 910,000 | | Amadeus IT Holding SA | 38,722,272 |
| 538,000 | | Apple, Inc. | 64,291,000 |
| 472,000 | 3 | Avago Technologies Ltd. | 58,117,360 |
| 605,300 | 1 | Facebook, Inc. | 61,722,441 |
| 600,000 | | Mastercard, Inc. | 59,394,000 |
| 2,455,259 | 1 | Micron Technology, Inc. | 40,659,089 |
| 150,000 | | Microsoft Corporation | 7,896,000 |
| 663,300 | 1 | NXP Semiconductors NV | 51,969,555 |
| 710,000 | 1 | Salesforce.com, Inc. | 55,174,100 |
| 279,400 | | TE Connectivity Ltd. | 18,004,536 |
| 1,290,000 | 1 | Vantiv, Inc. | 64,693,500 |
| 425,000 | 3 | Visa, Inc., Class A | 32,971,500 |
| | | TOTAL | 664,936,912 |
| | | Materials—6.1% | |
| 660,000 | | LyondellBasell Investment LLC | 61,320,600 |
| 412,300 | 3 | Martin Marietta Materials | 63,968,345 |
| 282,300 | | Sherwin-Williams Co. | 75,326,109 |
| | | TOTAL | 200,615,054 |
| | | Telecommunication Services—1.9% | |
| 1,665,000 | 1 | T-Mobile USA, Inc. | 63,086,850 |
| | | TOTAL COMMON STOCKS
(IDENTIFIED COST $2,442,680,206) | 2,938,055,934 |
Annual Shareholder Report
| Shares | | | Value |
| | | WARRANT—0.1% | |
| | | Consumer Discretionary—0.1% | |
| 1,610,007 | 1,3 | Central European Media Enterprises Ltd., Warrants, Expiration
Date 5/2/18
(IDENTIFIED COST $3,231,013) | $3,011,035 |
| | | INVESTMENT COMPANIES—11.8%4 | |
| 79,491,400 | 6 | Federated Money Market Management, Institutional Shares, 0.16%5 | 79,491,400 |
| 309,342,785 | | Federated Prime Value Obligations Fund, Institutional Shares, 0.16%5 | 309,342,785 |
| | | TOTAL INVESTMENT COMPANIES
(AT NET ASSET VALUE) | 388,834,185 |
| | | TOTAL INVESTMENTS—101.3%
(IDENTIFIED COST $2,834,745,404)7 | 3,329,901,154 |
| | | OTHER ASSETS AND LIABILITIES - NET—(1.3)%8 | (42,577,406) |
| | | TOTAL NET ASSETS—100% | $3,287,323,748 |
At October 31, 2015, the Fund had the following outstanding foreign exchange contracts:
| Settlement Date | Counterparty | Foreign Currency
Units to
Deliver/Receive | In
Exchange
For | Unrealized
Depreciation |
| 11/4/2015 | JPMorgan Chase | 350,000,000 JPY | $2,907,807 | $(7,334) |
Unrealized Depreciation on Foreign Exchange Contracts is included in “Other Assets and Liabilities—Net.”
| 1 | Non-income-producing security. |
| 2 | Market quotations and price evaluations are not available. Fair value determined in accordance with procedures established by and under the general supervision of the Fund's Board of Trustees (the “Trustees”). |
| 3 | All or a portion of these securities are temporarily on loan to unaffiliated broker/dealers. |
| 4 | Affiliated company or holding. |
| 5 | 7-day net yield. |
| 6 | All or a portion of this security is held as collateral for securities lending. |
| 7 | The cost of investments for federal tax purposes amounts to $2,839,312,052. |
| 8 | Assets, other than investments in securities, less liabilities. See Statement of Assets and Liabilities. |
Note: The categories of investments are shown as a percentage of total net assets at October 31, 2015.
Annual Shareholder Report
Various inputs are used in determining the value of the Fund's investments. These inputs are summarized in the three broad levels listed below:
Level 1—quoted prices in active markets for identical securities.
Level 2—other significant observable inputs (including quoted prices for similar securities, interest rates, prepayment speeds, credit risk, etc.). Also includes securities valued at amortized cost.
Level 3—significant unobservable inputs (including the Fund's own assumptions in determining the fair value of investments).
The inputs or methodology used for valuing securities are not an indication of the risk associated with investing in those securities.
The following is a summary of the inputs used, as of October 31, 2015, in valuing the Fund's assets carried at fair value:
| Valuation Inputs | | | | |
| | Level 1—
Quoted
Prices | Level 2—
Other
Significant
Observable
Inputs | Level 3—
Significant
Unobservable
Inputs | Total |
| Equity Securities: | | | | |
| Common Stocks | | | | |
| Domestic | $2,329,559,313 | $— | $310,641 | $2,329,869,954 |
| International | 398,562,683 | 206,722,825 | 2,900,472 | 608,185,980 |
| Warrant | — | 3,011,035 | — | 3,011,035 |
| Investment Companies | 388,834,185 | — | — | 388,834,185 |
| TOTAL SECURITIES | $3,116,956,181 | $209,733,860 | $3,211,113 | $3,329,901,154 |
OTHER FINANCIAL
INSTRUMENTS* | $(7,334) | — | — | $(7,334) |
*Other financial instruments include foreign exchange contracts.
The following acronyms are used throughout this portfolio:
| ADR | —American Depositary Receipt |
| JPY | —Japanese Yen |
See Notes which are an integral part of the Financial Statements
Annual Shareholder Report
Financial Highlights–Class A Shares
(For a Share Outstanding Throughout Each Period)
| Year Ended October 31 | 2015 | 2014 | 2013 | 2012 | 2011 |
| Net Asset Value, Beginning of Period | $18.39 | $16.13 | $12.22 | $11.07 | $10.53 |
| Income From Investment Operations: | | | | | |
| Net investment income (loss) | (0.02)1 | (0.04)1 | (0.04)1 | (0.04)1 | (0.04)1 |
| Net realized and unrealized gain on investments and foreign currency transactions | 1.13 | 2.65 | 4.27 | 1.64 | 0.63 |
| TOTAL FROM INVESTMENT OPERATIONS | 1.11 | 2.61 | 4.23 | 1.60 | 0.59 |
| Less Distributions: | | | | | |
| Distributions from net investment income | (0.00)2 | — | — | — | (0.05) |
| Distributions from net realized gain on investments and foreign currency transactions | (0.70) | (0.35) | (0.32) | (0.45) | (0.00)2 |
| TOTAL DISTRIBUTIONS | (0.70) | (0.35) | (0.32) | (0.45) | (0.05) |
| Net Asset Value, End of Period | $18.80 | $18.39 | $16.13 | $12.22 | $11.07 |
| Total Return3 | 6.14% | 16.42% | 35.44% | 15.08% | 5.63% |
| Ratios to Average Net Assets: | | | | | |
| Net expenses | 1.09%4 | 1.15%4 | 1.50%4 | 1.50% | 1.50%4 |
| Net investment income (loss) | (0.12)% | (0.23)% | (0.27)% | (0.34)% | (0.37)% |
| Expense waiver/reimbursement5 | 0.11% | 0.17% | 0.44% | 0.49% | 0.56% |
| Supplemental Data: | | | | | |
| Net assets, end of period (000 omitted) | $968,786 | $485,104 | $365,693 | $142,229 | $140,128 |
| Portfolio turnover | 55% | 68% | 114% | 94% | 128% |
| 1 | Per share numbers have been calculated using the average shares method. |
| 2 | Represents less than $0.01. |
| 3 | Based on net asset value, which does not reflect the sales charge, redemption fee or contingent deferred sales charge, if applicable. |
| 4 | The net expense ratio is calculated without reduction for fees paid indirectly for expense offset arrangements. The net expense ratios are 1.09%, 1.15%, 1.50% and 1.50% for the years ended October 31, 2015, 2014, 2013 and 2011, respectively, after taking into account these expense reductions. |
| 5 | This expense decrease is reflected in both the net expense and the net investment income (loss) ratios shown above. |
See Notes which are an integral part of the Financial Statements
Annual Shareholder Report
Financial Highlights–Class C Shares
(For a Share Outstanding Throughout Each Period)
| Year Ended October 31 | 2015 | 2014 | 2013 | 2012 | 2011 |
| Net Asset Value, Beginning of Period | $17.50 | $15.48 | $11.84 | $10.82 | $10.33 |
| Income From Investment Operations: | | | | | |
| Net investment income (loss) | (0.16)1 | (0.17)1 | (0.15)1 | (0.13)1 | (0.13)1 |
| Net realized and unrealized gain on investments and foreign currency transactions | 1.08 | 2.54 | 4.11 | 1.60 | 0.62 |
| TOTAL FROM INVESTMENT OPERATIONS | 0.92 | 2.37 | 3.96 | 1.47 | 0.49 |
| Less Distributions: | | | | | |
| Distributions from net investment income | (0.00)2 | — | — | — | — |
| Distributions from net realized gain on investments and foreign currency transactions | (0.70) | (0.35) | (0.32) | (0.45) | — |
| TOTAL DISTRIBUTIONS | (0.70) | (0.35) | (0.32) | (0.45) | — |
| Net Asset Value, End of Period | $17.72 | $17.50 | $15.48 | $11.84 | $10.82 |
| Total Return3 | 5.34% | 15.54% | 34.27% | 14.20% | 4.74% |
| Ratios to Average Net Assets: | | | | | |
| Net expenses | 1.87%4 | 1.93%4 | 2.33%4 | 2.34% | 2.33%4 |
| Net investment income (loss) | (0.89)% | (1.03)% | (1.08)% | (1.15)% | (1.20)% |
| Expense waiver/reimbursement5 | 0.09% | 0.14% | 0.35% | 0.40% | 0.48% |
| Supplemental Data: | | | | | |
| Net assets, end of period (000 omitted) | $492,637 | $280,250 | $181,073 | $81,269 | $69,810 |
| Portfolio turnover | 55% | 68% | 114% | 94% | 128% |
| 1 | Per share numbers have been calculated using the average shares method. |
| 2 | Represents less than $0.01. |
| 3 | Based on net asset value, which does not reflect the sales charge, redemption fee or contingent deferred sales charge, if applicable. |
| 4 | The net expense ratio is calculated without reduction for fees paid indirectly for expense offset arrangements. The net expense ratios are 1.87%, 1.93%, 2.33% and 2.33% for the years ended October 31, 2015, 2014, 2013 and 2011, respectively, after taking into account these expense reductions. |
| 5 | This expense decrease is reflected in both the net expense and the net investment income (loss) ratios shown above. |
See Notes which are an integral part of the Financial Statements
Annual Shareholder Report
Financial Highlights–Class R Shares
(For a Share Outstanding Throughout Each Period)
| Year Ended October 31 | 2015 | 2014 | 2013 | 2012 | 2011 |
| Net Asset Value, Beginning of Period | $17.86 | $15.74 | $11.97 | $10.91 | $10.40 |
| Income From Investment Operations: | | | | | |
| Net investment income (loss) | (0.09)1 | (0.11)1 | (0.10)1 | (0.09)1 | (0.07)1 |
| Net realized and unrealized gain on investments and foreign currency transactions | 1.10 | 2.58 | 4.19 | 1.60 | 0.61 |
| TOTAL FROM INVESTMENT OPERATIONS | 1.01 | 2.47 | 4.09 | 1.51 | 0.54 |
| Less Distributions: | | | | | |
| Distributions from net investment income | (0.00)2 | — | — | — | (0.03) |
| Distributions from net realized gain on investments and foreign currency transactions | (0.70) | (0.35) | (0.32) | (0.45) | (0.00)2 |
| TOTAL DISTRIBUTIONS | (0.70) | (0.35) | (0.32) | (0.45) | (0.03) |
| Net Asset Value, End of Period | $18.17 | $17.86 | $15.74 | $11.97 | $10.91 |
| Total Return3 | 5.74% | 15.93% | 35.00% | 14.46% | 5.20% |
| Ratios to Average Net Assets: | | | | | |
| Net expenses | 1.48%4 | 1.55%4 | 1.93%4 | 1.95% | 1.95%4 |
| Net investment income (loss) | (0.48)% | (0.64)% | (0.76)% | (0.77)% | (0.65)% |
| Expense waiver/reimbursement5 | 0.14% | 0.19% | 0.40% | 0.44% | 0.55% |
| Supplemental Data: | | | | | |
| Net assets, end of period (000 omitted) | $80,007 | $72,580 | $66,543 | $19,688 | $16,393 |
| Portfolio turnover | 55% | 68% | 114% | 94% | 128% |
| 1 | Per share numbers have been calculated using the average shares method. |
| 2 | Represents less than $0.01. |
| 3 | Based on net asset value. |
| 4 | The net expense ratio is calculated without reduction for fees paid indirectly for expense offset arrangements. The net expense ratios are 1.48%, 1.55%, 1.93% and 1.95% for the years ended October 31, 2015, 2014, 2013 and 2011, respectively, after taking into account these expense reductions. |
| 5 | This expense decrease is reflected in both the net expense and the net investment income (loss) ratios shown above. |
See Notes which are an integral part of the Financial Statements
Annual Shareholder Report
Financial Highlights–Institutional Shares
(For a Share Outstanding Throughout Each Period)
| Year Ended October 31 | 2015 | 2014 | 2013 | 2012 | 2011 |
| Net Asset Value, Beginning of Period | $18.64 | $16.30 | $12.32 | $11.13 | $10.58 |
| Income From Investment Operations: | | | | | |
| Net investment income (loss) | 0.031 | (0.00)1 | (0.01)1 | (0.01)1 | (0.01)1 |
| Net realized and unrealized gain on investments and foreign currency transactions | 1.14 | 2.69 | 4.31 | 1.65 | 0.63 |
| TOTAL FROM INVESTMENT OPERATIONS | 1.17 | 2.69 | 4.30 | 1.64 | 0.62 |
| Less Distributions: | | | | | |
| Distributions from net investment income | (0.00)2 | — | — | — | (0.07) |
| Distributions from net realized gain on investments and foreign currency transactions | (0.70) | (0.35) | (0.32) | (0.45) | (0.00)2 |
| TOTAL DISTRIBUTIONS | (0.70) | (0.35) | (0.32) | (0.45) | (0.07) |
| Net Asset Value, End of Period | $19.11 | $18.64 | $16.30 | $12.32 | $11.13 |
| Total Return3 | 6.38% | 16.74% | 35.72% | 15.37% | 5.89% |
| Ratios to Average Net Assets: | | | | | |
| Net expenses | 0.84%4 | 0.89%4 | 1.25%4 | 1.25% | 1.25%4 |
| Net investment income (loss) | 0.13% | (0.01)% | (0.07)% | (0.07)% | (0.10)% |
| Expense waiver/reimbursement5 | 0.10% | 0.15% | 0.41% | 0.45% | 0.52% |
| Supplemental Data: | | | | | |
| Net assets, end of period (000 omitted) | $1,556,775 | $813,517 | $365,715 | $106,055 | $93,222 |
| Portfolio turnover | 55% | 68% | 114% | 94% | 128% |
| 1 | Per share numbers have been calculated using the average shares method. |
| 2 | Represents less than $0.01. |
| 3 | Based on net asset value. |
| 4 | The net expense ratio is calculated without reduction for fees paid indirectly for expense offset arrangements. The net expense ratios are 0.84%, 0.89%, 1.25% and 1.25% for the years ended October 31, 2015, 2014, 2013 and 2011, respectively, after taking into account these expense reductions. |
| 5 | This expense decrease is reflected in both the net expense and the net investment income (loss) ratios shown above. |
See Notes which are an integral part of the Financial Statements
Annual Shareholder Report
Financial Highlights–Class R6 Shares
(For a Share Outstanding Throughout Each Period)
| | Year Ended
10/31/2015 | Period
Ended
10/31/20141 |
| Net Asset Value, Beginning of Period | $18.65 | $16.81 |
| Income From Investment Operations: | | |
| Net investment income | 0.042 | 0.012 |
| Net realized and unrealized gain on investments and foreign currency transactions | 1.16 | 1.83 |
| TOTAL FROM INVESTMENT OPERATIONS | 1.18 | 1.84 |
| Less Distributions: | | |
| Distributions from net investment income | (0.00)3 | — |
| Distributions from net realized gain on investments and foreign currency transactions | (0.70) | — |
| TOTAL DISTRIBUTIONS | (0.70) | — |
| Net Asset Value, End of Period | $19.13 | $18.65 |
| Total Return4 | 6.43% | 10.95% |
| Ratios to Average Net Assets: | | |
| Net expenses | 0.78%5 | 0.78%5,6 |
| Net investment income | 0.21% | 0.07%6 |
| Expense waiver/reimbursement7 | 0.09% | 0.11%6 |
| Supplemental Data: | | |
| Net assets, end of period (000 omitted) | $189,120 | $129,160 |
| Portfolio turnover | 55% | 68%8 |
| 1 | Reflects operations for the period from December 30, 2013 (date of initial investment) to October 31, 2014. |
| 2 | Per share numbers have been calculated using the average shares method. |
| 3 | Represents less than $0.01. |
| 4 | Based on net asset value. Total returns for periods of less than one year are not annualized. |
| 5 | The net expense ratio is calculated without reduction for fees paid indirectly for expense offset arrangements. The net expense ratios are 0.78% and 0.78% for the year ended October 31, 2015, and for the period ended October 31, 2014, respectively, after taking into account these expense reductions. |
| 6 | Computed on an annualized basis. |
| 7 | This expense decrease is reflected in both the net expense and the net investment income ratios shown above. |
| 8 | Portfolio turnover is calculated at the Fund level. Percentage indicated was calculated for the year ended October 31, 2014. |
See Notes which are an integral part of the Financial Statements
Annual Shareholder Report
Statement of Assets and Liabilities
October 31, 2015
| Assets: | | |
| Total investment in securities, at value including $79,416,950 of securities loaned, $388,834,185 of investment in affiliated holdings and $42,758,121 of investment in an affiliated company (Note 5) (identified cost $2,834,745,404) | | $3,329,901,154 |
| Cash denominated in foreign currencies (identified cost $2,293) | | 2,247 |
| Income receivable | | 973,942 |
| Receivable for investments sold | | 43,740,591 |
| Receivable for shares sold | | 14,566,264 |
| Other assets | | 9,969 |
| TOTAL ASSETS | | 3,389,194,167 |
| Liabilities: | | |
| Payable for investments purchased | $17,161,350 | |
| Payable for shares redeemed | 3,439,316 | |
| Unrealized depreciation on foreign exchange contracts | 7,334 | |
| Payable for collateral due to broker for securities lending | 79,491,400 | |
| Payable to adviser (Note 5) | 115,978 | |
| Payable for distribution services fee (Note 5) | 332,061 | |
| Payable for other service fees (Notes 2 and 5) | 610,550 | |
| Accrued expenses (Note 5) | 712,430 | |
| TOTAL LIABILITIES | | 101,870,419 |
| Net assets for 175,099,924 shares outstanding | | $3,287,323,748 |
| Net Assets Consist of: | | |
| Paid-in capital | | $2,865,306,004 |
| Net unrealized appreciation of investments and translation of assets and liabilities in foreign currency | | 495,110,109 |
| Accumulated net realized loss on investments and foreign currency transactions | | (70,010,189) |
| Accumulated net investment income (loss) | | (3,082,176) |
| TOTAL NET ASSETS | | $3,287,323,748 |
Annual Shareholder Report
Statement of Assets and Liabilities–continued
| Net Asset Value, Offering Price and Redemption Proceeds Per Share | | |
| Class A Shares: | | |
| Net asset value per share ($968,785,954 ÷ 51,543,749 shares outstanding), no par value, unlimited shares authorized | | $18.80 |
| Offering price per share (100/94.50 of $18.80) | | $19.89 |
| Redemption proceeds per share | | $18.80 |
| Class C Shares: | | |
| Net asset value per share ($492,637,064 ÷ 27,808,493 shares outstanding), no par value, unlimited shares authorized | | $17.72 |
| Offering price per share | | $17.72 |
| Redemption proceeds per share (99.00/100 of $17.72) | | $17.54 |
| Class R Shares: | | |
| Net asset value per share ($80,006,507 ÷ 4,403,765 shares outstanding), no par value, unlimited shares authorized | | $18.17 |
| Offering price per share | | $18.17 |
| Redemption proceeds per share | | $18.17 |
| Institutional Shares: | | |
| Net asset value per share ($1,556,774,502 ÷ 81,458,737 shares outstanding), no par value, unlimited shares authorized | | $19.11 |
| Offering price per share | | $19.11 |
| Redemption proceeds per share | | $19.11 |
| Class R6 Shares: | | |
| Net asset value per share ($189,119,721 ÷ 9,885,180 shares outstanding), no par value, unlimited shares authorized | | $19.13 |
| Offering price per share | | $19.13 |
| Redemption proceeds per share | | $19.13 |
See Notes which are an integral part of the Financial Statements
Annual Shareholder Report
Statement of Operations
Year Ended October 31, 2015
| Investment Income: | | | |
| Dividends (including $272,112 received from affiliated holdings (Note 5) and net of foreign taxes withheld of $139,737) | | | $23,123,233 |
| Interest (including income on securities loaned of $69,773) | | | 1,538,278 |
| TOTAL INCOME | | | 24,661,511 |
| Expenses: | | | |
| Investment adviser fee (Note 5) | | $18,912,892 | |
| Administrative fee (Note 5) | | 1,973,628 | |
| Custodian fees | | 131,449 | |
| Transfer agent fee (Note 2) | | 2,297,360 | |
| Directors'/Trustees' fees (Note 5) | | 18,436 | |
| Auditing fees | | 38,700 | |
| Legal fees | | 9,891 | |
| Portfolio accounting fees | | 216,312 | |
| Distribution services fee (Note 5) | | 3,270,554 | |
| Other service fees (Notes 2 and 5) | | 2,754,934 | |
| Share registration costs | | 338,385 | |
| Printing and postage | | 98,249 | |
| Miscellaneous (Note 5) | | 27,973 | |
| TOTAL EXPENSES | | 30,088,763 | |
| Waivers, Reimbursements and Reduction: | | | |
| Waiver/reimbursement of investment adviser fee (Note 5) | $(2,326,225) | | |
Waiver/reimbursement of other operating expenses
(Notes 2 and 5) | (306,528) | | |
| Fees paid indirectly from directed brokerage arrangements (Note 6) | (21,205) | | |
| TOTAL WAIVERS, REIMBURSEMENTS AND REDUCTION | | (2,653,958) | |
| Net expenses | | | 27,434,805 |
| Net investment income (loss) | | | (2,773,294) |
| Realized and Unrealized Gain (Loss) on Investments and Foreign Currency Transactions: | | | |
| Net realized loss on investments and foreign currency transactions (including realized loss of $(584,367) on sales of investments in an affiliated company (Note 5)) | | | (64,862,508) |
| Net change in unrealized appreciation of investments and translation of assets and liabilities in foreign currency | | | 146,681,512 |
| Net realized and unrealized gain on investments and foreign currency transactions | | | 81,819,004 |
| Change in net assets resulting from operations | | | $79,045,710 |
See Notes which are an integral part of the Financial Statements
Annual Shareholder Report
Statement of Changes in Net Assets
| Year Ended October 31 | 2015 | 2014 |
| Increase (Decrease) in Net Assets | | |
| Operations: | | |
| Net investment income (loss) | $(2,773,294) | $(3,938,434) |
| Net realized gain (loss) on investments and foreign currency transactions | (64,862,508) | 71,697,788 |
| Net change in unrealized appreciation/depreciation of investments and translation of assets and liabilities in foreign currency | 146,681,512 | 141,867,207 |
| CHANGE IN NET ASSETS RESULTING FROM OPERATIONS | 79,045,710 | 209,626,561 |
| Distributions to Shareholders: | | |
| Distributions from net investment income | | |
| Class A Shares | (34,816) | — |
| Class C Shares | (18,547) | — |
| Class R Shares | (3,748) | — |
| Institutional Shares | (56,818) | — |
| Class R6 Shares | (7,776) | — |
| Distributions from net realized gain on investments and foreign currency transactions | | |
| Class A Shares | (18,830,180) | (8,670,116) |
| Class C Shares | (11,506,933) | (4,381,245) |
| Class R Shares | (2,785,051) | (1,474,660) |
| Institutional Shares | (32,254,792) | (8,908,655) |
| Class R6 Shares | (4,463,397) | — |
| CHANGE IN NET ASSETS RESULTING FROM DISTRIBUTIONS TO SHAREHOLDERS | (69,962,058) | (23,434,676) |
| Share Transactions: | | |
| Proceeds from sale of shares | 2,014,417,661 | 1,029,764,602 |
| Net asset value of shares issued to shareholders in payment of distributions declared | 56,441,444 | 19,553,826 |
| Cost of shares redeemed | (573,230,224) | (433,922,725) |
| CHANGE IN NET ASSETS RESULTING FROM SHARE TRANSACTIONS | 1,497,628,881 | 615,395,703 |
| Change in net assets | 1,506,712,533 | 801,587,588 |
| Net Assets: | | |
| Beginning of period | 1,780,611,215 | 979,023,627 |
| End of period (including accumulated net investment income (loss) of $(3,082,176) and $0, respectively) | $3,287,323,748 | $1,780,611,215 |
See Notes which are an integral part of the Financial Statements
Annual Shareholder Report
Notes to Financial Statements
October 31, 2015
1. ORGANIZATION
Federated Equity Funds (the “Trust”) is registered under the Investment Company Act of 1940, as amended (the “Act”), as an open-end management investment company. The Trust consists of 14 diversified portfolios. The financial statements included herein are only those of Federated Kaufmann Large Cap Fund (the “Fund”), a diversified portfolio. The financial statements of the other portfolios are presented separately. The assets of each portfolio are segregated and a shareholder's interest is limited to the portfolio in which shares are held. Each portfolio pays its own expenses. The Fund offers five classes of shares: Class A Shares, Class C Shares, Class R Shares, Institutional Shares and Class R6 Shares. All shares of the Fund have equal rights with respect to voting, except on class-specific matters. The investment objective of the Fund is to provide capital appreciation.
2. SIGNIFICANT ACCOUNTING POLICIES
The following is a summary of significant accounting policies consistently followed by the Fund in the preparation of its financial statements. These policies are in conformity with U.S. generally accepted accounting principles (GAAP).
Investment Valuation
In calculating its net asset value (NAV), the Fund generally values investments as follows:
| ■ | Equity securities listed on an exchange or traded through a regulated market system are valued at their last reported sale price or official closing price in their principal exchange or market. |
| ■ | Fixed-income securities acquired with remaining maturities greater than 60 days are fair valued using price evaluations provided by a pricing service approved by the Fund's Trustees. |
| ■ | Fixed-income securities and repurchase agreements acquired with remaining maturities of 60 days or less are valued at their cost (adjusted for the accretion of any discount or amortization of any premium), unless the issuer's creditworthiness is impaired or other factors indicate that amortized cost is not an accurate estimate of the investment's fair value, in which case it would be valued in the same manner as a longer-term security. |
| ■ | Shares of other mutual funds or non-exchange-traded investment companies are valued based upon their reported NAVs. |
| ■ | Derivative contracts listed on exchanges are valued at their reported settlement or closing price, except that options are valued at the mean of closing bid and asked quotations. |
| ■ | Over-the-counter (OTC) derivative contracts are fair valued using price evaluations provided by a pricing service approved by the Trustees. |
| ■ | For securities that are fair valued in accordance with procedures established by and under the general supervision of the Trustees, certain factors may be considered such as: the last traded or purchase price of the security, information obtained by contacting the issuer or dealers, analysis of the issuer's financial statements or other available documents, fundamental analytical data, the nature and duration of restrictions on disposition, the movement of the market in which the security is normally traded, public trading in similar securities or derivative contracts of the issuer or comparable issuers, movement of a relevant index, or other factors including but not limited to industry changes and relevant government actions. |
Annual Shareholder Report
If any price, quotation, price evaluation or other pricing source is not readily available when the NAV is calculated, or if the Fund cannot obtain price evaluations from a pricing service or from more than one dealer for an investment within a reasonable period of time as set forth in the Fund's valuation policies and procedures, the Fund uses the fair value of the investment determined in accordance with the procedures described below. There can be no assurance that the Fund could obtain the fair value assigned to an investment if it sold the investment at approximately the time at which the Fund determines its NAV per share.
Fair Valuation and Significant Events Procedures
The Trustees have ultimate responsibility for determining the fair value of investments for which market quotations are not readily available. The Trustees have appointed a valuation committee (“Valuation Committee”) comprised of officers of the Fund, Federated Equity Management Company of Pennsylvania (“Adviser”) and certain of the Adviser's affiliated companies to assist in determining fair value and in overseeing the calculation of the NAV. The Trustees have also authorized the use of pricing services recommended by the Valuation Committee to provide fair value evaluations of the current value of certain investments for purposes of calculating the NAV. The Valuation Committee employs various methods for reviewing third-party pricing-service evaluations including periodic reviews of third-party pricing services' policies, procedures and valuation methods (including key inputs, methods, models and assumptions), transactional back-testing, comparisons of evaluations of different pricing services, and review of price challenges by the Adviser based on recent market activity. In the event that market quotations and price evaluations are not available for an investment, the Valuation Committee determines the fair value of the investment in accordance with procedures adopted by the Trustees. The Trustees periodically review and approve the fair valuations made by the Valuation Committee and any changes made to the procedures.
Factors considered by pricing services in evaluating an investment include the yields or prices of investments of comparable quality, coupon, maturity, call rights and other potential prepayments, terms and type, reported transactions, indications as to values from dealers and general market conditions. Some pricing services provide a single price evaluation reflecting the bid-side of the market for an investment (a “bid” evaluation). Other pricing services offer both bid evaluations and price evaluations indicative of a price between the prices bid and asked for the investment (a “mid” evaluation). The Fund normally uses bid evaluations for any U.S. Treasury and Agency securities, mortgage-backed securities and municipal securities. The Fund normally uses mid evaluations for any other types of fixed-income securities and any OTC derivative contracts. In the event that market quotations and price evaluations are not available for an investment, the fair value of the investment is determined in accordance with procedures adopted by the Trustees.
The Trustees also have adopted procedures requiring an investment to be priced at its fair value whenever the Adviser determines that a significant event affecting the value of the investment has occurred between the time as of which the price of the investment would otherwise be determined and the time as of which the NAV is computed. An event is considered significant if there is both an affirmative expectation that the investment's value will change in response to the event and a reasonable basis for quantifying the resulting change in value. Examples of significant events that may occur after the close of the principal market on which a security is traded, or after the time of a price evaluation provided by a pricing service or a dealer, include:
| ■ | With respect to securities traded principally in foreign markets, significant trends in U.S. equity markets or in the trading of foreign securities index futures contracts; |
Annual Shareholder Report
| ■ | Political or other developments affecting the economy or markets in which an issuer conducts its operations or its securities are traded; |
| ■ | Announcements concerning matters such as acquisitions, recapitalizations, litigation developments, or a natural disaster affecting the issuer's operations or regulatory changes or market developments affecting the issuer's industry. |
The Trustees have adopted procedures whereby the Valuation Committee uses a pricing service to determine the fair value of equity securities traded principally in foreign markets when the Adviser determines that there has been a significant trend in the U.S. equity markets or in index futures trading. For other significant events, the Fund may seek to obtain more current quotations or price evaluations from alternative pricing sources. If a reliable alternative pricing source is not available, the Fund will determine the fair value of the investment in accordance with the fair valuation procedures approved by the Trustees. The Trustees have ultimate responsibility for any fair valuations made in response to a significant event.
Repurchase Agreements
The Fund may invest in repurchase agreements for short-term liquidity purposes. It is the policy of the Fund to require the other party to a repurchase agreement to transfer to the Fund's custodian or sub-custodian eligible securities or cash with a market value (after transaction costs) at least equal to the repurchase price to be paid under the repurchase agreement. The eligible securities are transferred to accounts with the custodian or sub-custodian in which the Fund holds a “securities entitlement” and exercises “control” as those terms are defined in the Uniform Commercial Code. The Fund has established procedures for monitoring the market value of the transferred securities and requiring the transfer of additional eligible securities if necessary to equal at least the repurchase price. These procedures also allow the other party to require securities to be transferred from the account to the extent that their market value exceeds the repurchase price or in exchange for other eligible securities of equivalent market value.
The insolvency of the other party or other failure to repurchase the securities may delay the disposition of the underlying securities or cause the Fund to receive less than the full repurchase price. Under the terms of the repurchase agreement, any amounts received by the Fund in excess of the repurchase price and related transaction costs must be remitted to the other party.
The Fund may enter into repurchase agreements in which eligible securities are transferred into joint trading accounts maintained by the custodian or sub-custodian for investment companies and other clients advised by the Fund's Adviser and its affiliates. The Fund will participate on a pro rata basis with the other investment companies and clients in its share of the securities transferred under such repurchase agreements and in its share of proceeds from any repurchase or other disposition of such securities.
Investment Income, Gains and Losses, Expenses and Distributions
Investment transactions are accounted for on a trade-date basis. Realized gains and losses from investment transactions are recorded on an identified-cost basis. Interest income and expenses are accrued daily. Dividend income and distributions to shareholders are recorded on the ex-dividend date. Foreign dividends are recorded on the ex-dividend date or when the Fund is informed of the ex-dividend date. Distributions of net investment income, if any, are declared and paid annually. Non-cash dividends included in dividend income, if any, are recorded at fair value. Investment income, realized and unrealized gains and losses and certain fund-level expenses are allocated to each class based on relative average daily net
Annual Shareholder Report
assets, except that Class A Shares, Class C Shares, Class R Shares, Institutional Shares and Class R6 Shares may bear distribution services fees, other service fees and transfer agent fees unique to those classes. For the year ended October 31, 2015, transfer agent fees for the Fund were as follows:
| | Transfer
Agent Fees
Incurred | Transfer
Agent Fees
Reimbursed |
| Class A Shares | $693,284 | $(151,052) |
| Class C Shares | 392,008 | — |
| Class R Shares | 203,730 | — |
| Institutional Shares | 985,846 | (116,649) |
| Class R6 Shares | 22,492 | — |
| TOTAL | $2,297,360 | $(267,701) |
Dividends are declared separately for each class. No class has preferential dividend rights; differences in per share dividend rates are generally due to differences in separate class expenses.
Other Service Fees
The Fund may pay other service fees up to 0.25% of the average daily net assets of the Fund's Class A Shares and Class C Shares to unaffiliated financial intermediaries or to Federated Shareholder Services Company (FSSC) for providing services to shareholders and maintaining shareholder accounts. Subject to the terms described in the Expense Limitation note, FSSC may voluntarily reimburse the Fund for other service fees. For the year ended October 31, 2015, other service fees for the Fund were as follows:
| | Other
Service Fees
Incurred |
| Class A Shares | $1,794,173 |
| Class C Shares | 960,761 |
| TOTAL | $2,754,934 |
Premium and Discount Amortization
All premiums and discounts on fixed-income securities are amortized/accreted using the effective-interest-rate method.
Federal Taxes
It is the Fund's policy to comply with the Subchapter M provision of the Internal Revenue Code (the “Code”) and to distribute to shareholders each year substantially all of its income. Accordingly, no provision for federal income tax is necessary. As of and during the year ended October 31, 2015, the Fund did not have a liability for any uncertain tax positions. The Fund recognizes interest and penalties, if any, related to tax liabilities as income tax expense in the Statement of Operations. As of October 31, 2015, tax years 2012 through 2015 remain subject to examination by the Fund's major tax jurisdictions, which include the United States of America and the Commonwealth of Massachusetts.
Annual Shareholder Report
The Fund may be subject to taxes imposed by governments of countries in which it invests. Such taxes are generally based on either income or gains earned or repatriated. The Fund accrues and applies such taxes to net investment income, net realized gains and net unrealized gains as income and/or gains are earned.
When-Issued and Delayed-Delivery Transactions
The Fund may engage in when-issued or delayed-delivery transactions. The Fund records when-issued securities on the trade date and maintains security positions such that sufficient liquid assets will be available to make payment for the securities purchased. Securities purchased on a when-issued or delayed-delivery basis are marked to market daily and begin earning interest on the settlement date. Losses may occur on these transactions due to changes in market conditions or the failure of counterparties to perform under the contract.
Restricted Securities
The Fund may purchase securities which are considered restricted. Restricted securities are securities that either: (a) cannot be offered for public sale without first being registered, or being able to take advantage of an exemption from registration, under the Securities Act of 1933; or (b) are subject to contractual restrictions on public sales. In some cases, when a security cannot be offered for public sale without first being registered, the issuer of the restricted security has agreed to register such securities for resale, at the issuer's expense, either upon demand by the Fund or in connection with another registered offering of the securities. Many such restricted securities may be resold in the secondary market in transactions exempt from registration. Restricted securities may be determined to be liquid under criteria established by the Trustees. The Fund will not incur any registration costs upon such resales. The Fund's restricted securities, like other securities, are priced in accordance with procedures established by and under the general supervision of the Trustees.
Foreign Exchange Contracts
The Fund enters into foreign exchange contracts to manage currency and market risks. Purchased contracts are used to acquire exposure to foreign currencies, whereas, contracts to sell are used to hedge the Fund's securities against currency fluctuations. Risks may arise upon entering into these transactions from the potential inability of counterparties to meet the terms of their commitments and from unanticipated movements in security prices or foreign exchange rates. The foreign exchange contracts are adjusted by the daily exchange rate of the underlying currency and any gains or losses are recorded for financial statement purposes as unrealized until the settlement date.
Foreign exchange contracts are subject to Master Netting Agreements which are agreements between the Fund and its counterparties that provides for the net settlement of all transactions and collateral with the Fund, through a single payment, in the event of default or termination. Amounts presented on the Portfolio of Investments and Statement of Assets and Liabilities are not net settlement amounts but gross. Foreign exchange contracts outstanding at period end, including net unrealized appreciation/depreciation or net settlement amount, are listed after the Fund's Portfolio of Investments.
The average value at settlement date payable of foreign exchange contracts purchased by the Fund throughout the period was $1,125. This is based on the contracts held as of each month-end throughout the fiscal period.
Annual Shareholder Report
Foreign Currency Translation
The accounting records of the Fund are maintained in U.S. dollars. All assets and liabilities denominated in foreign currencies (FCs) are translated into U.S. dollars based on the rates of exchange of such currencies against U.S. dollars on the date of valuation. Purchases and sales of securities, income and expenses are translated at the rate of exchange quoted on the respective date that such transactions are recorded. The Fund does not isolate that portion of the results of operations resulting from changes in foreign exchange rates on investments from the fluctuations arising from changes in market prices of securities held. Such fluctuations are included with the net realized and unrealized gain or loss from investments.
Reported net realized foreign exchange gains or losses arise from sales of portfolio securities, sales and maturities of short-term securities, sales of FCs, currency gains or losses realized between the trade and settlement dates on securities transactions, the difference between the amounts of dividends, interest and foreign withholding taxes recorded on the Fund's books, and the U.S. dollar equivalent of the amounts actually received or paid. Net unrealized foreign exchange gains and losses arise from changes in the value of assets and liabilities other than investments in securities at fiscal year end, resulting from changes in the exchange rate.
Securities Lending
The Fund participates in a securities lending program providing for the lending of equity securities to qualified brokers. The Fund normally receives cash collateral for securities loaned that is invested in an affiliated money market fund or in short-term securities including repurchase agreements. Collateral is maintained at a minimum level of 100% of the market value of investments loaned, plus interest, if applicable. Earnings on collateral are allocated between the borrower of the security, the securities lending agent, as a fee for its services under the program and the Fund, according to agreed-upon rates.
The securities lending agreement permits the net settlement of all transactions and collateral with the Fund, through a single payment, in the event of default or termination. Amounts presented on the Portfolio of Investments and Statement of Assets and Liabilities are not net settlement amount but gross. As indicated below, the cash collateral received by the Fund exceeds the market value of the securities loaned reducing the net settlement amount to zero. The chart below identifies the amount of collateral received as well as the market value of securities on loan. Additionally, the securities lending agreement executed by the Fund includes an indemnification clause. This clause stipulates that the borrower will reimburse the Fund for any losses as a result of any failure of the borrower to return equivalent securities to the Fund.
As of October 31, 2015, securities subject to this type of arrangement and related collateral were as follows:
Market Value of
Securities Loaned | Market Value
of Collateral |
| $79,416,950 | $79,491,400 |
Annual Shareholder Report
Additional Disclosure Related to Derivative Instruments
| Fair Value of Derivative Instruments |
| | Liability |
| | Statement of
Assets and
Liabilities
Location | Fair
Value |
Derivatives not accounted for as hedging instruments
under ASC Topic 815 | | |
| Foreign exchange contracts | Unrealized
depreciation
on foreign
exchange
contracts | $7,334 |
The Effect of Derivative Instruments on the Statement of Operations for the Year Ended October 31, 2015
| Amount of Realized Gain or (Loss) on Derivatives Recognized in Income |
| | Forward
Currency
Contracts |
| Foreign exchange contracts | $(59,509) |
| Change in Unrealized Appreciation or (Depreciation) on Derivatives Recognized in Income |
| | Forward
Currency
Contracts |
| Foreign exchange contracts | $(7,334) |
Other
The preparation of financial statements in conformity with GAAP requires management to make estimates and assumptions that affect the amounts of assets, liabilities, expenses and revenues reported in the financial statements. Actual results could differ from those estimated. The Fund applies Investment Company accounting and reporting guidance.
3. SHARES OF BENEFICIAL INTEREST
The following tables summarize share activity:
| Year Ended October 31 | 2015 | 2014 |
| Class A Shares: | Shares | Amount | Shares | Amount |
| Shares sold | 32,794,835 | $629,236,802 | 15,162,985 | $257,106,457 |
| Shares issued to shareholders in payment of distributions declared | 960,735 | 17,475,760 | 490,757 | 8,156,394 |
| Shares redeemed | (8,594,728) | (162,694,344) | (11,947,053) | (208,713,135) |
| NET CHANGE RESULTING FROM CLASS A SHARE TRANSACTIONS | 25,160,842 | $484,018,218 | 3,706,689 | $56,549,716 |
Annual Shareholder Report
| Year Ended October 31 | 2015 | 2014 |
| Class C Shares: | Shares | Amount | Shares | Amount |
| Shares sold | 13,995,909 | $253,463,462 | 5,987,338 | $97,441,036 |
| Shares issued to shareholders in payment of distributions declared | 499,010 | 8,612,914 | 204,539 | 3,256,263 |
| Shares redeemed | (2,701,132) | (48,505,835) | (1,872,577) | (30,720,354) |
| NET CHANGE RESULTING FROM CLASS C SHARE TRANSACTIONS | 11,793,787 | $213,570,541 | 4,319,300 | $69,976,945 |
| Year Ended October 31 | 2015 | 2014 |
| Class R Shares: | Shares | Amount | Shares | Amount |
| Share sold | 1,333,747 | $24,688,173 | 1,026,619 | $17,043,401 |
| Shares issued to shareholders in payment of distributions declared | 154,558 | 2,726,396 | 89,345 | 1,446,491 |
| Shares redeemed | (1,147,750) | (21,183,341) | (1,281,309) | (21,317,376) |
| NET CHANGE RESULTING FROM CLASS R SHARE TRANSACTIONS | 340,555 | $6,231,228 | (165,345) | $(2,827,484) |
| Year Ended October 31 | 2015 | 2014 |
| Institutional Shares: | Shares | Amount | Shares | Amount |
| Shares sold | 51,781,342 | $1,007,177,205 | 29,176,724 | $509,784,728 |
| Shares issued to shareholders in payment of distributions declared | 1,458,882 | 26,930,963 | 398,256 | 6,694,678 |
| Shares redeemed | (15,427,426) | (295,558,472) | (8,362,069) | (144,739,744) |
| NET CHANGE RESULTING FROM INSTITUTIONAL SHARE TRANSACTIONS | 37,812,798 | $738,549,696 | 21,212,911 | $371,739,662 |
| | Year Ended
10/31/2015 | Period Ended
10/31/20141 |
| Class R6 Shares: | Shares | Amount | Shares | Amount |
| Shares sold | 5,251,863 | $99,852,019 | 8,624,811 | $148,388,980 |
| Shares issued to shareholders in payment of distributions declared | 37,651 | 695,411 | — | — |
| Shares redeemed | (2,330,797) | (45,288,232) | (1,698,348) | (28,432,116) |
| NET CHANGE RESULTING FROM CLASS R6 SHARE TRANSACTIONS | 2,958,717 | $55,259,198 | 6,926,463 | $119,956,864 |
| NET CHANGE RESULTING FROM TOTAL FUND SHARE TRANSACTIONS | 78,066,699 | $1,497,628,881 | 36,000,018 | $615,395,703 |
| 1 | Reflects operations for the period from December 30, 2013 (date of initial investment) to October 31, 2014. |
Annual Shareholder Report
4. FEDERAL TAX INFORMATION
The timing and character of income and capital gain distributions are determined in accordance with income tax regulations, which may differ from GAAP. These differences are due to differing treatments for capital gains tax expense, foreign currency transactions and discount accretion/premium amortization on debt securities
For the year ended October 31, 2015, permanent differences identified and reclassified among the components of net assets were as follows:
| Increase (Decrease) |
Undistributed
Net Investment
Income (Loss) | Accumulated
Net Realized
Gain (Loss) |
| $(187,177) | $187,177 |
Net investment income (loss), net realized gains (losses) and net assets were not affected by this reclassification.
The tax character of distributions as reported on the Statement of Changes in Net Assets for the years ended October 31, 2015 and 2014 was as follows:
| | 2015 | 2014 |
| Ordinary income1 | $41,627,865 | $15,174,058 |
| Long-term capital gains | $28,334,193 | $8,260,618 |
| 1 | For tax purposes, short-term capital gain distributions are considered ordinary income distributions. |
| | |
As of October 31, 2015, the components of distributable earnings on a tax basis were as follows:
| Net unrealized appreciation | $490,550,795 |
| Capital loss carryforwards and deferrals | $(68,533,051) |
The difference between book-basis and tax-basis net unrealized appreciation/depreciation is attributable to differing treatments for the deferral of losses on wash sales.
At October 31, 2015, the cost of investments for federal tax purposes was $2,839,312,052. The net unrealized appreciation of investments for federal tax purposes excluding any unrealized appreciation/ depreciation resulting from: (a) the translation from FCs to U.S. dollars of assets and liabilities other than investments in securities; and (b) outstanding foreign currency commitments was $490,589,102. This consists of net unrealized appreciation from investments for those securities having an excess of value over cost of $528,327,225 and net unrealized depreciation from investments for those securities having an excess of cost over value of $37,738,123
At October 31, 2015, the Fund had a capital loss carryforward of $65,443,541 which will reduce the Fund's taxable income arising from future net realized gains on investments, if any, to the extent permitted by the Code, thereby reducing the amount of distributions to shareholders which would otherwise be necessary to relieve the Fund of any liability for federal income tax. Pursuant to the Code, a net capital loss incurred in taxable years beginning after December 22, 2010, retains its character as either short-term or long-term and does not expire. All of the Fund's capital loss carryforwards were incurred in taxable years beginning after December 22, 2010.
Annual Shareholder Report
The following schedule summarizes the Fund's capital loss carryforwards:
| Short-Term | Long-Term | Total |
| $65,443,541 | $— | $65,443,541 |
Under current tax rules, a late-year ordinary loss may be deferred, in whole or in part, and treated as occurring on the first day of the following fiscal year. As of October 31, 2015, for federal income tax purposes, a late-year ordinary loss of $3,089,510 was deferred to November 1, 2015.
5. INVESTMENT ADVISER FEE AND OTHER TRANSACTIONS WITH AFFILIATES
Investment Adviser Fee
The advisory agreement between the Fund and the Adviser provides for an annual fee equal to 0.75% of the Fund's average daily net assets. Subject to the terms described in the Expense Limitation note, the Adviser may voluntarily choose to waive any portion of its fee. For the year ended October 31, 2015, the Adviser voluntarily waived $2,096,754 of its fee and reimbursed $266,701 of transfer agent fees.
Certain of the Fund's assets are managed by Federated Global Investment Management Corp. (the “Sub-Adviser”). Under the terms of a sub-advisory agreement between the Adviser and the Sub-Adviser, the Sub-Adviser receives an allocable portion of the Fund's adviser fee. The fee is paid by the Adviser out of its resources and is not an incremental Fund expense. For the year ended October 31, 2015, the Sub-Adviser earned a fee of $15,519,087.
Administrative Fee
Federated Administrative Services (FAS), under the Administrative Services Agreement, provides the Fund with administrative personnel and services. For purposes of determining the appropriate rate breakpoint, “Investment Complex” is defined as all of the Federated Funds subject to a fee under the Administrative Services Agreement. The fee paid to FAS is based on the average daily net assets of the Investment Complex as specified below, plus certain out-of-pocket expenses:
| Administrative Fee | Average Daily Net Assets
of the Investment Complex |
| 0.150% | on the first $5 billion |
| 0.125% | on the next $5 billion |
| 0.100% | on the next $10 billion |
| 0.075% | on assets in excess of $20 billion |
Subject to the terms described in the Expense Limitation note, FAS may voluntarily choose to waive any portion of its fee. For the year ended October 31, 2015, the annualized fee paid to FAS was 0.078% of average daily net assets of the Fund.
Annual Shareholder Report
Distribution Services Fee
The Fund has adopted a Distribution Plan (the “Plan”) pursuant to Rule 12b-1 under the Act. Under the terms of the Plan, the Fund will compensate Federated Securities Corp. (FSC), the principal distributor, from the daily net assets of the Fund's Class A Shares, Class C Shares and Class R Shares to finance activities intended to result in the sale of these shares. The Plan provides that the Fund may incur distribution expenses at the following percentages of average daily net assets annually, to compensate FSC:
| Share Class Name | Percentage of Average Daily
Net Assets of Class |
| Class A Shares | 0.25% |
| Class C Shares | 0.75% |
| Class R Shares | 0.50% |
Subject to the terms described in the Expense Limitation note, FSC may voluntarily choose to waive any portion of its fee. For the year ended October 31, 2015, distribution services fees for the Fund were as follows:
| | Distribution
Services Fees
Incurred | Distribution
Services Fees
Waived |
| Class C Shares | $2,882,284 | $— |
| Class R Shares | 388,270 | (38,827) |
| TOTAL | $3,270,554 | $(38,827) |
When FSC receives fees, it may pay some or all of them to financial intermediaries whose customers purchase shares. For the year ended October 31, 2015, FSC retained $952,373 of fees paid by the Fund. For the year ended October 31, 2015, the Fund's Class A Shares did not incur a distribution services fee; however, it may begin to incur this fee upon approval of the Trustees.
Sales Charges
Front-end sales charges and contingent deferred sales charges (CDSC) do not represent expenses of the Fund. They are deducted from the proceeds of sales of Fund shares prior to investment or from redemption proceeds prior to remittance, as applicable. For the year ended October 31, 2015, FSC retained $422,821 in sales charges from the sale of Class A Shares. FSC also retained $29,333 of CDSC relating to redemptions of Class A Shares and $72,007 relating to redemptions of Class C Shares.
Other Service Fees
For the year ended October 31, 2015, FSSC received $24,425 of the other service fees disclosed in Note 2.
Expense Limitation
The Adviser and certain of its affiliates (which may include FSC, FAS and FSSC) on their own initiative have agreed to waive certain amounts of their respective fees and/or reimburse expenses. Effective January 1, 2016, total annual fund operating expenses (as shown in the financial highlights, excluding expenses allocated from affiliated partnerships, extraordinary expenses and proxy-related expenses paid by the Fund, if any) paid by the Fund's Class A Shares, Class C Shares, Class R Shares, Institutional Shares and Class R6 Shares (after the
Annual Shareholder Report
voluntary waivers and/or reimbursements) will not exceed 1.08%, 1.86%, 1.47%, 0.83% and 0.77% (the “Fee Limit”), respectively, up to but not including the later of (the “Termination Date”): (a) January 1, 2017; or (b) the date of the Fund's next effective Prospectus. While the Adviser and its applicable affiliates currently do not anticipate terminating or increasing these arrangements prior to the Termination Date, these arrangements may only be terminated or the Fee Limit increased prior to the Termination Date with the agreement of the Trustees.
Interfund Transactions
During the year ended October 31, 2015, the Fund engaged in purchase transactions with funds that have a common investment adviser (or affiliated investment advisers), common Directors/Trustees and/or common Officers. These purchase transactions complied with Rule 17a-7 under the Act and amounted to $75,303,054.
General
Certain Officers and Trustees of the Fund are Officers and Directors or Trustees of certain of the above companies. To efficiently facilitate payment, Directors'/Trustees' fees and certain expenses related to conducting meetings of the Directors/Trustees and other miscellaneous expenses are paid by an affiliate of the Adviser which in due course are reimbursed by the Fund. Such expenses may be included in Accrued and Miscellaneous Expenses on the Statement of Assets and Liabilities and Statement of Operations, respectively.
Transactions Involving Affiliated Companies and Affiliated Holdings
An affiliated company is a company in which the Fund, alone or in combination with other affiliated Funds, has ownership of at least 5% of the voting shares. Transactions with affiliated companies during the year ended October 31, 2015, were as follows:
| Affiliates | Balance of
Shares Held
10/31/2014 | Purchases/
Additions | Sales/
Reductions | Balance of
Shares Held
10/31/2015 | Value | Dividend/
Interest
Income |
*Central European
Media Enterprises Ltd.,
Class A | 3,879,474 | 1,620,526 | (5,500,000) | — | $— | $— |
*Central European
Media Enterprises,
Ltd., Rights | 721,119 | 888,888 | — | 1,610,007 | $3,011,035 | — |
*Central European
Media Enterprises Ltd.,
15.00%, 12/1/2017 | 3,433,900 | 5,525,515 | (8,959,415) | — | $— | 297,742 |
| Premier, Inc. | 1,106,601 | 393,399 | (235,341) | 1,264,659 | $42,758,121 | — |
TOTAL OF
AFFILIATED
COMPANIES | 9,141,094 | 8,428,328 | (14,694,756) | 2,874,666 | $45,769,156 | $297,742 |
| * | At October 31, 2015, the Fund no longer has ownership of at least 5% of the voting shares. |
Annual Shareholder Report
Affiliated holdings are investment companies which are managed by the Adviser or an affiliate of the Adviser. The Adviser has agreed to reimburse the Fund for certain investment adviser fees as a result of transactions in other affiliated investment companies. For the year ended October 31, 2015, the Adviser reimbursed $229,471. Transactions involving the affiliated holdings during the year ended October 31, 2015, were as follows:
| | Federated
Money Market
Management,
Institutional
Shares | Federated
Prime Value
Obligations Fund,
Institutional
Shares | Total of
Affiliated
Transactions |
| Balance of Shares Held 10/31/2014 | 159,883,073 | 48,793,317 | 208,676,390 |
| Purchases/Additions | 977,563,546 | 1,466,544,031 | 2,444,107,577 |
| Sales/Reductions | (1,057,955,219) | (1,205,994,563) | (2,263,949,782) |
| Balance of Shares Held 10/31/2015 | 79,491,400 | 309,342,785 | 388,834,185 |
| Value | $79,491,400 | $309,342,785 | $388,834,185 |
| Dividend Income | $113,715 | $158,397 | $272,112 |
6. EXPENSE Reduction
The Fund directs portfolio trades to a broker that in turn pays a portion of the Fund's operating expenses. For the year ended October 31, 2015, the Fund's expenses were reduced by $21,205 under these arrangements.
7. Investment TRANSACTIONS
Purchases and sales of investments, excluding long-term U.S. government securities and short-term obligations, for the year ended October 31, 2015, were as follows:
| Purchases | $2,468,041,923 |
| Sales | $1,323,208,096 |
8. CONCENTRATION OF RISK
The Fund invests in securities of non-U.S. issuers. Political or economic developments may have an effect on the liquidity and volatility of portfolio securities and currency holdings.
9. LINE OF CREDIT
The Fund participates in a $100,000,000 unsecured, uncommitted revolving line of credit (LOC) agreement with PNC Bank. The LOC was made available for extraordinary or emergency purposes, primarily for financing redemption payments. Borrowings are charged interest at a rate offered to the Fund by PNC Bank at the time of the borrowing. As of October 31, 2015, there were no outstanding loans. During the year ended October 31, 2015, the Fund did not utilize the LOC.
Annual Shareholder Report
10. INTERFUND LENDING
Pursuant to an Exemptive Order issued by the Securities and Exchange Commission, the Fund, along with other funds advised by subsidiaries of Federated Investors, Inc., may participate in an interfund lending program. This program provides an alternative credit facility allowing the Fund to borrow from other participating affiliated funds. As of October 31, 2015, there were no outstanding loans. During the year ended October 31, 2015, the program was not utilized.
11. FEDERAL TAX INFORMATION (UNAUDITED)
For the year ended October 31, 2015, the amount of long-term capital gains designated by the Fund was $28,334,193.
For the fiscal year ended October 31, 2015, 28.31% of total ordinary income (including short-term capital gain) distributions made by the Fund are qualifying dividends which may be subject to a maximum tax rate of 15%, as provided for by the Jobs and Growth Tax Relief Act of 2003. Complete information is reported in conjunction with the reporting of your distributions on Form 1099-DIV.
Of the ordinary income (including short-term capital gain) distributions made by the Fund during the year ended October 31, 2015, 19.60% qualify for the dividend received deduction available to corporate shareholders.
Annual Shareholder Report
Report of Independent Registered Public Accounting Firm
TO THE BOARD OF Trustees OF Federated Equity Funds AND SHAREHOLDERS OF Federated Kaufmann Large Cap Fund:
We have audited the accompanying statement of assets and liabilities of Federated Kaufmann Large Cap Fund (the “Fund”) (one of the portfolios constituting Federated Equity Funds), including the portfolio of investments, as of October 31, 2015, and the related statement of operations for the year then ended, the statement of changes in net assets for each of the two years in the period then ended and the financial highlights for each of the years or periods indicated therein. These financial statements and financial highlights are the responsibility of the Fund's management. Our responsibility is to express an opinion on these financial statements and financial highlights based on our audits.
We conducted our audits in accordance with standards of the Public Company Accounting Oversight Board (United States). Those standards require that we plan and perform the audit to obtain reasonable assurance about whether the financial statements and financial highlights are free of material misstatement. We were not engaged to perform an audit of the Fund's internal control over financial reporting. Our audits included consideration of internal control over financial reporting as a basis for designing audit procedures that are appropriate in the circumstances, but not for the purpose of expressing an opinion on the effectiveness of the Fund's internal control over financial reporting. Accordingly, we express no such opinion. An audit also includes examining, on a test basis, evidence supporting the amounts and disclosures in the financial statements and financial highlights, assessing the accounting principles used and significant estimates made by management, and evaluating the overall financial statement presentation. Our procedures included confirmation of securities owned as of October 31, 2015, by correspondence with the custodian and others or by other appropriate auditing procedures where replies from others were not received. We believe that our audits provide a reasonable basis for our opinion.
In our opinion, the financial statements and financial highlights referred to above present fairly, in all material respects, the financial position of the Federated Kaufmann Large Cap Fund, a portfolio of Federated Equity Funds, at October 31, 2015, the results of its operations for the year then ended, the changes in its net assets for each of the two years in the period then ended and the financial highlights for each of the years or periods indicated therein, in conformity with U.S. generally accepted accounting principles.
Boston, Massachusetts
December 23, 2015
Annual Shareholder Report
Shareholder Expense Example (unaudited)
As a shareholder of the Fund, you incur two types of costs: (1) transaction costs, including sales charges (loads) on purchase or redemption payments; and (2) ongoing costs, including management fees and to the extent applicable, distribution (12b-1) fees and/or other service fees and other Fund expenses. This Example is intended to help you to understand your ongoing costs (in dollars) of investing in the Fund and to compare these costs with the ongoing costs of investing in other mutual funds. It is based on an investment of $1,000 invested at the beginning of the period and held for the entire period from May 1, 2015 to October 31, 2015.
ACTUAL EXPENSES
The first section of the table below provides information about actual account values and actual expenses. You may use the information in this section, together with the amount you invested, to estimate the expenses that you incurred over the period. Simply divide your account value by $1,000 (for example, an $8,600 account value divided by $1,000 = 8.6), then multiply the result by the number in the first section under the heading entitled “Expenses Paid During Period” to estimate the expenses attributable to your investment during this period.
HYPOTHETICAL EXAMPLE FOR COMPARISON PURPOSES
The second section of the table below provides information about hypothetical account values and hypothetical expenses based on the Fund's actual expense ratio and an assumed rate of return of 5% per year before expenses, which is not the Fund's actual return. Thus, you should not use the hypothetical account values and expenses to estimate the actual ending account balance or your expenses for the period. Rather, these figures are required to be provided to enable you to compare the ongoing costs of investing in the Fund with other funds. To do so, compare this 5% hypothetical example with the 5% hypothetical examples that appear in the shareholder reports of the other funds.
Annual Shareholder Report
Please note that the expenses shown in the table are meant to highlight your ongoing costs only and do not reflect any transaction costs, such as sales charges (loads) on purchase or redemption payments. Therefore, the second section of the table is useful in comparing ongoing costs only, and will not help you determine the relative total costs of owning different funds. In addition, if these transaction costs were included, your costs would have been higher.
| | Beginning
Account Value
5/1/2015 | Ending
Account Value
10/31/2015 | Expenses Paid
During Period1 |
| Actual: | | | |
| Class A Shares | $1,000 | $973.10 | $5.42 |
| Class C Shares | $1,000 | $969.40 | $9.33 |
| Class R Shares | $1,000 | $971.10 | $7.40 |
| Institutional Shares | $1,000 | $974.00 | $4.23 |
| R6 Shares | $1,000 | $974.50 | $3.88 |
Hypothetical (assuming a 5% return
before expenses): | | | |
| Class A Shares | $1,000 | $1,019.71 | $5.55 |
| Class C Shares | $1,000 | $1,015.73 | $9.55 |
| Class R Shares | $1,000 | $1,017.69 | $7.58 |
| Institutional Shares | $1,000 | $1,020.92 | $4.33 |
| R6 Shares | $1,000 | $1,021.27 | $3.97 |
| 1 | Expenses are equal to the Fund's annualized net expense ratios, multiplied by the average account value over the period, multiplied by 184/365 (to reflect the one-half-year period). The annualized net expense ratios are as follows: |
| | |
| Class A Shares | 1.09% |
| Class C Shares | 1.88% |
| Class R Shares | 1.49% |
| Institutional Shares | 0.85% |
| R6 Shares | 0.78% |
Annual Shareholder Report
Board of Trustees and Trust Officers
The Board of Trustees is responsible for managing the Trust's business affairs and for exercising all the Trust's powers except those reserved for the shareholders. The following tables give information about each Trustee and the senior officers of the Fund. Where required, the tables separately list Trustees who are “interested persons” of the Fund (i.e., “Interested” Trustees) and those who are not (i.e., “Independent” Trustees). Unless otherwise noted, the address of each person listed is Federated Investors Tower, 1001 Liberty Avenue, Pittsburgh, PA 15222. The address of all Independent Trustees listed is 4000 Ericsson Drive, Warrendale, PA 15086-7561; Attention: Mutual Fund Board. As of December 31, 2014, the Trust comprised 14 portfolio(s), and the Federated Fund Family consisted of 40 investment companies (comprising 131 portfolios). Unless otherwise noted, each Officer is elected annually. Unless otherwise noted, each Trustee oversees all portfolios in the Federated Fund Family and serves for an indefinite term. The Fund's Statement of Additional Information includes additional information about Trust Trustees and is available, without charge and upon request, by calling 1-800-341-7400.
Interested Trustees Background
Name
Birth Date
Positions Held with Trust
Date Service Began | Principal Occupation(s) for Past Five Years,
Other Directorships Held and Previous Position(s) |
John F. Donahue*
Birth Date: July 28, 1924
Trustee
Indefinite Term
Began serving: April 1984 | Principal Occupations: Director or Trustee of the Federated Fund Family; Chairman and Director, Federated Investors, Inc.; Chairman of the Federated Fund Family's Executive Committee.
Previous Positions: Chairman of the Federated Fund Family; Trustee, Federated Investment Management Company; Chairman and Director, Federated Investment Counseling. |
J. Christopher Donahue*
Birth Date: April 11, 1949
President and Trustee
Indefinite Term
Began serving: January 2000 | Principal Occupations: Principal Executive Officer and President of certain of the Funds in the Federated Fund Family; Director or Trustee of the Funds in the Federated Fund Family; President, Chief Executive Officer and Director, Federated Investors, Inc.; Chairman and Trustee, Federated Investment Management Company; Trustee, Federated Investment Counseling; Chairman and Director, Federated Global Investment Management Corp.; Chairman, Federated Equity Management Company of Pennsylvania and Passport Research, Ltd. (investment advisory subsidiary of Federated); Trustee, Federated Shareholder Services Company; Director, Federated Services Company.
Previous Positions: President, Federated Investment Counseling; President and Chief Executive Officer, Federated Investment Management Company, Federated Global Investment Management Corp. and Passport Research, Ltd. |
| * | Family relationships and reasons for “interested” status: John F. Donahue is the father of J. Christopher Donahue; both are “interested” due to their beneficial ownership of shares of Federated Investors, Inc. and the positions they hold with Federated and its subsidiaries. |
Annual Shareholder Report
INDEPENDENT Trustees Background
Name
Birth Date
Positions Held with Trust
Date Service Began | Principal Occupation(s) for Past Five Years,
Other Directorships Held, Previous Position(s) and Qualifications |
John T. Collins
Birth Date: January 24, 1947
Trustee
Indefinite Term
Began serving: October 2013 | Principal Occupations: Director or Trustee of the Federated Fund Family; Chairman and CEO, The Collins Group, Inc. (a private equity firm).
Other Directorships Held: Director, Chair of the Compensation Committee, Audit Committee member, KLX Corp.
Qualifications: Mr. Collins has served in several business and financial management roles and directorship positions throughout his career. Mr. Collins serves as Chairman Emeriti, Bentley University. Mr. Collins previously served as Director, FleetBoston Financial Corp.; Director and Audit Committee Member, Bank of America Corp. and Director, Beth Israel Deaconess Medical Center (Harvard University Affiliate Hospital). |
G. Thomas Hough
Birth Date: February 28, 1955
Trustee
Indefinite Term
Began serving: August 2015 | Principal Occupations: Director or Trustee of the Federated Fund Family; Retired.
Other Directorships Held: Director, Chair of the Audit Committee, Governance Committee, Publix Super Markets, Inc.
Qualifications: Mr. Hough has served in accounting, business management and directorship positions throughout his career. Mr. Hough most recently held the position of Americas Vice Chair of Assurance with Ernst & Young LLP. Mr. Hough is an Executive Committee member of the United States Golf Association, he serves on the President's Cabinet and Business School Board of Visitors for the University of Alabama and is on the Business School Board of Visitors for Wake Forest University. |
Maureen Lally-Green
Birth Date: July 5, 1949
Trustee
Indefinite Term
Began serving: August 2009 | Principal Occupations: Director or Trustee of the Federated Fund Family; Adjunct Professor of Law, Duquesne University School of Law.
Other Directorships Held: Director, CONSOL Energy Inc.
Qualifications: Judge Lally-Green has served in various legal and business roles and directorship positions throughout her career. Judge Lally-Green previously served as: Associate General Secretary, Diocese of Pittsburgh; Professor of Law, Duquesne University School of Law and was a member of the Superior Court of Pennsylvania. Judge Lally-Green also holds the positions of: Member, Pennsylvania State Board of Education; Director, Saint Vincent College; Director and Chair, UPMC Mercy Hospital; Regent, St. Vincent Seminary; Director, Epilepsy Foundation of Western and Central Pennsylvania; Director, Our Campaign for the Church Alive!, Inc.; Director, Pennsylvania Bar Institute; and Director, Cardinal Wuerl North Catholic High School, Inc. Judge Lally-Green has held the positions of: Director, Auberle; Director, Ireland Institute of Pittsburgh; Director, Saint Thomas More Society; and Director, Catholic High Schools of the Diocese of Pittsburgh, Inc. |
Annual Shareholder Report
Name
Birth Date
Positions Held with Trust
Date Service Began | Principal Occupation(s) for Past Five Years,
Other Directorships Held, Previous Position(s) and Qualifications |
Peter E. Madden
Birth Date: March 16, 1942
Trustee
Indefinite Term
Began serving: November 1991 | Principal Occupation: Director or Trustee, and Chair of the Board of Directors or Trustees, of the Federated Fund Family; Retired.
Other Directorships Held: None.
Qualifications: Mr. Madden has served in several business management, mutual fund services and directorship positions throughout his career. Mr. Madden previously served as President, Chief Operating Officer and Director, State Street Bank and Trust Company (custodian bank) and State Street Corporation (financial services). He was Director, VISA USA and VISA International and Chairman and Director, Massachusetts Bankers Association. Mr. Madden served as Director, Depository Trust Corporation and Director, The Boston Stock Exchange. Mr. Madden also served as a Representative to the Commonwealth of Massachusetts General Court. |
Charles F. Mansfield, Jr.
Birth Date: April 10, 1945
Trustee
Indefinite Term
Began serving: January 1999 | Principal Occupations: Director or Trustee of the Federated Fund Family; Management Consultant.
Other Directorships Held: None.
Qualifications: Mr. Mansfield has served in several banking, business management and educational roles and directorship positions throughout his career. Mr. Mansfield previously served as Chief Executive Officer, PBTC International Bank; Partner, Arthur Young & Company (now Ernst & Young LLP); Chief Financial Officer of Retail Banking Sector, Chase Manhattan Bank; Senior Vice President, HSBC Bank USA (formerly, Marine Midland Bank); Vice President, Citibank; Assistant Professor of Banking and Finance, Frank G. Zarb School of Business, Hofstra University; Executive Vice President DVC Group, Inc. (marketing, communications and technology). |
Thomas M. O'Neill
Birth Date: June 14, 1951
Trustee
Indefinite Term
Began serving: October 2006 | Principal Occupations: Director or Trustee, Vice Chair of the Audit Committee of the Federated Fund Family; Sole Proprietor, Navigator Management Company (investment and strategic consulting).
Other Directorships Held: None.
Qualifications: Mr. O'Neill has served in several business, mutual fund and financial management roles and directorship positions throughout his career. Mr. O'Neill serves as Director, Medicines for Humanity and Director, The Golisano Children's Museum of Naples, Florida. Mr. O'Neill previously served as Chief Executive Officer and President, Managing Director and Chief Investment Officer, Fleet Investment Advisors; President and Chief Executive Officer, Aeltus Investment Management, Inc.; General Partner, Hellman, Jordan Management Co., Boston, MA; Chief Investment Officer, The Putnam Companies, Boston, MA; Credit Analyst and Lending Officer, Fleet Bank; Director and Consultant, EZE Castle Software (investment order management software); and Director, Midway Pacific (lumber). |
Annual Shareholder Report
Name
Birth Date
Positions Held with Trust
Date Service Began | Principal Occupation(s) for Past Five Years,
Other Directorships Held, Previous Position(s) and Qualifications |
P. Jerome Richey
Birth Date: February 23, 1949
Trustee
Indefinite Term
Began serving: October 2013 | Principal Occupations: Director or Trustee of the Federated Fund Family; Management Consultant.
Other Directorships Held: None.
Qualifications: Mr. Richey has served in several business and legal management roles and directorship positions throughout his career. Mr. Richey most recently held the positions of Senior Vice Chancellor and Chief Legal Officer, University of Pittsburgh. Mr. Richey serves as Board Member, Epilepsy Foundation of Western Pennsylvania and Board member, World Affairs Council of Pittsburgh. Mr. Richey previously served as Chief Legal Officer and Executive Vice President, CONSOL Energy Inc. and Shareholder, Buchanan Ingersoll & Rooney PC (a law firm). |
John S. Walsh
Birth Date: November 28, 1957
Trustee
Indefinite Term
Began serving: January 1999 | Principal Occupations: Director or Trustee, Chair of the Audit Committee of the Federated Fund Family; President and Director, Heat Wagon, Inc. (manufacturer of construction temporary heaters); President and Director, Manufacturers Products, Inc. (distributor of portable construction heaters); President, Portable Heater Parts, a division of Manufacturers Products, Inc.
Other Directorships Held: None.
Qualifications: Mr. Walsh has served in several business management roles and directorship positions throughout his career. Mr. Walsh previously served as Vice President, Walsh & Kelly, Inc. (paving contractors). |
OFFICERS
Name
Birth Date
Address
Positions Held with Trust
Date Service Began | Principal Occupation(s) for Past Five Years
and Previous Position(s) |
John W. McGonigle
Birth Date: October 26, 1938
EXECUTIVE VICE PRESIDENT AND SECRETARY
Officer since: April 1984 | Principal Occupations: Executive Vice President and Secretary of the Federated Fund Family; Vice Chairman, Executive Vice President, Secretary and Director, Federated Investors, Inc.
Previous Positions: Trustee, Federated Investment Management Company and Federated Investment Counseling; Director, Federated Global Investment Management Corp., Federated Services Company and Federated Securities Corp. |
Annual Shareholder Report
Name
Birth Date
Address
Positions Held with Trust
Date Service Began | Principal Occupation(s) for Past Five Years
and Previous Position(s) |
Lori A. Hensler
Birth Date: January 6, 1967
TREASURER
Officer since: April 2013 | Principal Occupations: Principal Financial Officer and Treasurer of the Federated Fund Family; Senior Vice President, Federated Administrative Services; Financial and Operations Principal for Federated Securities Corp. and Edgewood Services, Inc.; and Assistant Treasurer, Federated Investors Trust Company. Ms. Hensler has received the Certified Public Accountant designation.
Previous Positions: Controller of Federated Investors, Inc.; Senior Vice President and Assistant Treasurer, Federated Investors Management Company; Treasurer, Federated Investors Trust Company; Assistant Treasurer, Federated Administrative Services, Federated Administrative Services, Inc., Federated Securities Corp., Edgewood Services, Inc., Federated Advisory Services Company, Federated Equity Management Company of Pennsylvania, Federated Global Investment Management Corp., Federated Investment Counseling, Federated Investment Management Company, Passport Research, Ltd., and Federated MDTA, LLC; Financial and Operations Principal for Federated Securities Corp., Edgewood Services, Inc. and Southpointe Distribution Services, Inc. |
Richard B. Fisher
Birth Date: May 17, 1923
VICE PRESIDENT
Officer since: April 1987 | Principal Occupations: Vice Chairman or Vice President of some of the Funds in the Federated Fund Family; Vice Chairman, Federated Investors, Inc.; Chairman, Federated Securities Corp.
Previous Positions: President and Director or Trustee of some of the Funds in the Federated Fund Family; Executive Vice President, Federated Investors, Inc.; Director and Chief Executive Officer, Federated Securities Corp. |
Peter J. Germain
Birth Date: September 3, 1959
CHIEF LEGAL OFFICER
Officer since: January 2005 | Principal Occupations: Mr. Germain is Chief Legal Officer of the Federated Fund Family. He is General Counsel and Vice President, Federated Investors, Inc.; President, Federated Administrative Services and Federated Administrative Services, Inc.; Vice President, Federated Securities Corp.; Secretary, Federated Private Asset Management, Inc.; and Secretary, Retirement Plan Service Company of America. Mr. Germain joined Federated in 1984 and is a member of the Pennsylvania Bar Association.
Previous Positions: Deputy General Counsel, Special Counsel, Managing Director of Mutual Fund Services, Federated Investors, Inc.; Senior Vice President, Federated Services Company; and Senior Corporate Counsel, Federated Investors, Inc. |
Stephen Van Meter
Birth Date: June 5, 1975
CHIEF COMPLIANCE OFFICER AND SENIOR VICE PRESIDENT
Officer since: July 2015 | Principal Occupations: Senior Vice President and Chief Compliance Officer of the Federated Fund Family; Vice President and Chief Compliance Officer of Federated Investors, Inc. and Chief Compliance Officer of certain of its subsidiaries. Mr. Van Meter joined Federated in October 2011. He holds FINRA licenses under Series 3, 7, 24 and 66.
Previous Positions: Mr. Van Meter previously held the position of Compliance Operating Officer, Federated Investors, Inc. Prior to joining Federated, Mr. Van Meter served at the United States Securities and Exchange Commission in the positions of Senior Counsel, Office of Chief Counsel, Division of Investment Management and Senior Counsel, Division of Enforcement. |
Annual Shareholder Report
Name
Birth Date
Address
Positions Held with Trust
Date Service Began | Principal Occupation(s) for Past Five Years
and Previous Position(s) |
Stephen F. Auth
Birth Date: September 3, 1956
101 Park Avenue
41st Floor
New York, NY 10178
CHIEF INVESTMENT OFFICER
Officer since: November 2002 | Principal Occupations: Stephen F. Auth is Chief Investment Officer of various Funds in the Federated Fund Family; Executive Vice President, Federated Investment Counseling, Federated Global Investment Management Corp. and Federated Equity Management Company of Pennsylvania.
Previous Positions: Executive Vice President, Federated Investment Management Company and Passport Research, Ltd. (investment advisory subsidiary of Federated); Senior Vice President, Global Portfolio Management Services Division; Senior Vice President, Federated Investment Management Company and Passport Research, Ltd.; Senior Managing Director and Portfolio Manager, Prudential Investments. |
Annual Shareholder Report
Evaluation and Approval of Advisory Contract–May 2015
Federated Kaufmann Large Cap Fund (the “Fund”)
Following a review and recommendation of approval by the Fund's independent trustees, the Fund's Board reviewed and approved at its May 2015 meetings the Fund's investment advisory and subadvisory contracts for an additional one-year term. The Board's decision regarding these contracts reflects the exercise of its business judgment on whether to continue the existing arrangements.
In this connection, the Federated Funds' Board had previously appointed a Senior Officer, whose duties include specified responsibilities relating to the process by which advisory fees are to be charged to a Federated fund. The Senior Officer has the authority to retain consultants, experts, or staff as may be reasonably necessary to assist in the performance of his duties, reports directly to the Board, and may be terminated only with the approval of a majority of the independent members of the Board. The Senior Officer prepared and furnished to the Board an independent, written evaluation that covered topics discussed below (the “Evaluation”). The Board considered that Evaluation, along with other information, in deciding to approve the advisory and subadvisory contracts.
The Board is also familiar with and considered judicial decisions concerning allegedly excessive investment advisory fees, which have indicated that the following factors may be relevant to an Adviser's fiduciary duty with respect to its receipt of compensation from a fund: the nature and quality of the services provided by the Adviser to a fund and its shareholders, including the performance and expenses of the fund and of comparable funds; the Adviser's cost of providing the services, including the profitability to the Adviser of providing advisory services to a fund; the extent to which the Adviser may realize “economies of scale” as a fund grows larger and, if such economies of scale exist, whether they have been shared with a fund and its shareholders or the family of funds; any “fall-out financial benefits” that accrue to the Adviser because of its relationship with a fund (including research services received from brokers that execute fund trades and any fees paid to affiliates of the Adviser for services rendered to a fund); comparative fee structures, including a comparison of fees paid to the Adviser with those paid by similar funds; and the extent of care, conscientiousness and independence with which the Board members perform their duties and their expertise, including whether they are fully informed about all facts the Board deems relevant to its consideration of the Adviser's services and fees. The Board noted that SEC disclosure requirements regarding the basis for the Board's approval of the Fund's advisory contract generally track the factors listed above. Consistent with these judicial decisions and SEC disclosure requirements, the Board also considered management fees charged to institutional and other clients of the Adviser and subadviser for what
Annual Shareholder Report
might be viewed as like services. The Board was aware of these factors and was guided by them in its review of the Fund's advisory and subadvisory contracts to the extent it considered them to be appropriate and relevant, as discussed further below.
The Board considered and weighed these circumstances in light of its substantial accumulated experience in governing the Fund and working with Federated on matters relating to the Federated funds, and was assisted in its deliberations by independent legal counsel. Throughout the year, and in connection with its May meetings, the Board requested and received substantial and detailed information about the Fund and the Federated organization that was in addition to the extensive materials that comprise and accompany the Senior Officer's Evaluation. Federated provided much of this information at each regular meeting of the Board, and furnished additional substantial information in connection with the May meeting at which the Board's formal review of the advisory and subadvisory contracts occurred. At this May meeting, senior management of the Adviser also met with the independent trustees and their counsel to discuss the materials presented and any other matters thought relevant by the Adviser or the trustees. Between regularly scheduled meetings, the Board also received information on particular matters as the need arose. Thus, the Board's consideration of the advisory and subadvisory contracts included review of the Senior Officer's Evaluation, accompanying data and additional information covering such matters as: the Adviser's and subadviser's investment philosophy, revenue, profitability, personnel and processes; investment and operating strategies; the Fund's short- and long-term performance (in absolute terms, both on a gross basis and net of expenses, as well as in relationship to its particular investment program and certain competitor or “peer group” funds and/or other benchmarks, as appropriate), and comments on the reasons for performance; the Fund's investment objectives; the Fund's expenses (including the advisory fee itself and the overall expense structure of the Fund, both in absolute terms and relative to similar and/or competing funds, with due regard for contractual or voluntary expense limitations); the use and allocation of brokerage commissions derived from trading the Fund's portfolio securities (if any); and the nature, quality and extent of the advisory and other services provided to the Fund by the Adviser and its affiliates. The Board also considered the preferences and expectations of Fund shareholders; the entrepreneurial risk assumed by the Adviser in sponsoring the funds; the continuing state of competition in the mutual fund industry and market practices; the range of comparable fees for similar funds in the mutual fund industry; the Fund's relationship to the Federated family of funds which include a comprehensive array of funds with different investment objectives, policies and strategies which are available for exchange without the incurrence of additional sales charges; compliance and audit reports concerning the Federated funds and the Federated companies that service them (including communications from regulatory agencies), as well as Federated's responses to any issues raised therein;
Annual Shareholder Report
and relevant developments in the mutual fund industry and how the Federated funds and/or Federated are responding to them. The Board also considered that the longevity and experience of the Fund's portfolio management team and their unique approach to investing may limit the utility of comparisons to other equity mutual funds. The Board's evaluation process is evolutionary. The criteria considered and the emphasis placed on relevant criteria change in recognition of changing circumstances in the mutual fund marketplace.
While mindful that courts have cautioned against giving such comparisons too much weight, the Board has found the use of comparisons of the Fund's fees and expenses to other mutual funds with comparable investment programs to be relevant. In this regard, the Board was presented with, and considered, information regarding the contractual advisory fee rates, net advisory fee rates and total expense ratios relative to a fund's peers. The Board focused on comparisons with other similar mutual funds more heavily than non-mutual fund products or services because it is believed that they are more relevant. For example, other mutual funds are the products most like the Fund, they are readily available to Fund shareholders as alternative investment vehicles, and they are the type of investment vehicle in fact chosen and maintained by the Fund's investors. The range of their fees and expenses therefore appears to be a relevant indicator of what consumers have found to be reasonable in the precise marketplace in which the Fund competes.
The Board reviewed the contractual advisory fee rate, net advisory fee rate where partially waived and other expenses of the Fund and noted the position of the Fund's fee rates relative to its peers. In this regard, the Board noted that the contractual advisory fee rate was above the median of the relevant peer group, but the Board noted the applicable waivers and reimbursements and that the overall expense structure of the Fund remained competitive. The Board will continue to monitor advisory fees and other expenses borne by the Fund in the context of the other factors considered relevant by the Board.
By contrast, the Senior Officer has reviewed Federated's fees for providing advisory services to products outside the Federated family of funds (e.g., institutional and separate accounts and sub-adviser services). He concluded that mutual funds and institutional accounts are inherently different products. Those differences include, but are not limited to, different types of targeted investors; being subject to different laws and regulations; different legal structures; different average account sizes and portfolio management techniques made necessary by different cash flows and different associated costs; and the time spent by portfolio managers and their teams, funds financial services, legal, compliance and risk management in reviewing securities pricing, addressing different administrative responsibilities, addressing different degrees of risk associated with management and a variety of different costs. The Senior Officer did not consider these fee schedules to be determinative in judging the appropriateness of mutual fund advisory fees.
Annual Shareholder Report
The Fund's ability to deliver competitive performance when compared to its peer group was also deemed to be relevant by the Board as a useful indicator of how the Adviser is executing the Fund's investment program, which in turn was one of the Board's considerations in reaching a conclusion that the nature, extent, and quality of the Adviser's investment management services were such as to warrant continuation of the advisory and subadvisory contracts.
The Senior Officer reviewed information compiled by Federated, using data supplied by independent fund ranking organizations, regarding the performance of, and fees charged by, other mutual funds, noting his view that comparisons to fund peer groups may be helpful, though not conclusive, in judging the reasonableness of the proposed fees. The Board considered, in evaluating such comparisons, that in some cases individual funds may exhibit significant and unique differences in their objectives and management techniques when compared to other funds within an industry peer group.
For the one-year, three-year and five-year periods covered by the Evaluation, the Fund's performance was above the median of the relevant peer group.
The Board also received financial information about Federated, including information regarding the compensation and benefits Federated derived from its relationships with the Federated funds. This information covered not only the fees under the advisory contracts, but also fees received by Federated's subsidiaries for providing other services to the Federated funds under separate contracts (e.g., for serving as the Federated funds' administrator). The information also detailed any indirect benefit Federated may derive from its receipt of research services from brokers who execute Federated fund trades. In addition, the Board considered the fact that, in order for a fund to be competitive in the marketplace, Federated and its affiliates frequently waived fees and/or reimbursed expenses and have disclosed to fund investors and/or indicated to the Board their intention to do so in the future, where appropriate. Moreover, the Board receives regular reporting as to the institution, adjustment or elimination of these voluntary waivers.
In addition, over the past two years, following discussions regarding the Senior Officer's recommendations, Federated made meaningful reductions to the contractual advisory fees for several Funds. The Board noted that in November 2013, the Senior Officer proposed, and the Board subsequently approved, a reduction in the contractual advisory fee to more closely align the contractual fee with the net fee actually charged after the imposition of applicable voluntary waivers which was believed by both the Senior Officer and the Board to improve the market competitiveness of the Fund. At the May 2015 Meetings, Federated proposed and the board approved reductions to the subadvisory fees under the subadvisory contract for the Fund, effective as of the date of the previous contractual advisory fee reduction. Formerly, the contractual subadvisory fee was 1.175%. The new subadvisory fee will be 0.615%. This sub-advisory fee represents 82% of the current gross advisory fee of 0.75%.
Annual Shareholder Report
Federated furnished information, requested by the Senior Officer, that reported revenues on a fund-by-fund basis and made estimates of the allocation of expenses on a fund-by-fund basis, using allocation methodologies specified by the Senior Officer. The Senior Officer noted that, while these cost allocation reports apply consistent allocation processes, the inherent difficulties in allocating costs continues to cause the Senior Officer to question the precision of the process and to conclude that such reports may be unreliable, since a single change in an allocation estimate may dramatically alter the resulting estimate of cost and/or profitability of a fund and may produce unintended consequences. The allocation information, including the Senior Officer's view that fund-by-fund estimations may be unreliable, was considered in the analysis by the Board.
The Board and the Senior Officer also reviewed information compiled by Federated comparing profitability information for Federated to other publicly held fund management companies. In this regard, the Senior Officer concluded that Federated's profit margins did not appear to be excessive. The Senior Officer also noted that Federated appeared financially sound, with the resources to fulfill its obligations under its contracts with the Funds.
The Senior Officer's Evaluation also discussed the notion of possible realization of “economies of scale” as a fund grows larger. The Board considered in this regard that the Adviser has made significant and long-term investments in areas that support all of the Federated family of funds, such as personnel and processes for the portfolio management, shareholder services, compliance, internal audit, and risk management functions; and systems technology; and that the benefits of these efforts (as well as any economies of scale, should they exist) were likely to be enjoyed by the fund family as a whole. Federated, as it does throughout the year, and again in connection with the Board's review, furnished information relative to revenue sharing or adviser paid fees. Federated and the Senior Officer noted that this information should be viewed to determine if there was an incentive to either not apply breakpoints or to apply breakpoints at higher levels and should not be viewed to determining the appropriateness of advisory fees, because it would represent marketing and distribution expenses. Finally, the Board also noted the absence of any applicable regulatory or industry guidelines on this subject, which (as discussed in the Senior Officer's Evaluation) is compounded by the lack of any common industry practice or general pattern with respect to structuring fund advisory fees with “breakpoints” that serve to reduce the fee as the fund attains a certain size.
The Senior Officer noted that, subject to the comments and recommendations made within his Evaluation, his observations and the information accompanying the Evaluation supported a finding by the Board that the management fees for each of the funds were reasonable. Under these circumstances, other than the reduction in the sub-advisory fee noted above, no changes were recommended to, and no objection was raised to, the continuation of the Fund's advisory and subadvisory contracts.
Annual Shareholder Report
In its decision to continue an existing investment advisory contract, the Board was mindful of the potential disruptions of the Fund's operations and various risks, uncertainties and other effects that could occur as a result of a decision to terminate or not renew an advisory contract. In particular, the Board recognized that many shareholders have invested in the Fund on the strength of the Adviser's industry standing and reputation and with the expectation that the Adviser will have a continuing role in providing advisory services to the Fund. Thus, the Board's approval of the advisory and subadvisory contracts reflected the fact that it is the shareholders who have effectively selected the Adviser by virtue of having invested in the Fund. The Board concluded that, in light of the factors discussed above, including the nature, quality and scope of the services provided to the Fund by the Adviser and its affiliates, continuation of the advisory contract was appropriate.
The Board based its decision to approve the advisory and subadvisory contracts on the totality of the circumstances and relevant factors and with a view to past and future long-term considerations. Not all of the factors and considerations identified above were necessarily relevant to the Fund, nor did the Board consider any one of them to be determinative. With respect to the factors that were relevant, the Board's decision to approve the contract reflects its determination that Federated's performance and actions provided a satisfactory basis to support the decision to continue the existing arrangements.
Annual Shareholder Report
Voting Proxies on Fund Portfolio Securities
A description of the policies and procedures that the Fund uses to determine how to vote proxies, if any, relating to securities held in the Fund's portfolio is available, without charge and upon request, by calling 1-800-341-7400. A report on “Form N-PX” of how the Fund voted any such proxies during the most recent 12-month period ended June 30 is available via the Proxy Voting Record (Form N-PX) link associated with the Fund and share class name at www.FederatedInvestors.com/FundInformation. Form N-PX filings are also available at the SEC's website at www.sec.gov.
Quarterly Portfolio Schedule
The Fund files with the SEC a complete schedule of its portfolio holdings, as of the close of the first and third quarters of its fiscal year, on “Form N-Q.” These filings are available on the SEC's website at www.sec.gov and may be reviewed and copied at the SEC's Public Reference Room in Washington, DC. (Call 1-800-SEC-0330 for information on the operation of the Public Reference Room.) You may also access this information via the link to the Fund and share class name at www.FederatedInvestors.com/FundInformation.
Annual Shareholder Report
[PAGE INTENTIONALLY LEFT BLANK]
Mutual funds are not bank deposits or obligations, are not guaranteed by any bank and are not insured or guaranteed by the U.S. government, the Federal Deposit Insurance Corporation, the Federal Reserve Board or any other government agency. Investment in mutual funds involves investment risk, including the possible loss of principal.
This Report is authorized for distribution to prospective investors only when preceded or accompanied by the Fund's Prospectus, which contains facts concerning its objective and policies, management fees, expenses and other information.
Federated Kaufmann Large Cap Fund
Federated Investors Funds
4000 Ericsson Drive
Warrendale, PA 15086-7561
Contact us at FederatedInvestors.com
or call 1-800-341-7400.
Federated Securities Corp., Distributor
CUSIP 314172446
CUSIP 314172438
CUSIP 314172420
CUSIP 314172412
CUSIP 314172131
39667 (12/15)
Federated is a registered trademark of Federated Investors, Inc.
2015 ©Federated Investors, Inc.
Annual Shareholder Report
October 31, 2015
| Share Class | Ticker |
| A | FKASX |
| B | FKBSX |
| C | FKCSX |
| R | FKKSX |
Federated Kaufmann Small Cap Fund
Fund Established 2002
A Portfolio of Federated Equity Funds
Not FDIC Insured • May Lose Value • No Bank Guarantee
CONTENTS
| 1 |
| 6 |
| 7 |
| 14 |
| 18 |
| 20 |
| 21 |
| 22 |
| 36 |
| 37 |
| 39 |
| 45 |
| 51 |
| 51 |
Management's Discussion of Fund Performance (unaudited)
The total return of Federated Kaufmann Small Cap Fund (the “Fund”), based on net asset value for the 12-month reporting period ended October 31, 2015, was 7.12% for the Class A Shares, 6.52% for the Class B Shares, 6.52% for the Class C Shares and 7.15% for the Class R Shares. The total return of the Russell 2000® Growth Index (R2000G),1 the Fund's broad-based securities market index, was 3.52% for the same period. The total return of the Morningstar Small Growth Funds Average (MSGFA),2 a peer group average for the Fund, was 1.52% for the same period. The Fund's total return for the most recently completed fiscal year reflected actual cash flows, transaction costs and other expenses, which were not reflected in the total return of the R2000G.
During the reporting period, the Fund's investment strategy focused on stock selection, sector exposure, international exposure3 and the effect of cash holdings. These were the most significant factors affecting the Fund's performance relative to the R2000G.
The following discussion will focus on the performance of the Fund's Class R Shares.
Market Overview
During the reporting period, the equity markets globally performed well with the European stock markets leading the way. Most central banks around the world continued their monetary easing while the United States looked to enter a tightening period throughout most of the reporting period. The U.S. Federal Reserve (the “Fed”) postponed its first rate raise in nearly a decade multiple times despite positive economic data. Concern about global growth kept the Fed static. Worries about global growth pressured markets during the summer months particularly as China's economy slowed further, causing deflationary worries. Despite persistent geopolitical headwinds, e.g., Syria and the Middle East, global economies continued to grow, albeit slowly. Policymakers around the world continued to lean towards stimulus. Meanwhile, the U.S. pursued the opposite approach, a tightening strategy, which drove the strength in the U.S. Dollar Index.4 Despite these uncertainties, the equity markets performed well, and corporate earnings remained strong during the reporting period.
Stock Selection
The key factor affecting performance from a macroeconomic standpoint was the improving U.S. economic fundamentals, as well as accommodating monetary policies by the Fed and other central banks. The monetary easing policies allowed a slow but gradual recovery of the major world economies. Profitability of many of the companies in which the Fund invested remained strong throughout the reporting period.
Annual Shareholder Report
The outperformance of the Fund versus the R2000G was due to stock selection particularly in the Health Care, Financials, Technology and Consumer Staples sectors. Individual companies that most contributed to performance during the reporting period were: Dexcom Inc, Dynavax Technologies, Globant SA, Diplomat Pharmacy Inc, and Progenics Pharmaceuticals. Laggard companies that hurt relative Fund performance were: BioDelivery Sciences, US Silica Holdings Inc., Allegheny Technologies, Caesar Stone and Memorial Resource Development Corp.
Sector Exposure
At the end of the reporting period, approximately 81% of the portfolio was currently invested in four large sectors: Consumer Discretionary, Health Care, Industrials and Information Technology. These sectors have historically provided good opportunities for bottom-up growth investors. Being overweight the Health Care sector and underweight the Industrial sector benefited relative performance versus the R2000G.
International Exposure
Stock selection of companies domiciled outside the U.S. was a positive contributor to Fund performance. Approximately 11% of the Fund's assets were invested in such companies during the reporting period, and this helped relative performance.
Effect of Cash Holdings
The Fund had an average cash position of 3.64% which had a positive impact on Fund performance.
| 1 | Please see the footnotes to the line graphs below for definitions of, and further information about, the R2000G. |
| 2 | Please see the footnotes to the line graphs below for definitions of, and further information about, the MSGFA. |
| 3 | International investing involves special risks including currency risk, increased volatility, political risks and differences in auditing and other financial standards. Small company stocks may be less liquid and subject to greater price volatility than large capitalization stocks. |
| 4 | The U.S. Dollar Index indicates the general international value of the U.S. dollar by averaging the exchange rates between the U.S. dollar and six major world currencies. The index is unmanaged, and it is not possible to invest directly in an index. |
Annual Shareholder Report
FUND PERFORMANCE AND GROWTH OF A $10,000 INVESTMENT
The graphs below illustrate the hypothetical investment of $10,0001 in the Federated Kaufmann Small Cap Fund from October 31, 2005 (or later) to October 31, 2015 compared to the Russell 2000® Growth Index (R2000G)2 and the Morningstar Small Growth Funds Average (MSGFA).3 The graph for the R Shares illustrates a hypothetical investment from November 1, 2005 (start of performance) to October 31, 2015. The Average Annual Total Return table below shows returns for each class averaged over the stated periods.
Growth of a $10,000 Investment–CLASS A SHARES
Growth of $10,000 as of October 31, 2015
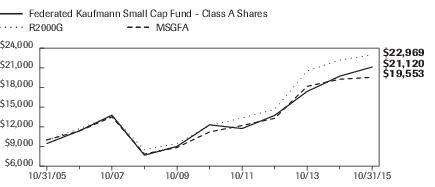
| Federated Kaufmann Small Cap Fund - | Class A Shares | NA | R2000G | MSGFA |
| F | NA | I | I |
| 10/31/2005 | 9,450 | | 10,000 | 10,000 |
| 10/31/2006 | 11,387 | | 11,707 | 11,363 |
| 10/31/2007 | 13,770 | | 13,665 | 13,511 |
| 10/31/2008 | 7,671 | | 8,490 | 7,850 |
| 10/31/2009 | 9,015 | | 9,453 | 8,848 |
| 10/31/2010 | 12,302 | | 12,163 | 11,218 |
| 10/31/2011 | 11,737 | | 13,360 | 12,195 |
| 10/31/2012 | 13,733 | | 14,656 | 13,297 |
| 10/31/2013 | 17,392 | | 20,495 | 18,165 |
| 10/31/2014 | 19,718 | | 22,188 | 19,250 |
| 10/31/2015 | 21,120 | | 22,969 | 19,553 |
41 graphic description end -->
| ■ | Total returns shown include the maximum sales charge of 5.50% ($10,000 investment minus $550 sales charge = $9,450). |
Annual Shareholder Report
Growth of a $10,000 INVESTMENT–CLASS R SHARES
Growth of $10,000 as of October 31, 2015

| Federated Kaufmann Small Cap Fund - | Class R Shares | NA | R2000G | MSGFA |
| F | NA | I | I |
| 11/1/2005 | 10,000 | | 10,000 | 10,000 |
| 10/31/2006 | 11,431 | | 11,478 | 11,141 |
| 10/31/2007 | 13,822 | | 13,398 | 13,246 |
| 10/31/2008 | 7,701 | | 8,325 | 7,696 |
| 10/31/2009 | 9,049 | | 9,269 | 8,675 |
| 10/31/2010 | 12,349 | | 11,926 | 10,999 |
| 10/31/2011 | 11,782 | | 13,099 | 11,956 |
| 10/31/2012 | 13,784 | | 14,370 | 13,037 |
| 10/31/2013 | 17,475 | | 20,095 | 17,809 |
| 10/31/2014 | 19,822 | | 21,755 | 18,874 |
| 10/31/2015 | 21,238 | | 22,521 | 19,171 |
41 graphic description end -->
The Fund offers multiple share classes whose performance may be greater than or less than its other share class(es) due to differences in sales charges and expenses. See the Average Annual Total Return table below for the returns of additional classes not shown in the line graph above.
Average Annual Total Returns for the Period Ended 10/31/2015
(returns reflect all applicable sales charges and contingent deferred sales charges as specified below in footnote #1)
| | 1 Year | 5 Years | 10 Years | Start of
Performance* |
| Class A Shares | 1.24% | 10.16% | 7.76% | N/A |
| Class B Shares | 1.79% | 10.54% | 7.90% | N/A |
| Class C Shares | 5.66% | 10.80% | 7.78% | N/A |
| Class R Shares | 7.15% | 11.45% | N/A% | 8.39% |
| R2000G | 3.52% | 13.56% | 8.67% | 8.48% |
| MSGFA | 1.52% | 12.11% | 7.86% | 6.77% |
| * | The Fund's Class R Shares start of performance date was November 1, 2005. |
| | |
Annual Shareholder Report
Performance data quoted represents past performance which is no guarantee of future results. Investment return and principal value will fluctuate so that an investor's shares, when redeemed, may be worth more or less than their original cost. Mutual fund performance changes over time and current performance may be lower or higher than what is stated. For current to the most recent month-end performance and after-tax returns, visit FederatedInvestors.com or call 1-800-341-7400. Returns shown do not reflect the deduction of taxes that a shareholder would pay on Fund distributions or the redemption of Fund shares. Mutual funds are not obligations of or guaranteed by any bank and are not federally insured.
| 1 | Represents a hypothetical investment of $10,000 in the Fund after deducting the applicable sales charges: for Class A Shares, the maximum sales charge of 5.50% ($10,000 investment minus $550 sales charge = $9,450); for Class B Shares, the maximum contingent deferred sales charge is 5.50% on any redemption less than one year from the purchase date; for Class C Shares, a 1.00% contingent deferred sales charge would be applied on any redemption less than one year from the purchase date. The Fund's performance assumes the reinvestment of all dividends and distributions. The R2000G and the MSGFA have been adjusted to reflect reinvestment of dividends on securities in the index and the average. |
| 2 | The Russell 2000® Growth Index measures the performance of the small-cap growth segment of the U.S. equity universe. It includes those Russell 2000® Index companies with higher price-to-value ratios and higher forecasted growth values. The R2000G is constructed to provide a comprehensive and unbiased barometer for the small-cap growth segment. The R2000G is completely reconstituted annually to ensure larger stocks do not distort the performance and characteristics of the true small-cap opportunity set and that the represented companies continue to reflect growth characteristics. The R2000G is not adjusted to reflect sales charges, expenses or other fees that the Securities and Exchange Commission (SEC) requires to be reflected in the Fund's performance. The index is unmanaged and unlike the Fund, is not affected by cash flows. It is not possible to invest directly in an index.
|
| 3 | Morningstar figures represent the average of the total returns reported by all the mutual funds designated by Morningstar as falling into the respective category indicated. They do not reflect sales charges. |
Annual Shareholder Report
Portfolio of Investments Summary Table (unaudited)
At October 31, 2015, the Fund's sector composition1 was as follows:
| Sector Composition | Percentage of
Total Net Assets |
| Health Care | 29.4% |
| Information Technology | 25.0% |
| Consumer Discretionary | 16.2% |
| Industrials | 9.8% |
| Financials | 5.1% |
| Energy | 1.0% |
| Consumer Staples | 0.4% |
| Materials | 3.4% |
| Telecommunication Services | 0.8% |
| Securities Lending Collateral2 | 13.9% |
| Cash Equivalents3 | 8.3% |
| Other Assets and Liabilities—Net4 | (13.3)% |
| TOTAL | 100.0% |
| 1 | Except for Securities Lending Collateral, Cash Equivalents and Other Assets and Liabilities, sector classifications are based upon, and individual portfolio securities are assigned to, the classifications of the Global Industry Classification Standard (GICS) except that the Adviser assigns a classification to securities not classified by the GICS and to securities for which the Adviser does not have access to the classification made by the GICS. |
| 2 | Cash collateral received from lending portfolio securities which is invested in short-term investments such as repurchase agreements or money market mutual funds. |
| 3 | Cash Equivalents include any investments in money market mutual funds and/or overnight repurchase agreements other than those representing securities lending collateral. |
| 4 | Assets, other than investments in securities, less liabilities. See Statement of Assets and Liabilities. |
Annual Shareholder Report
Portfolio of Investments
October 31, 2015
Shares or
Principal
Amount | | | Value |
| | | COMMON STOCKS—90.3% | |
| | | Consumer Discretionary—16.0% | |
| 82,000 | 1,2 | 2U, Inc. | $1,720,360 |
| 120,000 | | AMC Entertainment Holdings, Inc. | 3,284,400 |
| 207,400 | 1,2 | Boot Barn Holdings, Inc. | 3,111,000 |
| 365,800 | | Clubcorp Holdings, Inc. | 7,476,952 |
| 43,317 | 2 | Cracker Barrel Old Country Store, Inc. | 5,954,355 |
| 245,000 | 1 | Dave & Buster's Entertainment, Inc. | 9,452,100 |
| 274,600 | 1,2 | Habit Restaurants, Inc./The, Class A | 6,557,448 |
| 445,300 | 1 | La Quinta Holdings, Inc. | 6,746,295 |
| 715,000 | | Metaldyne Performance Group, Inc. | 15,601,300 |
| 182,400 | | Moncler SpA | 2,940,269 |
| 7,961,000 | | NagaCorp Limited | 5,610,381 |
| 29,490 | | National CineMedia, Inc. | 418,758 |
| 295,000 | 1 | Party City Holdco, Inc. | 4,669,850 |
| 245,000 | 1,2 | Planet Fitness, Inc. | 4,003,300 |
| 76,900 | | Salvatore Ferragamo Italia SpA | 2,089,901 |
| 1,829,000 | | Samsonite International SA | 5,395,350 |
| 92,500 | 1 | Shutterfly, Inc. | 3,858,175 |
| 160,400 | | Six Flags Entertainment Corp. | 8,347,216 |
| 242,000 | 1 | Sportsman's Warehouse Holdings, Inc. | 2,603,920 |
| 330,600 | | Tower International, Inc. | 9,081,582 |
| 61,000 | 1,3 | Townsquare Media, Inc., Class A | 668,560 |
| 41,200 | | Vail Resorts, Inc. | 4,703,804 |
| 234,600 | 1,2 | Wingstop, Inc. | 5,426,298 |
| 192,900 | 1 | Yoox Net-A-Porter Group | 6,529,983 |
| 252,900 | 1,2 | Zoe's Kitchen, Inc. | 8,707,347 |
| | | TOTAL | 134,958,904 |
| | | Consumer Staples—0.4% | |
| 179,100 | 1,2 | Blue Buffalo Pet Products, Inc. | 3,213,054 |
| | | Energy—1.0% | |
| 470,600 | 1 | Memorial Resource Development Corp. | 8,324,914 |
| | | Financials—5.1% | |
| 500,000 | | Chimera Investment Corp. | 7,040,000 |
| 149,200 | | Cyrusone, Inc. | 5,263,776 |
| 330,000 | | EverBank Financial Corp. | 5,695,800 |
Annual Shareholder Report
Shares or
Principal
Amount | | | Value |
| | | COMMON STOCKS—continued | |
| | | Financials—continued | |
| 250,000 | | Hannon Armstrong Sustainable Infrastructure Capital, Inc. | $4,502,500 |
| 235,000 | | James River Group Holdings Ltd. | 6,916,050 |
| 132,500 | | National Storage Affiliates Trust | 1,992,800 |
| 141,000 | | Ryman Hospitality Properties | 7,416,600 |
| 157,000 | 1 | Walker & Dunlop, Inc. | 4,554,570 |
| | | TOTAL | 43,382,096 |
| | | Health Care—28.8% | |
| 118,000 | 1 | Acadia Pharmaceuticals, Inc. | 4,108,760 |
| 25,900 | 1,2 | Agios Pharmaceuticals, Inc. | 1,887,074 |
| 64,000 | 1 | Alkermes, Inc. | 4,602,880 |
| 357,144 | 1 | Amphastar Pharmaceuticals, Inc. | 4,228,585 |
| 128,200 | 1 | AtriCure, Inc. | 2,374,905 |
| 18,200 | 1,2 | aTyr Pharma, Inc. | 226,772 |
| 475,000 | 1,2,3 | BioDelivery Sciences International, Inc. | 2,555,500 |
| 1,500,000 | 1,3 | Catalyst Pharmaceutical Partners, Inc. | 4,740,000 |
| 168,000 | 1,2 | Coherus Biosciences, Inc. | 4,678,800 |
| 1,439,277 | 1,3 | Corcept Therapeutics, Inc. | 5,310,932 |
| 260,000 | 1 | Dexcom, Inc. | 21,663,200 |
| 370,000 | 1,2 | Diplomat Pharmacy, Inc. | 10,400,700 |
| 188,400 | 1,3 | Dyax Corp. | 5,186,652 |
| 1,115,500 | 1,3 | Dynavax Technologies Corp. | 25,333,005 |
| 475,000 | 1,3 | Egalet Corp. | 3,942,500 |
| 775,000 | 1,2 | Eleven Biotherapeutics, Inc. | 2,084,750 |
| 103,100 | 1,2 | Entellus Medical, Inc. | 1,751,669 |
| 141,700 | 1,3 | ExamWorks Group, Inc. | 4,001,608 |
| 42,300 | 1 | GW Pharmaceuticals PLC, ADR | 3,345,507 |
| 155,000 | 1,2,3 | Galapagos NV | 7,478,864 |
| 122,066 | 1,2,3 | Galapagos NV, ADR | 5,859,168 |
| 110,300 | 1,2 | Genfit | 4,949,409 |
| 50,000 | 1 | Glaukos Corp. | 1,002,000 |
| 232,900 | 1 | HealthEquity, Inc. | 7,618,159 |
| 345,008 | 1 | Intersect ENT, Inc. | 6,610,353 |
| 187,200 | 1 | MacroGenics, Inc. | 5,816,304 |
| 195,420 | 1,2,3 | Minerva Neurosciences, Inc. | 1,024,001 |
| 267,000 | 1,3,4 | Minerva Neurosciences, Inc. | 1,399,081 |
| 330,000 | 1 | Mirna Therapeutics, Inc. | 1,907,400 |
| 400,000 | 1 | NeoGenomics, Inc. | 2,820,000 |
Annual Shareholder Report
Shares or
Principal
Amount | | | Value |
| | | COMMON STOCKS—continued | |
| | | Health Care—continued | |
| 531,211 | 1 | Neovasc, Inc. | $2,969,469 |
| 110,137 | 1 | Nivalis Therapeutics, Inc. | 883,299 |
| 324,830 | 1,2,3 | Ocular Therapeutix, Inc. | 2,803,283 |
| 225,000 | 1,3 | Otonomy, Inc. | 4,869,000 |
| 170,598 | 1,3 | Premier, Inc. | 5,767,918 |
| 1,958,600 | 1,3 | Progenics Pharmaceuticals, Inc. | 14,376,124 |
| 150,000 | 1,2 | ProNAi Therapeutics, Inc. | 2,574,000 |
| 175,000 | 1 | REGENXBIO, Inc. | 2,705,500 |
| 75,000 | 1 | Repligen Corp. | 2,493,000 |
| 463,800 | 1,3 | SCYNEXIS, Inc. | 2,963,682 |
| 80,000 | 1,2 | Seres Therapeutics, Inc. | 2,371,200 |
| 125,200 | 1,2 | Spark Therapeutics, Inc. | 6,748,280 |
| 345,900 | 1,3 | SteadyMed Ltd. | 975,438 |
| 409,417 | 1,3,4 | SteadyMed Ltd., Pfd. | 1,154,556 |
| 50,000 | 1,2 | Teladoc, Inc. | 983,500 |
| 363,700 | 1,2 | TherapeuticsMD, Inc. | 2,134,919 |
| 386,500 | 1,3 | Threshold Pharmaceuticals, Inc., Class THL | 1,472,565 |
| 62,900 | 1 | Ultragenyx Pharmaceutical, Inc. | 6,249,115 |
| 70,000 | 1 | VCA, Inc. | 3,833,900 |
| 237,500 | 1 | Veeva Systems, Inc. | 6,025,375 |
| 169,361 | 1,2 | Veracyte, Inc. | 1,102,540 |
| 315,000 | 1,2 | Versartis, Inc. | 3,253,950 |
| 282,000 | 1,3 | Zogenix, Inc. | 3,324,780 |
| 188,800 | 1,2,3 | Zynerba Pharmaceuticals, Inc. | 2,376,992 |
| | | TOTAL | 243,320,923 |
| | | Industrials—9.8% | |
| 170,000 | | Advanced Drainage System, Inc. | 5,341,400 |
| 249,500 | | Air Lease Corp. | 8,410,645 |
| 5,579,000 | | Aramex PJSC | 4,687,817 |
| 168,500 | 1 | Beacon Roofing Supply, Inc. | 5,963,215 |
| 206,000 | 1 | Caesar Stone SDOT Yam Ltd. | 7,315,060 |
| 100,500 | | Hexcel Corp. | 4,655,160 |
| 25,700 | 1 | IHS, Inc., Class A | 3,072,178 |
| 189,100 | | KAR Auction Services, Inc. | 7,261,440 |
| 106,500 | 1 | Kirby Corp. | 6,953,385 |
| 650,000 | 1 | Kornit Digital Ltd. | 7,761,000 |
| 359,200 | 1 | Milacron Holdings Corp. | 6,131,544 |
Annual Shareholder Report
Shares or
Principal
Amount | | | Value |
| | | COMMON STOCKS—continued | |
| | | Industrials—continued | |
| 320,000 | | NN, Inc. | $4,416,000 |
| 1,032,800 | 1 | Radiant Logistics, Inc. | 4,100,216 |
| 160,000 | 1,2 | Trex Co., Inc. | 6,251,200 |
| | | TOTAL | 82,320,260 |
| | | Information Technology—25.0% | |
| 994,000 | 1,3 | Adesto Technologies Corp. | 5,914,300 |
| 350,000 | 1,2 | Alarm.com Holdings, Inc. | 4,427,500 |
| 20,000 | 1 | Baozun, Inc., ADR | 172,800 |
| 400,000 | 1,2 | Box, Inc. | 4,992,000 |
| 325,000 | 1,2 | BroadSoft, Inc. | 10,390,250 |
| 1,500,000 | 1,2 | CPI Card Group, Inc. | 16,650,000 |
| 245,000 | 1 | CalAmp Corp. | 4,645,200 |
| 1,630,000 | 1,2 | Camtek Ltd. | 3,960,900 |
| 327,300 | 1,3 | ChannelAdvisor Corp. | 2,854,056 |
| 49,000 | 1 | CoStar Group, Inc. | 9,950,430 |
| 125,200 | 1 | Cvent, Inc. | 3,957,572 |
| 90,437 | 1,2 | Demandware, Inc. | 5,127,778 |
| 145,000 | 1,2 | Fleetmatics Group PLC | 8,070,700 |
| 205,000 | 1 | GTT Communications, Inc. | 3,837,600 |
| 205,000 | 1,2 | Globant SA | 7,086,850 |
| 126,900 | 1,2 | GoDaddy, Inc. | 3,487,212 |
| 185,500 | 1 | Infoblox, Inc. | 3,025,505 |
| 115,000 | 1,2 | Jinkosolar Holding Co., Ltd., ADR | 2,977,350 |
| 300,000 | 1 | Marketo, Inc. | 8,829,000 |
| 199,800 | 1 | Microsemi Corp. | 7,194,798 |
| 180,000 | 1 | NIC, Inc. | 3,414,600 |
| 500,000 | 1 | NeoPhotonics Corp. | 4,135,000 |
| 1,813,333 | 1 | Optimal Payments PLC | 8,473,122 |
| 205,500 | 1 | Q2 Holdings, Inc. | 5,065,575 |
| 322,500 | 1 | RADWARE Ltd. | 4,808,475 |
| 175,000 | 1,2 | Rapid7, Inc. | 3,598,000 |
| 196,960 | 1 | RingCentral, Inc. | 3,643,760 |
| 355,000 | 1 | Rubicon Project, Inc./The | 5,381,800 |
| 103,000 | 1,2 | Shopify, Inc. | 3,318,660 |
| 1,220,000 | 1 | Sigma Designs, Inc. | 10,748,200 |
| 150,000 | | Silicon Motion Technology Corp., ADR | 4,768,500 |
| 542,000 | 1 | Synacor, Inc. | 720,860 |
Annual Shareholder Report
Shares or
Principal
Amount | | | Value |
| | | COMMON STOCKS—continued | |
| | | Information Technology—continued | |
| 350,000 | 1,2 | Synchronoss Technologies, Inc. | $12,313,000 |
| 130,000 | | Tessera Technologies, Inc. | 4,546,100 |
| 348,200 | 1,2,3 | Textura Corp. | 10,223,152 |
| 38,700 | 1 | Tyler Technologies, Inc. | 6,592,932 |
| 50,000 | 1,2 | Varonis Systems, Inc. | 798,500 |
| 60,200 | 1 | Yodlee, Inc. | 1,010,156 |
| | | TOTAL | 211,112,193 |
| | | Materials—3.4% | |
| 285,000 | 1,2 | BioAmber, Inc. | 2,128,950 |
| 68,400 | | Eagle Materials, Inc. | 4,516,452 |
| 547,100 | 1 | Summit Materials, Inc. | 11,521,926 |
| 181,000 | 1 | U.S. Concrete, Inc. | 10,038,260 |
| | | TOTAL | 28,205,588 |
| | | Telecommunication Services—0.8% | |
| 325,000 | 1 | inContact, Inc. | 2,892,500 |
| 769,800 | 1,4 | Infrastrutture Wireless Italiane SPA | 4,001,478 |
| | | TOTAL | 6,893,978 |
| | | TOTAL COMMON STOCKS
(IDENTIFIED COST $617,433,418) | 761,731,910 |
| | | PREFERRED STOCK—0.3% | |
| | | Health Care—0.3% | |
| 179,074 | 1,4,6 | aTyr Pharma, Inc., Pfd., Series E
(IDENTIFIED COST $1,939,999) | 2,161,200 |
| | | CORPORATE BOND—0.1% | |
| | | Health Care—0.1% | |
| $635,000 | 4,5 | Protalix Biotherapeutics, Inc., Conv. Bond, Series 144A,
4.50%, 9/15/2018
(IDENTIFIED COST $635,000) | 466,596 |
| | | WARRANTS—0.4% | |
| | | Consumer Discretionary—0.2% | |
| 817,782 | 1,2 | Central European Media Enterprises Ltd., Warrants | 1,529,416 |
| | | Health Care—0.2% | |
| 3,300,000 | 1 | Alexza Pharmaceuticals, Inc., Warrants | 197,340 |
| 267,000 | 1,3 | Minerva Neurosciences, Inc., Warrants | 278,641 |
| 1,896,750 | 1,3 | Zogenix, Inc., Warrants | 1,426,925 |
| | | TOTAL | 1,902,906 |
| | | TOTAL WARRANTS
(IDENTIFIED COST $1,862,812) | 3,432,322 |
Annual Shareholder Report
Shares or
Principal
Amount | | | Value |
| | | INVESTMENT COMPANIES—22.2% | |
| 117,018,245 | 3,8 | Federated Money Market Management, Institutional Shares, 0.16%7 | $117,018,245 |
| 70,519,373 | 3 | Federated Prime Value Obligations Fund, Institutional Shares, 0.16%7 | 70,519,373 |
| | | TOTAL INVESTMENT COMPANIES
(AT NET ASSET VALUE) | 187,537,618 |
| | | TOTAL INVESTMENTS—113.3%
(IDENTIFIED COST $809,408,847)9 | 955,329,646 |
| | | OTHER ASSETS AND LIABILITIES - NET—(13.3)%10 | (111,772,736) |
| | | TOTAL NET ASSETS—100% | $843,556,910 |
| 1 | Non-income-producing security. |
| 2 | All or a portion of these securities are temporarily on loan to unaffiliated broker/dealers. |
| 3 | Affiliated companies and holdings. |
| 4 | Denotes a restricted security that either: (a) cannot be offered for public sale without first being registered, or being able to take advantage of an exemption from registration, under the Securities Act of 1933; or (b) is subject to a contractual restriction on public sales. At October 31, 2015, these restricted securities amounted to $9,182,911, which represented 1.1% of total net assets. |
| 5 | Denotes a restricted security that may be resold without restriction to “qualified institutional buyers” as defined in Rule 144A under the Securities Act of 1933 and that the Fund has determined to be liquid under criteria established by the Fund's Board of Trustees (the “Trustees”). At October 31, 2015, these liquid restricted securities amounted to $466,596, which represented 0.1% of total net assets. |
| 6 | Market quotations and price evaluations are not available. Fair value determined in accordance with procedures established by and under the general supervision of the Trustees. |
| 7 | 7-day net yield. |
| 8 | All or a portion of this security is held as collateral for securities lending. |
| 9 | The cost of investments for federal tax purposes amounts to $814,638,678. |
| 10 | Assets, other than investments in securities, less liabilities. See Statement of Assets and Liabilities. A significant portion of this balance represents loans to unaffiliated qualified brokers for securities lending. The Fund receives cash from the broker as collateral for the loaned securities and reinvests the collateral in certain short-term securities such as repurchase agreements or money market mutual funds. |
Note: The categories of investments are shown as a percentage of total net assets at October 31, 2015.
Various inputs are used in determining the value of the Fund's investments. These inputs are summarized in the three broad levels listed below:
Level 1—quoted prices in active markets for identical securities.
Level 2—other significant observable inputs (including quoted prices for similar securities, interest rates, prepayment speeds, credit risk, etc.). Also includes securities valued at amortized cost.
Level 3—significant unobservable inputs (including the Fund's own assumptions in determining the fair value of investments).
The inputs or methodology used for valuing securities are not an indication of the risk associated with investing in those securities.
Annual Shareholder Report
The following is a summary of the inputs used, as of October 31, 2015, in valuing the Fund's assets carried at fair value:
| Valuation Inputs | | | | |
| | Level 1—
Quoted
Prices | Level 2—
Other
Significant
Observable
Inputs | Level 3—
Significant
Unobservable
Inputs | Total |
| Equity Securities: | | | | |
| Common Stocks | | | | |
| Domestic | $638,024,823 | $— | $— | $638,024,823 |
| International | 71,550,513 | 52,156,574 | — | 123,707,087 |
| Preferred Stocks | | | | |
| Domestic | — | — | 2,161,200 | 2,161,200 |
| Debt Securities: | | | | |
| Corporate Bonds | — | 466,596 | — | 466,596 |
| Warrants | — | 3,432,322 | — | 3,432,322 |
| Investment Companies | 187,537,618 | — | — | 187,537,618 |
| TOTAL SECURITIES | $897,112,954 | $56,055,492 | $2,161,200 | $955,329,646 |
The following acronym is used throughout this portfolio:
| ADR | —American Depositary Receipt |
See Notes which are an integral part of the Financial Statements
Annual Shareholder Report
Financial Highlights–Class A Shares
(For a Share Outstanding Throughout Each Period)
| Year Ended October 31 | 2015 | 2014 | 2013 | 2012 | 2011 |
| Net Asset Value, Beginning of Period | $28.77 | $29.88 | $25.26 | $23.24 | $24.36 |
| Income From Investment Operations: | | | | | |
| Net investment income (loss) | (0.22)1 | (0.32)1 | (0.26)1 | (0.26)1 | (0.29)1 |
| Net realized and unrealized gain (loss) on investments and foreign currency transactions | 2.09 | 4.16 | 6.50 | 3.94 | (0.83) |
| TOTAL FROM INVESTMENT OPERATIONS | 1.87 | 3.84 | 6.24 | 3.68 | (1.12) |
| Less Distributions: | | | | | |
| Distributions from net realized gain on investments and foreign currency transactions | (5.26) | (4.95) | (1.62) | (1.66) | — |
| Net Asset Value, End of Period | $25.38 | $28.77 | $29.88 | $25.26 | $23.24 |
| Total Return2 | 7.12% | 13.37% | 26.65% | 17.00% | (4.60)% |
| Ratios to Average Net Assets: | | | | | |
| Net expenses | 1.95%3 | 1.95%3 | 1.95%3 | 1.95%3 | 1.95% |
| Net investment income ( loss) | (0.83)% | (1.11)% | (0.97)% | (1.09)% | (1.15)% |
| Expense waiver/reimbursement4 | 0.12% | 0.23% | 0.32% | 0.35% | 0.36% |
| Supplemental Data: | | | | | |
| Net assets, end of period (000 omitted) | $600,840 | $466,020 | $463,557 | $525,581 | $687,567 |
| Portfolio turnover | 88% | 65% | 66% | 44% | 55% |
| 1 | Per share numbers have been calculated using the average shares method. |
| 2 | Based on net asset value, which does not reflect the sales charge, redemption fee or contingent deferred sales charge, if applicable. |
| 3 | The net expense ratio is calculated without reduction for fees paid indirectly for expense offset arrangements. The net expense ratios are 1.95%, 1.95%, 1.95%, and 1.95% for the years ended October 31, 2015, 2014, 2013 and 2012, respectively, after taking into account these expense reductions. |
| 4 | This expense decrease is reflected in both the net expense and the net investment income (loss) ratios shown above. |
See Notes which are an integral part of the Financial Statements
Annual Shareholder Report
Financial Highlights–Class B Shares
(For a Share Outstanding Throughout Each Period)
| Year Ended October 31 | 2015 | 2014 | 2013 | 2012 | 2011 |
| Net Asset Value, Beginning of Period | $26.41 | $27.93 | $23.84 | $22.14 | $23.34 |
| Income From Investment Operations: | | | | | |
| Net investment income (loss) | (0.33)1 | (0.45)1 | (0.37)1 | (0.37)1 | (0.41)1 |
| Net realized and unrealized gain (loss) on investments and foreign currency transactions | 1.90 | 3.88 | 6.08 | 3.73 | (0.79) |
| TOTAL FROM INVESTMENT OPERATIONS | 1.57 | 3.43 | 5.71 | 3.36 | (1.20) |
| Less Distributions: | | | | | |
| Distributions from net realized gain on investments and foreign currency transactions | (5.26) | (4.95) | (1.62) | (1.66) | — |
| Net Asset Value, End of Period | $22.72 | $26.41 | $27.93 | $23.84 | $22.14 |
| Total Return2 | 6.52% | 12.75% | 25.97% | 16.36% | (5.14)% |
| Ratios to Average Net Assets: | | | | | |
| Net expenses | 2.50%3 | 2.50%3 | 2.50%3 | 2.50%3 | 2.50% |
| Net investment income (loss) | (1.36)% | (1.68)% | (1.51)% | (1.64)% | (1.69)% |
| Expense waiver/reimbursement4 | 0.12% | 0.25% | 0.33% | 0.35% | 0.32% |
| Supplemental Data: | | | | | |
| Net assets, end of period (000 omitted) | $20,182 | $25,108 | $36,591 | $42,298 | $61,010 |
| Portfolio turnover | 88% | 65% | 66% | 44% | 55% |
| 1 | Per share numbers have been calculated using the average shares method. |
| 2 | Based on net asset value, which does not reflect the sales charge, redemption fee or contingent deferred sales charge, if applicable. |
| 3 | The net expense ratio is calculated without reduction for expense offset arrangements. The net expense ratios are 2.50%, 2.50%, 2.50% and 2.50% for the years ended October 31, 2015, 2014, 2013 and 2012, respectively, after taking into account these expense reductions. |
| 4 | This expense decrease is reflected in both the net expense and the net investment income (loss) ratios shown above. |
See Notes which are an integral part of the Financial Statements
Annual Shareholder Report
Financial Highlights–Class C Shares
(For a Share Outstanding Throughout Each Period)
| Year Ended October 31 | 2015 | 2014 | 2013 | 2012 | 2011 |
| Net Asset Value, Beginning of Period | $26.41 | $27.93 | $23.84 | $22.14 | $23.34 |
| Income From Investment Operations: | | | | | |
| Net investment income (loss) | (0.33)1 | (0.44)1 | (0.38)1 | (0.38)1 | (0.41)1 |
| Net realized and unrealized gain (loss) on investments and foreign currency transactions | 1.90 | 3.87 | 6.09 | 3.74 | (0.79) |
| TOTAL FROM INVESTMENT OPERATIONS | 1.57 | 3.43 | 5.71 | 3.36 | (1.20) |
| Less Distributions: | | | | | |
| Distributions from net realized gain on investments and foreign currency transactions | (5.26) | (4.95) | (1.62) | (1.66) | — |
| Net Asset Value, End of Period | $22.72 | $26.41 | $27.93 | $23.84 | $22.14 |
| Total Return2 | 6.52% | 12.75% | 25.97% | 16.36% | (5.14)% |
| Ratios to Average Net Assets: | | | | | |
| Net expenses | 2.50%3 | 2.50%3 | 2.50%3 | 2.50%3 | 2.50% |
| Net investment income (loss) | (1.36)% | (1.67)% | (1.54)% | (1.65)% | (1.68)% |
| Expense waiver/reimbursement4 | 0.08% | 0.19% | 0.27% | 0.27% | 0.28% |
| Supplemental Data: | | | | | |
| Net assets, end of period (000 omitted) | $182,689 | $182,173 | $180,147 | $160,295 | $172,922 |
| Portfolio turnover | 88% | 65% | 66% | 44% | 55% |
| 1 | Per share numbers have been calculated using the average shares method. |
| 2 | Based on net asset value, which does not reflect the sales charge, redemption fee or contingent deferred sales charge, if applicable. |
| 3 | The net expense ratio is calculated without reduction for expense offset arrangements. The net expense ratios are 2.50%, 2.50%, 2.50% and 2.50% for the years ended October 31, 2015, 2014, 2013 and 2012, respectively, after taking into account these expense reductions. |
| 4 | This expense decrease is reflected in both the net expense and the net investment income (loss) ratios shown above. |
See Notes which are an integral part of the Financial Statements
Annual Shareholder Report
Financial Highlights–Class R Shares
(For a Share Outstanding Throughout Each Period)
| Year Ended October 31 | 2015 | 2014 | 2013 | 2012 | 2011 |
| Net Asset Value, Beginning of Period | $28.82 | $29.91 | $25.26 | $23.24 | $24.36 |
| Income From Investment Operations: | | | | | |
| Net investment income (loss) | (0.21)1 | (0.31)1 | (0.25)1 | (0.27)1 | (0.29)1 |
| Net realized and unrealized gain (loss) on investments and foreign currency transactions | 2.09 | 4.17 | 6.52 | 3.95 | (0.83) |
| TOTAL FROM INVESTMENT OPERATIONS | 1.88 | 3.86 | 6.27 | 3.68 | (1.12) |
| Less Distributions: | | | | | |
| Distributions from net realized gain on investments and foreign currency transactions | (5.26) | (4.95) | (1.62) | (1.66) | — |
| Net Asset Value, End of Period | $25.44 | $28.82 | $29.91 | $25.26 | $23.24 |
| Total Return2 | 7.15% | 13.43% | 26.77% | 17.00% | (4.60)% |
| Ratios to Average Net Assets: | | | | | |
| Net expenses | 1.90%3 | 1.90%3 | 1.90%3 | 1.95%3 | 1.95% |
| Net investment income (loss) | (0.76)% | (1.07)% | (0.93)% | (1.10)% | (1.14)% |
| Expense waiver/reimbursement4 | 0.31% | 0.38% | 0.44% | 0.44% | 0.45% |
| Supplemental Data: | | | | | |
| Net assets, end of period (000 omitted) | $39,846 | $35,789 | $34,056 | $31,485 | $27,715 |
| Portfolio turnover | 88% | 65% | 66% | 44% | 55% |
| 1 | Per share numbers have been calculated using the average shares method. |
| 2 | Based on net asset value. |
| 3 | The net expense ratio is calculated without reduction for expense offset arrangements. The net expense ratios are 1.90%, 1.90%, 1.90% and 1.95% for the years ended October 31, 2015, 2014, 2013 and 2012, respectively, after taking into account these expense reductions. |
| 4 | This expense decrease is reflected in both the net expense and the net investment income (loss) ratios shown above. |
See Notes which are an integral part of the Financial Statements
Annual Shareholder Report
Statement of Assets and Liabilities
October 31, 2015
| Assets: | | |
| Total investment in securities, at value including $113,347,665 of securities loaned, $187,537,618 of investment in affiliated holdings and $128,281,283 of investment in affiliated companies (Note 5) (identified cost $809,408,847) | | $955,329,646 |
| Cash denominated in foreign currencies (identified cost $4,134) | | 4,062 |
| Income receivable | | 69,492 |
| Receivable for investments sold | | 8,473,529 |
| Receivable for shares sold | | 734,974 |
| TOTAL ASSETS | | 964,611,703 |
| Liabilities: | | |
| Payable for investments purchased | $841,793 | |
| Payable for shares redeemed | 2,159,787 | |
| Payable for collateral due to broker for securities lending | 117,018,245 | |
| Payable to adviser (Note 5) | 59,298 | |
| Payable for distribution services fee (Note 5) | 238,619 | |
| Payable for other service fees (Notes 2 and 5) | 361,723 | |
| Accrued expenses (Note 5) | 375,328 | |
| TOTAL LIABILITIES | | 121,054,793 |
| Net assets for 34,172,765 shares outstanding | | $843,556,910 |
| Net Assets Consist of: | | |
| Paid-in capital | | $634,842,487 |
| Net unrealized appreciation of investments and translation of assets and liabilities in foreign currency | | 145,920,732 |
| Accumulated net realized gain on investments and foreign currency transactions | | 63,870,182 |
| Accumulated net investment income (loss) | | (1,076,491) |
| TOTAL NET ASSETS | | $843,556,910 |
Annual Shareholder Report
Statement of Assets and Liabilities–continued
| Net Asset Value, Offering Price and Redemption Proceeds Per Share | | |
| Class A Shares: | | |
| Net asset value per share ($600,840,089 ÷ 23,677,067 shares outstanding), no par value, unlimited shares authorized | | $25.38 |
| Offering price per share (100/94.50 of $25.38) | | $26.86 |
| Redemption proceeds per share | | $25.38 |
| Class B Shares: | | |
| Net asset value per share ($20,182,069 ÷ 888,415 shares outstanding), no par value, unlimited shares authorized | | $22.72 |
| Offering price per share | | $22.72 |
| Redemption proceeds per share (94.50/100 of $22.72) | | $21.47 |
| Class C Shares: | | |
| Net asset value per share ($182,688,532 ÷ 8,041,223 shares outstanding), no par value, unlimited shares authorized | | $22.72 |
| Offering price per share | | $22.72 |
| Redemption proceeds per share (99.00/100 of $22.72) | | $22.49 |
| Class R Shares: | | |
| Net asset value per share ($39,846,220 ÷ 1,566,060 shares outstanding), no par value, unlimited shares authorized | | $25.44 |
| Offering price per share | | $25.44 |
| Redemption proceeds per share | | $25.44 |
See Notes which are an integral part of the Financial Statements
Annual Shareholder Report
Statement of Operations
Year Ended October 31, 2015
| Investment Income: | | | |
| Dividends (including $151,076 received from affiliated holdings (Note 5) and net of foreign taxes withheld of $61,952) | | | $4,824,982 |
| Interest (including income on securities loaned of $3,126,824) | | | 4,132,635 |
| TOTAL INCOME | | | 8,957,617 |
| Expenses: | | | |
| Investment adviser fee (Note 5) | | $10,301,754 | |
| Administrative fee (Note 5) | | 620,183 | |
| Custodian fees | | 116,461 | |
| Transfer agent fee (Note 2) | | 1,093,837 | |
| Directors'/Trustees' fees (Note 5) | | 6,334 | |
| Auditing fees | | 39,700 | |
| Legal fees | | 9,611 | |
| Portfolio accounting fees | | 151,129 | |
| Distribution services fee (Note 5) | | 3,149,934 | |
| Other service fees (Notes 2 and 5) | | 1,872,217 | |
| Share registration costs | | 105,127 | |
| Printing and postage | | 72,659 | |
| Miscellaneous (Note 5) | | 23,454 | |
| TOTAL EXPENSES | | 17,562,400 | |
| Reimbursements, Waiver and Reduction: | | | |
| Reimbursement of investment adviser fee (Note 5) | $(92,146) | | |
Waiver/reimbursement of other operating expenses
(Notes 2 and 5) | (823,507) | | |
| Fees paid indirectly from directed brokerage arrangements (Note 6) | (13,504) | | |
| TOTAL REIMBURSEMENTS, WAIVER AND REDUCTION | | (929,157) | |
| Net expenses | | | 16,633,243 |
| Net investment income (loss) | | | (7,675,626) |
| Realized and Unrealized Gain (Loss) on Investments and Foreign Currency Transactions: | | | |
| Net realized gain on investments and foreign currency transactions (including realized gain of $6,246,091 on sales of investments in affiliated companies (Note 5)) | | | 73,427,498 |
| Net change in unrealized appreciation of investments and translation of assets and liabilities in foreign currency | | | (35,059,733) |
| Net realized and unrealized gain on investments and foreign currency transactions | | | 38,367,765 |
| Change in net assets resulting from operations | | | $30,692,139 |
See Notes which are an integral part of the Financial Statements
Annual Shareholder Report
Statement of Changes in Net Assets
| Year Ended October 31 | 2015 | 2014 |
| Increase (Decrease) in Net Assets | | |
| Operations: | | |
| Net investment income (loss) | $(7,675,626) | $(9,476,863) |
| Net realized gain on investments and foreign currency transactions | 73,427,498 | 139,444,272 |
| Net change in unrealized appreciation/depreciation of investments and translation of assets and liabilities in foreign currency | (35,059,733) | (40,749,832) |
| CHANGE IN NET ASSETS RESULTING FROM OPERATIONS | 30,692,139 | 89,217,577 |
| Distributions to Shareholders: | | |
| Distributions from net realized gain on investments and foreign currency transactions | | |
| Class A Shares | (83,688,012) | (75,602,998) |
| Class B Shares | (4,701,998) | (6,255,616) |
| Class C Shares | (35,503,025) | (31,207,961) |
| Class R Shares | (6,369,928) | (5,740,683) |
| CHANGE IN NET ASSETS RESULTING FROM DISTRIBUTIONS TO SHAREHOLDERS | (130,262,963) | (118,807,258) |
| Share Transactions: | | |
| Proceeds from sale of shares | 314,496,270 | 137,646,260 |
| Net asset value of shares issued to shareholders in payment of distributions declared | 120,343,459 | 108,523,114 |
| Cost of shares redeemed | (200,802,723) | (221,840,239) |
| CHANGE IN NET ASSETS RESULTING FROM SHARE TRANSACTIONS | 234,037,006 | 24,329,135 |
| Change in net assets | 134,466,182 | (5,260,546) |
| Net Assets: | | |
| Beginning of period | 709,090,728 | 714,351,274 |
| End of period (including accumulated net investment income (loss) of $(1,076,491) and $(387,618), respectively) | $843,556,910 | $709,090,728 |
See Notes which are an integral part of the Financial Statements
Annual Shareholder Report
Notes to Financial Statements
October 31, 2015
1. ORGANIZATION
Federated Equity Funds (the “Trust”) is registered under the Investment Company Act of 1940, as amended (the “Act”), as an open-end management investment company. The Trust consists of 14 portfolios. The financial statements included herein are only those of Federated Kaufmann Small Cap Fund (the “Fund”), a diversified portfolio. The financial statements of the other portfolios are presented separately. The assets of each portfolio are segregated and a shareholder's interest is limited to the portfolio in which shares are held. Each portfolio pays its own expenses. The Fund offers four classes of shares: Class A Shares, Class B Shares, Class C Shares and Class R Shares. All shares of the Fund have equal rights with respect to voting, except on class-specific matters. The investment objective of the Fund is to provide capital appreciation.
2. SIGNIFICANT ACCOUNTING POLICIES
The following is a summary of significant accounting policies consistently followed by the Fund in the preparation of its financial statements. These policies are in conformity with U.S. generally accepted accounting principles (GAAP).
Investment Valuation
In calculating its net asset value (NAV), the Fund generally values investments as follows:
| ■ | Equity securities listed on an exchange or traded through a regulated market system are valued at their last reported sale price or official closing price in their principal exchange or market. |
| ■ | Shares of other mutual funds or non-exchange-traded investment companies are valued based upon their reported NAVs. |
| ■ | Fixed-income securities acquired with remaining maturities greater than 60 days are fair valued using price evaluations provided by a pricing service approved by the Trustees. |
| ■ | Fixed-income securities and repurchase agreements acquired with remaining maturities of 60 days or less are valued at their cost (adjusted for the accretion of any discount or amortization of any premium), unless the issuer's creditworthiness is impaired or other factors indicate that amortized cost is not an accurate estimate of the investment's fair value, in which case it would be valued in the same manner as a longer-term security. |
| ■ | Derivative contracts listed on exchanges are valued at their reported settlement or closing price, except that options are valued at the mean of closing bid and asked quotations. |
| ■ | Over-the-counter (OTC) derivative contracts are fair valued using price evaluations provided by a pricing service approved by the Trustees. |
| ■ | For securities that are fair valued in accordance with procedures established by and under the general supervision of the Trustees, certain factors may be considered such as: the last traded or purchase price of the security, information obtained by contacting the issuer or dealers, analysis of the issuer's financial statements or other available documents, fundamental analytical data, the nature and duration of restrictions on disposition, the movement of the market in which the security is normally traded, public trading in similar securities or derivative contracts of the issuer or comparable issuers, movement of a relevant index, or other factors including but not limited to industry changes and relevant government actions. |
Annual Shareholder Report
If any price, quotation, price evaluation or other pricing source is not readily available when the NAV is calculated, or if the Fund cannot obtain price evaluations from a pricing service or from more than one dealer for an investment within a reasonable period of time as set forth in the Fund's valuation policies and procedures, the Fund uses the fair value of the investment determined in accordance with the procedures described below. There can be no assurance that the Fund could obtain the fair value assigned to an investment if it sold the investment at approximately the time at which the Fund determines its NAV per share.
Fair Valuation and Significant Events Procedures
The Trustees have ultimate responsibility for determining the fair value of investments for which market quotations are not readily available. The Trustees have appointed a valuation committee (“Valuation Committee”) comprised of officers of the Fund, Federated Equity Management Company of Pennsylvania (“Adviser”) and certain of the Adviser's affiliated companies to assist in determining fair value and in overseeing the calculation of the NAV. The Trustees have also authorized the use of pricing services recommended by the Valuation Committee to provide fair value evaluations of the current value of certain investments for purposes of calculating the NAV. The Valuation Committee employs various methods for reviewing third-party pricing-service evaluations including periodic reviews of third-party pricing services' policies, procedures and valuation methods (including key inputs, methods, models and assumptions), transactional back-testing, comparisons of evaluations of different pricing services, and review of price challenges by the Adviser based on recent market activity. In the event that market quotations and price evaluations are not available for an investment, the Valuation Committee determines the fair value of the investment in accordance with procedures adopted by the Trustees. The Trustees periodically review and approve the fair valuations made by the Valuation Committee and any changes made to the procedures.
Factors considered by pricing services in evaluating an investment include the yields or prices of investments of comparable quality, coupon, maturity, call rights and other potential prepayments, terms and type, reported transactions, indications as to values from dealers and general market conditions. Some pricing services provide a single price evaluation reflecting the bid-side of the market for an investment (a “bid” evaluation). Other pricing services offer both bid evaluations and price evaluations indicative of a price between the prices bid and asked for the investment (a “mid” evaluation). The Fund normally uses bid evaluations for any U.S. Treasury and Agency securities, mortgage-backed securities and municipal securities. The Fund normally uses mid evaluations for any other types of fixed-income securities and any OTC derivative contracts. In the event that market quotations and price evaluations are not available for an investment, the fair value of the investment is determined in accordance with procedures adopted by the Trustees.
The Trustees also have adopted procedures requiring an investment to be priced at its fair value whenever the Adviser determines that a significant event affecting the value of the investment has occurred between the time as of which the price of the investment would otherwise be determined and the time as of which the NAV is computed. An event is considered significant if there is both an affirmative expectation that the investment's value will change in response to the event and a reasonable basis for quantifying the resulting change in value. Examples of significant events that may occur after the close of the principal market on which a security is traded, or after the time of a price evaluation provided by a pricing service or a dealer, include:
| ■ | With respect to securities traded principally in foreign markets, significant trends in U.S. equity markets or in the trading of foreign securities index futures contracts; |
Annual Shareholder Report
| ■ | Political or other developments affecting the economy or markets in which an issuer conducts its operations or its securities are traded; |
| ■ | Announcements concerning matters such as acquisitions, recapitalizations, litigation developments, or a natural disaster affecting the issuer's operations or regulatory changes or market developments affecting the issuer's industry. |
The Trustees have adopted procedures whereby the Valuation Committee uses a pricing service to determine the fair value of equity securities traded principally in foreign markets when the Adviser determines that there has been a significant trend in the U.S. equity markets or in index futures trading. For other significant events, the Fund may seek to obtain more current quotations or price evaluations from alternative pricing sources. If a reliable alternative pricing source is not available, the Fund will determine the fair value of the investment in accordance with the fair valuation procedures approved by the Trustees. The Trustees have ultimate responsibility for any fair valuations made in response to a significant event.
Repurchase Agreements
The Fund may invest in repurchase agreements for short-term liquidity purposes. It is the policy of the Fund to require the other party to a repurchase agreement to transfer to the Fund's custodian or sub-custodian eligible securities or cash with a market value (after transaction costs) at least equal to the repurchase price to be paid under the repurchase agreement. The eligible securities are transferred to accounts with the custodian or sub-custodian in which the Fund holds a “securities entitlement” and exercises “control” as those terms are defined in the Uniform Commercial Code. The Fund has established procedures for monitoring the market value of the transferred securities and requiring the transfer of additional eligible securities if necessary to equal at least the repurchase price. These procedures also allow the other party to require securities to be transferred from the account to the extent that their market value exceeds the repurchase price or in exchange for other eligible securities of equivalent market value.
The insolvency of the other party or other failure to repurchase the securities may delay the disposition of the underlying securities or cause the Fund to receive less than the full repurchase price. Under the terms of the repurchase agreement, any amounts received by the Fund in excess of the repurchase price and related transaction costs must be remitted to the other party.
The Fund may enter into repurchase agreements in which eligible securities are transferred into joint trading accounts maintained by the custodian or sub-custodian for investment companies and other clients advised by the Fund's Adviser and its affiliates. The Fund will participate on a pro rata basis with the other investment companies and clients in its share of the securities transferred under such repurchase agreements and in its share of proceeds from any repurchase or other disposition of such securities.
Investment Income, Gains and Losses, Expenses and Distributions
Investment transactions are accounted for on a trade-date basis. Realized gains and losses from investment transactions are recorded on an identified-cost basis. Interest income and expenses are accrued daily. Dividend income and distributions to shareholders are recorded on the ex-dividend date. Foreign dividends are recorded on the ex-dividend date or when the Fund is informed of the ex-dividend date. Distributions of net investment income, if any, are declared and paid annually. Non-cash dividends included in dividend income, if any, are recorded at fair value. Investment income, realized and unrealized gains and losses, and
Annual Shareholder Report
certain fund-level expenses are allocated to each class based on relative average daily net assets, except that Class A Shares, Class B Shares, Class C Shares and Class R Shares may bear distribution services fees, other service fees and transfer agent fees unique to those classes. For the year ended October 31, 2015, transfer agent fees for the Fund were as follows:
| | Transfer
Agent Fees
Incurred | Transfer
Agent Fees
Reimbursed |
| Class A Shares | $683,182 | $(295,545) |
| Class B Shares | 40,385 | (23,754) |
| Class C Shares | 263,140 | (124,896) |
| Class R Shares | 107,130 | — |
| TOTAL | $1,093,837 | $(444,195) |
Dividends are declared separately for each class. No class has preferential dividend rights; differences in per share dividend rates are generally due to differences in separate class expenses.
Other Service Fees
The Fund may pay other service fees up to 0.25% of the average daily net assets of the Fund's Class A Shares, Class B Shares and Class C Shares to unaffiliated financial intermediaries or to Federated Shareholder Services Company (FSSC) for providing services to shareholders and maintaining shareholder accounts. Financial intermediaries may include a company affiliated with management of Federated Investors, Inc. A financial intermediary affiliated with management of Federated Investors, Inc. received $18,634 of other service fees for the year ended October 31, 2015. Subject to the terms described in the Expense Limitation note, FSSC may voluntarily reimburse the Fund for other service fees. For the year ended October 31, 2015, other service fees for the Fund were as follows:
| | Other
Service Fees
Incurred |
| Class A Shares | $1,337,533 |
| Class B Shares | 57,229 |
| Class C Shares | 477,455 |
| TOTAL | $1,872,217 |
Premium and Discount Amortization
All premiums and discounts on fixed-income securities are amortized/accreted using the effective-interest-rate method.
Federal Taxes
It is the Fund's policy to comply with the Subchapter M provision of the Internal Revenue Code and to distribute to shareholders each year substantially all of its income. Accordingly, no provision for federal income tax is necessary. As of and during the year ended October 31, 2015, the Fund did not have a liability for any uncertain tax positions. The Fund
Annual Shareholder Report
recognizes interest and penalties, if any, related to tax liabilities as income tax expense in the Statement of Operations. As of October 31, 2015, tax years 2012 through 2015 remain subject to examination by the Fund's major tax jurisdictions, which include the United States of America and the Commonwealth of Massachusetts.
The Fund may be subject to taxes imposed by governments of countries in which it invests. Such taxes are generally based on either income or gains earned or repatriated. The Fund accrues and applies such taxes to net investment income, net realized gains and net unrealized gains as income and/or gains are earned.
When-Issued and Delayed-Delivery Transactions
The Fund may engage in when-issued or delayed-delivery transactions. The Fund records when-issued securities on the trade date and maintains security positions such that sufficient liquid assets will be available to make payment for the securities purchased. Securities purchased on a when-issued or delayed-delivery basis are marked to market daily and begin earning interest on the settlement date. Losses may occur on these transactions due to changes in market conditions or the failure of counterparties to perform under the contract.
Foreign Exchange Contracts
The Fund enters into foreign exchange contracts to manage currency and market risks. Purchased contracts are used to acquire exposure to foreign currencies, whereas, contracts to sell are used to hedge the Fund's securities against currency fluctuations. Risks may arise upon entering into these transactions from the potential inability of counterparties to meet the terms of their commitments and from unanticipated movements in security prices or foreign exchange rates. The foreign exchange contracts are adjusted by the daily exchange rate of the underlying currency and any gains or losses are recorded for financial statement purposes as unrealized until the settlement date.
At October 31, 2015, the Fund had no outstanding foreign exchange contracts.
The average value at settlement date payable and receivable of foreign exchange contracts purchased and sold by the Fund throughout the period was $32 and $110, respectively. This is based on the contracts held as of each month-end throughout the fiscal period.
Foreign Currency Translation
The accounting records of the Fund are maintained in U.S. dollars. All assets and liabilities denominated in foreign currencies (FCs) are translated into U.S. dollars based on the rates of exchange of such currencies against U.S. dollars on the date of valuation. Purchases and sales of securities, income and expenses are translated at the rate of exchange quoted on the respective date that such transactions are recorded. The Fund does not isolate that portion of the results of operations resulting from changes in foreign exchange rates on investments from the fluctuations arising from changes in market prices of securities held. Such fluctuations are included with the net realized and unrealized gain or loss from investments.
Reported net realized foreign exchange gains or losses arise from sales of portfolio securities, sales and maturities of short-term securities, sales of FCs, currency gains or losses realized between the trade and settlement dates on securities transactions, the difference between the amounts of dividends, interest and foreign withholding taxes recorded on the Fund's books, and the U.S. dollar equivalent of the amounts actually received or paid. Net unrealized foreign exchange gains and losses arise from changes in the value of assets and liabilities other than investments in securities at fiscal year end, resulting from changes in the exchange rate.
Annual Shareholder Report
Additional Disclosure Related to Derivative Instruments
The Effect of Derivative Instruments on the Statement of Operations for the Year Ended October 31, 2015
| Amount of Realized Gain or (Loss) on Derivatives Recognized in Income |
| | Forward
Currency
Contracts |
| Foreign exchange contracts | $(10,978) |
Securities Lending
The Fund participates in a securities lending program providing for the lending of equity securities to qualified brokers. The Fund normally receives cash collateral for securities loaned that is invested in an affiliated money market fund or in short-term securities including repurchase agreements. Collateral is maintained at a minimum level of 100% of the market value of investments loaned, plus interest, if applicable. Earnings on collateral are allocated between the borrower of the security, the securities lending agent, as a fee for its services under the program and the Fund, according to agreed-upon rates.
The securities lending agreement permits the net settlement of all transactions and collateral with the Fund, through, a single payment, in the event of default or termination. Amounts presented on the Portfolio of Investments and Statement of Assets and Liabilities are not net settlement amount but gross. As indicated below, the cash collateral received by the Fund exceeds the market value of the securities loaned reducing the net settlement amount to zero. The chart below identifies the amount of collateral received as well as the market value of securities on loan. Additionally, the securities lending agreement executed by the Fund includes an indemnification clause. This clause stipulates that the borrower will reimburse the Fund for any losses as a result of any failure of the borrower to return equivalent securities to the Fund.
As of October 31, 2015, securities subject to this type of arrangement and related collateral were as follows:
Market Value of
Securities Loaned | Market Value
of Collateral |
| $113,347,665 | $117,018,245 |
Restricted Securities
The Fund may purchase securities which are considered restricted. Restricted securities are securities that either: (a) cannot be offered for public sale without first being registered, or being able to take advantage of an exemption from registration, under the Securities Act of 1933; or (b) are subject to contractual restrictions on public sales. In some cases, when a security cannot be offered for public sale without first being registered, the issuer of the restricted security has agreed to register such securities for resale, at the issuer's expense, either upon demand by the Fund or in connection with another registered offering of the securities. Many such restricted securities may be resold in the secondary market in transactions exempt from registration. Restricted securities may be determined to be liquid under criteria established by the Trustees. The Fund will not incur any registration costs upon such resales. The Fund's restricted securities, like other securities, are priced in accordance with procedures established by and under the general supervision of the Trustees.
Annual Shareholder Report
Additional information on restricted securities, excluding securities purchased under Rule 144A that have been deemed liquid by the Trustees, if applicable, held at October 31, 2015, is as follows:
| Security | Acquisition Date | Cost | Market Value |
| aTyr Pharma, Inc., Pfd., Series E | 3/31/2015 | $1,939,999 | $2,161,200 |
| Infrastrutture Wireless Italiane SPA | 6/18/15 - 6/22/15 | $3,195,691 | $4,001,478 |
| Minerva Neurosciences, Inc. | 3/13/2015 | $1,284,270 | $1,399,081 |
| SteadyMed Ltd., Pfd. | 1/26/2015 | $3,475,000 | $1,154,556 |
Other
The preparation of financial statements in conformity with GAAP requires management to make estimates and assumptions that affect the amounts of assets, liabilities, expenses and revenues reported in the financial statements. Actual results could differ from those estimated. The Fund applies Investment Company accounting and reporting guidance.
3. SHARES OF BENEFICIAL INTEREST
The following tables summarize share activity:
| Year Ended October 31 | 2015 | 2014 |
| Class A Shares: | Shares | Amount | Shares | Amount |
| Shares sold | 9,669,635 | $267,363,437 | 3,654,364 | $105,034,029 |
| Shares issued to shareholders in payment of distributions declared | 3,219,354 | 79,067,350 | 2,524,989 | 70,472,440 |
| Shares redeemed | (5,409,581) | (143,467,663) | (5,497,490) | (155,574,626) |
| NET CHANGE RESULTING FROM CLASS A SHARE TRANSACTIONS | 7,479,408 | $202,963,124 | 681,863 | $19,931,843 |
| Year Ended October 31 | 2015 | 2014 |
| Class B Shares: | Shares | Amount | Shares | Amount |
| Shares sold | 170,375 | $4,133,847 | 91,937 | $2,456,111 |
| Shares issued to shareholders in payment of distributions declared | 202,444 | 4,471,984 | 229,938 | 5,918,608 |
| Shares redeemed | (435,135) | (10,477,225) | (681,412) | (17,799,013) |
| NET CHANGE RESULTING FROM CLASS B SHARE TRANSACTIONS | (62,316) | $(1,871,394) | (359,537) | $(9,424,294) |
| Year Ended October 31 | 2015 | 2014 |
| Class C Shares: | Shares | Amount | Shares | Amount |
| Shares sold | 1,118,017 | $26,893,516 | 716,799 | $18,746,293 |
| Shares issued to shareholders in payment of distributions declared | 1,380,572 | 30,496,839 | 1,028,416 | 26,471,424 |
| Shares redeemed | (1,354,868) | (32,588,580) | (1,298,072) | (34,317,177) |
| NET CHANGE RESULTING FROM CLASS C SHARE TRANSACTIONS | 1,143,721 | $24,801,775 | 447,143 | $10,900,540 |
Annual Shareholder Report
| Year Ended October 31 | 2015 | 2014 |
| Class R Shares: | Shares | Amount | Shares | Amount |
| Shares sold | 597,815 | $16,105,470 | 394,165 | $11,409,827 |
| Shares issued to shareholders in payment of distributions declared | 256,290 | 6,307,286 | 202,527 | 5,660,642 |
| Shares redeemed | (529,755) | (14,269,255) | (493,647) | (14,149,423) |
| NET CHANGE RESULTING FROM CLASS R SHARE TRANSACTIONS | 324,350 | $8,143,501 | 103,045 | $2,921,046 |
| NET CHANGE RESULTING FROM TOTAL FUND SHARE TRANSACTIONS | 8,885,163 | $234,037,006 | 872,514 | $24,329,135 |
4. FEDERAL TAX INFORMATION
The timing and character of income and capital gain distributions are determined in accordance with income tax regulations, which may differ from GAAP. These differences are primarily due to differing treatments for foreign currency transactions, net operating losses, passive foreign investment companies (PFICs) and discount accretion/premium amortization on debt securities.
For the year ended October 31, 2015, permanent differences identified and reclassified among the components of net assets were as follows:
| Increase (Decrease) |
Undistributed
Net Investment
Income (Loss) | Accumulated
Net Realized
Gain (Loss) |
| $6,986,753 | $(6,986,753) |
Net investment income (loss), net realized gains (losses), and net assets were not affected by this reclassification.
The tax character of distributions as reported on the Statement of Changes in Net Assets for the years ended October 31, 2015 and 2014, was as follows:
| | 2015 | 2014 |
| Ordinary income1 | $50,620,264 | $23,428,608 |
| Long-term capital gains | $79,642,699 | $95,378,650 |
| 1 | For tax purposes, short-term capital gain distributions are considered ordinary income distributions. |
As of October 31, 2015, the components of distributable earnings on a tax-basis were as follows:
| Undistributed ordinary income2 | $2,151,573 |
| Undistributed long-term capital gains | $65,871,949 |
| Net unrealized appreciation | $140,690,901 |
| 2 | For tax purposes, short-term capital gains are considered ordinary income in determining distributable earnings. |
Annual Shareholder Report
The difference between book-basis and tax-basis net unrealized appreciation/depreciation is attributable to differing treatments for the deferral of losses on wash sales and for the realization for tax purposes of unrealized gains on investments in PFICs.
At October 31, 2015, the cost of investments for federal tax purposes was $814,638,678. The net unrealized appreciation of investments for federal tax purposes excluding any unrealized depreciation resulting from the translation from FCs to U.S. dollars of assets and liabilities other than investments in securities was $140,690,968. This consists of net unrealized appreciation from investments for those securities having an excess of value over cost of $185,295,300 and net unrealized depreciation from investments for those securities having an excess of cost over value of $44,604,332.
5. INVESTMENT ADVISER FEE AND OTHER TRANSACTIONS WITH AFFILIATES
Investment Adviser Fee
The advisory agreement between the Fund and the Adviser provides for an annual fee equal to 1.30% of the Fund's average daily net assets. Subject to the terms described in the Expense Limitation note, the Adviser may voluntarily choose to waive any portion of its fee. For the year ended October 31, 2015, an affiliate of the Adviser reimbursed $444,195 of transfer agent fees.
Certain of the Fund's assets are managed by Federated Global Investment Management Corp. (the “Sub-Adviser”). Under the terms of a sub-advisory agreement between the Adviser and the Sub-Adviser, the Sub-Adviser receives an allocable portion of the Fund's adviser fee. The fee is paid by the Adviser out of its resources and is not an incremental Fund expense. For the year ended October 31, 2015, the Sub-Adviser earned a fee of $8,454,428.
Administrative Fee
Federated Administrative Services (FAS), under the Administrative Services Agreement, provides the Fund with administrative personnel and services. For purposes of determining the appropriate rate breakpoint, “Investment Complex” is defined as all of the Federated Funds subject to a fee under the Administrative Services Agreement. The fee paid to FAS is based on the average daily net assets of the Investment Complex as specified below, plus certain out-of-pocket expenses:
| Administrative Fee | Average Daily Net Assets
of the Investment Complex |
| 0.150% | on the first $5 billion |
| 0.125% | on the next $5 billion |
| 0.100% | on the next $10 billion |
| 0.075% | on assets in excess of $20 billion |
Subject to the terms described in the Expense Limitation note, FAS may voluntarily choose to waive any portion of its fee. For the year ended October 31, 2015, the annualized fee paid to FAS was 0.078% of average daily net assets of the Fund.
Annual Shareholder Report
Distribution Services Fee
The Fund has adopted a Distribution Plan (the “Plan”) pursuant to Rule 12b-1 under the Act. Under the terms of the Plan, the Fund will compensate Federated Securities Corp. (FSC), the principal distributor, from the daily net assets of the Fund's Class A Shares, Class B Shares, Class C Shares and Class R Shares to finance activities intended to result in the sale of these shares. The Plan provides that the Fund may incur distribution expenses at the following percentages of average daily net assets annually, to compensate FSC:
| Share Class Name | Percentage of Average Daily
Net Assets of Class |
| Class A Shares | 0.25% |
| Class B Shares | 0.75% |
| Class C Shares | 0.75% |
| Class R Shares | 0.50% |
Subject to the terms described in the Expense Limitation note, FSC may voluntarily choose to waive any portion of its fee. For the year ended October 31, 2015, distribution services fees for the Fund were as follows:
| | Distribution
Services Fees
Incurred | Distribution
Services Fees
Waived |
| Class A Shares | $1,346,964 | $(259,962) |
| Class B Shares | 171,687 | — |
| Class C Shares | 1,432,366 | — |
| Class R Shares | 198,917 | (119,350) |
| TOTAL | $3,149,934 | $(379,312) |
When FSC receives fees, it may pay some or all of them to financial intermediaries whose customers purchase shares. For the year ended October 31, 2015, FSC retained $1,139,990 of fees paid by the Fund.
Sales Charges
Front-end sales charges and contingent deferred sales charges (CDSC) do not represent expenses of the Fund. They are deducted from the proceeds of sales of Fund shares prior to investment or from redemption proceeds prior to remittance, as applicable. For the year ended October 31, 2015, FSC retained $43,459 in sales charges from the sale of Class A Shares. FSC also retained $50,245, $24,324 and $8,194 of CDSC relating to redemptions of Class A Shares, Class B Shares and Class C Shares, respectively.
Other Service Fees
For the year ended October 31, 2015, FSSC received $93,227 of the other service fees disclosed in Note 2.
Annual Shareholder Report
Expense Limitation
The Adviser and certain of its affiliates (which may include FSC, FAS and FSSC) on their own initiative have agreed to waive certain amounts of their respective fees and/or reimburse expenses. Total annual fund operating expenses (as shown in the financial highlights, excluding expenses allocated from affiliated partnerships, extraordinary expenses and proxy-related expenses paid by the Fund, if any) paid by the Fund's Class A Shares, Class B Shares, Class C Shares and Class R Shares (after the voluntary waivers and/or reimbursements) will not exceed 1.95%, 2.50%, 2.50% and 1.95% (the “Fee Limit”), respectively, up to but not including the later of (the “Termination Date”): (a) January 1, 2017; or (b) the date of the Fund's next effective Prospectus. While the Adviser and its applicable affiliates currently do not anticipate terminating or increasing these arrangements prior to the Termination Date, these arrangements may only be terminated or the Fee Limit increased prior to the Termination Date with the agreement of the Trustees.
Interfund Transactions
During the year ended October 31, 2015, the Fund engaged in purchase and sale transactions with funds that have a common investment adviser (or affiliated investment advisers), common Directors/Trustees, and/or common Officers. These purchase and sale transactions complied with Rule 17a-7 under the Act and amounted to $10,668,708 and $1,740,955, respectively.
General
Certain Officers and Trustees of the Fund are Officers and Directors or Trustees of certain of the above companies. To efficiently facilitate payment, Directors'/Trustees' fees and certain expenses related to conducting meetings of the Directors/Trustees and other miscellaneous expenses are paid by an affiliate of the Adviser which in due course are reimbursed by the Fund. Such expenses may be included in Accrued and Miscellaneous Expenses on the Statement of Assets and Liabilities and Statement of Operations, respectively.
Transactions Involving Affiliated Companies and Affiliated Holdings
An affiliated company is a company in which the Fund, alone or in combination with other affiliated funds, has ownership of at least 5% of the voting shares. Transactions with affiliated companies during the year ended October 31, 2015, were as follows:
| Affiliates | Balance of
Shares Held
10/31/2014 | Purchases/
Additions | Sales/
Reductions | Balance of
Shares Held
10/31/2015 | Value | Dividend
Income |
| Adesto Technologies Corp. | — | 1,000,000 | (6,000) | 994,000 | $5,914,300 | — |
| BioDelivery Sciences International, Inc. | 809,700 | 65,000 | (399,700) | 475,000 | $2,555,500 | — |
| *Cardica, Inc. | 3,870,800 | — | (3,870,800) | — | — | — |
| Catalyst Pharmaceutical Partners, Inc. | 1,435,000 | 115,000 | (50,000) | 1,500,000 | $4,740,000 | — |
| *Central European Media Enterprises Ltd., Class A | 2,415,000 | — | (2,415,000) | — | — | — |
Annual Shareholder Report
| Affiliates | Balance of
Shares Held
10/31/2014 | Purchases/
Additions | Sales/
Reductions | Balance of
Shares Held
10/31/2015 | Value | Dividend
Income |
| *Central European Media Enterprises Ltd., Warrants | 817,782 | — | — | 817,782 | $1,529,416 | — |
| *Central European Media Enterprises Ltd., 15.00%, 12/1/2017 | 3,894,200 | 656,617 | (4,550,817) | — | — | $640,953 |
| ChannelAdvisor Corp. | 205,000 | 122,300 | — | 327,300 | $2,854,056 | — |
| *Cinedigm Corp. | 3,585,694 | 100,000 | (3,685,694) | — | — | — |
| Corcept Therapeutics, Inc. | 1,325,000 | 164,277 | (50,000) | 1,439,277 | $5,310,932 | — |
| *Corcept Therapeutics, Inc., Warrants | 121,142 | 43,135 | (164,277) | — | — | — |
| *Dexcom, Inc. | 397,400 | — | (137,400) | 260,000 | $21,663,200 | — |
| Dyax Corp. | 216,600 | 47,200 | (75,400) | 188,400 | $5,186,652 | — |
| Dynavax Technologies Corp. | — | 1,115,000 | — | 1,115,000 | $25,333,005 | — |
| *Dynavax Technologies Corp. | 16,122,000 | — | (16,122,000) | — | — | — |
| *Dynavax Technologies Corp., Warrants | 446,014 | — | (446,014) | — | — | — |
| Egalet Corp. | 300,000 | 190,000 | (15,000) | 475,000 | $3,942,500 | — |
| ExamWorks Group, Inc. | — | 141,700 | — | 141,700 | $4,001,608 | — |
| Galapagos NV | 144,100 | 58,722 | (47,822) | 155,000 | $7,478,864 | — |
| Galapagos NV, ADR | — | 122,066 | — | 122,066 | $5,859,168 | — |
| *Innovative Solutions and Support, Inc. | 1,050,000 | — | (1,050,000) | — | — | — |
| *Inovalon Holdings, Inc. | — | 130,500 | (130,500) | — | — | — |
| Minerva Neurosciences, Inc. | — | 196,752 | (1,332) | 195,420 | $1,024,001 | — |
| Minerva Neurosciences, Inc. | — | 267,000 | — | 267,000 | $1,399,081 | — |
| Minerva Neurosciences, Inc., Warrants | — | 267,000 | — | 267,000 | $278,641 | — |
| Ocular Therapeutix, Inc. | 350,000 | 97,030 | (122,200) | 324,830 | $2,803,283 | — |
| Otonomy, Inc. | 16,500 | 217,000 | (8,500) | 225,000 | $4,869,000 | — |
| Premier, Inc. | — | 235,000 | (64,402) | 170,598 | $5,767,918 | — |
| Progenics Pharmaceuticals, Inc. | 1,958,600 | — | — | 1,958,600 | $14,376,124 | — |
| *Protalix Biotherapeutics, Inc. | 987,600 | — | (987,600) | — | — | — |
Annual Shareholder Report
| Affiliates | Balance of
Shares Held
10/31/2014 | Purchases/
Additions | Sales/
Reductions | Balance of
Shares Held
10/31/2015 | Value | Dividend
Income |
| *Protalix Biotherapeutics, Inc., Conv. Bond, Series, 4.50%, 9/15/2018 | 635,000 | — | — | 635,000 | $466,596 | $28,575 |
| SCYNEXIS, Inc. | — | 463,800 | — | 463,800 | $2,963,682 | — |
| SteadyMed Ltd. | — | 345,900 | — | 345,900 | $975,438 | — |
| SteadyMed Ltd. | — | 409,417 | — | 409,417 | $1,154,556 | — |
| Textura Corp. | 287,884 | 60,316 | - | 348,200 | $10,223,152 | — |
| Threshold Pharmaceuticals, Inc., Class THL | 489,988 | — | (103,488) | 386,500 | $1,472,565 | — |
| Townsquare Media LLC | 83,696 | 6,600 | (29,296) | 61,000 | $668,560 | — |
| *Venaxis, Inc. | 1,322,300 | — | (1,322,300) | — | — | — |
| Zogenix, Inc. | — | 282,000 | — | 282,000 | $3,324,780 | — |
| *Zogenix, Inc. | 2,868,000 | — | (2,868,000) | — | — | — |
| Zogenix, Inc., Warrants | 1,046,250 | 850,500 | — | 1,896,750 | $1,426,925 | — |
| Zynerba Pharmaceuticals, Inc. | — | 188,800 | — | 188,800 | $2,376,992 | — |
TOTAL OF
AFFILIATED
COMPANIES | 47,201,250 | 7,958,632 | (38,723,542) | 16,436,340 | $151,940,495 | $669,528 |
| * | At October 31, 2015, the Fund no longer has ownership of at least 5% of the voting shares. |
Affiliated holdings are investment companies which are managed by the Adviser or an affiliate of the Adviser. The Adviser has agreed to reimburse the Fund for certain investment adviser fees as a result of transactions in other affiliated investment companies. For the year ended October 31, 2015, the Adviser reimbursed $92,146. Transactions involving the affiliated holdings during the year ended October 31, 2015, were as follows:
| | Federated
Money Market
Management,
Institutional
Shares | Federated
Prime Value
Obligations Fund,
Institutional
Shares | Total of
Affiliated
Transactions |
| Balance of Shares Held 10/31/2014 | 101,766,905 | — | 101,766,905 |
| Purchases/Additions | 407,977,679 | 337,418,316 | 744,726,063 |
| Sales/Reductions | (392,726,339) | (266,898,943) | (658,955,350) |
| Balance of Shares Held 10/31/2015 | 117,018,245 | 70,519,373 | 187,537,618 |
| Value | $117,018,245 | $70,519,373 | $187,537,618 |
| Dividend Income | $111,181 | $39,895 | $151,076 |
Annual Shareholder Report
6. EXPENSE Reduction
The Fund directs portfolio trades to a broker that in turn pays a portion of the Fund's operating expenses. For the year ended October 31, 2015, the Fund's expenses were reduced by $13,504 under these arrangements.
7. Investment TRANSACTIONS
Purchases and sales of investments, excluding long-term U.S. government securities and short-term obligations, for the year ended October 31, 2015, were as follows:
| Purchases | $678,046,893 |
| Sales | $660,574,282 |
8. CONCENTRATION OF RISK
The Fund may invest a portion of its assets in securities of companies that are deemed by the Fund's management to be classified in similar business sectors. Economic developments may have an effect on the liquidity and volatility of the portfolio securities.
9. LINE OF CREDIT
The Fund participates in a $100,000,000 unsecured, uncommitted revolving line of credit (LOC) agreement with PNC Bank. The LOC was made available for extraordinary or emergency purposes, primarily for financing redemption payments. Borrowings are charged interest at a rate offered to the Fund by PNC Bank at the time of the borrowing. As of October 31, 2015, there were no outstanding loans. During the year ended October 31, 2015, the Fund did not utilize the LOC.
10. INTERFUND LENDING
Pursuant to an Exemptive Order issued by the Securities and Exchange Commission (SEC), the Fund, along with other funds advised by subsidiaries of Federated Investors, Inc., may participate in an interfund lending program. This program provides an alternative credit facility allowing the Fund to borrow from other participating affiliated funds. As of October 31, 2015, there were no outstanding loans. During the year ended October 31, 2015, the program was not utilized.
11. FEDERAL TAX INFORMATION (UNAUDITED)
For the year ended October 31, 2015, the amount of long-term capital gains designated by the Fund was $79,642,699.
For the fiscal year ended October 31, 2015, 5.47% of total ordinary income (including short-term capital gain) distributions made by the Fund are qualifying dividends which may be subject to a maximum tax rate of 15%, as provided for by the Jobs and Growth Tax Relief Act of 2003. Complete information is reported in conjunction with the reporting of your distributions on Form 1099-DIV.
Of the ordinary income (including short-term capital gain) distributions made by the Fund during the year ended October 31, 2015, 3.62% qualify for the dividend received deduction available to corporate shareholders.
Annual Shareholder Report
Report of Independent Registered Public Accounting Firm
TO THE BOARD OF Trustees OF Federated Equity Funds AND SHAREHOLDERS OF Federated Kaufmann Small Cap Fund:
We have audited the accompanying statement of assets and liabilities of Federated Kaufmann Small Cap Fund (the “Fund”) (one of the portfolios constituting Federated Equity Funds), including the portfolio of investments, as of October 31, 2015, and the related statement of operations for the year then ended, the statement of changes in net assets for each of the two years in the period then ended, and the financial highlights for each of the five years in the period then ended. These financial statements and financial highlights are the responsibility of the Fund's management. Our responsibility is to express an opinion on these financial statements and financial highlights based on our audits.
We conducted our audits in accordance with standards of the Public Company Accounting Oversight Board (United States). Those standards require that we plan and perform the audit to obtain reasonable assurance about whether the financial statements and financial highlights are free of material misstatement. We were not engaged to perform an audit of the Fund's internal control over financial reporting. Our audits included consideration of internal control over financial reporting as a basis for designing audit procedures that are appropriate in the circumstances, but not for the purpose of expressing an opinion on the effectiveness of the Fund's internal control over financial reporting. Accordingly, we express no such opinion. An audit also includes examining, on a test basis, evidence supporting the amounts and disclosures in the financial statements and financial highlights, assessing the accounting principles used and significant estimates made by management, and evaluating the overall financial statement presentation. Our procedures included confirmation of securities owned as of October 31, 2015, by correspondence with the custodian and others or by other appropriate auditing procedures where replies from others were not received. We believe that our audits provide a reasonable basis for our opinion.
In our opinion, the financial statements and financial highlights referred to above present fairly, in all material respects, the financial position of Federated Kaufmann Small Cap Fund, a portfolio of Federated Equity Funds, at October 31, 2015, the results of its operations for the year then ended, the changes in its net assets for each of the two years in the period then ended, and the financial highlights for each of the five years in the period then ended, in conformity with U.S. generally accepted accounting principles.
Boston, Massachusetts
December 23, 2015
Annual Shareholder Report
Shareholder Expense Example (unaudited)
As a shareholder of the Fund, you incur two types of costs: (1) transaction costs, including sales charges (loads) on purchase or redemption payments; and (2) ongoing costs, including management fees and to the extent applicable, distribution (12b-1) fees and/or other service fees and other Fund expenses. This Example is intended to help you to understand your ongoing costs (in dollars) of investing in the Fund and to compare these costs with the ongoing costs of investing in other mutual funds. It is based on an investment of $1,000 invested at the beginning of the period and held for the entire period from May 1, 2015 to October 31, 2015.
ACTUAL EXPENSES
The first section of the table below provides information about actual account values and actual expenses. You may use the information in this section, together with the amount you invested, to estimate the expenses that you incurred over the period. Simply divide your account value by $1,000 (for example, an $8,600 account value divided by $1,000 = 8.6), then multiply the result by the number in the first section under the heading entitled “Expenses Paid During Period” to estimate the expenses attributable to your investment during this period.
HYPOTHETICAL EXAMPLE FOR COMPARISON PURPOSES
The second section of the table below provides information about hypothetical account values and hypothetical expenses based on the Fund's actual expense ratio and an assumed rate of return of 5% per year before expenses, which is not the Fund's actual return. Thus, you should not use the hypothetical account values and expenses to estimate the actual ending account balance or your expenses for the period. Rather, these figures are required to be provided to enable you to compare the ongoing costs of investing in the Fund with other funds. To do so, compare this 5% hypothetical example with the 5% hypothetical examples that appear in the shareholder reports of the other funds.
Annual Shareholder Report
Please note that the expenses shown in the table are meant to highlight your ongoing costs only and do not reflect any transaction costs, such as sales charges (loads) on purchase or redemption payments. Therefore, the second section of the table is useful in comparing ongoing costs only, and will not help you determine the relative total costs of owning different funds. In addition, if these transaction costs were included, your costs would have been higher.
| | Beginning
Account Value
5/1/2015 | Ending
Account Value
10/31/2015 | Expenses Paid
During Period1 |
| Actual: | | | |
| Class A Shares | $1,000 | $951.30 | $9.59 |
| Class B Shares | $1,000 | $948.60 | $12.28 |
| Class C Shares | $1,000 | $948.60 | $12.28 |
| Class R Shares | $1,000 | $951.40 | $9.35 |
Hypothetical (assuming a 5% return
before expenses): | | | |
| Class A Shares | $1,000 | $1,015.38 | $9.91 |
| Class B Shares | $1,000 | $1,012.60 | $12.68 |
| Class C Shares | $1,000 | $1,012.60 | $12.68 |
| Class R Shares | $1,000 | $1,015.63 | $9.65 |
| 1 | Expenses are equal to the Fund's annualized net expense ratios, multiplied by the average account value over the period, multiplied by 184/365 (to reflect the one-half-year period). The annualized net expense ratios are as follows: |
| | |
| Class A Shares | 1.95% |
| Class B Shares | 2.50% |
| Class C Shares | 2.50% |
| Class R Shares | 1.90% |
Annual Shareholder Report
Board of Trustees and Trust Officers
The Board of Trustees is responsible for managing the Trust's business affairs and for exercising all the Trust's powers except those reserved for the shareholders. The following tables give information about each Trustee and the senior officers of the Fund. Where required, the tables separately list Trustees who are “interested persons” of the Fund (i.e., “Interested” Trustees) and those who are not (i.e., “Independent” Trustees). Unless otherwise noted, the address of each person listed is Federated Investors Tower, 1001 Liberty Avenue, Pittsburgh, PA 15222. The address of all Independent Trustees listed is 4000 Ericsson Drive, Warrendale, PA 15086-7561; Attention: Mutual Fund Board. As of December 31, 2014, the Trust comprised 14 portfolio(s), and the Federated Fund Family consisted of 40 investment companies (comprising 131 portfolios). Unless otherwise noted, each Officer is elected annually. Unless otherwise noted, each Trustee oversees all portfolios in the Federated Fund Family and serves for an indefinite term. The Fund's Statement of Additional Information includes additional information about Trust Trustees and is available, without charge and upon request, by calling 1-800-341-7400.
Interested Trustees Background
Name
Birth Date
Positions Held with Trust
Date Service Began | Principal Occupation(s) for Past Five Years,
Other Directorships Held and Previous Position(s) |
John F. Donahue*
Birth Date: July 28, 1924
Trustee
Indefinite Term
Began serving: April 1984 | Principal Occupations: Director or Trustee of the Federated Fund Family; Chairman and Director, Federated Investors, Inc.; Chairman of the Federated Fund Family's Executive Committee.
Previous Positions: Chairman of the Federated Fund Family; Trustee, Federated Investment Management Company; Chairman and Director, Federated Investment Counseling. |
J. Christopher Donahue*
Birth Date: April 11, 1949
President and Trustee
Indefinite Term
Began serving: January 2000 | Principal Occupations: Principal Executive Officer and President of certain of the Funds in the Federated Fund Family; Director or Trustee of the Funds in the Federated Fund Family; President, Chief Executive Officer and Director, Federated Investors, Inc.; Chairman and Trustee, Federated Investment Management Company; Trustee, Federated Investment Counseling; Chairman and Director, Federated Global Investment Management Corp.; Chairman, Federated Equity Management Company of Pennsylvania and Passport Research, Ltd. (investment advisory subsidiary of Federated); Trustee, Federated Shareholder Services Company; Director, Federated Services Company.
Previous Positions: President, Federated Investment Counseling; President and Chief Executive Officer, Federated Investment Management Company, Federated Global Investment Management Corp. and Passport Research, Ltd. |
| * | Family relationships and reasons for “interested” status: John F. Donahue is the father of J. Christopher Donahue; both are “interested” due to their beneficial ownership of shares of Federated Investors, Inc. and the positions they hold with Federated and its subsidiaries. |
Annual Shareholder Report
INDEPENDENT Trustees Background
Name
Birth Date
Positions Held with Trust
Date Service Began | Principal Occupation(s) for Past Five Years,
Other Directorships Held, Previous Position(s) and Qualifications |
John T. Collins
Birth Date: January 24, 1947
Trustee
Indefinite Term
Began serving: October 2013 | Principal Occupations: Director or Trustee of the Federated Fund Family; Chairman and CEO, The Collins Group, Inc. (a private equity firm).
Other Directorships Held: Director, Chair of the Compensation Committee, Audit Committee member, KLX Corp.
Qualifications: Mr. Collins has served in several business and financial management roles and directorship positions throughout his career. Mr. Collins serves as Chairman Emeriti, Bentley University. Mr. Collins previously served as Director, FleetBoston Financial Corp.; Director and Audit Committee Member, Bank of America Corp. and Director, Beth Israel Deaconess Medical Center (Harvard University Affiliate Hospital). |
G. Thomas Hough
Birth Date: February 28, 1955
Trustee
Indefinite Term
Began serving: August 2015 | Principal Occupations: Director or Trustee of the Federated Fund Family; Retired.
Other Directorships Held: Director, Chair of the Audit Committee, Governance Committee, Publix Super Markets, Inc.
Qualifications: Mr. Hough has served in accounting, business management and directorship positions throughout his career. Mr. Hough most recently held the position of Americas Vice Chair of Assurance with Ernst & Young LLP. Mr. Hough is an Executive Committee member of the United States Golf Association, he serves on the President's Cabinet and Business School Board of Visitors for the University of Alabama and is on the Business School Board of Visitors for Wake Forest University. |
Maureen Lally-Green
Birth Date: July 5, 1949
Trustee
Indefinite Term
Began serving: August 2009 | Principal Occupations: Director or Trustee of the Federated Fund Family; Adjunct Professor of Law, Duquesne University School of Law.
Other Directorships Held: Director, CONSOL Energy Inc.
Qualifications: Judge Lally-Green has served in various legal and business roles and directorship positions throughout her career. Judge Lally-Green previously served as: Associate General Secretary, Diocese of Pittsburgh; Professor of Law, Duquesne University School of Law and was a member of the Superior Court of Pennsylvania. Judge Lally-Green also holds the positions of: Member, Pennsylvania State Board of Education; Director, Saint Vincent College; Director and Chair, UPMC Mercy Hospital; Regent, St. Vincent Seminary; Director, Epilepsy Foundation of Western and Central Pennsylvania; Director, Our Campaign for the Church Alive!, Inc.; Director, Pennsylvania Bar Institute; and Director, Cardinal Wuerl North Catholic High School, Inc. Judge Lally-Green has held the positions of: Director, Auberle; Director, Ireland Institute of Pittsburgh; Director, Saint Thomas More Society; and Director, Catholic High Schools of the Diocese of Pittsburgh, Inc. |
Annual Shareholder Report
Name
Birth Date
Positions Held with Trust
Date Service Began | Principal Occupation(s) for Past Five Years,
Other Directorships Held, Previous Position(s) and Qualifications |
Peter E. Madden
Birth Date: March 16, 1942
Trustee
Indefinite Term
Began serving: November 1991 | Principal Occupation: Director or Trustee, and Chair of the Board of Directors or Trustees, of the Federated Fund Family; Retired.
Other Directorships Held: None.
Qualifications: Mr. Madden has served in several business management, mutual fund services and directorship positions throughout his career. Mr. Madden previously served as President, Chief Operating Officer and Director, State Street Bank and Trust Company (custodian bank) and State Street Corporation (financial services). He was Director, VISA USA and VISA International and Chairman and Director, Massachusetts Bankers Association. Mr. Madden served as Director, Depository Trust Corporation and Director, The Boston Stock Exchange. Mr. Madden also served as a Representative to the Commonwealth of Massachusetts General Court. |
Charles F. Mansfield, Jr.
Birth Date: April 10, 1945
Trustee
Indefinite Term
Began serving: January 1999 | Principal Occupations: Director or Trustee of the Federated Fund Family; Management Consultant.
Other Directorships Held: None.
Qualifications: Mr. Mansfield has served in several banking, business management and educational roles and directorship positions throughout his career. Mr. Mansfield previously served as Chief Executive Officer, PBTC International Bank; Partner, Arthur Young & Company (now Ernst & Young LLP); Chief Financial Officer of Retail Banking Sector, Chase Manhattan Bank; Senior Vice President, HSBC Bank USA (formerly, Marine Midland Bank); Vice President, Citibank; Assistant Professor of Banking and Finance, Frank G. Zarb School of Business, Hofstra University; Executive Vice President DVC Group, Inc. (marketing, communications and technology). |
Thomas M. O'Neill
Birth Date: June 14, 1951
Trustee
Indefinite Term
Began serving: October 2006 | Principal Occupations: Director or Trustee, Vice Chair of the Audit Committee of the Federated Fund Family; Sole Proprietor, Navigator Management Company (investment and strategic consulting).
Other Directorships Held: None.
Qualifications: Mr. O'Neill has served in several business, mutual fund and financial management roles and directorship positions throughout his career. Mr. O'Neill serves as Director, Medicines for Humanity and Director, The Golisano Children's Museum of Naples, Florida. Mr. O'Neill previously served as Chief Executive Officer and President, Managing Director and Chief Investment Officer, Fleet Investment Advisors; President and Chief Executive Officer, Aeltus Investment Management, Inc.; General Partner, Hellman, Jordan Management Co., Boston, MA; Chief Investment Officer, The Putnam Companies, Boston, MA; Credit Analyst and Lending Officer, Fleet Bank; Director and Consultant, EZE Castle Software (investment order management software); and Director, Midway Pacific (lumber). |
Annual Shareholder Report
Name
Birth Date
Positions Held with Trust
Date Service Began | Principal Occupation(s) for Past Five Years,
Other Directorships Held, Previous Position(s) and Qualifications |
P. Jerome Richey
Birth Date: February 23, 1949
Trustee
Indefinite Term
Began serving: October 2013 | Principal Occupations: Director or Trustee of the Federated Fund Family; Management Consultant.
Other Directorships Held: None.
Qualifications: Mr. Richey has served in several business and legal management roles and directorship positions throughout his career. Mr. Richey most recently held the positions of Senior Vice Chancellor and Chief Legal Officer, University of Pittsburgh. Mr. Richey serves as Board Member, Epilepsy Foundation of Western Pennsylvania and Board member, World Affairs Council of Pittsburgh. Mr. Richey previously served as Chief Legal Officer and Executive Vice President, CONSOL Energy Inc. and Shareholder, Buchanan Ingersoll & Rooney PC (a law firm). |
John S. Walsh
Birth Date: November 28, 1957
Trustee
Indefinite Term
Began serving: January 1999 | Principal Occupations: Director or Trustee, Chair of the Audit Committee of the Federated Fund Family; President and Director, Heat Wagon, Inc. (manufacturer of construction temporary heaters); President and Director, Manufacturers Products, Inc. (distributor of portable construction heaters); President, Portable Heater Parts, a division of Manufacturers Products, Inc.
Other Directorships Held: None.
Qualifications: Mr. Walsh has served in several business management roles and directorship positions throughout his career. Mr. Walsh previously served as Vice President, Walsh & Kelly, Inc. (paving contractors). |
OFFICERS
Name
Birth Date
Address
Positions Held with Trust
Date Service Began | Principal Occupation(s) for Past Five Years
and Previous Position(s) |
John W. McGonigle
Birth Date: October 26, 1938
EXECUTIVE VICE PRESIDENT AND SECRETARY
Officer since: April 1984 | Principal Occupations: Executive Vice President and Secretary of the Federated Fund Family; Vice Chairman, Executive Vice President, Secretary and Director, Federated Investors, Inc.
Previous Positions: Trustee, Federated Investment Management Company and Federated Investment Counseling; Director, Federated Global Investment Management Corp., Federated Services Company and Federated Securities Corp. |
Annual Shareholder Report
Name
Birth Date
Address
Positions Held with Trust
Date Service Began | Principal Occupation(s) for Past Five Years
and Previous Position(s) |
Lori A. Hensler
Birth Date: January 6, 1967
TREASURER
Officer since: April 2013 | Principal Occupations: Principal Financial Officer and Treasurer of the Federated Fund Family; Senior Vice President, Federated Administrative Services; Financial and Operations Principal for Federated Securities Corp. and Edgewood Services, Inc.; and Assistant Treasurer, Federated Investors Trust Company. Ms. Hensler has received the Certified Public Accountant designation.
Previous Positions: Controller of Federated Investors, Inc.; Senior Vice President and Assistant Treasurer, Federated Investors Management Company; Treasurer, Federated Investors Trust Company; Assistant Treasurer, Federated Administrative Services, Federated Administrative Services, Inc., Federated Securities Corp., Edgewood Services, Inc., Federated Advisory Services Company, Federated Equity Management Company of Pennsylvania, Federated Global Investment Management Corp., Federated Investment Counseling, Federated Investment Management Company, Passport Research, Ltd., and Federated MDTA, LLC; Financial and Operations Principal for Federated Securities Corp., Edgewood Services, Inc. and Southpointe Distribution Services, Inc. |
Richard B. Fisher
Birth Date: May 17, 1923
VICE PRESIDENT
Officer since: April 1987 | Principal Occupations: Vice Chairman or Vice President of some of the Funds in the Federated Fund Family; Vice Chairman, Federated Investors, Inc.; Chairman, Federated Securities Corp.
Previous Positions: President and Director or Trustee of some of the Funds in the Federated Fund Family; Executive Vice President, Federated Investors, Inc.; Director and Chief Executive Officer, Federated Securities Corp. |
Peter J. Germain
Birth Date: September 3, 1959
CHIEF LEGAL OFFICER
Officer since: January 2005 | Principal Occupations: Mr. Germain is Chief Legal Officer of the Federated Fund Family. He is General Counsel and Vice President, Federated Investors, Inc.; President, Federated Administrative Services and Federated Administrative Services, Inc.; Vice President, Federated Securities Corp.; Secretary, Federated Private Asset Management, Inc.; and Secretary, Retirement Plan Service Company of America. Mr. Germain joined Federated in 1984 and is a member of the Pennsylvania Bar Association.
Previous Positions: Deputy General Counsel, Special Counsel, Managing Director of Mutual Fund Services, Federated Investors, Inc.; Senior Vice President, Federated Services Company; and Senior Corporate Counsel, Federated Investors, Inc. |
Stephen Van Meter
Birth Date: June 5, 1975
CHIEF COMPLIANCE OFFICER AND SENIOR VICE PRESIDENT
Officer since: July 2015 | Principal Occupations: Senior Vice President and Chief Compliance Officer of the Federated Fund Family; Vice President and Chief Compliance Officer of Federated Investors, Inc. and Chief Compliance Officer of certain of its subsidiaries. Mr. Van Meter joined Federated in October 2011. He holds FINRA licenses under Series 3, 7, 24 and 66.
Previous Positions: Mr. Van Meter previously held the position of Compliance Operating Officer, Federated Investors, Inc. Prior to joining Federated, Mr. Van Meter served at the United States Securities and Exchange Commission in the positions of Senior Counsel, Office of Chief Counsel, Division of Investment Management and Senior Counsel, Division of Enforcement. |
Annual Shareholder Report
Name
Birth Date
Address
Positions Held with Trust
Date Service Began | Principal Occupation(s) for Past Five Years
and Previous Position(s) |
Stephen F. Auth
Birth Date: September 3, 1956
101 Park Avenue
41st Floor
New York, NY 10178
CHIEF INVESTMENT OFFICER
Officer since: November 2002 | Principal Occupations: Stephen F. Auth is Chief Investment Officer of various Funds in the Federated Fund Family; Executive Vice President, Federated Investment Counseling, Federated Global Investment Management Corp. and Federated Equity Management Company of Pennsylvania.
Previous Positions: Executive Vice President, Federated Investment Management Company and Passport Research, Ltd. (investment advisory subsidiary of Federated); Senior Vice President, Global Portfolio Management Services Division; Senior Vice President, Federated Investment Management Company and Passport Research, Ltd.; Senior Managing Director and Portfolio Manager, Prudential Investments. |
Annual Shareholder Report
Evaluation and Approval of Advisory Contract–May 2015
Federated Kaufmann Small Cap Fund (the “Fund”)
Following a review and recommendation of approval by the Fund's independent trustees, the Fund's Board reviewed and approved at its May 2015 meetings the Fund's investment advisory and subadvisory contracts for an additional one-year term. The Board's decision regarding these contracts reflects the exercise of its business judgment on whether to continue the existing arrangements.
In this connection, the Federated Funds' Board had previously appointed a Senior Officer, whose duties include specified responsibilities relating to the process by which advisory fees are to be charged to a Federated fund. The Senior Officer has the authority to retain consultants, experts, or staff as may be reasonably necessary to assist in the performance of his duties, reports directly to the Board, and may be terminated only with the approval of a majority of the independent members of the Board. The Senior Officer prepared and furnished to the Board an independent, written evaluation that covered topics discussed below (the “Evaluation”). The Board considered that Evaluation, along with other information, in deciding to approve the advisory and subadvisory contracts.
The Board is also familiar with and considered judicial decisions concerning allegedly excessive investment advisory fees, which have indicated that the following factors may be relevant to an Adviser's fiduciary duty with respect to its receipt of compensation from a fund: the nature and quality of the services provided by the Adviser to a fund and its shareholders, including the performance and expenses of the fund and of comparable funds; the Adviser's cost of providing the services, including the profitability to the Adviser of providing advisory services to a fund; the extent to which the Adviser may realize “economies of scale” as a fund grows larger and, if such economies of scale exist, whether they have been shared with a fund and its shareholders or the family of funds; any “fall-out financial benefits” that accrue to the Adviser because of its relationship with a fund (including research services received from brokers that execute fund trades and any fees paid to affiliates of the Adviser for services rendered to a fund); comparative fee structures, including a comparison of fees paid to the Adviser with those paid by similar funds; and the extent of care, conscientiousness and independence with which the Board members perform their duties and their expertise, including whether they are fully informed about all facts the Board deems relevant to its consideration of the Adviser's services and fees. The Board noted that SEC disclosure requirements regarding the basis for the Board's approval of the Fund's advisory contract generally track the factors listed above. Consistent with these judicial decisions and SEC disclosure requirements, the Board also considered management fees charged to institutional and other clients of the Adviser and subadviser for what
Annual Shareholder Report
might be viewed as like services. The Board was aware of these factors and was guided by them in its review of the Fund's advisory and subadvisory contracts to the extent it considered them to be appropriate and relevant, as discussed further below.
The Board considered and weighed these circumstances in light of its substantial accumulated experience in governing the Fund and working with Federated on matters relating to the Federated funds, and was assisted in its deliberations by independent legal counsel. Throughout the year, and in connection with its May meetings, the Board requested and received substantial and detailed information about the Fund and the Federated organization that was in addition to the extensive materials that comprise and accompany the Senior Officer's Evaluation. Federated provided much of this information at each regular meeting of the Board, and furnished additional substantial information in connection with the May meeting at which the Board's formal review of the advisory and subadvisory contracts occurred. At this May meeting, senior management of the Adviser also met with the independent trustees and their counsel to discuss the materials presented and any other matters thought relevant by the Adviser or the trustees. Between regularly scheduled meetings, the Board also received information on particular matters as the need arose. Thus, the Board's consideration of the advisory and subadvisory contracts included review of the Senior Officer's Evaluation, accompanying data and additional information covering such matters as: the Adviser's and subadviser's investment philosophy, revenue, profitability, personnel and processes; investment and operating strategies; the Fund's short- and long-term performance (in absolute terms, both on a gross basis and net of expenses, as well as in relationship to its particular investment program and certain competitor or “peer group” funds and/or other benchmarks, as appropriate), and comments on the reasons for performance; the Fund's investment objectives; the Fund's expenses (including the advisory fee itself and the overall expense structure of the Fund, both in absolute terms and relative to similar and/or competing funds, with due regard for contractual or voluntary expense limitations); the use and allocation of brokerage commissions derived from trading the Fund's portfolio securities (if any); and the nature, quality and extent of the advisory and other services provided to the Fund by the Adviser and its affiliates. The Board also considered the preferences and expectations of Fund shareholders; the entrepreneurial risk assumed by the Adviser in sponsoring the funds; the continuing state of competition in the mutual fund industry and market practices; the range of comparable fees for similar funds in the mutual fund industry; the Fund's relationship to the Federated family of funds which include a comprehensive array of funds with different investment objectives, policies and strategies which are available for exchange without the incurrence of additional sales charges; compliance and audit reports concerning the Federated funds and the Federated companies that service them (including communications from regulatory agencies), as well as Federated's responses to any issues raised therein;
Annual Shareholder Report
and relevant developments in the mutual fund industry and how the Federated funds and/or Federated are responding to them. The Board also considered that the longevity and experience of the Fund's portfolio management team and their unique approach to investing may limit the utility of comparisons to other equity mutual funds. The Board's evaluation process is evolutionary. The criteria considered and the emphasis placed on relevant criteria change in recognition of changing circumstances in the mutual fund marketplace.
While mindful that courts have cautioned against giving such comparisons too much weight, the Board has found the use of comparisons of the Fund's fees and expenses to other mutual funds with comparable investment programs to be relevant. In this regard, the Board was presented with, and considered, information regarding the contractual advisory fee rates, net advisory fee rates and total expense ratios relative to a fund's peers. The Board focused on comparisons with other similar mutual funds more heavily than non-mutual fund products or services because it is believed that they are more relevant. For example, other mutual funds are the products most like the Fund, they are readily available to Fund shareholders as alternative investment vehicles, and they are the type of investment vehicle in fact chosen and maintained by the Fund's investors. The range of their fees and expenses therefore appears to be a relevant indicator of what consumers have found to be reasonable in the precise marketplace in which the Fund competes.
The Board reviewed the contractual advisory fee rate and other expenses of the Fund and noted the position of the Fund's fee rates relative to its peers. In this regard, the Board noted that the contractual advisory fee rate was above the median of the relevant peer group, but the Board noted the applicable waivers and reimbursements and that the overall expense structure of the Fund remained competitive. The Board will continue to monitor advisory fees and other expenses borne by the Fund in the context of the other factors considered relevant by the Board.
By contrast, the Senior Officer has reviewed Federated's fees for providing advisory services to products outside the Federated family of funds (e.g., institutional and separate accounts and sub-adviser services). He concluded that mutual funds and institutional accounts are inherently different products. Those differences include, but are not limited to, different types of targeted investors; being subject to different laws and regulations; different legal structures; different average account sizes and portfolio management techniques made necessary by different cash flows and different associated costs; and the time spent by portfolio managers and their teams, funds financial services, legal, compliance and risk management in reviewing securities pricing, addressing different administrative responsibilities, addressing different degrees of risk associated with management and a variety of different costs. The Senior Officer did not consider these fee schedules to be determinative in judging the appropriateness of mutual fund advisory fees.
Annual Shareholder Report
The Senior Officer noted that the services, administrative responsibilities and risks associated with such relationships are quite different than serving as a primary adviser to a fund. The Senior Officer noted that the same group that manages the Federated Kaufmann Small Cap Fund did manage a similarly managed sub-advised fund for a lesser fee. However, the Senior Officer noted that the relationship with this similarly managed sub-advised fund was terminated during the fourth quarter of 2014.
The Fund's ability to deliver competitive performance when compared to its peer group was also deemed to be relevant by the Board as a useful indicator of how the Adviser is executing the Fund's investment program, which in turn was one of the Board's considerations in reaching a conclusion that the nature, extent, and quality of the Adviser's investment management services were such as to warrant continuation of the advisory and subadvisory contracts.
The Senior Officer reviewed information compiled by Federated, using data supplied by independent fund ranking organizations, regarding the performance of, and fees charged by, other mutual funds, noting his view that comparisons to fund peer groups may be helpful, though not conclusive, in judging the reasonableness of the proposed fees. The Board considered, in evaluating such comparisons, that in some cases individual funds may exhibit significant and unique differences in their objectives and management techniques when compared to other funds within an industry peer group.
For the periods covered by the Evaluation, the Fund's performance for the one-year and three-year periods was above the median of the relevant peer group, and the Fund's performance fell below the median of the relevant peer group for the five-year period. The Board discussed the Fund's performance with the Adviser and recognized the efforts being undertaken by the Adviser. The Board will continue to monitor these efforts and the performance of the Fund in the context of the other factors considered relevant by the Board.
The Board also received financial information about Federated, including information regarding the compensation and benefits Federated derived from its relationships with the Federated funds. This information covered not only the fees under the advisory contracts, but also fees received by Federated's subsidiaries for providing other services to the Federated funds under separate contracts (e.g., for serving as the Federated funds' administrator). The information also detailed any indirect benefit Federated may derive from its receipt of research services from brokers who execute Federated fund trades. In addition, the Board considered the fact that, in order for a fund to be competitive in the marketplace, Federated and its affiliates frequently waived fees and/or reimbursed expenses and have disclosed to fund investors and/or indicated to the Board their intention to do so in the future, where appropriate. Moreover, the Board receives regular reporting as to the institution, adjustment or elimination of these voluntary waivers.
Annual Shareholder Report
In addition, over the past two years, following discussions regarding the Senior Officer's recommendations, Federated made meaningful reductions to the contractual advisory fees for several Funds. The Board noted that in May 2014, the Senior Officer proposed, and the Board subsequently approved, a reduction in the contractual advisory fee to more closely align the contractual fee with the net fee actually charged after the imposition of applicable voluntary waivers which was believed by both the Senior Officer and the Board to improve the market competitiveness of the Fund. At the May 2015 Meetings, Federated proposed and the Board approved reductions to the subadvisory fees under the subadvisory contract for the Fund, effective as of the date of the previous contractual advisory fee reduction. Formerly, the contractual subadvisory fee was 1.175%. The new subadvisory fee will be 1.066%. This sub-advisory fee represents 82% of the current gross advisory fee of 1.30%.
Federated furnished information, requested by the Senior Officer, that reported revenues on a fund-by-fund basis and made estimates of the allocation of expenses on a fund-by-fund basis, using allocation methodologies specified by the Senior Officer. The Senior Officer noted that, while these cost allocation reports apply consistent allocation processes, the inherent difficulties in allocating costs continues to cause the Senior Officer to question the precision of the process and to conclude that such reports may be unreliable, since a single change in an allocation estimate may dramatically alter the resulting estimate of cost and/or profitability of a fund and may produce unintended consequences. The allocation information, including the Senior Officer's view that fund-by-fund estimations may be unreliable, was considered in the analysis by the Board.
The Board and the Senior Officer also reviewed information compiled by Federated comparing profitability information for Federated to other publicly held fund management companies. In this regard, the Senior Officer concluded that Federated's profit margins did not appear to be excessive. The Senior Officer also noted that Federated appeared financially sound, with the resources to fulfill its obligations under its contracts with the Funds.
The Senior Officer's Evaluation also discussed the notion of possible realization of “economies of scale” as a fund grows larger. The Board considered in this regard that the Adviser has made significant and long-term investments in areas that support all of the Federated family of funds, such as personnel and processes for the portfolio management, shareholder services, compliance, internal audit, and risk management functions; and systems technology; and that the benefits of these efforts (as well as any economies of scale, should they exist) were likely to be enjoyed by the fund family as a whole. Federated, as it does throughout the year, and again in connection with the Board's review, furnished information relative to revenue sharing or adviser paid fees. Federated and the Senior Officer noted that this information should be viewed to determine if there was an incentive to either not apply breakpoints or to apply breakpoints at higher levels and should not be viewed to determining the appropriateness of advisory fees, because it would represent marketing and distribution expenses.
Annual Shareholder Report
Finally, the Board also noted the absence of any applicable regulatory or industry guidelines on this subject, which (as discussed in the Senior Officer's Evaluation) is compounded by the lack of any common industry practice or general pattern with respect to structuring fund advisory fees with “breakpoints” that serve to reduce the fee as the fund attains a certain size.
The Senior Officer noted that, subject to the comments and recommendations made within his Evaluation, his observations and the information accompanying the Evaluation supported a finding by the Board that the management fees for each of the funds were reasonable. Under these circumstances, other than the reduction in the sub-advisory fee noted above, no changes were recommended to, and no objection was raised to, the continuation of the Fund's advisory and subadvisory contracts.
In its decision to continue an existing investment advisory contract, the Board was mindful of the potential disruptions of the Fund's operations and various risks, uncertainties and other effects that could occur as a result of a decision to terminate or not renew an advisory contract. In particular, the Board recognized that many shareholders have invested in the Fund on the strength of the Adviser's industry standing and reputation and with the expectation that the Adviser will have a continuing role in providing advisory services to the Fund. Thus, the Board's approval of the advisory and subadvisory contracts reflected the fact that it is the shareholders who have effectively selected the Adviser by virtue of having invested in the Fund. The Board concluded that, in light of the factors discussed above, including the nature, quality and scope of the services provided to the Fund by the Adviser and its affiliates, continuation of the advisory contract was appropriate.
The Board based its decision to approve the advisory and subadvisory contracts on the totality of the circumstances and relevant factors and with a view to past and future long-term considerations. Not all of the factors and considerations identified above were necessarily relevant to the Fund, nor did the Board consider any one of them to be determinative. With respect to the factors that were relevant, the Board's decision to approve the contract reflects its determination that Federated's performance and actions provided a satisfactory basis to support the decision to continue the existing arrangements.
Annual Shareholder Report
Voting Proxies on Fund Portfolio Securities
A description of the policies and procedures that the Fund uses to determine how to vote proxies, if any, relating to securities held in the Fund's portfolio is available, without charge and upon request, by calling 1-800-341-7400. A report on “Form N-PX” of how the Fund voted any such proxies during the most recent 12-month period ended June 30 is available via the Proxy Voting Record (Form N-PX) link associated with the Fund and share class name at www.FederatedInvestors.com/FundInformation. Form N-PX filings are also available at the SEC's website at www.sec.gov.
Quarterly Portfolio Schedule
The Fund files with the SEC a complete schedule of its portfolio holdings, as of the close of the first and third quarters of its fiscal year, on “Form N-Q.” These filings are available on the SEC's website at www.sec.gov and may be reviewed and copied at the SEC's Public Reference Room in Washington, DC. (Call 1-800-SEC-0330 for information on the operation of the Public Reference Room.) You may also access this information via the link to the Fund and share class name at www.FederatedInvestors.com/FundInformation.
Annual Shareholder Report
Mutual funds are not bank deposits or obligations, are not guaranteed by any bank and are not insured or guaranteed by the U.S. government, the Federal Deposit Insurance Corporation, the Federal Reserve Board or any other government agency. Investment in mutual funds involves investment risk, including the possible loss of principal.
This Report is authorized for distribution to prospective investors only when preceded or accompanied by the Fund's Prospectus, which contains facts concerning its objective and policies, management fees, expenses and other information.
Federated Kaufmann Small Cap Fund
Federated Investors Funds
4000 Ericsson Drive
Warrendale, PA 15086-7561
Contact us at FederatedInvestors.com
or call 1-800-341-7400.
Federated Securities Corp., Distributor
CUSIP 314172636
CUSIP 314172628
CUSIP 314172610
CUSIP 314172537
29503 (12/15)
Federated is a registered trademark of Federated Investors, Inc.
2015 ©Federated Investors, Inc.
Annual Shareholder Report
October 31, 2015
| Share Class | Ticker |
| A | FGSAX |
| B | FGSBX |
| C | FGSCX |
| R | FGSKX |
| Institutional | FGSIX |
Federated MDT Mid Cap Growth Strategies Fund
Fund Established 1984
A Portfolio of Federated Equity Funds
Dear Valued Shareholder,
I am pleased to present the Annual Shareholder Report for your fund covering the period from November 1, 2014 through October 31, 2015. This report includes Management's Discussion of Fund Performance, a complete listing of your fund's holdings, performance information and financial statements along with other important fund information.
In addition, our website, FederatedInvestors.com, offers easy access to Federated resources that include timely fund updates, economic and market insights from our investment strategists, and financial planning tools. We invite you to register to take full advantage of its capabilities.
Thank you for investing with Federated. I hope you find this information useful and look forward to keeping you informed.
Sincerely,
J. Christopher Donahue, President
Not FDIC Insured • May Lose Value • No Bank Guarantee
CONTENTS
| 1 |
| 6 |
| 8 |
| 14 |
| 19 |
| 21 |
| 22 |
| 23 |
| 35 |
| 36 |
| 38 |
| 44 |
| 50 |
| 50 |
Management's Discussion of Fund Performance (unaudited)
The total return of Federated MDT Mid Cap Growth Strategies Fund (the “Fund”), based on net asset value for the 12-month reporting period ended October 31, 2015, was 1.96% for the Class A Shares, 1.17% for the Class B Shares, 1.18% for the Class C Shares, 1.49% for the Class R Shares and 2.19% for the Institutional Shares. The total return of the Russell Midcap® Growth Index (RMCGI),1,2 the Fund's broad-based securities market index, was 4.94% for the same period. The total return of the Morningstar Mid Cap Growth Funds Average (MMCGFA),3 a peer group average for the Fund, was 3.00% during the reporting period. The Fund's and the MMCGFA's total returns for the most recently completed fiscal year reflected actual cash flows, transaction costs and other expenses which were not reflected in the total return of the RMCGI.
During the reporting period, the Fund's investment strategy focused on stock selection, which was the most significant factor affecting the Fund's performance relative to the RMCGI.
The following discussion will focus on the performance of the Fund's Institutional Shares during the reporting period.
MARKET OVERVIEW
The reporting period favored large-cap stocks the most (the Russell Top 200® Index4 returned 5.75%), followed by mid-cap stocks with the Russell Midcap® Index (RMCI)5 returning 2.77%. Small-cap stocks were neutral, with the Russell 2000® Index6 returning 0.34%. Within the RMCI during the reporting period, growth outperformed value as the RMCGI returned 4.94% while the Russell Midcap® Value Index7 returned 0.47%.
The best performing sectors in the RMCGI during the reporting period were Health Care (10.91%), Consumer Staples (10.79%) and Information Technology (8.62%). Underperforming sectors during the same period included Energy (-34.68%) and Utilities (-22.29%).
Annual Shareholder Report
STOCK SELECTION
Stock selection based on fundamentals was the biggest contributor to the Fund's underperformance of the RMCGI during the reporting period. The Fund looked for stocks with the specific combinations of fundamentals that internal research has shown to predict outperformance relative to the RMCGI. During this reporting period, the most important combination of fundamentals was a low requirement for external financing paired with high earnings to price and/or high structural earnings, a proprietary measure which is used by the Fund to find stocks with high repeatable earnings potential. The mid-cap growth stocks in the Fund with these relatively strong value characteristics underperformed the RMCGI. Additional underperformance came from stocks with moderate value characteristics and low earnings estimate momentum. These stocks were held primarily for diversification purposes. The stocks in the Fund with the same limited requirement for external financing paired with positive earnings estimate momentum instead of high structural earnings provided a favorable offset to the underperformance.
The Consumer Discretionary sector followed by the Financials sector contributed the most to the Fund's underperformance versus the RMCGI. All of the underperformance in these sectors was driven by poor stock selection based on fundamentals rather than by sector selection, as the Fund is roughly sector-neutral. Favorable stock selection in the Energy sector partially offset the underperformance.
Individual stocks enhancing the Fund's performance included Electronic Arts Incorporated, Cameron International Corporation and Kroger Company. All of these stocks outperformed the RMCGI during the reporting period and were overweighted relative to the RMCGI. Individual stocks detracting from the Fund's performance during the reporting period included Credit Acceptance Corporation, Fossil Group Incorporated, Apollo Group Incorporated and Gap Incorporated, which all underperformed the benchmark.
Annual Shareholder Report
| 1 | Please see the footnotes to the line graphs below for definitions of, and further information about, the RMCGI. |
| 2 | Mid-Capitalization companies often have narrower markets and limited managerial and financial resources compared to larger and more established companies. |
| 3 | Please see the footnotes to the line graphs below for definitions of, and further information about, the MMCGFA. |
| 4 | The Russell Top 200® Index measures the performance of the largest cap segment of the U.S. equity universe. The Russell Top 200® Index is a subset of the Russell 3000® Index. It includes approximately 200 of the largest securities based on a combination of their market cap and current index membership and represents approximately 68% of the U.S. market. The Russell Top 200® Index is constructed to provide a comprehensive and unbiased barometer for this very large cap segment and is completely reconstituted annually to ensure new and growing equities are reflected. The index is unmanaged, and it is not possible to invest directly in an index. |
| 5 | The Russell Midcap® Index measures the performance of the mid-cap segment of the U.S. equity universe. The Russell Midcap® Index is a subset of the Russell 1000® Index. It includes approximately 800 of the smallest securities based on a combination of their market cap and current index membership. The Russell Midcap® Index represents approximately 31% of the total market capitalization of the Russell 1000® companies. The Russell Midcap® Index is constructed to provide a comprehensive and unbiased barometer for the mid-cap segment and is completely reconstituted annually to ensure larger stocks do not distort the performance and characteristics of the true mid-cap opportunity set. The index is unmanaged, and it is not possible to invest directly in an index. |
| 6 | The Russell 2000® Index measures the performance of the small-cap segment of the U.S. equity universe. The Russell 2000® Index is a subset of the Russell 3000® Index representing approximately 10% of the total market capitalization of that index. It includes approximately 2000 of the smallest securities based on a combination of their market cap and current index membership. The Russell 2000® is constructed to provide a comprehensive and unbiased small-cap barometer and is completely reconstituted annually to ensure larger stocks do not distort the performance and characteristics of the true small-cap opportunity set. The index is unmanaged, and it is not possible to invest directly in an index. |
| 7 | The Russell Midcap® Value Index measures the performance of the mid-cap value segment of the U.S. equity universe. It includes those Russell Midcap Index companies with lower price-to-book ratios and lower forecasted growth values. The Russell Midcap® Value Index is constructed to provide a comprehensive and unbiased barometer of the mid-cap value market and is completely reconstituted annually to ensure larger stocks do not distort the performance and characteristics of the true mid-cap value market. The index is unmanaged, and it is not possible to invest directly in an index. |
Annual Shareholder Report
FUND PERFORMANCE AND GROWTH OF A $10,000 INVESTMENT
The graph below illustrates the hypothetical investment of $10,0001 in the Federated MDT Mid Cap Growth Strategies Fund2 from October 31, 2005 to October 31, 2015, compared to the Russell Midcap® Growth Index (RMCGI)3 and the Morningstar Mid Cap Growth Funds Average (MMCGFA).4 The Average Annual Total Return table below shows returns for each class averaged over the stated periods.
Growth of a $10,000 Investment
Growth of $10,000 as of October 31, 2015
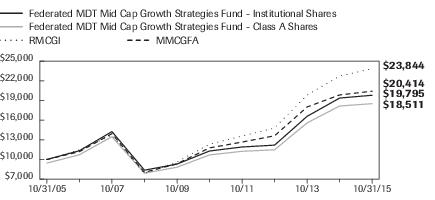
| Federated MDT Mid Cap Growth Strategies Fund - | Institutional Shares | Class A Shares | RMCGI | MMCGFA |
| F | F | I | I |
| 10/31/2005 | 10,000 | 9,450 | 10,000 | 10,000 |
| 10/31/2006 | 11,337 | 10,717 | 11,451 | 11,194 |
| 10/31/2007 | 14,249 | 13,473 | 13,709 | 13,938 |
| 10/31/2008 | 8,371 | 7,921 | 7,862 | 8,039 |
| 10/31/2009 | 9,299 | 8,817 | 9,630 | 9,344 |
| 10/31/2010 | 11,295 | 10,695 | 12,329 | 11,768 |
| 10/31/2011 | 11,908 | 11,246 | 13,572 | 12,655 |
| 10/31/2012 | 12,190 | 11,484 | 14,806 | 13,616 |
| 10/31/2013 | 16,584 | 15,583 | 19,830 | 18,009 |
| 10/31/2014 | 19,370 | 18,154 | 22,723 | 19,843 |
| 10/31/2015 | 19,795 | 18,511 | 23,844 | 20,414 |
41 graphic description end -->
| ■ | Total returns shown for the Class A Shares include the maximum sales charge of 5.50% ($10,000 investment minus $550 sales charge = $9,450). |
The Fund offers multiple share classes whose performance may be greater than or less than its other share class(es) due to differences in sales charges and expenses. See the Average Annual Total Return table below for the returns of additional classes not shown in the line graph above.
Average Annual Total Returns for the Period Ended 10/31/2015
(returns reflect all applicable sales charges and contingent deferred sales charges as specified below in footnote #1)
| | 1 Year | 5 Years | 10 Years |
| Class A Shares | -3.65% | 10.34% | 6.35% |
| Class B Shares | -3.49% | 10.49% | 6.31% |
| Class C Shares | 0.33% | 10.77% | 6.15% |
| Class R Shares | 1.49% | 11.06% | 6.46% |
| Institutional Shares | 2.19% | 11.87% | 7.07% |
| RMCGI | 4.94% | 14.10% | 9.08 % |
| MMCGFA | 3.00% | 12.00% | 7.98% |
Annual Shareholder Report
Performance data quoted represents past performance which is no guarantee of future results. Investment return and principal value will fluctuate so that an investor's shares, when redeemed, may be worth more or less than their original cost. Mutual fund performance changes over time and current performance may be lower or higher than what is stated. For current to the most recent month-end performance and after-tax returns, visit FederatedInvestors.com or call 1-800-341-7400. Returns shown do not reflect the deduction of taxes that a shareholder would pay on Fund distributions or the redemption of Fund shares. Mutual funds are not obligations of or guaranteed by any bank and are not federally insured.
| 1 | Represents a hypothetical investment of $10,000 in the Fund after deducting applicable sales charges: for Class A Shares, the maximum sales charge of 5.50% ($10,000 investment minus $550 sales charge = $9,450); for Class B Shares, the maximum contingent deferred sales charge is 5.50% on any redemption less than one year from the purchase date; for Class C Shares, the maximum contingent deferred sales charge is 1.00% on any redemption less than one year from the purchase date. The Fund's performance assumes the reinvestment of all dividends and distributions. The RMCGI and the MMCGFA have been adjusted to reflect reinvestment of dividends on securities in the index and average. |
| 2 | The Fund's Class R Shares and Institutional Shares commenced operations on December 12, 2006 and January 29, 2010, respectively. For the period prior to commencement of operations of the Class R Shares, the performance information shown is for the Fund's Class A Shares, adjusted to reflect the expenses of the Class R Shares. For the period prior to the commencement of operations of the Institutional Shares, the performance information shown is for the Fund's Class A Shares. The performance of the Class A Shares has not been adjusted to reflect the expenses of the Institutional Shares since the Institutional Shares have a lower expense ratio than the expense ratio of the Class A Shares. The performance of Class A Shares has been adjusted to remove any voluntary waiver of Fund expenses that may have occurred during the period prior to the commencement of operations of the Institutional Shares. |
| 3 | The RMCGI measures the performance of the mid-cap growth segment of the U.S. equity universe. It includes those Russell Midcap® Index companies with higher price-to-book ratios and higher forecasted growth values. The RMCGI is constructed to provide a comprehensive and unbiased barometer of the mid-cap growth market and is completely reconstituted annually to ensure larger stocks do not distort the performance and characteristics of the true mid-cap growth market. The RMCGI is not adjusted to reflect sales loads, expenses or other fees that the Securities and Exchange Commission (SEC) requires to be reflected in the Fund's performance. The index is unmanaged and unlike the Fund, is not affected by cash flows. It is not possible to invest directly in an index. |
| 4 | Morningstar figures represent the average of the total returns reported by all the mutual funds designated by Morningstar as falling into the respective category indicated. They do not reflect sales charges. |
Annual Shareholder Report
Portfolio of Investments Summary Table (unaudited)
At October 31, 2015, the Fund's industry composition1 was as follows:
| Industry Composition | Percentage of
Total Net Assets |
| Clothing Stores | 5.2% |
| Medical Supplies | 4.7% |
| Auto Original Equipment Manufacturers | 4.4% |
| Software Packaged/Custom | 4.4% |
| Financial Services | 4.1% |
| Department Stores | 3.8% |
| IT Services | 3.7% |
| Specialty Retailing | 3.7% |
| Auto Components | 2.7% |
| Hotels | 2.7% |
| Grocery Chain | 2.6% |
| Airline—Regional | 2.5% |
| Computer Peripherals | 2.4% |
| Airline—National | 2.2% |
| Electronic Equipment Instruments & Components | 2.2% |
| Services to Medical Professionals | 2.1% |
| Home Products | 2.0% |
| Ethical Drugs | 1.9% |
| Other Communications Equipment | 1.8% |
| Paper Products | 1.7% |
| Personal Loans | 1.7% |
| Communications Equipment | 1.6% |
| Food Products | 1.6% |
| Textiles Apparel & Luxury Goods | 1.5% |
| Defense Aerospace | 1.4% |
| Health Care Equipment & Supplies | 1.4% |
| Computer Services | 1.3% |
| Internet Services | 1.3% |
| Truck Manufacturing | 1.2% |
| Auto Rentals | 1.1% |
| Construction Machinery | 1.1% |
| Health Care Providers & Services | 1.1% |
| Home Building | 1.1% |
| Officer Equipment | 1.1% |
| Oil Refiner | 1.1% |
| Plastic Containers | 1.1% |
| Shipbuilding | 1.1% |
Annual Shareholder Report
| Industry Composition | Percentage of
Total Net Assets |
| Cosmetics & Toiletries | 1.0% |
| Semiconductors & Semiconductor Equipment | 1.0% |
| Soft Drinks | 1.0% |
| Technology Hardware Storage & Peripherals | 1.0% |
| Other2 | 11.6% |
| Cash Equivalents3 | 1.8% |
| Other Assets and Liabilities—Net4 | 0.0% |
| TOTAL | 100.0% |
| 1 | Except for Cash Equivalents and Other Assets and Liabilities, industry classifications are based upon, and individual portfolio securities are assigned to, the classifications of the Global Industry Classification Standard (GICS) except that the Adviser assigns a classification to securities not classified by the GICS and to securities for which the Adviser does not have access to the classification made by the GICS. |
| 2 | For purposes of this table, industry classifications which constitute less than 1.0% of the Fund's total net assets have been aggregated under the designation “Other”. |
| 3 | Cash Equivalents include any investments in money market mutual funds and/or overnight repurchase agreements. |
| 4 | Assets, other than investments in securities, less liabilities. See Statement of Assets and Liabilities. |
Annual Shareholder Report
Portfolio of Investments
October 31, 2015
| Shares | | | Value |
| | | COMMON STOCKS—98.2% | |
| | | Airline - National—2.2% | |
| 12,980 | | Delta Air Lines, Inc. | $659,903 |
| 74,942 | 1 | Jet Blue Airways Corp. | 1,861,560 |
| 70,326 | 1 | United Continental Holdings, Inc. | 4,241,361 |
| | | TOTAL | 6,762,824 |
| | | Airline - Regional—2.5% | |
| 43,880 | | Alaska Air Group, Inc. | 3,345,850 |
| 99,767 | | Southwest Airlines Co. | 4,618,214 |
| | | TOTAL | 7,964,064 |
| | | Auto Components—2.7% | |
| 68,820 | | Allison Transmission Holdings, Inc. | 1,975,134 |
| 195,076 | | Goodyear Tire & Rubber Co. | 6,406,296 |
| | | TOTAL | 8,381,430 |
| | | Auto Original Equipment Manufacturers—4.4% | |
| 60,173 | | Lear Corp. | 7,525,235 |
| 22,687 | 1 | O'Reilly Automotive, Inc. | 6,267,511 |
| | | TOTAL | 13,792,746 |
| | | Auto Rentals—1.1% | |
| 32,705 | 1 | Avis Budget Group, Inc. | 1,633,288 |
| 23,971 | 1 | United Rentals, Inc. | 1,794,469 |
| | | TOTAL | 3,427,757 |
| | | Biotechnology—0.1% | |
| 9,523 | 1 | Isis Pharmaceuticals, Inc. | 458,532 |
| | | Cable & Wireless Television—0.4% | |
| 39,209 | 1 | Discovery Communications, Inc. | 1,154,313 |
| | | Cable TV—0.8% | |
| 9,859 | 1 | AMC Networks, Inc. | 728,482 |
| 79,260 | 1 | MSG Networks, Inc. | 1,626,415 |
| | | TOTAL | 2,354,897 |
| | | Clothing Stores—5.2% | |
| 88,418 | 1 | Fossil, Inc. | 4,810,823 |
| 280,048 | | Gap (The), Inc. | 7,622,907 |
| 99,818 | 1 | Michael Kors Holdings Ltd. | 3,856,967 |
| | | TOTAL | 16,290,697 |
| | | Commodity Chemicals—0.1% | |
| 4,819 | | Westlake Chemical Corp. | 290,441 |
Annual Shareholder Report
| Shares | | | Value |
| | | COMMON STOCKS—continued | |
| | | Communications Equipment—1.6% | |
| 30,504 | 1 | Palo Alto Networks, Inc. | $4,911,144 |
| | | Computer Peripherals—2.4% | |
| 76,029 | 1 | Fortinet, Inc. | 2,612,356 |
| 140,500 | | NetApp, Inc. | 4,777,000 |
| | | TOTAL | 7,389,356 |
| | | Computer Services—1.3% | |
| 29,872 | | Global Payments, Inc. | 4,074,839 |
| | | Construction Machinery—1.1% | |
| 32,026 | | Joy Global, Inc. | 550,207 |
| 111,363 | | Trinity Industries, Inc. | 3,014,596 |
| | | TOTAL | 3,564,803 |
| | | Cosmetics & Toiletries—1.0% | |
| 108,500 | | Avon Products, Inc. | 437,255 |
| 14,707 | 1 | Ulta Salon Cosmetics & Fragrance, Inc. | 2,558,430 |
| | | TOTAL | 2,995,685 |
| | | Defense Aerospace—1.4% | |
| 84,362 | 1 | Spirit Aerosystems Holdings, Inc., Class A | 4,449,252 |
| | | Department Stores—3.8% | |
| 43,404 | | Dillards, Inc., Class A | 3,883,790 |
| 33,400 | | Kohl's Corp. | 1,540,408 |
| 124,194 | | Macy's, Inc. | 6,331,410 |
| | | TOTAL | 11,755,608 |
| | | Discount Department Stores—0.9% | |
| 43,126 | | Foot Locker, Inc. | 2,921,786 |
| | | Diversified Consumer Services—0.6% | |
| 49,518 | 1 | ServiceMaster Global Holdings, Inc. | 1,765,317 |
| | | Education & Training Services—0.2% | |
| 81,400 | 1 | Apollo Group, Inc., Class A | 590,964 |
| | | Electronic Equipment Instruments & Components—2.2% | |
| 156,995 | | CDW Corp. | 7,016,107 |
| | | Ethical Drugs—1.9% | |
| 40,978 | 1 | United Therapeutics Corp. | 6,008,604 |
| | | Financial Services—4.1% | |
| 112,300 | 1 | Ally Financial, Inc. | 2,237,016 |
| 67,197 | | Ameriprise Financial, Inc. | 7,751,846 |
| 55,595 | | Total System Services, Inc. | 2,915,958 |
| | | TOTAL | 12,904,820 |
Annual Shareholder Report
| Shares | | | Value |
| | | COMMON STOCKS—continued | |
| | | Food Products—1.6% | |
| 98,320 | | Keurig Green Mountain Coffee, Inc. | $4,989,740 |
| | | Furniture—0.6% | |
| 24,365 | 1 | Tempur Sealy International, Inc. | 1,896,572 |
| | | Grocery Chain—2.6% | |
| 203,222 | | Kroger Co. | 7,681,792 |
| 12,045 | | Whole Foods Market, Inc. | 360,868 |
| | | TOTAL | 8,042,660 |
| | | Health Care Equipment & Supplies—1.4% | |
| 12,915 | 1 | Dexcom, Inc. | 1,076,078 |
| 21,792 | 1 | Edwards Lifesciences Corp. | 3,424,613 |
| | | TOTAL | 4,500,691 |
| | | Health Care Providers & Services—1.1% | |
| 64,182 | 1 | VCA, Inc. | 3,515,248 |
| | | Home Building—1.1% | |
| 106,407 | | D. R. Horton, Inc. | 3,132,622 |
| 8,462 | 1 | Toll Brothers, Inc. | 304,378 |
| | | TOTAL | 3,437,000 |
| | | Home Products—2.0% | |
| 108,352 | | Tupperware Brands Corp. | 6,378,682 |
| | | Hotels—2.7% | |
| 104,230 | | Wyndham Worldwide Corp. | 8,479,110 |
| | | Household Durables—0.3% | |
| 588 | 1 | NVR, Inc. | 963,003 |
| | | Internet Services—1.3% | |
| 45,410 | | IAC Interactive Corp. | 3,042,924 |
| 11,827 | 1 | Rackspace Hosting, Inc. | 305,728 |
| 27,398 | 1 | Yelp, Inc. | 609,606 |
| | | TOTAL | 3,958,258 |
| | | IT Services—3.7% | |
| 75,781 | 1 | Vantiv, Inc. | 3,800,417 |
| 410,626 | | Western Union Co. | 7,904,551 |
| | | TOTAL | 11,704,968 |
| | | Medical Supplies—4.7% | |
| 33,300 | | Cardinal Health, Inc. | 2,737,260 |
| 52,300 | 1 | HCA, Inc. | 3,597,717 |
| 215,402 | 1 | Hologic, Inc. | 8,370,522 |
| | | TOTAL | 14,705,499 |
Annual Shareholder Report
| Shares | | | Value |
| | | COMMON STOCKS—continued | |
| | | Metal Fabrication—0.2% | |
| 16,400 | | Timken Co. | $518,240 |
| | | Miscellaneous Food Products—0.7% | |
| 23,093 | | Ingredion, Inc. | 2,195,221 |
| | | Multi-Line Insurance—0.8% | |
| 68,100 | | Allied World Assurance Holdings Ltd. | 2,476,116 |
| | | Office Equipment—1.1% | |
| 170,451 | | Pitney Bowes, Inc. | 3,519,813 |
| | | Office Supplies—0.5% | |
| 22,305 | | Avery Dennison Corp. | 1,449,156 |
| | | Oil Refiner—1.1% | |
| 32,072 | | Tesoro Petroleum Corp. | 3,429,459 |
| | | Other Communications Equipment—1.8% | |
| 73,652 | | Skyworks Solutions, Inc. | 5,688,880 |
| | | Paper Products—1.7% | |
| 121,312 | | International Paper Co. | 5,178,809 |
| | | Personal Loans—1.7% | |
| 28,191 | 1 | Credit Acceptance Corp. | 5,330,636 |
| | | Photo-Optical Component-Equipment—0.9% | |
| 34,970 | 1 | IPG Photonics Corp. | 2,889,221 |
| | | Plastic Containers—1.1% | |
| 11,227 | | Bemis Co., Inc. | 513,972 |
| 50,747 | 1 | Owens-Illinois, Inc. | 1,093,598 |
| 40,605 | | Sealed Air Corp. | 1,994,517 |
| | | TOTAL | 3,602,087 |
| | | Printed Circuit Boards—0.4% | |
| 51,700 | | Jabil Circuit, Inc. | 1,188,066 |
| | | Printing—0.7% | |
| 120,996 | | Donnelley (R.R.) & Sons Co. | 2,041,203 |
| | | Savings & Loan—0.6% | |
| 268,486 | 1 | Ocwen Financial Corp. | 1,876,717 |
| | | Semiconductors & Semiconductor Equipment—1.0% | |
| 39,490 | | Lam Research Corp. | 3,024,539 |
| | | Services to Medical Professionals—2.1% | |
| 22,399 | 1 | MEDNAX, Inc. | 1,578,458 |
| 75,400 | | Quest Diagnostics, Inc. | 5,123,430 |
| | | TOTAL | 6,701,888 |
| | | Shipbuilding—1.1% | |
| 28,269 | | Huntington Ingalls Industries, Inc. | 3,390,584 |
Annual Shareholder Report
| Shares | | | Value |
| | | COMMON STOCKS—continued | |
| | | Shoes—0.9% | |
| 86,829 | 1 | Skechers USA, Inc., Class A | $2,709,065 |
| | | Soft Drinks—1.0% | |
| 62,980 | | Coca-Cola Enterprises, Inc. | 3,233,393 |
| | | Software Packaged/Custom—4.4% | |
| 8,124 | 1 | Citrix Systems, Inc. | 666,980 |
| 96,597 | 1 | Electronic Arts, Inc. | 6,961,746 |
| 5,149 | 1 | F5 Networks, Inc. | 567,420 |
| 158,477 | | Symantec Corp. | 3,264,626 |
| 20,519 | 1 | Tableau Software, Inc. | 1,722,775 |
| 3,240 | 1 | Ultimate Software Group, Inc. | 662,094 |
| | | TOTAL | 13,845,641 |
| | | Specialty Retailing—3.7% | |
| 17,200 | | Abercrombie & Fitch Co., Class A | 364,468 |
| 129,574 | 1 | Bed Bath & Beyond, Inc. | 7,726,498 |
| 8,198 | | Expedia, Inc. | 1,117,387 |
| 25,771 | | GNC Holdings, Inc. | 766,687 |
| 29,802 | | Penske Automotive Group, Inc. | 1,455,530 |
| | | TOTAL | 11,430,570 |
| | | Technology Hardware Storage & Peripherals—1.0% | |
| 109,626 | 1 | Teradata Corp. | 3,081,587 |
| | | Technology Services—0.9% | |
| 95,912 | | Sabre Corp. | 2,812,140 |
| | | Telecommunication Equipment & Services—0.1% | |
| 10,800 | 1 | NeuStar, Inc., Class A | 293,652 |
| | | Textiles Apparel & Luxury Goods—1.5% | |
| 51,599 | | PVH Corp. | 4,692,929 |
| | | Truck Manufacturing—1.2% | |
| 69,589 | | PACCAR, Inc. | 3,663,861 |
| | | Undesignated Consumer Cyclicals—0.9% | |
| 41,750 | 1 | Herbalife Ltd. | 2,339,670 |
| 29,000 | | Weight Watchers International, Inc. | 446,020 |
| | | TOTAL | 2,785,690 |
| | | TOTAL COMMON STOCKS
(IDENTIFIED COST $293,583,799) | 306,846,580 |
Annual Shareholder Report
| Shares | | | Value |
| | | INVESTMENT COMPANY—1.8% | |
| 5,674,153 | 2 | Federated Prime Value Obligations Fund, Institutional Shares, 0.16%3
(AT NET ASSET VALUE) | $5,674,153 |
| | | TOTAL INVESTMENTS—100.0%
(IDENTIFIED COST $299,257,952)4 | 312,520,733 |
| | | OTHER ASSETS AND LIABILITIES - NET—0.0%5 | 109,993 |
| | | TOTAL NET ASSETS—100% | $312,630,726 |
| 1 | Non-income-producing security. |
| 2 | Affiliated holding. |
| 3 | 7-day net yield. |
| 4 | The cost of investments for federal tax purposes amounts to $299,352,723. |
| 5 | Assets, other than investments in securities, less liabilities. See Statement of Assets and Liabilities. |
Note: The categories of investments are shown as a percentage of total net assets at October 31, 2015.
Various inputs are used in determining the value of the Fund's investments. These inputs are summarized in the three broad levels listed below:
Level 1—quoted prices in active markets for identical securities.
Level 2—other significant observable inputs (including quoted prices for similar securities, interest rates, prepayment speeds, credit risk, etc.). Also includes securities valued at amortized cost.
Level 3—significant unobservable inputs (including the Fund's own assumptions in determining the fair value of investments).
The inputs or methodology used for valuing securities are not an indication of the risk associated with investing in those securities.
As of October 31, 2015, all investments of the Fund utilized Level 1 inputs in valuing the Fund's assets carried at fair value.
See Notes which are an integral part of the Financial Statements
Annual Shareholder Report
Financial Highlights–Class A Shares
(For a Share Outstanding Throughout Each Period)
| Year Ended October 31 | 2015 | 2014 | 2013 | 2012 | 2011 |
| Net Asset Value, Beginning of Period | $48.23 | $47.18 | $34.77 | $34.05 | $32.38 |
| Income From Investment Operations: | | | | | |
| Net investment income (loss) | (0.03)1 | 0.081 | 0.091 | (0.11)1 | (0.21)1 |
| Net realized and unrealized gain on investments | 1.01 | 6.88 | 12.32 | 0.77 | 1.88 |
| TOTAL FROM INVESTMENT OPERATIONS | 0.98 | 6.96 | 12.41 | 0.66 | 1.67 |
| Less Distributions: | | | | | |
| Distributions from net investment income | (0.07) | — | — | — | — |
| Distributions from net realized gain on investments | (6.64) | (5.91) | — | — | — |
| TOTAL DISTRIBUTIONS | (6.71) | (5.91) | — | — | — |
| Regulatory Settlement Proceeds | — | — | — | 0.062 | — |
| Net Asset Value, End of Period | $42.50 | $48.23 | $47.18 | $34.77 | $34.05 |
| Total Return3 | 1.96% | 16.50% | 35.69% | 2.11%2 | 5.16% |
| Ratios to Average Net Assets: | | | | | |
| Net expenses | 1.22% | 1.22% | 1.22%4 | 1.22% | 1.19%4,5 |
| Net investment income (loss) | (0.08)% | 0.17% | 0.23% | (0.32)% | (0.60)% |
| Expense waiver/reimbursement6 | 0.07% | 0.06% | 0.11% | 0.18% | 0.22% |
| Supplemental Data: | | | | | |
| Net assets, end of period (000 omitted) | $246,414 | $269,537 | $257,734 | $226,079 | $245,823 |
| Portfolio turnover | 122% | 41% | 124% | 135% | 172% |
| 1 | Per share numbers have been calculated using the average shares method. |
| 2 | During the year ended October 31, 2012, the Fund received a regulatory settlement from an unaffiliated third party, which had an impact of 0.21% on the total return. |
| 3 | Based on net asset value, which does not reflect the sales charge, redemption fee or contingent deferred sales charge, if applicable. |
| 4 | The net expense ratio is calculated without reduction for expense offset arrangements. The net expense ratios are 1.22% and 1.18%, for the years ended October 31, 2013 and 2011, respectively, after taking into account these expense reductions. |
| 5 | Pursuant to a settlement with the New York Attorney General, the Adviser has agreed to waive management fees in compliance with an Assurance of Discontinuance dated November 17, 2005. The net management fee was reduced to 0.4975% effective January 1, 2006 through December 31, 2010. |
| 6 | This expense decrease is reflected in both the net expense and the net investment income (loss) ratios shown above. |
See Notes which are an integral part of the Financial Statements
Annual Shareholder Report
Financial Highlights–Class B Shares
(For a Share Outstanding Throughout Each Period)
| Year Ended October 31 | 2015 | 2014 | 2013 | 2012 | 2011 |
| Net Asset Value, Beginning of Period | $39.84 | $40.23 | $29.87 | $29.48 | $28.24 |
| Income From Investment Operations: | | | | | |
| Net investment income (loss) | (0.29)1 | (0.22)1 | (0.17)1 | (0.32)1 | (0.42)1 |
| Net realized and unrealized gain on investments | 0.83 | 5.74 | 10.53 | 0.66 | 1.66 |
| TOTAL FROM INVESTMENT OPERATIONS | 0.54 | 5.52 | 10.36 | 0.34 | 1.24 |
| Less Distributions: | | | | | |
| Distributions from net realized gain on investments | (6.64) | (5.91) | — | — | — |
| Regulatory Settlement Proceeds | — | — | — | 0.052 | — |
| Net Asset Value, End of Period | $33.74 | $39.84 | $40.23 | $29.87 | $29.48 |
| Total Return3 | 1.17% | 15.66% | 34.68% | 1.32%2 | 4.39% |
| Ratios to Average Net Assets: | | | | | |
| Net expenses | 1.97% | 1.97% | 1.97%4 | 1.97% | 1.93%4,5 |
| Net investment income (loss) | (0.83)% | (0.58)% | (0.50)% | (1.06)% | (1.35)% |
| Expense waiver/reimbursement6 | 0.14% | 0.14% | 0.23% | 0.31% | 0.30% |
| Supplemental Data: | | | | | |
| Net assets, end of period (000 omitted) | $3,322 | $4,054 | $4,331 | $4,239 | $6,325 |
| Portfolio turnover | 122% | 41% | 124% | 135% | 172% |
| 1 | Per share numbers have been calculated using the average shares method. |
| 2 | During the year ended October 31, 2012, the Fund received a regulatory settlement from an unaffiliated third party, which had an impact of 0.24% on the total return. |
| 3 | Based on net asset value, which does not reflect the sales charge, redemption fee or contingent deferred sales charge, if applicable. |
| 4 | The net expense ratio is calculated without reduction for expense offset arrangements. The net expense ratios are 1.97% and 1.93%, for the years ended October 31, 2013 and 2011, respectively, after taking into account these expense reductions. |
| 5 | Pursuant to a settlement with the New York Attorney General, the Adviser has agreed to waive management fees in compliance with an Assurance of Discontinuance dated November 17, 2005. The net management fee was reduced to 0.4975% effective January 1, 2006 through December 31, 2010. |
| 6 | This expense decrease is reflected in both the net expense and the net investment income (loss) ratios shown above. |
See Notes which are an integral part of the Financial Statements
Annual Shareholder Report
Financial Highlights–Class C Shares
(For a Share Outstanding Throughout Each Period)
| Year Ended October 31 | 2015 | 2014 | 2013 | 2012 | 2011 |
| Net Asset Value, Beginning of Period | $40.36 | $40.68 | $30.21 | $29.81 | $28.55 |
| Income From Investment Operations: | | | | | |
| Net investment income (loss) | (0.30)1 | (0.22)1 | (0.19)1 | (0.33)1 | (0.42)1 |
| Net realized and unrealized gain on investments | 0.85 | 5.81 | 10.66 | 0.68 | 1.68 |
| TOTAL FROM INVESTMENT OPERATIONS | 0.55 | 5.59 | 10.47 | 0.35 | 1.26 |
| Less Distributions: | | | | | |
| Distributions from net realized gain on investments | (6.64) | (5.91) | — | — | — |
| Regulatory Settlement Proceeds | — | — | — | 0.052 | — |
| Net Asset Value, End of Period | $34.27 | $40.36 | $40.68 | $30.21 | $29.81 |
| Total Return3 | 1.18% | 15.66% | 34.66% | 1.34%2 | 4.41% |
| Ratios to Average Net Assets: | | | | | |
| Net expenses | 1.97% | 1.97% | 1.97%4 | 1.97% | 1.94%4,5 |
| Net investment income (loss) | (0.83)% | (0.58)% | (0.53)% | (1.07)% | (1.34)% |
| Expense waiver/reimbursement6 | 0.09% | 0.10% | 0.14% | 0.20% | 0.26% |
| Supplemental Data: | | | | | |
| Net assets, end of period (000 omitted) | $11,509 | $12,666 | $12,032 | $9,843 | $10,733 |
| Portfolio turnover | 122% | 41% | 124% | 135% | 172% |
| 1 | Per share numbers have been calculated using the average shares method. |
| 2 | During the year ended October 31, 2012, the Fund received a regulatory settlement from an unaffiliated third party, which had an impact of 0.20% on the total return. |
| 3 | Based on net asset value, which does not reflect the sales charge, redemption fee or contingent deferred sales charge, if applicable. |
| 4 | The net expense ratio is calculated without reduction for expense offset arrangements. The net expense ratios are 1.97% and 1.93%, for the years ended October 31, 2013 and 2011, respectively, after taking into account these expense reductions. |
| 5 | Pursuant to a settlement with the New York Attorney General, the Adviser has agreed to waive management fees in compliance with an Assurance of Discontinuance dated November 17, 2005. The net management fee was reduced to 0.4975% effective January 1, 2006 through December 31, 2010. |
| 6 | This expense decrease is reflected in both the net expense and the net investment income (loss) ratios shown above. |
See Notes which are an integral part of the Financial Statements
Annual Shareholder Report
Financial Highlights–Class R Shares
(For a Share Outstanding Throughout Each Period)
| Year Ended October 31 | 2015 | 2014 | 2013 | 2012 | 2011 |
| Net Asset Value, Beginning of Period | $46.63 | $46.02 | $34.07 | $33.53 | $32.04 |
| Income From Investment Operations: | | | | | |
| Net investment income (loss) | (0.23)1 | (0.17)1 | (0.12)1 | (0.29)1 | (0.36)1 |
| Net realized and unrealized gain on investments | 0.98 | 6.69 | 12.07 | 0.77 | 1.85 |
| TOTAL FROM INVESTMENT OPERATIONS | 0.75 | 6.52 | 11.95 | 0.48 | 1.49 |
| Less Distributions: | | | | | |
| Distributions from net realized gain on investments | (6.64) | (5.91) | — | — | — |
| Regulatory Settlement Proceeds | — | — | — | 0.062 | — |
| Net Asset Value, End of Period | $40.74 | $46.63 | $46.02 | $34.07 | $33.53 |
| Total Return3 | 1.49% | 15.89% | 35.07% | 1.61%2 | 4.65% |
| Ratios to Average Net Assets: | | | | | |
| Net expenses | 1.69% | 1.72% | 1.67%4 | 1.72% | 1.70%4,5 |
| Net investment income (loss) | (0.55)% | (0.37)% | (0.30)% | (0.83)% | (1.04)% |
| Expense waiver/reimbursement6 | 0.01% | 0.08% | 0.03% | 0.09% | 0.17% |
| Supplemental Data: | | | | | |
| Net assets, end of period (000 omitted) | $1,831 | $2,150 | $4,532 | $2,156 | $1,483 |
| Portfolio turnover | 122% | 41% | 124% | 135% | 172% |
| 1 | Per share numbers have been calculated using the average shares method. |
| 2 | During the year ended October 31, 2012, the Fund received a regulatory settlement from an unaffiliated third party, which had an impact of 0.15% on the total return. |
| 3 | Based on net asset value. |
| 4 | The net expense ratio is calculated without reduction for expense offset arrangements. The net expense ratios are 1.67% and 1.69%, for the years ended October 31, 2013 and 2011, respectively, after taking into account these expense reductions. |
| 5 | Pursuant to a settlement with the New York Attorney General, the Adviser has agreed to waive management fees in compliance with an Assurance of Discontinuance dated November 17, 2005. The net management fee was reduced to 0.4975% effective January 1, 2006 through December 31, 2010. |
| 6 | This expense decrease is reflected in both the net expense and the net investment income (loss) ratios shown above. |
See Notes which are an integral part of the Financial Statements
Annual Shareholder Report
Financial Highlights–Institutional Shares
(For a Share Outstanding Throughout Each Period)
| Year Ended October 31 | 2015 | 2014 | 2013 | 2012 | 2011 |
| Net Asset Value, Beginning of Period | $48.88 | $47.63 | $35.01 | $34.20 | $32.44 |
| Income From Investment Operations: | | | | | |
| Net investment income (loss) | 0.081 | 0.201 | 0.201 | (0.03)1 | (0.12)1 |
| Net realized and unrealized gain (loss) on investments | 1.01 | 6.96 | 12.42 | 0.78 | 1.88 |
| TOTAL FROM INVESTMENT OPERATIONS | 1.09 | 7.16 | 12.62 | 0.75 | 1.76 |
| Less Distributions: | | | | | |
| Distributions from net investment income | (0.19) | — | — | — | — |
| Distributions from net realized gain on investments | (6.64) | (5.91) | — | — | — |
| TOTAL DISTRIBUTIONS | (6.83) | (5.91) | — | — | — |
| Regulatory Settlement Proceeds | — | — | — | 0.062 | — |
| Net Asset Value, End of Period | $43.14 | $48.88 | $47.63 | $35.01 | $34.20 |
| Total Return3 | 2.19% | 16.80% | 36.05% | 2.37%2 | 5.43% |
| Ratios to Average Net Assets: | | | | | |
| Net expenses | 0.97% | 0.97% | 0.97%4 | 0.97% | 0.93%4,5 |
| Net investment income (loss) | 0.19% | 0.43% | 0.48% | (0.09)% | (0.35)% |
| Expense waiver/reimbursement6 | 0.05% | 0.07% | 0.11% | 0.11% | 0.18% |
| Supplemental Data: | | | | | |
| Net assets, end of period (000 omitted) | $49,554 | $75,756 | $93,618 | $82,490 | $26,835 |
| Portfolio turnover | 122% | 41% | 124% | 135% | 172% |
| 1 | Per share numbers have been calculated using the average shares method. |
| 2 | During the year ended October 31, 2012, the Fund received a regulatory settlement from an unaffiliated third party, which had an impact of 0.06% on the total return. |
| 3 | Based on net asset value. |
| 4 | The net expense ratio is calculated without reduction for expense offset arrangements. The net expense ratios are 0.97% and 0.92%, for the years ended October 31, 2013 and 2011, respectively, after taking into account these expense reductions. |
| 5 | Pursuant to a settlement with the New York Attorney General, the Adviser has agreed to waive management fees in compliance with an Assurance of Discontinuance dated November 17, 2005. The net management fee was reduced to 0.4975% effective January 1, 2006 through December 31, 2010. |
| 6 | This expense decrease is reflected in both the net expense and the net investment income (loss) ratios shown above. |
See Notes which are an integral part of the Financial Statements
Annual Shareholder Report
Statement of Assets and Liabilities
October 31, 2015
| Assets: | | |
| Total investment in securities, at value including $5,674,153 of investment in an affiliated holding (Note 5) (identified cost $299,257,952) | | $312,520,733 |
| Income receivable | | 64,362 |
| Receivable for investments sold | | 9,359,299 |
| Receivable for shares sold | | 144,241 |
| Other assets | | 9,338 |
| TOTAL ASSETS | | 322,097,973 |
| Liabilities: | | |
| Payable for investments purchased | $8,826,129 | |
| Payable for shares redeemed | 330,739 | |
| Payable to adviser (Note 5) | 12,544 | |
| Payable for distribution services fee (Note 5) | 10,287 | |
| Payable for other service fees (Notes 2 and 5) | 137,896 | |
| Accrued expenses (Note 5) | 149,652 | |
| TOTAL LIABILITIES | | 9,467,247 |
| Net assets for 7,426,465 shares outstanding | | $312,630,726 |
| Net Assets Consist of: | | |
| Paid-in capital | | $239,714,707 |
| Net unrealized appreciation of investments | | 13,262,781 |
| Accumulated net realized gain on investments | | 59,921,561 |
| Distributions in excess of net investment income | | (268,323) |
| TOTAL NET ASSETS | | $312,630,726 |
Annual Shareholder Report
Statement of Assets and Liabilities–continued
| Net Asset Value, Offering Price and Redemption Proceeds Per Share | | |
| Class A Shares: | | |
| Net asset value per share ($246,414,478 ÷ 5,798,587 shares outstanding), no par value, unlimited shares authorized | | $42.50 |
| Offering price per share (100/94.50 of $42.50) | | $44.97 |
| Redemption proceeds per share | | $42.50 |
| Class B Shares: | | |
| Net asset value per share ($3,321,815 ÷ 98,446 shares outstanding), no par value, unlimited shares authorized | | $33.74 |
| Offering price per share | | $33.74 |
| Redemption proceeds per share (94.50/100 of $33.74) | | $31.88 |
| Class C Shares: | | |
| Net asset value per share ($11,509,306 ÷ 335,838 shares outstanding), no par value, unlimited shares authorized | | $34.27 |
| Offering price per share | | $34.27 |
| Redemption proceeds per share (99.00/100 of $34.27) | | $33.93 |
| Class R Shares: | | |
| Net asset value per share ($1,831,315 ÷ 44,951 shares outstanding), no par value, unlimited shares authorized | | $40.74 |
| Offering price per share | | $40.74 |
| Redemption proceeds per share | | $40.74 |
| Institutional Shares: | | |
| Net asset value per share ($49,553,812 ÷ 1,148,643 shares outstanding), no par value, unlimited shares authorized | | $43.14 |
| Offering price per share | | $43.14 |
| Redemption proceeds per share | | $43.14 |
See Notes which are an integral part of the Financial Statements
Annual Shareholder Report
Statement of Operations
Year Ended October 31, 2015
| Investment Income: | | | |
| Dividends (including $6,007 received from an affiliated holding (Note 5) and net of foreign taxes withheld of $1,700) | | | $3,987,630 |
| Expenses: | | | |
| Investment adviser fee (Note 5) | | $2,601,880 | |
| Administrative fee (Note 5) | | 271,488 | |
| Custodian fees | | 29,203 | |
| Transfer agent fee (Note 2) | | 447,986 | |
| Directors'/Trustees' fees (Note 5) | | 3,585 | |
| Auditing fees | | 24,550 | |
| Legal fees | | 8,913 | |
| Portfolio accounting fees | | 126,914 | |
| Distribution services fee (Note 5) | | 132,727 | |
| Other service fees (Notes 2 and 5) | | 698,769 | |
| Share registration costs | | 66,015 | |
| Printing and postage | | 38,771 | |
| Miscellaneous (Note 5) | | 6,815 | |
| TOTAL EXPENSES | | 4,457,616 | |
| Waiver and Reimbursements: | | | |
| Waiver/reimbursement of investment adviser fee (Note 5) | $(27,932) | | |
| Reimbursements of other operating expenses (Notes 2 and 5) | (201,380) | | |
| TOTAL WAIVER AND REIMBURSEMENTS | | (229,312) | |
| Net expenses | | | 4,228,304 |
| Net investment income (loss) | | | (240,674) |
| Realized and Unrealized Gain (Loss) on Investments: | | | |
| Net realized gain on investments | | | 65,149,653 |
| Net change in unrealized appreciation of investments | | | (55,935,007) |
| Net realized and unrealized gain on investments | | | 9,214,646 |
| Change in net assets resulting from operations | | | $8,973,972 |
See Notes which are an integral part of the Financial Statements
Annual Shareholder Report
Statement of Changes in Net Assets
| Year Ended October 31 | 2015 | 2014 |
| Increase (Decrease) in Net Assets | | |
| Operations: | | |
| Net investment income (loss) | $(240,674) | $660,884 |
| Net realized gain on investments | 65,149,653 | 50,829,550 |
| Net change in unrealized appreciation/depreciation of investments | (55,935,007) | 3,568,605 |
| CHANGE IN NET ASSETS RESULTING FROM OPERATIONS | 8,973,972 | 55,059,039 |
| Distributions to Shareholders: | | |
| Distributions from net investment income | | |
| Class A Shares | (346,797) | — |
| Institutional Shares | (286,817) | — |
| Distributions from net realized gain on investments | | |
| Class A Shares | (36,726,907) | (32,014,483) |
| Class B Shares | (667,440) | (622,207) |
| Class C Shares | (2,027,731) | (1,750,992) |
| Class R Shares | (311,311) | (576,474) |
| Institutional Shares | (10,339,645) | (10,941,135) |
| CHANGE IN NET ASSETS RESULTING FROM DISTRIBUTIONS TO SHAREHOLDERS | (50,706,648) | (45,905,291) |
| Share Transactions: | | |
| Proceeds from sale of shares | 21,228,341 | 25,649,169 |
| Net asset value of shares issued to shareholders in payment of distributions declared | 47,265,286 | 42,911,658 |
| Cost of shares redeemed | (78,293,355) | (85,798,765) |
| CHANGE IN NET ASSETS RESULTING FROM SHARE TRANSACTIONS | (9,799,728) | (17,237,938) |
| Change in net assets | (51,532,404) | (8,084,190) |
| Net Assets: | | |
| Beginning of period | 364,163,130 | 372,247,320 |
| End of period (including undistributed (distributions in excess of) net investment income of $(268,323) and $660,884, respectively) | $312,630,726 | $364,163,130 |
See Notes which are an integral part of the Financial Statements
Annual Shareholder Report
Notes to Financial Statements
October 31, 2015
1. ORGANIZATION
Federated Equity Funds (the “Trust”) is registered under the Investment Company Act of 1940, as amended (the “Act”), as an open-end management investment company. The Trust consists of 14 diversified portfolios. The financial statements included herein are only those of Federated MDT Mid Cap Growth Strategies Fund (the “Fund”). The financial statements of the other portfolios are presented separately. The assets of each portfolio are segregated and a shareholder's interest is limited to the portfolio in which shares are held. Each portfolio pays its own expenses. The Fund offers five classes of shares: Class A Shares, Class B Shares, Class C Shares, Class R Shares and Institutional Shares. All shares of the Fund have equal rights with respect to voting, except on class-specific matters. The investment objective of the Fund is appreciation of capital.
Class B Shares were closed to new accounts/investors on June 1, 2015, and were closed to new purchases/exchanges by existing shareholders on August 1, 2015.
2. SIGNIFICANT ACCOUNTING POLICIES
The following is a summary of significant accounting policies consistently followed by the Fund in the preparation of its financial statements. These policies are in conformity with U.S. generally accepted accounting principles (GAAP).
Investment Valuation
In calculating its net asset value (NAV), the Fund generally values investments as follows:
| ■ | Equity securities listed on an exchange or traded through a regulated market system are valued at their last reported sale price or official closing price in their principal exchange or market. |
| ■ | Shares of other mutual funds or non-exchange-traded investment companies are valued based upon their reported NAVs. |
| ■ | Derivative contracts listed on exchanges are valued at their reported settlement or closing price, except that options are valued at the mean of closing bid and asked quotations. |
| ■ | Over-the-counter (OTC) derivative contracts are fair valued using price evaluations provided by a pricing service approved by the Board of Trustees (the “Trustees”). |
| ■ | Fixed-income securities acquired with remaining maturities greater than 60 days are fair valued using price evaluations provided by a pricing service approved by the Trustees. |
| ■ | Fixed-income securities and repurchase agreements acquired with remaining maturities of 60 days or less are valued at their cost (adjusted for the accretion of any discount or amortization of any premium), unless the issuer's creditworthiness is impaired or other factors indicate that amortized cost is not an accurate estimate of the investment's fair value, in which case it would be valued in the same manner as a longer-term security. |
Annual Shareholder Report
| ■ | For securities that are fair valued in accordance with procedures established by and under the general supervision of the Trustees, certain factors may be considered such as: the last traded or purchase price of the security, information obtained by contacting the issuer or dealers, analysis of the issuer's financial statements or other available documents, fundamental analytical data, the nature and duration of restrictions on disposition, the movement of the market in which the security is normally traded, public trading in similar securities or derivative contracts of the issuer or comparable issuers, movement of a relevant index, or other factors including but not limited to industry changes and relevant government actions. |
If any price, quotation, price evaluation or other pricing source is not readily available when the NAV is calculated, or if the Fund cannot obtain price evaluations from a pricing service or from more than one dealer for an investment within a reasonable period of time as set forth in the Fund's valuation policies and procedures, the Fund uses the fair value of the investment determined in accordance with the procedures described below. There can be no assurance that the Fund could obtain the fair value assigned to an investment if it sold the investment at approximately the time at which the Fund determines its NAV per share.
Fair Valuation and Significant Events Procedures
The Trustees have ultimate responsibility for determining the fair value of investments for which market quotations are not readily available. The Trustees have appointed a valuation committee (“Valuation Committee”) comprised of officers of the Fund, Federated MDTA LLC (“Adviser”) and certain of the Adviser's affiliated companies to assist in determining fair value and in overseeing the calculation of the NAV. The Trustees have also authorized the use of pricing services recommended by the Valuation Committee to provide fair value evaluations of the current value of certain investments for purposes of calculating the NAV. The Valuation Committee employs various methods for reviewing third-party pricing-service evaluations including periodic reviews of third-party pricing services' policies, procedures and valuation methods (including key inputs, methods, models and assumptions), transactional back-testing, comparisons of evaluations of different pricing services, and review of price challenges by the Adviser based on recent market activity. In the event that market quotations and price evaluations are not available for an investment, the Valuation Committee determines the fair value of the investment in accordance with procedures adopted by the Trustees. The Trustees periodically review and approve the fair valuations made by the Valuation Committee and any changes made to the procedures.
Factors considered by pricing services in evaluating an investment include the yields or prices of investments of comparable quality, coupon, maturity, call rights and other potential prepayments, terms and type, reported transactions, indications as to values from dealers and general market conditions. Some pricing services provide a single price evaluation reflecting the bid-side of the market for an investment (a “bid” evaluation). Other pricing services offer both bid evaluations and price evaluations indicative of a price between the prices bid and asked for the investment (a “mid” evaluation). The Fund normally uses bid evaluations for any U.S. Treasury and Agency securities, mortgage-backed securities and municipal securities. The Fund normally uses mid evaluations for any other types of fixed-income securities and any OTC derivative contracts. In the event that market quotations and price evaluations are not available for an investment, the fair value of the investment is determined in accordance with procedures adopted by the Trustees.
Annual Shareholder Report
The Trustees also have adopted procedures requiring an investment to be priced at its fair value whenever the Adviser determines that a significant event affecting the value of the investment has occurred between the time as of which the price of the investment would otherwise be determined and the time as of which the NAV is computed. An event is considered significant if there is both an affirmative expectation that the investment's value will change in response to the event and a reasonable basis for quantifying the resulting change in value. Examples of significant events that may occur after the close of the principal market on which a security is traded, or after the time of a price evaluation provided by a pricing service or a dealer, include:
| ■ | With respect to securities traded principally in foreign markets, significant trends in U.S. equity markets or in the trading of foreign securities index futures contracts; |
| ■ | Political or other developments affecting the economy or markets in which an issuer conducts its operations or its securities are traded; |
| ■ | Announcements concerning matters such as acquisitions, recapitalizations, litigation developments, or a natural disaster affecting the issuer's operations or regulatory changes or market developments affecting the issuer's industry. |
The Trustees have adopted procedures whereby the Valuation Committee uses a pricing service to determine the fair value of equity securities traded principally in foreign markets when the Adviser determines that there has been a significant trend in the U.S. equity markets or in index futures trading. For other significant events, the Fund may seek to obtain more current quotations or price evaluations from alternative pricing sources. If a reliable alternative pricing source is not available, the Fund will determine the fair value of the investment in accordance with the fair valuation procedures approved by the Trustees. The Trustees have ultimate responsibility for any fair valuations made in response to a significant event.
Repurchase Agreements
The Fund may invest in repurchase agreements for short-term liquidity purposes. It is the policy of the Fund to require the other party to a repurchase agreement to transfer to the Fund's custodian or sub-custodian eligible securities or cash with a market value (after transaction costs) at least equal to the repurchase price to be paid under the repurchase agreement. The eligible securities are transferred to accounts with the custodian or sub-custodian in which the Fund holds a “securities entitlement” and exercises “control” as those terms are defined in the Uniform Commercial Code. The Fund has established procedures for monitoring the market value of the transferred securities and requiring the transfer of additional eligible securities if necessary to equal at least the repurchase price. These procedures also allow the other party to require securities to be transferred from the account to the extent that their market value exceeds the repurchase price or in exchange for other eligible securities of equivalent market value.
The insolvency of the other party or other failure to repurchase the securities may delay the disposition of the underlying securities or cause the Fund to receive less than the full repurchase price. Under the terms of the repurchase agreement, any amounts received by the Fund in excess of the repurchase price and related transaction costs must be remitted to the other party.
The Fund may enter into repurchase agreements in which eligible securities are transferred into joint trading accounts maintained by the custodian or sub-custodian for investment companies and other clients advised by the Fund's Adviser and its affiliates. The Fund will participate on a pro rata basis with the other investment companies and clients in its share of the securities transferred under such repurchase agreements and in its share of proceeds from any repurchase or other disposition of such securities.
Annual Shareholder Report
Investment Income, Gains and Losses, Expenses and Distributions
Investment transactions are accounted for on a trade-date basis. Realized gains and losses from investment transactions are recorded on an identified-cost basis. Interest income and expenses are accrued daily. Dividend income and distributions to shareholders are recorded on the ex-dividend date. Foreign dividends are recorded on the ex-dividend date or when the Fund is informed of the ex-dividend date. Distributions of net investment income, if any, are declared and paid annually. Non-cash dividends included in dividend income, if any, are recorded at fair value. Investment income, realized and unrealized gains and losses, and certain fund-level expenses are allocated to each class based on relative average daily net assets, except that Class A Shares, Class B Shares, Class C Shares, Class R Shares and Institutional Shares may bear distribution services fees, other service fees and transfer agent fees unique to those classes. For the year ended October 31, 2015, transfer agent fees for the Fund were as follows:
| | Transfer
Agent Fees
Incurred | Transfer
Agent Fees
Reimbursed |
| Class A Shares | $349,257 | $(160,653) |
| Class B Shares | 7,870 | (5,262) |
| Class C Shares | 19,057 | (10,700) |
| Class R Shares | 5,554 | — |
| Institutional Shares | 66,248 | (24,765) |
| TOTAL | $447,986 | $(201,380) |
Dividends are declared separately for each class. No class has preferential dividend rights; differences in per share dividend rates are generally due to differences in separate class expenses.
Other Service Fees
The Fund may pay other service fees up to 0.25% of the average daily net assets of the Fund's Class A Shares, Class B Shares, Class C Shares and Institutional Shares to unaffiliated financial intermediaries or to Federated Shareholder Services Company (FSSC) for providing services to shareholders and maintaining shareholder accounts. Subject to the terms described in the Expense Limitation note, FSSC may voluntarily reimburse the Fund for other service fees. For the year ended October 31, 2015, other service fees for the Fund were as follows:
| | Other Service
Fees
Incurred |
| Class A Shares | $657,853 |
| Class B Shares | 9,709 |
| Class C Shares | 31,207 |
| TOTAL | $698,769 |
For the year ended October 31, 2015, the Fund's Institutional Shares did not incur other service fees.
Annual Shareholder Report
Premium and Discount Amortization
All premiums and discounts on fixed-income securities are amortized/accreted using the effective-interest-rate method.
Federal Taxes
It is the Fund's policy to comply with the Subchapter M provision of the Internal Revenue Code (the “Code”) and to distribute to shareholders each year substantially all of its income. Accordingly, no provision for federal income tax is necessary. As of and during the year ended October 31, 2015, the Fund did not have a liability for any uncertain tax positions. The Fund recognizes interest and penalties, if any, related to tax liabilities as income tax expense in the Statement of Operations. As of October 31, 2015, tax years 2012 through 2015 remain subject to examination by the Fund's major tax jurisdictions, which include the United States of America and the Commonwealth of Massachusetts.
The Fund may be subject to taxes imposed by governments of countries in which it invests. Such taxes are generally based on either income or gains earned or repatriated. The Fund accrues and applies such taxes to net investment income, net realized gains and net unrealized gains as income and/or gains are earned.
When-Issued and Delayed-Delivery Transactions
The Fund may engage in when-issued or delayed-delivery transactions. The Fund records when-issued securities on the trade date and maintains security positions such that sufficient liquid assets will be available to make payment for the securities purchased. Securities purchased on a when-issued or delayed-delivery basis are marked to market daily and begin earning interest on the settlement date. Losses may occur on these transactions due to changes in market conditions or the failure of counterparties to perform under the contract.
Foreign Exchange Contracts
The Fund enters into foreign exchange contracts for the delayed-delivery of securities or foreign currency exchange transactions. The Fund enters into foreign exchange contracts to protect assets against adverse changes in foreign currency exchange rates or exchange control regulations. Purchased contracts are used to acquire exposure to foreign currencies, whereas, contracts to sell are used to hedge the Fund's securities against currency fluctuations. Risks may arise upon entering into these transactions from the potential inability of counterparties to meet the terms of their commitments and from unanticipated movements in security prices or foreign exchange rates. The foreign exchange contracts are adjusted by the daily exchange rate of the underlying currency and any gains or losses are recorded for financial statement purposes as unrealized until the settlement date.
At October 31, 2015, the Fund had no outstanding foreign exchange contracts.
Annual Shareholder Report
Foreign Currency Translation
The accounting records of the Fund are maintained in U.S. dollars. All assets and liabilities denominated in foreign currencies (FCs) are translated into U.S. dollars based on the rates of exchange of such currencies against U.S. dollars on the date of valuation. Purchases and sales of securities, income and expenses are translated at the rate of exchange quoted on the respective date that such transactions are recorded. The Fund does not isolate that portion of the results of operations resulting from changes in foreign exchange rates on investments from the fluctuations arising from changes in market prices of securities held. Such fluctuations are included with the net realized and unrealized gain or loss from investments.
Reported net realized foreign exchange gains or losses arise from sales of portfolio securities, sales and maturities of short-term securities, sales of FCs, currency gains or losses realized between the trade and settlement dates on securities transactions, the difference between the amounts of dividends, interest and foreign withholding taxes recorded on the Fund's books, and the U.S. dollar equivalent of the amounts actually received or paid. Net unrealized foreign exchange gains and losses arise from changes in the value of assets and liabilities other than investments in securities at fiscal year end, resulting from changes in the exchange rate.
Securities Lending
The Fund participates in a securities lending program providing for the lending of equity securities to qualified brokers. The Fund normally receives cash collateral for securities loaned that is invested in an affiliated money market fund or in short-term securities including repurchase agreements. Collateral is maintained at a minimum level of 100% of the market value of investments loaned, plus interest, if applicable. Earnings on collateral are allocated between the borrower of the security, the securities lending agent, as a fee for its services under the program and the Fund, according to agreed-upon rates.
As of October 31, 2015, the Fund had no outstanding securities on loan.
Other
The preparation of financial statements in conformity with GAAP requires management to make estimates and assumptions that affect the amounts of assets, liabilities, expenses and revenues reported in the financial statements. Actual results could differ from those estimated. The Fund applies Investment Company accounting and reporting guidance.
3. SHARES OF BENEFICIAL INTEREST
The following tables summarize share activity:
| Year Ended October 31 | 2015 | 2014 |
| Class A Shares: | Shares | Amount | Shares | Amount |
| Shares sold | 251,886 | $11,173,128 | 247,225 | $11,309,582 |
| Shares issued to shareholders in payment of distributions declared | 799,513 | 34,139,213 | 700,736 | 29,634,128 |
| Shares redeemed | (841,012) | (37,374,450) | (822,773) | (37,585,287) |
| NET CHANGE RESULTING FROM CLASS A SHARE TRANSACTIONS | 210,387 | $7,937,891 | 125,188 | 3,358,423 |
Annual Shareholder Report
| Year Ended October 31 | 2015 | 2014 |
| Class B Shares: | Shares | Amount | Shares | Amount |
| Shares sold | 12,967 | $465,391 | 15,580 | $591,726 |
| Shares issued to shareholders in payment of distributions declared | 18,436 | 629,242 | 16,744 | 588,733 |
| Shares redeemed | (34,717) | (1,221,561) | (38,222) | (1,461,971) |
| NET CHANGE RESULTING FROM CLASS B SHARE TRANSACTIONS | (3,314) | $(126,928) | (5,898) | $(281,512) |
| Year Ended October 31 | 2015 | 2014 |
| Class C Shares: | Shares | Amount | Shares | Amount |
| Shares sold | 36,146 | $1,294,014 | 31,520 | $1,211,858 |
| Shares issued to shareholders in payment of distributions declared | 54,179 | 1,877,852 | 44,122 | 1,571,618 |
| Shares redeemed | (68,330) | (2,467,271) | (57,534) | (2,219,267) |
| NET CHANGE RESULTING FROM CLASS C SHARE TRANSACTIONS | 21,995 | $704,595 | 18,108 | $564,209 |
| Year Ended October 31 | 2015 | 2014 |
| Class R Shares: | Shares | Amount | Shares | Amount |
| Shares sold | 8,887 | $380,525 | 7,079 | $317,567 |
| Shares issued to shareholders in payment of distributions declared | 7,249 | 297,934 | 14,036 | 576,474 |
| Shares redeemed | (17,282) | (727,507) | (73,503) | (3,125,174) |
| NET CHANGE RESULTING FROM CLASS R SHARE TRANSACTIONS | (1,146) | $(49,048) | (52,388) | $(2,231,133) |
| Year Ended October 31 | 2015 | 2014 |
| Institutional Shares: | Shares | Amount | Shares | Amount |
| Shares sold | 175,799 | $7,915,283 | 257,873 | $12,218,436 |
| Shares issued to shareholders in payment of distributions declared | 238,637 | 10,321,045 | 246,509 | 10,540,705 |
| Shares redeemed | (815,710) | (36,502,566) | (920,144) | (41,407,066) |
| NET CHANGE RESULTING FROM INSTITUTIONAL SHARE TRANSACTIONS | (401,274) | $(18,266,238) | (415,762) | $(18,647,925) |
| NET CHANGE RESULTING FROM TOTAL FUND SHARE TRANSACTIONS | (173,352) | $(9,799,728) | (330,752) | $(17,237,938) |
4. FEDERAL TAX INFORMATION
The timing and character of income and capital gain distributions are determined in accordance with income tax regulations, which may differ from GAAP. These differences are due in part to differing treatments for regulatory settlement proceeds and partnership income reclassifications.
Annual Shareholder Report
For the year ended October 31, 2015, permanent differences identified and reclassified among the components of net assets were as follows:
| Increase (Decrease) |
| Paid-In Capital | Undistributed
Net Investment
Income (Loss) | Accumulated
Net Realized
Gain (Loss) |
| $(4,108) | $(54,919) | $59,027 |
Net investment income (loss), net realized gains (losses) and net assets were not affected by this reclassification.
The tax character of distributions as reported on the Statement of Changes in Net Assets for the years ended October 31, 2015 and 2014, was as follows:
| | 2015 | 2014 |
| Ordinary income1 | $20,777,922 | $11,404,227 |
| Long-term capital gains | $29,928,726 | $34,501,064 |
| 1 | For tax purposes, short-term capital gain distributions are considered ordinary income distributions. |
As of October 31, 2015, the components of distributable earnings on a tax-basis were as follows:
| Undistributed long-term capital gains | $60,823,085 |
| Net unrealized appreciation | $13,168,010 |
| Capital loss carryforwards and deferrals | $(1,075,076) |
The difference between book-basis and tax-basis net unrealized appreciation/depreciation is attributable to differing treatments for the deferral of losses on wash sales.
At October 31, 2015, the cost of investments for federal tax purposes was $299,352,723. The net unrealized appreciation of investments for federal tax purposes was $13,168,010. This consists of net unrealized appreciation from investments for those securities having an excess of value over cost of $36,531,433 and net unrealized depreciation from investments for those securities having an excess of cost over value of $23,363,423.
At October 31, 2015, the Fund had a capital loss carryforward of $806,753 which will reduce the Fund's taxable income arising from future net realized gains on investments, if any, to the extent permitted by the Code, thereby reducing the amount of distributions to shareholders which would otherwise be necessary to relieve the Fund of any liability for federal income tax. Pursuant to the Code, a net capital loss incurred in taxable years beginning on or before December 22, 2010, is characterized as short-term and may be carried forward for a maximum of eight tax years (“Carryforward Limit”), whereas a net capital loss incurred in taxable years beginning after December 22, 2010, retains its character as either short-term or long-term, does not expire and is required to be utilized prior to the losses which have a Carryforward Limit.
Annual Shareholder Report
The following schedule summarizes the Fund's capital loss carryforwards and expiration years:
| Expiration Year | Short-Term | Long-Term | Total |
| 2016 | $806,753 | NA | $806,753 |
The Fund used capital loss carryforwards of $989,975 to offset capital gains realized during the year ended October 31, 2015.
As a result of the September 2012 tax-free transfer of assets from Performance Leaders Equity Fund, certain capital loss carryforwards listed above may be limited.
Under current tax rules, a late-year ordinary loss may be deferred, in whole or in part, and treated as occurring on the first day of the following fiscal year. As of October 31, 2015, for federal income tax purposes, a late year ordinary loss of $268,323 was deferred to November 1, 2015.
5. INVESTMENT ADVISER FEE AND OTHER TRANSACTIONS WITH AFFILIATES
Investment Adviser Fee
The advisory agreement between the Fund and the Adviser provides for an annual fee equal to 0.75% of the Fund's average daily net assets. Subject to the terms described in the Expense Limitation note, the Adviser may voluntarily choose to waive any portion of its fee and/or reimburse certain operating expenses of the Fund. For the year ended October 31, 2015, the Adviser voluntarily waived $21,131 of its fee and voluntarily reimbursed $201,380 of transfer agent fees.
Administrative Fee
Federated Administrative Services (FAS), under the Administrative Services Agreement, provides the Fund with administrative personnel and services. For purposes of determining the appropriate rate breakpoint, “Investment Complex” is defined as all of the Federated Funds subject to a fee under the Administrative Services Agreement. The fee paid to FAS is based on the average daily net assets of the Investment Complex as specified below, plus certain out-of-pocket expenses:
| Administrative Fee | Average Daily Net Assets
of the Investment Complex |
| 0.150% | on the first $5 billion |
| 0.125% | on the next $5 billion |
| 0.100% | on the next $10 billion |
| 0.075% | on assets in excess of $20 billion |
Annual Shareholder Report
Subject to the terms described in the Expense Limitation note, FAS may voluntarily choose to waive any portion of its fee. For the year ended October 31, 2015, the annualized fee paid to FAS was 0.078% of average daily net assets of the Fund.
Distribution Services Fee
The Fund has adopted a Distribution Plan (the “Plan”) pursuant to Rule 12b-1 under the Act. Under the terms of the Plan, the Fund will compensate Federated Securities Corp. (FSC), the principal distributor, from the daily net assets of the Fund's Class B Shares, Class C Shares and Class R Shares to finance activities intended to result in the sale of these shares. The Plan provides that the Fund may incur distribution expenses at the following percentages of average daily net assets annually, to compensate FSC:
| Share Class Name | Percentage of Average Daily
Net Assets of Class |
| Class B Shares | 0.75% |
| Class C Shares | 0.75% |
| Class R Shares | 0.50% |
Subject to the terms described in the Expense Limitation note, FSC may voluntarily choose to waive any portion of its fee. For the year ended October 31, 2015, distribution services fees for the Fund were as follows:
| | Distribution Services
Fees Incurred |
| Class B Shares | $29,165 |
| Class C Shares | 93,615 |
| Class R Shares | 9,947 |
| TOTAL | $132,727 |
When FSC receives fees, it may pay some or all of them to financial intermediaries whose customers purchase shares. For the year ended October 31, 2015, FSC retained $28,512 of fees paid by the Fund.
Sales Charges
Front-end sales charges and contingent deferred sales charges (CDSC) do not represent expenses of the Fund. They are deducted from the proceeds of sales of Fund shares prior to investment or from redemption proceeds prior to remittance, as applicable. For the year ended October 31, 2015, FSC retained $11,277 in sales charges from the sale of Class A Shares. FSC also retained $4,476 of CDSC relating to redemptions of Class B Shares and $748 relating to redemptions of Class C Shares.
Other Service Fees
For the year ended October 31, 2015, FSSC received $47,049 of the other service fees disclosed in Note 2.
Annual Shareholder Report
Expense Limitation
The Adviser and certain of its affiliates (which may include FSC, FAS and FSSC) on their own initiative have agreed to waive certain amounts of their respective fees and/or reimburse expenses. Total annual fund operating expenses (as shown in the financial highlights, excluding extraordinary expenses, expense allocated from affiliated partnerships and proxy-related expenses paid by the Fund, if any) paid by the Fund's Class A Shares, Class B Shares, Class C Shares, Class R Shares and Institutional Shares (after the voluntary waivers and/or reimbursements) will not exceed 1.22%, 1.97%, 1.97%, 1.72% and 0.97% (the “Fee Limit”), respectively, up to but not including the later of (the “Termination Date”): (a) January 1, 2017; or (b) the date of the Fund's next effective Prospectus. While the Adviser and its applicable affiliates currently do not anticipate terminating or increasing these arrangements prior to the Termination Date, these arrangements may only be terminated or the Fee Limit increased prior to the Termination Date with the agreement of the Trustees.
General
Certain Officers and Trustees of the Fund are Officers and Directors or Trustees of certain of the above companies. To efficiently facilitate payment, Directors'/Trustees' fees and certain expenses related to conducting meetings of the Directors/Trustees and other miscellaneous expenses are paid by an affiliate of the Adviser which in due course are reimbursed by the Fund. Such expenses may be included in Accrued and Miscellaneous Expenses on the Statement of Assets and Liabilities and Statement of Operations, respectively.
Transactions Involving Affiliated Holdings
Affiliated holdings are investment companies which are managed by the Adviser or an affiliate of the Adviser. The Adviser has agreed to reimburse the Fund for certain investment adviser fees as a result of transactions in other affiliated investment companies. For the year ended October 31, 2015, the Adviser reimbursed $6,801. Transactions involving the affiliated holding during the year ended October 31, 2015, were as follows:
| | Federated
Prime Value
Obligations Fund,
Institutional Shares |
| Balance of Shares Held 10/31/2014 | 6,129,933 |
| Purchases/Additions | 46,574,182 |
| Sales/Reductions | (47,029,962) |
| Balance of Shares Held 10/31/2015 | 5,674,153 |
| Value | $5,674,153 |
| Dividend Income | $6,007 |
6. Investment TRANSACTIONS
Purchases and sales of investments, excluding long-term U.S. government securities and short-term obligations, for the year ended October 31, 2015, were as follows:
| Purchases | $413,854,636 |
| Sales | $473,246,184 |
Annual Shareholder Report
7. LINE OF CREDIT
The Fund participates in a $100,000,000 unsecured, uncommitted revolving line of credit (LOC) agreement with PNC Bank. The LOC was made available for extraordinary or emergency purposes, primarily for financing redemption payments. Borrowings are charged interest at a rate offered to the Fund by PNC Bank at the time of the borrowing. As of October 31, 2015, there were no outstanding loans. During the year ended October 31, 2015, the Fund did not utilize the LOC.
8. INTERFUND LENDING
Pursuant to an Exemptive Order issued by the Securities and Exchange Commission, the Fund, along with other funds advised by subsidiaries of Federated Investors, Inc., may participate in an interfund lending program. This program provides an alternative credit facility allowing the Fund to borrow from other participating affiliated funds. As of October 31, 2015, there were no outstanding loans. During the year ended October 31, 2015, the program was not utilized.
9. FEDERAL TAX INFORMATION (UNAUDITED)
For the year ended October 31, 2015, the amount of long-term capital gains designated by the Fund was $29,928,726.
For the fiscal year ended October 31, 2015, 33.9% of total ordinary income (including short-term capital gain) distributions made by the Fund are qualifying dividends which may be subject to a maximum tax rate of 15%, as provided for by the Jobs and Growth Tax Relief Act of 2003. Complete information is reported in conjunction with the reporting of your distributions on Form 1099-DIV.
Of the ordinary income (including short-term capital gain) distributions made by the Fund during the year ended October 31, 2015, 32.8% qualify for the dividend received deduction available to corporate shareholders.
Annual Shareholder Report
Report of Independent Registered Public Accounting Firm
TO THE BOARD OF TRUSTEES OF THE FEDERATED EQUITY FUNDS AND SHAREHOLDERS OF FEDERATED MDT MID CAP GROWTH STRATEGIES FUND:
We have audited the accompanying statement of assets and liabilities, including the portfolio of investments, of the Federated MDT Mid Cap Growth Strategies Fund (the “Fund”), a portfolio of Federated Equity Funds, as of October 31, 2015, and the related statement of operations for the year then ended, the statements of changes in net assets for each of the years in the two-year period then ended, and the financial highlights for each of the years or periods in the five-year period then ended. These financial statements and financial highlights are the responsibility of the Fund's management. Our responsibility is to express an opinion on these financial statements and financial highlights based on our audits.
We conducted our audits in accordance with the standards of the Public Company Accounting Oversight Board (United States). Those standards require that we plan and perform the audit to obtain reasonable assurance about whether the financial statements and financial highlights are free of material misstatement. An audit includes examining, on a test basis, evidence supporting the amounts and disclosures in the financial statements. Our procedures included confirmation of securities owned as of October 31, 2015, by correspondence with the custodian, and brokers. An audit also includes assessing the accounting principles used and significant estimates made by management, as well as evaluating the overall financial statement presentation. We believe that our audits provide a reasonable basis for our opinion.
In our opinion, the financial statements and financial highlights referred to above present fairly, in all material respects, the financial position of the Federated MDT Mid Cap Growth Strategies Fund as of October 31, 2015, and the results of its operations for the year then ended, the changes in its net assets for each of the years in the two-year period then ended, and the financial highlights for each of the years or periods in the five-year period then ended, in conformity with U.S. generally accepted accounting principles.
Boston, Massachusetts
December 23, 2015
Annual Shareholder Report
Shareholder Expense Example (unaudited)
As a shareholder of the Fund, you incur two types of costs: (1) transaction costs, including sales charges (“loads”) on purchase or redemption payments; and (2) ongoing costs, including management fees and to the extent applicable, distribution (12b-1) fees and/or other service fees and other Fund expenses. This Example is intended to help you to understand your ongoing costs (in dollars) of investing in the Fund and to compare these costs with the ongoing costs of investing in other mutual funds. It is based on an investment of $1,000 invested at the beginning of the period and held for the entire period from May 1, 2015 to October 31, 2015.
ACTUAL EXPENSES
The first section of the table below provides information about actual account values and actual expenses. You may use the information in this section, together with the amount you invested, to estimate the expenses that you incurred over the period. Simply divide your account value by $1,000 (for example, an $8,600 account value divided by $1,000 = 8.6), then multiply the result by the number in the first section under the heading entitled “Expenses Paid During Period” to estimate the expenses attributable to your investment during this period.
HYPOTHETICAL EXAMPLE FOR COMPARISON PURPOSES
The second section of the table below provides information about hypothetical account values and hypothetical expenses based on the Fund's actual expense ratio and an assumed rate of return of 5% per year before expenses, which is not the Fund's actual return. Thus, you should not use the hypothetical account values and expenses to estimate the actual ending account balance or your expenses for the period. Rather, these figures are required to be provided to enable you to compare the ongoing costs of investing in the Fund with other funds. To do so, compare this 5% hypothetical example with the 5% hypothetical examples that appear in the shareholder reports of the other funds.
Annual Shareholder Report
Please note that the expenses shown in the table are meant to highlight your ongoing costs only and do not reflect any transaction costs, such as sales charges (“loads”) on purchase or redemption payments. Therefore, the second section of the table is useful in comparing ongoing costs only, and will not help you determine the relative total costs of owning different funds. In addition, if these transaction costs were included, your costs would have been higher.
| | Beginning
Account Value
5/1/2015 | Ending
Account Value
10/31/2015 | Expenses Paid
During Period1 |
| Actual: | | | |
| Class A Shares | $1,000 | $958.90 | $6.02 |
| Class B Shares | $1,000 | $955.00 | $9.71 |
| Class C Shares | $1,000 | $955.10 | $9.71 |
| Class R Shares | $1,000 | $956.60 | $8.35 |
| Institutional Shares | $1,000 | $959.90 | $4.83 |
Hypothetical (assuming a 5% return
before expenses): | | | |
| Class A Shares | $1,000 | $1,019.06 | $6.21 |
| Class B Shares | $1,000 | $1,015.27 | $10.01 |
| Class C Shares | $1,000 | $1,015.27 | $10.01 |
| Class R Shares | $1,000 | $1,016.69 | $8.59 |
| Institutional Shares | $1,000 | $1,020.27 | $4.99 |
| 1 | Expenses are equal to the Fund's annualized net expense ratios, multiplied by the average account value over the period, multiplied by 184/365 (to reflect the one-half-year period). The annualized net expense ratios are as follows: |
| | |
| Class A Shares | 1.22% |
| Class B Shares | 1.97% |
| Class C Shares | 1.97% |
| Class R Shares | 1.69% |
| Institutional Shares | 0.98% |
Annual Shareholder Report
Board of Trustees and Trust Officers
The Board of Trustees is responsible for managing the Trust's business affairs and for exercising all the Trust's powers except those reserved for the shareholders. The following tables give information about each Trustee and the senior officers of the Fund. Where required, the tables separately list Trustees who are “interested persons” of the Fund (i.e., “Interested” Trustees) and those who are not (i.e., “Independent” Trustees). Unless otherwise noted, the address of each person listed is Federated Investors Tower, 1001 Liberty Avenue, Pittsburgh, PA 15222. The address of all Independent Trustees listed is 4000 Ericsson Drive, Warrendale, PA 15086-7561; Attention: Mutual Fund Board. As of December 31, 2014, the Trust comprised 14 portfolio(s), and the Federated Fund Family consisted of 40 investment companies (comprising 131 portfolios). Unless otherwise noted, each Officer is elected annually. Unless otherwise noted, each Trustee oversees all portfolios in the Federated Fund Family and serves for an indefinite term. The Fund's Statement of Additional Information includes additional information about Trust Trustees and is available, without charge and upon request, by calling 1-800-341-7400.
Interested TRUSTEES Background
Name
Birth Date
Positions Held with Trust
Date Service Began | Principal Occupation(s) for Past Five Years,
Other Directorships Held and Previous Position(s) |
John F. Donahue*
Birth Date: July 28, 1924
Trustee
Indefinite Term
Began serving: April 1984 | Principal Occupations: Director or Trustee of the Federated Fund Family; Chairman and Director, Federated Investors, Inc.; Chairman of the Federated Fund Family's Executive Committee.
Previous Positions: Chairman of the Federated Fund Family; Trustee, Federated Investment Management Company; Chairman and Director, Federated Investment Counseling. |
J. Christopher Donahue*
Birth Date: April 11, 1949
President and Trustee
Indefinite Term
Began serving: January 2000 | Principal Occupations: Principal Executive Officer and President of certain of the Funds in the Federated Fund Family; Director or Trustee of the Funds in the Federated Fund Family; President, Chief Executive Officer and Director, Federated Investors, Inc.; Chairman and Trustee, Federated Investment Management Company; Trustee, Federated Investment Counseling; Chairman and Director, Federated Global Investment Management Corp.; Chairman, Federated Equity Management Company of Pennsylvania and Passport Research, Ltd. (investment advisory subsidiary of Federated); Trustee, Federated Shareholder Services Company; Director, Federated Services Company.
Previous Positions: President, Federated Investment Counseling; President and Chief Executive Officer, Federated Investment Management Company, Federated Global Investment Management Corp. and Passport Research, Ltd. |
| * | Family relationships and reasons for “interested” status: John F. Donahue is the father of J. Christopher Donahue; both are “interested” due to their beneficial ownership of shares of Federated Investors, Inc. and the positions they hold with Federated and its subsidiaries. |
Annual Shareholder Report
INDEPENDENT TRUSTEES Background
Name
Birth Date
Positions Held with Trust
Date Service Began | Principal Occupation(s) for Past Five Years,
Other Directorships Held, Previous Position(s) and Qualifications |
John T. Collins
Birth Date: January 24, 1947
Trustee
Indefinite Term
Began serving: October 2013 | Principal Occupations: Director or Trustee of the Federated Fund Family; Chairman and CEO, The Collins Group, Inc. (a private equity firm).
Other Directorships Held: Director, Chair of the Compensation Committee, Audit Committee member, KLX Corp.
Qualifications: Mr. Collins has served in several business and financial management roles and directorship positions throughout his career. Mr. Collins serves as Chairman Emeriti, Bentley University. Mr. Collins previously served as Director, FleetBoston Financial Corp.; Director and Audit Committee Member, Bank of America Corp. and Director, Beth Israel Deaconess Medical Center (Harvard University Affiliate Hospital). |
G. Thomas Hough
Birth Date: February 28, 1955
Trustee
Indefinite Term
Began serving: August 2015 | Principal Occupations: Director or Trustee of the Federated Fund Family; Retired.
Other Directorships Held: Director, Chair of the Audit Committee, Governance Committee, Publix Super Markets, Inc.
Qualifications: Mr. Hough has served in accounting, business management and directorship positions throughout his career. Mr. Hough most recently held the position of Americas Vice Chair of Assurance with Ernst & Young LLP. Mr. Hough is an Executive Committee member of the United States Golf Association, he serves on the President's Cabinet and Business School Board of Visitors for the University of Alabama and is on the Business School Board of Visitors for Wake Forest University. |
Maureen Lally-Green
Birth Date: July 5, 1949
Trustee
Indefinite Term
Began serving: August 2009 | Principal Occupations: Director or Trustee of the Federated Fund Family; Adjunct Professor of Law, Duquesne University School of Law.
Other Directorships Held: Director, CONSOL Energy Inc.
Qualifications: Judge Lally-Green has served in various legal and business roles and directorship positions throughout her career. Judge Lally-Green previously served as: Associate General Secretary, Diocese of Pittsburgh; Professor of Law, Duquesne University School of Law and was a member of the Superior Court of Pennsylvania. Judge Lally-Green also holds the positions of: Member, Pennsylvania State Board of Education; Director, Saint Vincent College; Director and Chair, UPMC Mercy Hospital; Regent, St. Vincent Seminary; Director, Epilepsy Foundation of Western and Central Pennsylvania; Director, Our Campaign for the Church Alive!, Inc.; Director, Pennsylvania Bar Institute; and Director, Cardinal Wuerl North Catholic High School, Inc. Judge Lally-Green has held the positions of: Director, Auberle; Director, Ireland Institute of Pittsburgh; Director, Saint Thomas More Society; and Director, Catholic High Schools of the Diocese of Pittsburgh, Inc. |
Annual Shareholder Report
Name
Birth Date
Positions Held with Trust
Date Service Began | Principal Occupation(s) for Past Five Years,
Other Directorships Held, Previous Position(s) and Qualifications |
Peter E. Madden
Birth Date: March 16, 1942
Trustee
Indefinite Term
Began serving: November 1991 | Principal Occupation: Director or Trustee, and Chair of the Board of Directors or Trustees, of the Federated Fund Family; Retired.
Other Directorships Held: None.
Qualifications: Mr. Madden has served in several business management, mutual fund services and directorship positions throughout his career. Mr. Madden previously served as President, Chief Operating Officer and Director, State Street Bank and Trust Company (custodian bank) and State Street Corporation (financial services). He was Director, VISA USA and VISA International and Chairman and Director, Massachusetts Bankers Association. Mr. Madden served as Director, Depository Trust Corporation and Director, The Boston Stock Exchange. Mr. Madden also served as a Representative to the Commonwealth of Massachusetts General Court. |
Charles F. Mansfield, Jr.
Birth Date: April 10, 1945
Trustee
Indefinite Term
Began serving: January 1999 | Principal Occupations: Director or Trustee of the Federated Fund Family; Management Consultant.
Other Directorships Held: None.
Qualifications: Mr. Mansfield has served in several banking, business management and educational roles and directorship positions throughout his career. Mr. Mansfield previously served as Chief Executive Officer, PBTC International Bank; Partner, Arthur Young & Company (now Ernst & Young LLP); Chief Financial Officer of Retail Banking Sector, Chase Manhattan Bank; Senior Vice President, HSBC Bank USA (formerly, Marine Midland Bank); Vice President, Citibank; Assistant Professor of Banking and Finance, Frank G. Zarb School of Business, Hofstra University; Executive Vice President DVC Group, Inc. (marketing, communications and technology). |
Thomas M. O'Neill
Birth Date: June 14, 1951
Trustee
Indefinite Term
Began serving: October 2006 | Principal Occupations: Director or Trustee, Vice Chair of the Audit Committee of the Federated Fund Family; Sole Proprietor, Navigator Management Company (investment and strategic consulting).
Other Directorships Held: None.
Qualifications: Mr. O'Neill has served in several business, mutual fund and financial management roles and directorship positions throughout his career. Mr. O'Neill serves as Director, Medicines for Humanity and Director, The Golisano Children's Museum of Naples, Florida. Mr. O'Neill previously served as Chief Executive Officer and President, Managing Director and Chief Investment Officer, Fleet Investment Advisors; President and Chief Executive Officer, Aeltus Investment Management, Inc.; General Partner, Hellman, Jordan Management Co., Boston, MA; Chief Investment Officer, The Putnam Companies, Boston, MA; Credit Analyst and Lending Officer, Fleet Bank; Director and Consultant, EZE Castle Software (investment order management software); and Director, Midway Pacific (lumber). |
Annual Shareholder Report
Name
Birth Date
Positions Held with Trust
Date Service Began | Principal Occupation(s) for Past Five Years,
Other Directorships Held, Previous Position(s) and Qualifications |
P. Jerome Richey
Birth Date: February 23, 1949
Trustee
Indefinite Term
Began serving: October 2013 | Principal Occupations: Director or Trustee of the Federated Fund Family; Management Consultant.
Other Directorships Held: None.
Qualifications: Mr. Richey has served in several business and legal management roles and directorship positions throughout his career. Mr. Richey most recently held the positions of Senior Vice Chancellor and Chief Legal Officer, University of Pittsburgh. Mr. Richey serves as Board Member, Epilepsy Foundation of Western Pennsylvania and Board member, World Affairs Council of Pittsburgh. Mr. Richey previously served as Chief Legal Officer and Executive Vice President, CONSOL Energy Inc. and Shareholder, Buchanan Ingersoll & Rooney PC (a law firm). |
John S. Walsh
Birth Date: November 28, 1957
Trustee
Indefinite Term
Began serving: January 1999 | Principal Occupations: Director or Trustee, Chair of the Audit Committee of the Federated Fund Family; President and Director, Heat Wagon, Inc. (manufacturer of construction temporary heaters); President and Director, Manufacturers Products, Inc. (distributor of portable construction heaters); President, Portable Heater Parts, a division of Manufacturers Products, Inc.
Other Directorships Held: None.
Qualifications: Mr. Walsh has served in several business management roles and directorship positions throughout his career. Mr. Walsh previously served as Vice President, Walsh & Kelly, Inc. (paving contractors). |
OFFICERS
Name
Birth Date
Address
Positions Held with Trust
Date Service Began | Principal Occupation(s) for Past Five Years
and Previous Position(s) |
John W. McGonigle
Birth Date: October 26, 1938
EXECUTIVE VICE PRESIDENT AND SECRETARY
Officer since: April 1984 | Principal Occupations: Executive Vice President and Secretary of the Federated Fund Family; Vice Chairman, Executive Vice President, Secretary and Director, Federated Investors, Inc.
Previous Positions: Trustee, Federated Investment Management Company and Federated Investment Counseling; Director, Federated Global Investment Management Corp., Federated Services Company and Federated Securities Corp. |
Annual Shareholder Report
Name
Birth Date
Address
Positions Held with Trust
Date Service Began | Principal Occupation(s) for Past Five Years
and Previous Position(s) |
Lori A. Hensler
Birth Date: January 6, 1967
TREASURER
Officer since: April 2013 | Principal Occupations: Principal Financial Officer and Treasurer of the Federated Fund Family; Senior Vice President, Federated Administrative Services; Financial and Operations Principal for Federated Securities Corp. and Edgewood Services, Inc.; and Assistant Treasurer, Federated Investors Trust Company. Ms. Hensler has received the Certified Public Accountant designation.
Previous Positions: Controller of Federated Investors, Inc.; Senior Vice President and Assistant Treasurer, Federated Investors Management Company; Treasurer, Federated Investors Trust Company; Assistant Treasurer, Federated Administrative Services, Federated Administrative Services, Inc., Federated Securities Corp., Edgewood Services, Inc., Federated Advisory Services Company, Federated Equity Management Company of Pennsylvania, Federated Global Investment Management Corp., Federated Investment Counseling, Federated Investment Management Company, Passport Research, Ltd., and Federated MDTA, LLC; Financial and Operations Principal for Federated Securities Corp., Edgewood Services, Inc. and Southpointe Distribution Services, Inc. |
Richard B. Fisher
Birth Date: May 17, 1923
Vice President
Officer since: April 1987 | Principal Occupations: Vice Chairman or Vice President of some of the Funds in the Federated Fund Family; Vice Chairman, Federated Investors, Inc.; Chairman, Federated Securities Corp.
Previous Positions: President and Director or Trustee of some of the Funds in the Federated Fund Family; Executive Vice President, Federated Investors, Inc.; Director and Chief Executive Officer, Federated Securities Corp. |
Peter J. Germain
Birth Date: September 3, 1959
CHIEF LEGAL OFFICER
Officer since: January 2005 | Principal Occupations: Mr. Germain is Chief Legal Officer of the Federated Fund Family. He is General Counsel and Vice President, Federated Investors, Inc.; President, Federated Administrative Services and Federated Administrative Services, Inc.; Vice President, Federated Securities Corp.; Secretary, Federated Private Asset Management, Inc.; and Secretary, Retirement Plan Service Company of America. Mr. Germain joined Federated in 1984 and is a member of the Pennsylvania Bar Association.
Previous Positions: Deputy General Counsel, Special Counsel, Managing Director of Mutual Fund Services, Federated Investors, Inc.; Senior Vice President, Federated Services Company; and Senior Corporate Counsel, Federated Investors, Inc. |
Stephen Van Meter
Birth Date: June 5, 1975
CHIEF COMPLIANCE OFFICER AND SENIOR VICE PRESIDENT
Officer since: July 2015 | Principal Occupations: Senior Vice President and Chief Compliance Officer of the Federated Fund Family; Vice President and Chief Compliance Officer of Federated Investors, Inc. and Chief Compliance Officer of certain of its subsidiaries. Mr. Van Meter joined Federated in October 2011. He holds FINRA licenses under Series 3, 7, 24 and 66.
Previous Positions: Mr. Van Meter previously held the position of Compliance Operating Officer, Federated Investors, Inc. Prior to joining Federated, Mr. Van Meter served at the United States Securities and Exchange Commission in the positions of Senior Counsel, Office of Chief Counsel, Division of Investment Management and Senior Counsel, Division of Enforcement. |
Annual Shareholder Report
Name
Birth Date
Address
Positions Held with Trust
Date Service Began | Principal Occupation(s) for Past Five Years
and Previous Position(s) |
Stephen F. Auth
Birth Date: September 3, 1956
101 Park Avenue
41st Floor
New York, NY 10178
CHIEF INVESTMENT OFFICER
Officer since: November 2002 | Principal Occupations: Stephen F. Auth is Chief Investment Officer of various Funds in the Federated Fund Family; Executive Vice President, Federated Investment Counseling, Federated Global Investment Management Corp. and Federated Equity Management Company of Pennsylvania.
Previous Positions: Executive Vice President, Federated Investment Management Company and Passport Research, Ltd. (investment advisory subsidiary of Federated); Senior Vice President, Global Portfolio Management Services Division; Senior Vice President, Federated Investment Management Company and Passport Research, Ltd.; Senior Managing Director and Portfolio Manager, Prudential Investments. |
Annual Shareholder Report
Evaluation and Approval of Advisory Contract–May 2015
Federated MDT Mid Cap Growth Strategies Fund (the “Fund”)
Following a review and recommendation of approval by the Fund's independent trustees, the Fund's Board reviewed and approved at its May 2015 meetings the Fund's investment advisory contract for an additional one-year term. The Board's decision regarding the contract reflects the exercise of its business judgment on whether to continue the existing arrangements.
In this connection, the Federated Funds' Board had previously appointed a Senior Officer, whose duties include specified responsibilities relating to the process by which advisory fees are to be charged to a Federated fund. The Senior Officer has the authority to retain consultants, experts, or staff as may be reasonably necessary to assist in the performance of his duties, reports directly to the Board, and may be terminated only with the approval of a majority of the independent members of the Board. The Senior Officer prepared and furnished to the Board an independent, written evaluation that covered topics discussed below (the “Evaluation”). The Board considered that Evaluation, along with other information, in deciding to approve the advisory contract.
The Board is also familiar with and considered judicial decisions concerning allegedly excessive investment advisory fees, which have indicated that the following factors may be relevant to an Adviser's fiduciary duty with respect to its receipt of compensation from a fund: the nature and quality of the services provided by the Adviser to a fund and its shareholders, including the performance and expenses of the fund and of comparable funds; the Adviser's cost of providing the services, including the profitability to the Adviser of providing advisory services to a fund; the extent to which the Adviser may realize “economies of scale” as a fund grows larger and, if such economies of scale exist, whether they have been shared with a fund and its shareholders or the family of funds; any “fall-out financial benefits” that accrue to the Adviser because of its relationship with a fund (including research services received from brokers that execute fund trades and any fees paid to affiliates of the Adviser for services rendered to a fund); comparative fee structures, including a comparison of fees paid to the Adviser with those paid by similar funds; and the extent of care, conscientiousness and independence with which the Board members perform their duties and their expertise, including whether they are fully informed about all facts the Board deems relevant to its consideration of the Adviser's services and fees. The Board noted that SEC disclosure requirements regarding the basis for the Board's approval of the Fund's advisory contract generally track the factors listed above. Consistent with these judicial decisions and SEC disclosure requirements, the Board also considered management fees
Annual Shareholder Report
charged to institutional and other clients of the Adviser for what might be viewed as like services. The Board was aware of these factors and was guided by them in its review of the Fund's advisory contract to the extent it considered them to be appropriate and relevant, as discussed further below.
The Board considered and weighed these circumstances in light of its substantial accumulated experience in governing the Fund and working with Federated on matters relating to the Federated funds, and was assisted in its deliberations by independent legal counsel. Throughout the year, and in connection with its May meetings, the Board requested and received substantial and detailed information about the Fund and the Federated organization that was in addition to the extensive materials that comprise and accompany the Senior Officer's Evaluation. Federated provided much of this information at each regular meeting of the Board, and furnished additional substantial information in connection with the May meeting at which the Board's formal review of the advisory contract occurred. At this May meeting, senior management of the Adviser also met with the independent trustees and their counsel to discuss the materials presented and any other matters thought relevant by the Adviser or the trustees. Between regularly scheduled meetings, the Board also received information on particular matters as the need arose. Thus, the Board's consideration of the advisory contract included review of the Senior Officer's Evaluation, accompanying data and additional information covering such matters as: the Adviser's investment philosophy, revenue, profitability, personnel and processes; investment and operating strategies; the Fund's short- and long-term performance (in absolute terms, both on a gross basis and net of expenses, as well as in relationship to its particular investment program and certain competitor or “peer group” funds and/or other benchmarks, as appropriate), and comments on the reasons for performance; the Fund's investment objectives; the Fund's expenses (including the advisory fee itself and the overall expense structure of the Fund, both in absolute terms and relative to similar and/or competing funds, with due regard for contractual or voluntary expense limitations); the use and allocation of brokerage commissions derived from trading the Fund's portfolio securities (if any); and the nature, quality and extent of the advisory and other services provided to the Fund by the Adviser and its affiliates. The Board also considered the preferences and expectations of Fund shareholders; the entrepreneurial risk assumed by the Adviser in sponsoring the funds; the continuing state of competition in the mutual fund industry and market practices; the range of comparable fees for similar funds in the mutual fund industry; the Fund's relationship to the Federated family of funds which include a comprehensive array of funds with different investment objectives, policies and strategies which are available for exchange without the incurrence of additional sales charges; compliance and audit reports concerning the Federated funds and the Federated companies that service them (including communications from regulatory agencies), as well as Federated's responses to any issues raised therein; and relevant developments in
Annual Shareholder Report
the mutual fund industry and how the Federated funds and/or Federated are responding to them. The Board's evaluation process is evolutionary. The criteria considered and the emphasis placed on relevant criteria change in recognition of changing circumstances in the mutual fund marketplace.
While mindful that courts have cautioned against giving such comparisons too much weight, the Board has found the use of comparisons of the Fund's fees and expenses to other mutual funds with comparable investment programs to be relevant. In this regard, the Board was presented with, and considered, information regarding the contractual advisory fee rates, net advisory fee rates and total expense ratios relative to a fund's peers. The Board focused on comparisons with other similar mutual funds more heavily than non-mutual fund products or services because it is believed that they are more relevant. For example, other mutual funds are the products most like the Fund, they are readily available to Fund shareholders as alternative investment vehicles, and they are the type of investment vehicle in fact chosen and maintained by the Fund's investors. The range of their fees and expenses therefore appears to be a relevant indicator of what consumers have found to be reasonable in the precise marketplace in which the Fund competes.
The Board reviewed the contractual advisory fee rate, net advisory fee rate where partially waived and other expenses of the Fund and noted the position of the Fund's fee rates relative to its peers. In this regard, the Board noted that the contractual advisory fee rate was below the median of the relevant peer group and that it was satisfied that the overall expense structure of the Fund remained competitive.
By contrast, the Senior Officer has reviewed Federated's fees for providing advisory services to products outside the Federated family of funds (e.g., institutional and separate accounts and sub-adviser services). He concluded that mutual funds and institutional accounts are inherently different products. Those differences include, but are not limited to, different types of targeted investors; being subject to different laws and regulations; different legal structures; different average account sizes and portfolio management techniques made necessary by different cash flows and different associated costs; and the time spent by portfolio managers and their teams, funds financial services, legal, compliance and risk management in reviewing securities pricing, addressing different administrative responsibilities, addressing different degrees of risk associated with management and a variety of different costs. The Senior Officer did not consider these fee schedules to be determinative in judging the appropriateness of mutual fund advisory fees.
The Senior Officer noted that the services, administrative responsibilities and risks associated with such relationships are quite different than serving as a primary adviser to a fund.
Annual Shareholder Report
The Fund's ability to deliver competitive performance when compared to its peer group was also deemed to be relevant by the Board as a useful indicator of how the Adviser is executing the Fund's investment program, which in turn was one of the Board's considerations in reaching a conclusion that the nature, extent, and quality of the Adviser's investment management services were such as to warrant continuation of the advisory contract.
The Senior Officer reviewed information compiled by Federated, using data supplied by independent fund ranking organizations, regarding the performance of, and fees charged by, other mutual funds, noting his view that comparisons to fund peer groups may be helpful, though not conclusive, in judging the reasonableness of the proposed fees. The Board considered, in evaluating such comparisons, that in some cases individual funds may exhibit significant and unique differences in their objectives and management techniques when compared to other funds within an industry peer group, and that the Senior Officer had specifically noted that the Fund's quantitative focus makes fee and expense comparisons particularly difficult as the peer group of funds varied widely in their complexity, and the management of the Fund is among the more complex relative to its peers.
For the periods covered by the Evaluation, the Fund's performance for the one-year and three-year period was above the median of the relevant peer group, and the Fund's performance fell below the median of the relevant peer group for the five-year period. In addition, the Board was informed by the Adviser that, for the same periods, the Fund outperformed its benchmark index for the one-year period, underperformed its benchmark index for the three-year period and underperformed its benchmark index for the five-year period. The Board discussed the Fund's performance with the Adviser and recognized the efforts being undertaken by the Adviser. The Board will continue to monitor these efforts and the performance of the Fund in the context of the other factors considered relevant by the Board.
The Board also received financial information about Federated, including information regarding the compensation and benefits Federated derived from its relationships with the Federated funds. This information covered not only the fees under the advisory contracts, but also fees received by Federated's subsidiaries for providing other services to the Federated funds under separate contracts (e.g., for serving as the Federated funds' administrator). The information also detailed any indirect benefit Federated may derive from its receipt of research services from brokers who execute Federated fund trades. In addition, the Board considered the fact that, in order for a fund to be competitive in the marketplace, Federated and its affiliates frequently waived fees and/or reimbursed expenses and have disclosed to fund investors and/or indicated to the Board their intention to do so in the future, where appropriate. Moreover, the Board receives regular reporting as to the institution, adjustment or elimination of these voluntary waivers.
Annual Shareholder Report
In addition, over the past two years, following discussions regarding the Senior Officer's recommendations, Federated made meaningful reductions to the contractual advisory fees for several Funds. At the Board meeting in May 2015, following previous recommendations of the Senior Officer, Federated proposed, and the Board approved, reductions in the contractual advisory fees of certain other Funds.
Federated furnished information, requested by the Senior Officer, that reported revenues on a fund-by-fund basis and made estimates of the allocation of expenses on a fund-by-fund basis, using allocation methodologies specified by the Senior Officer. The Senior Officer noted that, while these cost allocation reports apply consistent allocation processes, the inherent difficulties in allocating costs continues to cause the Senior Officer to question the precision of the process and to conclude that such reports may be unreliable, since a single change in an allocation estimate may dramatically alter the resulting estimate of cost and/or profitability of a fund and may produce unintended consequences. The allocation information, including the Senior Officer's view that fund-by-fund estimations may be unreliable, was considered in the analysis by the Board.
The Board and the Senior Officer also reviewed information compiled by Federated comparing profitability information for Federated to other publicly held fund management companies. In this regard, the Senior Officer concluded that Federated's profit margins did not appear to be excessive. The Senior Officer also noted that Federated appeared financially sound, with the resources to fulfill its obligations under its contracts with the Funds.
The Senior Officer's Evaluation also discussed the notion of possible realization of “economies of scale” as a fund grows larger. The Board considered in this regard that the Adviser has made significant and long-term investments in areas that support all of the Federated family of funds, such as personnel and processes for the portfolio management, shareholder services, compliance, internal audit, and risk management functions; and systems technology; and that the benefits of these efforts (as well as any economies of scale, should they exist) were likely to be enjoyed by the fund family as a whole. Federated, as it does throughout the year, and again in connection with the Board's review, furnished information relative to revenue sharing or adviser paid fees. Federated and the Senior Officer noted that this information should be viewed to determine if there was an incentive to either not apply breakpoints or to apply breakpoints at higher levels and should not be viewed to determining the appropriateness of advisory fees, because it would represent marketing and distribution expenses. Finally, the Board also noted the absence of any applicable regulatory or industry guidelines on this subject, which (as discussed in the Senior Officer's Evaluation) is compounded by the lack of any common industry practice or general pattern with respect to structuring fund advisory fees with “breakpoints” that serve to reduce the fee as the fund attains a certain size.
Annual Shareholder Report
The Senior Officer noted that, subject to the comments and recommendations made within his Evaluation, his observations and the information accompanying the Evaluation supported a finding by the Board that the management fees for each of the funds were reasonable. Under these circumstances, no changes were recommended to, and no objection was raised to, the continuation of the Fund's advisory contract.
In its decision to continue an existing investment advisory contract, the Board was mindful of the potential disruptions of the Fund's operations and various risks, uncertainties and other effects that could occur as a result of a decision to terminate or not renew an advisory contract. In particular, the Board recognized that many shareholders have invested in the Fund on the strength of the Adviser's industry standing and reputation and with the expectation that the Adviser will have a continuing role in providing advisory services to the Fund. Thus, the Board's approval of the advisory contract reflected the fact that it is the shareholders who have effectively selected the Adviser by virtue of having invested in the Fund. The Board concluded that, in light of the factors discussed above, including the nature, quality and scope of the services provided to the Fund by the Adviser and its affiliates, continuation of the advisory contract was appropriate.
The Board based its decision to approve the advisory contract on the totality of the circumstances and relevant factors and with a view to past and future long-term considerations. Not all of the factors and considerations identified above were necessarily relevant to the Fund, nor did the Board consider any one of them to be determinative. With respect to the factors that were relevant, the Board's decision to approve the contract reflects its determination that Federated's performance and actions provided a satisfactory basis to support the decision to continue the existing arrangements.
Annual Shareholder Report
Voting Proxies on Fund Portfolio Securities
A description of the policies and procedures that the Fund uses to determine how to vote proxies, if any, relating to securities held in the Fund's portfolio is available, without charge and upon request, by calling 1-800-341-7400. A report on “Form N-PX” of how the Fund voted any such proxies during the most recent 12-month period ended June 30 is available via the Proxy Voting Record (Form N-PX) link associated with the Fund and share class name at www.FederatedInvestors.com/FundInformation. Form N-PX filings are also available at the SEC's website at www.sec.gov.
Quarterly Portfolio Schedule
The Fund files with the SEC a complete schedule of its portfolio holdings, as of the close of the first and third quarters of its fiscal year, on “Form N-Q.” These filings are available on the SEC's website at www.sec.gov and may be reviewed and copied at the SEC's Public Reference Room in Washington, DC. (Call 1-800-SEC-0330 for information on the operation of the Public Reference Room.) You may also access this information via the link to the Fund and share class name at www.FederatedInvestors.com/FundInformation.
Annual Shareholder Report
Mutual funds are not bank deposits or obligations, are not guaranteed by any bank and are not insured or guaranteed by the U.S. government, the Federal Deposit Insurance Corporation, the Federal Reserve Board or any other government agency. Investment in mutual funds involves investment risk, including the possible loss of principal.
This Report is authorized for distribution to prospective investors only when preceded or accompanied by the Fund's Prospectus, which contains facts concerning its objective and policies, management fees, expenses and other information.
Federated MDT Mid Cap Growth Strategies Fund
Federated Investors Funds
4000 Ericsson Drive
Warrendale, PA 15086-7561
Contact us at FederatedInvestors.com
or call 1-800-341-7400.
Federated Securities Corp., Distributor
CUSIP 314172107
CUSIP 314172206
CUSIP 314172305
CUSIP 314172529
CUSIP 314172198
G01228-08 (12/15)
Federated is a registered trademark of Federated Investors, Inc.
2015 ©Federated Investors, Inc.
Annual Shareholder Report
October 31, 2015
| Share Class | Ticker |
| A | FMAAX |
| B | FMBBX |
| C | FMRCX |
| Institutional | FMIIX |
Federated Absolute Return Fund
Fund Established 2000
A Portfolio of Federated Equity Funds
Dear Valued Shareholder,
I am pleased to present the Annual Shareholder Report for your fund covering the period from November 1, 2014 through October 31, 2015. This report includes Management's Discussion of Fund Performance, a complete listing of your fund's holdings, performance information and financial statements along with other important fund information.
In addition, our website, FederatedInvestors.com, offers easy access to Federated resources that include timely fund updates, economic and market insights from our investment strategists, and financial planning tools. We invite you to register to take full advantage of its capabilities.
Thank you for investing with Federated. I hope you find this information useful and look forward to keeping you informed.
Sincerely,
J. Christopher Donahue, President
Not FDIC Insured • May Lose Value • No Bank Guarantee
CONTENTS
| 1 |
| 5 |
| 7 |
| 19 |
| 23 |
| 25 |
| 26 |
| 27 |
| 42 |
| 43 |
| 45 |
| 51 |
| 57 |
| 57 |
Management's Discussion of Fund Performance (unaudited)
The total return of Federated Absolute Return Fund (the “Fund”), based on net asset value for the 12-month reporting period ended October 31, 2015, was 3.45% for Class A Shares, 2.62% for Class B Shares, 2.64% for Class C Shares and 3.69% for Institutional Shares. The total return of the BofA Merrill Lynch U.S. 3-Month Treasury Bill Index (BAML3MT),1 the Fund's broad-based securities market index (formerly BofA Merrill Lynch 91-Day Treasury Bill Index), was 0.02%. The total return of the Lipper Absolute Return Funds Average (LARFA),2 a peer group average for the Fund, was -0.75%. The Fund's and LARFA's total returns for the most recently completed fiscal year reflected actual cash flows, transaction costs and other expenses which were not reflected in the total return of the BAML3MT.
The Fund's investment strategy during the reporting period focused on long and short3 positions in equities and use of derivatives.4 These were the most significant factors affecting the Fund's performance relative to the BAML3MT.
The following discussion will focus on the performance of the Fund's Institutional Shares.
MARKET OVERVIEW
It was a positive reporting period for the U.S. stock market. However, the disparity of equity returns around the globe was wide. Developed market equities generally produced positive returns, while emerging market equities generally produced negative returns.
During the reporting period, the U.S. dollar strengthened considerably and China industrial production continued to slow. This environment caused non-U.S. currencies, commodities, and commodity-driven companies and countries to generally underperform. Also notable was the bout of volatility in August through September, a situation which mostly subsided by the end of the reporting period.
LONG positions
The long equity positions contributed 6.0% to the Fund return (this return and those below are gross figures). The equity sectors for which the Fund's holdings produced the largest positive contribution to Fund performance were Health Care and Information Technology. The equity sector for which the Fund's holdings negatively affected Fund performance was Energy.
SHORT positions
The short equity positions contributed 1.4% to the Fund return. The equity sectors/countries for which the Fund's short positions produced the largest positive contribution to Fund performance were emerging markets, Australia and Japan.
Annual Shareholder Report
Derivatives positions
The short equity derivative positions detracted 2.9% from the Fund return (which includes losses from shorting equity index futures and from long equity put option positions). Both equity index futures and equity put options were used throughout the reporting period. The purpose of these derivative positions was to reach the desired Fund net equity market exposure and reduce the Fund's correlation to the U.S. equity market.
The Fund invested in currency forward and currency option contracts for both active exposures to currencies and for hedging currency risks of international stock holdings. These currency derivatives positions added 0.4% to Fund performance.
| 1 | Please see the footnotes to the line graphs below for definitions of, and further information about, the BAML3MT. |
| 2 | Please see the footnotes to the line graphs below for definitions of, and further information about, the LARFA. |
| 3 | The Fund may make short sales of securities, which involves unlimited risk including the possibility that losses may exceed the original amount invested. |
| 4 | The Fund's use of derivative instruments involves risks different from, or possibly greater than, the risks associated with investing directly in securities and other traditional instruments. |
Annual Shareholder Report
FUND PERFORMANCE AND GROWTH OF A $10,000 INVESTMENT
The graph below illustrates the hypothetical investment of $10,0001 in the Federated Absolute Return Fund (the “Fund”) from October 31, 2005 to October 31, 2015, compared to the BofA Merrill Lynch U.S. 3-Month Treasury Bill Index (BAML3MT)2 and the Lipper Absolute Return Funds Average (LARFA).3 The Average Annual Total Return table below shows returns for each class averaged over the stated periods.
Growth of a $10,000 Investment
Growth of $10,000 as of October 31, 2015
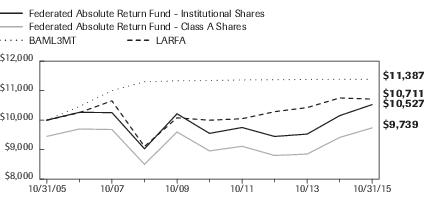
| Federated Absolute Return Fund - | Institutional Shares | Class A Shares | BAML3MT | LARFA |
| F | F | I | I |
| 10/31/2005 | 10,000 | 9,450 | 10,000 | 10,000 |
| 10/31/2006 | 10,264 | 9,699 | 10,462 | 10,254 |
| 10/31/2007 | 10,255 | 9,682 | 10,999 | 10,654 |
| 10/31/2008 | 9,030 | 8,503 | 11,298 | 9,107 |
| 10/31/2009 | 10,215 | 9,598 | 11,332 | 10,079 |
| 10/31/2010 | 9,552 | 8,958 | 11,345 | 9,997 |
| 10/31/2011 | 9,750 | 9,114 | 11,360 | 10,048 |
| 10/31/2012 | 9,447 | 8,803 | 11,369 | 10,286 |
| 10/31/2013 | 9,527 | 8,849 | 11,379 | 10,424 |
| 10/31/2014 | 10,152 | 9,414 | 11,385 | 10,752 |
| 10/31/2015 | 10,527 | 9,739 | 11,387 | 10,711 |
41 graphic description end -->
| ■ | Total returns shown for Class A Shares include the maximum sales charge of 5.50% ($10,000 investment minus $550 sales charge = $9,450). |
The Fund offers multiple share classes whose performance may be greater than or less than its other share class(es) due to differences in sales charges and expenses. See the Average Annual Total Return table below for the returns of additional classes not shown in the line graph above.
Average Annual Total Returns for the Period Ended 10/31/2015
(returns reflect all applicable sales charges and contingent deferred sales charges as specified below in footnote #1)
| | 1 Year | 5 Years | 10 Years |
| Class A Shares | -2.28% | 0.54% | -0.26% |
| Class B Shares | -2.88% | 0.54% | -0.30% |
| Class C Shares | 1.61% | 0.91% | -0.46% |
| Institutional Shares4 | 3.69% | 1.94% | 0.50% |
| BAML3MT | 0.02% | 0.07% | 1.31% |
| LARFA | -0.75% | 1.89% | 0.22% |
Annual Shareholder Report
Performance data quoted represents past performance which is no guarantee of future results. Investment return and principal value will fluctuate so that an investor's shares, when redeemed, may be worth more or less than their original cost. Mutual fund performance changes over time and current performance may be lower or higher than what is stated. For current to the most recent month-end performance and after-tax returns, visit FederatedInvestors.com or call 1-800-341-7400. Returns shown do not reflect the deduction of taxes that a shareholder would pay on Fund distributions or the redemption of Fund shares. Mutual funds are not obligations of or guaranteed by any bank and are not federally insured.
| 1 | Represents a hypothetical investment of $10,000 in the Fund after deducting applicable sales charges: for Class A Shares, the maximum sales charge of 5.50% ($10,000 investment minus $550 sales charge = $9,450); for Class B Shares, the maximum contingent deferred sales charge is 5.50% on any redemption less than one year from the purchase date; for Class C Shares, the maximum contingent deferred sales charge is 1.00% on any redemption less than one year from the purchase date. The Fund's performance assumes the reinvestment of all dividends and distributions. The BAML3MT and the LARFA have been adjusted to reflect reinvestment of dividends on securities in the indexes. |
| 2 | The BAML3MT measures the return on U.S. Treasury Bills maturing in 90 days. The BAML3MT is not adjusted to reflect sales charges, expenses or other fees that the Securities and Exchange Commission (SEC) requires to be reflected in the Fund's performance. The index is unmanaged and unlike the Fund, is not affected by cash flows. It is not possible to invest directly in an index. |
| 3 | LARFA figures represent the average of the total returns reported by all mutual funds designated by Lipper, Inc., as falling into the respective category and is not adjusted to reflect any sales charges. These total returns are reported net of expenses and other fees that the SEC requires to be reflected in a mutual fund's performance. |
| 4 | The Fund's Institutional Shares commenced operations on June 29, 2007. For the period prior to commencement of operations of the Institutional Shares, the performance information shown is for the Fund's Class A Shares. The performance for Class A Shares has not been adjusted to reflect the expenses of the Institutional Shares since the Institutional Shares are estimated to have a lower expense ratio than the expense ratio of the Class A Shares. The performance of the Class A Shares has been adjusted to remove any voluntary waiver of Fund expenses related to the Class A Shares that may have occurred during the period prior to commencement of operations of the Institutional Shares. |
Annual Shareholder Report
Portfolio of Investments Summary Tables (unaudited)
At October 31, 2015, the Fund's portfolio composition1 was as follows:
| Security Type | Percentage of
Total Net Assets2 |
| Futures Contracts—Short (notional value)3 | (13.5)% |
| Securities Sold Short | (13.8)% |
| U.S. Equity Securities | 66.8% |
| International Equity Securities | 9.6% |
| Corporate Bonds | 3.0% |
| U.S. Treasury Securities | 7.3% |
| Purchased Put Options | 1.6% |
| Purchased Call Options | 0.2% |
| Other Derivative Contracts4 | 0.0%5 |
| Cash Equivalents6 | 9.9% |
| Adjustment for Futures Contracts (notional value)3 | 12.8% |
| Collateral on Deposit for Securities Sold Short | 13.8% |
| Other Assets and Liabilities—Net7 | 2.3% |
| TOTAL | 100.0% |
At October 31, 2015, the Fund's sector composition8 for its equity securities was as follows:
| Sector Composition | Percentage of
Equity Securities |
| Health Care | 28.0% |
| Information Technology | 19.7% |
| Financials | 15.7% |
| Industrials | 12.3% |
| Consumer Discretionary | 10.3% |
| Consumer Staples | 3.7% |
| Energy | 3.1% |
| Materials | 2.7% |
| Telecommunication Services | 2.3% |
| Utilities | 2.2% |
| TOTAL | 100.0% |
Annual Shareholder Report
| 1 | See the Fund's Prospectus for a description of the principal types of securities in which the Fund invests. |
| 2 | As of the date specified above, the Fund owned shares of one or more affiliated investment companies. For purposes of this table, an affiliated investment company (other than an affiliated money market mutual fund) is not treated as a single portfolio security, but rather the Fund is treated as owning a pro rata portion of each security and each other asset and liability owned by the affiliated investment company. Accordingly, the percentages of total net assets shown in the table will differ from those presented on the Portfolio of Investments. |
| 3 | More complete information regarding the Fund's direct investments in futures contracts, including unrealized appreciation (depreciation), value, and notional values or amounts of such contracts, can be found in the table at the end of the Portfolio of Investments included in this Report. |
| 4 | Based upon net unrealized appreciation (depreciation) or value of the derivative contracts as applicable. Other Derivative Contracts may consist of futures, forwards, options and swaps. The impact of a derivative contract on the Fund's performance may be larger than its unrealized appreciation (depreciation) or value may indicate. In many cases, the notional value or amount of a derivative contract may provide a better indication of the contract's significance to the portfolio. More complete information regarding the Fund's direct investments in derivative contracts, including unrealized appreciation (depreciation), value, and notional values or amounts of such contracts, can be found in the table at the end of the Portfolio of Investments included in this Report. |
| 5 | Represents less than 0.1%. |
| 6 | Cash Equivalents include any investments in money market mutual funds and/or overnight repurchase agreements. |
| 7 | Assets, other than investments in securities and derivative contracts less liabilities. See Statement of Assets and Liabilities. |
| 8 | Sector classifications are based upon, and individual portfolio securities are assigned to, the classifications of the Global Industry Classification Standard (GICS) except that the Adviser assigns a classification to securities not classified by the GICS and to securities for which the Adviser does not have access to the classification made by the GICS. |
Annual Shareholder Report
Portfolio of Investments
October 31, 2015
Shares,
Principal
Amount or
Contracts | | | Value in
U.S. Dollars |
| | | COMMON STOCKS—76.4% | |
| | | Aerospace & Defense—1.5% | |
| 10,000 | | Boeing Co. | $1,480,700 |
| 12,000 | | General Dynamics Corp. | 1,782,960 |
| 10,000 | | Orbital ATK, Inc. | 856,200 |
| | | TOTAL | 4,119,860 |
| | | Air Freight & Logistics—0.6% | |
| 10,000 | | FedEx Corp. | 1,560,500 |
| | | Airlines—2.3% | |
| 10,000 | | Alaska Air Group, Inc. | 762,500 |
| 10,000 | | American Airlines Group, Inc. | 462,200 |
| 40,000 | | Delta Air Lines, Inc. | 2,033,600 |
| 40,000 | | Southwest Airlines Co. | 1,851,600 |
| 20,000 | 1 | United Continental Holdings Inc. | 1,206,200 |
| | | TOTAL | 6,316,100 |
| | | Auto Components—0.7% | |
| 20,000 | | BorgWarner, Inc. | 856,400 |
| 30,000 | | Bridgestone Corp. | 1,099,934 |
| | | TOTAL | 1,956,334 |
| | | Automobiles—0.5% | |
| 100,000 | | Ford Motor Co. | 1,481,000 |
| | | Banks—5.3% | |
| 60,000 | | Citigroup, Inc. | 3,190,200 |
| 50,000 | | East West Bancorp, Inc. | 2,019,500 |
| 50,000 | | JPMorgan Chase & Co. | 3,212,500 |
| 50,000 | | PrivateBancorp, Inc. | 2,091,500 |
| 120,000 | | Regions Financial Corp. | 1,122,000 |
| 50,000 | | Wells Fargo & Co. | 2,707,000 |
| | | TOTAL | 14,342,700 |
| | | Beverages—0.8% | |
| 20,000 | | PepsiCo, Inc. | 2,043,800 |
| | | Biotechnology—9.6% | |
| 30,000 | | AbbVie, Inc. | 1,786,500 |
| 20,000 | 1 | Acorda Therapeutics, Inc. | 720,800 |
| 50,000 | 1 | Aimmune Therapeutics, Inc. | 752,500 |
Annual Shareholder Report
Shares,
Principal
Amount or
Contracts | | | Value in
U.S. Dollars |
| | | COMMON STOCKS—continued | |
| | | Biotechnology—continued | |
| 16,000 | | Amgen, Inc. | $2,530,880 |
| 10,000 | 1 | Biogen, Inc. | 2,905,100 |
| 8,000 | 1 | Bluebird Bio, Inc. | 617,040 |
| 80,000 | 1 | Catabasis Pharmaceuticals, Inc. | 558,400 |
| 20,000 | 1 | Celgene Corp. | 2,454,200 |
| 21,000 | 1 | Chiasma, Inc. | 477,540 |
| 30,000 | 1 | Chimerix, Inc. | 1,175,400 |
| 20,000 | 1 | Clovis Oncology, Inc. | 1,998,200 |
| 12,000 | 1 | Esperion Therapeutics, Inc. | 288,000 |
| 26,000 | | Gilead Sciences, Inc. | 2,811,380 |
| 30,000 | 1 | Inotek Pharmaceuticals Corp. | 326,700 |
| 10,000 | 1 | Juno Therapeutics, Inc. | 517,600 |
| 10,000 | 1 | Kite Pharma, Inc. | 680,500 |
| 80,000 | 1 | Lion Biotechnologies, Inc. | 517,600 |
| 60,000 | 1 | Merrimack Pharmaceuticals, Inc. | 560,400 |
| 20,000 | 1 | Neurocrine Biosciences, Inc. | 981,800 |
| 10,000 | 1 | Ophthotech Corp. | 499,300 |
| 25,000 | 1 | Regulus Therapeutics, Inc. | 166,250 |
| 20,000 | 1 | Spark Therapeutics, Inc. | 1,078,000 |
| 400,000 | 1 | Sunesis Pharmaceuticals, Inc. | 352,000 |
| 50,000 | 1 | Versartis, Inc. | 516,500 |
| 8,000 | 1 | Vertex Pharmaceuticals, Inc. | 997,920 |
| | | TOTAL | 26,270,510 |
| | | Building Products—0.6% | |
| 26,000 | | Allegion PLC | 1,694,420 |
| | | Capital Markets—2.6% | |
| 44,000 | | Charles Schwab Corp. | 1,342,880 |
| 14,000 | | Goldman Sachs Group, Inc. | 2,625,000 |
| 20,000 | | HFF, Inc., Class A | 690,400 |
| 44,000 | | Morgan Stanley | 1,450,680 |
| 20,000 | 1 | Stifel Financial Corp. | 888,600 |
| 5,000 | | Virtual Financial, Inc., Class A | 121,000 |
| | | TOTAL | 7,118,560 |
| | | Chemicals—1.0% | |
| 10,000 | | PPG Industries, Inc. | 1,042,600 |
| 15,000 | | RPM International, Inc. | 685,650 |
Annual Shareholder Report
Shares,
Principal
Amount or
Contracts | | | Value in
U.S. Dollars |
| | | COMMON STOCKS—continued | |
| | | Chemicals—continued | |
| 4,000 | | Sherwin-Williams Co. | $1,067,320 |
| | | TOTAL | 2,795,570 |
| | | Communications Equipment—1.9% | |
| 10,000 | 1 | Arista Networks, Inc. | 645,100 |
| 40,000 | 1 | CIENA Corp. | 965,600 |
| 100,000 | | Cisco Systems, Inc. | 2,885,000 |
| 10,000 | | Qualcomm, Inc. | 594,200 |
| | | TOTAL | 5,089,900 |
| | | Construction & Engineering—0.6% | |
| 1,000,000 | | China Railway Construction Corp., Class H | 1,491,051 |
| | | Diversified Financial Services—0.8% | |
| 15,000 | 1 | Berkshire Hathaway, Inc., Class B | 2,040,300 |
| | | Diversified Telecommunication Services—1.8% | |
| 87,840 | | AT&T, Inc. | 2,943,518 |
| 40,000 | | Verizon Communications, Inc. | 1,875,200 |
| | | TOTAL | 4,818,718 |
| | | Electric Utilities—1.0% | |
| 25,000 | | Duke Energy Corp. | 1,786,750 |
| 10,000 | | NextEra Energy, Inc. | 1,026,600 |
| | | TOTAL | 2,813,350 |
| | | Electrical Equipment—0.4% | |
| 20,000 | | Eaton Corp. PLC | 1,118,200 |
| | | Electronic Equipment Instruments & Components—0.3% | |
| 20,000 | 1 | Universal Display Corp. | 686,200 |
| | | Energy Equipment & Services—1.2% | |
| 22,000 | | Baker Hughes, Inc. | 1,158,960 |
| 30,000 | | Halliburton Co. | 1,151,400 |
| 100,000 | 1 | Independence Contract Drilling, Inc. | 703,000 |
| 20,000 | | Transocean Partners LLC | 226,400 |
| | | TOTAL | 3,239,760 |
| | | Food & Staples Retailing—0.7% | |
| 20,000 | | CVS Health Corp. | 1,975,600 |
| | | Food Products—0.1% | |
| 30,000 | 1 | Amplify Snack Brands, Inc. | 362,400 |
| | | Health Care Equipment & Supplies—1.5% | |
| 24,000 | | Medtronic PLC | 1,774,080 |
Annual Shareholder Report
Shares,
Principal
Amount or
Contracts | | | Value in
U.S. Dollars |
| | | COMMON STOCKS—continued | |
| | | Health Care Equipment & Supplies—continued | |
| 80,000 | 1 | Novocure Ltd. | $1,797,600 |
| 10,000 | 1 | Penumbra, Inc. | 370,300 |
| | | TOTAL | 3,941,980 |
| | | Health Care Providers & Services—3.3% | |
| 15,000 | | Cardinal Health, Inc. | 1,233,000 |
| 20,000 | 1 | Centene Corp. | 1,189,600 |
| 12,000 | | CIGNA Corp. | 1,608,480 |
| 10,000 | | McKesson Corp. | 1,788,000 |
| 12,000 | | UnitedHealth Group, Inc. | 1,413,360 |
| 20,000 | 1 | Wellcare Health Plans, Inc. | 1,772,000 |
| | | TOTAL | 9,004,440 |
| | | Hotels Restaurants & Leisure—0.8% | |
| 30,000 | 1 | FOGO De Chao, Inc. | 453,000 |
| 80,000 | 1 | La Quinta Holdings, Inc. | 1,212,000 |
| 35,000 | 1 | Planet Fitness, Inc. | 571,900 |
| | | TOTAL | 2,236,900 |
| | | Household Durables—0.8% | |
| 30,573 | 1 | CalAtlantic Group, Inc. | 1,164,526 |
| 60,000 | | Pulte Group, Inc. | 1,099,800 |
| | | TOTAL | 2,264,326 |
| | | Household Products—0.3% | |
| 20,000 | | Energizer Holdings, Inc. | 856,600 |
| | | Independent Power and Renewable Electricity Products—0.1% | |
| 20,000 | | 8Point3 Energy Partners LP | 269,200 |
| | | Industrial Conglomerates—0.9% | |
| 80,000 | | General Electric Co. | 2,313,600 |
| | | Insurance—1.3% | |
| 25,000 | | American International Group, Inc. | 1,576,500 |
| 20,000 | | MetLife, Inc. | 1,007,600 |
| 80,000 | 1 | Patriot National, Inc. | 1,016,000 |
| | | TOTAL | 3,600,100 |
| | | Internet & Catalog Retail—1.5% | |
| 4,000 | 1 | Amazon.com, Inc. | 2,503,600 |
| 1,000 | 1 | Priceline.com, Inc. | 1,454,240 |
| | | TOTAL | 3,957,840 |
Annual Shareholder Report
Shares,
Principal
Amount or
Contracts | | | Value in
U.S. Dollars |
| | | COMMON STOCKS—continued | |
| | | Internet Software & Services—2.4% | |
| 20,000 | 1 | Alarm.com Holdings, Inc. | $253,000 |
| 3,000 | 1 | Alphabet, Inc., Class A | 2,212,170 |
| 3,000 | 1 | Alphabet, Inc., Class C | 2,132,427 |
| 20,000 | 1 | Facebook, Inc., Class A | 2,039,400 |
| | | TOTAL | 6,636,997 |
| | | IT Services—1.0% | |
| 15,000 | 1 | Black Knight Financial Services, Inc., Class A | 540,450 |
| 10,000 | | Computer Sciences Corp. | 665,900 |
| 25,000 | 1 | MOL Global, Inc., ADR | 14,750 |
| 40,000 | 1 | PayPal, Inc. | 1,440,400 |
| | | TOTAL | 2,661,500 |
| | | Leisure Products—0.3% | |
| 60,000 | 1 | Malibu Boats, Inc., Class A | 852,600 |
| | | Machinery—1.3% | |
| 1,400,000 | | CRRC Corp. Ltd. | 1,780,726 |
| 30,000 | | Ingersoll-Rand PLC, Class A | 1,777,800 |
| | | TOTAL | 3,558,526 |
| | | Media—1.4% | |
| 35,000 | | Comcast Corp., Class A | 2,191,700 |
| 15,000 | | Walt Disney Co. | 1,706,100 |
| | | TOTAL | 3,897,800 |
| | | Metals & Mining—1.0% | |
| 21,575 | 1 | Barisan Gold Corp. | 330 |
| 30,000 | | Royal Gold, Inc. | 1,435,200 |
| 100,000 | | Silver Wheaton Corp. | 1,359,000 |
| | | TOTAL | 2,794,530 |
| | | Multi-Utilities—0.6% | |
| 22,000 | | Dominion Resources, Inc. | 1,571,460 |
| | | Multiline Retail—0.1% | |
| 15,000 | 1 | Ollie's Bargain Outlet Holding, Inc. | 237,750 |
| | | Oil Gas & Consumable Fuels—1.2% | |
| 60,000 | | Kinder Morgan, Inc. | 1,641,000 |
| 10,000 | | Pioneer Natural Resources, Inc. | 1,371,400 |
| 15,000 | 1 | Whiting Petroleum Corp. | 258,450 |
| | | TOTAL | 3,270,850 |
Annual Shareholder Report
Shares,
Principal
Amount or
Contracts | | | Value in
U.S. Dollars |
| | | COMMON STOCKS—continued | |
| | | Pharmaceuticals—7.0% | |
| 8,000 | 1 | Allergan PLC | $2,467,760 |
| 22,000 | | Bristol-Myers Squibb Co. | 1,450,900 |
| 60,000 | 1 | Foamix Pharmaceuticals Ltd. | 427,800 |
| 10,000 | 1 | Jazz Pharmaceuticals PLC | 1,372,800 |
| 200,000 | 1 | KemPharm, Inc. | 3,270,000 |
| 40,000 | 1 | Mylan NV | 1,763,600 |
| 10,000 | | Novartis AG, ADR | 904,300 |
| 50,000 | | Pfizer, Inc. | 1,691,000 |
| 13,000 | | Shire Ltd., ADR | 2,951,650 |
| 40,000 | | Teva Pharmaceutical Industries Ltd., ADR | 2,367,600 |
| 50,000 | 1 | Xenoport, Inc. | 305,500 |
| | | TOTAL | 18,972,910 |
| | | Real Estate Investment Trusts (REITs)—1.5% | |
| 30,000 | | HCP, Inc. | 1,116,000 |
| 15,000 | | InfraREIT, Inc. | 358,200 |
| 75,000 | | National Storage Affiliates Trust | 1,128,000 |
| 25,000 | | ProLogis, Inc. | 1,068,250 |
| 20,000 | | STORE Capital Corp. | 453,400 |
| | | TOTAL | 4,123,850 |
| | | Road & Rail—1.2% | |
| 20,000 | | Norfolk Southern Corp. | 1,600,600 |
| 20,000 | | Union Pacific Corp. | 1,787,000 |
| | | TOTAL | 3,387,600 |
| | | Semiconductors & Semiconductor Equipment—2.1% | |
| 100,000 | | Applied Materials, Inc. | 1,677,000 |
| 40,000 | | Intel Corp. | 1,354,400 |
| 25,000 | | Lam Research Corp. | 1,914,750 |
| 15,000 | 1 | Solaredge Technologies, Inc. | 277,350 |
| 30,000 | | Teradyne, Inc. | 585,600 |
| | | TOTAL | 5,809,100 |
| | | Software—4.7% | |
| 20,000 | 1 | Check Point Software Technologies Ltd. | 1,698,800 |
| 15,000 | | Fair Isaac & Co., Inc. | 1,385,550 |
| 10,000 | 1 | Fortinet Inc. | 343,600 |
| 60,000 | | Microsoft Corporation | 3,158,400 |
| 40,000 | | Oracle Corp. | 1,553,600 |
Annual Shareholder Report
Shares,
Principal
Amount or
Contracts | | | Value in
U.S. Dollars |
| | | COMMON STOCKS—continued | |
| | | Software—continued | |
| 20,000 | 1 | Red Hat, Inc. | $1,582,200 |
| 50,000 | 1 | Rubicon Project, Inc./The | 758,000 |
| 20,000 | 1 | Solarwinds, Inc. | 1,160,600 |
| 20,000 | 1 | VMware, Inc., Class A | 1,203,000 |
| | | TOTAL | 12,843,750 |
| | | Specialty Retail—1.5% | |
| 15,000 | | Home Depot, Inc. | 1,854,600 |
| 30,000 | | TJX Cos., Inc. | 2,195,700 |
| | | TOTAL | 4,050,300 |
| | | Technology Hardware Storage & Peripherals—2.7% | |
| 40,000 | | Apple, Inc. | 4,780,000 |
| 30,000 | | EMC Corp. | 786,600 |
| 40,000 | | Hewlett-Packard Co. | 1,078,400 |
| 500 | | Samsung Electronics Co. Ltd. | 598,949 |
| | | TOTAL | 7,243,949 |
| | | Textiles Apparel & Luxury Goods—0.2% | |
| 10,000 | 1 | Deckers Outdoor Corp. | 556,600 |
| | | Thrifts & Mortgage Finance—0.5% | |
| 60,000 | 1 | Essent Group Ltd. | 1,446,000 |
| | | Tobacco—0.9% | |
| 20,000 | | Philip Morris International, Inc. | 1,768,000 |
| 14,000 | | Reynolds American, Inc. | 676,480 |
| | | TOTAL | 2,444,480 |
| | | Trading Companies & Distributors—0.0% | |
| 6,000 | 1 | Now, Inc. | 99,060 |
| | | TOTAL COMMON STOCKS
(IDENTIFIED COST $190,281,628) | 208,239,431 |
| | | TRADE FINANCE NOTES—0.0% | |
| | | Oil, Natural Gas & Mining—0.0% | |
| $217,080 | 1,2 | PT BUMI Uninsured, 11.1935%, 8/26/2016
(IDENTIFIED COST $160,217) | 86,832 |
| | 3 | U.S. TREASURY—7.3% | |
| 18,000,000 | 4 | United States Treasury Bill, 0.107%, 11/12/2015 | 17,999,962 |
| 2,000,000 | 4 | United States Treasury Bill, 0.020%, 11/19/2015 | 1,999,988 |
| | | TOTAL U.S. TREASURY
(IDENTIFIED COST $19,999,362) | 19,999,950 |
Annual Shareholder Report
Shares,
Principal
Amount or
Contracts | | | Value in
U.S. Dollars |
| | | PURCHASED PUT OPTIONS—1.6% | |
| | | Diversified Financial Services—0.1% | |
| 200 | | iShares JP Morgan USD Emerging, Strike Price $110, Expiration Date 1/15/2016 | $76,000 |
| 200 | | iShares MSCI Emerging Markets, Strike Price $35, Expiration Date 1/15/2016 | 33,400 |
| 2,000 | | iShares MSCI Japan ETF, Strike Price $12, Expiration Date 1/15/2016 | 62,000 |
| | | TOTAL | 171,400 |
| | | Index—1.5% | |
| 400 | | Energy Select Sector SPDR Fund, Strike Price $70, Expiration Date 1/15/2016 | 168,000 |
| 1,000 | | Powershares QQQ Trust Series 1, Strike Price $100, Expiration Date 1/15/2016 | 70,000 |
| 500 | | Powershares QQQ Trust Series 1, Strike Price $100, Expiration Date 1/20/2017 | 259,500 |
| 1,000 | | SPDR S&P 500 ETF Trust, Strike Price $140, Expiration Date 1/20/2017 | 269,000 |
| 1,600 | | SPDR S&P 500 ETF Trust, Strike Price $160, Expiration Date 6/17/2016 | 334,400 |
| 2,600 | | SPDR S&P 500 ETF Trust, Strike Price $180, Expiration Date 11/20/2015 | 19,500 |
| 2,000 | | SPDR S&P 500 ETF Trust, Strike Price $180, Expiration Date 12/19/2015 | 87,000 |
| 1,500 | | SPDR S&P 500 ETF Trust, Strike Price $180, Expiration Date 1/20/2017 | 1,259,250 |
| 1,200 | | SPDR S&P 500 ETF Trust, Strike Price $200, Expiration Date 11/20/2015 | 93,600 |
| 1,400 | | SPDR S&P 500 ETF Trust, Strike Price $200, Expiration Date 12/19/2015 | 323,400 |
| 300 | | SPDR S&P 500 ETF Trust, Strike Price $200, Expiration Date 3/18/2016 | 176,700 |
| 400 | | SPDR S&P 500 ETF Trust, Strike Price $200, Expiration Date 6/17/2016 | 354,600 |
| 700 | | SPDR S&P 500 ETF Trust, Strike Price $210, Expiration Date 3/18/2016 | 662,900 |
| | | TOTAL | 4,077,850 |
| | | TOTAL PURCHASED PUT OPTIONS
(IDENTIFIED COST $6,712,159) | 4,249,250 |
| | | PURCHASED CALL OPTIONS—0.2% | |
| | | Metals & Mining—0.2% | |
| 600 | | Market Vectors Gold Miners, Strike Price $14, Expiration Date 03/18/2016 | 128,700 |
| 1,000 | | Market Vectors Gold Miners, Strike Price $18, Expiration Date 01/20/2017 | 189,000 |
| 2,600 | | Market Vectors Gold Miners, Strike Price $20, Expiration Date 01/15/2016 | 44,200 |
Annual Shareholder Report
Shares,
Principal
Amount or
Contracts | | | Value in
U.S. Dollars |
| | | PURCHASED CALL OPTIONS—continued | |
| | | Metals & Mining—continued | |
| 800 | | Market Vectors Gold Miners, Strike Price $20, Expiration Date 01/20/2017 | $116,400 |
| | | TOTAL PURCHASED CALL OPTIONS
(IDENTIFIED COST $571,879) | 478,300 |
| | | INVESTMENT COMPANIES—12.8%5 | |
| 26,531,646 | | Federated Prime Value Obligations Fund, Institutional Shares, 0.16%6 | 26,531,646 |
| 1,378,553 | | High Yield Bond Portfolio | 8,491,887 |
| | | TOTAL INVESTMENT COMPANIES
(IDENTIFIED COST $35,621,307) | 35,023,533 |
| | | TOTAL INVESTMENTS—98.3%
(IDENTIFIED COST $253,346,552)7 | 268,077,296 |
| | | OTHER ASSETS AND LIABILITIES - NET—1.7%8 | 4,528,167 |
| | | TOTAL NET ASSETS—100% | $272,605,463 |
SECURITIES SOLD SHORT
| Shares | | | Value in
U.S. Dollars |
| 20,000 | | iShares JP Morgan USD Emerging Markets Bond Fund | $2,170,000 |
| 240,000 | | iShares MSCI Australia Index Fund | 4,540,800 |
| 100,000 | | iShares MSCI Brazil | 2,287,000 |
| 100,000 | | iShares MSCI EAFE Index Fund | 6,111,000 |
| 200,000 | | iShares MSCI Emerging Markets ETF | 6,974,000 |
| 400,000 | | iShares MSCI Japan ETF | 4,928,000 |
| 100,000 | | iShares MSCI Mexico Index Fund | 5,472,000 |
| 20,000 | | SPDR S&P MidCap 400 ETF Trust | 5,254,200 |
| | | TOTAL SECURITIES SOLD SHORT
(PROCEEDS $41,264,079) | $37,737,000 |
At October 31, 2015, the Fund had the following open futures contracts:
| Description | Number of
Contracts | Notional
Value | Expiration
Date | Unrealized
(Depreciation) |
| 1Russell 2000 Index Futures, Short Futures | 50 | $5,791,500 | December 2015 | $(47,063) |
| 1S&P 500 Index, Short Futures | 60 | $31,105,500 | December 2015 | $(1,960,445) |
| NET UNREALIZED DEPRECIATION ON FUTURES CONTRACTS | $(2,007,508) |
Annual Shareholder Report
At October 31, 2015, the Fund had the following outstanding foreign exchange contracts:
| Settlement Date | Counterparty | Foreign Currency
Units to
Receive/Deliver | In
Exchange
For | Unrealized
Appreciation
(Depreciation) |
| Contracts Purchased: |
| 11/12/2015 | JPMorgan | 2,600,000 GBP | $3,991,362 | $16,506 |
| 11/13/2015 | Goldman Sachs | 2,300,000 EUR | $2,534,439 | $(4,833) |
| 12/1/2015 | Goldman Sachs | 1,150,000 EUR | $1,270,440 | $(5,337) |
| 12/1/2015 | Goldman Sachs | 1,100,000 EUR | $1,215,203 | $(5,105) |
| 12/1/2015 | JPMorgan | 1,150,000 EUR | $1,296,677 | $(31,574) |
| 12/1/2015 | Bank of America | 800,000 GBP | 10,116,560 SEK | $48,140 |
| 12/1/2015 | JPMorgan | $520,000 | 698,277 CAD | $(13,909) |
| 12/1/2015 | JPMorgan | $520,000 | 698,277 CAD | $(13,909) |
| 12/1/2015 | JPMorgan | $520,000 | 698,277 CAD | $(13,909) |
| 12/1/2015 | JPMorgan | $491,000 | 659,334 CAD | $(13,134) |
| 12/1/2015 | JPMorgan | $130,000 | 174,456 CAD | $(3,391) |
| 12/1/2015 | JPMorgan | $130,000 | 174,456 CAD | $(3,391) |
| 12/1/2015 | JPMorgan | $122,750 | 164,727 CAD | $(3,202) |
| 12/1/2015 | JPMorgan | $130,000 | 174,456 CAD | $(3,391) |
| 12/1/2015 | Goldman Sachs | $1,307,753 | 156,216,515 JPY | $12,793 |
| 12/1/2015 | Goldman Sachs | $1,292,247 | 154,364,145 JPY | $12,642 |
| Contracts Sold: |
| 11/9/2015 | Goldman Sachs | 471,000,000 JPY | $3,780,691 | $(122,824) |
| 11/12/2015 | JPMorgan | 7,800,000 GBP | $12,066,641 | $43,037 |
| 11/12/2015 | JPMorgan | 2,600,000 GBP | $3,994,982 | $(12,886) |
| 11/13/2015 | Goldman Sachs | 2,300,000 EUR | $2,543,996 | $14,390 |
| 11/18/2015 | JPMorgan | 5,775,000 EUR | $6,408,076 | $56,171 |
| 12/1/2015 | JPMorgan | $650,000 | 871,948 CAD | $16,700 |
| 12/1/2015 | JPMorgan | $650,000 | 865,376 CAD | $11,675 |
| 12/1/2015 | JPMorgan | $650,000 | 866,306 CAD | $12,386 |
| 12/1/2015 | JPMorgan | $613,750 | 821,339 CAD | $14,254 |
| 12/1/2015 | Goldman Sachs | $2,600,000 | 312,065,520 JPY | $(13,126) |
| 12/1/2015 | Bank of America | 800,000 GBP | 9,970,800 SEK | $(65,212) |
| 12/1/2015 | Goldman Sachs | 1,100,000 EUR | $1,249,669 | $39,571 |
| 12/1/2015 | JPMorgan | 2,300,000 EUR | $2,568,824 | $38,618 |
| 1/20/2016 | Bank of America | $2,400,000 | 9,520,800 BRL | $2,302 |
| 1/20/2016 | JPMorgan | 37,984,406 MXN | $2,284,155 | $(1,951) |
| 1/20/2016 | JPMorgan | 6,523,879 TRY | $2,191,092 | $5,991 |
| 1/20/2016 | JPMorgan | 30,327,168 ZAR | $2,276,156 | $116,875 |
| NET UNREALIZED APPRECIATION ON FOREIGN EXCHANGE CONTRACTS | $130,967 |
Net Unrealized Appreciation (Depreciation) on value of Securities Sold Short, Futures Contracts and Foreign Exchange Contracts is included in “Other Assets and Liabilities—Net.”
Annual Shareholder Report
| 1 | Non-income-producing security. |
| 2 | Issuer in default. |
| 3 | Pledged as collateral to ensure the Fund is able to satisfy the obligations of its outstanding short futures contracts. |
| 4 | Discount rate at time of purchase. |
| 5 | Affiliated holdings. |
| 6 | 7-day net yield. |
| 7 | The cost of investments for federal tax purposes amounts to $282,957,041. |
| 8 | Assets, other than investments in securities, less liabilities. See Statement of Assets and Liabilities. |
Note: The categories of investments are shown as a percentage of total net assets at October 31, 2015.
Various inputs are used in determining the value of the Fund's investments. These inputs are summarized in the three broad levels listed below:
Level 1—quoted prices in active markets for identical securities.
Level 2—other significant observable inputs (including quoted prices for similar securities, interest rates, prepayment speeds, credit risk, etc.). Also includes securities valued at amortized cost.
Level 3—significant unobservable inputs (including the Fund's own assumptions in determining the fair value of investments).
The inputs or methodology used for valuing securities are not an indication of the risk associated with investing in those securities.
The following is a summary of the inputs used, as of October 31, 2015, in valuing the Fund's assets carried at fair value:
| Valuation Inputs | | | | |
| | Level 1—
Quoted
Prices | Level 2—
Other
Significant
Observable
Inputs | Level 3—
Significant
Unobservable
Inputs | Total |
| Equity Securities: | | | | |
| Common Stocks | | | | |
| Domestic | $182,059,891 | $— | $— | $182,059,891 |
| International | 21,208,8801 | 4,970,660 | — | 26,179,540 |
| Debt Securities: | | | | |
| Trade Finance Notes | — | — | 86,832 | 86,832 |
| U.S. Treasury | — | 19,999,950 | — | 19,999,950 |
| Purchased Put Options | 4,249,250 | — | — | 4,249,250 |
| Purchased Call Options | 478,300 | — | — | 478,300 |
| Investment Companies2 | 26,531,646 | 8,491,8873 | — | 35,023,533 |
| TOTAL SECURITIES | $234,527,967 | $33,462,497 | $86,832 | $268,077,296 |
| OTHER FINANCIAL INSTRUMENTS4 | $(39,744,508) | $130,967 | $— | $(39,613,541) |
Annual Shareholder Report
| 1 | Includes $2,489 of a security transferred from Level 2 to Level 1 because quoted prices on equity securities traded principally in foreign markets were utilized to value securities for which fair value factors were previously applied to account for significant post market close activity. Transfer shown represents the value of the security at the beginning of the period. |
| 2 | High Yield Bond Portfolio is an affiliated holding offered only to registered investment companies and other accredited investors. An investment in this fund is deemed Level 2 due to the fact that the net asset value (NAV) is not publically available. |
| 3 | Includes $9,070,879 of an affiliated investment company holding transferred from Level 1 to Level 2 because the Adviser determined that this investment more appropriately meets the definition of Level 2. Transfer shown represents the value of the investment at the beginning of the period. |
| 4 | Other financial instruments include securities sold short, futures contracts and foreign exchange contracts. |
The following acronyms are used throughout this portfolio:
| ADR | —American Depositary Receipt |
| BRL | —Brazilian Real |
| CAD | —Canadian Dollar |
| ETF | —Exchange-Traded Fund |
| EUR | —Euro |
| GBP | —Great Britain Pound |
| JPY | —Japanese Yen |
| MXN | —Mexican Peso |
| REITs | —Real Estate Investment Trusts |
| SEK | —Swedish Krona |
| SPDR | —Standard & Poor's Depositary Receipts |
| TRY | —Turkish Lira |
| ZAR | —South African Rand |
See Notes which are an integral part of the Financial Statements
Annual Shareholder Report
Financial Highlights–Class A Shares
(For a Share Outstanding Throughout Each Period)
| Year Ended October 31 | 2015 | 2014 | 2013 | 2012 | 2011 |
| Net Asset Value, Beginning of Period | $10.07 | $9.47 | $9.50 | $9.89 | $10.10 |
| Income From Investment Operations: | | | | | |
| Net investment income (loss)1 | (0.00)2 | 0.05 | 0.08 | (0.04) | (0.04) |
| Net realized and unrealized gain (loss) on investments, short sales, futures contracts, written options, certain receivables and foreign currency transactions | 0.34 | 0.55 | (0.03) | (0.30) | 0.21 |
| TOTAL FROM INVESTMENT OPERATIONS | 0.34 | 0.60 | 0.05 | (0.34) | 0.17 |
| Less Distributions: | | | | | |
| Distributions from net investment income | (0.13) | (0.00)2 | (0.03) | (0.05) | (0.38) |
| Return of capital3 | — | — | (0.05) | — | — |
| TOTAL DISTRIBUTIONS | (0.13) | (0.00) 2 | (0.08) | (0.05) | (0.38) |
| Net Asset Value, End of Period | $10.28 | $10.07 | $9.47 | $9.50 | $9.89 |
| Total Return4 | 3.45% | 6.38% | 0.53% | (3.41)% | 1.74% |
| Ratios to Average Net Assets: | | | | | |
| Net expenses | 1.50% | 1.26% | 1.24% | 1.26% | 1.26%5 |
| Net expenses excluding dividends and other expenses related to short sales | 1.32% | 1.26% | 1.24% | 1.24% | 1.24%5 |
| Net investment income (loss) | 0.03% | 0.49% | 0.90% | (0.45)% | (0.41)% |
| Expense waiver/reimbursement6 | 0.12% | 0.15% | 0.18% | 0.10% | 0.08% |
| Supplemental Data: | | | | | |
| Net assets, end of period (000 omitted) | $94,755 | $88,588 | $112,417 | $175,186 | $257,503 |
| Portfolio turnover | 94% | 117% | 198% | 182% | 129% |
| 1 | Per share numbers have been calculated using the average shares method. |
| 2 | Represents less than $0.01. |
| 3 | Represents a return of capital for federal income tax purposes. |
| 4 | Based on net asset value, which does not reflect the sales charge, redemption fee or contingent deferred sales charge, if applicable. |
| 5 | The net expense ratio is calculated without reduction for expense offset arrangements. The net expense ratio is 1.26% for the year ended October 31, 2011, after taking into account these expense reductions. The net expense ratio excluding dividends and other expenses related to short sales are also calculated without reduction for these expenses offset arrangements. |
| 6 | This expense decrease is reflected in both the net expense and net investment income (loss) ratios shown above. |
See Notes which are an integral part of the Financial Statements
Annual Shareholder Report
Financial Highlights–Class B Shares
(For a Share Outstanding Throughout Each Period)
| Year Ended October 31 | 2015 | 2014 | 2013 | 2012 | 2011 |
| Net Asset Value, Beginning of Period | $9.91 | $9.39 | $9.41 | $9.82 | $9.99 |
| Income From Investment Operations: | | | | | |
| Net investment income (loss)1 | (0.07) | (0.03) | 0.01 | (0.12) | (0.11) |
| Net realized and unrealized gain (loss) on investments, short sales, futures contracts, written options, certain receivables and foreign currency transactions | 0.33 | 0.55 | (0.03) | (0.29) | 0.21 |
| TOTAL FROM INVESTMENT OPERATIONS | 0.26 | 0.52 | (0.02) | (0.41) | 0.10 |
| Less Distributions: | | | | | |
| Distributions from net investment income | — | (0.00)2 | — | — | (0.27) |
| Net Asset Value, End of Period | $10.17 | $9.91 | $9.39 | $9.41 | $9.82 |
| Total Return3 | 2.62% | 5.59% | (0.21)% | (4.18)% | 1.08% |
| Ratios to Average Net Assets: | | | | | |
| Net expenses | 2.24% | 2.03% | 1.99% | 2.01% | 2.01%4 |
| Net expenses excluding dividends and other expenses related to short sales | 2.07% | 2.03% | 1.99% | 1.99% | 1.99%4 |
| Net investment income (loss) | (0.70)% | (0.28)% | 0.16% | (1.21)% | (1.15)% |
| Expense waiver/reimbursement5 | 0.13% | 0.15% | 0.18% | 0.10% | 0.09% |
| Supplemental Data: | | | | | |
| Net assets, end of period (000 omitted) | $7,517 | $11,193 | $17,267 | $34,029 | $60,018 |
| Portfolio turnover | 94% | 117% | 198% | 182% | 129% |
| 1 | Per share numbers have been calculated using the average shares method. |
| 2 | Represents less than $0.01. |
| 3 | Based on net asset value, which does not reflect the sales charge, redemption fee or contingent deferred sales charge, if applicable. |
| 4 | The net expense ratio is calculated without reduction for expense offset arrangements. The net expense ratio is 2.01% for the year ended October 31, 2011, after taking into account these expense reductions. The net expense ratios excluding dividends and other expenses related to short sales are also calculated without reduction for these expense offset arrangements. |
| 5 | This expense decrease is reflected in both the net expense and net investment income (loss) ratios shown above. |
See Notes which are an integral part of the Financial Statements
Annual Shareholder Report
Financial Highlights–Class C Shares
(For a Share Outstanding Throughout Each Period)
| Year Ended October 31 | 2015 | 2014 | 2013 | 2012 | 2011 |
| Net Asset Value, Beginning of Period | $9.86 | $9.35 | $9.37 | $9.77 | $9.96 |
| Income From Investment Operations: | | | | | |
| Net investment income (loss)1 | (0.07) | (0.03) | 0.01 | (0.11) | (0.11) |
| Net realized and unrealized gain (loss) on investments, short sales, futures contracts, written options, certain receivables and foreign currency transactions | 0.33 | 0.54 | (0.03) | (0.29) | 0.20 |
| TOTAL FROM INVESTMENT OPERATIONS | 0.26 | 0.51 | (0.02) | (0.40) | 0.09 |
| Less Distributions: | | | | | |
| Distributions from net investment income | — | (0.00)2 | — | — | (0.28) |
| Net Asset Value, End of Period | $10.12 | $9.86 | $9.35 | $9.37 | $9.77 |
| Total Return3 | 2.64% | 5.50% | (0.21)% | (4.09)% | 0.98% |
| Ratios to Average Net Assets: | | | | | |
| Net expenses | 2.24% | 2.04% | 1.99% | 2.01% | 2.01%4 |
| Net expenses excluding dividends and other expenses related to short sales | 2.07% | 2.04% | 1.99% | 1.99% | 1.99%4 |
| Net investment income (loss) | (0.71)% | (0.28)% | 0.15% | (1.19)% | (1.16)% |
| Expense waiver/reimbursement5 | 0.13% | 0.15% | 0.18% | 0.10% | 0.08% |
| Supplemental Data: | | | | | |
| Net assets, end of period (000 omitted) | $63,406 | $70,323 | $87,659 | $147,819 | $207,932 |
| Portfolio turnover | 94% | 117% | 198% | 182% | 129% |
| 1 | Per share numbers have been calculated using the average shares method. |
| 2 | Represents less than $0.01. |
| 3 | Based on net asset value, which does not reflect the sales charge, redemption fee or contingent deferred sales charge, if applicable. |
| 4 | The net expense ratio is calculated without reduction for expense offset arrangements. The net expense ratio is 2.01% year ended October 31, 2011, after taking into account this expense reduction. The net expense ratios excluding dividends and other expenses related to short sales are also calculated without reduction for these expense offset arrangements. |
| 5 | This expense decrease is reflected in both the net expense and net investment income (loss) ratios shown above. |
See Notes which are an integral part of the Financial Statements
Annual Shareholder Report
Financial Highlights–Institutional Shares
(For a Share Outstanding Throughout Each Period)
| Year Ended October 31 | 2015 | 2014 | 2013 | 2012 | 2011 |
| Net Asset Value, Beginning of Period | $10.14 | $9.52 | $9.56 | $9.95 | $10.15 |
| Income From Investment Operations: | | | | | |
| Net investment income (loss)1 | 0.02 | 0.07 | 0.11 | (0.02) | (0.02) |
| Net realized and unrealized gain (loss) on investments, short sales, futures contracts, written options, certain receivables and foreign currency transactions | 0.35 | 0.55 | (0.04) | (0.29) | 0.22 |
| TOTAL FROM INVESTMENT OPERATIONS | 0.37 | 0.62 | 0.07 | (0.31) | 0.20 |
| Less Distributions: | | | | | |
| Distributions from net investment income | (0.16) | (0.00)2 | (0.05) | (0.08) | (0.40) |
| Return of capital3 | — | — | (0.06) | — | — |
| TOTAL DISTRIBUTIONS | (0.16) | (0.00) 2 | (0.11) | (0.08) | (0.40) |
| Net Asset Value, End of Period | $10.35 | $10.14 | $9.52 | $9.56 | $9.95 |
| Total Return4 | 3.69% | 6.56% | 0.75% | (3.11)% | 2.08% |
| Ratios to Average Net Assets: | | | | | |
| Net expenses | 1.27% | 1.04% | 0.99% | 1.01% | 1.01%5 |
| Net expenses excluding dividends and other expenses related to short sales | 1.07% | 1.04% | 0.99% | 0.99% | 0.99%5 |
| Net investment income (loss) | 0.22% | 0.72% | 1.18% | (0.20)% | (0.17)% |
| Expense waiver/reimbursement6 | 0.11% | 0.14% | 0.18% | 0.10% | 0.08% |
| Supplemental Data: | | | | | |
| Net assets, end of period (000 omitted) | $106,928 | $36,380 | $27,681 | $81,598 | $90,569 |
| Portfolio turnover | 94% | 117% | 198% | 182% | 129% |
| 1 | Per share numbers have been calculated using the average shares method. |
| 2 | Represents less than $0.01. |
| 3 | Represents return of capital for federal income tax purposes. |
| 4 | Based on net asset value. |
| 5 | The net expense ratio is calculated without reduction for expense offset arrangements. The net expense ratio is 1.01% for the year ended October 31, 2011, after taking into account these expense reductions. The net expense ratios excluding dividends and other expenses related to short sales are also calculated without reduction for these expense offset arrangements. |
| 6 | This expense decrease is reflected in both the net expense and net investment income (loss) ratios shown above. |
See Notes which are an integral part of the Financial Statements
Annual Shareholder Report
Statement of Assets and Liabilities
October 31, 2015
| Assets: | | |
| Total investments in securities, at value including $35,023,533 of investment in affiliated holdings (Note 5) (identified cost $253,346,552) | | $268,077,296 |
| Deposit at broker for short sales | | 37,718,665 |
| Restricted cash (Note 2) | | 1,650,000 |
| Cash denominated in foreign currencies (identified cost $141,398) | | 134,720 |
| Cash | | 112,570 |
| Receivable for investments sold, net of reserve of $3,138,055 (Note 9) | | 2,195,442 |
| Receivable for shares sold | | 2,094,232 |
| Income receivable | | 495,284 |
| Unrealized appreciation on foreign exchange contracts | | 462,051 |
| Receivable for daily variation margin | | 152,500 |
| TOTAL ASSETS | | 313,092,760 |
| Liabilities: | | |
| Securities sold short, at value (premiums received $41,264,079) | $37,737,000 | |
| Payable for investments purchased | 1,573,795 | |
| Payable for shares redeemed | 575,142 | |
| Unrealized depreciation on foreign exchange contracts | 331,084 | |
| Payable for distribution services fee (Note 5) | 45,079 | |
| Payable for other service fees (Notes 2 and 5) | 24,342 | |
| Payable for investment adviser fee (Note 5) | 9,636 | |
| Payable for administrative fee (Note 5) | 1,175 | |
| Payable for Directors'/Trustees' fees (Note 5) | 251 | |
| Accrued expenses (Note 5) | 189,793 | |
| TOTAL LIABILITIES | | 40,487,297 |
| Net assets for 26,554,121 shares outstanding | | $272,605,463 |
| Net Assets Consists of: | | |
| Paid-in capital | | $690,177,470 |
| Net unrealized appreciation of investments, futures contracts, short sales, certain receivables and translation of assets and liabilities in foreign currency | | 13,279,837 |
| Accumulated net realized loss on investments, futures contracts, short sales and foreign currency transactions | | (430,336,452) |
| Distributions in excess of net investment income | | (515,392) |
| TOTAL NET ASSETS | | $272,605,463 |
Annual Shareholder Report
Statement of Assets and Liabilities–continued
| Net Asset Value, Offering Price and Redemption Proceeds Per Share: | | |
| Class A Shares: | | |
| Net asset value per share ($94,754,624 ÷ 9,219,447 shares outstanding), no par value, unlimited shares authorized | | $10.28 |
| Offering price per share (100/94.50 of $10.28) | | $10.88 |
| Redemption proceeds per share | | $10.28 |
| Class B Shares: | | |
| Net asset value per share ($7,517,349 ÷ 739,228 shares outstanding), no par value, unlimited shares authorized | | $10.17 |
| Offering price per share | | $10.17 |
| Redemption proceeds per share (94.50/100 of $10.17) | | $9.61 |
| Class C Shares: | | |
| Net asset value per share ($63,405,729 ÷ 6,263,814 shares outstanding), no par value, unlimited shares authorized | | $10.12 |
| Offering price per share | | $10.12 |
| Redemption proceeds per share (99.00/100 of $10.12) | | $10.02 |
| Institutional Shares: | | |
| Net asset value per share ($106,927,761 ÷ 10,331,632 shares outstanding), no par value, unlimited shares authorized | | $10.35 |
| Offering price per share | | $10.35 |
| Redemption proceeds per share | | $10.35 |
See Notes which are an integral part of the Financial Statements
Annual Shareholder Report
Statement of Operations
Year Ended October 31, 2015
| Investment Income: | | |
| Interest | | $135,484 |
| Dividends (including $632,530 received from affiliated holdings (Note 5) and net of foreign taxes withheld of $25,569) | | 3,334,934 |
| TOTAL INCOME | | 3,470,418 |
| Expenses: | | |
| Investment adviser fee (Note 5) | $1,716,512 | |
| Administrative fee (Note 5) | 179,119 | |
| Custodian fees | 32,026 | |
| Transfer agent fees | 397,825 | |
| Directors'/Trustees' fees (Note 5) | 1,946 | |
| Auditing fees | 37,520 | |
| Legal fees | 7,563 | |
| Distribution services fee (Note 5) | 562,458 | |
| Other service fees (Notes 2 and 5) | 411,739 | |
| Portfolio accounting fees | 166,496 | |
| Share registration costs | 67,133 | |
| Printing and postage | 43,035 | |
| Risk insurance expense | 51,106 | |
| Dividends and expenses related to short positions | 416,417 | |
| Miscellaneous (Note 5) | 19,149 | |
| TOTAL EXPENSES | 4,110,044 | |
| Waiver/reimbursement of investment adviser fee (Note 5) | (276,878) | |
| Net expenses | | 3,833,166 |
| Net investment income (loss) | | (362,748) |
| Realized and Unrealized Gain (Loss) on Investments, Futures Contracts, Short Sales, Certain Receivables and Foreign Currency Transactions: | | |
| Net realized gain on investments (including realized loss of $(185,278) on sales of investments in affiliated holdings (Note 5)) and foreign currency transactions | | 12,403,872 |
| Net realized loss on futures contracts | | (1,836,456) |
| Net realized gain on short sales | | 17,788 |
| Realized gain distribution from affiliated investment company shares (Note 5) | | 96,344 |
| Net change in unrealized appreciation of investments, certain receivables and translation of assets and liabilities in foreign currency | | (7,788,584) |
| Net change in unrealized depreciation of futures contracts | | (430,814) |
| Net change in unrealized depreciation on short sales | | 3,595,124 |
| Net realized and unrealized gain on investments, futures contracts, short sales, certain receivables and foreign currency transactions | | 6,057,274 |
| Change in net assets resulting from operations | | $5,694,526 |
See Notes which are an integral part of the Financial Statements
Annual Shareholder Report
Statement of Changes in Net Assets
| Year Ended October 31 | 2015 | 2014 |
| Increase (Decrease) in Net Assets | | |
| Operations: | | |
| Net investment income (loss) | $(362,748) | $448,588 |
| Net realized gain on investments, including allocation from affiliated investment company shares, futures contracts, short sales, written options and foreign currency transactions | 10,681,548 | 7,395,455 |
| Net change in unrealized appreciation/depreciation of investments, futures contracts, short sales, certain receivables and translation of assets and liabilities in foreign currency | (4,624,274) | 5,144,378 |
| CHANGE IN NET ASSETS RESULTING FROM OPERATIONS | 5,694,526 | 12,988,421 |
| Distributions to Shareholders: | | |
| Distributions from net investment income | | |
| Class A Shares | (1,150,185) | (49,723) |
| Class B Shares | — | (7,386) |
| Class C Shares | — | (38,927) |
| Institutional Shares | (570,298) | (11,940) |
| CHANGE IN NET ASSETS RESULTING FROM DISTRIBUTIONS TO SHAREHOLDERS | (1,720,483) | (107,976) |
| Share Transactions: | | |
| Proceeds from sale of shares | 123,072,360 | 37,980,145 |
| Net asset value of shares issued to shareholders in payment of distributions declared | 1,473,536 | 91,324 |
| Cost of shares redeemed | (62,398,575) | (89,492,724) |
| CHANGE IN NET ASSETS RESULTING FROM SHARE TRANSACTIONS | 62,147,321 | (51,421,255) |
| Change in net assets | 66,121,364 | (38,540,810) |
| Net Assets: | | |
| Beginning of period | 206,484,099 | 245,024,909 |
| End of period (including (distributions in excess of) undistributed net investment income of $(515,392) and $1,514,133, respectively) | $272,605,463 | $206,484,099 |
See Notes which are an integral part of the Financial Statements
Annual Shareholder Report
Notes to Financial Statements
October 31, 2015
1. ORGANIZATION
Federated Equity Funds (the “Trust”), is registered under the Investment Company Act of 1940, as amended (the “Act”), as an open-end management investment company. The Trust consists of fourteen diversified portfolios. The financial statements included herein are only those of Federated Absolute Return Fund (the “Fund”). The financial statements of the other portfolios are presented separately. The assets of each portfolio are segregated and a shareholder's interest is limited to the portfolio in which shares are held. Each portfolio pays its own expenses. The Fund offers four classes of shares: Class A Shares, Class B Shares, Class C Shares and Institutional Shares. All shares of the Fund have equal rights with respect to voting, except on class-specific matters. Class B Shares were closed to new accounts/investors on June 1, 2015, and to new purchases/exchanges by existing shareholders on August 1, 2015. The investment objective of the Fund is to provide absolute (positive) returns with low correlation to the U.S. equity market.
2. SIGNIFICANT ACCOUNTING POLICIES
The following is a summary of significant accounting policies consistently followed by the Fund in the preparation of its financial statements. These policies are in conformity with U.S. generally accepted accounting principles (GAAP).
Investment Valuation
In calculating its net asset value (NAV), the Fund generally values investments as follows:
| ■ | Equity securities listed on an exchange or traded through a regulated market system are valued at their last reported sale price or official closing price in their principal exchange or market. |
| ■ | Shares of other mutual funds or non-exchange-traded investment companies are valued based upon their reported NAVs. |
| ■ | Fixed-income securities acquired with remaining maturities greater than 60 days are fair valued using price evaluations provided by a pricing service approved by the Board of Trustees (the “Trustees”). |
| ■ | Fixed-income securities and repurchase agreements acquired with remaining maturities of 60 days or less are valued at their cost (adjusted for the accretion of any discount or amortization of any premium) unless the issuer's creditworthiness is impaired or other factors indicate that amortized cost is not an accurate estimate of the investment's fair value, in which case it would be valued in the same manner as a longer-term security. |
| ■ | Derivative contracts listed on exchanges are valued at their reported settlement or closing price, except that options are valued at the mean of closing bid and asked quotations. |
| ■ | Over-the-counter (OTC) derivative contracts are fair valued using price evaluations provided by a pricing service approved by the Trustees. |
| ■ | For securities that are fair valued in accordance with procedures established by and under the general supervision of the Trustees, certain factors may be considered such as: the last traded or purchase price of the security, information obtained by contacting the issuer or dealers, analysis of the issuer's financial statements or other available documents, fundamental analytical data, the nature and duration of restrictions on disposition, the movement of the market in which the security is normally traded, public trading in similar |
Annual Shareholder Report
| | securities or derivative contracts of the issuer or comparable issuers, movement of a relevant index, or other factors including, but not limited to, industry changes and relevant government actions. |
If any price, quotation, price evaluation or other pricing source is not readily available when the NAV is calculated, or if the Fund cannot obtain price evaluations from a pricing service or from more than one dealer for an investment within a reasonable period of time as set forth in the Fund's valuation policies and procedures, the Fund uses the fair value of the investment determined in accordance with the procedures described below. There can be no assurance that the Fund could obtain the fair value assigned to an investment if it sold the investment at approximately the time at which the Fund determines its NAV per share.
Fair Valuation and Significant Events Procedures
The Trustees have ultimate responsibility for determining the fair value of investments for which market quotations are not readily available. The Trustees have appointed a valuation committee (“Valuation Committee”) comprised of officers of the Fund, Federated Equity Management Company of Pennsylvania (“Adviser”) and certain of the Adviser's affiliated companies to assist in determining fair value and in overseeing the calculation of the NAV. The Trustees have also authorized the use of pricing services recommended by the Valuation Committee to provide fair value evaluations of the current value of certain investments for purposes of calculating the NAV. The Valuation Committee employs various methods for reviewing third-party pricing-service evaluations including periodic reviews of third-party pricing services' policies, procedures and valuation methods (including key inputs, methods, models and assumptions), transactional back-testing, comparisons of evaluations of different pricing services and review of price challenges by the Adviser based on recent market activity. In the event that market quotations and price evaluations are not available for an investment, the Valuation Committee determines the fair value of the investment in accordance with procedures adopted by the Trustees. The Trustees periodically review and approve the fair valuations made by the Valuation Committee and any changes made to the procedures.
Factors considered by pricing services in evaluating an investment include the yields or prices of investments of comparable quality, coupon, maturity, call rights and other potential prepayments, terms and type, reported transactions, indications as to values from dealers and general market conditions. Some pricing services provide a single price evaluation reflecting the bid-side of the market for an investment (a “bid” evaluation). Other pricing services offer both bid evaluations and price evaluations indicative of a price between the prices bid and asked for the investment (a “mid” evaluation). The Fund normally uses bid evaluations for any U.S. Treasury and Agency securities, mortgage-backed securities and municipal securities. The Fund normally uses mid evaluations for any other types of fixed-income securities and any OTC derivative contracts. In the event that market quotations and price evaluations are not available for an investment, the fair value of the investment is determined in accordance with procedures adopted by the Trustees.
The Trustees also have adopted procedures requiring an investment to be priced at its fair value whenever the Adviser determines that a significant event affecting the value of the investment has occurred between the time as of which the price of the investment would otherwise be determined and the time as of which the NAV is computed. An event is considered significant if there is both an affirmative expectation that the investment's value
Annual Shareholder Report
will change in response to the event and a reasonable basis for quantifying the resulting change in value. Examples of significant events that may occur after the close of the principal market on which a security is traded, or after the time of a price evaluation provided by a pricing service or a dealer, include:
| ■ | With respect to securities traded principally in foreign markets, significant trends in U.S. equity markets or in the trading of foreign securities index futures contracts; |
| ■ | Political or other developments affecting the economy or markets in which an issuer conducts its operations or its securities are traded; |
| ■ | Announcements concerning matters such as acquisitions, recapitalizations, litigation developments, or a natural disaster affecting the issuer's operations or regulatory changes or market developments affecting the issuer's industry. |
The Trustees have adopted procedures whereby the Valuation Committee uses a pricing service to determine the fair value of equity securities traded principally in foreign markets when the Adviser determines that there has been a significant trend in the U.S. equity markets or in index futures trading. For other significant events, the Fund may seek to obtain more current quotations or price evaluations from alternative pricing sources. If a reliable alternative pricing source is not available, the Fund will determine the fair value of the investment in accordance with the fair valuation procedures approved by the Trustees. The Trustees have ultimate responsibility for any fair valuations made in response to a significant event.
Repurchase Agreements
The Fund may invest in repurchase agreements for short-term liquidity purposes. It is the policy of the Fund to require the other party to a repurchase agreement to transfer to the Fund's custodian or sub-custodian eligible securities or cash with a market value (after transaction costs) at least equal to the repurchase price to be paid under the repurchase agreement. The eligible securities are transferred to accounts with the custodian or sub-custodian in which the Fund holds a “securities entitlement” and exercises “control” as those terms are defined in the Uniform Commercial Code. The Fund has established procedures for monitoring the market value of the transferred securities and requiring the transfer of additional eligible securities if necessary to equal at least the repurchase price. These procedures also allow the other party to require securities to be transferred from the account to the extent that their market value exceeds the repurchase price or in exchange for other eligible securities of equivalent market value.
The insolvency of the other party or other failure to repurchase the securities may delay the disposition of the underlying securities or cause the Fund to receive less than the full repurchase price. Under the terms of the repurchase agreement, any amounts received by the Fund in excess of the repurchase price and related transaction costs must be remitted to the other party.
The Fund may enter into repurchase agreements in which eligible securities are transferred into joint trading accounts maintained by the custodian or sub-custodian for investment companies and other clients advised by the Fund's Adviser and its affiliates. The Fund will participate on a pro rata basis with the other investment companies and clients in its share of the securities transferred under such repurchase agreements and in its share of proceeds from any repurchase or other disposition of such securities.
Annual Shareholder Report
Investment Income, Gains and Losses, Expenses and Distributions
Investment transactions are accounted for on a trade-date basis. Realized gains and losses from investment transactions are recorded on an identified-cost basis. Interest income and expenses are accrued daily. Dividend income and distributions to shareholders are recorded on the ex-dividend date. Foreign dividends are recorded on the ex-dividend date or when the Fund is informed of the ex-dividend date. Distributions of net investment income are declared and paid annually. Non-cash dividends included in dividend income, if any, are recorded at fair value. Investment income, realized and unrealized gains and losses, and certain fund-level expenses are allocated to each class based on relative average daily net assets, except that Class A Shares, Class B Shares and Class C Shares may bear distribution services fees and other service fees unique to those classes.
Dividends are declared separately for each class. No class has preferential dividend rights; differences in per share dividend rates are generally due to differences in separate class expenses.
Other Service Fees
The Fund may pay other service fees up to 0.25% of the average daily net assets of the Fund's Class A Shares, Class B Shares, and Class C Shares to unaffiliated financial intermediaries or to Federated Shareholder Services Company (FSSC) for providing services to shareholders and maintaining shareholder accounts. Subject to the terms described in the Expense Limitation note, FSSC may voluntarily reimburse the Fund for other service fees. In addition, unaffiliated third-party financial intermediaries may waive other service fees. This waiver can be modified or terminated at any time. For the year ended October 31, 2015, other service fees for the Fund were as follows:
| | Other
Service Fees
Incurred |
| Class A Shares | $224,253 |
| Class B Shares | 22,946 |
| Class C Shares | 164,540 |
| TOTAL | $411,739 |
Premium and Discount Amortization
All premiums and discounts on fixed-income securities are amortized/accreted using the effective-interest-rate method.
Federal Taxes
It is the Fund's policy to comply with the Subchapter M provision of the Internal Revenue Code (the “Code”) and to distribute to shareholders each year substantially all of its income. Accordingly, no provision for federal income tax is necessary. As of and during the year ended October 31, 2015, the Fund did not have a liability for any uncertain tax positions. The Fund recognizes interest and penalties, if any, related to tax liabilities as income tax expense in the Statement of Operations. As of October 31, 2015, tax years 2012 through 2015 remain subject to examination by the Fund's major tax jurisdictions, which include the United States of America and the Commonwealth of Massachusetts.
Annual Shareholder Report
The Fund may be subject to taxes imposed by governments of countries in which it invests. Such taxes are generally based on either income or gains earned or repatriated. The Fund accrues and applies such taxes to net investment income, net realized gains and net unrealized gains as income and/or gains are earned.
When-Issued and Delayed-Delivery Transactions
The Fund may engage in when-issued or delayed-delivery transactions. The Fund records when-issued securities on the trade date and maintains security positions such that sufficient liquid assets will be available to make payment for the securities purchased. Securities purchased on a when-issued or delayed-delivery basis are marked to market daily and begin earning interest on the settlement date. Losses may occur on these transactions due to changes in market conditions or the failure of counterparties to perform under the contract.
Futures Contracts
The Fund purchases and sells financial futures contracts to increase return and to manage country, duration and market risk. Upon entering into a financial futures contract with a broker, the Fund is required to deposit in a segregated account a specified amount of cash or U.S. government securities, which is shown as Restricted cash in the Statement of Assets and Liabilities. Futures contracts are valued daily and unrealized gains or losses are recorded in a “variation margin” account. Daily, the Fund receives from or pays to the broker a specified amount of cash based upon changes in the variation margin account. When a contract is closed, the Fund recognizes a realized gain or loss. Futures contracts have market risks, including the risk that the change in the value of the contract may not correlate with the changes in the value of the underlying securities. There is minimal counterparty risk to the Fund since futures are exchange traded and the exchange's clearing house, as counterparty to all exchange-traded futures, guarantees the futures against default.
Futures contracts outstanding at the period end are listed after the Fund's Portfolio of Investments.
The average notional value of short futures contracts held by the Fund throughout the period was $61,866,645. This is based on amounts held as of each month-end throughout the fiscal year.
Foreign Exchange Contracts
The Fund may enter into foreign exchange contracts to increase return and to manage currency risk. Purchased contracts are used to acquire exposure to foreign currencies, whereas, contracts to sell are used to hedge the Fund's securities against currency fluctuations. Risks may arise upon entering into these transactions from the potential inability of counterparties to meet the terms of their commitments and from unanticipated movements in security prices or foreign exchange rates. The foreign exchange contracts are adjusted by the daily exchange rate of the underlying currency and any gains or losses are recorded for financial statement purposes as unrealized until the settlement date.
Foreign exchange contracts are subject to Master Netting Agreements (MNA) which are agreements between the Fund and its counterparties that provide for the net settlement of all transactions and collateral with the Fund, through a single payment, in the event of default or termination.
Foreign exchange contracts outstanding at period end, including net unrealized appreciation/depreciation or net settlement amounts, are listed after the Fund's Portfolio of Investments.
Annual Shareholder Report
The average value at settlement date payable and receivable of foreign exchange contracts purchased and sold by the Fund throughout the period was $920,431 and $1,219,575, respectively. This is based on the contracts held as of each month-end throughout the fiscal year.
Foreign Currency Translation
The accounting records of the Fund are maintained in U.S. dollars. All assets and liabilities denominated in foreign currencies (FCs) are translated into U.S. dollars based on the rates of exchange of such currencies against U.S. dollars on the date of valuation. Purchases and sales of securities, income and expenses are translated at the rate of exchange quoted on the respective date that such transactions are recorded. The Fund does not isolate that portion of the results of operations resulting from changes in foreign exchange rates on investments from the fluctuations arising from changes in market prices of securities held. Such fluctuations are included with the net realized and unrealized gain or loss from investments.
Reported net realized foreign exchange gains or losses arise from sales of portfolio securities, sales and maturities of short-term securities, sales of FCs, currency gains or losses realized between the trade and settlement dates on securities transactions, the difference between the amounts of dividends, interest and foreign withholding taxes recorded on the Fund's books and the U.S. dollar equivalent of the amounts actually received or paid. Net unrealized foreign exchange gains and losses arise from changes in the value of assets and liabilities other than investments in securities at fiscal period-end, resulting from changes in the exchange rate.
Short Sales
In a short sale, the Fund sells a security it does not own in anticipation of a decline in the fair market value of the security. When the Fund sells a security short, it must borrow the security in order to deliver it at the completion of the sale. A gain, limited to the price at which the Fund sold the security short, or a loss, unlimited in size, will be recognized upon the termination of the short sale.
The Fund has an obligation to replace the borrowed security (e.g., to purchase the security at a future date and deliver it to the lender of the security). While the security is borrowed, the proceeds from the sale are deposited with the lender (“Prime Broker”). The Fund may incur two types of expenses from short sales: borrowing expenses and dividend expenses. Borrowing expenses may occur because the Fund may be obligated to pay fees to the Prime Broker on borrowed securities. This fee is normally based upon the market value of the borrowed security and is dependent upon the availability of the security. Dividend expenses may occur because the Fund has to pay the Prime Broker the equivalent of any dividends earned on the borrowed security.
For the year ended October 31, 2015, the net realized gain (loss) on short sales was $17,788.
Option Contracts
The Fund buys/sells put and call options to increase return and to manage country, currency, individual security, market and sector/asset risk. The seller (writer) of an option receives a payment or premium, from the buyer, which the writer keeps regardless of whether the buyer exercises the option. When the Fund writes a put or call option, an amount equal to the premium received is recorded as a liability and subsequently marked to market to reflect the current value of the option written. Premiums received from writing options which expire are treated as realized gains. The Fund, as a writer of an option, bears the market risk of an
Annual Shareholder Report
unfavorable change in the price of the underlying reference instrument. When the Fund purchases a put or call option, an amount equal to the premium paid is recorded as an increase to the cost of the investment and subsequently marked to market to reflect the current value of the option purchased. Premiums paid for purchasing options which expire are treated as realized losses. Premiums received/paid for writing/purchasing options which are exercised or closed are added to the proceeds or offset against amounts paid on the underlying reference instrument to determine the realized gain or loss. The risk associated with purchasing put and call options is limited to the premium paid. Options can trade on securities or commodities exchanges. In this case, the exchange sets all the terms of the contract except for the price. Most exchanges require investors to maintain margin accounts through their brokers to cover their potential obligations to the exchange. This protects investors against potential defaults by the counterparty.
The average market value of purchased options held by the Fund throughout the fiscal period was $3,462,961. This is based on amounts held as of each month-end throughout the fiscal year.
Additional Disclosure Related to Derivative Instruments
| Fair Value of Derivative Instruments |
| | Asset | Liability |
| | Statement of
Assets and
Liabilities
Location | Fair
Value | Statement of
Assets and
Liabilities
Location | Fair
Value |
| Derivatives not accounted for as hedging instruments under ASC Topic 815 | | | | |
| Foreign exchange contracts | Unrealized
appreciation
on foreign
exchange
contracts | $462,051 | Unrealized
depreciation
on foreign
exchange
contracts | $331,084 |
| Equity contracts | Total investments
in securities,
at value | 4,727,550 | | — |
| Equity contracts | Receivable for daily
variation margin | (2,007,508)* | | — |
| Total derivatives not accounted for as hedging instruments under ASC Topic 815 | | $3,182,093 | | $331,084 |
| * | Includes cumulative depreciation of futures contracts as reported in the footnotes to the Portfolio of Investments. Only the current day's variation margin is reported within the Statement of Assets and Liabilities. |
Annual Shareholder Report
The Effect of Derivative Instruments on the Statement of Operations for the Year Ended October 31, 2015
| Amount of Realized Gain or (Loss) on Derivatives Recognized in Income |
| | Futures | Options
Purchased | Forward
Currency
Contracts | Total |
| Foreign exchange contracts | $— | $(99,540) | $979,515 | $879,975 |
| Equity contracts | $(1,618,037) | $(1,142,158) | $— | $(2,760,195) |
| Interest rate contracts | $(218,419) | $— | $— | $(218,419) |
| TOTAL | $(1,836,456) | $(1,241,698) | $979,515 | $(2,098,639) |
| Change in Unrealized Appreciation or (Depreciation) on Derivatives Recognized in Income |
| | Futures | Options
Purchased | Forward
Currency
Contracts | Total |
| Foreign exchange contracts | $— | $— | $42,589 | $42,589 |
| Equity contracts | $(477,020) | $(1,614,055) | $— | $(2,091,075) |
| Interest rate contracts | $46,206 | $— | $— | $46,206 |
| TOTAL | $(430,814) | $(1,614,055) | $42,589 | $(2,002,280) |
As indicated above, certain derivative investments are transacted subject to MNA. These agreements permit the Fund to offset with a counterparty certain derivative payables and/or receivables with collateral held and create one single net payment in the event of default or termination of the agreement by either the Fund or the counterparty. Amounts presented on the Portfolio of Investments and Statement of Assets and Liabilities are not net settlement amounts but gross. As of October 31, 2015, the impact of netting assets and liabilities and the collateral pledged or received based on MNA are detailed below:
| Gross Amounts Not Offset in the Statement of Assets and Liabilities |
| Transaction | Gross Asset
Derivatives
Presented in
Statement of
Assets and
Liabilities | Financial
Instruments | Collateral
Received | Net Amount |
| Foreign Exchange Contracts | $462,051 | $(244,485) | $— | $217,566 |
| TOTAL | $462,051 | $(244,485) | $— | $217,566 |
| Transaction | Gross Liability
Derivatives
Presented in
Statement of
Assets and
Liabilities | Financial
Instruments | Collateral
Pledged | Net Amount |
| Foreign Exchange Contracts | $331,084 | $(244,485) | $— | $86,599 |
| TOTAL | $331,084 | $(244,485) | $— | $86,599 |
Annual Shareholder Report
Other
The preparation of financial statements in conformity with GAAP requires management to make estimates and assumptions that affect the amounts of assets, liabilities, expenses and revenues reported in the financial statements. Actual results could differ from those estimated. The Fund applies Investment Company accounting and reporting guidance.
3. SHARES OF BENEFICIAL INTEREST
The following tables summarize share activity:
| Year Ended October 31 | 2015 | 2014 |
| Class A Shares: | Shares | Amount | Shares | Amount |
| Shares sold | 2,524,520 | $26,115,312 | 1,186,149 | $11,597,303 |
| Shares issued to shareholders in payment of distributions declared | 105,262 | 1,053,668 | 4,778 | 45,820 |
| Shares redeemed | (2,209,206) | (22,735,504) | (4,260,807) | (41,707,526) |
| NET CHANGE RESULTING FROM CLASS A SHARE TRANSACTIONS | 420,576 | $4,433,476 | (3,069,880) | $(30,064,403) |
| Year Ended October 31 | 2015 | 2014 |
| Class B Shares: | Shares | Amount | Shares | Amount |
| Shares sold | 19,531 | $197,777 | 40,481 | $390,554 |
| Shares issued to shareholders in payment of distributions declared | — | — | 641 | 6,087 |
| Shares redeemed | (410,261) | (4,161,999) | (749,627) | (7,236,656) |
| NET CHANGE RESULTING FROM CLASS B SHARE TRANSACTIONS | (390,730) | $(3,964,222) | (708,505) | $(6,840,015) |
| Year Ended October 31 | 2015 | 2014 |
| Class C Shares: | Shares | Amount | Shares | Amount |
| Shares sold | 681,192 | $6,945,031 | 359,504 | $3,450,698 |
| Shares issued to shareholders in payment of distributions declared | — | — | 3,455 | 32,689 |
| Shares redeemed | (1,549,861) | (15,668,389) | (2,607,013) | (24,980,059) |
| NET CHANGE RESULTING FROM CLASS C SHARE TRANSACTIONS | (868,669) | $(8,723,358) | (2,244,054) | $(21,496,672) |
Annual Shareholder Report
| Year Ended October 31 | 2015 | 2014 |
| Institutional Shares: | Shares | Amount | Shares | Amount |
| Shares sold | 8,619,085 | $89,814,240 | 2,266,346 | $22,541,590 |
| Shares issued to shareholders in payment of distributions declared | 41,736 | 419,868 | 698 | 6,728 |
| Shares redeemed | (1,918,171) | (19,832,683) | (1,587,080) | (15,568,483) |
| NET CHANGE RESULTING FROM INSTITUTIONAL SHARE TRANSACTIONS | 6,742,650 | $70,401,425 | 679,964 | $6,979,835 |
| NET CHANGE RESULTING FROM TOTAL FUND SHARE TRANSACTIONS | 5,903,827 | $62,147,321 | (5,342,475) | $(51,421,255) |
4. FEDERAL TAX INFORMATION
The timing and character of income and capital gain distributions are determined in accordance with income tax regulations, which may differ from GAAP. These differences are due to differing treatments for foreign currency transactions, discount accretion/premium amortization on debt securities, trade error reclass, short-term capital gain distribution reclass, partnership adjustments, net operating loss, taxable over distribution, expiration of capital loss carryforwards, short dividends disallowed and REIT reclass.
For the year ended October 31, 2015, permanent differences identified and reclassified among the components of net assets were as follows:
| | Increase (Decrease) |
| Paid-In Capital | Undistributed
Net Investment
Income (Loss) | Accumulated
Net Realized
Gain (Loss) |
| $(26,956,800) | $53,706 | $26,903,094 |
Net investment income (loss), net realized gains (losses), and net assets were not affected by this reclassification.
The tax character of distributions as reported on the Statement of Changes in Net Assets for the years ended October 31, 2015 and 2014, was as follows:
| | 2015 | 2014 |
| Ordinary income | $1,720,483 | $107,976 |
As of October 31, 2015, the components of distributable earnings on a tax-basis were as follows:
| Net unrealized depreciation | $(14,454,111) |
| Capital loss carryforwards and deferrals | $(403,117,896) |
The difference between book-basis and tax-basis net unrealized appreciation/depreciation is attributable to differing treatments for the deferral of losses on wash sales, defaulted bonds, partnerships and unrealized AICPA amortization.
At October 31, 2015, the cost of investments for federal tax purposes was $282,957,041. The net unrealized depreciation of investments for federal tax purposes excluding any unrealized appreciation/depreciation resulting from: (a) the translation from FCs to U.S. dollars of assets and liabilities other than investment in securities; (b) outstanding foreign currency
Annual Shareholder Report
commitments; (c) securities sold short; and (d) futures contracts was $14,879,745. This consists of net unrealized appreciation from investments for those securities having an excess of value over cost of $29,559,484 and net unrealized depreciation from investments for those securities having an excess of cost over value of $44,439,229.
At October 31, 2015, the Fund had a capital loss carryforward of $402,569,442 which will reduce the Fund's taxable income arising from future net realized gains on investments, if any, to the extent permitted by the Code, thereby reducing the amount of distributions to shareholders which would otherwise be necessary to relieve the Fund of any liability for federal income tax. Pursuant to the Code, a net capital loss incurred in taxable years beginning on or before December 22, 2010 is characterized as short-term and may be carried forward for maximum of eight tax years (“Carryforward Limit”), whereas a net capital loss incurred in taxable years beginning after December 22, 2010, retains its character as either short-term or long-term and does not expire and is required to be utilized prior to the losses which have Carryforward Limit.
The following schedule summarizes the Fund's capital loss carryforwards and expiration years:
| Expiration Year | Short-Term | Long-Term | Total |
| No expiration | $11,640,590 | $3,886,849 | $15,527,439 |
| 2017 | $257,322,572 | NA | $257,322,572 |
| 2018 | $111,074,244 | NA | $111,074,244 |
| 2019 | $18,645,187 | NA | $18,645,187 |
The Fund used capital loss carryforwards of $7,073,575 to offset capital gains realized during the year ended October 31, 2015. Capital loss carryforwards of $26,587,308 expired during the year ended October 31, 2015.
Under current tax rules, a late-year ordinary loss may be deferred, in whole or in part, and treated as occurring on the first day of the following fiscal year. As of October 31, 2015, for federal income tax purposes, a late year ordinary loss of $515,392 was deferred to November 1, 2015.
At October 31, 2015, for federal tax purposes, the Fund had $33,062 in straddle loss deferrals.
5. INVESTMENT ADVISER FEE AND OTHER TRANSACTIONS WITH AFFILIATES
Investment Adviser Fee
The advisory agreement between the Fund and the Adviser provides for an annual fee equal to 0.75% of the Fund's average daily net assets. Subject to the terms described in the Expense Limitation note, the Adviser may voluntarily choose to waive any portion of its fee. For the year ended October 31, 2015, the Adviser voluntarily waived $258,020 of its fee.
Certain of the Fund's assets are managed by Federated Investment Management Company (the “Sub-Adviser”). Under the terms of a sub-advisory agreement between the Adviser and the Sub-Adviser, the Sub-Adviser receives an allocable portion of the Fund's adviser fee. The fee is paid by the Adviser out of its resources and is not an incremental Fund expense. For the year ended October 31, 2015, the Sub-Adviser earned a fee of $43,585.
Annual Shareholder Report
Administrative Fee
Federated Administrative Services (FAS), under the Administrative Services Agreement, provides the Fund with administrative personnel and services. For purposes of determining the appropriate rate breakpoint, “Investment Complex” is defined as all of the Federated Funds subject to a fee under the Administrative Services Agreement. The fee paid to FAS is based on the average daily net assets of the Investment Complex as specified below, plus certain out-of-pocket expenses:
| Administrative Fee | Average Daily Net Assets
of the Investment Complex |
| 0.150% | on the first $5 billion |
| 0.125% | on the next $5 billion |
| 0.100% | on the next $10 billion |
| 0.075% | on assets in excess of $20 billion |
Subject to the terms described in the Expense Limitation note, FAS may voluntarily choose to waive any portion of its fee. For the year ended October 31, 2015, the annualized fee paid to FAS was 0.078% of average daily net assets of the Fund.
Distribution Services Fee
The Fund has adopted a Distribution Plan (the “Plan”) pursuant to Rule 12b-1 under the Act. Under the terms of the Plan, the Fund will compensate Federated Securities Corp. (FSC), the principal distributor, from the daily net assets of the Fund's Class A Shares, Class B Shares and Class C Shares to finance activities intended to result in the sale of these shares. The Plan provides that the Fund may incur distribution expenses at the following percentages of average daily net assets annually, to compensate FSC:
| Share Class Name | Percentage of Average Daily
Net Assets of Class |
| Class A Shares | 0.05% |
| Class B Shares | 0.75% |
| Class C Shares | 0.75% |
Subject to the terms described in the Expense Limitation note, FSC may voluntarily choose to waive any portion of its fee. For the year ended October 31, 2015, distribution services fees for the Fund were as follows:
| | Distribution
Services Fees
Incurred |
| Class B Shares | $68,839 |
| Class C Shares | 493,619 |
| TOTAL | $562,458 |
When FSC receives fees, it may pay some or all of them to financial intermediaries whose customers purchase shares. For the year ended October 31, 2015, FSC retained $55,509 of fees paid by the Fund. For the year ended October 31, 2015, the Fund's Class A Shares did not incur a distribution services fee; however, it may begin to incur this fee upon approval of the Trustees.
Annual Shareholder Report
Sales Charges
Front-end sales charges and contingent deferred sales charges (CDSC) do not represent expenses of the Fund. They are deducted from the proceeds of sales of Fund shares prior to investment or from redemption proceeds prior to remittance, as applicable. For the year ended October 31, 2015, FSC retained $12,555 in sales charges from the sale of Class A Shares. For the year ended October 31, 2015, FSC also retained $1,328, $9,713 and $1,403 of CDSC relating to redemptions of Class A Shares, Class B Shares and Class C Shares, respectively.
Other Service Fees
For the year ended October 31, 2015, FSSC received $17,594 of the other service fees disclosed in Note 2.
Expense Limitation
The Adviser and certain of its affiliates (which may include FSC, FAS and FSSC) on their own initiative have agreed to waive certain amounts of their respective fees and/or reimburse expenses. Total annual fund operating expenses (as shown in the financial highlights, excluding dividends and other expenses related to short sales, premiums for risk insurance policies on certain portfolio securities, expenses allocated from affiliated partnerships, extraordinary expenses and proxy-related expenses paid by the Fund, if any) paid by the Fund's Class A Shares, Class B Shares, Class C Shares and Institutional Shares (after the voluntary waivers and reimbursements) will not exceed 1.29%, 2.04%, 2.04% and 1.04% (the “Fee Limit”), respectively, up to but not including the later of (the “Termination Date”): (a) January 1, 2017; or (b) the date of the Fund's next effective Prospectus. While the Adviser and its applicable affiliates currently do not anticipate terminating or increasing these arrangements prior to the Termination Date, these arrangements may only be terminated or the Fee Limit increased prior to the Termination Date with the agreement of the Trustees.
General
Certain Officers and Trustees of the Fund are Officers and Directors or Trustees of certain of the above companies. To efficiently facilitate payment, Directors'/Trustees' fees and certain expenses related to conducting meetings of the Directors/Trustees and other miscellaneous expenses are paid by an affiliate of the Adviser which in due course are reimbursed by the Fund. Such expenses may be included in Accrued and Miscellaneous Expenses on the Statement of Assets and Liabilities and Statement of Operations, respectively.
Annual Shareholder Report
Transactions Involving Affiliated Holdings
Affiliated holdings are investment companies which are managed by the Adviser or an affiliate of the Adviser. The Adviser has agreed to reimburse the Fund for certain investment adviser fees as a result of transactions in other affiliated investment companies. For the year ended October 31, 2015, the Adviser reimbursed $18,858. Transactions with the affiliated holding during the year ended October 31, 2015, were as follows:
| | Federated
Prime Value
Obligations
Fund,
Institutional
Shares | High Yield
Bond
Portfolio | Federated
Project and
Trade
Finance
Core Fund | Total of
Affiliated
Transactions |
| Balance of Shares Held 10/31/2014 | 20,111,613 | 1,275,936 | 911,085 | 22,298,634 |
| Purchases/Additions | 183,294,961 | 102,617 | 3,800 | 183,401,378 |
| Sales/Reductions | (176,874,928) | — | (914,885) | (177,789,813) |
| Balance of Shares Held 10/31/2015 | 26,531,646 | 1,378,553 | — | 27,910,199 |
| Value | $26,531,646 | $8,491,887 | $— | $35,023,533 |
| Dividend Income | $16,463 | $547,999 | $68,068 | $632,530 |
| Realized Gain Distributions | $— | $96,344 | $— | $96,344 |
6. Investment TRANSACTIONS
Purchases and sales of investments, excluding long-term U.S. government securities and short-term obligations, for the year ended October 31, 2015, were as follows:
| Purchases | $ 187,334,094 |
| Sales | $ 187,981,123 |
7. LINE OF CREDIT
The Fund participates in a $100,000,000 unsecured, uncommitted revolving line of credit (LOC) agreement with PNC Bank. The LOC was made available for extraordinary or emergency purposes, primarily for financing redemption payments. Borrowings are charged interest at a rate offered to the Fund by PNC Bank at the time of the borrowing. As of October 31, 2015, there were no outstanding loans. During the year ended October 31, 2015, the Fund did not utilize the LOC.
8. INTERFUND LENDING
Pursuant to an Exemptive Order issued by the Securities and Exchange Commission, the Fund, along with other funds advised by subsidiaries of Federated Investors, Inc., may participate in an interfund lending program. This program provides an alternative credit facility allowing the Fund to borrow from other participating affiliated funds. As of October 31, 2015, there were no outstanding loans. During the year ended October 31, 2015, the program was not utilized.
Annual Shareholder Report
9. RECEIVABLE FROM BANKRUPTCY TRUSTEE
The amount presented on the Statement of Assets and Liabilities, under the caption receivable for investments sold, includes net realizable proceeds of $1,069,638 which represents the estimated amount expected to be received from the bankruptcy trustee for certain security transactions executed through Lehman Brothers in 2008.
10. FEDERAL TAX INFORMATION (UNAUDITED)
For the fiscal year ended October 31, 2015, 100% of total ordinary income distributions made by the Fund are qualifying dividends which may be subject to a maximum tax rate of 15%, as provided for by the Jobs and Growth Tax Relief Act of 2003. Complete information is reported in conjunction with the reporting of your distributions on Form 1099-DIV. Of the ordinary income distributions made by the Fund during the year ended October 31, 2015, 100% qualify for the dividend received deduction available to corporate shareholders.
Annual Shareholder Report
Report of Independent Registered Public Accounting Firm
TO THE BOARD OF TRUSTEES OF THE FEDERATED EQUITY FUNDS AND SHAREHOLDERS OF Federated absolute return fund:
We have audited the accompanying statement of assets and liabilities, including the portfolio of investments, of Federated Absolute Return Fund (the “Fund”), a portfolio of Federated Equity Funds, as of October 31, 2015, and the related statement of operations for the year then ended, the statements of changes in net assets for each of the years in the two-year period then ended and the financial highlights for each of the years in the five-year period then ended. These financial statements and financial highlights are the responsibility of the Fund's management. Our responsibility is to express an opinion on these financial statements and financial highlights based on our audits.
We conducted our audits in accordance with the standards of the Public Company Accounting Oversight Board (United States). Those standards require that we plan and perform the audit to obtain reasonable assurance about whether the financial statements and financial highlights are free of material misstatement. An audit includes examining, on a test basis, evidence supporting the amounts and disclosures in the financial statements. Our procedures included confirmation of securities owned as of October 31, 2015, by correspondence with the custodian and brokers. An audit also includes assessing the accounting principles used and significant estimates made by management, as well as evaluating the overall financial statement presentation. We believe that our audits provide a reasonable basis for our opinion.
In our opinion, the financial statements and financial highlights referred to above present fairly, in all material respects, the financial position of the Federated Absolute Return Fund as of October 31, 2015, and the results of its operations for the year then ended, the changes in its net assets for each of the years in the two-year period then ended and the financial highlights for each of the years in the five-year period then ended, in conformity with U.S. generally accepted accounting principles.
Boston, Massachusetts
December 23, 2015
Annual Shareholder Report
Shareholder Expense Example (unaudited)
As a shareholder of the Fund, you incur two types of costs: (1) transaction costs, including sales charges (loads) on purchase or redemption payments; and (2) ongoing costs, including management fees and to the extent applicable, distribution (12b-1) fees and/or other service fees and other Fund expenses. This Example is intended to help you to understand your ongoing costs (in dollars) of investing in the Fund and to compare these costs with the ongoing costs of investing in other mutual funds. It is based on an investment of $1,000 invested at the beginning of the period and held for the entire period from May 1, 2015 to October 31, 2015.
ACTUAL EXPENSES
The first section of the table below provides information about actual account values and actual expenses. You may use the information in this section, together with the amount you invested, to estimate the expenses that you incurred over the period. Simply divide your account value by $1,000 (for example, an $8,600 account value divided by $1,000 = 8.6), then multiply the result by the number in the first section under the heading entitled “Expenses Paid During Period” to estimate the expenses attributable to your investment during this period.
HYPOTHETICAL EXAMPLE FOR COMPARISON PURPOSES
The second section of the table below provides information about hypothetical account values and hypothetical expenses based on the Fund's actual expense ratio and an assumed rate of return of 5% per year before expenses, which is not the Fund's actual return. Thus, you should not use the hypothetical account values and expenses to estimate the actual ending account balance or your expenses for the period. Rather, these figures are required to be provided to enable you to compare the ongoing costs of investing in the Fund with other funds. To do so, compare this 5% hypothetical example with the 5% hypothetical examples that appear in the shareholder reports of the other funds.
Annual Shareholder Report
Please note that the expenses shown in the table are meant to highlight your ongoing costs only and do not reflect any transaction costs, such as sales charges (loads) on purchase or redemption payments. Therefore, the second section of the table is useful in comparing ongoing costs only, and will not help you determine the relative total costs of owning different funds. In addition, if these transaction costs were included, your costs would have been higher.
| | Beginning
Account Value
5/1/2015 | Ending
Account Value
10/31/2015 | Expenses Paid
During Period1 |
| Actual: | | | |
| Class A Shares | $1,000 | $1,000.00 | $8.37 |
| Class B Shares | $1,000 | $996.10 | $12.23 |
| Class C Shares | $1,000 | $996.10 | $12.18 |
| Institutional Shares | $1,000 | $1,001.00 | $6.86 |
Hypothetical (assuming a 5% return
before expenses): | | | |
| Class A Shares | $1,000 | $1,016.84 | $8.44 |
| Class B Shares | $1,000 | $1,012.96 | $12.33 |
| Class C Shares | $1,000 | $1,013.01 | $12.28 |
| Institutional Shares | $1,000 | $1,018.35 | $6.92 |
| 1 | Expenses are equal to the Fund's annualized net expense ratios, multiplied by the average account value over the period, multiplied by 184/365 (to reflect the one-half-year period). The annualized net expense ratios are as follows: |
| | |
| Class A Shares | 1.66% |
| Class B Shares | 2.43% |
| Class C Shares | 2.42% |
| Institutional Shares | 1.36% |
Annual Shareholder Report
Board of Trustees and Trust Officers
The Board of Trustees is responsible for managing the Trust's business affairs and for exercising all the Trust's powers except those reserved for the shareholders. The following tables give information about each Trustee and the senior officers of the Fund. Where required, the tables separately list Trustees who are “interested persons” of the Fund (i.e., “Interested” Trustees) and those who are not (i.e., “Independent” Trustees). Unless otherwise noted, the address of each person listed is Federated Investors Tower, 1001 Liberty Avenue, Pittsburgh, PA 15222. The address of all Independent Trustees listed is 4000 Ericsson Drive, Warrendale, PA 15086-7561; Attention: Mutual Fund Board. As of December 31, 2014, the Trust comprised 14 portfolio(s), and the Federated Fund Family consisted of 40 investment companies (comprising 131 portfolios). Unless otherwise noted, each Officer is elected annually. Unless otherwise noted, each Trustee oversees all portfolios in the Federated Fund Family and serves for an indefinite term. The Fund's Statement of Additional Information includes additional information about Trust Trustees and is available, without charge and upon request, by calling 1-800-341-7400.
Interested Trustees Background
Name
Birth Date
Positions Held with Trust
Date Service Began | Principal Occupation(s) for Past Five Years,
Other Directorships Held and Previous Position(s) |
John F. Donahue*
Birth Date: July 28, 1924
Trustee
Indefinite Term
Began serving: April 1984 | Principal Occupations: Director or Trustee of the Federated Fund Family; Chairman and Director, Federated Investors, Inc.; Chairman of the Federated Fund Family's Executive Committee.
Previous Positions: Chairman of the Federated Fund Family; Trustee, Federated Investment Management Company; Chairman and Director, Federated Investment Counseling. |
J. Christopher Donahue*
Birth Date: April 11, 1949
President and Trustee
Indefinite Term
Began serving: January 2000 | Principal Occupations: Principal Executive Officer and President of certain of the Funds in the Federated Fund Family; Director or Trustee of the Funds in the Federated Fund Family; President, Chief Executive Officer and Director, Federated Investors, Inc.; Chairman and Trustee, Federated Investment Management Company; Trustee, Federated Investment Counseling; Chairman and Director, Federated Global Investment Management Corp.; Chairman, Federated Equity Management Company of Pennsylvania and Passport Research, Ltd. (investment advisory subsidiary of Federated); Trustee, Federated Shareholder Services Company; Director, Federated Services Company.
Previous Positions: President, Federated Investment Counseling; President and Chief Executive Officer, Federated Investment Management Company, Federated Global Investment Management Corp. and Passport Research, Ltd. |
| * | Family relationships and reasons for “interested” status: John F. Donahue is the father of J. Christopher Donahue; both are “interested” due to their beneficial ownership of shares of Federated Investors, Inc. and the positions they hold with Federated and its subsidiaries. |
Annual Shareholder Report
INDEPENDENT Trustees Background
Name
Birth Date
Positions Held with Trust
Date Service Began | Principal Occupation(s) for Past Five Years,
Other Directorships Held, Previous Position(s) and Qualifications |
John T. Collins
Birth Date: January 24, 1947
Trustee
Indefinite Term
Began serving: October 2013 | Principal Occupations: Director or Trustee of the Federated Fund Family; Chairman and CEO, The Collins Group, Inc. (a private equity firm).
Other Directorships Held: Director, Chair of the Compensation Committee, Audit Committee member, KLX Corp.
Qualifications: Mr. Collins has served in several business and financial management roles and directorship positions throughout his career. Mr. Collins serves as Chairman Emeriti, Bentley University. Mr. Collins previously served as Director, FleetBoston Financial Corp.; Director and Audit Committee Member, Bank of America Corp. and Director, Beth Israel Deaconess Medical Center (Harvard University Affiliate Hospital). |
G. Thomas Hough
Birth Date: February 28, 1955
Trustee
Indefinite Term
Began serving: August 2015 | Principal Occupations: Director or Trustee of the Federated Fund Family; Retired.
Other Directorships Held: Director, Chair of the Audit Committee, Governance Committee, Publix Super Markets, Inc.
Qualifications: Mr. Hough has served in accounting, business management and directorship positions throughout his career. Mr. Hough most recently held the position of Americas Vice Chair of Assurance with Ernst & Young LLP. Mr. Hough is an Executive Committee member of the United States Golf Association, he serves on the President's Cabinet and Business School Board of Visitors for the University of Alabama and is on the Business School Board of Visitors for Wake Forest University. |
Maureen Lally-Green
Birth Date: July 5, 1949
Trustee
Indefinite Term
Began serving: August 2009 | Principal Occupations: Director or Trustee of the Federated Fund Family; Adjunct Professor of Law, Duquesne University School of Law.
Other Directorships Held: Director, CONSOL Energy Inc.
Qualifications: Judge Lally-Green has served in various legal and business roles and directorship positions throughout her career. Judge Lally-Green previously served as: Associate General Secretary, Diocese of Pittsburgh; Professor of Law, Duquesne University School of Law and was a member of the Superior Court of Pennsylvania. Judge Lally-Green also holds the positions of: Member, Pennsylvania State Board of Education; Director, Saint Vincent College; Director and Chair, UPMC Mercy Hospital; Regent, St. Vincent Seminary; Director, Epilepsy Foundation of Western and Central Pennsylvania; Director, Our Campaign for the Church Alive!, Inc.; Director, Pennsylvania Bar Institute; and Director, Cardinal Wuerl North Catholic High School, Inc. Judge Lally-Green has held the positions of: Director, Auberle; Director, Ireland Institute of Pittsburgh; Director, Saint Thomas More Society; and Director, Catholic High Schools of the Diocese of Pittsburgh, Inc. |
Annual Shareholder Report
Name
Birth Date
Positions Held with Trust
Date Service Began | Principal Occupation(s) for Past Five Years,
Other Directorships Held, Previous Position(s) and Qualifications |
Peter E. Madden
Birth Date: March 16, 1942
Trustee
Indefinite Term
Began serving: November 1991 | Principal Occupation: Director or Trustee, and Chair of the Board of Directors or Trustees, of the Federated Fund Family; Retired.
Other Directorships Held: None.
Qualifications: Mr. Madden has served in several business management, mutual fund services and directorship positions throughout his career. Mr. Madden previously served as President, Chief Operating Officer and Director, State Street Bank and Trust Company (custodian bank) and State Street Corporation (financial services). He was Director, VISA USA and VISA International and Chairman and Director, Massachusetts Bankers Association. Mr. Madden served as Director, Depository Trust Corporation and Director, The Boston Stock Exchange. Mr. Madden also served as a Representative to the Commonwealth of Massachusetts General Court. |
Charles F. Mansfield, Jr.
Birth Date: April 10, 1945
Trustee
Indefinite Term
Began serving: January 1999 | Principal Occupations: Director or Trustee of the Federated Fund Family; Management Consultant.
Other Directorships Held: None.
Qualifications: Mr. Mansfield has served in several banking, business management and educational roles and directorship positions throughout his career. Mr. Mansfield previously served as Chief Executive Officer, PBTC International Bank; Partner, Arthur Young & Company (now Ernst & Young LLP); Chief Financial Officer of Retail Banking Sector, Chase Manhattan Bank; Senior Vice President, HSBC Bank USA (formerly, Marine Midland Bank); Vice President, Citibank; Assistant Professor of Banking and Finance, Frank G. Zarb School of Business, Hofstra University; Executive Vice President DVC Group, Inc. (marketing, communications and technology). |
Thomas M. O'Neill
Birth Date: June 14, 1951
Trustee
Indefinite Term
Began serving: October 2006 | Principal Occupations: Director or Trustee, Vice Chair of the Audit Committee of the Federated Fund Family; Sole Proprietor, Navigator Management Company (investment and strategic consulting).
Other Directorships Held: None.
Qualifications: Mr. O'Neill has served in several business, mutual fund and financial management roles and directorship positions throughout his career. Mr. O'Neill serves as Director, Medicines for Humanity and Director, The Golisano Children's Museum of Naples, Florida. Mr. O'Neill previously served as Chief Executive Officer and President, Managing Director and Chief Investment Officer, Fleet Investment Advisors; President and Chief Executive Officer, Aeltus Investment Management, Inc.; General Partner, Hellman, Jordan Management Co., Boston, MA; Chief Investment Officer, The Putnam Companies, Boston, MA; Credit Analyst and Lending Officer, Fleet Bank; Director and Consultant, EZE Castle Software (investment order management software); and Director, Midway Pacific (lumber). |
Annual Shareholder Report
Name
Birth Date
Positions Held with Trust
Date Service Began | Principal Occupation(s) for Past Five Years,
Other Directorships Held, Previous Position(s) and Qualifications |
P. Jerome Richey
Birth Date: February 23, 1949
Trustee
Indefinite Term
Began serving: October 2013 | Principal Occupations: Director or Trustee of the Federated Fund Family; Management Consultant.
Other Directorships Held: None.
Qualifications: Mr. Richey has served in several business and legal management roles and directorship positions throughout his career. Mr. Richey most recently held the positions of Senior Vice Chancellor and Chief Legal Officer, University of Pittsburgh. Mr. Richey serves as Board Member, Epilepsy Foundation of Western Pennsylvania and Board member, World Affairs Council of Pittsburgh. Mr. Richey previously served as Chief Legal Officer and Executive Vice President, CONSOL Energy Inc. and Shareholder, Buchanan Ingersoll & Rooney PC (a law firm). |
John S. Walsh
Birth Date: November 28, 1957
Trustee
Indefinite Term
Began serving: January 1999 | Principal Occupations: Director or Trustee, Chair of the Audit Committee of the Federated Fund Family; President and Director, Heat Wagon, Inc. (manufacturer of construction temporary heaters); President and Director, Manufacturers Products, Inc. (distributor of portable construction heaters); President, Portable Heater Parts, a division of Manufacturers Products, Inc.
Other Directorships Held: None.
Qualifications: Mr. Walsh has served in several business management roles and directorship positions throughout his career. Mr. Walsh previously served as Vice President, Walsh & Kelly, Inc. (paving contractors). |
OFFICERS
Name
Birth Date
Address
Positions Held with Trust
Date Service Began | Principal Occupation(s) for Past Five Years
and Previous Position(s) |
John W. McGonigle
Birth Date: October 26, 1938
EXECUTIVE VICE PRESIDENT AND SECRETARY
Officer since: April 1984 | Principal Occupations: Executive Vice President and Secretary of the Federated Fund Family; Vice Chairman, Executive Vice President, Secretary and Director, Federated Investors, Inc.
Previous Positions: Trustee, Federated Investment Management Company and Federated Investment Counseling; Director, Federated Global Investment Management Corp., Federated Services Company and Federated Securities Corp. |
Annual Shareholder Report
Name
Birth Date
Address
Positions Held with Trust
Date Service Began | Principal Occupation(s) for Past Five Years
and Previous Position(s) |
Lori A. Hensler
Birth Date: January 6, 1967
TREASURER
Officer since: April 2013 | Principal Occupations: Principal Financial Officer and Treasurer of the Federated Fund Family; Senior Vice President, Federated Administrative Services; Financial and Operations Principal for Federated Securities Corp. and Edgewood Services, Inc.; and Assistant Treasurer, Federated Investors Trust Company. Ms. Hensler has received the Certified Public Accountant designation.
Previous Positions: Controller of Federated Investors, Inc.; Senior Vice President and Assistant Treasurer, Federated Investors Management Company; Treasurer, Federated Investors Trust Company; Assistant Treasurer, Federated Administrative Services, Federated Administrative Services, Inc., Federated Securities Corp., Edgewood Services, Inc., Federated Advisory Services Company, Federated Equity Management Company of Pennsylvania, Federated Global Investment Management Corp., Federated Investment Counseling, Federated Investment Management Company, Passport Research, Ltd., and Federated MDTA, LLC; Financial and Operations Principal for Federated Securities Corp., Edgewood Services, Inc. and Southpointe Distribution Services, Inc. |
Richard B. Fisher
Birth Date: May 17, 1923
VICE PRESIDENT
Officer since: April 1984 | Principal Occupations: Vice Chairman or Vice President of some of the Funds in the Federated Fund Family; Vice Chairman, Federated Investors, Inc.; Chairman, Federated Securities Corp.
Previous Positions: President and Director or Trustee of some of the Funds in the Federated Fund Family; Executive Vice President, Federated Investors, Inc.; Director and Chief Executive Officer, Federated Securities Corp. |
Peter J. Germain
Birth Date: September 3, 1959
CHIEF LEGAL OFFICER
Officer since: January 2005 | Principal Occupations: Mr. Germain is Chief Legal Officer of the Federated Fund Family. He is General Counsel and Vice President, Federated Investors, Inc.; President, Federated Administrative Services and Federated Administrative Services, Inc.; Vice President, Federated Securities Corp.; Secretary, Federated Private Asset Management, Inc.; and Secretary, Retirement Plan Service Company of America. Mr. Germain joined Federated in 1984 and is a member of the Pennsylvania Bar Association.
Previous Positions: Deputy General Counsel, Special Counsel, Managing Director of Mutual Fund Services, Federated Investors, Inc.; Senior Vice President, Federated Services Company; and Senior Corporate Counsel, Federated Investors, Inc. |
Stephen Van Meter
Birth Date: June 5, 1975
CHIEF COMPLIANCE OFFICER AND SENIOR VICE PRESIDENT
Officer since: July 2015 | Principal Occupations: Senior Vice President and Chief Compliance Officer of the Federated Fund Family; Vice President and Chief Compliance Officer of Federated Investors, Inc. and Chief Compliance Officer of certain of its subsidiaries. Mr. Van Meter joined Federated in October 2011. He holds FINRA licenses under Series 3, 7, 24 and 66.
Previous Positions: Mr. Van Meter previously held the position of Compliance Operating Officer, Federated Investors, Inc. Prior to joining Federated, Mr. Van Meter served at the United States Securities and Exchange Commission in the positions of Senior Counsel, Office of Chief Counsel, Division of Investment Management and Senior Counsel, Division of Enforcement. |
Annual Shareholder Report
Name
Birth Date
Address
Positions Held with Trust
Date Service Began | Principal Occupation(s) for Past Five Years
and Previous Position(s) |
Stephen F. Auth
Birth Date: September 3, 1956
101 Park Avenue
41st Floor
New York, NY 10178
CHIEF INVESTMENT OFFICER
Officer since: November 2002 | Principal Occupations: Stephen F. Auth is Chief Investment Officer of various Funds in the Federated Fund Family; Executive Vice President, Federated Investment Counseling, Federated Global Investment Management Corp. and Federated Equity Management Company of Pennsylvania.
Previous Positions: Executive Vice President, Federated Investment Management Company and Passport Research, Ltd. (investment advisory subsidiary of Federated); Senior Vice President, Global Portfolio Management Services Division; Senior Vice President, Federated Investment Management Company and Passport Research, Ltd.; Senior Managing Director and Portfolio Manager, Prudential Investments. |
Annual Shareholder Report
Evaluation and Approval of Advisory Contract–May 2015
Federated Absolute Return Fund (the “Fund”)
Following a review and recommendation of approval by the Fund's independent trustees, the Fund's Board reviewed and approved at its May 2015 meetings the Fund's investment advisory and subadvisory contracts for an additional one-year term. The Board's decision regarding these contracts reflects the exercise of its business judgment on whether to continue the existing arrangements.
In this connection, the Federated Funds' Board had previously appointed a Senior Officer, whose duties include specified responsibilities relating to the process by which advisory fees are to be charged to a Federated fund. The Senior Officer has the authority to retain consultants, experts, or staff as may be reasonably necessary to assist in the performance of his duties, reports directly to the Board, and may be terminated only with the approval of a majority of the independent members of the Board. The Senior Officer prepared and furnished to the Board an independent, written evaluation that covered topics discussed below (the “Evaluation”). The Board considered that Evaluation, along with other information, in deciding to approve the advisory and subadvisory contracts.
The Board is also familiar with and considered judicial decisions concerning allegedly excessive investment advisory fees, which have indicated that the following factors may be relevant to an Adviser's fiduciary duty with respect to its receipt of compensation from a fund: the nature and quality of the services provided by the Adviser to a fund and its shareholders, including the performance and expenses of the fund and of comparable funds; the Adviser's cost of providing the services, including the profitability to the Adviser of providing advisory services to a fund; the extent to which the Adviser may realize “economies of scale” as a fund grows larger and, if such economies of scale exist, whether they have been shared with a fund and its shareholders or the family of funds; any “fall-out financial benefits” that accrue to the Adviser because of its relationship with a fund (including research services received from brokers that execute fund trades and any fees paid to affiliates of the Adviser for services rendered to a fund); comparative fee structures, including a comparison of fees paid to the Adviser with those paid by similar funds; and the extent of care, conscientiousness and independence with which the Board members perform their duties and their expertise, including whether they are fully informed about all facts the Board deems relevant to its consideration of the Adviser's services and fees. The Board noted that SEC disclosure requirements regarding the basis for the Board's approval of the Fund's advisory contract generally track the factors listed above. Consistent with these judicial decisions and SEC disclosure requirements, the Board also considered management fees charged to institutional and other clients of the Adviser and subadviser for what
Annual Shareholder Report
might be viewed as like services. The Board was aware of these factors and was guided by them in its review of the Fund's advisory and subadvisory contracts to the extent it considered them to be appropriate and relevant, as discussed further below.
The Board considered and weighed these circumstances in light of its substantial accumulated experience in governing the Fund and working with Federated on matters relating to the Federated funds, and was assisted in its deliberations by independent legal counsel. Throughout the year, and in connection with its May meetings, the Board requested and received substantial and detailed information about the Fund and the Federated organization that was in addition to the extensive materials that comprise and accompany the Senior Officer's Evaluation. Federated provided much of this information at each regular meeting of the Board, and furnished additional substantial information in connection with the May meeting at which the Board's formal review of the advisory and subadvisory contracts occurred. At this May meeting, senior management of the Adviser also met with the independent trustees and their counsel to discuss the materials presented and any other matters thought relevant by the Adviser or the trustees. Between regularly scheduled meetings, the Board also received information on particular matters as the need arose. Thus, the Board's consideration of the advisory and subadvisory contracts included review of the Senior Officer's Evaluation, accompanying data and additional information covering such matters as: the Adviser's and subadviser's investment philosophy, revenue, profitability, personnel and processes; investment and operating strategies; the Fund's short- and long-term performance (in absolute terms, both on a gross basis and net of expenses, as well as in relationship to its particular investment program and certain competitor or “peer group” funds and/or other benchmarks, as appropriate), and comments on the reasons for performance; the Fund's investment objectives; the Fund's expenses (including the advisory fee itself and the overall expense structure of the Fund, both in absolute terms and relative to similar and/or competing funds, with due regard for contractual or voluntary expense limitations); the use and allocation of brokerage commissions derived from trading the Fund's portfolio securities (if any); and the nature, quality and extent of the advisory and other services provided to the Fund by the Adviser and its affiliates. The Board also considered the preferences and expectations of Fund shareholders; the entrepreneurial risk assumed by the Adviser in sponsoring the funds; the continuing state of competition in the mutual fund industry and market practices; the range of comparable fees for similar funds in the mutual fund industry; the Fund's relationship to the Federated family of funds which include a comprehensive array of funds with different investment objectives, policies and strategies which are available for exchange without the incurrence of additional sales charges; compliance and audit reports concerning the Federated funds and the Federated companies that service them (including communications from regulatory agencies), as well as Federated's responses to any issues raised therein;
Annual Shareholder Report
and relevant developments in the mutual fund industry and how the Federated funds and/or Federated are responding to them. The Board's evaluation process is evolutionary. The criteria considered and the emphasis placed on relevant criteria change in recognition of changing circumstances in the mutual fund marketplace.
While mindful that courts have cautioned against giving such comparisons too much weight, the Board has found the use of comparisons of the Fund's fees and expenses to other mutual funds with comparable investment programs to be relevant. In this regard, the Board was presented with, and considered, information regarding the contractual advisory fee rates, net advisory fee rates and total expense ratios relative to a fund's peers. The Board focused on comparisons with other similar mutual funds more heavily than non-mutual fund products or services because it is believed that they are more relevant. For example, other mutual funds are the products most like the Fund, they are readily available to Fund shareholders as alternative investment vehicles, and they are the type of investment vehicle in fact chosen and maintained by the Fund's investors. The range of their fees and expenses therefore appears to be a relevant indicator of what consumers have found to be reasonable in the precise marketplace in which the Fund competes.
The Board reviewed the contractual advisory fee rate, net advisory fee rate where partially waived and other expenses of the Fund and noted the position of the Fund's fee rates relative to its peers. In this regard, the Board noted that the contractual advisory fee rate was below the median of the relevant peer group and that it was satisfied that the overall expense structure of the Fund remained competitive.
By contrast, the Senior Officer has reviewed Federated's fees for providing advisory services to products outside the Federated family of funds (e.g., institutional and separate accounts and sub-adviser services). He concluded that mutual funds and institutional accounts are inherently different products. Those differences include, but are not limited to, different types of targeted investors; being subject to different laws and regulations; different legal structures; different average account sizes and portfolio management techniques made necessary by different cash flows and different associated costs; and the time spent by portfolio managers and their teams, funds financial services, legal, compliance and risk management in reviewing securities pricing, addressing different administrative responsibilities, addressing different degrees of risk associated with management and a variety of different costs. The Senior Officer did not consider these fee schedules to be determinative in judging the appropriateness of mutual fund advisory fees.
Annual Shareholder Report
The Fund's ability to deliver competitive performance when compared to its peer group was also deemed to be relevant by the Board as a useful indicator of how the Adviser is executing the Fund's investment program, which in turn was one of the Board's considerations in reaching a conclusion that the nature, extent, and quality of the Adviser's investment management services were such as to warrant continuation of the advisory and subadvisory contracts.
The Senior Officer reviewed information compiled by Federated, using data supplied by independent fund ranking organizations, regarding the performance of, and fees charged by, other mutual funds, noting his view that comparisons to fund peer groups may be helpful, though not conclusive, in judging the reasonableness of the proposed fees. The Board considered, in evaluating such comparisons, that in some cases individual funds may exhibit significant and unique differences in their objectives and management techniques when compared to other funds within an industry peer group.
For the periods covered by the Evaluation, the Fund's performance for the one-year period was above the median of the relevant peer group, and the Fund's performance fell below the median of the relevant peer group for three-year and five-year periods. The Board discussed the Fund's performance with the Adviser and recognized the efforts being undertaken by the Adviser. The Board will continue to monitor these efforts and the performance of the Fund in the context of the other factors considered relevant by the Board.
The Board also received financial information about Federated, including information regarding the compensation and benefits Federated derived from its relationships with the Federated funds. This information covered not only the fees under the advisory contracts, but also fees received by Federated's subsidiaries for providing other services to the Federated funds under separate contracts (e.g., for serving as the Federated funds' administrator). The information also detailed any indirect benefit Federated may derive from its receipt of research services from brokers who execute Federated fund trades. In addition, the Board considered the fact that, in order for a fund to be competitive in the marketplace, Federated and its affiliates frequently waived fees and/or reimbursed expenses and have disclosed to fund investors and/or indicated to the Board their intention to do so in the future, where appropriate. Moreover, the Board receives regular reporting as to the institution, adjustment or elimination of these voluntary waivers.
In addition, over the past two years, following discussions regarding the Senior Officer's recommendations, Federated made meaningful reductions to the contractual advisory fees for several Funds. At the Board meeting in May 2015, following previous recommendations of the Senior Officer, Federated proposed, and the Board approved, reductions in the contractual advisory fees of certain other Funds.
Annual Shareholder Report
Federated furnished information, requested by the Senior Officer, that reported revenues on a fund-by-fund basis and made estimates of the allocation of expenses on a fund-by-fund basis, using allocation methodologies specified by the Senior Officer. The Senior Officer noted that, while these cost allocation reports apply consistent allocation processes, the inherent difficulties in allocating costs continues to cause the Senior Officer to question the precision of the process and to conclude that such reports may be unreliable, since a single change in an allocation estimate may dramatically alter the resulting estimate of cost and/or profitability of a fund and may produce unintended consequences. The allocation information, including the Senior Officer's view that fund-by-fund estimations may be unreliable, was considered in the analysis by the Board.
The Board and the Senior Officer also reviewed information compiled by Federated comparing profitability information for Federated to other publicly held fund management companies. In this regard, the Senior Officer concluded that Federated's profit margins did not appear to be excessive. The Senior Officer also noted that Federated appeared financially sound, with the resources to fulfill its obligations under its contracts with the Funds.
The Senior Officer's Evaluation also discussed the notion of possible realization of “economies of scale” as a fund grows larger. The Board considered in this regard that the Adviser has made significant and long-term investments in areas that support all of the Federated family of funds, such as personnel and processes for the portfolio management, shareholder services, compliance, internal audit, and risk management functions; and systems technology; and that the benefits of these efforts (as well as any economies of scale, should they exist) were likely to be enjoyed by the fund family as a whole. Federated, as it does throughout the year, and again in connection with the Board's review, furnished information relative to revenue sharing or adviser paid fees. Federated and the Senior Officer noted that this information should be viewed to determine if there was an incentive to either not apply breakpoints or to apply breakpoints at higher levels and should not be viewed to determining the appropriateness of advisory fees, because it would represent marketing and distribution expenses. Finally, the Board also noted the absence of any applicable regulatory or industry guidelines on this subject, which (as discussed in the Senior Officer's Evaluation) is compounded by the lack of any common industry practice or general pattern with respect to structuring fund advisory fees with “breakpoints” that serve to reduce the fee as the fund attains a certain size.
The Senior Officer noted that, subject to the comments and recommendations made within his Evaluation, his observations and the information accompanying the Evaluation supported a finding by the Board that the management fees for each of the funds were reasonable. Under these circumstances, no changes were recommended to, and no objection was raised to, the continuation of the Fund's advisory and subadvisory contracts.
Annual Shareholder Report
In its decision to continue an existing investment advisory contract, the Board was mindful of the potential disruptions of the Fund's operations and various risks, uncertainties and other effects that could occur as a result of a decision to terminate or not renew an advisory contract. In particular, the Board recognized that many shareholders have invested in the Fund on the strength of the Adviser's industry standing and reputation and with the expectation that the Adviser will have a continuing role in providing advisory services to the Fund. Thus, the Board's approval of the advisory contract reflected the fact that it is the shareholders who have effectively selected the Adviser by virtue of having invested in the Fund. The Board concluded that, in light of the factors discussed above, including the nature, quality and scope of the services provided to the Fund by the Adviser and its affiliates, continuation of the advisory contract was appropriate.
The Board based its decision to approve the advisory and subadvisory contracts on the totality of the circumstances and relevant factors and with a view to past and future long-term considerations. Not all of the factors and considerations identified above were necessarily relevant to the Fund, nor did the Board consider any one of them to be determinative. With respect to the factors that were relevant, the Board's decision to approve the contract reflects its determination that Federated's performance and actions provided a satisfactory basis to support the decision to continue the existing arrangements.
Annual Shareholder Report
Voting Proxies on Fund Portfolio Securities
A description of the policies and procedures that the Fund uses to determine how to vote proxies, if any, relating to securities held in the Fund's portfolio is available, without charge and upon request, by calling 1-800-341-7400. A report on “Form N-PX” of how the Fund voted any such proxies during the most recent 12-month period ended June 30 is available via the Proxy Voting Record (Form N-PX) link associated with the Fund and share class name at www.FederatedInvestors.com/FundInformation. Form N-PX filings are also available at the SEC's website at www.sec.gov.
Quarterly Portfolio Schedule
The Fund files with the SEC a complete schedule of its portfolio holdings, as of the close of the first and third quarters of its fiscal year, on “Form N-Q.” These filings are available on the SEC's website at www.sec.gov and may be reviewed and copied at the SEC's Public Reference Room in Washington, DC. (Call 1-800-SEC-0330 for information on the operation of the Public Reference Room.) You may also access this information via the link to the Fund and share class name at www.FederatedInvestors.com/FundInformation.
Annual Shareholder Report
Mutual funds are not bank deposits or obligations, are not guaranteed by any bank and are not insured or guaranteed by the U.S. government, the Federal Deposit Insurance Corporation, the Federal Reserve Board or any other government agency. Investment in mutual funds involves investment risk, including the possible loss of principal.
This Report is authorized for distribution to prospective investors only when preceded or accompanied by the Fund's Prospectus, which contains facts concerning its objective and policies, management fees, expenses and other information.
Federated Absolute Return Fund
Federated Investors Funds
4000 Ericsson Drive
Warrendale, PA 15086-7561
Contact us at FederatedInvestors.com
or call 1-800-341-7400.
Federated Securities Corp., Distributor
CUSIP 314172743
CUSIP 314172735
CUSIP 314172727
CUSIP 314172453
26852 (12/15)
Federated is a registered trademark of Federated Investors, Inc.
2015 ©Federated Investors, Inc.
Annual Shareholder Report
October 31, 2015
| Share Class | Ticker |
| A | SVAAX |
| C | SVACX |
| Institutional | SVAIX |
Federated Strategic Value Dividend Fund
Fund Established 2005
A Portfolio of Federated Equity Funds
Dear Valued Shareholder,
I am pleased to present the Annual Shareholder Report for your fund covering the period from November 1, 2014 through October 31, 2015. This report includes Management's Discussion of Fund Performance, a complete listing of your fund's holdings, performance information and financial statements along with other important fund information.
In addition, our website, FederatedInvestors.com, offers easy access to Federated resources that include timely fund updates, economic and market insights from our investment strategists, and financial planning tools. We invite you to register to take full advantage of its capabilities.
Thank you for investing with Federated. I hope you find this information useful and look forward to keeping you informed.
Sincerely,
J. Christopher Donahue, President
Not FDIC Insured • May Lose Value • No Bank Guarantee
CONTENTS
| 1 |
| 6 |
| 7 |
| 10 |
| 13 |
| 15 |
| 16 |
| 17 |
| 28 |
| 29 |
| 31 |
| 37 |
| 43 |
| 43 |
Management's Discussion of Fund Performance (unaudited)
The total return of Federated Strategic Value Dividend Fund (the “Fund”), based on net asset value for the 12-month reporting period ended October 31, 2015, was 4.45% for the Class A Shares, 3.68% for the Class C Shares and 4.87% for the Institutional Shares. The total return of the Dow Jones Select Dividend Index (DJSDI),1 a broad-based securities market index that represents the domestic dividend-paying universe, was 2.03% for the reporting period, while the total return of the Standard and Poor's 500 Index (S&P 500),2 reflecting the performance of the broad market, was 5.20% for the same period. The Fund's total return for the most recently completed fiscal year reflects actual cash flows, transaction costs and other expenses which are not reflected in the total return of the DJSDI or the S&P 500.
The following discussion will focus on the performance of the Fund's Institutional Shares.
MARKET OVERVIEW
The 12-month reporting period began with the U.S. equity market grinding to new highs on an improving U.S. economy in November. Come December, plunging oil prices rattled the global and domestic markets, causing a brief but significant sell-off in equities before the calm returned and the rally resumed.
In the first half of 2015, equities oscillated up and down driven first by signs of improving stimulus-fed economies in Europe and Japan, but ultimately dampened by weather-related softness in the U.S. Among the forces weighing on U.S. markets were ongoing concerns about lower oil prices dampening business investment which hammered the Energy sector. A stronger dollar also threatened to cut into to the results of U.S.-based multinationals, which account for roughly half of the S&P 500's profits. As uncertainty regarding the Federal Reserve's (the Fed) future target interest rate plan weighed further on the market, volatility in the market increased during the second quarter and equities continued to fall. This pull-back in equities continued into the third quarter as investors' fears over China, lower oil prices and a potential global slowdown outweighed generally better economic data at home.
The 12-month reporting period ended with the major indexes shrugging off China worries, softening economic data, and so-so quarterly earnings that once again were beating extremely marked-down estimates. Expectations that the worst may be over on the earnings front—combined with typical end-of-the-year seasonal forces, additional commitments for even more stimulus from European and Japanese monetary authorities and yet another delay in a Fed liftoff—helped feed a final surge.
Annual Shareholder Report
Dividend Based Performance3
Regardless of the recent volatility in the markets, the Fund remained focused on its core goals of providing investors with dividend income, dividend growth and lower downside risk, finishing the reporting period with a 30-day SEC yield of 3.6% and a weighted average dividend yield of 4.3%.4 The Fund surpassed the yields of the DJSDI (3.8%), the S&P 500 (2.1%) and the 10-Year U.S. Treasury Note (2.2%). Complementing its high yield, the Fund's portfolio realized 34 dividend increases for the reporting period. Notable dividend increases include Ventas (9.0%), Altria (8.7%), Coca-Cola (8.2%), Dominion Resources (7.9%) and Reynolds American (7.5%). GlaxoSmithKline PLC also declared a special dividend valued at 0.20 British Pounds per share that will be payable in 2016. The Fund's portfolio experienced no dividend cuts during the reporting period. Of the 35 stocks in the portfolio, 60% have increased dividends each year for the past 10 years, 46% have increased dividends each year for the past 20 years, 34% have increased each year for the past 30 years, and 9% have commendably increased dividends each year for the past 50 years.
From a sector perspective, the Fund's holdings within Consumer Staples were the largest positive contributor to performance, as it posted a return of 24.8%. Consumer Staples' outperformance was driven by Kraft Heinz which returned 73.4% over the reporting period. Kraft posted a 1-day return of 35.6% on March 25 following the announcement of their merger agreement with Heinz. Reynolds American and Altria also helped performance, posting returns of 59.5% and 30.4% respectively. Reynolds American shares were propelled by their merger agreement with Lorillard which was completed on June 12, 2015. In addition, Reynolds recently announced plans to sell its international rights to the Natural American Spirit franchise to Japan Tobacco, valued at approximately $5.0 billion, which was 34 times 2014 sales. Strong revenue growth and strong pricing (cigarette pricing increased 5.9% year-over-year) also added to tobacco's positive returns, benefitting Reynolds and Altria alike. Consumer Discretionary added further to Fund performance, as the sector's only holding, McDonalds returned 24% for the reporting period, bolstered recently by strong third quarter earnings results.
By contrast, weakness was noted in the Fund's holdings in the Energy sector as it was the largest negative contributor, returning -16.6% as oil prices were cut more than in half driven by oversupply concerns and weakness in China. Six of the worst performers within the portfolio were Kinder Morgan (-25.4%), Total (-25.0%), Royal Dutch Shell (-24.2%), Chevron (-21.0%), and ConocoPhillips (-12.2%), all of which were within the Energy sector. In response to low oil prices, the Fund's holdings within Energy have cut capital expenditures to improve liquidity and save cash, while maximizing profits in their downstream operations. They have also committed to rebalancing their financial framework
Annual Shareholder Report
to manage through a period of low oil prices while maintaining dividends as a top priority within that framework. The Fund's holdings in Energy were supportive of an income-oriented investment strategy, as evidenced by their weighted average dividend yield of 5.8%
Due to the Fund's focus on high dividend income and growth in that income over time, the Fund's strategy tends to perform best when the markets prefer high-yield, high-quality, low-beta,5 large-cap stocks. Often times, the strategy may also outperform in flat markets or periods of modest market distress. Conversely, the strategy may lag the broad market when investors prefer low-yield, low-quality, high-risk, small-cap stocks. Over the reporting period, the strategy faced a significant headwind with the lowest yielding stocks outperforming high-yielding investments. When quintiling the S&P 500, low yield outperformed high yield by 13.9% over the reporting period; however, the Fund still captured 94% of the performance of the broad market.
| 1 | Please see the footnotes to the line graphs below for definitions of, and further information about, the DJSDI. |
| 2 | Please see the footnotes to the line graphs below for definitions of, and further information about, the S&P 500. |
| 3 | There are no guarantees that dividend paying stocks will continue to pay dividends. In addition, dividend paying stocks may not experience the same capital appreciation potential as non-dividend paying stocks. |
| 4 | In the absence of temporary expense waivers and reimbursements, the 30-day SEC yield would have been 3.45%. The dividend yield represents the average yield of the underlying securities within the Fund. The average yield is a weighted average calculated by assigning a weight to each of the underlying securities in the Fund based upon the portion of total assets of the Fund each underlying security represents. |
| 5 | Beta measures a Fund's volatility relative to the market. A Beta greater than 1.00 suggests the Fund has historically been more volatile than the market as measured by the fund's benchmark. A Beta less than 1.00 suggests the Fund has historically had less volatility relative to the market. |
Annual Shareholder Report
FUND PERFORMANCE AND GROWTH OF A $10,000 INVESTMENT
The graph below illustrates the hypothetical investment of $10,0001 in the Federated Strategic Value Dividend Fund from October 31, 2005 to October 31, 2015, compared to the Standard & Poor's 500 Index (S& P 500)2 and the Dow Jones Select Dividend Index (DJSDI).2 The Average Annual Total Return table below shows returns for each class averaged over the stated periods.
Growth of a $10,000 InvestmenT
Growth of $10,000 as of October 31, 2015
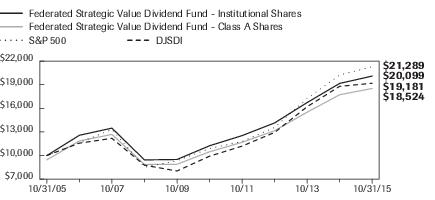
| Federated Strategic Value Dividend Fund - | Institutional Shares | Class A Shares | S&P 500 | DJSDI |
| F | F | I | I |
| 10/31/2005 | 10,000 | 9,450 | 10,000 | 10,000 |
| 10/31/2006 | 12,578 | 11,862 | 11,634 | 11,580 |
| 10/31/2007 | 13,483 | 12,687 | 13,328 | 12,185 |
| 10/31/2008 | 9,448 | 8,864 | 8,517 | 8,773 |
| 10/31/2009 | 9,501 | 8,892 | 9,352 | 8,041 |
| 10/31/2010 | 11,243 | 10,478 | 10,897 | 9,916 |
| 10/31/2011 | 12,534 | 11,683 | 11,778 | 11,199 |
| 10/31/2012 | 14,147 | 13,159 | 13,569 | 12,939 |
| 10/31/2013 | 16,736 | 15,509 | 17,256 | 16,208 |
| 10/31/2014 | 19,167 | 17,727 | 20,236 | 18,799 |
| 10/31/2015 | 20,099 | 18,524 | 21,289 | 19,181 |
41 graphic description end -->
| ■ | Total returns shown for Class A Shares include the maximum sales charge of 5.50% ($10,000 investment minus $550 sales charge = $9,450). |
The Fund offers multiple share classes whose performance may be greater than or less than its other share class(es) due to differences in sales charges and expenses. See the Average Annual Return table below for the returns of additional classes not shown in the line graph above.
Average Annual Total Returns for the Period Ended 10/31/2015
(returns reflect all applicable sales charges and contingent sales charges as specified below in footnote #1)
| | 1 Year | 5 Years | 10 Years |
| Class A Shares | -1.23% | 10.82% | 6.36% |
| Class C Shares | 2.71% | 11.22% | 6.16% |
| Institutional Shares | 4.87% | 12.32% | 7.23% |
| S&P 500 | 5.20% | 14.33% | 7.85% |
| DJSDI | 2.03% | 14.11% | 6.73% |
Annual Shareholder Report
Performance data quoted represents past performance which is no guarantee of future results. Investment return and principal value will fluctuate so that an investor's shares, when redeemed, may be worth more or less than their original cost. Mutual fund performance changes over time and current performance may be lower or higher than what is stated. For current to the most recent month-end performance and after-tax returns, visit FederatedInvestors.com or call 1-800-341-7400. Returns shown do not reflect the deduction of taxes that a shareholder would pay on Fund distributions or the redemption of Fund shares. Mutual funds are not obligations of or guaranteed by any bank and are not federally insured.
| 1 | Represents a hypothetical investment of $10,000 in the Fund after deducting applicable sales charges: For Class A Shares, the maximum sales charge of 5.50% ($10,000 investment minus $550 sales charge = $9,450); for Class C Shares, a 1.00% contingent deferred sales charge would be applied on any redemption less than one year from the purchase date. The Fund's performance assumes the reinvestment of all dividends and distributions. The S&P 500 and DJSDI have been adjusted to reflect reinvestment of dividends on securities in the indexes. |
| 2 | The S&P 500 is a capitalization-weighted index of 500 stocks designed to measure performance of the broad domestic economy through changes in the aggregate market value of 500 stocks representing all major industries. The DJSDI is a dividend-weighted index intended to represent the 100 stocks in the Dow Jones U.S. Total Market Index that have the highest indicated annual dividend yield. The S&P 500 and the DJSDI are not adjusted to reflect sales loads, expenses or other fees that the Securities and Exchange Commission requires to be reflected in the Fund's performance. The indexes are unmanaged and, unlike the Fund, are not affected by cash flows. It is not possible to invest in an index. |
Annual Shareholder Report
Portfolio of Investments Summary Table (unaudited)
At October 31, 2015, the Fund's sector composition1 was as follows:
| Sector Composition | Percentage of
Total Net Assets |
| Consumer Staples | 35.4% |
| Utilities | 16.9% |
| Telecommunication Services | 13.6% |
| Energy | 12.9% |
| Health Care | 9.6% |
| Financials | 5.3% |
| Consumer Discretionary | 4.9% |
| Cash Equivalents2 | 1.1% |
| Other Assets and Liabilities—Net3 | 0.3% |
| TOTAL | 100.0% |
| 1 | Except for Cash Equivalents and Other Assets and Liabilities, sector classifications are based upon, and individual portfolio securities are assigned to, the classifications of the Global Industry Classification Standard (GICS) except that the Adviser assigns a classification to securities not classified by the GICS and to securities for which the Adviser does not have access to the classification made by the GICS. |
| 2 | Cash Equivalents include any investments in money market mutual funds and/or overnight repurchase agreements. |
| 3 | Assets, other than investments in securities, less liabilities. See Statement of Assets and Liabilities. |
Annual Shareholder Report
Portfolio of Investments
October 31, 2015
| Shares | | | Value |
| | | COMMON STOCKS—98.6% | |
| | | Consumer Discretionary—4.9% | |
| 4,309,555 | | McDonald's Corp. | $483,747,549 |
| | | Consumer Staples—35.4% | |
| 9,118,841 | | Altria Group, Inc. | 551,416,315 |
| 3,440,385 | | General Mills, Inc. | 199,920,772 |
| 1,758,425 | | Kellogg Co. | 124,004,131 |
| 2,152,600 | | Kimberly-Clark Corp. | 257,687,746 |
| 6,044,440 | | Kraft Heinz Co./The | 471,284,987 |
| 955,700 | | PepsiCo, Inc. | 97,662,983 |
| 5,318,478 | | Philip Morris International, Inc. | 470,153,455 |
| 5,452,105 | | Procter & Gamble Co. | 416,431,780 |
| 10,172,454 | | Reynolds American, Inc. | 491,532,977 |
| 3,337,050 | | The Coca-Cola Co. | 141,324,068 |
| 6,548,567 | | Unilever PLC | 290,818,604 |
| | | TOTAL | 3,512,237,818 |
| | | Energy—12.9% | |
| 49,319,000 | | BP PLC | 292,743,087 |
| 3,305,749 | | Chevron Corp. | 300,426,469 |
| 3,200,000 | | Exxon Mobil Corp. | 264,768,000 |
| 5,427,170 | | Kinder Morgan, Inc. | 148,433,100 |
| 10,304,824 | | Royal Dutch Shell PLC, Class B | 269,162,507 |
| | | TOTAL | 1,275,533,163 |
| | | Financials—5.3% | |
| 2,055,000 | | Digital Realty Trust, Inc. | 151,987,800 |
| 4,535,276 | | HCP, Inc. | 168,712,267 |
| 1,960,500 | | National Retail Properties, Inc. | 74,499,000 |
| 2,433,725 | | Ventas, Inc. | 130,739,707 |
| | | TOTAL | 525,938,774 |
| | | Health Care—9.6% | |
| 19,986,773 | | GlaxoSmithKline PLC | 430,469,995 |
| 875,985 | | Johnson & Johnson | 88,500,764 |
| 5,666,010 | | Merck & Co., Inc. | 309,704,107 |
| 1,254,812 | | Sanofi | 126,509,974 |
| | | TOTAL | 955,184,840 |
| | | Telecommunication Services—13.6% | |
| 12,710,180 | | AT&T, Inc. | 425,918,132 |
Annual Shareholder Report
| Shares | | | Value |
| | | COMMON STOCKS—continued | |
| | | Telecommunication Services—continued | |
| 4,242,910 | | BCE, Inc. | $183,396,508 |
| 9,348,241 | | Verizon Communications, Inc. | 438,245,538 |
| 92,199,989 | | Vodafone Group PLC | 303,948,957 |
| | | TOTAL | 1,351,509,135 |
| | | Utilities—16.9% | |
| 2,088,015 | | American Electric Power Co., Inc. | 118,286,050 |
| 1,732,295 | | Dominion Resources, Inc. | 123,737,832 |
| 4,693,859 | | Duke Energy Corp. | 335,470,102 |
| 32,912,919 | | National Grid PLC | 468,442,080 |
| 8,036,905 | | PPL Corp. | 276,469,532 |
| 7,708,068 | | Southern Co. | 347,633,867 |
| | | TOTAL | 1,670,039,463 |
| | | TOTAL COMMON STOCKS
(IDENTIFIED COST $8,382,173,736) | 9,774,190,742 |
| | | INVESTMENT COMPANY—1.1% | |
| 106,538,329 | 1 | Federated Prime Value Obligations Fund, Institutional Shares, 0.16%2
(AT NET ASSET VALUE) | 106,538,329 |
| | | TOTAL INVESTMENTS—99.7%
(IDENTIFIED COST $8,488,712,065)3 | 9,880,729,071 |
| | | OTHER ASSETS AND LIABILITIES - NET—0.3%4 | 31,817,343 |
| | | TOTAL NET ASSETS—100% | $9,912,546,414 |
| 1 | Affiliated holding. |
| 2 | 7-day net yield. |
| 3 | Also represents cost for federal tax purposes. |
| 4 | Assets, other than investments in securities, less liabilities. See Statement of Assets and Liabilities. |
Note: The categories of investments are shown as a percentage of total net assets at October 31, 2015.
Various inputs are used in determining the value of the Fund's investments. These inputs are summarized in the three broad levels listed below:
Level 1—quoted prices in active markets for identical securities.
Level 2—other significant observable inputs (including quoted prices for similar securities, interest rates, prepayment speeds, credit risk, etc.). Also includes securities valued at amortized cost.
Level 3—significant unobservable inputs (including the Fund's own assumptions in determining the fair value of investments).
The inputs or methodology used for valuing securities are not an indication of the risk associated with investing in those securities.
Annual Shareholder Report
The following is a summary of the inputs used, as of October 31, 2015, in valuing the Fund's assets carried at fair value:
| Valuation Inputs | | | | |
| | Level 1—
Quoted
Prices | Level 2—
Other
Significant
Observable
Inputs | Level 3—
Significant
Unobservable
Inputs | Total |
| Equity Securities: | | | | |
| Common Stocks | | | | |
| Domestic | $7,408,699,030 | $— | $— | $7,408,699,030 |
| International | 183,396,508 | 2,182,095,204 | — | 2,365,491,712 |
| Investment Companies | 106,538,329 | — | — | 106,538,329 |
| TOTAL SECURITIES | $7,698,633,867 | $2,182,095,204 | $— | $9,880,729,071 |
See Notes which are an integral part of the Financial Statements
Annual Shareholder Report
Financial Highlights–Class A Shares
(For a Share Outstanding Throughout Each Period)
| Year Ended October 31 | 2015 | 2014 | 2013 | 2012 | 2011 |
| Net Asset Value, Beginning of Period | $6.25 | $5.78 | $5.08 | $4.69 | $4.36 |
| Income From Investment Operations: | | | | | |
| Net investment income | 0.18 | 0.30 | 0.18 | 0.19 | 0.171 |
| Net realized and unrealized gain on investments and foreign currency transactions | 0.08 | 0.50 | 0.70 | 0.39 | 0.32 |
| TOTAL FROM INVESTMENT OPERATIONS | 0.26 | 0.80 | 0.88 | 0.58 | 0.49 |
| Less Distributions: | | | | | |
| Distributions from net investment income | (0.18) | (0.30) | (0.18) | (0.19) | (0.16) |
| Distributions from net realized gain on investments and foreign currency transactions | (0.27) | (0.03) | (0.00)2 | — | — |
| TOTAL DISTRIBUTIONS | (0.45) | (0.33) | (0.18) | (0.19) | (0.16) |
| Net Asset Value, End of Period | $6.06 | $6.25 | $5.78 | $5.08 | $4.69 |
| Total Return3 | 4.45% | 14.30% | 17.85% | 12.63% | 11.50% |
| Ratios to Average Net Assets: | | | | | |
| Net expenses | 1.05% | 1.05% | 1.05% | 1.05%4 | 1.05%4 |
| Net investment income | 3.07% | 5.06% | 3.46% | 3.83% | 3.67% |
| Expense waiver/reimbursement5 | 0.13% | 0.13% | 0.14% | 0.14% | 0.14% |
| Supplemental Data: | | | | | |
| Net assets, end of period (000 omitted) | $2,358,470 | $2,277,514 | $1,944,577 | $1,531,723 | $992,799 |
| Portfolio turnover | 16% | 17% | 25% | 20% | 17% |
| 1 | Per share number has been calculated using the average shares method. |
| 2 | Represents less than $0.01. |
| 3 | Based on net asset value, which does not reflect the sales charge, redemption fee or contingent deferred sales charge, if applicable. |
| 4 | The net expense ratio is calculated without reduction for expense offset arrangements. The net expense ratios are 1.05% and 1.05% for the years October 31, 2012 and 2011, respectively, after taking into account these expense reductions. |
| 5 | This expense decrease is reflected in both the net expense and the net investment income ratios shown above. |
See Notes which are an integral part of the Financial Statements
Annual Shareholder Report
Financial Highlights–Class C Shares
(For a Share Outstanding Throughout Each Period)
| Year Ended October 31 | 2015 | 2014 | 2013 | 2012 | 2011 |
| Net Asset Value, Beginning of Period | $6.26 | $5.79 | $5.08 | $4.70 | $4.37 |
| Income From Investment Operations: | | | | | |
| Net investment income | 0.14 | 0.26 | 0.15 | 0.15 | 0.131 |
| Net realized and unrealized gain on investments and foreign currency transactions | 0.08 | 0.50 | 0.71 | 0.38 | 0.33 |
| TOTAL FROM INVESTMENT OPERATIONS | 0.22 | 0.76 | 0.86 | 0.53 | 0.46 |
| Less Distributions: | | | | | |
| Distributions from net investment income | (0.14) | (0.26) | (0.15) | (0.15) | (0.13) |
| Distributions from net realized gain on investments and foreign currency transactions | (0.27) | (0.03) | (0.00)2 | — | — |
| TOTAL DISTRIBUTIONS | (0.41) | (0.29) | (0.15) | (0.15) | (0.13) |
| Net Asset Value, End of Period | $6.07 | $6.26 | $5.79 | $5.08 | $4.70 |
| Total Return3 | 3.68% | 13.44% | 17.18% | 11.56% | 10.67% |
| Ratios to Average Net Assets: | | | | | |
| Net expenses | 1.80% | 1.80% | 1.80% | 1.80%4 | 1.80%4 |
| Net investment income | 2.31% | 4.27% | 2.69% | 3.05% | 2.95% |
| Expense waiver/reimbursement5 | 0.13% | 0.13% | 0.14% | 0.14% | 0.14% |
| Supplemental Data: | | | | | |
| Net assets, end of period (000 omitted) | $1,592,942 | $1,361,583 | $1,021,307 | $667,700 | $328,987 |
| Portfolio turnover | 16% | 17% | 25% | 20% | 17% |
| 1 | Per share number has been calculated using the average shares method. |
| 2 | Represents less than $0.01. |
| 3 | Based on net asset value, which does not reflect the sales charge, redemption fee or contingent deferred sales charge, if applicable. |
| 4 | The net expense ratio is calculated without reduction for expense offset arrangements. The net expense ratios are 1.80% and 1.80% for the years ended October 31, 2012 and 2011, respectively, after taking into account these expense reductions. |
| 5 | This expense decrease is reflected in both the net expense and the net investment income ratios shown above. |
See Notes which are an integral part of the Financial Statements
Annual Shareholder Report
Financial Highlights–Institutional Shares
(For a Share Outstanding Throughout Each Period)
| Year Ended October 31 | 2015 | 2014 | 2013 | 2012 | 2011 |
| Net Asset Value, Beginning of Period | $6.27 | $5.80 | $5.09 | $4.70 | $4.38 |
| Income From Investment Operations: | | | | | |
| Net investment income | 0.20 | 0.32 | 0.20 | 0.20 | 0.181 |
| Net realized and unrealized gain on investments and foreign currency transactions | 0.09 | 0.50 | 0.71 | 0.39 | 0.31 |
| TOTAL FROM INVESTMENT OPERATIONS | 0.29 | 0.82 | 0.91 | 0.59 | 0.49 |
| Less Distributions: | | | | | |
| Distributions from net investment income | (0.20) | (0.32) | (0.20) | (0.20) | (0.17) |
| Distributions from net realized gain on investments and foreign currency transactions | (0.27) | (0.03) | (0.00)2 | — | — |
| TOTAL DISTRIBUTIONS | (0.47) | (0.35) | (0.20) | (0.20) | (0.17) |
| Net Asset Value, End of Period | $6.09 | $6.27 | $5.80 | $5.09 | $4.70 |
| Total Return3 | 4.87% | 14.53% | 18.30% | 12.87% | 11.48% |
| Ratios to Average Net Assets: | | | | | |
| Net expenses | 0.80% | 0.80% | 0.80% | 0.80%4 | 0.80%4 |
| Net investment income | 3.31% | 5.29% | 3.73% | 4.11% | 3.89% |
| Expense waiver/reimbursement5 | 0.13% | 0.13% | 0.14% | 0.14% | 0.14% |
| Supplemental Data: | | | | | |
| Net assets, end of period (000 omitted) | $5,961,135 | $5,750,788 | $4,902,127 | $4,662,436 | $3,263,920 |
| Portfolio turnover | 16% | 17% | 25% | 20% | 17% |
| 1 | Per share number has been calculated using the average shares method. |
| 2 | Represents less than $0.01. |
| 3 | Based on net asset value. |
| 4 | The net expense ratio is calculated without reduction for expense offset arrangements. The net expense ratios are 0.80% and 0.80% for the years ended October 31, 2012 and 2011, respectively, after taking into account these expense reductions. |
| 5 | This expense decrease is reflected in both the net expense and the net investment income ratios shown above. |
See Notes which are an integral part of the Financial Statements
Annual Shareholder Report
Statement of Assets and Liabilities
October 31, 2015
| Assets: | | |
| Total investment in securities, at value including $106,538,329 of investment in an affiliated holding (Note 5) (identified cost $8,488,712,065) | | $9,880,729,071 |
| Income receivable | | 22,139,608 |
| Receivable for investments sold | | 161,694 |
| Receivable for shares sold | | 25,194,770 |
| TOTAL ASSETS | | 9,928,225,143 |
| Liabilities: | | |
| Payable for shares redeemed | $11,113,978 | |
| Income distribution payable | 875 | |
| Payable to adviser (Note 5) | 342,268 | |
| Payable for transfer agent fee | 1,064,242 | |
| Payable for distribution services fee (Note 5) | 986,999 | |
| Payable for other service fees (Notes 2 and 5) | 1,763,149 | |
| Accrued expenses (Note 5) | 407,218 | |
| TOTAL LIABILITIES | | 15,678,729 |
| Net assets for 1,630,870,522 shares outstanding | | $9,912,546,414 |
| Net Assets Consist of: | | |
| Paid-in capital | | $8,033,338,731 |
| Net unrealized appreciation of investments and translation of assets and liabilities in foreign currency | | 1,392,034,758 |
| Accumulated net realized gain on investments and foreign currency transactions | | 470,483,143 |
| Undistributed net investment income | | 16,689,782 |
| TOTAL NET ASSETS | | $9,912,546,414 |
Annual Shareholder Report
Statement of Assets and Liabilities–continued
| Net Asset Value, Offering Price and Redemption Proceeds Per Share | | |
| Class A Shares: | | |
| Net asset value per share ($2,358,469,724 ÷ 389,074,041 shares outstanding), no par value, unlimited shares authorized | | $6.06 |
| Offering price per share (100/94.50 of $6.06) | | $6.41 |
| Redemption proceeds per share | | $6.06 |
| Class C Shares: | | |
| Net asset value per share ($1,592,941,685 ÷ 262,408,292 shares outstanding), no par value, unlimited shares authorized | | $6.07 |
| Offering price per share | | $6.07 |
| Redemption proceeds per share (99.00/100 of $6.07) | | $6.01 |
| Institutional Shares: | | |
| Net asset value per share ($5,961,135,005 ÷ 979,388,189 shares outstanding), no par value, unlimited shares authorized | | $6.09 |
| Offering price per share | | $6.09 |
| Redemption proceeds per share | | $6.09 |
See Notes which are an integral part of the Financial Statements
Annual Shareholder Report
Statement of Operations
Year Ended October 31, 2015
| Investment Income: | | | |
| Dividends (including $111,478 received from an affiliated holding (Note 5) and net of foreign taxes withheld of $3,352,590) | | | $397,667,796 |
| Interest | | | 111,470 |
| TOTAL INCOME | | | 397,779,266 |
| Expenses: | | | |
| Investment adviser fee (Note 5) | | $72,369,701 | |
| Administrative fee (Note 5) | | 7,551,399 | |
| Custodian fees | | 1,034,319 | |
| Transfer agent fee | | 8,361,251 | |
| Directors'/Trustees' fees (Note 5) | | 63,912 | |
| Auditing fees | | 22,400 | |
| Legal fees | | 8,912 | |
| Portfolio accounting fees | | 192,218 | |
| Distribution services fee (Note 5) | | 11,151,743 | |
| Other service fees (Notes 2 and 5) | | 9,511,275 | |
| Share registration costs | | 221,930 | |
| Printing and postage | | 272,882 | |
| Miscellaneous (Note 5) | | 58,160 | |
| TOTAL EXPENSES | | 110,820,102 | |
| Waivers and Reimbursement (Note 5): | | | |
| Waiver/reimbursement of investment adviser fee | $(12,489,923) | | |
| Waiver of other operating expenses | (6,500) | | |
| TOTAL WAIVERS AND REIMBURSEMENT | | (12,496,423) | |
| Net expenses | | | 98,323,679 |
| Net investment income | | | 299,455,587 |
| Realized and Unrealized Gain (Loss) on Investments and Foreign Currency Transactions: | | | |
| Net realized gain on investments and foreign currency transactions | | | 469,225,429 |
| Net change in unrealized appreciation of investments and translation of assets and liabilities in foreign currency | | | (337,671,645) |
| Net realized and unrealized gain on investments and foreign currency transactions | | | 131,553,784 |
| Change in net assets resulting from operations | | | $431,009,371 |
See Notes which are an integral part of the Financial Statements
Annual Shareholder Report
Statement of Changes in Net Assets
| Year Ended October 31 | 2015 | 2014 |
| Increase (Decrease) in Net Assets | | |
| Operations: | | |
| Net investment income | $299,455,587 | $424,890,466 |
| Net realized gain on investments and foreign currency transactions | 469,225,429 | 413,671,383 |
| Net change in unrealized appreciation/depreciation of investments and translation of assets and liabilities in foreign currency | (337,671,645) | 257,027,838 |
| CHANGE IN NET ASSETS RESULTING FROM OPERATIONS | 431,009,371 | 1,095,589,687 |
| Distributions to Shareholders: | | |
| Distributions from net investment income | | |
| Class A Shares | (70,612,785) | (104,323,855) |
| Class C Shares | (34,033,049) | (48,843,088) |
| Institutional Shares | (191,881,175) | (261,762,626) |
| Distributions from net realized gain on investments and foreign currency transactions | | |
| Class A Shares | (100,376,006) | (10,105,558) |
| Class C Shares | (60,443,413) | (5,361,225) |
| Institutional Shares | (253,178,559) | (24,924,001) |
| CHANGE IN NET ASSETS RESULTING FROM DISTRIBUTIONS TO SHAREHOLDERS | (710,524,987) | (455,320,353) |
| Share Transactions: | | |
| Proceeds from sale of shares | 2,739,143,854 | 2,844,348,998 |
| Net asset value of shares issued to shareholders in payment of distributions declared | 550,611,984 | 337,525,246 |
| Cost of shares redeemed | (2,487,578,860) | (2,300,269,181) |
| CHANGE IN NET ASSETS RESULTING FROM SHARE TRANSACTIONS | 802,176,978 | 881,605,063 |
| Change in net assets | 522,661,362 | 1,521,874,397 |
| Net Assets: | | |
| Beginning of period | 9,389,885,052 | 7,868,010,655 |
| End of period (including undistributed net investment income of $16,689,782 and $15,018,936, respectively) | $9,912,546,414 | $9,389,885,052 |
See Notes which are an integral part of the Financial Statements
Annual Shareholder Report
Notes to Financial Statements
October 31, 2015
1. ORGANIZATION
Federated Equity Funds (the “Trust”) is registered under the Investment Company Act of 1940, as amended (the “Act”), as an open-end management investment company. The Trust consists of 14 diversified portfolios. The financial statements included herein are only those of Federated Strategic Value Dividend Fund (the “Fund”), a diversified portfolio. The financial statements of the other portfolios are presented separately. The assets of each portfolio are segregated and a shareholder's interest is limited to the portfolio in which shares are held. Each portfolio pays its own expenses. The Fund offers three classes of shares: Class A Shares, Class C Shares and Institutional Shares. All shares of the Fund have equal rights with respect to voting, except on class-specific matters. The investment objective of the Fund is to provide income and long-term capital appreciation.
2. SIGNIFICANT ACCOUNTING POLICIES
The following is a summary of significant accounting policies consistently followed by the Fund in the preparation of its financial statements. These policies are in conformity with U.S. generally accepted accounting principles (GAAP).
Investment Valuation
In calculating its net asset value (NAV), the Fund generally values investments as follows:
| ■ | Equity securities listed on an exchange or traded through a regulated market system are valued at their last reported sale price or official closing price in their principal exchange or market. |
| ■ | Shares of other mutual funds or non-exchange-traded investment companies are valued based upon their reported NAVs. |
| ■ | Derivative contracts listed on exchanges are valued at their reported settlement or closing price, except that options are valued at the mean of closing bid and asked quotations. |
| ■ | Over-the-counter (OTC) derivative contracts are fair valued using price evaluations provided by a pricing service approved by the Board of Trustees (the “Trustees”). |
| ■ | Fixed-income securities acquired with remaining maturities greater than 60 days are fair valued using price evaluations provided by a pricing service approved by the Trustees. |
| ■ | Fixed-income securities and repurchase agreements acquired with remaining maturities of 60 days or less are valued at their cost (adjusted for the accretion of any discount or amortization of any premium), unless the issuer's creditworthiness is impaired or other factors indicate that amortized cost is not an accurate estimate of the investment's fair value, in which case it would be valued in the same manner as a longer-term security. |
| ■ | For securities that are fair valued in accordance with procedures established by and under the general supervision of the Trustees, certain factors may be considered such as: the last traded or purchase price of the security, information obtained by contacting the issuer or dealers, analysis of the issuer's financial statements or other available documents, fundamental analytical data, the nature and duration of restrictions on disposition, the movement of the market in which the security is normally traded, public trading in similar securities or derivative contracts of the issuer or comparable issuers, movement of a relevant index, or other factors including but not limited to industry changes and relevant government actions. |
Annual Shareholder Report
If any price, quotation, price evaluation or other pricing source is not readily available when the NAV is calculated, or if the Fund cannot obtain price evaluations from a pricing service or from more than one dealer for an investment within a reasonable period of time as set forth in the Fund's valuation policies and procedures, the Fund uses the fair value of the investment determined in accordance with the procedures described below. There can be no assurance that the Fund could obtain the fair value assigned to an investment if it sold the investment at approximately the time at which the Fund determines its NAV per share.
Fair Valuation and Significant Events Procedures
The Trustees have ultimate responsibility for determining the fair value of investments for which market quotations are not readily available. The Trustees have appointed a valuation committee (“Valuation Committee”) comprised of officers of the Fund, Federated Equity Management Company of Pennsylvania (“Adviser”) and certain of the Adviser's affiliated companies to assist in determining fair value and in overseeing the calculation of the NAV. The Trustees have also authorized the use of pricing services recommended by the Valuation Committee to provide fair value evaluations of the current value of certain investments for purposes of calculating the NAV. The Valuation Committee employs various methods for reviewing third-party pricing-service evaluations including periodic reviews of third-party pricing services' policies, procedures and valuation methods (including key inputs, methods, models and assumptions), transactional back-testing, comparisons of evaluations of different pricing services, and review of price challenges by the Adviser based on recent market activity. In the event that market quotations and price evaluations are not available for an investment, the Valuation Committee determines the fair value of the investment in accordance with procedures adopted by the Trustees. The Trustees periodically review and approve the fair valuations made by the Valuation Committee and any changes made to the procedures.
Factors considered by pricing services in evaluating an investment include the yields or prices of investments of comparable quality, coupon, maturity, call rights and other potential prepayments, terms and type, reported transactions, indications as to values from dealers and general market conditions. Some pricing services provide a single price evaluation reflecting the bid-side of the market for an investment (a “bid” evaluation). Other pricing services offer both bid evaluations and price evaluations indicative of a price between the prices bid and asked for the investment (a “mid” evaluation). The Fund normally uses bid evaluations for any U.S. Treasury and Agency securities, mortgage-backed securities and municipal securities. The Fund normally uses mid evaluations for any other types of fixed-income securities and any OTC derivative contracts. In the event that market quotations and price evaluations are not available for an investment, the fair value of the investment is determined in accordance with procedures adopted by the Trustees.
The Trustees also have adopted procedures requiring an investment to be priced at its fair value whenever the Adviser determines that a significant event affecting the value of the investment has occurred between the time as of which the price of the investment would otherwise be determined and the time as of which the NAV is computed. An event is considered significant if there is both an affirmative expectation that the investment's value will change in response to the event and a reasonable basis for quantifying the resulting change in value. Examples of significant events that may occur after the close of the principal market on which a security is traded, or after the time of a price evaluation provided by a pricing service or a dealer, include:
| ■ | With respect to securities traded principally in foreign markets, significant trends in U.S. equity markets or in the trading of foreign securities index futures contracts; |
Annual Shareholder Report
| ■ | Political or other developments affecting the economy or markets in which an issuer conducts its operations or its securities are traded; |
| ■ | Announcements concerning matters such as acquisitions, recapitalizations, litigation developments, or a natural disaster affecting the issuer's operations or regulatory changes or market developments affecting the issuer's industry. |
The Trustees have adopted procedures whereby the Valuation Committee uses a pricing service to determine the fair value of equity securities traded principally in foreign markets when the Adviser determines that there has been a significant trend in the U.S. equity markets or in index futures trading. For other significant events, the Fund may seek to obtain more current quotations or price evaluations from alternative pricing sources. If a reliable alternative pricing source is not available, the Fund will determine the fair value of the investment in accordance with the fair valuation procedures approved by the Trustees. The Board has ultimate responsibility for any fair valuations made in response to a significant event.
Repurchase Agreements
The Fund may invest in repurchase agreements for short-term liquidity purposes. It is the policy of the Fund to require the other party to a repurchase agreement to transfer to the Fund's custodian or sub-custodian eligible securities or cash with a market value (after transaction costs) at least equal to the repurchase price to be paid under the repurchase agreement. The eligible securities are transferred to accounts with the custodian or sub-custodian in which the Fund holds a “securities entitlement” and exercises “control” as those terms are defined in the Uniform Commercial Code. The Fund has established procedures for monitoring the market value of the transferred securities and requiring the transfer of additional eligible securities if necessary to equal at least the repurchase price. These procedures also allow the other party to require securities to be transferred from the account to the extent that their market value exceeds the repurchase price or in exchange for other eligible securities of equivalent market value.
The insolvency of the other party or other failure to repurchase the securities may delay the disposition of the underlying securities or cause the Fund to receive less than the full repurchase price. Under the terms of the repurchase agreement, any amounts received by the Fund in excess of the repurchase price and related transaction costs must be remitted to the other party.
The Fund may enter into repurchase agreements in which eligible securities are transferred into joint trading accounts maintained by the custodian or sub-custodian for investment companies and other clients advised by the Fund's Adviser and its affiliates. The Fund will participate on a pro rata basis with the other investment companies and clients in its share of the securities transferred under such repurchase agreements and in its share of proceeds from any repurchase or other disposition of such securities.
Investment Income, Gains and Losses, Expenses and Distributions
Investment transactions are accounted for on a trade-date basis. Realized gains and losses from investment transactions are recorded on an identified-cost basis. Interest income and expenses are accrued daily. Dividend income and distributions to shareholders are recorded on the ex-dividend date. Foreign dividends are recorded on the ex-dividend date or when the Fund is informed of the ex-dividend date. Distributions of net investment income are declared and paid monthly. Non-cash dividends included in dividend income, if any, are recorded at fair
Annual Shareholder Report
value. Investment income, realized and unrealized gains and losses, and certain fund-level expenses are allocated to each class based on relative average daily net assets, except that Class A Shares, Class C Shares and Institutional Shares may bear distribution services fees and other service fees unique to those classes.
Dividends are declared separately for each class. No class has preferential dividend rights; differences in per share dividend rates are generally due to differences in separate class expenses.
Other Service Fees
The Fund may pay other service fees up to 0.25% of the average daily net assets of the Fund's Class A Shares and Class C Shares to unaffiliated financial intermediaries or to Federated Shareholder Services Company (FSSC) for providing services to shareholders and maintaining shareholder accounts. Subject to the terms described in the Expense Limitation note, FSSC may voluntarily reimburse the Fund for other service fees. For the year ended October 31, 2015, other service fees for the Fund were as follows:
| | Other
Service Fees
Incurred |
| Class A Shares | $5,794,027 |
| Class C Shares | 3,717,248 |
| TOTAL | $9,511,275 |
Premium and Discount Amortization
All premiums and discounts on fixed-income securities are amortized/accreted using the effective-interest-rate method.
Federal Taxes
It is the Fund's policy to comply with the Subchapter M provision of the Internal Revenue Code (the “Code”) and to distribute to shareholders each year substantially all of its income. Accordingly, no provision for federal income tax is necessary. As of and during the year ended October 31, 2015, the Fund did not have a liability for any uncertain tax positions. The Fund recognizes interest and penalties, if any, related to tax liabilities as income tax expense in the Statement of Operations. As of October 31, 2015, tax years 2012 through 2015 remain subject to examination by the Fund's major tax jurisdictions, which include the United States of America and the Commonwealth of Massachusetts.
The Fund may be subject to taxes imposed by governments of countries in which it invests. Such taxes are generally based on either income or gains earned or repatriated. The Fund accrues and applies such taxes to net investment income, net realized gains and net unrealized gains as income and/or gains are earned.
When-Issued and Delayed-Delivery Transactions
The Fund may engage in when-issued or delayed-delivery transactions. The Fund records when-issued securities on the trade date and maintains security positions such that sufficient liquid assets will be available to make payment for the securities purchased. Securities purchased on a when-issued or delayed-delivery basis are marked to market daily and begin earning interest on the settlement date. Losses may occur on these transactions due to changes in market conditions or the failure of counterparties to perform under the contract.
Annual Shareholder Report
Foreign Exchange Contracts
The Fund enters into foreign exchange contracts for the delayed delivery of securities or foreign currency exchange transactions. The Fund enters into foreign exchange contracts to protect assets against adverse changes in foreign currency exchange rates or exchange control regulations. Purchased contracts are used to acquire exposure to foreign currencies, whereas, contracts to sell are used to hedge the Fund's securities against currency fluctuations. Risks may arise upon entering into these transactions from the potential inability of counterparties to meet the terms of their commitments and from unanticipated movements in security prices or foreign exchange rates. The foreign exchange contracts are adjusted by the daily exchange rate of the underlying currency and any gains or losses are recorded for financial statement purposes as unrealized until the settlement date.
At October 31, 2015, the Fund had no outstanding foreign exchange contracts.
The average value at settlement date payable and receivable of foreign exchange contracts purchased and sold by the Fund throughout the period was $9,376 and $1,244, respectively. This is based on the contracts held as of each month-end throughout the fiscal period.
Foreign Currency Translation
The accounting records of the Fund are maintained in U.S. dollars. All assets and liabilities denominated in foreign currencies (FCs) are translated into U.S. dollars based on the rates of exchange of such currencies against U.S. dollars on the date of valuation. Purchases and sales of securities, income and expenses are translated at the rate of exchange quoted on the respective date that such transactions are recorded. The Fund does not isolate that portion of the results of operations resulting from changes in foreign exchange rates on investments from the fluctuations arising from changes in market prices of securities held. Such fluctuations are included with the net realized and unrealized gain or loss from investments.
Reported net realized foreign exchange gains or losses arise from sales of portfolio securities, sales and maturities of short-term securities, sales of FCs, currency gains or losses realized between the trade and settlement dates on securities transactions, the difference between the amounts of dividends, interest and foreign withholding taxes recorded on the Fund's books, and the U.S. dollar equivalent of the amounts actually received or paid. Net unrealized foreign exchange gains and losses arise from changes in the value of assets and liabilities other than investments in securities at fiscal year end, resulting from changes in the exchange rate.
Additional Disclosure Related to Derivative Instruments
The Effect of Derivative Instruments on the Statement of Operations for the Year Ended October 31, 2015
| Amount of Realized Gain or (Loss) on Derivatives Recognized in Income |
| | Forward
Currency
Contracts |
| Foreign exchange contracts | $(212,742) |
Annual Shareholder Report
Other
The preparation of financial statements in conformity with GAAP requires management to make estimates and assumptions that affect the amounts of assets, liabilities, expenses and revenues reported in the financial statements. Actual results could differ from those estimated. The Fund applies Investment Company accounting and reporting guidance.
3. SHARES OF BENEFICIAL INTEREST
The following tables summarize share activity:
| Year Ended October 31 | 2015 | 2014 |
| Class A Shares: | Shares | Amount | Shares | Amount |
| Shares sold | 109,065,993 | $651,390,612 | 122,159,209 | $740,413,321 |
| Shares issued to shareholders in payment of distributions declared | 26,198,446 | 157,315,958 | 17,493,647 | 103,700,461 |
| Shares redeemed | (110,743,261) | (657,421,353) | (111,562,748) | (674,431,536) |
| NET CHANGE RESULTING FROM CLASS A SHARE TRANSACTIONS | 24,521,178 | $151,285,217 | 28,090,108 | $169,682,246 |
| Year Ended October 31 | 2015 | 2014 |
| Class C Shares: | Shares | Amount | Shares | Amount |
| Shares sold | 66,765,099 | $398,625,388 | 58,851,007 | $355,329,632 |
| Shares issued to shareholders in payment of distributions declared | 13,333,823 | 80,214,522 | 7,539,441 | 44,669,953 |
| Shares redeemed | (35,331,675) | (209,818,346) | (25,208,230) | (151,221,297) |
| NET CHANGE RESULTING FROM CLASS C SHARE TRANSACTIONS | 44,767,247 | $269,021,564 | 41,182,218 | $248,778,288 |
| Year Ended October 31 | 2015 | 2014 |
| Institutional Shares: | Shares | Amount | Shares | Amount |
| Shares sold | 282,628,960 | $1,689,127,854 | 287,662,903 | $1,748,606,045 |
| Shares issued to shareholders in payment of distributions declared | 51,957,788 | 313,081,504 | 31,783,280 | 189,154,832 |
| Shares redeemed | (272,221,621) | (1,620,339,161) | (247,598,316) | (1,474,616,348) |
| NET CHANGE RESULTING FROM INSTITUTIONAL SHARE TRANSACTIONS | 62,365,127 | $381,870,197 | 71,847,867 | $463,144,529 |
| NET CHANGE RESULTING FROM TOTAL FUND SHARE TRANSACTIONS | 131,653,552 | $802,176,978 | 141,120,193 | $881,605,063 |
Annual Shareholder Report
4. FEDERAL TAX INFORMATION
The timing and character of income and capital gain distributions are determined in accordance with income tax regulations, which may differ from GAAP. These differences are due to differing treatments for foreign currency transactions.
For the year ended October 31, 2015, permanent differences identified and reclassified among the components of net assets were as follows:
| Increase (Decrease) |
Undistributed
Net Investment
Income (Loss) | Accumulated
Net Realized
Gain (Loss) |
| $(1,257,732) | $1,257,732 |
Net investment income (loss), net realized gains (losses), and net assets were not affected by this reclassification.
The tax character of distributions as reported on the Statement of Changes in Net Assets for the years ended October 31, 2015 and 2014, was as follows:
| | 2015 | 2014 |
| Ordinary income1 | $332,422,203 | $414,929,569 |
| Long-term capital gains | $378,102,784 | $40,390,784 |
| 1 | For tax purposes, short-term capital gain distributions are considered ordinary income distributions. |
| | |
As of October 31, 2015, the components of distributable earnings on a tax basis were as follows:
| Undistributed ordinary income2 | $32,017,778 |
| Undistributed long-term capital gains | $455,155,147 |
| Net unrealized appreciation | $1,392,034,758 |
| 2 | For tax purposes, short-term capital gains are considered ordinary income in determining distributable earnings. |
| | |
At October 31, 2015, the cost of investments for federal tax purposes was $8,488,712,065. The net unrealized appreciation of investments for federal tax purposes excluding any unrealized appreciation resulting from the translation from FCs to U.S. dollars of assets and liabilities other than investments in securities was $1,392,017,006. This consists of net unrealized appreciation from investments for those securities having an excess of value over cost of $1,788,467,858 and net unrealized depreciation from investments for those securities having an excess of cost over value of $396,450,852.
Annual Shareholder Report
5. INVESTMENT ADVISER FEE AND OTHER TRANSACTIONS WITH AFFILIATES
Investment Adviser Fee
The advisory agreement between the Fund and the Adviser provides for an annual fee equal to 0.75% of the Fund's average daily net assets. Subject to the terms described in the Expense Limitation note, the Adviser may voluntarily choose to waive any portion of its fee. For the year ended October 31, 2015, the Adviser voluntarily waived $12,365,809 of its fee.
Administrative Fee
Federated Administrative Services (FAS), under the Administrative Services Agreement, provides the Fund with administrative personnel and services. For purposes of determining the appropriate rate breakpoint, “Investment Complex” is defined as all of the Federated Funds subject to a fee under the Administrative Services Agreement. The fee paid to FAS is based on the average daily net assets of the Investment Complex as specified below, plus certain out-of-pocket expenses:
| Administrative Fee | Average Daily Net Assets
of the Investment Complex |
| 0.150% | on the first $5 billion |
| 0.125% | on the next $5 billion |
| 0.100% | on the next $10 billion |
| 0.075% | on assets in excess of $20 billion |
For the year ended October 31, 2015, the annualized fee paid to FAS was 0.078% of average daily net assets of the Fund.
Distribution Services Fee
The Fund has adopted a Distribution Plan (the “Plan”) pursuant to Rule 12b-1 under the Act. Under the terms of the Plan, the Fund will compensate Federated Securities Corp. (FSC), the principal distributor, from the daily net assets of the Fund's Class A Shares and Class C Shares to finance activities intended to result in the sale of these shares. The Plan provides that the Fund may incur distribution expenses at the following percentages of average daily net assets annually, to compensate FSC:
| Share Class Name | Percentage of Average Daily
Net Assets of Class |
| Class A Shares | 0.05% |
| Class C Shares | 0.75% |
Subject to the terms described in the Expense Limitation note, FSC may voluntarily choose to waive any portion of its fee. For the year ended October 31, 2015, distribution services fees for the Fund were as follows:
| | Distribution
Services Fees
Incurred | Distribution
Services Fees
Waived |
| Class C Shares | $11,151,743 | $(6,500) |
Annual Shareholder Report
When FSC receives fees, it may pay some or all of them to financial intermediaries whose customers purchase shares. For the year ended October 31, 2015, FSC retained $2,915,307 of fees paid by the Fund. For the year ended October 31, 2015, the Fund's Class A Shares did not incur a distribution services fee; however, it may begin to incur this fee upon approval of the Trustees.
Sales Charges
Front-end sales charges and contingent deferred sales charges (CDSC) do not represent expenses of the Fund. They are deducted from the proceeds of sales of Fund shares prior to investment or from redemption proceeds prior to remittance, as applicable. For the year ended October 31, 2015, FSC retained $864,367 in sales charges from the sale of Class A Shares. FSC also retained $2,494 of CDSC relating to redemptions of Class A Shares and $218,885 of CDSC relating to redemptions of Class C Shares.
Other Service Fees
For the year ended October 31, 2015 FSSC received $27,114 of other service fees disclosed in Note 2.
Expense Limitation
The Adviser and certain of its affiliates (which may include FSC, FAS and FSSC) on their own initiative have agreed to waive certain amounts of their respective fees and/or reimburse expenses. Total annual fund operating expenses (as shown in the financial highlights, excluding expenses allocated from affiliated partnerships, extraordinary expenses and proxy-related expenses paid by the Fund, if any) paid by the Fund's Class A Shares, Class C Shares and Institutional Shares (after the voluntary waivers and/or reimbursements) will not exceed 1.05%, 1.80% and 0.80% (the “Fee Limit”), respectively, up to but not including the later of (the “Termination Date”): (a) January 1, 2017; or (b) the date of the Fund's next effective Prospectus. While the Adviser and its applicable affiliates currently do not anticipate terminating or increasing these arrangements prior to the Termination Date, these arrangements may only be terminated or the Fee Limit increased prior to the Termination Date with the agreement of the Trustees.
General
Certain Officers and Trustees of the Fund are Officers and Directors or Trustees of certain of the above companies. To efficiently facilitate payment, Directors'/Trustees' fees and certain expenses related to conducting meetings of the Directors/Trustees and other miscellaneous expenses are paid by an affiliate of the Adviser which in due course are reimbursed by the Fund. Such expenses may be included in Accrued and Miscellaneous Expenses on the Statement of Assets and Liabilities and Statement of Operations, respectively.
Annual Shareholder Report
Transactions Involving Affiliated Holdings
Affiliated holdings are investment companies which are managed by the Adviser or an affiliate of the Adviser. The Adviser has agreed to reimburse the Fund for certain investment adviser fees as a result of transactions in other affiliated investment companies. For the year ended October 31, 2015, the Adviser reimbursed $124,114. Transactions involving the affiliated holding during the year ended October 31, 2015, were as follows:
| | Federated
Prime Value
Obligations Fund,
Institutional Shares |
| Balance of Shares Held 10/31/2014 | 69,839,976 |
| Purchases/Additions | 1,326,404,009 |
| Sales/Reductions | (1,289,705,656) |
| Balance of Shares Held 10/31/2015 | 106,538,329 |
| Value | $106,538,329 |
| Dividend Income | $111,478 |
6. Investment TRANSACTIONS
Purchases and sales of investments, excluding long-term U.S. government securities and short-term obligations, for the year ended October 31, 2015, were as follows:
| Purchases | $1,954,675,899 |
| Sales | $1,495,445,190 |
7. LINE OF CREDIT
The Fund participates in a $100,000,000 unsecured, uncommitted revolving line of credit (LOC) agreement with PNC Bank. The LOC was made available for extraordinary or emergency purposes, primarily for financing redemption payments. Borrowings are charged interest at a rate offered to the Fund by PNC Bank at the time of the borrowing. As of October 31, 2015, there were no outstanding loans. During the year ended October 31, 2015, the Fund did not utilize the LOC.
Annual Shareholder Report
8. INTERFUND LENDING
Pursuant to an Exemptive Order issued by the Securities and Exchange Commission (SEC), the Fund, along with other funds advised by subsidiaries of Federated Investors, Inc., may participate in an interfund lending program. This program provides an alternative credit facility allowing the Fund to borrow from other participating affiliated funds. As of October 31, 2015, there were no outstanding loans. During the year ended October 31, 2015, the program was not utilized.
9. FEDERAL TAX INFORMATION (UNAUDITED)
For the year ended October 31, 2015, the amount of long-term capital gains designated by the Fund was $378,102,784.
For the fiscal year ended October 31, 2015, 100.00% of total ordinary income (including short-term capital gain) distributions made by the Fund are qualifying dividends which may be subject to a maximum tax rate of 15%, as provided for by the Jobs and Growth Tax Relief Act of 2003. Complete information is reported in conjunction with the reporting of your distributions on Form 1099-DIV.
Of the ordinary income (including short-term capital gain) distributions made by the Fund during the year ended October 31, 2015, 74.30% qualify for the dividend received deduction available to corporate shareholders.
Annual Shareholder Report
Report of Independent Registered Public Accounting Firm
TO THE BOARD OF Trustees OF Federated Equity Funds AND SHAREHOLDERS OF Federated Strategic Value Dividend Fund:
We have audited the accompanying statement of assets and liabilities of Federated Strategic Value Dividend Fund (the “Fund”) (one of the portfolios constituting Federated Equity Funds), including the portfolio of investments, as of October 31, 2015, and the related statement of operations for the year then ended, the statement of changes in net assets for each of the two years in the period then ended, and the financial highlights for each of the five years in the period then ended. These financial statements and financial highlights are the responsibility of the Fund's management. Our responsibility is to express an opinion on these financial statements and financial highlights based on our audits.
We conducted our audits in accordance with standards of the Public Company Accounting Oversight Board (United States). Those standards require that we plan and perform the audit to obtain reasonable assurance about whether the financial statements and financial highlights are free of material misstatement. We were not engaged to perform an audit of the Fund's internal control over financial reporting. Our audits included consideration of internal control over financial reporting as a basis for designing audit procedures that are appropriate in the circumstances, but not for the purpose of expressing an opinion on the effectiveness of the Fund's internal control over financial reporting. Accordingly, we express no such opinion. An audit also includes examining, on a test basis, evidence supporting the amounts and disclosures in the financial statements and financial highlights, assessing the accounting principles used and significant estimates made by management, and evaluating the overall financial statement presentation. Our procedures included confirmation of securities owned as of October 31, 2015, by correspondence with the custodian and others. We believe that our audits provide a reasonable basis for our opinion.
In our opinion, the financial statements and financial highlights referred to above present fairly, in all material respects, the financial position of the Federated Strategic Value Dividend Fund, a portfolio of Federated Equity Funds, at October 31, 2015, the results of its operations for the year then ended, the changes in its net assets for each of the two years in the period then ended, and the financial highlights for each of the five years in the period then ended, in conformity with U.S. generally accepted accounting principles.
Boston, Massachusetts
December 23, 2015
Annual Shareholder Report
Shareholder Expense Example (unaudited)
As a shareholder of the Fund, you incur two types of costs: (1) transaction costs, including sales charges (“loads”) on purchase or redemption payments; and (2) ongoing costs, including management fees and to the extent applicable, distribution (12b-1) fees and/or other service fees and other Fund expenses. This Example is intended to help you to understand your ongoing costs (in dollars) of investing in the Fund and to compare these costs with the ongoing costs of investing in other mutual funds. It is based on an investment of $1,000 invested at the beginning of the period and held for the entire period from May 1, 2015 to October 31, 2015.
ACTUAL EXPENSES
The first section of the table below provides information about actual account values and actual expenses. You may use the information in this section, together with the amount you invested, to estimate the expenses that you incurred over the period. Simply divide your account value by $1,000 (for example, an $8,600 account value divided by $1,000 = 8.6), then multiply the result by the number in the first section under the heading entitled “Expenses Paid During Period” to estimate the expenses attributable to your investment during this period.
HYPOTHETICAL EXAMPLE FOR COMPARISON PURPOSES
The second section of the table below provides information about hypothetical account values and hypothetical expenses based on the Fund's actual expense ratio and an assumed rate of return of 5% per year before expenses, which is not the Fund's actual return. Thus, you should not use the hypothetical account values and expenses to estimate the actual ending account balance or your expenses for the period. Rather, these figures are required to be provided to enable you to compare the ongoing costs of investing in the Fund with other funds. To do so, compare this 5% hypothetical example with the 5% hypothetical examples that appear in the shareholder reports of the other funds.
Annual Shareholder Report
Please note that the expenses shown in the table are meant to highlight your ongoing costs only and do not reflect any transaction costs, such as sales charges (“loads”) on purchase or redemption payments. Therefore, the second section of the table is useful in comparing ongoing costs only, and will not help you determine the relative total costs of owning different funds. In addition, if these transaction costs were included, your costs would have been higher.
| | Beginning
Account Value
5/1/2015 | Ending
Account Value
10/31/2015 | Expenses Paid
During Period1 |
| Actual: | | | |
| Class A Shares | $1,000 | $1,023.90 | $5.36 |
| Class C Shares | $1,000 | $1,020.00 | $9.16 |
| Institutional Shares | $1,000 | $1,026.70 | $4.09 |
Hypothetical (assuming a 5% return
before expenses): | | | |
| Class A Shares | $1,000 | $1,019.91 | $5.35 |
| Class C Shares | $1,000 | $1,016.13 | $9.15 |
| Institutional Shares | $1,000 | $1,021.17 | $4.08 |
| 1 | Expenses are equal to the Fund's annualized net expense ratios, multiplied by the average account value over the period, multiplied by 184/365 (to reflect the one-half-year period). The annualized net expense ratios are as follows: |
| | |
| Class A Shares | 1.05% |
| Class C Shares | 1.80% |
| Institutional Shares | 0.80% |
Annual Shareholder Report
Board of Trustees and Trust Officers
The Board of Trustees is responsible for managing the Trust's business affairs and for exercising all the Trust's powers except those reserved for the shareholders. The following tables give information about each Trustee and the senior officers of the Fund. Where required, the tables separately list Trustees who are “interested persons” of the Fund (i.e., “Interested” Trustees) and those who are not (i.e., “Independent” Trustees). Unless otherwise noted, the address of each person listed is Federated Investors Tower, 1001 Liberty Avenue, Pittsburgh, PA 15222. The address of all Independent Trustees listed is 4000 Ericsson Drive, Warrendale, PA 15086-7561; Attention: Mutual Fund Board. As of December 31, 2014, the Trust comprised 14 portfolio(s), and the Federated Fund Family consisted of 40 investment companies (comprising 131 portfolios). Unless otherwise noted, each Officer is elected annually. Unless otherwise noted, each Trustee oversees all portfolios in the Federated Fund Family and serves for an indefinite term. The Fund's Statement of Additional Information includes additional information about Trust Trustees and is available, without charge and upon request, by calling 1-800-341-7400.
Interested TRUSTEES Background
Name
Birth Date
Positions Held with Trust
Date Service Began | Principal Occupation(s) for Past Five Years,
Other Directorships Held and Previous Position(s) |
John F. Donahue*
Birth Date: July 28, 1924
Trustee
Indefinite Term
Began serving: April 1984 | Principal Occupations: Director or Trustee of the Federated Fund Family; Chairman and Director, Federated Investors, Inc.; Chairman of the Federated Fund Family's Executive Committee.
Previous Positions: Chairman of the Federated Fund Family; Trustee, Federated Investment Management Company; Chairman and Director, Federated Investment Counseling. |
J. Christopher Donahue*
Birth Date: April 11, 1949
President and Trustee
Indefinite Term
Began serving: January 2000 | Principal Occupations: Principal Executive Officer and President of certain of the Funds in the Federated Fund Family; Director or Trustee of the Funds in the Federated Fund Family; President, Chief Executive Officer and Director, Federated Investors, Inc.; Chairman and Trustee, Federated Investment Management Company; Trustee, Federated Investment Counseling; Chairman and Director, Federated Global Investment Management Corp.; Chairman, Federated Equity Management Company of Pennsylvania and Passport Research, Ltd. (investment advisory subsidiary of Federated); Trustee, Federated Shareholder Services Company; Director, Federated Services Company.
Previous Positions: President, Federated Investment Counseling; President and Chief Executive Officer, Federated Investment Management Company, Federated Global Investment Management Corp. and Passport Research, Ltd. |
| * | Family relationships and reasons for “interested” status: John F. Donahue is the father of J. Christopher Donahue; both are “interested” due to their beneficial ownership of shares of Federated Investors, Inc. and the positions they hold with Federated and its subsidiaries. |
Annual Shareholder Report
INDEPENDENT TRUSTEES Background
Name
Birth Date
Positions Held with Trust
Date Service Began | Principal Occupation(s) for Past Five Years,
Other Directorships Held, Previous Position(s) and Qualifications |
John T. Collins
Birth Date: January 24, 1947
Trustee
Indefinite Term
Began serving: October 2013 | Principal Occupations: Director or Trustee of the Federated Fund Family; Chairman and CEO, The Collins Group, Inc. (a private equity firm).
Other Directorships Held: Director, Chair of the Compensation Committee, Audit Committee member, KLX Corp.
Qualifications: Mr. Collins has served in several business and financial management roles and directorship positions throughout his career. Mr. Collins serves as Chairman Emeriti, Bentley University. Mr. Collins previously served as Director, FleetBoston Financial Corp.; Director and Audit Committee Member, Bank of America Corp. and Director, Beth Israel Deaconess Medical Center (Harvard University Affiliate Hospital). |
G. Thomas Hough
Birth Date: February 28, 1955
Trustee
Indefinite Term
Began serving: August 2015 | Principal Occupations: Director or Trustee of the Federated Fund Family; Retired.
Other Directorships Held: Director, Chair of the Audit Committee, Governance Committee, Publix Super Markets, Inc.
Qualifications: Mr. Hough has served in accounting, business management and directorship positions throughout his career. Mr. Hough most recently held the position of Americas Vice Chair of Assurance with Ernst & Young LLP. Mr. Hough is an Executive Committee member of the United States Golf Association, he serves on the President's Cabinet and Business School Board of Visitors for the University of Alabama and is on the Business School Board of Visitors for Wake Forest University. |
Maureen Lally-Green
Birth Date: July 5, 1949
Trustee
Indefinite Term
Began serving: August 2009 | Principal Occupations: Director or Trustee of the Federated Fund Family; Adjunct Professor of Law, Duquesne University School of Law.
Other Directorships Held: Director, CONSOL Energy Inc.
Qualifications: Judge Lally-Green has served in various legal and business roles and directorship positions throughout her career. Judge Lally-Green previously served as: Associate General Secretary, Diocese of Pittsburgh; Professor of Law, Duquesne University School of Law and was a member of the Superior Court of Pennsylvania. Judge Lally-Green also holds the positions of: Member, Pennsylvania State Board of Education; Director, Saint Vincent College; Director and Chair, UPMC Mercy Hospital; Regent, St. Vincent Seminary; Director, Epilepsy Foundation of Western and Central Pennsylvania; Director, Our Campaign for the Church Alive!, Inc.; Director, Pennsylvania Bar Institute; and Director, Cardinal Wuerl North Catholic High School, Inc. Judge Lally-Green has held the positions of: Director, Auberle; Director, Ireland Institute of Pittsburgh; Director, Saint Thomas More Society; and Director, Catholic High Schools of the Diocese of Pittsburgh, Inc. |
Annual Shareholder Report
Name
Birth Date
Positions Held with Trust
Date Service Began | Principal Occupation(s) for Past Five Years,
Other Directorships Held, Previous Position(s) and Qualifications |
Peter E. Madden
Birth Date: March 16, 1942
Trustee
Indefinite Term
Began serving: November 1991 | Principal Occupation: Director or Trustee, and Chair of the Board of Directors or Trustees, of the Federated Fund Family; Retired.
Other Directorships Held: None.
Qualifications: Mr. Madden has served in several business management, mutual fund services and directorship positions throughout his career. Mr. Madden previously served as President, Chief Operating Officer and Director, State Street Bank and Trust Company (custodian bank) and State Street Corporation (financial services). He was Director, VISA USA and VISA International and Chairman and Director, Massachusetts Bankers Association. Mr. Madden served as Director, Depository Trust Corporation and Director, The Boston Stock Exchange. Mr. Madden also served as a Representative to the Commonwealth of Massachusetts General Court. |
Charles F. Mansfield, Jr.
Birth Date: April 10, 1945
Trustee
Indefinite Term
Began serving: January 1999 | Principal Occupations: Director or Trustee of the Federated Fund Family; Management Consultant.
Other Directorships Held: None.
Qualifications: Mr. Mansfield has served in several banking, business management and educational roles and directorship positions throughout his career. Mr. Mansfield previously served as Chief Executive Officer, PBTC International Bank; Partner, Arthur Young & Company (now Ernst & Young LLP); Chief Financial Officer of Retail Banking Sector, Chase Manhattan Bank; Senior Vice President, HSBC Bank USA (formerly, Marine Midland Bank); Vice President, Citibank; Assistant Professor of Banking and Finance, Frank G. Zarb School of Business, Hofstra University; Executive Vice President DVC Group, Inc. (marketing, communications and technology). |
Thomas M. O'Neill
Birth Date: June 14, 1951
Trustee
Indefinite Term
Began serving: October 2006 | Principal Occupations: Director or Trustee, Vice Chair of the Audit Committee of the Federated Fund Family; Sole Proprietor, Navigator Management Company (investment and strategic consulting).
Other Directorships Held: None.
Qualifications: Mr. O'Neill has served in several business, mutual fund and financial management roles and directorship positions throughout his career. Mr. O'Neill serves as Director, Medicines for Humanity and Director, The Golisano Children's Museum of Naples, Florida. Mr. O'Neill previously served as Chief Executive Officer and President, Managing Director and Chief Investment Officer, Fleet Investment Advisors; President and Chief Executive Officer, Aeltus Investment Management, Inc.; General Partner, Hellman, Jordan Management Co., Boston, MA; Chief Investment Officer, The Putnam Companies, Boston, MA; Credit Analyst and Lending Officer, Fleet Bank; Director and Consultant, EZE Castle Software (investment order management software); and Director, Midway Pacific (lumber). |
Annual Shareholder Report
Name
Birth Date
Positions Held with Trust
Date Service Began | Principal Occupation(s) for Past Five Years,
Other Directorships Held, Previous Position(s) and Qualifications |
P. Jerome Richey
Birth Date: February 23, 1949
Trustee
Indefinite Term
Began serving: October 2013 | Principal Occupations: Director or Trustee of the Federated Fund Family; Management Consultant.
Other Directorships Held: None.
Qualifications: Mr. Richey has served in several business and legal management roles and directorship positions throughout his career. Mr. Richey most recently held the positions of Senior Vice Chancellor and Chief Legal Officer, University of Pittsburgh. Mr. Richey serves as Board Member, Epilepsy Foundation of Western Pennsylvania and Board member, World Affairs Council of Pittsburgh. Mr. Richey previously served as Chief Legal Officer and Executive Vice President, CONSOL Energy Inc. and Shareholder, Buchanan Ingersoll & Rooney PC (a law firm). |
John S. Walsh
Birth Date: November 28, 1957
Trustee
Indefinite Term
Began serving: January 1999 | Principal Occupations: Director or Trustee, Chair of the Audit Committee of the Federated Fund Family; President and Director, Heat Wagon, Inc. (manufacturer of construction temporary heaters); President and Director, Manufacturers Products, Inc. (distributor of portable construction heaters); President, Portable Heater Parts, a division of Manufacturers Products, Inc.
Other Directorships Held: None.
Qualifications: Mr. Walsh has served in several business management roles and directorship positions throughout his career. Mr. Walsh previously served as Vice President, Walsh & Kelly, Inc. (paving contractors). |
OFFICERS
Name
Birth Date
Address
Positions Held with Trust
Date Service Began | Principal Occupation(s) for Past Five Years
and Previous Position(s) |
John W. McGonigle
Birth Date: October 26, 1938
EXECUTIVE VICE PRESIDENT AND SECRETARY
Officer since: April 1984 | Principal Occupations: Executive Vice President and Secretary of the Federated Fund Family; Vice Chairman, Executive Vice President, Secretary and Director, Federated Investors, Inc.
Previous Positions: Trustee, Federated Investment Management Company and Federated Investment Counseling; Director, Federated Global Investment Management Corp., Federated Services Company and Federated Securities Corp. |
Annual Shareholder Report
Name
Birth Date
Address
Positions Held with Trust
Date Service Began | Principal Occupation(s) for Past Five Years
and Previous Position(s) |
Lori A. Hensler
Birth Date: January 6, 1967
TREASURER
Officer since: April 2013 | Principal Occupations: Principal Financial Officer and Treasurer of the Federated Fund Family; Senior Vice President, Federated Administrative Services; Financial and Operations Principal for Federated Securities Corp. and Edgewood Services, Inc.; and Assistant Treasurer, Federated Investors Trust Company. Ms. Hensler has received the Certified Public Accountant designation.
Previous Positions: Controller of Federated Investors, Inc.; Senior Vice President and Assistant Treasurer, Federated Investors Management Company; Treasurer, Federated Investors Trust Company; Assistant Treasurer, Federated Administrative Services, Federated Administrative Services, Inc., Federated Securities Corp., Edgewood Services, Inc., Federated Advisory Services Company, Federated Equity Management Company of Pennsylvania, Federated Global Investment Management Corp., Federated Investment Counseling, Federated Investment Management Company, Passport Research, Ltd., and Federated MDTA, LLC; Financial and Operations Principal for Federated Securities Corp., Edgewood Services, Inc. and Southpointe Distribution Services, Inc. |
Richard B. Fisher
Birth Date: May 17, 1923
VICE PRESIDENT
Officer since: April 1987 | Principal Occupations: Vice Chairman or Vice President of some of the Funds in the Federated Fund Family; Vice Chairman, Federated Investors, Inc.; Chairman, Federated Securities Corp.
Previous Positions: President and Director or Trustee of some of the Funds in the Federated Fund Family; Executive Vice President, Federated Investors, Inc.; Director and Chief Executive Officer, Federated Securities Corp. |
Peter J. Germain
Birth Date: September 3, 1959
CHIEF LEGAL OFFICER
Officer since: January 2005 | Principal Occupations: Mr. Germain is Chief Legal Officer of the Federated Fund Family. He is General Counsel and Vice President, Federated Investors, Inc.; President, Federated Administrative Services and Federated Administrative Services, Inc.; Vice President, Federated Securities Corp.; Secretary, Federated Private Asset Management, Inc.; and Secretary, Retirement Plan Service Company of America. Mr. Germain joined Federated in 1984 and is a member of the Pennsylvania Bar Association.
Previous Positions: Deputy General Counsel, Special Counsel, Managing Director of Mutual Fund Services, Federated Investors, Inc.; Senior Vice President, Federated Services Company; and Senior Corporate Counsel, Federated Investors, Inc. |
Stephen Van Meter
Birth Date: June 5, 1975
CHIEF COMPLIANCE OFFICER AND SENIOR VICE PRESIDENT
Officer since: July 2015 | Principal Occupations: Senior Vice President and Chief Compliance Officer of the Federated Fund Family; Vice President and Chief Compliance Officer of Federated Investors, Inc. and Chief Compliance Officer of certain of its subsidiaries. Mr. Van Meter joined Federated in October 2011. He holds FINRA licenses under Series 3, 7, 24 and 66.
Previous Positions: Mr. Van Meter previously held the position of Compliance Operating Officer, Federated Investors, Inc. Prior to joining Federated, Mr. Van Meter served at the United States Securities and Exchange Commission in the positions of Senior Counsel, Office of Chief Counsel, Division of Investment Management and Senior Counsel, Division of Enforcement. |
Annual Shareholder Report
Name
Birth Date
Address
Positions Held with Trust
Date Service Began | Principal Occupation(s) for Past Five Years
and Previous Position(s) |
Stephen F. Auth
Birth Date: September 3, 1956
101 Park Avenue
41st Floor
New York, NY 10178
CHIEF INVESTMENT OFFICER
Officer since: November 2002 | Principal Occupations: Stephen F. Auth is Chief Investment Officer of various Funds in the Federated Fund Family; Executive Vice President, Federated Investment Counseling, Federated Global Investment Management Corp. and Federated Equity Management Company of Pennsylvania.
Previous Positions: Executive Vice President, Federated Investment Management Company and Passport Research, Ltd. (investment advisory subsidiary of Federated); Senior Vice President, Global Portfolio Management Services Division; Senior Vice President, Federated Investment Management Company and Passport Research, Ltd.; Senior Managing Director and Portfolio Manager, Prudential Investments. |
Annual Shareholder Report
Evaluation and Approval of Advisory Contract–May 2015
Federated Strategic Value Dividend Fund (the “Fund”)
Following a review and recommendation of approval by the Fund's independent trustees, the Fund's Board reviewed and approved at its May 2015 meetings the Fund's investment advisory contract for an additional one-year term. The Board's decision regarding the contract reflects the exercise of its business judgment on whether to continue the existing arrangements.
In this connection, the Federated Funds' Board had previously appointed a Senior Officer, whose duties include specified responsibilities relating to the process by which advisory fees are to be charged to a Federated fund. The Senior Officer has the authority to retain consultants, experts, or staff as may be reasonably necessary to assist in the performance of his duties, reports directly to the Board, and may be terminated only with the approval of a majority of the independent members of the Board. The Senior Officer prepared and furnished to the Board an independent, written evaluation that covered topics discussed below (the “Evaluation”). The Board considered that Evaluation, along with other information, in deciding to approve the advisory contract.
The Board is also familiar with and considered judicial decisions concerning allegedly excessive investment advisory fees, which have indicated that the following factors may be relevant to an Adviser's fiduciary duty with respect to its receipt of compensation from a fund: the nature and quality of the services provided by the Adviser to a fund and its shareholders, including the performance and expenses of the fund and of comparable funds; the Adviser's cost of providing the services, including the profitability to the Adviser of providing advisory services to a fund; the extent to which the Adviser may realize “economies of scale” as a fund grows larger and, if such economies of scale exist, whether they have been shared with a fund and its shareholders or the family of funds; any “fall-out financial benefits” that accrue to the Adviser because of its relationship with a fund (including research services received from brokers that execute fund trades and any fees paid to affiliates of the Adviser for services rendered to a fund); comparative fee structures, including a comparison of fees paid to the Adviser with those paid by similar funds; and the extent of care, conscientiousness and independence with which the Board members perform their duties and their expertise, including whether they are fully informed about all facts the Board deems relevant to its consideration of the Adviser's services and fees. The Board noted that SEC disclosure requirements regarding the basis for the Board's approval of the Fund's advisory contract generally track the factors listed above. Consistent with these judicial decisions and SEC disclosure requirements, the Board also considered management fees
Annual Shareholder Report
charged to institutional and other clients of the Adviser for what might be viewed as like services. The Board was aware of these factors and was guided by them in its review of the Fund's advisory contract to the extent it considered them to be appropriate and relevant, as discussed further below.
The Board considered and weighed these circumstances in light of its substantial accumulated experience in governing the Fund and working with Federated on matters relating to the Federated funds, and was assisted in its deliberations by independent legal counsel. Throughout the year, and in connection with its May meetings, the Board requested and received substantial and detailed information about the Fund and the Federated organization that was in addition to the extensive materials that comprise and accompany the Senior Officer's Evaluation. Federated provided much of this information at each regular meeting of the Board, and furnished additional substantial information in connection with the May meeting at which the Board's formal review of the advisory contract occurred. At this May meeting, senior management of the Adviser also met with the independent trustees and their counsel to discuss the materials presented and any other matters thought relevant by the Adviser or the trustees. Between regularly scheduled meetings, the Board also received information on particular matters as the need arose. Thus, the Board's consideration of the advisory contract included review of the Senior Officer's Evaluation, accompanying data and additional information covering such matters as: the Adviser's investment philosophy, revenue, profitability, personnel and processes; investment and operating strategies; the Fund's short- and long-term performance (in absolute terms, both on a gross basis and net of expenses, as well as in relationship to its particular investment program and certain competitor or “peer group” funds and/or other benchmarks, as appropriate), and comments on the reasons for performance; the Fund's investment objectives; the Fund's expenses (including the advisory fee itself and the overall expense structure of the Fund, both in absolute terms and relative to similar and/or competing funds, with due regard for contractual or voluntary expense limitations); the use and allocation of brokerage commissions derived from trading the Fund's portfolio securities (if any); and the nature, quality and extent of the advisory and other services provided to the Fund by the Adviser and its affiliates. The Board also considered the preferences and expectations of Fund shareholders; the entrepreneurial risk assumed by the Adviser in sponsoring the funds; the continuing state of competition in the mutual fund industry and market practices; the range of comparable fees for similar funds in the mutual fund industry; the Fund's relationship to the Federated family of funds which include a comprehensive array of funds with different investment objectives, policies and strategies which are available for exchange without the incurrence of additional sales charges; compliance and audit reports concerning the Federated funds and the Federated companies that service them (including communications from regulatory agencies), as well as Federated's responses to any issues raised therein; and relevant developments in
Annual Shareholder Report
the mutual fund industry and how the Federated funds and/or Federated are responding to them. The Board's evaluation process is evolutionary. The criteria considered and the emphasis placed on relevant criteria change in recognition of changing circumstances in the mutual fund marketplace.
While mindful that courts have cautioned against giving such comparisons too much weight, the Board has found the use of comparisons of the Fund's fees and expenses to other mutual funds with comparable investment programs to be relevant. In this regard, the Board was presented with, and considered, information regarding the contractual advisory fee rates, net advisory fee rates and total expense ratios relative to a fund's peers. The Board focused on comparisons with other similar mutual funds more heavily than non-mutual fund products or services because it is believed that they are more relevant. For example, other mutual funds are the products most like the Fund, they are readily available to Fund shareholders as alternative investment vehicles, and they are the type of investment vehicle in fact chosen and maintained by the Fund's investors. The range of their fees and expenses therefore appears to be a relevant indicator of what consumers have found to be reasonable in the precise marketplace in which the Fund competes.
The Board reviewed the contractual advisory fee rate, net advisory fee rate where partially waived and other expenses of the Fund and noted the position of the Fund's fee rates relative to its peers. In this regard, the Board noted that the contractual advisory fee rate was above the median of the relevant peer group, but the Board noted the applicable waivers and reimbursements and that the overall expense structure of the Fund remained competitive. The Board will continue to monitor advisory fees and other expenses borne by the Fund in the context of the other factors considered relevant by the Board.
By contrast, the Senior Officer has reviewed Federated's fees for providing advisory services to products outside the Federated family of funds (e.g., institutional and separate accounts and sub-adviser services). He concluded that mutual funds and institutional accounts are inherently different products. Those differences include, but are not limited to, different types of targeted investors; being subject to different laws and regulations; different legal structures; different average account sizes and portfolio management techniques made necessary by different cash flows and different associated costs; and the time spent by portfolio managers and their teams, funds financial services, legal, compliance and risk management in reviewing securities pricing, addressing different administrative responsibilities, addressing different degrees of risk associated with management and a variety of different costs. The Senior Officer did not consider these fee schedules to be determinative in judging the appropriateness of mutual fund advisory fees.
The Senior Officer noted that the services, administrative responsibilities and risks associated with such relationships is quite different than serving as a primary adviser to a fund.
Annual Shareholder Report
The Fund's ability to deliver competitive performance when compared to its peer group was also deemed to be relevant by the Board as a useful indicator of how the Adviser is executing the Fund's investment program, which in turn was one of the Board's considerations in reaching a conclusion that the nature, extent, and quality of the Adviser's investment management services were such as to warrant continuation of the advisory contract.
The Senior Officer reviewed information compiled by Federated, using data supplied by independent fund ranking organizations, regarding the performance of, and fees charged by, other mutual funds, noting his view that comparisons to fund peer groups may be helpful, though not conclusive, in judging the reasonableness of the proposed fees. The Board considered, in evaluating such comparisons, that in some cases individual funds may exhibit significant and unique differences in their objectives and management techniques when compared to other funds within an industry peer group.
For the periods covered by the Evaluation, the Fund's performance for the one-year period was above the median of the relevant peer group, and the Fund's performance fell below the median of the relevant peer group for the three-year and five-year periods. The Board discussed the Fund's performance with the Adviser and recognized the efforts being undertaken by the Adviser. The Board will continue to monitor these efforts and the performance of the Fund in the context of the other factors considered relevant by the Board.
The Board also received financial information about Federated, including information regarding the compensation and benefits Federated derived from its relationships with the Federated funds. This information covered not only the fees under the advisory contracts, but also fees received by Federated's subsidiaries for providing other services to the Federated funds under separate contracts (e.g., for serving as the Federated funds' administrator). The information also detailed any indirect benefit Federated may derive from its receipt of research services from brokers who execute Federated fund trades. In addition, the Board considered the fact that, in order for a fund to be competitive in the marketplace, Federated and its affiliates frequently waived fees and/or reimbursed expenses and have disclosed to fund investors and/or indicated to the Board their intention to do so in the future, where appropriate. Moreover, the Board receives regular reporting as to the institution, adjustment or elimination of these voluntary waivers.
In addition, over the past two years, following discussions regarding the Senior Officer's recommendations, Federated made meaningful reductions to the contractual advisory fees for several Funds. At the Board meeting in May 2015, following previous recommendations of the Senior Officer, Federated proposed, and the Board approved, reductions in the contractual advisory fees of certain other Funds.
Annual Shareholder Report
Federated furnished information, requested by the Senior Officer, that reported revenues on a fund-by-fund basis and made estimates of the allocation of expenses on a fund-by-fund basis, using allocation methodologies specified by the Senior Officer. The Senior Officer noted that, while these cost allocation reports apply consistent allocation processes, the inherent difficulties in allocating costs continues to cause the Senior Officer to question the precision of the process and to conclude that such reports may be unreliable, since a single change in an allocation estimate may dramatically alter the resulting estimate of cost and/or profitability of a fund and may produce unintended consequences. The allocation information, including the Senior Officer's view that fund-by-fund estimations may be unreliable, was considered in the analysis by the Board.
The Board and the Senior Officer also reviewed information compiled by Federated comparing profitability information for Federated to other publicly held fund management companies. In this regard, the Senior Officer concluded that Federated's profit margins did not appear to be excessive. The Senior Officer also noted that Federated appeared financially sound, with the resources to fulfill its obligations under its contracts with the Funds.
The Senior Officer's Evaluation also discussed the notion of possible realization of “economies of scale” as a fund grows larger. The Board considered in this regard that the Adviser has made significant and long-term investments in areas that support all of the Federated family of funds, such as personnel and processes for the portfolio management, shareholder services, compliance, internal audit, and risk management functions; and systems technology; and that the benefits of these efforts (as well as any economies of scale, should they exist) were likely to be enjoyed by the fund family as a whole. Federated, as it does throughout the year, and again in connection with the Board's review, furnished information relative to revenue sharing or adviser paid fees. Federated and the Senior Officer noted that this information should be viewed to determine if there was an incentive to either not apply breakpoints or to apply breakpoints at higher levels and should not be viewed to determining the appropriateness of advisory fees, because it would represent marketing and distribution expenses. Finally, the Board also noted the absence of any applicable regulatory or industry guidelines on this subject, which (as discussed in the Senior Officer's Evaluation) is compounded by the lack of any common industry practice or general pattern with respect to structuring fund advisory fees with “breakpoints” that serve to reduce the fee as the fund attains a certain size.
The Senior Officer noted that, subject to the comments and recommendations made within his Evaluation, his observations and the information accompanying the Evaluation supported a finding by the Board that the management fees for each of the funds were reasonable. Under these circumstances, no changes were recommended to, and no objection was raised to, the continuation of the Fund's advisory contract.
Annual Shareholder Report
In its decision to continue an existing investment advisory contract, the Board was mindful of the potential disruptions of the Fund's operations and various risks, uncertainties and other effects that could occur as a result of a decision to terminate or not renew an advisory contract. In particular, the Board recognized that many shareholders have invested in the Fund on the strength of the Adviser's industry standing and reputation and with the expectation that the Adviser will have a continuing role in providing advisory services to the Fund. Thus, the Board's approval of the advisory contract reflected the fact that it is the shareholders who have effectively selected the Adviser by virtue of having invested in the Fund. The Board concluded that, in light of the factors discussed above, including the nature, quality and scope of the services provided to the Fund by the Adviser and its affiliates, continuation of the advisory contract was appropriate.
The Board based its decision to approve the advisory contract on the totality of the circumstances and relevant factors and with a view to past and future long-term considerations. Not all of the factors and considerations identified above were necessarily relevant to the Fund, nor did the Board consider any one of them to be determinative. With respect to the factors that were relevant, the Board's decision to approve the contract reflects its determination that Federated's performance and actions provided a satisfactory basis to support the decision to continue the existing arrangements.
Annual Shareholder Report
Voting Proxies on Fund Portfolio Securities
A description of the policies and procedures that the Fund uses to determine how to vote proxies, if any, relating to securities held in the Fund's portfolio is available, without charge and upon request, by calling 1-800-341-7400. A report on “Form N-PX” of how the Fund voted any such proxies during the most recent 12-month period ended June 30 is available via the Proxy Voting Record (Form N-PX) link associated with the Fund and share class name at www.FederatedInvestors.com/FundInformation. Form N-PX filings are also available at the SEC's website at www.sec.gov.
Quarterly Portfolio Schedule
The Fund files with the SEC a complete schedule of its portfolio holdings, as of the close of the first and third quarters of its fiscal year, on “Form N-Q.” These filings are available on the SEC's website at www.sec.gov and may be reviewed and copied at the SEC's Public Reference Room in Washington, DC. (Call 1-800-SEC-0330 for information on the operation of the Public Reference Room.) You may also access this information via the link to the Fund and share class name at www.FederatedInvestors.com/FundInformation.
Annual Shareholder Report
Mutual funds are not bank deposits or obligations, are not guaranteed by any bank and are not insured or guaranteed by the U.S. government, the Federal Deposit Insurance Corporation, the Federal Reserve Board or any other government agency. Investment in mutual funds involves investment risk, including the possible loss of principal.
This Report is authorized for distribution to prospective investors only when preceded or accompanied by the Fund's Prospectus, which contains facts concerning its objective and policies, management fees, expenses and other information.
Federated Strategic Value Dividend Fund
Federated Investors Funds
4000 Ericsson Drive
Warrendale, PA 15086-7561
Contact us at FederatedInvestors.com
or call 1-800-341-7400.
Federated Securities Corp., Distributor
CUSIP 314172586
CUSIP 314172578
CUSIP 314172560
33982 (12/15)
Federated is a registered trademark of Federated Investors, Inc.
2015 ©Federated Investors, Inc.
Annual Shareholder Report
October 31, 2015
| Share Class | Ticker |
| A | FDRAX |
| Institutional | FDRIX |
Federated Managed Risk Fund
Fund Established 2013
A Portfolio of Federated Equity Funds
Dear Valued Shareholder,
I am pleased to present the Annual Shareholder Report for your fund covering the period from November 1, 2014 through October 31, 2015. This report includes Management's Discussion of Fund Performance, a complete listing of your fund's holdings, performance information and financial statements along with other important fund information.
In addition, our website, FederatedInvestors.com, offers easy access to Federated resources that include timely fund updates, economic and market insights from our investment strategists, and financial planning tools. We invite you to register to take full advantage of its capabilities.
Thank you for investing with Federated. I hope you find this information useful and look forward to keeping you informed.
Sincerely,
J. Christopher Donahue, President
Not FDIC Insured • May Lose Value • No Bank Guarantee
CONTENTS
| 1 |
| 6 |
| 7 |
| 17 |
| 19 |
| 21 |
| 23 |
| 24 |
| 38 |
| 39 |
| 41 |
| 47 |
| 53 |
| 53 |
Management's Discussion of Fund Performance (unaudited)
The total return of Federated Managed Risk Fund (the “Fund”), based on net asset value for the 12-month reporting period ended October 31, 2015, was -5.03% for the Class A Shares and -4.91% for the Institutional Shares. The total returns of the MSCI All Country World Index1 and the Barclays U.S. Universal Index2 were -0.03% and 1.67%, respectively. Weighting these benchmarks (60% MSCI All Country World Index and 40% Barclays U.S. Universal Index), the total return of the blended benchmark (Blended Index)3 was 0.86%. The Lipper Alternative Global Macro Funds Average (LAGMFA)4 had a total return of -3.95% for the same period. The Fund's and LAGMFA's total returns reflected actual cash flows, transaction costs and other expenses, which were not reflected in the total return of the Blended Index.
During this period, the Fund's investment strategy was affected by: (a) the Fund's targeted neutral asset allocation; (b) tactical allocation relative to these neutral points; (c) the security selection of the underlying Funds; and (d) the Fund's tactical overlay. The tactical overlay was the most significant factor affecting the Fund's performance relative to the Blended Index.
The following discussion will focus on the performance of the Fund's Institutional Shares.
MARKET OVERVIEW
The reporting period was best categorized as an oscillating market environment caused by multiple macro-economic headlines. The most notable was the uncertainty of the timing of the Federal Reserve's (the “Fed”) target interest rate hike in the third quarter of 2015, which caused the S&P 500 Index (S&P 500) to decline -10.18% in just four short trading days ending August 25th. Despite the potential rate-hike, U.S. yields fell during the reporting period, boosting bond returns. U.S. equities continued to outperform those of the rest of the world, as well as fixed income, with the S&P 500 returning 5.20% compared with the -0.07% return of the MSCI EAFE Index5 and the 1.96% return of the Barclays U.S. Aggregate Bond Index.6 Given supply increases, soft demand and a strong U.S. Dollar, commodity prices fell significantly, as measured by the -30.42% return of the DBIQ Optimum Yield Diversified Commodity Index.7 Benign inflation expectations led to underperformance of the Treasury Inflation-Protected Securities (TIPS) asset class, as the total return of U.S. TIPS, as measured by the Barclays U.S. TIPS Index,8 was -1.24%.
Market volatility started and ended the reporting period at about the same level, with the Chicago Board Options Exchange (CBOE) Volatility Index (VIX),9 a measure of implied forward volatility of the S&P 500, moving from 14.03 to 15.07. This slight rise in the VIX belied the large swings of volatility during the year, with geopolitical fears escalating in late December 2014, the Greek debt crisis in June 2015, and China growth concerns and Fed rate hike
Annual Shareholder Report
fears in August 2015. In the first instance, the closing VIX peaked at 23.57 on December 16, 2014, before dropping down as low as 14.37 on December 24, 2014; another peak occurred in June at 18.85, following Greek debt fears; however, both of these were dwarfed by the 40.74 peak on August 24, 2015, the highest level since August 2011.
By the end of the reporting period, the VIX had decreased to five-year median levels; however, many headline risks remained.
NEUTRAL ASSET ALLOCATION
The diversified10 neutral allocation, which was intended to provide resilience in down markets, was tilted toward fixed-income investments relative to the Blended Index. Also, the fixed-income portion of the Fund11 held TIPS, commodities and floating rate notes for inflation protection, which underperformed fixed-rate bonds. The diversified mix succeeded in having a lower volatility than that of the benchmark, but it moderated returns over the reporting period.
TACTICAL ALLOCATION
The Fund was overweight domestic equities and underweight commodities, which added value during the reporting period.
SECURITY SELECTION
Security selection in our Domestic Small-Cap Value Equity sleeve and the International Equity12 sleeve added to performance. This was partially offset by negative security selection in the Fund's Fixed Income sleeve.
TACTICAL OVERLAY
The Fund uses an S&P 500 futures13 overlay to raise beta in calm markets and to reduce Fund risk in markets with unusually high volatility. During the reporting period, the volatility of the market, as measured by the VIX, oscillated between nearly five-year lows and five-year highs, spiking three times, in December, June and August. During these times of heightened volatility, the Fund acted to remove its equity overlay position and, in January and August, entered short positions to hedge the neutral weight equity. Other than those three time periods of heightened volatility, the Fund maintained a positive equity overlay during the reporting period. The overlay detracted value, mostly during the quick pullback in August. At the end of the reporting period, the Fund had a slightly positive overlay.
Annual Shareholder Report
| 1 | Please see the footnotes to the line graphs under “Fund Performance and Growth of a $10,000 Investment” below for the definition of, and more information about, the MSCI All Country World Index. |
| 2 | Please see the footnotes to the line graphs under “Fund Performance and Growth of a $10,000 Investment” below for the definition of, and more information about, the Barclays U.S. Universal Index. |
| 3 | Please see the footnotes to the line graphs under “Fund Performance and Growth of a $10,000 Investment” below for the definition of, and more information about, the Blended Index. The Blended Index is being used for comparison purposes because, although it is not the Fund's broad-based securities market index, the Fund's Adviser believes it more closely reflects the market sectors in which the Fund invests. The total return of the S&P 500 Index, the Fund's broad-based securities market index, was 5.20%. |
| 4 | Lipper figures represent the average of the total returns reported by all the mutual funds designated by Lipper Inc. as falling into the respective categories indicated. They do not reflect sales charges. |
| 5 | The MSCI EAFE Index is a free float-adjusted market capitalization weighted index that is designed to measure the equity market performance of developed markets outside of North America (Europe, Australasia and the Far East). As of November 2013, the MSCI EAFE Index consisted of 21 developed market country indices. The developed market country indices included are: Australia, Austria, Belgium, Denmark, Finland, France, Germany, Hong Kong, Ireland, Israel, Italy, Japan, Netherlands, New Zealand, Norway, Portugal, Singapore, Spain, Sweden, Switzerland and the United Kingdom. The index is unmanaged, and it is not possible to invest directly in an index. |
| 6 | The Barclays U.S. Aggregate Bond Index is an unmanaged index composed of securities from the Barclays Government/Corporate Bond Index, Mortgage-Backed Securities Index and the Asset-Backed Securities Index. Total return comprises price appreciation/depreciation and income as a percentage of the original investment. Indices are rebalanced monthly by market capitalization. The index is unmanaged, and it is not possible to invest directly in an index. |
| 7 | The DBIQ Optimum Yield Diversified Commodity Index is based on 14 commodities drawn from the energy, precious metals, industrial metals and agriculture sectors. The index is unmanaged, and it is not possible to invest directly in an index. |
| 8 | The Barclays U.S. TIPS Index represents a market index made up of U.S. TIPS. The index is unmanaged, and it is not possible to invest directly in an index. |
| 9 | The CBOE Volatility Index® (VIX®) is a key measure of market expectations of near-term volatility conveyed by S&P 500 stock index option prices. The index is unmanaged, and it is not possible to invest directly in an index. |
| 10 | Diversification does not assure a profit nor protect against loss. |
| 11 | Bond prices are sensitive to changes in interest rates, and a rise in interest rates can cause a decline in their prices. |
| 12 | International investing involves special risks including currency risk, increased volatility, political risks and differences in auditing and other financial standards. |
| 13 | The Fund's use of derivative instruments involves risks different from, or possibly greater than, the risks associated with investing directly in securities or other traditional instruments. |
Annual Shareholder Report
FUND PERFORMANCE AND GROWTH OF A $10,000 INVESTMENT
The graph below illustrates the hypothetical investment of $10,0001 in the Federated Managed Risk Fund from December 16, 2013 (start of performance) to October 31, 2015, compared to the Standard & Poor's 500 Index (S&P 500),2 60% MSCI All Country World Index/40% Barclays U.S. Universal Index (Blended Index)3 and the Lipper Alternative Global Macro Funds Average (LAGMFA).4 The Average Annual Total Return table below shows returns for each class averaged over the stated periods.
Growth of a $10,000 Investment
Growth of $10,000 as of October 31, 2015
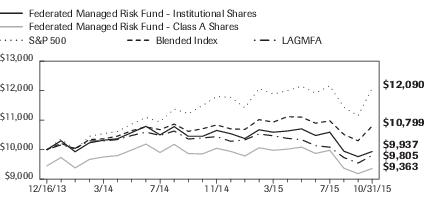
| Federated Managed Risk Fund - | Institutional Shares | Class A Shares | S&P 500 | Blended Index | LAGMFA |
| F | F | I | I | I |
| 12/16/2013 | 10,000 | 9,450 | 10,000 | 10,000 | 10,000 |
| 12/31/2013 | 10,300 | 9,733 | 10,354 | 10,214 | 10,160 |
| 1/31/2014 | 9,929 | 9,382 | 9,996 | 10,023 | 10,045 |
| 2/28/2014 | 10,229 | 9,667 | 10,453 | 10,342 | 10,297 |
| 3/31/2014 | 10,320 | 9,752 | 10,541 | 10,366 | 10,291 |
| 4/30/2014 | 10,370 | 9,799 | 10,619 | 10,459 | 10,344 |
| 5/31/2014 | 10,580 | 9,989 | 10,868 | 10,643 | 10,479 |
| 6/30/2014 | 10,791 | 10,188 | 11,093 | 10,770 | 10,593 |
| 7/31/2014 | 10,500 | 9,904 | 10,940 | 10,678 | 10,481 |
| 8/31/2014 | 10,781 | 10,179 | 11,378 | 10,866 | 10,631 |
| 9/30/2014 | 10,450 | 9,866 | 11,218 | 10,620 | 10,360 |
| 10/31/2014 | 10,450 | 9,856 | 11,492 | 10,707 | 10,397 |
| 11/30/2014 | 10,651 | 10,046 | 11,801 | 10,837 | 10,441 |
| 12/31/2014 | 10,540 | 9,940 | 11,771 | 10,704 | 10,282 |
| 1/31/2015 | 10,376 | 9,785 | 11,418 | 10,685 | 10,333 |
| 2/28/2015 | 10,673 | 10,065 | 12,074 | 11,017 | 10,530 |
| 3/31/2015 | 10,591 | 9,978 | 11,883 | 10,933 | 10,470 |
| 4/30/2015 | 10,632 | 10,017 | 11,997 | 11,118 | 10,382 |
| 5/31/2015 | 10,704 | 10,085 | 12,151 | 11,102 | 10,339 |
| 6/30/2015 | 10,479 | 9,872 | 11,916 | 10,895 | 10,133 |
| 7/31/2015 | 10,591 | 9,978 | 12,166 | 10,977 | 10,085 |
| 8/31/2015 | 9,947 | 9,370 | 11,432 | 10,513 | 9,731 |
| 9/30/2015 | 9,763 | 9,187 | 11,149 | 10,301 | 9,545 |
| 10/31/2015 | 9,937 | 9,363 | 12,090 | 10,799 | 9,805 |
41 graphic description end -->
| ■ | Total returns shown for Class A Shares include the maximum sales charge of 5.50% ($10,000 investment minus $550 sales charge = $9,450). |
The Fund offers multiple share classes whose performance may be greater than or less than its other share class(es) due to differences in sales charges and expenses.
Average Annual Total Returns for the Period Ended 10/31/2015
(returns reflect all applicable sales charges and contingent deferred sales charges as specified below in footnote #1)
| | 1 Year | Start of
Performance* |
| Class A Shares | -10.29% | -3.45% |
| Institutional Shares | -4.91% | -0.34% |
| S&P 500 | 5.20% | 10.66% |
| Blended Index | 0.86% | 4.19% |
| LAGMFA | -3.95% | -1.34% |
| * | The Fund's start of performance date was December 16, 2013. |
Annual Shareholder Report
Performance data quoted represents past performance which is no guarantee of future results. Investment return and principal value will fluctuate so that an investor's shares, when redeemed, may be worth more or less than their original cost. Mutual fund performance changes over time and current performance may be lower or higher than what is stated. For current to the most recent month-end performance and after-tax returns, visit FederatedInvestors.com or call 1-800-341-7400. Returns shown do not reflect the deduction of taxes that a shareholder would pay on Fund distributions or the redemption of Fund shares. Mutual funds are not obligations of or guaranteed by any bank and are not federally insured.
| 1 | Represents a hypothetical investment of $10,000 in the Fund after deducting the applicable sales charge: for Class A Shares, the maximum sales charge of 5.50% ($10,000 investment minus $550 sales charge = $9,450). The Fund's performance assumes the reinvestment of all dividends and distributions. The S&P 500, Blended Index and the LAGMFA have been adjusted to reflect reinvestment of dividends on securities in the index and the average. |
| 2 | The S&P 500 Index, a broad-based securities market index of the Fund, is an unmanaged capitalization weighted index of 500 stocks designed to measure performance of the broad domestic economy through changes in the aggregate market value of 500 stocks representing all major industries. The S&P 500 is unmanaged and, unlike the Fund, is not affected by cash flows. It is not possible to invest directly in an index. The S& P 500 is not adjusted to reflect sales charges, expenses or other fees that the Securities and Exchange Commission (SEC) requires to be reflected in the Fund's performance. |
| 3 | The Blended Index is comprised of 60% MSCI All Country World Index and 40% Barclays U.S. Universal Index. The MSCI All Country World Index captures large- and mid-cap representation across 23 developed markets countries and 23 emerging markets countries. With 2,449 constituents, the index covers approximately 85% of the global investable equity opportunity set. The Barclays U.S. Universal Index covers USD-denominated, taxable bonds that are rated either investment grade or high-yield. The indexes are unmanaged and, unlike the Fund, are not affected by cash flows. It is not possible to invest directly in an index. The indexes are not adjusted to reflect sales charges, expenses or other fees that the SEC requires to be reflected in the Fund's performance. |
| 4 | The LAGMFA represents the average of the total returns reported by all of the mutual funds designated by Lipper, Inc. as falling in the category indicated, and is not adjusted to reflect any sales charges. However, these total returns are reported net of expenses or other fees that the SEC requires to be reflected in a fund's performance. |
Annual Shareholder Report
Portfolio of Investments Summary Table (unaudited)
At October 31, 2015, the Fund's portfolio composition1 was as follows:
| Sector | Percentage of
Total Net Assets |
| Securities Sold Short | (0.8)% |
| Derivative Contracts—Short (notional value)2 | (0.6)% |
| Domestic Equity Securities | 31.5% |
| International Equity Securities | 18.5% |
| Domestic Fixed-Income Securities | 10.4% |
| Trade Finance Agreements | 9.3% |
| U.S. Treasury Securities | 5.5% |
| U.S. Government Agency Mortgage-Backed Securities | 2.7% |
| International Fixed-Income Securities | 1.9% |
| Adjustment for Derivative Contracts (notional value)2 | 0.6% |
| Floating Rate Loan | 0.6% |
| Foreign Governments/Agencies | 0.4% |
| Non-Agency Mortgage-Backed Securities | 0.4% |
| Asset-Backed Securities | 0.2% |
| Derivative Contracts3 | 0.2% |
| Other Security Types4 | 7.0% |
| Cash Equivalents5 | 13.0% |
| Other Assets and Liabilities—Net6 | (0.8)% |
| TOTAL | 100.0% |
| 1 | See the Fund's Prospectus for a description of the principal types of securities in which the Fund invests. As of the date specified above, the Fund owned shares of one or more affiliated investment companies. For purposes of this table, the affiliated investment company (other than an affiliated money market mutual fund) is not treated as a single portfolio security, but rather the Fund is treated as owning a pro rata portion of each security and each other asset and liability owned by the affiliated investment company. Accordingly, the percentages of total net assets shown in the table will differ from those presented on the Portfolio of Investments. |
| 2 | Represents the notional value of S&P 500 futures contracts held by the Federated Prudent Bear Fund. |
| 3 | Based upon net unrealized appreciation (depreciation) or value of the derivative contracts as applicable. Derivative contracts may consist of futures, forwards, options and swaps. The impact of a derivative contract on the Fund's performance may be larger than its unrealized appreciation (depreciation) or value may indicate. In many cases, the notional value or amount of a derivative contract may provide a better indication of the contract's significance to the portfolio. More complete information regarding the Fund's direct investments in derivative contracts, including unrealized appreciation (depreciation), value, and notional values or amounts of such contracts, can be found in the table at the end of the Portfolio of Investments included in this Report. |
| 4 | Other Security Types consist of exchange-traded funds, purchased put options, purchased call options, rights and warrants. |
| 5 | Cash Equivalents include any investments in money market mutual funds and/or overnight repurchase agreements. |
| 6 | Assets, other than investments in securities and derivative contracts, less liabilities. See Statement of Assets and Liabilities. |
Annual Shareholder Report
Portfolio of Investments
October 31, 2015
Shares,
Principal
Amount or
Contracts | | | Value |
| | | COMMON STOCKS—30.8% | |
| | | Consumer Discretionary—2.3% | |
| 251 | 1 | Ascena Retail Group, Inc. | $3,343 |
| 328 | 1 | Belmond Ltd. | 3,523 |
| 165 | | Best Buy Co., Inc. | 5,780 |
| 219 | | Big Lots, Inc. | 10,096 |
| 130 | | Darden Restaurants, Inc. | 8,046 |
| 94 | 1 | Deckers Outdoor Corp. | 5,232 |
| 40 | | Delphi Automotive PLC | 3,328 |
| 131 | 1 | Diamond Resorts International, Inc. | 3,726 |
| 166 | 1 | Eros International PLC | 1,854 |
| 25 | | Home Depot, Inc. | 3,091 |
| 56 | | Kohl's Corp. | 2,583 |
| 177 | | La-Z-Boy, Inc. | 5,053 |
| 170 | | Lowe's Cos., Inc. | 12,551 |
| 246 | | M.D.C. Holdings, Inc. | 6,393 |
| 120 | | Mens Wearhouse, Inc. | 4,798 |
| 142 | | Pulte Group, Inc. | 2,603 |
| 175 | | Sinclair Broadcast Group, Inc. | 5,252 |
| 572 | | Staples, Inc. | 7,430 |
| 121 | 1 | Starz Series A | 4,055 |
| 85 | | TJX Cos., Inc. | 6,221 |
| 353 | 1 | TRI Pointe Group, Inc. | 4,582 |
| 75 | | Target Corp. | 5,788 |
| 84 | 1 | Tenneco, Inc. | 4,753 |
| | | TOTAL | 120,081 |
| | | Consumer Staples—2.1% | |
| 215 | | Altria Group, Inc. | 13,001 |
| 209 | | Archer-Daniels-Midland Co. | 9,543 |
| 283 | | CVS Health Corp. | 27,955 |
| 115 | | Energizer Holdings, Inc. | 4,926 |
| 755 | | Koninklijke Ahold NV- ADR | 15,312 |
| 33 | | PepsiCo, Inc. | 3,372 |
| 167 | | Philip Morris International, Inc. | 14,763 |
| 520 | 1 | SUPERVALU, Inc. | 3,416 |
Annual Shareholder Report
Shares,
Principal
Amount or
Contracts | | | Value |
| | | COMMON STOCKS—continued | |
| | | Consumer Staples—continued | |
| 51 | | Spectrum Brands Holdings, Inc. | $4,888 |
| 69 | 1 | TreeHouse Foods, Inc. | 5,909 |
| 240 | | Vector Group Ltd. | 5,820 |
| | | TOTAL | 108,905 |
| | | Energy—2.7% | |
| 103 | | Baker Hughes, Inc. | 5,426 |
| 87 | | ENI S.p.A, ADR | 2,836 |
| 260 | | Marathon Petroleum Corp. | 13,468 |
| 1,274 | 1 | McDermott International, Inc. | 5,873 |
| 214 | 1 | Newfield Exploration Co. | 8,600 |
| 117 | 1 | PDC Energy, Inc. | 7,060 |
| 58 | | Royal Dutch Shell PLC | 3,043 |
| 243 | | Schlumberger Ltd. | 18,993 |
| 1,520 | | Technip SA | 19,988 |
| 160 | | Teekay Corp. | 5,141 |
| 256 | | Tesoro Petroleum Corp. | 27,374 |
| 64 | | Total SA, ADR | 3,087 |
| 312 | | Valero Energy Corp. | 20,567 |
| | | TOTAL | 141,456 |
| | | Financials—10.2% | |
| 178 | | American Equity Investment Life Holding Co. | 4,571 |
| 122 | | American Financial Group, Inc., Ohio | 8,807 |
| 686 | | American International Group, Inc. | 43,259 |
| 206 | | Argo Group International Holdings Ltd. | 12,879 |
| 152 | | Assurant, Inc. | 12,393 |
| 1,441 | | Bank of America Corp. | 24,180 |
| 652 | | CNO Financial Group, Inc. | 12,525 |
| 51 | | Capital One Financial Corp. | 4,024 |
| 276 | | Corporate Office Properties Trust | 6,348 |
| 138 | | Digital Realty Trust, Inc. | 10,206 |
| 185 | | Discover Financial Services | 10,401 |
| 333 | | Duke Realty Corp. | 6,893 |
| 106 | | EPR Properties | 6,022 |
| 237 | | Fidelity & Guaranty Life | 6,328 |
| 375 | | First Potomac Realty Trust | 4,421 |
| 270 | | Flushing Financial Corp. | 5,681 |
Annual Shareholder Report
Shares,
Principal
Amount or
Contracts | | | Value |
| | | COMMON STOCKS—continued | |
| | | Financials—continued | |
| 52 | | Goldman Sachs Group, Inc. | $9,750 |
| 444 | | Great Western Bancorp, Inc. | 12,547 |
| 178 | | Hanover Insurance Group, Inc. | 14,996 |
| 797 | | Hartford Financial Services Group, Inc. | 36,869 |
| 423 | 1 | Hilltop Holdings, Inc. | 8,870 |
| 812 | | Hospitality Properties Trust | 21,794 |
| 622 | | Investors Bancorp, Inc. | 7,781 |
| 571 | | J.P. Morgan Chase & Co. | 36,687 |
| 131 | | LaSalle Hotel Properties | 3,853 |
| 1,016 | | Lexington Realty Trust | 8,981 |
| 260 | | Lincoln National Corp. | 13,913 |
| 368 | | Maiden Holdings Ltd. | 5,722 |
| 854 | | Morgan Stanley | 28,156 |
| 812 | | New Residential Investment Corp. | 9,850 |
| 387 | | NorthStar Realty Finance Corp. | 4,648 |
| 152 | | Opus Bank | 5,662 |
| 137 | | PNC Financial Services Group | 12,366 |
| 44 | | PartnerRe Ltd. | 6,116 |
| 215 | | Popular, Inc. | 6,358 |
| 183 | | Provident Financial Services, Inc. | 3,719 |
| 15 | | Public Storage | 3,442 |
| 301 | | Radian Group, Inc. | 4,355 |
| 368 | | Retail Properties of America, Inc. | 5,509 |
| 147 | | STORE Capital Corp. | 3,332 |
| 384 | | Starwood Property Trust, Inc. | 7,715 |
| 283 | | Starwood Waypoint Residential Trust | 6,962 |
| 77 | | Sun Communities, Inc. | 5,160 |
| 309 | | Synovus Financial Corp. | 9,774 |
| 525 | | TCF Financial Corp. | 8,080 |
| 352 | | Talmer Bancorp, Inc., Class A | 5,921 |
| 89 | | Tanger Factory Outlet Centers, Inc. | 3,111 |
| 153 | | The Bank of New York Mellon Corp. | 6,372 |
| 402 | | Umpqua Holdings Corp. | 6,713 |
| 292 | | WSFS Financial Corp. | 9,277 |
| 55 | | Wells Fargo & Co. | 2,978 |
| | | TOTAL | 526,277 |
Annual Shareholder Report
Shares,
Principal
Amount or
Contracts | | | Value |
| | | COMMON STOCKS—continued | |
| | | Health Care—3.6% | |
| 183 | | Aetna, Inc. | $21,005 |
| 189 | 1 | Alere, Inc. | 8,717 |
| 84 | | Amgen, Inc. | 13,287 |
| 78 | | Anthem, Inc. | 10,854 |
| 192 | | Cardinal Health, Inc. | 15,782 |
| 144 | | Gilead Sciences, Inc. | 15,571 |
| 77 | | GlaxoSmithKline PLC, ADR | 3,316 |
| 255 | | Johnson & Johnson | 25,763 |
| 98 | 1 | Magellan Health, Inc. | 5,233 |
| 131 | 1 | Medicines Co. | 4,485 |
| 224 | | Merck & Co., Inc. | 12,244 |
| 186 | | Pfizer, Inc. | 6,290 |
| 43 | | St. Jude Medical, Inc. | 2,744 |
| 409 | | Teva Pharmaceutical Industries, Ltd., ADR | 24,209 |
| 48 | | UnitedHealth Group, Inc. | 5,653 |
| 78 | 1 | Wellcare Health Plans, Inc. | 6,911 |
| 226 | 1 | Wright Medical Group NV | 4,368 |
| | | TOTAL | 186,432 |
| | | Industrials—3.3% | |
| 191 | | Actuant Corp. | 4,355 |
| 163 | | Alaska Air Group, Inc. | 12,429 |
| 175 | | Barnes Group, Inc. | 6,578 |
| 156 | | Boeing Co. | 23,099 |
| 43 | | Caterpillar, Inc. | 3,139 |
| 97 | | Curtiss Wright Corp. | 6,747 |
| 134 | | Delta Air Lines, Inc. | 6,813 |
| 200 | | Deluxe Corp. | 11,910 |
| 366 | | Donnelley (R.R.) & Sons Co. | 6,174 |
| 86 | | Dun & Bradstreet Corp. | 9,793 |
| 56 | | Eaton Corp PLC | 3,131 |
| 155 | 1 | FTI Consulting, Inc. | 5,272 |
| 202 | | General Cable Corp. | 3,109 |
| 158 | | General Dynamics Corp. | 23,476 |
| 186 | | Hexcel Corp. | 8,615 |
| 230 | | KBR, Inc. | 4,241 |
| 33 | | Lockheed Martin Corp. | 7,254 |
Annual Shareholder Report
Shares,
Principal
Amount or
Contracts | | | Value |
| | | COMMON STOCKS—continued | |
| | | Industrials—continued | |
| 71 | | Manpower Group, Inc. | $6,516 |
| 110 | | Masco Corp. | 3,190 |
| 32 | | Northrop Grumman Corp. | 6,008 |
| 29 | | Parker-Hannifin Corp. | 3,036 |
| 71 | | Republic Services, Inc. | 3,105 |
| 40 | | Unifirst Corp. | 4,203 |
| | | TOTAL | 172,193 |
| | | Information Technology—3.5% | |
| 223 | | Apple, Inc. | 26,648 |
| 591 | | Atmel Corp. | 4,492 |
| 145 | | Avnet, Inc. | 6,587 |
| 438 | | Brooks Automation, Inc. | 4,835 |
| 118 | | CA, Inc. | 3,270 |
| 315 | 1 | CIENA Corp. | 7,604 |
| 801 | | Cisco Systems, Inc. | 23,109 |
| 340 | | Computer Sciences Corp. | 22,641 |
| 1,088 | | EMC Corp. Mass | 28,527 |
| 216 | 1 | Fairchild Semiconductor International, Inc., Class A | 3,603 |
| 211 | | Hewlett-Packard Co. | 5,689 |
| 109 | | Intel Corp. | 3,691 |
| 19 | | International Business Machines Corp. | 2,662 |
| 142 | | Lam Research Corp. | 10,876 |
| 128 | 1 | Marketo, Inc. | 3,767 |
| 155 | | Maxim Integrated Products, Inc. | 6,352 |
| 2,855 | 1 | Quantum Corp. | 2,398 |
| 145 | 1 | Unisys Corp. | 1,943 |
| 125 | 1 | Veeco Instruments, Inc. | 2,252 |
| 112 | 1 | Verint Systems, Inc. | 5,329 |
| 72 | 1 | ViaSat, Inc. | 4,749 |
| | | TOTAL | 181,024 |
| | | Materials—0.8% | |
| 136 | | Ashland, Inc. | 14,922 |
| 212 | | Avery Dennison Corp. | 13,774 |
| 278 | 1 | Berry Plastics Group, Inc. | 9,313 |
| 65 | | Dow Chemical Co. | 3,358 |
| | | TOTAL | 41,367 |
Annual Shareholder Report
Shares,
Principal
Amount or
Contracts | | | Value |
| | | COMMON STOCKS—continued | |
| | | Telecommunication Services—0.8% | |
| 217 | | BCE, Inc. | $9,376 |
| 241 | | CenturyLink, Inc. | 6,799 |
| 527 | | Verizon Communications | 24,706 |
| | | TOTAL | 40,881 |
| | | Utilities—1.5% | |
| 271 | | Aqua America, Inc. | 7,751 |
| 189 | | Atmos Energy Corp. | 11,907 |
| 166 | | Duke Energy Corp. | 11,864 |
| 143 | | Entergy Corp. | 9,747 |
| 237 | | NRG Energy, Inc. | 3,055 |
| 97 | | Pinnacle West Capital Corp. | 6,160 |
| 209 | | Portland General Electric Co. | 7,750 |
| 315 | | Public Service Enterprises Group, Inc. | 13,006 |
| 251 | | TECO Energy, Inc. | 6,777 |
| | | TOTAL | 78,017 |
| | | TOTAL COMMON STOCKS
(IDENTIFIED COST $1,510,082) | 1,596,633 |
| | | ASSET-BACKED SECURITIES—0.1% | |
| | | Auto Receivables—0.0% | |
| $470 | | Santander Drive Auto Receivables Trust 2014-3, A2B, 0.461%, 08/15/2017 | 470 |
| | | Credit Card—0.1% | |
| 4,999 | | Capital One Multi Asset Execution Trust 2014-A4, A4, 0.516%, 06/15/2022 | 5,003 |
| | | TOTAL ASSET-BACKED SECURITIES
(IDENTIFIED COST $5,470) | 5,473 |
| | | COMMERCIAL MORTGAGE-BACKED SECURITY—0.2% | |
| | | Commercial Mortgage—0.2% | |
| 10,000 | | WF-RBS Commercial Mortgage Trust 2014-C25 AS,
3.984%, 11/15/2047
(IDENTIFIED COST $10,799) | 10,325 |
| | | CORPORATE BONDS—0.3% | |
| | | Consumer Cyclical - Automotive—0.1% | |
| 5,000 | | American Honda Finance Co, Unsecd. Deb., Series MTN, 2.250%, 8/15/2019 | 5,018 |
| | | Consumer Cyclical - Retailers—0.0% | |
| 2,000 | | Wal-Mart Stores, Inc., Sr. Unsecd. Note, 3.300%, 04/22/2024 | 2,080 |
Annual Shareholder Report
Shares,
Principal
Amount or
Contracts | | | Value |
| | | CORPORATE BONDS—continued | |
| | | Financial Institution - Banking—0.1% | |
| $5,000 | | Comerica, Inc., 3.800%, 7/22/2026 | $4,970 |
| | | Technology—0.1% | |
| 5,000 | | Adobe Systems, Inc., Sr. Unsecd. Note, 3.250%, 2/01/2025 | 4,952 |
| | | TOTAL CORPORATE BONDS
(IDENTIFIED COST $17,014) | 17,020 |
| | | U.S. TREASURIES—5.1% | |
| | | U.S. Treasury Bonds—1.8% | |
| 9,109 | | U.S. Treasury Inflation-Protected Bond, 0.750%, 2/15/2045 | 8,109 |
| 27,618 | | U.S. Treasury Inflation-Protected Bond, 2.000%, 1/15/2026 | 31,070 |
| 17,077 | | U.S. Treasury Inflation-Protected Bond, Series TIPS of, 1.375%, 2/15/2044 | 17,750 |
| 34,129 | | U.S. Treasury Inflation-Protected Bond, Series TIPS of, 1.750%, 1/15/2028 | 37,945 |
| | | TOTAL | 94,874 |
| | | U.S. Treasury Notes—3.3% | |
| 20,620 | | U.S. Treasury Inflation-Protected Note, 0.125%, 4/15/2018 | 20,638 |
| 24,016 | | U.S. Treasury Inflation-Protected Note, 2.000%, 1/15/2016 | 23,983 |
| 4,086 | | U.S. Treasury Inflation-Protected Note, Series A-2024, 0.625%, 1/15/2024 | 4,083 |
| 32,784 | | U.S. Treasury Inflation-Protected Note, Series D-2020, 1.250%, 7/15/2020 | 34,370 |
| 15,361 | | U.S. Treasury Inflation-Protected Note, Series D-2023, 0.375%, 7/15/2023 | 15,153 |
| 22,082 | | U.S. Treasury Inflation-Protected Note, Series D-2024, 0.125%, 7/15/2024 | 21,176 |
| 23,754 | | U.S. Treasury Inflation-Protected Note, Series W-2016, 0.125%, 4/15/2016 | 23,592 |
| 27,281 | | U.S. Treasury Inflation-Protected Note, Series X-2017, 0.125%, 4/15/2017 | 27,248 |
| | | TOTAL | 170,243 |
| | | TOTAL U.S. TREASURIES
(IDENTIFIED COST $267,466) | 265,117 |
| | | EXCHANGE-TRADED FUNDS—6.0% | |
| | | Financials—6.0% | |
| 2,034 | | iShares Dow Jones U.S. Real Estate Index Fund | 153,282 |
| 6,802 | 1 | PowerShares DB Commodity Index Tracking Fund | 103,390 |
| 250 | | SPDR S&P 500 ETF Trust | 51,983 |
| | | TOTAL EXCHANGE-TRADED FUNDS
(IDENTIFIED COST $344,035) | 308,655 |
Annual Shareholder Report
Shares,
Principal
Amount or
Contracts | | | Value |
| | | PURCHASED CALL OPTIONS—1.0% | |
| 38 | | CBOE SPX Volatility Index (CALL-Option) Strike Price: 20; Expiration Date: 12/16/2015 | $5,225 |
| 20 | | SPDR S&P 500 ETF Trust (CALL-Option) Strike Price: 200; Expiration Date: 6/17/2016 | 29,840 |
| 15 | | SPDR S&P 500 ETF Trust (CALL-Option) Strike Price: 210; Expiration Date: 3/18/2016 | 8,978 |
| 20 | | SPDR S&P 500 ETF Trust (CALL-Option) Strike Price: 210; Expiration Date: 12/19/2015 | 5,840 |
| | | TOTAL PURCHASED CALL OPTIONS
(IDENTIFIED COST $38,577) | 49,883 |
| | | INVESTMENT COMPANIES—57.9%2 | |
| 705 | | Emerging Markets Fixed Income Core Fund | 24,314 |
| 2,914 | | Federated Bank Loan Core Fund | 28,991 |
| 12,198 | | Federated Emerging Markets Equity Fund, Institutional Shares | 100,878 |
| 49,953 | | Federated Intermediate Corporate Bond Fund, Institutional Shares | 464,559 |
| 28,670 | | Federated International Leaders Fund, Class R6 Shares | 940,367 |
| 8,206 | | Federated Kaufmann Large Cap Fund, Class R6 Shares | 156,976 |
| 15,908 | | Federated Mortgage Core Portfolio | 157,963 |
| 321,370 | | Federated Prime Value Obligations Fund, Institutional Shares, 0.16%3 | 321,370 |
| 61,028 | | Federated Project and Trade Finance Core Fund | 570,612 |
| 34,500 | | Federated Prudent Bear Fund, Institutional Shares | 74,865 |
| 26,519 | | High Yield Bond Portfolio | 163,356 |
| | | TOTAL INVESTMENT COMPANIES
(IDENTIFIED COST $3,072,957) | 3,004,251 |
| | | TOTAL INVESTMENTS—101.4%
(IDENTIFIED COST $5,266,400)4 | 5,257,357 |
| | | OTHER ASSETS AND LIABILITIES - NET—(1.4)%5 | (73,032) |
| | | TOTAL NET ASSETS—100% | $5,184,325 |
Annual Shareholder Report
At October 31, 2015, the Fund had the following outstanding futures contracts:
| Description | Number of
Contracts | Notional
Value | Expiration
Date | Unrealized
Appreciation
(Depreciation) |
| 1S&P 500 E-Mini Index Long Futures | 2 | $207,370 | December 2015 | $888 |
| 1United States Long Bond Long Futures | 1 | $156,437 | December 2015 | $(2,994) |
| 1United States Treasury Notes 2-Year Long Futures | 1 | $218,656 | December 2015 | $(80) |
| 1United States Treasury Notes 5-Year Short Futures | 3 | $359,320 | December 2015 | $759 |
| NET UNREALIZED DEPRECIATION ON FUTURES CONTRACTS | $(1,427) |
At October 31, 2015, the Fund had the following outstanding written options:
| Security | Expiration
Date | Exercise
Price | Contracts | Value |
CBOE SPX Volatility Index (CALL-Option)
(PREMIUMS PAID $2,817) | December 2015 | $30 | 38 | $(1,710) |
Net Unrealized Depreciation on Futures Contracts and Written Options Contract is included in “Other Assets and Liabilities—Net.”
| 1 | Non-income-producing security. |
| 2 | Affiliated holdings. |
| 3 | 7-day net yield. |
| 4 | The cost of investments for federal tax purposes amounts to $5,303,367. |
| 5 | Assets, other than investments in securities, less liabilities. See Statement of Assets and Liabilities. |
Note: The categories of investments are shown as a percentage of total net assets at October 31, 2015.
Various inputs are used in determining the value of the Fund's investments. These inputs are summarized in the three broad levels listed below:
Level 1—quoted prices in active markets for identical securities.
Level 2—other significant observable inputs (including quoted prices for similar securities, interest rates, prepayment speeds, credit risk, etc.). Also includes securities valued at amortized cost.
Level 3—significant unobservable inputs (including the Fund's own assumptions in determining the fair value of investments).
The inputs or methodology used for valuing securities are not an indication of the risk associated with investing in those securities.
Annual Shareholder Report
The following is a summary of the inputs used, as of October 31, 2015, in valuing the Fund's assets carried at fair value:
| Valuation Inputs | | | | |
| | Level 1—
Quoted
Prices | Level 2—
Other
Significant
Observable
Inputs | Level 3—
Significant
Unobservable
Inputs | Total |
| Equity Securities: | | | | |
| Common Stocks | | | | |
| International | $1,450,275 | $— | $— | $1,450,275 |
| Domestic | 146,358 | — | — | 146,358 |
| Debt Securities: | | | | |
| Asset-Backed Securities | — | 5,473 | — | 5,473 |
| Commercial Mortgage-Backed Security | — | 10,325 | — | 10,325 |
| Corporate Bonds | — | 17,020 | — | 17,020 |
| U.S. Treasuries | — | 265,117 | — | 265,117 |
| Exchange-Traded Funds | 308,655 | — | — | 308,655 |
| Purchased Call Options | 49,883 | — | — | 49,883 |
| Investment Companies1 | 2,059,015 | 945,2362 | — | 3,004,251 |
| TOTAL SECURITIES | $4,014,186 | $1,243,171 | $— | $5,257,357 |
| OTHER FINANCIAL INSTRUMENTS3 | $(3,137) | $— | $— | $(3,137) |
| 1 | Emerging Markets Fixed Income Core Fund, Federated Bank Loan Core Fund, Federated Mortgage Core Portfolio, Federated Project and Trade Finance Core Fund and High Yield Bond Portfolio are affiliated holdings offered only to registered investment companies and other accredited investors. Investments in these funds are deemed Level 2 due to the fact that the net asset value (the NAV) is not publicly available and, with respect to Federated Project and Trade Finance Core Fund, due to the fact that the price of shares redeemed may be determined as of the closing NAV of the fund up to twenty-four days after receipt of a shareholder redemption request. |
| 2 | Includes $387,001 of affiliated investment company holdings transferred from Level 1 to Level 2 because the Adviser determined that these investments more appropriately meet the definition of Level 2. Transfers shown represent the value of the investments at the beginning of the period. |
| 3 | Other financial instruments include futures contracts and written options. |
The following acronyms are used throughout this portfolio:
| ADR | —American Depositary Receipt |
| MTN | —Medium Term Note |
| TIPS | —Treasury Inflation-Protected Notes |
See Notes which are an integral part of the Financial Statements
Annual Shareholder Report
Financial Highlights–Class A Shares
(For a Share Outstanding Throughout Each Period)
| | Year Ended
10/31/2015 | Period
Ended
10/31/20141 |
| Net Asset Value, Beginning of Period | $10.40 | $10.00 |
| Income From Investment Operations: | | |
| Net investment income | 0.12 | 0.102 |
| Net realized and unrealized gain (loss) on investments, futures contracts, written options and foreign currency transactions | (0.63) | 0.33 |
| TOTAL FROM INVESTMENT OPERATIONS | (0.51) | 0.43 |
| Less Distributions: | | |
| Distributions from net investment income | (0.12) | (0.03) |
| Distributions from net realized gain on investments, futures contracts, written options and foreign currency transactions | (0.07) | — |
| TOTAL DISTRIBUTIONS | (0.19) | (0.03) |
| Net Asset Value, End of Period | $9.70 | $10.40 |
| Total Return3 | (5.03)% | 4.30% |
| Ratios to Average Net Assets: | | |
| Net expenses | 0.94% | 0.98%4 |
| Net investment income | 1.23% | 1.11%4 |
| Expense waiver/reimbursement5 | 5.82% | 7.68%4 |
| Supplemental Data: | | |
| Net assets, end of period (000 omitted) | $396 | $270 |
| Portfolio turnover | 92% | 95% |
| 1 | Reflects operations for the period from December 16, 2013 (date of initial investment) to October 31, 2014. |
| 2 | Per share number has been calculated using the average shares method. |
| 3 | Based on net asset value, which does not reflect the sales charge, redemption fee or contingent deferred sales charge, if applicable. Total returns for periods of less than one year are not annualized. |
| 4 | Computed on an annualized basis. |
| 5 | This expense decrease is reflected in both the net expense and the net investment income ratios shown above. |
See Notes which are an integral part of the Financial Statements
Annual Shareholder Report
Financial Highlights–Institutional Shares
(For a Share Outstanding Throughout Each Period)
| | Year Ended
10/31/2015 | Period
Ended
10/31/20141 |
| Net Asset Value, Beginning of Period | $10.42 | $10.00 |
| Income From Investment Operations: | | |
| Net investment income | 0.15 | 0.132 |
| Net realized and unrealized gain (loss) on investments, futures contracts, written options and foreign currency transactions | (0.65) | 0.32 |
| TOTAL FROM INVESTMENT OPERATIONS | (0.50) | 0.45 |
| Less Distributions: | | |
| Distributions from net investment income | (0.13) | (0.03) |
| Distributions from net realized gain on investments, futures contracts, written options and foreign currency transactions | (0.07) | — |
| TOTAL DISTRIBUTIONS | (0.20) | (0.03) |
| Net Asset Value, End of Period | $9.72 | $10.42 |
| Total Return3 | (4.91)% | 4.50% |
| Ratios to Average Net Assets: | | |
| Net expenses | 0.72% | 0.73%4 |
| Net investment income | 1.43% | 1.45%4 |
| Expense waiver/reimbursement5 | 5.82% | 9.09%4 |
| Supplemental Data: | | |
| Net assets, end of period (000 omitted) | $4,788 | $4,125 |
| Portfolio turnover | 92% | 95% |
| 1 | Reflects operations for the period from December 16, 2013 (date of initial investment) to October 31, 2014. |
| 2 | Per share number has been calculated using the average shares method. |
| 3 | Based on net asset value. Total returns for periods of less than one year are not annualized. |
| 4 | Computed on an annualized basis. |
| 5 | This expense decrease is reflected in both the net expense and the net investment income ratios shown above. |
See Notes which are an integral part of the Financial Statements
Annual Shareholder Report
Statement of Assets and Liabilities
October 31, 2015
| Assets: | | |
| Total investment in securities, at value including $3,004,251 of investment in affiliated holdings (Note 5) (identified cost $5,266,400) | | $5,257,357 |
| Cash denominated in foreign currencies (identified cost $28,446) | | 25,934 |
| Restricted cash (Note 2) | | 11,663 |
| Income receivable | | 2,943 |
| Receivable for investments sold | | 22,060 |
| TOTAL ASSETS | | 5,319,957 |
| Liabilities: | | |
| Payable for investments purchased | $64,300 | |
| Written options outstanding, at value (premium paid $2,817) | 1,710 | |
| Bank overdraft | 106 | |
| Payable for daily variation margin | 375 | |
| Payable to adviser (Note 5) | 651 | |
| Payable for auditing fees | 29,850 | |
| Payable for legal fees | 3,430 | |
| Payable for portfolio accounting fees | 13,901 | |
| Payable for other service fees (Notes 2 and 5) | 396 | |
| Payable for share registration costs | 12,164 | |
| Payable for insurance premiums | 4,287 | |
| Accrued expenses (Note 5) | 4,462 | |
| TOTAL LIABILITIES | | 135,632 |
| Net assets for 533,236 shares outstanding | | $5,184,325 |
| Net Assets Consist of: | | |
| Paid-in capital | | $5,464,179 |
| Net unrealized depreciation of investments, futures contracts, written options and translation of assets and liabilities in foreign currency | | (11,879) |
| Accumulated net realized loss on investments, futures contracts, written options and foreign currency transactions | | (323,064) |
| Undistributed net investment income | | 55,089 |
| TOTAL NET ASSETS | | $5,184,325 |
Annual Shareholder Report
Statement of Assets and Liabilities–continued
| Net Asset Value, Offering Price and Redemption Proceeds Per Share | | |
| Class A Shares: | | |
| Net asset value per share ($395,990 ÷ 40,827 shares outstanding), no par value, unlimited shares authorized | | $9.70 |
| Offering price per share (100/94.50 of $9.70) | | $10.26 |
| Redemption proceeds per share | | $9.70 |
| Institutional Shares: | | |
| Net asset value per share ($4,788,335 ÷ 492,409 shares outstanding), no par value, unlimited shares authorized | | $9.72 |
| Offering price per share | | $9.72 |
| Redemption proceeds per share | | $9.72 |
See Notes which are an integral part of the Financial Statements
Annual Shareholder Report
Statement of Operations
Year Ended October 31, 2015
| Investment Income: | | | |
| Dividends (including $61,555 received from affiliated holdings (Note 5) and net of foreign taxes withheld of $806) | | | $109,239 |
| Interest | | | 2,913 |
| Investment income allocated from affiliated partnership (Note 5) | | | 1,263 |
| TOTAL INCOME | | | 113,415 |
| Expenses: | | | |
| Investment adviser fee (Note 5) | | $39,539 | |
| Administrative fee (Note 5) | | 129,127 | |
| Custodian fees | | 23,592 | |
| Transfer agent fee | | 4,649 | |
| Directors'/Trustees' fees (Note 5) | | 628 | |
| Auditing fees | | 29,850 | |
| Legal fees | | 11,759 | |
| Portfolio accounting fees | | 56,929 | |
| Other service fees (Notes 2 and 5) | | 911 | |
| Share registration costs | | 37,445 | |
| Printing and postage | | 5,077 | |
| Miscellaneous (Note 5) | | 6,420 | |
| TOTAL EXPENSES | | 345,926 | |
Annual Shareholder Report
Statement of Operations–continued
| Waiver and Reimbursements (Note 5): | | | |
| Waiver/reimbursement of investment adviser fee | $(39,539) | | |
| Reimbursement of other operating expenses | (267,457) | | |
| TOTAL WAIVER AND REIMBURSEMENTS | | $(306,996) | |
| Net expenses | | | $38,930 |
| Net investment income | | | 74,485 |
| Realized and Unrealized Gain (Loss) on Investments, Futures Contracts, Written Options and Foreign Currency Transactions: | | | |
| Net realized loss on investments and foreign currency transactions (including realized loss of $(16,873) on sales of investments in affiliated holdings (Note 5)) | | | (86,374) |
| Net realized loss on futures contracts | | | (227,774) |
| Net realized loss on written options | | | (80) |
| Net realized loss on investments and foreign currency transactions allocated from affiliated partnership (Note 5) | | | (1,271) |
| Realized gain distribution from affiliated investment company shares (Note 5) | | | 1,397 |
| Net change in unrealized appreciation of investments and translation of assets and liabilities in foreign currency | | | (40,702) |
| Net change in unrealized depreciation of futures contracts | | | (1,295) |
| Net change in unrealized depreciation of written options | | | 1,107 |
| Net realized and unrealized loss on investments, futures contracts, written options and foreign currency transactions | | | (354,992) |
| Change in net assets resulting from operations | | | $(280,507) |
See Notes which are an integral part of the Financial Statements
Annual Shareholder Report
Statement of Changes in Net Assets
| | Year Ended
10/31/2015 | Period Ended
10/31/20141 |
| Increase (Decrease) in Net Assets | | |
| Operations: | | |
| Net investment income | $74,485 | $43,442 |
| Net realized gain (loss) on investments including allocation from affiliated partnership, futures contracts, written options and foreign currency transactions | (314,102) | 17,734 |
| Net change in unrealized appreciation/depreciation of investments, futures contracts, written options and translation of assets and liabilities in foreign currency | (40,890) | 29,011 |
| CHANGE IN NET ASSETS RESULTING FROM OPERATIONS | (280,507) | 90,187 |
| Distributions to Shareholders: | | |
| Distributions from net investment income | | |
| Class A Shares | (4,534) | (0)2 |
| Institutional Shares | (55,140) | (2,951) |
| Distributions from net realized gain on investments, futures contracts, written options and foreign currency transactions | | |
| Class A Shares | (2,215) | — |
| Institutional Shares | (24,694) | — |
| CHANGE IN NET ASSETS RESULTING FROM DISTRIBUTIONS TO SHAREHOLDERS | (86,583) | (2,951) |
| Share Transactions: | | |
| Proceeds from sale of shares | 1,366,630 | 4,368,261 |
| Net asset value of shares issued to shareholders in payment of distributions declared | 85,855 | 2,950 |
| Cost of shares redeemed | (296,545) | (62,972) |
| CHANGE IN NET ASSETS RESULTING FROM SHARE TRANSACTIONS | 1,155,940 | 4,308,239 |
| Change in net assets | 788,850 | 4,395,475 |
| Net Assets: | | |
| Beginning of period | 4,395,475 | — |
| End of period (including undistributed net investment income of $55,089 and $39,823, respectively) | $5,184,325 | $4,395,475 |
| 1 | Reflects operations for the period from December 16, 2013 (date of initial investment) to October 31, 2014. |
| 2 | Represents less than $1. |
See Notes which are an integral part of the Financial Statements
Annual Shareholder Report
Notes to Financial Statements
October 31, 2015
1. ORGANIZATION
Federated Equity Funds (the “Trust”) is registered under the Investment Company Act of 1940, as amended (the “Act”), as a diversified, open-end management investment company. Due to changes in the Commodity Futures Trading Commission's interpretation of the Commodity Exchange Act, Federated Global Investment Management Corp., Federated Investment Management Company and Federated Equity Management Company of Pennsylvania (collectively, the “Co-Advisers”) each became registered as a “commodity pool operator” with respect to operation of the Fund. The Trust consists of 14 diversified portfolios. The financial statements included herein are only those of Federated Managed Risk Fund (the “Fund”). The financial statements of the other portfolios are presented separately. The assets of each portfolio are segregated and a shareholder's interest is limited to the portfolio in which shares are held. Each portfolio pays its own expenses. The Fund offers two classes of shares: Class A Shares and Institutional Shares. All shares of the Fund have equal rights with respect to voting, except on class-specific matters. The investment objective of the Fund is to provide long-term total return.
The Fund commenced operations on December 16, 2013.
2. SIGNIFICANT ACCOUNTING POLICIES
The following is a summary of significant accounting policies consistently followed by the Fund in the preparation of its financial statements. These policies are in conformity with U.S. generally accepted accounting principles (GAAP).
Investment Valuation
In calculating its net asset value (NAV), the Fund generally values investments as follows:
| ■ | Equity securities including shares of exchange-traded funds listed on an exchange or traded through a regulated market system are valued at their last reported sale price or official closing price in their principal exchange or market. |
| ■ | Shares of other mutual funds or non-exchange-traded investment companies are valued based upon their reported NAVs. |
| ■ | Fixed-income securities acquired with remaining maturities greater than 60 days are fair valued using price evaluations provided by a pricing service approved by the Fund's Board of Trustees (the “Trustees”). |
| ■ | Fixed-income securities and repurchase agreements acquired with remaining maturities of 60 days or less are valued at their cost (adjusted for the accretion of any discount or amortization of any premium), unless the issuer's creditworthiness is impaired or other factors indicate that amortized cost is not an accurate estimate of the investment's fair value, in which case it would be valued in the same manner as a longer-term security. |
| ■ | Derivative contracts listed on exchanges are valued at their reported settlement or closing price, except that options are valued at the mean of closing bid and asked quotations. |
| ■ | Over-the-counter (OTC) derivative contracts are fair valued using price evaluations provided by a pricing service approved by the Trustees. |
| ■ | For securities that are fair valued in accordance with procedures established by and under the general supervision of the Trustees, certain factors may be considered such as: the last traded or purchase price of the security, information obtained by contacting the issuer or dealers, analysis of the issuer's financial statements or other available documents, fundamental analytical data, the nature and duration of restrictions on disposition, the |
Annual Shareholder Report
| | movement of the market in which the security is normally traded, public trading in similar securities or derivative contracts of the issuer or comparable issuers, movement of a relevant index, or other factors including but not limited to industry changes and relevant government actions. |
If any price, quotation, price evaluation or other pricing source is not readily available when the NAV is calculated, or if the Fund cannot obtain price evaluations from a pricing service or from more than one dealer for an investment within a reasonable period of time as set forth in the Fund's valuation policies and procedures, the Fund uses the fair value of the investment determined in accordance with the procedures described below. There can be no assurance that the Fund could obtain the fair value assigned to an investment if it sold the investment at approximately the time at which the Fund determines its NAV per share.
Fair Valuation and Significant Events Procedures
The Trustees have ultimate responsibility for determining the fair value of investments for which market quotations are not readily available. The Trustees have appointed a valuation committee (“Valuation Committee”) comprised of officers of the Fund, the Co-Advisers and certain of the Co-Adviser's affiliated companies to assist in determining fair value and in overseeing the calculation of the NAV. The Trustees have also authorized the use of pricing services recommended by the Valuation Committee to provide fair value evaluations of the current value of certain investments for purposes of calculating the NAV. The Valuation Committee employs various methods for reviewing third-party pricing-service evaluations including periodic reviews of third-party pricing services' policies, procedures and valuation methods (including key inputs, methods, models and assumptions), transactional back-testing, comparisons of evaluations of different pricing services, and review of price challenges by the Co-Advisers based on recent market activity. In the event that market quotations and price evaluations are not available for an investment, the Valuation Committee determines the fair value of the investment in accordance with procedures adopted by the Trustees. The Trustees periodically review and approve the fair valuations made by the Valuation Committee and any changes made to the procedures.
Factors considered by pricing services in evaluating an investment include the yields or prices of investments of comparable quality, coupon, maturity, call rights and other potential prepayments, terms and type, reported transactions, indications as to values from dealers and general market conditions. Some pricing services provide a single price evaluation reflecting the bid-side of the market for an investment (a “bid” evaluation). Other pricing services offer both bid evaluations and price evaluations indicative of a price between the prices bid and asked for the investment (a “mid” evaluation). The Fund normally uses bid evaluations for any U.S. Treasury and Agency securities, mortgage-backed securities and municipal securities. The Fund normally uses mid evaluations for any other types of fixed-income securities and any OTC derivative contracts. In the event that market quotations and price evaluations are not available for an investment, the fair value of the investment is determined in accordance with procedures adopted by the Trustees.
The Trustees also have adopted procedures requiring an investment to be priced at its fair value whenever the Co-Advisers determine that a significant event affecting the value of the investment has occurred between the time as of which the price of the investment would otherwise be determined and the time as of which the NAV is computed. An event is considered significant if there is both an affirmative expectation that the investment's value
Annual Shareholder Report
will change in response to the event and a reasonable basis for quantifying the resulting change in value. Examples of significant events that may occur after the close of the principal market on which a security is traded, or after the time of a price evaluation provided by a pricing service or a dealer, include:
| ■ | With respect to securities traded principally in foreign markets, significant trends in U.S. equity markets or in the trading of foreign securities index futures contracts; |
| ■ | Political or other developments affecting the economy or markets in which an issuer conducts its operations or its securities are traded; |
| ■ | Announcements concerning matters such as acquisitions, recapitalizations, litigation developments, or a natural disaster affecting the issuer's operations or regulatory changes or market developments affecting the issuer's industry. |
The Trustees have adopted procedures whereby the Valuation Committee uses a pricing service to determine the fair value of equity securities traded principally in foreign markets when the Co-Advisers determine that there has been a significant trend in the U.S. equity markets or in index futures trading. For other significant events, the Fund may seek to obtain more current quotations or price evaluations from alternative pricing sources. If a reliable alternative pricing source is not available, the Fund will determine the fair value of the investment in accordance with the fair valuation procedures approved by the Trustees. The Trustees have ultimate responsibility for any fair valuations made in response to a significant event.
Repurchase Agreements
The Fund may invest in repurchase agreements for short-term liquidity purposes. It is the policy of the Fund to require the other party to a repurchase agreement to transfer to the Fund's custodian or sub-custodian eligible securities or cash with a market value (after transaction costs) at least equal to the repurchase price to be paid under the repurchase agreement. The eligible securities are transferred to accounts with the custodian or sub-custodian in which the Fund holds a “securities entitlement” and exercises “control” as those terms are defined in the Uniform Commercial Code. The Fund has established procedures for monitoring the market value of the transferred securities and requiring the transfer of additional eligible securities if necessary to equal at least the repurchase price. These procedures also allow the other party to require securities to be transferred from the account to the extent that their market value exceeds the repurchase price or in exchange for other eligible securities of equivalent market value.
The insolvency of the other party or other failure to repurchase the securities may delay the disposition of the underlying securities or cause the Fund to receive less than the full repurchase price. Under the terms of the repurchase agreement, any amounts received by the Fund in excess of the repurchase price and related transaction costs must be remitted to the other party.
The Fund may enter into repurchase agreements in which eligible securities are transferred into joint trading accounts maintained by the custodian or sub-custodian for investment companies and other clients advised by the Fund's Co-Advisers and its affiliates. The Fund will participate on a pro rata basis with the other investment companies and clients in its share of the securities transferred under such repurchase agreements and in its share of proceeds from any repurchase or other disposition of such securities.
Annual Shareholder Report
Investment Income, Gains and Losses, Expenses and Distributions
Investment transactions are accounted for on a trade-date basis. Realized gains and losses from investment transactions are recorded on an identified-cost basis. Interest income and expenses are accrued daily. Dividend income and distributions to shareholders are recorded on the ex-dividend date. Foreign dividends are recorded on the ex-dividend date or when the Fund is informed of the ex-dividend date. Positive or negative inflation adjustments on Treasury Inflation-Protected Securities (TIPS) are included in interest income. Distributions of net investment income are declared and paid annually. Non-cash dividends included in dividend income, if any, are recorded at fair value. The Fund invests in Emerging Markets Fixed Income Core Fund (EMCORE), a portfolio of Federated Core Trust II, L.P., which is a limited partnership established under the laws of the state of Delaware. The Fund records daily its proportionate share of income, expenses, realized and unrealized gains and losses from EMCORE. Investment income, realized and unrealized gains and losses, and certain fund-level expenses are allocated to each class based on relative average daily net assets, except that Class A Shares may bear distribution services fees and other service fees unique to that class.
Dividends are declared separately for each class. No class has preferential dividend rights; differences in per share dividend rates are generally due to differences in separate class expenses.
Other Service Fees
The Fund may pay other service fees up to 0.25% of the average daily net assets of the Fund's Class A Shares to unaffiliated financial intermediaries or to Federated Shareholder Services Company (FSSC) for providing services to shareholders and maintaining shareholder accounts. Subject to the terms described in the Expense Limitation note, FSSC may voluntarily reimburse the Fund for other service fees. For the year ended October 31, 2015, other service fees for the Fund were as follows:
| | Other
Service Fees
Incurred |
| Class A Shares | $911 |
Premium and Discount Amortization
All premiums and discounts on fixed-income securities are amortized/accreted using the effective-interest-rate method.
Federal Taxes
It is the Fund's policy to comply with the Subchapter M provision of the Internal Revenue Code (the “Code”) and to distribute to shareholders each year substantially all of its income. Accordingly, no provision for federal income tax is necessary. As of and during the year ended October 31, 2015, the Fund did not have a liability for any uncertain tax positions. The Fund recognizes interest and penalties, if any, related to tax liabilities as income tax expense in the Statement of Operations. As of October 31, 2015, tax years 2014 and 2015 remain subject to examination by the Fund's major tax jurisdictions, which include the United States of America and the Commonwealth of Massachusetts.
The Fund may be subject to taxes imposed by governments of countries in which it invests. Such taxes are generally based on either income or gains earned or repatriated. The Fund accrues and applies such taxes to net investment income, net realized gains and net unrealized gains as income and/or gains are earned.
Annual Shareholder Report
When-Issued and Delayed-Delivery Transactions
The Fund may engage in when-issued or delayed-delivery transactions. The Fund records when-issued securities on the trade date and maintains security positions such that sufficient liquid assets will be available to make payment for the securities purchased. Securities purchased on a when-issued or delayed-delivery basis are marked to market daily and begin earning interest on the settlement date. Losses may occur on these transactions due to changes in market conditions or the failure of counterparties to perform under the contract.
Futures Contracts
The Fund purchases and sells financial futures contracts to manage duration and yield curve risks. Upon entering into a financial futures contract with a broker, the Fund is required to deposit in a segregated account a specified amount of cash or U.S. government securities. Futures contracts are valued daily and unrealized gains or losses are recorded in a “variation margin” account. Daily, the Fund receives from or pays to the broker a specified amount of cash based upon changes in the variation margin account. When a contract is closed, the Fund recognizes a realized gain or loss. Futures contracts have market risks, including the risk that the change in the value of the contract may not correlate with the changes in the value of the underlying securities. There is minimal counterparty risk to the Fund since futures are exchange traded and the exchange's clearing house, as counterparty to all exchange traded futures, guarantees the futures against default.
Futures contracts outstanding at period end are listed after the Fund's Portfolio of Investments.
The average notional value of long and short futures contracts held by the Fund throughout the period was $1,078,976 and $422,483, respectively. This is based on amounts held as of each month-end throughout the fiscal period.
Foreign Exchange Contracts
The Fund enters into foreign exchange contracts to manage duration and yield curve risks. Purchased contracts are used to acquire exposure to foreign currencies, whereas, contracts to sell are used to hedge the Fund's securities against currency fluctuations. Risks may arise upon entering into these transactions from the potential inability of counterparties to meet the terms of their commitments and from unanticipated movements in security prices or foreign exchange rates. The foreign exchange contracts are adjusted by the daily exchange rate of the underlying currency and any gains or losses are recorded for financial statement purposes as unrealized until the settlement date.
At October 31, 2015, the Fund had no outstanding foreign exchange contracts.
Foreign Currency Translation
The accounting records of the Fund are maintained in U.S. dollars. All assets and liabilities denominated in foreign currencies (FCs) are translated into U.S. dollars based on the rates of exchange of such currencies against U.S. dollars on the date of valuation. Purchases and sales of securities, income and expenses are translated at the rate of exchange quoted on the respective date that such transactions are recorded. The Fund does not isolate that portion of the results of operations resulting from changes in foreign exchange rates on investments from the fluctuations arising from changes in market prices of securities held. Such fluctuations are included with the net realized and unrealized gain or loss from investments.
Annual Shareholder Report
Reported net realized foreign exchange gains or losses arise from sales of portfolio securities, sales and maturities of short-term securities, sales of FCs, currency gains or losses realized between the trade and settlement dates on securities transactions, the difference between the amounts of dividends, interest and foreign withholding taxes recorded on the Fund's books, and the U.S. dollar equivalent of the amounts actually received or paid. Net unrealized foreign exchange gains and losses arise from changes in the value of assets and liabilities other than investments in securities at fiscal year end, resulting from changes in the exchange rate.
Option Contracts
The Fund buys or sells put and call options to increase return and manage market risk. The seller (“writer”) of an option receives a payment or premium, from the buyer, which the writer keeps regardless of whether the buyer exercises the option. When the Fund writes a put or call option, an amount equal to the premium received is recorded as a liability and subsequently marked to market to reflect the current value of the option written. Premiums received from writing options which expire are treated as realized gains. The Fund, as a writer of an option, bears the market risk of an unfavorable change in the price of the underlying reference instrument. When the Fund purchases a put or call option, an amount equal to the premium paid is recorded as an increase to the cost of the investment and subsequently marked to market to reflect the current value of the option purchased. Premiums paid for purchasing options which expire are treated as realized losses. Premiums received/paid for writing/purchasing options which are exercised or closed are added to the proceeds or offset against amounts paid on the underlying reference instrument to determine the realized gain or loss. The risk associated with purchasing put and call options is limited to the premium paid. Options can trade on securities or commodities exchanges. In this case, the exchange sets all the terms of the contract except for the price. Most exchanges require investors to maintain margin accounts through their brokers to cover their potential obligations to the exchange. This protects investors against potential defaults by the counterparty.
The following is a summary of the Fund's written option activity:
| Contracts | Number of
Contracts | Premium |
| Outstanding at October 31, 2014 | — | $— |
| Contracts written | 38 | 2,817 |
| Outstanding at October 31, 2015 | 38 | $2,817 |
Written options outstanding at period end are listed after the Fund's Portfolio of Investments.
The average market value of purchased put and call options held by the Fund throughout the period was $23,967. This is based on amounts held as of each month-end throughout the fiscal period.
The average market value of written options held by the Fund throughout the period was $132. This is based on amounts held as of each month-end throughout the fiscal period.
Annual Shareholder Report
Additional Disclosure Related to Derivative Instruments
| Fair Value of Derivative Instruments |
| | Asset | Liability |
| | Statement of
Assets and
Liabilities
Location | Fair
Value | Statement of
Assets and
Liabilities
Location | Fair
Value |
Derivatives not accounted for as hedging
instruments under ASC Topic 815 | | | | |
| Interest rate contracts | Purchased options,
at value | $5,225 | Written options
outstanding, at value | $1,710 |
| Interest rate contracts | — | — | Payable for daily
variation margin | $2,315* |
| Equity contracts | Purchased options,
at value | $44,658 | — | — |
| Equity contracts | — | — | Payable for daily
variation margin | $(888)* |
Total derivatives not accounted for as
hedging instruments
under ASC Topic 815 | | $49,883 | | $3,137 |
| * | Includes cumulative depreciation of futures contracts as reported in the footnotes to the Portfolio of Investments. Only the current day's variation margin is reported within the Statement of Assets and Liabilities. |
The Effect of Derivative Instruments on the Statement of Operations for the Year Ended October 31, 2015
| Amount of Realized Gain or (Loss) on Derivatives Recognized in Income |
| | Futures | Purchased
Options | Written
Options | Total |
| Interest rate contracts | $(1,596) | $— | $(80) | $(1,676) |
| Equity contracts | (226,178) | (27,601) | — | (253,779) |
| TOTAL | $(227,774) | $(27,601) | $(80) | $(255,455) |
| Change in Unrealized Appreciation or (Depreciation) on Derivatives Recognized in Income |
| | Futures | Purchased
Options | Written
Options | Total |
| Interest rate contracts | $(2,183) | $(3,016) | $1,107 | $(4,092) |
| Equity contracts | 888 | 14,322 | — | 15,210 |
| TOTAL | $(1,295) | $11,306 | $1,107 | $11,118 |
Other
The preparation of financial statements in conformity with GAAP requires management to make estimates and assumptions that affect the amounts of assets, liabilities, expenses and revenues reported in the financial statements. Actual results could differ from those estimated. The Fund applies Investment Company accounting and reporting guidance.
Annual Shareholder Report
3. SHARES OF BENEFICIAL INTEREST
The following tables summarize share activity:
| | Year Ended
10/31/2015 | Period Ended
10/31/20141 |
| Class A Shares: | Shares | Amount | Shares | Amount |
| Shares sold | 43,380 | $450,630 | 31,849 | $332,007 |
| Shares issued to shareholders in payment of distributions declared | 650 | 6,747 | — | — |
| Shares redeemed | (29,165) | (296,439) | (5,887) | (62,865) |
NET CHANGE RESULTING FROM
CLASS A SHARE TRANSACTIONS | 14,865 | $160,938 | 25,962 | $269,142 |
| | Year Ended
10/31/2015 | Period Ended
10/31/20141 |
| Institutional Shares: | Shares | Amount | Shares | Amount |
| Shares sold | 88,799 | $916,000 | 395,728 | $4,036,254 |
| Shares issued to shareholders in payment of distributions declared | 7,614 | 79,108 | 288 | 2,950 |
| Shares redeemed | (10) | (106) | (10) | (107) |
NET CHANGE RESULTING FROM
INSTITUTIONAL SHARE TRANSACTIONS | 96,403 | $995,002 | 396,006 | $4,039,097 |
NET CHANGE RESULTING FROM
TOTAL FUND SHARE TRANSACTIONS | 111,268 | $1,155,940 | 421,968 | $4,308,239 |
| 1 | Reflects operations for the period from December 16, 2013 (date of initial investment) to October 31, 2014. |
4. FEDERAL TAX INFORMATION
The timing and character of income and capital gain distributions are determined in accordance with income tax regulations, which may differ from GAAP. These differences are primarily due to foreign currency transactions, short-term capital gain distributions from registered investment companies, allocated investment income from partnerships and discount accretion/premium amortization on debt securities.
For the year ended October 31, 2015, permanent differences identified and reclassified among the components of net assets were as follows:
| Increase (Decrease) |
Undistributed
Net Investment
Income (Loss) | Accumulated
Net Realized
Gain (Loss) |
| $455 | $(455) |
Net investment income (loss), net realized gains (losses), and net assets were not affected by this reclassification.
Annual Shareholder Report
The tax character of distributions as reported on the Statement of Changes in Net Assets for the year ended October 31, 2015 and for the period ended October 31, 2014, was as follows:
| | 2015 | 2014 |
| Ordinary income1 | $65,150 | $2,951 |
| Long-term capital gains | $21,433 | $— |
| 1 | For tax purposes, short-term capital gain distributions are considered ordinary income distributions. |
| | |
As of October 31, 2015, the components of distributable earnings on a tax basis were as follows:
| Undistributed ordinary income | $55,089 |
| Net unrealized depreciation | $(45,509) |
| Capital loss carryforwards and straddle loss deferrals | $(289,434) |
The difference between book-basis and tax-basis net unrealized appreciation/depreciation is attributable to differing treatments for the deferral of losses on wash sales, discount accretion/premium amortization on debt securities and partnership basis adjustments.
At October 31, 2015, the cost of investments for federal tax purposes was $5,303,367. The net unrealized depreciation of investments for federal tax purposes excluding any unrealized appreciation/depreciation resulting from: (a) the translation from FCs to U.S. dollars of assets and liabilities other than investments in securities; (b) futures contracts; and (c) written options was $46,010. This consists of net unrealized appreciation from investments for those securities having an excess of value over cost of $160,309 and net unrealized depreciation from investments for those securities having an excess of cost over value of $206,319.
At October 31, 2015, the Fund had a capital loss carryforward of $275,030 which will reduce the Fund's taxable income arising from future net realized gains on investments, if any, to the extent permitted by the Code, thereby reducing the amount of distributions to shareholders which would otherwise be necessary to relieve the Fund of any liability for federal income tax. Pursuant to the Code, a net capital loss incurred in taxable years beginning after December 22, 2010, retains its character as either short-term or long-term and does not expire. All of the Fund's capital loss carryforwards were incurred in taxable years beginning after December 22, 2010.
The following schedule summarizes the Fund's capital loss carryforwards and expiration years:
| Short-Term | Long-Term | Total |
| $162,549 | $112,481 | $275,030 |
As of October 31, 2015, for federal income tax purposes, the Fund has $14,404 in straddle loss deferrals.
Annual Shareholder Report
5. INVESTMENT ADVISER FEE AND OTHER TRANSACTIONS WITH AFFILIATES
Investment Adviser Fee
The co-advisory agreement between the Fund and the Co-Advisers provides for an annual fee equal to 0.75% of the Fund's average daily net assets. Subject to the terms described in the Expense Limitation note, the Co-Advisers may voluntarily choose to waive any portion of their fee and/or reimburse certain operating expenses of the Fund. For the year ended October 31, 2015, the Co-Advisers voluntarily waived $29,317 of their fee and voluntarily reimbursed $267,457 of other operating expenses. Prior to August 20, 2014, Federated Global Investment Management Corp. acted as the sole Adviser to the Fund, with Federated Investment Management Company and Federated Equity Management Company of Pennsylvania acting as Sub-Advisers.
Administrative Fee
Federated Administrative Services (FAS), under the Administrative Services Agreement, provides the Fund with administrative personnel and services. For purposes of determining the appropriate rate breakpoint, “Investment Complex” is defined as all of the Federated Funds subject to a fee under the Administrative Services Agreement. The fee paid to FAS is based on the average daily net assets of the Investment Complex as specified below, plus certain out-of-pocket expenses:
| Administrative Fee | Average Daily Net Assets
of the Investment Complex |
| 0.150% | on the first $5 billion |
| 0.125% | on the next $5 billion |
| 0.100% | on the next $10 billion |
| 0.075% | on assets in excess of $20 billion |
In addition to the fees described above, the Fund agrees to pay FAS an annual Administrative Service Charge of $125,000 for administrative and compliance services related to commodities Futures Trading Commission Rule 4.5. Subject to the terms described in the Expense Limitation note, FAS may voluntarily choose to waive any portion of its fee. For the year ended October 31, 2015, the annualized fee paid to FAS was 2.450% of average daily net assets of the Fund.
Distribution Services Fee
The Fund has adopted a Distribution Plan (the “Plan”) pursuant to Rule 12b-1 under the Act. Under the terms of the Plan, the Fund will compensate Federated Securities Corp. (FSC), the principal distributor, from the daily net assets of the Fund's Class A Shares to finance activities intended to result in the sale of these shares. The Plan provides that the Fund may incur distribution expenses at 0.05% of average daily net assets, annually, to compensate FSC. Subject to the terms described in the Expense Limitation note, FSC may voluntarily choose to waive any portion of its fee. When FSC receives fees, it may pay some or all of them to financial intermediaries whose customers purchase shares. For the year ended October 31, 2015, the Fund's Class A Shares did not incur a distribution services fee; however, it may begin to incur this fee upon approval of the Trustees.
Annual Shareholder Report
Sales Charges
Front-end sales charges and contingent deferred sales charges (CDSC) do not represent expenses of the Fund. They are deducted from the proceeds of sales of Fund shares prior to investment or from redemption proceeds prior to remittance, as applicable. For the year ended October 31, 2015, FSC retained $499 in sales charges from the sale of Class A Shares.
Other Service Fees
For the year ended October 31, 2015, FSSC did not receive any of the other service fees disclosed in Note 2.
Expense Limitation
The Co-Advisers and certain of their affiliates (which may include FSC, FAS and FSSC) on their own initiative have agreed to waive certain amounts of their respective fees and/or reimburse expenses. Effective January 1, 2016, total annual fund operating expenses (as shown in the financial highlights, excluding expenses allocated from affiliated partnerships, extraordinary expenses and proxy-related expenses paid by the Fund, if any) paid by the Fund's Class A Shares and Institutional Shares (after the voluntary waivers and/or reimbursements) will not exceed 0.88% and 0.63% (the “Fee Limit”), respectively, up to but not including the later of (the “Termination Date”): (a) January 1, 2017; or (b) the date of the Fund's next effective Prospectus. While the Co-Advisers and their applicable affiliates currently do not anticipate terminating or increasing these arrangements prior to the Termination Date, these arrangements may only be terminated or the Fee Limit increased prior to the Termination Date with the agreement of the Trustees.
Interfund Transactions
During the year ended October 31, 2015, the Fund engaged in purchase and sale transactions with funds that have a common investment adviser (or affiliated investment advisers), common Directors/Trustees, and/or common Officers. These purchase and sale transactions complied with Rule 17a-7 under the Act and amounted to $8,317 and $6,519, respectively.
General
Certain Officers and Trustees of the Fund are Officers and Directors or Trustees of certain of the above companies. To efficiently facilitate payment, Directors'/Trustees' fees and certain expenses related to conducting meetings of the Directors/Trustees and other miscellaneous expenses are paid by an affiliate of the Co-Advisers which in due course are reimbursed by the Fund. Such expenses may be included in Accrued and Miscellaneous Expenses on the Statement of Assets and Liabilities and Statement of Operations, respectively.
Annual Shareholder Report
Transactions Involving Affiliated Holdings
Affiliated holdings are investment companies which are managed by the Co-Advisers or an affiliate of the Co-Advisers. The Co-Advisers have agreed to reimburse the Fund for certain investment adviser fees as a result of transactions in other affiliated investment companies. For the year ended October 31, 2015, the Co-Advisers reimbursed $10,222. Transactions involving the affiliated holdings during the year ended October 31, 2015, were as follows:
| | Balance
of
Shares
Held
10/31/2014 | Purchases/
Additions | Sales/
Reductions | Balance
of
Shares
Held
10/31/2015 | Value | Dividend
Income/
Allocated
Invest-
ment
Income | Capital
Gain
Distri-
butions/
Allocated
Net
Realized
Gain/
(Loss) |
Emerging
Markets
Fixed
Income
Core Fund | 598 | 830 | (723) | 705 | $24,314 | $1,263 | $(1,271) |
Federated
Bank Loan
Core Fund | 1,008 | 11,772 | (9,866) | 2,914 | $28,991 | $2,036 | $— |
Federated
Emerging
Markets
Equity Fund,
Institutional
Shares | — | 13,466 | (1,268) | 12,198 | $100,878 | $— | $— |
Federated
Intermediate
Corporate
Bond Fund,
Institutional
Shares | 37,947 | 22,730 | (10,724) | 49,953 | $464,559 | $17,048 | $482 |
Federated
International
Leaders
Fund,
Class R6
Shares | 21,837 | 11,965 | (5,132) | 28,670 | $940,367 | $8,053 | $— |
Federated
Kaufmann
Large Cap
Fund,
Class R6
Shares | — | 9,435 | (1,229) | 8,206 | $156,976 | $— | $— |
Annual Shareholder Report
| | Balance
of
Shares
Held
10/31/2014 | Purchases/
Additions | Sales/
Reductions | Balance
of
Shares
Held
10/31/2015 | Value | Dividend
Income/
Allocated
Invest-
ment
Income | Capital
Gain
Distri-
butions/
Allocated
Net
Realized
Gain/
(Loss) |
Federated
Mortgage
Core Portfolio | 19,395 | 14,412 | (17,899) | 15,908 | $157,963 | $6,822 | $— |
Federated
Prime Value
Obligations
Fund,
Institutional
Shares | 345,759 | 3,779,807 | (3,804,196) | 321,370 | $321,370 | $261 | $— |
Federated
Project and
Trade
Finance
Core Fund | 47,437 | 13,591 | — | 61,028 | $570,612 | $20,330 | $— |
Federated
Prudent
Bear Fund,
Institutional
Shares | 26,652 | 18,651 | (10,803) | 34,500 | $74,865 | $— | $— |
High Yield
Bond Portfolio | 10,360 | 20,657 | (4,498) | 26,519 | $163,356 | $7,005 | $915 |
TOTAL OF
AFFILIATED
TRANSACTIONS | 510,993 | 3,917,316 | (3,866,338) | 561,971 | $3,004,251 | $62,818 | $126 |
Affiliated Shares of Beneficial Interest
As of October 31, 2015, a majority of the shares of beneficial interest outstanding are owned by an affiliate of the Co-Advisers.
6. investment transactions
Purchases and sales of investments, excluding long-term U.S. government securities and short-term obligations, for the year ended October 31, 2015, were as follows:
| Purchases | $4,912,832 |
| Sales | $4,034,951 |
Annual Shareholder Report
7. LINE OF CREDIT
The Fund participates in a $100,000,000 unsecured, uncommitted revolving line of credit (LOC) agreement with PNC Bank. The LOC was made available for extraordinary or emergency purposes, primarily for financing redemption payments. Borrowings are charged interest at a rate offered to the Fund by PNC Bank at the time of the borrowing. As of October 31, 2015, there were no outstanding loans. During the year ended October 31, 2015, the Fund did not utilize the LOC.
8. INTERFUND LENDING
Pursuant to an Exemptive Order issued by the Securities and Exchange Commission, the Fund, along with other funds advised by subsidiaries of Federated Investors, Inc., may participate in an interfund lending program. This program provides an alternative credit facility allowing the Fund to borrow from other participating affiliated funds. As of October 31, 2015, there were no outstanding loans. During the year ended October 31, 2015, the program was not utilized.
9. FEDERAL TAX INFORMATION (UNAUDITED)
For the year ended October 31, 2015, the amount of long-term capital gains designated by the Fund was $21,433.
For the fiscal year ended October 31, 2015, 54.70% of total ordinary (including short-term capital gain) distributions paid by the Fund are qualifying dividends which may be subject to a maximum tax rate of 15%, as provided for by the Jobs and Growth Tax Relief Act of 2003. Complete information is reported in conjunction with the reporting of your distributions on Form 1099-DIV.
Of the ordinary income (including short-term capital gain) distributions made by the Fund during the year ended October 31, 2015, 39.78% qualify for the dividends received deduction available to corporate shareholders.
Annual Shareholder Report
Report of Independent Registered Public Accounting Firm
TO THE BOARD OF TRUSTEES OF THE FEDERATED EQUITY FUNDS AND SHAREHOLDERS OF FEDERATED MANAGED RISK FUND:
We have audited the accompanying statement of assets and liabilities, including the portfolio of investments, of the Federated Managed Risk Fund (the “Fund”), a portfolio of Federated Equity Funds, as of October 31, 2015, and the related statement of operations for the year then ended, the statement of changes in net assets, and financial highlights for the period from December 16, 2013 (commencement of operations) through October 31, 2015. These financial statements and financial highlights are the responsibility of the Fund's management. Our responsibility is to express an opinion on these financial statements and financial highlights based on our audit.
We conducted our audit in accordance with the standards of the Public Company Accounting Oversight Board (United States). Those standards require that we plan and perform the audit to obtain reasonable assurance about whether the financial statements and financial highlights are free of material misstatement. An audit includes examining, on a test basis, evidence supporting the amounts and disclosures in the financial statements. Our procedures included confirmation of securities owned as of October 31, 2015, by correspondence with the custodian, transfer agent, and brokers or by other appropriate auditing procedures. An audit also includes assessing the accounting principles used and significant estimates made by management, as well as evaluating the overall financial statement presentation. We believe that our audit provides a reasonable basis for our opinion.
In our opinion, the financial statements and financial highlights referred to above present fairly, in all material respects, the financial position of the Federated Managed Risk Fund as of October 31, 2015, and the results of its operations for the year then ended, the changes in its net assets, and financial highlights for the period from December 16, 2013 (commencement of operations) through October 31, 2015, in conformity with U.S. generally accepted accounting principles.
Boston, Massachusetts
December 23, 2015
Annual Shareholder Report
Shareholder Expense Example (unaudited)
As a shareholder of the Fund, you incur two types of costs: (1) transaction costs, including sales charges (loads) on purchase or redemption payments; and (2) ongoing costs, including management fees and to the extent applicable, distribution (12b-1) fees and/or other service fees and other Fund expenses. This Example is intended to help you to understand your ongoing costs (in dollars) of investing in the Fund and to compare these costs with the ongoing costs of investing in other mutual funds. It is based on an investment of $1,000 invested at the beginning of the period and held for the entire period from May 1, 2015 to October 31, 2015.
ACTUAL EXPENSES
The first section of the table below provides information about actual account values and actual expenses. You may use the information in this section, together with the amount you invested, to estimate the expenses that you incurred over the period. Simply divide your account value by $1,000 (for example, an $8,600 account value divided by $1,000 = 8.6), then multiply the result by the number in the first section under the heading entitled “Expenses Paid During Period” to estimate the expenses attributable to your investment during this period.
HYPOTHETICAL EXAMPLE FOR COMPARISON PURPOSES
The second section of the table below provides information about hypothetical account values and hypothetical expenses based on the Fund's actual expense ratio and an assumed rate of return of 5% per year before expenses, which is not the Fund's actual return. Thus, you should not use the hypothetical account values and expenses to estimate the actual ending account balance or your expenses for the period. Rather, these figures are required to be provided to enable you to compare the ongoing costs of investing in the Fund with other funds. To do so, compare this 5% hypothetical example with the 5% hypothetical examples that appear in the shareholder reports of the other funds.
Annual Shareholder Report
Please note that the expenses shown in the table are meant to highlight your ongoing costs only and do not reflect any transaction costs, such as sales charges (loads) on purchase or redemption payments. Therefore, the second section of the table is useful in comparing ongoing costs only, and will not help you determine the relative total costs of owning different funds. In addition, if these transaction costs were included, your costs would have been higher.
| | Beginning
Account Value
5/1/2015 | Ending
Account Value
10/31/2015 | Expenses Paid
During Period1 |
| Actual: | | | |
| Class A Shares | $1,000 | $934.50 | $4.49 |
| Institutional Shares | $1,000 | $934.60 | $3.51 |
Hypothetical (assuming a 5% return
before expenses): | | | |
| Class A Shares | $1,000 | $1,020.57 | $4.69 |
| Institutional Shares | $1,000 | $1,021.58 | $3.67 |
| 1 | Expenses are equal to the Fund's annualized net expense ratios, multiplied by the average account value over the period, multiplied by 184/365 (to reflect the one-half-year period). The annualized net expense ratios are as follows: |
| | |
| Class A Shares | 0.92% |
| Institutional Shares | 0.72% |
Annual Shareholder Report
Board of Trustees and Trust Officers
The Board of Trustees is responsible for managing the Trust's business affairs and for exercising all the Trust's powers except those reserved for the shareholders. The following tables give information about each Trustee and the senior officers of the Fund. Where required, the tables separately list Trustees who are “interested persons” of the Fund (i.e., “Interested” Trustees) and those who are not (i.e., “Independent” Trustees). Unless otherwise noted, the address of each person listed is Federated Investors Tower, 1001 Liberty Avenue, Pittsburgh, PA 15222. The address of all Independent Trustees listed is 4000 Ericsson Drive, Warrendale, PA 15086-7561; Attention: Mutual Fund Board. As of December 31, 2014, the Trust comprised 14 portfolio(s), and the Federated Fund Family consisted of 40 investment companies (comprising 131 portfolios). Unless otherwise noted, each Officer is elected annually. Unless otherwise noted, each Trustee oversees all portfolios in the Federated Fund Family and serves for an indefinite term. The Fund's Statement of Additional Information includes additional information about Trust Trustees and is available, without charge and upon request, by calling 1-800-341-7400.
Interested TRUSTEES Background
Name
Birth Date
Positions Held with Fund
Date Service Began | Principal Occupation(s) for Past Five Years,
Other Directorships Held and Previous Position(s) |
John F. Donahue*
Birth Date: July 28, 1924
Trustee
Indefinite Term
Began serving: April 1984 | Principal Occupations: Director or Trustee of the Federated Fund Family; Chairman and Director, Federated Investors, Inc.; Chairman of the Federated Fund Family's Executive Committee.
Previous Positions: Chairman of the Federated Fund Family; Trustee, Federated Investment Management Company; Chairman and Director, Federated Investment Counseling. |
J. Christopher Donahue*
Birth Date: April 11, 1949
President and Trustee
Indefinite Term
Began serving: January 2000 | Principal Occupations: Principal Executive Officer and President of certain of the Funds in the Federated Fund Family; Director or Trustee of the Funds in the Federated Fund Family; President, Chief Executive Officer and Director, Federated Investors, Inc.; Chairman and Trustee, Federated Investment Management Company; Trustee, Federated Investment Counseling; Chairman and Director, Federated Global Investment Management Corp.; Chairman, Federated Equity Management Company of Pennsylvania and Passport Research, Ltd. (investment advisory subsidiary of Federated); Trustee, Federated Shareholder Services Company; Director, Federated Services Company.
Previous Positions: President, Federated Investment Counseling; President and Chief Executive Officer, Federated Investment Management Company, Federated Global Investment Management Corp. and Passport Research, Ltd. |
| * | Family relationships and reasons for “interested” status: John F. Donahue is the father of J. Christopher Donahue; both are “interested” due to their beneficial ownership of shares of Federated Investors, Inc. and the positions they hold with Federated and its subsidiaries. |
Annual Shareholder Report
INDEPENDENT TRUSTEES Background
Name
Birth Date
Positions Held with Fund
Date Service Began | Principal Occupation(s) for Past Five Years,
Other Directorships Held, Previous Position(s) and Qualifications |
John T. Collins
Birth Date: January 24, 1947
Trustee
Indefinite Term
Began serving: October 2013 | Principal Occupations: Director or Trustee of the Federated Fund Family; Chairman and CEO, The Collins Group, Inc. (a private equity firm).
Other Directorships Held: Director, Chair of the Compensation Committee, Audit Committee member, KLX Corp.
Qualifications: Mr. Collins has served in several business and financial management roles and directorship positions throughout his career. Mr. Collins serves as Chairman Emeriti, Bentley University. Mr. Collins previously served as Director, FleetBoston Financial Corp.; Director and Audit Committee Member, Bank of America Corp. and Director, Beth Israel Deaconess Medical Center (Harvard University Affiliate Hospital). |
G. Thomas Hough
Birth Date: February 28, 1955
Trustee
Indefinite Term
Began serving: August 2015 | Principal Occupations: Director or Trustee of the Federated Fund Family; Retired.
Other Directorships Held: Director, Chair of the Audit Committee, Governance Committee, Publix Super Markets, Inc.
Qualifications: Mr. Hough has served in accounting, business management and directorship positions throughout his career. Mr. Hough most recently held the position of Americas Vice Chair of Assurance with Ernst & Young LLP. Mr. Hough is an Executive Committee member of the United States Golf Association, he serves on the President's Cabinet and Business School Board of Visitors for the University of Alabama and is on the Business School Board of Visitors for Wake Forest University. |
Maureen Lally-Green
Birth Date: July 5, 1949
Trustee
Indefinite Term
Began serving: August 2009 | Principal Occupations: Director or Trustee of the Federated Fund Family; Adjunct Professor of Law, Duquesne University School of Law.
Other Directorships Held: Director, CONSOL Energy Inc.
Qualifications: Judge Lally-Green has served in various legal and business roles and directorship positions throughout her career. Judge Lally-Green previously served as: Associate General Secretary, Diocese of Pittsburgh; Professor of Law, Duquesne University School of Law and was a member of the Superior Court of Pennsylvania. Judge Lally-Green also holds the positions of: Member, Pennsylvania State Board of Education; Director, Saint Vincent College; Director and Chair, UPMC Mercy Hospital; Regent, St. Vincent Seminary; Director, Epilepsy Foundation of Western and Central Pennsylvania; Director, Our Campaign for the Church Alive!, Inc.; Director, Pennsylvania Bar Institute; and Director, Cardinal Wuerl North Catholic High School, Inc. Judge Lally-Green has held the positions of: Director, Auberle; Director, Ireland Institute of Pittsburgh; Director, Saint Thomas More Society; and Director, Catholic High Schools of the Diocese of Pittsburgh, Inc. |
Annual Shareholder Report
Name
Birth Date
Positions Held with Fund
Date Service Began | Principal Occupation(s) for Past Five Years,
Other Directorships Held, Previous Position(s) and Qualifications |
Peter E. Madden
Birth Date: March 16, 1942
Trustee
Indefinite Term
Began serving: November 1991 | Principal Occupation: Director or Trustee, and Chair of the Board of Directors or Trustees, of the Federated Fund Family; Retired.
Other Directorships Held: None.
Qualifications: Mr. Madden has served in several business management, mutual fund services and directorship positions throughout his career. Mr. Madden previously served as President, Chief Operating Officer and Director, State Street Bank and Trust Company (custodian bank) and State Street Corporation (financial services). He was Director, VISA USA and VISA International and Chairman and Director, Massachusetts Bankers Association. Mr. Madden served as Director, Depository Trust Corporation and Director, The Boston Stock Exchange. Mr. Madden also served as a Representative to the Commonwealth of Massachusetts General Court. |
Charles F. Mansfield, Jr.
Birth Date: April 10, 1945
Trustee
Indefinite Term
Began serving: November 1999 | Principal Occupations: Director or Trustee of the Federated Fund Family; Management Consultant.
Other Directorships Held: None.
Qualifications: Mr. Mansfield has served in several banking, business management and educational roles and directorship positions throughout his career. Mr. Mansfield previously served as Chief Executive Officer, PBTC International Bank; Partner, Arthur Young & Company (now Ernst & Young LLP); Chief Financial Officer of Retail Banking Sector, Chase Manhattan Bank; Senior Vice President, HSBC Bank USA (formerly, Marine Midland Bank); Vice President, Citibank; Assistant Professor of Banking and Finance, Frank G. Zarb School of Business, Hofstra University; Executive Vice President DVC Group, Inc. (marketing, communications and technology). |
Thomas M. O'Neill
Birth Date: June 14, 1951
Trustee
Indefinite Term
Began serving: October 2006 | Principal Occupations: Director or Trustee, Vice Chair of the Audit Committee of the Federated Fund Family; Sole Proprietor, Navigator Management Company (investment and strategic consulting).
Other Directorships Held: None.
Qualifications: Mr. O'Neill has served in several business, mutual fund and financial management roles and directorship positions throughout his career. Mr. O'Neill serves as Director, Medicines for Humanity and Director, The Golisano Children's Museum of Naples, Florida. Mr. O'Neill previously served as Chief Executive Officer and President, Managing Director and Chief Investment Officer, Fleet Investment Advisors; President and Chief Executive Officer, Aeltus Investment Management, Inc.; General Partner, Hellman, Jordan Management Co., Boston, MA; Chief Investment Officer, The Putnam Companies, Boston, MA; Credit Analyst and Lending Officer, Fleet Bank; Director and Consultant, EZE Castle Software (investment order management software); and Director, Midway Pacific (lumber). |
Annual Shareholder Report
Name
Birth Date
Positions Held with Fund
Date Service Began | Principal Occupation(s) for Past Five Years,
Other Directorships Held, Previous Position(s) and Qualifications |
P. Jerome Richey
Birth Date: February 23, 1949
Trustee
Indefinite Term
Began serving: October 2013 | Principal Occupations: Director or Trustee of the Federated Fund Family; Management Consultant.
Other Directorships Held: None.
Qualifications: Mr. Richey has served in several business and legal management roles and directorship positions throughout his career. Mr. Richey most recently held the positions of Senior Vice Chancellor and Chief Legal Officer, University of Pittsburgh. Mr. Richey serves as Board Member, Epilepsy Foundation of Western Pennsylvania and Board member, World Affairs Council of Pittsburgh. Mr. Richey previously served as Chief Legal Officer and Executive Vice President, CONSOL Energy Inc. and Shareholder, Buchanan Ingersoll & Rooney PC (a law firm). |
John S. Walsh
Birth Date: November 28, 1957
Trustee
Indefinite Term
Began serving: January 1999 | Principal Occupations: Director or Trustee, Chair of the Audit Committee of the Federated Fund Family; President and Director, Heat Wagon, Inc. (manufacturer of construction temporary heaters); President and Director, Manufacturers Products, Inc. (distributor of portable construction heaters); President, Portable Heater Parts, a division of Manufacturers Products, Inc.
Other Directorships Held: None.
Qualifications: Mr. Walsh has served in several business management roles and directorship positions throughout his career. Mr. Walsh previously served as Vice President, Walsh & Kelly, Inc. (paving contractors). |
OFFICERS
Name
Birth Date
Address
Positions Held with Fund
Date Service Began | Principal Occupation(s) for Past Five Years
and Previous Position(s) |
John W. McGonigle
Birth Date: October 26, 1938
EXECUTIVE VICE PRESIDENT AND SECRETARY
Officer since: April 1984 | Principal Occupations: Executive Vice President and Secretary of the Federated Fund Family; Vice Chairman, Executive Vice President, Secretary and Director, Federated Investors, Inc.
Previous Positions: Trustee, Federated Investment Management Company and Federated Investment Counseling; Director, Federated Global Investment Management Corp., Federated Services Company and Federated Securities Corp. |
Annual Shareholder Report
Name
Birth Date
Address
Positions Held with Fund
Date Service Began | Principal Occupation(s) for Past Five Years
and Previous Position(s) |
Lori A. Hensler
Birth Date: January 6, 1967
TREASURER
Officer since: April 2013 | Principal Occupations: Principal Financial Officer and Treasurer of the Federated Fund Family; Senior Vice President, Federated Administrative Services; Financial and Operations Principal for Federated Securities Corp. and Edgewood Services, Inc.; and Assistant Treasurer, Federated Investors Trust Company. Ms. Hensler has received the Certified Public Accountant designation.
Previous Positions: Controller of Federated Investors, Inc.; Senior Vice President and Assistant Treasurer, Federated Investors Management Company; Treasurer, Federated Investors Trust Company; Assistant Treasurer, Federated Administrative Services, Federated Administrative Services, Inc., Federated Securities Corp., Edgewood Services, Inc., Federated Advisory Services Company, Federated Equity Management Company of Pennsylvania, Federated Global Investment Management Corp., Federated Investment Counseling, Federated Investment Management Company, Passport Research, Ltd., and Federated MDTA, LLC; Financial and Operations Principal for Federated Securities Corp., Edgewood Services, Inc. and Southpointe Distribution Services, Inc. |
Richard B. Fisher
Birth Date: May 17, 1923
Vice President
Officer since: April 1987 | Principal Occupations: Vice Chairman or Vice President of some of the Funds in the Federated Fund Family; Vice Chairman, Federated Investors, Inc.; Chairman, Federated Securities Corp.
Previous Positions: President and Director or Trustee of some of the Funds in the Federated Fund Family; Executive Vice President, Federated Investors, Inc.; Director and Chief Executive Officer, Federated Securities Corp. |
Peter J. Germain
Birth Date: September 3, 1959
CHIEF LEGAL OFFICER
Officer since: January 2005 | Principal Occupations: Mr. Germain is Chief Legal Officer of the Federated Fund Family. He is General Counsel and Vice President, Federated Investors, Inc.; President, Federated Administrative Services and Federated Administrative Services, Inc.; Vice President, Federated Securities Corp.; Secretary, Federated Private Asset Management, Inc.; and Secretary, Retirement Plan Service Company of America. Mr. Germain joined Federated in 1984 and is a member of the Pennsylvania Bar Association.
Previous Positions: Deputy General Counsel, Special Counsel, Managing Director of Mutual Fund Services, Federated Investors, Inc.; Senior Vice President, Federated Services Company; and Senior Corporate Counsel, Federated Investors, Inc. |
Stephen Van Meter
Birth Date: June 5, 1975
CHIEF COMPLIANCE OFFICER AND SENIOR VICE PRESIDENT
Officer since: July 2015 | Principal Occupations: Senior Vice President and Chief Compliance Officer of the Federated Fund Family; Vice President and Chief Compliance Officer of Federated Investors, Inc. and Chief Compliance Officer of certain of its subsidiaries. Mr. Van Meter joined Federated in October 2011. He holds FINRA licenses under Series 3, 7, 24 and 66.
Previous Positions: Mr. Van Meter previously held the position of Compliance Operating Officer, Federated Investors, Inc. Prior to joining Federated, Mr. Van Meter served at the United States Securities and Exchange Commission in the positions of Senior Counsel, Office of Chief Counsel, Division of Investment Management and Senior Counsel, Division of Enforcement. |
Annual Shareholder Report
Name
Birth Date
Address
Positions Held with Fund
Date Service Began | Principal Occupation(s) for Past Five Years
and Previous Position(s) |
Stephen F. Auth
Birth Date: September 3, 1956
101 Park Avenue
41st Floor
New York, NY 10178
CHIEF INVESTMENT OFFICER
Officer since: November 2002 | Principal Occupations: Stephen F. Auth is Chief Investment Officer of various Funds in the Federated Fund Family; Executive Vice President, Federated Investment Counseling, Federated Global Investment Management Corp. and Federated Equity Management Company of Pennsylvania.
Previous Positions: Executive Vice President, Federated Investment Management Company and Passport Research, Ltd. (investment advisory subsidiary of Federated); Senior Vice President, Global Portfolio Management Services Division; Senior Vice President, Federated Investment Management Company and Passport Research, Ltd.; Senior Managing Director and Portfolio Manager, Prudential Investments. |
Annual Shareholder Report
Evaluation and Approval of Advisory Contract–May 2015
Federated Managed Risk Fund (the “Fund”)
Following a review and recommendation of approval by the Fund's independent trustees, the Fund's Board reviewed and approved at its May 2015 meetings the Fund's investment advisory contract, under which three Federated entities will serve as co-advisers to the Fund (“Co-Advisers”), for an additional one-year term. The Board's decision regarding the contract reflects the exercise of its business judgment on whether to continue the existing arrangements.
In this connection, the Federated Funds' Board had previously appointed a Senior Officer, whose duties include specified responsibilities relating to the process by which advisory fees are to be charged to a Federated fund. The Senior Officer has the authority to retain consultants, experts, or staff as may be reasonably necessary to assist in the performance of his duties, reports directly to the Board, and may be terminated only with the approval of a majority of the independent members of the Board. The Senior Officer prepared and furnished to the Board an independent, written evaluation that covered topics discussed below (the “Evaluation”). The Board considered that Evaluation, along with other information, in deciding to approve the advisory contract.
The Board is also familiar with and considered judicial decisions concerning allegedly excessive investment advisory fees, which have indicated that the following factors may be relevant to an adviser's fiduciary duty with respect to its receipt of compensation from a fund: the nature and quality of the services provided by an adviser to a fund and its shareholders, including the performance and expenses of the fund and of comparable funds; an adviser's cost of providing the services, including the profitability to an adviser of providing advisory services to a fund; the extent to which an adviser may realize “economies of scale” as a fund grows larger and, if such economies of scale exist, whether they have been shared with a fund and its shareholders or the family of funds; any “fall-out financial benefits” that accrue to an adviser because of its relationship with a fund (including research services received from brokers that execute fund trades and any fees paid to affiliates of an adviser for services rendered to a fund); comparative fee structures, including a comparison of fees paid to an adviser with those paid by similar funds; and the extent of care, conscientiousness and independence with which board members perform their duties and their expertise, including whether they are fully informed about all facts the board deems relevant to its consideration of an adviser's services and fees. The Board noted that SEC disclosure requirements regarding the basis for the Board's approval of the Fund's advisory contract generally track the factors listed above. Consistent with these judicial decisions and SEC disclosure requirements, the Board also considered management fees charged to institutional and other clients of the Co-Adviser for what might be viewed as like services. The Board was aware of these factors and was guided by them in
Annual Shareholder Report
its review of the Fund's advisory contract to the extent it considered them to be appropriate and relevant, as discussed further below. Also, in weighing these factors, the board considered the aggregate advisory fee paid by the Fund for the services of all Co-Advisers but also considered the allocation of that aggregate fee among the Co-Advisers and the rational for that allocation.
The Board considered and weighed these circumstances in light of its substantial accumulated experience in governing the Fund and working with Federated on matters relating to the Federated funds, and was assisted in its deliberations by independent legal counsel. Throughout the year, and in connection with its May meetings, the Board requested and received substantial and detailed information about the Fund and the Federated organization that was in addition to the extensive materials that comprise and accompany the Senior Officer's Evaluation. Federated provided much of this information at each regular meeting of the Board, and furnished additional substantial information in connection with the May meeting at which the Board's formal review of the advisory contract occurred. At this May meeting, senior management of the Co-Adviser also met with the independent trustees and their counsel to discuss the materials presented and any other matters thought relevant by the Co-Adviser or the trustees. Between regularly scheduled meetings, the Board also received information on particular matters as the need arose. Thus, the Board's consideration of the advisory contract included review of the Senior Officer's Evaluation, accompanying data and additional information covering such matters as: the Co-Advisers' investment philosophy, revenue, profitability, personnel and processes; investment and operating strategies; the Fund's short- and long-term performance (in absolute terms, both on a gross basis and net of expenses, as well as in relationship to its particular investment program and certain competitor or “peer group” funds and/or other benchmarks, as appropriate), and comments on the reasons for performance; the Fund's investment objectives; the Fund's expenses (including the advisory fee itself and the overall expense structure of the Fund, both in absolute terms and relative to similar and/or competing funds, with due regard for contractual or voluntary expense limitations); the use and allocation of brokerage commissions derived from trading the Fund's portfolio securities (if any); and the nature, quality and extent of the advisory and other services provided to the Fund by the Adviser and its affiliates. In particular, the Board considered the services provided by the Co-Advisers in the aggregate, to the extent that the Co-Advisers collaborate with respect to the implementation of the Fund's strategy, as well as separately, to the extent that specific services provided by a Co-Adviser are distinguishable and subject to meaningful assessment. The Board also considered the preferences and expectations of Fund shareholders; the entrepreneurial risk assumed by the Co-Advisers in sponsoring the funds; the continuing state of competition in the mutual fund industry and market practices; the range of comparable fees for similar funds in the mutual fund industry; the Fund's relationship to the Federated family of funds which include
Annual Shareholder Report
a comprehensive array of funds with different investment objectives, policies and strategies which are available for exchange without the incurrence of additional sales charges; compliance and audit reports concerning the Federated funds and the Federated companies that service them (including communications from regulatory agencies), as well as Federated's responses to any issues raised therein; and relevant developments in the mutual fund industry and how the Federated funds and/or Federated are responding to them. The Board's evaluation process is evolutionary. The criteria considered and the emphasis placed on relevant criteria change in recognition of changing circumstances in the mutual fund marketplace.
While mindful that courts have cautioned against giving such comparisons too much weight, the Board has found the use of comparisons of the Fund's fees and expenses to other mutual funds with comparable investment programs to be relevant. In this regard, the Board was presented with, and considered, information regarding the contractual advisory fee rates, net advisory fee rates and total expense ratios relative to a fund's peers. The Board focused on comparisons with other similar mutual funds more heavily than non-mutual fund products or services because it is believed that they are more relevant. For example, other mutual funds are the products most like the Fund, they are readily available to Fund shareholders as alternative investment vehicles, and they are the type of investment vehicle in fact chosen and maintained by the Fund's investors. The range of their fees and expenses therefore appears to be a relevant indicator of what consumers have found to be reasonable in the precise marketplace in which the Fund competes.
The advisory contract between the Fund and the Co-Advisers provides for payment of a single advisory fee by the Fund for all services provided by the Co-Advisers. The advisory contract permits the Co-Advisers to allocate the advisory fee in a manner commensurate with the services they provide to the Fund. The Board considered the fee allocation and analyzed whether the allocation of fees among the Co-Advisers continued to be a reasonable proxy for and measurement of, the level of resources and services provided by each Co-Adviser toward the management of the Fund.
It was noted in the materials for the Board meeting that for the period covered by the Evaluation, the Fund's investment advisory fee was waived in its entirety. The Board reviewed the contractual advisory fee rate, net advisory fee rate and other expenses of the Fund with the Co-Advisers and noted the position of the Fund's fee rates relative to its peers. In this regard, the Board noted that the contractual advisory fee rate was below the median of the relevant peer group and that it was satisfied that the overall expense structure of the Fund remained competitive.
By contrast, the Senior Officer has reviewed Federated's fees for providing advisory services to products outside the Federated family of funds (e.g., institutional and separate accounts and sub-adviser services). He concluded that mutual funds and institutional accounts are inherently different products.
Annual Shareholder Report
Those differences include, but are not limited to, different types of targeted investors; being subject to different laws and regulations; different legal structures; different average account sizes and portfolio management techniques made necessary by different cash flows and different associated costs; and the time spent by portfolio managers and their teams, funds financial services, legal, compliance and risk management in reviewing securities pricing, addressing different administrative responsibilities, addressing different degrees of risk associated with management and a variety of different costs. The Senior Officer did not consider these fee schedules to be determinative in judging the appropriateness of mutual fund advisory fees.
The Fund's ability to deliver competitive performance when compared to its peer group was also deemed to be relevant by the Board as a useful indicator of how the Co-Advisers are executing the Fund's investment program, which in turn was one of the Board's considerations in reaching a conclusion that the nature, extent, and quality of the Co-Advisers' investment management services were such as to warrant continuation of the advisory contract.
The Senior Officer reviewed information compiled by Federated, using data supplied by independent fund ranking organizations, regarding the performance of, and fees charged by, other mutual funds, noting his view that comparisons to fund peer groups may be helpful, though not conclusive, in judging the reasonableness of proposed fees. The Board considered, in evaluating such comparisons, that in some cases individual funds may exhibit significant and unique differences in their objectives and management techniques when compared to other funds within an industry peer group.
The Fund's performance fell below the median of the relevant peer group for the one-year period covered by the Evaluation. The Board discussed the Fund's performance with the Co-Advisers and recognized the efforts being undertaken by the Co-Advisers. The Board will continue to monitor these efforts and the performance of the Fund in the context of the other factors considered relevant by the Board.
The Board also received financial information about Federated, including information regarding the compensation and benefits Federated derived from its relationships with the Federated funds. This information covered not only the fees under the advisory contracts, but also fees received by Federated's subsidiaries for providing other services to the Federated funds under separate contracts (e.g., for serving as the Federated funds' administrator). The information also detailed any indirect benefit Federated may derive from its receipt of research services from brokers who execute Federated fund trades. In addition, the Board considered the fact that, in order for a fund to be competitive in the marketplace, Federated and its affiliates frequently waived fees and/or reimbursed expenses and have disclosed to fund investors and/or indicated to the Board their intention to do so in the future, where appropriate. Moreover, the Board receives regular reporting as to the institution, adjustment or elimination of these voluntary waivers.
Annual Shareholder Report
In addition, over the past two years, following discussions regarding the Senior Officer's recommendations, Federated made meaningful reductions to the contractual advisory fees for several Funds. At the Board meeting in May 2015, following previous recommendations of the Senior Officer, Federated proposed, and the Board approved, reductions in the contractual advisory fees of certain other Funds.
Federated furnished information, requested by the Senior Officer, that reported revenues on a fund-by-fund basis and made estimates of the allocation of expenses on a fund-by-fund basis, using allocation methodologies specified by the Senior Officer. The Senior Officer noted that, while these cost allocation reports apply consistent allocation processes, the inherent difficulties in allocating costs continues to cause the Senior Officer to question the precision of the process and to conclude that such reports may be unreliable, since a single change in an allocation estimate may dramatically alter the resulting estimate of cost and/or profitability of a fund and may produce unintended consequences. The allocation information, including the Senior Officer's view that fund-by-fund estimations may be unreliable, was considered in the analysis by the Board.
The Board and the Senior Officer also reviewed information compiled by Federated comparing profitability information for Federated to other publicly held fund management companies. In this regard, the Senior Officer concluded that Federated's profit margins did not appear to be excessive. The Senior Officer also noted that Federated appeared financially sound, with the resources to fulfill its obligations under its contracts with the Funds.
The Senior Officer's Evaluation also discussed the notion of possible realization of “economies of scale” as a fund grows larger. The Board considered in this regard that the Co-Adviser has made significant and long-term investments in areas that support all of the Federated family of funds, such as personnel and processes for the portfolio management, shareholder services, compliance, internal audit, and risk management functions; and systems technology; and that the benefits of these efforts (as well as any economies of scale, should they exist) were likely to be enjoyed by the fund family as a whole. Federated, as it does throughout the year, and again in connection with the Board's review, furnished information relative to revenue sharing or adviser paid fees. Federated and the Senior Officer noted that this information should be viewed to determine if there was an incentive to either not apply breakpoints or to apply breakpoints at higher levels and should not be viewed to determining the appropriateness of advisory fees, because it would represent marketing and distribution expenses. Finally, the Board also noted the absence of any applicable regulatory or industry guidelines on this subject, which (as discussed in the Senior Officer's Evaluation) is compounded by the lack of any common industry practice or general pattern with respect to structuring fund advisory fees with “breakpoints” that serve to reduce the fee as the fund attains a certain size.
Annual Shareholder Report
The Senior Officer noted that, subject to the comments and recommendations made within his Evaluation, his observations and the information accompanying the Evaluation supported a finding by the Board that the management fees for each of the funds were reasonable. Under these circumstances, no changes were recommended to, and no objection was raised to the continuation of, the Fund's advisory contract.
In its decision to continue an existing investment advisory contract, the Board was mindful of the potential disruptions of the Fund's operations and various risks, uncertainties and other effects that could occur as a result of a decision to terminate or not renew an advisory contract. In particular, the Board recognized that many shareholders have invested in the Fund on the strength of the Co-Advisers' industry standing and reputation and with the expectation that the Co-Advisers will have a continuing role in providing advisory services to the Fund. Thus, the Board's approval of the advisory contract reflected the fact that it is the shareholders who have effectively selected the Co-Advisers by virtue of having invested in the Fund. The Board concluded that, in light of the factors discussed above, including the nature, quality and scope of the services provided to the Fund by the Co-Advisers and their affiliates, continuation of the advisory contract was appropriate.
The Board based its decision to approve the advisory contract on the totality of the circumstances and relevant factors and with a view to past and future long-term considerations. Not all of the factors and considerations identified above were necessarily relevant to the Fund, nor did the Board consider any one of them to be determinative. With respect to the factors that were relevant, the Board's decision to approve the contract reflects its determination that Federated's performance and actions provided a satisfactory basis to support the decision to continue the existing arrangements.
Annual Shareholder Report
Voting Proxies on Fund Portfolio Securities
A description of the policies and procedures that the Fund uses to determine how to vote proxies, if any, relating to securities held in the Fund's portfolio is available, without charge and upon request, by calling 1-800-341-7400. A report on “Form N-PX” of how the Fund voted any such proxies during the most recent 12-month period ended June 30 is available via the Proxy Voting Record (Form N-PX) link associated with the Fund and share class name at www.FederatedInvestors.com/FundInformation. Form N-PX filings are also available at the SEC's website at www.sec.gov.
Quarterly Portfolio Schedule
The Fund files with the SEC a complete schedule of its portfolio holdings, as of the close of the first and third quarters of its fiscal year, on “Form N-Q.” These filings are available on the SEC's website at www.sec.gov and may be reviewed and copied at the SEC's Public Reference Room in Washington, DC. (Call 1-800-SEC-0330 for information on the operation of the Public Reference Room.) You may also access this information via the link to the Fund and share class name at www.FederatedInvestors.com/FundInformation.
Annual Shareholder Report
Mutual funds are not bank deposits or obligations, are not guaranteed by any bank and are not insured or guaranteed by the U.S. government, the Federal Deposit Insurance Corporation, the Federal Reserve Board or any other government agency. Investment in mutual funds involves investment risk, including the possible loss of principal.
This Report is authorized for distribution to prospective investors only when preceded or accompanied by the Fund's Prospectus, which contains facts concerning its objective and policies, management fees, expenses and other information.
Federated Managed Risk Fund
Federated Investors Funds
4000 Ericsson Drive
Warrendale, PA 15086-7561
Contact us at FederatedInvestors.com
or call 1-800-341-7400.
Federated Securities Corp., Distributor
CUSIP 314172156
CUSIP 314172149
Q451884 (12/15)
Federated is a registered trademark of Federated Investors, Inc.
2015 ©Federated Investors, Inc.
Item 2. Code of Ethics
(a) As of the end of the period covered by this report, the registrant has adopted a code of ethics (the "Section 406 Standards for Investment Companies - Ethical Standards for Principal Executive and Financial Officers") that applies to the registrant's Principal Executive Officer and Principal Financial Officer; the registrant's Principal Financial Officer also serves as the Principal Accounting Officer.
(c) There was no amendment to the registrant’s code of ethics described in Item 2(a) above during the period covered by the report.
(d) There was no waiver granted, either actual or implicit, from a provision to the registrant’s code of ethics described in Item 2(a) above during the period covered by the report.
(e) Not Applicable
(f)(3) The registrant hereby undertakes to provide any person, without charge, upon request, a copy of the code of ethics. To request a copy of the code of ethics, contact the registrant at 1-800-341-7400, and ask for a copy of the Section 406 Standards for Investment Companies - Ethical Standards for Principal Executive and Financial Officers.
Item 3. Audit Committee Financial Expert
The registrant's Board has determined that each of the following members of the Board's Audit Committee is an “audit committee financial expert,” and is "independent," for purposes of this Item: John T. Collins, Thomas M. O'Neill and John S. Walsh.
Item 4. Principal Accountant Fees and Services
(a) Audit Fees billed to the registrant for the two most recent fiscal years:
Fiscal year ended 2015 - $411,650
Fiscal year ended 2014 - $405,300
(b) Audit-Related Fees billed to the registrant for the two most recent fiscal years:
Fiscal year ended 2015 - $174
Fiscal year ended 2014 - $60
Fiscal year ended 2015- Travel to Audit Committee Meeting.
Fiscal year ended 2014- Travel to Audit Committee Meeting.
Amount requiring approval of the registrant’s audit committee pursuant to paragraph (c)(7)(ii) of Rule 2-01 of Regulation S-X, $121 and $3,743 respectively. Fiscal year ended 2015- Travel expenses for attendance at Audit Committee meeting. Fiscal year ended 2014- Audit consent fee for N-1A filing.
(c) Tax Fees billed to the registrant for the two most recent fiscal years:
Fiscal year ended 2015 - $0
Fiscal year ended 2014 - $27,000
Fiscal year ended 2014- Service fee for tax reclaim recovery filings.
Amount requiring approval of the registrant’s audit committee pursuant to paragraph (c)(7)(ii) of Rule 2-01 of Regulation S-X, $0 and $6,162 respectively. Fiscal year ended 2014- Service fee for transfer pricing analysis of co-advisory services.
(d) All Other Fees billed to the registrant for the two most recent fiscal years:
Fiscal year ended 2015 - $0
Fiscal year ended 2014 - $0
Amount requiring approval of the registrant’s audit committee pursuant to paragraph (c)(7)(ii) of Rule 2-01 of Regulation S-X, $43,184 and $30,002 respectively. Fiscal year ended 2015- Service fee for analysis of potential Passive Foreign Investment Company holdings. Fiscal year ended 2014- Service fee for analysis of potential Passive Foreign Investment Company holdings.
(e)(1) Audit Committee Policies regarding Pre-approval of Services.
The Audit Committee is required to pre-approve audit and non-audit services performed by the independent auditor in order to assure that the provision of such services do not impair the auditor’s independence. Unless a type of service to be provided by the independent auditor has received general pre-approval, it will require specific pre-approval by the Audit Committee. Any proposed services exceeding pre-approved cost levels will require specific pre-approval by the Audit Committee.
Certain services have the general pre-approval of the Audit Committee. The term of the general pre-approval is 12 months from the date of pre-approval, unless the Audit Committee specifically provides for a different period. The Audit Committee will annually review the services that may be provided by the independent auditor without obtaining specific pre-approval from the Audit Committee and may grant general pre-approval for such services. The Audit Committee will revise the list of general pre-approved services from time to time, based on subsequent determinations. The Audit Committee will not delegate its responsibilities to pre-approve services performed by the independent auditor to management.
The Audit Committee has delegated pre-approval authority to its Chairman. The Chairman will report any pre-approval decisions to the Audit Committee at its next scheduled meeting. The Committee will designate another member with such pre-approval authority when the Chairman is unavailable.
AUDIT SERVICES
The annual Audit services engagement terms and fees will be subject to the specific pre-approval of the Audit Committee. The Audit Committee must approve any changes in terms, conditions and fees resulting from changes in audit scope, registered investment company (RIC) structure or other matters.
In addition to the annual Audit services engagement specifically approved by the Audit Committee, the Audit Committee may grant general pre-approval for other Audit Services, which are those services that only the independent auditor reasonably can provide. The Audit Committee has pre-approved certain Audit services, all other Audit services must be specifically pre-approved by the Audit Committee.
AUDIT-RELATED SERVICES
Audit-related services are assurance and related services that are reasonably related to the performance of the audit or review of the Company’s financial statements or that are traditionally performed by the independent auditor. The Audit Committee believes that the provision of Audit-related services does not impair the independence of the auditor, and has pre-approved certain Audit-related services, all other Audit-related services must be specifically pre-approved by the Audit Committee.
TAX SERVICES
The Audit Committee believes that the independent auditor can provide Tax services to the Company such as tax compliance, tax planning and tax advice without impairing the auditor’s independence. However, the Audit Committee will not permit the retention of the independent auditor in connection with a transaction initially recommended by the independent auditor, the purpose of which may be tax avoidance and the tax treatment of which may not be supported in the Internal Revenue Code and related regulations. The Audit Committee has pre-approved certain Tax services, all Tax services involving large and complex transactions must be specifically pre-approved by the Audit Committee.
ALL OTHER SERVICES
With respect to the provision of services other than audit, review or attest services the pre-approval requirement is waived if:
| (1) | The aggregate amount of all such services provided constitutes no more than five percent of the total amount of revenues paid by the registrant, the registrant’s adviser (not including any sub-adviser whose role is primarily portfolio management and is subcontracted with or overseen by another investment adviser), and any entity controlling, controlled by, or under common control with the investment adviser that provides ongoing services to the registrant to its accountant during the fiscal year in which the services are provided; |
| (2) | Such services were not recognized by the registrant, the registrant’s adviser (not including any sub-adviser whose role is primarily portfolio management and is subcontracted with or overseen by another investment adviser), and any entity controlling, controlled by, or under common control with the investment adviser that provides ongoing services to the registrant at the time of the engagement to be non-audit services; and |
| (3) | Such services are promptly brought to the attention of the Audit Committee of the issuer and approved prior to the completion of the audit by the Audit Committee or by one or more members of the Audit Committee who are members of the board of directors to whom authority to grant such approvals has been delegated by the Audit Committee. |
The Audit Committee may grant general pre-approval to those permissible non-audit services classified as All Other services that it believes are routine and recurring services, and would not impair the independence of the auditor.
The SEC’s rules and relevant guidance should be consulted to determine the precise definitions of prohibited non-audit services and the applicability of exceptions to certain of the prohibitions.
PRE-APPROVAL FEE LEVELS
Pre-approval fee levels for all services to be provided by the independent auditor will be established annually by the Audit Committee. Any proposed services exceeding these levels will require specific pre-approval by the Audit Committee.
PROCEDURES
Requests or applications to provide services that require specific approval by the Audit Committee will be submitted to the Audit Committee by both the independent auditor and the Principal Accounting Officer and/or Internal Auditor, and must include a joint statement as to whether, in their view, the request or application is consistent with the SEC’s rules on auditor independence.
(e)(2) Percentage of services identified in items 4(b) through 4(d) that were approved by the registrants audit committee pursuant to paragraph (c)(7)(i)(C) of Rule 2-01 of Regulation S-X:
4(b)
Fiscal year ended 2015 – 0%
Fiscal year ended 2014 - 0%
Percentage of services provided to the registrants investment adviser and any entity controlling, controlled by, or under common control with the investment adviser that provides ongoing services to the registrant that were approved by the registrants audit committee pursuant to paragraph (c)(7)(i)(C) of Rule 2-01 of Regulation S-X, 0% and 0% respectively.
4(c)
Fiscal year ended 2015 – 0%
Fiscal year ended 2014 – 0%
Percentage of services provided to the registrants investment adviser and any entity controlling, controlled by, or under common control with the investment adviser that provides ongoing services to the registrant that were approved by the registrants audit committee pursuant to paragraph (c)(7)(i)(C) of Rule 2-01 of Regulation S-X, 0% and 0% respectively.
4(d)
Fiscal year ended 2015 – 0%
Fiscal year ended 2014 – 0%
Percentage of services provided to the registrants investment adviser and any entity controlling, controlled by, or under common control with the investment adviser that provides ongoing services to the registrant that were approved by the registrants audit committee pursuant to paragraph (c)(7)(i)(C) of Rule 2-01 of Regulation S-X, 0% and 0% respectively.
| (g) | Non-Audit Fees billed to the registrant, the registrant’s investment adviser, and certain entities controlling, controlled by or under common control with the investment adviser: |
Fiscal year ended 2015 - $77,151
Fiscal year ended 2014 - $172,756
(h) The registrant’s Audit Committee has considered that the provision of non-audit services that were rendered to the registrant’s adviser (not including any sub-adviser whose role is primarily portfolio management and is subcontracted with or overseen by another investment adviser), and any entity controlling, controlled by, or under common control with the investment adviser that provides ongoing services to the registrant that were not pre-approved pursuant to paragraph (c)(7)(ii) of Rule 2-01 of Regulation S-X is compatible with maintaining the principal accountant’s independence.
Item 5. Audit Committee of Listed Registrants
Not Applicable
Item 6. Schedule of Investments
(a) The registrant’s Schedule of Investments is included as part of the Report to Stockholders filed under Item 1 of this form.
(b) Not Applicable; Fund had no divestments during the reporting period covered since the previous Form N-CSR filing.
Item 7. Disclosure of Proxy Voting Policies and Procedures for Closed-End Management Investment Companies
Item 8. Portfolio Managers of Closed-End Management Investment Companies
Item 9. Purchases of Equity Securities by Closed-End Management Investment Company and Affiliated Purchasers
Item 10. Submission of Matters to a Vote of Security Holders
No Changes to Report
Item 11. Controls and Procedures
(a) The registrant’s President and Treasurer have concluded that the
registrant’s disclosure controls and procedures (as defined in rule 30a-3(c) under the Act) are effective in design and operation and are sufficient to form the basis of the certifications required by Rule 30a-(2) under the Act, based on their evaluation of these disclosure controls and procedures within 90 days of the filing date of this report on Form N-CSR.
(b) There were no changes in the registrant’s internal control over financial reporting (as defined in rule 30a-3(d) under the Act) during the second fiscal quarter of the period covered by this report that have materially affected, or are reasonably likely to materially affect, the registrant’s internal control over financial reporting.
Item 12. Exhibits
(a)(1) Code of Ethics- Not Applicable to this Report.
(a)(2) Certifications of Principal Executive Officer and Principal Financial Officer.
(a)(3) Not Applicable.
(b) Certifications pursuant to 18 U.S.C. Section 1350.
SIGNATURES
Pursuant to the requirements of the Securities Exchange Act of 1934 and the Investment Company Act of 1940, the registrant has duly caused this report to be signed on its behalf by the undersigned, thereunto duly authorized.
Registrant Federated Equity Funds
By /S/ Lori A. Hensler
Lori A. Hensler, Principal Financial Officer
Date December 23, 2015
Pursuant to the requirements of the Securities Exchange Act of 1934 and the Investment Company Act of 1940, this report has been signed below by the following persons on behalf of the registrant and in the capacities and on the dates indicated.
By /S/ J. Christopher Donahue
J. Christopher Donahue, Principal Executive Officer
Date December 23, 2015
By /S/ Lori A. Hensler
Lori A. Hensler, Principal Financial Officer
Date December 23, 2015