UNITED STATES
SECURITIES AND EXCHANGE COMMISSION
Washington, D.C. 20549
FORMN-CSR
CERTIFIED SHAREHOLDER REPORT OF REGISTERED
MANAGEMENT INVESTMENT COMPANIES
Investment Company Act file number:811-04033
Sit Mutual Funds II, Inc.
(Exact name of registrant as specified in charter)
3300 IDS Center
80 South Eighth Street
Minneapolis, MN 55402
(Address of principal executive offices)
Paul E. Rasmussen, VP Treasurer
Sit Mutual Funds, Inc.
3300 IDS Center
80 South Eighth Street
Minneapolis, MN 55402
(Name and address of agent for service)
Copy to:
Mike Radmer, Esq.
Dorsey & Whitney
Suite 1500
50 South Sixth Street
Minneapolis, MN 55402-1498
Registrant’s telephone number, including area code: (612)332-3223
Date of fiscal year end: March 31, 2019
Date of reporting period: March 31, 2019
Item 1: Reports to Stockholders
|
Sit Mutual Funds BOND FUNDS ANNUAL REPORT TABLE OF CONTENTS |
This document must be preceded or accompanied by a Prospectus.
CHAIRMAN’S LETTER
May 3, 2019
Dear fellow shareholders:
The story of U.S. fixed income markets over the last twelve months can be divided into two chapters. The first chapter is dominated by a hawkish Federal Reserve methodically raising the Fed Funds Rate every quarter into December 2018. The second followed the dramatic dovish pivot by the Fed in early January and the vigorous bond market rally that ensued. The fiscal year ended with a much publicized, albeit brief, inversion of the Treasury yield curve between3-month bill rates and10-year bonds.
The Fed drove short-term rates steadily higher throughout 2018, which flattened the yield curve as longer-term rates did not rise proportionately. The Fed pivoted in early 2019 and long rates dropped sharply. The3-monthT-bill rate was at 1.73% at the end of March 2018 and closed at 2.40% a year later, up 67 basis points. Yields on the10-year Treasury went on a roller coaster ride, from 2.74% at the end of March 2018 to as high as 3.24% on November 8th (highest since May 2011), collapsing to 2.39% by March 28, 2019 (lowest since December 2017). This net decline of 35 basis points over the year ending 3/31/19 caused the yield curve to pancake. Indeed, a notable inversion occurred for five days in late March 2019 in the closely watched3-month/10-year “economists’ curve.” Yields on the3-monthT-bill were slightly higher (up to 5 bps) than those for the10-year bond. The30-year Treasury yield was not quite as volatile over the 12 months. It started at 2.97%, peaked at 3.46% on November 2nd, before settling at the end of March 2019 at a12-month low of 2.81%, not far from where it was 12 months ago.
Federal Reserve Drive to Normalization Stalls
Jerome Powell assumed the Chair of the Federal Reserve in February 2018 in the midst of a momentous Fed campaign to normalize monetary policy that had been formulated under his two predecessors. In December 2013, the Fed had finally begun “tapering” (reducing) Quantitative Easing (QE) – a ground-breaking shock treatment program of asset purchases started in 2007 to combat the Great Recession. All QE new purchases were ended by December 2014, topping the Fed balance sheet off at $4.5 trillion (up from $807 billion as of August 2007). Next, in December 2015, the Fed raised the Fed Funds Rate for the first time since June 2006, to a target of 0.25% - 0.50%. The Fed Funds Rate had been effectively held at zero since December 2008. The Fed waited another year before raising rates again. Then in March 2017, the Fed launched a series of regular quarterly rate hikes of 0.25%. By December 2018, it had implemented 7 hikes, bringing the Fed Funds rate up to the current 2.25% - 2.50% level. Meanwhile, in October 2017 the Fed began quantitative tightening - reducing the size of its balance sheet by gradually curtailing reinvestment of cash flows from its portfolio. The fullramp-up of balance sheet reduction to $50 billion per month was attained in October 2018. Notably, the Fed was the only major central bank shrinking its portfolio.
Shift to Patience
Pursuing the path to normalization has been an evolving process for Chairman Powell. In early October 2018, he stated that the Fed was a “long way” from neutral, which precipitated a stock market
sell-off. In November, the position was softened to “just below neutral.” Inmid-December 2018, most Fed Governors still believed that two more interest rate increases were likely. In December, a comment that balance sheet reduction was on “auto-pilot” caused a steep stock market swoon. Meanwhile, a flurry of weak economic reports came forth around the time of the December 19th Fed hike, causing corporate bond spreads to widen sharply. Oil prices tumbled, unemployment claims had a sharp uptick, and retail sales slowed. The stock market had its worst December performance since 1931. Negative market sentiment reached levels not seen since 2008.
A sudden Fed reversal occurred early in January, which some central bank watchers interpreted as a “Powell Put” on the stock market. He stated that the Fed was “listening” to the markets, would be “patient,” and was not on a preset path to raising rates. “The case for raising rates has weakened somewhat,” he added later that month, and the current Fed Funds rate is now in neutral range. In March, the shift to neutral was complete with the announcement that balance sheet reduction would start phasing out in May and stabilize in 4Q19 at $3.5 trillion. Upward pressures on interest rates have been placed on hold, as the Fed waits for direction in future data. The Fed is now in a “no win” predicament at this late stage of the economic expansion, as uncertainty is high, and clarity in the outlook is low.
The Fed has also begun a listening tour that suggests a review of the dual mandate is underway. “Low inflation is one of the major challenges of our time” Powell declared in March. Since formally adopting a 2% inflation target in 2012, the Fed has not consistently met the target, despite bringing unemployment significantly below previously assumed levels of natural full employment to lows rarely seen in the last 50 years. This economic expansion is very likely to become the longest in U.S. history by this July and could extend well into election year 2020 as long as inflation remains quite mild, and the Fed is so accommodative. Comments from Fed Governors suggest that the Fed may tolerate surges of inflation over 2% for extended periods in the future.
Economic Data Flashing Yellow
The Fed has demonstrably fulfilled its goal of full employment with stable low inflation – a Goldilocks environment. However, the full and longer-term costs of achieving this may become clearer with the benefit of hindsight. Times have changed. Quantitative easing appears likely to have become a permanent weapon in the arsenal of central banks, particularly since over 20% of sovereign debt still bears negative nominal interest rates at time of this writing. Record low interest rates in Europe and Japan exert downward pressure on U.S. interest rates, but their influence is limited by the effects of currency hedging costs. Europe and Japan may require central bank purchases to induce economic growth in the future.
Meanwhile, there are signs of continued U.S. economic expansion, although at a slower pace than the robust,fiscal-cut-stimulated growth of 2018. These include further recent lows in unemployment claims, still healthy U.S. Purchasing Managers’ Index levels (despite recent dips), overall home price appreciation (although tepid sales),
| | | | |
| | | | |
2 | | | SIT MUTUAL FUNDS ANNUAL REPORT | |
and increases in hourly earnings. Household debt is much lower now than in the previous market cycle. Lower mortgage rates and a rebound in equities also provide some tailwind. A likely trade deal with China, coupled with economic stimulus in China’s economy, should provide some lift later in 2019. A looming scarcity of qualified labor is currently the main concern in surveys of employers and suggests inflationary sparks could ignite. The temporary effects of the record federal government shutdown from December 22nd to January 25th as well as the unusually cold polar vortex winter, are now also removed.
Another key support for the U.S. economy is increasing federal deficit spending. It is highly unusual to have deficits of the current magnitude (4.5% of GDP) - and also to have such a sharply rising debt/GDP ratio - while unemployment is at historic lows with growth as solid as last year. The federal deficit exceeds the entire amount of expected GDP growth. The $1 trillion U.S. deficit in 2019 will be financed by spiraling Treasury borrowing, in addition to hundreds of billions of maturing notes rolled over each year. This supply should increasingly pressure bond market yields (notwithstandingnew-fangled Modern Monetary Theory claims). When a recession eventually arrives, deficit borrowing could surge to unprecedented levels and push up interest rates at a difficult juncture.
Meaning of Yield Curve Inversion
The3-month/10-year yield curve inversion in late March 2019 was highlighted in the media as a strong portent of recession. For many economists to make this call, a longer and deeper inversion is necessary than the brief 1 to 5 basis points inversion seen over this5-day period (which at time of this writing has dissipated). Moreover, a3-month/10-year inversion is usually preceded by inversions of the2-year/10-year and5-year/30-year curves. That did not happen this time.
Perhaps most importantly, the Fed has ceased tightening for the time being. Yield curve inversions in the past were harbingers of further near-term Fed increases, which in turn helped cause recessions. This time may be different, as the Fed is more apprehensive about triggering a recession with central banks around the world struggling with normalization. In the past, the Fed kept hiking rates due to concerns over rising inflation - which is missing now. Moreover, analysts have posited that inversions may become more frequent since the “term premium” of the yield curve (excess yield for longer duration bonds) may have fundamentally shifted to new lows. Fed market activity, such as concentrating Treasury issuance in shorter
maturities, also has had a substantial impact on the slope of the yield curve. On balance, the flat yield curve may merely be signaling that the Fed is in neutral. It may stay flat for an extended period.
Strategy
This year may unfold similarly to 2015 and 2016, when U.S. growth slowed, and fears of recession were running strong. We remain cautiously optimistic on the economy, and mindful of the potential for interest rate surprises. While the future path of interest rates remains somewhat uncertain, we believe that uncertainty will create opportunities over the next few years. We believe the Sit Funds are well positioned to take advantage of these opportunities while continuing to earn substantial levels of current income.
The U.S. Government Securities Fund remains focused on a core of seasoned, high coupon federal Agency mortgage securities with short duration which should continue to provide superior long-term income and principal stability. The Sit Quality Income Fund also maintains a defensive posture against increases in short-term interest rates, through its combination of very short duration and higher quality assets such as government securities, residential mortgage backed securities, short-term asset-backed securities, and taxable municipal bonds. The shorter-than-benchmark duration makes it particularly attractive as a cash management vehicle
Thetax-exempt fixed income strategy for both the Tax-Free Income Fund and the MinnesotaTax-Free Income Fund prioritizestax-exempt coupon income, which is the primary source of total return over longer periods of time. Our investment approach relies heavily on the use of higher coupon bonds, as well as bonds structured with call provisions, sinking funds, and prepayment clauses that provide attractive and regular cash flows. We also continue to focus on sectors and security features that offer incremental yield, while diversifying to manage credit risk.
We appreciate your continued interest in the Sit family of funds.
With best wishes,

Roger J. Sit
Chairman and President Sit Mutual Funds
|
|
| |
Sit U.S. Government Securities Fund |
OBJECTIVE & STRATEGY
The objective of the U.S. Government Securities Fund is to provide high current income and safety of principal, which it seeks to attain by investing solely in debt obligations issued, guaranteed or insured by the U.S. government or its agencies or its instrumentalities. Agency mortgage securities and U.S. Treasury securities are the principal holdings in the Fund. The mortgage securities that the Fund purchases consist of pass-through securities including those issued by Government National Mortgage Association (GNMA), Federal National Mortgage Association (FNMA), and Federal Home Loan Mortgage Corporation (FHLMC).
The Sit U.S. Government Securities Fund provided a return of +3.31% during the12-month period ending March 31, 2019, compared to the return of the Bloomberg Barclays Intermediate Government Bond Index of +3.79%. The Fund’s30-day SEC yield was 3.39% and its12-month distribution rate was 2.15%.
During the12-month period, the Fund benefited from the consistent relatively high level of income provided by its holdings in higher coupon government agency mortgages. The Fund reduces interest rate risk by using futures and options on Treasury securities. The use of futures and options was successful in providing stability to the Fund’s net asset value, however, detracted from the return. The Federal Reserve hiked the Fed Funds rate three times over the12-month period as it continued to normalize monetary policy. The strong U.S. economy caused interest rates to climb higher throughout most of 2018; however, as the global economy has begun to slow, the Federal Reserve has reversed course on both the normalization of monetary policy as well as the reduction of the balance sheet. The about face caused both short- and long-term interest rates to fall. The Federal Reserve now expects to reduce the balance sheet to $3.5 trillion by fourth quarter of 2019, a much smaller reduction than previously reported. They also expect to pause with further rate hikes for the foreseeable future. As a result, we expect interest rates to remain lower until global concerns wane or growth in the U.S. economy accelerates. The Fund’s high coupon mortgages should continue to produce an income advantage in this environment as prepayments are likely to remain stable.
We continue to position the Fund defensively against rising short-term interest rates while maintaining the Fund’s focus on seasoned, high coupon agency mortgage securities which provide a high level of income with relatively stable prices. This high level of income and stability of principal has been a fundamental focus of the Fund since its inception.
| | |
Bryce A. Doty, CFA | | Mark H. Book, CFA |
Senior Portfolio Manager | | Portfolio Manager |
HYPOTHETICAL GROWTH OF $10,000
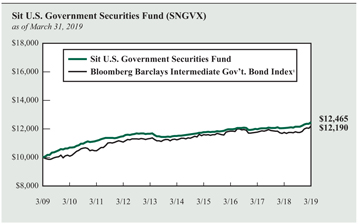
The chart above illustrates the total value of a hypothetical $10,000 investment in the Fund over the past 10 years (or for the life of the Fund if shorter) as compared to the performance of the Bloomberg Barclays Intermediate Government Bond Index. Past performance does not guarantee future results. Returns include the reinvestment of distributions. The chart does not reflect the deduction of taxes that a shareholder would pay on Fund distributions or the redemption of Fund shares.
1 The Bloomberg Barclays Intermediate Government Bond Index is asub-index of the Bloomberg Barclays Government Bond Index covering issues with remaining maturities of between three and five years. The Bloomberg Barclays Government Bond Index is an index that measures the performance of all public U.S. government obligations with remaining maturities of one year or more. The returns include the reinvestment of income and do not include any transaction costs, management fees or other costs. It is not possible to invest directly in an index. This is the Fund’s primary index.
| | |
| Information on this page is unaudited. |
4 | | SIT MUTUAL FUNDS ANNUAL REPORT |
| | | | | | | | | | | | |
| COMPARATIVE RATES OF RETURNS | |
as of March 31, 2019 | | | | | | | | | | | | |
| | | Sit U.S.
Government
Securities
Fund | | Bloomberg
Barclays
Inter. Gov’t
Bond Index1 | | Lipper
U.S.
Gov’t Fund
Index2 |
| | | |
One Year | | | 3.31 | % | | | 3.79 | % | | | 3.83 | % |
| | | |
Five Years | | | 1.61 | | | | 1.65 | | | | 2.27 | |
| | | |
Ten Years | | | 2.23 | | | | 2.00 | | | | 2.98 | |
| | | |
Since Inception (6/2/87) | | | 5.20 | | | | 5.36 | | | | 5.25 | |
Performance figures are historical and do not guarantee future results. Investment returns and principal value will vary, and you may have a gain or loss when you sell shares. Current performance may be lower or higher than the performance data quoted. Contact the Fund for performance data current to the most recentmonth-end. Returns include changes in share price as well as reinvestment of all dividends and capital gains and all fee waivers. Without the fee waivers total return and yield figures would have been lower. Returns do not reflect the deduction of taxes that a shareholder would pay on Fund distributions or the redemption of Fund shares. Management fees and administrative expenses are included in the Fund’s performance. Returns for periods greater than one year are compounded average annual rates of return.
1 The Bloomberg Barclays Intermediate Government Bond Index is asub-index of the Bloomberg Barclays Government Bond Index covering issues with remaining maturities of between three and five years. The Bloomberg Barclays Government Bond Index is an index that measures the performance of all public U.S. government obligations with remaining maturities of one year or more. The returns include the reinvestment of income and do not include any transaction costs, management fees or other costs. It is not possible to invest directly in an index.
2 The Lipper returns are obtained from Lipper Analytical Services, Inc., a large independent evaluator of mutual funds.
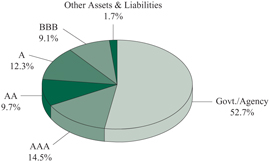
FUND DIVERSIFICATION
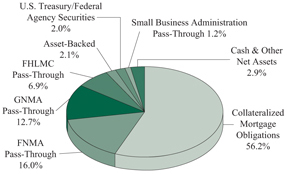
Based on total net assets as of March 31, 2019. Subject to change.
| | |
PORTFOLIO SUMMARY |
Net Asset Value 3/31/19: | | $10.92 Per Share |
Net Asset Value 3/31/18: | | $10.80 Per Share |
Total Net Assets: | | $427.3 Million |
Effective Duration3: | | 3.1 Years |
3 Duration is a measure of estimated price sensitivity relative to changes in interest rates. Portfolios with longer durations are typically more sensitive to changes in interest rates. For example, if interest rates rise by 1%, the fair value of a security with an effective duration of 5 years would decrease by 5%, with all other factors being constant. The correlation between duration and price sensitivity is greater for securities rated investment-grade than it is for securities rated below investment-grade. Duration estimates are based on assumptions by the Adviser and are subject to a number of limitations. Effective duration is calculated based on historical price changes of securities held by the Fund, and therefore is a more accurate estimate of price sensitivity provided interest rates remain within their historical range.
| | | | |
ESTIMATED AVERAGE LIFE | |
| |
0-1 Year | | | 2.9 | % |
| |
1-5 Years | | | 93.7 | |
| |
5-10 Years | | | 2.6 | |
| |
20+ Years | | | 0.8 | |
The table represents the Adviser’s estimates of the dollar weighted average life of the portfolio’s securities, which differ from their stated maturities. The Fund’s average stated maturity was 18.1 years as of March 31, 2019.
| | |
| Information on this page is unaudited. |
| MARCH 31, 2019 | | 5 |
SCHEDULE OF INVESTMENTS
March 31, 2019
Sit U.S. Government Securities Fund
| | | | | | | | | | |
Principal
Amount ($) | | Coupon Rate (%) | | Maturity
Date | | | Fair
Value ($) | |
| |
Mortgage Pass-Through Securities - 36.8% | | | | | |
Federal Home Loan Mortgage Corporation - 6.9% | | | | | |
185,301 | | 4.00 | | | 7/1/25 | | | | 191,233 | |
966,681 | | 5.00 | | | 5/1/42 | | | | 1,043,185 | |
1,220,513 | | 5.00 | | | 9/1/43 | | | | 1,325,449 | |
54,147 | | 5.82 | | | 10/1/37 | | | | 58,288 | |
469,391 | | 6.50 | | | 12/1/34 | | | | 517,358 | |
2,001,812 | | 6.50 | | | 11/1/35 | | | | 2,254,356 | |
238,566 | | 6.88 | | | 2/17/31 | | | | 265,362 | |
63,986 | | 7.00 | | | 8/1/27 | | | | 65,896 | |
22,876 | | 7.00 | | | 10/1/27 | | | | 22,948 | |
920,290 | | 7.00 | | | 4/1/28 | | | | 986,637 | |
7,548,948 | | 7.00 | | | 12/1/31 | | | | 8,461,760 | |
509,088 | | 7.00 | | | 2/1/37 | | | | 556,108 | |
6,040,941 | | 7.00 | | | 10/1/37 | | | | 7,065,410 | |
2,916,834 | | 7.00 | | | 10/1/38 | | | | 3,380,255 | |
700,965 | | 7.00 | | | 1/1/39 | | | | 810,840 | |
79,478 | | 7.38 | | | 12/17/24 | | | | 83,331 | |
102,085 | | 7.50 | | | 1/1/31 | | | | 105,393 | |
536,322 | | 7.50 | | | 1/1/32 | | | | 600,692 | |
349,766 | | 7.50 | | | 8/1/32 | | | | 373,957 | |
45,509 | | 7.50 | | | 10/1/38 | | | | 47,371 | |
12,227 | | 7.95 | | | 10/1/25 | | | | 12,248 | |
13,660 | | 7.95 | | | 11/1/25 | | | | 13,682 | |
71,324 | | 8.00 | | | 5/1/31 | | | | 76,244 | |
65,693 | | 8.00 | | | 11/1/36 | | | | 74,595 | |
140,296 | | 8.00 | | | 1/1/37 | | | | 159,886 | |
179,627 | | 8.50 | | | 12/1/21 | | | | 187,069 | |
177,766 | | 8.50 | | | 6/20/27 | | | | 202,138 | |
37,328 | | 8.50 | | | 12/1/29 | | | | 40,275 | |
111,016 | | 8.50 | | | 3/1/31 | | | | 126,243 | |
15,325 | | 9.00 | | | 11/1/25 | | | | 15,557 | |
42,922 | | 9.00 | | | 3/20/27 | | | | 43,105 | |
122,834 | | 9.00 | | | 2/17/31 | | | | 124,341 | |
123,488 | | 9.00 | | | 5/1/31 | | | | 136,456 | |
24,891 | | 9.50 | | | 12/17/21 | | | | 24,928 | |
4,243 | | 10.00 | | | 9/1/20 | | | | 4,260 | |
6,960 | | 10.00 | | | 3/1/21 | | | | 6,990 | |
25,012 | | 10.00 | | | 3/17/25 | | | | 25,217 | |
5,505 | | 10.00 | | | 3/25/25 | | | | 5,544 | |
22,465 | | 10.00 | | | 7/1/30 | | | | 22,686 | |
2,217 | | 10.50 | | | 6/1/19 | | | | 2,214 | |
760 | | 11.00 | | | 8/25/20 | | | | 766 | |
| | | | | | | | | | |
| | | |
| | | | | | | | | 29,520,273 | |
| | | | | | | | | | |
| | | | | | | | | | |
Principal
Amount ($) | | Coupon Rate (%) | | Maturity
Date | | | Fair
Value ($) | |
| |
Federal National Mortgage Association - 16.0% | | | | | |
5,763,035 | | 4.50 | | | 4/1/48 | | | | 6,132,689 | |
409,800 | | 5.50 | | | 6/1/33 | | | | 435,440 | |
72,124 | | 5.61 | | | 11/1/22 | | | | 72,074 | |
936,529 | | 5.93 | | | 5/1/35 | | | | 964,392 | |
2,812,021 | | 5.96 | | | 6/1/28 | | | | 3,248,253 | |
703,592 | | 6.00 | | | 11/1/34 | | | | 775,825 | |
191,100 | | 6.00 | | | 5/1/37 | | | | 207,239 | |
96,742 | | 6.00 | | | 9/1/37 | | | | 104,505 | |
255,960 | | 6.00 | | | 11/1/37 | | | | 266,729 | |
2,088,747 | | 6.00 | | | 4/1/38 | | | | 2,287,104 | |
7,309,324 | | 6.00 | | | 5/1/41 | | | | 8,061,013 | |
2,318,789 | | 6.06 | | | 11/1/43 | | | | 2,564,750 | |
14,660 | | 6.50 | | | 1/1/22 | | | | 14,855 | |
1,963,987 | | 6.50 | | | 2/1/29 | | | | 2,169,078 | |
313,259 | | 6.50 | | | 3/1/29 | | | | 333,853 | |
4,806,248 | | 6.50 | | | 12/1/30 | | | | 5,371,627 | |
359,422 | | 6.50 | | | 6/1/31 | | | | 404,917 | |
63,834 | | 6.50 | | | 8/1/34 | | | | 69,173 | |
1,029,705 | | 6.50 | | | 12/1/36 | | | | 1,167,884 | |
308,265 | | 6.50 | | | 1/1/39 | | | | 339,220 | |
3,702,356 | | 6.50 | | | 6/1/40 | | | | 4,244,806 | |
1,724,847 | | 6.50 | | | 9/1/40 | | | | 2,016,639 | |
1,238,794 | | 6.75 | | | 6/1/32 | | | | 1,414,009 | |
1,192,395 | | 6.92 | | | 6/1/40 | | | | 1,327,544 | |
29,527 | | 1 Mo. Libor + 2.27, 6.95% | | | 8/1/21 | 1 | | | 28,845 | |
24,690 | | 7.00 | | | 9/1/21 | | | | 25,257 | |
87,958 | | 7.00 | | | 3/1/22 | | | | 90,332 | |
118,628 | | 7.00 | | | 6/1/22 | | | | 121,713 | |
56,423 | | 7.00 | | | 1/1/24 | | | | 58,768 | |
35,759 | | 7.00 | | | 2/1/26 | | | | 37,396 | |
86,158 | | 7.00 | | | 9/1/27 | | | | 91,064 | |
45,038 | | 7.00 | | | 10/1/27 | | | | 48,008 | |
205,753 | | 7.00 | | | 11/1/27 | | | | 226,407 | |
39,454 | | 7.00 | | | 1/1/28 | | | | 41,949 | |
39,642 | | 7.00 | | | 10/1/32 | | | | 42,803 | |
4,907,651 | | 7.00 | | | 12/1/32 | | | | 5,663,731 | |
101,212 | | 7.00 | | | 7/1/33 | | | | 110,537 | |
124,583 | | 7.00 | | | 7/1/34 | | | | 139,485 | |
606,265 | | 7.00 | | | 3/1/37 | | | | 703,505 | |
878,079 | | 7.00 | | | 10/1/37 | | | | 1,029,840 | |
39,564 | | 7.00 | | | 12/1/37 | | | | 42,652 | |
730,275 | | 7.00 | | | 11/1/38 | | | | 873,018 | |
2,632,567 | | 7.00 | | | 3/1/39 | | | | 3,076,601 | |
863,466 | | 7.00 | | | 5/1/39 | | | | 997,418 | |
1,729,130 | | 7.00 | | | 1/1/40 | | | | 1,993,967 | |
600,349 | | 7.00 | | | 9/1/47 | | | | 638,036 | |
27,484 | | 7.50 | | | 6/1/22 | | | | 28,245 | |
12,297 | | 7.50 | | | 8/1/22 | | | | 12,341 | |
31,571 | | 7.50 | | | 12/1/22 | | | | 31,841 | |
35,859 | | 7.50 | | | 3/1/23 | | | | 36,133 | |
194,397 | | 7.50 | | | 4/1/32 | | | | 216,724 | |
10,593 | | 7.50 | | | 8/1/32 | | | | 10,789 | |
| | | | |
See accompanying notes to financial statements. | | | | |
6 | | | SIT MUTUAL FUNDS ANNUAL REPORT | |
| | | | | | | | | | |
Principal
Amount ($) | | Coupon Rate (%) | | Maturity
Date | | | Fair
Value ($) | |
| | | |
219,639 | | 7.50 | | | 1/1/34 | | | | 240,966 | |
1,015,013 | | 7.50 | | | 10/1/37 | | | | 1,206,268 | |
1,878,852 | | 7.50 | | | 11/1/38 | | | | 2,191,663 | |
19,402 | | 7.59 | | | 7/20/30 | | | | 19,538 | |
67,632 | | 8.00 | | | 10/1/23 | | | | 69,413 | |
256,279 | | 8.00 | | | 6/1/25 | | | | 272,048 | |
7,919 | | 8.00 | | | 7/20/28 | | | | 7,981 | |
104,868 | | 8.00 | | | 2/1/31 | | | | 118,984 | |
91,641 | | 8.00 | | | 1/1/32 | | | | 100,490 | |
310,544 | | 8.00 | | | 11/1/37 | | | | 353,467 | |
330,315 | | 8.00 | | | 3/1/38 | | | | 388,478 | |
109,047 | | 8.08 | | | 11/15/31 | | | | 120,853 | |
2,846 | | 8.33 | | | 7/15/20 | | | | 2,857 | |
85,891 | | 8.50 | | | 11/1/26 | | | | 89,696 | |
106,987 | | 8.50 | | | 3/1/28 | | | | 118,215 | |
67,342 | | 8.50 | | | 10/1/28 | | | | 76,626 | |
35,302 | | 8.50 | | | 11/1/28 | | | | 39,065 | |
223,208 | | 8.50 | | | 4/1/29 | | | | 247,867 | |
47,932 | | 8.50 | | | 10/1/29 | | | | 48,323 | |
96,640 | | 8.50 | | | 7/1/30 | | | | 109,399 | |
65,324 | | 8.50 | | | 8/1/30 | | | | 78,252 | |
248,301 | | 8.50 | | | 4/1/32 | | | | 298,602 | |
339,028 | | 8.50 | | | 1/1/37 | | | | 403,150 | |
17,033 | | 8.84 | | | 8/20/25 | | | | 17,246 | |
22,216 | | 9.00 | | | 9/1/24 | | | | 22,415 | |
11,372 | | 9.00 | | | 6/15/25 | | | | 11,519 | |
49,749 | | 9.00 | | | 6/1/30 | | | | 54,262 | |
42,762 | | 9.00 | | | 7/1/30 | | | | 43,866 | |
31,024 | | 9.00 | | | 10/1/30 | | | | 33,862 | |
126,589 | | 9.00 | | | 2/1/31 | | | | 135,405 | |
21,875 | | 9.00 | | | 7/1/31 | | | | 21,915 | |
46,175 | | 9.00 | | | 10/1/31 | | | | 51,655 | |
77,139 | | 9.00 | | | 8/1/37 | | | | 86,301 | |
23,989 | | 9.00 | | | 1/1/38 | | | | 24,167 | |
166,675 | | 9.00 | | | 2/1/38 | | | | 179,902 | |
28,518 | | 9.01 | | | 5/15/28 | | | | 28,947 | |
7,876 | | 9.24 | | | 3/15/22 | | | | 7,958 | |
7,345 | | 9.50 | | | 3/1/20 | | | | 7,438 | |
11,489 | | 9.50 | | | 7/1/20 | | | | 11,697 | |
251 | | 9.50 | | | 12/15/20 | | | | 253 | |
778 | | 9.50 | | | 4/15/21 | | | | 794 | |
23,864 | | 9.50 | | | 8/1/24 | | | | 24,182 | |
171,725 | | 9.50 | | | 5/1/29 | | | | 196,589 | |
32,623 | | 9.50 | | | 4/1/30 | | | | 36,536 | |
156,999 | | 9.50 | | | 8/1/31 | | | | 178,990 | |
701 | | 9.99 | | | 8/15/20 | | | | 705 | |
33,994 | | 10.00 | | | 2/1/28 | | | | 34,570 | |
148,534 | | 10.00 | | | 6/1/30 | | | | 169,294 | |
4,109 | | 10.50 | | | 6/1/28 | | | | 4,119 | |
206 | | 11.01 | | | 7/15/20 | | | | 207 | |
| | | | | | | | | | |
| | | |
| | | | | | | | | 68,398,018 | |
| | | | | | | | | | |
| | | | | | | | | | |
Principal
Amount ($) | | Coupon Rate (%) | | Maturity
Date | | | Fair
Value ($) | |
| |
Government National Mortgage Association - 12.7% | | | | | |
195,830 | | 4.00 | | | 12/15/24 | | | | 201,543 | |
671,453 | | 4.00 | | | 10/20/30 | | | | 698,749 | |
10,601,285 | | 4.00 | | | 8/20/31 | | | | 11,031,742 | |
982,510 | | 4.00 | | | 12/20/31 | | | | 1,022,514 | |
850,262 | | 4.25 | | | 10/20/31 | | | | 889,808 | |
505,258 | | 4.25 | | | 3/20/37 | | | | 528,354 | |
2,440,028 | | 4.75 | | | 9/20/31 | | | | 2,585,871 | |
92,773 | | 5.50 | | | 9/15/25 | | | | 98,857 | |
1,204,658 | | 5.50 | | | 5/15/29 | | | | 1,283,981 | |
2,812,497 | | 5.75 | | | 2/15/29 | | | | 3,015,642 | |
942,737 | | 5.75 | | | 10/20/31 | | | | 1,017,719 | |
605,280 | | 6.00 | | | 9/15/33 | | | | 655,658 | |
487,633 | | 6.00 | | | 2/20/47 | | | | 534,768 | |
4,830,327 | | 6.00 | | | 7/20/47 | | | | 5,245,683 | |
78,811 | | 6.25 | | | 12/15/23 | | | | 85,908 | |
877,399 | | 6.25 | | | 4/15/29 | | | | 956,824 | |
156,387 | | 6.50 | | | 11/15/23 | | | | 164,444 | |
276,318 | | 6.50 | | | 4/15/24 | | | | 289,483 | |
1,046,042 | | 6.50 | | | 2/20/28 | | | | 1,173,208 | |
617,236 | | 6.50 | | | 2/20/29 | | | | 664,859 | |
1,175,768 | | 6.50 | | | 11/20/29 | | | | 1,321,929 | |
3,711,210 | | 6.50 | | | 2/15/35 | | | | 4,170,355 | |
17,367 | | 6.50 | | | 12/20/38 | | | | 18,010 | |
372,729 | | 6.50 | | | 1/20/39 | | | | 421,038 | |
231,908 | | 6.50 | | | 2/20/39 | | | | 262,294 | |
410,067 | | 6.50 | | | 4/20/39 | | | | 463,757 | |
554,575 | | 6.50 | | | 6/20/39 | | | | 627,000 | |
792,753 | | 6.50 | | | 8/20/39 | | | | 888,210 | |
563,390 | | 6.50 | | | 4/20/43 | | | | 628,413 | |
5,806,977 | | 7.00 | | | 8/15/29 | | | | 6,537,160 | |
6,114,050 | | 7.00 | | | 10/15/29 | | | | 6,909,625 | |
| | | | | | | | | | |
| | | |
| | | | | | | | | 54,393,406 | |
| | | | | | | | | | |
Small Business Administration - 1.2% | | | | | |
1,484,185 | | 5.33 | | | 8/25/36 | | | | 1,577,466 | |
3,247,535 | | 5.33 | | | 9/25/36 | | | | 3,444,779 | |
| | | | | | | | | | |
| | | |
| | | | | | | | | 5,022,245 | |
| | | | | | | | | | |
| |
Total Mortgage Pass-Through Securities
(cost: $156,742,821) | | | | 157,333,942 | |
| | | | | | | | | | |
U.S. Treasury / Federal Agency Securities - 2.0% | | | | | |
United States Treasury Strip Principal: | | | | | |
8,000,000 | | 2.86 | | | 8/15/47 | 6 | | | 3,547,408 | |
6,000,000 | | 2.91 | | | 11/15/27 | 6 | | | 4,884,936 | |
| | | | | | | | | | |
| |
Total U.S. Treasury / Federal Agency Securities
(cost: $8,254,167) | | | | 8,432,344 | |
| | | | | | | | | | |
| | | | |
See accompanying notes to financial statements. | | | | |
MARCH 31, 2019 | | | 7 | |
SCHEDULE OF INVESTMENTS
March 31, 2019
Sit U.S. Government Securities Fund (Continued)
| | | | | | | | | | |
Principal
Amount ($) | | Coupon Rate (%) | | Maturity
Date | | | Fair
Value ($) | |
| |
Collateralized Mortgage Obligations - 56.2% | | | | | |
Federal Home Loan Mortgage Corporation - 15.1% | | | | | |
566,183 | | 5.00 | | | 2/15/23 | | | | 585,192 | |
2,020,383 | | 5.44 | | | 7/25/32 | 1 | | | 2,177,258 | |
560,436 | | 5.51 | | | 5/15/38 | 1 | | | 596,247 | |
5,628 | | 6.00 | | | 9/15/21 | | | | 5,756 | |
1,734,209 | | 6.00 | | | 1/15/33 | | | | 2,000,639 | |
2,796,148 | | 6.00 | | | 9/15/42 | | | | 3,167,826 | |
38,980 | | 6.25 | | | 5/15/29 | | | | 41,849 | |
158,944 | | 6.50 | | | 9/15/23 | | | | 168,085 | |
64,709 | | 6.50 | | | 3/15/24 | | | | 69,109 | |
20,759 | | 6.50 | | | 2/15/30 | | | | 22,997 | |
1,198,886 | | 6.50 | | | 8/15/31 | | | | 1,352,514 | |
377,360 | | 6.50 | | | 1/15/32 | | | | 419,635 | |
92,141 | | 6.50 | | | 3/15/32 | | | | 101,996 | |
492,271 | | 6.50 | | | 6/25/32 | | | | 547,078 | |
149,744 | | 6.50 | | | 7/15/32 | | | | 165,715 | |
6,456,569 | | 6.50 | | | 5/15/33 | | | | 7,258,664 | |
1,148,417 | | 6.50 | | | 5/15/35 | | | | 1,312,561 | |
623,989 | | 6.50 | | | 8/15/39 | | | | 710,171 | |
858,005 | | 6.50 | | | 2/25/43 | | | | 994,657 | |
646,518 | | 6.50 | | | 3/25/43 | | | | 724,195 | |
780,419 | | 6.50 | | | 7/25/43 | | | | 898,892 | |
684,724 | | 6.50 | | | 10/25/43 | | | | 794,361 | |
5,540,363 | | 6.50 | | | 8/15/45 | | | | 6,513,569 | |
22,465 | | 6.70 | | | 9/15/23 | | | | 23,903 | |
587,911 | | 6.95 | | | 3/15/28 | | | | 644,154 | |
3 | | 7.00 | | | 12/15/20 | | | | 3 | |
1,541 | | 7.00 | | | 3/15/21 | | | | 1,549 | |
35,574 | | 7.00 | | | 10/15/22 | | | | 37,225 | |
9,673 | | 7.00 | | | 11/15/22 | | | | 10,080 | |
320,984 | | 7.00 | | | 3/25/23 | | | | 334,897 | |
13,945 | | 7.00 | | | 4/15/23 | | | | 14,697 | |
59,148 | | 7.00 | | | 7/15/23 | | | | 62,955 | |
95,245 | | 7.00 | | | 1/15/24 | | | | 101,663 | |
80,712 | | 7.00 | | | 3/15/24 | | | | 85,864 | |
116,203 | | 7.00 | | | 8/15/25 | | | | 126,063 | |
95,029 | | 7.00 | | | 9/15/26 | | | | 103,544 | |
151,843 | | 7.00 | | | 6/15/29 | | | | 169,066 | |
1,167,574 | | 7.00 | | | 8/15/29 | | | | 1,235,702 | |
472,494 | | 7.00 | | | 10/20/29 | | | | 535,357 | |
817,656 | | 7.00 | | | 11/15/29 | | | | 839,847 | |
1,970,407 | | 7.00 | | | 12/15/29 | | | | 2,015,019 | |
122,190 | | 7.00 | | | 1/15/30 | | | | 137,318 | |
305,601 | | 7.00 | | | 10/15/30 | | | | 349,284 | |
170,397 | | 7.00 | | | 7/15/31 | | | | 192,069 | |
124,870 | | 7.00 | | | 4/15/32 | | | | 138,629 | |
719,809 | | 7.00 | | | 5/15/32 | | | | 819,351 | |
3,973,063 | | 7.00 | | | 8/15/41 | | | | 4,415,824 | |
2,388,565 | | 7.00 | | | 2/25/43 | | | | 2,758,563 | |
839,255 | | 7.00 | | | 3/25/43 | | | | 944,092 | |
956,225 | | 7.00 | | | 7/25/43 | | | | 1,123,466 | |
1,885,241 | | 7.00 | | | 9/25/43 | | | | 2,222,496 | |
| | | | | | | | | | |
Principal
Amount ($) | | Coupon Rate (%) | | Maturity
Date | | | Fair
Value ($) | |
| | | |
2,800,259 | | 7.00 | | | 3/15/49 | | | | 3,357,948 | |
18,450 | | 7.50 | | | 10/15/21 | | | | 19,070 | |
85,196 | | 7.50 | | | 7/15/22 | | | | 88,669 | |
149,548 | | 7.50 | | | 3/15/23 | | | | 158,009 | |
545,877 | | 7.50 | | | 4/15/23 | | | | 578,931 | |
68,194 | | 7.50 | | | 9/20/26 | | | | 76,266 | |
337,132 | | 7.50 | | | 3/15/28 | | | | 380,190 | |
409,418 | | 7.50 | | | 9/15/29 | | | | 468,572 | |
166,921 | | 7.50 | | | 12/15/29 | | | | 186,946 | |
242,137 | | 7.50 | | | 6/15/30 | | | | 278,638 | |
361,509 | | 7.50 | | | 8/15/30 | | | | 407,603 | |
478,884 | | 7.50 | | | 9/15/30 | | | | 554,929 | |
130,628 | | 7.50 | | | 11/15/30 | | | | 148,834 | |
3,215,133 | | 7.50 | | | 6/15/34 | | | | 3,768,684 | |
1,269,492 | | 7.50 | | | 8/25/42 | 1 | | | 1,534,765 | |
952,175 | | 7.50 | | | 9/25/43 | | | | 1,107,030 | |
38,810 | | 8.00 | | | 7/15/21 | | | | 39,364 | |
618,562 | | 8.00 | | | 2/15/23 | | | | 657,328 | |
43,108 | | 8.00 | | | 4/25/24 | | | | 46,027 | |
157,840 | | 8.00 | | | 2/15/27 | | | | 178,614 | |
168,420 | | 8.00 | | | 11/20/29 | | | | 193,442 | |
220,252 | | 8.00 | | | 1/15/30 | | | | 254,052 | |
10,593 | | 8.25 | | | 6/15/22 | | | | 11,254 | |
22,958 | | 8.30 | | | 11/15/20 | | | | 23,681 | |
7,265 | | 8.50 | | | 10/15/22 | | | | 7,379 | |
128,767 | | 8.50 | | | 3/15/25 | | | | 144,207 | |
34,415 | | 8.50 | | | 3/15/32 | | | | 39,012 | |
227 | | 9.15 | | | 10/15/20 | | | | 230 | |
| | | | | | | | | | |
| | | |
| | | | | | | | | 64,781,320 | |
| | | | | | | | | | |
Federal National Mortgage Association - 24.8% | | | | | | | | |
849,994 | | 3.93 | | | 8/25/43 | 1 | | | 864,224 | |
347,561 | | 4.55 | | | 6/25/43 | | | | 366,381 | |
960,078 | | 5.00 | | | 6/25/43 | | | | 1,019,223 | |
877,058 | | 5.35 | | | 7/25/37 | 1 | | | 831,608 | |
797,961 | | 5.36 | | | 6/25/42 | | | | 869,385 | |
1,077,596 | | 5.50 | | | 9/25/33 | | | | 1,165,364 | |
4,498,323 | | 5.50 | | | 6/25/40 | | | | 5,036,519 | |
1,416,990 | | 5.57 | | | 12/25/53 | 1 | | | 1,581,710 | |
1,027,897 | | 5.81 | | | 8/25/43 | | | | 1,112,108 | |
1,098,912 | | 5.88 | | | 12/25/42 | 1 | | | 1,191,238 | |
2,214,478 | | 6.00 | | | 5/25/30 | | | | 2,451,746 | |
3,113,167 | | 6.00 | | | 5/25/36 | | | | 3,536,539 | |
202,685 | | 6.00 | | | 6/25/36 | | | | 240,495 | |
2,716,831 | | 6.00 | | | 11/25/43 | | | | 3,010,440 | |
272,779 | | 6.00 | | | 8/25/45 | | | | 300,701 | |
3,530,775 | | 6.00 | | | 2/25/48 | | | | 4,080,126 | |
1,149,758 | | 6.33 | | | 8/25/47 | 1 | | | 1,251,444 | |
316,478 | | 6.50 | | | 8/20/28 | | | | 337,226 | |
174,279 | | 6.50 | | | 3/25/32 | | | | 197,328 | |
421,299 | | 6.50 | | | 6/25/32 | | | | 475,441 | |
333,083 | | 6.50 | | | 7/25/36 | | | | 379,838 | |
117,661 | | 6.50 | | | 9/25/36 | | | | 129,627 | |
287,996 | | 6.50 | | | 3/25/42 | | | | 319,189 | |
| | | | |
See accompanying notes to financial statements. | | | | |
8 | | | SIT MUTUAL FUNDS ANNUAL REPORT | |
| | | | | | | | | | |
Principal
Amount ($) | | Coupon Rate (%) | | Maturity
Date | | | Fair
Value ($) | |
1,848,878 | | 6.50 | | | 5/25/42 | | | | 2,094,551 | |
5,032,398 | | 6.50 | | | 7/25/42 | | | | 5,600,748 | |
396,388 | | 6.50 | | | 9/25/42 | | | | 444,303 | |
875,805 | | 6.50 | | | 11/25/42 | | | | 966,594 | |
4,340,039 | | 6.50 | | | 7/25/44 | | | | 4,819,860 | |
532,183 | | 6.56 | | | 9/25/37 | 1 | | | 593,738 | |
367,420 | | 6.66 | | | 2/25/45 | 1 | | | 420,023 | |
4,009,417 | | 6.75 | | | 6/25/32 | | | | 4,575,167 | |
701,393 | | 6.75 | | | 4/25/37 | | | | 768,974 | |
104,521 | | 6.85 | | | 12/18/27 | | | | 115,451 | |
482,720 | | 6.93 | | | 8/25/37 | 1 | | | 509,251 | |
1,923 | | 7.00 | | | 1/25/21 | | | | 1,955 | |
9,616 | | 7.00 | | | 7/25/22 | | | | 9,983 | |
18,065 | | 7.00 | | | 11/25/22 | | | | 18,965 | |
35,464 | | 7.00 | | | 12/25/22 | | | | 37,477 | |
26,472 | | 7.00 | | | 6/25/23 | | | | 27,787 | |
732,877 | | 7.00 | | | 4/25/24 | | | | 776,057 | |
227,479 | | 7.00 | | | 9/18/27 | | | | 250,675 | |
4,595,277 | | 7.00 | | | 5/25/31 | | | | 5,153,863 | |
396,965 | | 7.00 | | | 9/25/40 | | | | 478,469 | |
651,197 | | 7.00 | | | 10/25/41 | | | | 726,519 | |
317,469 | | 7.00 | | | 11/25/41 | | | | 366,762 | |
423,346 | | 7.00 | | | 12/25/41 | | | | 476,942 | |
1,131,299 | | 7.00 | | | 1/25/42 | | | | 1,282,268 | |
1,191,631 | | 7.00 | | | 7/25/42 | | | | 1,362,032 | |
1,945,570 | | 7.00 | | | 10/25/42 | 1 | | | 2,137,764 | |
2,952,386 | | 7.00 | | | 2/25/44 | | | | 3,346,619 | |
145,219 | | 7.00 | | | 8/25/44 | | | | 166,544 | |
40,555 | | 7.50 | | | 8/20/27 | | | | 45,400 | |
279,455 | | 7.50 | | | 10/25/40 | | | | 316,269 | |
787,862 | | 7.50 | | | 11/25/40 | | | | 873,063 | |
887,039 | | 7.50 | | | 6/19/41 | 1 | | | 1,008,686 | |
1,857,667 | | 7.50 | | | 7/25/41 | | | | 2,138,328 | |
1,257,749 | | 7.50 | | | 8/25/41 | | | | 1,447,540 | |
347,631 | | 7.50 | | | 11/25/41 | | | | 402,569 | |
625,747 | | 7.50 | | | 1/25/42 | | | | 720,345 | |
3,090,040 | | 7.50 | | | 2/25/42 | 1 | | | 3,374,305 | |
4,205,277 | | 7.50 | | | 5/25/42 | | | | 4,922,397 | |
456,775 | | 7.50 | | | 6/25/42 | | | | 518,820 | |
3,747,969 | | 7.50 | | | 8/25/42 | 1 | | | 4,413,502 | |
1,378,653 | | 7.50 | | | 2/25/44 | | | | 1,597,303 | |
821,491 | | 7.50 | | | 3/25/44 | | | | 919,039 | |
971,974 | | 7.50 | | | 5/25/44 | | | | 1,136,285 | |
64,352 | | 7.50 | | | 10/25/44 | | | | 73,862 | |
5,860,534 | | 7.50 | | | 1/25/48 | | | | 6,818,857 | |
53,044 | | 8.00 | | | 7/25/22 | | | | 55,955 | |
68,088 | | 8.00 | | | 7/18/27 | | | | 76,045 | |
789,476 | | 8.00 | | | 11/25/37 | 1 | | | 915,373 | |
581,341 | | 8.00 | | | 7/25/44 | | | | 664,074 | |
423,335 | | 8.11 | | | 11/25/37 | 1 | | | 490,981 | |
10,233 | | 8.50 | | | 1/25/21 | | | | 10,325 | |
8,435 | | 8.50 | | | 9/25/21 | | | | 8,730 | |
| | | | | | | | | | |
Principal
Amount ($) | | Coupon Rate (%) | | Maturity
Date | | | Fair Value ($) | |
16,256 | | 8.50 | | | 1/25/25 | | | | 17,868 | |
651,181 | | 8.50 | | | 6/25/30 | | | | 758,612 | |
59,273 | | 8.67 | | | 10/25/42 | 1 | | | 72,936 | |
1,865 | | 8.70 | | | 12/25/19 | | | | 1,881 | |
662 | | 8.75 | | | 9/25/20 | | | | 680 | |
4,619 | | 8.95 | | | 10/25/20 | | | | 4,756 | |
1,795 | | 9.00 | | | 12/25/19 | | | | 1,814 | |
310 | | 9.00 | | | 3/25/20 | | | | 315 | |
11,724 | | 9.00 | | | 5/25/20 | | | | 11,970 | |
910 | | 9.00 | | | 6/25/20 | | | | 932 | |
705 | | 9.00 | | | 7/25/20 | | | | 720 | |
3,117 | | 9.00 | | | 9/25/20 | | | | 3,212 | |
2,388 | | 9.00 | | | 10/25/20 | | | | 2,464 | |
46,194 | | 9.00 | | | 1/25/21 | | | | 47,798 | |
10,936 | | 9.00 | | | 8/25/22 | | | | 11,776 | |
88,516 | | 9.00 | | | 11/25/28 | | | | 99,626 | |
475,186 | | 9.00 | | | 6/25/30 | | | | 570,930 | |
79,511 | | 9.00 | | | 10/25/30 | | | | 95,392 | |
2 | | 9.25 | | | 1/25/20 | | | | 2 | |
164,766 | | 9.36 | | | 6/25/32 | 1 | | | 185,579 | |
2,807 | | 9.50 | | | 3/25/20 | | | | 2,865 | |
392 | | 9.50 | | | 4/25/20 | | | | 399 | |
4,268 | | 9.50 | | | 11/25/20 | | | | 4,417 | |
101,525 | | 9.50 | | | 11/25/31 | | | | 118,703 | |
283,088 | | 9.50 | | | 12/25/41 | | | | 336,683 | |
6,222 | | 9.60 | | | 3/25/20 | | | | 6,320 | |
1,389,875 | | 11.06 | | | 9/25/42 | 1 | | | 1,784,495 | |
431,966 | | 11.26 | | | 6/25/44 | 1 | | | 489,736 | |
24,323 | | 22.23 | | | 3/25/39 | 1 | | | 32,958 | |
| | | | | | | | | | |
| | | |
| | | | | | | | | 105,891,133 | |
| | | | | | | | | | |
Government National Mortgage Association - 13.9% | | | | | |
500,000 | | 5.50 | | | 9/20/39 | | | | 588,089 | |
3,444,580 | | 5.52 | | | 11/20/45 | 1 | | | 3,831,620 | |
6,938,710 | | 5.66 | | | 4/20/40 | 1 | | | 7,838,197 | |
972,517 | | 5.99 | | | 11/20/43 | 1 | | | 1,077,110 | |
2,662,118 | | 6.00 | | | 11/20/33 | | | | 2,932,680 | |
757,409 | | 6.00 | | | 12/20/35 | | | | 852,686 | |
491,638 | | 6.00 | | | 3/20/42 | | | | 548,399 | |
4,665,426 | | 6.00 | | | 3/20/49 | | | | 5,277,763 | |
1,281,877 | | 6.09 | | | 10/20/40 | 1 | | | 1,436,071 | |
2,831,851 | | 6.13 | | | 1/20/39 | 1 | | | 3,239,254 | |
573,193 | | 6.40 | | | 4/20/37 | 1 | | | 636,897 | |
3,116,773 | | 6.49 | | | 6/20/41 | 1 | | | 3,517,069 | |
350,519 | | 6.50 | | | 5/16/32 | | | | 396,188 | |
1,464,759 | | 6.50 | | | 7/20/32 | | | | 1,515,731 | |
303,104 | | 6.50 | | | 2/20/37 | | | | 338,750 | |
303,791 | | 6.50 | | | 9/16/38 | | | | 337,173 | |
4,897,224 | | 6.50 | | | 8/20/48 | | | | 5,715,792 | |
1,011,179 | | 6.56 | | | 7/20/39 | 1 | | | 1,147,940 | |
1,979,096 | | 6.65 | | | 9/20/44 | 1 | | | 2,264,821 | |
618,355 | | 6.66 | | | 4/20/39 | 1 | | | 710,762 | |
1,532,149 | | 6.90 | | | 8/20/40 | 1 | | | 1,763,858 | |
| | | | |
See accompanying notes to financial statements. | | | | |
MARCH 31, 2019 | | | 9 | |
SCHEDULE OF INVESTMENTS
March 31, 2019
Sit U.S. Government Securities Fund (Continued)
| | | | | | | | | | |
Principal
Amount ($) | | Coupon Rate (%) | | Maturity
Date | | | Fair
Value ($) | |
985,535 | | 6.98 | | | 6/20/45 | 1 | | | 1,119,043 | |
682,756 | | 7.00 | | | 6/20/26 | | | | 682,605 | |
178,244 | | 7.00 | | | 9/16/33 | | | | 203,481 | |
573,363 | | 7.00 | | | 5/20/42 | | | | 650,569 | |
2,992,365 | | 7.00 | | | 10/20/48 | | | | 3,445,180 | |
974,960 | | 7.15 | | | 12/20/33 | 1 | | | 1,097,849 | |
2,089,509 | | 7.30 | | | 8/20/38 | 1 | | | 2,363,247 | |
2,638,124 | | 7.47 | | | 7/20/44 | 1 | | | 2,988,762 | |
714,428 | | 7.49 | | | 7/16/24 | | | | 803,122 | |
61,959 | | 7.50 | | | 5/16/27 | | | | 61,878 | |
| | | | | | | | | | |
| | | |
| | | | | | | | | 59,382,586 | |
| | | | | | | | | | |
Vendee Mortgage Trust - 2.4% | | | | | | | | |
2,507,510 | | 6.50 | | | 8/15/31 | | | | 2,845,087 | |
1,160,263 | | 6.50 | | | 10/15/31 | | | | 1,313,551 | |
1,674,847 | | 6.64 | | | 3/15/25 | 1 | | | 1,876,655 | |
989,290 | | 6.75 | | | 2/15/26 | | | | 1,089,858 | |
1,056,445 | | 7.00 | | | 3/15/28 | | | | 1,179,887 | |
172,927 | | 7.25 | | | 9/15/22 | | | | 177,096 | |
365,404 | | 7.25 | | | 9/15/25 | | | | 402,457 | |
532,208 | | 7.75 | | | 5/15/22 | | | | 558,955 | |
494,204 | | 7.75 | | | 9/15/24 | | | | 535,107 | |
173,690 | | 8.00 | | | 2/15/25 | | | | 193,120 | |
103,600 | | 8.29 | | | 12/15/26 | | | | 116,015 | |
| | | | | | | | | | |
| | | |
| | | | | | | | | 10,287,788 | |
| | | | | | | | | | |
Total Collateralized Mortgage Obligations
(cost: $238,554,349) | | | | | | | 240,342,827 | |
| | | | | | | | | | |
| | |
Asset-Backed Securities - 2.1% | | | | | | | | |
Federal Home Loan Mortgage Corporation - 0.4% | | | | | |
738 | | 6.09 | | | 9/25/29 | 1 | | | 723 | |
1,290,456 | | 7.16 | | | 7/25/29 | | | | 1,422,984 | |
| | | | | | | | | | |
| | | |
| | | | | | | | | 1,423,707 | |
| | | | | | | | | | |
Federal National Mortgage Association - 0.5% | | | | | |
15,579 | | 1 Mo. Libor + 0.34, 2.83% | | | 11/25/32 | 1 | | | 15,262 | |
510,684 | | 4.69 | | | 9/26/33 | 14 | | | 556,897 | |
170,661 | | 5.00 | | | 10/25/33 | 14 | | | 176,858 | |
1,141,139 | | 5.75 | | | 2/25/33 | 14 | | | 1,199,777 | |
3,756 | | 6.47 | | | 10/25/31 | 14 | | | 3,865 | |
18,883 | | 6.50 | | | 5/25/32 | 14 | | | 19,202 | |
211,498 | | 6.59 | | | 10/25/31 | 14 | | | 224,428 | |
1,322 | | 6.83 | | | 7/25/31 | 14 | | | 1,313 | |
8,365 | | 7.80 | | | 6/25/26 | 1 | | | 9,360 | |
| | | | | | | | | | |
| | | |
| | | | | | | | | 2,206,962 | |
| | | | | | | | | | |
| | | | | | | | | | |
Principal
Amount ($) | | Coupon Rate (%) | | Maturity
Date | | | Fair Value ($) | |
Small Business Administration - 1.2% | | | | | | | | |
474,656 | | 5.78 | | | 8/1/27 | | | | 501,074 | |
1,986,238 | | 5.87 | | | 7/1/28 | | | | 2,120,414 | |
1,746,343 | | 6.02 | | | 8/1/28 | | | | 1,860,056 | |
287,478 | | 7.13 | | | 10/1/20 | | | | 289,751 | |
185,524 | | 7.33 | | | 8/1/20 | | | | 187,678 | |
193,062 | | 8.03 | | | 5/1/20 | | | | 195,219 | |
| | | | | | | | | | |
| | | |
| | | | | | | | | 5,154,192 | |
| | | | | | | | | | |
Total Asset-Backed Securities
(cost: $8,674,214) | | | | | | | 8,784,861 | |
| | | | | | | | | | |
| | | | |
| Quantity Name of Issuer | | Fair Value ($) | |
Short-Term Securities - 1.2% | | | | |
5,024,306 Fidelity Inst. Money Mkt. Gvt. Fund, 2.31% | | | 5,024,306 | |
| | | | |
(cost: $5,024,306) | | | | |
Total Investments in Securities - 98.3%
(cost: $417,249,857) | | | 419,918,280 | |
| | | | |
| |
Other Assets and Liabilities, net - 1.7% | | | 7,395,608 | |
| | | | |
| |
Total Net Assets - 100.0% | | $ | 427,313,888 | |
| | | | |
| 1 | Variable rate security. Rate disclosed is as of March 31, 2019. Certain variable rate securities are not based on a published reference rate and spread but are determined by the issuer or agent and are based on current market conditions, or, for mortgage-backed securities, are impacted by the individual mortgages which are paying off over time. These securities do not indicate a reference rate and spread in their descriptions. |
| 6 | Zero coupon or convertible capital appreciation bond, for which the rate disclosed is either the effective yield on purchase date or the coupon rate to be paid upon conversion to coupon paying, respectively. |
| 14 | Step Coupon: A bond that pays a coupon rate that increases on a specified date(s). Rate disclosed is as of March 31, 2019. |
Numeric footnotes not disclosed are not applicable to this Schedule of Investments.
| | | | |
See accompanying notes to financial statements. | | | | |
10 | | | SIT MUTUAL FUNDS ANNUAL REPORT | |
A summary of the levels for the Fund’s investments as of March 31, 2019 is as follows (see Note 2 - significant accounting policies in the notes to financial statements):
| | | | | | | | | | | | | | |
| | | Investment in Securities | |
| | | | |
| | | Level 1 | | | Level 2 | | | Level 3 | | | |
| | | Quoted | | | Other significant | | | Significant | | | |
| | | Price ($) | | | observable inputs ($) | | | unobservable inputs ($) | | Total ($) | |
Assets | | | | | | | | | | | | | | |
Mortgage Pass-Through Securities | | | — | | | | 157,333,942 | | | — | | | 157,333,942 | |
U.S. Treasury / Federal Agency Securities | | | — | | | | 8,432,344 | | | — | | | 8,432,344 | |
Collateralized Mortgage Obligations | | | — | | | | 240,342,827 | | | — | | | 240,342,827 | |
Asset-Backed Securities | | | — | | | | 8,784,861 | | | — | | | 8,784,861 | |
Short-Term Securities | | | 5,024,306 | | | | — | | | — | | | 5,024,306 | |
| | | | |
| | | 5,024,306 | | | | 414,893,974 | | | — | | | 419,918,280 | |
There were no transfers into or out of level 3 during the reporting period.
| | | | |
See accompanying notes to financial statements. | | | | |
MARCH 31, 2019 | | | 11 | |
OBJECTIVE & STRATEGY
The objective of the Quality Income Fund is to provide high current income and safety of principal, which it seeks to attain by investing at least 80% of its assets in debt securities issued by the U.S. government and its agencies, debt securities issued by corporations, and mortgage and other asset-backed securities. The Fund invests at least 50% of its assets in U.S. government debt securities, which are securities issued, guaranteed or insured by the U.S. government, its agencies or instrumentalities.
The Sit Quality Income Fund provided a return of +2.17% during the12-month period ending March 31, 2019, compared to the return of the Bloomberg Barclays1-3 Year Government/Credit Bond Index of +3.03%. The Fund’s30-day SEC yield was 2.19% and its12-month distribution rate was 1.94%.
The primary goal of the Fund is to maintain a high credit quality portfolio with stable principal values, while generating a relatively high level of income. During the year, the Fund benefitted from the income advantage produced by its holdings in residential mortgages, corporate, and taxable municipal securities.Non-agency residential mortgages underperformed as the income advantage was not enough to offset the price weakness. Taxable municipal securities outperformed as the strong income return more than offset the underperformance from a price perspective. Corporate securities outperformed despite modest spread widening. The Fund reduces interest rate risk by using futures and options on Treasury securities. The use of futures and options was successful in providing stability to the Fund’s net asset value, however, detracted from the return.
The Federal Reserve hiked interest rates three times over the12-month period, as it continued to seek a more normalized monetary policy. The Federal Reserve’s balance sheet continued to decrease throughout the year which caused interest rates to rise throughout most of 2018. However, global growth concerns and a potential slow patch in the U.S. economy caused the Federal Reserve to reverse course on its normalization policies, causing interest rates to decline. The Federal Reserve now expects to reduce the balance sheet to $3.5 trillion by fourth quarter of 2019, and refrain from future rate hikes for the foreseeable future. As a result, we expect interest rates to remain at current levels until global concerns wane or growth in the U.S. economy accelerates.
We have positioned the Fund defensively, in both credit quality and interest rate sensitivity to maximize return potential while preserving principal. We focus on a mix of Treasury, agency and credit sectors that provide relatively high levels of income and stable prices.
| | |
Bryce A. Doty, CFA | | Mark H. Book, CFA |
Senior Portfolio Manager | | Chris M. Rasmussen, CFA |
| | Portfolio Managers |
HYPOTHETICAL GROWTH OF $10,000
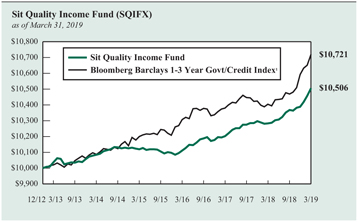
The chart above illustrates the total value of a hypothetical $10,000 investment in the Fund over the past 10 years (or for the life of the Fund if shorter) as compared to the performance of the Bloomberg Barclays1-3 Year Government/Credit Index. Past performance does not guarantee future results. Returns include the reinvestment of distributions. The chart does not reflect the deduction of taxes that a shareholder would pay on Fund distributions or the redemption of Fund shares.
1 The Bloomberg Barclays1-3 Year Government/Credit Index is an unmanaged index of Treasury or government agency securities and investment grade corporate debt securities with maturities of one to three years. The returns include the reinvestment of income and do not include any transaction costs, management fees or other costs. It is not possible to invest directly in an index. This is the Fund’s primary index.
| | |
| Information on this page is unaudited. |
12 | | SIT MUTUAL FUNDS ANNUAL REPORT |
| | | | | | | | | | | | |
COMPARATIVE RATES OF RETURNS | |
| | | |
as of March 31, 2019 | | | | | | | | | | | | |
| | | Sit Quality
Income Fund | | | Bloomberg
Barclays 1-3 Year
Government/Credit
Index1 | | | Lipper
Short
Investment
Grade Bond
Index2 | |
| | | |
One Year | | | 2.17% | | | | 3.03% | | | | 3.11% | |
Five Years | | | 0.82 | | | | 1.22 | | | | 1.53 | |
Since Inception (12/31/12) | | | 0.79 | | | | 1.12 | | | | 1.42 | |
Performance figures are historical and do not guarantee future results. Investment returns and principal value will vary, and you may have a gain or loss when you sell shares. Current performance may be lower or higher than the performance data quoted. Contact the Fund for performance data current to the most recentmonth-end. Returns include changes in share price as well as reinvestment of all dividends and capital gains and all fee waivers. Without the fee waivers total return and yield figures would have been lower. Returns do not reflect the deduction of taxes that a shareholder would pay on Fund distributions or the redemption of Fund shares. Management fees and administrative expenses are included in the Fund’s performance. Returns for the periods greater than one year are compounded average annual rates of return.
1 The Bloomberg Barclays1-3 Year Government/Credit Index is an unmanaged index of Treasury or government agency securities and investment grade corporate debt securities with maturities of one to three years. The returns include the reinvestment of income and do not include any transaction costs, management fees or other costs. It is not possible to invest directly in an index.
2 The Lipper returns are obtained from Lipper Analytical Services, Inc., a large independent evaluator of mutual funds.
| | | | |
FUND DIVERSIFICATION | |
| |
U.S. Treasury/Federal Agency Securities | | | 39.0 | % |
Corporate Bonds | | | 17.4 | |
Mortgage Pass-Through (Agency) | | | 11.9 | |
Taxable Municipal Bonds | | | 11.0 | |
Asset-Backed(Non-Agency) | | | 10.4 | |
Collateralized Mortgage Obligations(Non-Agency) | | | 8.6 | |
Other Net Assets | | | 1.7 | |
Based on total net assets as of March 31, 2019. Subject to change.
| | |
PORTFOLIO SUMMARY |
| |
Net Asset Value 3/31/19: | | $9.80 Per Share |
Net Asset Value 3/31/18: | | $9.78 Per Share |
Total Net Assets: | | $82.3 Million |
Average Maturity: | | 9.7 Years |
Effective Duration3: | | 1.1 Years |
3 Duration is a measure of estimated price sensitivity relative to changes in interest rates. Portfolios with longer durations are typically more sensitive to changes in interest rates. For example, if interest rates rise by 1%, the fair value of a security with an effective duration of 5 years would decrease by 5%, with all other factors being constant. The correlation between duration and price sensitivity is greater for securities rated investment-grade than it is for securities rated below investment-grade. Duration estimates are based on assumptions by the Adviser and are subject to a number of limitations. Effective duration is calculated based on historical price changes of securities held by the Fund, and therefore is a more accurate estimate of price sensitivity provided interest rates remain within their historical range.
QUALITY RATINGS (% of Total Net Assets)
Lower of Moody’s, S&P, Fitch or Duff & Phelps ratings used.
| | |
| Information on this page is unaudited. |
| MARCH 31, 2019 | | 13 |
SCHEDULE OF INVESTMENTS
March 31, 2019
Sit Quality Income Fund
| | | | | | | | | | | | | | | | |
| Name of Issuer | | Principal
Amount ($) | | | Coupon
Rate (%) | | | Maturity
Date | | | Fair Value ($) | |
| | | | |
Asset-Backed Securities - 12.4% | | | | | | | | | | | | | | | | |
Agency - 2.0% | | | | | | | | | | | | | | | | |
FNMA Grantor Trust, Series2004-T5, Class A111 | | | 697,715 | | | | 2.87 | | | | 5/28/35 | | | | 682,990 | |
FNMA REMICS, Series2001-W2, Class AS514 | | | 4,652 | | | | 6.47 | | | | 10/25/31 | | | | 4,787 | |
Small Business Administration, Series2000-20D | | | 40,466 | | | | 7.47 | | | | 4/1/20 | | | | 40,795 | |
Small Business Administration, Series2006-20D, Class 1 | | | 288,175 | | | | 5.64 | | | | 4/1/26 | | | | 300,574 | |
Small Business Administration, Series2007-20B, Class 1 | | | 206,790 | | | | 5.49 | | | | 2/1/27 | | | | 217,246 | |
Small Business Administration, Series2007-20J, Class 1 | | | 337,455 | | | | 5.57 | | | | 10/1/27 | | | | 353,535 | |
| | | | | | | | | | | | | | | | |
| | | | | | | | | | | | | | | 1,599,927 | |
| | | | | | | | | | | | | | | | |
Non-Agency - 10.4% | | | | | | | | | | | | | | | | |
Aegis Asset Backed Securities Corp., Series2003-2, Class M1, 1 Mo. Libor + 1.13%1 | | | 747,206 | | | | 3.61 | | | | 11/25/33 | | | | 747,761 | |
Bayview Opportunity Master Fund, Series 2017-SPL5, Class A1,4 | | | 423,989 | | | | 3.50 | | | | 6/28/57 | | | | 425,267 | |
Bear Stearns Asset Backed Securities I Trust, Series2005-AQ2, Class A3, 1 Mo. Libor + 0.36%1 | | | 125,345 | | | | 2.85 | | | | 9/25/35 | | | | 125,296 | |
Centex Home Equity Loan Trust, Series2004-A, Class AF414 | | | 102,684 | | | | 5.01 | | | | 8/25/32 | | | | 105,026 | |
Centex Home Equity Loan Trust, Series2004-A, Class AF514 | | | 310,000 | | | | 5.43 | | | | 1/25/34 | | | | 320,002 | |
Centex Home Equity Loan Trust, Series2004-D, Class AF614 | | | 5,175 | | | | 5.17 | | | | 9/25/34 | | | | 5,218 | |
CIT Home Equity Loan Trust, Series2003-1, Class A614 | | | 3,943 | | | | 4.56 | | | | 10/20/32 | | | | 3,955 | |
Countrywide Asset-Backed Certificates, Series2004-S1, Class A314 | | | 147,512 | | | | 5.12 | | | | 2/25/35 | | | | 147,972 | |
Credit Acceptance Auto Loan Trust, Series2018-2A, Class B4 | | | 500,000 | | | | 3.94 | | | | 7/15/27 | | | | 508,919 | |
Credit Suisse First Boston Mortgage Securities Corp. Series 2005-AGE1, Class M3, 1 Mo. Libor + 0.65%1 | | | 257,774 | | | | 3.14 | | | | 2/25/32 | | | | 257,134 | |
GSAMP Trust, Series2004-FM1, Class M1, 1 Mo. Libor + 0.98%1 | | | 201,687 | | | | 3.46 | | | | 11/25/33 | | | | 200,209 | |
Irwin Whole Loan Home Equity Trust, Series2005-A, Class M1, 1 Mo. Libor + 0.86%1 | | | 532,628 | | | | 3.34 | | | | 6/25/34 | | | | 531,332 | |
Mill City Mortgage Loan Trust, Series2017-3, Class A11,4 | | | 361,577 | | | | 2.75 | | | | 1/25/61 | | | | 356,313 | |
New Century Home Equity Loan Trust, Series2003-5, Class AI71 | | | 4,622 | | | | 5.08 | | | | 11/25/33 | | | | 4,710 | |
New Residential Mortgage Loan Trust,2018-1A, Class A1A1,4 | | | 441,124 | | | | 4.00 | | | | 12/25/57 | | | | 450,252 | |
New Residential Mortgage Loan Trust, Series2017-6A, Class A11,4 | | | 219,855 | | | | 4.00 | | | | 8/27/57 | | | | 223,295 | |
NovaStar Mortgage Funding Trust, Series2004-2, Class M2, 1 Mo. Libor + 1.02%1 | | | 44,812 | | | | 3.51 | | | | 9/25/34 | | | | 44,692 | |
OSCAR US Funding Trust VI, LLC, Series2017-1A, Class A34 | | | 1,000,000 | | | | 2.82 | | | | 6/10/21 | | | | 999,015 | |
OSCAR US Funding Trust VI, LLC, Series2017-1A, Class A44 | | | 940,000 | | | | 3.30 | | | | 5/10/24 | | | | 945,623 | |
OSCAR US Funding Trust VII, LLC, Series2017-2A, Class A34 | | | 880,000 | | | | 2.45 | | | | 12/10/21 | | | | 874,684 | |
OSCAR US Funding Trust VIII, LLC, Series2018-1A, Class A2A4 | | | 210,252 | | | | 2.91 | | | | 4/12/21 | | | | 210,063 | |
OSCAR US Funding Trust VIII, LLC, Series2018-1A, Class A2B, 1 Mo. Libor + 0.49%1,4 | | | 600,720 | | | | 2.98 | | | | 4/12/21 | | | | 600,831 | |
World Omni Auto Receivables Trust, Series2018-A, Class B | | | 500,000 | | | | 2.89 | | | | 4/15/25 | | | | 500,234 | |
| | | | | | | | | | | | | | | | |
| | | | | | | | | | | | | | | 8,587,803 | |
| | | | | | | | | | | | | | | | |
Total Asset-Backed Securities (cost: $10,179,280) | | | | | | | | | | | | | | | 10,187,730 | |
| | | | | | | | | | | | | | | | |
Collateralized Mortgage Obligations - 32.1% | | | | | | | | | | | | | | | | |
Agency - 23.5% | | | | | | | | | | | | | | | | |
FHLMC Multifamily Structured Pass Through Certificates, Series K007, Class A2 | | | 96,361 | | | | 4.22 | | | | 3/25/20 | | | | 97,410 | |
FHLMC Multifamily Structured Pass Through Certificates, Series K716, Class A2 | | | 2,000,000 | | | | 3.13 | | | | 6/25/21 | | | | 2,019,217 | |
FHLMC Multifamily Structured Pass Through Certificates, Series K727, Class A2 | | | 293,000 | | | | 2.95 | | | | 7/25/24 | | | | 296,821 | |
FHLMC Multifamily Structured Pass Through Certificates, Series K728, Class A21 | | | 2,000,000 | | | | 3.06 | | | | 8/25/24 | | | | 2,038,843 | |
FHLMC Multifamily Structured Pass Through Certificates, Series K729, Class A2 | | | 1,500,000 | | | | 3.14 | | | | 10/25/24 | | | | 1,532,311 | |
FHLMC Multifamily Structured Pass Through Certificates, Series K730, Class A2 | | | 1,500,000 | | | | 3.59 | | | | 1/25/25 | | | | 1,567,385 | |
FHLMC REMICS, Series 2528, Class KM | | | 39,914 | | | | 5.50 | | | | 11/15/22 | | | | 40,952 | |
FHLMC REMICS, Series 3104, Class BY | | | 135,097 | | | | 5.50 | | | | 1/15/26 | | | | 143,786 | |
FHLMC REMICS, Series 3614, Class QA | | | 36,711 | | | | 4.00 | | | | 5/15/24 | | | | 36,698 | |
FHLMC REMICS, Series 3806, Class JA | | | 351,099 | | | | 3.50 | | | | 2/15/26 | | | | 354,942 | |
FHLMC REMICS, Series 4759, Class NA | | | 921,646 | | | | 3.00 | | | | 8/15/44 | | | | 924,649 | |
FHLMC REMICS, Series 4776, Class QG | | | 944,095 | | | | 3.00 | | | | 9/15/42 | | | | 949,396 | |
FNMA ACES, Series2009-M1, Class A2 | | | 24,467 | | | | 4.29 | | | | 7/25/19 | | | | 24,433 | |
| | | | |
See accompanying notes to financial statements. | | | | |
14 | | | SIT MUTUAL FUNDS ANNUAL REPORT | |
| | | | | | | | | | | | | | | | | | | | |
| | | | | |
| Name of Issuer | | Principal
Amount ($) | | Coupon
Rate (%) | | Maturity Date | | Fair Value ($) | |
FNMA ACES, Series2013-M14, Class A21 | | | 327,862 | | | | 3.33 | | | | 10/25/23 | | | | 336,818 | | | | | |
FNMA ACES, Series2013-M9, Class A21 | | | 1,093,125 | | | | 2.39 | | | | 1/25/23 | | | | 1,083,057 | | | | | |
FNMA Grantor Trust, Series2004-T1, Class 2A1 | | | 610,648 | | | | 3.93 | | | | 8/25/43 | | | | 620,871 | | | | | |
FNMA REMICS, Series2003-52, Class NA | | | 50,525 | | | | 4.00 | | | | 6/25/23 | | | | 50,947 | | | | | |
FNMA REMICS, Series2005-19, Class PA | | | 36,535 | | | | 5.50 | | | | 7/25/34 | | | | 36,942 | | | | | |
FNMA REMICS, Series2005-68, Class PC | | | 8,533 | | | | 5.50 | | | | 7/25/35 | | | | 8,640 | | | | | |
FNMA REMICS, Series2008-65, Class CD | | | 18,427 | | | | 4.50 | | | | 8/25/23 | | | | 18,433 | | | | | |
FNMA REMICS, Series2009-13, Class NX | | | 86,066 | | | | 4.50 | | | | 3/25/24 | | | | 86,159 | | | | | |
FNMA REMICS, Series2009-71, Class MB | | | 47,394 | | | | 4.50 | | | | 9/25/24 | | | | 48,674 | | | | | |
FNMA REMICS, Series2009-88, Class DA | | | 3,888 | | | | 4.50 | | | | 10/25/20 | | | | 3,891 | | | | | |
FNMA REMICS, Series2011-16, Class GE | | | 179 | | | | 2.75 | | | | 3/25/26 | | | | 179 | | | | | |
FNMA REMICS, Series2012-19, Class GH | | | 36,316 | | | | 3.00 | | | | 11/25/30 | | | | 36,573 | | | | | |
FNMA REMICS, Series2013-74, Class AD | | | 182,611 | | | | 2.00 | | | | 7/25/23 | | | | 180,666 | | | | | |
FNMA REMICS, Series2017-97, Class DP | | | 1,079,641 | | | | 3.50 | | | | 10/25/46 | | | | 1,090,124 | | | | | |
FNMA REMICS, Series2018-1, Class TE | | | 720,225 | | | | 3.50 | | | | 3/25/44 | | | | 731,438 | | | | | |
FNMA REMICS, Series2018-25, Class AG | | | 757,279 | | | | 3.50 | | | | 4/25/47 | | | | 776,464 | | | | | |
FREMF Multifamily Aggregation Risk Transfer Trust, Series 2017-KT01, Class A, 1 Mo. Libor + 0.32%1 | | | 1,000,000 | | | | 2.81 | | | | 2/25/20 | | | | 999,049 | | | | | |
FRESB Mortgage Trust, Series 2018-SB45, Class A5H, 1 Mo. Libor + 2.96%1 | | | 951,794 | | | | 2.96 | | | | 11/25/37 | | | | 959,025 | | | | | |
FRESB Mortgage Trust, Series 2018-SB46, Class A5H, 1 Mo. Libor + 2.89%1 | | | 883,835 | | | | 2.89 | | | | 12/25/37 | | | | 888,738 | | | | | |
GNMA, Series2011-29, Class JA | | | 15,375 | | | | 4.50 | | | | 4/20/40 | | | | 15,418 | | | | | |
NCUA Guaranteed Notes Trust, Series2010-R1, Class 1A, 1 Mo. Libor + 0.45%1 | | | 180,333 | | | | 2.93 | | | | 10/7/20 | | | | 180,684 | | | | | |
NCUA Guaranteed Notes Trust, Series2010-R3, Class 2A, 1 Mo. Libor + 0.56%1 | | | 1,059,721 | | | | 3.04 | | | | 12/8/20 | | | | 1,063,824 | | | | | |
Vendee Mortgage Trust, Series1993-1, Class ZB | | | 76,006 | | | | 7.25 | | | | 2/15/23 | | | | 81,207 | | | | | |
| | | | | | | | | | | | | | | | | | | | |
| | | | | | | | | | | | | | | 19,324,664 | | | | | |
| | | | | | | | | | | | | | | | | | | | |
Non-Agency - 8.6% | | | | | | | | | | | | | | | | | | | | |
COLT Mortgage Loan Trust, Series2017-1, Class A11,4 | | | 139,506 | | | | 2.61 | | | | 5/27/47 | | | | 138,751 | | | | | |
COLT Mortgage Loan Trust, Series2017-2, Class A2A1,4 | | | 172,830 | | | | 2.57 | | | | 10/25/47 | | | | 172,234 | | | | | |
COLT Mortgage Loan Trust, Series2019-1, Class A11,4 | | | 486,037 | | | | 3.71 | | | | 3/25/49 | | | | 487,731 | | | | | |
GSR Mortgage Loan Trust, Series2005-5F, Class 8A1, 1 Mo. Libor + 0.50%1 | | | 44,189 | | | | 2.99 | | | | 6/25/35 | | | | 41,892 | | | | | |
JPMorgan Mortgage Trust, Series2019-1, Class A61,4 | | | 705,029 | | | | 4.00 | | | | 5/25/49 | | | | 714,334 | | | | | |
MASTR Adjustable Rate Mortgages Trust, Series2004-13, Class 3A11 | | | 212,617 | | | | 4.47 | | | | 11/21/34 | | | | 218,462 | | | | | |
MASTR Alternative Loan Trust, Series2003-4, Class 2A1 | | | 70,286 | | | | 6.25 | | | | 6/25/33 | | | | 73,265 | | | | | |
MASTR Alternative Loan Trust, Series2003-5, Class 4A1 | | | 103,006 | | | | 5.50 | | | | 7/25/33 | | | | 108,722 | | | | | |
MASTR Alternative Loan Trust, Series2003-8, Class 3A1 | | | 108,457 | | | | 5.50 | | | | 12/25/33 | | | | 111,148 | | | | | |
MASTR Asset Securitization Trust, Series2005-2, Class 1A3 | | | 42,000 | | | | 5.35 | | | | 11/25/35 | | | | 43,246 | | | | | |
New Residential Mortgage Loan Trust, Series2017-2A, Class A4 1, 4 | | | 625,172 | | | | 4.00 | | | | 3/25/57 | | | | 635,465 | | | | | |
New Residential Mortgage Loan Trust, Series2017-3A, Class A1 1, 4 | | | 676,057 | | | | 4.00 | | | | 4/25/57 | | | | 690,661 | | | | | |
New Residential Mortgage Loan Trust, Series2017-5A, Class A1 1, 4 | | | 307,072 | | | | 3.99 | | | | 6/25/57 | | | | 311,708 | | | | | |
New Residential Mortgage Loan Trust, Series2018-4, Class A1S, 1 Mo. Libor + 0.75%1,4 | | | 846,861 | | | | 3.24 | | | | 1/25/48 | | | | 840,849 | | | | | |
New Residential Mortgage Loan Trust, Series2019-1A, Class A1 1, 4 | | | 528,520 | | | | 4.00 | | | | 9/25/57 | | | | 534,882 | | | | | |
Prime Mortgage Trust, Series2004-CL1, Class 1A1 | | | 76,585 | | | | 6.00 | | | | 2/25/34 | | | | 80,670 | | | | | |
RAAC Trust, Series2004-SP3, Class AI51 | | | 606 | | | | 4.89 | | | | 12/25/32 | | | | 615 | | | | | |
Sequoia Mortgage Trust, Series2012-2, Class B11 | | | 653,961 | | | | 4.23 | | | | 4/25/42 | | | | 673,586 | | | | | |
Sequoia Mortgage Trust, Series2017-4, Class A41,4 | | | 377,113 | | | | 3.50 | | | | 7/25/47 | | | | 378,704 | | | | | |
Sequoia Mortgage Trust, Series2018-3, Class A41,4 | | | 670,481 | | | | 3.50 | | | | 3/25/48 | | | | 672,046 | | | | | |
Structured Asset Securities, Corp. Mtg Pass-Through Certificates, Series2003-22A, Class 3A1 | | | 86,609 | | | | 4.53 | | | | 6/25/33 | | | | 87,674 | | | | | |
WaMu Mortgage Pass Through Certificates, Series2002-AR2 Class A, US FED + 1.25%1 | | | 70,913 | | | | 2.38 | | | | 2/27/34 | | | | 69,824 | | | | | |
WaMu Mortgage Pass Through Certificates, Series2004-CB2, Class 7A | | | 1,711 | | | | 5.50 | | | | 8/25/19 | | | | 1,707 | | | | | |
| | | | | | | | | | | | | | | | | | | | |
| | | | | | | | | | | | | | | 7,088,176 | | | | | |
| | | | | | | | | | | | | | | | | | | | |
Total Collateralized Mortgage Obligations
(cost: $26,265,048) | | | | | | | | | | | | | | | 26,412,840 | | | | | |
| | | | | | | | | | | | | | | | | | | | |
| | | | |
See accompanying notes to financial statements. | | | | |
MARCH 31, 2019 | | | 15 | |
SCHEDULE OF INVESTMENTS
March 31, 2019
Sit Quality Income Fund (Continued)
| | | | | | | | | | | | | | | | | | | | | | | | | |
| | | | | |
| Name of Issuer | | Principal
Amount ($) | | Coupon
Rate (%) | | Maturity
Date | | Fair Value ($) |
Corporate Bonds - 17.4% | | | | | | | | | | | | | | | | | | | | | | | | | |
Assured Guaranty US Holdings, Inc. | | | | 250,000 | | | | | 5.00 | | | | | 7/1/24 | | | | | 268,068 | | | | | | |
Aviation Capital Group, LLC4 | | | | 425,000 | | | | | 6.75 | | | | | 4/6/21 | | | | | 452,945 | | | | | | |
AXIS Specialty Finance, LLC | | | | 800,000 | | | | | 5.88 | | | | | 6/1/20 | | | | | 824,141 | | | | | | |
Bank of America Corp., 3 Mo. Libor + 0.66%1 | | | | 750,000 | | | | | 3.42 | | | | | 7/21/21 | | | | | 751,796 | | | | | | |
Bank of Montreal | | | | 750,000 | | | | | 2.90 | | | | | 3/26/22 | | | | | 750,735 | | | | | | |
Citigroup, Inc., 3 Mo. Libor + 0.96%1 | | | | 550,000 | | | | | 3.73 | | | | | 4/25/22 | | | | | 554,125 | | | | | | |
CommonSpirit Health | | | | 700,000 | | | | | 2.95 | | | | | 11/1/22 | | | | | 695,189 | | | | | | |
Doric Nimrod Air Finance Alpha2012-1 Trust4 | | | | 486,944 | | | | | 5.13 | | | | | 11/30/22 | | | | | 493,652 | | | | | | |
Duke Energy Florida, LLC | | | | 1,000,000 | | | | | 1.73 | | | | | 9/1/22 | | | | | 974,171 | | | | | | |
Equifax, Inc., 3 Mo. Libor + 0.87%1 | | | | 800,000 | | | | | 3.55 | | | | | 8/15/21 | | | | | 795,017 | | | | | | |
Express Scripts Holding Co. | | | | 733,000 | | | | | 2.60 | | | | | 11/30/20 | | | | | 729,859 | | | | | | |
FS KKR Capital Corp. | | | | 800,000 | | | | | 4.00 | | | | | 7/15/19 | | | | | 801,461 | | | | | | |
Goldman Sachs Group, Inc., 3 Mo. Libor + 1.00%1 | | | | 150,000 | | | | | 3.78 | | | | | 7/24/23 | | | | | 149,922 | | | | | | |
Hawaiian Airlines Pass Through Certificates, Series2013-1, Class A | | | | 724,182 | | | | | 3.90 | | | | | 1/15/26 | | | | | 718,896 | | | | | | |
HSBC Holdings, PLC, 3 Mo. Libor + 1.00%1 | | | | 700,000 | | | | | 3.68 | | | | | 5/18/24 | | | | | 694,264 | | | | | | |
Manufacturers & Traders Trust Co. (Subordinated), 3 Mo. Libor + 0.64%1 | | | | 900,000 | | | | | 3.27 | | | | | 12/1/21 | | | | | 895,554 | | | | | | |
Massachusetts Mutual Life Insurance Co. (Subordinated)4 | | | | 750,000 | | | | | 7.50 | | | | | 3/1/24 | | | | | 881,508 | | | | | | |
Nationwide Mutual Insurance Co. (Subordinated), 3 Mo. Libor + 2.29%1, 4 | | | | 725,000 | | | | | 4.90 | | | | | 12/15/24 | | | | | 720,483 | | | | | | |
United Airlines2013-1 Class A Pass Through Trust | | | | 847,549 | | | | | 4.30 | | | | | 8/15/25 | | | | | 878,377 | | | | | | |
US Airways2012-2 Class A Pass Through Trust | | | | 163,340 | | | | | 4.63 | | | | | 6/3/25 | | | | | 170,352 | | | | | | |
US Airways2013-1 Class A Pass Through Trust | | | | 718,348 | | | | | 3.95 | | | | | 11/15/25 | | | | | 728,289 | | | | | | |
Wells Fargo Bank NA, 3 Mo. Libor + 0.51%1 | | | | 400,000 | | | | | 3.27 | | | | | 10/22/21 | | | | | 400,778 | | | | | | |
| | | | | | | | | | | | | | | | | | | | | | | | | |
| | | | | |
Total Corporate Bonds
(cost: $14,298,062) | | | | | | | | | | | | | | | | | | | 14,329,582 | | | | | | |
| | | | | | | | | | | | | | | | | | | | | | | | | |
Mortgage Pass-Through Securities - 11.9% | | | | | | | | | | | | | | | | | | | | | | | | | |
Federal Home Loan Mortgage Corporation - 0.9% | | | | | | | | | | | | | | | | | | | | | | | | | |
Freddie Mac | | | | 156,935 | | | | | 3.00 | | | | | 9/1/27 | | | | | 159,002 | | | | | | |
Freddie Mac | | | | 34,043 | | | | | 3.50 | | | | | 7/1/26 | | | | | 34,926 | | | | | | |
Freddie Mac | | | | 222,731 | | | | | 4.00 | | | | | 7/1/26 | | | | | 231,072 | | | | | | |
Freddie Mac | | | | 224,908 | | | | | 4.00 | | | | | 1/1/27 | | | | | 233,342 | | | | | | |
Freddie Mac | | | | 666 | | | | | 4.50 | | | | | 5/1/19 | | | | | 678 | | | | | | |
Freddie Mac | | | | 1,853 | | | | | 4.50 | | | | | 6/1/19 | | | | | 1,885 | | | | | | |
Freddie Mac | | | | 1,045 | | | | | 4.50 | | | | | 6/1/19 | | | | | 1,063 | | | | | | |
Freddie Mac | | | | 26,716 | | | | | 4.50 | | | | | 12/1/21 | | | | | 27,195 | | | | | | |
Freddie Mac | | | | 12,033 | | | | | 4.50 | | | | | 7/1/26 | | | | | 12,260 | | | | | | |
Freddie Mac | | | | 2,851 | | | | | 5.00 | | | | | 7/1/19 | | | | | 2,887 | | | | | | |
Freddie Mac | | | | 15,474 | | | | | 5.00 | | | | | 10/1/25 | | | | | 16,374 | | | | | | |
Freddie Mac | | | | 686 | | | | | 5.50 | | | | | 10/1/19 | | | | | 686 | | | | | | |
Freddie Mac | | | | 11,327 | | | | | 5.50 | | | | | 5/1/20 | | | | | 11,352 | | | | | | |
Freddie Mac | | | | 2,923 | | | | | 5.50 | | | | | 7/1/20 | | | | | 2,930 | | | | | | |
Freddie Mac | | | | 2,375 | | | | | 5.50 | | | | | 12/1/20 | | | | | 2,380 | | | | | | |
Freddie Mac | | | | 20,077 | | | | | 5.50 | | | | | 3/1/21 | | | | | 20,285 | | | | | | |
Freddie Mac | | | | 14,711 | | | | | 5.50 | | | | | 3/1/21 | | | | | 14,938 | | | | | | |
| | | | | | | | | | | | | | | | | | | | | | | | | |
| | | | | |
| | | | | | | | | | | | | | | | | | | 773,255 | | | | | | |
| | | | | | | | | | | | | | | | | | | | | | | | | |
Federal National Mortgage Association - 7.0% | | | | | | | | | | | | | | | | | | | | | | | | | |
Fannie Mae | | | | 421,101 | | | | | 2.50 | | | | | 6/1/23 | | | | | 419,717 | | | | | | |
Fannie Mae | | | | 973,988 | | | | | 2.61 | | | | | 2/1/23 | | | | | 979,480 | | | | | | |
Fannie Mae | | | | 888,087 | | | | | 2.70 | | | | | 4/1/23 | | | | | 891,958 | | | | | | |
| | | | |
See accompanying notes to financial statements. | | | | |
16 | | | SIT MUTUAL FUNDS ANNUAL REPORT | |
| | | | | | | | | | | | | | | | | | | | |
| | | | | |
| Name of Issuer | | Principal
Amount ($) | | Coupon
Rate (%) | | Maturity
Date | | Fair
Value ($) | |
Fannie Mae | | | 693,221 | | | | 2.72 | | | | 12/1/22 | | | | 696,243 | | | | | |
Fannie Mae | | | 338,376 | | | | 2.75 | | | | 5/1/25 | | | | 340,685 | | | | | |
Fannie Mae | | | 981,749 | | | | 2.77 | | | | 11/1/23 | | | | 989,947 | | | | | |
Fannie Mae | | | 255,617 | | | | 3.00 | | | | 8/1/28 | | | | 258,947 | | | | | |
Fannie Mae | | | 632,013 | | | | 3.50 | | | | 1/1/26 | | | | 646,529 | | | | | |
Fannie Mae | | | 19,132 | | | | 4.00 | | | | 9/1/24 | | | | 19,707 | | | | | |
Fannie Mae | | | 138,282 | | | | 4.00 | | | | 6/1/25 | | | | 142,441 | | | | | |
Fannie Mae | | | 22,347 | | | | 4.00 | | | | 10/1/31 | | | | 23,232 | | | | | |
Fannie Mae | | | 127,412 | | | | 4.50 | | | | 4/1/25 | | | | 131,869 | | | | | |
Fannie Mae | | | 138,389 | | | | 4.73 | | | | 2/1/20 | | | | 138,860 | | | | | |
Fannie Mae | | | 3,074 | | | | 5.00 | | | | 8/1/19 | | | | 3,143 | | | | | |
Fannie Mae | | | 35,041 | | | | 5.00 | | | | 9/1/20 | | | | 35,828 | | | | | |
Fannie Mae | | | 5,818 | | | | 5.50 | | | | 1/1/21 | | | | 5,853 | | | | | |
Fannie Mae | | | 3,851 | | | | 5.50 | | | | 10/1/21 | | | | 3,879 | | | | | |
| | | | | | | | | | | | | | | | | | | | |
| | | | | | | | | | | | | | | 5,728,318 | | | | | |
| | | | | | | | | | | | | | | | | | | | |
Government National Mortgage Association - 0.2% | | | | | | | | | | | | | | | | | | | | |
Ginnie Mae, US Treasury + 1.50%1 | | | 43,150 | | | | 3.63 | | | | 4/20/33 | | | | 44,675 | | | | | |
Ginnie Mae, US Treasury + 1.50%1 | | | 9,233 | | | | 3.63 | | | | 4/20/42 | | | | 9,466 | | | | | |
Ginnie Mae | | | 32,887 | | | | 5.00 | | | | 12/20/23 | | | | 34,823 | | | | | |
Ginnie Mae | | | 21,427 | | | | 5.00 | | | | 9/15/24 | | | | 21,846 | | | | | |
Ginnie Mae | | | 47,370 | | | | 5.00 | | | | 6/20/26 | | | | 51,498 | | | | | |
| | | | | | | | | | | | | | | | | | | | |
| | | | | | | | | | | | | | | 162,308 | | | | | |
| | | | | | | | | | | | | | | | | | | | |
Other Federal Agency Securities - 3.8% | | | | | | | | | | | | | | | | | | | | |
Small Business Administration Pools, PRIME - 2.50%1 | | | 670,496 | | | | 3.00 | | | | 5/25/43 | | | | 664,636 | | | | | |
Small Business Administration Pools, PRIME + 0.78%1 | | | 584,847 | | | | 6.27 | | | | 3/25/30 | | | | 639,513 | | | | | |
Small Business Administration Pools, PRIME + 0.80%1 | | | 1,674,691 | | | | 6.29 | | | | 2/25/28 | | | | 1,819,675 | | | | | |
| | | | | | | | | | | | | | | | | | | | |
| | | | | | | | | | | | | | | 3,123,824 | | | | | |
| | | | | | | | | | | | | | | | | | | | |
Total Mortgage Pass-Through Securities
(cost: $9,814,963) | | | | | | | | | | | | | | | 9,787,705 | | | | | |
| | | | | | | | | | | | | | | | | | | | |
Taxable Municipal Bonds - 11.0% | | | | | | | | | | | | | | | | | | | | |
Atlanta Downtown Development Authority17 | | | 435,000 | | | | 6.88 | | | | 2/1/21 | | | | 459,795 | | | | | |
Berks County Industrial Development Authority | | | 395,000 | | | | 3.20 | | | | 5/15/21 | | | | 395,000 | | | | | |
Century Housing Corp. | | | 500,000 | | | | 3.82 | | | | 11/1/20 | | | | 500,181 | | | | | |
City of Wilkes-Barre PA17 | | | 1,000,000 | | | | 3.24 | | | | 11/15/21 | | | | 1,019,040 | | | | | |
Colorado Housing & Finance Authority | | | 10,000 | | | | 4.00 | | | | 11/1/31 | | | | 10,127 | | | | | |
Kentucky Higher Education Student Loan Corp. | | | 790,000 | | | | 3.92 | | | | 6/1/32 | | | | 804,868 | | | | | |
Massachusetts Educational Financing Authority | | | 415,000 | | | | 4.00 | | | | 1/1/32 | | | | 427,201 | | | | | |
Massachusetts Educational Financing Authority | | | 750,000 | | | | 4.41 | | | | 7/1/34 | | | | 782,182 | | | | | |
Morongo Band of Mission Indians4 | | | 500,000 | | | | 5.25 | | | | 10/1/21 | | | | 504,650 | | | | | |
New Hampshire Housing Finance Authority | | | 560,000 | | | | 4.22 | | | | 7/1/29 | | | | 579,270 | | | | | |
New Hampshire Housing Finance Authority | | | 195,000 | | | | 4.00 | | | | 7/1/35 | | | | 196,841 | | | | | |
New Hampshire Housing Finance Authority | | | 10,000 | | | | 4.00 | | | | 1/1/37 | | | | 10,131 | | | | | |
Rhode Island Housing & Mortgage Finance Corp. | | | 75,000 | | | | 4.00 | | | | 10/1/39 | | | | 75,861 | | | | | |
San Francisco Comm. Facs. Dist.No. 2014-1 | | | 375,000 | | | | 3.03 | | | | 9/1/23 | | | | 378,739 | | | | | |
San Francisco Comm. Facs. Dist.No. 2014-1 | | | 310,000 | | | | 3.11 | | | | 9/1/24 | | | | 313,466 | | | | | |
Southern California Public Power Authority | | | 400,000 | | | | 5.61 | | | | 7/1/24 | | | | 425,844 | | | | | |
Tennessee Housing Development Agency | | | 115,000 | | | | 3.50 | | | | 7/1/31 | | | | 115,182 | | | | | |
Town of Ledgeview WI | | | 400,000 | | | | 5.00 | | | | 12/1/21 | | | | 415,164 | | | | | |
Town of Mammoth Lakes CA | | | 225,000 | | | | 2.75 | | | | 10/1/22 | | | | 224,649 | | | | | |
| | | | |
See accompanying notes to financial statements. | | | | |
MARCH 31, 2019 | | | 17 | |
SCHEDULE OF INVESTMENTS
March 31, 2018
Sit Quality Income Fund (Continued)
| | | | | | | | | | | | | | | | |
| | | | | |
| Name of Issuer | | Principal
Amount ($) | | | Coupon Rate (%) | | | Maturity Date | | | Fair Value ($) | |
University of Colorado | | | 400,000 | | | | 6.11 | | | | 6/1/29 | | | | 402,236 | |
Washington State University | | | 1,000,000 | | | | 6.41 | | | | 10/1/34 | | | | 1,019,640 | |
| | | | | | | | | | | | | | | | |
| | | | |
Total Taxable Municipal Bonds
(cost: $8,981,307) | | | | | | | | | | | | | | | 9,060,067 | |
| | | | | | | | | | | | | | | | |
| | | | |
U.S. Treasury / Federal Agency Securities - 13.5% | | | | | | | | | | | | | | | | |
Federal Agency Issues - 0.7% | | | | | | | | | | | | | | | | |
Federal Agricultural Mortgage Corp., 3 Mo. Libor + 0.37%1 | | | 250,000 | | | | 2.97 | | | | 3/9/23 | | | | 252,510 | |
Pershing Road Development Co., LLC, 3 Mo. Libor + 0.40%1, 4 | | | 350,000 | | | | 3.03 | | | | 9/15/21 | | | | 350,000 | |
| | | | | | | | | | | | | | | | |
| | | | |
| | | | | | | | | | | | | | | 602,510 | |
| | | | | | | | | | | | | | | | |
U.S. Treasury - 12.8% | | | | | | | | | | | | | | | | |
U.S. Treasury Floating Rate Note, 3 Mo. Libor + 0.04%1 | | | 2,500,000 | | | | 2.44 | | | | 7/31/20 | | | | 2,497,685 | |
U.S. Treasury Floating Rate Note, 3 Mo. Libor + 0.05%1 | | | 4,000,000 | | | | 2.44 | | | | 10/31/20 | | | | 3,994,234 | |
U.S. Treasury Note | | | 4,000,000 | | | | 2.25 | | | | 11/15/24 | | | | 3,992,188 | |
| | | | | | | | | | | | | | | | |
| | | | |
| | | | | | | | | | | | | | | 10,484,107 | |
| | | | | | | | | | | | | | | | |
| | | | |
Total U.S. Treasury / Federal Agency Securities | | | | | | | | | | | | | | | | |
(cost: $11,051,571) | | | | | | | | | | | | | | | 11,086,617 | |
| | | | | | | | | | | | | | | | |
Short-Term Securities - 0.3% | | | | | | | | | | | | | | | | |
Fidelity Inst. Money Mkt. Gvt. Fund, 2.31% | | | 301,549 | | | | | | | | | | | | 301,549 | |
| | | | | | | | | | | | | | | | |
(cost: $301,549) | | | | | | | | | | | | | | | | |
Total Investments in Securities - 98.6% | | | | | | | | | | | | | | | | |
(cost: $80,891,780) | | | | | | | | | | | | | | | 81,166,090 | |
| | | | | | | | | | | | | | | | |
Call Options Written10, 19- (0.3%) | | | | | | | | | | | | | | | | |
(premiums received: $148,953) | | | | | | | | | | | | | | | (291,992 | ) |
Other Assets and Liabilities, net - 1.7% | | | | | | | | | | | | | | | 1,412,881 | |
| | | | | | | | | | | | | | | | |
| | | | |
Total Net Assets - 100.0% | | | | | | | | | | | | | | $ | 82,286,979 | |
| | | | | | | | | | | | | | | | |
| | | | | | | | | | | | | | | | | |
| 1 | Variable rate security. Rate disclosed is as of March 31, 2019. Certain variable rate securities are not based on a published reference rate and spread but are determined by the issuer or agent and are based on current market conditions, or, for mortgage-backed securities, are impacted by the individual mortgages which are paying off over time. These securities do not indicate a reference rate and spread in their descriptions. |
| 4 | 144A Restricted Security. The total value of such securities as of March 31, 2019 was $14,574,865 and represented 17.7% of net assets. These securities have been determined to be liquid by the Adviser in accordance with guidelines established by the Board of Directors. |
| 10 | The amount of $1,000,000 in cash was segregated with the broker to cover margin requirements for derivative transactions as of March 31, 2019. |
| 14 | Step Coupon: A bond that pays a coupon rate that increases on a specified date(s). Rate disclosed is as of March 31, 2019. |
| 17 | Security that is either an absolute and unconditional obligation of the United States Government or is collateralized by securities, loans, or leases guaranteed by the U.S. Government or its agencies or instrumentalities. |
Numeric footnotes not disclosed are not applicable to this Schedule of Investments.
| | | | |
See accompanying notes to financial statements. | | | | |
18 | | | SIT MUTUAL FUNDS ANNUAL REPORT | |
(19) Options outstanding as of March 31, 2019 were as follows:
| | | | | | | | | | | | | | | | | | | | | | | | |
| Description | | Contracts | | Exercise
Price ($) | | Expiration
Date | | | Counterparty | | | Notional
Amount ($) | | | Cost/
Premiums ($) | | | Value ($) | |
Call Options Written - U.S. Treasury Futures: | | | | | | | | | | | | | | | | | | | | |
5-Year | | (299) | | 115.00 | | | June 2019 | | | | FCStone Financial | | | | 34,385,000 | | | | (148,953) | | | | (291,992) | |
A summary of the levels for the Fund’s investments as of March 31, 2019 is as follows (see Note 2 - significant accounting policies in the notes to financial statements):
| | | | | | | | | | | | | | | | |
| | | Investment in Securities | |
| | | Level 1 | | | Level 2 | | | Level 3 | | | | |
| | | Quoted | | | Other Significant | | | Other Significant | | | | |
| | | Price ($) | | | Observable Inputs ($) | | | Observable Inputs ($) | | | Total ($) | |
Assets | | | | | | | | | | | | | | | | |
Asset-Backed Securities | | | — | | | | 10,187,730 | | | | — | | | | 10,187,730 | |
Collateralized Mortgage Obligations | | | — | | | | 26,412,840 | | | | — | | | | 26,412,840 | |
Corporate Bonds | | | — | | | | 14,329,582 | | | | — | | | | 14,329,582 | |
Mortgage Pass-Through Securities | | | — | | | | 9,787,705 | | | | — | | | | 9,787,705 | |
Taxable Municipal Bonds | | | — | | | | 9,060,067 | | | | — | | | | 9,060,067 | |
U.S. Treasury / Federal Agency Securities | | | — | | | | 11,086,617 | | | | — | | | | 11,086,617 | |
Short-Term Securities | | | 301,549 | | | | — | | | | — | | | | 301,549 | |
| | | 301,549 | | | | 80,864,541 | | | | — | | | | 81,166,090 | |
Liabilities | | | | | | | | | | | | | | | | |
Call Options Written | | | (291,992 | ) | | | — | | | | — | | | | (291,992 | ) |
There were no transfers into or out of level 3 during the reporting period.
| | | | |
See accompanying notes to financial statements. | | | | |
MARCH 31, 2019 | | | 19 | |
OBJECTIVE & STRATEGY
The objective of theTax-Free Income Fund is to provide a high level of current income that is exempt from federal income tax, consistent with preservation of capital, by investing primarily in investment-grade municipal securities.
Such municipal securities generate interest income that is exempt from both federal regular income tax and federal alternative minimum tax. During normal market conditions, the Fund invests 100% of its net assets in suchtax-exempt municipal securities.
The SitTax-Free Income Fund provided a return of +3.67% during the fiscal year ended March 31, 2019, versus a return of +4.42% for its benchmark, the Bloomberg Barclays5-year Municipal Bond Index. As of March 31, 2019, the Fund’s30-day SEC yield was 2.67%, compared to the yield of 1.83% for the benchmark index. The Fund’s12-month distribution rate was 3.30%.
Thetax-exempt yield curve shifted lower during the past year withshort-to-intermediate yields falling the most. Yields for5-year to15-year maturities fell approximately50-55 basis points while yields for long bonds fell approximately35-40 basis points. The municipal market was buoyed by lower issuance volume throughout the fiscal year. Going into 2018, lighter supply was expected in the wake of federal tax law changes in 2017. Specifically, issuance for the period of April 1, 2018 through December 31, 2018 fell to $253.1B, or 13.1% below the average for that period since 2001. 2019Q1 issuance was $69.9B, bringing the fiscal year total to $323.0B, or 13.3% below the average for that period.Tax-exempt fund flows also provided support for the municipal market when they turned positive in December and accelerated in the first quarter of 2019 to a record $23.4B of inflows, the best start to a calendar year since the data series began in 1992.
The Fund maintained a larger weighting of long duration bonds relative to the benchmark over the last year. This strategy proved advantageous as yields fell across the curve and long duration bonds outperformed short duration bonds. However, the effect was dampened using U.S. Treasury futures to shorten duration, which we’ve done since April 2017 in anticipation of moderately rising interest rates. This hedging strategy was beneficial to the Fund’s performance between April and October, but detrimental as Treasury yields declined throughout the remainder of the fiscal year. As a result, the Fund underperformed its benchmark for the year. Offsetting factors included the Fund’s overweight in housing bonds and superior selection innon-rated bonds. The single-family and multi-family housing sectors, which represent the Fund’s largest weightings, significantly outperformed the benchmark index. At the end of the fiscal year, the Fund held 20% of net assets innon-rated bonds and these bonds outperformed rated bonds over the past year.
HYPOTHETICAL GROWTH OF $10,000
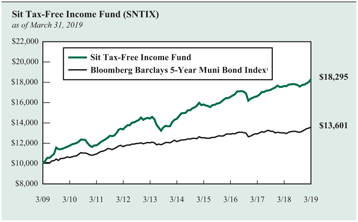
The chart above illustrates the total value of a hypothetical $10,000 investment in the Fund over the past 10 years (or for the life of the Fund if shorter) as compared to the performance of the Bloomberg Barclays5-Year Municipal Bond Index. Past performance does not guarantee future results. Returns include the reinvestment of distributions. The chart does not reflect the deduction of taxes that a shareholder would pay on Fund distributions or the redemption of Fund shares.
1 The Bloomberg Barclays5-Year Municipal Bond Index is the 5 year(4-6) component of the Municipal Bond Index, an unmanaged, rules-based, market-value-weighted index for the long-termtax-exempt bond market. The index includes bonds with a minimum credit rating of BBB. The returns include the reinvestment of income and do not include any transaction costs, management fees or other costs. It is not possible to invest directly in an index. This is the Fund’s primary index.
The Fund’s core strategy continues to emphasize current income as the primary driver of returns over the long run, thus we will add to higher coupon bonds when available. We will also focus deeply on credit analysis to take advantage of opportunities as they arise. We expect to continue hedging to maintain duration close to that of the Fund’s benchmark, but we will remain prepared to adjust this position as market conditions warrant. We remain diversified on an industry and issuer basis in order to manage credit and liquidity risk, and we believe the Fund is positioned to achieve attractive risk-adjusted returns going forward.
Paul J. Jungquist, CFA
Senior Portfolio Manager
| | |
| Information on this page is unaudited. |
20 | | SIT MUTUAL FUNDS ANNUAL REPORT |
COMPARATIVE RATES OF RETURNS
as of March 31, 2019
| | | | | | | | | | | | |
| | | Sit
Tax-Free
Income
Fund | | | Bloomberg
Barclays
5-Year Muni
Bond Index1 | | | Lipper
General
Muni. Bond
Fund Index2 | |
| | | |
One Year | | | 3.67% | | | | 4.42% | | | | 5.07% | |
Five Years | | | 4.88 | | | | 2.23 | | | | 4.04 | |
Ten Years | | | 6.23 | | | | 3.12 | | | | 5.42 | |
Since Inception (9/29/88) | | | 5.19 | | | | 4.92 | | | | 5.50 | |
Performance figures are historical and do not guarantee future results. Investment returns and principal value will vary, and you may have a gain or loss when you sell shares. Current performance may be lower or higher than the performance data quoted. Contact the Fund for performance data current to the most recentmonth-end. Returns include changes in share price as well as reinvestment of all dividends and capital gains and all fee waivers. Without the fee waivers total return and yield figures would have been lower. Returns do not reflect the deduction of taxes that a shareholder would pay on Fund distributions or the redemption of Fund shares. Management fees and administrative expenses are included in the Fund’s performance. Returns for periods greater than one year are compounded average annual rates of return.
1 The Bloomberg Barclays5-Year Municipal Bond Index is the 5 year(4-6) component of the Municipal Bond Index, an unmanaged, rules-based, market-value-weighted index for the long-termtax-exempt bond market. The index includes bonds with a minimum credit rating of BBB. The returns include the reinvestment of income and do not include any transaction costs, management fees or other costs. It is not possible to invest directly in an index.
2 The Lipper returns are obtained from Lipper Analytical Services, Inc., a large independent evaluator of mutual funds.
FUND DIVERSIFICATION
| | | | |
Single Family Mortgage | | | 25.9% | |
Multi Family Mortgage | | | 21.0 | |
Other Revenue | | | 9.4 | |
Insured | | | 7.3 | |
Education/Student Loan | | | 7.0 | |
General Obligation | | | 6.1 | |
Hospital/Health Care | | | 5.1 | |
Sectors less than 5% | | | 12.3 | |
Cash & Other Net Assets | | | 5.9 | |
Based on total net assets as of March 31, 2019. Subject to change.
PORTFOLIO SUMMARY
| | |
Net Asset Value 3/31/19: | | $9.69 Per Share |
Net Asset Value 3/31/18: | | $9.66 Per Share |
Total Net Assets: | | $247.4 Million |
Average Maturity: | | 18.0 Years |
Effective Duration3: | | 4.3 Years |
3 Duration is a measure of estimated price sensitivity relative to changes in interest rates. Portfolios with longer durations are typically more sensitive to changes in interest rates. For example, if interest rates rise by 1%, the fair value of a security with an effective duration of 5 years would decrease by 5%, with all other factors being constant. The correlation between duration and price sensitivity is greater for securities rated investment-grade than it is for securities rated below investment-grade. Duration estimates are based on assumptions by the Adviser and are subject to a number of limitations. Effective duration is calculated based on historical price changes of securities held by the Fund, and therefore is a more accurate estimate of price sensitivity provided interest rates remain within their historical range.
QUALITY RATINGS (% of Total Net Assets)

Lower of Moody’s, S&P, Fitch or Duff & Phelps ratings used.
Adviser’s Assessment ofNon-Rated Securities
| | | | |
AAA | | | 0.0% | |
AA | | | 0.1 | |
A | | | 0.0 | |
BBB | | | 0.8 | |
BB | | | 15.3 | |
<BB | | | 3.3 | |
| | | | |
Total | | | 19.5% | |
| | |
| Information on this page is unaudited. |
| MARCH 31, 2019 | | 21 |
SCHEDULE OF INVESTMENTS
March 31, 2019
SitTax-Free Income Fund
| | | | | | | | | | | | | | | | |
| Name of Issuer | | Principal
Amount ($) | | Coupon
Rate (%) | | | Maturity Date | | Fair Value ($) | |
| | | | |
Municipal Bonds - 90.5% | | | | | | | | | | | | | | | | |
| | | | |
Alabama - 0.2% | | | | | | | | | | | | | | | | |
Pell City Special Care Facs. Finance Auth. Rev. (Noland Health Services, Inc.) | | | 500,000 | | | | 5.00 | | | | 12/1/31 | | | | 536,605 | |
| | | | | | | | | | | | | | | | |
| | | | |
Alaska - 1.0% | | | | | | | | | | | | | | | | |
| | | | | | | | | | | | | | | | |
AK Hsg. Finance Corp. Mtg. Rev. | | | 640,000 | | | | 4.13 | | | | 12/1/37 | | | | 654,573 | |
AK Hsg. Finance Corp. Mtg. Rev. | | | 550,000 | | | | 4.25 | | | | 12/1/40 | | | | 561,913 | |
AK Hsg. Finance Corp. Mtg. Rev. (G.O. of Corp. Insured) | | | 500,000 | | | | 4.50 | | | | 12/1/35 | | | | 504,805 | |
AK Hsg. Finance Corp. Rev. (State Capital Proj.) | | | 500,000 | | | | 4.00 | | | | 6/1/36 | | | | 530,355 | |
AK Industrial Dev. & Export Auth. Rev. (Boys & Girls Home)2,5, 15 | | | 250,000 | | | | 5.50 | | | | N/A | | | | 12,500 | |
AK Industrial Dev. & Export Auth. Rev. (GTR Fairbanks Community Hospital Foundation) | | | 250,000 | | | | 5.00 | | | | 4/1/33 | | | | 271,410 | |
| | | | | | | | | | | | | | | | |
| | | | |
| | | | | | | | | | | | | | | 2,535,556 | |
| | | | | | | | | | | | | | | | |
| | | | |
Arizona - 2.2% | | | | | | | | | | | | | | | | |
AZ Industrial Dev. Auth. Rev. (Bridgewater Avondale Proj.) | | | 500,000 | | | | 5.38 | | | | 1/1/38 | | | | 505,185 | |
AZ Industrial Dev. Auth. Rev. (Pinecrest Academy Horizon)4 | | | 500,000 | | | | 5.75 | | | | 7/15/38 | | | | 543,275 | |
Glendale Industrial Dev. & Auth. Rev. (Beatitudes Campus Proj.) | | | 300,000 | | | | 5.00 | | | | 11/15/36 | | | | 314,538 | |
Glendale Industrial Dev. & Auth. Rev. (Glencroft Retirement Community) | | | 300,000 | | | | 5.00 | | | | 11/15/36 | | | | 309,375 | |
La Paz Co. Industrial Dev. Auth. (Charter School Solutions Harmony Public Proj.) | | | 750,000 | | | | 5.00 | | | | 2/15/48 | | | | 809,535 | |
Maricopa Co. Industrial Dev. Auth. Education Rev. (Horizon Community Learning Center) | | | 300,000 | | | | 5.00 | | | | 7/1/35 | | | | 312,558 | |
Maricopa Co. Industrial Dev. Auth. Rev. (Christian Care Surprise Inc.)4 | | | 250,000 | | | | 5.75 | | | | 1/1/36 | | | | 254,665 | |
Peoria Industrial Dev. Auth. Rev. (Sierra Winds Life Care Community) | | | 400,000 | | | | 5.25 | | | | 11/15/29 | | | | 402,100 | |
Phoenix City Industrial Dev. Auth. Rev. (Great Hearts Academies Proj.) | | | 250,000 | | | | 6.30 | | | | 7/1/42 | | | | 275,885 | |
Phoenix City Industrial Dev. Auth. Rev. (Vista College Preparatory Proj.) | | | 400,000 | | | | 4.13 | | | | 7/1/38 | | | | 421,808 | |
Pima Co. Industrial Dev. Auth. Education Rev. (American Leadership Academy Proj.)4 | | | 370,000 | | | | 4.75 | | | | 6/15/37 | | | | 375,572 | |
Quechan Indian Tribe of Fort Yuma Rev. (Tribal Economic Dev.) | | | 415,000 | | | | 9.75 | | | | 5/1/25 | | | | 457,899 | |
Tempe Industrial Dev. Auth. Rev. (Mirabella at ASU Proj.)4 | | | 500,000 | | | | 4.70 | | | | 10/1/24 | | | | 510,410 | |
| | | | | | | | | | | | | | | | |
| | | | |
| | | | | | | | | | | | | | | 5,492,805 | |
| | | | | | | | | | | | | | | | |
| | | | |
Arkansas - 0.6% | | | | | | | | | | | | | | | | |
Rogers City Rev. | | | 1,000,000 | | | | 3.88 | | | | 11/1/39 | | | | 1,043,610 | |
Springdale City Sales & Use Tax Rev. Ref. (BAM Insured) | | | 500,000 | | | | 3.60 | | | | 4/1/41 | | | | 505,880 | |
| | | | | | | | | | | | | | | | |
| | | | |
| | | | | | | | | | | | | | | 1,549,490 | |
| | | | | | | | | | | | | | | | |
| | | | |
California - 6.0% | | | | | | | | | | | | | | | | |
CA School Facs. Finance Auth. Rev. (Azusa Unified School District) (AGM Insured)6 | | | 500,000 | | | | 6.00 | | | | 8/1/29 | | | | 637,825 | |
CA State G.O. | | | 500,000 | | | | 4.00 | | | | 12/1/40 | | | | 515,735 | |
Carlsbad Unified School District G.O. Capital Appreciation6 | | | 400,000 | | | | 6.00 | | | | 8/1/31 | | | | 473,184 | |
Colton Joint Unified School District G.O. (AGM Insured)6 | | | 1,000,000 | | | | 6.00 | | | | 8/1/35 | | | | 1,044,610 | |
Encinitas Union School District G.O. Capital Appreciation6 | | | 500,000 | | | | 7.00 | | | | 8/1/35 | | | | 608,130 | |
Hartnell Community College G.O.6 | | | 500,000 | | | | 7.00 | | | | 8/1/34 | | | | 551,120 | |
Healdsburg Unified School District G.O.6 | | | 1,250,000 | | | | 5.00 | | | | 8/1/37 | | | | 1,183,475 | |
Imperial Community College District G.O. Capital Appreciation (AGM Insured)6 | | | 250,000 | | | | 6.75 | | | | 8/1/40 | | | | 328,270 | |
Los Alamitos Unified School District Capital Appreciation C.O.P.6 | | | 1,100,000 | | | | 6.00 | | | | 8/1/34 | | | | 1,093,125 | |
Martinez Unified School District G.O.6 | | | 250,000 | | | | 6.13 | | | | 8/1/35 | | | | 309,740 | |
Morongo Band of Mission Indians Rev.4 | | | 300,000 | | | | 5.00 | | | | 10/1/42 | | | | 326,232 | |
Placentia-Yorba Linda Unified School District C.O.P. Capital Appreciation (AGM Insured)6 | | | 500,000 | | | | 6.25 | | | | 10/1/28 | | | | 559,145 | |
Redondo Beach School District G.O.6 | | | 600,000 | | | | 6.38 | | | | 8/1/34 | | | | 775,230 | |
Reef-Sunset Unified School District (BAM Insured)6 | | | 750,000 | | | | 5.00 | | | | 8/1/38 | | | | 745,972 | |
Ripon Unified School District G.O. (BAM Insured) 6 | | | 270,000 | | | | 4.50 | | | | 8/1/30 | | | | 300,831 | |
Ripon Unified School District G.O. (BAM Insured) 6 | | | 80,000 | | | | 4.50 | | | | 8/1/30 | | | | 87,248 | |
Sacramento Co. Water Financing Auth. Rev.(NATL-RE FGIC Insured)1 | | | 500,000 | | | | 2.33 | | | | 6/1/39 | | | | 465,635 | |
San Jose Financing Auth. Rev. (Civic Center Garage Proj.)9 | | | 400,000 | | | | 5.00 | | | | 6/1/39 | | | | 446,068 | |
San Jose G.O. Capital Appreciation (Libraries Parks and Public Safety Proj.) (NATL Insured) | | | 500,000 | | | | 5.00 | | | | 9/1/32 | | | | 501,320 | |
| | | | |
See accompanying notes to financial statements. | | | | |
22 | | | SIT MUTUAL FUNDS ANNUAL REPORT | |
| | | | | | | | | | | | | | |
| Name of Issuer | | Principal
Amount ($) | | Coupon
Rate (%) | | Maturity
Date | | Fair Value ($) | |
| | | | |
South Tahoe Joint Powers Financing Auth. Tax Allocation Ref. (South Tahoe Redev. Proj.) (AGM Insured) | | | 500,000 | | | 5.00 | | | 10/1/30 | | | | 569,210 | |
Sulphur Springs Union School District C.O.P. (AGM Insured)6 | | | 450,000 | | | 6.50 | | | 12/1/37 | | | | 559,588 | |
Tracy Joint Unified School District G.O. Capital Appreciation6 | | | 600,000 | | | 7.00 | | | 8/1/41 | | | | 545,766 | |
Tustin Unified School District G.O. Capital Appreciation6 | | | 500,000 | | | 6.00 | | | 8/1/28 | | | | 541,240 | |
Upland Unified School District G.O. Capital Appreciation6 | | | 1,000,000 | | | 7.00 | | | 8/1/41 | | | | 1,222,340 | |
Val Verde Unified School District G.O. Capital Appreciation (AGM Insured)6 | | | 500,000 | | | 6.00 | | | 8/1/34 | | | | 568,475 | |
| | | | | | | | | | | | | | |
| | | | |
| | | | | | | | | | | | | 14,959,514 | |
| | | | | | | | | | | | | | |
Colorado - 3.2% | | | | | | | | | | | | | | |
Buffalo Highlands Metropolitan District G.O. | | | 350,000 | | | 5.25 | | | 12/1/38 | | | | 355,533 | |
CO Educational & Cultural Facs. Auth. Rev. (CO Springs Charter Academy Proj.) | | | 250,000 | | | 5.60 | | | 7/1/34 | | | | 256,992 | |
CO Educational & Cultural Facs. Auth. Rev. Ref. (Windsor Charter Academy)4 | | | 800,000 | | | 5.00 | | | 9/1/36 | | | | 804,296 | |
CO Health Facs. Auth. Rev. (Covenant Retirement Community) | | | 650,000 | | | 5.00 | | | 12/1/48 | | | | 723,027 | |
CO Science and Technology Park Metropolitan District No.1 Rev. | | | 500,000 | | | 5.00 | | | 12/1/33 | | | | 517,665 | |
Copperleaf Metro District No. 2 G.O. | | | 500,000 | | | 5.75 | | | 12/1/45 | | | | 523,970 | |
Crystal Crossing Metro District G.O. | | | 500,000 | | | 5.25 | | | 12/1/40 | | | | 507,260 | |
Denver 9th Avenue Metropolitan District No.2 G.O | | | 500,000 | | | 5.00 | | | 12/1/48 | | | | 512,440 | |
Denver Urban Renewal Auth. Tax Allocation4 | | | 500,000 | | | 5.25 | | | 12/1/39 | | | | 508,160 | |
East Morgan Co. Hospital District C.O.P.9 | | | 500,000 | | | 5.88 | | | 12/1/38 | | | | 504,290 | |
Lambertson Farms Metro District No. 1 G.O. | | | 500,000 | | | 5.00 | | | 12/15/25 | | | | 501,080 | |
Leyden Rock Metropolitan District No. 10 G.O. | | | 250,000 | | | 5.00 | | | 12/1/45 | | | | 254,422 | |
Palisade Metropolitan District No. 2 G.O. | | | 500,000 | | | 5.00 | | | 12/1/46 | | | | 506,110 | |
St. Vrain Lakes Metropolitan District No. 2 G.O. | | | 500,000 | | | 5.00 | | | 12/1/37 | | | | 506,465 | |
Tallman Gulch Metropolitan District G.O. | | | 500,000 | | | 5.25 | | | 12/1/47 | | | | 501,075 | |
Velocity Metropolitan District No. 3 G.O. | | | 500,000 | | | 5.38 | | | 12/1/39 | | | | 511,140 | |
| | | | | | | | | | | | | | |
| | | | |
| | | | | | | | | | | | | 7,993,925 | |
| | | | | | | | | | | | | | |
Connecticut - 0.6% | | | | | | | | | | | | | | |
CT Hsg. Finance Auth. Rev. | | | 550,000 | | | 3.88 | | | 11/15/35 | | | | 575,690 | |
CT Hsg. Finance Auth. Rev.9 | | | 505,000 | | | 4.25 | | | 6/15/43 | | | | 523,993 | |
CT Hsg. Finance Auth. Rev.9 | | | 455,000 | | | 4.30 | | | 6/15/48 | | | | 472,313 | |
| | | | | | | | | | | | | | |
| | | | |
| | | | | | | | | | | | | 1,571,996 | |
| | | | | | | | | | | | | | |
District of Columbia - 0.5% | | | | | | | | | | | | | | |
District of Columbia Hsg. Finance Agency Rev. (Multi-Family Dev. Program) | | | 600,000 | | | 4.05 | | | 9/1/43 | | | | 625,878 | |
District of Columbia Rev. (Ingleside Rock Creek Proj.) | | | 500,000 | | | 5.00 | | | 7/1/37 | | | | 524,055 | |
| | | | | | | | | | | | | | |
| | | | |
| | | | | | | | | | | | | 1,149,933 | |
| | | | | | | | | | | | | | |
Florida - 9.0% | | | | | | | | | | | | | | |
Alachua Co. Health Facs. Auth. Rev. (Oak Hammock University) | | | 385,000 | | | 8.00 | | | 10/1/32 | | | | 437,837 | |
Bay Co. Educational Facs. Rev. (Bay Haven Charter) | | | 455,000 | | | 5.25 | | | 9/1/30 | | | | 468,882 | |
Blackburn Creek Community Dev. District Special Assessment (Grand Palm Proj.) | | | 200,000 | | | 6.25 | | | 5/1/35 | | | | 213,974 | |
Capital Trust Agency Rev. (Elim Senior Housing, Inc.)4 | | | 250,000 | | | 5.00 | | | 8/1/27 | | | | 254,020 | |
Capital Trust Agency Rev. (Elim Senior Housing, Inc.)4 | | | 250,000 | | | 5.38 | | | 8/1/32 | | | | 255,110 | |
Capital Trust Agency Rev. (River City Educational Services, Inc. Proj.) | | | 500,000 | | | 5.38 | | | 2/1/35 | | | | 507,830 | |
Capital Trust Agency Rev. (Tallahassee Tapestry)4 | | | 550,000 | | | 6.75 | | | 12/1/35 | | | | 567,154 | |
Capital Trust Agency Rev. (Tapestry Walden Senior Hsg. Proj.)4 | | | 250,000 | | | 6.75 | | | 7/1/37 | | | | 258,415 | |
Capital Trust Agency Rev. (Tuscan Gardens Senior Living Center) | | | 250,000 | | | 7.00 | | | 4/1/35 | | | | 249,047 | |
Capital Trust Agency Rev. (University Bridge LLC Student Housing Proj.)4 | | | 500,000 | | | 5.25 | | | 12/1/43 | | | | 503,355 | |
Celebration Pointe Community Dev. District Special Assessment Rev.4 | | | 250,000 | | | 5.00 | | | 5/1/32 | | | | 264,375 | |
Collier Co. Industrial Dev. Auth. Rev. (Arlington of Naples Proj.)4 | | | 250,000 | | | 7.25 | | | 5/15/26 | | | | 252,090 | |
Collier Co. Industrial Dev. Auth. Rev. (Arlington of Naples Proj.)4 | | | 750,000 | | | 8.13 | | | 5/15/44 | | | | 751,590 | |
Collier Co. Industrial Dev. Auth. Rev. (NCH Healthcare System Proj.) | | | 415,000 | | | 6.25 | | | 10/1/39 | | | | 449,437 | |
Dowden West Community Dev. District Special Assessment4 | | | 360,000 | | | 5.40 | | | 5/1/39 | | | | 371,567 | |
| | | | |
See accompanying notes to financial statements. | | | | |
MARCH 31, 2019 | | | 23 | |
SCHEDULE OF INVESTMENTS
March 31, 2019
Sit Tax-Free Income Fund (Continued)
| | | | | | | | | | | | | | | | |
| | | | | |
| Name of Issuer | | Principal
Amount ($) | | Coupon
Rate (%) | | Maturity
Date | | Fair Value ($) | |
| | | | |
Durbin Crossing Community Dev. District Special Assessment (AGM Insured) | | | 520,000 | | | | 5.00 | | | | 5/1/32 | | | | 597,891 | |
Escambia Co. Housing Finance Auth. Rev. (Multi-County Program) | | | 990,000 | | | | 3.75 | | | | 10/1/49 | | | | 988,832 | |
Fiddlers Creek Community Dev. District No. 2 Special Assessment Rev.2, 5, 15 | | | 100,000 | | | | 5.75 | | | | N/A | | | | 63,000 | |
FL Hsg. Finance Corp. (GNMA/FNMA Collateralized) | | | 90,000 | | | | 5.00 | | | | 7/1/26 | | | | 92,092 | |
FL Hsg. Finance Corp. (GNMA/FNMA/FHLMC Collateralized) | | | 140,000 | | | | 5.00 | | | | 7/1/39 | | | | 140,797 | |
FL Hsg. Finance Corp. (GNMA/FNMA/FHLMC Collateralized) | | | 1,000,000 | | | | 4.20 | | | | 1/1/45 | | | | 1,054,960 | |
Gramercy Farms Community Dev. District Special Assessment6 | | | 465,000 | | | | 3.24 | | | | 5/1/39 | | | | 223,200 | |
Heritage Harbour North Community Dev. District Special Assessment | | | 235,000 | | | | 5.00 | | | | 5/1/34 | | | | 251,290 | |
Lakewood Ranch Stewardship District Cap. Improvement Special Assessment Rev. | | | 340,000 | | | | 4.25 | | | | 5/1/25 | | | | 344,930 | |
Lakewood Ranch Stewardship District Cap. Improvement Special Assessment Rev. (Country Club East Proj.) | | | 250,000 | | | | 6.70 | | | | 5/1/33 | | | | 269,702 | |
Lakewood Ranch Stewardship District Cap. Improvement Special Assessment Rev. (Lakewood Center) | | | 300,000 | | | | 7.40 | | | | 5/1/30 | | | | 327,756 | |
Lakewood Ranch Stewardship District Cap. Improvement Special Assessment Rev. (Lakewood National) | | | 300,000 | | | | 5.25 | | | | 5/1/37 | | | | 315,714 | |
Lakewood Ranch Stewardship District Cap. Improvement Special Assessment Rev. (Lakewood Ranch) | | | 400,000 | | | | 5.00 | | | | 5/1/36 | | | | 409,288 | |
Lakewood Ranch Stewardship District Cap. Improvement Special Assessment Rev. (NE Sector Proj.) | | | 300,000 | | | | 5.00 | | | | 5/1/38 | | | | 304,785 | |
Lakewood Ranch Stewardship District Cap. Improvement Special Assessment Rev. (NE Sector Proj.)4 | | | 550,000 | | | | 5.30 | | | | 5/1/39 | | | | 572,644 | |
Lakewood Ranch Stewardship District Cap. Improvement Special Assessment Rev. (Webb Proj.)4 | | | 320,000 | | | | 5.00 | | | | 5/1/37 | | | | 330,288 | |
Lee Co. Industrial Dev. Auth. Rev. (Preserve Proj.)4 | | | 315,000 | | | | 5.38 | | | | 12/1/32 | | | | 320,761 | |
Lee Co. Industrial Dev. Auth. Rev. (Preserve Proj.)4 | | | 300,000 | | | | 5.75 | | | | 12/1/52 | | | | 307,164 | |
Lexington Oaks Community Dev. District Special Assessment Rev. | | | 245,000 | | | | 5.65 | | | | 5/1/33 | | | | 254,580 | |
Live Oak No. 2 Community Dev. District Special Assessment Rev. | | | 400,000 | | | | 4.00 | | | | 5/1/35 | | | | 406,564 | |
Long Lake Ranch Community Dev. District Special Assessment | | | 110,000 | | | | 5.63 | | | | 5/1/24 | | | | 112,967 | |
Long Lake Ranch Community Dev. District Special Assessment | | | 500,000 | | | | 4.63 | | | | 5/1/36 | | | | 502,160 | |
Long Lake Ranch Community Dev. District Special Assessment | | | 465,000 | | | | 5.00 | | | | 5/1/38 | | | | 475,542 | |
Magnolia Creek Community Dev. District Rev.2, 5, 15 | | | 250,000 | | | | 5.60 | | | | N/A | | | | 45,000 | |
Marshall Creek Community Dev. District Cap. Improvement Special Assessment Rev. | | | 250,000 | | | | 5.00 | | | | 5/1/32 | | | | 253,652 | |
Miami-Dade Co. Transit Sales Tax Rev. | | | 500,000 | | | | 5.00 | | | | 7/1/34 | | | | 569,450 | |
New River Community Dev. District Cap. Improvement Special Assessment Rev.2, 5, 15 | | | 230,000 | | | | 5.00 | | | | N/A | | | | 2 | |
Northern Palm Beach Co. Improvement District Special Assessment | | | 500,000 | | | | 5.00 | | | | 8/1/29 | | | | 529,425 | |
Northern Palm Beach Co. Improvement District Special Assessment | | | 250,000 | | | | 5.00 | | | | 8/1/37 | | | | 262,308 | |
Orange Co. Health Facs. Auth. Rev. (Presbyterian Retirement Community Proj.) | | | 550,000 | | | | 5.00 | | | | 8/1/34 | | | | 595,859 | |
Orange Co. Health Facs. Auth. Rev. (Presbyterian Retirement Community Proj.) | | | 500,000 | | | | 5.00 | | | | 8/1/35 | | | | 547,120 | |
Orange Co. Health Facs. Auth. Rev. (Presbyterian Retirement Community Proj.) | | | 250,000 | | | | 5.00 | | | | 8/1/41 | | | | 270,958 | |
Orange Co. Hsg. Finance Auth. Rev. (GNMA/FNMA/FHLMC Collateralized) | | | 480,000 | | | | 3.95 | | | | 3/1/40 | | | | 492,370 | |
Orange Co. Hsg. Finance Auth. Rev. (GNMA/FNMA/FHLMC Collateralized) | | | 435,000 | | | | 4.00 | | | | 9/1/48 | | | | 463,606 | |
Orlando Tourist Dev. Rev. (Senior Lien Tourist Dev.) (AGM Insured) | | | 250,000 | | | | 5.00 | | | | 11/1/38 | | | | 287,488 | |
Palm Beach Co. Health Facs. Auth. Rev. (ACTS Retirement-Life Community, Inc.) | | | 500,000 | | | | 5.00 | | | | 11/15/32 | | | | 566,865 | |
Port St. Lucie Research Foundation Rev. (Vaccine Gene Therapy Inst.) | | | 500,000 | | | | 5.00 | | | | 5/1/33 | | | | 517,750 | |
Seven Oaks Community Dev. District Special Assessment Rev | | | 250,000 | | | | 5.50 | | | | 5/1/33 | | | | 262,562 | |
Tolomato Community Dev. District Special Assessment2, 5 | | | 120,000 | | | | 6.61 | | | | 5/1/40 | | | | 1 | |
Tolomato Community Dev. District Special Assessment6 | | | 185,000 | | | | 7.00 | | | | 5/1/40 | | | | 150,773 | |
Tolomato Community Dev. District Special Assessment6 | | | 110,000 | | | | 7.00 | | | | 5/1/40 | | | | 73,667 | |
Tolomato Community Dev. District Special Assessment6 | | | 85,000 | | | | 7.00 | | | | 5/1/40 | | | | 84,599 | |
Tolomato Community Dev. District Special Assessment6 | | | 45,000 | | | | 7.00 | | | | 5/1/40 | | | | 37,351 | |
Tolomato Community Dev. District Special Assessment (AGM Insured) | | | 500,000 | | | | 3.75 | | | | 5/1/40 | | | | 509,675 | |
Trout Creek Community Dev. District Special Assessment | | | 300,000 | | | | 5.38 | | | | 5/1/38 | | | | 312,123 | |
Waters Edge Community Dev. District Cap. Improvement Rev. | | | 9,000 | | | | 5.35 | | | | 5/1/39 | | | | 8,999 | |
Waters Edge Community Dev. District Cap. Improvement Rev.6 | | | 195,000 | | | | 6.60 | | | | 5/1/39 | | | | 195,597 | |
Wiregrass Community Dev. District Special Assessment | | | 245,000 | | | | 5.38 | | | | 5/1/35 | | | | 258,061 | |
Zephyr Ridge Community Dev. District Special Assessment2, 5, 15 | | | 450,000 | | | | 5.25 | | | | N/A | | | | 378,000 | |
| | | | | | | | | | | | | | | | |
| | | | |
| | | | | | | | | | | | | | | 22,144,851 | |
| | | | | | | | | | | | | | | | |
| | | | |
See accompanying notes to financial statements. | | | | |
24 | | | SIT MUTUAL FUNDS ANNUAL REPORT | |
| | | | | | | | | | | | | | | | |
| | | | | |
| Name of Issuer | | Principal
Amount ($) | | Coupon
Rate (%) | | Maturity
Date | | Fair Value ($) | |
| | | | |
Georgia - 4.2% | | | | | | | | | | | | | | | | |
Atlanta Dev. Auth. Senior Health Care Facs. Rev. (GA Proton Treatment Center) | | | 250,000 | | | | 6.50 | | | | 1/1/29 | | | | 255,097 | |
Fulton Co. Dev. Auth. Rev. (Woodruff Arts Center) | | | 500,000 | | | | 5.00 | | | | 3/15/44 | | | | 577,335 | |
GA Housing & Finance Authority Rev. | | | 1,280,000 | | | | 3.80 | | | | 12/1/37 | | | | 1,300,634 | |
GA Housing & Finance Authority Rev. | | | 1,000,000 | | | | 4.00 | | | | 12/1/37 | | | | 1,018,240 | |
GA Housing & Finance Authority Rev. | | | 500,000 | | | | 3.85 | | | | 12/1/38 | | | | 517,080 | |
GA Housing & Finance Authority Rev. | | | 500,000 | | | | 4.00 | | | | 12/1/39 | | | | 521,025 | |
GA Housing & Finance Authority Rev. | | | 650,000 | | | | 3.80 | | | | 12/1/40 | | | | 662,727 | |
GA Housing & Finance Authority Rev. | | | 605,000 | | | | 3.85 | | | | 12/1/41 | | | | 612,635 | |
GA Housing & Finance Authority Rev. | | | 540,000 | | | | 3.95 | | | | 12/1/43 | | | | 557,728 | |
GA Housing & Finance Authority Rev. | | | 1,000,000 | | | | 3.50 | | | | 12/1/46 | | | | 1,008,090 | |
GA Housing & Finance Authority Rev. | | | 600,000 | | | | 4.00 | | | | 12/1/48 | | | | 620,610 | |
GA Housing & Finance Authority Rev. | | | 1,100,000 | | | | 4.20 | | | | 12/1/48 | | | | 1,159,444 | |
GA Tax Allocation (Beltline Proj.) | | | 500,000 | | | | 5.00 | | | | 1/1/30 | | | | 510,830 | |
Gainesville Hospital Auth. Rev. (Northeast Georgia Health System, Inc. Proj.) | | | 500,000 | | | | 5.00 | | | | 2/15/37 | | | | 577,405 | |
Glynn-Brunswick Memorial Hospital Auth. Rev. (Southeast Georgia Health System Proj.) | | | 350,000 | | | | 5.00 | | | | 8/1/47 | | | | 388,098 | |
| | | | | | | | | | | | | | | | |
| | | | |
| | | | | | | | | | | | | | | 10,286,978 | |
| | | | | | | | | | | | | | | | |
Idaho - 0.7% | | | | | | | | | | | | | | | | |
ID Health Facs. Authority Rev. (Terraces Boise Proj.) | | | 475,000 | | | | 7.00 | | | | 10/1/24 | | | | 522,082 | |
ID Health Facs. Authority Rev. (Terraces Boise Proj.) | | | 250,000 | | | | 7.38 | | | | 10/1/29 | | | | 273,712 | |
ID Health Facs. Authority Rev. (Terraces Boise Proj.) | | | 500,000 | | | | 8.00 | | | | 10/1/44 | | | | 559,615 | |
ID Hsg. & Fin. Assoc. Nonprofit Facs. Rev. (Idaho Arts Charter School Proj.) | | | 425,000 | | | | 5.75 | | | | 12/1/32 | | | | 456,837 | |
| | | | | | | | | | | | | | | | |
| | | | |
| | | | | | | | | | | | | | | 1,812,246 | |
| | | | | | | | | | | | | | | | |
Illinois - 8.0% | | | | | | | | | | | | | | | | |
Bellwood G.O. | | | 500,000 | | | | 5.88 | | | | 12/1/27 | | | | 562,645 | |
Bolingbrook Special Tax (AGM Insured) | | | 999,000 | | | | 4.00 | | | | 3/1/30 | | | | 1,076,752 | |
Burbank Educational Facs. Rev. (Intercultural Montessori Language School)4 | | | 500,000 | | | | 6.00 | | | | 9/1/35 | | | | 536,470 | |
Bureau Co. Township High School Dist. No. 502 G.O. (BAM Insured) | | | 500,000 | | | | 6.25 | | | | 12/1/33 | | | | 603,325 | |
Chicago Heights G.O.(NATL-RE Insured) | | | 500,000 | | | | 4.50 | | | | 12/1/29 | | | | 542,830 | |
Chicago Midway Airport Rev. (Second Lien) | | | 500,000 | | | | 5.25 | | | | 1/1/35 | | | | 549,270 | |
Chicago Park Dist. G.O (Limited Tax) | | | 1,000,000 | | | | 5.00 | | | | 1/1/28 | | | | 1,091,070 | |
Chicago Transit Auth. Sales Tax Rev. | | | 250,000 | | | | 5.25 | | | | 12/1/30 | | | | 265,677 | |
IL Educational Facs. Auth. Rev. | | | 250,000 | | | | 4.50 | | | | 11/1/36 | | | | 263,622 | |
IL Educational Facs. Auth. Rev. (Field Museum of Natural History) | | | 500,000 | | | | 3.90 | | | | 11/1/36 | | | | 518,955 | |
IL Fin. Auth. Rev. (Admiral Lake Proj.) | | | 670,000 | | | | 5.13 | | | | 5/15/38 | | | | 675,494 | |
IL Fin. Auth. Rev. (Christian Homes, Inc.) | | | 500,000 | | | | 5.00 | | | | 5/15/36 | | | | 525,630 | |
IL Fin. Auth. Rev. (Edward Elmhurst Healthcare) | | | 1,000,000 | | | | 5.00 | | | | 1/1/44 | | | | 1,108,620 | |
IL Fin. Auth. Rev. (Lifespace Communities) | | | 500,000 | | | | 5.00 | | | | 5/15/35 | | | | 536,260 | |
IL Fin. Auth. Rev. (Lifespace Communities) | | | 500,000 | | | | 5.00 | | | | 5/15/45 | | | | 527,970 | |
IL Fin. Auth. Rev. (Rogers Park Montessori School Proj.) | | | 200,000 | | | | 5.00 | | | | 2/1/24 | | | | 208,516 | |
IL Fin. Auth. Rev. (Westminster Village) | | | 500,000 | | | | 5.25 | | | | 5/1/38 | | | | 524,640 | |
IL Fin. Auth. Sports Facs. Rev. (North Shore Ice Arena Proj.) | | | 1,000,000 | | | | 6.25 | | | | 12/1/38 | | | | 706,090 | |
IL G.O. | | | 250,000 | | | | 5.50 | | | | 7/1/33 | | | | 266,500 | |
IL G.O. (AGM Insured) | | | 500,000 | | | | 4.00 | | | | 2/1/30 | | | | 531,620 | |
IL Housing Dev. Auth. Rev. (Evergreen Towers) | | | 250,000 | | | | 4.95 | | | | 7/1/34 | | | | 268,180 | |
IL Housing Dev. Auth. Rev. (GNMA/FNMA/FHLMC Collateralized) | | | 450,000 | | | | 3.88 | | | | 4/1/41 | | | | 461,920 | |
IL Housing Dev. Auth. Rev. (GNMA/FNMA/FHLMC Collateralized) | | | 395,000 | | | | 4.00 | | | | 10/1/48 | | | | 419,881 | |
IL Rev. | | | 500,000 | | | | 5.00 | | | | 6/15/33 | | | | 554,450 | |
IL Sports Facilities Auth. Rev. (State Tax Supported) (AGM Insured) | | | 1,000,000 | | | | 5.25 | | | | 6/15/31 | | | | 1,116,260 | |
Johnson Co. School Dist. No. 55 Vienna G.O. (AGM Insured) | | | 500,000 | | | | 5.40 | | | | 12/1/27 | | | | 511,310 | |
La Salle & Bureau Counties Township High School Dist. No. 120 LaSalle-Peru G.O. (BAM Insured) | | | 250,000 | | | | 5.00 | | | | 12/1/31 | | | | 290,220 | |
| | | | |
See accompanying notes to financial statements. | | | | |
MARCH 31, 2019 | | | 25 | |
SCHEDULE OF INVESTMENTS
March 31, 2019
Sit Tax-Free Income Fund (Continued)
| | | | | | | | | | | | | | | | |
| | | | | |
| Name of Issuer | | Principal
Amount ($) | | Coupon
Rate (%) | | Maturity
Date | | Fair Value ($) | |
| | | | |
Lake Co. Community Consolidated School District No. 50 Woodland G.O. | | | 250,000 | | | | 5.63 | | | | 1/1/26 | | | | 267,398 | |
Macon & Moultrie Counties Community Unit School District No. 3 Mt Zion G.O. | | | 335,000 | | | | 5.50 | | | | 12/1/41 | | | | 374,105 | |
Macon Co. School District No. 61 Decatur G.O. (AGM Insured) | | | 250,000 | | | | 5.25 | | | | 1/1/37 | | | | 262,165 | |
Macoupin Sangamon & Montgomery Counties Community Unit School District G.O. (AGM Insured) | | | 990,000 | | | | 4.25 | | | | 12/1/35 | | | | 1,034,609 | |
Malta Tax Allocation Rev.2, 5 | | | 1,921,000 | | | | 5.75 | | | | 12/30/25 | | | | 614,720 | |
Metropolitan Pier & Exposition Auth. Rev. (McCormick Place Expansion Proj.) | | | 250,000 | | | | 5.00 | | | | 6/15/57 | | | | 264,252 | |
Southwestern IL Dev. Auth. Tax Allocation Ref. (Local Govt. Program)2 | | | 415,000 | | | | 7.00 | | | | 10/1/22 | | | | 240,700 | |
University of Illinois (AGM Insured) | | | 1,000,000 | | | | 4.13 | | | | 4/1/48 | | | | 1,050,050 | |
Upper Illinois River Valley Dev. Auth. Rev. (Cambridge Lakes Learning Center)4 | | | 250,000 | | | | 4.00 | | | | 12/1/22 | | | | 247,888 | |
Upper Illinois River Valley Dev. Auth. Rev. (Cambridge Lakes Learning Center)4 | | | 250,000 | | | | 5.25 | | | | 12/1/37 | | | | 254,862 | |
| | | | | | | | | | | | | | | | |
| | | | |
| | | | | | | | | | | | | | | 19,854,926 | |
| | | | | | | | | | | | | | | | |
Indiana - 1.8% | | | | | | | | | | | | | | | | |
Carmel Multifamily Hsg. Rev. (Barrington Carmel Proj.)2 | | | 495,000 | | | | 6.00 | | | | 11/15/22 | | | | 396,000 | |
Damon Run Conservancy Dist. G.O. (State Intercept Insured) | | | 300,000 | | | | 6.10 | | | | 7/1/25 | | | | 303,531 | |
Evansville Hsg. Rev. (Silver Birch Evansville Proj.) | | | 250,000 | | | | 5.45 | | | | 1/1/38 | | | | 254,325 | |
IN Finance Auth. Rev. (BHI Senior Living) | | | 775,000 | | | | 5.88 | | | | 11/15/41 | | | | 862,350 | |
IN Finance Auth. Rev. (BHI Senior Living) | | | 425,000 | | | | 6.00 | | | | 11/15/41 | | | | 476,136 | |
IN Finance Auth. Rev. (Greencroft Obligated Group) | | | 350,000 | | | | 6.50 | | | | 11/15/33 | | | | 383,926 | |
IN Housing & Community Dev. Auth. Rev. (Hammond Assisted Living Proj.) | | | 500,000 | | | | 5.75 | | | | 1/1/36 | | | | 500,435 | |
Merrillville Industry Economic Dev. Rev. (Belvedere Housing Proj.) | | | 300,000 | | | | 5.75 | | | | 4/1/36 | | | | 286,242 | |
Mishawaka Multifamily Hsg. Rev. (Silver Birch Mishawaka Proj.)4 | | | 500,000 | | | | 5.38 | | | | 1/1/38 | | | | 506,045 | |
Richmond Hospital Auth. Rev. (Reid Hospital & Health Care) | | | 350,000 | | | | 5.00 | | | | 1/1/35 | | | | 388,902 | |
| | | | | | | | | | | | | | | | |
| | | | |
| | | | | | | | | | | | | | | 4,357,892 | |
| | | | | | | | | | | | | | | | |
Iowa - 0.8% | | | | | | | | | | | | | | | | |
IA Fin. Auth. Rev. (Lifespace Communities, Inc.) | | | 650,000 | | | | 5.00 | | | | 5/15/36 | | | | 697,645 | |
IA Student Loan Liquidity Corp. Rev. | | | 250,000 | | | | 5.80 | | | | 12/1/31 | | | | 256,000 | |
North Polk Community School District G.O. (AGM Insured) | | | 1,000,000 | | | | 4.00 | | | | 6/1/31 | | | | 1,023,130 | |
| | | | | | | | | | | | | | | | |
| | | | |
| | | | | | | | | | | | | | | 1,976,775 | |
| | | | | | | | | | | | | | | | |
Kansas - 0.3% | | | | | | | | | | | | | | | | |
Wichita Health Care Facs. Rev. (Kansas Masonic Home) | | | 300,000 | | | | 5.25 | | | | 12/1/36 | | | | 318,624 | |
Wichita Health Care Facs. Rev. (Presbyterian Manors, Inc.) | | | 500,000 | | | | 6.25 | | | | 5/15/34 | | | | 500,620 | |
| | | | | | | | | | | | | | | | |
| | | | |
| | | | | | | | | | | | | | | 819,244 | |
| | | | | | | | | | | | | | | | |
Kentucky - 0.2% | | | | | | | | | | | | | | | | |
Pikeville Hospital Rev. Ref. (Pikeville Medical Center) | | | 425,000 | | | | 6.50 | | | | 3/1/41 | | | | 453,760 | |
| | | | | | | | | | | | | | | | |
| | | | |
Louisiana - 1.4% | | | | | | | | | | | | | | | | |
Denham Springs/Livingston Hsg. & Mtg. Finance Auth. Rev. (GNMA/FHLMC Collateralized) | | | 22,072 | | | | 5.00 | | | | 11/1/40 | | | | 22,100 | |
LA Hsg. Fin. Agy. Single Family Mtg. Rev. (Mtg. Backed Sec. Prog.) (GNMA/FHLMC Collateralized) | | | 140,000 | | | | 4.60 | | | | 6/1/29 | | | | 144,654 | |
LA Local Government Environmental Facilities & Community Development Auth. | | | 500,000 | | | | 5.25 | | | | 11/15/25 | | | | 532,115 | |
LA Local Government Environmental Facilities & Community Development Auth. | | | 500,000 | | | | 6.00 | | | | 11/15/30 | | | | 551,820 | |
LA Local Government Environmental Facilities & Community Development Auth. Rev.4 | | | 300,000 | | | | 5.65 | | | | 11/1/37 | | | | 328,800 | |
LA Local Government Environmental Facilities & Community Development Auth. Rev.4 | | | 300,000 | | | | 5.50 | | | | 11/1/39 | | | | 316,617 | |
LA Public Facs. Auth. Rev. (Belle-Chase Educational Foundation Proj.)(NATL-RE Insured) | | | 250,000 | | | | 6.50 | | | | 5/1/31 | | | | 263,148 | |
LA Public Facs. Auth. Rev. (Franciscan Missionaries Health System Proj.) | | | 300,000 | | | | 5.00 | | | | 7/1/35 | | | | 336,444 | |
LA Public Facs. Auth. Rev. (Tulane Univ. Proj.)(NATL-RE Insured)1 | | | 595,000 | | | | 2.50 | | | | 2/15/36 | | | | 565,910 | |
St. Tammany Parish Fin. Auth. Rev. (Christwood Proj.) | | | 300,000 | | | | 5.25 | | | | 11/15/37 | | | | 318,072 | |
| | | | | | | | | | | | | | | | |
| | | | |
| | | | | | | | | | | | | | | 3,379,680 | |
| | | | | | | | | | | | | | | | |
| | | | |
See accompanying notes to financial statements. | | | | |
26 | | | SIT MUTUAL FUNDS ANNUAL REPORT | |
| | | | | | | | | | | | | | | | |
| | | | | |
| Name of Issuer | | Principal
Amount ($) | | Coupon Rate (%) | | Maturity Date | | Fair Value ($) | |
| | | | |
Maine - 1.3% | | | | | | | | | | | | | | | | |
ME Hsg. Auth. Rev. | | | 600,000 | | | | 4.00 | | | | 11/15/35 | | | | 623,256 | |
ME Hsg. Auth. Rev. | | | 500,000 | | | | 4.00 | | | | 11/15/37 | | | | 520,855 | |
ME Hsg. Auth. Rev. | | | 105,000 | | | | 4.50 | | | | 11/15/37 | | | | 109,093 | |
ME Hsg. Auth. Rev. | | | 750,000 | | | | 4.13 | | | | 11/15/38 | | | | 791,355 | |
ME Hsg. Auth. Rev. | | | 500,000 | | | | 3.85 | | | | 11/15/40 | | | | 511,960 | |
ME Hsg. Auth. Rev. | | | 500,000 | | | | 4.25 | | | | 11/15/48 | | | | 541,465 | |
| | | | | | | | | | | | | | | | |
| | | | |
| | | | | | | | | | | | | | | 3,097,984 | |
| | | | | | | | | | | | | | | | |
| | | | |
Maryland - 0.6% | | | | | | | | | | | | | | | | |
MD Community Dev. Administration Rev. | | | 350,000 | | | | 4.10 | | | | 9/1/38 | | | | 369,422 | |
MD Community Dev. Administration Rev. | | | 350,000 | | | | 3.75 | | | | 3/1/39 | | | | 355,698 | |
MD Community Dev. Administration Rev. | | | 350,000 | | | | 4.20 | | | | 7/1/46 | | | | 367,910 | |
Montgomery Co. Housing Opportunities Commission Rev. | | | 405,000 | | | | 4.00 | | | | 7/1/38 | | | | 407,600 | |
| | | | | | | | | | | | | | | | |
| | | | |
| | | | | | | | | | | | | | | 1,500,630 | |
| | | | | | | | | | | | | | | | |
| | | | |
Massachusetts - 2.7% | | | | | | | | | | | | | | | | |
Dedham Municipal Purpose Loan. G.O. (NATL Insured) | | | 480,000 | | | | 4.00 | | | | 10/15/24 | | | | 480,888 | |
Ipswich Muncipal Purpose Loan G.O. (AGM Insured) | | | 500,000 | | | | 4.00 | | | | 6/1/25 | | | | 500,895 | |
MA Dev. Finance Agy. Rev. | | | 890,000 | | | | 5.00 | | | | 7/1/44 | | | | 1,010,524 | |
MA Dev. Finance Agy. Rev. (Newbridge on the Charles, Inc.)4 | | | 300,000 | | | | 5.00 | | | | 10/1/47 | | | | 317,223 | |
MA Dev. Finance Agy. Rev. (Orchard Cove, Inc.) | | | 400,000 | | | | 5.00 | | | | 10/1/49 | | | | 440,720 | |
MA Education Finance Auth. Education Rev. | | | 105,000 | | | | 5.15 | | | | 1/1/26 | | | | 107,000 | |
MA Housing Finance Agy. Rev. | | | 250,000 | | | | 4.75 | | | | 6/1/35 | | | | 261,620 | |
MA Housing Finance Agy. Rev. | | | 500,000 | | | | 4.00 | | | | 12/1/38 | | | | 518,625 | |
MA Housing Finance Agy. Rev. | | | 500,000 | | | | 3.75 | | | | 12/1/40 | | | | 507,580 | |
MA Housing Finance Agy. Rev. | | | 900,000 | | | | 3.85 | | | | 12/1/47 | | | | 921,465 | |
MA Housing Finance Agy. Rev. (FHA Insured) | | | 500,000 | | | | 5.30 | | | | 12/1/38 | | | | 516,370 | |
MA Housing Finance Agy. Rev. (GNMA/FNMA/FHLMC Collateralized) | | | 270,000 | | | | 3.90 | | | | 12/1/38 | | | | 272,284 | |
Northbridge Muncipal Purpose Loan G.O (AGM Insured) | | | 500,000 | | | | 4.00 | | | | 6/15/25 | | | | 500,795 | |
Rowley Land Acquisition Loan G.O (AGM Insured) | | | 360,000 | | | | 4.00 | | | | 5/1/27 | | | | 360,590 | |
| | | | | | | | | | | | | | | | |
| | | | |
| | | | | | | | | | | | | | | 6,716,579 | |
| | | | | | | | | | | | | | | | |
| | | | |
Michigan - 2.8% | | | | | | | | | | | | | | | | |
MI Finance Auth. Rev. (Presbyterian Village) | | | 250,000 | | | | 5.25 | | | | 11/15/35 | | | | 257,445 | |
MI Hsg. Dev. Auth. (G.O. of Authority Insured) | | | 250,000 | | | | 4.63 | | | | 10/1/41 | | | | 257,972 | |
MI Hsg. Dev. Auth. Rev. | | | 500,000 | | | | 4.10 | | | | 10/1/35 | | | | 521,660 | |
MI Hsg. Dev. Auth. Rev. | | | 500,000 | | | | 3.70 | | | | 12/1/36 | | | | 513,275 | |
MI Hsg. Dev. Auth. Rev. | | | 1,500,000 | | | | 4.13 | | | | 12/1/38 | | | | 1,584,720 | |
MI Hsg. Dev. Auth. Rev. | | | 705,000 | | | | 3.95 | | | | 12/1/40 | | | | 721,716 | |
MI Hsg. Dev. Auth. Rev. | | | 300,000 | | | | 3.75 | | | | 10/1/42 | | | | 305,118 | |
MI Hsg. Dev. Auth. Rev. | | | 750,000 | | | | 4.00 | | | | 10/1/43 | | | | 776,618 | |
MI Hsg. Dev. Auth. Rev. | | | 105,000 | | | | 3.70 | | | | 12/1/45 | | | | 105,225 | |
MI Hsg. Dev. Auth. Rev. | | | 1,000,000 | | | | 4.00 | | | | 6/1/49 | | | | 1,028,530 | |
Muskegon Heights Water Supply Rev. (NATL Insured) | | | 165,000 | | | | 4.15 | | | | 11/1/23 | | | | 165,292 | |
Muskegon Heights Water Supply Rev. (NATL Insured) | | | 135,000 | | | | 4.20 | | | | 11/1/24 | | | | 135,244 | |
Taylor Brownfield Redevelopment Authority (NATL Insured) | | | 250,000 | | | | 5.00 | | | | 5/1/32 | | | | 275,295 | |
Universal Academy Michigan Public School Rev. | | | 160,000 | | | | 6.50 | | | | 12/1/23 | | | | 164,307 | |
| | | | | | | | | | | | | | | | |
| | | | |
| | | | | | | | | | | | | | | 6,812,417 | |
| | | | | | | | | | | | | | | | |
| | | | |
Minnesota - 0.5% | | | | | | | | | | | | | | | | |
Apple Valley City Rev. (Senior Living, LLC Proj.) | | | 500,000 | | | | 5.00 | | | | 1/1/47 | | | | 510,970 | |
MN Hsg. Fin. Agy. Mtg. Rev. (Mtg. Backed Securities Program) (GNMA/FNMA Collateralized) | | | 100,000 | | | | 4.40 | | | | 7/1/32 | | | | 101,899 | |
| | | | |
See accompanying notes to financial statements. | | | | |
MARCH 31, 2019 | | | 27 | |
SCHEDULE OF INVESTMENTS
March 31, 2019
Sit Tax-Free Income Fund (Continued)
| | | | | | | | | | | | | | | | |
| | | | | |
| Name of Issuer | | Principal
Amount ($) | | Coupon Rate (%) | | Maturity Date | | Fair Value ($) | |
| | | | |
MN Hsg. Fin. Agy. Residential Hsg. Rev. | | | 145,000 | | | | 5.10 | | | | 1/1/40 | | | | 145,599 | |
Rochester City Rev. (Math & Science Academy Proj.) | | | 500,000 | | | | 5.13 | | | | 9/1/38 | | | | 503,690 | |
| | | | | | | | | | | | | | | | |
| | | | |
| | | | | | | | | | | | | | | 1,262,158 | |
| | | | | | | | | | | | | | | | |
| | | | |
Mississippi - 0.5% | | | | | | | | | | | | | | | | |
MS Gaming Tax Rev. | | | 740,000 | | | | 4.00 | | | | 10/15/38 | | | | 780,064 | |
MS Home Corp. Single Family Mtg. Rev. (GNMA/FNMA/FHLMC Collateralized) | | | 435,000 | | | | 4.00 | | | | 12/1/43 | | | | 458,255 | |
| | | | | | | | | | | | | | | | |
| | | | |
| | | | | | | | | | | | | | | 1,238,319 | |
| | | | | | | | | | | | | | | | |
| | | | |
Missouri - 0.8% | | | | | | | | | | | | | | | | |
Kansas City Industrial Dev. Auth. Rev. (Kansas City Pkg. LLC) | | | 200,000 | | | | 5.45 | | | | 9/1/23 | | | | 204,660 | |
Kansas City Industrial Dev. Auth. Rev. (United Methodist Retirement Home, Inc.)4 | | | 500,000 | | | | 5.75 | | | | 11/15/36 | | | | 436,320 | |
MO Highway & Transportation Commission Rev. | | | 450,000 | | | | 5.00 | | | | 5/1/20 | | | | 451,282 | |
MO Hsg. Dev. Commission Rev. (GNMA/FNMA/FHLMC Collateralized) | | | 745,000 | | | | 3.80 | | | | 11/1/48 | | | | 764,728 | |
| | | | | | | | | | | | | | | | |
| | | | |
| | | | | | | | | | | | | | | 1,856,990 | |
| | | | | | | | | | | | | | | | |
| | | | |
Montana - 0.6% | | | | | | | | | | | | | | | | |
Forsyth Pollution Control Rev. | | | 250,000 | | | | 5.00 | | | | 5/1/33 | | | | 261,865 | |
MT Board of Housing Single Family Rev. | | | 205,000 | | | | 4.00 | | | | 12/1/38 | | | | 212,070 | |
MT Board of Housing Single Family Rev. (BRD Insured) | | | 500,000 | | | | 4.00 | | | | 6/1/45 | | | | 519,380 | |
MT Board of Housing Single Family Rev. (FHA Insured) | | | 270,000 | | | | 3.75 | | | | 12/1/38 | | | | 275,624 | |
MT Board of Housing Single Family Rev. (G.O. of BRD Insured) | | | 90,000 | | | | 4.70 | | | | 12/1/26 | | | | 91,790 | |
MT Facs. Finance Auth. Rev. (Great FallsPre-Release Services Proj.) | | | 222,896 | | | | 5.08 | | | | 4/1/21 | | | | 225,720 | |
| | | | | | | | | | | | | | | | |
| | | | |
| | | | | | | | | | | | | | | 1,586,449 | |
| | | | | | | | | | | | | | | | |
| | | | |
Nebraska - 0.3% | | | | | | | | | | | | | | | | |
Douglas Co. Hospital Auth. No. 3 (Methodist Hospital) | | | 400,000 | | | | 5.00 | | | | 11/1/30 | | | | 456,748 | |
Mead Village Tax Allocation Rev. (E3 Biofuels - Mead LLC Proj.)2, 5, 15 | | | 410,000 | | | | 5.13 | | | | N/A | | | | 38,130 | |
Nebraska Investment Fin. Auth. Rev. (GNMA/FNMA/FHLMC Collateralized) | | | 310,000 | | | | 3.75 | | | | 9/1/35 | | | | 322,062 | |
| | | | | | | | | | | | | | | | |
| | | | |
| | | | | | | | | | | | | | | 816,940 | |
| | | | | | | | | | | | | | | | |
| | | | |
Nevada - 0.5% | | | | | | | | | | | | | | | | |
City of North Las Vegas (Special Northern Beltway Commercial Area)4 | | | 375,000 | | | | 4.00 | | | | 12/1/27 | | | | 368,779 | |
City of North Las Vegas (Special Northern Beltway Commercial Area)4 | | | 380,000 | | | | 5.00 | | | | 12/1/37 | | | | 383,819 | |
Nevada Hsg. Division Rev. (GNMA/FNMA/FHLMC Collateralized) | | | 400,000 | | | | 3.85 | | | | 10/1/39 | | | | 407,640 | |
NV Hsg. Dev. Single Family Mtg. Program Mezzanine (GNMA/FNMA/FHLMC Collateralized) | | | 30,000 | | | | 5.10 | | | | 10/1/40 | | | | 30,335 | |
| | | | | | | | | | | | | | | | |
| | | | |
| | | | | | | | | | | | | | | 1,190,573 | |
| | | | | | | | | | | | | | | | |
| | | | |
New Hampshire - 0.5% | | | | | | | | | | | | | | | | |
NH Health & Educ. Facs. Auth. Rev. (Wentworth Douglas Hospital) | | | 400,000 | | | | 6.00 | | | | 1/1/34 | | | | 430,052 | |
NH Hsg. Fin. Agy. Rev. (Cimarron, Whittier Falls & Mars) (FHA Insured) | | | 725,000 | | | | 4.00 | | | | 7/1/52 | | | | 744,858 | |
| | | | | | | | | | | | | | | | |
| | | | |
| | | | | | | | | | | | | | | 1,174,910 | |
| | | | | | | | | | | | | | | | |
| | | | |
New Jersey - 2.7% | | | | | | | | | | | | | | | | |
NJ Economic Dev. Auth. Rev. (North Star Academy Charter School Newark) | | | 250,000 | | | | 5.00 | | | | 7/15/47 | | | | 268,745 | |
NJ Economic Dev. Auth. Rev. (State Government Buildings Proj.)9 | | | 500,000 | | | | 5.00 | | | | 6/15/42 | | | | 540,910 | |
NJ Economic Dev. Auth. Rev. (State Housing Proj.)9 | | | 250,000 | | | | 5.00 | | | | 6/15/37 | | | | 275,220 | |
NJ Economic Dev. Auth. Rev. (State Housing Proj.)9 | | | 500,000 | | | | 5.00 | | | | 6/15/43 | | | | 543,960 | |
NJ Higher Education Assistance Auth. Student Loan Rev. | | | 5,000 | | | | 5.00 | | | | 12/1/28 | | | | 5,197 | |
NJ Hsg. & Mtg. Finance Agy. Rev. | | | 265,000 | | | | 5.05 | | | | 10/1/39 | | | | 265,000 | |
NJ Hsg. & Mtg. Finance Agy. Rev. | | | 750,000 | | | | 3.95 | | | | 11/1/43 | | | | 774,045 | |
NJ Hsg. & Mtg. Finance Agy. Rev. (Mciver Homes Hsg. Proj.) (FHLMC Collateralized) | | | 550,000 | | | | 3.60 | | | | 1/1/30 | | | | 567,567 | |
NJ Hsg. & Mtg. Finance Agy. Single Family Mtg. Rev. | | | 350,000 | | | | 4.50 | | | | 10/1/30 | | | | 365,246 | |
NJ Hsg. & Mtg. Finance Agy. Single Family Mtg. Rev. | | | 1,000,000 | | | | 3.75 | | | | 10/1/35 | | | | 1,038,870 | |
NJ Hsg. & Mtg. Finance Agy. Single Family Mtg. Rev. | | | 690,000 | | | | 4.50 | | | | 10/1/48 | | | | 752,645 | |
| | | | |
See accompanying notes to financial statements. | | | | |
28 | | | SIT MUTUAL FUNDS ANNUAL REPORT | |
| | | | | | | | | | | | | | | | |
| | | | | |
| Name of Issuer | | Principal
Amount ($) | | Coupon Rate (%) | | Maturity Date | | Fair Value ($) | |
| | | | |
NJ Hsg. & Mtg. Finance Agy. Single Family Mtg. Rev. | | | 500,000 | | | | 4.00 | | | | 4/1/49 | | | | 518,505 | |
NJ Transportation Trust Fund Auth. Rev.9 | | | 500,000 | | | | 5.25 | | | | 6/15/43 | | | | 557,395 | |
Tobacco Settlement Financing Corp. Rev. | | | 300,000 | | | | 5.00 | | | | 6/1/46 | | | | 316,449 | |
| | | | | | | | | | | | | | | | |
| | | | |
| | | | | | | | | | | | | | | 6,789,754 | |
| | | | | | | | | | | | | | | | |
| | | | |
New Mexico - 1.6% | | | | | | | | | | | | | | | | |
NM Mtg. Fin. Auth. Single Family Mtg. Rev. (FHA Insured) | | | 350,000 | | | | 3.90 | | | | 9/1/42 | | | | 354,641 | |
NM Mtg. Fin. Auth. Single Family Mtg. Rev. (GNMA/FNMA/FHLMC Collateralized) | | | 185,000 | | | | 4.80 | | | | 9/1/29 | | | | 185,984 | |
NM Mtg. Fin. Auth. Single Family Mtg. Rev. (GNMA/FNMA/FHLMC Collateralized) | | | 340,000 | | | | 4.13 | | | | 9/1/42 | | | | 348,225 | |
NM Mtg. Fin. Auth. Single Family Mtg. Rev. (GNMA/FNMA/FHLMC Collateralized) | | | 745,000 | | | | 3.85 | | | | 7/1/43 | | | | 765,540 | |
NM Mtg. Fin. Auth. Single Family Mtg. Rev. (GNMA/FNMA/FHLMC Collateralized) | | | 495,000 | | | | 3.85 | | | | 7/1/43 | | | | 510,083 | |
NM Mtg. Fin. Auth. Single Family Mtg. Rev. (GNMA/FNMA/FHLMC Collateralized) | | | 440,000 | | | | 3.80 | | | | 9/1/46 | | | | 448,417 | |
NM Mtg. Fin. Auth. Single Family Mtg. Rev. (GNMA/FNMA/FHLMC Collateralized) | | | 845,000 | | | | 4.00 | | | | 7/1/48 | | | | 872,310 | |
NM Mtg. Fin. Auth. Single Family Mtg. Rev. (GNMA/FNMA/FHLMC Collateralized) | | | 500,000 | | | | 4.00 | | | �� | 7/1/49 | | | | 522,340 | |
| | | | | | | | | | | | | | | | |
| | | | |
| | | | | | | | | | | | | | | 4,007,540 | |
| | | | | | | | | | | | | | | | |
| | | | |
New York - 3.4% | | | | | | | | | | | | | | | | |
Hempstead Town Local Development Corp. Rev. (Hofstra University Proj.) | | | 350,000 | | | | 4.00 | | | | 7/1/33 | | | | 366,684 | |
New York City Housing Development Corp. Multifamily Mtg. Rev. | | | 250,000 | | | | 4.60 | | | | 11/1/36 | | | | 260,478 | |
New York City Housing Development Corp. Multifamily Mtg. Rev. | | | 300,000 | | | | 4.05 | | | | 11/1/41 | | | | 311,280 | |
New York City Housing Development Corp. Multifamily Mtg. Rev. | | | 300,000 | | | | 3.85 | | | | 11/1/42 | | | | 307,764 | |
New York City Housing Development Corp. Multifamily Mtg. Rev. | | | 650,000 | | | | 3.65 | | | | 11/1/47 | | | | 656,123 | |
New York City Housing Development Corp. Multifamily Mtg. Rev. | | | 500,000 | | | | 3.95 | | | | 11/1/49 | | | | 514,995 | |
New York City Housing Development Corp. Rev. | | | 500,000 | | | | 3.80 | | | | 11/1/37 | | | | 507,775 | |
New York City Municipal Water Finance Authority | | | 750,000 | | | | 5.00 | | | | 6/15/38 | | | | 833,205 | |
NY Mortgage Agency Rev. | | | 190,000 | | | | 3.75 | | | | 10/1/42 | | | | 191,775 | |
NY Mortgage Agency Rev. | | | 500,000 | | | | 4.20 | | | | 10/1/43 | | | | 528,045 | |
NY Mortgage Agency Rev. | | | 750,000 | | | | 3.80 | | | | 10/1/48 | | | | 761,932 | |
NY State Dormitory Auth. Rev. Ref. (Miriam Osborne Memorial Home) | | | 500,000 | | | | 5.00 | | | | 7/1/42 | | | | 503,205 | |
NY State Dormitory Auth. Rev. Ref. (N. Shore-Long Island Jewish Obligation) | | | 300,000 | | | | 5.00 | | | | 5/1/33 | | | | 340,896 | |
NY State Housing Finance Agency Rev. (Affordable Hsg. Proj.) | | | 590,000 | | | | 3.75 | | | | 11/1/37 | | | | 597,275 | |
NY State Housing Finance Agency Rev. (Affordable Hsg. Proj.) | | | 400,000 | | | | 4.88 | | | | 11/1/42 | | | | 414,736 | |
NY State Housing Finance Agency Rev. (Affordable Hsg. Proj.) (FNMA/FHLMC Collateralized) | | | 500,000 | | | | 3.65 | | | | 11/1/34 | | | | 511,360 | |
NY State Housing Finance Agency Rev. (Affordable Hsg. Proj.) (GNMA/FNMA/FHLMC Collateralized) | | | 500,000 | | | | 3.95 | | | | 11/1/37 | | | | 521,175 | |
NY State Housing Finance Agency Rev. (GNMA/FNMA/FHLMC Collateralized) | | | 250,000 | | | | 4.10 | | | | 11/1/41 | | | | 260,652 | |
| | | | | | | | | | | | | | | | |
| | | | |
| | | | | | | | | | | | | | | 8,389,355 | |
| | | | | | | | | | | | | | | | |
| | | | |
North Carolina - 2.1% | | | | | | | | | | | | | | | | |
NC Housing Finance Agency Rev. | | | 650,000 | | | | 3.85 | | | | 7/1/37 | | | | 673,738 | |
NC Housing Finance Agency Rev. | | | 300,000 | | | | 3.95 | | | | 1/1/41 | | | | 309,159 | |
NC Housing Finance Agency Rev. | | | 1,120,000 | | | | 4.00 | | | | 7/1/47 | | | | 1,183,482 | |
NC Housing Finance Agency Rev. (GNMA/FNMA/FHLMC Collateralized) | | | 1,000,000 | | | | 4.10 | | | | 1/1/41 | | | | 1,055,160 | |
NC Housing Finance Agency Rev. (GNMA/FNMA/FHLMC Collateralized) | | | 500,000 | | | | 4.00 | | | | 1/1/48 | | | | 515,625 | |
NC Housing Finance Agency Rev. (GNMA/FNMA/FHLMC Collateralized) | | | 1,250,000 | | | | 3.63 | | | | 7/1/49 | | | | 1,248,462 | |
NC Medical Care Comm. Rev. (Salemtowne Proj.) | | | 300,000 | | | | 5.00 | | | | 10/1/38 | | | | 309,615 | |
| | | | | | | | | | | | | | | | |
| | | | |
| | | | | | | | | | | | | | | 5,295,241 | |
| | | | | | | | | | | | | | | | |
| | | | |
North Dakota - 0.4% | | | | | | | | | | | | | | | | |
ND Housing Finance Agency Rev. | | | 550,000 | | | | 3.85 | | | | 1/1/42 | | | | 567,606 | |
ND Housing Finance Agency Rev. | | | 480,000 | | | | 4.00 | | | | 7/1/48 | | | | 509,405 | |
| | | | | | | | | | | | | | | | |
| | | | |
| | | | | | | | | | | | | | | 1,077,011 | |
| | | | | | | | | | | | | | | | |
| | | | |
See accompanying notes to financial statements. | | | | |
MARCH 31, 2019 | | | 29 | |
SCHEDULE OF INVESTMENTS
March 31, 2019
SitTax-Free Income Fund (Continued)
| | | | | | | | | | | | | | | | |
| Name of Issuer | | Principal
Amount ($) | | Coupon
Rate (%) | | Maturity
Date | | Fair
Value ($) | |
| | | | |
Ohio - 1.6% | | | | | | | | | | | | | | | | |
Dayton-Montgomery Co. Port Auth. Rev. (Storypoint Troy Proj.) | | | 400,000 | | | | 7.00 | | | | 1/15/40 | | | | 405,432 | |
Lake Co. Port & Economic Dev. Auth. Rev. (Tapestry Wickliffe Proj.)4 | | | 250,000 | | | | 6.50 | | | | 12/1/37 | | | | 256,458 | |
Lucas Metro Hsg. Auth. | | | 500,000 | | | | 5.00 | | | | 11/1/36 | | | | 538,290 | |
OH Housing Finance Agency Rev. (GNMA/FNMA Collateralized) | | | 450,000 | | | | 4.05 | | | | 3/1/37 | | | | 468,459 | |
OH Housing Finance Agency Rev. (GNMA/FNMA/FHLMC Collateralized) | | | 455,000 | | | | 3.35 | | | | 9/1/39 | | | | 454,618 | |
OH Housing Finance Agency Rev. (GNMA/FNMA/FHLMC Collateralized) | | | 995,000 | | | | 4.00 | | | | 9/1/48 | | | | 1,028,880 | |
OH Housing Finance Agency Rev. (GNMA/FNMA/FHLMC Collateralized) | | | 750,000 | | | | 4.00 | | | | 3/1/49 | | | | 776,430 | |
| | | | | | | | | | | | | | | | |
| | | | |
| | | | | | | | | | | | | | | 3,928,567 | |
| | | | | | | | | | | | | | | | |
Oklahoma - 0.4% | | | | | | | | | | | | | | | | |
Fort Sill Apache Tribe Economic Dev. Auth.4 | | | 505,000 | | | | 8.50 | | | | 8/25/26 | | | | 569,761 | |
Sallisaw Municipal Auth. Rev. (AGM Insured) | | | 500,000 | | | | 4.45 | | | | 1/1/28 | | | | 507,530 | |
| | | | | | | | | | | | | | | | |
| | | | |
| | | | | | | | | | | | | | | 1,077,291 | |
| | | | | | | | | | | | | | | | |
Oregon - 2.0% | | | | | | | | | | | | | | | | |
Clackamas Co. Hospital Fac. Auth. Rev. (Willamette View Proj.) | | | 460,000 | | | | 5.00 | | | | 11/15/52 | | | | 493,585 | |
Clackamas Co. Hsg. Auth. Rev. (Easton Ridge Apts. Proj.) | | | 350,000 | | | | 3.50 | | | | 9/1/33 | | | | 354,872 | |
Deschutes Co. G.O. (AGC Insured) | | | 635,000 | | | | 4.45 | | | | 6/1/28 | | | | 635,464 | |
Forest Grove Rev. (Campus Improvement-Pacific Unv. Proj.) | | | 250,000 | | | | 5.25 | | | | 5/1/34 | | | | 267,182 | |
Marion Co. School District No.1 Gervais G.O. | | | 500,000 | | | | 4.00 | | | | 6/1/33 | | | | 505,600 | |
OR Hsg. & Community Services Dept. Rev. | | | 250,000 | | | | 3.80 | | | | 7/1/34 | | | | 261,982 | |
OR Hsg. & Community Services Dept. Rev. (Single Family Mtg. Program) | | | 275,000 | | | | 3.75 | | | | 7/1/35 | | | | 280,404 | |
OR Hsg. & Community Services Dept. Rev. (Single Family Mtg. Program) | | | 390,000 | | | | 4.00 | | | | 7/1/38 | | | | 395,542 | |
OR Hsg. & Community Services Dept. Rev. (Single Family Mtg. Program) | | | 460,000 | | | | 3.75 | | | | 7/1/48 | | | | 468,165 | |
OR State Ref G.O. (Veterans Welfare Service) | | | 1,000,000 | | | | 3.90 | | | | 12/1/39 | | | | 1,022,020 | |
Polk Co. Hospital Fac. Auth. Rev. (Dallas Retirement Village Proj.) | | | 250,000 | | | | 5.13 | | | | 7/1/35 | | | | 260,760 | |
| | | | | | | | | | | | | | | | |
| | | | |
| | | | | | | | | | | | | | | 4,945,576 | |
| | | | | | | | | | | | | | | | |
Pennsylvania - 3.8% | | | | | | | | | | | | | | | | |
Allegheny Co. Industrial Dev. Auth. Charter School Rev. (Propel Charter-McKeesport) | | | 145,000 | | | | 5.90 | | | | 8/15/26 | | | | 149,855 | |
Butler Co. General Authority Rev. (School District Proj.) (AGM G.O. of District)1 | | | 465,000 | | | | 2.44 | | | | 10/1/34 | | | | 442,945 | |
Central Bradford Progress Auth. Rev. (Guthrie Healthcare System) | | | 250,000 | | | | 5.50 | | | | 12/1/31 | | | | 270,642 | |
Commonwealth Financing Auth. Rev. (Tobacco Master Settlement Payment) (AGM Insured) | | | 350,000 | | | | 4.00 | | | | 6/1/39 | | | | 367,349 | |
Dauphin Co. General Auth. Rev. (Harrisburg University Science Technology)4 | | | 400,000 | | | | 4.00 | | | | 10/15/22 | | | | 404,336 | |
Erie Co. Hospital Auth. Rev. (St. Vincent Health Center Proj.) | | | 250,000 | | | | 7.00 | | | | 7/1/27 | | | | 266,532 | |
Exeter Township School District G.O. | | | 500,000 | | | | 4.50 | | | | 5/15/28 | | | | 501,735 | |
PA Higher Educational Facs. Auth. Rev. (La Salle University) | | | 280,000 | | | | 5.00 | | | | 5/1/42 | | | | 288,968 | |
PA Hsg. Finance Agy. Rev. | | | 500,000 | | | | 3.90 | | | | 10/1/36 | | | | 521,975 | |
PA Hsg. Finance Agy. Rev. | | | 530,000 | | | | 3.95 | | | | 10/1/38 | | | | 549,472 | |
PA Hsg. Finance Agy. Rev. | | | 500,000 | | | | 4.05 | | | | 10/1/40 | | | | 513,950 | |
PA Hsg. Finance Agy. Rev. | | | 500,000 | | | | 4.05 | | | | 10/1/40 | | | | 512,895 | |
PA Hsg. Finance Agy. Rev. | | | 825,000 | | | | 3.65 | | | | 10/1/42 | | | | 840,230 | |
PA Hsg. Finance Agy. Rev. | | | 250,000 | | | | 4.00 | | | | 10/1/42 | | | | 257,028 | |
PA Hsg. Finance Agy. Rev. | | | 500,000 | | | | 4.10 | | | | 10/1/45 | | | | 500,000 | |
PA Hsg. Finance Agy. Rev. | | | 210,000 | | | | 4.00 | | | | 10/1/46 | | | | 221,355 | |
PA Hsg. Finance Agy. Rev. | | | 500,000 | | | | 4.00 | | | | 10/1/47 | | | | 514,340 | |
PA Turnpike Commission Rev. Capital Appreciation6 | | | 500,000 | | | | 5.13 | | | | 12/1/35 | | | | 529,495 | |
PA Turnpike Commission Rev. Capital Appreciation6 | | | 1,250,000 | | | | 5.00 | | | | 12/1/38 | | | | 1,430,412 | |
Philadelphia Industrial Dev. Auth. Rev. (Charter School Proj.) | | | 250,000 | | | | 5.63 | | | | 8/1/36 | | | | 257,618 | |
| | | | | | | | | | | | | | | | |
| | | | |
| | | | | | | | | | | | | | | 9,341,132 | |
| | | | | | | | | | | | | | | | |
Rhode Island - 0.1% | | | | | | | | | | | | | | | | |
RI Hsg. & Mortgage Finance Corp. Rev. | | | 250,000 | | | | 3.90 | | | | 10/1/37 | | | | 254,575 | |
| | | | | | | | | | | | | | | | |
| | | | |
See accompanying notes to financial statements. | | | | |
30 | | | SIT MUTUAL FUNDS ANNUAL REPORT | |
| | | | | | | | | | | | | | | | |
| | | | | |
| Name of Issuer | | Principal
Amount ($) | | Coupon
Rate (%) | | Maturity
Date | | Fair
Value ($) | |
| | | | |
South Carolina - 0.9% | | | | | | | | | | | | | | | | |
SC Education Assistance Auth. Student Loan Rev. | | | 210,000 | | | | 5.10 | | | | 10/1/29 | | | | 212,908 | |
SC Public Service Auth. Rev. (Santee Cooper) | | | 250,000 | | | | 5.00 | | | | 12/1/38 | | | | 273,528 | |
SC Public Service Auth. Rev. (Santee Cooper) | | | 500,000 | | | | 5.75 | | | | 12/1/43 | | | | 592,140 | |
SC State Hsg. Finance & Dev. Auth. Rev. | | | 1,035,000 | | | | 4.00 | | | | 1/1/47 | | | | 1,068,224 | |
| | | | | | | | | | | | | | | | |
| | | | |
| | | | | | | | | | | | | | | 2,146,800 | |
| | | | | | | | | | | | | | | | |
South Dakota - 0.2% | | | | | | | | | | | | | | | | |
SD Health & Educational Facs. Auth. Rev. (Westhills Village Retirement Community) | | | 500,000 | | | | 5.00 | | | | 9/1/40 | | | | 562,915 | |
| | | | | | | | | | | | | | | | |
| | | | |
Tennessee - 3.1% | | | | | | | | | | | | | | | | |
Franklin Health & Education Facs. Board Rev. (Provision Cares Proton Therapy Center)4 | | | 500,000 | | | | 6.50 | | | | 6/1/27 | | | | 520,255 | |
Nashville Metropolitan Dev. & Hsg. Agency Tax Allocation4 | | | 300,000 | | | | 5.13 | | | | 6/1/36 | | | | 321,147 | |
Shelby Co. Health, Education & Hsg. Facs. Rev. (CME Memphis Apts. Proj.)2, 5, 15 | | | 1,850,000 | | | | 5.35 | | | | N/A | | | | 4,625 | |
Shelby Co. Health, Education & Hsg. Facs. Rev. (CME Memphis Apts. Proj.)2, 5 | | | 7,875,000 | | | | 5.55 | | | | 1/1/29 | | | | 19,688 | |
Shelby Co. Health, Education & Hsg. Facs. Rev. (CME Memphis Apts. Proj.)2, 5 | | | 1,630,000 | | | | 6.00 | | | | 1/1/29 | | | | 16 | |
TN Hsg. Dev. Agency. Rev. | | | 430,000 | | | | 3.60 | | | | 1/1/31 | | | | 437,908 | |
TN Hsg. Dev. Agency. Rev. | | | 575,000 | | | | 3.88 | | | | 7/1/35 | | | | 596,994 | |
TN Hsg. Dev. Agency. Rev. | | | 320,000 | | | | 3.95 | | | | 7/1/35 | | | | 333,494 | |
TN Hsg. Dev. Agency. Rev. | | | 695,000 | | | | 4.00 | | | | 7/1/39 | | | | 727,498 | |
TN Hsg. Dev. Agency. Rev. | | | 495,000 | | | | 3.85 | | | | 7/1/42 | | | | 507,895 | |
TN Hsg. Dev. Agency. Rev. | | | 495,000 | | | | 3.90 | | | | 7/1/42 | | | | 507,865 | |
TN Hsg. Dev. Agency. Rev. | | | 1,000,000 | | | | 4.00 | | | | 7/1/44 | | | | 1,039,270 | |
TN Hsg. Dev. Agency. Rev. | | | 1,000,000 | | | | 3.95 | | | | 1/1/49 | | | | 1,027,400 | |
TN Hsg. Dev. Agency. Rev. | | | 1,615,000 | | | | 4.05 | | | | 1/1/49 | | | | 1,673,592 | |
| | | | | | | | | | | | | | | | |
| | | | |
| | | | | | | | | | | | | | | 7,717,647 | |
| | | | | | | | | | | | | | | | |
Texas - 5.7% | | | | | | | | | | | | | | | | |
Arlington Higher Education Finance Corp. Rev. (KIPP, Inc.) | | | 750,000 | | | | 4.00 | | | | 8/15/43 | | | | 791,820 | |
Arlington Higher Education Finance Corp., Education Rev. (Arlington Classics Academy) | | | 845,000 | | | | 7.00 | | | | 8/15/28 | | | | 900,981 | |
Arlington Higher Education Finance Corp., Education Rev. (Leadership Prep School) | | | 200,000 | | | | 5.00 | | | | 6/15/36 | | | | 203,236 | |
Arlington Special Tax (BAM Insured) | | | 350,000 | | | | 5.00 | | | | 2/15/41 | | | | 389,126 | |
Bexar Co. Rev. (Venue Proj.) | | | 1,000,000 | | | | 5.00 | | | | 8/15/39 | | | | 1,086,220 | |
City of Pearland Waterworks & Sewer System Rev. | | | 500,000 | | | | 4.50 | | | | 9/1/35 | | | | 505,555 | |
Dallas/Fort Worth International Airport Rev. (JT Improvement) | | | 500,000 | | | | 5.25 | | | | 11/1/37 | | | | 563,595 | |
Fort Bend Co. Municipal Utility District No. 25 G.O. (AGM Insured) | | | 350,000 | | | | 5.00 | | | | 10/1/38 | | | | 356,044 | |
Harris Co. Cultural Education Facs. Finance Corp. Rev. (Brazos Presbyterian Homes, Inc. Proj.) | | | 500,000 | | | | 5.00 | | | | 1/1/37 | | | | 537,395 | |
Harris Co. Cultural Education Facs. Finance Corp. Rev. (Space Center Houston Proj.) | | | 600,000 | | | | 6.75 | | | | 8/15/21 | | | | 611,658 | |
Harris-Fort Bend Counties Municipal Utilities Dist. No. 5 G.O. (AGC Insured) | | | 300,000 | | | | 4.88 | | | | 4/1/25 | | | | 300,084 | |
Huffman Independent School District G.O. | | | 955,000 | | | | 4.00 | | | | 2/15/28 | | | | 972,438 | |
New Hope Cultural Education Facs. Corp. Rev. (Cardinal Bay, Inc.) | | | 400,000 | | | | 5.00 | | | | 7/1/46 | | | | 442,224 | |
New Hope Cultural Education Facs. Corp. Rev. (Jubilee Academic Center)4 | | | 250,000 | | | | 5.00 | | | | 8/15/36 | | | | 252,488 | |
New Hope Cultural Education Facs. Corp. Rev. (Legacy Preparatory Charter Academy)4 | | | 500,000 | | | | 6.00 | | | | 8/15/37 | | | | 524,115 | |
New Hope Cultural Education Facs. Corp. Rev. (Presbyterian Village North Proj.) | | | 500,000 | | | | 5.00 | | | | 10/1/34 | | | | 524,270 | |
New Hope Cultural Education Facs. Corp. Rev. (Wesleyan Homes Inc. Proj.) | | | 250,000 | | | | 5.50 | | | | 1/1/35 | | | | 266,295 | |
North Central Texas Health Facility Development Corp. (CC Young Memorial Home) | | | 161,000 | | | | 5.38 | | | | 2/15/25 | | | | 161,159 | |
Red River Health Facs. Dev. Corp. Rev. (MRC Crossings Proj.) | | | 250,000 | | | | 7.50 | | | | 11/15/34 | | | | 282,228 | |
Sheldon Independent School District G.O. | | | 360,000 | | | | 4.00 | | | | 2/15/27 | | | | 367,412 | |
Sugar Land Dev. Corp. Rev. (BAM Insured) | | | 500,000 | | | | 5.00 | | | | 2/15/33 | | | | 550,835 | |
Tarrant Co. Cultural Education Facs. Finance Corp. Rev. (Buckingham Senior Living Community, Inc.)2 | | | 500,000 | | | | 5.63 | | | | 11/15/27 | | | | 395,000 | |
Tarrant Co. Cultural Education Facs. Finance Corp. Rev. (Buckner Retirement Service) | | | 500,000 | | | | 5.00 | | | | 11/15/37 | | | | 557,480 | |
Tarrant Co. Cultural Education Facs. Finance Corp. Rev. (Buckner Senior Living Ventana Proj.) | | | 250,000 | | | | 5.63 | | | | 11/15/24 | | | | 252,802 | |
Tarrant Co. Cultural Education Facs. Finance Corp. Rev. (Buckner Senior Living Ventana Proj.) | | | 500,000 | | | | 6.63 | | | | 11/15/37 | | | | 566,840 | |
| | | | |
See accompanying notes to financial statements. | | | | |
MARCH 31, 2019 | | | 31 | |
SCHEDULE OF INVESTMENTS
March 31, 2019
SitTax-Free Income Fund (Continued)
| | | | | | | | | | | | | | | | |
| | | | | |
| Name of Issuer | | Principal
Amount ($) | | Coupon
Rate (%) | | Maturity Date | | Fair Value ($) | |
| | | | |
Travis Co. Health Facs. Dev. Corp. Rev. (Longhorn Village Proj.) | | | 300,000 | | | | 7.13 | | | | 1/1/46 | | | | 328,053 | |
Travis Co. Health Facs. Dev. Corp. Rev. (Longhorn Village Proj.)1 | | | 425,000 | | | | 5.25 | | | | 1/1/47 | | | | 440,848 | |
TX Department of Housing & Community Affairs (GNMA Collateralized) | | | 500,000 | | | | 4.13 | | | | 9/1/38 | | | | 524,165 | |
TX Grand Parkway Transportation Corp. Rev.6 | | | 500,000 | | | | 6.00 | | | | 10/1/35 | | | | 505,615 | |
| | | | | | | | | | | | | | | | |
| | | | |
| | | | | | | | | | | | | | | 14,159,981 | |
| | | | | | | | | | | | | | | | |
Utah - 0.9% | | | | | | | | | | | | | | | | |
UT Charter School Finance Auth. Rev. (Academy Sciences Proj.)4 | | | 625,000 | | | | 4.65 | | | | 7/15/33 | | | | 625,681 | |
UT Charter School Finance Auth. Rev. (Spectrum Academy Proj.)4 | | | 500,000 | | | | 6.00 | | | | 4/15/45 | | | | 508,970 | |
UT Hsg. Corp. Single Family Mtg. Rev. | | | 50,000 | | | | 5.75 | | | | 1/1/33 | | | | 50,364 | |
UT Hsg. Corp. Single Family Mtg. Rev. | | | 90,000 | | | | 4.60 | | | | 7/1/34 | | | | 91,749 | |
UT Hsg. Corp. Single Family Mtg. Rev. (FHA Insured) | | | 365,000 | | | | 4.00 | | | | 1/1/36 | | | | 369,584 | |
West Valley City Municipal Building Auth. Rev. (AGM Insured) | | | 400,000 | | | | 5.00 | | | | 2/1/39 | | | | 459,844 | |
| | | | | | | | | | | | | | | | |
| | | | |
| | | | | | | | | | | | | | | 2,106,192 | |
| | | | | | | | | | | | | | | | |
Vermont - 0.2% | | | | | | | | | | | | | | | | |
VT Hsg. Fin. Agy. Rev. (GNMA/FNMA/FHLMC Collateralized) | | | 500,000 | | | | 3.50 | | | | 5/1/38 | | | | 505,815 | |
| | | | | | | | | | | | | | | | |
Virginia - 1.1% | | | | | | | | | | | | | | | | |
VA Hsg. Dev. Auth. Rev. (Commonwealth Mtg.) | | | 1,000,000 | | | | 3.63 | | | | 1/1/31 | | | | 1,025,060 | |
VA Hsg. Dev. Auth. Rev. (Commonwealth Mtg.) | | | 525,000 | | | | 3.88 | | | | 1/1/38 | | | | 533,825 | |
VA Hsg. Dev. Auth. Rev. (Rental Hsg. Proj.) | | | 400,000 | | | | 4.13 | | | | 7/1/33 | | | | 419,140 | |
VA Hsg. Dev. Auth. Rev. (Rental Hsg. Proj.) | | | 500,000 | | | | 5.00 | | | | 12/1/39 | | | | 502,470 | |
VA Hsg. Dev. Auth. Rev. (Rental Hsg. Proj.) (G.O. of Auth. Insured) | | | 250,000 | | | | 4.60 | | | | 12/1/38 | | | | 257,022 | |
| | | | | | | | | | | | | | | | |
| | | | |
| | | | | | | | | | | | | | | 2,737,517 | |
| | | | | | | | | | | | | | | | |
Washington - 2.2% | | | | | | | | | | | | | | | | |
Chelan Co. Public Utility District No. 1 Rev. | | | 1,000,000 | | | | 5.00 | | | | 7/1/29 | | | | 1,008,020 | |
Kalispel Tribe of Indians Rev.4 | | | 300,000 | | | | 5.25 | | | | 1/1/38 | | | | 325,584 | |
Pike Place Market Preservation Dev. Auth. Rev. | | | 500,000 | | | | 5.00 | | | | 12/1/40 | | | | 569,555 | |
Vancouver Hsg. Auth. Rev. | | | 500,000 | | | | 3.75 | | | | 8/1/34 | | | | 518,500 | |
WA Hsg. Fin. Commission Multi Family Mtg. Rev. (Bayview Manor Homes)4 | | | 250,000 | | | | 5.00 | | | | 7/1/31 | | | | 268,735 | |
WA Hsg. Fin. Commission Multi Family Mtg. Rev. (Bayview Manor Homes)4 | | | 750,000 | | | | 5.00 | | | | 7/1/36 | | | | 794,318 | |
WA Hsg. Fin. Commission Multi Family Mtg. Rev. (Horizon House Proj.)4 | | | 500,000 | | | | 5.00 | | | | 1/1/38 | | | | 550,970 | |
WA Hsg. Fin. Commission Multi Family Mtg. Rev. (Wesley Homes Lea Hill Proj.)4 | | | 300,000 | | | | 5.00 | | | | 7/1/36 | | | | 312,558 | |
WA Hsg. Fin. Commission Rev. (Heron’s Key Senior Living)4 | | | 400,000 | | | | 6.50 | | | | 7/1/30 | | | | 436,744 | |
WA Hsg. Fin. Commission Single Family Mtg. Rev. (GNMA/FNMA/FHLMC Collateralized) | | | 60,000 | | | | 4.60 | | | | 10/1/33 | | | | 60,583 | |
WA Hsg. Fin. Commission Single Family Mtg. Rev. (GNMA/FNMA/FHLMC Collateralized) | | | 480,000 | | | | 4.00 | | | | 12/1/47 | | | | 502,368 | |
| | | | | | | | | | | | | | | | |
| | | | |
| | | | | | | | | | | | | | | 5,347,935 | |
| | | | | | | | | | | | | | | | |
West Virginia - 0.5% | | | | | | | | | | | | | | | | |
WV Hsg. Dev. Fund Rev. | | | 250,000 | | | | 3.75 | | | | 11/1/32 | | | | 259,962 | |
WV Hsg. Dev. Fund Rev. | | | 295,000 | | | | 3.80 | | | | 11/1/35 | | | | 299,154 | |
WV Hsg. Dev. Fund Rev. | | | 500,000 | | | | 4.00 | | | | 11/1/37 | | | | 521,455 | |
WV Hsg. Dev. Fund Rev. | | | 165,000 | | | | 4.10 | | | | 11/1/45 | | | | 169,998 | |
| | | | | | | | | | | | | | | | |
| | | | |
| | | | | | | | | | | | | | | 1,250,569 | |
| | | | | | | | | | | | | | | | |
Wisconsin - 5.0% | | | | | | | | | | | | | | | | |
WI Health & Education Facs. Auth. Rev. (Medical College) | | | 870,000 | | | | 5.25 | | | | 12/1/35 | | | | 872,854 | |
WI Health & Education Facs. Auth. Rev. (PHW Oconomowoc, Inc. Proj.) | | | 1,000,000 | | | | 5.13 | | | | 10/1/48 | | | | 1,037,720 | |
WI Health & Education Facs. Auth. Rev. (Rogers Memorial Hospital) | | | 700,000 | | | | 4.40 | | | | 7/1/38 | | | | 701,771 | |
WI Health & Education Facs. Auth. Rev. (St. John’s Communities, Inc. Proj.) | | | 500,000 | | | | 5.00 | | | | 9/15/40 | | | | 519,990 | |
WI Health & Education Facs. Auth. Rev. (Three Pillars Senior Living) | | | 1,000,000 | | | | 5.00 | | | | 8/15/43 | | | | 1,071,860 | |
WI Health & Educational Facs. Auth. Rev. (Aspirus, Inc. Obligation Group) | | | 500,000 | | | | 5.00 | | | | 8/15/32 | | | | 567,145 | |
WI Health & Educational Facs. Auth. Rev. (Benevolent Corp. Cedar Community) | | | 300,000 | | | | 5.00 | | | | 6/1/37 | | | | 315,054 | |
| | | | |
See accompanying notes to financial statements. | | | | |
32 | | | SIT MUTUAL FUNDS ANNUAL REPORT | |
| | | | | | | | | | | | | | | | |
| Name of Issuer | | Principal
Amount ($) | | Coupon
Rate (%) | | Maturity
Date | | Fair
Value ($) | |
| | | | |
WI Health & Educational Facs. Auth. Rev. (Froedtert Health, Inc. Obligated Group) | | | 500,000 | | | | 5.00 | | | | 4/1/35 | | | | 579,115 | |
WI Housing & Economic Dev. Auth. Rev. | | | 250,000 | | | | 3.88 | | | | 11/1/35 | | | | 259,428 | |
WI Housing & Economic Dev. Auth. Rev. | | | 560,000 | | | | 3.90 | | | | 11/1/42 | | | | 576,246 | |
WI Housing & Economic Dev. Auth. Rev. | | | 500,000 | | | | 4.15 | | | | 5/1/55 | | | | 514,805 | |
WI Public Finance Auth. Rev. (Coral Academy of Science Las Vegas) | | | 300,000 | | | | 5.00 | | | | 7/1/38 | | | | 326,367 | |
WI Public Finance Auth. Rev. (Delray Beach Radiation Therapy) 4 | | | 750,000 | | | | 6.25 | | | | 11/1/28 | | | | 817,972 | |
WI Public Finance Auth. Rev. (Glenridge Palmer Ranch Proj.) 4 | | | 500,000 | | | | 8.25 | | | | 6/1/46 | | | | 558,765 | |
WI Public Finance Auth. Rev. (Lombard Public Facilities Corp.) 2, 4, 6 | | | 16,520 | | | | 9.00 | | | | 1/1/46 | | | | 519 | |
WI Public Finance Auth. Rev. (Lombard Public Facilities Corp.) 2,4, 6 | | | 16,287 | | | | 9.00 | | | | 1/1/47 | | | | 508 | |
WI Public Finance Auth. Rev. (Lombard Public Facilities Corp.) 2,4, 6 | | | 447 | | | | 12.00 | | | | 1/1/47 | | | | 14 | |
WI Public Finance Auth. Rev. (Lombard Public Facilities Corp.) 2,4, 6 | | | 16,171 | | | | 9.00 | | | | 1/1/48 | | | | 501 | |
WI Public Finance Auth. Rev. (Lombard Public Facilities Corp.) 2,4, 6 | | | 390 | | | | 12.00 | | | | 1/1/48 | | | | 12 | |
WI Public Finance Auth. Rev. (Lombard Public Facilities Corp.) 2,4, 6 | | | 16,055 | | | | 9.00 | | | | 1/1/49 | | | | 494 | |
WI Public Finance Auth. Rev. (Lombard Public Facilities Corp.) 2,4, 6 | | | 384 | | | | 11.00 | | | | 1/1/49 | | | | 12 | |
WI Public Finance Auth. Rev. (Lombard Public Facilities Corp.) 2,4, 6 | | | 15,822 | | | | 9.00 | | | | 1/1/50 | | | | 483 | |
WI Public Finance Auth. Rev. (Lombard Public Facilities Corp.) 2,4, 6 | | | 372 | | | | 11.00 | | | | 1/1/50 | | | | 11 | |
WI Public Finance Auth. Rev. (Lombard Public Facilities Corp.) 2,4, 6 | | | 17,334 | | | | 9.00 | | | | 1/1/51 | | | | 526 | |
WI Public Finance Auth. Rev. (Lombard Public Facilities Corp.) 2,4, 6 | | | 365 | | | | 11.00 | | | | 1/1/51 | | | | 11 | |
WI Public Finance Auth. Rev. (Lombard Public Facilities Corp.) 1,2, 4 | | | 451,406 | | | | 3.75 | | | | 7/1/51 | | | | 415,113 | |
WI Public Finance Auth. Rev. (Lombard Public Facilities Corp.) 2,4, 6 | | | 17,218 | | | | 9.00 | | | | 1/1/52 | | | | 519 | |
WI Public Finance Auth. Rev. (Lombard Public Facilities Corp.) 2,4, 6 | | | 475 | | | | 10.00 | | | | 1/1/52 | | | | 14 | |
WI Public Finance Auth. Rev. (Lombard Public Facilities Corp.) 2,4, 6 | | | 16,985 | | | | 9.00 | | | | 1/1/53 | | | | 509 | |
WI Public Finance Auth. Rev. (Lombard Public Facilities Corp.) 2,4, 6 | | | 469 | | | | 10.00 | | | | 1/1/53 | | | | 14 | |
WI Public Finance Auth. Rev. (Lombard Public Facilities Corp.) 2,4, 6 | | | 16,869 | | | | 9.00 | | | | 1/1/54 | | | | 502 | |
WI Public Finance Auth. Rev. (Lombard Public Facilities Corp.) 2,4, 6 | | | 453 | | | | 10.00 | | | | 1/1/54 | | | | 13 | |
WI Public Finance Auth. Rev. (Lombard Public Facilities Corp.) 2,4, 6 | | | 16,636 | | | | 9.00 | | | | 1/1/55 | | | | 492 | |
WI Public Finance Auth. Rev. (Lombard Public Facilities Corp.) 2,4, 6 | | | 444 | | | | 9.00 | | | | 1/1/55 | | | | 13 | |
WI Public Finance Auth. Rev. (Lombard Public Facilities Corp.) 2,4, 6 | | | 16,404 | | | | 9.00 | | | | 1/1/56 | | | | 482 | |
WI Public Finance Auth. Rev. (Lombard Public Facilities Corp.) 2,4, 6 | | | 434 | | | | 9.00 | | | | 1/1/56 | | | | 13 | |
WI Public Finance Auth. Rev. (Lombard Public Facilities Corp.) 2,4 | | | 21,153 | | | | 5.50 | | | | 7/1/56 | | | | 20,125 | |
WI Public Finance Auth. Rev. (Lombard Public Facilities Corp.) 2,4, 6 | | | 16,287 | | | | 9.00 | | | | 1/1/57 | | | | 476 | |
WI Public Finance Auth. Rev. (Lombard Public Facilities Corp.) 2,4, 6 | | | 481 | | | | 9.00 | | | | 1/1/57 | | | | 14 | |
WI Public Finance Auth. Rev. (Lombard Public Facilities Corp.) 2,4, 6 | | | 16,055 | | | | 9.00 | | | | 1/1/58 | | | | 467 | |
WI Public Finance Auth. Rev. (Lombard Public Facilities Corp.) 2,4, 6 | | | 469 | | | | 9.00 | | | | 1/1/58 | | | | 14 | |
WI Public Finance Auth. Rev. (Lombard Public Facilities Corp.) 2,4, 6 | | | 15,938 | | | | 9.00 | | | | 1/1/59 | | | | 461 | |
WI Public Finance Auth. Rev. (Lombard Public Facilities Corp.) 2,4, 6 | | | 456 | | | | 9.00 | | | | 1/1/59 | | | | 13 | |
WI Public Finance Auth. Rev. (Lombard Public Facilities Corp.) 2,4, 6 | | | 447 | | | | 8.00 | | | | 1/1/60 | | | | 13 | |
WI Public Finance Auth. Rev. (Lombard Public Facilities Corp.) 2,4, 6 | | | 15,822 | | | | 9.00 | | | | 1/1/60 | | | | 455 | |
WI Public Finance Auth. Rev. (Lombard Public Facilities Corp.) 2,4, 6 | | | 440 | | | | 8.00 | | | | 1/1/61 | | | | 13 | |
WI Public Finance Auth. Rev. (Lombard Public Facilities Corp.) 2,4, 6 | | | 15,589 | | | | 9.00 | | | | 1/1/61 | | | | 446 | |
WI Public Finance Auth. Rev. (Lombard Public Facilities Corp.) 2,4, 6 | | | 428 | | | | 8.00 | | | | 1/1/62 | | | | 12 | |
WI Public Finance Auth. Rev. (Lombard Public Facilities Corp.) 2,4, 6 | | | 15,473 | | | | 9.00 | | | | 1/1/62 | | | | 440 | |
WI Public Finance Auth. Rev. (Lombard Public Facilities Corp.) 2,4, 6 | | | 419 | | | | 8.00 | | | | 1/1/63 | | | | 12 | |
WI Public Finance Auth. Rev. (Lombard Public Facilities Corp.) 2,4, 6 | | | 15,240 | | | | 9.00 | | | | 1/1/63 | | | | 431 | |
WI Public Finance Auth. Rev. (Lombard Public Facilities Corp.) 2,4, 6 | | | 409 | | | | 8.00 | | | | 1/1/64 | | | | 12 | |
WI Public Finance Auth. Rev. (Lombard Public Facilities Corp.) 2,4, 6 | | | 15,124 | | | | 9.00 | | | | 1/1/64 | | | | 426 | |
WI Public Finance Auth. Rev. (Lombard Public Facilities Corp.) 2,4, 6 | | | 403 | | | | 7.00 | | | | 1/1/65 | | | | 11 | |
WI Public Finance Auth. Rev. (Lombard Public Facilities Corp.) 2,4, 6 | | | 15,008 | | | | 9.00 | | | | 1/1/65 | | | | 421 | |
WI Public Finance Auth. Rev. (Lombard Public Facilities Corp.) 2,4, 6 | | | 434 | | | | 7.00 | | | | 1/1/66 | | | | 12 | |
WI Public Finance Auth. Rev. (Lombard Public Facilities Corp.) 2,4, 6 | | | 14,775 | | | | 9.00 | | | | 1/1/66 | | | | 412 | |
WI Public Finance Auth. Rev. (Lombard Public Facilities Corp.) 2,4, 6 | | | 5,235 | | | | 7.00 | | | | 1/1/67 | | | | 145 | |
WI Public Finance Auth. Rev. (Lombard Public Facilities Corp.) 2,4, 6 | | | 192,429 | | | | 9.00 | | | | 1/1/67 | | | | 5,340 | |
| | | | |
See accompanying notes to financial statements. | | | | |
MARCH 31, 2019 | | | 33 | |
SCHEDULE OF INVESTMENTS
March 31, 2019
SitTax-Free Income Fund (Continued)
| | | | | | | | | | | | | | | | |
| Name of Issuer | | Principal
Amount ($)/
Quantity | | Coupon
Rate (%) | | Maturity
Date | | Fair Value ($) | |
| | | | |
WI Public Finance Auth. Rev. (MD Proton Treatment Center) 4 | | | 500,000 | | | | 6.13 | | | | 1/1/33 | | | | 536,225 | |
WI Public Finance Auth. Rev. (MN College of Osteopathic Medicine) 4 | | | 250,000 | | | | 5.50 | | | | 12/1/48 | | | | 258,498 | |
WI Public Finance Auth. Rev. (Mountain Island Charter School) | | | 820,000 | | | | 5.00 | | | | 7/1/37 | | | | 871,980 | |
WI Public Finance Auth. Rev. (Rose Villa Proj.) 4 | | | 450,000 | | | | 5.00 | | | | 11/15/24 | | | | 481,302 | |
WI Public Finance Auth. Rev. (Roseman University Health Sciences) | | | 250,000 | | | | 5.00 | | | | 4/1/25 | | | | 264,005 | |
WI Public Finance Auth. Rev. (Roseman University Health Sciences) | | | 500,000 | | | | 5.50 | | | | 4/1/32 | | | | 526,910 | |
WI State Rev. | | | 225,000 | | | | 6.00 | | | | 5/1/27 | | | | 225,817 | |
| | | | | | | | | | | | | | | | |
| | | | |
| | | | | | | | | | | | | | | 12,334,775 | |
| | | | | | | | | | | | | | | | |
| | | | |
Wyoming - 0.8% | | | | | | | | | | | | | | | | |
WY Community Dev. Auth. Rev. | | | 505,000 | | | | 3.75 | | | | 12/1/32 | | | | 517,681 | |
WY Community Dev. Auth. Rev. | | | 50,000 | | | | 4.25 | | | | 12/1/37 | | | | 50,287 | |
WY Community Dev. Auth. Rev. | | | 1,000,000 | | | | 3.90 | | | | 12/1/38 | | | | 1,037,710 | |
WY Community Dev. Auth. Rev. | | | 285,000 | | | | 4.05 | | | | 12/1/38 | | | | 291,618 | |
| | | | | | | | | | | | | | | | |
| | | | |
| | | | | | | | | | | | | | | 1,897,296 | |
| | | | | | | | | | | | | | | | |
Total Municipal Bonds
(cost: $229,261,672) | | | | | | | | | | | | | | | 224,003,609 | |
| | | | | | | | | | | | | | | | |
| | | | |
Investment Companies - 3.6% | | | | | | | | | | | | | | | | |
BlackRock Long-Term Municipal Advantage Trust (BTA) | | | 59,383 | | | | | | | | | | | | 726,848 | |
BlackRock Municipal Income Investment Quality Trust (BAF) | | | 25,000 | | | | | | | | | | | | 347,500 | |
BlackRock MuniEnhanced Fund, Inc. (MEN) | | | 24,000 | | | | | | | | | | | | 256,800 | |
BlackRock MuniHoldings Florida Insured Fund (MFL) | | | 63,500 | | | | | | | | | | | | 819,785 | |
BlackRock MuniHoldings Fund II, Inc. (MUH) | | | 36,000 | | | | | | | | | | | | 532,440 | |
BlackRock MuniHoldings Quality Fund II, Inc. (MUE) | | | 20,000 | | | | | | | | | | | | 246,000 | |
BlackRock MuniHoldings Quality Fund, Inc. (MUS) | | | 26,438 | | | | | | | | | | | | 320,164 | |
BlackRock MuniYield Insured Fund (MYI) | | | 71,171 | | | | | | | | | | | | 920,241 | |
BlackRock MuniYield Michigan Insured Fund (MIY) | | | 21,538 | | | | | | | | | | | | 287,748 | |
DWS Municipal, Income Trust (KTF) | | | 50,436 | | | | | | | | | | | | 555,805 | |
Invesco Municipal Opportunity Trust (VMO) | | | 38,400 | | | | | | | | | | | | 458,112 | |
Invesco Municipal Trust (VKQ) | | | 25,000 | | | | | | | | | | | | 301,250 | |
Invesco Quality Municipal Income Trust (IQI) | | | 25,000 | | | | | | | | | | | | 302,750 | |
Invesco Van Kampen Advantage Muni Income Trust (VKI) | | | 40,200 | | | | | | | | | | | | 432,954 | |
Invesco Van Kampen Trust For Investment Grade Municipals (VGM) | | | 25,000 | | | | | | | | | | | | 309,750 | |
NuveenAMT-Free Quality Municipal Income Fund (NEA) | | | 117,572 | | | | | | | | | | | | 1,570,762 | |
Nuveen Quality Municipal Income Fund (NAD) | | | 21,173 | | | | | | | | | | | | 287,318 | |
Putnam Municipal Opportunities Trust (PMO) | | | 15,000 | | | | | | | | | | | | 183,900 | |
| | | | | | | | | | | | | | | | |
| | | | |
Total Investment Companies
(cost: $8,978,210) | | | | | | | | | | | | | | | 8,860,127 | |
| | | | | | | | | | | | | | | | |
| | | | |
Total Investments in Securities - 94.1%
(cost: $238,239,882) | | | | | | | | | | | | | | | 232,863,736 | |
Other Assets and Liabilities, net - 5.9% | | | | | | | | | | | | | | | 14,487,112 | |
| | | | | | | | | | | | | | | | |
| | | | |
Total Net Assets - 100.0% | | | | | | | | | | | | | | $ | 247,350,848 | |
| | | | | | | | | | | | | | | | |
| | | | |
See accompanying notes to financial statements. | | | | |
34 | | | SIT MUTUAL FUNDS ANNUAL REPORT | |
| 1 | Variable rate security. Rate disclosed is as of March 31, 2019. Certain variable rate securities are not based on a published reference rate and spread but are determined by the issuer or agent and are based on current market conditions, or, for mortgage-backed securities, are impacted by the individual mortgages which are paying off over time. These securities do not indicate a reference rate and spread in their descriptions. |
| 2 | Securities considered illiquid by the Investment Adviser. The total value of such securities as of March 31, 2019 was $2,658,328 and represented 1.1% of net assets. |
| 4 | 144A Restricted Security. The total value of such securities as of March 31, 2019 was $21,803,794 and represented 8.8% of net assets. These securities have been determined to be liquid by the Adviser in accordance with guidelines established by the Board of Directors. |
| 5 | The issuer is in default of interest or principal payments, or other debt covenants. Income is not being accrued. The total value of such securities as of March 31, 2019 was $1,175,682 and represented 0.5% of net assets. |
| 6 | Zero coupon or convertible capital appreciation bond, for which the rate disclosed is either the effective yield on purchase date or the coupon rate to be paid upon conversion to coupon paying, respectively. |
| 9 | Municipal Lease Security. The total value of such securities as of March 31, 2019 was $3,864,149 and represented 1.6% of net assets. These securities have been determined to be liquid by the Adviser in accordance with guidelines established by the Board of Directors. |
| 15 | Securities with a “N/A” maturity date have passed their stated maturity date and have pending restructuring arrangements. |
Numeric footnotes not disclosed are not applicable to this Schedule of Investments.
Short futures contracts outstanding as of March 31, 2019 were as follows:
| | | | | | | | | | | | | | | | | | | | | | | | | | | | |
| Type | | Contracts | | | | | | Expiration
Date | | | | | | Notional
Amount ($) | | | | | | Value/
Unrealized
Appreciation
Depreciation ($) |
| | | | | | | | |
Short Futures:10 | | | | | | | | | | | | | | | | | | | | | | | | | | | | |
U.S. Treasury10-Year | | | 145 | | | | | | | | June 2019 | | | | | | | | (18,011,719 | ) | | | | | | (262,154) | | |
U.S. Treasury5-Year | | | 117 | | | | | | | | June 2019 | | | | | | | | (13,551,891 | ) | | | | | | (129,255) | | |
U.S. Treasury2-Year | | | 67 | | | | | | | | June 2019 | | | | | | | | (14,277,281 | ) | | | | | | (55,170) | | |
U.S. Treasury Long Bond | | | 46 | | | | | | | | June 2019 | | | | | | | | (6,884,188 | ) | | | | | | (171,215) | | |
| | | | | | | | |
| | | | | | | | | | | | | | | | | | | | | | | | | | (617,794) | | |
| 10 | The amount of $3,000,000 in cash was segregated with the broker to cover margin requirements for derivative transactions as of March 31, 2019. |
A summary of the levels for the Fund’s investments as of March 31, 2019 is as follows (see Note 2 - significant accounting policies in the notes to financial statements):
| | | | | | | | | | | | | | | | | | | | |
| | | | | Investment in Securities | | |
| | | Level 1 | | Level 2 | | Level 3 | | |
| | | Quoted | | Other significant | | Significant | | |
| | | Price ($) | | observable inputs ($) | | unobservable inputs ($) | | Total ($) |
Assets | | | | | | | | | | | | | | | | | | | | |
Municipal Bonds | | | | — | | | | | 224,003,609 | | | | | — | | | | | 224,003,609 | |
Investment Companies | | | | 8,860,127 | | | | | — | | | | | — | | | | | 8,860,127 | |
| | | | |
| | | | 8,860,127 | | | | | 224,003,609 | | | | | — | | | | | 232,863,736 | |
Liabilities | | | | | | | | | | | | | | | | | | | | |
Futures | | | | (617,794 | ) | | | | — | | | | | — | | | | | (617,794 | ) |
There were no transfers into or out of level 3 during the reporting period.
| | | | |
See accompanying notes to financial statements. | | | | |
MARCH 31, 2019 | | | 35 | |
|
|
| |
Sit Minnesota Tax-Free Income Fund |
OBJECTIVE & STRATEGY
The investment objective of the MinnesotaTax-Free Income Fund is to provide a high level of current income exempt from federal regular income tax and Minnesota regular personal income tax as is consistent with the preservation of capital.
During normal market conditions, the Fund invests 100% of its net assets in municipal securities that generate interest income that is exempt from federal regular income tax and Minnesota regular personal income tax. The Fund anticipates that substantially all of its distributions to its shareholders will be exempt as such. For investors subject to the alternative minimum tax (“AMT”), up to 20% of the Fund’s income may be alternative minimum taxable income.
The Sit Minnesota Tax-Free Income Fund provided a return of +4.15% during the fiscal year ended March 31, 2019, versus a return of +4.42% for its benchmark, the Bloomberg Barclays5-year Municipal Bond Index. As of March 31, 2019, the Fund’s30-day SEC yield was 2.60%, compared to the yield of 1.83% for the benchmark index. The Fund’s12-month distribution rate was 3.11%.
Minnesota’s steady economic performance continues. The latest forecast for theFY2018-19 biennium shows a $563 million surplus for the state. The unemployment rate declined to 3.1% and remains below the 3.8% national rate as of February 2019. The State has benefited from the ongoing U.S. economic expansion and revenue growth that have allowed it to build up reserves, creating a strong buffer for future revenue declines. Minnesota’s state general obligation bond rating remains at AAA by Standard & Poor’s Corp. and Aa1 by Moody’s.
Thetax-exempt yield curve shifted lower during the past year with short to intermediate yields falling the most. Yields for5-year to15-year maturities fell approximately50-55 basis points while yields for long bonds fell approximately35-40 basis points. The municipal market was buoyed by lower issuance volume throughout the fiscal year. Going into 2018, lighter supply was expected in the wake of federal tax law changes in 2017. Specifically, issuance for the period of April 1, 2018 through December 31, 2018 fell to $253.1B, or 13.1% below the average for that period since 2001. 2019Q1 issuance was $69.9B, bringing the fiscal year total to $323.0B, or 13.3% below the average for that period. Supply of Minnesotatax-exempt bonds was lower than in recent years but sufficient for us to find attractive investment opportunities for the Fund.Tax-exempt fund flows also provided support for the municipal market when they turned positive in December and accelerated in the first quarter of 2019 to a record $23.4B of inflows, the best start to a calendar year since the data series began in 1992.
The Fund maintained a larger weighting of long duration bonds relative to the benchmark over the last year. This strategy proved advantageous as yields fell across the curve and long duration bonds outperformed short duration bonds. However, the effect was dampened using U.S. Treasury futures to shorten duration, which we’ve done since April 2017 in anticipation of moderately rising interest rates. This hedging strategy was beneficial to the Fund’s performance between April and October, but detrimental as Treasury yields declined throughout the remainder of the fiscal year. As a result, the Fund underper-formed its benchmark for the year. Offsetting factors included sector allocation and the Fund’s superior selection innon-rated bonds.
HYPOTHETICAL GROWTH OF $10,000
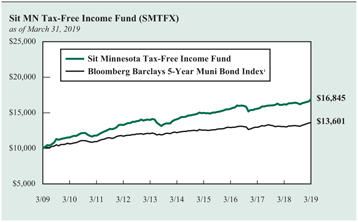
The chart above illustrates the total value of a hypothetical $10,000 investment in the Fund over the past 10 years (or for the life of the Fund if shorter) as compared to the performance of the Bloomberg Barclays5-Year Municipal Bond Index. Past performance does not guarantee future results. Returns include the reinvestment of distributions. The chart does not reflect the deduction of taxes that a shareholder would pay on Fund distributions or the redemption of Fund shares.
1 The Bloomberg Barclays5-Year Municipal Bond Index is the 5 year(4-6) component of the Municipal Bond Index, an unmanaged, rules-based, market-value-weighted index for the long-termtax-exempt bond market. The index includes bonds with a minimum credit rating of BBB. The returns include the reinvestment of income and do not include any transaction costs, management fees or other costs. It is not possible to invest directly in an index. This is the Fund’s primary index.
The Fund was overweight in housing, education and healthcare bonds – all of which outperformed the benchmark index. At the end of the fiscal year, the Fund held 25% of net assets innon-rated bonds and these bonds outperformed rated bonds over the past year.
The Fund’s core strategy continues to emphasize current income as the primary driver of returns over the long run, thus we will add to higher coupon bonds when available. We will also focus deeply on credit analysis to take advantage of opportunities as they arise. We expect to continue hedging to maintain duration close to that of the Fund’s benchmark, but we will remain prepared to adjust this position as market conditions warrant. We remain diversified on an industry and issuer basis in order to manage credit and liquidity risk, and we believe the Fund is positioned to achieve attractive risk-adjusted returns going forward.
Paul J. Jungquist, CFA
Senior Portfolio Manager
| | |
Information on this page is unaudited. |
36 | | SIT MUTUAL FUNDS ANNUAL REPORT |
COMPARATIVE RATES OF RETURNS
as of March 31, 2019
| | | | | | | | | | |
| | | Sit
Minnesota
Tax-Free
Income Fund | | Bloomberg
Barclays
5-Year
Muni. Bond
Index1 | | | Lipper MN
Muni. Bond
Fund Index2 | |
| | | |
One Year | | 4.15% | | | 4.42% | | | | 4.27% | |
Five Years | | 3.69 | | | 2.23 | | | | 3.41 | |
Ten Years | | 5.35 | | | 3.12 | | | | 4.51 | |
Since Inception (12/1/93) | | 4.66 | | | 4.22 | | | | 4.39 | |
Performance figures are historical and do not guarantee future results. Investment returns and principal value will vary, and you may have a gain or loss when you sell shares. Current performance may be lower or higher than the performance data quoted. Contact the Fund for performance data current to the most recentmonth-end. Returns include changes in share price as well as reinvestment of all dividends and capital gains. Returns do not reflect the deduction of taxes that a shareholder would pay on Fund distributions or the redemption of Fund shares. Management fees and administrative expenses are included in the Fund’s performance. Returns for periods greater than one year are compounded average annual rates of return.
1 The Bloomberg Barclays5-Year Municipal Bond Index is the 5 year(4-6) component of the Municipal Bond Index, an unmanaged, rules-based, market-value-weighted index made for the long-termtax-exempt bond market. The index includes bonds with a minimum credit rating of BBB. The returns include the reinvestment of income and do not include any transaction costs, management fees or other costs. It is not possible to invest directly in an index.
2 The Lipper returns are obtained from Lipper Analytical Services, Inc., a large independent evaluator of mutual funds.
FUND DIVERSIFICATION
| | | | |
Multifamily Mortgage | | | 19.4% | |
Single Family Mortgage | | | 16.9 | |
Hospital/Health Care | | | 15.7 | |
Education/Student Loan | | | 13.2 | |
General Obligation | | | 8.7 | |
Municipal Lease | | | 5.2 | |
Sectors less than 5.0% | | | 15.6 | |
Cash & Other Net Assets | | | 5.3 | |
Based on total net assets as of March 31, 2019. Subject to change.
PORTFOLIO SUMMARY
| | |
Net Asset Value 3/31/19: | | $10.49 Per Share |
Net Asset Value 3/31/18: | | $10.39 Per Share |
Total Net Assets: | | $ 617.8 Million |
Average Maturity: | | 15.9 Years |
Effective Duration3: | | 4.7 Years |
3 Duration is a measure of estimated price sensitivity relative to changes in interest rates. Portfolios with longer durations are typically more sensitive to changes in interest rates. For example, if interest rates rise by 1%, the fair value of a security with an effective duration of 5 years would decrease by 5%, with all other factors being constant. The correlation between duration and price sensitivity is greater for securities rated investment-grade than it is for securities rated below investment-grade. Duration estimates are based on assumptions by the Adviser and are subject to a number of limitations. Effective duration is calculated based on historical price changes of securities held by the Fund, and therefore is a more accurate estimate of price sensitivity provided interest rates remain within their historical range.
QUALITY RATINGS (% of Total Net Assets)
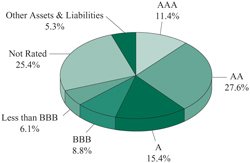
Lower of Moody’s, S&P, Fitch or Duff & Phelps ratings used.
Adviser’s Assessment ofNon-Rated Securities:
| | | | |
A | | | 1.4% | |
BBB | | | 4.9 | |
BB | | | 17.7 | |
<BB | | | 1.4 | |
| | | | |
Total | | | 25.4% | |
| | |
| Information on this page is unaudited. |
| MARCH 31, 2019 | | 37 |
SCHEDULE OF INVESTMENTS
March 31, 2019
Sit MinnesotaTax-Free Income Fund
| | | | | | | | | | | | | | | | |
| Name of Issuer | | Principal
Amount ($) | | Coupon
Rate (%) | | Maturity Date | | Fair Value ($) | |
| | | | |
Municipal Bonds - 93.7% | | | | | | | | | | | | | | | | |
Education/Student Loan - 13.2% | | | | | | | | | | | | | | | | |
| | | | |
Baytown Township Rev. (St. Croix Prep) | | | 1,000,000 | | | | 4.00 | | | | 8/1/36 | | | | 991,310 | |
Baytown Township Rev. (St. Croix Prep) | | | 1,250,000 | | | | 4.00 | | | | 8/1/41 | | | | 1,201,675 | |
Baytown Township Rev. (St. Croix Prep) | | | 1,000,000 | | | | 4.25 | | | | 8/1/46 | | | | 985,630 | |
Bethel Charter School Lease Rev. (Spectrum High School Proj.) | | | 500,000 | | | | 3.50 | | | | 7/1/27 | | | | 499,270 | |
Bethel Charter School Lease Rev. (Spectrum High School Proj.) | | | 900,000 | | | | 4.00 | | | | 7/1/32 | | | | 908,784 | |
Bethel Charter School Lease Rev. (Spectrum High School Proj.) | | | 1,100,000 | | | | 4.00 | | | | 7/1/37 | | | | 1,094,302 | |
Bethel Charter School Lease Rev. (Spectrum High School Proj.) | | | 1,500,000 | | | | 4.25 | | | | 7/1/47 | | | | 1,507,005 | |
Brooklyn Park Charter School Lease Rev. (Athlos Leadership Academy Proj.) | | | 605,000 | | | | 5.25 | | | | 7/1/30 | | | | 627,760 | |
Cologne Charter School Lease Rev. (Cologne Academy Proj.) | | | 285,000 | | | | 4.00 | | | | 7/1/21 | | | | 289,834 | |
Cologne Charter School Lease Rev. (Cologne Academy Proj.) | | | 295,000 | | | | 4.00 | | | | 7/1/22 | | | | 301,115 | |
Cologne Charter School Lease Rev. (Cologne Academy Proj.) | | | 575,000 | | | | 5.00 | | | | 7/1/29 | | | | 607,292 | |
Cologne Charter School Lease Rev. (Cologne Academy Proj.) | | | 500,000 | | | | 5.00 | | | | 7/1/34 | | | | 516,765 | |
Deephaven Charter School Lease Rev. (Eagle Ridge Academy Proj.) | | | 585,000 | | | | 5.25 | | | | 7/1/37 | | | | 624,698 | |
Deephaven Charter School Lease Rev. (Eagle Ridge Academy Proj.) | | | 600,000 | | | | 5.25 | | | | 7/1/40 | | | | 637,308 | |
Deephaven Charter School Lease Rev. (Eagle Ridge Academy Proj.) | | | 1,000,000 | | | | 5.50 | | | | 7/1/50 | | | | 1,068,910 | |
Forest Lake Charter School Lease Rev. (Lake International Language Academy) | | | 580,000 | | | | 4.50 | | | | 8/1/26 | | | | 603,090 | |
Forest Lake Charter School Lease Rev. (Lake International Language Academy) | | | 1,000,000 | | | | 5.00 | | | | 8/1/36 | | | | 1,040,050 | |
Forest Lake Charter School Lease Rev. (Lake International Language Academy) | | | 750,000 | | | | 5.50 | | | | 8/1/36 | | | | 788,468 | |
Ham Lake Charter School Lease Rev. (Davinci Academy Proj.) | | | 625,000 | | | | 5.00 | | | | 7/1/31 | | | | 657,919 | |
Ham Lake Charter School Lease Rev. (Davinci Academy Proj.) | | | 1,000,000 | | | | 5.00 | | | | 7/1/36 | | | | 1,037,450 | |
Ham Lake Charter School Lease Rev. (Parnassus Prep. Sch. Proj.) | | | 1,000,000 | | | | 4.00 | | | | 11/1/26 | | | | 999,970 | |
Ham Lake Charter School Lease Rev. (Parnassus Prep. Sch. Proj.) | | | 2,720,000 | | | | 5.00 | | | | 11/1/36 | | | | 2,792,379 | |
Hugo Charter School Lease Rev. (Noble Academy Proj.) | | | 460,000 | | | | 4.00 | | | | 7/1/21 | | | | 470,010 | |
Hugo Charter School Lease Rev. (Noble Academy Proj.) | | | 750,000 | | | | 5.00 | | | | 7/1/29 | | | | 791,678 | |
Hugo Charter School Lease Rev. (Noble Academy Proj.) | | | 1,000,000 | | | | 5.00 | | | | 7/1/34 | | | | 1,042,520 | |
Independence Charter School Lease Rev. (Beacon Academy Proj.) | | | 500,000 | | | | 4.25 | | | | 7/1/26 | | | | 503,385 | |
Independence Charter School Lease Rev. (Beacon Academy Proj.) | | | 750,000 | | | | 4.75 | | | | 7/1/31 | | | | 759,585 | |
Independence Charter School Lease Rev. (Beacon Academy Proj.) | | | 1,200,000 | | | | 5.00 | | | | 7/1/36 | | | | 1,215,192 | |
Minneapolis Charter School Lease Rev. (Hiawatha Academy Proj.) | | | 975,000 | | | | 4.00 | | | | 7/1/26 | | | | 979,426 | |
Minneapolis Educational Fac. Lease Rev. (Seed/Harvest Preparatory Proj.) 4 | | | 525,000 | | | | 6.25 | | | | 3/1/21 | | | | 478,926 | |
Minneapolis School Lease Rev. (Twin Cities International School) 4 | | | 1,000,000 | | | | 4.25 | | | | 12/1/27 | | | | 994,940 | |
Minneapolis School Lease Rev. (Twin Cities International School) 4 | | | 1,000,000 | | | | 5.00 | | | | 12/1/37 | | | | 984,430 | |
MN Higher Education Fac. Auth. Rev. (Bethel Univ.) | | | 1,200,000 | | | | 5.00 | | | | 5/1/37 | | | | 1,304,832 | |
MN Higher Education Fac. Auth. Rev. (Bethel Univ.) | | | 1,000,000 | | | | 5.00 | | | | 5/1/47 | | | | 1,077,020 | |
MN Higher Education Fac. Auth. Rev. (College of St. Benedict) | | | 1,000,000 | | | | 4.00 | | | | 3/1/43 | | | | 1,009,640 | |
MN Higher Education Fac. Auth. Rev. (College of St. Benedict) | | | 1,900,000 | | | | 5.00 | | | | 3/1/37 | | | | 2,088,727 | |
MN Higher Education Fac. Auth. Rev. (Gustavus Adolphus College) | | | 1,250,000 | | | | 4.00 | | | | 10/1/41 | | | | 1,315,812 | |
MN Higher Education Fac. Auth. Rev. (St. Olaf College) | | | 500,000 | | | | 4.00 | | | | 10/1/32 | | | | 547,560 | |
MN Higher Education Fac. Auth. Rev. (St. Olaf College) | | | 500,000 | | | | 4.00 | | | | 10/1/34 | | | | 544,260 | |
MN Higher Education Fac. Auth. Rev. (St. Olaf College) | | | 500,000 | | | | 4.00 | | | | 10/1/35 | | | | 543,375 | |
MN Higher Education Fac. Auth. Rev. (St. Scholastica College) | | | 1,400,000 | | | | 5.00 | | | | 12/1/27 | | | | 1,403,052 | |
MN Higher Education Fac. Auth. Rev. (St. Scholastica College) | | | 1,800,000 | | | | 6.30 | | | | 12/1/40 | | | | 1,841,868 | |
MN Higher Education Fac. Auth. Rev. (Univ. of St. Thomas) | | | 400,000 | | | | 4.00 | | | | 10/1/35 | | | | 432,504 | |
MN Higher Education Fac. Auth. Rev. (Univ. of St. Thomas) | | | 500,000 | | | | 4.00 | | | | 10/1/37 | | | | 536,820 | |
MN Higher Education Fac. Auth. Rev. (Univ. of St. Thomas) | | | 3,150,000 | | | | 4.00 | | | | 4/1/39 | | | | 3,339,284 | |
MN Higher Education Fac. Auth. Rev. (Univ. of St. Thomas) | | | 750,000 | | | | 5.00 | | | | 4/1/35 | | | | 863,978 | |
MN Office of Higher Education Rev. 8 | | | 5,000,000 | | | | 4.00 | | | | 11/1/37 | | | | 5,224,500 | |
MN State Colleges and Universities Rev. | | | 510,000 | | | | 4.00 | | | | 10/1/35 | | | | 526,830 | |
Moorhead Educational Fac. Rev. (Concordia College Corp. Proj.) | | | 1,250,000 | | | | 5.00 | | | | 12/1/40 | | | | 1,360,212 | |
Olmsted Co. Hsg. & Redev. Auth. Rev. (Schaeffer Academy Proj.) | | | 548,746 | | | | 4.98 | | | | 4/25/27 | | | | 548,878 | |
Ramsey Lease Rev. (Pact Charter School Proj.) | | | 385,000 | | | | 5.00 | | | | 12/1/26 | | | | 400,546 | |
| | | | |
See accompanying notes to financial statements. | | | | |
38 | | | SIT MUTUAL FUNDS ANNUAL REPORT | |
| | | | | | | | | | | | | | | | |
| | | | | |
| Name of Issuer | | Principal
Amount ($) | | Coupon Rate (%) | | Maturity Date | | Fair Value ($) | |
Ramsey Lease Rev. (Pact Charter School Proj.) | | | 1,850,000 | | | | 5.50 | | | | 12/1/33 | | | | 1,922,206 | |
Rice Co. Educational Fac. Rev.(Shattuck-St. Mary’s School)4 | | | 3,500,000 | | | | 5.00 | | | | 8/1/22 | | | | 3,672,655 | |
Rochester Rev. (Math & Science Academy) | | | 1,430,000 | | | | 5.13 | | | | 9/1/38 | | | | 1,440,553 | |
Savage Charter School Lease Rev. (Aspen Academy) | | | 500,000 | | | | 4.00 | | | | 10/1/26 | | | | 474,760 | |
Savage Charter School Lease Rev. (Aspen Academy) | | | 1,000,000 | | | | 4.75 | | | | 10/1/31 | | | | 962,580 | |
St. Cloud Charter School Lease Rev. (Stride Academy Proj.)2 | | | 350,000 | | | | 3.00 | | | | 4/1/21 | | | | 240,303 | |
St. Cloud Charter School Lease Rev. (Stride Academy Proj.)2 | | | 1,850,000 | | | | 5.00 | | | | 4/1/36 | | | | 1,038,553 | |
St. Paul Hsg. & Redev, Auth. Rev. (Hmong College Preparatory Academy Proj.) | | | 1,000,000 | | | | 5.25 | | | | 9/1/31 | | | | 1,082,810 | |
St. Paul Hsg. & Redev, Auth. Rev. (Metro Deaf School Proj.)4 | | | 700,000 | | | | 5.00 | | | | 6/15/38 | | | | 713,020 | |
St. Paul Hsg. & Redev, Auth. Rev. (Nova Classical Academy Proj.) | | | 600,000 | | | | 4.00 | | | | 9/1/36 | | | | 592,566 | |
St. Paul Hsg. & Redev. Auth. | | | 700,000 | | | | 5.00 | | | | 12/1/30 | | | | 755,734 | |
St. Paul Hsg. & Redev. Auth. | | | 1,000,000 | | | | 5.00 | | | | 12/1/37 | | | | 1,056,930 | |
St. Paul Hsg. & Redev. Auth. | | | 705,000 | | | | 5.00 | | | | 12/1/46 | | | | 726,319 | |
St. Paul Hsg. & Redev. Auth. (German Immersion School) | | | 450,000 | | | | 4.00 | | | | 7/1/23 | | | | 453,663 | |
St. Paul Hsg. & Redev. Auth. (German Immersion School) | | | 855,000 | | | | 5.00 | | | | 7/1/33 | | | | 870,313 | |
St. Paul Hsg. & Redev. Auth. (German Immersion School) | | | 500,000 | | | | 5.00 | | | | 7/1/44 | | | | 503,765 | |
St. Paul Hsg. & Redev. Auth. (Higher Ground Academy Proj.) | | | 1,300,000 | | | | 4.25 | | | | 12/1/23 | | | | 1,322,451 | |
St. Paul Hsg. & Redev. Auth. (Higher Ground Academy Proj.) | | | 1,500,000 | | | | 5.00 | | | | 12/1/33 | | | | 1,533,630 | |
St. Paul Hsg. & Redev. Auth. (Higher Ground Academy Proj.) | | | 390,000 | | | | 5.13 | | | | 12/1/38 | | | | 397,332 | |
St. Paul Hsg. & Redev. Auth. (Hope Community Academy Proj.) | | | 720,000 | | | | 4.50 | | | | 12/1/29 | | | | 727,855 | |
St. Paul Hsg. & Redev. Auth. (St. Paul Conservatory for Performing Artists) | | | 1,135,000 | | | | 4.63 | | | | 3/1/43 | | | | 1,089,725 | |
St. Paul Hsg. & Redev. Auth. (Twin Cities Academy Proj.) | | | 1,600,000 | | | | 4.00 | | | | 7/1/25 | | | | 1,614,912 | |
St. Paul Hsg. & Redev. Auth. (Twin Cities Academy Proj.) | | | 955,000 | | | | 5.00 | | | | 7/1/35 | | | | 972,878 | |
St. Paul Hsg. & Redev. Auth. Lease Rev. (Hmong College Preparatory Academy) | | | 295,000 | | | | 4.75 | | | | 9/1/22 | | | | 303,835 | |
St. Paul Hsg. & Redev. Auth. Lease Rev. (Hmong College Preparatory Academy) | | | 500,000 | | | | 5.00 | | | | 9/1/27 | | | | 514,935 | |
St. Paul Hsg. & Redev. Auth. Lease Rev. (Nova Classical Academy Proj.) | | | 390,000 | | | | 5.70 | | | | 9/1/21 | | | | 406,634 | |
University of Minnesota Rev. | | | 1,000,000 | | | | 5.00 | | | | 4/1/41 | | | | 1,154,540 | |
Victoria Private School Fac. Rev. (Holy Family Catholic High) | | | 1,610,000 | | | | 4.00 | | | | 9/1/23 | | | | 1,615,571 | |
Woodbury Charter School Lease Rev. (MSA Building) | | | 355,000 | | | | 5.00 | | | | 12/1/27 | | | | 374,198 | |
Woodbury Charter School Lease Rev. (MSA Building) | | | 225,000 | | | | 5.00 | | | | 12/1/32 | | | | 235,321 | |
| | | | | | | | | | | | | | | | |
| | | | |
| | | | | | | | | | | | | | | 81,681,321 | |
| | | | | | | | | | | | | | | | |
Escrowed To Maturity/Prerefunded - 3.2% | | | | | | | | | | | | | | | | |
Anoka Co. Charter School Lease Rev. | | | 295,000 | | | | 5.00 | | | | 6/1/27 | | | | 312,411 | |
Anoka Co. Charter School Lease Rev. | | | 2,435,000 | | | | 5.00 | | | | 6/1/43 | | | | 2,578,714 | |
Bemidji Sales Tax G.O. | | | 1,000,000 | | | | 5.00 | | | | 2/1/34 | | | | 1,062,570 | |
Bemidji Sales Tax G.O. | | | 1,350,000 | | | | 6.00 | | | | 2/1/41 | | | | 1,458,743 | |
Deephaven Charter School Lease Rev. (Eagle Ridge Academy Proj.) | | | 1,280,000 | | | | 5.13 | | | | 7/1/33 | | | | 1,460,557 | |
MN Higher Education Fac. Auth. Rev. (Hamline Univ.) | | | 750,000 | | | | 6.00 | | | | 10/1/32 | | | | 830,662 | |
MN Higher Education Fac. Auth. Rev. (Hamline Univ.) | | | 1,000,000 | | | | 6.00 | | | | 10/1/40 | | | | 1,107,550 | |
Oak Park Heights Hsg. Rev. (Oakgreen Commons Proj.) | | | 1,000,000 | | | | 6.00 | | | | 8/1/25 | | | | 1,057,400 | |
Oak Park Heights Hsg. Rev. (Oakgreen Commons Proj.) | | | 1,000,000 | | | | 6.25 | | | | 8/1/33 | | | | 1,079,550 | |
Rochester Health Care & Hsg. Rev. (Samaritan Bethany, Inc. Proj.) | | | 475,000 | | | | 5.75 | | | | 12/1/19 | | | | 487,763 | |
Rochester Health Care & Hsg. Rev. (Samaritan Bethany, Inc. Proj.) | | | 2,515,000 | | | | 7.38 | | | | 12/1/41 | | | | 2,609,413 | |
St. Louis Park Health Care Facs. Rev. (Park Nicollet Health Proj.) | | | 2,000,000 | | | | 5.50 | | | | 7/1/29 | | | | 2,019,040 | |
St. Paul Hsg. & Redev. Auth. Rev. (HealthEast Care System Proj.) | | | 1,000,000 | | | | 5.00 | | | | 11/15/26 | | | | 1,054,620 | |
St. Paul Hsg. & Redev. Auth. Rev. (HealthEast Care System Proj.) | | | 1,000,000 | | | | 5.25 | | | | 11/15/28 | | | | 1,058,600 | |
St. Paul Hsg. & Redev. Auth. Rev. (HealthEast Care System Proj.) | | | 1,000,000 | | | | 5.25 | | | | 11/15/35 | | | | 1,058,600 | |
West St. Paul Health Care (Walker Thompson Hill) | | | 525,000 | | | | 6.75 | | | | 9/1/31 | | | | 535,941 | |
| | | | | | | | | | | | | | | | |
| | | | |
| | | | | | | | | | | | | | | 19,772,134 | |
| | | | | | | | | | | | | | | | |
| | | | |
See accompanying notes to financial statements. | | | | |
MARCH 31, 2019 | | | 39 | |
SCHEDULE OF INVESTMENTS
March 31, 2019
Sit MinnesotaTax-Free Income Fund (Continued)
| | | | | | | | | | | | | | | | |
| | | | | |
| Name of Issuer | | Principal
Amount ($) | | Coupon Rate (%) | | Maturity Date | | Fair Value ($) | |
| | | | |
General Obligation - 8.7% | | | | | | | | | | | | | | | | |
Brainerd Independent School District No. 181 | | | 1,000,000 | | | | 4.00 | | | | 2/1/42 | | | | 1,066,190 | |
Brainerd Independent School District No. 181 | | | 4,000,000 | | | | 4.00 | | | | 2/1/43 | | | | 4,254,920 | |
Brooklyn Center Independent School District No. 286 | | | 4,000,000 | | | | 4.00 | | | | 2/1/40 | | | | 4,216,880 | |
Cloquet Independent School District No. 94 | | | 5,000,000 | | | | 4.00 | | | | 2/1/36 | | | | 5,273,900 | |
Deer River G.O. | | | 500,000 | | | | 4.00 | | | | 2/1/48 | | | | 523,100 | |
Fosston Independent School District No. 601 | | | 1,000,000 | | | | 4.00 | | | | 2/1/36 | | | | 1,079,960 | |
Fosston Independent School District No. 601 | | | 1,000,000 | | | | 4.00 | | | | 2/1/38 | | | | 1,070,570 | |
Fridley Independent School District No. 14 | | | 400,000 | | | | 4.00 | | | | 2/1/30 | | | | 441,036 | |
Glencoe-Silver Lake Independent School District No. 2859 | | | 1,300,000 | | | | 4.00 | | | | 2/1/40 | | | | 1,368,250 | |
Long Prairie G.O.8 | | | 750,000 | | | | 4.00 | | | | 2/1/37 | | | | 779,423 | |
Minneapolis Capital Improvement | | | 4,000,000 | | | | 4.00 | | | | 12/1/43 | | | | 4,296,320 | |
Minneapolis Capital Improvement | | | 2,000,000 | | | | 4.00 | | | | 12/1/46 | | | | 2,145,460 | |
Minnetonka Independent School District No. 276 | | | 1,900,000 | | | | 5.00 | | | | 2/1/41 | | | | 2,109,494 | |
Morrison Co. Education District No. 6979 | | | 1,000,000 | | | | 4.50 | | | | 2/1/34 | | | | 1,027,300 | |
Mounds View Independent School District No. 621 | | | 500,000 | | | | 4.00 | | | | 2/1/24 | | | | 508,935 | |
Richfield Independent School District No. 280 | | | 6,000,000 | | | | 4.00 | | | | 2/1/37 | | | | 6,445,260 | |
Robbinsdale Independent School District No. 281 | | | 1,050,000 | | | | 4.00 | | | | 2/1/31 | | | | 1,138,830 | |
Roseville Independent School District No. 623 | | | 930,000 | | | | 4.00 | | | | 2/1/35 | | | | 1,005,739 | |
Roseville Independent School District No. 623 | | | 4,895,000 | | | | 4.00 | | | | 2/1/36 | | | | 5,277,006 | |
South Washington Co. Independent School District No. 833 | | | 5,000,000 | | | | 4.00 | | | | 2/1/31 | | | | 5,470,000 | |
St. Cloud Independent School District No. 742 | | | 1,000,000 | | | | 4.00 | | | | 2/1/37 | | | | 1,071,400 | |
St. Francis Independent School District No. 15 | | | 550,000 | | | | 4.00 | | | | 2/1/35 | | | | 575,377 | |
St. Francis Independent School District No. 15 | | | 750,000 | | | | 4.00 | | | | 2/1/36 | | | | 783,308 | |
St. Michael-Albertville Independent School District No. 885 | | | 500,000 | | | | 4.00 | | | | 2/1/30 | | | | 554,290 | |
United Hospital District Health Care Facs. G.O (Lake Wood Health System) | | | 1,005,000 | | | | 5.00 | | | | 12/1/30 | | | | 1,161,800 | |
| | | | | | | | | | | | | | | | |
| | | | |
| | | | | | | | | | | | | | | 53,644,748 | |
| | | | | | | | | | | | | | | | |
Hospital/Health Care - 15.7% | | | | | | | | | | | | | | | | |
Anoka Health Care and Hsg. Facs. Rev. | | | 1,135,000 | | | | 5.38 | | | | 11/1/34 | | | | 1,209,411 | |
Anoka Health Care and Hsg. Facs. Rev. (Walker Methodist Plaza) | | | 1,500,000 | | | | 5.25 | | | | 7/1/35 | | | | 1,511,790 | |
Breckenridge Rev. (Catholic Health Initiatives Proj.) | | | 3,480,000 | | | | 5.00 | | | | 5/1/30 | | | | 3,518,176 | |
Center City Heath Care Facs. Rev. (Hazelden Betty Ford Foundation Proj.) | | | 3,000,000 | | | | 4.50 | | | | 11/1/34 | | | | 3,135,030 | |
Center City Heath Care Facs. Rev. (Hazelden Betty Ford Foundation Proj.) | | | 500,000 | | | | 4.75 | | | | 11/1/31 | | | | 505,505 | |
Center City Heath Care Facs. Rev. (Hazelden Betty Ford Foundation Proj.) | | | 250,000 | | | | 5.00 | | | | 11/1/29 | | | | 274,968 | |
Center City Heath Care Facs. Rev. (Hazelden Betty Ford Foundation Proj.) | | | 500,000 | | | | 5.00 | | | | 11/1/44 | | | | 543,430 | |
Chippewa Co. Rev. (Monte Video Hospital Proj.) | | | 2,000,000 | | | | 4.00 | | | | 3/1/32 | | | | 2,082,320 | |
Crookston Health Care Facs. Rev. (Riverview Health Care Proj.) | | | 1,000,000 | | | | 4.00 | | | | 5/1/32 | | | | 1,015,830 | |
Dakota Co. Community Dev. Agy. (Sanctuary at W. St. Paul Proj.) | | | 2,000,000 | | | | 5.75 | | | | 8/1/30 | | | | 2,018,980 | |
Dakota Co. Community Dev. Agy. (Sanctuary at W. St. Paul Proj.) | | | 1,050,000 | | | | 6.00 | | | | 8/1/35 | | | | 1,061,330 | |
Duluth Economic Dev. Auth. Rev. (St. Lukes Hospital Oblig. Group) | | | 1,095,000 | | | | 4.75 | | | | 6/15/22 | | | | 1,114,787 | |
Duluth Economic Dev. Auth. Rev. (St. Lukes Hospital Oblig. Group) | | | 1,600,000 | | | | 5.75 | | | | 6/15/32 | | | | 1,743,952 | |
Duluth Economic Dev. Auth. Rev. (St. Lukes Hospital Oblig. Group) | | | 2,000,000 | | | | 6.00 | | | | 6/15/39 | | | | 2,198,020 | |
Glencoe Health Care Fac. Rev. (Glencoe Regional Health Services Proj.) | | | 2,110,000 | | | | 4.00 | | | | 4/1/31 | | | | 2,176,845 | |
Hayward Health Care Fac. Rev. (American Baptist Homes Midwest Proj.) | | | 1,350,000 | | | | 5.38 | | | | 8/1/34 | | | | 1,368,293 | |
Hayward Health Care Fac. Rev. (American Baptist Homes Midwest Proj.) | | | 500,000 | | | | 5.75 | | | | 2/1/44 | | | | 511,685 | |
Hayward Hsg. & Health Care Fac. Rev. (St. John Lutheran Home of Albert Lea Proj.) | | | 1,900,000 | | | | 5.00 | | | | 10/1/34 | | | | 1,929,165 | |
Maple Grove Health Care System Rev. (Maple Grove Hospital Corp.) | | | 3,500,000 | | | | 4.00 | | | | 5/1/37 | | | | 3,656,205 | |
Maple Grove Health Care System Rev. (Maple Grove Hospital Corp.) | | | 325,000 | | | | 5.00 | | | | 5/1/32 | | | | 376,724 | |
Maple Grove Health Care System Rev. (Memorial Health Care) | | | 1,275,000 | | | | 4.00 | | | | 9/1/35 | | | | 1,325,477 | |
Minneapolis Health Care System Rev. (Fairview Health Services) | | | 3,000,000 | | | | 4.00 | | | | 11/15/37 | | | | 3,211,050 | |
Minneapolis Health Care System Rev. (Fairview Health Services) | | | 1,000,000 | | | | 4.00 | | | | 11/15/38 | | | | 1,066,980 | |
Minneapolis Health Care System Rev. (Fairview Health Services) | | | 2,590,000 | | | | 5.00 | | | | 11/15/34 | | | | 2,970,963 | |
| | | | |
See accompanying notes to financial statements. | | | | |
40 | | | SIT MUTUAL FUNDS ANNUAL REPORT | |
| | | | | | | | | | | | | | | | |
| | | | | |
| Name of Issuer | | Principal Amount ($) | | Coupon Rate (%) | | Maturity Date | | Fair Value ($) | |
| | | | |
Minneapolis Health Care System Rev. (Fairview Health Services) | | | 2,500,000 | | | | 5.00 | | | | 11/15/49 | | | | 2,863,550 | |
Minneapolis Pooled Rev. (Care Choice Member Proj.) | | | 20,000 | | | | 5.75 | | | | 4/1/19 | | | | 20,000 | |
Minneapolis Rev. Ref. (Walker Campus) | | | 1,160,000 | | | | 4.50 | | | | 11/15/20 | | | | 1,181,553 | |
Moorhead Economic Dev. Auth. Rev. | | | 550,000 | | | | 4.60 | | | | 9/1/25 | | | | 555,984 | |
Oak Park Heights Nursing Home Rev. (Boutwells Landing Care Center) | | | 1,500,000 | | | | 5.50 | | | | 8/1/28 | | | | 1,598,385 | |
Oak Park Heights Nursing Home Rev. (Boutwells Landing Care Center) | | | 1,000,000 | | | | 6.00 | | | | 8/1/36 | | | | 1,074,210 | |
Rochester Health Care Facs. Rev. (Mayo Clinic) | | | 5,000,000 | | | | 4.00 | | | | 11/15/48 | | | | 5,317,600 | |
Rochester Health Care Facs. Rev. (Mayo Clinic) | | | 5,000,000 | | | | 5.00 | | | | 11/15/33 | | | | 6,566,550 | |
Rochester Health Care Facs. Rev. (Olmsted Medical Center Proj.) | | | 1,500,000 | | | | 5.88 | | | | 7/1/30 | | | | 1,571,145 | |
Shakopee Health Care Facs. Rev. (St. Francis Regional Medical Center Proj.) | | | 745,000 | | | | 5.00 | | | | 9/1/28 | | | | 843,824 | |
Shakopee Health Care Facs. Rev. (St. Francis Regional Medical Center Proj.) | | | 1,350,000 | | | | 5.00 | | | | 9/1/34 | | | | 1,485,742 | |
St. Cloud Health Care Rev. (CentraCare Health System Proj.) | | | 2,500,000 | | | | 4.00 | | | | 5/1/37 | | | | 2,660,925 | |
St. Cloud Health Care Rev. (CentraCare Health System Proj.) | | | 500,000 | | | | 4.00 | | | | 5/1/49 | | | | 525,925 | |
St. Cloud Health Care Rev. (CentraCare Health System Proj.) | | | 3,750,000 | | | | 5.00 | | | | 5/1/46 | | | | 4,236,788 | |
St. Cloud Health Care Rev. (CentraCare Health System Proj.) | | | 500,000 | | | | 5.00 | | | | 5/1/48 | | | | 584,355 | |
St. Louis Park Health Care Facs. Rev. (Mount Olivet Careview Home Health Proj.)1 | | | 2,250,000 | | | | 4.60 | | | | 6/1/41 | | | | 2,296,688 | |
St. Paul Hsg. & Redev. Auth. Health Care Rev. (Fairview Health Services Proj.) | | | 750,000 | | | | 4.00 | | | | 11/15/35 | | | | 806,018 | |
St. Paul Hsg. & Redev. Auth. Health Care Rev. (Fairview Health Services Proj.) | | | 4,000,000 | | | | 4.00 | | | | 11/15/43 | | | | 4,213,440 | |
St. Paul Hsg. & Redev. Auth. Health Care Rev. (Fairview Health Services Proj.) | | | 1,000,000 | | | | 5.00 | | | | 11/15/47 | | | | 1,139,710 | |
St. Paul Hsg. & Redev. Auth. Health Care Rev. (HealthPartners Oblig. Group Proj.) | | | 4,800,000 | | | | 5.00 | | | | 7/1/32 | | | | 5,438,880 | |
St. Paul Hsg. & Redev. Auth. Health Care Rev. (HealthPartners Oblig. Group Proj.) | | | 2,000,000 | | | | 5.00 | | | | 7/1/33 | | | | 2,255,160 | |
St. Paul Hsg. & Redev. Auth. Health Care Rev. (Senior Episcopal Homes Proj.) | | | 525,000 | | | | 4.25 | | | | 11/1/25 | | | | 524,386 | |
St. Paul Hsg. & Redev. Auth. Health Care Rev. (Senior Episcopal Homes Proj.) | | | 750,000 | | | | 4.75 | | | | 11/1/31 | | | | 751,328 | |
St. Paul Hsg. & Redev. Auth. Health Care Rev. (Senior Episcopal Homes Proj.) | | | 2,150,000 | | | | 5.00 | | | | 5/1/38 | | | | 2,167,264 | |
St. Paul Hsg. & Redev. Auth. Health Care Rev. (Senior Episcopal Homes Proj.) | | | 500,000 | | | | 5.15 | | | | 11/1/42 | | | | 501,630 | |
St. Paul Hsg. & Redev. Auth. Rev. (Nursing HomeNTS-Episcopal) | | | 1,939,585 | | | | 5.63 | | | | 10/1/33 | | | | 1,943,619 | |
Victoria Health Care Facs. Rev. (Augustana Emerald Care LLC) | | | 1,000,000 | | | | 4.25 | | | | 8/1/24 | | | | 1,024,490 | |
West St. Paul Hsg. & Health Care Rev. (Walker Westwood Ridge Camp) | | | 1,000,000 | | | | 5.00 | | | | 11/1/37 | | | | 1,052,590 | |
Winsted Health Care Rev. (St. Mary’s Care Center Proj.)2,5 | | | 1,071,148 | | | | 6.00 | | | | 9/1/25 | | | | 749,803 | |
Winsted Health Care Rev. (St. Mary’s Care Center Proj.)2,5 | | | 1,029,950 | | | | 6.50 | | | | 9/1/34 | | | | 720,965 | |
| | | | | | | | | | | | | | | | |
| | | | |
| | | | | | | | | | | | | | | 97,199,423 | |
| | | | | | | | | | | | | | | | |
Industrial/Pollution Control - 0.5% | | | | | | | | | | | | | | | | |
St. Paul Port Auth. Rev.8 | | | 1,000,000 | | | | 4.00 | | | | 10/1/40 | | | | 1,043,220 | |
St. Paul Port Auth. Rev. | | | 1,000,000 | | | | 4.00 | | | | 10/1/42 | | | | 1,057,630 | |
St. Paul Port Auth. Solid Waste Disposal Rev. (Gerdau St. Paul Steel Mill Proj.)4,8 | | | 1,000,000 | | | | 4.50 | | | | 10/1/37 | | | | 944,730 | |
| | | | | | | | | | | | | | | | |
| | | | |
| | | | | | | | | | | | | | | 3,045,580 | |
| | | | | | | | | | | | | | | | |
Insured - 0.4% | | | | | | | | | | | | | | | | |
Guam Power Auth. Rev. (AGM Insured)11 | | | 500,000 | | | | 5.00 | | | | 10/1/30 | | | | 548,920 | |
MN Governmental Agy. Fin. Group (Flex Terminal Prog.) (AGC Insured) | | | 75,000 | | | | 4.00 | | | | 3/1/20 | | | | 75,124 | |
MN Governmental Agy. Fin. Group (Flex Terminal Prog.) (AGC Insured) | | | 90,000 | | | | 4.00 | | | | 3/1/22 | | | | 90,127 | |
Puerto Rico Public Improvement G.O. (AGM Insured)11 | | | 600,000 | | | | 5.13 | | | | 7/1/30 | | | | 615,354 | |
Virgin Islands Public Fin. Auth. (Gross Receipts Taxes Loan Note) (NATL Insured)11 | | | 1,000,000 | | | | 5.00 | | | | 10/1/23 | | | | 1,010,800 | |
| | | | | | | | | | | | | | | | |
| | | | |
| | | | | | | | | | | | | | | 2,340,325 | |
| | | | | | | | | | | | | | | | |
Multifamily Mortgage - 19.4% | | | | | | | | | | | | | | | | |
Anoka Hsg. Rev. (Homestead at Anoka, Inc. Proj.) | | | 1,000,000 | | | | 4.75 | | | | 11/1/35 | | | | 1,042,180 | |
Anoka Hsg. Rev. (Homestead at Anoka, Inc. Proj.) | | | 1,000,000 | | | | 5.50 | | | | 11/1/46 | | | | 1,085,210 | |
Apple Valley Economic Dev. Auth. Rev. (Augustana Healthcare Center) | | | 500,000 | | | | 3.90 | | | | 2/1/31 | | | | 501,845 | |
Apple Valley Economic Dev. Auth. Rev. (Augustana Healthcare Center) | | | 500,000 | | | | 4.15 | | | | 2/1/36 | | | | 500,770 | |
Apple Valley Senior Hsg. Rev. (Presbyterian Homes) | | | 1,500,000 | | | | 5.00 | | | | 9/1/43 | | | | 1,594,710 | |
Apple Valley Senior Living Rev. (Senior Living LLC Proj.) | | | 500,000 | | | | 4.00 | | | | 1/1/25 | | | | 509,015 | |
Apple Valley Senior Living Rev. (Senior Living LLC Proj.) | | | 1,000,000 | | | | 4.00 | | | | 1/1/30 | | | | 1,032,390 | |
| | | | |
See accompanying notes to financial statements. | | | | |
MARCH 31, 2019 | | | 41 | |
SCHEDULE OF INVESTMENTS
March 31, 2019
Sit MinnesotaTax-Free Income Fund (Continued)
| | | | | | | | | | | | | | | | |
| | | | | |
| Name of Issuer | | Principal
Amount ($) | | Coupon
Rate (%) | | Maturity
Date | | Fair Value ($) | |
| | | | |
Apple Valley Senior Living Rev. (Senior Living LLC Proj.) | | | 660,000 | | | | 4.13 | | | | 1/1/28 | | | | 670,441 | |
Apple Valley Senior Living Rev. (Senior Living LLC Proj.) | | | 1,500,000 | | | | 4.25 | | | | 1/1/37 | | | | 1,534,395 | |
Apple Valley Senior Living Rev. (Senior Living LLC Proj.) | | | 3,000,000 | | | | 5.00 | | | | 1/1/47 | | | | 3,065,820 | |
Apple Valley Senior Living Rev. (Senior Living LLC Proj.) | | | 1,700,000 | | | | 6.75 | | | | 1/1/27 | | | | 1,708,483 | |
Apple Valley Senior Living Rev. (Senior Living LLC Proj.) | | | 1,000,000 | | | | 7.00 | | | | 1/1/37 | | | | 1,001,030 | |
Bethel Rev. (Grandview Christian Home Proj.) | | | 3,000,000 | | | | 5.00 | | | | 10/1/41 | | | | 3,104,220 | |
Blaine Senior Hsg. & Health Care Fac. Rev. (Crest View Senior Community Proj.) | | | 540,000 | | | | 5.13 | | | | 7/1/25 | | | | 534,703 | |
Blaine Senior Hsg. & Health Care Fac. Rev. (Crest View Senior Community Proj.) | | | 1,500,000 | | | | 5.75 | | | | 7/1/35 | | | | 1,481,160 | |
Cambridge Hsg. & Health Care Facs. Rev. (Walker Methodist Levande, LLC Proj.) | | | 1,250,000 | | | | 5.13 | | | | 3/1/39 | | | | 1,334,163 | |
Champlin Multifamily Hsg. Rev. (Champlin Drive Apts.) | | | 625,000 | | | | 6.00 | | | | 1/1/27 | | | | 632,156 | |
Chisago Hsg. and Health Care Rev. (CDL Homes LLC) | | | 750,000 | | | | 6.00 | | | | 8/1/33 | | | | 813,090 | |
City of Otsego Rev. (Riverview Landing Proj.) | | | 1,500,000 | | | | 5.00 | | | | 10/1/42 | | | | 1,551,660 | |
Cloquet Hsg. Fac. Ref. (HADC Cloquet LLC Proj.) | | | 1,020,000 | | | | 5.00 | | | | 8/1/38 | | | | 1,033,127 | |
Columbus Hsg. Rev. (Richfield Senior Hsg., Inc.) | | | 1,000,000 | | | | 5.00 | | | | 1/1/34 | | | | 994,770 | |
Columbus Hsg. Rev. (Richfield Senior Hsg., Inc.) | | | 1,000,000 | | | | 5.25 | | | | 1/1/40 | | | | 983,780 | |
Crystal Multifamily Hsg. Rev. (Cavanagh Proj.) | | | 2,500,000 | | | | 5.25 | | | | 6/1/31 | | | | 2,541,300 | |
Dakota Co. Community Dev. Agy. (Glen at Valley Creek Proj.) | | | 1,400,000 | | | | 4.50 | | | | 8/1/36 | | | | 1,403,094 | |
Dakota Co. Community Dev. Agy. Multifamily Hsg. Rev. Dakota Co. Community Dev. Agy. Multifamily Hsg. Rev. (Walker Highviews Hills LLC)4 | |
| 3,500,000
750,000 |
| |
| 4.00
5.00 |
| |
| 1/1/42
8/1/36 |
| |
| 3,612,875
775,733 |
|
Dakota Co. Community Dev. Agy. Multifamily Hsg. Rev. (Walker Highviews Hills LLC)4 | | | 500,000 | | | | 5.00 | | | | 8/1/51 | | | | 511,815 | |
Deephaven Hsg. & Healthcare Rev. (St. Therese Senior Living Proj.) | | | 1,345,000 | | | | 5.00 | | | | 4/1/38 | | | | 1,354,186 | |
Fridley Multifamily Hsg. Rev. (Village Green Apartments Proj.) | | | 3,486,616 | | | | 3.75 | | | | 11/1/34 | | | | 3,667,223 | |
Independence Health Care Facs. Rev. (Augustana Chapel View Home) | | | 250,000 | | | | 4.00 | | | | 12/1/32 | | | | 251,600 | |
Minneapolis & St.Paul Hsg. & Redev. Auth. Multifamily Hsg. Rev. (GNMA Collateralized)8 | | | 2,765,000 | | | | 4.75 | | | | 1/20/42 | | | | 2,767,240 | |
Minneapolis Multifamily Hsg. Rev. (Greenway Heights Family Housing) | | | 1,015,000 | | | | 5.75 | | | | 7/15/31 | | | | 1,067,922 | |
Minneapolis Senior Hsg. & Health Care Rev. (Ecumen Mill City Quarter) | | | 375,000 | | | | 4.75 | | | | 11/1/28 | | | | 386,479 | |
Minneapolis Senior Hsg. & Health Care Rev. (Ecumen Mill City Quarter) | | | 1,500,000 | | | | 5.00 | | | | 11/1/35 | | | | 1,538,295 | |
Minneapolis Student Hsg. Rev. (Riverton Community Housing Proj.)4 | | | 1,000,000 | | | | 4.75 | | | | 8/1/43 | | | | 1,031,790 | |
Minneapolis Student Hsg. Rev. (Riverton Community Housing Proj.)4 | | | 500,000 | | | | 5.00 | | | | 8/1/53 | | | | 518,910 | |
MN Hsg. Fin. Agy. Rental Hsg. (G.O. of AGY. Insured) | | | 250,000 | | | | 5.05 | | | | 8/1/31 | | | | 263,250 | |
MN Hsg. Fin. Agy. Rental Hsg. (G.O. of AGY. Insured) | | | 2,560,000 | | | | 5.25 | | | | 8/1/40 | | | | 2,600,064 | |
MN Hsg. Fin. Agy. Rental Hsg. (G.O. of AGY. Insured) | | | 1,760,000 | | | | 5.45 | | | | 8/1/41 | | | | 1,846,926 | |
MN Hsg. Fin. Agy. Rental Hsg. Rev. | | | 1,000,000 | | | | 5.20 | | | | 8/1/43 | | | | 1,075,100 | |
MN Hsg. Fin. Agy. Rev. | | | 270,000 | | | | 4.00 | | | | 8/1/29 | | | | 295,618 | |
MN Hsg. Fin. Agy. Rev. | | | 255,000 | | | | 4.00 | | | | 8/1/31 | | | | 276,532 | |
MN Hsg. Fin. Agy. Rev. | | | 335,000 | | | | 4.00 | | | | 8/1/34 | | | | 359,947 | |
MN Hsg. Fin. Agy. Rev. | | | 335,000 | | | | 4.00 | | | | 8/1/35 | | | | 358,654 | |
MN Hsg. Fin. Agy. Rev. (State Appropriation) | | | 250,000 | | | | 4.00 | | | | 8/1/33 | | | | 275,568 | |
MN Hsg. Fin. Agy. Rev. (State Appropriation) | | | 2,000,000 | | | | 5.00 | | | | 8/1/34 | | | | 2,280,020 | |
MN Hsg. Fin. Agy. Rev. (State Appropriation) | | | 1,000,000 | | | | 5.00 | | | | 8/1/35 | | | | 1,138,160 | |
Moorhead Economic Dev. Auth. Rev. Ref. (EverCare Sr. Living LLC) | | | 280,000 | | | | 4.65 | | | | 9/1/26 | | | | 282,699 | |
Moorhead Health Care Rev. Ref. (EverCare Sr. Living LLC) | | | 1,000,000 | | | | 5.00 | | | | 9/1/32 | | | | 1,009,190 | |
Moorhead Health Care Rev. Ref. (EverCare Sr. Living LLC) | | | 250,000 | | | | 5.13 | | | | 9/1/37 | | | | 252,072 | |
New Ulm Economic Dev. Auth. Rev. (HADC Ridgeway Proj.) | | | 1,500,000 | | | | 5.00 | | | | 8/1/39 | | | | 1,530,765 | |
North Oaks Senior Hsg. Rev. (Waverly Gardens Proj.) | | | 2,000,000 | | | | 4.00 | | | | 10/1/33 | | | | 2,020,680 | |
North Oaks Senior Hsg. Rev. (Waverly Gardens Proj.) | | | 1,500,000 | | | | 5.00 | | | | 10/1/35 | | | | 1,627,770 | |
North Oaks Senior Hsg. Rev. (Waverly Gardens Proj.) | | | 1,000,000 | | | | 5.00 | | | | 10/1/47 | | | | 1,073,220 | |
Oakdale Rev. (Sr. Hsg. Oak Meadows Proj.) | | | 875,000 | | | | 5.00 | | | | 4/1/34 | | | | 883,269 | |
Red Wing Sr. Hsg. Rev. (Deer Crest Proj.) | | | 325,000 | | | | 5.00 | | | | 11/1/27 | | | | 336,466 | |
Red Wing Sr. Hsg. Rev. (Deer Crest Proj.) | | | 330,000 | | | | 5.00 | | | | 11/1/32 | | | | 341,022 | |
Red Wing Sr. Hsg. Rev. (Deer Crest Proj.) | | | 500,000 | | | | 5.00 | | | | 11/1/42 | | | | 515,685 | |
Rochester Health Care & Hsg. Rev. (Homestead Rochester, Inc.) | | | 1,950,000 | | | | 5.00 | | | | 12/1/30 | | | | 2,004,346 | |
Rochester Health Care & Hsg. Rev. (Homestead Rochester, Inc.) | | | 1,325,000 | | | | 5.00 | | | | 12/1/49 | | | | 1,329,372 | |
| | | | |
See accompanying notes to financial statements. | | | | |
42 | | | SIT MUTUAL FUNDS ANNUAL REPORT | |
| | | | | | | | | | | | | | | | |
| | | | | |
| Name of Issuer | | Principal
Amount ($) | | Coupon
Rate (%) | | Maturity
Date | | Fair Value ($) | |
| | | | |
Rochester Health Care & Hsg. Rev. (Samaritan Bethany, Inc. Proj.) | | | 1,000,000 | | | | 5.00 | | | | 8/1/37 | | | | 1,037,250 | |
Rochester Health Care & Hsg. Rev. (Samaritan Bethany, Inc. Proj.) | | | 800,000 | | | | 5.00 | | | | 8/1/48 | | | | 817,792 | |
Rochester Health Care & Hsg. Rev. (The Homestead at Rochester) | | | 720,000 | | | | 6.38 | | | | 12/1/33 | | | | 774,605 | |
Rochester Health Care & Hsg. Rev. (The Homestead at Rochester) | | | 2,500,000 | | | | 6.50 | | | | 12/1/35 | | | | 2,694,975 | |
Rochester Health Care & Hsg. Rev. (The Homestead at Rochester) | | | 250,000 | | | | 6.88 | | | | 12/1/48 | | | | 270,018 | |
Rochester Multifamily Hsg. Rev. (Essex Place Apartments Proj.) (FHLMC) | | | 4,000,000 | | | | 3.75 | | | | 6/1/29 | | | | 4,138,720 | |
Sartell Health Care & Hsg. Fac. Rev. (Country Manor Campus LLC Proj.) | | | 930,000 | | | | 4.00 | | | | 9/1/20 | | | | 947,121 | |
Sartell Health Care & Hsg. Fac. Rev. (Country Manor Campus LLC Proj.) | | | 850,000 | | | | 5.00 | | | | 9/1/42 | | | | 920,932 | |
Sartell Health Care & Hsg. Fac. Rev. (Country Manor Campus LLC Proj.) | | | 1,135,000 | | | | 5.25 | | | | 9/1/27 | | | | 1,227,991 | |
Sartell Health Care & Hsg. Fac. Rev. (Country Manor Campus LLC Proj.) | | | 2,150,000 | | | | 5.30 | | | | 9/1/37 | | | | 2,325,225 | |
Sauk Rapids Health Care & Hsg. Facs. Rev. (Good Shepherd Lutheran Home Proj.) | | | 1,705,000 | | | | 5.13 | | | | 1/1/39 | | | | 1,738,299 | |
St. Anthony Multifamily Hsg. Rev. (Silver Lake Village Hsg.) | | | 250,000 | | | | 5.75 | | | | 12/1/28 | | | | 271,420 | |
St. Anthony Multifamily Hsg. Rev. (Silver Lake Village Hsg.) | | | 2,000,000 | | | | 6.00 | | | | 12/1/30 | | | | 2,178,060 | |
St. Paul Hsg. & Redev. Auth. (Pioneer Press Apts. Proj.)1,4 | | | 5,000,000 | | | | 3.38 | | | | 5/1/21 | | | | 4,994,950 | |
St. Paul Hsg. & Redev. Auth. Health Care Rev. (Carondelet Village Proj.) | | | 2,415,000 | | | | 4.25 | | | | 12/1/27 | | | | 2,496,458 | |
St. Paul Hsg. & Redev. Auth. Health Care Rev. (Carondelet Village Proj.) | | | 2,400,000 | | | | 5.00 | | | | 12/1/47 | | | | 2,563,488 | |
St. Paul Hsg. & Redev. Auth. Multifamily Housing Rev. (Marian Center Proj.) | | | 1,055,000 | | | | 5.20 | | | | 11/1/22 | | | | 1,055,591 | |
St. Paul Hsg. & Redev. Auth. Multifamily Housing Rev. (Marian Center Proj.) | | | 1,000,000 | | | | 5.30 | | | | 11/1/30 | | | | 1,000,150 | |
St. Paul Hsg. & Redev. Auth. Multifamily Housing Rev. (Marian Center Proj.) | | | 2,590,000 | | | | 5.38 | | | | 5/1/43 | | | | 2,563,996 | |
St. Paul Park Health Care Facs. Rev (Presbyterian Homes Interlu Proj.) | | | 1,000,000 | | | | 5.00 | | | | 5/1/43 | | | | 1,054,580 | |
St. Paul Park Hsg. Rev. (Buffalo Senior Housing Proj.) | | | 1,115,000 | | | | 5.00 | | | | 10/1/38 | | | | 1,147,368 | |
St. Paul Park Senior Hsg. Rev. (Presbyterian Homes Bloomin Proj.) | | | 1,000,000 | | | | 5.00 | | | | 9/1/42 | | | | 1,080,020 | |
St. Paul Port Auth. Rev. (Energy Park Utility Company Proj.)8 | | | 2,515,000 | | | | 5.70 | | | | 8/1/36 | | | | 2,575,184 | |
St. Peter Hsg. & Health Care Fac. Rev. (Ecumen Second Century & Owatonna Senior Living Proj.) | | | 700,000 | | | | 5.00 | | | | 3/1/40 | | | | 723,464 | |
Vergas Hsg. & Healthcare Facs. Rev. (CDL Homes Proj.) | | | 1,000,000 | | | | 4.25 | | | | 8/1/43 | | | | 1,002,320 | |
Wayzata Sr. Hsg. Rev. (Folkestone Sr. Living Community) | | | 730,000 | | | | 5.20 | | | | 5/1/25 | | | | 746,520 | |
Wayzata Sr. Hsg. Rev. (Folkestone Sr. Living Community) | | | 1,250,000 | | | | 5.50 | | | | 11/1/32 | | | | 1,277,025 | |
Wayzata Sr. Hsg. Rev. (Folkestone Sr. Living Community) | | | 1,135,000 | | | | 5.75 | | | | 11/1/39 | | | | 1,159,630 | |
Willmar Hsg. & Redev. Auth. Multifamily Rev. (Eagle Ridge Apartments) | | | 2,610,000 | | | | 4.63 | | | | 4/1/30 | | | | 2,588,911 | |
| | | | | | | | | | | | | | | | |
| | | | |
| | | | | | | | | | | | | | | 119,486,038 | |
| | | | | | | | | | | | | | | | |
Municipal Lease9- 5.2% | | | | | | | | | | | | | | | | |
Anoka Co. Hsg. & Redev. Rev. | | | 415,000 | | | | 5.63 | | | | 5/1/22 | | | | 422,067 | |
Anoka Co. Hsg. & Redev. Rev. | | | 500,000 | | | | 6.63 | | | | 5/1/30 | | | | 511,870 | |
Anoka Co. Hsg. & Redev. Rev. | | | 500,000 | | | | 6.88 | | | | 5/1/40 | | | | 510,830 | |
Anoka-Hennepin Independent School District No. 11 Lease Rev. | | | 600,000 | | | | 4.00 | | | | 2/1/41 | | | | 615,882 | |
Chaska Economic Dev. Auth. Lease Rev. | | | 1,100,000 | | | | 4.00 | | | | 2/1/31 | | | | 1,186,229 | |
Chaska Economic Dev. Auth. Lease Rev. | | | 690,000 | | | | 4.00 | | | | 2/1/33 | | | | 737,651 | |
Chaska Economic Dev. Auth. Lease Rev. | | | 500,000 | | | | 4.00 | | | | 2/1/35 | | | | 532,540 | |
Duluth Independent School District No. 709 | | | 1,000,000 | | | | 4.00 | | | | 2/1/27 | | | | 1,085,690 | |
Duluth Independent School District No. 709 | | | 2,000,000 | | | | 5.00 | | | | 2/1/25 | | | | 2,269,520 | |
Duluth Independent School District No. 709 | | | 785,000 | | | | 5.13 | | | | 3/1/29 | | | | 795,064 | |
Golden Valley Hsg. & Redev. Auth. Rev. | | | 1,000,000 | | | | 4.00 | | | | 2/1/30 | | | | 1,063,410 | |
Golden Valley Hsg. & Redev. Auth. Rev. | | | 500,000 | | | | 4.00 | | | | 2/1/32 | | | | 527,295 | |
Goodhue Co. Education District No. 6051 Lease Rev. | | | 1,030,000 | | | | 5.00 | | | | 2/1/34 | | | | 1,140,560 | |
Goodhue Co. Education District No. 6051 Lease Rev. | | | 1,500,000 | | | | 5.00 | | | | 2/1/39 | | | | 1,638,585 | |
Guam Education Fin. Foundation11 | | | 1,000,000 | | | | 5.00 | | | | 10/1/21 | | | | 1,062,340 | |
Guam Education Fin. Foundation11 | | | 1,730,000 | | | | 5.00 | | | | 10/1/22 | | | | 1,877,361 | |
Minnetonka Independent School District No. 276 | | | 450,000 | | | | 4.00 | | | | 3/1/30 | | | | 486,310 | |
Minnetonka Independent School District No. 276 | | | 340,000 | | | | 4.00 | | | | 2/1/33 | | | | 354,572 | |
Minnetonka Independent School District No. 276 | | | 300,000 | | | | 4.00 | | | | 3/1/33 | | | | 318,903 | |
Minnetonka Independent School District No. 276 | | | 400,000 | | | | 4.00 | | | | 2/1/36 | | | | 414,516 | |
Minnetonka Independent School District No. 276 | | | 500,000 | | | | 4.50 | | | | 1/1/41 | | | | 535,045 | |
| | | | |
See accompanying notes to financial statements. | | | | |
MARCH 31, 2019 | | | 43 | |
SCHEDULE OF INVESTMENTS
March 31, 2019
Sit MinnesotaTax-Free Income Fund (Continued)
| | | | | | | | | | | | | | | | |
| | | | | |
| Name of Issuer | | Principal
Amount ($) | | Coupon Rate (%) | | Maturity
Date | | Fair Value ($) | |
| | | | |
MN Hsg. Fin. Agy. Hsg. Infrastructure (State Appropriation) | | | 750,000 | | | | 3.88 | | | | 8/1/38 | | | | 782,858 | |
MN Hsg. Fin. Agy. Hsg. Infrastructure (State Appropriation) | | | 1,040,000 | | | | 4.00 | | | | 8/1/36 | | | | 1,104,449 | |
MN Hsg. Fin. Agy. Hsg. Infrastructure (State Appropriation) | | | 580,000 | | | | 4.00 | | | | 8/1/37 | | | | 607,863 | |
MN Hsg. Fin. Agy. Hsg. Infrastructure (State Appropriation) | | | 945,000 | | | | 4.00 | | | | 8/1/40 | | | | 981,883 | |
MN Hsg. Fin. Agy. Rev. (State Appropriation) | | | 300,000 | | | | 5.00 | | | | 8/1/35 | | | | 336,519 | |
Northeastern Metropolitan Intermediate School District No. 916 | | | 1,000,000 | | | | 5.00 | | | | 2/1/34 | | | | 1,138,360 | |
Osseo Independent School District No. 279 | | | 1,000,000 | | | | 4.00 | | | | 2/1/28 | | | | 1,078,760 | |
Plymouth Intermediate District No. 287 | | | 1,285,000 | | | | 3.00 | | | | 5/1/32 | | | | 1,295,216 | |
Plymouth Intermediate District No. 287 | | | 470,000 | | | | 4.00 | | | | 5/1/31 | | | | 503,953 | |
Plymouth Intermediate District No. 287 | | | 600,000 | | | | 4.00 | | | | 2/1/37 | | | | 641,490 | |
Southern Plains Education Cooperative No. 915 | | | 1,215,000 | | | | 4.00 | | | | 2/1/37 | | | | 1,193,640 | |
Southern Plains Education Cooperative No. 915 | | | 1,000,000 | | | | 4.50 | | | | 2/1/39 | | | | 1,014,040 | |
St. Cloud Independent School District No. 742 | | | 750,000 | | | | 4.00 | | | | 2/1/38 | | | | 774,600 | |
Waconia Independent School District No. 110 | | | 500,000 | | | | 5.00 | | | | 2/1/37 | | | | 565,610 | |
Winona School District No. 861 Lease Purchase | | | 384,501 | | | | 6.04 | | | | 8/1/24 | | | | 385,251 | |
Worthington Independent School District No. 518 | | | 1,400,000 | | | | 4.00 | | | | 2/1/45 | | | | 1,461,460 | |
| | | | | | | | | | | | | | | | |
| | | | |
| | | | | | | | | | | | | | | 31,952,192 | |
| | | | | | | | | | | | | | | | |
Municipal Money Market - 0.8% | | | | | | | | | | | | | | | | |
City of Minneapolis Hsg. Dev. Rev. (One Ten Grant Proj.)1 | | | 2,300,000 | | | | 1.51 | | | | 9/1/26 | | | | 2,300,000 | |
City of Minneapolis Rev. (Univ. Gateway Proj.)1 | | | 2,200,000 | | | | 1.51 | | | | 12/1/27 | | | | 2,200,000 | |
City of Minneapolis Rev. (Univ. Gateway Proj.)1 | | | 500,000 | | | | 1.51 | | | | 6/1/32 | | | | 500,000 | |
| | | | | | | | | | | | | | | | |
| | | | |
| | | | | | | | | | | | | | | 5,000,000 | |
| | | | | | | | | | | | | | | | |
Other Revenue Bonds - 4.5% | | | | | | | | | | | | | | | | |
Crystal Governmental Fac. Rev. | | | 417,608 | | | | 5.10 | | | | 12/15/26 | | | | 417,871 | |
Milaca Rev. (Edina Headquarters Proj.) | | | 250,000 | | | | 5.00 | | | | 2/1/44 | | | | 252,653 | |
Minneapolis Community Dev. Agy. Limited Tax Common Bond Fund (Discount Steel)8 | | | 80,000 | | | | 5.25 | | | | 6/1/19 | | | | 80,435 | |
Minneapolis Rev. (YMCA Greater Twin Cities Proj.) | | | 165,000 | | | | 4.00 | | | | 6/1/29 | | | | 181,589 | |
Minneapolis Rev. (YMCA Greater Twin Cities Proj.) | | | 125,000 | | | | 4.00 | | | | 6/1/30 | | | | 136,495 | |
Minneapolis Rev. (YMCA Greater Twin Cities Proj.) | | | 250,000 | | | | 4.00 | | | | 6/1/31 | | | | 271,240 | |
Minneapolis Tax Increment Rev. | | | 320,000 | | | | 3.50 | | | | 3/1/23 | | | | 326,336 | |
Minneapolis Tax Increment Rev. | | | 170,000 | | | | 3.80 | | | | 3/1/25 | | | | 174,036 | |
Minneapolis Tax Increment Rev. | | | 200,000 | | | | 4.00 | | | | 3/1/27 | | | | 205,022 | |
Minneapolis Tax Increment Rev. | | | 260,000 | | | | 4.00 | | | | 3/1/30 | | | | 264,805 | |
MN Development Rev. Limited Tax Supported Comm. Board | | | 1,000,000 | | | | 6.00 | | | | 12/1/40 | | | | 1,069,070 | |
MN Development Rev. Limited Tax Supported Comm. Board | | | 2,000,000 | | | | 6.25 | | | | 12/1/30 | | | | 2,146,300 | |
Mound Hsg. & Redev. Auth. Tax Increment Rev. Ref. (Metroplain Proj.) | | | 875,000 | | | | 5.00 | | | | 2/15/27 | | | | 875,280 | |
Northeastern Metropolitan Intermediate School District No. 916 | | | 4,500,000 | | | | 4.00 | | | | 2/1/38 | | | | 4,693,635 | |
St. Louis Park Economic Dev. Auth. Tax Increment Rev. (Hoigaard Vlg.) | | | 850,000 | | | | 5.00 | | | | 2/1/23 | | | | 850,527 | |
St. Paul Hsg. & Redev. Auth. Tax Increment Rev. (9th St. Lofts Proj.) | | | 870,000 | | | | 6.38 | | | | 2/15/28 | | | | 874,028 | |
St. Paul Hsg. & Redev. Auth. Tax Increment Rev. (Drake Marble Proj.) | | | 534,000 | | | | 6.75 | | | | 3/1/28 | | | | 534,326 | |
St. Paul Hsg. & Redev. Auth. Tax Increment Rev. (Emerald Gardens Proj.) | | | 720,000 | | | | 6.50 | | | | 3/1/29 | | | | 730,584 | |
St. Paul Hsg. & Redev. Auth. Tax Increment Rev. (North Quadrant Owner Occupied Proj.) | | | 929,000 | | | | 7.00 | | | | 2/15/28 | | | | 935,494 | |
St. Paul Hsg. & Redev. Auth. Tax Increment Rev. (North Quadrant Owner Occupied Proj.) | | | 753,000 | | | | 7.50 | | | | 2/15/28 | | | | 753,881 | |
St. Paul Hsg. & Redev. Auth. Tax Increment Rev. (Upper Landing Proj.) | | | 180,000 | | | | 5.00 | | | | 9/1/19 | | | | 181,409 | |
St. Paul Hsg. & Redev. Auth. Tax Increment Rev. (Upper Landing Proj.) | | | 185,000 | | | | 5.00 | | | | 3/1/20 | | | | 188,154 | |
St. Paul Hsg. & Redev. Auth. Tax Increment Rev. (Upper Landing Proj.) | | | 220,000 | | | | 5.00 | | | | 9/1/20 | | | | 225,641 | |
St. Paul Hsg. & Redev. Auth. Tax Increment Rev. (Upper Landing Proj.) | | | 225,000 | | | | 5.00 | | | | 3/1/21 | | | | 232,582 | |
St. Paul Hsg. & Redev. Auth. Tax Increment Rev. (Upper Landing Proj.) | | | 1,000,000 | | | | 5.00 | | | | 9/1/26 | | | | 1,032,030 | |
St. Paul Hsg. & Redev. Auth. Tax Increment Rev. (Upper Landing Proj.) | | | 930,000 | | | | 5.00 | | | | 3/1/29 | | | | 957,705 | |
St. Paul Port Auth. Lease Rev. (Regions Hospital Parking Ramp Proj.) | | | 3,875,000 | | | | 5.00 | | | | 8/1/36 | | | | 3,881,316 | |
St. Paul Port Auth. Rev. (Amherst H. Wilder Foundation) | | | 3,000,000 | | | | 5.00 | | | | 12/1/36 | | | | 3,028,740 | |
| | | | |
See accompanying notes to financial statements. | | | | |
44 | | | SIT MUTUAL FUNDS ANNUAL REPORT | |
| | | | | | | | | | | | | | | | |
| | | | | |
| Name of Issuer | | Principal
Amount ($) | | Coupon
Rate (%) | | Maturity
Date | | Fair Value ($) | |
| | | | |
Territory of Guam. Rev.11 | | | 500,000 | | | | 5.00 | | | | 12/1/46 | | | | 535,325 | |
Virgin Islands Public Fin. Auth. (Gross Receipts Taxes Loan Note)11 | | | 2,000,000 | | | | 5.00 | | | | 10/1/42 | | | | 1,800,000 | |
| | | | | | | | | | | | | | | | |
| | | | |
| | | | | | | | | | | | | | | 27,836,509 | |
| | | | | | | | | | | | | | | | |
Public Facilities - 0.2% | | | | | | | | | | | | | | | | |
Lakeville Hsg. & Redev. Auth. Parking Rev. (Ice Arena. Proj.) | | | 1,250,000 | | | | 4.00 | | | | 2/1/32 | | | | 1,350,413 | |
| | | | | | | | | | | | | | | | |
Sales Tax Revenue - 1.2% | | | | | | | | | | | | | | | | |
American Samoa Economic Development Authority Rev.4,11 | | | 1,000,000 | | | | 6.00 | | | | 9/1/23 | | | | 1,013,490 | |
American Samoa Economic Development Authority Rev.11 | | | 2,000,000 | | | | 6.25 | | | | 9/1/29 | | | | 2,036,780 | |
Guam Govt. Business Privilege Tax Rev.11 | | | 2,750,000 | | | | 5.00 | | | | 11/15/35 | | | | 2,964,885 | |
St. Paul Sales Tax Rev. | | | 1,400,000 | | | | 5.00 | | | | 11/1/31 | | | | 1,602,384 | |
| | | | | | | | | | | | | | | | |
| | | | |
| | | | | | | | | | | | | | | 7,617,539 | |
| | | | | | | | | | | | | | | | |
Single Family Mortgage - 16.9% | | | | | | | | | | | | | | | | |
Dakota Co. Community Dev. Agy. Single Family Mtg. Rev. (GNMA) | | | 1,045,000 | | | | 4.45 | | | | 12/1/32 | | | | 1,071,773 | |
Dakota Co. Community Dev. Agy. Single Family Mtg. Rev. (GNMA-FNMA-FHLMC) | | | 335,000 | | | | 4.63 | | | | 12/1/30 | | | | 341,244 | |
Dakota Co. Community Dev. Agy. Single Family Mtg. Rev. (GNMA-FNMA-FHLMC) | | | 620,000 | | | | 4.88 | | | | 12/1/33 | | | | 634,558 | |
Dakota Co. Community Dev. Agy. Single Family Mtg. Rev. (GNMA-FNMA-FHLMC)8 | | | 55,948 | | | | 5.13 | | | | 12/1/40 | | | | 56,077 | |
Dakota Co. Community Dev. Agy. Single Family Mtg. Rev. (GNMA-FNMA-FHLMC)8 | | | 2,604 | | | | 5.15 | | | | 12/1/38 | | | | 2,605 | |
Dakota Co. Community Dev. Agy. Single Family Mtg. Rev. (GNMA-FNMA-FHLMC)8 | | | 48,548 | | | | 5.30 | | | | 12/1/39 | | | | 48,574 | |
Minneapolis St. Paul Hsg. Fin. Board Single Family Mtg. Rev. (GNMA-FNMA) | | | 375,000 | | | | 4.45 | | | | 12/1/27 | | | | 394,174 | |
Minneapolis St. Paul Hsg. Fin. Board Single Family Mtg. Rev. (GNMA-FNMA)8 | | | 4,574 | | | | 5.00 | | | | 12/1/38 | | | | 4,576 | |
Minneapolis St. Paul Hsg. Fin. Board Single Family Mtg. Rev. (GNMA-FNMA-FHLMC)8 | | | 43,101 | | | | 5.25 | | | | 12/1/40 | | | | 43,209 | |
MN Hsg. Fin. Agy. Homeownership Fin. (GNMA-FNMA) | | | 3,265,000 | | | | 4.40 | | | | 7/1/32 | | | | 3,327,002 | |
MN Hsg. Fin. Agy. Homeownership Fin. (GNMA-FNMA-FHLMC) | | | 4,846,515 | | | | 3.30 | | | | 3/1/48 | | | | 4,885,627 | |
MN Hsg. Fin. Agy. Homeownership Fin. (GNMA-FNMA-FHLMC) | | | 3,903,065 | | | | 3.30 | | | | 5/1/48 | | | | 3,934,562 | |
MN Hsg. Fin. Agy. Homeownership Fin. (GNMA-FNMA-FHLMC) | | | 2,000,000 | | | | 3.45 | | | | 3/1/49 | | | | 2,028,860 | |
MN Hsg. Fin. Agy. Homeownership Fin. (GNMA-FNMA-FHLMC) | | | 1,994,988 | | | | 3.60 | | | | 1/1/49 | | | | 2,036,464 | |
MN Hsg. Fin. Agy. Homeownership Fin. (GNMA-FNMA-FHLMC) | | | 1,771,407 | | | | 3.75 | | | | 11/1/48 | | | | 1,819,501 | |
MN Hsg. Fin. Agy. Homeownership Fin. (GNMA-FNMA-FHLMC) | | | 2,720,000 | | | | 4.45 | | | | 7/1/31 | | | | 2,805,571 | |
MN Hsg. Fin. Agy. Homeownership Fin. (GNMA-FNMA-FHLMC) | | | 1,410,000 | | | | 4.70 | | | | 1/1/31 | | | | 1,440,766 | |
MN Hsg. Fin. Agy. Residential Hsg. Rev.8 | | | 1,005,000 | | | | 3.20 | | | | 1/1/33 | | | | 1,014,216 | |
MN Hsg. Fin. Agy. Residential Hsg. Rev. | | | 1,970,000 | | | | 3.30 | | | | 7/1/29 | | | | 2,041,117 | |
MN Hsg. Fin. Agy. Residential Hsg. Rev. | | | 2,565,000 | | | | 5.10 | | | | 1/1/40 | | | | 2,575,593 | |
MN Hsg. Fin. Agy. Residential Hsg. Rev. (G.O. of AGY. Insured) | | | 1,470,000 | | | | 3.63 | | | | 7/1/25 | | | | 1,492,329 | |
MN Hsg. Fin. Agy. Residential Hsg. Rev. (G.O. of AGY. Insured) | | | 1,910,000 | | | | 3.90 | | | | 7/1/30 | | | | 1,960,405 | |
MN Hsg. Fin. Agy. Residential Hsg. Rev. (GNMA-FNMA-FHLMC)8 | | | 1,900,000 | | | | 3.10 | | | | 7/1/31 | | | | 1,916,929 | |
MN Hsg. Fin. Agy. Residential Hsg. Rev. (GNMA-FNMA-FHLMC) | | | 5,905,000 | | | | 3.10 | | | | 7/1/35 | | | | 5,934,348 | |
MN Hsg. Fin. Agy. Residential Hsg. Rev. (GNMA-FNMA-FHLMC) | | | 1,855,000 | | | | 3.15 | | | | 1/1/37 | | | | 1,840,568 | |
MN Hsg. Fin. Agy. Residential Hsg. Rev. (GNMA-FNMA-FHLMC)8 | | | 1,250,000 | | | | 3.20 | | | | 7/1/30 | | | | 1,230,862 | |
MN Hsg. Fin. Agy. Residential Hsg. Rev. (GNMA-FNMA-FHLMC)8 | | | 935,000 | | | | 3.30 | | | | 1/1/30 | | | | 950,586 | |
MN Hsg. Fin. Agy. Residential Hsg. Rev. (GNMA-FNMA-FHLMC) | | | 1,000,000 | | | | 3.30 | | | | 7/1/33 | | | | 1,019,060 | |
MN Hsg. Fin. Agy. Residential Hsg. Rev. (GNMA-FNMA-FHLMC) | | | 6,910,000 | | | | 3.30 | | | | 1/1/34 | | | | 7,035,347 | |
MN Hsg. Fin. Agy. Residential Hsg. Rev. (GNMA-FNMA-FHLMC) | | | 1,605,000 | | | | 3.35 | | | | 7/1/29 | | | | 1,630,263 | |
MN Hsg. Fin. Agy. Residential Hsg. Rev. (GNMA-FNMA-FHLMC) | | | 1,465,000 | | | | 3.40 | | | | 7/1/38 | | | | 1,475,753 | |
MN Hsg. Fin. Agy. Residential Hsg. Rev. (GNMA-FNMA-FHLMC) | | | 7,320,000 | | | | 3.50 | | | | 1/1/32 | | | | 7,485,798 | |
MN Hsg. Fin. Agy. Residential Hsg. Rev. (GNMA-FNMA-FHLMC) | | | 4,865,000 | | | | 3.60 | | | | 7/1/31 | | | | 4,935,786 | |
MN Hsg. Fin. Agy. Residential Hsg. Rev. (GNMA-FNMA-FHLMC) | | | 2,255,000 | | | | 3.60 | | | | 7/1/33 | | | | 2,292,050 | |
MN Hsg. Fin. Agy. Residential Hsg. Rev. (GNMA-FNMA-FHLMC)8 | | | 2,370,000 | | | | 3.63 | | | | 7/1/32 | | | | 2,438,232 | |
MN Hsg. Fin. Agy. Residential Hsg. Rev. (GNMA-FNMA-FHLMC) | | | 4,745,000 | | | | 3.65 | | | | 7/1/37 | | | | 4,870,410 | |
MN Hsg. Fin. Agy. Residential Hsg. Rev. (GNMA-FNMA-FHLMC) | | | 1,000,000 | | | | 3.80 | | | | 1/1/33 | | | | 1,053,460 | |
MN Hsg. Fin. Agy. Residential Hsg. Rev. (GNMA-FNMA-FHLMC) | | | 5,085,000 | | | | 3.80 | | | | 7/1/38 | | | | 5,169,920 | |
MN Hsg. Fin. Agy. Residential Hsg. Rev. (GNMA-FNMA-FHLMC) | | | 4,620,000 | | | | 3.90 | | | | 7/1/43 | | | | 4,688,699 | |
| | | | |
See accompanying notes to financial statements. | | | | |
MARCH 31, 2019 | | | 45 | |
SCHEDULE OF INVESTMENTS
March 31, 2019
Sit MinnesotaTax-Free Income Fund (Continued)
| | | | | | | | | | | | | | | | |
| Name of Issuer | | Principal
Amount ($)/
Quantity | | Coupon
Rate (%) | | Maturity
Date | | Fair Value ($) | |
| | | | |
MN Hsg. Fin. Agy. Residential Hsg. Rev. (GNMA-FNMA-FHLMC) | | | 255,000 | | | | 4.00 | | | | 7/1/40 | | | | 259,730 | |
MN Hsg. Fin. Agy. Residential Hsg. Rev. (GNMA-FNMA-FHLMC) | | | 1,760,000 | | | | 4.00 | | | | 1/1/48 | | | | 1,864,262 | |
MN Hsg. Fin. Agy. Residential Hsg. Rev. (GNMA-FNMA-FHLMC) | | | 3,715,000 | | | | 4.00 | | | | 7/1/48 | | | | 3,961,750 | |
MN Hsg. Fin. Agy. Rev. (GNMA-FNMA Collateralized) | | | 460,000 | | | | 5.00 | | | | 1/1/31 | | | | 477,365 | |
MN Hsg. Fin. Agy. Rev. (GNMA-FNMA FHLMC) | | | 3,710,000 | | | | 3.70 | | | | 1/1/31 | | | | 3,898,282 | |
MN Hsg. Fin. Agy. Rev. (GNMA-FNMA FHLMC) | | | 1,500,000 | | | | 4.00 | | | | 1/1/47 | | | | 1,567,875 | |
MN Hsg. Fin. Agy. Rev. (GNMA-FNMA-FHLMC) | | | 380,000 | | | | 3.10 | | | | 7/1/26 | | | | 385,890 | |
MN Hsg. Fin. Agy. Rev. (GNMA-FNMA-FHLMC)8 | | | 1,175,000 | | | | 4.00 | | | | 1/1/41 | | | | 1,220,414 | |
MN Hsg. Fin. Agy. Single Family Mtg. Rev. | | | 30,000 | | | | 4.90 | | | | 7/1/29 | | | | 30,153 | |
MN Hsg. Fin. Agy. Single Family Mtg. Rev. | | | 890,000 | | | | 5.05 | | | | 7/1/34 | | | | 893,907 | |
| | | | | | | | | | | | | | | | |
| | | | |
| | | | | | | | | | | | | | | 104,486,502 | |
| | | | | | | | | | | | | | | | |
Transportation - 0.3% | | | | | | | | | | | | | | | | |
Minneapolis & St. Paul Metro Airport Commission Sub. Rev. | | | 1,100,000 | | | | 5.00 | | | | 1/1/33 | | | | 1,233,111 | |
Minneapolis & St. Paul Metro Airport Commission Sub. Rev. | | | 600,000 | | | | 5.00 | | | | 1/1/34 | | | | 671,172 | |
| | | | | | | | | | | | | | | | |
| | | | |
| | | | | | | | | | | | | | | 1,904,283 | |
| | | | | | | | | | | | | | | | |
Utility - 3.5% | | | | | | | | | | | | | | | | |
Guam Govt. Waterworks Auth. Rev.11 | | | 2,000,000 | | | | 5.00 | | | | 1/1/46 | | | | 2,173,180 | |
MN Municipal Power Agy. Electric Rev. | | | 500,000 | | | | 4.00 | | | | 10/1/31 | | | | 533,900 | |
MN Municipal Power Agy. Electric Rev. | | | 1,250,000 | | | | 4.00 | | | | 10/1/32 | | | | 1,330,812 | |
MN Municipal Power Agy. Electric Rev. | | | 1,155,000 | | | | 4.00 | | | | 10/1/33 | | | | 1,222,568 | |
MN Municipal Power Agy. Electric Rev. | | | 1,000,000 | | | | 5.25 | | | | 10/1/35 | | | | 1,051,410 | |
Northern Municipal Power Agy. Electric Rev. | | | 695,000 | | | | 5.00 | | | | 1/1/31 | | | | 760,490 | |
Rochester Electric Utility Rev. | | | 500,000 | | | | 5.00 | | | | 12/1/42 | | | | 576,370 | |
Southern Minnesota Municipal Power Agency | | | 1,000,000 | | | | 5.00 | | | | 1/1/41 | | | | 1,135,930 | |
St. Paul Hsg. & Redev. Auth. | | | 900,000 | | | | 3.38 | | | | 10/1/37 | | | | 904,212 | |
St. Paul Hsg. & Redev. Auth. | | | 880,000 | | | | 4.00 | | | | 10/1/31 | | | | 949,978 | |
St. Paul Hsg. & Redev. Auth. | | | 650,000 | | | | 4.00 | | | | 10/1/33 | | | | 695,766 | |
St. Paul Hsg. & Redev. Auth. | | | 800,000 | | | | 4.00 | | | | 10/1/37 | | | | 842,336 | |
St. Paul Port Auth. Rev. (Energy Park Utility Company Proj.)8 | | | 1,250,000 | | | | 5.45 | | | | 8/1/28 | | | | 1,282,762 | |
Western MN Municipal Power Agy. Rev. | | | 600,000 | | | | 5.00 | | | | 1/1/35 | | | | 696,660 | |
Western MN Municipal Power Agy. Rev. | | | 1,750,000 | | | | 5.00 | | | | 1/1/36 | | | | 1,958,338 | |
Western MN Municipal Power Agy. Rev. | | | 4,725,000 | | | | 5.00 | | | | 1/1/46 | | | | 5,232,701 | |
| | | | | | | | | | | | | | | | |
| | | | | | | | | | | | | | | 21,347,413 | |
| | | | | | | | | | | | | | | | |
Total Municipal Bonds
(cost: $566,979,890) | | | | | | | | | | | | | | | 578,664,420 | |
| | | | | | | | | | | | | | | | |
Investment Companies - 1.0% | | | | | | | | | | | | | | | | |
Delaware Investments Minnesota Municipal Income Fund II (VMM) | | | 334,436 | | | | | | | | | | | | 4,225,264 | |
Nuveen Minnesota Municipal Income Fund (NMS) | | | 159,408 | | | | | | | | | | | | 2,136,067 | |
| | | | | | | | | | | | | | | | |
| | | | |
Total Investment Companies
(cost: $7,237,880) | | | | | | | | | | | | | | | 6,361,331 | |
| | | | | | | | | | | | | | | | |
| | | | |
Total Investments in Securities - 94.7%
(cost: $574,217,770) | | | | | | | | | | | | | | | 585,025,751 | |
Other Assets and Liabilities, net - 5.3% | | | | | | | | | | | | | | | 32,740,061 | |
| | | | | | | | | | | | | | | | |
| | | | |
Total Net Assets - 100.0% | | | | | | | | | | | | | | | $617,765,812 | |
| | | | | | | | | | | | | | | | |
| | | | | | | | | | | | | | | | | |
| | | | |
See accompanying notes to financial statements. | | | | |
46 | | | SIT MUTUAL FUNDS ANNUAL REPORT | |
| 1 | Variable rate security. Rate disclosed is as of March 31, 2019. Certain variable rate securities are not based on a published reference rate and spread but are determined by the issuer or agent and are based on current market conditions, or, for mortgage-backed securities, are impacted by the individual mortgages which are paying off over time. These securities do not indicate a reference rate and spread in their descriptions. |
| 2 | Security considered illiquid by the Investment Adviser. The total value of such securities as of March 31, 2019 was $2,749,624 and represented 0.4% of net assets. |
| 4 | 144A Restricted Security. The total value of such securities as of March 31, 2019 was $16,635,389 and represented 2.7% of net assets. These securities have been determined to be liquid by the Adviser in accordance with guidelines established by the Board of Directors. |
| 5 | The issuer is in default of interest or principal payments, or other debt covenants. Income is not being accrued. The total value of such securities as of March 31, 2019 was $1,470,768 and represented 0.2% of net assets. |
| 8 | Securities the income from which is treated as a tax preference that is included in alternative minimum taxable income for purposes of computing federal alternative minimum tax (AMT). At March 31, 2019, 3.8% of net assets in the Fund was invested in such securities. |
| 9 | Municipal Lease Security. The total value of such securities as of March 31, 2019 was $31,952,192 and represented 5.2% of net assets. These securities have been determined to be liquid by the Adviser in accordance with guidelines established by the Board of Directors. |
| 11 | The Fund may invest in obligations issued by U.S. territories, for example Guam, Puerto Rico, and Virgin Islands. The total value of such securities as of March 31, 2019 was $15,638,435 and represented 2.5% of net assets. |
Numeric footnotes not disclosed are not applicable to this Schedule of Investments.
Short futures contracts outstanding as of March 31, 2019 were as follows:
| | | | | | | | | | | | |
| Type | | Contracts | | | Expiration
Date | | Notional
Amount ($) | | Value/
Unrealized
Appreciation
(Depreciation) ($) |
Short Futures: 10 | | | | | | | | | | | | |
U.S. Treasury10-Year | | | 68 | | | June 2019 | | | (8,446,875 | ) | | (122,941) |
U.S. Treasury5-Year | | | 55 | | | June 2019 | | | (6,370,547 | ) | | (60,761) |
U.S. Treasury2-Year | | | 32 | | | June 2019 | | | (6,819,000 | ) | | (26,350) |
U.S. Treasury Long Bond | | | 22 | | | June 2019 | | | (3,292,438 | ) | | (81,885) |
| | | | | | | | | | | | |
| | | | |
| | | | | | | | | | | | (291,937) |
| 10 | The amount of $3,000,000 in cash was segregated with the broker to cover margin requirements for derivative transactions as of March 31, 2019. |
A summary of the levels for the Fund’s investments as of March 31, 2019 is as follows (see Note 2 - significant accounting policies in the notes to financial statements):
| | | | | | | | | | | | | | |
| | | Investment in Securities | |
| | | Level 1
Quoted
Price ($) | | | Level 2
Other significant
observable inputs ($) | | Level 3 Significant
unobservable inputs ($) | | Total ($) | |
Assets | | | | | | | | | | | | | | |
Municipal Bonds | | | — | | | | 578,664,420 | | | — | | | 578,664,420 | |
Investment Companies | | | 6,361,331 | | | | — | | | — | | | 6,361,331 | |
| | | 6,361,331 | | | | 578,664,420 | | | — | | | 585,025,751 | |
Liabilities | | | | | | | | | | | | | | |
Futures | | | (291,937 | ) | | | — | | | — | | | (291,937 | ) |
There were no transfers into or out of level 3 during the reporting period.
| | | | |
See accompanying notes to financial statements. | | | | |
MARCH 31, 2019 | | | 47 | |
STATEMENTS OF ASSETS AND LIABILITIES
March 31, 2019
| | | | | | | | | | | | | | | | |
| | | Sit U.S.
Government
Securities
Fund | | | Sit Quality
Income
Fund | | | SitTax-Free
Income
Fund | | | Sit Minnesota
Tax-Free
Income
Fund | |
ASSETS | | | | | | | | | | | | | | | | |
Investments in securities, at identified cost | | $ | 417,249,857 | | | $ | 80,891,780 | | | $ | 238,239,882 | | | $ | 574,217,770 | |
| | | | | | | | | | | | | | | | |
| | | | |
Investments in securities, at fair value - see accompanying schedule for detail | | $ | 419,918,280 | | | $ | 81,166,090 | | | $ | 232,863,736 | | | $ | 585,025,751 | |
Cash in bank on demand deposit | | | — | | | | — | | | | 13,356,732 | | | | 24,210,450 | |
Cash collateral held at broker | | | 6,000,000 | | | | 1,000,000 | | | | 3,000,000 | | | | 3,000,000 | |
Accrued interest and dividends receivable | | | 2,032,589 | | | | 454,376 | | | | 2,950,035 | | | | 6,897,812 | |
Receivable for investment securities sold | | | 15,609 | | | | 33,759 | | | | — | | | | — | |
Other receivables | | | — | | | | — | | | | — | | | | 1,500 | |
Receivable for Fund shares sold | | | 397,421 | | | | — | | | | 197,061 | | | | 1,162,992 | |
| | | | | | | | | | | | | | | | |
| | | | |
Total assets | | | 428,363,899 | | | | 82,654,225 | | | | 252,367,564 | | | | 620,298,505 | |
| | | | | | | | | | | | | | | | |
| | | | |
LIABILITIES | | | | | | | | | | | | | | | | |
Payable for investment securities purchased | | | — | | | | — | | | | 3,954,710 | | | | 1,000,000 | |
Payable for Fund shares redeemed | | | 704,995 | | | | 2,406 | | | | 146,331 | | | | 630,663 | |
Cash portion of dividends payable to shareholders | | | 56,928 | | | | 10,105 | | | | 134,234 | | | | 197,015 | |
Variation margin on futures contracts | | | — | | | | — | | | | 617,794 | | | | 291,937 | |
Accrued investment management fees | | | 288,088 | | | | 62,743 | | | | 163,647 | | | | 413,078 | |
Outstanding options written, at fair value (premiums received $148,953) | | | — | | | | 291,992 | | | | — | | | | — | |
| | | | | | | | | | | | | | | | |
| | | | |
Total liabilities | | | 1,050,011 | | | | 367,246 | | | | 5,016,716 | | | | 2,532,693 | |
| | | | | | | | | | | | | | | | |
| | | | |
Net assets applicable to outstanding capital stock | | $ | 427,313,888 | | | $ | 82,286,979 | | | $ | 247,350,848 | | | $ | 617,765,812 | |
| | | | | | | | | | | | | | | | |
| | | | |
Net assets consist of: | | | | | | | | | | | | | | | | |
Capital (par value andpaid-in surplus) | | $ | 440,574,465 | | | $ | 84,095,930 | | | $ | 261,072,415 | | | $ | 609,302,113 | |
Total distributable earnings (loss), including unrealized appreciation (depreciation) | | | (13,260,577 | ) | | | (1,808,951 | ) | | | (13,721,567 | ) | | | 8,463,699 | |
| | | | | | | | | | | | | | | | |
| | | | |
| | $ | 427,313,888 | | | $ | 82,286,979 | | | $ | 247,350,848 | | | $ | 617,765,812 | |
| | | | | | | | | | | | | | | | |
| | | | |
Outstanding shares | | | 39,138,326 | | | | 8,396,361 | | | | 25,514,272 | | | | 58,910,382 | |
| | | | | | | | | | | | | | | | |
| | | | |
Net asset value per share of outstanding capital stock | | | $10.92 | | | | $9.80 | | | | $9.69 | | | | $10.49 | |
| | | | | | | | | | | | | | | | |
| | | | |
See accompanying notes to financial statements. | | | | |
48 | | | SIT MUTUAL FUNDS ANNUAL REPORT | |
STATEMENTS OF OPERATIONS
Year Ended March 31, 2019
| | | | | | | | | | | | | | | | |
| | | Sit U.S.
Government
Securities
Fund | | | Sit Quality
Income
Fund | | | Sit Tax-Free
Income
Fund | | | Sit Minnesota
Tax-Free
Income
Fund | |
Investment income: | | | | | | | | | | | | | | | | |
Income: | | | | | | | | | | | | | | | | |
Dividends | | | — | | | | — | | | | $435,753 | | | | $244,170 | |
Interest | | $ | 13,872,710 | | | $ | 2,267,588 | | | | 8,664,448 | | | | 22,220,015 | |
| | | | | | | | | | | | | | | | |
| | | | |
Total income | | | 13,872,710 | | | | 2,267,588 | | | | 9,100,201 | | | | 22,464,185 | |
| | | | | | | | | | | | | | | | |
| | | | |
Expenses (note 4): | | | | | | | | | | | | | | | | |
Investment management fee | | | 3,782,521 | | | | 714,764 | | | | 1,746,359 | | | | 4,589,531 | |
| | | | | | | | | | | | | | | | |
| | | | |
Total expenses | | | 3,782,521 | | | | 714,764 | | | | 1,746,359 | | | | 4,589,531 | |
| | | | | | | | | | | | | | | | |
| | | | |
Net investment income | | | 10,090,189 | | | | 1,552,824 | | | | 7,353,842 | | | | 17,874,654 | |
| | | | | | | | | | | | | | | | |
| | | | |
Realized and unrealized gain (loss): | | | | | | | | | | | | | | | | |
Net realized gain (loss) on investments | | | (3,593,450 | ) | | | (487,731 | ) | | | (1,336,002 | ) | | | (877,988 | ) |
Net realized gain (loss) on written options | | | 312,618 | | | | 112,414 | | | | — | | | | — | |
Net realized gain (loss) on futures | | | — | | | | (451,871 | ) | | | (1,299,014 | ) | | | (1,203,694 | ) |
| | | | |
Net change in unrealized appreciation (depreciation) on investments | | | 7,513,558 | | | | 1,023,609 | | | | 4,162,073 | | | | 7,571,960 | |
Net change in unrealized appreciation (depreciation) on written options | | | 301,674 | | | | (143,039 | ) | | | — | | | | — | |
Net change in unrealized appreciation (depreciation) on futures | | | — | | | | 119,184 | | | | (344,231 | ) | | | 151,055 | |
| | | | | | | | | | | | | | | | |
| | | | |
Net gain (loss) | | | 4,534,400 | | | | 172,566 | | | | 1,182,826 | | | | 5,641,333 | |
| | | | | | | | | | | | | | | | |
| | | | |
Net increase (decrease) in net assets resulting from operations | | $ | 14,624,589 | | | $ | 1,725,390 | | | | $8,536,668 | | | $ | 23,515,987 | |
| | | | | | | | | | | | | | | | |
| | | | |
See accompanying notes to financial statements. | | | | |
MARCH 31, 2019 | | | 49 | |
STATEMENTS OF CHANGES IN NET ASSETS
| | | | | | | | |
| | | Sit U.S. Government
Securities Fund |
| | |
| | | Year
Ended
March 31,
2019 | | Year
Ended
March 31,
2018 |
Operations: | | | | | | | | |
Net investment income | | | $10,090,189 | | | | $10,154,053 | |
Net realized gain (loss) on investments, written options and futures | | | (3,280,832 | ) | | | 1,619,622 | |
Net change in unrealized appreciation (depreciation) of investments, written options and futures | | | 7,815,232 | | | | (7,251,930 | ) |
| | | | | | | | |
| | |
Net increase (decrease) in net assets resulting from operations | | | 14,624,589 | | | | 4,521,745 | |
| | | | | | | | |
| | |
Distributions from: | | | | | | | | |
Net investment income and net realized gains | | | (9,999,800 | ) | | | (10,154,053 | ) 1 |
| | | | | | | | |
| | |
Total distributions | | | (9,999,800 | ) | | | (10,154,053 | ) |
| | | | | | | | |
| | |
Capital share transactions: | | | | | | | | |
Proceeds from shares sold | | | 89,008,596 | | | | 132,808,397 | |
Reinvested distributions | | | 9,446,690 | | | | 9,667,291 | |
Payments for shares redeemed | | | (203,514,634 | ) | | | (252,398,673 | ) |
| | | | | | | | |
| | |
Increase (decrease) in net assets from capital transactions | | | (105,059,348 | ) | | | (109,922,985 | ) |
| | | | | | | | |
| | |
Total increase (decrease) in net assets | | | (100,434,559 | ) | | | (115,555,293 | ) |
| | |
Net assets: | | | | | | | | |
Beginning of period | | | 527,748,447 | | | | 643,303,740 | |
| | | | | | | | |
| | |
End of period2 | | | $427,313,888 | | | | $527,748,447 | |
| | | | | | | | |
| | |
Capital transactions in shares: | | | | | | | | |
Sold | | | 8,232,091 | | | | 12,188,543 | |
Reinvested distributions | | | 874,500 | | | | 889,177 | |
Redeemed | | | (18,840,376 | ) | | | (23,199,596 | ) |
| | | | | | | | |
| | |
Net increase (decrease) | | | (9,733,785 | ) | | | (10,121,876 | ) |
| | | | | | | | |
1 For the year ended March 31, 2018, all distributions to shareholders were from net investment income for book purposes. During 2018, the Securities and Exchange Commission eliminated the requirement to distinguish between distributions from net investment income and net realized gains for book purposes. The tax character of distributions is disclosed in the notes to the financial statements.
2 During 2018, the Securities and Exchange Commission eliminated the requirement to disclose end of year undistributed (distributions in excess of) net investment income.
| | | | |
See accompanying notes to financial statements. | | | | |
50 | | | SIT MUTUAL FUNDS ANNUAL REPORT | |
| | | | | | | | | | | | | | | | | | | | | | | | | | | | |
Sit Quality
Income Fund | | SitTax-Free
Income Fund | | Sit MinnesotaTax-Free
Income Fund |
| Year | | Year | | Year | | Year | | Year | | Year |
| Ended | | Ended | | Ended | | Ended | | Ended | | Ended |
| March 31, | | March 31, | | March 31, | | March 31, | | March 31, | | March 31, |
| 2019 | | 2018 | | 2019 | | 2018 | | 2019 | | 2018 |
| | | | | |
| | | $1,552,824 | | | | | $985,779 | | | | | $7,353,842 | | | | | $7,138,637 | | | | | $17,874,654 | | | | | $16,474,457 | |
| | | (827,188 | ) | | | | 333,632 | | | | | (2,635,016 | ) | | | | 592,104 | | | | | (2,081,682 | ) | | | | 1,956,145 | |
| | | | | |
| | | 999,754 | | | | | (752,564 | ) | | | | 3,817,842 | | | | | 2,228,796 | | | | | 7,723,015 | | | | | 3,216,286 | |
| | | | | | | | | | | | | | | | | | | | | | | | | | | | | |
| | | | | |
| | | 1,725,390 | | | | | 566,847 | | | | | 8,536,668 | | | | | 9,959,537 | | | | | 23,515,987 | | | | | 21,646,888 | |
| | | | | | | | | | | | | | | | | | | | | | | | | | | | | |
| | | | | |
| | | (1,542,826 | ) | | | | (985,896 | )1 | | | | (7,220,989 | ) | | | | (7,143,190 | )1 | | | | (17,780,483 | ) | | | | (16,459,459 | ) 1 |
| | | | | | | | | | | | | | | | | | | | | | | | | | | | | |
| | | | | |
| | | (1,542,826 | ) | | | | (985,896 | ) | | | | (7,220,989 | ) | | | | (7,143,190 | ) | | | | (17,780,483 | ) | | | | (16,459,459 | ) |
| | | | | | | | | | | | | | | | | | | | | | | | | | | | | |
| | | | | |
| | | 50,682,279 | | | | | 51,183,608 | | | | | 89,073,224 | | | | | 55,698,315 | | | | | 166,504,993 | | | | | 116,133,884 | |
| | | 1,451,693 | | | | | 949,395 | | | | | 5,808,755 | | | | | 6,064,679 | | | | | 15,266,867 | | | | | 14,116,257 | |
| | | (44,571,989 | ) | | | | (51,032,358 | ) | | | | (44,865,212 | ) | | | | (29,006,204 | ) | | | | (120,904,068 | ) | | | | (114,096,206 | ) |
| | | | | | | | | | | | | | | | | | | | | | | | | | | | | |
| | | | | |
| | | 7,561,983 | | | | | 1,100,645 | | | | | 50,016,767 | | | | | 32,756,790 | | | | | 60,867,792 | | | | | 16,153,935 | |
| | | | | | | | | | | | | | | | | | | | | | | | | | | | | |
| | | | | |
| | | 7,744,547 | | | | | 681,596 | | | | | 51,332,446 | | | | | 35,573,137 | | | | | 66,603,296 | | | | | 21,341,364 | |
| | | | | |
| | | 74,542,432 | | | | | 73,860,836 | | | | | 196,018,402 | | | | | 160,445,265 | | | | | 551,162,516 | | | | | 529,821,152 | |
| | | | | | | | | | | | | | | | | | | | | | | | | | | | | |
| | | | | |
| | | $82,286,979 | | | | | $74,542,432 | | | | $ | 247,350,848 | | | | $ | 196,018,402 | | | | | $617,765,812 | | | | | $551,162,516 | |
| | | | | | | | | | | | | | | | | | | | | | | | | | | | | |
| | | | | |
| | | 5,192,415 | | | | | 5,202,564 | | | | | 9,296,735 | | | | | 5,760,763 | | | | | 16,120,183 | | | | | 11,124,647 | |
| | | 148,699 | | | | | 96,609 | | | | | 606,282 | | | | | 628,951 | | | | | 1,475,949 | | | | | 1,353,797 | |
| | | (4,567,369 | ) | | | | (5,188,246 | ) | | | | (4,684,646 | ) | | | | (3,005,135 | ) | | | | (11,727,325 | ) | | | | (10,933,655 | ) |
| | | | | | | | | | | | | | | | | | | | | | | | | | | | | |
| | | | | |
| | | 773,745 | | | | | 110,927 | | | | | 5,218,371 | | | | | 3,384,579 | | | | | 5,868,807 | | | | | 1,544,789 | |
| | | | | | | | | | | | | | | | | | | | | | | | | | | | | |
FINANCIAL HIGHLIGHTS
Per share income and capital changes for a share outstanding throughout the period. See accompanying notes to financial statements.
Sit U.S. Government Securities Fund
| | | | | | | | | | | | | | | | | | | | |
| | | | | | Year Ended March 31, | | | |
| | | 2019 | | | 2018 | | | 2017 | | | 2016 | | | 2015 |
| | | | | |
Net Asset Value: | | | | | | | | | | | | | | | | | | | | |
Beginning of period | | | $10.80 | | | | $10.90 | | | | $11.07 | | | | $11.09 | | | | $11.04 | |
| | | | |
| | | | | |
Operations: | | | | | | | | | | | | | | | | | | | | |
Net investment income1 | | | 0.23 | | | | 0.18 | | | | 0.17 | | | | 0.20 | | | | 0.21 | |
Net realized and unrealized gains (losses) on investments, written options and futures | | | 0.12 | | | | (0.10 | ) | | | (0.17 | ) | | | (0.02 | ) | | | 0.05 | |
| | | | |
Total from operations | | | 0.35 | | | | 0.08 | | | | — | | | | 0.18 | | | | 0.26 | |
| | | | |
Distributions from: | | | | | | | | | | | | | | | | | | | | |
Net investment income | | | (0.23 | ) | | | (0.18 | ) | | | (0.17 | ) | | | (0.20 | ) | | | (0.21) | |
| | | | |
Net Asset Value: | | | | | | | | | | | | | | | | | | | | |
End of period | | | $10.92 | | | | $10.80 | | | | $10.90 | | | | $11.07 | | | | $11.09 | |
| | | | |
| | | | | |
Total investment return2 | | | 3.31% | | | | 0.76% | | | | 0.02 | % | | | 1.63% | | | | 2.37% | |
| | | | |
| | | | | |
Net assets at end of period (000’s omitted) | | | $427,314 | | | | $527,748 | | | | $643,304 | | | | $663,676 | | | | $587,210 | |
| | | | | |
Ratios:3 | | | | | | | | | | | | | | | | | | | | |
Expenses | | | 0.80% | | | | 0.80% | | | | 0.80% | | | | 0.80% | | | | 0.80% | |
Net investment income | | | 2.13% | | | | 1.68% | | | | 1.57% | | | | 1.81% | | | | 1.89% | |
| | | | | |
Portfolio turnover rate (excluding short-term securities) | | | 14.88% | | | | 14.68% | | | | 29.00% | | | | 28.65% | | | | 13.71% | |
| 1 | The net investment income per share is based on average shares outstanding for the period. |
| 2 | Total investment return is based on the change in net asset value of a share during the period (not annualized) and assumes reinvestment of distributions at net asset value. |
| 3 | Ratios are annualized for periods less than one year. In addition to fees and expenses which the Fund bears directly, the Fund indirectly bears a pro rata share of the fees and expenses of the acquired funds in which it invests. Such indirect expenses are not included in the above reported expense ratios. |
| | | | |
| | | | |
52 | | | SIT MUTUAL FUNDS ANNUAL REPORT | |
FINANCIAL HIGHLIGHTS
Per share income and capital changes for a share outstanding throughout the period. See accompanying notes to financial statements.
Sit Quality Income Fund
| | | | | | | | | | | | | | | | | | | | |
| | | | | | Years Ended March 31, | | | | |
| | | 2019 | | | 2018 | | | 2017 | | | 2016 | | | 2015 | |
| | | | | |
Net Asset Value: | | | | | | | | | | | | | | | | | | | | |
Beginning of period | | | $9.78 | | | | $9.83 | | | | $9.83 | | | | $9.94 | | | | $9.97 | |
| | | | |
| | | | | |
Operations: | | | | | | | | | | | | | | | | | | | | |
Net investment income 1 | | | 0.19 | | | | 0.13 | | | | 0.09 | | | | 0.10 | | | | 0.06 | |
Net realized and unrealized gains (losses) on investments, written options and futures | | | 0.02 | | | | (0.05 | ) | | | — | | | | (0.11 | ) | | | (0.03 | ) |
| | | | |
Total from operations | | | 0.21 | | | | 0.08 | | | | 0.09 | | | | (0.01 | ) | | | 0.03 | |
| | | | |
Distributions from: | | | | | | | | | | | | | | | | | | | | |
Net investment income | | | (0.19 | ) | | | (0.13 | ) | | | (0.09 | ) | | | (0.10 | ) | | | (0.06 | ) |
| | | | |
Net Asset Value: | | | | | | | | | | | | | | | | | | | | |
End of period | | | $9.80 | | | | $9.78 | | | | $9.83 | | | | $9.83 | | | | $9.94 | |
| | | | |
| | | | | |
Total investment return 2 | | | 2.17% | | | | 0.79% | | | | 0.91% | | | | (0.10%) | | | | 0.36% | |
| | | | |
| | | | | |
Net assets at end of period (000’s omitted) | | | $82,287 | | | | $74,542 | | | | $73,861 | | | | $66,880 | | | | $124,418 | |
| | | | | |
Ratios: 3 | | | | | | | | | | | | | | | | | | | | |
Expenses | | | 0.90% | | | | 0.90% | | | | 0.90% | | | | 0.90% | | | | 0.90% | |
Net investment income | | | 1.96% | | | | 1.31% | | | | 0.91% | | | | 1.02% | | | | 0.63% | |
| | | | | |
Portfolio turnover rate (excluding short-term securities) | | | 68.93% | | | | 81.14% | | | | 84.03% | | | | 90.38% | | | | 241.64% | |
| 1 | The net investment income per share is based on average shares outstanding for the period. |
| 2 | Total investment return is based on the change in net asset value of a share during the period (not annualized) and assumes reinvestment of distributions at net asset value. |
| 3 | Ratios are annualized for periods less than one year. In addition to fees and expenses which the Fund bears directly, the Fund indirectly bears a pro rata share of the fees and expenses of the acquired funds in which it invests. Such indirect expenses are not included in the above reported expense ratios. |
FINANCIAL HIGHLIGHTS
Per share income and capital changes for a share outstanding throughout the period. See accompanying notes to financial statements.
SitTax-Free Income Fund
| | | | | | | | | | | | | | | | | | | | |
| |
| | | | | | Years Ended March 31, | | | | |
| | | 2019 | | | 2018 | | | 2017 | | | 2016 | | | 2015 | |
| |
| | | | | |
Net Asset Value: | | | | | | | | | | | | | | | | | | | | |
Beginning of period | | | $9.66 | | | | $9.49 | | | | $9.80 | | | | $9.68 | | | | $9.16 | |
| | | | |
| | | | | |
Operations: | | | | | | | | | | | | | | | | | | | | |
Net investment income 1 | | | 0.32 | | | | 0.39 | | | | 0.35 | | | | 0.33 | | | | 0.37 | |
Net realized and unrealized gains (losses) on investments and futures | | | 0.03 | | | | 0.17 | | | | (0.31 | ) | | | 0.12 | | | | 0.52 | |
| | | | |
Total from operations | | | 0.35 | | | | 0.56 | | | | 0.04 | | | | 0.45 | | | | 0.89 | |
| | | | |
Distributions from: | | | | | | | | | | | | | | | | | | | | |
Net investment income | | | (0.32 | ) | | | (0.39 | ) | | | (0.35 | ) | | | (0.33 | ) | | | (0.37 | ) |
| | | | |
Net Asset Value: | | | | | | | | | | | | | | | | | | | | |
End of period | | | $9.69 | | | | $9.66 | | | | $9.49 | | | | $9.80 | | | | $9.68 | |
| | | | |
| | | | | |
Total investment return 2 | | | 3.67% | | | | 6.00% | | | | 0.37% | | | | 4.78% | | | | 9.81% | |
| | | | |
| | | | | |
Net assets at end of period (000’s omitted) | | | $247,351 | | | | $196,018 | | | | $160,445 | | | | $156,890 | | | | $165,150 | |
| | | | | |
Ratios: 3 | | | | | | | | | | | | | | | | | | | | |
Expenses | | | 0.80% | | | | 0.80% | | | | 0.80% | | | | 0.80% | | | | 0.80% | |
Net investment income | | | 3.37% | | | | 4.03% | | | | 3.58% | | | | 3.45% | | | | 3.86% | |
| | | | | |
Portfolio turnover rate (excluding short-term securities) | | | 13.80% | | | | 15.72% | | | | 25.41% | | | | 23.11% | | | | 31.14% | |
| 1 | The net investment income per share is based on average shares outstanding for the period. |
| 2 | Total investment return is based on the change in net asset value of a share during the period (not annualized) and assumes reinvestment of distributions at net asset value. |
| 3 | Ratios are annualized for periods less than one year. In addition to fees and expenses which the Fund bears directly, the Fund indirectly bears a pro rata share of the fees and expenses of the acquired funds in which it invests. Such indirect expenses are not included in the above reported expense ratios. |
| | | | |
| | | | |
54 | | | SIT MUTUAL FUNDS ANNUAL REPORT | |
FINANCIAL HIGHLIGHTS
Per share income and capital changes for a share outstanding throughout the period. See accompanying notes to financial statements.
Sit MinnesotaTax-Free Income Fund
| | | | | | | | | | | | | | | | | | | | |
| |
| | | | | | Years Ended March 31, | | | | |
| | | 2019 | | | 2018 | | | 2017 | | | 2016 | | | 2015 | |
| |
| | | | | |
Net Asset Value: | | | | | | | | | | | | | | | | | | | | |
Beginning of period | | | $10.39 | | | | $10.29 | | | | $10.63 | | | | $10.57 | | | | $10.26 | |
| | | | |
| | | | | |
Operations: | | | | | | | | | | | | | | | | | | | | |
Net investment income 1 | | | 0.32 | | | | 0.32 | | | | 0.32 | | | | 0.34 | | | | 0.36 | |
Net realized and unrealized gains (losses) on investments and futures | | | 0.10 | | | | 0.10 | | | | (0.34 | ) | | | 0.06 | | | | 0.31 | |
| | | | |
Total from operations | | | 0.42 | | | | 0.42 | | | | (0.02 | ) | | | 0.40 | | | | 0.67 | |
| | | | |
Distributions from: | | | | | | | | | | | | | | | | | | | | |
Net investment income | | | (0.32 | ) | | | (0.32 | ) | | | (0.32 | ) | | | (0.34 | ) | | | (0.36 | ) |
| | | | |
Net Asset Value: | | | | | | | | | | | | | | | | | | | | |
End of period | | | $10.49 | | | | $10.39 | | | | $10.29 | | | | $10.63 | | | | $10.57 | |
| | | | |
| | | | | |
Total investment return 2 | | | 4.15% | | | | 4.08% | | | | (0.19% | ) | | | 3.89% | | | | 6.62% | |
| | | | |
| | | | | |
Net assets at end of period (000’s omitted) | | | $617,766 | | | | $551,163 | | | | $529,821 | | | | $508,209 | | | | $436,883 | |
| | | | | |
Ratios: 3 | | | | | | | | | | | | | | | | | | | | |
Expenses | | | 0.80% | | | | 0.80% | | | | 0.80% | | | | 0.80% | | | | 0.80% | |
Net investment income | | | 3.12% | | | | 3.05% | | | | 3.06% | | | | 3.25% | | | | 3.43% | |
| | | | | |
Portfolio turnover rate (excluding short-term securities) | | | 9.25% | | | | 12.97% | | | | 16.18% | | | | 10.45% | | | | 9.68% | |
| 1 | The net investment income per share is based on average shares outstanding for the period. |
| 2 | Total investment return is based on the change in net asset value of a share during the period (not annualized) and assumes reinvestment of distributions at net asset value. |
| 3 | Ratios are annualized for periods less than one year. In addition to fees and expenses which the Fund bears directly, the Fund indirectly bears a pro rata share of the fees and expenses of the acquired funds in which it invests. Such indirect expenses are not included in the above reported expense ratios. |
NOTES TO FINANCIAL STATEMENTS
Year Ended March 31, 2019
The Sit Mutual Funds (the Funds) areno-load funds, and are registered under the Investment Company Act of 1940 (as amended) as diversified (except MinnesotaTax-Free Income Fund which isnon-diversified),open-end management investment companies, or series thereof. The Sit Quality Income Fund, SitTax-Free Income Fund and MinnesotaTax-Free Income Fund are series funds of Sit Mutual Funds II, Inc. Each fund has 10 billion authorized shares of capital stock. Shares in the U.S. Government Securities Fund have a par value of $0.01, and shares in other funds have a par value of $0.001. This report covers the bond funds of the Sit Mutual Funds.
The investment objective for each Fund is as follows:
| | |
| Fund | | Investment Objective |
U.S. Government Securities | | High level of current income and safety of principal. |
Quality Income Fund | | High level of current income and safety of principal. |
Tax-Free Income | | High level of current income that is exempt from federal income tax, consistent with the preservation of capital. |
MinnesotaTax-Free Income | | High level of current income that is exempt from federal regular income tax and Minnesota regular personal income tax, consistent with the preservation of capital. |
| (2) | Significant Accounting Policies |
The Funds are investment companies and follow accounting and reporting guidance under Financial Accounting Standards Board (“FASB”) Accounting Standards Codification (“ASC”) Topic 946, “Financial Services-Investment Companies”. The following is a summary of significant accounting policies consistently followed by the Funds in the preparation of their financial statements in conformity with U.S. generally accepted accounting principles (“GAAP”).
Investments in Securities
Investment securities are carried at fair value based upon closing market quotations on the last business day of the period. Investments in securities traded on national or international securities exchanges are valued at the last reported sales price prior to the time when assets are valued. Equity securities traded on theover-the-counter market are valued at the last reported sales price or if the last sales price is not available, at the last reported bid price. The sale and bid prices or prices deemed best to reflect fair value quoted by dealers who make markets in these securities are obtained from independent pricing services. Consistent with the Funds’ valuation policies and procedures, the current fair value of certain fixed income securities is provided by an independent pricing service. Fixed income securities for which prices are not available from an independent pricing service but where an active market exists are valued using market quotations obtained from broker-dealers or quotation systems. Securities for which market quotations are not available, such as private placement securities, are valued at fair value according to methods selected in good faith by Sit Investment Associates, Inc. (the “Adviser”) and may include dealer-supplied valuations or other inputs and assumptions that pricing services would typically utilize. Short-term investments of sufficient credit quality with maturities of 60 days or less when acquired, or which subsequently are within 60 days of maturity, are valued at amortized cost, which approximates fair value. Options and futures contracts entered into and held by the Funds are valued at the close of the securities and commodities exchange on which they are traded.
Security transactions are accounted for on the date the securities are purchased or sold. Gains and losses are calculated on the identified-cost basis. Interest, including level-yield amortization of long-term bond premium and discount, is recorded on the accrual basis. Dividends received fromclosed-end fund holdings are included in Dividend Income and distributions from capital gains, if any, are included in Net Realized Gain (Loss).
Delivery and payment for securities which have been purchased by the Funds on a forward commitment or when-issued basis can take place two weeks or more after the transaction date. During this period, such securities are subject to market fluctuations and may increase or decrease in value prior to delivery.
The MinnesotaTax-Free Income Fund concentrates its investments in Minnesota, and therefore may have more credit risk related to the economic conditions in the state of Minnesota than a portfolio with broader geographical diversification.
| | | | |
| | | | |
56 | | | SIT MUTUAL FUNDS ANNUAL REPORT | |
Derivative Instruments
The Funds apply derivative instrument disclosure standards in order to enable investors to understand how and why the Funds use derivatives, how derivatives are accounted for, and how derivative instruments affect the Funds’ financial statements.
To hedge interest rate risk, the Funds used Treasury options and futures traded on a U.S. exchange. Risks of entering into futures and options contracts include the possibility of an illiquid market and that a change in the value of the option may not correlate with changes in the value of the underlying securities.
The premiums paid for the options represent the cost of the investment and the options are valued daily at their closing price. The Funds recognize a realized gain or loss when the option is sold or expired. Option holdings within the Funds, which may include put options and call options, are subject to loss of value with the passage of time, and may experience a total loss of value upon expiration. With options, there is minimal counterparty risk to the Funds since they are exchange traded.
Upon entering into a futures contract, a Fund is required to deposit either cash or securities in an amount (initial margin) equal to a certain percentage of the contract value. Subsequent payments (variation margin) are made or received by the Fund each day. The variation margin payments are equal to the daily changes in the contract value and are recorded as unrealized gains and losses. The Fund recognizes a realized gain or loss when the contract is closed or expired. With futures contracts, there is minimal counterparty risk to the Fund since futures are exchange traded and the exchange’s clearinghouse, as counterparty to all exchange-traded futures, guarantees the futures against default.
During the year ended March 31, 2019, the average volume of derivative activity, calculated on a quarterly basis, was as follows:
| | | | | | | | | | | | | | | | | | | | | | | | |
| | | | | | Average
Cost | | | | | | Average
Premium
Received | | | | | | Average
Notional
Amount | |
U.S. Government Securities Fund | | | | | | | | | | | | | | | | | | | | | | | | |
Purchased put options | | | | | | | $565,503 | | | | | | | | — | | | | | | | | $129,439,650 | |
Written call options | | | | | | | — | | | | | | | | $348,403 | | | | | | | | 132,125,702 | |
| | | | | | |
Quality Income Fund | | | | | | | | | | | | | | | | | | | | | | | | |
Written call options | | | | | | | — | | | | | | | | 32,715 | | | | | | | | 9,827,500 | |
Treasury futures - short | | | | | | | — | | | | | | | | — | | | | | | | | 26,709,111 | |
| | | | | | |
Tax-Free Income Fund | | | | | | | | | | | | | | | | | | | | | | | | |
Treasury futures - short | | | | | | | — | | | | | | | | — | | | | | | | | 57,584,287 | |
| | | | | | |
MinnesotaTax-Free Income Fund | | | | | | | | | | | | | | | | | | | | | | | | |
Treasury futures - short | | | | | | | — | | | | | | | | — | | | | | | | | 57,765,090 | |
The number of open option contracts and open futures contracts outstanding as of March 31, 2019 also serve as indicators of the volume of activity for the Funds throughout the period.
NOTES TO FINANCIAL STATEMENTS
Year Ended March 31, 2019 (Continued)
Statement of Assets and Liabilities - Values of derivatives as of March 31, 2019
| | | | | | | | | | |
| | | Asset Derivatives Value | | | | Liability Derivatives Value |
Interest rate risk: | | | | | | | | | | |
Quality Income Fund | | | | | | | | | | |
Written Call Options | | | — | | | | |
| $291,992
| 1
|
Tax-Free Income Fund | | | | | | | | | | |
Treasury futures | | | — | | | | |
| 617,794
| 2
|
MinnesotaTax-Free Income Fund | | | | | | | | | | |
Treasury futures | | | — | | | | | | 291,937 | 2 |
| | 1 | Statement of Assets and Liabilities location: Outstanding options written, at fair value. | |
| | 2 | Statement of Assets and Liabilities location: Variation margin receivable/payable. Includes cumulative appreciation(depreciation) of futures as reported in the Schedule of Investments. | |
The effect of derivative instruments on the statement of operations for the year ended March 31, 2019:
| | | | | | | | | | |
| | | Amount of Realized | | Change in Unrealized |
| | | Gain (Loss) on Derivatives 3 | | Appreciation (Depreciation) on Derivatives 4 |
Interest rate risk: | | | | | | | | | | |
U.S. Government Securities Fund | | | | | | | | | | |
Purchased put options | | | | ($1,926,369 | ) | | | | $320,625 | |
Written call options | | | | 312,618 | | | | | 301,674 | |
Quality Income Fund | | | | | | | | | | |
Written call options | | | | 112,414 | | | | | (143,039 | ) |
Treasury futures | | | | (451,871 | ) | | | | 119,184 | |
| | |
Tax-Free Income Fund | | | | | | | | | | |
Treasury futures | | | | (1,299,014 | ) | | | | (344,231 | ) |
| | |
MinnesotaTax-Free Income Fund | | | | | | | | | | |
Treasury futures | | | | (1,203,694 | ) | | | | 151,055 | |
| | 3 | Statement of Operations location: Net realized gain (loss) on investments, net realized gain (loss) on written options and net realized gain (loss) on futures, respectively. | |
| | 4 | Statement of Operations location: Net change in unrealized appreciation (depreciation) on investments, net change in unrealized appreciation (depreciation) on written options and net change in unrealized appreciation (depreciation) on futures, respectively. | |
| | | | |
| | | | |
58 | | | SIT MUTUAL FUNDS ANNUAL REPORT | |
Fair Value Measurements
The inputs and valuation techniques used to measure fair value of the Funds’ net assets are summarized into three levels as described in the hierarchy below:
| | • | | Level 1 – quoted prices in active markets for identical securities. An active market for the security is a market in which transactions occur with sufficient frequency and volume to provide pricing information on an ongoing basis. A quoted price in an active market provides the most reliable evidence of fair value. |
| | • | | Level 2 – debt securities are valued based on evaluated prices received from independent pricing services or from dealers who make markets in such securities. For corporate bonds, U.S. government and government agency obligations, and municipal securities the pricing services utilize matrix pricing which considers yield or price of bonds of comparable quality, coupon, maturity, and type as well as dealer supplied prices. For asset-backed securities and mortgage-backed securities, the pricing services utilize matrix pricing which considers prepayment speed assumptions, attributes of the collateral, yield or price of bonds of comparable quality, coupon, maturity, and type as well as dealer supplied prices. All of these inputs are derived principally from or corroborated by observable market data. An adjustment to any observable input that is significant to the fair value may render the measurement a Level 3 measurement. |
| | • | | Level 3 – significant unobservable inputs, including the Adviser’s own assumptions in determining the fair value of investments. |
The inputs or methodology used for valuing securities are not necessarily an indication of the risk associated with investing in those securities.
At the end of each calendar quarter, management evaluates the Level 2 and 3 assets and liabilities for changes in liquidity, including but not limited to: whether a broker is willing to execute at the quoted price, the depth and consistency of prices from third party services, and the existence of contemporaneous, observable trades in the market. Additionally, management evaluates the Level 1 and 2 assets and liabilities on a quarterly basis for changes in listings or delistings on national exchanges. Due to the inherent uncertainty of determining the fair value of investments that do not have a readily available market value, the fair value of the Funds’ investments may fluctuate from period to period. Additionally, the fair value of investments may differ significantly from the values that would have been used had a ready market existed for such investments and may differ materially from the values the Fund may ultimately realize. Further, such investments may be subject to legal and other restrictions on resale or otherwise are less liquid than publicly traded securities.
A summary of the levels for the Funds’ investments as of March 31, 2019 is included with the Funds’ schedules of investments.
Federal Taxes
The Funds’ policy is to comply with the requirements of the Internal Revenue Code applicable to regulated investment companies and to distribute all of their taxable income to shareholders. The Funds have recorded in their financial statements the full benefit of their tax positions taken in connection with the Registered Investment Company (RIC) qualification and distribution requirements of the Internal Revenue Code. Therefore, no income tax provision is required. Also, in order to avoid the payment of any federal excise taxes, the Funds will distribute substantially all of their net investment income and net realized gains on a calendar year basis.
Management has analyzed the Funds’ tax positions taken in federal tax returns for all open tax years and has concluded that as of March 31, 2019, no provision for income tax would be required in the Funds’ financial statements. The Funds’ federal and state income and federal excise tax returns remain subject to examination by the Internal Revenue Service and state departments of revenue until such time as the applicable statute of limitations for audit has expired. For example, U.S. tax returns are generally subject to audit for three years from the date they are filed.
NOTES TO FINANCIAL STATEMENTS
Year Ended March 31, 2019 (Continued)
At March 31, 2019, the gross unrealized appreciation (depreciation) on investments and cost of investments on a tax basis for federal income tax purposes were as follows:
| | | | | | | | | | | | | | | | |
| | | Unrealized
Appreciation | | Unrealized
Depreciation | | Net Unrealized
Appreciation
(Depreciation) | | Cost (Proceeds)
of Investments
on a Tax Basis |
U.S. Government Securities - Investments | | | $6,175,218 | | | | ($3,506,795 | ) | | | $2,668,423 | | | | $417,249,857 | |
Quality Income - Investments | | | 504,876 | | | | (232,100 | ) | | | 272,776 | | | | 80,893,314 | |
Tax-Free Income - Investments | | | 9,703,111 | | | | (15,072,175 | ) | | | (5,369,064 | ) | | | 238,232,800 | |
MinnesotaTax-Free Income - Investments | | | 14,300,467 | | | | (3,419,221 | ) | | | 10,881,246 | | | | 574,144,505 | |
Net investment income and net realized gains may differ for financial statement and tax purposes. The character of distributions made during the year from net investment income or net realized gains may also differ from its ultimate characterization for tax purposes. The tax character of distributions paid during the fiscal years ended March 31, 2019 and 2018 were as follows:
| | | | | | | | | | | | | | | | | | | | |
Year Ended March 31, 2019: | | | | | | | | | | | | | | | | | | | | |
| | | | |
| | | Ordinary Income | | Tax-Exempt
Income | | Long Term
Capital Gain | | Total |
U.S. Government Securities | | | | $10,088,083 | | | | | — | | | | | — | | | | | $10,088,083 | |
Quality Income | | | | 1,541,309 | | | | | — | | | | | — | | | | | 1,541,309 | |
Tax-Free Income* | | | | 155,254 | | | | | $7,037,416 | | | | | — | | | | | 7,192,670 | |
MinnesotaTax-Free Income* | | | | 43,587 | | | | | 17,831,078 | | | | | — | | | | | 17,874,665 | |
*97.8% and 99.8% of dividends were derived from interest ontax-exempt securities for theTax-Free Income and MinnesotaTax-Free Income Funds, respectively. | |
| | | | |
Year Ended March 31, 2018: | | | | | | | | | | | | | | | | | | | | |
| | | Ordinary Income | | Tax-Exempt
Income | | Long Term
Capital Gain | | Total |
U.S. Government Securities | | | | $10,036,925 | | | | | — | | | | | — | | | | | $10,036,925 | |
Quality Income | | | | 979,607 | | | | | — | | | | | — | | | | | 979,607 | |
Tax-Free Income* | | | | 357,688 | | | | | $6,755,280 | | | | | — | | | | | 7,112,968 | |
MinnesotaTax-Free Income* | | | | 43,477 | | | | | 16,314,954 | | | | | — | | | | | 16,358,431 | |
* 95.0% and 99.7% of dividends were derived from interest ontax-exempt securities for theTax-Free Income and MinnesotaTax-Free Income Funds, respectively. | |
As of March 31, 2019 the components of distributable earnings on a tax basis were as follows:
| | | | | | | | | | | | | | | | | | | | |
| | | | | | | | | Unrealized |
| | | Undistributed | | Undistributed | | Accumulated | | Appreciation |
| | | Ordinary Income | | Tax-Exempt Income | | Gain (Loss) | | (Depreciation) |
U.S. Government Securities | | | $ | 147,317 | | | | | — | | | | ($ | 15,811,773 | ) | | | | $2,668,423 | |
Quality Income | | | | 19,986 | | | | | — | | | | | (2,050,372 | ) | | | | 272,777 | |
Tax-Free Income | | | | — | | | | $ | 264,134 | | | | | (8,482,403 | ) | | | | (5,369,064 | ) |
MinnesotaTax-Free Income | | | | — | | | | | 283,413 | | | | | (2,503,945 | ) | | | | 10,881,246 | |
| | | | |
| | | | |
60 | | | SIT MUTUAL FUNDS ANNUAL REPORT | |
On the statement of assets and liabilities, as a result of permanentbook-to-tax differences, reclassification adjustments were made to the following capital accounts:
| | | | | | | | | | | | | | | |
| | | Distributable | | Additional Paid | | |
| | | Earnings | | in Capital |
Tax-Free Income | | | $ | 2,401,634 | | | | ($ | 2,401,634 | ) |
These differences were primarily attributable to market discount accretion adjustments and capital loss carryovers expiring.
Net capital loss carryovers and late year losses, if any, as of March 31, 2019, are available to offset future realized capital gains and thereby reduce future capital gains distributions. The Funds are permitted to carry forward capital losses for an unlimited period. Capital losses that are carried forward retain their character as either short-term or long-term capital losses. The net capital loss carryovers and the late year losses deferred as of March 31, 2019, were as follows:
| | | | | | | | | | | | | | | | | | | | | | | | | |
| | | Unlimited Period of Net | | Late Year | | Accumulated | | |
| | | Capital Loss Carryover | | Losses | | Capital and |
| | | Short-Term | | Long-Term | | Deferred | | Other Losses |
U.S. Government Securities | | | $ | 8,122,223 | | | | $ | 7,689,550 | | | | | — | | | | $ | 15,811,773 | |
Quality Income | | | | 1,077,553 | | | | | 972,819 | | | | | — | | | | | 2,050,372 | |
Tax-Free Income | | | | 813,905 | | | | | 7,668,498 | | | | | — | | | | | 8,482,403 | |
MinnesotaTax-Free Income | | | | 1,235,782 | | | | | 1,268,163 | | | | | — | | | | | 2,503,945 | |
For the year ended March 31, 2019, the Funds’ utilized capital losses and expired capital losses as follows:
| | | | | | | | | |
| | | Utilized | | Expired | | |
Tax-Free Income | | | | — | | | $2,401,634 |
Distributions
Distributions to shareholders are recorded as of the close of business on the record date. Such distributions are payable in cash or reinvested in additional shares of the Funds’ capital stock. Distributions from net investment income are declared daily and paid monthly for the Funds. Distributions from net realized gains, if any, will be made annually for each of the Funds.
Use of Estimates
The preparation of financial statements in conformity with U.S. generally accepted accounting principles requires management to make certain estimates and assumptions that affect the reported amounts of assets and liabilities and disclosure of contingent assets and liabilities at the date of the financial statements and the reported results for the respective periods. Actual results could differ from those estimates.
Guarantees and Indemnifications
Under each Fund’s organizational documents, its officers and directors are indemnified against certain liabilities arising out of the performance of their duties to each Fund. In addition, certain of each Fund’s contracts with its service providers contain general indemnification clauses. Each Fund’s maximum exposure under these arrangements is unknown since the amount of any future claims that may be made against each Fund cannot be determined and each Fund has no historical basis for predicting the likelihood of any such claims.
NOTES TO FINANCIAL STATEMENTS
Year Ended March 31, 2019 (Continued)
| (3) | Investment Security Transactions |
The cost of purchases and proceeds from sales and maturities of investment securities, other than short-term securities, for the year ended March 31, 2019, were as follows:
| | | | | | | | | | | | | | | | | | | | |
| | | Purchases | | Proceeds |
| | | U.S. Government | | Other | | U.S. Government | | Other |
U.S. Government Securities | | | $ | 68,478,959 | | | | | — | | | | $ | 152,860,945 | | | | | — | |
Quality Income | | | | 27,353,414 | | | | $ | 32,399,393 | | | | | 21,789,551 | | | | $ | 30,685,162 | |
Tax-Free Income | | | | — | | | | | 75,488,057 | | | | | — | | | | | 28,301,559 | |
MinnesotaTax-Free Income | | | | — | | | | | 98,801,824 | | | | | — | | | | | 51,520,848 | |
| (4) | Affiliated Fees and Transactions |
Investment Adviser
The Funds each have entered into an investment management agreement with Sit Investment Associates Inc. (SIA), under which SIA manages the Funds’ assets and provides research, statistical and advisory services, and pays related office rental, executive expenses and executive salaries. SIA also is obligated to pay all of the Funds’ expenses (excluding extraordinary expenses, stock transfer taxes, interest, brokerage commissions, and other transaction charges relating to investing activities). The fee for investment management and advisory services is based on the average daily net assets of the Funds at the annual rate of:
| | | | | | | |
| | | Average Daily Net Assets | | |
U.S. Government Securities | | | | 0.80 | % |
Quality Income | | | | 0.90 | % |
Tax-Free Income | | | | 0.80 | % |
MinnesotaTax-Free Income | | | | 0.80 | % |
Transactions with affiliates
The investment adviser, affiliates of the investment adviser, directors and officers of the Funds as a whole owned the following shares as of March 31, 2019:
| | | | | | | | | | | | |
| | | Shares | | % Shares Outstanding | | |
U.S. Government Securities | | | | 856,520 | | | | | 2.2 | |
Quality Income | | | | 6,221,691 | | | | | 74.1 | |
Tax-Free Income | | | | 1,595,076 | | | | | 6.3 | |
MinnesotaTax-Free Income | | | | 2,200,616 | | | | | 3.7 | |
| | | | |
| | | | |
62 | | | SIT MUTUAL FUNDS ANNUAL REPORT | |
REPORT OF INDEPENDENT REGISTERED PUBLIC ACCOUNTING FIRM
To the Shareholders and Board of Directors:
Sit U.S. Government Securities Fund, Inc.
Sit Mutual Funds II, Inc.:
Opinion on the Financial Statements
We have audited the accompanying statements of assets and liabilities of Sit U.S. Government Securities Fund, Inc. and Sit Quality Income Fund, SitTax-Free Income Fund, and Sit MinnesotaTax-Free Income Fund (each a series of Sit Mutual Funds II, Inc.) (collectively, the Funds), including the schedules of investments, as of March 31, 2019, the related statements of operations for the year then ended, the statements of changes in net assets for each of the years in the two year period then ended, and the related notes (collectively, the financial statements) and the financial highlights for each of the years in the five year period then ended. In our opinion, the financial statements and financial highlights present fairly, in all material respects, the financial position of the Funds as of March 31, 2019, the results of their operations for the year then ended, the changes in their net assets for each of the years in the two year period then ended, and the financial highlights for each of the years in the five year period then ended, in conformity with U.S. generally accepted accounting principles.
Basis for Opinion
These financial statements and financial highlights are the responsibility of the Funds’ management. Our responsibility is to express an opinion on these financial statements and financial highlights based on our audits. We are a public accounting firm registered with the Public Company Accounting Oversight Board (United States) (PCAOB) and are required to be independent with respect to the Company in accordance with the U.S. federal securities laws and the applicable rules and regulations of the Securities and Exchange Commission and the PCAOB.
We conducted our audits in accordance with the standards of the PCAOB. Those standards require that we plan and perform the audit to obtain reasonable assurance about whether the financial statements and financial highlights are free of material misstatement, whether due to error or fraud. Our audits included performing procedures to assess the risks of material misstatement of the financial statements and financial highlights, whether due to error or fraud, and performing procedures that respond to those risks. Such procedures included examining, on a test basis, evidence regarding the amounts and disclosures in the financial statements and financial highlights. Such procedures also included confirmation of securities owned as of March 31, 2019, by correspondence with custodians and brokers. Our audits also included evaluating the accounting principles used and significant estimates made by management, as well as evaluating the overall presentation of the financial statements and financial highlights. We believe that our audits provide a reasonable basis for our opinion.
We have served as the auditor of one or more Sit Mutual Funds investment companies since 1982.
KPMG LLP
Minneapolis, Minnesota
May 22, 2019
EXPENSE EXAMPLE (Unaudited)
As a shareholder of the Funds, you incur two types of costs: (1) transaction costs, including redemption fees and (2) ongoing costs, including management fees; and other Fund expenses. This Example is intended to help you understand your ongoing costs (in dollars) of investing in the Funds and to compare these costs with the ongoing costs of investing in other mutual funds.
The Example is based on an investment of $1,000 invested at the beginning of the period and held for the entire period October 1, 2018 to March 31, 2019.
Actual Expenses
The first line of the following table provides information about actual account values and actual expenses. You may use the information in this line, together with the amount you invested, to estimate the expenses that you paid over the period. Simply divide your account value by $1,000 (for example, an $8,600 account value divided by $1,000 = 8.6), then multiply the result by the number in the first line under the heading entitled “Expenses Paid During Period” to estimate the expenses you paid on your account during this period.
Hypothetical Example for Comparison Purposes
The second line of the table provides information about hypothetical account values and hypothetical expenses based on the Fund’s actual expense ratio and an assumed rate of return of 5% per year before expenses, which is not the Fund’s actual return. The hypothetical account values and expenses may not be used to estimate the actual ending account balance or expenses you paid for the period. You may use this information to compare the ongoing costs of investing in the Fund and other funds. To do so, compare this 5% hypothetical example with the 5% hypothetical examples that appear in the shareholder reports of the other funds.
Please note that the expenses shown in the table are meant to highlight your ongoing costs only and do not reflect any transactional costs, such as redemption fees. Therefore, the second line of the table is useful in comparing ongoing costs only, and will not help you determine the relative total costs of owning different funds. In addition, if these transactional costs (redemption fees) were included, your costs would have been higher.
| | | | | | | | | | |
| | | Beginning
Account
Value
(10/1/18) | | | Ending
Account
Value
(3/31/19) | | | Expenses
Paid During
Period
(10/1/18-
3/31/19)* |
| U.S. Government Securities Fund |
Actual | | | $1,000 | | | | $1,025.80 | | | $4.04 |
Hypothetical | | | $1,000 | | | | $1,020.94 | | | $4.03 |
| |
| Quality Income Fund |
Actual | | | $1,000 | | | | $1,013.40 | | | $4.52 |
Hypothetical | | | $1,000 | | | | $1,020.44 | | | $4.53 |
| |
| Tax-Free Income Fund |
Actual | | | $1,000 | | | | $1,032.20 | | | $4.05 |
Hypothetical | | | $1,000 | | | | $1,020.94 | | | $4.03 |
| |
| MinnesotaTax-Free Income Fund |
Actual | | | $1,000 | | | | $1,033.40 | | | $4.06 |
Hypothetical | | | $1,000 | | | | $1,020.94 | | | $4.03 |
*Expenses are equal to the Funds’ annualized expense ratio of 0.80% for the U.S. Government Securities,Tax-Free Income and MinnesotaTax-Free Funds; and 0.90% for the Quality Income Fund, multiplied by the average account value over the period, multiplied by 182/365 (to reflect theone-half year period.)
| | | | |
| | | | |
64 | | | SIT MUTUAL FUNDS ANNUAL REPORT | |
FEDERAL TAX INFORMATION (Unaudited)
Sit Bond Funds
For corporate shareholders, the percentage of investment income (dividend income and short-term gains, if any), for each of the Funds that qualify for the dividends-received deductions for the period of April 1, 2018 to March 31, 2019 is as follows:
| | |
| Fund | | Percentage |
| |
U.S. Government Securities Fund | | 0.0% |
Quality Income Fund | | 0.0 |
Tax-Free Income Fund | | 0.0 |
MinnesotaTax-Free Income Fund | | 0.0 |
For the year ended March 31, 2019, certain dividends paid by the Funds may be subject to a maximum tax rate of 15%, as provided by the Jobs and Growth Tax Relief Reconciliation Act of 2003. Of the distributions made by the following Funds, the corresponding percentages represent the amount of each distribution which may qualify for the 15% dividend income tax rate.
| | |
| Fund | | Percentage |
| |
U.S. Government Securities Fund | | 0.0% |
Quality Income Fund | | 0.0 |
Tax-Free Income Fund | | 0.0 |
MinnesotaTax-Free Income Fund | | 0.0 |
There were no funds that designated amounts as long-term capital gain dividends during the year ended March 31, 2019. Distributable long-term gains are based on net realized long term gains determined on a tax basis and may differ from such amounts for financial reporting purposes.
For the year ended March 31, 2019, 97.8% and 99.8% of dividends were derived from interest ontax-exempt securities for theTax-Free Income Fund and MinnesotaTax-Free Income Fund, respectively. This portion of exempt-interest dividends is exempt from federal taxes and should not be included in shareholders’gross income. Exempt-interest dividends may be subject to state and local taxes. Each shareholder should consult a tax adviser about reporting this income for state and local tax purposes.
INFORMATION ABOUT DIRECTORS AND OFFICERS (Unaudited)
The Sit Mutual Funds are a family ofno-load mutual funds. The bond funds described in this Annual Report are the Sit U.S. Government Securities Fund, SitTax-Free Income Fund, Sit MinnesotaTax-Free Income Fund, and the Sit Quality Income Fund (the “Funds” or individually, a “Fund”). The Sit U.S. Government Securities Fund and the corporate issuer of the SitTax-Free Income Fund, Sit MinnesotaTax-Free Income Fund and Sit Quality Income Fund have a Board of Directors and officers. Pursuant to Minnesota law, the Boards of Directors are responsible for the management of the Funds and the establishment of the Funds’ policies. The officers of the Funds manage theday-to-day operation of the Funds. Information pertaining to the directors and officers of the Funds is set forth below. The business address, unless otherwise noted below, is that of the Funds’ investment adviser – 3300 IDS Center, 80 South Eighth Street, Minneapolis, Minnesota 55402. The Boards have a separate Audit Committee. The Bond Funds’ SAI has additional information about the Fund’s directors and is available without charge upon request by calling the Sit Funds at800-332-5580.
| | | | | | | | |
Name, Age, and Position with the Funds | | Term of Office (1) and Length of Time Served | | Principal Occupations During
Past Five Years | | Number of Funds
Overseen in Fund Complex | | Other Directorships
Held by Director
During the Past
Five Years (3) |
INTERESTED DIRECTORS: | | | | | | |
Roger J. Sit (2) Age: 57 Chairman and President | | Chairman since 10/08; Officer since 1998. | | Chairman, President, CEO and Global CIO of Sit Investment Associates, Inc. (the “Adviser”); Chairman and CEO of Sit Investment Fixed Income Advisors, Inc. (“SF”); Chairman of SIA Securities Corp. (the “Distributor”). | | 14 | | TCF Financial Corporation. |
INDEPENDENT DIRECTORS: | | | | | | |
Edward M. Giles Age: 83 Director | | Director since 2012 or the Fund’s inception if later. | | Senior Vice President of Peter B. Cannell & Co., July 2011 to present. | | 14 | | None. |
Sidney L. Jones Age: 85 Director | | Director since 1993 or the Fund’s inception, if later: Director from 1988 to 1989. | | Lecturer, Washington Campus Consortium of 17 Universities. | | 14 | | None. |
Bruce C. Lueck Age: 78 Director | | Director since 2004 or the Fund’s inception, if later. | | Consultant for Zephyr Management, L.P. (investment management) and committee member of several investment funds and foundations. | | 14 | | None. |
Donald W. Phillips Age: 70 Director | | Director of the International Fund since 1993, and since 1990 or the Fund’s inception if later for all other Funds. | | Chairman and CEO of WP Global Partners Inc., July 2005 to present. | | 14 | | None. |
Barry N. Winslow Age: 71 Director | | Director since 2010 or the Fund’s inception is later. | | Vice-Chairman of TCF Financial Corporation, July 2008 to July 2014. | | 14 | | TCF Financial Corporation. |
| | | | |
| | | | |
66 | | | SIT MUTUAL FUNDS ANNUAL REPORT | |
| | | | | | | | |
| | | | | |
Name, Age, and Position with the Funds | | Term of Office(1) and Length of Time Served | | Principal Occupations During
Past Five Years | | Number of Funds
Overseen in Fund Complex | | Other Directorships
Held by Director
During the Past Five Years(3) |
OFFICERS: | | | | | | | | |
Mark H. Book Age: 55 Vice President – Investments of U.S. Govt. Fund only. | | Officer since 2002; Re-Elected by the Boards annually. | | Vice President and Portfolio Manager of SF. | | N/A | | N/A |
Kelly K. Boston Age: 50 Assistant Secretary & Assistant Treasurer | | Officer since 2000; Re-Elected by the Boards annually. | | Staff Attorney of the Adviser; Secretary of the Distributor. | | N/A | | N/A |
Bryce A. Doty Age: 52 Vice President - Investments of U.S. Govt. Fund only. | | Officer since 1996; Re-Elected by the Boards annually. | | Senior Vice President and Senior Portfolio Manager of SF. | | N/A | | N/A |
Paul J. Junquist Age: 57 Vice President - Investments ofTax-Free & MN Tax-Free Funds only. | | Officer since 1996; Re-Elected by the Boards annually. | | Senior Vice President and Senior Portfolio Manager of SF since 2016; Vice President and Portfolio Manager of SF. | | N/A | | N/A |
Michael J. Radmer 50 S. 6th Street Minneapolis, MN 55402 Age: 73 Secretary | | Officer since 1984; Re-Elected by the Boards annually. | | Senior Counsel with the law firm of Dorsey & Whitney, LLP since January 2016; Partner from 1976 to December 2015. | | N/A | | N/A |
Paul E. Rasmussen Age: 58 Vice President, Treasurer & Chief Compliance Officer | | Officer since 1994; Re-Elected by the Boards annually. | | Vice President, Secretary, Controller and Chief Compliance Officer of the Adviser; Vice President, Secretary, and Chief Compliance Officer of SF; President and Treasurer of the Distributor. | | N/A | | N/A |
Carla J. Rose Age: 52 Vice President, Assistant Secretary & Assistant Treasurer | | Officer since 2000; Re-Elected by the Boards annually. | | Vice President, Administration & Deputy Controller of the Adviser; Vice President, Controller, Treasurer & Assistant Secretary of SF; Vice President and Assistant Secretary of the Distributor. | | N/A | | N/A |
| 1 | Directors serve until their death, resignation, removal or the next shareholder meeting at which election of directors is an agenda item and a successor is duly elected and qualified. |
| 2 | Director who is deemed to be an “interested person” of the Funds as that term is defined by the Investment Company Act of 1940. Mr. Sit is considered an “interested person” because he is a director and shareholder of Sit Investment Associates, Inc., the Fund’s investment adviser. |
| 3 | Includes only directorships of companies required to report under the Securities Exchange Act of 1934 (i.e., public companies) or other investment companies registered under the 1940 Act. |
ADDITIONAL INFORMATION (Unaudited)
PROXY VOTING
A description of the policies and procedures that Sit Investment uses to vote proxies related to the Funds’ portfolio securities is set forth in the Funds’ Statement of Additional Information, which is available on the Funds’ website at www.sitfunds.com, without charge by calling800-332-5580 and on the Securities and Exchange Commission’s (SEC) website at www.sec.gov. The Funds’ proxy voting record is available without charge by calling800-332-5580 and on the SEC’s website at www.sec.gov no later than August 31 for the prior 12 months ending June.
QUARTERLY PORTFOLIO SCHEDULES
Each Fund files a complete schedule of investments with the SEC for the first and third quarters of each fiscal year on FormN-PORT. The Funds’ FormN-PORT is available on the SEC’s website at www.sec.gov. Each Fund’s complete schedule of investments, as filed on FormN-PORT, is also available on its website at www.sitfunds.com, or without charge by calling800-332-5580.
RE-APPROVAL OF INVESTMENT MANAGEMENT AGREEMENTS
At their joint meeting held on October 22, 2018, the Boards of Directors of the Sit Mutual Funds unanimously approved the continuation for another one year period the investment management agreements entered into by and between Sit Investment Associates, Inc. (“SIA”) and Sit Mutual Funds II, Inc. dated November 1, 1992; and Sit U.S. Government Securities Fund, Inc. dated November 1, 1992 (the “Agreements”).
The Boards approved the Agreements after a lengthy discussion and consideration of various factors relating to both the Boards’ selection of SIA as the investment adviser and the Boards’ approval of the fees to be paid under the Agreements.
Investment Adviser Criteria.The Directors began their analysis by discussing their criteria for determining the quality of an investment adviser. The Directors’ noted that their analysis is similar to that used by institutional investors in evaluating and selecting investment advisers. The Directors discussed several factors used to determine the overall quality of an investment adviser and the nature, extent and quality of the services performed by SIA, including the following:
Investment Philosophy and Process. The Directors considered SIA’s philosophy of managing assets. With respect to fixed income securities, SIA stresses the consistent attainment of superior risk-adjusted returns using a conservative investment management approach that identifies pricing anomalies in the market and management of portfolio duration.
With respect to fixed income securities, SIA seeks securities with a special emphasis on interest income and significant stability of principal value. SIA’s style seeks to avoid excessive return volatility and generate consistent results over an economic cycle. The Directors noted that the Bond Funds’ objectives are to seek high current income. The Directors reviewed the Bond Funds’ characteristics, and noted that SIA has consistently managed the Bond Funds in this style. The Directors noted that since the Bond Funds emphasize income, they may at times not rank highly in total return comparisons with other funds during certain periods.
The Directors discussed SIA’s consistent and well-defined investment process. With respect to fixed income securities, the portfolio managers are responsible for implementing the strategy set forth in the Chief Fixed Income Officer’s duration targets and the Chief Investment Officer’s interest rate projections.
Investment Professionals. The Directors discussed the experience, knowledge and organizational stability of SIA and its investment professionals. The Directors noted that SIA’s senior professionals are actively involved in the investment process and have significant investment industry experience.
The Directors discussed the depth of SIA’s investment staff. The Directors noted that SIA has over 30 investment professionals. Given the investment products offered by SIA and the assets under management, the Directors determined that SIA’s investment staff is well positioned to meet the current needs of its clients, including the Funds, and to accommodate growth in the number of clients and assets under management for the near future. The Directors concluded that the depth of the investment staff, and in particular senior management and
| | | | |
| | | | |
| | |
68 | | | SIT MUTUAL FUNDS ANNUAL REPORT | |
investment analysts, is actually greater than the Funds currently require at their present asset size. The Directors noted that SIA has the resources of a $13.2 billion dollar investment firm working for the benefit of the Fund shareholders.
Investment Performance. The Directors reviewed and discussed the Funds’ investment performance on an absolute and comparable basis for various periods as discussed below. The Directors noted that the investment performance of the Funds has generally been competitive with indices and other funds with similar investment styles as the Funds, such as fixed income funds seeking to maximize income.
Corporate Culture. The Directors discussed SIA’s corporate values to operate under the highest ethical and professional standards. SIA’s culture is set and practiced by senior management who insist that all professionals exhibit honesty and integrity. The Board noted that the firm’s values are evident in all of the services provided to the Funds.
Review of Specific Factors.The Directors continued their analysis by reviewing specific information on SIA and the Funds and specific terms of the Agreements, including the following.
Investment Performance. The Directors reviewed investment performance of each Fund for 1 month, 3 months, 6 months,year-to-date, 1 year, 5 years (as applicable), 10 years (as applicable) and since inception, both on an absolute basis and on a comparative basis to indices and mutual funds within the same investment categories. As noted above, the Directors concluded that the investment performance of the Funds has been competitive in relation to their stated objectives and strategies on a comparable basis with funds with similar objectives and strategies.
Fees and Expenses. The Directors noted that the Funds pay SIA a monthly fee and SIA is responsible for all of the Funds’ expenses except interest, brokerage commissions and transaction charges and certain extraordinary expenses. The Directors reviewed fees paid in prior years and the fees to be paid under the Agreements.
The Directors compared each Fund’s expense ratio to the average and median expense ratios ofno-load mutual funds within the same Morningstar, Inc. investment category, the average expense ratios for load funds within the Morningstar category, and the average expense ratios for all funds within the Morningstar category. Certain of the Fund’s expense ratios were higher than the averages, and certain of the Fund’s expense ratios were lower than the averages. The Directors noted that the Morningstarno-load categories include funds of various asset sizes, some of which are significantly larger in assets than the Funds. The Directors found that each Fund’s total expense ratio to be within an acceptable range compared to the total expense ratios of otherno-load funds within the Fund’s Morningstar category. The Directors concluded that the fees paid by the Funds are reasonable and appropriate.
The Directors reviewed the extent to which the fees to be paid under the Agreements by each Fund may be affected by an increase in the Fund’s assets, which included reviewing each Fund’s current and historical assets and the likelihood and magnitude of future increases in the Fund’s assets. The Directors agreed that it is appropriate that the Funds benefit from improved economies of scale as the Funds’ assets increase. However, the Directors concluded that given the amount of the Funds’ current assets and the likelihood and magnitude of future increases in the Funds’ assets, negotiating a graduated fee structure is unnecessary at this time since the fees to be paid under the current Agreements are reasonable and appropriate.
The Directors reviewed the expenses paid by SIA relating to the operations of the Funds, and SIA’s income with respect to the management of the Funds for the past two calendar years. The Directors concluded that the expenses paid were appropriate.
The Directors reviewed SIA’s investment advisory fee schedule for investment management services provided to other clients. The Directors compared the services provided to the Funds and other clients of SIA, and recognized that the Funds’ expenses are borne by SIA. The Directors concluded that the fees paid by the Funds in relation to the fees paid by other SIA clients were appropriate and reasonable. The Directors also concluded that SIA’s profit margin with respect to the management of the Funds was appropriate.
The Directors discussed the extent to which SIA receives benefits from the relationship with the Funds such as soft dollar arrangements by which brokers provide research services to SIA as a result of brokerage generated by the Funds. The Board concluded that any benefits SIA receives from its relationship with the Funds are well within industry norms and are reflected in the amount of the fees paid by the Funds to SIA and are appropriate and reasonable.
ADDITIONAL INFORMATION (Unaudited) (Continued)
Non-Advisory Services. The Directors considered the quality ofnon-advisory services which SIA provides to the Funds (and their shareholders) and the quality and depth of SIA’snon-investment personnel who provide such services. Directors concluded that the level of such services and the quality and depth of such personnel are consistent with industry standards.
Finally, the Directors considered the compliance staff and the regulatory history of SIA and the Funds, and concluded that both are consistent with industry standards.
Based on these conclusions, without any single conclusion being dispositive, the Directors determined that renewal of the Agreements was in the interest of each Fund and its shareholders.
| | | | |
| | | | |
70 | | | SIT MUTUAL FUNDS ANNUAL REPORT | |
[This page intentionally left blank.]
[This page intentionally left blank.]
Item 2: Code of Ethics.
The registrant has adopted a code of ethics that applies to the registrant’s principal executive officer, principal financial officer, principal accounting officer, and persons performing similar functions. The registrant has not made any amendment to its code of ethics during the period covered by this report which must be described herein pursuant to Item 2. The registrant has not granted any waivers from any provisions of the code of ethics during the period covered by this report.
A copy of the registrant’s code of ethics is available without charge upon request by calling the registrant at612-332-3223 or1-800-332-5580, or by mail at Sit Mutual Funds, 3300 IDS Center, 80 South Eighth Street, Minneapolis, MN 55402.
Item 3: Audit Committee Financial Expert.
The registrant’s Board of Directors has determined that Mr. Edward M. Giles, Mr. Sidney L. Jones, Mr. Bruce C. Lueck, Mr. Donald W. Phillips, and Mr. Barry N. Winslow are audit committee financial experts serving on its audit committee. Mr. Giles, Mr. Jones, Mr. Lueck, Mr. Phillips, and Mr. Winslow are independent for purposes of this item.
Item 4: Principal Accountant Fees and Services.
(a) – (d) Aggregate fees billed to the registrant for the last two fiscal years for professional services rendered by the registrant’s principal accountant were as follows:
| | | | | | | | | | | | | | | | | | | | | | | | | | | | | | | | |
| | | 2019 | | | 2018 | |
| | | Audit | | | Audit | | | Tax | | | Other | | | Audit | | | Audit | | | Tax | | | Other | |
| | | Fees | | | Related | | | Fees | | | Fees | | | Fees | | | Related | | | Fees | | | Fees | |
Fiscal year ended March 31 | | | | | | | | | | | | | | | | | | | | | | | | | | | | | | | | |
Sit Mutual Funds II, Inc. | | | | | | | | | | | | | | | | | | | | | | | | | | | | | | | | |
SitTax-Free Income Fund (series A) | | $ | 27,625 | | | $ | 0 | | | $ | 5,600 | | | $ | 0 | | | $ | 31,000 | | | $ | 0 | | | $ | 5,430 | | | $ | 0 | |
Sit MinnesotaTax-Free Income Fund (series B) | | $ | 27,625 | | | $ | 0 | | | $ | 5,600 | | | $ | 0 | | | $ | 29,800 | | | $ | 0 | | | $ | 5,430 | | | $ | 0 | |
Sit Quality Income Fund (Series E) | | $ | 27,625 | | | $ | 0 | | | $ | 5,600 | | | $ | 0 | | | $ | 18,300 | | | $ | 0 | | | $ | 5,430 | | | $ | 0 | |
| | | | | | | | | | | | | | | | | | | | | | | | | | | | | | | | |
Total Mutual Funds II, Inc. | | $ | 82,875 | | | $ | 0 | | | $ | 16,800 | | | $ | 0 | | | $ | 79,100 | | | $ | 0 | | | $ | 16,290 | | | $ | 0 | |
Audit fees include amounts related to the audit of the registrant’s annual financial statements and services normally provided by the accountant in connection with statutory and regulatory filings. Audit-related fees include amounts reasonably related to the performance of the audit of the registrant’s financial statements, and/or are traditionally performed by the auditor. Tax fees include amounts related to tax compliance, tax planning, and tax advice.
(e) (1) The Audit Committee is required topre-approve audit andnon-audit services performed for the registrant by the independent auditor in order to assure that the provision of such services does not impair the auditor’s independence. The audit committee also is required topre-approve certainnon-audit services performed by the registrant’s independent auditor for the registrant’s investment adviser and certain of the adviser’s affiliates if the services relate directly to the operations and financial reporting of the registrant. Services to be provided by the auditor must receive generalpre-approval or specificpre-approval by the audit committee. Any proposed services exceedingpre-approved cost levels will require separatepre-approval by the audit committee.
The audit committee may delegatepre-approval authority to the audit committee chairman. The chairman shall report anypre-approval decisions to the audit committee at its next scheduled meeting. The audit committee does not delegate its responsibility topre-approve services performed by the independent auditor to management.
(2) No services included in (b) – (d) were approved pursuant to paragraph (c)(7)(i)(C) of Rule2-01 of RegulationS-X.
(f) Not applicable.
(g) The aggregate fees billed for the most recent fiscal year and the preceding fiscal year by the registrant’s principal accountant fornon-audit services rendered to the registrant, its investment adviser, and any entity controlling, controlled by, or under common control with the investment adviser that provides ongoing services to the registrant were $0 and $0 respectively.
(h) The registrant’s audit committee has determined that the provision ofnon-audit services rendered to the registrant’s investment adviser, and any entity controlling, controlled by, or under common control with the investment adviser that provides ongoing services to the registrant, that were notpre-approved pursuant to paragraph (c)(7)(ii) of Rule2-01 of RegulationS-X is considered compatible with maintaining the principal accountant’s independence.
Item 5: Audit Committee of Listed Registrants.
Not applicable toopen-end investment companies.
Item 6: Schedule of Investments.
The schedule of investments is included as part of the report to shareholders filed under Item 1 of this Form.
Item 7: Disclosure of Proxy Voting Policies and Procedures forClosed-End Management Investment Companies.
Not applicable toopen-end investment companies.
Item 8: Portfolio Managers ofClosed-End Management Investments Companies.
Not applicable toopen-end investment companies.
Item 9: Purchases of Equity Securities byClosed-End Management Investment Company and Affiliated Purchasers.
Not applicable toopen-end investment companies.
Item 10. Submission of Matters to a vote of Security Holders.
There have been no material changes to the procedures by which shareholders may recommend nominees to the registrant’s board of directors.
Item 11: Controls and Procedures -
(a) Based on their evaluation of the Registrant’s Disclosure Controls and Procedures as of a date within 90 days of the Filing Date, the Registrant’s Chairman and Treasurer have determined that the Disclosure Controls and Procedures (as defined in Rule30a-2(c) under the Act) are designed to ensure that information required to be disclosed by the Registrant is recorded, processed, summarized and reported by the filing Date, and that information required to be disclosed in the report is communicated to the Registrant’s management, as appropriate, to allow timely decisions regarding required disclosure.
(b) There were no significant changes in the Registrant’s internal controls or in other factors that could significantly affect these controls subsequent to the date of their evaluation, and there were no corrective actions with regard to significant deficiencies and material weaknesses.
Item 12: Exhibits:
(a) The following exhibits are attached to this FormN-CSR:
(2) A separate certification for each principal executive and principal financial officer of the registrant as required by Rule30a-2(a) under the Act (17 CFR270.30a-2) (certification required by Section 302 of the Sarbanes-Oxley Act of 2002).
(b) Certification required by Rule30a-2(b) under the Act (certification required by Section 906 of the Sarbanes-Oxley Act of 2002).
SIGNATURES
Pursuant to the requirements of the Securities Exchange Act of 1934 and the Investment Company Act of 1940, the registrant has duly caused this report to be signed on its behalf by the undersigned, thereunto duly authorized.
Sit Mutual Funds II, Inc.
| | | | |
| By (Signature and Title)* | | /s/ Paul E. Rasmussen | | |
| | Paul E. Rasmussen | | |
| | Vice President, Treasurer | | |
Date May 22, 2019
Pursuant to the requirements of the Securities Exchange Act of 1934 and the Investment Company Act of 1940, this report has been signed below by the following persons on behalf of the registrant and in the capacities and on the dates indicated.
| | | | |
| By (Signature and Title) | | /s/ Paul E. Rasmussen | | |
| | Paul E. Rasmussen | | |
| | Vice President, Treasurer | | |
| | |
Date May 22, 2019 | | | | |
| | |
| By (Signature and Title) | | /s/ Roger J. Sit | | |
| | Roger J. Sit | | |
| | Chairman | | |
Date May 22, 2019 | | | | |