UNITED STATES
SECURITIES AND EXCHANGE COMMISSION
Washington, D.C. 20549
FORM N-CSR
CERTIFIED SHAREHOLDER REPORT OF REGISTERED
MANAGEMENT INVESTMENT COMPANIES
Investment Company Act file number: 811-04033
Sit Mutual Funds II, Inc.
(Exact name of registrant as specified in charter)
3300 IDS Center
80 South Eighth Street
Minneapolis, MN 55402
(Address of principal executive offices)
Paul E. Rasmussen, VP Treasurer
Sit Mutual Funds, Inc.
3300 IDS Center
80 South Eighth Street
Minneapolis, MN 55402
(Name and address of agent for service)
Registrant’s telephone number, including area code:
(612) 332-3223
Date of fiscal year end: March 31, 2021
Date of reporting period: March 31, 2021
| Item 1: | Reports to Stockholders |

| | |
Sit Mutual Funds BOND FUNDS ANNUAL REPORT TABLE OF CONTENTS | | |
This document must be preceded or accompanied by a Prospectus.
CHAIRMAN’S LETTER
May 5, 2021
Dear fellow shareholders:
It is hard to imagine just over a year ago that the world would experience the worst pandemic in over a century causing global economies to shut down. Challenges that investors felt were insurmountable a year ago became trivial in comparison to the pandemic. The year 2020 will go down in history as one that the world would prefer to forget.
The total number of cases of the COVID-19 virus were approximately 130 million at the end of March 2021, and 2.8 million of those cases proved to be fatal. All hope was not lost as the world came together against a common enemy, the COVID-19 virus. Companies scrambled to be the first to produce lifesaving vaccines, but in the interim, the world had to learn several new phrases such as “social distance” and “flatten the curve.” Most underestimated how quickly this virus could spread, which led to waves of infections from one country to the next. Countries tried to learn from one another by imposing closures policies and strict mask mandates, which created a “playbook” to combat the deadly virus. Each month that passed, the vaccine developments and trials provided glimmers of hope that normalcy could return in the not-too-distant future.
Investors paid close attention to vaccine developments in the later part of the year. As one could expect, market volatility during that time increased significantly, but positive developments outweighed the negative. Preliminary results of vaccine trials surpassed all expectations with efficacy in the 90-95% range. It was a remarkable feat to accomplish, not only the efficacy but the time in which it was done. The first vaccination in the U.S. occurred in December of 2020, which was within a year of when COVID-19 first gained a foothold domestically. The ramp up in vaccination production as well as the roll-out to the population have been intensely scrutinized and grossly underestimated. At first, governments scrambled to secure doses of the vaccines, but then had to turn their focus on who should get doses first. First responders, elderly, and those with pre-existing conditions saw first doses of vaccines when they were in short supply. Governments then began scaling back by age tier, but soon opened the vaccine to age groups where cases were increasing the most. Future growth in the economy will be dictated by vaccine distribution and the pace at which people are vaccinated.
The U.S. economy was solid prior to the pandemic, only to experience the worst quarter-over-quarter contraction in history. Unemployment rates went from a 50-year low of 3.5% in February 2020 to 14.8% by April 2020, resulting in quarterly GDP contracting -31.4% in the second quarter. What tailwinds that existed from the low unemployment rates, and the U.S. and China trade deals, were all overwhelmed by the headwinds of the response to the COVID-19 virus and staggeringly high unemployment rates. As a result, the U.S. government scrambled to provide stimulus checks to the population to assist in these perilous times. As states began to flatten the curve, re-openings of businesses sparked the largest quarterly economic rebound in history. Quarterly GDP growth reached +33.4% in the third quarter of 2020. Despite the strong rebound, the U.S. economy had still contracted -3.5% for all of 2020. Forecasts for 2021 look
much more promising as economists expect yearly GDP growth to exceed 6%.
Do Whatever it Takes
The Federal Reserve (Fed) had its hands full during the year. The Fed did an about face regarding most of its policies. Conversations of how to taper purchase programs and increase the Fed Funds rate quickly turned to how to expand purchase programs and cut the Fed Funds rate. The Fed Funds rate reached a high of 2.50% in 2019 only to be slashed to 0 - 0.25% by March of 2020. The Fed not only expanded its existing purchase program of mortgage and treasury securities, but added programs allowing it to buy corporate, municipal, and commercial mortgage-backed securities and more. Several of these programs have ceased over the year due to stabilization in the economy, however, the Fed continues to buy $120 billion per month; $80 billion of Treasury securities and $40 billion of agency mortgage-backed securities. The Fed’s balance sheet has ballooned to previously unimaginable heights reaching $7.1 trillion by the end of March 2021. The “do whatever it takes” approach provided stability to reeling financial markets, creating one of the largest risk-on environments investors have ever seen.
However, doing whatever it takes to stabilize markets comes at a cost. The Fed announced in late August 2020 that it would allow inflation to run above its longstanding 2.00% target. The widely criticized “dot plots” of Fed members projects short rates near zero until at least 2023, which adds fuel to the inflation expectations fire. The lack of global travel and countries shutting down their borders made it increasingly difficult to get goods. Many ports were understaffed leading to delays in delivery times. Some prices skyrocketed as a result. Spiking energy and commodity prices are also putting upward pressure on shipping costs as global supply chains resume after prolonged shutdowns. Trade deficits jumped to record highs in February 2021, as the U.S. economic activity rebounded at a quicker rate than global competitors. These inflationary pressures will continue as economies re-open globally.
Congress also pulled out all the stops as it relates to fiscal policy to stabilize the economy. Throughout the course of the year, the government passed several relief packages aimed to support individuals and businesses across the nation. Many individuals received benefits including extra unemployment compensation for those who lost their jobs, three stimulus checks, and delayed mortgage and student loan repayments, to name a few. States received massive relief payments to help with testing, unemployment benefits and other shortfalls. Large and small companies were able to receive relief payments to improve solvency. The staggering $12.8 trillion total relief payments to date has contributed to the much-improved intermediate economic outlook.
It has been a wild ride for U.S. treasury yields as well. Yields declined sharply due to an initial flight to quality from stocks to Treasury bonds, but then, as liquidity dried up, investors began selling whatever they could, including treasury bonds. Massive open-end and ETF outflows exacerbated the already stressed marketplace. As the
| | | | |
| | | | |
2 | | | SIT MUTUAL FUNDS ANNUAL REPORT | |
Fed and U.S. government took measures to stabilize the economy, investors began to feel much more confident and went from flight-to-cash environment to risk-on environment. Spreads on credit sensitive securities that had massive spikes to levels not seen since 2008 have since reversed to near historic lows. The overall yield curve saw short rates decline due to the Fed Funds rate being anchored in the 0-0.25% range, while intermediate to longer term rates rebounded this year due to strength of the economic recovery and increased inflation expectations.
Strategy
Overall, emotional overreactions caused several dislocations in the market thereby providing intermediate to long-term investment opportunities. We remain optimistic regarding growth prospects as global vaccine distributions accelerate and consumers resume normal activities. In the longer-term, the economy will eventually need to adjust from the removal of historic levels of government deficit spending to an environment of higher taxes, lower fiscal spending, and greater levels of regulation as a result of the new majority held Democratic government. The inevitable slowdown likely to be felt by the economy from disappearing relief payments should help curb inflation concerns. Employment growth will likely slow as head-winds regarding rising minimum wage laws come to fruition.
While the Fed was implementing its purchase programs, the Sit Quality Income Fund invested heavily in securities that would benefit. Such securities include investment grade corporate bonds, money market securities, agency mortgage bonds, asset-backed bonds, and more. As these programs wound down in August, the focus shifted to inflation protected treasury securities to help mitigate price and inflation risk. Furthermore, we are looking to take advantage of any dislocations as our longer-term view is for improved economic activity
in 2021. The Fund will also be positioned defensively against a potentially higher than expected increase in inflation. Within the Sit U.S. Government Securities Fund, we continue to position the Fund defensively while maintaining the Fund’s focus on seasoned, high coupon agency mortgage securities which provide a high level of income with relatively stable prices.
Tax-exempt bonds will likely see support in the upcoming year with the prospect of increased taxes. The Biden administration plans to increase corporate tax rates as well as individual tax rates on high income earners. The increase in taxes should continue to push investors to tax-exempt securities. Although spreads on tax-exempt securities could tighten further, we believe most has already occurred. Close attention will be paid on how state and local government finances were impacted during the pandemic, but we believe the long-term prospects look favorable.
In conclusion, investors should maintain a diversified portfolio of stocks and bonds underpinned by strong fundamentals to help manage risk in challenging market conditions. We appreciate your continued interest in the Sit family of funds. Please see our complete Outlook and Strategy research paper at www.sitfunds.com.
With best wishes,

Roger J. Sit
Chairman and President Sit Mutual Funds
|
|
| |
Sit U.S. Government Securities Fund - Class S and Class Y |
OBJECTIVE & STRATEGY
The objective of the U.S. Government Securities Fund is to provide high current income and safety of principal, which it seeks to attain by investing solely in debt obligations issued, guaranteed or insured by the U.S. government or its agencies or its instrumentalities. Agency mortgage securities and U.S. Treasury securities are the principal holdings in the Fund. The mortgage securities that the Fund purchases consist of pass-through securities including those issued by Government National Mortgage Association (GNMA), Federal National Mortgage Association (FNMA), and Federal Home Loan Mortgage Corporation (FHLMC).
Fund Performance
The Sit U.S. Government Securities Fund (Class S) provided a return of +0.44% during the 12-month period ending March 31, 2021, compared to the return of the Bloomberg Barclays Intermediate Government Bond Index of -1.20%. The Fund’s 30-day SEC yield was 1.82% and its 12-month distribution rate was 1.24%.
Factors that Influenced the Fund’s Performance
During the 12-month period, the Fund benefited from the consistent relatively high level of income provided by its holdings in higher coupon government agency mortgages. U.S. Treasury securities steepened with intermediate to longer maturities increasing in yield and shorter maturity securities decreasing in yield. The Fund performed well in this environment as the income more than offset the negative price performance. In addition, the Fund continued to experience relatively stable prepayment rates as the mortgage holdings are generally well seasoned and have been through many refinancing cycles. The Fund reduces interest rate risk by using futures and options on Treasury securities. The use of futures and options was effective in providing stability to the Fund’s net asset value and contributed positively to the return.
Outlook and Positioning
The year began with one of the worst economic downturns since the Great Depression due to widespread infections of the COVID-19 virus. Over the course of the year, the U.S. had to endure several waves of increasing infections in different states across the nation. During that time, companies were scrambling to create a safe and effective vaccine to combat the virus. As positive developments regarding these vaccines occurred, consumers continued to spend at a healthy clip as overall confidence began to turn positively. Several consumers received three different stimulus checks throughout the year for assistance during these unprecedented times. The Federal Reserve continued to buoy the market by keeping the Fed Funds rate at 0-0.25% and its ongoing asset purchase program. The Federal Reserve concluded its purchase program of investment grade corporate bonds but continues its purchases of mortgage and treasury securities. Investors will be watching inflation closely as expectations have risen to levels not seen since 2018. Fannie Mae and Freddie Mac announced
HYPOTHETICAL GROWTH OF $10,000
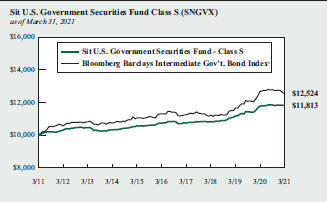
The chart above illustrates the total value of a hypothetical $10,000 investment in the Fund over the past 10 years (or for the life of the Fund if shorter) as compared to the performance of the Bloomberg Barclays Intermediate Government Bond Index. Past performance does not guarantee future results. Returns include the reinvestment of distributions. The chart does not reflect the deduction of taxes that a shareholder would pay on Fund distributions or the redemption of Fund shares.
1 The Bloomberg Barclays Intermediate Government Bond Index is a sub-index of the Bloomberg Barclays Government Bond Index covering issues with remaining maturities of between three and five years. The Bloomberg Barclays Government Bond Index is an index that measures the performance of all public U.S. government obligations with remaining maturities of one year or more. The returns include the reinvestment of income and do not include any transaction costs, management fees or other costs. It is not possible to invest directly in an index. This is the Fund’s primary index.
a joint policy adjustment to extend the buyout timeline for delinquent loans from 4 months to 24 months to allow additional time for borrowers to cure delinquencies. As a result, we expect mortgage yield spreads to continue to narrow as any buyouts will be delayed and investors continue to be starved for yield. The Fund’s high coupon mortgages should continue to produce an income advantage in this environment as prepayments are likely to remain stable.
We continue to position the Fund opportunistically as concerns regarding COVID-19 virus wane while maintaining the Fund’s focus on seasoned, high coupon agency mortgage securities which provide a high level of income with relatively stable prices. This high level of income and stability of principal has been a fundamental focus of the Fund since its inception.
| | |
Bryce A. Doty, CFA | | Mark H. Book, CFA |
Senior Portfolio Manager | | Portfolio Manager |
| | |
| Information on this page is unaudited |
4 | | SIT MUTUAL FUNDS ANNUAL REPORT |
COMPARATIVE RATES OF RETURNS
| | | | | | | | | | | | | | | | |
| as of March 31, 2021 | | | | | | | | | | | | |
| | | Sit U.S.
Government
Securities Fund | | | Bloomberg
Barclays
Inter. Gov’t Bond Index1 | | | Lipper
U.S.
Gov’t Fund Index2 | |
| | | Class S | | | Class Y | |
One Year | | | 0.44% | | | | 0.72% | | | | -1.20% | | | | -2.54% | |
Five Years | | | 1.94 | | | | n/a | | | | 2.07 | | | | 2.51 | |
Ten Years | | | 1.68 | | | | n/a | | | | 2.28 | | | | 2.98 | |
Since Inception-Class S (6/2/87) | | | 5.05 | | | | n/a | | | | 5.26 | | | | 5.19 | |
Since Inception-Class Y (1/1/20) | | | n/a | | | | 3.15 | | | | 3.12 | | | | n/a | |
| | | | | | | | | | | | | | | | |
Performance figures are historical and do not guarantee future results. Investment returns and principal value will vary, and you may have a gain or loss when you sell shares. Current performance may be lower or higher than the performance data quoted. Contact the Fund for performance data current to the most recent month-end. Returns include changes in share price as well as reinvestment of all dividends and capital gains and all fee waivers. Without the fee waivers total return and yield figures would have been lower. Returns do not reflect the deduction of taxes that a shareholder would pay on Fund distributions or the redemption of Fund shares. Management fees and administrative expenses are included in the Fund’s performance. Returns for periods greater than one year are compounded average annual rates of return.
1 The Bloomberg Barclays Intermediate Government Bond Index is a sub-index of the Bloomberg Barclays Government Bond Index covering issues with remaining maturities of between three and five years. The Bloomberg Barclays Government Bond Index is an index that measures the performance of all public U.S. government obligations with remaining maturities of one year or more. The returns include the reinvestment of income and do not include any transaction costs, management fees or other costs. It is not possible to invest directly in an index.
2 The Lipper returns are obtained from Lipper Analytical Services, Inc., a large independent evaluator of mutual funds.
FUND DIVERSIFICATION
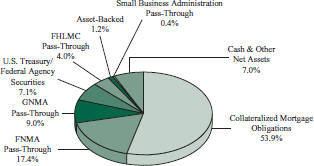
Based on total net assets as of March 31, 2021. Subject to change.
PORTFOLIO SUMMARY
| | | | |
Class S: | | | | |
Net Asset Value 3/31/21: | | $11.17 Per Share | | |
Net Asset Value 3/31/20: | | $11.26 Per Share | | |
Total Net Assets: | | $398.8 Million | | |
Class Y: | | | | |
Net Asset Value 3/31/21: | | $11.17 Per Share | | |
Net Asset Value 3/31/20: | | $11.26 Per Share | | |
Total Net Assets: | | $128.4 Million | | |
| | |
Effective Duration3: | | 1.9 Years | | |
3 Duration is a measure of estimated price sensitivity relative to changes in interest rates. Portfolios with longer durations are typically more sensitive to changes in interest rates. For example, if interest rates rise by 1%, the fair value of a security with an effective duration of 5 years would decrease by 5%, with all other factors being constant. The correlation between duration and price sensitivity is greater for securities rated investment-grade than it is for securities rated below investment-grade. Duration estimates are based on assumptions by the Adviser and are subject to a number of limitations. Effective duration is calculated based on historical price changes of securities held by the Fund, and therefore is a more accurate estimate of price sensitivity provided interest rates remain within their historical range.
| | | | |
ESTIMATED AVERAGE LIFE | | | | |
| |
0-1 Year | | | 6.8% | |
1-5 Years | | | 88.6 | |
5-10 Years | | | 3.1 | |
10-20 Years | | | 1.2 | |
20+ Years | | | 0.3 | |
| | | | | |
The table represents the Adviser’s estimates of the dollar weighted average life of the portfolio’s securities, which differ from their stated maturities. The Fund’s average stated maturity was 17.9 years as of March 31, 2021.
| | |
| Information on this page is unaudited |
| MARCH 31, 2021 | | 5 |
SCHEDULE OF INVESTMENTS
March 31, 2021
Sit U.S. Government Securities Fund
| | | | | | | | | | |
Principal
Amount ($) | | Coupon Rate (%) | | Maturity
Date | | | Fair
Value ($) | |
| |
Mortgage Pass-Through Securities - 30.8% | | | | | |
Federal Home Loan Mortgage Corporation - 4.0% | | | | | |
88,608 | | 4.00 | | | 7/1/25 | | | | 94,329 | |
686,171 | | 5.00 | | | 5/1/42 | | | | 775,415 | |
1,519,439 | | 5.50 | | | 8/1/49 | | | | 1,775,062 | |
50,519 | | 5.82 | | | 10/1/37 | | | | 56,681 | |
389,609 | | 6.50 | | | 12/1/34 | | | | 449,765 | |
1,400,066 | | 6.50 | | | 11/1/35 | | | | 1,596,522 | |
1,731,668 | | 6.50 | | | 9/1/39 | | | | 1,987,847 | |
179,549 | | 6.88 | | | 2/17/31 | | | | 205,521 | |
43,409 | | 7.00 | | | 8/1/27 | | | | 44,837 | |
488,214 | | 7.00 | | | 4/1/28 | | | | 531,454 | |
3,395,493 | | 7.00 | | | 12/1/31 | | | | 3,878,166 | |
429,078 | | 7.00 | | | 2/1/37 | | | | 484,947 | |
305,281 | | 7.00 | | | 4/1/37 | | | | 364,579 | |
4,432,393 | | 7.00 | | | 10/1/37 | | | | 5,157,980 | |
2,242,307 | | 7.00 | | | 10/1/38 | | | | 2,644,090 | |
38,284 | | 7.38 | | | 12/17/24 | | | | 39,520 | |
60,692 | | 7.50 | | | 1/1/31 | | | | 62,355 | |
353,124 | | 7.50 | | | 1/1/32 | | | | 408,396 | |
213,981 | | 7.50 | | | 8/1/32 | | | | 234,792 | |
7,512 | | 7.95 | | | 10/1/25 | | | | 7,542 | |
3,465 | | 7.95 | | | 11/1/25 | | | | 3,476 | |
18,364 | | 8.00 | | | 5/1/31 | | | | 18,440 | |
54,270 | | 8.00 | | | 11/1/36 | | | | 64,135 | |
96,669 | | 8.00 | | | 1/1/37 | | | | 115,647 | |
32,527 | | 8.50 | | | 12/1/21 | | | | 33,000 | |
91,776 | | 8.50 | | | 6/20/27 | | | | 104,541 | |
20,795 | | 8.50 | | | 12/1/29 | | | | 22,761 | |
83,053 | | 8.50 | | | 3/1/31 | | | | 96,051 | |
17,317 | | 9.00 | | | 3/20/27 | | | | 17,434 | |
45,686 | | 9.00 | | | 2/17/31 | | | | 45,893 | |
36,407 | | 9.00 | | | 5/1/31 | | | | 38,374 | |
665 | | 9.50 | | | 12/17/21 | | | | 664 | |
69 | | 10.00 | | | 3/17/25 | | | | 69 | |
3 | | 10.00 | | | 3/25/25 | | | | 3 | |
1,091 | | 10.00 | | | 7/1/30 | | | | 1,096 | |
| | | | | | | | | | |
| | | |
| | | | | | | | | 21,361,384 | |
| | | | | | | | | | |
Federal National Mortgage Association - 17.4% | | | | | |
3,100,000 | | 2.48 | | | 2/1/35 | | | | 3,140,359 | |
3,100,000 | | 2.68 | | | 2/1/35 | | | | 3,174,209 | |
5,596,252 | | 2.93 | | | 12/1/24 | | | | 5,698,603 | |
3,219,368 | | 4.50 | | | 4/1/48 | | | | 3,556,356 | |
1,784,009 | | 5.00 | | | 9/1/43 | | | | 2,089,585 | |
11,401,049 | | 5.00 | | | 2/1/49 | | | | 13,208,334 | |
584,535 | | 5.00 | | | 6/1/51 | | | | 677,972 | |
369,201 | | 5.50 | | | 6/1/33 | | | | 409,110 | |
5,010,694 | | 5.50 | | | 12/1/41 | | | | 5,956,332 | |
3,330,062 | | 5.50 | | | 1/1/49 | | | | 3,888,953 | |
2,355,930 | | 5.50 | | | 5/1/49 | | | | 2,642,908 | |
1,614,364 | | 5.50 | | | 4/1/50 | | | | 1,806,772 | |
864,745 | | 5.93 | | | 5/1/35 | | | | 864,408 | |
457,417 | | 6.00 | | | 11/1/34 | | | | 546,502 | |
| | | | | | | | | | |
Principal
Amount ($) | | Coupon Rate (%) | | Maturity
Date | | | Fair
Value ($) | |
139,026 | | 6.00 | | | 5/1/37 | | | | 157,426 | |
56,147 | | 6.00 | | | 9/1/37 | | | | 61,211 | |
1,643,623 | | 6.00 | | | 4/1/38 | | | | 1,954,390 | |
450,248 | | 6.00 | | | 2/1/40 | | | | 520,563 | |
4,846,107 | | 6.00 | | | 5/1/41 | | | | 5,788,986 | |
1,930,485 | | 6.01 | | | 11/1/43 | | | | 2,225,748 | |
1,266 | | 6.50 | | | 1/1/22 | | | | 1,269 | |
1,157,929 | | 6.50 | | | 2/1/29 | | | | 1,299,693 | |
150,800 | | 6.50 | | | 3/1/29 | | | | 162,503 | |
3,012,943 | | 6.50 | | | 12/1/30 | | | | 3,435,982 | |
248,123 | | 6.50 | | | 6/1/31 | | | | 283,634 | |
355,096 | | 6.50 | | | 4/1/32 | | | | 404,683 | |
51,554 | | 6.50 | | | 8/1/34 | | | | 58,215 | |
345,577 | | 6.50 | | | 11/1/34 | | | | 390,605 | |
724,559 | | 6.50 | | | 12/1/36 | | | | 837,919 | |
228,234 | | 6.50 | | | 1/1/39 | | | | 251,565 | |
2,508,048 | | 6.50 | | | 6/1/40 | | | | 2,915,123 | |
1,157,983 | | 6.50 | | | 9/1/40 | | | | 1,332,806 | |
1,012,703 | | 6.75 | | | 6/1/32 | | | | 1,201,419 | |
775,446 | | 6.86 | | | 6/1/40 | | | | 891,894 | |
2,932 | | 7.00 | | | 9/1/21 | | | | 2,947 | |
18,512 | | 7.00 | | | 3/1/22 | | | | 18,786 | |
21,180 | | 7.00 | | | 6/1/22 | | | | 21,568 | |
7,922 | | 7.00 | | | 1/1/24 | | | | 7,979 | |
20,490 | | 7.00 | | | 2/1/26 | | | | 21,953 | |
60,477 | | 7.00 | | | 9/1/27 | | | | 65,470 | |
32,516 | | 7.00 | | | 10/1/27 | | | | 35,579 | |
124,394 | | 7.00 | | | 11/1/27 | | | | 137,888 | |
27,456 | | 7.00 | | | 1/1/28 | | | | 29,874 | |
23,943 | | 7.00 | | | 10/1/32 | | | | 26,179 | |
3,270,831 | | 7.00 | | | 12/1/32 | | | | 3,872,216 | |
85,627 | | 7.00 | | | 7/1/33 | | | | 96,415 | |
97,494 | | 7.00 | | | 7/1/34 | | | | 110,846 | |
10,844 | | 7.00 | | | 12/1/37 | | | | 12,207 | |
1,859,006 | | 7.00 | | | 3/1/39 | | | | 2,254,726 | |
4,123,178 | | 7.00 | | | 1/1/40 | | | | 4,790,671 | |
458,202 | | 7.00 | | | 9/1/47 | | | | 493,134 | |
5,696 | | 7.50 | | | 6/1/22 | | | | 5,733 | |
5,672 | | 7.50 | | | 12/1/22 | | | | 5,723 | |
13,098 | | 7.50 | | | 3/1/23 | | | | 13,239 | |
95,977 | | 7.50 | | | 4/1/32 | | | | 108,056 | |
9,704 | | 7.50 | | | 8/1/32 | | | | 10,006 | |
135,193 | | 7.50 | | | 1/1/34 | | | | 151,630 | |
2,884,350 | | 7.50 | | | 10/1/38 | | | | 3,402,178 | |
1,280,328 | | 7.50 | | | 11/1/38 | | | | 1,526,489 | |
10,111 | | 7.66 | | | 7/20/30 | | | | 10,247 | |
5,410 | | 7.97 | | | 8/20/25 | | | | 5,477 | |
20,927 | | 8.00 | | | 10/1/23 | | | | 21,005 | |
121,301 | | 8.00 | | | 6/1/25 | | | | 130,030 | |
4,861 | | 8.00 | | | 7/20/28 | | | | 4,930 | |
66,867 | | 8.00 | | | 2/1/31 | | | | 77,318 | |
142,307 | | 8.00 | | | 1/1/32 | | | | 156,007 | |
56,545 | | 8.00 | | | 11/1/37 | | | | 67,438 | |
| | | | |
See accompanying notes to financial statements. | | | | |
6 | | | SIT MUTUAL FUNDS ANNUAL REPORT | |
| | | | | | | | | | |
Principal
Amount ($) | | Coupon Rate (%) | | Maturity
Date | | | Fair
Value ($) | |
313,275 | | 8.00 | | | 3/1/38 | | | | 382,568 | |
63,074 | | 8.13 | | | 11/15/31 | | | | 71,345 | |
66,954 | | 8.50 | | | 11/1/26 | | | | 70,389 | |
59,787 | | 8.50 | | | 3/1/28 | | | | 62,736 | |
36,901 | | 8.50 | | | 10/1/28 | | | | 41,702 | |
2,395 | | 8.50 | | | 11/1/28 | | | | 2,406 | |
120,094 | | 8.50 | | | 4/1/29 | | | | 135,349 | |
36,918 | | 8.50 | | | 10/1/29 | | | | 37,264 | |
66,482 | | 8.50 | | | 7/1/30 | | | | 78,131 | |
45,036 | | 8.50 | | | 8/1/30 | | | | 54,757 | |
150,243 | | 8.50 | | | 4/1/32 | | | | 184,941 | |
150,527 | | 8.50 | | | 1/1/37 | | | | 173,623 | |
7,425 | | 9.00 | | | 9/1/24 | | | | 7,518 | |
2,137 | | 9.00 | | | 6/15/25 | | | | 2,166 | |
21,884 | | 9.00 | | | 5/15/28 | | | | 22,258 | |
19,902 | | 9.00 | | | 6/1/30 | | | | 20,328 | |
10,592 | | 9.00 | | | 10/1/30 | | | | 11,660 | |
70,693 | | 9.00 | | | 2/1/31 | | | | 73,824 | |
19,598 | | 9.00 | | | 7/1/31 | | | | 19,668 | |
27,165 | | 9.00 | | | 10/1/31 | | | | 31,663 | |
62,671 | | 9.00 | | | 8/1/37 | | | | 66,119 | |
23,069 | | 9.00 | | | 1/1/38 | | | | 23,272 | |
158,567 | | 9.00 | | | 2/1/38 | | | | 175,325 | |
16,419 | | 9.50 | | | 8/1/24 | | | | 16,612 | |
104,495 | | 9.50 | | | 5/1/29 | | | | 119,750 | |
15,112 | | 9.50 | | | 4/1/30 | | | | 16,811 | |
119,059 | | 9.50 | | | 8/1/31 | | | | 137,261 | |
25,083 | | 10.00 | | | 2/1/28 | | | | 25,475 | |
82,302 | | 10.00 | | | 6/1/30 | | | | 93,623 | |
| | | | | | | | | | |
| | | |
| | | | | | | | | 91,688,525 | |
| | | | | | | | | | |
Government National Mortgage Association - 9.0% | | | | | |
110,038 | | 4.00 | | | 12/15/24 | | | | 116,986 | |
437,457 | | 4.00 | | | 10/20/30 | | | | 484,180 | |
7,934,440 | | 4.00 | | | 8/20/31 | | | | 8,650,285 | |
827,020 | | 4.00 | | | 12/20/31 | | | | 915,673 | |
638,681 | | 4.25 | | | 10/20/31 | | | | 708,168 | |
342,026 | | 4.25 | | | 3/20/37 | | | | 373,182 | |
1,798,998 | | 4.75 | | | 9/20/31 | | | | 2,043,542 | |
6,482,596 | | 5.00 | | | 12/15/45 | | | | 7,877,877 | |
1,924,116 | | 5.00 | | | 7/20/49 | | | | 2,111,449 | |
68,458 | | 5.50 | | | 9/15/25 | | | | 74,290 | |
823,893 | | 5.50 | | | 5/15/29 | | | | 928,430 | |
1,941,725 | | 5.75 | | | 2/15/29 | | | | 2,163,459 | |
664,860 | | 5.75 | | | 10/20/31 | | | | 747,242 | |
394,307 | | 6.00 | | | 9/15/33 | | | | 443,000 | |
298,426 | | 6.00 | | | 2/20/47 | | | | 351,197 | |
2,923,612 | | 6.00 | | | 7/20/47 | | | | 3,426,368 | |
30,992 | | 6.25 | | | 12/15/23 | | | | 33,962 | |
605,638 | | 6.25 | | | 4/15/29 | | | | 677,775 | |
66,419 | | 6.50 | | | 11/15/23 | | | | 69,892 | |
215,633 | | 6.50 | | | 4/15/24 | | | | 226,684 | |
656,921 | | 6.50 | | | 2/20/28 | | | | 742,911 | |
250,904 | | 6.50 | | | 2/20/29 | | | | 271,241 | |
| | | | | | | | | | |
Principal
Amount ($) | | Coupon Rate (%) | | Maturity
Date | | | Fair
Value ($) | |
434,022 | | 6.50 | | | 7/20/34 | | | | 521,531 | |
2,351,511 | | 6.50 | | | 2/15/35 | | | | 2,719,160 | |
16,482 | | 6.50 | | | 12/20/38 | | | | 17,916 | |
227,602 | | 6.50 | | | 1/20/39 | | | | 268,425 | |
125,762 | | 6.50 | | | 2/20/39 | | | | 150,434 | |
262,420 | | 6.50 | | | 4/20/39 | | | | 307,895 | |
313,449 | | 6.50 | | | 6/20/39 | | | | 362,979 | |
506,794 | | 6.50 | | | 8/20/39 | | | | 597,726 | |
315,968 | | 6.50 | | | 4/20/43 | | | | 375,773 | |
3,566,657 | | 7.00 | | | 8/15/29 | | | | 4,107,891 | |
3,727,260 | | 7.00 | | | 10/15/29 | | | | 4,301,910 | |
191,944 | | 7.00 | | | 10/15/36 | | | | 215,727 | |
| | | | | | | | | | |
| | | |
| | | | | | | | | 47,385,160 | |
| | | | | | | | | | |
Small Business Administration - 0.4% | | | | | |
1,374,110 | | 5.33 | | | 8/25/36 | | | | 1,480,413 | |
685,872 | | 5.33 | | | 9/25/36 | | | | 739,244 | |
| | | | | | | | | | |
| | | |
| | | | | | | | | 2,219,657 | |
| | | | | | | | | | |
Total Mortgage Pass-Through Securities
(cost: $157,974,001) | | | | | | | 162,654,726 | |
| | | | | | | | | | |
U.S. Treasury / Federal Agency Securities - 7.1% | | | | | |
U.S. Treasury Bond: | | | | | | | | |
1,900,000 | | 2.00 | | | 2/15/50 | | | | 1,732,266 | |
U.S. Treasury Inflation Indexed Bonds: | | | | | | | | |
26,064,980 | | 0.13 | | | 1/15/23 | | | | 27,335,139 | |
U.S. Treasury Strip Principal: | | | | | | | | |
9,800,000 | | 1.05 | | | 5/15/30 | 6 | | | 8,400,951 | |
| | | | | | | | | | |
| | |
Total U.S. Treasury / Federal Agency Securities
(cost: $38,301,260) | | | | | | | 37,468,356 | |
| | | | | | | | | | |
| |
Collateralized Mortgage Obligations - 53.9% | | | | | |
Federal Home Loan Mortgage Corporation - 10.0% | | | | | |
162,956 | | 5.00 | | | 2/15/23 | | | | 167,949 | |
4,824,752 | | 5.00 | | | 11/25/50 | 1 | | | 5,585,796 | |
387,679 | | 5.54 | | | 5/15/38 | 1 | | | 425,811 | |
480 | | 6.00 | | | 9/15/21 | | | | 484 | |
1,837,141 | | 6.00 | | | 1/15/33 | | | | 2,169,300 | |
1,978,094 | | 6.00 | | | 5/15/36 | | | | 2,331,608 | |
2,225,553 | | 6.00 | | | 9/15/42 | | | | 2,556,973 | |
21,426 | | 6.25 | | | 5/15/29 | | | | 23,350 | |
67,135 | | 6.50 | | | 9/15/23 | | | | 71,009 | |
28,283 | | 6.50 | | | 3/15/24 | | | | 30,246 | |
387,038 | | 6.50 | | | 7/15/27 | | | | 439,829 | |
390,474 | | 6.50 | | | 2/15/28 | | | | 437,324 | |
478,787 | | 6.50 | | | 3/15/29 | | | | 544,547 | |
12,559 | | 6.50 | | | 2/15/30 | | | | 14,137 | |
386,616 | | 6.50 | | | 1/15/31 | | | | 442,590 | |
805,877 | | 6.50 | | | 8/15/31 | | | | 920,726 | |
146,640 | | 6.50 | | | 1/15/32 | | | | 168,552 | |
66,639 | | 6.50 | | | 3/15/32 | | | | 78,042 | |
370,115 | | 6.50 | | | 6/25/32 | | | | 432,994 | |
203,743 | | 6.50 | | | 7/15/32 | | | | 237,951 | |
4,227,474 | | 6.50 | | | 5/15/33 | | | | 5,007,010 | |
| | | | |
See accompanying notes to financial statements. | | | | |
MARCH 31, 2021 | | | 7 | |
SCHEDULE OF INVESTMENTS
March 31, 2021
Sit U.S. Government Securities Fund (Continued)
| | | | | | | | | | |
Principal
Amount ($) | | Coupon Rate (%) | | Maturity
Date | | | Fair
Value ($) | |
807,781 | | 6.50 | | | 5/15/35 | | | | 967,502 | |
449,473 | | 6.50 | | | 8/15/39 | | | | 528,647 | |
795,671 | | 6.50 | | | 2/25/43 | | | | 933,119 | |
499,014 | | 6.50 | | | 3/25/43 | | | | 587,221 | |
652,829 | | 6.50 | | | 7/25/43 | | | | 789,648 | |
601,582 | | 6.50 | | | 10/25/43 | | | | 697,245 | |
2,980,962 | | 6.50 | | | 8/15/45 | | | | 3,549,065 | |
751,495 | | 6.50 | | | 2/15/49 | | | | 850,328 | |
9,531 | | 6.70 | | | 9/15/23 | | | | 10,077 | |
415,661 | | 6.75 | | | 3/15/28 | | | | 473,985 | |
385,757 | | 6.95 | | | 3/15/28 | | | | 436,993 | |
27,576 | | 7.00 | | | 10/15/22 | | | | 28,389 | |
2,637 | | 7.00 | | | 11/15/22 | | | | 2,721 | |
86,504 | | 7.00 | | | 3/25/23 | | | | 89,217 | |
5,329 | | 7.00 | | | 4/15/23 | | | | 5,575 | |
23,118 | | 7.00 | | | 7/15/23 | | | | 24,418 | |
61,161 | | 7.00 | | | 1/15/24 | | | | 64,953 | |
35,477 | | 7.00 | | | 3/15/24 | | | | 37,613 | |
54,457 | | 7.00 | | | 8/15/25 | | | | 59,850 | |
49,063 | | 7.00 | | | 9/15/26 | | | | 54,360 | |
99,035 | | 7.00 | | | 6/15/29 | | | | 113,982 | |
266,237 | | 7.00 | | | 8/15/29 | | | | 308,719 | |
313,301 | | 7.00 | | | 10/20/29 | | | | 364,282 | |
50,772 | | 7.00 | | | 1/15/30 | | | | 59,909 | |
219,531 | | 7.00 | | | 10/15/30 | | | | 262,283 | |
130,130 | | 7.00 | | | 7/15/31 | | | | 153,343 | |
69,837 | | 7.00 | | | 4/15/32 | | | | 79,937 | |
474,815 | | 7.00 | | | 5/15/32 | | | | 566,364 | |
2,542,802 | | 7.00 | | | 8/15/41 | | | | 2,997,307 | |
3,409,911 | | 7.00 | | | 2/25/43 | | | | 4,040,326 | |
656,981 | | 7.00 | | | 3/25/43 | | | | 777,563 | |
890,923 | | 7.00 | | | 7/25/43 | | | | 1,073,239 | |
1,098,119 | | 7.00 | | | 3/15/49 | | | | 1,287,329 | |
2,888 | | 7.50 | | | 10/15/21 | | | | 2,919 | |
15,145 | | 7.50 | | | 7/15/22 | | | | 15,464 | |
43,518 | | 7.50 | | | 3/15/23 | | | | 45,658 | |
187,326 | | 7.50 | | | 4/15/23 | | | | 196,418 | |
37,898 | | 7.50 | | | 9/20/26 | | | | 42,963 | |
194,646 | | 7.50 | | | 3/15/28 | | | | 225,647 | |
276,843 | | 7.50 | | | 9/15/29 | | | | 328,699 | |
90,985 | | 7.50 | | | 12/15/29 | | | | 105,027 | |
163,369 | | 7.50 | | | 6/15/30 | | | | 194,795 | |
240,029 | | 7.50 | | | 8/15/30 | | | | 283,189 | |
373,310 | | 7.50 | | | 9/15/30 | | | | 449,708 | |
85,788 | | 7.50 | | | 11/15/30 | | | | 101,386 | |
2,543,301 | | 7.50 | | | 6/15/34 | | | | 3,138,670 | |
1,302,983 | | 7.50 | | | 8/25/42 | 1 | | | 1,625,890 | |
759,263 | | 7.50 | | | 9/25/43 | | | | 887,531 | |
1,518 | | 8.00 | | | 7/15/21 | | | | 1,519 | |
208,062 | | 8.00 | | | 2/15/23 | | | | 218,854 | |
25,700 | | 8.00 | | | 4/25/24 | | | | 27,132 | |
99,284 | | 8.00 | | | 2/15/27 | | | | 114,330 | |
| | | | | | | | | | |
Principal
Amount ($) | | Coupon Rate (%) | | Maturity
Date | | | Fair
Value ($) | |
118,553 | | 8.00 | | | 11/20/29 | | | | 140,150 | |
141,277 | | 8.00 | | | 1/15/30 | | | | 168,057 | |
2,366 | | 8.25 | | | 6/15/22 | | | | 2,450 | |
74,063 | | 8.50 | | | 3/15/25 | | | | 83,218 | |
23,135 | | 8.50 | | | 3/15/32 | | | | 27,579 | |
| | | | | | | | | | |
| | | |
| | | | | | | | | 52,788,990 | |
| | | | | | | | | | |
Federal National Mortgage Association - 18.4% | | | | | | | | |
536,551 | | 1.55 | | | 7/25/37 | 1 | | | 533,495 | |
523,325 | | 3.26 | | | 8/25/43 | 1 | | | 556,624 | |
217,706 | | 4.55 | | | 6/25/43 | | | | 240,522 | |
2,462,803 | | 5.00 | | | 7/25/40 | | | | 2,663,300 | |
432,314 | | 5.00 | | | 11/25/41 | | | | 495,483 | |
625,522 | | 5.00 | | | 6/25/43 | | | | 696,204 | |
2,583,603 | | 5.00 | | | 11/25/50 | | | | 2,947,932 | |
3,837,836 | | 5.00 | | | 12/25/50 | | | | 4,469,006 | |
606,415 | | 5.36 | | | 6/25/42 | | | | 693,865 | |
2,334,858 | | 5.39 | | | 2/25/42 | 1 | | | 2,593,931 | |
1,523,077 | | 5.46 | | | 10/25/42 | 1 | | | 1,758,471 | |
776,944 | | 5.50 | | | 9/25/33 | | | | 887,011 | |
3,668,282 | | 5.50 | | | 6/25/40 | | | | 3,946,214 | |
1,042,287 | | 5.60 | | | 12/25/53 | 1 | | | 1,226,604 | |
2,691,921 | | 5.63 | | | 12/25/42 | 1 | | | 2,979,678 | |
710,298 | | 5.81 | | | 8/25/43 | | | | 803,372 | |
1,329,845 | | 6.00 | | | 5/25/30 | | | | 1,530,118 | |
2,095,302 | | 6.00 | | | 5/25/36 | | | | 2,515,326 | |
202,685 | | 6.00 | | | 6/25/36 | | | | 241,741 | |
2,010,669 | | 6.00 | | | 11/25/43 | | | | 2,325,982 | |
1,005,429 | | 6.00 | | | 9/25/46 | | | | 1,132,988 | |
1,685,411 | | 6.00 | | | 2/25/48 | | | | 1,923,880 | |
1,106,831 | | 6.30 | | | 8/25/47 | 1 | | | 1,261,090 | |
203,265 | | 6.50 | | | 8/20/28 | | | | 222,446 | |
1,028,958 | | 6.50 | | | 1/25/32 | | | | 1,217,009 | |
169,619 | | 6.50 | | | 3/25/32 | | | | 199,790 | |
294,628 | | 6.50 | | | 6/25/32 | | | | 345,274 | |
230,896 | | 6.50 | | | 7/25/36 | | | | 272,614 | |
73,688 | | 6.50 | | | 9/25/36 | | | | 86,380 | |
1,852,998 | | 6.50 | | | 11/25/41 | | | | 2,186,403 | |
255,695 | | 6.50 | | | 3/25/42 | | | | 292,093 | |
1,214,924 | | 6.50 | | | 5/25/42 | | | | 1,441,344 | |
4,872,008 | | 6.50 | | | 7/25/42 | | | | 5,289,518 | |
273,054 | | 6.50 | | | 9/25/42 | | | | 318,183 | |
682,815 | | 6.50 | | | 11/25/42 | | | | 783,108 | |
1,260,615 | | 6.50 | | | 7/25/44 | | | | 1,343,905 | |
252,725 | | 6.54 | | | 2/25/45 | 1 | | | 299,985 | |
348,241 | | 6.71 | | | 9/25/37 | 1 | | | 426,788 | |
2,561,794 | | 6.75 | | | 6/25/32 | | | | 3,059,786 | |
568,069 | | 6.75 | | | 4/25/37 | | | | 636,914 | |
62,814 | | 6.85 | | | 12/18/27 | | | | 71,617 | |
347,919 | | 6.93 | | | 8/25/37 | 1 | | | 386,315 | |
1,928 | | 7.00 | | | 7/25/22 | | | | 1,969 | |
6,132 | | 7.00 | | | 11/25/22 | | | | 6,363 | |
8,040 | | 7.00 | | | 12/25/22 | | | | 8,302 | |
| | | | |
See accompanying notes to financial statements. | | | | |
8 | | | SIT MUTUAL FUNDS ANNUAL REPORT | |
| | | | | | | | | | |
Principal
Amount ($) | | Coupon Rate (%) | | Maturity
Date | | | Fair
Value ($) | |
7,761 | | 7.00 | | | 6/25/23 | | | | 8,165 | |
291,169 | | 7.00 | | | 4/25/24 | | | | 307,984 | |
138,633 | | 7.00 | | | 9/18/27 | | | | 157,013 | |
2,122,716 | | 7.00 | | | 5/25/31 | | | | 2,359,164 | |
1,158,074 | | 7.00 | | | 12/25/33 | | | | 1,364,328 | |
203,994 | | 7.00 | | | 9/25/40 | | | | 237,801 | |
437,525 | | 7.00 | | | 10/25/41 | | | | 503,122 | |
191,684 | | 7.00 | | | 11/25/41 | | | | 232,190 | |
307,458 | | 7.00 | | | 12/25/41 | | | | 362,352 | |
2,739,131 | | 7.00 | | | 1/25/42 | | | | 3,225,201 | |
934,930 | | 7.00 | | | 7/25/42 | | | | 1,119,781 | |
1,974,244 | | 7.00 | | | 2/25/44 | | | | 2,338,460 | |
101,894 | | 7.00 | | | 8/25/44 | | | | 122,191 | |
26,079 | | 7.50 | | | 8/20/27 | | | | 29,838 | |
203,926 | | 7.50 | | | 10/25/40 | | | | 235,771 | |
1,446,139 | | 7.50 | | | 11/25/40 | | | | 1,552,886 | |
736,855 | | 7.50 | | | 6/19/41 | 1 | | | 868,624 | |
1,375,235 | | 7.50 | | | 7/25/41 | | | | 1,652,142 | |
846,101 | | 7.50 | | | 8/25/41 | | | | 1,010,083 | |
263,886 | | 7.50 | | | 11/25/41 | | | | 321,144 | |
495,479 | | 7.50 | | | 1/25/42 | | | | 594,066 | |
3,346,696 | | 7.50 | | | 5/25/42 | | | | 4,025,580 | |
333,697 | | 7.50 | | | 6/25/42 | | | | 397,502 | |
3,028,165 | | 7.50 | | | 8/25/42 | 1 | | | 3,738,614 | |
1,054,945 | | 7.50 | | | 2/25/44 | | | | 1,261,086 | |
533,229 | | 7.50 | | | 3/25/44 | | | | 623,379 | |
731,903 | | 7.50 | | | 5/25/44 | | | | 894,341 | |
47,843 | | 7.50 | | | 10/25/44 | | | | 57,681 | |
4,395,943 | | 7.50 | | | 1/25/48 | | | | 5,333,632 | |
12,431 | | 8.00 | | | 7/25/22 | | | | 12,830 | |
37,593 | | 8.00 | | | 7/18/27 | | | | 42,549 | |
497,277 | | 8.00 | | | 11/25/37 | 1 | | | 595,465 | |
380,519 | | 8.00 | | | 7/25/44 | | | | 441,980 | |
256,114 | | 8.10 | | | 11/25/37 | 1 | | | 307,651 | |
41,420 | | 8.16 | | | 10/25/42 | 1 | | | 51,016 | |
22 | | 8.50 | | | 9/25/21 | | | | 22 | |
6,060 | | 8.50 | | | 1/25/25 | | | | 6,693 | |
440,364 | | 8.50 | | | 6/25/30 | | | | 531,536 | |
2,797 | | 9.00 | | | 8/25/22 | | | | 2,934 | |
45,069 | | 9.00 | | | 11/25/28 | | | | 52,329 | |
297,706 | | 9.00 | | | 6/25/30 | | | | 368,626 | |
50,123 | | 9.00 | | | 10/25/30 | | | | 61,848 | |
85,986 | | 9.40 | | | 6/25/32 | 1 | | | 100,471 | |
67,746 | | 9.50 | | | 11/25/31 | | | | 82,872 | |
204,027 | | 9.50 | | | 12/25/41 | | | | 248,589 | |
276,438 | | 11.16 | | | 6/25/44 | 1 | | | 323,218 | |
924,239 | | 11.27 | | | 9/25/42 | 1 | | | 1,209,749 | |
16,629 | | 21.44 | | | 3/25/39 | 1 | | | 25,393 | |
| | | | | | | | | | |
| | | |
| | | | | | | | | 96,718,835 | |
| | | | | | | | | | |
Government National Mortgage Association - 24.3% | | | | | |
3,685,193 | | 5.00 | | | 12/20/50 | | | | 4,328,079 | |
25,447,475 | | 5.00 | | | 2/20/51 | | | | 29,816,171 | |
7,000,000 | | 5.02 | | | 12/20/50 | 1 | | | 8,089,375 | |
| | | | | | | | | | |
Principal
Amount ($) | | Coupon Rate (%) | | Maturity
Date | | | Fair
Value ($) | |
500,000 | | 5.50 | | | 9/20/39 | | | | 590,424 | |
8,273,008 | | 5.50 | | | 10/20/50 | | | | 9,904,144 | |
2,461,516 | | 5.50 | | | 11/20/50 | | | | 2,899,856 | |
4,013,804 | | 5.50 | | | 1/20/51 | | | | 4,801,020 | |
2,233,879 | | 5.53 | | | 11/20/45 | 1 | | | 2,600,886 | |
371,199 | | 5.55 | | | 4/20/48 | 1 | | | 425,074 | |
4,882,617 | | 5.59 | | | 4/20/40 | 1 | | | 5,682,317 | |
5,287,473 | | 5.80 | | | 3/20/45 | 1 | | | 6,098,831 | |
9,966,588 | | 5.97 | | | 2/20/51 | 1 | | | 12,074,683 | |
649,162 | | 5.99 | | | 11/20/43 | 1 | | | 756,393 | |
1,764,504 | | 6.00 | | | 11/20/33 | | | | 1,944,364 | |
514,788 | | 6.00 | | | 12/20/35 | | | | 596,308 | |
328,157 | | 6.00 | | | 3/20/42 | | | | 386,563 | |
582,438 | | 6.00 | | | 3/20/48 | | | | 658,569 | |
4,183,165 | | 6.00 | | | 3/20/49 | | | | 4,657,013 | |
1,276,011 | | 6.00 | | | 5/20/49 | | | | 1,412,050 | |
844,769 | | 6.02 | | | 10/20/40 | 1 | | | 994,175 | |
1,909,964 | | 6.14 | | | 1/20/39 | 1 | | | 2,280,625 | |
362,277 | | 6.42 | | | 4/20/37 | 1 | | | 406,747 | |
1,930,482 | | 6.49 | | | 6/20/41 | 1 | | | 2,271,181 | |
1,160,518 | | 6.50 | | | 7/20/32 | | | | 1,158,547 | |
1,244,571 | | 6.50 | | | 2/20/37 | | | | 1,427,036 | |
242,155 | | 6.50 | | | 9/16/38 | | | | 275,187 | |
2,904,648 | | 6.50 | | | 8/20/48 | | | | 3,382,195 | |
1,390,276 | | 6.50 | | | 10/20/48 | | | | 1,562,942 | |
2,431,880 | | 6.50 | | | 1/20/49 | | | | 2,710,618 | |
636,539 | | 6.56 | | | 7/20/39 | 1 | | | 747,343 | |
1,259,506 | | 6.63 | | | 9/20/44 | 1 | | | 1,477,995 | |
488,389 | | 6.65 | | | 4/20/39 | 1 | | | 578,944 | |
969,887 | | 6.88 | | | 8/20/40 | 1 | | | 1,140,259 | |
552,797 | | 6.99 | | | 6/20/45 | 1 | | | 638,429 | |
126,233 | | 7.00 | | | 9/16/33 | | | | 138,413 | |
364,170 | | 7.00 | | | 5/20/42 | | | | 434,757 | |
1,333,991 | | 7.00 | | | 10/20/48 | | | | 1,464,155 | |
979,990 | | 7.11 | | | 12/20/38 | 1 | | | 1,153,050 | |
620,862 | | 7.14 | | | 12/20/33 | 1 | | | 724,583 | |
1,464,521 | | 7.31 | | | 8/20/38 | 1 | | | 1,734,515 | |
3,132,276 | | 7.40 | | | 7/20/44 | 1 | | | 3,680,545 | |
| | | | | | | | | | |
| | | |
| | | | | | | | | 128,104,361 | |
| | | | | | | | | | |
Vendee Mortgage Trust - 1.2% | | | | | | | | |
1,127,848 | | 6.17 | | | 3/15/25 | 1 | | | 1,295,123 | |
1,694,888 | | 6.50 | | | 8/15/31 | | | | 1,904,072 | |
805,453 | | 6.50 | | | 10/15/31 | | | | 952,627 | |
589,853 | | 6.75 | | | 2/15/26 | | | | 663,695 | |
686,818 | | 7.00 | | | 3/15/28 | | | | 765,615 | |
55,449 | | 7.25 | | | 9/15/22 | | | | 56,777 | |
190,615 | | 7.25 | | | 9/15/25 | | | | 212,478 | |
185,602 | | 7.75 | | | 5/15/22 | | | | 191,072 | |
240,157 | | 7.75 | | | 9/15/24 | | | | 261,583 | |
| | | | |
See accompanying notes to financial statements. | | | | |
MARCH 31, 2021 | | | 9 | |
SCHEDULE OF INVESTMENTS
March 31, 2021
Sit U.S. Government Securities Fund (Continued)
| | | | | | | | | | |
Principal
Amount ($) | | Coupon Rate (%) | | Maturity
Date | | | Fair
Value ($) | |
91,796 | | 8.00 | | | 2/15/25 | | | | 99,501 | |
69,812 | | 8.29 | | | 12/15/26 | | | | 79,452 | |
| | | | | | | | | | |
| | | |
| | | | | | | | | 6,481,995 | |
| | | | | | | | | | |
Total Collateralized Mortgage Obligations
(cost: $276,932,872) | | | | | | | 284,094,181 | |
| | | | | | | | | | |
| | |
Asset-Backed Securities - 1.2% | | | | | | | | |
Federal Home Loan Mortgage Corporation - 0.2% | | | | | |
452 | | 6.09 | |
| 9/25/29
| 1
| | | 453 | |
780,589 | | 7.16 | | | 7/25/29 | | | | 901,942 | |
| | | | | | | | | | |
| | | |
| | | | | | | | | 902,395 | |
| | | | | | | | | | |
Federal National Mortgage Association - 0.5% | | | | | | | | |
12,803 | | 1 Mo. Libor + 0.17, 0.46% | | | 11/25/32 | 1 | | | 12,547 | |
318,087 | | 4.68 | | | 9/26/33 | 14 | | | 357,393 | |
116,982 | | 4.77 | | | 10/25/33 | 14 | | | 132,000 | |
1,833,297 | | 5.72 | | | 2/25/33 | 14 | | | 2,114,940 | |
5,155 | | 6.00 | | | 5/25/32 | 14 | | | 5,571 | |
94,401 | | 6.09 | | | 10/25/31 | 14 | | | 100,873 | |
125 | | 6.33 | | | 7/25/31 | 14 | | | 125 | |
4,392 | | 7.80 | | | 6/25/26 | 1 | | | 4,977 | |
| | | | | | | | | | |
| | | |
| | | | | | | | | 2,728,426 | |
| | | | | | | | | | |
Small Business Administration - 0.5% | | | | | | | | |
249,247 | | 5.78 | | | 8/1/27 | | | | 268,808 | |
1,131,264 | | 5.87 | | | 7/1/28 | | | | 1,243,723 | |
1,040,322 | | 6.02 | | | 8/1/28 | | | | 1,155,508 | |
| | | | | | | | | | |
| | | |
| | | | | | | | | 2,668,039 | |
| | | | | | | | | | |
Total Asset-Backed Securities
(cost: $5,758,886) | | | | | | | 6,298,860 | |
| | | | | | | | | | |
| | |
Put Options Purchased 19 - 0.2% | | | | | | | | |
(cost: $923,659) | | | | | | | 1,015,250 | |
| | | | | | | | | | |
| | | | |
| Quantity Name of Issuer | | Fair Value ($) | |
Short-Term Securities - 7.8% | | | | |
41,164,348 Fidelity Inst. Money Mkt. Gvt. Fund, 0.01% | | | 41,164,348 | |
| | | | |
(cost: $41,164,348) | | | | |
Total Investments in Securities - 101.0%
(cost: $521,055,026) | | | 532,695,721 | |
| | | | |
| |
Other Assets and Liabilities, net - (1.0%) | | | (5,426,406 | ) |
| | | | |
| |
Total Net Assets - 100.0% | | $ | 527,269,315 | |
| | | | |
| 1 | Variable rate security. Rate disclosed is as of March 31, 2021. Certain variable rate securities are not based on a published reference rate and spread but are determined by the issuer or agent and are based on current market conditions, or, for mortgage-backed securities, are impacted by the individual mortgages which are paying off over time. These securities do not indicate a reference rate and spread in their descriptions. |
| 6 | Zero coupon or convertible capital appreciation bond, for which the rate disclosed is either the effective yield on purchase date or the coupon rate to be paid upon conversion to coupon paying. |
| 14 | Step Coupon: A bond that pays a coupon rate that increases on a specified date(s). Rate disclosed is as of March 31, 2021. |
Numeric footnotes not disclosed are not applicable to this Schedule of Investments.
| | | | |
See accompanying notes to financial statements. | | | | |
10 | | | SIT MUTUAL FUNDS ANNUAL REPORT | |
| (19) | Options outstanding as of March 31, 2021 were as follows: |
| | | | | | | | | | | | | | | | | | | | | | |
| | | | | Exercise | | | Expiration | | | | Notional | | | Cost/ | | | | |
| Description | | Contracts | | Price ($) | | | Date | | Counterparty | | Amount ($) | | | Premiums ($) | | | Value ($) | |
| | |
Put Options Purchased - U.S. Treasury Futures: | | | | | | | | | |
| 30-Year | | 496 | | | 154.00 | | | May 2021 | | StoneX Financial, Inc. | | | 76,384,000 | | | | 923,659 | | | | 1,015,250 | |
A summary of the levels for the Fund’s investments as of March 31, 2021 is as follows (see Note 2-significant accounting policies in the notes to financial statements):
| | | | | | | | | | | | | | |
| | | Investment in Securities | |
| | | Level 1 | | | Level 2 | | | Level 3 | | | |
| | | Quoted | | | Other significant | | | Significant | | | |
| | | Price ($) | | | observable inputs ($) | | | unobservable inputs ($) | | Total ($) | |
Assets | | | | | | | | | | | | | | |
Mortgage Pass-Through Securities | | | — | | | | 162,654,726 | | | — | | | 162,654,726 | |
U.S. Treasury / Federal Agency Securities | | | — | | | | 37,468,356 | | | — | | | 37,468,356 | |
Collateralized Mortgage Obligations | | | — | | | | 284,094,181 | | | — | | | 284,094,181 | |
Asset-Backed Securities | | | — | | | | 6,298,860 | | | — | | | 6,298,860 | |
Put Options Purchased | | | 1,015,250 | | | | — | | | — | | | 1,015,250 | |
Short-Term Securities | | | 41,164,348 | | | | — | | | — | | | 41,164,348 | |
| | | | |
| | | 42,179,598 | | | | 490,516,123 | | | — | | | 532,695,721 | |
There were no transfers into or out of level 3 during the reporting period.
| | | | |
See accompanying notes to financial statements. | | | | |
MARCH 31, 2021 | | | 11 | |
OBJECTIVE & STRATEGY
The objective of the Quality Income Fund is to provide high current income and safety of principal, which it seeks to attain by investing at least 80% of its assets in debt securities issued by the U.S. government and its agencies, debt securities issued by corporations, and mortgage and other asset-backed securities. The Fund invests at least 50% of its assets in U.S. government debt securities, which are securities issued, guaranteed or insured by the U.S. government, its agencies or instrumentalities.
Fund Performance
The Sit Quality Income Fund provided a return of +3.32% during the 12-month period ending March 31, 2021, compared to the return of the Bloomberg Barclays 1-3 Year Government/Credit Index of +1.57%. The Fund’s 30-day SEC yield was 1.32% and its 12-month distribution rate was 1.05%.
Factors that Influenced the Fund’s Performance
The primary goal of the Fund is to maintain a high credit quality portfolio with stable principal values, while generating a relatively high level of income. During the 12-month period, the Fund benefited from the income advantage produced by its holdings in residential mortgages, corporate, and taxable municipal securities. The Fund reduces interest rate risk by using futures and options on Treasury securities. The use of futures and options was effective in providing stability to the Fund’s net asset value and contributed positively to the return. Corporate securities experienced a positive return for the Fund, as yield spreads for these securities rebounded as the economy began to improve. The Fund’s treasury holdings outperformed the benchmark as the securities held by the Fund were generally inflation protected securities which benefited from higher than expected inflation measures.The Fund’s collateralized mortgage obligations and asset-backed securities, outperformed as yield spreads narrowed on these securities as the economy began to stabilize.Agency mortgage-backed securities underperformed due to the income advantage not being enough to offset the weaker price performance relative to the index. Taxable municipal securities outperformed as the strong income return and narrowing yield spreads contributed positively to the return.
Outlook and Positioning
The year began with one of the worst economic downturns since the Great Depression due to widespread infections of the COVID-19 virus. Over the course of the year, the U.S. had to endure several waves of increasing infections in different states across the nation. During that time, companies were scrambling to create a safe and effective vaccine to combat the virus.As positive developments regarding these vaccines occurred, consumers continued to spend at a healthy clip as overall confidence began to turn positively. Several consumers
HYPOTHETICAL GROWTH OF $10,000
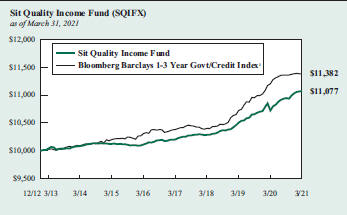
The chart above illustrates the total value of a hypothetical $10,000 investment in the Fund over the past 10 years (or for the life of the Fund if shorter) as compared to the performance of the Bloomberg Barclays 1-3 Year Government/Credit Index. Past performance does not guarantee future results. Returns include the reinvestment of distributions. The chart does not reflect the deduction of taxes that a shareholder would pay on Fund distributions or the redemption of Fund shares.
1 The Bloomberg Barclays 1-3Year Government/Credit Index is an unmanaged index of Treasury or government agency securities and investment grade corporate debt securities with maturities of one to three years. The returns include the reinvestment of income and do not include any transaction costs, management fees or other costs. It is not possible to invest directly in an index. This is the Fund’s primary index.
received three different stimulus checks throughout the year for assistance during these unprecedented times. The Federal Reserve continued to buoy the market by keeping the Fed Funds rate at 0-0.25% and its ongoing asset purchase program. The Federal Reserve concluded its purchase program of investment grade corporate bonds but continues its purchases of mortgage and treasury securities. Investors will be watching inflation closely as expectations have risen to levels not seen since 2018.
We have positioned the Fund opportunistically in terms of credit quality and defensively with respect to an inflationary environment in order to maximize return potential while preserving principal. We focus on a mix of Treasury, agency and credit sectors that provide relatively high levels of income and stable prices.
| | |
| Bryce A. Doty, CFA | | Chris M. Rasmussen, CFA |
| Senior Portfolio Manager | | Mark H. Book, CFA |
| | Portfolio Managers |
| | |
| Information on this page is unaudited. |
12 | | SIT MUTUAL FUNDS ANNUAL REPORT |
COMPARATIVE RATES OF RETURNS
| | | | | | | | | | | | |
as of March 31, 2021 | | | |
| | | | | Bloomberg | | Lipper |
| | | | | Barclays | | Short |
| | | Sit | | 1-3 Year | | Investment |
| | | Quality | | Government/Credit | | Grade Bond |
| | | Income Fund | | Index1 | | Index2 |
| | | |
One Year | | | 3.32 | % | | | 1.57 | % | | | 5.94 | % |
Five Years | | | 1.84 | | | | 2.00 | | | | 2.54 | |
Since Inception
(12/31/12) | | | 1.25 | | | | 1.58 | | | | 1.90 | |
Performance figures are historical and do not guarantee future results. Investment returns and principal value will vary, and you may have a gain or loss when you sell shares. Current performance may be lower or higher than the performance data quoted. Contact the Fund for performance data current to the most recent month-end. Returns include changes in share price as well as reinvestment of all dividends and capital gains and all fee waivers. Without the fee waivers total return and yield figures would have been lower. Returns do not reflect the deduction of taxes that a shareholder would pay on Fund distributions or the redemption of Fund shares. Management fees and administrative expenses are included in the Fund’s performance. Returns for the periods greater than one year are compounded average annual rates of return.
1 The Bloomberg Barclays 1-3Year Government/Credit Index is an unmanaged index of Treasury or government agency securities and investment grade corporate debt securities with maturities of one to three years. The returns include the reinvestment of income and do not include any transaction costs, management fees or other costs. It is not possible to invest directly in an index.
2 The Lipper returns are obtained from LipperAnalytical Services, Inc., a large independent evaluator of mutual funds.
FUND DIVERSIFICATION
| | | | |
| |
Corporate Bonds | | | 27.7 | % |
U.S. Treasury/Federal Agency Securities | | | 26.4 | |
Mortgage Pass-Through Securities | | | 25.3 | |
Taxable Municipal Bonds | | | 8.1 | |
Asset-Backed Securities. | | | 5.2 | |
Collateralized Mortgage Obligations (Non-Agency) | | | 5.0 | |
Other Net Assets | | | 2.3 | |
Based on total net assets as of March 31, 2021. Subject to change.
PORTFOLIO SUMMARY
| | |
Net Asset Value 3/31/21: | | $10.04 Per Share |
Net Asset Value 3/31/20: | | $9.82 Per Share |
Total Net Assets: | | $108.8 Million |
Average Maturity: | | 9.8 Years |
Effective Duration3: | | 1.2 Years |
3 Duration is a measure of estimated price sensitivity relative to changes in interest rates. Portfolios with longer durations are typically more sensitive to changes in interest rates. For example, if interest rates rise by 1%, the fair value of a security with an effective duration of 5 years would decrease by 5%, with all other factors being constant. The correlation between duration and price sensitivity is greater for securities rated investment-grade than it is for securities rated below investment-grade. Duration estimates are based on assumptions by the Adviser and are subject to a number of limitations. Effective duration is calculated based on historical price changes of securities held by the Fund, and therefore is a more accurate estimate of price sensitivity provided interest rates remain within their historical range.
QUALITY RATINGS (% of Total Net Assets)
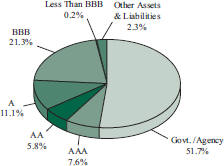
Lower of Moody’s, S&P, Fitch or Duff & Phelps ratings used.
| | | | |
Information on this page is unaudited. | | | | |
MARCH 31, 2021 | | | 13 | |
SCHEDULE OF INVESTMENTS
March 31, 2021
Sit Quality Income Fund
| | | | | | | | | | | | | | | | | | | | |
| | | | | |
| Name of Issuer | | Principal
Amount ($) | | Coupon Rate (%) | | Maturity Date | | Fair Value ($) |
| | | | |
Asset-Backed Securities - 6.1% | | | | | | | | | | | | | | | | | | | | |
Agency - 0.9% | | | | | | | | | | | | | | | | | | | | |
FNMA Grantor Trust, Series 2004-T5, Class A11 1 | | | | 541,055 | | | | | 0.70 | | | | | 5/28/35 | | | | | 533,694 | |
Small Business Administration, Series 2006-20D, Class 1 | | | | 149,061 | | | | | 5.64 | | | | | 4/1/26 | | | | | 158,941 | |
Small Business Administration, Series 2007-20B, Class 1 | | | | 116,986 | | | | | 5.49 | | | | | 2/1/27 | | | | | 126,026 | |
Small Business Administration, Series 2007-20J, Class 1 | | | | 205,515 | | | | | 5.57 | | | | | 10/1/27 | | | | | 224,621 | |
| | | | | | | | | | | | | | | | | | | | |
| | | | |
| | | | | | | | | | | | | | | | | | | 1,043,282 | |
| | | | | | | | | | | | | | | | | | | | |
Non-Agency - 5.2% | | | | | | | | | | | | | | | | | | | | |
ACE Securities Corp. Manufactured Housing Trust, Series 2003-MH1, Class M2 1, 4 | | | | 499,642 | | | | | 6.50 | | | | | 8/15/30 | | | | | 528,534 | |
Aegis Asset Backed Securities Corp., Series 2003-2, Class M1, 1 Mo. Libor + 1.13% 1 | | | | 747,206 | | | | | 1.23 | | | | | 11/25/33 | | | | | 746,510 | |
Bayview Opportunity Master Fund, Series 2017-SPL5, Class A 1, 4 | | | | 253,229 | | | | | 3.50 | | | | | 6/28/57 | | | | | 259,289 | |
Centex Home Equity Loan Trust, Series 2004-A, Class AF4 14 | | | | 102,684 | | | | | 5.01 | | | | | 8/25/32 | | | | | 105,305 | |
Centex Home Equity Loan Trust, Series 2004-A, Class AF5 14 | | | | 310,000 | | | | | 5.43 | | | | | 1/25/34 | | | | | 305,894 | |
Countrywide Asset-Backed Certificates, Series 2004-S1, Class A3 14 | | | | 57,521 | | | | | 5.12 | | | | | 2/25/35 | | | | | 57,449 | |
GSAMP Trust, Series 2004-FM1, Class M1, 1 Mo. Libor + 0.98% 1 | | | | 140,552 | | | | | 1.08 | | | | | 11/25/33 | | | | | 139,964 | |
Home Equity Mortgage Loan Asset-Backed Trust, Series 2003-A, Class AV2, 1 Mo. Libor + 0.86% 1 | | | | 276,264 | | | | | 0.97 | | | | | 10/25/33 | | | | | 273,055 | |
Mill City Mortgage Loan Trust, Series 2017-3, Class A1 1, 4 | | | | 193,293 | | | | | 2.75 | | | | | 1/25/61 | | | | | 197,146 | |
OSCAR US Funding Trust IX, LLC, Series 2018-2A, Class A4 4 | | | | 500,000 | | | | | 3.63 | | | | | 9/10/25 | | | | | 517,145 | |
OSCAR US Funding Trust VI, LLC, Series 2017-1A, Class A4 4 | | | | 341,211 | | | | | 3.30 | | | | | 5/10/24 | | | | | 343,736 | |
Towd Point Mortgage Trust, Series 2019-MH1, Class A2 1, 4 | | | | 800,000 | | | | | 3.00 | | | | | 11/25/58 | | | | | 820,663 | |
Towd Point Mortgage Trust, Series 2019-SJ1, Class A1 1, 4 | | | | 208,773 | | | | | 3.75 | | | | | 11/25/58 | | | | | 208,972 | |
Towd Point Mortgage Trust, Series 2019-SJ3, Class A1 1, 4 | | | | 379,860 | | | | | 3.00 | | | | | 11/25/59 | | | | | 384,038 | |
Towd Point Mortgage Trust, Series 2020-MH1, Class A1A 1, 4 | | | | 768,318 | | | | | 2.18 | | | | | 2/25/60 | | | | | 777,027 | |
| | | | | | | | | | | | | | | | | | | | |
| | | | |
| | | | | | | | | | | | | | | | | | | 5,664,727 | |
| | | | | | | | | | | | | | | | | | | | |
| | | | |
Total Asset-Backed Securities
(cost: $6,644,837) | | | | | | | | | | | | | | | | | | | 6,708,009 | |
| | | | | | | | | | | | | | | | | | | | |
| | | | |
Collateralized Mortgage Obligations - 10.0% | | | | | | | | | | | | | | | | | | | | |
Agency - 5.0% | | | | | | | | | | | | | | | | | | | | |
FHLMC REMICS, Series 2528, Class KM | | | | 11,593 | | | | | 5.50 | | | | | 11/15/22 | | | | | 11,903 | |
FHLMC REMICS, Series 3104, Class BY | | | | 74,696 | | | | | 5.50 | | | | | 1/15/26 | | | | | 80,464 | |
FHLMC REMICS, Series 3806, Class JA | | | | 147,847 | | | | | 3.50 | | | | | 2/15/26 | | | | | 153,590 | |
FHLMC REMICS, Series 4246, Class PT | | | | 381,424 | | | | | 6.50 | | | | | 2/15/36 | | | | | 451,269 | |
FHLMC REMICS, Series 4759, Class NA | | | | 403,603 | | | | | 3.00 | | | | | 8/15/44 | | | | | 413,656 | |
FHLMC REMICS, Series 4776, Class QG | | | | 227,953 | | | | | 3.00 | | | | | 9/15/42 | | | | | 230,527 | |
FHLMC Structured Pass-Through Certificates, Series T-60, Class 1A2 | | | | 695,280 | | | | | 7.00 | | | | | 3/25/44 | | | | | 798,990 | |
FNMA Grantor Trust, Series 2004-T1, Class 2A 1 | | | | 375,964 | | | | | 3.26 | | | | | 8/25/43 | | | | | 399,887 | |
FNMA REMICS, Series 2003-52, Class NA | | | | 10,705 | | | | | 4.00 | | | | | 6/25/23 | | | | | 10,824 | |
FNMA REMICS, Series 2009-13, Class NX | | | | 494 | | | | | 4.50 | | | | | 3/25/24 | | | | | 506 | |
FNMA REMICS, Series 2009-71, Class MB | | | | 14,759 | | | | | 4.50 | | | | | 9/25/24 | | | | | 15,203 | |
FNMA REMICS, Series 2012-19, Class GH | | | | 10,425 | | | | | 3.00 | | | | | 11/25/30 | | | | | 10,621 | |
FNMA REMICS, Series 2013-74, Class AD | | | | 48,049 | | | | | 2.00 | | | | | 7/25/23 | | | | | 48,497 | |
FNMA REMICS, Series 2017-97, Class DP | | | | 217,134 | | | | | 3.50 | | | | | 10/25/46 | | | | | 221,791 | |
FNMA REMICS, Series 2018-1, Class TE | | | | 206,104 | | | | | 3.50 | | | | | 3/25/44 | | | | | 212,163 | |
FNMA REMICS, Series 2018-25, Class AG | | | | 380,771 | | | | | 3.50 | | | | | 4/25/47 | | | | | 399,462 | |
FRESB Mortgage Trust, Series 2018-SB45, Class A5H 1 | | | | 687,063 | | | | | 2.96 | | | | | 11/25/37 | | | | | 704,466 | |
FRESB Mortgage Trust, Series 2018-SB46, Class A5H 1 | | | | 790,898 | | | | | 2.89 | | | | | 12/25/37 | | | | | 817,183 | |
Seasoned Credit Risk Transfer Trust, Series 2019-4, Class M55D | | | | 393,163 | | | | | 4.00 | | | | | 2/25/59 | | | | | 432,109 | |
Vendee Mortgage Trust, Series 1993-1, Class ZB | | | | 23,239 | | | | | 7.25 | | | | | 2/15/23 | | | | | 24,345 | |
| | | | | | | | | | | | | | | | | | | | |
| | | | |
| | | | | | | | | | | | | | | | | | | 5,437,456 | |
| | | | | | | | | | | | | | | | | | | | |
| | | | |
See accompanying notes to financial statements. | | | | |
14 | | | SIT MUTUAL FUNDS ANNUAL REPORT | |
| | | | | | | | | | | | | | | | | | | | |
| | | | | |
| Name of Issuer | | Principal
Amount ($) | | Coupon Rate (%) | | Maturity Date | | Fair Value ($) |
| | | | |
Non-Agency - 5.0% | | | | | | | | | | | | | | | | | | | | |
JP Morgan Mortgage Trust, Series 2019-9, Class A8 1, 4 | | | | 750,000 | | | | | 3.50 | | | | | 5/25/50 | | | | | 757,966 | |
JP Morgan Mortgage Trust, Series 2020-2, Class A4 1, 4 | | | | 296,181 | | | | | 3.50 | | | | | 7/25/50 | | | | | 298,782 | |
JP Morgan Mortgage Trust, Series 2020-8, Class A4 1, 4 | | | | 194,082 | | | | | 3.00 | | | | | 3/25/51 | | | | | 198,033 | |
JP Morgan Mortgage Trust, Series 2021-1, Class A4 1, 4 | | | | 1,021,490 | | | | | 2.50 | | | | | 6/25/51 | | | | | 1,043,929 | |
New Residential Mortgage Loan Trust, Series 2017-2A, Class A4 1, 4 | | | | 390,612 | | | | | 4.00 | | | | | 3/25/57 | | | | | 415,429 | |
New Residential Mortgage Loan Trust, Series 2017-3A, Class A1 1, 4 | | | | 412,860 | | | | | 4.00 | | | | | 4/25/57 | | | | | 437,994 | |
New Residential Mortgage Loan Trust, Series 2017-5A, Class A1, 1 Mo. Libor + 1.50% 1, 4 | | | | 157,107 | | | | | 1.61 | | | | | 6/25/57 | | | | | 159,681 | |
New Residential Mortgage Loan Trust, Series 2018-1A, Class A1A 1, 4 | | | | 294,391 | | | | | 4.00 | | | | | 12/25/57 | | | | | 314,244 | |
New Residential Mortgage Loan Trust, Series 2018-4A, Class A1S, 1 Mo. Libor + 0.75% 1, 4 | | | | 437,188 | | | | | 0.86 | | | | | 1/25/48 | | | | | 438,547 | |
Sequoia Mortgage Trust, Series 2018-3, Class A4 1, 4 | | | | 45,673 | | | | | 3.50 | | | | | 3/25/48 | | | | | 45,676 | |
Sequoia Mortgage Trust, Series 2020-2, Class A4 1, 4 | | | | 355,549 | | | | | 3.50 | | | | | 3/25/50 | | | | | 360,397 | |
Sequoia Mortgage Trust, Series 2020-4, Class A5 1, 4 | | | | 509,564 | | | | | 2.50 | | | | | 11/25/50 | | | | | 522,821 | |
Wells Fargo Mortgaged Backed Securities Trust, Series 2020-5, Class A3 1, 4 | | | | 449,654 | | | | | 2.50 | | | | | 9/25/50 | | | | | 454,186 | |
| | | | | | | | | | | | | | | | | | | | |
| | | | |
| | | | | | | | | | | | | | | | | | | 5,447,685 | |
| | | | | | | | | | | | | | | | | | | | |
| | | | |
Total Collateralized Mortgage Obligations
(cost: $10,749,702) | | | | | | | | | | | | | | | | | | | 10,885,141 | |
| | | | | | | | | | | | | | | | | | | | |
| | | | |
Corporate Bonds - 27.7% | | | | | | | | | | | | | | | | | | | | |
Alaska Airlines 2020-1 Class B Pass-Through Trust 4 | | | | 904,078 | | | | | 8.00 | | | | | 8/15/25 | | | | | 1,003,893 | |
AmSouth Bancorp. (Subordinated) | | | | 750,000 | | | | | 6.75 | | | | | 11/1/25 | | | | | 915,356 | |
BGC Partners, Inc. | | | | 900,000 | | | | | 4.38 | | | | | 12/15/25 | | | | | 957,877 | |
British Airways 2013-1 Class A Pass Through Trust 4 | | | | 653,873 | | | | | 4.63 | | | | | 6/20/24 | | | | | 678,263 | |
Broadcom Corp./Broadcom Cayman Finance, Ltd. | | | | 850,000 | | | | | 3.88 | | | | | 1/15/27 | | | | | 923,290 | |
Cabot Corp. | | | | 850,000 | | | | | 3.40 | | | | | 9/15/26 | | | | | 892,695 | |
Capital One Financial Corp. (Subordinated) | | | | 1,000,000 | | | | | 3.75 | | | | | 7/28/26 | | | | | 1,085,934 | |
Continental Airlines 2012-1 Class A Pass Through Trust | | | | 220,801 | | | | | 4.15 | | | | | 4/11/24 | | | | | 230,619 | |
Delta Air Lines 2015-1 Class A Pass Through Trust | | | | 570,785 | | | | | 3.88 | | | | | 7/30/27 | | | | | 579,189 | |
Delta Air Lines 2019-1 Class A Pass Through Trust | | | | 306,000 | | | | | 3.40 | | | | | 4/25/24 | | | | | 308,034 | |
Delta Air Lines, Inc./SkyMiles 4 | | | | 850,000 | | | | | 4.50 | | | | | 10/20/25 | | | | | 905,128 | |
Doric Nimrod Air Finance Alpha 2012-1 Trust 4 | | | | 259,643 | | | | | 5.13 | | | | | 11/30/22 | | | | | 258,647 | |
Duke Energy Florida Project Finance, LLC | | | | 540,942 | | | | | 1.73 | | | | | 9/1/22 | | | | | 546,659 | |
Equifax, Inc. | | | | 500,000 | | | | | 3.25 | | | | | 6/1/26 | | | | | 533,006 | |
Equinor ASA | | | | 224,000 | | | | | 7.15 | | | | | 11/15/25 | | | | | 279,962 | |
Expedia Group, Inc. | | | | 655,000 | | | | | 5.00 | | | | | 2/15/26 | | | | | 739,281 | |
Flex, Ltd. | | | | 600,000 | | | | | 3.75 | | | | | 2/1/26 | | | | | 643,527 | |
Fulton Financial Corp. (Subordinated) | | | | 429,000 | | | | | 4.50 | | | | | 11/15/24 | | | | | 478,384 | |
Georgia-Pacific, LLC | | | | 645,000 | | | | | 7.38 | | | | | 12/1/25 | | | | | 810,269 | |
JetBlue 2019-1 Class B Pass Through Trust | | | | 944,339 | | | | | 8.00 | | | | | 11/15/27 | | | | | 1,076,896 | |
John Hancock Life Insurance Co. (Subordinated) 4 | | | | 900,000 | | | | | 7.38 | | | | | 2/15/24 | | | | | 1,055,066 | |
JPMorgan Chase & Co., 3 Mo. Libor + 0.80% 1 | | | | 900,000 | | | | | 1.00 | | | | | 5/10/23 | | | | | 905,379 | |
Liberty Mutual Insurance Co. (Subordinated) 4 | | | | 700,000 | | | | | 8.50 | | | | | 5/15/25 | | | | | 848,939 | |
Mercury General Corp. | | | | 1,000,000 | | | | | 4.40 | | | | | 3/15/27 | | | | | 1,127,830 | |
Metropolitan Life Insurance Co. (Subordinated) 4 | | | | 750,000 | | | | | 7.80 | | | | | 11/1/25 | | | | | 933,587 | |
Minnesota Life Insurance Co. (Subordinated) 4 | | | | 750,000 | | | | | 8.25 | | | | | 9/15/25 | | | | | 911,646 | |
Nationwide Mutual Insurance Co. (Subordinated), 3 Mo. Libor + 2.29% 1, 4 | | | | 975,000 | | | | | 2.47 | | | | | 12/15/24 | | | | | 973,933 | |
Prudential Insurance Co. of America (Subordinated) 4 | | | | 615,000 | | | | | 8.30 | | | | | 7/1/25 | | | | | 780,305 | |
RenaissanceRe Finance, Inc. | | | | 500,000 | | | | | 3.70 | | | | | 4/1/25 | | | | | 540,191 | |
SBA Tower Trust 4 | | | | 500,000 | | | | | 2.84 | | | | | 1/15/25 | | | | | 524,402 | |
SBA Tower Trust, Series 2014-2A, Class C 4, 14 | | | | 750,000 | | | | | 3.87 | | | | | 10/15/49 | | | | | 794,531 | |
TIAA FSB Holdings, Inc. (Subordinated) | | | | 780,000 | | | | | 5.75 | | | | | 7/2/25 | | | | | 833,100 | |
Tosco Corp. | | | | 500,000 | | | | | 7.80 | | | | | 1/1/27 | | | | | 651,400 | |
| | | | |
See accompanying notes to financial statements. | | | | |
MARCH 31, 2021 | | | 15 | |
SCHEDULE OF INVESTMENTS
March 31, 2021
Sit Quality Income Fund (Continued)
| | | | | | | | | | | | | | | | | | | | |
| | | | | |
| Name of Issuer | | Principal
Amount ($) | | Coupon Rate (%) | | Maturity Date | | Fair Value ($) |
| | | | |
Tyco Intl. Finance | | | | 1,000,000 | | | | | 3.90 | | | | | 2/14/26 | | | | | 1,075,588 | |
United Airlines 2013-1 Class A Pass Through Trust | | | | 203,365 | | | | | 4.30 | | | | | 8/15/25 | | | | | 211,195 | |
United Airlines 2014-1 Class A Pass Through Trust | | | | 975,293 | | | | | 4.00 | | | | | 4/11/26 | | | | | 1,008,757 | |
United Airlines 2015-1 Class A Pass Through Trust | | | | 100,000 | | | | | 3.70 | | | | | 12/1/22 | | | | | 101,364 | |
Valero Energy Partners LP | | | | 1,000,000 | | | | | 4.38 | | | | | 12/15/26 | | | | | 1,120,516 | |
Wachovia Corp. (Subordinated) 14 | | | | 661,000 | | | | | 7.57 | | | | | 8/1/26 | | | | | 844,720 | |
Webster Financial Corp. | | | | 950,000 | | | | | 4.38 | | | | | 2/15/24 | | | | | 1,017,277 | |
| | | | | | | | | | | | | | | | | | | | |
| | | | |
Total Corporate Bonds
(cost: $29,695,222) | | | | | | | | | | | | | | | | | | | 30,106,635 | |
| | | | | | | | | | | | | | | | | | | | |
Mortgage Pass-Through Securities - 25.3% | | | | | | | | | | | | | | | | | | | | |
Federal Home Loan Mortgage Corporation - 5.5% | | | | | | | | | | | | | | | | | | | | |
Freddie Mac | | | | 479,931 | | | | | 2.00 | | | | | 11/1/31 | | | | | 493,749 | |
Freddie Mac | | | | 615,161 | | | | | 2.00 | | | | | 8/1/32 | | | | | 632,749 | |
Freddie Mac | | | | 87,970 | | | | | 3.00 | | | | | 9/1/27 | | | | | 93,455 | |
Freddie Mac | | | | 830,385 | | | | | 3.00 | | | | | 1/1/35 | | | | | 885,344 | |
Freddie Mac | | | | 1,964,365 | | | | | 3.00 | | | | | 1/1/36 | | | | | 2,088,110 | |
Freddie Mac | | | | 17,486 | | | | | 3.50 | | | | | 7/1/26 | | | | | 18,661 | |
Freddie Mac | | | | 472,342 | | | | | 3.50 | | | | | 9/1/32 | | | | | 509,544 | |
Freddie Mac | | | | 112,412 | | | | | 4.00 | | | | | 7/1/26 | | | | | 120,000 | |
Freddie Mac | | | | 124,720 | | | | | 4.00 | | | | | 1/1/27 | | | | | 133,203 | |
Freddie Mac | | | | 2 | | | | | 4.50 | | | | | 12/1/21 | | | | | 2 | |
Freddie Mac | | | | 4,433 | | | | | 4.50 | | | | | 7/1/26 | | | | | 4,656 | |
Freddie Mac | | | | 481,794 | | | | | 4.50 | | | | | 10/1/34 | | | | | 530,810 | |
Freddie Mac | | | | 8,063 | | | | | 5.00 | | | | | 10/1/25 | | | | | 8,917 | |
Freddie Mac | | | | 390,843 | | | | | 5.00 | | | | | 5/1/28 | | | | | 436,267 | |
| | | | | | | | | | | | | | | | | | | | |
| | | | |
| | | | | | | | | | | | | | | | | | | 5,955,467 | |
| | | | | | | | | | | | | | | | | | | | |
Federal National Mortgage Association - 17.3% | | | | | | | | | | | | | | | | | | | | |
Fannie Mae | | | | 1,245,539 | | | | | 2.35 | | | | | 5/1/23 | | | | | 1,281,985 | |
Fannie Mae | | | | 2,301,170 | | | | | 2.50 | | | | | 6/1/31 | | | | | 2,409,285 | |
Fannie Mae | | | | 955,683 | | | | | 2.50 | | | | | 2/1/35 | | | | | 1,001,334 | |
Fannie Mae | | | | 1,634,619 | | | | | 2.99 | | | | | 3/1/22 | | | | | 1,654,823 | |
Fannie Mae | | | | 140,724 | | | | | 3.00 | | | | | 8/1/28 | | | | | 148,352 | |
Fannie Mae | | | | 724,596 | | | | | 3.00 | | | | | 9/1/32 | | | | | 761,841 | |
Fannie Mae | | | | 1,641,910 | | | | | 3.00 | | | | | 6/1/40 | | | | | 1,758,163 | |
Fannie Mae | | | | 302,669 | | | | | 3.50 | | | | | 1/1/26 | | | | | 322,869 | |
Fannie Mae | | | | 804,164 | | | | | 3.50 | | | | | 2/1/32 | | | | | 859,965 | |
Fannie Mae | | | | 1,735,209 | | | | | 3.50 | | | | | 8/1/33 | | | | | 1,875,077 | |
Fannie Mae | | | | 686,780 | | | | | 3.50 | | | | | 5/1/35 | | | | | 739,777 | |
Fannie Mae | | | | 9,190 | | | | | 4.00 | | | | | 9/1/24 | | | | | 9,778 | |
Fannie Mae | | | | 64,940 | | | | | 4.00 | | | | | 6/1/25 | | | | | 69,144 | |
Fannie Mae | | | | 13,735 | | | | | 4.00 | | | | | 10/1/31 | | | | | 15,066 | |
Fannie Mae | | | | 1,072,935 | | | | | 4.00 | | | | | 10/1/34 | | | | | 1,143,867 | |
Fannie Mae | | | | 2,659,910 | | | | | 4.00 | | | | | 1/1/39 | | | | | 2,945,126 | |
Fannie Mae | | | | 54,088 | | | | | 4.50 | | | | | 4/1/25 | | | | | 57,545 | |
Fannie Mae | | | | 4 | | | | | 5.50 | | | | | 10/1/21 | | | | | 4 | |
Fannie Mae | | | | 636,197 | | | | | 5.50 | | | | | 8/1/40 | | | | | 758,018 | |
Fannie Mae | | | | 831,397 | | | | | 5.50 | | | | | 2/1/42 | | | | | 974,133 | |
| | | | | | | | | | | | | | | | | | | | |
| | | | |
| | | | | | | | | | | | | | | | | | | 18,786,152 | |
| | | | | | | | | | | | | | | | | | | | |
| | | | |
See accompanying notes to financial statements. | | | | |
16 | | | SIT MUTUAL FUNDS ANNUAL REPORT | |
| | | | | | | | | | | | | | | | | | | | |
| | | | | |
| Name of Issuer | | Principal
Amount ($) | | Coupon
Rate (%) | | Maturity
Date | | Fair
Value ($) |
| | | | |
Government National Mortgage Association - 0.7% | | | | | | | | | | | | | | | | | | | | |
Ginnie Mae, US Treasury + 1.50% 1 | | | | 26,424 | | | | | 2.88 | | | | | 4/20/33 | | | | | 27,660 | |
Ginnie Mae, US Treasury + 1.50% 1 | | | | 5,509 | | | | | 2.88 | | | | | 4/20/42 | | | | | 5,757 | |
Ginnie Mae | | | | 4,063 | | | | | 5.00 | | | | | 12/20/23 | | | | | 4,180 | |
Ginnie Mae | | | | 4,772 | | | | | 5.00 | | | | | 9/15/24 | | | | | 4,977 | |
Ginnie Mae | | | | 23,300 | | | | | 5.00 | | | | | 6/20/26 | | | | | 25,171 | |
Ginnie Mae | | | | 584,525 | | | | | 6.00 | | | | | 7/20/37 | | | | | 695,644 | |
| | | | | | | | | | | | | | | | | | | | |
| | | | |
| | | | | | | | | | | | | | | | | | | 763,389 | |
| | | | | | | | | | | | | | | | | | | | |
| | | | |
Other Federal Agency Securities - 1.8% | | | | | | | | | | | | | | | | | | | | |
Small Business Administration Pools, PRIME - 2.50% 1 | | | | 559,219 | | | | | 0.75 | | | | | 5/25/43 | | | | | 557,312 | |
Small Business Administration Pools, PRIME + 0.80% 1 | | | | 1,002,460 | | | | | 4.05 | | | | | 2/25/28 | | | | | 1,064,654 | |
Small Business Administration Pools, PRIME + 0.76% 1 | | | | 344,246 | | | | | 4.07 | | | | | 3/25/30 | | | | | 366,305 | |
| | | | | | | | | | | | | | | | | | | | |
| | | | |
| | | | | | | | | | | | | | | | | | | 1,988,271 | |
| | | | | | | | | | | | | | | | | | | | |
| | | | |
Total Mortgage Pass-Through Securities
(cost: $27,357,291) | | | | | | | | | | | | | | | | | | | 27,493,279 | |
| | | | | | | | | | | | | | | | | | | | |
Taxable Municipal Bonds - 8.1% | | | | | | | | | | | | | | | | | | | | |
Bay Area Toll Authority | | | | 500,000 | | | | | 1.43 | | | | | 4/1/27 | | | | | 491,735 | |
Berks County Industrial Development Authority | | | | 140,000 | | | | | 3.20 | | | | | 5/15/21 | | | | | 140,096 | |
Chino, CA Public Financing Authority | | | | 215,000 | | | | | 1.70 | | | | | 9/1/26 | | | | | 219,324 | |
Colorado Housing & Finance Authority | | | | 5,000 | | | | | 4.00 | | | | | 11/1/31 | | | | | 5,166 | |
County of Yamhill OR | | | | 500,000 | | | | | 4.50 | | | | | 10/1/30 | | | | | 528,135 | |
Florida Capital Projects Finance Authority | | | | 1,000,000 | | | | | 4.00 | | | | | 10/1/24 | | | | | 995,610 | |
Jersey City, NJ G.O. | | | | 335,000 | | | | | 1.13 | | | | | 9/1/26 | | | | | 329,164 | |
Kansas City Industrial Development Authority | | | | 1,000,000 | | | | | 1.75 | | | | | 3/1/26 | | | | | 1,004,540 | |
Massachusetts Educational Financing Authority | | | | 285,000 | | | | | 4.00 | | | | | 1/1/32 | | | | | 288,688 | |
Massachusetts Educational Financing Authority | | | | 595,000 | | | | | 4.41 | | | | | 7/1/34 | | | | | 619,139 | |
New Hampshire Housing Finance Authority | | | | 220,000 | | | | | 4.00 | | | | | 7/1/35 | | | | | 226,019 | |
New Hampshire Housing Finance Authority | | | | 5,000 | | | | | 4.00 | | | | | 1/1/37 | | | | | 5,280 | |
New Jersey Economic Development Authority | | | | 365,000 | | | | | 4.43 | | | | | 12/1/21 | | | | | 368,986 | |
New Jersey Turnpike Authority 4 | | | | 1,000,000 | | | | | 3.22 | | | | | 1/1/35 | | | | | 1,021,350 | |
New York City Transitional Finance Authority Future Tax Secured Revenue | | | | 750,000 | | | | | 6.27 | | | | | 8/1/39 | | | | | 754,050 | |
Pueblo County, CO C.O.P. | | | | 700,000 | | | | | 1.07 | | | | | 9/15/26 | | | | | 682,010 | |
St. Charles, LA Parish School District No. 1 | | | | 250,000 | | | | | 2.00 | | | | | 3/1/27 | | | | | 254,982 | |
Tennessee Housing Development Agency | | | | 50,000 | | | | | 3.50 | | | | | 7/1/31 | | | | | 51,113 | |
Wisconsin Housing & Economic Development Authority 8 | | | | 565,000 | | | | | 3.50 | | | | | 3/1/46 | | | | | 597,256 | |
Wisconsin Public Finance Authority (Statler Hilton) 6 | | | | 355,000 | | | | | 3.50 | | | | | 12/15/27 | | | | | 261,571 | |
| | | | | | | | | | | | | | | | | | | | |
| | | | |
Total Taxable Municipal Bonds
(cost: $8,842,527) | | | | | | | | | | | | | | | | | | | 8,844,214 | |
| | | | | | | | | | | | | | | | | | | | |
U.S. Treasury / Federal Agency Securities - 20.5% | | | | | | | | | | | | | | | | | | | | |
Federal Agency Issues - 2.6% | | | | | | | | | | | | | | | | | | | | |
Federal Agricultural Mortgage Corp., 3 Mo. Libor + 0.37% 1 | | | | 250,000 | | | | | 0.56 | | | | | 3/9/23 | | | | | 251,515 | |
Pershing Road Development Co., LLC, 3 Mo. Libor + 0.40% 1, 4 | | | | 1,996,849 | | | | | 0.59 | | | | | 9/1/26 | | | | | 1,922,157 | |
U.S. Department of Housing and Urban Development | | | | 690,000 | | | | | 4.28 | | | | | 8/1/27 | | | | | 698,204 | |
| | | | | | | | | | | | | | | | | | | | |
| | | | |
| | | | | | | | | | | | | | | | | | | 2,871,876 | |
| | | | | | | | | | | | | | | | | | | | |
U.S. Treasury - 17.9% | | | | | | | | | | | | | | | | | | | | |
U.S. Treasury Bill 6 | | | | 2,000,000 | | | | | 0.01 | | | | | 4/8/21 | | | | | 1,999,997 | |
U.S. Treasury Inflation Indexed Bonds | | | | 5,378,000 | | | | | 0.13 | | | | | 4/15/22 | | | | | 5,531,567 | |
U.S. Treasury Inflation Indexed Bonds | | | | 2,957,500 | | | | | 0.13 | | | | | 7/15/22 | | | | | 3,074,067 | |
| | | | |
See accompanying notes to financial statements. | | | | |
MARCH 31, 2021 | | | 17 | |
SCHEDULE OF INVESTMENTS
March 31, 2021
Sit Quality Income Fund (Continued)
| | | | | | | | | | | | | | | | | | | | |
| Name of Issuer | | Principal
Amount ($)/
Quantity | | Coupon
Rate (%) | | Maturity
Date | | Fair Value ($) |
| | | | |
U.S. Treasury Inflation Indexed Bonds | | | | 7,479,516 | | | | | 0.13 | | | | | 1/15/23 | | | | | 7,843,997 | |
U.S. Treasury Inflation Indexed Bonds | | | | 911,430 | | | | | 0.13 | | | | | 4/15/25 | | | | | 986,427 | |
| | | | | | | | | | | | | | | | | | | | |
| | | | |
| | | | | | | | | | | | | | | | | | | 19,436,055 | |
| | | | | | | | | | | | | | | | | | | | |
Total U.S. Treasury / Federal Agency Securities
(cost: $22,176,456) | | | | | | | | | | | | | | | | | | | 22,307,931 | |
| | | | | | | | | | | | | | | | | | | | |
| | | | |
Short-Term Securities - 1.3% | | | | | | | | | | | | | | | | | | | | |
Fidelity Inst. Money Mkt. Gvt. Fund, 0.01% | | | | 1,402,634 | | | | | | | | | | | | | | | 1,402,634 | |
| | | | | | | | | | | | | | | | | | | | |
(cost: $1,402,634) | | | | | | | | | | | | | | | | | | | | |
Total Investments in Securities - 99.0%
(cost: $106,868,669) | | | | | | | | | | | | | | | | | | | 107,747,843 | |
| | | | | | | | | | | | | | | | | | | | |
Call Options Written 19 - 0.0% | | | | | | | | | | | | | | | | | | | | |
(premiums received: $86,952) | | | | | | | | | | | | | | | | | | | (39,688 | ) |
Other Assets and Liabilities, net - 1.0% | | | | | | | | | | | | | | | | | | | 1,086,322 | |
| | | | | | | | | | | | | | | | | | | | |
| | | | |
Total Net Assets - 100.0% | | | | | | | | | | | | | | | | | | $ | 108,794,477 | |
| | | | | | | | | | | | | | | | | | | | |
| 1 | Variable rate security. Rate disclosed is as of March 31, 2021. Certain variable rate securities are not based on a published reference rate and spread but are determined by the issuer or agent and are based on current market conditions, or, for mortgage-backed securities, are impacted by the individual mortgages which are paying off over time. These securities do not indicate a reference rate and spread in their descriptions. |
| 4 | 144A Restricted Security. The total value of such securities as of March 31, 2021 was $22,096,082 and represented 20.3% of net assets. These securities have been determined to be liquid by the Adviser in accordance with guidelines established by the Board of Directors. |
| 6 | Zero coupon or convertible capital appreciation bond, for which the rate disclosed is either the effective yield on purchase date or the coupon rate to be paid upon conversion to coupon paying. |
| 8 | Securities the income from which is treated as a tax preference that is included in alternative minimum taxable income for purposes of computing federal alternative minimum tax (AMT). At March 31, 2021, 0.5% of net assets in the Fund was invested in such securities. |
| 14 | Step Coupon: A bond that pays a coupon rate that increases on a specified date(s). Rate disclosed is as of March 31, 2021. |
Numeric footnotes not disclosed are not applicable to this Schedule of Investments.
(19) Options outstanding as of March 31, 2021 were as follows:
| | | | | | | | | | | | | | | | | | | | | | |
| Description | | Contracts | | Strike
Price ($) | | Expiration
Date | | | Counterparty | | Notional
Amount ($) | | | Cost/
Premiums ($) | | | Value ($) | |
Call Options Written - U.S. Treasury Futures: | | | | | | | | | | | | | | | | | | |
5-Year | | 127 | | 124 | | | April 2021 | | | StoneX Financial, Inc. | | | 15,684,500 | | | | (86,952) | | | | (39,688) | |
Short futures contracts outstanding as of March 31, 2021 were as follows:
| | | | | | | | | | | | | | |
| | | | | | | | | | | Value/ | |
| | | | | | | | | | | Unrealized | |
| | | | | | Expiration | | Notional | | | Appreciation | |
| Type | | Contracts | | | Date | | Amount ($) | | | (Depreciation) ($) | |
| | | | |
Short Futures: 10 | | | | | | | | | | | | | | |
U.S. Treasury 5-Year | | | 230 | | | June 2021 | | | (28,381,641) | | | | 100,505 | |
| 10 | The amount of $500,000 in cash was segregated with the broker to cover margin requirements for derivative transactions as of March 31, 2021. |
| | | | |
See accompanying notes to financial statements. | | | | |
18 | | | SIT MUTUAL FUNDS ANNUAL REPORT | |
A summary of the levels for the Fund’s investments as of March 31, 2021 is as follows (see Note 2-significant accounting policies in the notes to financial statements):
| | | | | | | | | | | | | | | | |
| | | Investment in Securities | |
| | | Level 1 | | | Level 2 | | | Level 3 | | | | |
| | | Quoted | | | Other Significant | | | Other Significant | | | | |
| | | Price ($) | | | Observable Inputs ($) | | | Observable Inputs ($) | | | Total ($) | |
Assets | | | | | | | | | | | | | | | | |
Asset-Backed Securities | | | — | | | | 6,708,009 | | | | — | | | | 6,708,009 | |
Collateralized Mortgage Obligations | | | — | | | | 10,885,141 | | | | — | | | | 10,885,141 | |
Corporate Bonds | | | — | | | | 30,106,635 | | | | — | | | | 30,106,635 | |
Mortgage Pass-Through Securities | | | — | | | | 27,493,279 | | | | — | | | | 27,493,279 | |
Taxable Municipal Bonds | | | — | | | | 8,844,214 | | | | — | | | | 8,844,214 | |
U.S. Treasury / Federal Agency Securities | | | — | | | | 22,307,931 | | | | — | | | | 22,307,931 | |
Short-Term Securities | | | 1,402,634 | | | | — | | | | — | | | | 1,402,634 | |
Futures | | | 416,731 | | | | — | | | | — | | | | 416,731 | |
| | | 1,819,365 | | | | 106,345,209 | | | | — | | | | 108,164,574 | |
Liabilities | | | | | | | | | | | | | | | | |
Call Options Written | | | (39,688 | ) | | | — | | | | — | | | | (39,688 | ) |
There were no transfers into or out of level 3 during the reporting period.
| | | | |
See accompanying notes to financial statements. | | | | |
MARCH 31, 2021 | | | 19 | |
OBJECTIVE & STRATEGY
The objective of the Tax-Free Income Fund is to provide a high level of current income that is exempt from federal income tax, consistent with preservation of capital, by investing primarily in investment-grade municipal securities.
Such municipal securities generate interest income that is exempt from both federal regular income tax and federal alternative minimum tax. During normal market conditions, the Fund invests 100% of its net assets in such tax-exempt municipal securities.
Fund Performance
The Sit Tax-Free Income Fund provided a return of +6.73% during the fiscal year ended March 31, 2021, versus a return of +5.07% for its benchmark, the Bloomberg Barclays 5-Year Municipal Bond Index. As of March 31, 2021, the Fund’s 30-day SEC yield was 1.90%, compared to the yield of 0.67% for the benchmark index. The Fund’s 12-month distribution rate was 2.93%.
Factors that Influenced the Fund’s Performance
The tax-exempt yield curve shifted lower and steepened during the past year with short yields falling the most. Yields for short maturities fell approximately 60-90 basis points from COVID-19 crisis levels at the beginning of the year. Meanwhile, yields for intermediate to long maturities fell to historic lows in August before bouncing up to end the year down 20-25 basis points. Tax-exempt fund flows provided exceptionally strong support for the municipal market throughout much of the period. Outflows triggered by the crisis reversed in the second quarter of 2020 and net positive inflows exceeded $77B for the fiscal year. Municipal issuance for the fiscal year was about $450B, which slightly exceeded the prior fiscal year yet was easily absorbed by the market. Credit spreads for tax-exempt bonds were largely unchanged for the year for AA-rated and A-rated credits. BBB-rated spreads, which had widened in response to the pandemic leading into the fiscal year, narrowed somewhat.
The Fund benefited from a larger weighting of long duration bonds relative to the benchmark over the last year, as longer bonds significantly outperformed shorter bonds. In terms of quality, performance was directly correlated with credit risk as BBB-rated bonds were the best performing part of the index and AAA-rated bonds the worst. The Fund’s exposure to BBB-rated bonds as well as significant allocation to below investment grade and non-rated bonds were the biggest reasons the Fund outperformed its benchmark for the year. As such, the Fund benefited from holdings in multi-family mortgage revenue bonds, education/student loan revenue bonds, other revenue bonds and closed-end funds. Conversely, the Fund’s significant weighting in single-family mortgage revenue bonds lagged the benchmark.
Outlook and Positioning
The economic impact of the pandemic remains a concern for investors, but state and local governments have already received significant assistance from the federal government with more to come in
HYPOTHETICAL GROWTH OF $10,000
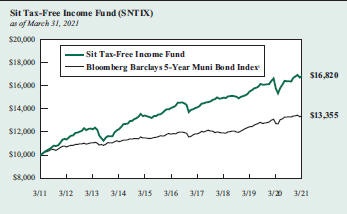
The chart above illustrates the total value of a hypothetical $10,000 investment in the Fund over the past 10 years (or for the life of the Fund if shorter) as compared to the performance of the Bloomberg Barclays 5-Year Municipal Bond Index. Past performance does not guarantee future results. Returns include the reinvestment of distributions. The chart does not reflect the deduction of taxes that a shareholder would pay on Fund distributions or the redemption of Fund shares.
1 The Bloomberg Barclays 5-Year Municipal Bond Index is the 5 year (4-6) component of the Municipal Bond Index, an unmanaged, rules-based, market-value-weighted index for the long-term tax-exempt bond market. The index includes bonds with a minimum credit rating of BBB. The returns include the reinvestment of income and do not include any transaction costs, management fees or other costs. It is not possible to invest directly in an index. This is the Fund’s primary index.
the form of the American Rescue Plan, which was enacted on March 11, 2021.
The Fund’s core strategy continues to emphasize current income as the primary driver of returns over the long run. Housing-related sectors remain a meaningful percentage of the Fund, totaling more than 40% of Fund assets, and continue to present an attractive relative value. Similarly, over 20% of the Fund remains invested in non-rated bonds which provide an attractive income advantage. We will add to higher coupon bonds when available and continue to focus deeply on credit analysis to take advantage of opportunities as they arise, which we expect to be limited in the current environment. The Fund remains diversified on a geographic and issuer basis to mitigate credit and liquidity risk, and we believe the Fund is well-positioned to achieve attractive risk-adjusted returns going forward.
Paul J. Jungquist, CFA
Senior Portfolio Manager
| | |
| Information on this page is unaudited. |
20 | | SIT MUTUAL FUNDS ANNUAL REPORT |
COMPARATIVE RATES OF RETURNS
as of March 31, 2021
| | | | | | | | | | | | |
| | | Sit
Tax-Free
Income
Fund | | | Bloomberg
Barclays
5-Year Muni
Bond Index1 | | | Lipper
General
Muni Bond
Fund Index2 | |
| | | |
One Year | | | 6.73% | | | | 5.07% | | | | 7.54% | |
Five Years | | | 3.66 | | | | 2.52 | | | | 3.72 | |
Ten Years | | | 5.34 | | | | 2.94 | | | | 5.03 | |
Since Inception (9/29/88) | | | 5.13 | | | | 4.84 | | | | 5.46 | |
Performance figures are historical and do not guarantee future results. Investment returns and principal value will vary, and you may have a gain or loss when you sell shares. Current performance may be lower or higher than the performance data quoted. Contact the Fund for performance data current to the most recent month-end. Returns include changes in share price as well as reinvestment of all dividends and capital gains and all fee waivers. Without the fee waivers total return and yield figures would have been lower. Returns do not reflect the deduction of taxes that a shareholder would pay on Fund distributions or the redemption of Fund shares. Management fees and administrative expenses are included in the Fund’s performance. Returns for periods greater than one year are compounded average annual rates of return.
1 The Bloomberg Barclays 5-Year Municipal Bond Index is the 5 year (4-6) component of the Municipal Bond Index, an unmanaged, rules-based, market-value-weighted index for the long-term tax-exempt bond market. The index includes bonds with a minimum credit rating of BBB. The returns include the reinvestment of income and do not include any transaction costs, management fees or other costs. It is not possible to invest directly in an index.
2 The Lipper returns are obtained from Lipper Analytical Services, Inc., a large independent evaluator of mutual funds.
FUND DIVERSIFICATION
| | | | |
Multifamily Mortgage | | | 25.0% | |
Single Family Mortgage | | | 18.2 | |
Other Revenue Bonds | | | 12.1 | |
Education/Student Loan | | | 10.0 | |
Insured | | | 7.3 | |
General Obligation | | | 6.3 | |
Investment Companies | | | 5.5 | |
Sectors less than 5% | | | 11.6 | |
Cash & Other Net Assets | | | 4.0 | |
Based on total net assets as of March 31, 2021. Subject to change.
PORTFOLIO SUMMARY
| | |
Net Asset Value 3/31/21: | | $9.91 Per Share |
Net Asset Value 3/31/20: | | $9.56 Per Share |
Total Net Assets: | | $348.2 Million |
Average Maturity: | | 19.5 Years |
Effective Duration3: | | 5.1 Years |
3 Duration is a measure of estimated price sensitivity relative to changes in interest rates. Portfolios with longer durations are typically more sensitive to changes in interest rates. For example, if interest rates rise by 1%, the fair value of a security with an effective duration of 5 years would decrease by 5%, with all other factors being constant. The correlation between duration and price sensitivity is greater for securities rated investment-grade than it is for securities rated below investment-grade. Duration estimates are based on assumptions by the Adviser and are subject to a number of limitations. Effective duration is calculated based on historical price changes of securities held by the Fund, and therefore is a more accurate estimate of price sensitivity provided interest rates remain within their historical range.
QUALITY RATINGS (% of Total Net Assets)
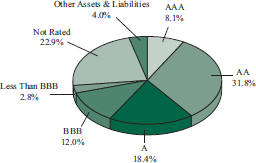
Lower of Moody’s, S&P, Fitch or Duff & Phelps ratings used.
Adviser’s Assessment of Non-Rated Securities
| | | | |
AA | | | 0.2% | |
BBB | | | 0.9 | |
BB | | | 19.0 | |
<BB | | | 2.8 | |
| | | | |
Total | | | 22.9% | |
| | |
| Information on this page is unaudited. |
| MARCH 31, 2021 | | 21 |
SCHEDULE OF INVESTMENTS
March 31, 2021
Sit Tax-Free Income Fund
| | | | | | | | | | | | | | | | | | | | |
| Name of Issuer | | Principal
Amount ($) | | Coupon
Rate (%) | | Maturity
Date | | Fair
Value ($) |
| | | | |
Municipal Bonds - 90.5% | | | | | | | | | | | | | | | | | | | | |
| | | | |
Alabama - 0.4% | | | | | | | | | | | | | | | | | | | | |
Clio Water & Sewer Rev. (AGM Insured) | | | | 340,000 | | | | | 3.10 | | | | | 1/1/33 | | | | | 340,598 | |
Mobile Co. Limited Obligation Warrants Rev. (Gomesa Proj.) 4 | | | | 500,000 | | | | | 4.00 | | | | | 11/1/45 | | | | | 501,065 | |
Pell City Special Care Facs. Finance Auth. Rev. (Noland Health Services, Inc.) | | | | 500,000 | | | | | 5.00 | | | | | 12/1/31 | | | | | 512,185 | |
| | | | | | | | | | | | | | | | | | | | |
| | | | |
| | | | | | | | | | | | | | | | | | | 1,353,848 | |
| | | | | | | | | | | | | | | | | | | | |
Alaska - 0.3% | | | | | | | | | | | | | | | | | | | | |
AK Hsg. Finance Corp. Rev. (State Capital Proj.) | | | | 500,000 | | | | | 4.00 | | | | | 6/1/36 | | | | | 545,775 | |
AK Industrial Dev. & Export Auth. Rev. (Boys & Girls Home) 2, 5, 15 | | | | 250,000 | | | | | 5.50 | | | | | N/A | | | | | 10,312 | |
AK Industrial Dev. & Export Auth. Rev. (GTR Fairbanks Community Hospital Foundation) | | | | 250,000 | | | | | 5.00 | | | | | 4/1/33 | | | | | 267,827 | |
AK Industrial Dev. & Export Auth. Rev. (Tanana Chiefs Conference Proj.) | | | | 300,000 | | | | | 4.00 | | | | | 10/1/49 | | | | | 332,739 | |
| | | | | | | | | | | | | | | | | | | | |
| | | | |
| | | | | | | | | | | | | | | | | | | 1,156,653 | |
| | | | | | | | | | | | | | | | | | | | |
Arizona - 2.9% | | | | | | | | | | | | | | | | | | | | |
AZ Health Facs. Auth. Rev. (Scottsdale Lincoln Hospital Proj.) 1 | | | | 250,000 | | | | | 4.00 | | | | | 12/1/39 | | | | | 250,187 | |
AZ Industrial Dev. Auth. Rev. (Legacy Cares, Inc. Proj.) 4 | | | | 750,000 | | | | | 6.75 | | | | | 7/1/30 | | | | | 801,420 | |
AZ Industrial Dev. Auth. Rev. (Legacy Cares, Inc. Proj.) 4 | | | | 750,000 | | | | | 7.75 | | | | | 7/1/50 | | | | | 813,247 | |
AZ Industrial Dev. Auth. Rev. (Pinecrest Academy Horizon) 4 | | | | 500,000 | | | | | 5.75 | | | | | 7/15/38 | | | | | 574,255 | |
AZ Industrial Dev. Auth. Rev. (Social Bond Equitable School Revolving Fund) | | | | 500,000 | | | | | 4.00 | | | | | 11/1/45 | | | | | 567,835 | |
Glendale Industrial Dev. & Auth. Rev. (Beatitudes Campus Proj.) | | | | 300,000 | | | | | 5.00 | | | | | 11/15/36 | | | | | 321,048 | |
La Paz Co. Industrial Dev. Auth. (Charter School Solutions Harmony Public Proj.) | | | | 750,000 | | | | | 5.00 | | | | | 2/15/48 | | | | | 857,572 | |
Maricopa Co. Industrial Dev. Auth. Education Rev. (Horizon Community Learning Center) | | | | 300,000 | | | | | 5.00 | | | | | 7/1/35 | | | | | 325,236 | |
Maricopa Co. Industrial Dev. Auth. Rev. (Lagacy Traditional School Proj.) | | | | 500,000 | | | | | 4.00 | | | | | 7/1/50 | | | | | 534,685 | |
Maricopa Co. Industrial Dev. Auth. Rev. (Paradise School Proj.) | | | | 1,000,000 | | | | | 4.00 | | | | | 7/1/54 | | | | | 1,134,800 | |
Peoria Industrial Dev. Auth. Rev. (Sierra Winds Life Care Community) | | | | 400,000 | | | | | 5.25 | | | | | 11/15/29 | | | | | 398,332 | |
Phoenix City Industrial Dev. Auth. Rev. (Northwest Christian School Proj.) 4 | | | | 600,000 | | | | | 5.00 | | | | | 9/1/45 | | | | | 649,068 | |
Phoenix City Industrial Dev. Auth. Rev. (Vista College Preparatory Proj.) | | | | 400,000 | | | | | 4.13 | | | | | 7/1/38 | | | | | 446,524 | |
Pima Co. Industrial Dev. Auth. Education Rev. (American Leadership Academy Proj.) 4 | | | | 1,000,000 | | | | | 5.38 | | | | | 6/15/35 | | | | | 1,084,680 | |
Pima Co. Industrial Dev. Auth. Education Rev. (American Leadership Academy Proj.) 4 | | | | 370,000 | | | | | 4.75 | | | | | 6/15/37 | | | | | 375,953 | |
Quechan Indian Tribe of Fort Yuma Rev. (Tribal Economic Dev.) | | | | 325,000 | | | | | 9.75 | | | | | 5/1/25 | | | | | 338,578 | |
Tempe Industrial Dev. Auth. Rev. (Mirabella at ASU Proj.) 4 | | | | 500,000 | | | | | 4.70 | | | | | 10/1/24 | | | | | 500,270 | |
| | | | | | | | | | | | | | | | | | | | |
| | | | |
| | | | | | | | | | | | | | | | | | | 9,973,690 | |
| | | | | | | | | | | | | | | | | | | | |
Arkansas - 0.5% | | | | | | | | | | | | | | | | | | | | |
Rogers City Rev. | | | | 1,000,000 | | | | | 3.88 | | | | | 11/1/39 | | | | | 1,112,700 | |
Springdale City Sales & Use Tax Rev. Ref. (BAM Insured) | | | | 500,000 | | | | | 3.60 | | | | | 4/1/41 | | | | | 517,130 | |
| | | | | | | | | | | | | | | | | | | | |
| | | | |
| | | | | | | | | | | | | | | | | | | 1,629,830 | |
| | | | | | | | | | | | | | | | | | | | |
California - 4.5% | | | | | | | | | | | | | | | | | | | | |
CA Health Facs. Financing Auth. Rev. (On Lok Senior Health Services) | | | | 500,000 | | | | | 5.00 | | | | | 8/1/50 | | | | | 601,415 | |
CA School Facs. Finance Auth. Rev. (Azusa Unified School District) (AGM Insured) 6 | | | | 500,000 | | | | | 6.00 | | | | | 8/1/29 | | | | | 634,795 | |
Carlsbad Unified School District G.O. Capital Appreciation 6 | | | | 400,000 | | | | | 6.00 | | | | | 8/1/31 | | | | | 540,700 | |
Colton Joint Unified School District G.O. (AGM Insured) 6 | | | | 1,000,000 | | | | | 6.00 | | | | | 8/1/35 | | | | | 1,245,840 | |
Encinitas Union School District G.O. Capital Appreciation 6 | | | | 500,000 | | | | | 7.00 | | | | | 8/1/35 | | | | | 722,475 | |
Hartnell Community College G.O. 6 | | | | 500,000 | | | | | 7.00 | | | | | 8/1/34 | | | | | 613,630 | |
Healdsburg Unified School District G.O. 6 | | | | 1,250,000 | | | | | 5.00 | | | | | 8/1/37 | | | | | 1,362,588 | |
Imperial Community College District G.O. Capital Appreciation (AGM Insured) 6 | | | | 250,000 | | | | | 6.75 | | | | | 8/1/40 | | | | | 315,132 | |
Los Alamitos Unified School District Capital Appreciation C.O.P. 6 | | | | 1,100,000 | | | | | 6.00 | | | | | 8/1/34 | | | | | 1,243,935 | |
Martinez Unified School District G.O. 6 | | | | 250,000 | | | | | 6.13 | | | | | 8/1/35 | | | | | 298,010 | |
Orange Co. Community Facs. District No. 2017-1 Special Assessment (Village of Esencia) | | | | 500,000 | | | | | 4.00 | | | | | 8/15/45 | | | | | 552,950 | |
Placentia-Yorba Linda Unified School District C.O.P. Capital Appreciation (AGM Insured) 6 | | | | 500,000 | | | | | 6.25 | | | | | 10/1/28 | | | | | 513,975 | |
Redondo Beach School District G.O. 6 | | | | 600,000 | | | | | 6.38 | | | | | 8/1/34 | | | | | 772,362 | |
| | | | |
See accompanying notes to financial statements. | | | | |
22 | | | SIT MUTUAL FUNDS ANNUAL REPORT | |
| | | | | | | | | | | | | | | | | | | | |
| Name of Issuer | | Principal
Amount ($) | | Coupon
Rate (%) | | Maturity
Date | | Fair Value ($) |
| | | | |
Reef-Sunset Unified School District (BAM Insured) 6 | | | | 750,000 | | | | | 5.00 | | | | | 8/1/38 | | | | | 858,082 | |
Ripon Unified School District G.O. (BAM Insured) 6 | | | | 270,000 | | | | | 4.50 | | | | | 8/1/30 | | | | | 294,770 | |
Ripon Unified School District G.O. (BAM Insured) 6 | | | | 80,000 | | | | | 4.50 | | | | | 8/1/30 | | | | | 87,288 | |
Sacramento Co. Water Financing Auth. Rev. (NATL-RE FGIC Insured) 1 | | | | 500,000 | | | | | 0.70 | | | | | 6/1/39 | | | | | 477,070 | |
San Jose Financing Auth. Rev. (Civic Center Garage Proj.) 9 | | | | 400,000 | | | | | 5.00 | | | | | 6/1/39 | | | | | 434,196 | |
South Tahoe Joint Powers Financing Auth. Tax Allocation Ref. (South Tahoe Redev. Proj.) (AGM Insured) | | | | 500,000 | | | | | 5.00 | | | | | 10/1/30 | | | | | 565,490 | |
Sulphur Springs Union School District C.O.P. (AGM Insured) 6 | | | | 450,000 | | | | | 6.50 | | | | | 12/1/37 | | | | | 562,986 | |
Tracy Joint Unified School District G.O. Capital Appreciation 6 | | | | 600,000 | | | | | 7.00 | | | | | 8/1/41 | | | | | 650,166 | |
Tustin Unified School District G.O. Capital Appreciation 6 | | | | 500,000 | | | | | 6.00 | | | | | 8/1/28 | | | | | 509,385 | |
Upland Unified School District G.O. Capital Appreciation 6 | | | | 1,000,000 | | | | | 7.00 | | | | | 8/1/41 | | | | | 1,267,250 | |
Val Verde Unified School District G.O. Capital Appreciation (AGM Insured) 6 | | | | 500,000 | | | | | 6.00 | | | | | 8/1/34 | | | | | 660,815 | |
| | | | | | | | | | | | | | | | | | | | |
| | | | |
| | | | | | | | | | | | | | | | | | | 15,785,305 | |
| | | | | | | | | | | | | | | | | | | | |
Colorado - 5.3% | | | | | | | | | | | | | | | | | | | | |
Aerotropolis Regional Transportation Auth. Rev. | | | | 400,000 | | | | | 5.00 | | | | | 12/1/51 | | | | | 425,168 | |
Brighton Crossing Metropolitan District No. 6 G.O. | | | | 515,000 | | | | | 5.00 | | | | | 12/1/40 | | | | | 565,146 | |
Broadway Station Metropolitan District No. 2 G.O. | | | | 750,000 | | | | | 5.13 | | | | | 12/1/48 | | | | | 810,952 | |
Broadway Station Metropolitan District No. 3 G.O. | | | | 500,000 | | | | | 5.00 | | | | | 12/1/49 | | | | | 543,210 | |
Buffalo Highlands Metropolitan District G.O. | | | | 350,000 | | | | | 5.25 | | | | | 12/1/38 | | | | | 374,342 | |
CO Educational & Cultural Facs. Auth. Rev. (CO Springs Charter Academy Proj.) | | | | 250,000 | | | | | 5.60 | | | | | 7/1/34 | | | | | 250,910 | |
CO Health Facs. Auth. Rev. (Covenant Living Community) | | | | 500,000 | | | | | 4.00 | | | | | 12/1/50 | | | | | 550,730 | |
CO Health Facs. Auth. Rev. (Covenant Retirement Community) | | | | 650,000 | | | | | 5.00 | | | | | 12/1/48 | | | | | 738,030 | |
Copperleaf Metro District No. 4 G.O. | | | | 750,000 | | | | | 5.00 | | | | | 12/1/49 | | | | | 805,192 | |
Creekwalk Marketplace Business Improvement District Rev. 4 | | | | 500,000 | | | | | 5.50 | | | | | 12/1/39 | | | | | 548,595 | |
Crystal Crossing Metro District G.O. | | | | 500,000 | | | | | 5.25 | | | | | 12/1/40 | | | | | 537,195 | |
Denver 9th Avenue Metropolitan District No. 2 G.O. | | | | 500,000 | | | | | 5.00 | | | | | 12/1/48 | | | | | 533,245 | |
Denver City & County Housing Auth. Rev. (Sustainability Bonds - Thrive Proj.) | | | | 500,000 | | | | | 2.05 | | | | | 2/1/39 | | | | | 485,395 | |
Denver Urban Renewal Auth. Tax Allocation 4 | | | | 500,000 | | | | | 5.25 | | | | | 12/1/39 | | | | | 538,440 | |
DIATC Metropolitan District G.O. 4 | | | | 500,000 | | | | | 5.00 | | | | | 12/1/49 | | | | | 534,675 | |
Green Valley Ranch East Metropolitan District No. 6 G.O. | | | | 1,000,000 | | | | | 5.88 | | | | | 12/1/50 | | | | | 1,092,920 | |
Haskins Station Metropolitan District G.O. | | | | 500,000 | | | | | 5.00 | | | | | 12/1/49 | | | | | 533,160 | |
Hunters Overlook Metropolitan District No. 5 G.O. | | | | 500,000 | | | | | 5.00 | | | | | 12/1/49 | | | | | 537,530 | |
Johnstown Village Metropolitan District No. 2. G.O. | | | | 500,000 | | | | | 5.00 | | | | | 12/1/50 | | | | | 535,860 | |
Lambertson Farms Metro District No. 1 G.O. | | | | 500,000 | | | | | 5.00 | | | | | 12/15/25 | | | | | 458,680 | |
Leyden Rock Metropolitan District No. 10 G.O. | | | | 250,000 | | | | | 5.00 | | | | | 12/1/45 | | | | | 259,915 | |
Mirabelle Metropolitan Dist. No. 2 G.O. | | | | 500,000 | | | | | 5.00 | | | | | 12/1/49 | | | | | 534,705 | |
Painted Prairie Public Improvement Auth. Rev. | | | | 500,000 | | | | | 5.00 | | | | | 12/1/39 | | | | | 544,695 | |
Palisade Metropolitan District No. 2 G.O. | | | | 500,000 | | | | | 5.00 | | | | | 12/1/46 | | | | | 519,090 | |
Peak Metropolitan District No. 1 G.O. 4 | | | | 500,000 | | | | | 5.00 | | | | | 12/1/41 | | | | | 540,250 | |
Peak Metropolitan District No. 1 G.O. 4 | | | | 500,000 | | | | | 5.00 | | | | | 12/1/51 | | | | | 532,185 | |
St. Vrain Lakes Metropolitan District No. 2 G.O. | | | | 500,000 | | | | | 5.00 | | | | | 12/1/37 | | | | | 533,845 | |
STC Metropolitan District No. 2 G.O. | | | | 500,000 | | | | | 5.00 | | | | | 12/1/49 | | | | | 537,995 | |
Tallman Gulch Metropolitan District G.O. | | | | 500,000 | | | | | 5.25 | | | | | 12/1/47 | | | | | 526,340 | |
Thompson Crossing Metropolitan District No. 4 G.O. | | | | 500,000 | | | | | 5.00 | | | | | 12/1/49 | | | | | 534,510 | |
Transport Metropolitan District No. 3 G.O. | | | | 750,000 | | | | | 5.00 | | | | | 12/1/51 | | | | | 807,112 | |
Vauxmont Metropolitan District G.O. (AGM Insured) | | | | 500,000 | | | | | 3.25 | | | | | 12/15/50 | | | | | 528,610 | |
Wild Plum Metropolitan District G.O. | | | | 595,000 | | | | | 5.00 | | | | | 12/1/49 | | | | | 642,255 | |
| | | | | | | | | | | | | | | | | | | | |
| | | | |
| | | | | | | | | | | | | | | | | | | 18,440,882 | |
| | | | | | | | | | | | | | | | | | | | |
Connecticut - 0.9% | | | | | | | | | | | | | | | | | | | | |
CT Health & Educational Facs. Auth. Rev. 4 | | | | 250,000 | | | | | 3.25 | | | | | 1/1/27 | | | | | 253,848 | |
CT Health & Educational Facs. Auth. Rev. 4 | | | | 250,000 | | | | | 5.00 | | | | | 1/1/55 | | | | | 269,672 | |
CT Hsg. Finance Auth. Rev. | | | | 300,000 | | | | | 3.88 | | | | | 11/15/35 | | | | | 328,551 | |
| | | | |
See accompanying notes to financial statements. | | | | |
MARCH 31, 2021 | | | 23 | |
SCHEDULE OF INVESTMENTS
March 31, 2021
Sit Tax-Free Income Fund (Continued)
| | | | | | | | | | | | | | | | | | | | |
| Name of Issuer | | Principal Amount ($) | | Coupon Rate (%) | | Maturity Date | | Fair Value ($) |
| | | | |
CT Hsg. Finance Auth. Rev. 9 | | | | 505,000 | | | | | 4.25 | | | | | 6/15/43 | | | | | 566,605 | |
CT Hsg. Finance Auth. Rev. | | | | 1,000,000 | | | | | 3.85 | | | | | 5/15/45 | | | | | 1,027,530 | |
CT Hsg. Finance Auth. Rev. 9 | | | | 455,000 | | | | | 4.30 | | | | | 6/15/48 | | | | | 508,590 | |
| | | | | | | | | | | | | | | | | | | | |
| | | | |
| | | | | | | | | | | | | | | | | | | 2,954,796 | |
| | | | | | | | | | | | | | | | | | | | |
District of Columbia - 0.3% | | | | | | | | | | | | | | | | | | | | |
District of Columbia Hsg. Finance Agency Rev. (Multi-Family Dev. Program) | | | | 600,000 | | | | | 4.05 | | | | | 9/1/43 | | | | | 676,002 | |
District of Columbia Rev. (Ingleside Rock Creek Proj.) | | | | 500,000 | | | | | 5.00 | | | | | 7/1/37 | | | | | 528,750 | |
| | | | | | | | | | | | | | | | | | | | |
| | | | |
| | | | | | | | | | | | | | | | | | | 1,204,752 | |
| | | | | | | | | | | | | | | | | | | | |
Florida - 12.1% | | | | | | | | | | | | | | | | | | | | |
Alachua Co. Health Facs. Auth. Rev. (Oak Hammock University) | | | | 385,000 | | | | | 8.00 | | | | | 10/1/32 | | | | | 420,247 | |
Atlantic Beach, Rev. (Fleet Landing Proj.) | | | | 750,000 | | | | | 3.00 | | | | | 11/15/23 | | | | | 750,225 | |
Ave Maria Stewardship Community District Special Assessment. (AGM Insured) | | | | 295,000 | | | | | 3.00 | | | | | 5/1/38 | | | | | 314,612 | |
Blackburn Creek Community Dev. District Special Assessment (Grand Palm Proj.) | | | | 200,000 | | | | | 6.25 | | | | | 5/1/35 | | | | | 225,302 | |
Capital Trust Agency Rev. (Lutz Preparatory School, Inc. Proj.) | | | | 300,000 | | | | | 4.00 | | | | | 6/1/41 | | | | | 319,845 | |
Capital Trust Agency Rev. (River City Educational Services, Inc. Proj.) | | | | 500,000 | | | | | 5.38 | | | | | 2/1/35 | | | | | 528,970 | |
Capital Trust Agency Rev. (River City Educational Services, Inc. Proj.) | | | | 300,000 | | | | | 5.63 | | | | | 2/1/45 | | | | | 316,608 | |
Capital Trust Agency Rev. (Tallahassee Tapestry) 2, 4, 5 | | | | 550,000 | | | | | 6.75 | | | | | 12/1/35 | | | | | 220,000 | |
Capital Trust Agency Rev. (Tapestry Walden Senior Hsg. Proj.) 2, 4, 5 | | | | 250,000 | | | | | 6.75 | | | | | 7/1/37 | | | | | 87,500 | |
Capital Trust Agency Rev. (Tuscan Gardens Senior Living Center) | | | | 250,000 | | | | | 7.00 | | | | | 4/1/35 | | | | | 137,217 | |
Capital Trust Agency Rev. (University Bridge LLC Student Housing Proj.) 4 | | | | 500,000 | | | | | 5.25 | | | | | 12/1/43 | | | | | 568,360 | |
Celebration Pointe Community Dev. District Special Assessment Rev. 4 | | | | 240,000 | | | | | 5.00 | | | | | 5/1/32 | | | | | 263,386 | |
Collier Co. Industrial Dev. Auth. Rev. (Arlington of Naples Proj.) 4, 5 | | | | 250,000 | | | | | 7.25 | | | | | 5/15/26 | | | | | 193,438 | |
Collier Co. Industrial Dev. Auth. Rev. (Arlington of Naples Proj.) 4, 5 | | | | 750,000 | | | | | 8.13 | | | | | 5/15/44 | | | | | 580,312 | |
Collier Co. Industrial Dev. Auth. Rev. (NCH Healthcare System Proj.) | | | | 415,000 | | | | | 6.25 | | | | | 10/1/39 | | | | | 416,498 | |
Durbin Crossing Community Dev. District Special Assessment (AGM Insured) | | | | 520,000 | | | | | 5.00 | | | | | 5/1/32 | | | | | 635,528 | |
Escambia Co. Housing Finance Auth. Rev. (Multi-County Program) | | | | 685,000 | | | | | 3.75 | | | | | 10/1/49 | | | | | 724,819 | |
Fishhawk Ranch Community Dev. District Special Assessment (AGM Insured) | | | | 500,000 | | | | | 3.00 | | | | | 11/1/41 | | | | | 509,665 | |
FL Dev. Finance Corp. Rev. (Discovery High School Proj.) 4 | | | | 500,000 | | | | | 5.00 | | | | | 6/1/40 | | | | | 545,005 | |
FL Dev. Finance Corp. Rev. (Green Bond-Brightline Proj.) 4 | | | | 650,000 | | | | | 7.38 | | | | | 1/1/49 | | | | | 638,826 | |
FL Higher Educational Facs Financial Auth. Rev. (Rollins College Proj.) | | | | 1,000,000 | | | | | 4.00 | | | | | 12/1/50 | | | | | 1,136,620 | |
FL Hsg. Finance Corp. (GNMA/FNMA/FHLMC Collateralized) | | | | 720,000 | | | | | 4.20 | | | | | 1/1/45 | | | | | 776,606 | |
FL Hsg. Finance Corp. (GNMA/FNMA/FHLMC Collateralized) | | | | 1,000,000 | | | | | 2.10 | | | | | 7/1/46 | | | | | 964,620 | |
FL Hsg. Finance Corp. (GNMA/FNMA/FHLMC Collateralized) | | | | 425,000 | | | | | 3.30 | | | | | 7/1/49 | | | | | 439,510 | |
FL Hsg. Finance Corp. (GNMA/FNMA/FHLMC Collateralized) | | | | 1,000,000 | | | | | 2.75 | | | | | 7/1/50 | | | | | 1,017,650 | |
FL State Department of Education | | | | 1,000,000 | | | | | 4.38 | | | | | 7/1/30 | | | | | 1,010,210 | |
FRERC Community Dev. District Special Assessment | | | | 1,000,000 | | | | | 5.38 | | | | | 11/1/40 | | | | | 1,056,910 | |
Gramercy Farms Community Dev. District Special Assessment 6 | | | | 365,000 | | | | | 3.20 | | | | | 5/1/39 | | | | | 200,750 | |
Grande Pines Community Dev. District Special Assessment | | | | 635,000 | | | | | 4.00 | | | | | 5/1/51 | | | | | 636,029 | |
Harbor Bay Community Dev. District Special Assessment | | | | 295,000 | | | | | 4.10 | | | | | 5/1/48 | | | | | 313,706 | |
Heritage Harbour North Community Dev. District Special Assessment | | | | 200,000 | | | | | 5.00 | | | | | 5/1/34 | | | | | 229,664 | |
Hollywood Beach Community Dev. District Special Assessment (Public Parking Facilities Proj.) | | | | 500,000 | | | | | 4.00 | | | | | 10/1/45 | | | | | 569,200 | |
Lake Co. Educational Project. Rev. (Imagine South Lake Charter School Proj.) 4 | | | | 550,000 | | | | | 5.00 | | | | | 1/15/39 | | | | | 598,912 | |
Lake Co. Retirement Project. Rev. (Lakeside at Waterman Village Proj.) | | | | 500,000 | | | | | 5.75 | | | | | 8/15/50 | | | | | 530,025 | |
Lakes of Sarasota Community Dev. District Special Assessment | | | | 300,000 | | | | | 3.88 | | | | | 5/1/31 | | | | | 297,654 | |
Lakes of Sarasota Community Dev. District Special Assessment | | | | 500,000 | | | | | 4.13 | | | | | 5/1/31 | | | | | 498,160 | |
Lakes of Sarasota Community Dev. District Special Assessment | | | | 265,000 | | | | | 4.10 | | | | | 5/1/51 | | | | | 264,539 | |
Lakewood Ranch Stewardship District Cap. Improvement Special Assesment Rev. (Azario Proj.) | | | | 520,000 | | | | | 3.75 | | | | | 5/1/40 | | | | | 538,112 | |
Lakewood Ranch Stewardship District Cap. Improvement Special Assesment Rev. (Azario Proj.) | | | | 580,000 | | | | | 4.00 | | | | | 5/1/40 | | | | | 613,884 | |
Lakewood Ranch Stewardship District Cap. Improvement Special Assesment Rev. (Lorraine Lakes Proj.) 4 | | | | 500,000 | | | | | 3.63 | | | | | 5/1/40 | | | | | 512,640 | |
Lakewood Ranch Stewardship District Cap. Improvement Special Assesment Rev. (Northeast Sector Proj.) 4 | | | | 485,000 | | | | | 3.75 | | | | | 5/1/40 | | | | | 501,209 | |
| | | | |
See accompanying notes to financial statements. | | | | |
24 | | | SIT MUTUAL FUNDS ANNUAL REPORT | |
| | | | | | | | | | | | | | | | | | | | |
| Name of Issuer | | Principal
Amount ($) | | Coupon
Rate (%) | | Maturity
Date | | Fair Value ($) |
| | | | |
Lakewood Ranch Stewardship District Cap. Improvement Special Assessment Rev. | | | | 155,000 | | | | | 4.25 | | | | | 5/1/25 | | | | | 161,158 | |
Lakewood Ranch Stewardship District Cap. Improvement Special Assessment Rev. (Country Club East Proj.) | | | | 135,000 | | | | | 6.70 | | | | | 5/1/33 | | | | | 143,752 | |
Lakewood Ranch Stewardship District Cap. Improvement Special Assessment Rev. (Lakewood Center) | | | | 200,000 | | | | | 7.40 | | | | | 5/1/30 | | | | | 201,042 | |
Lakewood Ranch Stewardship District Cap. Improvement Special Assessment Rev. (Lakewood National) | | | | 300,000 | | | | | 5.25 | | | | | 5/1/37 | | | | | 332,640 | |
Lakewood Ranch Stewardship District Cap. Improvement Special Assessment Rev. (Lakewood Ranch) | | | | 400,000 | | | | | 5.00 | | | | | 5/1/36 | | | | | 435,260 | |
Lakewood Ranch Stewardship District Cap. Improvement Special Assessment Rev. (NE Sector Proj.) | | | | 300,000 | | | | | 5.00 | | | | | 5/1/38 | | | | | 328,635 | |
Lakewood Ranch Stewardship District Cap. Improvement Special Assessment Rev. (NE Sector Proj.) | | | | 550,000 | | | | | 5.30 | | | | | 5/1/39 | | | | | 626,544 | |
Lakewood Ranch Stewardship District Cap. Improvement Special Assessment Rev. (Webb Proj.) 4 | | | | 320,000 | | | | | 5.00 | | | | | 5/1/37 | | | | | 348,784 | |
Lakewood Ranch Stewardship District Special Assessment (Lake Club Phase 4 Proj.) | | | | 470,000 | | | | | 4.50 | | | | | 5/1/49 | | | | | 503,022 | |
Lexington Oaks Community Dev. District Special Assessment Rev. | | | | 235,000 | | | | | 5.65 | | | | | 5/1/33 | | | | | 237,881 | |
Live Oak No. 2 Community Dev. District Special Assessment | | | | 400,000 | | | | | 4.00 | | | | | 5/1/35 | | | | | 427,292 | |
Long Lake Ranch Community Dev. District Special Assessment | | | | 35,000 | | | | | 5.63 | | | | | 5/1/24 | | | | | 36,211 | |
LT Ranch Community Dev. District Special Assessment | | | | 500,000 | | | | | 4.00 | | | | | 5/1/40 | | | | | 524,580 | |
Magnolia Creek Community Dev. District Rev. 2, 5, 15 | | | | 250,000 | | | | | 5.60 | | | | | N/A | | | | | 45,000 | |
Marshall Creek Community Dev. District Cap. Improvement Special Assessment Rev. | | | | 250,000 | | | | | 5.00 | | | | | 5/1/32 | | | | | 264,238 | |
Miami-Dade Co. Transit Sales Tax Rev. | | | | 500,000 | | | | | 5.00 | | | | | 7/1/34 | | | | | 586,190 | |
New River Community Dev. District Cap. Improvement Special Assessment Rev. 2, 5, 15 | | | | 230,000 | | | | | 5.00 | | | | | N/A | | | | | 2 | |
North River Ranch Community Dev. District Cap. Improvement Special Assesment Rev. | | | | 550,000 | | | | | 4.20 | | | | | 5/1/35 | | | | | 559,960 | |
Northern Palm Beach Co. Improvement District Special Assessment | | | | 500,000 | | | | | 5.00 | | | | | 8/1/29 | | | | | 542,470 | |
Northern Palm Beach Co. Improvement District Special Assessment | | | | 250,000 | | | | | 5.00 | | | | | 8/1/37 | | | | | 282,202 | |
Orange Co. Health Facs. Auth. Rev. (Presbyterian Retirement Community Proj.) | | | | 550,000 | | | | | 5.00 | | | | | 8/1/34 | | | | | 597,372 | |
Orange Co. Health Facs. Auth. Rev. (Presbyterian Retirement Community Proj.) | | | | 500,000 | | | | | 5.00 | | | | | 8/1/35 | | | | | 553,950 | |
Orange Co. Health Facs. Auth. Rev. (Presbyterian Retirement Community Proj.) | | | | 250,000 | | | | | 5.00 | | | | | 8/1/41 | | | | | 270,738 | |
Orange Co. Hsg. Finance Auth. Rev. (GNMA/FNMA/FHLMC Collateralized) | | | | 160,000 | | | | | 3.95 | | | | | 3/1/40 | | | | | 167,613 | |
Orange Co. Hsg. Finance Auth. Rev. (GNMA/FNMA/FHLMC Collateralized) | | | | 315,000 | | | | | 4.00 | | | | | 9/1/48 | | | | | 347,505 | |
Orlando Tourist Dev. Rev. (Senior Lien Tourist Dev.) (AGM Insured) | | | | 250,000 | | | | | 5.00 | | | | | 11/1/38 | | | | | 306,145 | |
Palm Beach Co. Health Facs. Auth. Rev. (ACTS Retirement-Life Community, Inc.) | | | | 500,000 | | | | | 5.00 | | | | | 11/15/32 | | | | | 586,185 | |
Palm Beach Co. Health Facs. Auth. Rev. (Lifespace Communities, Inc.) | | | | 500,000 | | | | | 4.00 | | | | | 5/15/53 | | | | | 537,680 | |
Palm Beach Co. Health Facs. Auth. Rev. (Sinai Residences Boca Raton Proj.) | | | | 600,000 | | | | | 7.25 | | | | | 6/1/34 | | | | | 644,832 | |
Palm Beach Co. Health Facs. Auth. Rev. (Sinai Residences Boca Raton Proj.) | | | | 690,000 | | | | | 7.50 | | | | | 6/1/49 | | | | | 741,433 | |
Palm Beach Co. Health Facs. Auth. Rev. (Toby & Leon Cooperman Sinai Residences of Boca Raton) | | | | 500,000 | | | | | 5.00 | | | | | 6/1/55 | | | | | 526,685 | |
Parker Road Community Dev. Dist. Special Assessment | | | | 500,000 | | | | | 4.10 | | | | | 5/1/50 | | | | | 518,790 | |
Parkview at Long Lake Ranch Community Dev. Dist. Special Assessment | | | | 270,000 | | | | | 4.00 | | | | | 5/1/51 | | | | | 278,078 | |
Pinellas Co. Industrial Dev. Auth. Rev. | | | | 500,000 | | | | | 5.00 | | | | | 7/1/39 | | | | | 586,030 | |
Pompano Beach, Rev. (John Knox Village Proj.) | | | | 1,250,000 | | | | | 4.00 | | | | | 9/1/50 | | | | | 1,353,638 | |
River Landing Community Dev. Dist. Special Assessment | | | | 500,000 | | | | | 4.25 | | | | | 11/1/35 | | | | | 520,430 | |
Sandridge Community Dev. District Special Assessment | | | | 500,000 | | | | | 3.88 | | | | | 5/1/41 | | | | | 494,820 | |
Seven Oaks Community Dev. District Special Assessment Rev | | | | 250,000 | | | | | 5.50 | | | | | 5/1/33 | | | | | 253,112 | |
Southern Groves Community Dev. District No. 5 Special Assessment | | | | 500,000 | | | | | 4.00 | | | | | 5/1/30 | | | | | 531,975 | |
St. Johns Co. Industrial Dev. Auth. Rev. (Presbyterian Retirement Communities Obligated Group Proj.) | | | | 1,000,000 | | | | | 4.00 | | | | | 8/1/55 | | | | | 1,063,740 | |
Tolomato Community Dev. District Special Assessment | | | | 500,000 | | | | | 4.25 | | | | | 5/1/37 | | | | | 546,345 | |
Tolomato Community Dev. District Special Assessment 2, 5 | | | | 120,000 | | | | | 6.61 | | | | | 5/1/40 | | | | | 1 | |
Tolomato Community Dev. District Special Assessment 6 | | | | 185,000 | | | | | 7.00 | | | | | 5/1/40 | | | | | 176,144 | |
Tolomato Community Dev. District Special Assessment 6 | | | | 110,000 | | | | | 7.00 | | | | | 5/1/40 | | | | | 81,423 | |
Tolomato Community Dev. District Special Assessment 6 | | | | 45,000 | | | | | 7.00 | | | | | 5/1/40 | | | | | 38,257 | |
Tolomato Community Dev. District Special Assessment (AGM Insured) | | | | 500,000 | | | | | 3.75 | | | | | 5/1/40 | | | | | 552,245 | |
Trout Creek Community Dev. District Special Assessment | | | | 300,000 | | | | | 5.38 | | | | | 5/1/38 | | | | | 336,108 | |
Trout Creek Community Dev. District Special Assessment | | | | 250,000 | | | | | 4.00 | | | | | 5/1/40 | | | | | 256,895 | |
University Park Recreation District Special Assessment (BAM Insured) | | | | 750,000 | | | | | 3.50 | | | | | 5/1/50 | | | | | 815,400 | |
Waters Edge Community Dev. District Cap. Improvement Rev. | | | | 9,000 | | | | | 5.35 | | | | | 5/1/39 | | | | | 9,006 | |
Waters Edge Community Dev. District Cap. Improvement Rev. 6 | | | | 120,000 | | | | | 6.60 | | | | | 5/1/39 | | | | | 121,286 | |
| | | | |
See accompanying notes to financial statements. | | | | |
MARCH 31, 2021 | | | 25 | |
SCHEDULE OF INVESTMENTS
March 31, 2021
Sit Tax-Free Income Fund (Continued)
| | | | | | | | | | | | | | | | | | | | |
| Name of Issuer | | Principal Amount ($) | | Coupon Rate (%) | | Maturity Date | | Fair Value ($) |
| | | | |
Wiregrass Community Dev. District Special Assessment | | | | 245,000 | | | | | 5.38 | | | | | 5/1/35 | | | | | 264,326 | |
Zephyr Ridge Community Dev. District Special Assessment 2, 5, 15 | | | | 450,000 | | | | | 5.25 | | | | | N/A | | | | | 198,000 | |
| | | | | | | | | | | | | | | | | | | | |
| | | | |
| | | | | | | | | | | | | | | | | | | 41,966,023 | |
| | | | | | | | | | | | | | | | | | | | |
Georgia - 2.7% | | | | | | | | | | | | | | | | | | | | |
Clarke Co. Hospital Auth. Rev. (Piedmont Healthcare) | | | | 350,000 | | | | | 5.00 | | | | | 7/1/46 | | | | | 404,131 | |
Cobb Co. Dev. Auth. Rev. (Presbyterian Village Proj.) 4 | | | | 650,000 | | | | | 5.00 | | | | | 12/1/39 | | | | | 660,458 | |
Fulton Co. Dev. Auth. Rev. (Woodruff Arts Center) | | | | 500,000 | | | | | 5.00 | | | | | 3/15/44 | | | | | 589,615 | |
GA Housing & Finance Authority Rev. | | | | 1,280,000 | | | | | 3.80 | | | | | 12/1/37 | | | | | 1,312,998 | |
GA Housing & Finance Authority Rev. | | | | 1,000,000 | | | | | 4.00 | | | | | 12/1/37 | | | | | 1,010,620 | |
GA Housing & Finance Authority Rev. | | | | 455,000 | | | | | 3.85 | | | | | 12/1/38 | | | | | 484,129 | |
GA Housing & Finance Authority Rev. | | | | 650,000 | | | | | 3.80 | | | | | 12/1/40 | | | | | 682,818 | |
GA Housing & Finance Authority Rev. | | | | 605,000 | | | | | 3.85 | | | | | 12/1/41 | | | | | 619,018 | |
GA Housing & Finance Authority Rev. | | | | 960,000 | | | | | 3.50 | | | | | 12/1/46 | | | | | 995,856 | |
GA Housing & Finance Authority Rev. | | | | 490,000 | | | | | 4.00 | | | | | 12/1/48 | | | | | 514,549 | |
GA Housing & Finance Authority Rev. | | | | 600,000 | | | | | 4.20 | | | | | 12/1/48 | | | | | 648,456 | |
GA Tax Allocation (Beltline Proj.) | | | | 500,000 | | | | | 5.00 | | | | | 1/1/30 | | | | | 501,650 | |
Gainesville Hospital Auth. Rev. (Northeast Georgia Health System, Inc. Proj.) | | | | 500,000 | | | | | 5.00 | | | | | 2/15/37 | | | | | 590,365 | |
Glynn-Brunswick Memorial Hospital Auth. Rev. (Southeast Georgia Health System Proj.) | | | | 350,000 | | | | | 5.00 | | | | | 8/1/47 | | | | | 401,968 | |
| | | | | | | | | | | | | | | | | | | | |
| | | | |
| | | | | | | | | | | | | | | | | | | 9,416,631 | |
| | | | | | | | | | | | | | | | | | | | |
Idaho - 0.4% | | | | | | | | | | | | | | | | | | | | |
ID Health Facs. Authority Rev. (Terraces Boise Proj.) | | | | 290,000 | | | | | 7.00 | | | | | 10/1/24 | | | | | 246,416 | |
ID Health Facs. Authority Rev. (Terraces Boise Proj.) | | | | 250,000 | | | | | 7.38 | | | | | 10/1/29 | | | | | 212,155 | |
ID Health Facs. Authority Rev. (Terraces Boise Proj.) | | | | 500,000 | | | | | 8.00 | | | | | 10/1/44 | | | | | 423,795 | |
ID Hsg. & Fin. Assoc. Nonprofit Facs. Rev. (Idaho Arts Charter School Proj.) | | | | 335,000 | | | | | 5.75 | | | | | 12/1/32 | | | | | 362,547 | |
| | | | | | | | | | | | | | | | | | | | |
| | | | |
| | | | | | | | | | | | | | | | | | | 1,244,913 | |
| | | | | | | | | | | | | | | | | | | | |
Illinois - 5.8% | | | | | | | | | | | | | | | | | | | | |
Bellwood Village G.O. | | | | 500,000 | | | | | 5.88 | | | | | 12/1/27 | | | | | 545,140 | |
Bolingbrook Special Tax (AGM Insured) | | | | 998,000 | | | | | 4.00 | | | | | 3/1/30 | | | | | 1,151,772 | |
Burbank Educational Facs. Rev. (Intercultural Montessori Language School) 4 | | | | 500,000 | | | | | 6.00 | | | | | 9/1/35 | | | | | 545,485 | |
Bureau Co. Township High School Dist. No. 502 G.O. (BAM Insured) | | | | 500,000 | | | | | 6.25 | | | | | 12/1/33 | | | | | 578,915 | |
Chicago Heights G.O. (NATL-RE Insured) | | | | 500,000 | | | | | 4.50 | | | | | 12/1/29 | | | | | 555,495 | |
Chicago Midway Airport Rev. (Second Lien) | | | | 500,000 | | | | | 5.25 | | | | | 1/1/35 | | | | | 538,955 | |
Chicago Park Dist. G.O. (BAM Insured) | | | | 500,000 | | | | | 4.00 | | | | | 1/1/42 | | | | | 567,980 | |
Chicago Park Dist. G.O. (Limited Tax) | | | | 1,000,000 | | | | | 5.00 | | | | | 1/1/28 | | | | | 1,097,960 | |
IL Educational Facs. Auth. Rev. | | | | 250,000 | | | | | 4.50 | | | | | 11/1/36 | | | | | 280,832 | |
IL Educational Facs. Auth. Rev. (Field Museum of Natural History) | | | | 500,000 | | | | | 3.90 | | | | | 11/1/36 | | | | | 538,560 | |
IL Fin. Auth. Rev. (Admiral Lake Proj.) | | | | 670,000 | | | | | 5.13 | | | | | 5/15/38 | | | | | 663,561 | |
IL Fin. Auth. Rev. (Christian Homes, Inc.) | | | | 500,000 | | | | | 5.00 | | | | | 5/15/36 | | | | | 546,545 | |
IL Fin. Auth. Rev. (Edward Elmhurst Healthcare) | | | | 1,000,000 | | | | | 5.00 | | | | | 1/1/44 | | | | | 1,178,450 | |
IL Fin. Auth. Rev. (Lifespace Communities) | | | | 500,000 | | | | | 5.00 | | | | | 5/15/35 | | | | | 554,935 | |
IL Fin. Auth. Rev. (Lifespace Communities) | | | | 1,000,000 | | | | | 5.00 | | | | | 5/15/45 | | | | | 1,094,200 | |
IL Fin. Auth. Rev. (Rogers Park Montessori School Proj.) | | | | 100,000 | | | | | 5.00 | | | | | 2/1/24 | | | | | 104,089 | |
IL Fin. Auth. Rev. (Westminster Village) | | | | 500,000 | | | | | 5.25 | | | | | 5/1/38 | | | | | 519,105 | |
IL Fin. Auth. Sports Facs. Rev. (North Shore Ice Arena Proj.) | | | | 1,000,000 | | | | | 6.25 | | | | | 12/1/38 | | | | | 659,630 | |
IL G.O. | | | | 250,000 | | | | | 5.50 | | | | | 7/1/33 | | | | | 268,748 | |
IL G.O. (AGM Insured) | | | | 500,000 | | | | | 4.00 | | | | | 2/1/30 | | | | | 559,145 | |
IL Housing Dev. Auth. Rev. | | | | 500,000 | | | | | 5.38 | | | | | 12/1/28 | | | | | 505,325 | |
IL Housing Dev. Auth. Rev. (GNMA/FNMA/FHLMC Collateralized) | | | | 290,000 | | | | | 3.88 | | | | | 4/1/41 | | | | | 311,910 | |
IL Housing Dev. Auth. Rev. (GNMA/FNMA/FHLMC Collateralized) | | | | 270,000 | | | | | 4.00 | | | | | 10/1/48 | | | | | 296,387 | |
IL Rev. | | | | 500,000 | | | | | 5.00 | | | | | 6/15/33 | | | | | 593,545 | |
IL Sports Facilities Auth. Rev. (State Tax Supported) (AGM Insured) | | | | 1,000,000 | | | | | 5.25 | | | | | 6/15/31 | | | | | 1,114,490 | |
| | | | |
See accompanying notes to financial statements. | | | | |
26 | | | SIT MUTUAL FUNDS ANNUAL REPORT | |
| | | | | | | | | | | | | | | | | | | | |
| Name of Issuer | | Principal Amount ($) | | Coupon Rate (%) | | Maturity Date | | Fair Value ($) |
| | | | |
La Salle & Bureau Counties Township High School Dist. No. 120 LaSalle-Peru G.O. (BAM Insured) | | | | 250,000 | | | | | 5.00 | | | | | 12/1/31 | | | | | 306,788 | |
Macon & Moultrie Counties Community Unit School District No. 3 Mt Zion G.O. | | | | 335,000 | | | | | 5.50 | | | | | 12/1/41 | | | | | 381,615 | |
Macoupin Sangamon & Montgomery Counties Community Unit School District G.O. (AGM Insured) | | | | 990,000 | | | | | 4.25 | | | | | 12/1/35 | | | | | 1,081,248 | |
Malta Tax Allocation Rev. 2, 5 | | | | 1,921,000 | | | | | 5.75 | | | | | 12/30/25 | | | | | 614,720 | |
Metropolitan Pier & Exposition Auth. Rev. (McCormick Place Expansion Proj.) | | | | 250,000 | | | | | 5.00 | | | | | 6/15/57 | | | | | 291,988 | |
Richton Park Public Library District G.O. | | | | 250,000 | | | | | 4.50 | | | | | 12/15/32 | | | | | 266,410 | |
Southwestern IL Dev. Auth. Tax Allocation Ref. (Local Govt. Program) 2 | | | | 370,000 | | | | | 7.00 | | | | | 10/1/22 | | | | | 214,600 | |
University of Illinois (AGM Insured) | | | | 1,000,000 | | | | | 4.13 | | | | | 4/1/48 | | | | | 1,110,580 | |
Upper Illinois River Valley Dev. Auth. Rev. (Cambridge Lakes Learning Center) 4 | | | | 140,000 | | | | | 4.00 | | | | | 12/1/22 | | | | | 141,947 | |
Upper Illinois River Valley Dev. Auth. Rev. (Cambridge Lakes Learning Center) 4 | | | | 250,000 | | | | | 5.25 | | | | | 12/1/37 | | | | | 268,428 | |
Upper Illinois River Valley Dev. Auth. Rev. (Prairie Crossing Charter) 4 | | | | 250,000 | | | | | 5.00 | | | | | 1/1/45 | | | | | 260,735 | |
| | | | | | | | | | | | | | | | | | | | |
| | | | |
| | | | | | | | | | | | | | | | | | | 20,310,218 | |
| | | | | | | | | | | | | | | | | | | | |
Indiana - 0.9% | | | | | | | | | | | | | | | | | | | | |
IN Finance Auth. Rev. (BHI Senior Living) | | | | 775,000 | | | | | 5.88 | | | | | 11/15/41 | | | | | 836,403 | |
IN Finance Auth. Rev. (BHI Senior Living) | | | | 425,000 | | | | | 6.00 | | | | | 11/15/41 | | | | | 460,003 | |
IN Finance Auth. Rev. (BHI Senior Living) | | | | 170,000 | | | | | 5.25 | | | | | 11/15/46 | | | | | 189,147 | |
IN Finance Auth. Rev. (Greencroft Obligated Group) | | | | 350,000 | | | | | 6.50 | | | | | 11/15/33 | | | | | 373,530 | |
IN Housing & Community Dev. Auth. Rev. (Hammond Assisted Living Proj.) | | | | 500,000 | | | | | 5.75 | | | | | 1/1/36 | | | | | 511,570 | |
Merrillville Industry Economic Dev. Rev. (Belvedere Housing Proj.) | | | | 300,000 | | | | | 5.75 | | | | | 4/1/36 | | | | | 309,423 | |
Richmond Hospital Auth. Rev. (Reid Hospital & Health Care) | | | | 350,000 | | | | | 5.00 | | | | | 1/1/35 | | | | | 391,118 | |
| | | | | | | | | | | | | | | | | | | | |
| | | | |
| | | | | | | | | | | | | | | | | | | 3,071,194 | |
| | | | | | | | | | | | | | | | | | | | |
Iowa - 0.7% | | | | | | | | | | | | | | | | | | | | |
IA Fin. Auth. Rev. (Lifespace Communities, Inc.) | | | | 650,000 | | | | | 5.00 | | | | | 5/15/36 | | | | | 734,825 | |
IA Fin. Auth. Rev. (Lifespace Communities, Inc.) | | | | 565,000 | | | | | 5.00 | | | | | 5/15/47 | | | | | 628,348 | |
IA Fin. Auth. Rev. (Lifespace Communities, Inc.) | | | | 530,000 | | | | | 4.00 | | | | | 5/15/55 | | | | | 569,941 | |
IA Higher Education Loan Auth. Rev. (Simpson College Proj.) | | | | 500,000 | | | | | 5.00 | | | | | 11/1/30 | | | | | 549,385 | |
| | | | | | | | | | | | | | | | | | | | |
| | | | |
| | | | | | | | | | | | | | | | | | | 2,482,499 | |
| | | | | | | | | | | | | | | | | | | | |
Kansas - 0.1% | | | | | | | | | | | | | | | | | | | | |
Wichita Health Care Facs. Rev. (Kansas Masonic Home) | | | | 300,000 | | | | | 5.25 | | | | | 12/1/36 | | | | | 303,780 | |
| | | | | | | | | | | | | | | | | | | | |
Louisiana - 1.6% | | | | | | | | | | | | | | | | | | | | |
Denham Springs/Livingston Hsg. & Mtg. Finance Auth. Rev. (GNMA/FHLMC Collateralized) | | | | 9,149 | | | | | 5.00 | | | | | 11/1/40 | | | | | 9,299 | |
LA Hsg. Fin. Agy. Single Family Mtg. Rev. (Home Ownership Prog.)(GNMA/FHLMC Collateralized) | | | | 485,000 | | | | | 2.50 | | | | | 12/1/45 | | | | | 485,136 | |
LA Local Government Environmental Facilities & Community Development Auth. | | | | 500,000 | | | | | 5.25 | | | | | 11/15/25 | | | | | 532,610 | |
LA Local Government Environmental Facilities & Community Development Auth. | | | | 500,000 | | | | | 6.00 | | | | | 11/15/30 | | | | | 553,225 | |
LA Local Government Environmental Facilities & Community Development Auth. Rev. 4 | | | | 300,000 | | | | | 5.65 | | | | | 11/1/37 | | | | | 340,011 | |
LA Local Government Environmental Facilities & Community Development Auth. Rev. 4 | | | | 500,000 | | | | | 5.00 | | | | | 7/1/39 | | | | | 507,040 | |
LA Local Government Environmental Facilities & Community Development Auth. Rev. 4 | | | | 300,000 | | | | | 5.50 | | | | | 11/1/39 | | | | | 328,191 | |
LA Local Government Environmental Facilities & Community Development Auth. Rev. 4 | | | | 500,000 | | | | | 4.00 | | | | | 11/1/44 | | | | | 503,960 | |
LA Local Government Environmental Facilities & Community Development Auth. Rev. 4 | | | | 495,000 | | | | | 4.40 | | | | | 11/1/44 | | | | | 513,048 | |
LA Local Government Environmental Facilities & Community Development Auth. Rev. 4 | | | | 750,000 | | | | | 4.00 | | | | | 11/1/46 | | | | | 751,162 | |
LA Public Facs. Auth. Rev. (Franciscan Missionaries Health System Proj.) | | | | 300,000 | | | | | 5.00 | | | | | 7/1/35 | | | | | 345,486 | |
LA Public Facs. Auth. Rev. (Tulane Univ. Proj.) (NATL-RE Insured) 1 | | | | 545,000 | | | | | 0.83 | | | | | 2/15/36 | | | | | 540,090 | |
St. Tammany Parish Fin. Auth. Rev. (Christwood Proj.) | | | | 300,000 | | | | | 5.25 | | | | | 11/15/37 | | | | | 321,546 | |
| | | | | | | | | | | | | | | | | | | | |
| | | | |
| | | | | | | | | | | | | | | | | | | 5,730,804 | |
| | | | | | | | | | | | | | | | | | | | |
| | | | |
See accompanying notes to financial statements. | | | | |
MARCH 31, 2021 | | | 27 | |
SCHEDULE OF INVESTMENTS
March 31, 2021
Sit Tax-Free Income Fund (Continued)
| | | | | | | | | | | | | | | | | | | | |
| Name of Issuer | | Principal Amount ($) | | Coupon Rate (%) | | Maturity Date | | Fair Value ($) |
| | | | |
Maine - 0.5% | | | | | | | | | | | | | | | | | | | | |
ME Hsg. Auth. Rev. | | | | 600,000 | | | | | 4.00 | | | | | 11/15/35 | | | | | 634,446 | |
ME Hsg. Auth. Rev. | | | | 500,000 | | | | | 4.00 | | | | | 11/15/37 | | | | | 536,200 | |
ME Hsg. Auth. Rev. | | | | 500,000 | | | | | 3.85 | | | | | 11/15/40 | | | | | 523,600 | |
| | | | | | | | | | | | | | | | | | | | |
| | | | |
| | | | | | | | | | | | | | | | | | | 1,694,246 | |
| | | | | | | | | | | | | | | | | | | | |
Maryland - 0.4% | | | | | | | | | | | | | | | | | | | | |
MD Community Dev. Administration Rev. | | | | 750,000 | | | | | 1.95 | | | | | 9/1/41 | | | | | 717,885 | |
MD Community Dev. Administration Rev. | | | | 350,000 | | | | | 4.20 | | | | | 7/1/46 | | | | | 378,584 | |
Montgomery Co. Housing Opportunities Commission Rev. | | | | 250,000 | | | | | 4.00 | | | | | 7/1/38 | | | | | 251,838 | |
| | | | | | | | | | | | | | | | | | | | |
| | | | |
| | | | | | | | | | | | | | | | | | | 1,348,307 | |
| | | | | | | | | | | | | | | | | | | | |
Massachusetts - 3.2% | | | | | | | | | | | | | | | | | | | | |
Dedham Municipal Purpose Loan. G.O. (NATL Insured) | | | | 480,000 | | | | | 4.00 | | | | | 10/15/24 | | | | | 481,339 | |
Ipswich Muncipal Purpose Loan G.O. (AGM Insured) | | | | 500,000 | | | | | 4.00 | | | | | 6/1/25 | | | | | 501,360 | |
MA Dev. Finance Agy. Rev. | | | | 890,000 | | | | | 5.00 | | | | | 7/1/44 | | | | | 1,065,802 | |
MA Dev. Finance Agy. Rev. (Atrius Health Issue) | | | | 1,375,000 | | | | | 4.00 | | | | | 6/1/49 | | | | | 1,528,794 | |
MA Dev. Finance Agy. Rev. (Newbridge on the Charles, Inc.) 4 | | | | 300,000 | | | | | 5.00 | | | | | 10/1/47 | | | | | 327,933 | |
MA Dev. Finance Agy. Rev. (Orchard Cove, Inc.) | | | | 400,000 | | | | | 5.00 | | | | | 10/1/49 | | | | | 446,296 | |
MA Education Finance Auth. Education Rev. | | | | 30,000 | | | | | 5.15 | | | | | 1/1/26 | | | | | 30,129 | |
MA Education Finance Auth. Education Rev. | | | | 815,000 | | | | | 3.63 | | | | | 7/1/34 | | | | | 849,034 | |
MA Education Finance Auth. Education Rev. | | | | 1,000,000 | | | | | 2.63 | | | | | 7/1/36 | | | | | 1,006,880 | |
MA Education Finance Auth. Education Rev. | | | | 875,000 | | | | | 3.75 | | | | | 7/1/48 | | | | | 893,410 | |
MA Housing Finance Agy. Rev. | | | | 250,000 | | | | | 4.75 | | | | | 6/1/35 | | | | | 251,198 | |
MA Housing Finance Agy. Rev. | | | | 500,000 | | | | | 4.00 | | | | | 12/1/38 | | | | | 549,145 | |
MA Housing Finance Agy. Rev. | | | | 500,000 | | | | | 3.75 | | | | | 12/1/40 | | | | | 530,560 | |
MA Housing Finance Agy. Rev. | | | | 900,000 | | | | | 3.85 | | | | | 12/1/47 | | | | | 964,143 | |
MA Housing Finance Agy. Rev. | | | | 500,000 | | | | | 2.80 | | | | | 6/1/63 | | | | | 505,275 | |
MA Housing Finance Agy. Rev. (FHA Insured) | | | | 500,000 | | | | | 5.30 | | | | | 12/1/38 | | | | | 501,100 | |
Northbridge Municipal Purpose Loan G.O. (AGM Insured) | | | | 500,000 | | | | | 4.00 | | | | | 6/15/25 | | | | | 501,380 | |
Rowley Land Acquisition Loan G.O. (AGM Insured) | | | | 360,000 | | | | | 4.00 | | | | | 5/1/27 | | | | | 360,994 | |
| | | | | | | | | | | | | | | | | | | | |
| | | | |
| | | | | | | | | | | | | | | | | | | 11,294,772 | |
| | | | | | | | | | | | | | | | | | | | |
Michigan - 3.3% | | | | | | | | | | | | | | | | | | | | |
Chandler Park Academy Rev. | | | | 85,000 | | | | | 5.00 | | | | | 11/1/22 | | | | | 85,167 | |
City of Allen Park G.O. (BAM Insured) | | | | 300,000 | | | | | 3.25 | | | | | 5/1/34 | | | | | 318,624 | |
City of Kalamazoo Economic Dev. Corp. Rev. (Revel Creek Proj.) | | | | 500,000 | | | | | 5.00 | | | | | 5/15/43 | | | | | 558,065 | |
MI Finance Auth. Rev. (Presbyterian Village) | | | | 250,000 | | | | | 5.25 | | | | | 11/15/35 | | | | | 264,105 | |
MI Hsg. Dev. Auth. (G.O. of Authority Insured) | | | | 250,000 | | | | | 4.63 | | | | | 10/1/41 | | | | | 257,525 | |
MI Hsg. Dev. Auth. Rev. | | | | 500,000 | | | | | 4.10 | | | | | 10/1/35 | | | | | 537,900 | |
MI Hsg. Dev. Auth. Rev. | | | | 430,000 | | | | | 3.70 | | | | | 12/1/36 | | | | | 457,163 | |
MI Hsg. Dev. Auth. Rev. | | | | 385,000 | | | | | 4.13 | | | | | 12/1/38 | | | | | 385,000 | |
MI Hsg. Dev. Auth. Rev. | | | | 300,000 | | | | | 3.75 | | | | | 10/1/42 | | | | | 320,376 | |
MI Hsg. Dev. Auth. Rev. | | | | 750,000 | | | | | 4.00 | | | | | 10/1/43 | | | | | 817,785 | |
MI Hsg. Dev. Auth. Rev. | | | | 1,000,000 | | | | | 4.00 | | | | | 6/1/49 | | | | | 1,060,440 | |
MI Hsg. Dev. Auth. Rev. | | | | 1,000,000 | | | | | 3.15 | | | | | 6/1/50 | | | | | 1,033,690 | |
MI Hsg. Dev. Auth. Rev. | | | | 2,000,000 | | | | | 2.75 | | | | | 6/1/51 | | | | | 2,019,240 | |
MI Hsg. Dev. Auth. Rev. | | | | 1,750,000 | | | | | 3.50 | | | | | 10/1/54 | | | | | 1,841,402 | |
MI Public Educational Facs. Auth. Rev. (Chandler Park Academy) | | | | 260,000 | | | | | 6.35 | | | | | 11/1/28 | | | | | 260,551 | |
MI Strategic Fund. Rev. (United Methodist Retirement Facs.) | | | | 415,000 | | | | | 5.00 | | | | | 11/15/49 | | | | | 456,919 | |
Muskegon Heights Water Supply Rev. (NATL Insured) | | | | 165,000 | | | | | 4.15 | | | | | 11/1/23 | | | | | 168,765 | |
Muskegon Heights Water Supply Rev. (NATL Insured) | | | | 135,000 | | | | | 4.20 | | | | | 11/1/24 | | | | | 138,120 | |
| | | | |
See accompanying notes to financial statements. | | | | |
28 | | | SIT MUTUAL FUNDS ANNUAL REPORT | |
| | | | | | | | | | | | | | | | | | | | |
| Name of Issuer | | Principal Amount ($) | | Coupon Rate (%) | | Maturity Date | | Fair Value ($) |
| | | | |
Taylor Brownfield Redevelopment Authority (NATL Insured) | | | | 250,000 | | | | | 5.00 | | | | | 5/1/32 | | | | | 282,595 | |
Universal Academy Michigan Public School Rev. | | | | 105,000 | | | | | 6.50 | | | | | 12/1/23 | | | | | 109,662 | |
| | | | | | | | | | | | | | | | | | | | |
| | | | |
| | | | | | | | | | | | | | | | | | | 11,373,094 | |
| | | | | | | | | | | | | | | | | | | | |
Minnesota - 0.1% | | | | | | | | | | | | | | | | | | | | |
Apple Valley Rev. (Senior Living, LLC Proj.) | | | | 500,000 | | | | | 5.00 | | | | | 1/1/47 | | | | | 337,335 | |
MN Hsg. Fin. Agy. Mtg. Rev. (Mtg. Backed Securities Program) (GNMA/FNMA Collateralized) | | | | 75,000 | | | | | 4.40 | | | | | 7/1/32 | | | | | 75,444 | |
| | | | | | | | | | | | | | | | | | | | |
| | | | |
| | | | | | | | | | | | | | | | | | | 412,779 | |
| | | | | | | | | | | | | | | | | | | | |
Mississippi - 0.6% | | | | | | | | | | | | | | | | | | | | |
MS Development Bank Rev. (Green Bond-Hancock County) 4 | | | | 1,000,000 | | | | | 4.55 | | | | | 11/1/39 | | | | | 1,055,660 | |
MS Gaming Tax Rev. | | | | 740,000 | | | | | 4.00 | | | | | 10/15/38 | | | | | 829,851 | |
MS Home Corp. Single Family Mtg. Rev. (GNMA/FNMA/FHLMC Collateralized) | | | | 300,000 | | | | | 4.00 | | | | | 12/1/43 | | | | | 322,800 | |
| | | | | | | | | | | | | | | | | | | | |
| | | | |
| | | | | | | | | | | | | | | | | | | 2,208,311 | |
| | | | | | | | | | | | | | | | | | | | |
Missouri - 1.5% | | | | | | | | | | | | | | | | | | | | |
Joplin Industrial Dev. Auth. Rev. (32nd Street Place Community Improvement Dist. Proj.) | | | | 250,000 | | | | | 3.50 | | | | | 11/1/40 | | | | | 242,395 | |
Kansas City Industrial Dev. Auth. Rev. (United Methodist Retirement Home, Inc.) 2, 4, 5 | | | | 500,000 | | | | | 5.75 | | | | | 11/15/36 | | | | | 175,250 | |
Lees Summit Industrial Dev. Auth. Rev. (John Knox Village Proj.) | | | | 370,000 | | | | | 5.00 | | | | | 8/15/32 | | | | | 410,904 | |
MO Health & Education Facs. Auth. Rev. (Lutheran Senior Services) | | | | 500,000 | | | | | 4.00 | | | | | 2/1/33 | | | | | 548,500 | |
MO Health & Education Facs. Auth. Rev. (Lutheran Senior Services) | | | | 775,000 | | | | | 4.00 | | | | | 2/1/42 | | | | | 823,089 | |
MO Health & Education Facs. Auth. Rev. (Lutheran Senior Services) | | | | 1,000,000 | | | | | 4.00 | | | | | 2/1/48 | | | | | 1,042,260 | |
MO Hsg. Dev. Commission Rev. (GNMA/FNMA/FHLMC Collateralized) | | | | 580,000 | | | | | 3.80 | | | | | 11/1/48 | | | | | 619,365 | |
MO Hsg. Dev. Commission Rev. (GNMA/FNMA/FHLMC Collateralized) | | | | 460,000 | | | | | 3.35 | | | | | 11/1/49 | | | | | 479,302 | |
MO Hsg. Dev. Commission Rev. (GNMA/FNMA/FHLMC Collateralized) | | | | 500,000 | | | | | 2.50 | | | | | 5/1/50 | | | | | 505,130 | |
MO Hsg. Dev. Commission Rev. (GNMA/FNMA/FHLMC Collateralized) | | | | 500,000 | | | | | 2.40 | | | | | 11/1/51 | | | | | 489,880 | |
| | | | | | | | | | | | | | | | | | | | |
| | | | |
| | | | | | | | | | | | | | | | | | | 5,336,075 | |
| | | | | | | | | | | | | | | | | | | | |
Montana - 0.4% | | | | | | | | | | | | | | | | | | | | |
MT Board of Housing Single Family Rev. | | | | 185,000 | | | | | 4.00 | | | | | 12/1/38 | | | | | 196,686 | |
MT Board of Housing Single Family Rev. | | | | 500,000 | | | | | 2.40 | | | | | 12/1/45 | | | | | 501,315 | |
MT Board of Housing Single Family Rev. (BRD Insured) | | | | 500,000 | | | | | 4.00 | | | | | 6/1/45 | | | | | 546,865 | |
MT Board of Housing Single Family Rev. (FHA Insured) | | | | 250,000 | | | | | 3.75 | | | | | 12/1/38 | | | | | 257,520 | |
MT Facs. Finance Auth. Rev. (Great Falls Pre-Release Services Proj.) | | | | 46,843 | | | | | 5.08 | | | | | N/A | | | | | 46,843 | |
| | | | | | | | | | | | | | | | | | | | |
| | | | |
| | | | | | | | | | | | | | | | | | | 1,549,229 | |
| | | | | | | | | | | | | | | | | | | | |
Nebraska - 0.4% | | | | | | | | | | | | | | | | | | | | |
Douglas Co. Hospital Auth. No. 2 Rev. (Children Hospital Obligation) | | | | 500,000 | | | | | 4.00 | | | | | 11/15/50 | | | | | 572,670 | |
Douglas Co. Hospital Auth. No. 3 Rev. (Methodist Hospital) | | | | 400,000 | | | | | 5.00 | | | | | 11/1/30 | | | | | 458,156 | |
Mead Village Tax Allocation Rev. (E3 Biofuels - Mead LLC Proj.) 2, 5, 15 | | | | 410,000 | | | | | 5.13 | | | | | N/A | | | | | 17,015 | |
Nebraska Investment Fin. Auth. Rev. (GNMA/FNMA/FHLMC Collateralized) | | | | 320,000 | | | | | 3.05 | | | | | 9/1/42 | | | | | 331,888 | |
| | | | | | | | | | | | | | | | | | | | |
| | | | |
| | | | | | | | | | | | | | | | | | | 1,379,729 | |
| | | | | | | | | | | | | | | | | | | | |
Nevada - 1.0% | | | | | | | | | | | | | | | | | | | | |
City of Las Vegas Special Improvement District No. 815 | | | | 500,000 | | | | | 5.00 | | | | | 12/1/49 | | | | | 556,545 | |
City of North Las Vegas (Special Northern Beltway Commercial Area) 4 | | | | 335,000 | | | | | 4.00 | | | | | 12/1/27 | | | | | 360,879 | |
City of North Las Vegas (Special Northern Beltway Commercial Area) 4 | | | | 340,000 | | | | | 5.00 | | | | | 12/1/37 | | | | | 380,606 | |
NV Hsg. Division Rev. (GNMA/FNMA/FHLMC Collateralized) | | | | 280,000 | | | | | 3.85 | | | | | 10/1/39 | | | | | 290,637 | |
NV Hsg. Division Rev. (GNMA/FNMA/FHLMC Collateralized) | | | | 825,000 | | | | | 3.35 | | | | | 10/1/49 | | | | | 861,061 | |
NV Hsg. Division Rev. (GNMA/FNMA/FHLMC Collateralized) | | | | 830,000 | | | | | 3.40 | | | | | 10/1/49 | | | | | 870,222 | |
| | | | | | | | | | | | | | | | | | | | |
| | | | |
| | | | | | | | | | | | | | | | | | | 3,319,950 | |
| | | | | | | | | | | | | | | | | | | | |
| | | | |
See accompanying notes to financial statements. | | | | |
MARCH 31, 2021 | | | 29 | |
SCHEDULE OF INVESTMENTS
March 31, 2021
Sit Tax-Free Income Fund (Continued)
| | | | | | | | | | | | | | | | | | | | |
| Name of Issuer | | Principal Amount ($) | | Coupon Rate (%) | | Maturity Date | | Fair Value ($) |
| | | | |
New Hampshire - 0.7% | | | | | | | | | | | | | | | | | | | | |
NH Business Finance Auth. Rev. (Springpoint Senior Living Proj.) | | | | 650,000 | | | | | 4.00 | | | | | 1/1/41 | | | | | 713,408 | |
NH Business Finance Auth. Rev. (The Vista Proj.) 4 | | | | 310,000 | | | | | 5.25 | | | | | 7/1/39 | | | | | 305,679 | |
NH Business Finance Auth. Rev. (The Vista Proj.) 4 | | | | 500,000 | | | | | 5.63 | | | | | 7/1/46 | | | | | 498,280 | |
NH Hsg. Fin. Agy. Rev. (Cimarron, Whittier Falls & Mars) (FHA Insured) | | | | 725,000 | | | | | 4.00 | | | | | 7/1/52 | | | | | 779,498 | |
| | | | | | | | | | | | | | | | | | | | |
| | | | |
| | | | | | | | | | | | | | | | | | | 2,296,865 | |
| | | | | | | | | | | | | | | | | | | | |
New Jersey - 3.2% | | | | | | | | | | | | | | | | | | | | |
NJ Economic Dev. Auth. Rev. 9 | | | | 500,000 | | | | | 4.00 | | | | | 6/15/50 | | | | | 555,520 | |
NJ Economic Dev. Auth. Rev. (North Star Academy Charter School Newark) | | | | 250,000 | | | | | 5.00 | | | | | 7/15/47 | | | | | 284,390 | |
NJ Economic Dev. Auth. Rev. (State Government Buildings Proj.) 9 | | | | 500,000 | | | | | 5.00 | | | | | 6/15/42 | | | | | 586,865 | |
NJ Economic Dev. Auth. Rev. (State Housing Proj.) 9 | | | | 250,000 | | | | | 5.00 | | | | | 6/15/37 | | | | | 302,270 | |
NJ Economic Dev. Auth. Rev. (State Housing Proj.) 9 | | | | 500,000 | | | | | 5.00 | | | | | 6/15/43 | | | | | 595,940 | |
NJ Higher Education Student Assistance Auth. Rev. | | | | 1,250,000 | | | | | 3.50 | | | | | 12/1/39 | | | | | 1,289,738 | |
NJ Higher Education Student Assistance Auth. Rev. | | | | 1,000,000 | | | | | 4.25 | | | | | 12/1/50 | | | | | 1,035,280 | |
NJ Hsg. & Mtg. Finance Agy. Rev. | | | | 750,000 | | | | | 3.95 | | | | | 11/1/43 | | | | | 817,612 | |
NJ Hsg. & Mtg. Finance Agy. Rev. | | | | 500,000 | | | | | 2.63 | | | | | 11/1/56 | | | | | 494,950 | |
NJ Hsg. & Mtg. Finance Agy. Rev. (Mciver Homes Hsg. Proj.) (FHLMC Collateralized) | | | | 550,000 | | | | | 3.60 | | | | | 1/1/30 | | | | | 571,104 | |
NJ Hsg. & Mtg. Finance Agy. Single Family Mtg. Rev. | | | | 925,000 | | | | | 3.75 | | | | | 10/1/35 | | | | | 1,013,809 | |
NJ Hsg. & Mtg. Finance Agy. Single Family Mtg. Rev. | | | | 535,000 | | | | | 4.50 | | | | | 10/1/48 | | | | | 604,331 | |
NJ Hsg. & Mtg. Finance Agy. Single Family Mtg. Rev. | | | | 475,000 | | | | | 4.00 | | | | | 4/1/49 | | | | | 510,198 | |
NJ Hsg. & Mtg. Finance Agy. Single Family Mtg. Rev. | | | | 1,000,000 | | | | | 2.45 | | | | | 10/1/50 | | | | | 999,190 | |
NJ Transportation Trust Fund Auth. Rev. 9 | | | | 500,000 | | | | | 4.00 | | | | | 12/15/39 | | | | | 559,700 | |
NJ Transportation Trust Fund Auth. Rev. 9 | | | | 500,000 | | | | | 5.25 | | | | | 6/15/43 | | | | | 604,720 | |
Tobacco Settlement Financing Corp. Rev. | | | | 300,000 | | | | | 5.00 | | | | | 6/1/46 | | | | | 348,552 | |
| | | | | | | | | | | | | | | | | | | | |
| | | | |
| | | | | | | | | | | | | | | | | | | 11,174,169 | |
| | | | | | | | | | | | | | | | | | | | |
New Mexico - 1.3% | | | | | | | | | | | | | | | | | | | | |
NM Mtg. Fin. Auth. Single Family Mtg. Rev. (GNMA/FNMA/FHLMC Collateralized) | | | | 290,000 | | | | | 3.90 | | | | | 9/1/42 | | | | | 293,532 | |
NM Mtg. Fin. Auth. Single Family Mtg. Rev. (GNMA/FNMA/FHLMC Collateralized) | | | | 250,000 | | | | | 4.13 | | | | | 9/1/42 | | | | | 253,545 | |
NM Mtg. Fin. Auth. Single Family Mtg. Rev. (GNMA/FNMA/FHLMC Collateralized) | | | | 700,000 | | | | | 3.85 | | | | | 7/1/43 | | | | | 745,710 | |
NM Mtg. Fin. Auth. Single Family Mtg. Rev. (GNMA/FNMA/FHLMC Collateralized) | | | | 425,000 | | | | | 3.85 | | | | | 7/1/43 | | | | | 457,814 | |
NM Mtg. Fin. Auth. Single Family Mtg. Rev. (GNMA/FNMA/FHLMC Collateralized) | | | | 345,000 | | | | | 3.80 | | | | | 9/1/46 | | | | | 358,479 | |
NM Mtg. Fin. Auth. Single Family Mtg. Rev. (GNMA/FNMA/FHLMC Collateralized) | | | | 775,000 | | | | | 4.00 | | | | | 7/1/48 | | | | | 833,636 | |
NM Mtg. Fin. Auth. Single Family Mtg. Rev. (GNMA/FNMA/FHLMC Collateralized) | | | | 995,000 | | | | | 3.35 | | | | | 7/1/49 | | | | | 1,037,904 | |
NM Mtg. Fin. Auth. Single Family Mtg. Rev. (GNMA/FNMA/FHLMC Collateralized) | | | | 455,000 | | | | | 4.00 | | | | | 7/1/49 | | | | | 490,299 | |
| | | | | | | | | | | | | | | | | | | | |
| | | | |
| | | | | | | | | | | | | | | | | | | 4,470,919 | |
| | | | | | | | | | | | | | | | | | | | |
New York - 4.8% | | | | | | | | | | | | | | | | | | | | |
Brookhaven Local Dev. Corp. Rev. (Jefferson’s Ferry Proj.) | | | | 675,000 | | | | | 4.00 | | | | | 11/1/45 | | | | | 707,170 | |
Buffalo & Erie Co. Industrial Land Dev. Corp. Rev. (D’Youville College Proj.) | | | | 500,000 | | | | | 4.00 | | | | | 11/1/40 | | | | | 547,480 | |
Hempstead Town Local Development Corp. Rev. (Hofstra University Proj.) | | | | 350,000 | | | | | 4.00 | | | | | 7/1/33 | | | | | 369,341 | |
New York City Housing Development Corp. Multifamily Mtg. Rev. | | | | 250,000 | | | | | 4.60 | | | | | 11/1/36 | | | | | 250,805 | |
New York City Housing Development Corp. Multifamily Mtg. Rev. | | | | 300,000 | | | | | 4.05 | | | | | 11/1/41 | | | | | 325,119 | |
New York City Housing Development Corp. Multifamily Mtg. Rev. | | | | 300,000 | | | | | 3.85 | | | | | 11/1/42 | | | | | 320,343 | |
New York City Housing Development Corp. Multifamily Mtg. Rev. | | | | 500,000 | | | | | 2.63 | | | | | 8/1/45 | | | | | 498,610 | |
New York City Housing Development Corp. Multifamily Mtg. Rev. | | | | 650,000 | | | | | 3.65 | | | | | 11/1/47 | | | | | 684,626 | |
New York City Housing Development Corp. Multifamily Mtg. Rev. | | | | 500,000 | | | | | 3.95 | | | | | 11/1/49 | | | | | 535,050 | |
New York City Housing Development Corp. Multifamily Mtg. Rev. | | | | 1,000,000 | | | | | 3.00 | | | | | 11/1/55 | | | | | 1,016,920 | |
New York City Housing Development Corp. Multifamily Mtg. Rev. | | | | 1,000,000 | | | | | 2.80 | | | | | 11/1/60 | | | | | 1,002,130 | |
New York City Housing Development Corp. Rev. | | | | 500,000 | | | | | 3.80 | | | | | 11/1/37 | | | | | 507,830 | |
New York City Municipal Water Finance Authority | | | | 750,000 | | | | | 5.00 | | | | | 6/15/38 | | | | | 821,828 | |
New York Transportation Dev. Corp. Rev. (John F. Kennedy International Airport Proj.) | | | | 300,000 | | | | | 4.00 | | | | | 12/1/40 | | | | | 333,699 | |
New York Transportation Dev. Corp. Rev. (Laguardia Airport Proj.) | | | | 750,000 | | | | | 4.00 | | | | | 10/1/30 | | | | | 869,212 | |
| | | | |
See accompanying notes to financial statements. | | | | |
30 | | | SIT MUTUAL FUNDS ANNUAL REPORT | |
| | | | | | | | | | | | | | | | | | | | |
| | | | | |
| Name of Issuer | | Principal
Amount ($) | | Coupon Rate (%) | | Maturity
Date | | Fair
Value ($) |
| | | | |
NY Monroe Co. Industrial Development Corp. Rev. (St. Ann’s Community Proj.) | | | | 705,000 | | | | | 4.00 | | | | | 1/1/30 | | | | | 756,874 | |
NY Monroe Co. Industrial Development Corp. Rev. (St. Ann’s Community Proj.) | | | | 350,000 | | | | | 5.00 | | | | | 1/1/50 | | | | | 378,574 | |
NY Mortgage Agency Rev. | | | | 125,000 | | | | | 3.75 | | | | | 10/1/42 | | | | | 126,600 | |
NY Mortgage Agency Rev. | | | | 1,295,000 | | | | | 3.80 | | | | | 10/1/48 | | | | | 1,368,465 | |
NY State Dormitory Auth. Rev. Ref. (N. Shore-Long Island Jewish Obligation) | | | | 300,000 | | | | | 5.00 | | | | | 5/1/33 | | | | | 342,033 | |
NY State Housing Finance Agency Rev. | | | | 500,000 | | | | | 2.75 | | | | | 11/1/45 | | | | | 507,050 | |
NY State Housing Finance Agency Rev. (Affordable Hsg. Proj.) | | | | 590,000 | | | | | 3.75 | | | | | 11/1/37 | | | | | 600,756 | |
NY State Housing Finance Agency Rev. (Affordable Hsg. Proj.) | | | | 400,000 | | | | | 4.88 | | | | | 11/1/42 | | | | | 405,528 | |
NY State Housing Finance Agency Rev. (Affordable Hsg. Proj.) (FNMA/FHLMC Collateralized) | | | | 500,000 | | | | | 3.65 | | | | | 11/1/34 | | | | | 525,230 | |
NY State Housing Finance Agency Rev. (Affordable Hsg. Proj.) (GNMA/FNMA/FHLMC Collateralized) | | | | 500,000 | | | | | 3.95 | | | | | 11/1/37 | | | | | 540,750 | |
NY State Housing Finance Agency Rev. (GNMA/FNMA/FHLMC Collateralized) | | | | 250,000 | | | | | 4.10 | | | | | 11/1/41 | | | | | 270,198 | |
NY State Mortgage Agency Rev. | | | | 1,000,000 | | | | | 2.50 | | | | | 10/1/46 | | | | | 998,320 | |
NY State Mortgage Agency Rev. | | | | 1,000,000 | | | | | 2.55 | | | | | 4/1/50 | | | | | 998,250 | |
| | | | | | | | | | | | | | | | | | | | |
| | | | |
| | | | | | | | | | | | | | | | | | | 16,608,791 | |
| | | | | | | | | | | | | | | | | | | | |
| | | | |
North Carolina - 1.4% | | | | | | | | | | | | | | | | | | | | |
Mecklenburg Co. Rev. (Little Rock Apts) | | | | 130,000 | | | | | 5.15 | | | | | 1/1/22 | | | | | 131,076 | |
Mecklenburg Co. Rev. (Little Rock Apts) | | | | 510,000 | | | | | 5.38 | | | | | 1/1/36 | | | | | 514,850 | |
NC Education Assistance Auth. Senior Bond-Student Loan Rev. | | | | 500,000 | | | | | 3.13 | | | | | 6/1/39 | | | | | 500,535 | |
NC Housing Finance Agency Rev. | | | | 280,000 | | | | | 3.95 | | | | | 1/1/41 | | | | | 302,112 | |
NC Housing Finance Agency Rev. | | | | 710,000 | | | | | 4.00 | | | | | 7/1/47 | | | | | 770,094 | |
NC Housing Finance Agency Rev. (GNMA/FNMA/FHLMC Collateralized) | | | | 450,000 | | | | | 4.00 | | | | | 1/1/48 | | | | | 483,250 | |
NC Housing Finance Agency Rev. (GNMA/FNMA/FHLMC Collateralized) | | | | 990,000 | | | | | 3.63 | | | | | 7/1/49 | | | | | 1,047,964 | |
NC Medical Care Comm. Rev. (Salemtowne Proj.) | | | | 400,000 | | | | | 5.00 | | | | | 10/1/38 | | | | | 432,544 | |
University of North Carolina School of the Arts | | | | 500,000 | | | | | 3.25 | | | | | 2/1/46 | | | | | 523,500 | |
| | | | | | | | | | | | | | | | | | | | |
| | | | |
| | | | | | | | | | | | | | | | | | | 4,705,925 | |
| | | | | | | | | | | | | | | | | | | | |
| | | | |
North Dakota - 0.4% | | | | | | | | | | | | | | | | | | | | |
ND Housing Finance Agency Rev. | | | | 415,000 | | | | | 3.85 | | | | | 1/1/42 | | | | | 445,793 | |
ND Housing Finance Agency Rev. | | | | 1,000,000 | | | | | 2.50 | | | | | 7/1/44 | | | | | 1,004,780 | |
| | | | | | | | | | | | | | | | | | | | |
| | | | |
| | | | | | | | | | | | | | | | | | | 1,450,573 | |
| | | | | | | | | | | | | | | | | | | | |
| | | | |
Ohio - 2.7% | | | | | | | | | | | | | | | | | | | | |
Ashland City School Dist. G.O. (Classroom Facilities & School Improvement) | | | | 750,000 | | | | | 4.00 | | | | | 11/1/49 | | | | | 751,590 | |
Butler Co. Port Auth. Rev. | | | | 640,000 | | | | | 5.00 | | | | | 12/1/34 | | | | | 641,491 | |
Cleveland-Cuyahoga County Port Auth. Rev. (Cleveland Museum of Natural History Proj.) | | | | 500,000 | | | | | 4.00 | | | | | 7/1/46 | | | | | 574,420 | |
Columbus-Franklin Co. Finance Auth. Rev. (Beulah Park Phase 1 Proj.) | | | | 840,000 | | | | | 4.00 | | | | | 5/15/49 | | | | | 916,112 | |
Franklin Co. Health Care Facs. Rev. (Ohio Living Communities) | | | | 1,000,000 | | | | | 4.00 | | | | | 7/1/45 | | | | | 1,047,990 | |
Lake Co. Port & Economic Dev. Auth. Rev. (Tapestry Wickliffe Proj.) 2, 4, 5 | | | | 250,000 | | | | | 6.50 | | | | | 12/1/37 | | | | | 87,500 | |
Liberty Community Infrastructure Financing Auth. Special Assessment | | | | 500,000 | | | | | 3.13 | | | | | 12/1/46 | | | | | 525,710 | |
Lucas Metro Hsg. Auth. | | | | 500,000 | | | | | 5.00 | | | | | 11/1/36 | | | | | 551,900 | |
OH Higher Educational Facs. Commission Rev. (Tiffin University Proj.) | | | | 1,045,000 | | | | | 4.00 | | | | | 11/1/49 | | | | | 1,074,594 | |
OH Housing Finance Agency Rev. | | | | 820,000 | | | | | 3.35 | | | | | 9/1/49 | | | | | 856,662 | |
OH Housing Finance Agency Rev. (GNMA/FNMA Collateralized) | | | | 315,000 | | | | | 4.05 | | | | | 3/1/37 | | | | | 343,293 | |
OH Housing Finance Agency Rev. (GNMA/FNMA/FHLMC Collateralized) | | | | 335,000 | | | | | 3.35 | | | | | 9/1/39 | | | | | 350,098 | |
OH Housing Finance Agency Rev. (GNMA/FNMA/FHLMC Collateralized) | | | | 660,000 | | | | | 4.00 | | | | | 9/1/48 | | | | | 703,573 | |
OH Housing Finance Agency Rev. (GNMA/FNMA/FHLMC Collateralized) | | | | 555,000 | | | | | 4.00 | | | | | 3/1/49 | | | | | 592,096 | |
Port of Greater Cincinnati Dev. Auth. Rev. (St. Xavier High School, Inc. Proj.) | | | | 400,000 | | | | | 4.00 | | | | | 4/1/40 | | | | | 444,428 | |
| | | | | | | | | | | | | | | | | | | | |
| | | | |
| | | | | | | | | | | | | | | | | | | 9,461,457 | |
| | | | | | | | | | | | | | | | | | | | |
| | | | |
Oklahoma - 0.4% | | | | | | | | | | | | | | | | | | | | |
Fort Sill Apache Tribe Economic Dev. Auth. 4 | | | | 410,000 | | | | | 8.50 | | | | | 8/25/26 | | | | | 423,038 | |
Oklahoma Dev. Finance Auth. Rev. (Oklahoma City University Proj.) | | | | 1,000,000 | | | | | 5.00 | | | | | 8/1/49 | | | | | 1,134,550 | |
| | | | | | | | | | | | | | | | | | | | |
| | | | |
| | | | | | | | | | | | | | | | | | | 1,557,588 | |
| | | | | | | | | | | | | | | | | | | | |
| | | | |
See accompanying notes to financial statements. | | | | |
MARCH 31, 2021 | | | 31 | |
SCHEDULE OF INVESTMENTS
March 31, 2021
Sit Tax-Free Income Fund (Continued)
| | | | | | | | | | | | | | | | | | | | |
| | | | | |
| Name of Issuer | | Principal
Amount ($) | | Coupon Rate (%) | | Maturity
Date | | Fair
Value ($) |
| | | | |
Oregon - 1.7% | | | | | | | | | | | | | | | | | | | | |
Clackamas Co. Hospital Facs. Auth. Rev. (Rose Villa Proj.) | | | | 500,000 | | | | | 5.38 | | | | | 11/15/55 | | | | | 535,900 | |
Clackamas Co. Hsg. Auth. Rev. (Easton Ridge Apts. Proj.) | | | | 350,000 | | | | | 3.50 | | | | | 9/1/33 | | | | | 358,638 | |
Forest Grove Rev. (Campus Improvement-Pacific Unv. Proj.) | | | | 250,000 | | | | | 5.25 | | | | | 5/1/34 | | | | | 259,185 | |
Marion Co. School District No.1 Gervais G.O. | | | | 500,000 | | | | | 4.00 | | | | | 6/1/33 | | | | | 500,740 | |
OR Hsg. & Community Services Dept. Rev. | | | | 225,000 | | | | | 3.80 | | | | | 7/1/34 | | | | | 247,000 | |
OR Hsg. & Community Services Dept. Rev. (Single Family Mtg. Program) | | | | 125,000 | | | | | 3.75 | | | | | 7/1/35 | | | | | 135,860 | |
OR Hsg. & Community Services Dept. Rev. (Single Family Mtg. Program) | | | | 360,000 | | | | | 4.00 | | | | | 7/1/38 | | | | | 373,374 | |
OR Hsg. & Community Services Dept. Rev. (Single Family Mtg. Program) | | | | 500,000 | | | | | 2.35 | | | | | 1/1/44 | | | | | 502,550 | |
OR Hsg. & Community Services Dept. Rev. (Single Family Mtg. Program) | | | | 395,000 | | | | | 3.75 | | | | | 7/1/48 | | | | | 416,658 | |
OR State Ref G.O. (Veterans Welfare Service) | | | | 1,000,000 | | | | | 3.90 | | | | | 12/1/39 | | | | | 1,041,590 | |
Polk Co. Hospital Fac. Auth. Rev. (Dallas Retirement Village Proj.) | | | | 1,000,000 | | | | | 4.00 | | | | | 7/1/24 | | | | | 1,001,560 | |
Polk Co. Hospital Fac. Auth. Rev. (Dallas Retirement Village Proj.) | | | | 500,000 | | | | | 5.13 | | | | | 7/1/55 | | | | | 510,795 | |
| | | | | | | | | | | | | | | | | | | | |
| | | | |
| | | | | | | | | | | | | | | | | | | 5,883,850 | |
| | | | | | | | | | | | | | | | | | | | |
| | | | |
Pennsylvania - 2.5% | | | | | | | | | | | | | | | | | | | | |
Allegheny Co. Industrial Dev. Auth. Charter School Rev. (Propel Charter-McKeesport) | | | | 115,000 | | | | | 5.90 | | | | | 8/15/26 | | | | | 115,344 | |
Butler Co. General Authority Rev. (School District Proj.) (AGM G.O. of District) 1 | | | | 465,000 | | | | | 0.84 | | | | | 10/1/34 | | | | | 458,137 | |
Chester Co. Health & Education Fac. Auth. Rev. (The Devereux Foundation) | | | | 475,000 | | | | | 3.00 | | | | | 11/1/30 | | | | | 493,691 | |
Commonwealth Financing Auth. Rev. (Tobacco Master Settlement Payment) (AGM Insured) | | | | 350,000 | | | | | 4.00 | | | | | 6/1/39 | | | | | 396,666 | |
Dauphin Co. General Auth. Rev. (Harrisburg University Science Technology) 4 | | | | 200,000 | | | | | 4.00 | | | | | 10/15/22 | | | | | 202,664 | |
PA Higher Educational Facs. Auth. Rev. (La Salle University) | | | | 280,000 | | | | | 5.00 | | | | | 5/1/42 | | | | | 286,017 | |
PA Hsg. Finance Agy. Rev. | | | | 400,000 | | | | | 3.90 | | | | | 10/1/36 | | | | | 400,000 | |
PA Hsg. Finance Agy. Rev. | | | | 825,000 | | | | | 3.65 | | | | | 10/1/42 | | | | | 855,838 | |
PA Hsg. Finance Agy. Rev. | | | | 135,000 | | | | | 4.00 | | | | | 10/1/46 | | | | | 146,031 | |
PA Hsg. Finance Agy. Rev. | | | | 140,000 | | | | | 4.00 | | | | | 10/1/47 | | | | | 150,147 | |
PA Hsg. Finance Agy. Rev. | | | | 1,000,000 | | | | | 3.40 | | | | | 10/1/49 | | | | | 1,041,560 | |
PA Turnpike Commission Rev. Capital Appreciation 6 | | | | 1,250,000 | | | | | 5.00 | | | | | 12/1/38 | | | | | 1,544,575 | |
Philadelphia Industrial Dev. Auth. Rev. (Alliance for Progress Charter School Proj.) | | | | 635,000 | | | | | 5.00 | | | | | 6/15/49 | | | | | 677,050 | |
Philadelphia Industrial Dev. Auth. Rev. (Charter School Proj.) | | | | 350,000 | | | | | 5.63 | | | | | 8/1/36 | | | | | 389,403 | |
Southcentral General Auth. Rev. (York College of Pennsylvania) | | | | 500,000 | | | | | 4.00 | | | | | 11/1/37 | | | | | 562,545 | |
Township of North Fayette G.O. | | | | 500,000 | | | | | 3.00 | | | | | 4/15/39 | | | | | 500,390 | |
West Cornwall Township Municipal Auth. Rev. (Lebanon Valley Brethren Home Proj.) | | | | 525,000 | | | | | 4.00 | | | | | 11/15/46 | | | | | 576,823 | |
| | | | | | | | | | | | | | | | | | | | |
| | | | |
| | | | | | | | | | | | | | | | | | | 8,796,881 | |
| | | | | | | | | | | | | | | | | | | | |
| | | | |
Rhode Island - 0.3% | | | | | | | | | | | | | | | | | | | | |
RI Hsg. & Mortgage Finance Corp. Rev. | | | | 250,000 | | | | | 3.90 | | | | | 10/1/37 | | | | | 256,570 | |
RI Student Loan Auth. Rev. | | | | 750,000 | | | | | 3.63 | | | | | 12/1/37 | | | | | 772,245 | |
| | | | | | | | | | | | | | | | | | | | |
| | | | |
| | | | | | | | | | | | | | | | | | | 1,028,815 | |
| | | | | | | | | | | | | | | | | | | | |
| | | | |
South Carolina - 1.2% | | | | | | | | | | | | | | | | | | | | |
Berkeley Co. Nexton Improvement District Special Assessment | | | | 350,000 | | | | | 4.25 | | | | | 11/1/40 | | | | | 385,896 | |
SC Education Assistance Auth. Student Loan Rev. | | | | 110,000 | | | | | 5.10 | | | | | 10/1/29 | | | | | 110,034 | |
SC Jobs-Economic Dev. Auth. Rev. (Bishop Gadsden Episcopal Retirement Community) | | | | 500,000 | | | | | 4.00 | | | | | 4/1/54 | | | | | 511,330 | |
SC Jobs-Economic Dev. Auth. Rev. (Bon Secours Mercy Health, Inc.) | | | | 750,000 | | | | | 4.00 | | | | | 12/1/44 | | | | | 859,815 | |
SC Public Service Auth. Rev. (Santee Cooper) | | | | 250,000 | | | | | 5.00 | | | | | 12/1/38 | | | | | 279,712 | |
SC Public Service Auth. Rev. (Santee Cooper) | | | | 500,000 | | | | | 5.75 | | | | | 12/1/43 | | | | | 572,880 | |
SC State Hsg. Finance & Dev. Auth. Rev. | | | | 500,000 | | | | | 3.05 | | | | | 7/1/45 | | | | | 517,740 | |
SC State Hsg. Finance & Dev. Auth. Rev. | | | | 790,000 | | | | | 4.00 | | | | | 1/1/47 | | | | | 838,119 | |
| | | | | | | | | | | | | | | | | | | | |
| | | | |
| | | | | | | | | | | | | | | | | | | 4,075,526 | |
| | | | | | | | | | | | | | | | | | | | |
| | | | |
See accompanying notes to financial statements. | | | | |
32 | | | SIT MUTUAL FUNDS ANNUAL REPORT | |
| | | | | | | | | | | | | | | | | | | | |
| | | | | |
| Name of Issuer | | Principal
Amount ($) | | Coupon
Rate (%) | | Maturity
Date | | Fair
Value ($) |
| | | | |
South Dakota - 0.3% | | | | | | | | | | | | | | | | | | | | |
SD Health & Educational Facs. Auth. Rev. (Westhills Village Retirement Community) | | | | 500,000 | | | | | 5.00 | | | | | 9/1/40 | | | | | 569,540 | |
SD Housing Dev. Auth. Rev. (GNMA/FNMA/FHLMC Collateralized) | | | | 500,000 | | | | | 2.20 | | | | | 11/1/43 | | | | | 492,445 | |
| | | | | | | | | | | | | | | | | | | | |
| | | | |
| | | | | | | | | | | | | | | | | | | 1,061,985 | |
| | | | | | | | | | | | | | | | | | | | |
| | | | |
Tennessee - 2.6% | | | | | | | | | | | | | | | | | | | | |
Franklin Health & Education Facs. Board Rev. (Provision Cares Proton Therapy Center) 2, 4, 5 | | | | 500,000 | | | | | 6.50 | | | | | 6/1/27 | | | | | 150,000 | |
Metropolitan Govt. Nashville & Davidson County Health & Edu. Facs. Board Rev. (Blakford at Green Hills) | | | | 895,000 | | | | | 4.00 | | | | | 11/1/45 | | | | | 930,111 | |
Nashville Metropolitan Dev. & Hsg. Agency Tax Allocation 4 | | | | 300,000 | | | | | 5.13 | | | | | 6/1/36 | | | | | 339,117 | |
Shelby Co. Health, Education & Hsg. Facs. Rev. (CME Memphis Apts. Proj.) 2, 5, 15 | | | | 1,850,000 | | | | | 5.35 | | | | | N/A | | | | | 4,625 | |
Shelby Co. Health, Education & Hsg. Facs. Rev. (CME Memphis Apts. Proj.) 2, 5 | | | | 7,875,000 | | | | | 5.55 | | | | | 1/1/29 | | | | | 19,688 | |
Shelby Co. Health, Education & Hsg. Facs. Rev. (CME Memphis Apts. Proj.) 2, 5 | | | | 1,630,000 | | | | | 6.00 | | | | | 1/1/29 | | | | | 16 | |
Shelby Co. Health, Education & Hsg. Facs. Rev. (The Farms at Bailey Station Proj.) | | | | 650,000 | | | | | 5.50 | | | | | 10/1/39 | | | | | 652,613 | |
TN Hsg. Dev. Agency. Rev. | | | | 290,000 | | | | | 3.60 | | | | | 1/1/31 | | | | | 298,303 | |
TN Hsg. Dev. Agency. Rev. | | | | 375,000 | | | | | 3.88 | | | | | 7/1/35 | | | | | 398,182 | |
TN Hsg. Dev. Agency. Rev. | | | | 195,000 | | | | | 3.95 | | | | | 7/1/35 | | | | | 207,578 | |
TN Hsg. Dev. Agency. Rev. | | | | 410,000 | | | | | 4.00 | | | | | 7/1/39 | | | | | 439,864 | |
TN Hsg. Dev. Agency. Rev. | | | | 460,000 | | | | | 3.85 | | | | | 7/1/42 | | | | | 495,015 | |
TN Hsg. Dev. Agency. Rev. | | | | 420,000 | | | | | 3.90 | | | | | 7/1/42 | | | | | 455,956 | |
TN Hsg. Dev. Agency. Rev. | | | | 980,000 | | | | | 4.00 | | | | | 7/1/44 | | | | | 1,063,986 | |
TN Hsg. Dev. Agency. Rev. | | | | 1,000,000 | | | | | 2.55 | | | | | 1/1/45 | | | | | 1,024,230 | |
TN Hsg. Dev. Agency. Rev. | | | | 935,000 | | | | | 3.95 | | | | | 1/1/49 | | | | | 996,691 | |
TN Hsg. Dev. Agency. Rev. | | | | 1,445,000 | | | | | 4.05 | | | | | 1/1/49 | | | | | 1,567,204 | |
| | | | | | | | | | | | | | | | | | | | |
| | | | |
| | | | | | | | | | | | | | | | | | | 9,043,179 | |
| | | | | | | | | | | | | | | | | | | | |
| | | | |
Texas - 7.4% | | | | | | | | | | | | | | | | | | | | |
Arlington Higher Education Finance Corp., Education Rev. (Leadership Prep School) | | | | 200,000 | | | | | 5.00 | | | | | 6/15/36 | | | | | 201,178 | |
Arlington Special Tax (BAM Insured) | | | | 350,000 | | | | | 5.00 | | | | | 2/15/41 | | | | | 392,997 | |
Brazoria Co. Municipal Utility District No. 28 G.O. (MAC Insured) | | | | 540,000 | | | | | 4.00 | | | | | 9/1/27 | | | | | 548,408 | |
Brazos Higher Education Auth., Inc. Rev. (Subordinate Student Loan) | | | | 1,000,000 | | | | | 3.00 | | | | | 4/1/40 | | | | | 935,560 | |
Central Texas Regional Mobility Auth. Rev. | | | | 500,000 | | | | | 4.00 | | | | | 1/1/45 | | | | | 561,195 | |
Central Texas Regional Mobility Auth. Rev. | | | | 500,000 | | | | | 4.00 | | | | | 1/1/50 | | | | | 562,505 | |
Cypress Hill Municipal Utility Dist. No. 1 G.O. (AGM Insured) | | | | 1,000,000 | | | | | 4.00 | | | | | 9/1/34 | | | | | 1,046,120 | |
Dallas/Fort Worth International Airport Rev. (JT Improvement) | | | | 500,000 | | | | | 5.25 | | | | | 11/1/37 | | | | | 557,515 | |
Danbury Higher Education Auth. Education Rev. (Golden Rule Schools) | | | | 650,000 | | | | | 5.13 | | | | | 8/15/49 | | | | | 670,286 | |
El Paso Co. Hospital District G.O. | | | | 825,000 | | | | | 5.00 | | | | | 8/15/43 | | | | | 869,080 | |
Fort Bend Co. Municipal Utility Dist. No. 50 G.O. (MAC Insured) | | | | 400,000 | | | | | 4.00 | | | | | 9/1/29 | | | | | 405,864 | |
Grand Parkway Transportation Corp. Rev. (Grand Parkway System) (BAM Insured) | | | | 1,000,000 | | | | | 3.00 | | | | | 10/1/50 | | | | | 1,050,410 | |
Harris Co. Cultural Education Facs. Finance Corp. Rev. (Brazos Presbyterian Homes, Inc. Proj.) | | | | 500,000 | | | | | 5.00 | | | | | 1/1/37 | | | | | 544,040 | |
Harris Co. Municipal Utility Dist. No. 284 G.O. (MAC Insured) | | | | 285,000 | | | | | 4.00 | | | | | 9/1/33 | | | | | 288,839 | |
Harris Co. Municipal Utility Dist. No. 381 G.O. (BAM Insured) | | | | 435,000 | | | | | 4.00 | | | | | 9/1/30 | | | | | 441,199 | |
Harris Co. Municipal Utility Dist. No. 381 G.O. (BAM Insured) | | | | 250,000 | | | | | 4.00 | | | | | 9/1/33 | | | | | 253,368 | |
Harris Co. Municipal Utility Dist. No. 400 G.O. (BAM Insured) | | | | 470,000 | | | | | 4.00 | | | | | 9/1/30 | | | | | 476,698 | |
Harris Co. Municipal Utility Dist. No. 400 G.O. (BAM Insured) | | | | 920,000 | | | | | 4.00 | | | | | 9/1/32 | | | | | 932,613 | |
Harris Co. Municipal Utility Dist. No. 400 G.O. (BAM Insured) | | | | 1,050,000 | | | | | 4.00 | | | | | 9/1/34 | | | | | 1,063,923 | |
Houston Higher Education Finance Corp. (Cosmos Foundation) | | | | 480,000 | | | | | 5.00 | | | | | 2/15/32 | | | | | 492,744 | |
Houston Higher Education Finance Corp. (Houston Baptist University Proj.) | | | | 500,000 | | | | | 3.38 | | | | | 10/1/37 | | | | | 498,580 | |
Meadowhill Regional Municipal Utility Dist. G.O. (AGM Insured) | | | | 500,000 | | | | | 4.00 | | | | | 10/1/35 | | | | | 524,090 | |
New Hope Cultural Education Fac. Corp. Rev. (Cardinal Bay) | | | | 260,000 | | | | | 4.00 | | | | | 7/1/23 | | | | | 250,442 | |
New Hope Cultural Education Fac. Corp. Rev. (Cardinal Bay) | | | | 460,000 | | | | | 4.00 | | | | | 7/1/26 | | | | | 415,086 | |
New Hope Cultural Education Facs. Corp. Rev. (Beta Academy) 4 | | | | 425,000 | | | | | 5.00 | | | | | 8/15/39 | | | | | 445,442 | |
New Hope Cultural Education Facs. Corp. Rev. (Cardinal Bay, Inc.) | | | | 400,000 | | | | | 5.00 | | | | | 7/1/46 | | | | | 400,880 | |
New Hope Cultural Education Facs. Corp. Rev. (Flower Mound Campus Proj.) 9 | | | | 495,000 | | | | | 3.75 | | | | | 6/1/28 | | | | | 510,949 | |
| | | | |
See accompanying notes to financial statements. | | | | |
MARCH 31, 2021 | | | 33 | |
SCHEDULE OF INVESTMENTS
March 31, 2021
Sit Tax-Free Income Fund (Continued)
| | | | | | | | | | | | | | | | | | | | |
| Name of Issuer | | Principal Amount ($) | | Coupon Rate (%) | | Maturity Date | | Fair Value ($) |
| | | | |
New Hope Cultural Education Facs. Corp. Rev. (Flower Mound Campus Proj.) 9 | | | | 500,000 | | | | | 4.00 | | | | | 6/1/32 | | | | | 519,455 | |
New Hope Cultural Education Facs. Corp. Rev. (Jubilee Academic Center) 4 | | | | 250,000 | | | | | 5.00 | | | | | 8/15/36 | | | | | 251,568 | |
New Hope Cultural Education Facs. Corp. Rev. (Presbyterian Village North Proj.) | | | | 500,000 | | | | | 5.00 | | | | | 10/1/34 | | | | | 524,815 | |
New Hope Cultural Education Facs. Corp. Rev. (Wesleyan Homes, Inc. Proj.) | | | | 250,000 | | | | | 5.50 | | | | | 1/1/35 | | | | | 261,735 | |
New Hope Cultural Education Facs. Finance Corp. Rev. (Presbyterian Village North Proj.) | | | | 350,000 | | | | | 5.25 | | | | | 10/1/49 | | | | | 362,702 | |
New Hope Cultural Education Facs. Finance Corp. Rev. (Wesleyan Homes, Inc. Proj.) | | | | 750,000 | | | | | 5.00 | | | | | 1/1/55 | | | | | 764,888 | |
Newark Higher Education Finance Corp. Rev. (Austin Achieve Public School) | | | | 100,000 | | | | | 5.00 | | | | | 6/15/37 | | | | | 105,648 | |
Newark Higher Education Finance Corp. Rev. (Austin Achieve Public School) | | | | 1,000,000 | | | | | 5.00 | | | | | 6/15/42 | | | | | 1,056,480 | |
North Central Texas Health Facility Development Corp. (CC Young Memorial Home) | | | | 204,000 | | | | | 5.38 | | | | | 2/15/25 | | | | | 163,131 | |
Parkway Utility Dist. G.O. (BAM Insured) | | | | 500,000 | | | | | 3.63 | | | | | 3/1/35 | | | | | 503,860 | |
Parkway Utility Dist. G.O. (Waterworks and Sewer System) (BAM Insured) | | | | 275,000 | | | | | 4.00 | | | | | 3/1/33 | | | | | 283,335 | |
Red River Health Facs. Dev. Corp. Rev. (MRC Crossings Proj.) | | | | 250,000 | | | | | 7.50 | | | | | 11/15/34 | | | | | 271,082 | |
Sugar Land Dev. Corp. Rev. (BAM Insured) | | | | 500,000 | | | | | 5.00 | | | | | 2/15/33 | | | | | 541,745 | |
Tarrant Co. Cultural Education Facs. Finance Corp. Rev. (Buckingham Senior Living Community,
Inc.) 2, 5 | | | | 500,000 | | | | | 5.63 | | | | | 11/15/27 | | | | | 226,250 | |
Tarrant Co. Cultural Education Facs. Finance Corp. Rev. (Buckner Retirement Service) | | | | 500,000 | | | | | 5.00 | | | | | 11/15/37 | | | | | 585,270 | |
Tarrant Co. Cultural Education Facs. Finance Corp. Rev. (Buckner Senior Living Ventana Proj.) | | | | 155,000 | | | | | 5.63 | | | | | 11/15/24 | | | | | 155,245 | |
TX Department of Housing & Community Affairs (GNMA Collateralized) | | | | 500,000 | | | | | 4.13 | | | | | 9/1/38 | | | | | 551,440 | |
TX Department of Housing & Community Affairs (GNMA Collateralized) | | | | 1,100,000 | | | | | 3.63 | | | | | 9/1/44 | | | | | 1,178,969 | |
TX Department of Housing & Community Affairs (GNMA Collateralized) | | | | 500,000 | | | | | 3.00 | | | | | 9/1/45 | | | | | 518,120 | |
TX Grand Parkway Transportation Corp. Rev. 6 | | | | 500,000 | | | | | 6.00 | | | | | 10/1/35 | | | | | 572,390 | |
TX State Affordable Hsg. Corp. Rev. (Heroes Home Loan Program) (GNMA Collateralized) | | | | 880,000 | | | | | 4.00 | | | | | 3/1/50 | | | | | 958,487 | |
| | | | | | | | | | | | | | | | | | | | |
| | | | |
| | | | | | | | | | | | | | | | | | | 25,696,626 | |
| | | | | | | | | | | | | | | | | | | | |
Utah - 0.2% | | | | | | | | | | | | | | | | | | | | |
UT Hsg. Corp. Single Family Mtg. Rev. | | | | 25,000 | | | | | 5.75 | | | | | 1/1/33 | | | | | 25,050 | |
UT Hsg. Corp. Single Family Mtg. Rev. | | | | 55,000 | | | | | 4.60 | | | | | 7/1/34 | | | | | 55,063 | |
UT Hsg. Corp. Single Family Mtg. Rev. (FHA Insured) | | | | 280,000 | | | | | 4.00 | | | | | 1/1/36 | | | | | 299,936 | |
West Valley City Municipal Building Auth. Rev. (AGM Insured) | | | | 400,000 | | | | | 5.00 | | | | | 2/1/39 | | | | | 471,172 | |
| | | | | | | | | | | | | | | | | | | | |
| | | | |
| | | | | | | | | | | | | | | | | | | 851,221 | |
| | | | | | | | | | | | | | | | | | | | |
Vermont - 0.1% | | | | | | | | | | | | | | | | | | | | |
VT Hsg. Fin. Agy. Rev. (GNMA/FNMA/FHLMC Collateralized) | | | | 325,000 | | | | | 3.50 | | | | | 5/1/38 | | | | | 343,187 | |
| | | | | | | | | | | | | | | | | | | | |
Virginia - 0.4% | | | | | | | | | | | | | | | | | | | | |
VA Hsg. Dev. Auth. Rev. (Commonwealth Mtg.) | | | | 300,000 | | | | | 3.88 | | | | | 1/1/38 | | | | | 300,000 | |
VA Hsg. Dev. Auth. Rev. (GNMA/FNMA/FHLMC Collateralized) | | | | 500,000 | | | | | 2.45 | | | | | 11/1/45 | | | | | 495,920 | |
VA Hsg. Dev. Auth. Rev. (Rental Hsg. Proj.) | | | | 400,000 | | | | | 4.13 | | | | | 7/1/33 | | | | | 416,604 | |
| | | | | | | | | | | | | | | | | | | | |
| | | | |
| | | | | | | | | | | | | | | | | | | 1,212,524 | |
| | | | | | | | | | | | | | | | | | | | |
Washington - 3.1% | | | | | | | | | | | | | | | | | | | | |
Kalispel Tribe of Indians Rev. 4 | | | | 300,000 | | | | | 5.25 | | | | | 1/1/38 | | | | | 340,695 | |
King Co. Hsg. Auth. Rev. | | | | 1,000,000 | | | | | 3.00 | | | | | 11/1/39 | | | | | 1,058,680 | |
King Co. Hsg. Auth. Rev. | | | | 750,000 | | | | | 3.00 | | | | | 8/1/40 | | | | | 792,578 | |
Pike Place Market Preservation Dev. Auth. Rev. | | | | 500,000 | | | | | 5.00 | | | | | 12/1/40 | | | | | 542,210 | |
Seattle Hsg. Auth. Rev. (Hinoki Apartments Proj.) | | | | 500,000 | | | | | 3.00 | | | | | 6/1/52 | | | | | 513,690 | |
Snohomish Co. Hsg. Auth. Rev. | | | | 500,000 | | | | | 4.00 | | | | | 4/1/44 | | | | | 547,560 | |
Vancouver Hsg. Auth. Rev. | | | | 500,000 | | | | | 3.75 | | | | | 8/1/34 | | | | | 543,505 | |
Vancouver Hsg. Auth. Rev. (Anthem Park & Columbia Hsg. Proj.) | | | | 1,000,000 | | | | | 3.00 | | | | | 6/1/38 | | | | | 1,035,400 | |
Vancouver Hsg. Auth. Rev. (Van Vista Plaza Proj.) | | | | 1,000,000 | | | | | 3.30 | | | | | 12/1/51 | | | | | 1,047,920 | |
WA Hsg. Fin. Commission Multi Family Mtg. Rev. (Bayview Manor Homes) 4 | | | | 250,000 | | | | | 5.00 | | | | | 7/1/31 | | | | | 267,838 | |
WA Hsg. Fin. Commission Multi Family Mtg. Rev. (Bayview Manor Homes) 4 | | | | 850,000 | | | | | 5.00 | | | | | 7/1/36 | | | | | 903,329 | |
WA Hsg. Fin. Commission Multi Family Mtg. Rev. (Horizon House Proj.) 4 | | | | 500,000 | | | | | 5.00 | | | | | 1/1/38 | | | | | 567,540 | |
WA Hsg. Fin. Commission Multi Family Mtg. Rev. (The Hearthstone Proj.) 4 | | | | 1,075,000 | | | | | 5.00 | | | | | 7/1/38 | | | | | 1,117,237 | |
| | | | |
See accompanying notes to financial statements. | | | | |
34 | | | SIT MUTUAL FUNDS ANNUAL REPORT | |
| | | | | | | | | | | | | | | | | | | | |
| Name of Issuer | | Principal Amount ($) | | Coupon Rate (%) | | Maturity Date | | Fair Value ($) |
| | | | |
WA Hsg. Fin. Commission Multi Family Mtg. Rev. (The Hearthstone Proj.) 4 | | | | 525,000 | | | | | 5.00 | | | | | 7/1/48 | | | | | 536,792 | |
WA Hsg. Fin. Commission Multi Family Mtg. Rev. (Transforming Age Proj.) 4 | | | | 500,000 | | | | | 5.00 | | | | | 1/1/44 | | | | | 546,320 | |
WA Hsg. Fin. Commission Multi Family Mtg. Rev. (Wesley Homes Lea Hill Proj.) 4 | | | | 300,000 | | | | | 5.00 | | | | | 7/1/36 | | | | | 311,160 | |
WA Hsg. Fin. Commission Single Family Mtg. Rev. (GNMA/FNMA/FHLMC Collateralized) | | | | 60,000 | | | | | 4.60 | | | | | 10/1/33 | | | | | 60,127 | |
| | | | | | | | | | | | | | | | | | | | |
| | | | |
| | | | | | | | | | | | | | | | | | | 10,732,581 | |
| | | | | | | | | | | | | | | | | | | | |
West Virginia - 0.4% | | | | | | | | | | | | | | | | | | | | |
WV Hsg. Dev. Fund Rev. | | | | 250,000 | | | | | 3.75 | | | | | 11/1/32 | | | | | 265,685 | |
WV Hsg. Dev. Fund Rev. | | | | 100,000 | | | | | 3.80 | | | | | 11/1/35 | | | | | 103,074 | |
WV Hsg. Dev. Fund Rev. | | | | 1,005,000 | | | | | 2.75 | | | | | 11/1/45 | | | | | 1,023,653 | |
| | | | | | | | | | | | | | | | | | | | |
| | | | |
| | | | | | | | | | | | | | | | | | | 1,392,412 | |
| | | | | | | | | | | | | | | | | | | | |
Wisconsin - 4.4% | | | | | | | | | | | | | | | | | | | | |
Public Finance Auth. Rev. (Appalachian Regional Healthcare System Obligated Group) | | | | 500,000 | | | | | 4.00 | | | | | 7/1/46 | | | | | 558,260 | |
Public Finance Auth. Rev. (Presbyterian Villages of Michigan) 4 | | | | 645,000 | | | | | 4.75 | | | | | 11/15/53 | | | | | 652,772 | |
WI Health & Education Facs. Auth. Rev. (Medical College) | | | | 870,000 | | | | | 5.25 | | | | | 12/1/35 | | | | | 872,958 | |
WI Health & Education Facs. Auth. Rev. (PHW Oconomowoc, Inc. Proj.) | | | | 500,000 | | | | | 5.13 | | | | | 10/1/48 | | | | | 518,740 | |
WI Health & Education Facs. Auth. Rev. (St. John’s Communities, Inc. Proj.) | | | | 500,000 | | | | | 5.00 | | | | | 9/15/40 | | | | | 523,030 | |
WI Health & Education Facs. Auth. Rev. (St. John’s Communities, Inc. Proj.) | | | | 500,000 | | | | | 5.00 | | | | | 9/15/45 | | | | | 520,990 | |
WI Health & Educational Facs. Auth. Rev. (Aspirus, Inc. Obligation Group) | | | | 500,000 | | | | | 5.00 | | | | | 8/15/32 | | | | | 569,465 | |
WI Health & Educational Facs. Auth. Rev. (Benevolent Corp. Cedar Community) | | | | 300,000 | | | | | 5.00 | | | | | 6/1/37 | | | | | 321,279 | |
WI Health & Educational Facs. Auth. Rev. (Froedtert Health, Inc. Obligated Group) | | | | 500,000 | | | | | 5.00 | | | | | 4/1/35 | | | | | 602,965 | |
WI Health & Educational Facs. Auth. Rev. (St. Camillus Health System, Inc.) | | | | 745,000 | | | | | 5.00 | | | | | 11/1/27 | | | | | 814,658 | |
WI Health & Educational Facs. Auth. Rev. (St. Camillus Health System, Inc.) | | | | 350,000 | | | | | 5.00 | | | | | 11/1/46 | | | | | 366,121 | |
WI Health & Educational Facs. Auth. Rev. (Three Pillars Senior Living Communities) | | | | 920,000 | | | | | 5.00 | | | | | 8/15/43 | | | | | 1,018,652 | |
WI Housing & Economic Dev. Auth. Rev. | | | | 250,000 | | | | | 3.88 | | | | | 11/1/35 | | | | | 267,225 | |
WI Housing & Economic Dev. Auth. Rev. | | | | 560,000 | | | | | 3.90 | | | | | 11/1/42 | | | | | 601,031 | |
WI Housing & Economic Dev. Auth. Rev. | | | | 1,500,000 | | | | | 4.15 | | | | | 5/1/55 | | | | | 1,604,580 | |
WI Public Finance Auth. Rev. (ACTS Retirement-Life Community, Inc.) | | | | 600,000 | | | | | 4.00 | | | | | 11/15/37 | | | | | 685,692 | |
WI Public Finance Auth. Rev. (Carmelite System, Inc.) | | | | 500,000 | | | | | 5.00 | | | | | 1/1/45 | | | | | 580,675 | |
WI Public Finance Auth. Rev. (Coral Academy of Science Reno) 4 | | | | 700,000 | | | | | 5.00 | | | | | 6/1/39 | | | | | 754,845 | |
WI Public Finance Auth. Rev. (Delray Beach Radiation Therapy) 4 | | | | 750,000 | | | | | 6.25 | | | | | 11/1/28 | | | | | 781,748 | |
WI Public Finance Auth. Rev. (Glenridge Palmer Ranch Proj.) 4 | | | | 500,000 | | | | | 8.25 | | | | | 6/1/46 | | | | | 513,525 | |
WI Public Finance Auth. Rev. (Lombard Public Facilities Corp.) 2, 4, 6 | | | | 16,520 | | | | | 9.00 | | | | | 1/1/46 | | | | | 483 | |
WI Public Finance Auth. Rev. (Lombard Public Facilities Corp.) 2, 4, 6 | | | | 16,287 | | | | | 9.00 | | | | | 1/1/47 | | | | | 458 | |
WI Public Finance Auth. Rev. (Lombard Public Facilities Corp.) 2, 4, 6 | | | | 447 | | | | | 12.00 | | | | | 1/1/47 | | | | | 13 | |
WI Public Finance Auth. Rev. (Lombard Public Facilities Corp.) 2, 4, 6 | | | | 16,171 | | | | | 9.00 | | | | | 1/1/48 | | | | | 447 | |
WI Public Finance Auth. Rev. (Lombard Public Facilities Corp.) 2, 4, 6 | | | | 390 | | | | | 12.00 | | | | | 1/1/48 | | | | | 11 | |
WI Public Finance Auth. Rev. (Lombard Public Facilities Corp.) 2, 4, 6 | | | | 16,055 | | | | | 9.00 | | | | | 1/1/49 | | | | | 435 | |
WI Public Finance Auth. Rev. (Lombard Public Facilities Corp.) 2, 4, 6 | | | | 384 | | | | | 11.00 | | | | | 1/1/49 | | | | | 10 | |
WI Public Finance Auth. Rev. (Lombard Public Facilities Corp.) 2, 4, 6 | | | | 15,822 | | | | | 9.00 | | | | | 1/1/50 | | | | | 412 | |
WI Public Finance Auth. Rev. (Lombard Public Facilities Corp.) 2, 4, 6 | | | | 372 | | | | | 11.00 | | | | | 1/1/50 | | | | | 10 | |
WI Public Finance Auth. Rev. (Lombard Public Facilities Corp.) 2, 4, 6 | | | | 17,334 | | | | | 9.00 | | | | | 1/1/51 | | | | | 443 | |
WI Public Finance Auth. Rev. (Lombard Public Facilities Corp.) 2, 4, 6 | | | | 365 | | | | | 11.00 | | | | | 1/1/51 | | | | | 9 | |
WI Public Finance Auth. Rev. (Lombard Public Facilities Corp.) 1, 2, 4 | | | | 446,245 | | | | | 3.75 | | | | | 7/1/51 | | | | | 299,516 | |
WI Public Finance Auth. Rev. (Lombard Public Facilities Corp.) 2, 4, 6 | | | | 17,218 | | | | | 9.00 | | | | | 1/1/52 | | | | | 423 | |
WI Public Finance Auth. Rev. (Lombard Public Facilities Corp.) 2, 4, 6 | | | | 475 | | | | | 10.00 | | | | | 1/1/52 | | | | | 12 | |
WI Public Finance Auth. Rev. (Lombard Public Facilities Corp.) 2, 4, 6 | | | | 16,985 | | | | | 9.00 | | | | | 1/1/53 | | | | | 409 | |
WI Public Finance Auth. Rev. (Lombard Public Facilities Corp.) 2, 4, 6 | | | | 469 | | | | | 10.00 | | | | | 1/1/53 | | | | | 11 | |
WI Public Finance Auth. Rev. (Lombard Public Facilities Corp.) 2, 4, 6 | | | | 16,869 | | | | | 9.00 | | | | | 1/1/54 | | | | | 395 | |
WI Public Finance Auth. Rev. (Lombard Public Facilities Corp.) 2, 4, 6 | | | | 453 | | | | | 10.00 | | | | | 1/1/54 | | | | | 11 | |
WI Public Finance Auth. Rev. (Lombard Public Facilities Corp.) 2, 4, 6 | | | | 16,636 | | | | | 9.00 | | | | | 1/1/55 | | | | | 381 | |
| | | | |
See accompanying notes to financial statements. | | | | |
MARCH 31, 2021 | | | 35 | |
SCHEDULE OF INVESTMENTS
March 31, 2021
Sit Tax-Free Income Fund (Continued)
| | | | | | | | | | | | | | | | | | | | |
| Name of Issuer | | Principal Amount ($) Quantity | | Coupon Rate (%) | | Maturity Date | | Fair Value ($) |
| | | | |
WI Public Finance Auth. Rev. (Lombard Public Facilities Corp.) 2, 4, 6 | | | | 444 | | | | | 9.00 | | | | | 1/1/55 | | | | | 10 | |
WI Public Finance Auth. Rev. (Lombard Public Facilities Corp.) 2, 4, 6 | | | | 16,404 | | | | | 9.00 | | | | | 1/1/56 | | | | | 370 | |
WI Public Finance Auth. Rev. (Lombard Public Facilities Corp.) 2, 4, 6 | | | | 434 | | | | | 9.00 | | | | | 1/1/56 | | | | | 10 | |
WI Public Finance Auth. Rev. (Lombard Public Facilities Corp.) 2, 4, 5 | | | | 22,407 | | | | | 5.50 | | | | | 7/1/56 | | | | | 17,041 | |
WI Public Finance Auth. Rev. (Lombard Public Facilities Corp.) 2, 4, 6 | | | | 16,287 | | | | | 9.00 | | | | | 1/1/57 | | | | | 357 | |
WI Public Finance Auth. Rev. (Lombard Public Facilities Corp.) 2, 4, 6 | | | | 481 | | | | | 9.00 | | | | | 1/1/57 | | | | | 11 | |
WI Public Finance Auth. Rev. (Lombard Public Facilities Corp.) 2, 4, 6 | | | | 16,055 | | | | | 9.00 | | | | | 1/1/58 | | | | | 344 | |
WI Public Finance Auth. Rev. (Lombard Public Facilities Corp.) 2, 4, 6 | | | | 469 | | | | | 9.00 | | | | | 1/1/58 | | | | | 10 | |
WI Public Finance Auth. Rev. (Lombard Public Facilities Corp.) 2, 4, 6 | | | | 15,938 | | | | | 9.00 | | | | | 1/1/59 | | | | | 335 | |
WI Public Finance Auth. Rev. (Lombard Public Facilities Corp.) 2, 4, 6 | | | | 456 | | | | | 9.00 | | | | | 1/1/59 | | | | | 10 | |
WI Public Finance Auth. Rev. (Lombard Public Facilities Corp.) 2, 4, 6 | | | | 447 | | | | | 8.00 | | | | | 1/1/60 | | | | | 9 | |
WI Public Finance Auth. Rev. (Lombard Public Facilities Corp.) 2, 4, 6 | | | | 15,822 | | | | | 9.00 | | | | | 1/1/60 | | | | | 322 | |
WI Public Finance Auth. Rev. (Lombard Public Facilities Corp.) 2, 4, 6 | | | | 440 | | | | | 8.00 | | | | | 1/1/61 | | | | | 9 | |
WI Public Finance Auth. Rev. (Lombard Public Facilities Corp.) 2, 4, 6 | | | | 15,589 | | | | | 9.00 | | | | | 1/1/61 | | | | | 308 | |
WI Public Finance Auth. Rev. (Lombard Public Facilities Corp.) 2, 4, 6 | | | | 428 | | | | | 8.00 | | | | | 1/1/62 | | | | | 8 | |
WI Public Finance Auth. Rev. (Lombard Public Facilities Corp.) 2, 4, 6 | | | | 15,473 | | | | | 9.00 | | | | | 1/1/62 | | | | | 298 | |
WI Public Finance Auth. Rev. (Lombard Public Facilities Corp.) 2, 4, 6 | | | | 419 | | | | | 8.00 | | | | | 1/1/63 | | | | | 8 | |
WI Public Finance Auth. Rev. (Lombard Public Facilities Corp.) 2, 4, 6 | | | | 15,240 | | | | | 9.00 | | | | | 1/1/63 | | | | | 288 | |
WI Public Finance Auth. Rev. (Lombard Public Facilities Corp.) 2, 4, 6 | | | | 409 | | | | | 8.00 | | | | | 1/1/64 | | | | | 8 | |
WI Public Finance Auth. Rev. (Lombard Public Facilities Corp.) 2, 4, 6 | | | | 15,124 | | | | | 9.00 | | | | | 1/1/64 | | | | | 281 | |
WI Public Finance Auth. Rev. (Lombard Public Facilities Corp.) 2, 4, 6 | | | | 403 | | | | | 7.00 | | | | | 1/1/65 | | | | | 7 | |
WI Public Finance Auth. Rev. (Lombard Public Facilities Corp.) 2, 4, 6 | | | | 15,008 | | | | | 9.00 | | | | | 1/1/65 | | | | | 269 | |
WI Public Finance Auth. Rev. (Lombard Public Facilities Corp.) 2, 4, 6 | | | | 434 | | | | | 7.00 | | | | | 1/1/66 | | | | | 7 | |
WI Public Finance Auth. Rev. (Lombard Public Facilities Corp.) 2, 4, 6 | | | | 14,775 | | | | | 9.00 | | | | | 1/1/66 | | | | | 252 | |
WI Public Finance Auth. Rev. (Lombard Public Facilities Corp.) 2, 4, 6 | | | | 5,235 | | | | | 5.00 | | | | | 1/1/67 | | | | | 83 | |
WI Public Finance Auth. Rev. (Lombard Public Facilities Corp.) 2, 4, 6 | | | | 192,429 | | | | | 9.00 | | | | | 1/1/67 | | | | | 3,054 | |
WI Public Finance Auth. Rev. (MD Proton Treatment Center) 4 | | | | 500,000 | | | | | 6.13 | | | | | 1/1/33 | | | | | 428,930 | |
WI Public Finance Auth. Rev. (MN College of Osteopathic Medicine) 2, 4, 5 | | | | 7,608 | | | | | 5.50 | | | | | 12/1/48 | | | | | 3,804 | |
WI Public Finance Auth. Rev. (North Carolina Leadership Academy) 4 | | | | 410,000 | | | | | 5.00 | | | | | 6/15/39 | | | | | 444,018 | |
WI Public Finance Auth. Rev. (Roseman University Health Sciences) | | | | 240,000 | | | | | 5.00 | | | | | 4/1/25 | | | | | 255,905 | |
WI Public Finance Auth. Rev. (Roseman University Health Sciences) | | | | 500,000 | | | | | 5.50 | | | | | 4/1/32 | | | | | 518,600 | |
WI Public Finance Auth. Rev. (Southminster) 4 | | | | 250,000 | | | | | 5.00 | | | | | 10/1/43 | | | | | 269,255 | |
| | | | | | | | | | | | | | | | | | | | |
| | | | |
| | | | | | | | | | | | | | | | | | | 15,377,321 | |
| | | | | | | | | | | | | | | | | | | | |
Wyoming - 0.2% | | | | | | | | | | | | | | | | | | | | |
WY Community Dev. Auth. Rev. | | | | 160,000 | | | | | 3.75 | | | | | 12/1/32 | | | | | 163,909 | |
WY Community Dev. Auth. Rev. | | | | 335,000 | | | | | 3.90 | | | | | 12/1/38 | | | | | 353,495 | |
WY Community Dev. Auth. Rev. | | | | 280,000 | | | | | 4.05 | | | | | 12/1/38 | | | | | 287,795 | |
| | | | | | | | | | | | | | | | | | | | |
| | | | |
| | | | | | | | | | | | | | | | | | | 805,199 | |
| | | | | | | | | | | | | | | | | | | | |
| | | | |
Total Municipal Bonds
(cost: $315,718,184) | | | | | | | | | | | | | | | | | | | 314,969,904 | |
| | | | | | | | | | | | | | | | | | | | |
| | | | |
Investment Companies - 5.5% | | | | | | | | | | | | | | | | | | | | |
BlackRock Long-Term Municipal Advantage Trust (BTA) | | | | 59,383 | | | | | | | | | | | | | | | 751,789 | |
BlackRock MuniEnhanced Fund, Inc. (MEN) | | | | 36,706 | | | | | | | | | | | | | | | 433,865 | |
BlackRock MuniHoldings Florida Insured Fund (MFL) | | | | 85,398 | | | | | | | | | | | | | | | 1,220,337 | |
BlackRock MuniHoldings Fund, Inc. (MHD) | | | | 81,102 | | | | | | | | | | | | | | | 1,297,632 | |
BlackRock MuniHoldings Quality Fund II, Inc. (MUE) | | | | 57,814 | | | | | | | | | | | | | | | 774,708 | |
BlackRock MuniYield Insured Fund (MYI) | | | | 71,171 | | | | | | | | | | | | | | | 1,014,898 | |
BlackRock MuniYield Michigan Insured Fund (MIY) | | | | 21,538 | | | | | | | | | | | | | | | 323,716 | |
BNY Mellon Strategic Municipal Bond Fund, Inc. (DSM) | | | | 35,000 | | | | | | | | | | | | | | | 274,050 | |
DWS Municipal, Income Trust (KTF) | | | | 93,236 | | | | | | | | | | | | | | | 1,086,199 | |
| | | | |
See accompanying notes to financial statements. | | | | |
36 | | | SIT MUTUAL FUNDS ANNUAL REPORT | |
| | | | | | | | | | | | | | | | |
| Name of Issuer | | Quantity | | | | | | | | | Fair Value ($) | |
| | | | |
DWS Strategic Municipal Income Trust (KSM) | | | 26,351 | | | | | | | | | | | | 311,732 | |
Eaton Vance Municipal Bond Fund (EIM) | | | 5,360 | | | | | | | | | | | | 71,288 | |
Invesco Municipal Opportunity Trust (VMO) | | | 67,520 | | | | | | | | | | | | 889,914 | |
Invesco Municipal Trust (VKQ) | | | 76,872 | | | | | | | | | | | | 1,014,710 | |
Invesco Quality Municipal Income Trust (IQI) | | | 89,700 | | | | | | | | | | | | 1,163,409 | |
Invesco Value Municipal Income Trust (IIM) | | | 44,500 | | | | | | | | | | | | 697,315 | |
Invesco Van Kampen Advantage Muni Income Trust (VKI) | | | 115,007 | | | | | | | | | | | | 1,362,833 | |
Invesco Van Kampen Trust For Investment Grade Municipals (VGM) | | | 71,847 | | | | | | | | | | | | 968,498 | |
Nuveen AMT-Free Quality Municipal Income Fund (NEA) | | | 163,972 | | | | | | | | | | | | 2,430,065 | |
Nuveen Dividend Advantage Municipal Income Fund (NVG) | | | 20,000 | | | | | | | | | | | | 338,000 | |
Nuveen Pennsylvania Quality Municipal Income Fund (NQP) | | | 5,000 | | | | | | | | | | | | 71,800 | |
Nuveen Quality Municipal Income Fund (NAD) | | | 163,973 | | | | | | | | | | | | 2,482,551 | |
Putnam Municipal Opportunities Trust (PMO) | | | 15,000 | | | | | | | | | | | | 201,000 | |
| | | | | | | | | | | | | | | | |
| | | | |
Total Investment Companies
(cost: $18,024,383) | | | | | | | | | | | | | | | 19,180,309 | |
| | | | | | | | | | | | | | | | |
| | | | |
Total Investments in Securities - 96.0%
(cost: $333,742,567) | | | | | | | | | | | | | | | 334,150,213 | |
Other Assets and Liabilities, net - 4.0% | | | | | | | | | | | | | | | 14,079,425 | |
| | | | | | | | | | | | | | | | |
| | | | |
Total Net Assets - 100.0% | | | | | | | | | | | | | | $ | 348,229,638 | |
| | | | | | | | | | | | | | | | |
| 1 | Variable rate security. Rate disclosed is as of March 31, 2021. Certain variable rate securities are not based on a published reference rate and spread but are determined by the issuer or agent and are based on current market conditions, or, for mortgage-backed securities, are impacted by the individual mortgages which are paying off over time. These securities do not indicate a reference rate and spread in their descriptions. |
| 2 | Securities considered illiquid by the Investment Adviser. The total value of such securities as of March 31, 2021 was $2,401,881 and represented 0.7% of net assets. |
| 4 | 144A Restricted Security. The total value of such securities as of March 31, 2021 was $32,167,482 and represented 9.2% of net assets. These securities have been determined to be liquid by the Adviser in accordance with guidelines established by the Board of Directors. |
| 5 | The issuer is in default of interest or principal payments, or other debt covenants. Income is not being accrued. The total value of such securities as of March 31, 2021 was $2,650,474 and represented 0.8% of net assets. |
| 6 | Zero coupon or convertible capital appreciation bond, for which the rate disclosed is either the effective yield on purchase date or the coupon rate to be paid upon conversion to coupon paying. |
| 9 | Municipal Lease Security. The total value of such securities as of March 31, 2021 was $5,744,810 and represented 1.6% of net assets. These securities have been determined to be liquid by the Adviser in accordance with guidelines established by the Board of Directors. |
| 15 | Securities with a “N/A” maturity date have passed their stated maturity date and have pending restructuring arrangements. |
Numeric footnotes not disclosed are not applicable to this Schedule of Investments.
A summary of the levels for the Fund’s investments as of March 31, 2021 is as follows (see Note 2-significant accounting policies in the notes to financial statements):
| | | | | | | | | | | | | | | | |
| | | | | | Investment in Securities | | | | |
| | | Level 1 | | | Level 2 | | | Level 3 | | | | |
| | | Quoted | | | Other significant | | | Significant | | | | |
| | | Price ($) | | | observable inputs ($) | | | unobservable inputs ($) | | | Total ($) | |
Assets | | | | | | | | | | | | | | | | |
Municipal Bonds | | | — | | | | 314,969,904 | | | | — | | | | 314,969,904 | |
Investment Companies | | | 19,180,309 | | | | — | | | | — | | | | 19,180,309 | |
| | | 19,180,309 | | | | 314,969,904 | | | | — | | | | 334,150,213 | |
There were no transfers into or out of level 3 during the reporting period.
| | | | |
See accompanying notes to financial statements. | | | | |
MARCH 31, 2021 | | | 37 | |
|
|
| |
Sit Minnesota Tax-Free Income Fund |
OBJECTIVE & STRATEGY
The investment objective of the Minnesota Tax-Free Income Fund is to provide a high level of current income exempt from federal regular income tax and Minnesota regular personal income tax as is consistent with the preservation of capital.
During normal market conditions, the Fund invests 100% of its net assets in municipal securities that generate interest income that is exempt from federal regular income tax and Minnesota regular personal income tax. The Fund anticipates that substantially all of its distributions to its shareholders will be exempt as such. For investors subject to the alternative minimum tax (“AMT”), up to 20% of the Fund’s income may be alternative minimum taxable income.
Fund Performance
The Sit Minnesota Tax-Free Income Fund provided a return of +5.94% during the fiscal year ended March 31, 2021, versus a return of +5.07% for its benchmark, the Bloomberg Barclays 5-year Municipal Bond Index. As of March 31, 2021, the Fund’s 30-day SEC yield was 1.81%, compared to the yield of 0.67% for the benchmark index. The Fund’s
12-month distribution rate was 2.83%.
Factors that Influenced the Fund’s Performance
The tax-exempt yield curve shifted lower and steepened during the past year with short yields falling the most. Yields for short maturities fell approximately 60-90 basis points from COVID-19 crisis levels at the beginning of the year. Meanwhile, yields for intermediate to long maturities fell to historic lows in August before bouncing up to end the year down 20-25 basis points. Tax-exempt fund flows provided exceptionally strong support for the municipal market throughout much of the period. Municipal issuance for the fiscal year was about $450B, which slightly exceeded the prior fiscal year yet was easily absorbed by the market. In comparison, Minnesota issuance declined more than 17% from the prior year, providing solid technical support. Credit spreads for tax-exempt bonds were largely unchanged for the year for AA-rated and A-rated credits. BBB-rated spreads, which had widened in response to the pandemic leading into the fiscal year, narrowed somewhat.
Minnesota’s budget and economic outlook have improved since the onset of the COVID-19 crisis. The latest forecast for the FY2020-21 biennium showed a projected surplus of $940 million. In addition, state economists now project a surplus of $1.6 billion for the next two-year budget. Minnesota’s unemployment rate of 4.3% compares favorably to the 6.2% national rate as of February 2021 and the state’s general obligation bond rating remains at AAA by Standard & Poor’s Corp. and Aa1 by Moody’s.
The Fund benefited from a larger weighting of long duration bonds relative to the benchmark over the last year, as longer bonds significantly outperformed shorter bonds. In terms of quality, performance was directly correlated with credit risk as BBB-rated bonds were the best performing part of the index and AAA-rated bonds the worst. The Fund’s exposure to BBB-rated bonds as well as significant allocation to below investment grade and non-rated bonds were the biggest reasons the Fund outperformed its benchmark for the year. As such, the Fund benefited from holdings in multi-family mortgage revenue bonds and education/student loan revenue bonds. Conversely, the Fund’s significant weighting in single-family mortgage revenue bonds lagged the benchmark.
HYPOTHETICAL GROWTH OF $10,000
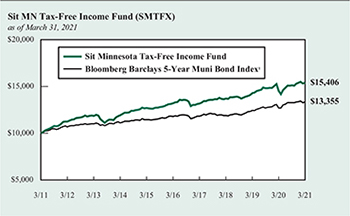
The chart above illustrates the total value of a hypothetical $10,000 investment in the Fund over the past 10 years (or for the life of the Fund if shorter) as compared to the performance of the Bloomberg Barclays 5-Year Municipal Bond Index. Past performance does not guarantee future results. Returns include the reinvestment of distributions. The chart does not reflect the deduction of taxes that a shareholder would pay on Fund distributions or the redemption of Fund shares.
1 The Bloomberg Barclays 5-Year Municipal Bond Index is the 5 year (4-6) component of the Municipal Bond Index, an unmanaged, rules-based, market-value-weighted index for the long-term tax-exempt bond market. The index includes bonds with a minimum credit rating of BBB. The returns include the reinvestment of income and do not include any transaction costs, management fees or other costs. It is not possible to invest directly in an index. This is the Fund’s primary index.
Outlook and Positioning
The economic impact of the pandemic remains a concern for investors, but Minnesota and its local governments have already received significant assistance from the federal government. In addition, Minnesota governments and programs are slated to receive almost $8 billion from the American Rescue Plan, which was enacted on March 11, 2021.
The Fund’s core strategy continues to emphasize current income as the primary driver of returns over the long run. Housing-related sectors remain a meaningful percentage of the Fund, totaling almost 40% of Fund assets, and continue to present an attractive relative value. Similarly, almost 25% of the Fund remains invested in non-rated bonds which provide an attractive income advantage. We will add to higher coupon bonds when available and continue to focus deeply on credit analysis to take advantage of opportunities as they arise, which we expect to be limited in the current environment. We believe the Fund is well-positioned to achieve attractive risk-adjusted returns going forward.
Paul J. Jungquist, CFA
Senior Portfolio Manager
| | |
Information on this page is unaudited. |
38 | | SIT MUTUAL FUNDS ANNUAL REPORT |
COMPARATIVE RATES OF RETURNS
| | | | | | | | | | | | | | | |
| as of March 31, 2021 | | Sit
Minnesota
Tax-Free
Income Fund | | Bloomberg
Barclays
5-Year
Muni. Bond
Index1 | | Lipper MN
Muni. Bond
Fund Index2 |
| | | |
One Year | | | | 5.94 | % | | | | 5.07 | % | | | | 4.43 | % |
| | | |
Five Years | | | | 3.11 | | | | | 2.52 | | | | | 2.83 | |
| | | |
Ten Years | | | | 4.42 | | | | | 2.94 | | | | | 4.11 | |
| | | |
Since Inception
(12/1/93) | | | | 4.60 | | | | | 4.18 | | | | | 4.34 | |
Performance figures are historical and do not guarantee future results. Investment returns and principal value will vary, and you may have a gain or loss when you sell shares. Current performance may be lower or higher than the performance data quoted. Contact the Fund for performance data current to the most recent month-end. Returns include changes in share price as well as reinvestment of all dividends and capital gains. Returns do not reflect the deduction of taxes that a shareholder would pay on Fund distributions or the redemption of Fund shares. Management fees and administrative expenses are included in the Fund’s performance. Returns for periods greater than one year are compounded average annual rates of return.
1 The Bloomberg Barclays 5-Year Municipal Bond Index is the 5 year (4-6) component of the Municipal Bond Index, an unmanaged, rules-based, market-value-weighted index made for the long-term tax-exempt bond market. The index includes bonds with a minimum credit rating of BBB. The returns include the reinvestment of income and do not include any transaction costs, management fees or other costs. It is not possible to invest directly in an index.
2 The Lipper returns are obtained from Lipper Analytical Services, Inc., a large independent evaluator of mutual funds.
FUND DIVERSIFICATION
| | | | |
| |
Multifamily Mortgage | | | 20.6 | % |
Single Family Mortgage | | | 17.7 | |
Education/Student Loan | | | 15.5 | |
Hospital/Health Care | | | 14.3 | |
General Obligation | | | 10.6 | |
Municipal Lease | | | 5.5 | |
Sectors less than 5.0% | | | 11.7 | |
Cash & Other Net Assets | | | 4.1 | |
Based on total net assets as of March 31, 2021. Subject to change.
PORTFOLIO SUMMARY
| | |
Net Asset Value 3/31/21: | | $10.68 Per Share |
| |
Net Asset Value 3/31/20: | | $10.37 Per Share |
| |
Total Net Assets: | | $680.3 Million |
| |
Average Maturity: | | 16.6 Years |
| |
Effective Duration3: | | 4.5 Years |
3 Duration is a measure of estimated price sensitivity relative to changes in interest rates. Portfolios with longer durations are typically more sensitive to changes in interest rates. For example, if interest rates rise by 1%, the fair value of a security with an effective duration of 5 years would decrease by 5%, with all other factors being constant. The correlation between duration and price sensitivity is greater for securities rated investment-grade than it is for securities rated below investment-grade. Duration estimates are based on assumptions by the Adviser and are subject to a number of limitations. Effective duration is calculated based on historical price changes of securities held by the Fund, and therefore is a more accurate estimate of price sensitivity provided interest rates remain within their historical range.
QUALITY RATINGS (% of Total Net Assets)
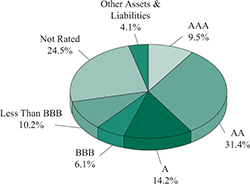
Lower of Moody’s, S&P, Fitch or Duff & Phelps ratings used.
Adviser’s Assessment of Non-Rated Securities:
| | | | |
A | | | 1.2 | % |
BBB | | | 5.0 | |
BB | | | 16.6 | |
< BB | | | 1.7 | |
| | | | |
Total | | | 24.5 | % |
| | |
Information on this page is unaudited. |
MARCH 31, 2021 | | 39 |
SCHEDULE OF INVESTMENTS
March 31, 2021
Sit Minnesota Tax-Free Income Fund
| | | | | | | | | | | | | | | | |
| | | | | | | | | |
| | | | | |
| Name of Issuer | | Principal
Amount ($) | | Coupon
Rate (%) | | Maturity
Date | | Fair Value ($) |
| | | | |
Municipal Bonds - 94.9% | | | | | | | | | | | | | | | | |
Education/Student Loan - 15.5% | | | | | | | | | | | | | | | | |
Baytown Township Rev. (St. Croix Prep) | | | 1,000,000 | | | | 4.00 | | | | 8/1/36 | | | | 1,054,360 | |
Baytown Township Rev. (St. Croix Prep) | | | 1,250,000 | | | | 4.00 | | | | 8/1/41 | | | | 1,305,375 | |
Baytown Township Rev. (St. Croix Prep) | | | 1,935,000 | | | | 4.25 | | | | 8/1/46 | | | | 2,030,724 | |
Bethel Charter School Lease Rev. (Spectrum High School Proj.) | | | 500,000 | | | | 3.50 | | | | 7/1/27 | | | | 519,640 | |
Bethel Charter School Lease Rev. (Spectrum High School Proj.) | | | 900,000 | | | | 4.00 | | | | 7/1/32 | | | | 964,098 | |
Bethel Charter School Lease Rev. (Spectrum High School Proj.) | | | 1,100,000 | | | | 4.00 | | | | 7/1/37 | | | | 1,165,087 | |
Bethel Charter School Lease Rev. (Spectrum High School Proj.) | | | 1,750,000 | | | | 4.25 | | | | 7/1/47 | | | | 1,849,033 | |
Brooklyn Park Charter School Lease Rev. (Athlos Leadership Academy Proj.) | | | 605,000 | | | | 5.25 | | | | 7/1/30 | | | | 649,050 | |
Cologne Charter School Lease Rev. (Cologne Academy Proj.) | | | 285,000 | | | | 4.00 | | | | 7/1/21 | | | | 286,699 | |
Cologne Charter School Lease Rev. (Cologne Academy Proj.) | | | 295,000 | | | | 4.00 | | | | 7/1/22 | | | | 303,717 | |
Cologne Charter School Lease Rev. (Cologne Academy Proj.) | | | 320,000 | | | | 4.00 | | | | 7/1/24 | | | | 341,734 | |
Cologne Charter School Lease Rev. (Cologne Academy Proj.) | | | 575,000 | | | | 5.00 | | | | 7/1/29 | | | | 620,736 | |
Cologne Charter School Lease Rev. (Cologne Academy Proj.) | | | 500,000 | | | | 5.00 | | | | 7/1/34 | | | | 533,330 | |
Deephaven Charter School Lease Rev. (Eagle Ridge Academy Proj.) | | | 855,000 | | | | 5.25 | | | | 7/1/37 | | | | 943,894 | |
Deephaven Charter School Lease Rev. (Eagle Ridge Academy Proj.) | | | 600,000 | | | | 5.25 | | | | 7/1/40 | | | | 659,352 | |
Deephaven Charter School Lease Rev. (Eagle Ridge Academy Proj.) | | | 1,000,000 | | | | 5.50 | | | | 7/1/50 | | | | 1,099,600 | |
Forest Lake Charter School Lease Rev. (Lake International Language Academy) | | | 580,000 | | | | 4.50 | | | | 8/1/26 | | | | 611,842 | |
Forest Lake Charter School Lease Rev. (Lake International Language Academy) | | | 1,000,000 | | | | 5.00 | | | | 8/1/36 | | | | 1,126,590 | |
Forest Lake Charter School Lease Rev. (Lake International Language Academy) | | | 750,000 | | | | 5.50 | | | | 8/1/36 | | | | 790,830 | |
Ham Lake Charter School Lease Rev. (Davinci Academy Proj.) | | | 875,000 | | | | 5.00 | | | | 7/1/31 | | | | 955,596 | |
Ham Lake Charter School Lease Rev. (Davinci Academy Proj.) | | | 1,000,000 | | | | 5.00 | | | | 7/1/36 | | | | 1,084,270 | |
Ham Lake Charter School Lease Rev. (Parnassus Prep. Sch. Proj.) | | | 1,000,000 | | | | 4.00 | | | | 11/1/26 | | | | 1,059,930 | |
Ham Lake Charter School Lease Rev. (Parnassus Prep. Sch. Proj.) | | | 2,720,000 | | | | 5.00 | | | | 11/1/36 | | | | 3,010,414 | |
Hugo Charter School Lease Rev. (Noble Academy Proj.) | | | 460,000 | | | | 4.00 | | | | 7/1/21 | | | | 462,194 | |
Hugo Charter School Lease Rev. (Noble Academy Proj.) | | | 750,000 | | | | 5.00 | | | | 7/1/29 | | | | 800,475 | |
Hugo Charter School Lease Rev. (Noble Academy Proj.) | | | 1,000,000 | | | | 5.00 | | | | 7/1/34 | | | | 1,056,800 | |
Independence Charter School Lease Rev. (Beacon Academy Proj.) | | | 440,000 | | | | 4.25 | | | | 7/1/26 | | | | 463,839 | |
Independence Charter School Lease Rev. (Beacon Academy Proj.) | | | 750,000 | | | | 4.75 | | | | 7/1/31 | | | | 786,420 | |
Independence Charter School Lease Rev. (Beacon Academy Proj.) | | | 1,200,000 | | | | 5.00 | | | | 7/1/36 | | | | 1,248,648 | |
Minneapolis Charter School Lease Rev. (Hiawatha Academy Proj.) | | | 800,000 | | | | 4.00 | | | | 7/1/26 | | | | 832,968 | |
Minneapolis School Lease Rev. (Friendship Academy of the Arts) 4 | | | 585,000 | | | | 4.00 | | | | 12/1/31 | | | | 598,016 | |
Minneapolis School Lease Rev. (Friendship Academy of the Arts) 4 | | | 1,385,000 | | | | 5.25 | | | | 12/1/43 | | | | 1,474,374 | |
Minneapolis School Lease Rev. (Twin Cities International School) 4 | | | 1,000,000 | | | | 4.25 | | | | 12/1/27 | | | | 1,097,010 | |
Minneapolis School Lease Rev. (Twin Cities International School) 4 | | | 1,000,000 | | | | 5.00 | | | | 12/1/37 | | | | 1,106,460 | |
MN Higher Education Fac. Auth. Rev. (Augsburg College) | | | 3,275,000 | | | | 4.25 | | | | 5/1/40 | | | | 3,049,549 | |
MN Higher Education Fac. Auth. Rev. (Bethel Univ.) | | | 1,200,000 | | | | 5.00 | | | | 5/1/37 | | | | 1,306,464 | |
MN Higher Education Fac. Auth. Rev. (Bethel Univ.) | | | 3,500,000 | | | | 5.00 | | | | 5/1/47 | | | | 3,745,840 | |
MN Higher Education Fac. Auth. Rev. (College of St. Benedict) | | | 1,000,000 | | | | 4.00 | | | | 3/1/43 | | | | 1,046,950 | |
MN Higher Education Fac. Auth. Rev. (College of St. Benedict) | | | 1,900,000 | | | | 5.00 | | | | 3/1/37 | | | | 2,124,086 | |
MN Higher Education Fac. Auth. Rev. (College of St. Scholastica) | | | 1,100,000 | | | | 4.00 | | | | 12/1/40 | | | | 1,197,977 | |
MN Higher Education Fac. Auth. Rev. (Gustavus Adolphus College) | | | 1,250,000 | | | | 4.00 | | | | 10/1/41 | | | | 1,371,462 | |
MN Higher Education Fac. Auth. Rev. (St. Olaf College) | | | 500,000 | | | | 4.00 | | | | 10/1/32 | | | | 565,930 | |
MN Higher Education Fac. Auth. Rev. (St. Olaf College) | | | 500,000 | | | | 4.00 | | | | 10/1/34 | | | | 563,185 | |
MN Higher Education Fac. Auth. Rev. (St. Olaf College) | | | 500,000 | | | | 4.00 | | | | 10/1/35 | | | | 562,075 | |
MN Higher Education Fac. Auth. Rev. (Univ. of St. Thomas) | | | 400,000 | | | | 4.00 | | | | 10/1/35 | | | | 455,072 | |
MN Higher Education Fac. Auth. Rev. (Univ. of St. Thomas) | | | 500,000 | | | | 4.00 | | | | 10/1/37 | | | | 565,850 | |
MN Higher Education Fac. Auth. Rev. (Univ. of St. Thomas) | | | 3,150,000 | | | | 4.00 | | | | 4/1/39 | | | | 3,490,924 | |
MN Higher Education Fac. Auth. Rev. (Univ. of St. Thomas) | | | 750,000 | | | | 4.00 | | | | 10/1/41 | | | | 853,065 | |
MN Higher Education Fac. Auth. Rev. (Univ. of St. Thomas) | | | 4,000,000 | | | | 4.00 | | | | 10/1/44 | | | | 4,515,920 | |
MN Higher Education Fac. Auth. Rev. (Univ. of St. Thomas) | | | 750,000 | | | | 5.00 | | | | 4/1/35 | | | | 875,610 | |
MN Higher Education Fac. Auth. Rev. (Univ. of St. Thomas) | | | 850,000 | | | | 5.00 | | | | 10/1/40 | | | | 1,042,559 | |
| | | | |
See accompanying notes to financial statements. | | | | |
40 | | | SIT MUTUAL FUNDS ANNUAL REPORT | |
| | | | | | | | | | | | | | | | |
| | | | | | | | | |
| | | | | |
| Name of Issuer | | Principal
Amount ($) | | Coupon
Rate (%) | | Maturity
Date | | Fair Value ($) |
| | | | |
MN Office of Higher Education Rev. 8 | | | 3,500,000 | | | | 2.65 | | | | 11/1/38 | | | | 3,465,945 | |
MN Office of Higher Education Rev. 8 | | | 5,000,000 | | | | 4.00 | | | | 11/1/37 | | | | 5,398,350 | |
Moorhead Educational Fac. Rev. (Concordia College Corp. Proj.) | | | 1,250,000 | | | | 5.00 | | | | 12/1/40 | | | | 1,384,625 | |
Olmsted Co. Hsg. & Redev. Auth. Rev. (Schaeffer Academy Proj.) | | | 488,555 | | | | 4.98 | | | | 4/25/27 | | | | 488,809 | |
Ramsey Lease Rev. (Pact Charter School Proj.) | | | 385,000 | | | | 5.00 | | | | 12/1/26 | | | | 393,227 | |
Ramsey Lease Rev. (Pact Charter School Proj.) | | | 1,850,000 | | | | 5.50 | | | | 12/1/33 | | | | 1,887,333 | |
Rice Co. Educational Fac. Rev. (Shattuck-St. Mary’s School) 4 | | | 3,300,000 | | | | 5.00 | | | | 8/1/22 | | | | 3,380,223 | |
Rochester Rev. (Math & Science Academy) | | | 1,430,000 | | | | 5.13 | | | | 9/1/38 | | | | 1,530,286 | |
Savage Charter School Lease Rev. (Aspen Academy) | | | 500,000 | | | | 4.00 | | | | 10/1/26 | | | | 517,690 | |
Savage Charter School Lease Rev. (Aspen Academy) | | | 1,000,000 | | | | 4.75 | | | | 10/1/31 | | | | 1,055,790 | |
St. Cloud Charter School Lease Rev. (Stride Academy Proj.) 2 | | | 350,000 | | | | 3.00 | | | | 4/1/21 | | | | 245,000 | |
St. Cloud Charter School Lease Rev. (Stride Academy Proj.) 2 | | | 1,850,000 | | | | 5.00 | | | | 4/1/36 | | | | 1,295,000 | |
St. Paul Hsg. & Redev. Auth. | | | 700,000 | | | | 5.00 | | | | 12/1/30 | | | | 763,294 | |
St. Paul Hsg. & Redev. Auth. | | | 1,150,000 | | | | 5.00 | | | | 12/1/37 | | | | 1,242,518 | |
St. Paul Hsg. & Redev. Auth. | | | 705,000 | | | | 5.00 | | | | 12/1/46 | | | | 751,142 | |
St. Paul Hsg. & Redev. Auth. (German Immersion School) | | | 285,000 | | | | 4.00 | | | | 7/1/23 | | | | 292,809 | |
St. Paul Hsg. & Redev. Auth. (German Immersion School) | | | 855,000 | | | | 5.00 | | | | 7/1/33 | | | | 897,408 | |
St. Paul Hsg. & Redev. Auth. (German Immersion School) | | | 500,000 | | | | 5.00 | | | | 7/1/44 | | | | 519,930 | |
St. Paul Hsg. & Redev. Auth. (Higher Ground Academy Proj.) | | | 815,000 | | | | 4.25 | | | | 12/1/23 | | | | 852,205 | |
St. Paul Hsg. & Redev. Auth. (Higher Ground Academy Proj.) | | | 1,500,000 | | | | 5.00 | | | | 12/1/33 | | | | 1,566,285 | |
St. Paul Hsg. & Redev. Auth. (Higher Ground Academy Proj.) | | | 390,000 | | | | 5.13 | | | | 12/1/38 | | | | 406,723 | |
St. Paul Hsg. & Redev. Auth. (Hope Community Academy Proj.) | | | 730,000 | | | | 3.88 | | | | 12/1/30 | | | | 734,066 | |
St. Paul Hsg. & Redev. Auth. (Hope Community Academy Proj.) | | | 720,000 | | | | 4.50 | | | | 12/1/29 | | | | 744,221 | |
St. Paul Hsg. & Redev. Auth. (Hope Community Academy Proj.) | | | 500,000 | | | | 5.00 | | | | 12/1/45 | | | | 527,795 | |
St. Paul Hsg. & Redev. Auth. (St. Paul Conservatory for Performing Artists) | | | 1,135,000 | | | | 4.63 | | | | 3/1/43 | | | | 1,157,042 | |
St. Paul Hsg. & Redev. Auth. (Twin Cities Academy Proj.) | | | 1,185,000 | | | | 4.00 | | | | 7/1/25 | | | | 1,242,899 | |
St. Paul Hsg. & Redev. Auth. (Twin Cities Academy Proj.) | | | 955,000 | | | | 5.00 | | | | 7/1/35 | | | | 1,025,326 | |
St. Paul Hsg. & Redev. Auth. (Twin Cities German Immersion School) | | | 555,000 | | | | 5.00 | | | | 7/1/49 | | | | 615,495 | |
St. Paul Hsg. & Redev. Auth. (Twin Cities German Immersion School) | | | 870,000 | | | | 5.00 | | | | 7/1/55 | | | | 959,636 | |
St. Paul Hsg. & Redev. Auth. Lease Rev. (Nova Classical Academy Proj.) | | | 135,000 | | | | 5.70 | | | | 9/1/21 | | | | 137,581 | |
St. Paul Hsg. & Redev. Auth. Rev. (Community of Peace Academy Proj.) | | | 600,000 | | | | 4.00 | | | | 12/1/39 | | | | 639,942 | |
St. Paul Hsg. & Redev. Auth. Rev. (Community of Peace Academy Proj.) | | | 1,000,000 | | | | 4.00 | | | | 12/1/49 | | | | 1,045,100 | |
St. Paul Hsg. & Redev. Auth. Rev. (Hmong College Preparatory Academy Proj.) | | | 1,000,000 | | | | 5.25 | | | | 9/1/31 | | | | 1,158,490 | |
St. Paul Hsg. & Redev. Auth. Rev. (Metro Deaf School Proj.) 4 | | | 700,000 | | | | 5.00 | | | | 6/15/38 | | | | 745,941 | |
St. Paul Hsg. & Redev. Auth. Rev. (Nova Classical Academy Proj.) | | | 600,000 | | | | 4.00 | | | | 9/1/36 | | | | 631,518 | |
St. Paul Hsg. & Redev. Auth. Rev. (Nova Classical Academy Proj.) | | | 1,000,000 | | | | 4.13 | | | | 9/1/47 | | | | 1,038,460 | |
University of Minnesota Rev. | | | 1,000,000 | | | | 5.00 | | | | 4/1/41 | | | | 1,192,950 | |
Victoria Private School Fac. Rev. (Holy Family Catholic High) | | | 1,610,000 | | | | 4.00 | | | | 9/1/23 | | | | 1,583,499 | |
Woodbury Charter School Lease Rev. | | | 500,000 | | | | 3.00 | | | | 12/1/30 | | | | 511,090 | |
Woodbury Charter School Lease Rev. | | | 400,000 | | | | 4.00 | | | | 12/1/40 | | | | 422,492 | |
Woodbury Charter School Lease Rev. | | | 555,000 | | | | 4.00 | | | | 12/1/50 | | | | 580,924 | |
| | | | | | | | | | | | | | | | |
| | | | |
| | | | | | | | | | | | | | | 105,254,682 | |
| | | | | | | | | | | | | | | | |
Escrowed To Maturity/Prerefunded - 1.7% | | | | | | | | | | | | | | | | |
Deephaven Charter School Lease Rev. (Eagle Ridge Academy Proj.) | | | 1,280,000 | | | | 5.13 | | | | 7/1/33 | | | | 1,415,565 | |
Goodhue Co. Education District No. 6051 Lease Rev. | | | 1,030,000 | | | | 5.00 | | | | 2/1/34 | | | | 1,163,756 | |
Goodhue Co. Education District No. 6051 Lease Rev. | | | 1,500,000 | | | | 5.00 | | | | 2/1/39 | | | | 1,694,790 | |
MN Higher Education Fac. Auth. Rev. (Hamline Univ.) | | | 750,000 | | | | 6.00 | | | | 10/1/32 | | | | 771,202 | |
MN Higher Education Fac. Auth. Rev. (Hamline Univ.) | | | 1,000,000 | | | | 6.00 | | | | 10/1/40 | | | | 1,028,270 | |
Western MN Municipal Power Agy. Rev. | | | 4,725,000 | | | | 5.00 | | | | 1/1/46 | | | | 5,335,801 | |
| | | | | | | | | | | | | | | | |
| | | | |
| | | | | | | | | | | | | | | 11,409,384 | |
| | | | | | | | | | | | | | | | |
| | | | |
See accompanying notes to financial statements. | | | | |
MARCH 31, 2021 | | | 41 | |
SCHEDULE OF INVESTMENTS
March 31, 2021
Sit Minnesota Tax-Free Income Fund (Continued)
| | | | | | | | | | | | | | | | |
| | | | | | | | | |
| | | | | |
| Name of Issuer | | Principal
Amount ($) | | Coupon Rate (%) | | Maturity
Date | | Fair Value ($) |
| | | | |
General Obligation - 10.6% | | | | | | | | | | | | | | | | |
Brainerd Independent School District No. 181 | | | 1,000,000 | | | | 4.00 | | | | 2/1/42 | | | | 1,125,280 | |
Brainerd Independent School District No. 181 | | | 4,000,000 | | | | 4.00 | | | | 2/1/43 | | | | 4,493,360 | |
Brooklyn Center Independent School District No. 286 | | | 4,000,000 | | | | 4.00 | | | | 2/1/40 | | | | 4,460,600 | |
Cloquet Independent School District No. 94 | | | 4,250,000 | | | | 4.00 | | | | 2/1/36 | | | | 4,603,260 | |
Elk River Independent School District No. 728 | | | 7,000,000 | | | | 3.00 | | | | 2/1/40 | | | | 7,489,930 | |
Fosston Independent School District No. 601 | | | 250,000 | | | | 4.00 | | | | 2/1/36 | | | | 276,118 | |
Fosston Independent School District No. 601 | | | 1,000,000 | | | | 4.00 | | | | 2/1/38 | | | | 1,099,680 | |
Itasca G.O. | | | 2,500,000 | | | | 2.38 | | | | 2/1/45 | | | | 2,498,075 | |
Itasca G.O. | | | 4,000,000 | | | | 2.50 | | | | 2/1/50 | | | | 4,013,760 | |
Long Prairie G.O. 8 | | | 750,000 | | | | 4.00 | | | | 2/1/37 | | | | 808,560 | |
Minneapolis Capital Improvement | | | 4,000,000 | | | | 4.00 | | | | 12/1/43 | | | | 4,531,200 | |
Minneapolis Capital Improvement | | | 2,000,000 | | | | 4.00 | | | | 12/1/46 | | | | 2,257,200 | |
Minneapolis G.O. | | | 5,000,000 | | | | 3.00 | | | | 12/1/42 | | | | 5,278,050 | |
Minneapolis Special School District No. 1 | | | 1,000,000 | | | | 4.00 | | | | 2/1/40 | | | | 1,167,690 | |
Minnetonka Independent School District No. 276 | | | 1,900,000 | | | | 5.00 | | | | 2/1/41 | | | | 2,168,736 | |
Morrison Co. Education District No. 6979 | | | 1,000,000 | | | | 4.50 | | | | 2/1/34 | | | | 960,340 | |
Owatonna Independent School District No. 761 | | | 750,000 | | | | 2.13 | | | | 2/1/40 | | | | 752,550 | |
Richfield Independent School District No. 280 | | | 6,000,000 | | | | 4.00 | | | | 2/1/37 | | | | 6,783,000 | |
Robbinsdale Independent School District No. 281 | | | 1,000,000 | | | | 2.25 | | | | 2/1/41 | | | | 1,007,020 | |
Roseville Independent School District No. 623 | | | 930,000 | | | | 4.00 | | | | 2/1/35 | | | | 1,053,727 | |
Roseville Independent School District No. 623 | | | 4,895,000 | | | | 4.00 | | | | 2/1/36 | | | | 5,533,259 | |
South Washington Co. Independent School District No. 833 | | | 5,000,000 | | | | 4.00 | | | | 2/1/31 | | | | 5,655,850 | |
St. Francis Independent School District No. 15 | | | 550,000 | | | | 4.00 | | | | 2/1/35 | | | | 577,995 | |
St. Francis Independent School District No. 15 | | | 750,000 | | | | 4.00 | | | | 2/1/36 | | | | 787,560 | |
United Hospital District Health Care Facs. G.O (Lake Wood Health System) | | | 1,005,000 | | | | 5.00 | | | | 12/1/30 | | | | 1,209,507 | |
Worthington Independent School District No. 518 | | | 1,000,000 | | | | 3.00 | | | | 2/1/37 | | | | 1,055,630 | |
Worthington Independent School District No. 518 | | | 500,000 | | | | 3.00 | | | | 2/1/40 | | | | 525,195 | |
| | | | | | | | | | | | | | | | |
| | | | |
| | | | | | | | | | | | | | | 72,173,132 | |
| | | | | | | | | | | | | | | | |
Hospital/Health Care - 14.3% | | | | | | | | | | | | | | | | |
Anoka Health Care and Hsg. Facs. Rev. | | | 1,135,000 | | | | 5.38 | | | | 11/1/34 | | | | 1,201,534 | |
Anoka Health Care and Hsg. Facs. Rev. (Walker Methodist Plaza) | | | 1,500,000 | | | | 5.25 | | | | 7/1/35 | | | | 1,508,145 | |
Center City Heath Care Facs. Rev. (Hazelden Betty Ford Foundation Proj.) | | | 3,000,000 | | | | 4.50 | | | | 11/1/34 | | | | 3,239,820 | |
Center City Heath Care Facs. Rev. (Hazelden Betty Ford Foundation Proj.) | | | 250,000 | | | | 5.00 | | | | 11/1/29 | | | | 278,590 | |
Center City Heath Care Facs. Rev. (Hazelden Betty Ford Foundation Proj.) | | | 500,000 | | | | 5.00 | | | | 11/1/44 | | | | 542,050 | |
Chatfield Health Care and Hsg. Facs. Rev. (Chosen Valley Care Center) | | | 350,000 | | | | 4.00 | | | | 9/1/39 | | | | 311,290 | |
Chatfield Health Care and Hsg. Facs. Rev. (Chosen Valley Care Center) | | | 500,000 | | | | 5.00 | | | | 9/1/44 | | | | 499,290 | |
Chatfield Health Care and Hsg. Facs. Rev. (Chosen Valley Care Center) | | | 1,225,000 | | | | 5.00 | | | | 9/1/52 | | | | 1,185,371 | |
Chippewa Co. Rev. (Monte Video Hospital Proj.) | | | 2,000,000 | | | | 4.00 | | | | 3/1/32 | | | | 2,118,080 | |
Crookston Health Care Facs. Rev. (Riverview Health Care Proj.) | | | 1,000,000 | | | | 4.00 | | | | 5/1/32 | | | | 1,000,550 | |
Crookston Health Care Facs. Rev. (Riverview Health Care Proj.) | | | 1,000,000 | | | | 5.00 | | | | 5/1/34 | | | | 1,035,330 | |
Crookston Health Care Facs. Rev. (Riverview Health Care Proj.) | | | 1,000,000 | | | | 5.00 | | | | 5/1/38 | | | | 1,034,540 | |
Dakota Co. Community Dev. Agy. (Sanctuary at W. St. Paul Proj.) | | | 1,700,000 | | | | 5.75 | | | | 8/1/30 | | | | 1,584,706 | |
Dakota Co. Community Dev. Agy. (Sanctuary at W. St. Paul Proj.) | | | 1,050,000 | | | | 6.00 | | | | 8/1/35 | | | | 936,684 | |
Duluth Economic Dev. Auth. Rev. (St. Lukes Hospital Oblig. Group) | | | 575,000 | | | | 4.75 | | | | 6/15/22 | | | | 586,701 | |
Duluth Economic Dev. Auth. Rev. (St. Lukes Hospital Oblig. Group) | | | 1,600,000 | | | | 5.75 | | | | 6/15/32 | | | | 1,662,048 | |
Duluth Economic Dev. Auth. Rev. (St. Lukes Hospital Oblig. Group) | | | 2,000,000 | | | | 6.00 | | | | 6/15/39 | | | | 2,077,860 | |
Glencoe Health Care Fac. Rev. (Glencoe Regional Health Services Proj.) | | | 2,110,000 | | | | 4.00 | | | | 4/1/31 | | | | 2,147,263 | |
Hayward Health Care Fac. Rev. (American Baptist Homes Midwest Proj.) | | | 1,350,000 | | | | 5.38 | | | | 8/1/34 | | | | 1,350,486 | |
Hayward Health Care Fac. Rev. (American Baptist Homes Midwest Proj.) | | | 500,000 | | | | 5.75 | | | | 2/1/44 | | | | 502,345 | |
Hayward Hsg. & Health Care Fac. Rev. (St. John Lutheran Home of Albert Lea Proj.) | | | 1,900,000 | | | | 5.00 | | | | 10/1/34 | | | | 1,813,816 | |
Maple Grove Health Care System Rev. (Maple Grove Hospital Corp.) | | | 4,175,000 | | | | 4.00 | | | | 5/1/37 | | | | 4,433,349 | |
| | | | |
See accompanying notes to financial statements. | | | | |
42 | | | SIT MUTUAL FUNDS ANNUAL REPORT | |
| | | | | | | | | | | | | | | | |
| | | | | | | | | |
| | | | | |
| Name of Issuer | | Principal
Amount ($) | | Coupon Rate (%) | | Maturity
Date | | Fair Value ($) |
| | | | |
Maple Grove Health Care System Rev. (Maple Grove Hospital Corp.) | | | 825,000 | | | | 5.00 | | | | 5/1/32 | | | | 964,532 | |
Maple Grove Health Care System Rev. (Memorial Health Care) | | | 1,375,000 | | | | 4.00 | | | | 9/1/35 | | | | 1,464,499 | |
Minneapolis Health Care System Rev. (Fairview Health Services) | | | 3,000,000 | | | | 4.00 | | | | 11/15/37 | | | | 3,391,650 | |
Minneapolis Health Care System Rev. (Fairview Health Services) | | | 1,000,000 | | | | 4.00 | | | | 11/15/38 | | | | 1,127,620 | |
Minneapolis Health Care System Rev. (Fairview Health Services) | | | 2,590,000 | | | | 5.00 | | | | 11/15/34 | | | | 2,985,286 | |
Minneapolis Health Care System Rev. (Fairview Health Services) | | | 2,500,000 | | | | 5.00 | | | | 11/15/49 | | | | 2,977,775 | |
Moorhead Economic Dev. Auth. Rev. | | | 550,000 | | | | 4.60 | | | | 9/1/25 | | | | 549,978 | |
Oak Park Heights Nursing Home Rev. (Boutwells Landing Care Center) | | | 1,500,000 | | | | 5.50 | | | | 8/1/28 | | | | 1,530,960 | |
Oak Park Heights Nursing Home Rev. (Boutwells Landing Care Center) | | | 1,000,000 | | | | 6.00 | | | | 8/1/36 | | | | 1,026,870 | |
Rochester Health Care Facs. Rev. (Mayo Clinic) | | | 7,500,000 | | | | 4.00 | | | | 11/15/48 | | | | 8,522,775 | |
Rochester Health Care Facs. Rev. (Mayo Clinic) | | | 5,000,000 | | | | 5.00 | | | | 11/15/33 | | | | 7,094,850 | |
Shakopee Health Care Facs. Rev. (St. Francis Regional Medical Center Proj.) | | | 745,000 | | | | 5.00 | | | | 9/1/28 | | | | 827,770 | |
Shakopee Health Care Facs. Rev. (St. Francis Regional Medical Center Proj.) | | | 1,350,000 | | | | 5.00 | | | | 9/1/34 | | | | 1,466,208 | |
St. Cloud Health Care Rev. (CentraCare Health System Proj.) | | | 2,500,000 | | | | 4.00 | | | | 5/1/37 | | | | 2,752,475 | |
St. Cloud Health Care Rev. (CentraCare Health System Proj.) | | | 500,000 | | | | 4.00 | | | | 5/1/49 | | | | 552,380 | |
St. Cloud Health Care Rev. (CentraCare Health System Proj.) | | | 3,750,000 | | | | 5.00 | | | | 5/1/46 | | | | 4,328,625 | |
St. Cloud Health Care Rev. (CentraCare Health System Proj.) | | | 500,000 | | | | 5.00 | | | | 5/1/48 | | | | 604,730 | |
St. Louis Park Health Care Facs. Rev. (Mount Olivet Careview Home Health Proj.) 1 | | | 2,250,000 | | | | 4.60 | | | | 6/1/41 | | | | 2,217,870 | |
St. Paul Hsg. & Redev. Auth. Health Care Rev. (Fairview Health Services Proj.) | | | 750,000 | | | | 4.00 | | | | 11/15/35 | | | | 840,360 | |
St. Paul Hsg. & Redev. Auth. Health Care Rev. (Fairview Health Services Proj.) | | | 4,000,000 | | | | 4.00 | | | | 11/15/43 | | | | 4,402,520 | |
St. Paul Hsg. & Redev. Auth. Health Care Rev. (Fairview Health Services Proj.) | | | 1,000,000 | | | | 5.00 | | | | 11/15/47 | | | | 1,173,190 | |
St. Paul Hsg. & Redev. Auth. Health Care Rev. (HealthPartners Oblig. Group Proj.) | | | 4,800,000 | | | | 5.00 | | | | 7/1/32 | | | | 5,566,512 | |
St. Paul Hsg. & Redev. Auth. Health Care Rev. (HealthPartners Oblig. Group Proj.) | | | 2,000,000 | | | | 5.00 | | | | 7/1/33 | | | | 2,316,680 | |
St. Paul Hsg. & Redev. Auth. Health Care Rev. (Senior Episcopal Homes Proj.) | | | 525,000 | | | | 4.25 | | | | 11/1/25 | | | | 525,220 | |
St. Paul Hsg. & Redev. Auth. Health Care Rev. (Senior Episcopal Homes Proj.) | | | 750,000 | | | | 4.75 | | | | 11/1/31 | | | | 750,338 | |
St. Paul Hsg. & Redev. Auth. Health Care Rev. (Senior Episcopal Homes Proj.) | | | 2,150,000 | | | | 5.00 | | | | 5/1/38 | | | | 2,154,945 | |
St. Paul Hsg. & Redev. Auth. Health Care Rev. (Senior Episcopal Homes Proj.) | | | 500,000 | | | | 5.15 | | | | 11/1/42 | | | | 500,215 | |
St. Paul Hsg. & Redev. Auth. Rev. (Nursing Home NTS-Episcopal) | | | 1,763,679 | | | | 5.63 | | | | 10/1/33 | | | | 1,770,382 | |
Victoria Health Care Facs. Rev. (Augustana Emerald Care LLC) | | | 720,000 | | | | 4.25 | | | | 8/1/24 | | | | 720,799 | |
West St. Paul Hsg. & Health Care Rev. (Walker Westwood Ridge Camp) | | | 1,000,000 | | | | 5.00 | | | | 11/1/37 | | | | 1,024,150 | |
| | | | | | | | | | | | | | | | |
| | | | |
| | | | | | | | | | | | | | | 97,182,012 | |
| | | | | | | | | | | | | | | | |
Industrial/Pollution Control - 0.6% | | | | | | | | | | | | | | | | |
International Falls Rev. (Boise Cascade Corp. Proj.) | | | 950,000 | | | | 5.65 | | | | 12/1/22 | | | | 951,102 | |
St. Paul Port Auth. Rev. 8 | | | 1,000,000 | | | | 4.00 | | | | 10/1/40 | | | | 1,092,120 | |
St. Paul Port Auth. Rev. | | | 1,000,000 | | | | 4.00 | | | | 10/1/42 | | | | 1,101,870 | |
St. Paul Port Auth. Solid Waste Disposal Rev. (Gerdau St. Paul Steel Mill Proj.) 4, 8 | | | 1,000,000 | | | | 4.50 | | | | 10/1/37 | | | | 1,022,550 | |
| | | | | | | | | | | | | | | | |
| | | | |
| | | | | | | | | | | | | | | 4,167,642 | |
| | | | | | | | | | | | | | | | |
Insured - 0.3% | | | | | | | | | | | | | | | | |
Guam Power Auth. Rev. (AGM Insured) 11 | | | 500,000 | | | | 5.00 | | | | 10/1/30 | | | | 529,265 | |
MN Governmental Agy. Fin. Group (Flex Terminal Prog.) (AGC Insured) | | | 55,000 | | | | 4.00 | | | | 3/1/22 | | | | 55,120 | |
Puerto Rico Public Improvement G.O. (AGM Insured) 11 | | | 750,000 | | | | 5.13 | | | | 7/1/30 | | | | 774,675 | |
Virgin Islands Public Fin. Auth. (Gross Receipts Taxes Loan Note) (NATL Insured) 11 | | | 1,000,000 | | | | 5.00 | | | | 10/1/23 | | | | 1,015,220 | |
| | | | | | | | | | | | | | | | |
| | | | |
| | | | | | | | | | | | | | | 2,374,280 | |
| | | | | | | | | | | | | | | | |
Multifamily Mortgage - 20.6% | | | | | | | | | | | | | | | | |
Anoka Hsg. Rev. (Homestead at Anoka, Inc. Proj.) | | | 315,000 | | | | 4.00 | | | | 11/1/21 | | | | 316,534 | |
Anoka Hsg. Rev. (Homestead at Anoka, Inc. Proj.) | | | 1,000,000 | | | | 4.75 | | | | 11/1/35 | | | | 1,062,790 | |
Anoka Hsg. Rev. (Homestead at Anoka, Inc. Proj.) | | | 1,000,000 | | | | 5.50 | | | | 11/1/46 | | | | 1,082,480 | |
Apple Valley Economic Dev. Auth. Rev. (Augustana Healthcare Center) | | | 500,000 | | | | 3.90 | | | | 2/1/31 | | | | 483,700 | |
Apple Valley Economic Dev. Auth. Rev. (Augustana Healthcare Center) | | | 500,000 | | | | 4.15 | | | | 2/1/36 | | | | 476,500 | |
Apple Valley Senior Hsg. Rev. (Orchard Path Proj.) | | | 2,000,000 | | | | 5.00 | | | | 9/1/58 | | | | 2,084,060 | |
Apple Valley Senior Hsg. Rev. (Presbyterian Homes) | | | 1,500,000 | | | | 5.00 | | | | 9/1/43 | | | | 1,573,680 | |
| | | | |
See accompanying notes to financial statements. | | | | |
MARCH 31, 2021 | | | 43 | |
SCHEDULE OF INVESTMENTS
March 31, 2021
Sit Minnesota Tax-Free Income Fund (Continued)
| | | | | | | | | | | | | | | | |
| | | | | | | | | |
| | | | | |
| Name of Issuer | | Principal
Amount ($) | | Coupon Rate (%) | | Maturity
Date | | Fair Value ($) |
| | | | |
Apple Valley Senior Living Rev. (Senior Living LLC Proj.) | | | 1,100,000 | | | | 4.00 | | | | 1/1/25 | | | | 1,070,498 | |
Apple Valley Senior Living Rev. (Senior Living LLC Proj.) | | | 500,000 | | | | 4.00 | | | | 1/1/25 | | | | 459,520 | |
Apple Valley Senior Living Rev. (Senior Living LLC Proj.) | | | 1,235,000 | | | | 4.00 | | | | 1/1/26 | | | | 1,189,935 | |
Apple Valley Senior Living Rev. (Senior Living LLC Proj.) | | | 1,000,000 | | | | 4.00 | | | | 1/1/30 | | | | 907,970 | |
Apple Valley Senior Living Rev. (Senior Living LLC Proj.) | | | 1,500,000 | | | | 4.25 | | | | 1/1/37 | | | | 1,291,290 | |
Apple Valley Senior Living Rev. (Senior Living LLC Proj.) | | | 2,775,000 | | | | 4.38 | | | | 1/1/47 | | | | 2,230,573 | |
Apple Valley Senior Living Rev. (Senior Living LLC Proj.) | | | 3,000,000 | | | | 5.00 | | | | 1/1/47 | | | | 2,024,010 | |
Apple Valley Senior Living Rev. (Senior Living LLC Proj.) | | | 1,355,000 | | | | 6.75 | | | | 1/1/27 | | | | 1,220,381 | |
Apple Valley Senior Living Rev. (Senior Living LLC Proj.) | | | 1,000,000 | | | | 7.00 | | | | 1/1/37 | | | | 793,590 | |
Bethel Rev. (Grandview Christian Home Proj.) | | | 3,000,000 | | | | 5.00 | | | | 10/1/41 | | | | 3,096,000 | |
Blaine Senior Hsg. & Health Care Fac. Rev. (Crest View Senior Community Proj.) | | | 1,985,000 | | | | 5.13 | | | | 7/1/25 | | | | 1,943,097 | |
Blaine Senior Hsg. & Health Care Fac. Rev. (Crest View Senior Community Proj.) | | | 1,645,000 | | | | 5.75 | | | | 7/1/35 | | | | 1,529,899 | |
Blaine Senior Hsg. & Health Care Fac. Rev. (Crest View Senior Community Proj.) | | | 2,000,000 | | | | 6.13 | | | | 7/1/45 | | | | 1,853,840 | |
Cambridge Hsg. & Health Care Facs. Rev. (Walker Methodist Levande, LLC Proj.) | | | 1,250,000 | | | | 5.13 | | | | 3/1/39 | | | | 1,339,038 | |
Champlin Multifamily Hsg. Rev. (Champlin Drive Apts.) | | | 495,000 | | | | 6.00 | | | | 1/1/27 | | | | 495,960 | |
Chisago Hsg. and Health Care Rev. (CDL Homes LLC) | | | 750,000 | | | | 6.00 | | | | 8/1/33 | | | | 790,740 | |
City of Otsego Rev. (Riverview Landing Proj.) | | | 1,500,000 | | | | 5.00 | | | | 10/1/42 | | | | 1,525,410 | |
Cloquet Hsg. Fac. Ref. (HADC Cloquet LLC Proj.) | | | 1,020,000 | | | | 5.00 | | | | 8/1/38 | | | | 1,021,224 | |
Columbus Hsg. Rev. (Richfield Senior Hsg., Inc.) | | | 1,000,000 | | | | 5.00 | | | | 1/1/34 | | | | 936,260 | |
Columbus Hsg. Rev. (Richfield Senior Hsg., Inc.) | | | 1,000,000 | | | | 5.25 | | | | 1/1/40 | | | | 913,040 | |
Crystal Multifamily Hsg. Rev. (Cavanagh Proj.) | | | 2,500,000 | | | | 5.25 | | | | 6/1/31 | | | | 2,468,850 | |
Dakota Co. Community Dev. Agy. (Glen at Valley Creek Proj.) | | | 1,400,000 | | | | 4.50 | | | | 8/1/36 | | | | 1,322,720 | |
Dakota Co. Community Dev. Agy. Multifamily Hsg. Rev. | | | 3,500,000 | | | | 4.00 | | | | 1/1/42 | | | | 3,644,935 | |
Dakota Co. Community Dev. Agy. Multifamily Hsg. Rev. (Walker Highviews Hills LLC) 4 | | | 750,000 | | | | 5.00 | | | | 8/1/36 | | | | 770,648 | |
Dakota Co. Community Dev. Agy. Multifamily Hsg. Rev. (Walker Highviews Hills LLC) 4 | | | 500,000 | | | | 5.00 | | | | 8/1/51 | | | | 511,800 | |
Deephaven Hsg. & Healthcare Rev. (St. Therese Senior Living Proj.) | | | 1,345,000 | | | | 5.00 | | | | 4/1/38 | | | | 1,360,710 | |
Fridley Multifamily Hsg. Rev. (Village Green Apartments Proj.) | | | 3,406,961 | | | | 3.75 | | | | 11/1/34 | | | | 3,867,139 | |
Independence Health Care Facs. Rev. (Augustana Chapel View Home) | | | 250,000 | | | | 4.00 | | | | 12/1/32 | | | | 245,642 | |
Maple Plain Senior Hsg. Health Care Rev. (Haven Home Inc Proj.) | | | 1,000,000 | | | | 4.25 | | | | 7/1/39 | | | | 1,005,930 | |
Maple Plain Senior Hsg. Health Care Rev. (Haven Home Inc Proj.) | | | 1,000,000 | | | | 4.45 | | | | 7/1/44 | | | | 1,008,610 | |
Maple Plain Senior Hsg. Health Care Rev. (Haven Home Inc Proj.) | | | 500,000 | | | | 5.00 | | | | 7/1/39 | | | | 524,800 | |
Maple Plain Senior Hsg. Health Care Rev. (Haven Home Inc Proj.) | | | 1,000,000 | | | | 5.00 | | | | 7/1/49 | | | | 1,040,100 | |
Minneapolis & St.PaulHsg. & Redev. Auth. Multifamily Hsg. Rev. (GNMA Collateralized) 8 | | | 2,765,000 | | | | 4.75 | | | | 1/20/42 | | | | 2,769,065 | |
Minneapolis Multifamily Hsg. Rev. (14th & Central LLLP Proj.) (FNMA Collateralized) | | | 5,000,000 | | | | 2.35 | | | | 2/1/38 | | | | 5,048,900 | |
Minneapolis Multifamily Hsg. Rev. (Greenway Heights Family Housing) | | | 1,015,000 | | | | 5.75 | | | | 7/15/31 | | | | 1,055,478 | |
Minneapolis Senior Hsg. & Health Care Rev. (Ecumen Mill City Quarter) | | | 375,000 | | | | 4.75 | | | | 11/1/28 | | | | 378,371 | |
Minneapolis Senior Hsg. & Health Care Rev. (Ecumen Mill City Quarter) | | | 1,500,000 | | | | 5.00 | | | | 11/1/35 | | | | 1,513,140 | |
Minneapolis Student Hsg. Rev. (Riverton Community Housing Proj.) 4 | | | 1,000,000 | | | | 4.75 | | | | 8/1/43 | | | | 1,032,190 | |
Minneapolis Student Hsg. Rev. (Riverton Community Housing Proj.) 4 | | | 500,000 | | | | 5.00 | | | | 8/1/53 | | | | 520,805 | |
Minnetonka MF Hsg. Rev. (Elmbrooke & Golden Valley Townhome Proj.) (FNMA Collateralized) | | | 1,914,054 | | | | 3.00 | | | | 11/1/34 | | | | 2,005,719 | |
MN Hsg. Fin. Agy. Rental Hsg. (G.O. of AGY. Insured) | | | 250,000 | | | | 5.05 | | | | 8/1/31 | | | | 252,635 | |
MN Hsg. Fin. Agy. Rental Hsg. (G.O. of AGY. Insured) | | | 1,760,000 | | | | 5.45 | | | | 8/1/41 | | | | 1,777,723 | |
MN Hsg. Fin. Agy. Rental Hsg. Rev. | | | 1,000,000 | | | | 5.20 | | | | 8/1/43 | | | | 1,062,890 | |
MN Hsg. Fin. Agy. Rev. | | | 270,000 | | | | 4.00 | | | | 8/1/29 | | | | 303,564 | |
MN Hsg. Fin. Agy. Rev. | | | 255,000 | | | | 4.00 | | | | 8/1/31 | | | | 284,715 | |
MN Hsg. Fin. Agy. Rev. | | | 335,000 | | | | 4.00 | | | | 8/1/34 | | | | 371,676 | |
MN Hsg. Fin. Agy. Rev. | | | 335,000 | | | | 4.00 | | | | 8/1/35 | | | | 371,123 | |
MN Hsg. Fin. Agy. Rev. | | | 515,000 | | | | 4.00 | | | | 8/1/39 | | | | 597,179 | |
MN Hsg. Fin. Agy. Rev. | | | 535,000 | | | | 4.00 | | | | 8/1/40 | | | | 618,465 | |
MN Hsg. Fin. Agy. Rev. | | | 815,000 | | | | 4.00 | | | | 8/1/41 | | | | 940,151 | |
MN Hsg. Fin. Agy. Rev. (State Appropriation) | | | 250,000 | | | | 4.00 | | | | 8/1/33 | | | | 289,435 | |
MN Hsg. Fin. Agy. Rev. (State Appropriation) | | | 2,000,000 | | | | 5.00 | | | | 8/1/34 | | | | 2,283,380 | |
MN Hsg. Fin. Agy. Rev. (State Appropriation) | | | 1,000,000 | | | | 5.00 | | | | 8/1/35 | | | | 1,139,920 | |
| | | | |
See accompanying notes to financial statements. | | | | |
44 | | | SIT MUTUAL FUNDS ANNUAL REPORT | |
| | | | | | | | | | | | | | | | |
| | | | | | | | | |
| | | | | |
| Name of Issuer | | Principal
Amount ($) | | Coupon Rate (%) | | Maturity
Date | | Fair Value ($) |
| | | | |
Moorhead Economic Dev. Auth. Rev. Ref. (EverCare Sr. Living LLC) | | | 280,000 | | | | 4.65 | | | | 9/1/26 | | | | 279,325 | |
Moorhead Health Care Rev. Ref. (EverCare Sr. Living LLC) | | | 1,000,000 | | | | 5.00 | | | | 9/1/32 | | | | 997,370 | |
Moorhead Health Care Rev. Ref. (EverCare Sr. Living LLC) | | | 250,000 | | | | 5.13 | | | | 9/1/37 | | | | 247,662 | |
New Ulm Economic Dev. Auth. Rev. (HADC Ridgeway Proj.) | | | 1,500,000 | | | | 5.00 | | | | 8/1/39 | | | | 1,485,690 | |
North Oaks Senior Hsg. Rev. (Waverly Gardens Proj.) | | | 2,000,000 | | | | 4.00 | | | | 10/1/33 | | | | 2,134,220 | |
North Oaks Senior Hsg. Rev. (Waverly Gardens Proj.) | | | 1,500,000 | | | | 5.00 | | | | 10/1/35 | | | | 1,643,565 | |
North Oaks Senior Hsg. Rev. (Waverly Gardens Proj.) | | | 1,000,000 | | | | 5.00 | | | | 10/1/47 | | | | 1,082,060 | |
Oakdale Rev. (Sr. Hsg. Oak Meadows Proj.) | | | 875,000 | | | | 5.00 | | | | 4/1/34 | | | | 875,621 | |
Red Wing Senior Hsg. Rev. (Deer Crest Proj.) | | | 325,000 | | | | 5.00 | | | | 11/1/27 | | | | 328,744 | |
Red Wing Senior Hsg. Rev. (Deer Crest Proj.) | | | 330,000 | | | | 5.00 | | | | 11/1/32 | | | | 333,670 | |
Red Wing Senior Hsg. Rev. (Deer Crest Proj.) | | | 500,000 | | | | 5.00 | | | | 11/1/42 | | | | 505,410 | |
Rochester Health Care & Hsg. Rev. (Homestead Rochester, Inc.) | | | 1,950,000 | | | | 5.00 | | | | 12/1/30 | | | | 2,031,900 | |
Rochester Health Care & Hsg. Rev. (Homestead Rochester, Inc.) | | | 1,325,000 | | | | 5.00 | | | | 12/1/49 | | | | 1,335,547 | |
Rochester Health Care & Hsg. Rev. (Samaritan Bethany, Inc. Proj.) | | | 1,000,000 | | | | 5.00 | | | | 8/1/37 | | | | 1,049,390 | |
Rochester Health Care & Hsg. Rev. (Samaritan Bethany, Inc. Proj.) | | | 1,800,000 | | | | 5.00 | | | | 8/1/48 | | | | 1,867,068 | |
Rochester Health Care & Hsg. Rev. (The Homestead at Rochester) | | | 720,000 | | | | 6.38 | | | | 12/1/33 | | | | 771,826 | |
Rochester Health Care & Hsg. Rev. (The Homestead at Rochester) | | | 2,500,000 | | | | 6.50 | | | | 12/1/35 | | | | 2,679,275 | |
Rochester Health Care & Hsg. Rev. (The Homestead at Rochester) | | | 250,000 | | | | 6.88 | | | | 12/1/48 | | | | 267,855 | |
Rochester Multifamily Hsg. Rev. (Essex Place Apartments Proj.) (FHLMC) | | | 4,000,000 | | | | 3.75 | | | | 6/1/29 | | | | 4,096,600 | |
Sartell Health Care & Hsg. Fac. Rev. (Country Manor Campus LLC Proj.) | | | 1,275,000 | | | | 5.00 | | | | 9/1/42 | | | | 1,298,702 | |
Sartell Health Care & Hsg. Fac. Rev. (Country Manor Campus LLC Proj.) | | | 1,135,000 | | | | 5.25 | | | | 9/1/27 | | | | 1,157,428 | |
Sartell Health Care & Hsg. Fac. Rev. (Country Manor Campus LLC Proj.) | | | 1,000,000 | | | | 5.25 | | | | 9/1/30 | | | | 1,014,960 | |
Sartell Health Care & Hsg. Fac. Rev. (Country Manor Campus LLC Proj.) | | | 2,150,000 | | | | 5.30 | | | | 9/1/37 | | | | 2,186,744 | |
Sauk Rapids Health Care & Hsg. Facs. Rev. (Good Shepherd Lutheran Home Proj.) | | | 1,705,000 | | | | 5.13 | | | | 1/1/39 | | | | 1,711,172 | |
St. Anthony Multifamily Hsg. Rev. (Silver Lake Village Hsg.) | | | 250,000 | | | | 5.75 | | | | 12/1/28 | | | | 265,635 | |
St. Anthony Multifamily Hsg. Rev. (Silver Lake Village Hsg.) | | | 2,000,000 | | | | 6.00 | | | | 12/1/30 | | | | 2,123,920 | |
St. Joseph Senior Hsg. & Health Care Rev. (Woodcrest of Country Manor Proj.) | | | 750,000 | | | | 4.25 | | | | 7/1/39 | | | | 697,598 | |
St. Joseph Senior Hsg. & Health Care Rev. (Woodcrest of Country Manor Proj.) | | | 1,125,000 | | | | 4.25 | | | | 7/1/44 | | | | 1,012,590 | |
St. Joseph Senior Hsg. & Health Care Rev. (Woodcrest of Country Manor Proj.) | | | 1,500,000 | | | | 5.00 | | | | 7/1/55 | | | | 1,502,610 | |
St. Paul Hsg. & Redev. Auth. Health Care Rev. (Carondelet Village Proj.) | | | 3,965,000 | | | | 4.25 | | | | 12/1/27 | | | | 4,152,782 | |
St. Paul Hsg. & Redev. Auth. Health Care Rev. (Carondelet Village Proj.) | | | 2,400,000 | | | | 5.00 | | | | 12/1/47 | | | | 2,568,120 | |
St. Paul Hsg. & Redev. Auth. Multifamily Housing Rev. (Marian Center Proj.) | | | 555,000 | | | | 5.20 | | | | 11/1/22 | | | | 555,749 | |
St. Paul Hsg. & Redev. Auth. Multifamily Housing Rev. (Marian Center Proj.) | | | 1,000,000 | | | | 5.30 | | | | 11/1/30 | | | | 1,000,760 | |
St. Paul Hsg. & Redev. Auth. Multifamily Housing Rev. (Marian Center Proj.) | | | 2,590,000 | | | | 5.38 | | | | 5/1/43 | | | | 2,590,881 | |
St. Paul Park Health Care Facs. Rev (Presbyterian Homes Interlu Proj.) | | | 1,000,000 | | | | 5.00 | | | | 5/1/43 | | | | 1,067,260 | |
St. Paul Park Hsg. Rev. (Buffalo Senior Housing Proj.) | | | 1,115,000 | | | | 5.00 | | | | 10/1/38 | | | | 1,118,992 | |
St. Paul Park Senior Hsg. Rev. (Presbyterian Homes Bloomin Proj.) | | | 1,000,000 | | | | 5.00 | | | | 9/1/42 | | | | 1,046,220 | |
St. Paul Port Auth. Rev. (Energy Park Utility Company Proj.) 8 | | | 2,515,000 | | | | 5.70 | | | | 8/1/36 | | | | 2,589,494 | |
St. Peter Hsg. & Health Care Fac. Rev. (Ecumen Second Century & Owatonna Senior Living Proj.) | | | 700,000 | | | | 5.00 | | | | 3/1/40 | | | | 733,565 | |
Vergas Hsg. & Healthcare Facs. Rev. (CDL Homes Proj.) | | | 1,000,000 | | | | 4.25 | | | | 8/1/43 | | | | 989,980 | |
Wayzata Senior Hsg. Rev. (Folkestone Senior Living Community) | | | 1,500,000 | | | | 4.00 | | | | 8/1/44 | | | | 1,517,865 | |
Wayzata Senior Hsg. Rev. (Folkestone Senior Living Community) | | | 1,000,000 | | | | 5.00 | | | | 8/1/49 | | | | 1,054,710 | |
Wayzata Senior Hsg. Rev. (Folkestone Senior Living Community) | | | 2,750,000 | | | | 5.00 | | | | 8/1/54 | | | | 2,893,385 | |
West St. Paul Hsg. & Health Care Rev. (Walker Westwood Ridge Camp) | | | 250,000 | | | | 5.00 | | | | 11/1/49 | | | | 252,328 | |
Willmar Hsg. & Redev. Auth. Multifamily Rev. (Eagle Ridge Apartments) | | | 2,610,000 | | | | 4.63 | | | | 4/1/30 | | | | 2,644,844 | |
| | | | | | | | | | | | | | | | |
| | | | |
| | | | | | | | | | | | | | | 139,861,519 | |
| | | | | | | | | | | | | | | | |
Municipal Lease 9 - 5.5% | | | | | | | | | | | | | | | | |
Anoka-Hennepin Independent School District No. 11 Lease Rev. | | | 600,000 | | | | 4.00 | | | | 2/1/41 | | | | 633,024 | |
Chaska Economic Dev. Auth. Lease Rev. | | | 1,100,000 | | | | 4.00 | | | | 2/1/31 | | | | 1,202,080 | |
Chaska Economic Dev. Auth. Lease Rev. | | | 690,000 | | | | 4.00 | | | | 2/1/33 | | | | 750,934 | |
Chaska Economic Dev. Auth. Lease Rev. | | | 500,000 | | | | 4.00 | | | | 2/1/35 | | | | 542,420 | |
Duluth Independent School District No. 709 | | | 1,875,000 | | | | 2.60 | | | | 3/1/28 | | | | 1,873,781 | |
| | | | |
See accompanying notes to financial statements. | | | | |
MARCH 31, 2021 | | | 45 | |
SCHEDULE OF INVESTMENTS
March 31, 2021
Sit Minnesota Tax-Free Income Fund (Continued)
| | | | | | | | | | | | | | | | |
| | | | | | | | | |
| | | | | |
| Name of Issuer | | Principal
Amount ($) | | Coupon Rate (%) | | Maturity
Date | | Fair Value ($) |
| | | | |
Duluth Independent School District No. 709 | | | 245,000 | | | | 3.00 | | | | 3/1/22 | | | | 247,249 | |
Duluth Independent School District No. 709 | | | 920,000 | | | | 3.00 | | | | 3/1/32 | | | | 910,680 | |
Duluth Independent School District No. 709 | | | 1,000,000 | | | | 4.00 | | | | 2/1/27 | | | | 1,139,620 | |
Duluth Independent School District No. 709 | | | 750,000 | | | | 4.20 | | | | 3/1/34 | | | | 791,288 | |
Duluth Independent School District No. 709 | | | 2,000,000 | | | | 5.00 | | | | 2/1/25 | | | | 2,300,680 | |
Golden Valley Hsg. & Redev. Auth. Rev. | | | 1,000,000 | | | | 4.00 | | | | 2/1/30 | | | | 1,071,340 | |
Golden Valley Hsg. & Redev. Auth. Rev. | | | 500,000 | | | | 4.00 | | | | 2/1/32 | | | | 533,665 | |
Guam Education Fin. Foundation 11 | | | 1,000,000 | | | | 5.00 | | | | 10/1/21 | | | | 1,016,010 | |
Guam Education Fin. Foundation 11 | | | 1,730,000 | | | | 5.00 | | | | 10/1/22 | | | | 1,813,057 | |
Hibbing Independent School District No. 701 | | | 2,000,000 | | | | 3.00 | | | | 3/1/41 | | | | 2,128,680 | |
Lake Agassiz Education Cooperative No. 0397-52 | | | 645,000 | | | | 2.50 | | | | 2/1/32 | | | | 635,847 | |
Lake Agassiz Education Cooperative No. 0397-52 | | | 365,000 | | | | 2.75 | | | | 2/1/36 | | | | 360,948 | |
Minnetonka Independent School District No. 276 | | | 450,000 | | | | 4.00 | | | | 3/1/30 | | | | 495,716 | |
Minnetonka Independent School District No. 276 | | | 340,000 | | | | 4.00 | | | | 2/1/33 | | | | 357,051 | |
Minnetonka Independent School District No. 276 | | | 300,000 | | | | 4.00 | | | | 3/1/33 | | | | 328,191 | |
Minnetonka Independent School District No. 276 | | | 400,000 | | | | 4.00 | | | | 2/1/36 | | | | 419,068 | |
Minnetonka Independent School District No. 276 | | | 500,000 | | | | 4.50 | | | | 1/1/41 | | | | 547,915 | |
MN Hsg. Fin. Agy. Hsg. Infrastructure (State Appropriation) | | | 750,000 | | | | 3.88 | | | | 8/1/38 | | | | 825,975 | |
MN Hsg. Fin. Agy. Hsg. Infrastructure (State Appropriation) | | | 1,040,000 | | | | 4.00 | | | | 8/1/36 | | | | 1,206,650 | |
MN Hsg. Fin. Agy. Hsg. Infrastructure (State Appropriation) | | | 580,000 | | | | 4.00 | | | | 8/1/37 | | | | 670,120 | |
MN Hsg. Fin. Agy. Hsg. Infrastructure (State Appropriation) | | | 945,000 | | | | 4.00 | | | | 8/1/40 | | | | 1,083,584 | |
MN Hsg. Fin. Agy. Rev. (State Appropriation) | | | 300,000 | | | | 5.00 | | | | 8/1/35 | | | | 330,864 | |
MN State Armory Building Commission Rev. | | | 1,900,000 | | | | 3.00 | | | | 6/1/38 | | | | 2,053,672 | |
MN State Armory Building Commission Rev. | | | 750,000 | | | | 3.00 | | | | 6/1/41 | | | | 799,072 | |
Northeastern Metropolitan Intermediate School District No. 916 | | | 1,000,000 | | | | 5.00 | | | | 2/1/34 | | | | 1,147,100 | |
Osseo Independent School District No. 279 | | | 1,000,000 | | | | 4.00 | | | | 2/1/28 | | | | 1,087,490 | |
Plymouth Intermediate District No. 287 | | | 535,000 | | | | 3.00 | | | | 5/1/32 | | | | 559,546 | |
Plymouth Intermediate District No. 287 | | | 470,000 | | | | 4.00 | | | | 5/1/31 | | | | 509,856 | |
Plymouth Intermediate District No. 287 | | | 600,000 | | | | 4.00 | | | | 2/1/37 | | | | 665,964 | |
Rochester Economic Dev. Auth. Rev. | | | 1,000,000 | | | | 2.13 | | | | 2/1/38 | | | | 1,009,170 | |
Southern Plains Education Cooperative No. 915 | | | 1,215,000 | | | | 4.00 | | | | 2/1/37 | | | | 1,274,681 | |
Southern Plains Education Cooperative No. 915 | | | 1,000,000 | | | | 4.50 | | | | 2/1/39 | | | | 1,067,310 | |
St. Cloud Independent School District No. 742 | | | 750,000 | | | | 4.00 | | | | 2/1/38 | | | | 800,048 | |
Waconia Independent School District No. 110 | | | 500,000 | | | | 5.00 | | | | 2/1/37 | | | | 562,135 | |
Winona School District No. 861 Lease Purchase | | | 184,456 | | | | 6.04 | | | | 8/1/24 | | | | 184,651 | |
Wright Co. | | | 1,350,000 | | | | 3.00 | | | | 12/1/39 | | | | 1,451,655 | |
| | | | | | | | | | | | | | | | |
| | | | | | | | | | | | | | | 37,388,787 | |
| | | | | | | | | | | | | | | | |
Municipal Money Market - 0.8% | | | | | | | | | | | | | | | | |
City of Minneapolis Rev. (Univ. Gateway Proj.) 1 | | | 5,400,000 | | | | 0.07 | | | | 12/1/27 | | | | 5,400,000 | |
| | | | | | | | | | | | | | | | |
Other Revenue Bonds - 3.5% | | | | | | | | | | | | | | | | |
Center City Heath Care Facs. Rev. (Hazelden Betty Ford Foundation Proj.) | | | 1,000,000 | | | | 4.00 | | | | 11/1/41 | | | | 1,112,130 | |
Crystal Governmental Fac. Rev. | | | 329,451 | | | | 5.10 | | | | 12/15/26 | | | | 319,377 | |
Milaca Rev. (Edina Headquarters Proj.) | | | 250,000 | | | | 5.00 | | | | 2/1/44 | | | | 251,878 | |
Minneapolis Rev. (YMCA Greater Twin Cities Proj.) | | | 165,000 | | | | 4.00 | | | | 6/1/29 | | | | 177,481 | |
Minneapolis Rev. (YMCA Greater Twin Cities Proj.) | | | 125,000 | | | | 4.00 | | | | 6/1/30 | | | | 133,238 | |
Minneapolis Rev. (YMCA Greater Twin Cities Proj.) | | | 250,000 | | | | 4.00 | | | | 6/1/31 | | | | 264,622 | |
Minneapolis Tax Increment Rev. | | | 320,000 | | | | 3.50 | | | | 3/1/23 | | | | 327,443 | |
Minneapolis Tax Increment Rev. | | | 170,000 | | | | 3.80 | | | | 3/1/25 | | | | 174,480 | |
Minneapolis Tax Increment Rev. | | | 200,000 | | | | 4.00 | | | | 3/1/27 | | | | 205,394 | |
Minneapolis Tax Increment Rev. | | | 260,000 | | | | 4.00 | | | | 3/1/30 | | | | 265,554 | |
MN Development Rev. Limited Tax Supported Comm. Board | | | 1,300,000 | | | | 6.00 | | | | 12/1/40 | | | | 1,311,427 | |
MN Development Rev. Limited Tax Supported Comm. Board | | | 2,000,000 | | | | 6.25 | | | | 12/1/30 | | | | 2,018,360 | |
| | | | |
See accompanying notes to financial statements. | | | | |
46 | | | SIT MUTUAL FUNDS ANNUAL REPORT | |
| | | | | | | | | | | | | | | | |
| | | | | | | | | |
| | | | | |
| Name of Issuer | | Principal
Amount ($) | | Coupon Rate (%) | | Maturity
Date | | Fair Value ($) |
| | | | |
Mound Hsg. & Redev. Auth. Tax Increment Rev. Ref. (Metroplain Proj.) | | | 537,000 | | | | 5.00 | | | | 2/15/27 | | | | 538,971 | |
Northeastern Metropolitan Intermediate School District No. 916 | | | 4,500,000 | | | | 4.00 | | | | 2/1/38 | | | | 4,841,460 | |
St. Louis Park Economic Dev. Auth. Tax Increment Rev. (Hoigaard Vlg.) | | | 475,000 | | | | 5.00 | | | | 2/1/23 | | | | 475,522 | |
St. Paul Hsg. & Redev. Auth. Rev. (Amherst H Wilder Foundation Proj.) | | | 1,750,000 | | | | 5.00 | | | | 12/1/36 | | | | 2,052,662 | |
St. Paul Hsg. & Redev. Auth. Tax Increment Rev. (9th St. Lofts Proj.) | | | 679,000 | | | | 6.38 | | | | 2/15/28 | | | | 683,678 | |
St. Paul Hsg. & Redev. Auth. Tax Increment Rev. (Drake Marble Proj.) | | | 370,000 | | | | 6.75 | | | | 3/1/28 | | | | 370,270 | |
St. Paul Hsg. & Redev. Auth. Tax Increment Rev. (Emerald Gardens Proj.) | | | 660,000 | | | | 6.50 | | | | 3/1/29 | | | | 661,049 | |
St. Paul Hsg. & Redev. Auth. Tax Increment Rev. (North Quadrant Owner Occupied Proj.) | | | 836,000 | | | | 7.00 | | | | 2/15/28 | | | | 843,114 | |
St. Paul Hsg. & Redev. Auth. Tax Increment Rev. (North Quadrant Owner Occupied Proj.) | | | 607,000 | | | | 7.50 | | | | 2/15/28 | | | | 607,917 | |
St. Paul Port Auth. Lease Rev. (Regions Hospital Parking Ramp Proj.) | | | 3,875,000 | | | | 5.00 | | | | 8/1/36 | | | | 3,878,371 | |
Territory of Guam. Rev. 11 | | | 500,000 | | | | 5.00 | | | | 12/1/46 | | | | 556,555 | |
Virgin Islands Public Fin. Auth. (Gross Receipts Taxes Loan Note) 11 | | | 2,000,000 | | | | 5.00 | | | | 10/1/42 | | | | 1,783,620 | |
| | | | | | | | | | | | | | | | |
| | | | |
| | | | | | | | | | | | | | | 23,854,573 | |
| | | | | | | | | | | | | | | | |
Public Facilities - 0.2% | | | | | | | | | | | | | | | | |
| | | | |
Lakeville Hsg. & Redev. Auth. Parking Rev. (Ice Arena. Proj.) | | | 1,250,000 | | | | 4.00 | | | | 2/1/32 | | | | 1,396,588 | |
| | | | | | | | | | | | | | | | |
Sales Tax Revenue - 1.1% | | | | | | | | | | | | | | | | |
American Samoa Economic Development Authority Rev. 4, 11 | | | 700,000 | | | | 6.00 | | | | 9/1/23 | | | | 742,875 | |
American Samoa Economic Development Authority Rev. 11 | | | 2,000,000 | | | | 6.25 | | | | 9/1/29 | | | | 2,297,500 | |
Guam Govt. Business Privilege Tax Rev. 11 | | | 2,750,000 | | | | 5.00 | | | | 11/15/35 | | | | 3,067,625 | |
St. Paul Sales Tax Rev. | | | 1,400,000 | | | | 5.00 | | | | 11/1/31 | | | | 1,613,850 | |
| | | | | | | | | | | | | | | | |
| | | | |
| | | | | | | | | | | | | | | 7,721,850 | |
| | | | | | | | | | | | | | | | |
Single Family Mortgage - 17.7% | | | | | | | | | | | | | | | | |
Dakota Co. Community Dev. Agy. Single Family Mtg. Rev. (GNMA) | | | 725,000 | | | | 4.45 | | | | 12/1/32 | | | | 727,798 | |
Dakota Co. Community Dev. Agy. Single Family Mtg. Rev. (GNMA-FNMA-FHLMC) | | | 245,000 | | | | 4.63 | | | | 12/1/30 | | | | 245,147 | |
Dakota Co. Community Dev. Agy. Single Family Mtg. Rev. (GNMA-FNMA-FHLMC) | | | 385,000 | | | | 4.88 | | | | 12/1/33 | | | | 385,200 | |
Dakota Co. Community Dev. Agy. Single Family Mtg. Rev. (GNMA-FNMA-FHLMC) 8 | | | 16,133 | | | | 5.13 | | | | 12/1/40 | | | | 16,144 | |
Minneapolis St. Paul Hsg. Fin. Board Single Family Mtg. Rev. (GNMA-FNMA) | | | 290,000 | | | | 4.45 | | | | 12/1/27 | | | | 290,148 | |
Minneapolis St. Paul Hsg. Fin. Board Single Family Mtg. Rev. (GNMA-FNMA) 8 | | | 233 | | | | 5.00 | | | | 12/1/38 | | | | 233 | |
Minneapolis St. Paul Hsg. Fin. Board Single Family Mtg. Rev. (GNMA-FNMA-FHLMC) 8 | | | 445 | | | | 5.25 | | | | 12/1/40 | | | | 445 | |
MN Hsg. Fin. Agy. Homeownership Fin. | | | 1,803,204 | | | | 2.35 | | | | 6/1/50 | | | | 1,845,561 | |
MN Hsg. Fin. Agy. Homeownership Fin. (GNMA-FNMA-FHLMC) | | | 3,715,000 | | | | 2.45 | | | | 7/1/45 | | | | 3,776,818 | |
MN Hsg. Fin. Agy. Homeownership Fin. (GNMA-FNMA-FHLMC) | | | 3,815,000 | | | | 2.45 | | | | 7/1/46 | | | | 3,811,223 | |
MN Hsg. Fin. Agy. Homeownership Fin. (GNMA-FNMA-FHLMC) | | | 1,799,516 | | | | 2.47 | | | | 1/1/50 | | | | 1,812,455 | |
MN Hsg. Fin. Agy. Homeownership Fin. (GNMA-FNMA-FHLMC) | | | 4,500,000 | | | | 2.50 | | | | 7/1/51 | | | | 4,498,380 | |
MN Hsg. Fin. Agy. Homeownership Fin. (GNMA-FNMA-FHLMC) | | | 6,045,000 | | | | 2.55 | | | | 1/1/51 | | | | 6,155,986 | |
MN Hsg. Fin. Agy. Homeownership Fin. (GNMA-FNMA-FHLMC) | | | 1,649,487 | | | | 3.15 | | | | 6/1/49 | | | | 1,729,272 | |
MN Hsg. Fin. Agy. Homeownership Fin. (GNMA-FNMA-FHLMC) | | | 3,204,098 | | | | 3.30 | | | | 3/1/48 | | | | 3,380,260 | |
MN Hsg. Fin. Agy. Homeownership Fin. (GNMA-FNMA-FHLMC) | | | 2,916,888 | | | | 3.30 | | | | 5/1/48 | | | | 3,077,258 | |
MN Hsg. Fin. Agy. Homeownership Fin. (GNMA-FNMA-FHLMC) | | | 1,227,610 | | | | 3.45 | | | | 3/1/49 | | | | 1,298,787 | |
MN Hsg. Fin. Agy. Homeownership Fin. (GNMA-FNMA-FHLMC) | | | 1,109,525 | | | | 3.60 | | | | 1/1/49 | | | | 1,175,941 | |
MN Hsg. Fin. Agy. Homeownership Fin. (GNMA-FNMA-FHLMC) | | | 1,129,849 | | | | 3.75 | | | | 11/1/48 | | | | 1,200,306 | |
MN Hsg. Fin. Agy. Homeownership Fin. (GNMA-FNMA-FHLMC) | | | 2,275,000 | | | | 4.40 | | | | 7/1/32 | | | | 2,288,468 | |
MN Hsg. Fin. Agy. Homeownership Fin. (GNMA-FNMA-FHLMC) | | | 2,155,000 | | | | 4.45 | | | | 7/1/31 | | | | 2,170,193 | |
MN Hsg. Fin. Agy. Homeownership Fin. (GNMA-FNMA-FHLMC) | | | 1,080,000 | | | | 4.70 | | | | 1/1/31 | | | | 1,087,474 | |
MN Hsg. Fin. Agy. Residential Hsg. Rev. | | | 560,000 | | | | 3.30 | | | | 7/1/29 | | | | 603,781 | |
MN Hsg. Fin. Agy. Residential Hsg. Rev. (G.O. of AGY. Insured) | | | 1,135,000 | | | | 3.63 | | | | 7/1/25 | | | | 1,153,807 | |
MN Hsg. Fin. Agy. Residential Hsg. Rev. (G.O. of AGY. Insured) | | | 1,480,000 | | | | 3.90 | | | | 7/1/30 | | | | 1,503,650 | |
MN Hsg. Fin. Agy. Residential Hsg. Rev. (GNMA-FNMA-FHLMC) | | | 2,335,000 | | | | 2.45 | | | | 7/1/34 | | | | 2,411,845 | |
MN Hsg. Fin. Agy. Residential Hsg. Rev. (GNMA-FNMA-FHLMC) | | | 7,475,000 | | | | 2.55 | | | | 7/1/39 | | | | 7,663,445 | |
MN Hsg. Fin. Agy. Residential Hsg. Rev. (GNMA-FNMA-FHLMC) | | | 3,540,000 | | | | 2.70 | | | | 7/1/44 | | | | 3,624,571 | |
MN Hsg. Fin. Agy. Residential Hsg. Rev. (GNMA-FNMA-FHLMC) | | | 5,475,000 | | | | 2.75 | | | | 7/1/44 | | | | 5,602,239 | |
| | | | |
See accompanying notes to financial statements. | | | | |
MARCH 31, 2021 | | | 47 | |
SCHEDULE OF INVESTMENTS
March 31, 2021
Sit Minnesota Tax-Free Income Fund (Continued)
| | | | | | | | | | | | | | | | |
| | | | | | | | | |
| | | | | |
| Name of Issuer | | Principal
Amount ($) | | Coupon
Rate (%) | | Maturity
Date | | Fair Value ($) |
| | | | |
MN Hsg. Fin. Agy. Residential Hsg. Rev. (GNMA-FNMA-FHLMC) | | | 4,040,000 | | | | 2.80 | | | | 1/1/44 | | | | 4,165,684 | |
MN Hsg. Fin. Agy. Residential Hsg. Rev. (GNMA-FNMA-FHLMC) | | | 575,000 | | | | 3.10 | | | | 7/1/35 | | | | 613,634 | |
MN Hsg. Fin. Agy. Residential Hsg. Rev. (GNMA-FNMA-FHLMC) | | | 640,000 | | | | 3.15 | | | | 1/1/37 | | | | 682,598 | |
MN Hsg. Fin. Agy. Residential Hsg. Rev. (GNMA-FNMA-FHLMC) 8 | | | 650,000 | | | | 3.30 | | | | 1/1/30 | | | | 695,071 | |
MN Hsg. Fin. Agy. Residential Hsg. Rev. (GNMA-FNMA-FHLMC) | | | 335,000 | | | | 3.30 | | | | 7/1/33 | | | | 357,716 | |
MN Hsg. Fin. Agy. Residential Hsg. Rev. (GNMA-FNMA-FHLMC) | | | 3,420,000 | | | | 3.30 | | | | 1/1/34 | | | | 3,683,101 | |
MN Hsg. Fin. Agy. Residential Hsg. Rev. (GNMA-FNMA-FHLMC) | | | 1,185,000 | | | | 3.35 | | | | 7/1/29 | | | | 1,208,747 | |
MN Hsg. Fin. Agy. Residential Hsg. Rev. (GNMA-FNMA-FHLMC) | | | 515,000 | | | | 3.40 | | | | 7/1/38 | | | | 532,479 | |
MN Hsg. Fin. Agy. Residential Hsg. Rev. (GNMA-FNMA-FHLMC) | | | 5,425,000 | | | | 3.50 | | | | 1/1/32 | | | | 5,673,411 | |
MN Hsg. Fin. Agy. Residential Hsg. Rev. (GNMA-FNMA-FHLMC) | | | 1,885,000 | | | | 3.60 | | | | 7/1/31 | | | | 1,960,777 | |
MN Hsg. Fin. Agy. Residential Hsg. Rev. (GNMA-FNMA-FHLMC) | | | 1,920,000 | | | | 3.60 | | | | 7/1/33 | | | | 1,979,078 | |
MN Hsg. Fin. Agy. Residential Hsg. Rev. (GNMA-FNMA-FHLMC) 8 | | | 305,000 | | | | 3.63 | | | | 7/1/32 | | | | 317,188 | |
MN Hsg. Fin. Agy. Residential Hsg. Rev. (GNMA-FNMA-FHLMC) | | | 600,000 | | | | 3.65 | | | | 7/1/37 | | | | 645,438 | |
MN Hsg. Fin. Agy. Residential Hsg. Rev. (GNMA-FNMA-FHLMC) | | | 2,955,000 | | | | 3.75 | | | | 1/1/50 | | | | 3,256,676 | |
MN Hsg. Fin. Agy. Residential Hsg. Rev. (GNMA-FNMA-FHLMC) | | | 80,000 | | | | 3.80 | | | | 1/1/33 | | | | 80,000 | |
MN Hsg. Fin. Agy. Residential Hsg. Rev. (GNMA-FNMA-FHLMC) | | | 4,315,000 | | | | 3.80 | | | | 7/1/38 | | | | 4,447,557 | |
MN Hsg. Fin. Agy. Residential Hsg. Rev. (GNMA-FNMA-FHLMC) | | | 3,900,000 | | | | 3.90 | | | | 7/1/43 | | | | 4,022,148 | |
MN Hsg. Fin. Agy. Residential Hsg. Rev. (GNMA-FNMA-FHLMC) | | | 20,000 | | | | 4.00 | | | | 7/1/40 | | | | 20,164 | |
MN Hsg. Fin. Agy. Residential Hsg. Rev. (GNMA-FNMA-FHLMC) | | | 1,250,000 | | | | 4.00 | | | | 1/1/48 | | | | 1,363,788 | |
MN Hsg. Fin. Agy. Residential Hsg. Rev. (GNMA-FNMA-FHLMC) | | | 3,140,000 | | | | 4.00 | | | | 7/1/48 | | | | 3,431,423 | |
MN Hsg. Fin. Agy. Rev. | | | 3,500,000 | | | | 2.00 | | | | 7/1/40 | | | | 3,447,115 | |
MN Hsg. Fin. Agy. Rev. | | | 4,250,000 | | | | 2.15 | | | | 7/1/45 | | | | 4,179,408 | |
MN Hsg. Fin. Agy. Rev. | | | 6,850,000 | | | | 2.20 | | | | 1/1/51 | | | | 6,679,092 | |
MN Hsg. Fin. Agy. Rev. (GNMA-FNMA Collateralized) | | | 415,000 | | | | 5.00 | | | | 1/1/31 | | | | 417,905 | |
MN Hsg. Fin. Agy. Rev. (GNMA-FNMA FHLMC) | | | 1,125,000 | | | | 3.70 | | | | 1/1/31 | | | | 1,217,002 | |
MN Hsg. Fin. Agy. Rev. (GNMA-FNMA FHLMC) | | | 845,000 | | | | 4.00 | | | | 1/1/47 | | | | 903,449 | |
MN Hsg. Fin. Agy. Rev. (GNMA-FNMA-FHLMC) 8 | | | 660,000 | | | | 4.00 | | | | 1/1/41 | | | | 693,376 | |
| | | | | | | | | | | | | | | | |
| | | | |
| | | | | | | | | | | | | | | 120,210,860 | |
| | | | | | | | | | | | | | | | |
Transportation - 0.3% | | | | | | | | | | | | | | | | |
Minneapolis & St. Paul Metro Airport Commission Sub. Rev. | | | 1,100,000 | | | | 5.00 | | | | 1/1/33 | | | | 1,223,981 | |
Minneapolis & St. Paul Metro Airport Commission Sub. Rev. | | | 600,000 | | | | 5.00 | | | | 1/1/34 | | | | 667,110 | |
| | | | | | | | | | | | | | | | |
| | | | |
| | | | | | | | | | | | | | | 1,891,091 | |
| | | | | | | | | | | | | | | | |
Utility - 2.2% | | | | | | | | | | | | | | | | |
Guam Govt. Waterworks Auth. Rev. 11 | | | 2,000,000 | | | | 5.00 | | | | 1/1/46 | | | | 2,241,160 | |
MN Municipal Power Agy. Electric Rev. | | | 500,000 | | | | 4.00 | | | | 10/1/31 | | | | 542,105 | |
MN Municipal Power Agy. Electric Rev. | | | 1,250,000 | | | | 4.00 | | | | 10/1/32 | | | | 1,351,875 | |
MN Municipal Power Agy. Electric Rev. | | | 1,155,000 | | | | 4.00 | | | | 10/1/33 | | | | 1,246,072 | |
Northern Municipal Power Agy. Electric Rev. | | | 695,000 | | | | 5.00 | | | | 1/1/31 | | | | 747,917 | |
Rochester Electric Utility Rev. | | | 500,000 | | | | 5.00 | | | | 12/1/42 | | | | 599,510 | |
Southern Minnesota Municipal Power Agency | | | 1,000,000 | | | | 5.00 | | | | 1/1/41 | | | | 1,172,570 | |
St. Paul Hsg. & Redev. Auth. | | | 900,000 | | | | 3.38 | | | | 10/1/37 | | | | 958,698 | |
St. Paul Hsg. & Redev. Auth. | | | 880,000 | | | | 4.00 | | | | 10/1/31 | | | | 1,002,531 | |
St. Paul Hsg. & Redev. Auth. | | | 650,000 | | | | 4.00 | | | | 10/1/33 | | | | 734,052 | |
St. Paul Hsg. & Redev. Auth. | | | 800,000 | | | | 4.00 | | | | 10/1/37 | | | | 893,424 | |
St. Paul Port Auth. Rev. 8 | | | 1,000,000 | | | | 4.00 | | | | 10/1/40 | | | | 1,092,120 | |
St. Paul Port Auth. Rev. | | | 550,000 | | | | 4.00 | | | | 10/1/41 | | | | 607,277 | |
St. Paul Port Auth. Rev. (Energy Park Utility Company Proj.) 8 | | | 1,250,000 | | | | 5.45 | | | | 8/1/28 | | | | 1,289,988 | |
Western MN Municipal Power Agy. Rev. | | | 600,000 | | | | 5.00 | | | | 1/1/35 | | | | 710,532 | |
| | | | | | | | | | | | | | | | |
| | | | |
| | | | | | | | | | | | | | | 15,189,831 | |
| | | | | | | | | | | | | | | | |
Total Municipal Bonds
(cost: $624,438,796) | | | | | | | | | | | | | | | 645,476,231 | |
| | | | | | | | | | | | | | | | |
| | | | |
See accompanying notes to financial statements. | | | | |
48 | | | SIT MUTUAL FUNDS ANNUAL REPORT | |
| | | | | | | | | | | | | | | | |
| | | | | | | | | | | |
| | | | | |
| Name of Issuer | | Quantity | | | | | | | | Fair Value ($) |
| | | | |
Investment Companies - 1.0% | | | | | | | | | | | | | | | | |
Delaware Investments Minnesota Municipal Income Fund II (VMM) | | | 334,436 | | | | | | | | | | | | 4,411,211 | |
Nuveen Minnesota Municipal Income Fund (NMS) | | | 159,408 | | | | | | | | | | | | 2,365,615 | |
| | | | | | | | | | | | | | | | |
| | | | |
Total Investment Companies
(cost: $7,237,880) | | | | | | | | | | | | | | | 6,776,826 | |
| | | | | | | | | | | | | | | | |
| | | | |
Total Investments in Securities - 95.9%
(cost: $631,676,676) | | | | | | | | | | | | | | | 652,253,057 | |
Other Assets and Liabilities, net - 4.1% | | | | | | | | | | | | | | | 28,047,978 | |
| | | | | | | | | | | | | | | | |
| | | | |
Total Net Assets - 100.0% | | | | | | | | | | | | | | $ | 680,301,035 | |
| | | | | | | | | | | | | | | | |
| | | | | | | | | | | | | | | | | |
| 1 | Variable rate security. Rate disclosed is as of March 31, 2021. Certain variable rate securities are not based on a published reference rate and spread but are determined by the issuer or agent and are based on current market conditions, or, for mortgage-backed securities, are impacted by the individual mortgages which are paying off over time. These securities do not indicate a reference rate and spread in their descriptions. |
| 2 | Security considered illiquid by the Investment Adviser. The total value of such securities as of March 31, 2021 was $1,540,000 and represented 0.2% of net assets. |
| 4 | 144A Restricted Security. The total value of such securities as of March 31, 2021 was $13,002,892 and represented 1.9% of net assets. These securities have been determined to be liquid by the Adviser in accordance with guidelines established by the Board of Directors. |
| 8 | Securities the income from which is treated as a tax preference that is included in alternative minimum taxable income for purposes of computing federal alternative minimum tax (AMT). At March 31, 2021, 3.1% of net assets in the Fund was invested in such securities. |
| 9 | Municipal Lease Security. The total value of such securities as of March 31, 2021 was $37,388,787 and represented 5.5% of net assets. These securities have been determined to be liquid by the Adviser in accordance with guidelines established by the Board of Directors. |
| 11 | The Fund may invest in obligations issued by U.S. territories, for example Guam, Puerto Rico, and Virgin Islands. The total value of such securities as of March 31, 2021 was $15,837,562 and represented 2.3% of net assets. |
Numeric footnotes not disclosed are not applicable to this Schedule of Investments.
A summary of the levels for the Fund’s investments as of March 31, 2021 is as follows (see Note 2-significant accounting policies in the notes to financial statements):
| | | | | | | | | | | | | | |
| | | Investment in Securities | |
| | | Level 1 Quoted Price ($) | | | Level 2 Other significant observable inputs ($) | | Level 3 Significant unobservable inputs ($) | | Total ($) | |
Assets | | | | | | | | | | | | | | |
Municipal Bonds | | | — | | | | 645,476,231 | | | — | | | 645,476,231 | |
Investment Companies | | | 6,776,826 | | | | — | | | — | | | 6,776,826 | |
| | | 6,776,826 | | | | 645,476,231 | | | — | | | 652,253,057 | |
There were no transfers into or out of level 3 during the reporting period.
| | | | |
See accompanying notes to financial statements. | | | | |
MARCH 31, 2021 | | | 49 | |
STATEMENTS OF ASSETS AND LIABILITIES
March 31, 2021
| | | | | | | | | | | | | | | | |
| | | Sit U.S.
Government
Securities
Fund | | | Sit Quality
Income
Fund | | | Sit Tax-Free
Income
Fund | | | Sit Minnesota
Tax-Free
Income
Fund | |
ASSETS | | | | | | | | | | | | | | | | |
Investments in securities, at identified cost | | | $521,055,026 | | | | $106,868,669 | | | | $333,742,567 | | | | $631,676,676 | |
| | | | | | | | | | | | | | | | |
| | | | |
Investments in securities, at fair value - see accompanying schedule
for detail | | | $532,695,721 | | | | $107,747,843 | | | | $334,150,213 | | | | $652,253,057 | |
Cash in bank on demand deposit | | | — | | | | — | | | | 11,389,348 | | | | 24,945,712 | |
Cash collateral held at broker | | | 500,000 | | | | 500,000 | | | | — | | | | — | |
Accrued interest and dividends receivable | | | 1,970,867 | | | | 519,844 | | | | 3,836,613 | | | | 6,949,613 | |
Receivable for investment securities sold | | | 7,216 | | | | 28,085 | | | | — | | | | — | |
Variation margin on futures contracts | | | — | | | | 416,731 | | | | — | | | | — | |
Receivable for Fund shares sold | | | 2,508,293 | | | | 758 | | | | 1,657,513 | | | | 635,787 | |
| | | | | | | | | | | | | | | | |
| | | | |
Total assets | | | 537,682,097 | | | | 109,213,261 | | | | 351,033,687 | | | | 684,784,169 | |
| | | | | | | | | | | | | | | | |
| | | | |
LIABILITIES | | | | | | | | | | | | | | | | |
Payable for investment securities purchased | | | 8,117,673 | | | | 255,890 | | | | 1,726,905 | | | | 3,031,047 | |
Payable for Fund shares redeemed | | | 1,885,257 | | | | 39,130 | | | | 531,172 | | | | 806,000 | |
Cash portion of dividends payable to shareholders | | | 86,341 | | | | 2,198 | | | | 312,354 | | | | 186,463 | |
Accrued supervisory and administrative fees | | | 236,621 | | | | — | | | | — | | | | — | |
Accrued investment management fees | | | 86,890 | | | | 81,878 | | | | 233,618 | | | | 459,624 | |
Outstanding options written, at fair value (premiums received $86,952) | | | — | | | | 39,688 | | | | — | | | | — | |
| | | | | | | | | | | | | | | | |
| | | | |
Total liabilities | | | 10,412,782 | | | | 418,784 | | | | 2,804,049 | | | | 4,483,134 | |
| | | | | | | | | | | | | | | | |
| | | | |
Net assets applicable to outstanding capital stock | | | $527,269,315 | | | | $108,794,477 | | | | $348,229,638 | | | | $680,301,035 | |
| | | | | | | | | | | | | | | | |
| | | | |
Net assets consist of: | | | | | | | | | | | | | | | | |
Capital (par value and paid-in surplus) | | | $531,972,862 | | | | $108,354,610 | | | | $357,297,776 | | | | $662,956,399 | |
Total distributable earnings (loss), including unrealized appreciation (depreciation) | | | (4,703,547 | ) | | | 439,867 | | | | (9,068,138 | ) | | | 17,344,636 | |
| | | | | | | | | | | | | | | | |
| | | $527,269,315 | | | | $108,794,477 | | | | $348,229,638 | | | | $680,301,035 | |
| | | | | | | | | | | | | | | | |
| | | | |
Outstanding shares: | | | | | | | | | | | | | | | | |
Class S Shares (Class S)* | | | 35,696,878 | | | | 10,840,253 | | | | 35,140,005 | | | | 63,709,567 | |
| | | | | | | | | | | | | | | | |
Class Y Shares (Class Y)* | | | 11,500,724 | | | | — | | | | — | | | | — | |
| | | | | | | | | | | | | | | | |
| | | | |
Net assets applicable to outstanding shares: | | | | | | | | | | | | | | | | |
Net Assets (Class S) * | | | $398,820,641 | | | | $108,794,477 | | | | $348,229,638 | | | | $680,301,035 | |
| | | | | | | | | | | | | | | | |
Net Assets (Class Y) * | | | 128,448,674 | | | | — | | | | — | | | | — | |
| | | | | | | | | | | | | | | | |
| | | | |
Net asset value per share of outstanding capital stock: | | | | | | | | | | | | | | | | |
Net Asset Value (Class S) * | | | $11.17 | | | | $10.04 | | | | $9.91 | | | | $10.68 | |
| | | | | | | | | | | | | | | | |
Net Asset Value (Class Y) * | | | 11.17 | | | | — | | | | — | | | | — | |
| | | | | | | | | | | | | | | | |
* Sit U.S. Government Securities Fund offers multiple share classes (S and Y). All other Funds offer a single share class.
| | | | |
See accompanying notes to financial statements. | | | | |
50 | | | SIT MUTUAL FUNDS ANNUAL REPORT | |
STATEMENTS OF OPERATIONS
Year Ended March 31, 2021
| | | | | | | | | | | | | | | | |
| | | Sit U.S.
Government
Securities
Fund | | | Sit Quality
Income
Fund | | | Sit Tax-Free
Income
Fund | | | Sit Minnesota
Tax-Free
Income
Fund | |
Investment income: | | | | | | | | | | | | | | | | |
Income: | | | | | | | | | | | | | | | | |
Dividends | | | — | | | | — | | | | $800,698 | | | | $229,100 | |
Interest | | | $9,595,609 | | | | $1,939,708 | | | | 11,332,319 | | | | 23,424,400 | |
| | | | | | | | | | | | | | | | |
Total income | | | 9,595,609 | | | | 1,939,708 | | | | 12,133,017 | | | | 23,653,500 | |
| | | | | | | | | | | | | | | | |
| | | | |
Expenses (note 4): | | | | | | | | | | | | | | | | |
Investment management fee | | | 939,360 | | | | 896,203 | | | | 2,605,810 | | | | 5,215,789 | |
Supervisory and administrative fee | | | 2,699,107 | | | | — | | | | — | | | | — | |
| | | | | | | | | | | | | | | | |
Total expenses | | | 3,638,467 | | | | 896,203 | | | | 2,605,810 | | | | 5,215,789 | |
| | | | | | | | | | | | | | | | |
| | | | |
Net investment income | | | 5,957,142 | | | | 1,043,505 | | | | 9,527,207 | | | | 18,437,711 | |
| | | | | | | | | | | | | | | | |
| | | | |
Realized and unrealized gain (loss): | | | | | | | | | | | | | | | | |
Net realized gain (loss) on investments | | | 1,063,720 | | | | 575,772 | | | | (151,568 | ) | | | (756,912 | ) |
Net realized gain (loss) on written options | | | 357,217 | | | | 78,227 | | | | — | | | | — | |
Net realized gain (loss) on futures | | | — | | | | 363,782 | | | | — | | | | — | |
| | | | |
Net change in unrealized appreciation (depreciation) on investments | | | (5,331,616 | ) | | | 897,882 | | | | 11,721,222 | | | | 19,096,672 | |
Net change in unrealized appreciation (depreciation) on written options | | | — | | | | 47,264 | | | | — | | | | — | |
Net change in unrealized appreciation (depreciation) on futures | | | — | | | | 100,505 | | | | — | | | | — | |
| | | | | | | | | | | | | | | | |
| | | | |
Net gain (loss) | | | (3,910,679 | ) | | | 2,063,432 | | | | 11,569,654 | | | | 18,339,760 | |
| | | | | | | | | | | | | | | | |
| | | | |
Net increase (decrease) in net assets resulting from operations | | | $2,046,463 | | | | $3,106,937 | | | | $21,096,861 | | | | $36,777,471 | |
| | | | | | | | | | | | | | | | |
| | | | |
See accompanying notes to financial statements. | | | | |
MARCH 31, 2021 | | | 51 | |
STATEMENTS OF CHANGES IN NET ASSETS
| | | | | | | | | | | | |
| | | Sit U.S. Government
Securities Fund | |
| | | |
| | | Year
Ended
March 31,
2021 | | | | | | Year
Ended
March 31,
2020 | |
Operations: | | | | | | | | | | | | |
Net investment income | | | $5,957,142 | | | | | | | | $8,479,108 | |
Net realized gain (loss) on investments, written options and futures | | | 1,420,937 | | | | | | | | (1,745,753 | ) |
Net change in unrealized appreciation (depreciation) of investments, written options and futures | | | (5,331,616 | ) | | | | | | | 14,303,888 | |
| | | | | | | | | | | | |
Net increase (decrease) in net assets resulting from operations | | | 2,046,463 | | | | | | | | 21,037,243 | |
| | | | | | | | | | | | |
| | | |
Distributions from: | | | | | | | | | | | | |
Net investment income and net realized gains | | | | | | | | | | | | |
Common shares (Class S) | | | (5,228,287 | ) | | | | | | | (8,509,113 | ) |
Common shares (Class Y) | | | (728,814 | ) | | | | | | | (60,462 | ) |
| | | | | | | | | | | | |
Total distributions | | | (5,957,101 | ) | | | | | | | (8,569,575 | ) |
| | | | | | | | | | | | |
| | | |
Capital share transactions: | | | | | | | | | | | | |
Proceeds from shares sold | | | | | | | | | | | | |
Class S Shares | | | 175,900,447 | | | | | | | | 101,588,852 | |
Class Y Shares | | | 132,909,586 | | | | | | | | 13,495,056 | |
Reinvested distributions | | | | | | | | | | | | |
Class S Shares | | | 4,972,098 | | | | | | | | 7,974,475 | |
Class Y Shares | | | 639,672 | | | | | | | | 51,559 | |
Payments for shares redeemed | | | | | | | | | | | | |
Class S Shares | | | (183,858,762 | ) | | | | | | | (144,047,050 | ) |
Class Y Shares | | | (17,452,406 | ) | | | | | | | (775,130 | ) |
| | | | | | | | | | | | |
Increase (decrease) in net assets from capital transactions | | | 113,110,635 | | | | | | | | (21,712,238 | ) |
| | | | | | | | | | | | |
| | | |
Total increase (decrease) in net assets | | | 109,199,997 | | | | | | | | (9,244,570 | ) |
| | | |
Net assets: | | | | | | | | | | | | |
Beginning of year | | | 418,069,318 | | | | | | | | 427,313,888 | |
| | | | | | | | | | | | |
End of year | | | $527,269,315 | | | | | | | | $418,069,318 | |
| | | | | | | | | | | | |
| | | |
Capital transactions in shares: | | | | | | | | | | | | |
Sold | | | | | | | | | | | | |
Class S Shares | | | 15,622,198 | | | | | | | | 45,551,026 | |
Class Y Shares | | | 11,836,082 | | | | | | | | 1,227,355 | |
Reinvested distributions | | | | | | | | | | | | |
Class S Shares | | | 442,475 | | | | | | | | 723,317 | |
Class Y Shares | | | 57,057 | | | | | | | | 4,611 | |
Redeemed | | | | | | | | | | | | |
Class S Shares | | | (16,345,293 | ) | | | | | | | (49,435,171 | ) |
Class Y Shares | | | (1,554,866 | ) | | | | | | | (69,515 | ) |
| | | | | | | | | | | | |
| | | |
Net increase (decrease) | | | 10,057,653 | | | | | | | | (1,998,377 | ) |
| | | | | | | | | | | | |
| | | | |
See accompanying notes to financial statements. | | | | |
52 | | | SIT MUTUAL FUNDS ANNUAL REPORT | |
| | | | | | | | | | | | | | | | | | | | | | |
Sit Quality
Income Fund | | | Sit Tax-Free
Income Fund | | | Minnesota Tax-Free
Income Fund | |
| | | | | |
| Year | | | Year | | | Year | | | Year | | | Year | | | Year | |
| Ended | | | Ended | | | Ended | | | Ended | | | Ended | | | Ended | |
| March 31, | | | March 31, | | | March 31, | | | March 31, | | | March 31, | | | March 31, | |
| 2021 | | | 2020 | | | 2021 | | | 2020 | | | 2021 | | | 2020 | |
| | | | | |
| | $1,043,505 | | | | $1,525,198 | | | | $9,527,207 | | | | $8,630,509 | | | | $18,437,711 | | | | $18,682,152 | |
| | 1,017,781 | | | | 345,244 | | | | (151,568 | ) | | | (1,465,404 | ) | | | (756,912 | ) | | | (323,774 | ) |
| | | | | |
| | 1,045,651 | | | | (149,979 | ) | | | 11,721,222 | | | | (5,319,636 | ) | | | 19,096,672 | | | | (9,036,335 | ) |
| | | | | | | | | | | | | | | | | | | | | | |
| | 3,106,937 | | | | 1,720,463 | | | | 21,096,861 | | | | 1,845,469 | | | | 36,777,471 | | | | 9,322,043 | |
| | | | | | | | | | | | | | | | | | | | | | |
| | | | | |
| | (1,043,484 | ) | | | (1,535,098 | ) | | | (9,527,607 | ) | | | (8,761,294 | ) | | | (18,437,904 | ) | | | (18,780,673 | ) |
| | — | | | | — | | | | — | | | | — | | | | — | | | | — | |
| | | | | | | | | | | | | | | | | | | | | | |
| | (1,043,484 | ) | | | (1,535,098 | ) | | | (9,527,607 | ) | | | (8,761,294 | ) | | | (18,437,904 | ) | | | (18,780,673 | ) |
| | | | | | | | | | | | | | | | | | | | | | |
| | | | | |
| | 39,380,433 | | | | 41,736,062 | | | | 88,915,647 | | | | 136,550,794 | | | | 136,016,186 | | | | 173,103,966 | |
| | — | | | | — | | | | — | | | | — | | | | — | | | | — | |
| | | | | | | | | | | | | | | | | | | | | | |
| | 1,004,721 | | | | 1,420,239 | | | | 6,204,641 | | | | 6,513,741 | | | | 16,170,025 | | | | 16,426,302 | |
| | — | | | | — | | | | — | | | | — | | | | — | | | | — | |
| | | | | | | | | | | | | | | | | | | | | | |
| | (23,927,160 | ) | | | (35,355,615 | ) | | | (71,755,723 | ) | | | (70,203,739 | ) | | | (132,247,052 | ) | | | (155,815,141 | ) |
| | — | | | | — | | | | — | | | | — | | | | — | | | | — | |
| | | | | | | | | | | | | | | | | | | | | | |
| | 16,457,994 | | | | 7,800,686 | | | | 23,364,565 | | | | 72,860,796 | | | | 19,939,159 | | | | 33,715,127 | |
| | | | | | | | | | | | | | | | | | | | | | |
| | | | | |
| | 18,521,447 | | | | 7,986,051 | | | | 34,933,819 | | | | 65,944,971 | | | | 38,278,726 | | | | 24,256,497 | |
| | | | | |
| | 90,273,030 | | | | 82,286,979 | | | | 313,295,819 | | | | 247,350,848 | | | | 642,022,309 | | | | 617,765,812 | |
| | | | | | | | | | | | | | | | | | | | | | |
| | $108,794,477 | | | | $90,273,030 | | | | $348,229,638 | | | | $313,295,819 | | | | $680,301,035 | | | | $642,022,309 | |
| | | | | | | | | | | | | | | | | | | | | | |
| | | | | |
| | 3,946,193 | | | | 4,246,769 | | | | 9,124,175 | | | | 13,869,208 | | | | 12,839,133 | | | | 16,257,684 | |
| | — | | | | — | | | | — | | | | — | | | | — | | | | — | |
| | | | | | | | | | | | | | | | | | | | | | |
| | 100,768 | | | | 144,292 | | | | 634,570 | | | | 661,211 | | | | 1,528,730 | | | | 1,540,122 | |
| | — | | | | — | | | | — | | | | — | | | | — | | | | — | |
| | | | | | | | | | | | | | | | | | | | | | |
| | (2,395,722 | ) | | | (3,598,408 | ) | | | (7,401,245 | ) | | | (7,262,186 | ) | | | (12,581,578 | ) | | | (14,784,906 | ) |
| | — | | | | — | | | | — | | | | — | | | | — | | | | — | |
| | | | | | | | | | | | | | | | | | | | | | |
| | | | | |
| | 1,651,239 | | | | 792,653 | | | | 2,357,500 | | | | 7,268,233 | | | | 1,786,285 | | | | 3,012,900 | |
| | | | | | | | | | | | | | | | | | | | | | |
FINANCIAL HIGHLIGHTS
Per share income and capital changes for a share outstanding throughout the period. See accompanying notes to financial statements.
Sit U.S. Government Securities Fund
| | | | | | | | | | | | | | | | | | | | |
| | |
| Class S | | Year Ended March 31, | |
| | | 2021 | | | 2020 | | | 2019 | | | 2018 | | | 2017 | |
| | | | | |
Net Asset Value: | | | | | | | | | | | | | | | | | | | | |
Beginning of period | | | $11.26 | | | | $10.92 | | | | $10.80 | | | | $10.90 | | | | $11.07 | |
| | | | | |
Operations: | | | | | | | | | | | | | | | | | | | | |
Net investment income 1 | | | 0.14 | | | | 0.22 | | | | 0.23 | | | | 0.18 | | | | 0.17 | |
Net realized and unrealized gains (losses) on investments, written options and futures | | | (0.09 | ) | | | 0.34 | | | | 0.12 | | | | (0.10 | ) | | | (0.17 | ) |
| | | | | |
Total from operations | | | 0.05 | | | | 0.56 | | | | 0.35 | | | | 0.08 | | | | — | |
| | | | | |
Distributions from: | | | | | | | | | | | | | | | | | | | | |
Net investment income | | | (0.14 | ) | | | (0.22 | ) | | | (0.23 | ) | | | (0.18 | ) | | | (0.17 | ) |
| | | | | |
Net Asset Value: | | | | | | | | | | | | | | | | | | | | |
End of period | | | $11.17 | | | | $11.26 | | | | $10.92 | | | | $10.80 | | | | $10.90 | |
| | | | | |
Total investment return 2 | | | 0.44% | | | | 5.25% | | | | 3.31% | | | | 0.76% | | | | 0.02% | |
| | | | | |
Net assets at end of period (000’s omitted) | | | $398,821 | | | | $404,985 | | | | $427,314 | | | | $527,748 | | | | $643,304 | |
| | | | | |
Ratios: 3 | | | | | | | | | | | | | | | | | | | | |
Expenses | | | 0.80% | | | | 0.80% | | | | 0.80% | | | | 0.80% | | | | 0.80% | |
Net investment income | | | 1.25% | | | | 2.06% | | | | 2.13% | | | | 1.68% | | | | 1.57% | |
| | | | | |
Portfolio turnover rate (excluding short-term securities) | | | 39.29% | | | | 29.91% | | | | 14.88% | | | | 14.68% | | | | 29.00% | |
| 1 | The net investment income per share is based on average shares outstanding for the period. |
| 2 | Total investment return is based on the change in net asset value of a share during the period (not annualized) and assumes reinvestment of distributions at net asset value. |
| 3 | Ratios are annualized for periods less than one year. In addition to fees and expenses which the Fund bears directly, the Fund indirectly bears a pro rata share of the fees and expenses of the acquired funds in which it invests. Such indirect expenses are not included in the above reported expense ratios. |
| | | | |
| | | | |
54 | | | SIT MUTUAL FUNDS ANNUAL REPORT | |
FINANCIAL HIGHLIGHTS
Per share income and capital changes for a share outstanding throughout the period. See accompanying notes to financial statements.
Sit U.S. Government Securities Fund
| | | | | | | | | | |
| | | |
| Class Y | | Year Ended March 31, | | Period Ended March 31, |
| | | 2021 | | 2020 1 |
Net Asset Value: | | | | | | | | | | |
Beginning of period | | | | $11.26 | | | | | $10.97 | |
Operations: | | | | | | | | | | |
Net investment income 2 | | | | 0.17 | | | | | 0.06 | |
Net realized and unrealized gains (losses) on investments, written options and futures | | | | (0.09 | ) | | | | 0.29 | |
Total from operations | | | | 0.08 | | | | | 0.35 | |
Distributions from: | | | | | | | | | | |
Net investment income | | | | (0.17 | ) | | | | (0.06 | ) |
Net Asset Value: | | | | | | | | | | |
End of period | | | | $11.17 | | | | | $11.26 | |
| | |
Total investment return 3 | | | | 0.72% | | | | | 3.20% | |
| | |
Net assets at end of period (000’s omitted) | | | | $128,449 | | | | | $13,085 | |
| | |
Ratios: 4 | | | | | | | | | | |
Expenses | | | | 0.55% | | | | | 0.55%5 | |
Net investment income | | | | 1.44% | | | | | 2.19% | |
| | |
Portfolio turnover rate (excluding short-term securities) | | | | 39.29% | | | | | 29.91% | |
| 1 | The inception date of Class Y shares was January 1, 2020. |
| 2 | The net investment income per share is based on average shares outstanding for the period. |
| 3 | Total investment return is based on the change in net asset value of a share during the period (not annualized) and assumes reinvestment of distributions at net asset value. |
| 4 | Ratios are annualized for periods less than one year. In addition to fees and expenses which the Fund bears directly, the Fund indirectly bears a pro rata share of the fees and expenses of the acquired funds in which it invests. Such indirect expenses are not included in the above reported expense ratios. |
| 5 | Sit U.S. Government Securities Fund Class Y shares were first issued on January 1, 2020, and therefore the fees presented reflect the fees provided for in the Investment Management Agreement and Supervision and Administration Agreement. |
FINANCIAL HIGHLIGHTS
Per share income and capital changes for a share outstanding throughout the period. See accompanying notes to financial statements.
Sit Quality Income Fund
| | | | | | | | | | | | | | | | | | | | |
| | | Years Ended March 31, | |
| | | 2021 | | | 2020 | | | 2019 | | | 2019 | | | 2017 | |
| | | | | |
Net Asset Value: | | | | | | | | | | | | | | | | | | | | |
Beginning of period | | | $9.82 | | | | $9.80 | | | | $9.78 | | | | $9.83 | | | | $9.83 | |
| | | | | |
Operations: | | | | | | | | | | | | | | | | | | | | |
Net investment income 1 | | | 0.10 | | | | 0.18 | | | | 0.19 | | | | 0.13 | | | | 0.09 | |
Net realized and unrealized gains (losses) on investments, written options and futures | | | 0.22 | | | | 0.02 | | | | 0.02 | | | | (0.05 | ) | | | — | |
| | | | | |
Total from operations | | | 0.32 | | | | 0.20 | | | | 0.21 | | | | 0.08 | | | | 0.09 | |
| | | | | |
Distributions from: | | | | | | | | | | | | | | | | | | | | |
Net investment income | | | (0.10 | ) | | | (0.18 | ) | | | (0.19 | ) | | | (0.13 | ) | | | (0.09 | ) |
| | | | | |
Net Asset Value: | | | | | | | | | | | | | | | | | | | | |
End of period | | | $10.04 | | | | $9.82 | | | | $9.80 | | | | $9.78 | | | | $9.83 | |
| | | | | |
Total investment return 2 | | | 3.32% | | | | 2.04% | | | | 2.17% | | | | 0.79% | | | | 0.91% | |
| | | | | |
Net assets at end of period (000’s omitted) | | | $108,794 | | | | $90,273 | | | | $82,287 | | | | $74,542 | | | | $73,861 | |
| | | | | |
Ratios: 3 | | | | | | | | | | | | | | | | | | | | |
Expenses | | | 0.90% | | | | 0.90% | | | | 0.90% | | | | 0.90% | | | | 0.90% | |
Net investment income | | | 1.05% | | | | 1.80% | | | | 1.96% | | | | 1.31% | | | | 0.91% | |
| | | | | |
Portfolio turnover rate (excluding short-term securities) | | | 77.96% | | | | 117.52% | | | | 68.93% | | | | 81.14% | | | | 84.03% | |
| 1 | The net investment income per share is based on average shares outstanding for the period. |
| 2 | Total investment return is based on the change in net asset value of a share during the period (not annualized) and assumes reinvestment of distributions at net asset value. |
| 3 | Ratios are annualized for periods less than one year. In addition to fees and expenses which the Fund bears directly, the Fund indirectly bears a pro rata share of the fees and expenses of the acquired funds in which it invests. Such indirect expenses are not included in the above reported expense ratios. |
| | | | |
| | | | |
56 | | | SIT MUTUAL FUNDS ANNUAL REPORT | |
FINANCIAL HIGHLIGHTS
Per share income and capital changes for a share outstanding throughout the period. See accompanying notes to financial statements.
Sit Tax-Free Income Fund
| | | | | | | | | | | | | | | | | | | | |
| | | Years Ended March 31, | |
| | | 2021 | | | 2020 | | | 2019 | | | 2018 | | | 2017 | |
| | | | | |
Net Asset Value: | | | | | | | | | | | | | | | | | | | | |
Beginning of period | | | $9.56 | | | | $9.69 | | | | $9.66 | | | | $9.49 | | | | $9.80 | |
| | | | | |
Operations: | | | | | | | | | | | | | | | | | | | | |
Net investment income 1 | | | 0.29 | | | | 0.29 | | | | 0.32 | | | | 0.39 | | | | 0.35 | |
Net realized and unrealized gains (losses) on investments and futures | | | 0.35 | | | | (0.13 | ) | | | 0.03 | | | | 0.17 | | | | (0.31 | ) |
| | | | | |
Total from operations | | | 0.64 | | | | 0.16 | | | | 0.35 | | | | 0.56 | | | | 0.04 | |
| | | | | |
Distributions from: | | | | | | | | | | | | | | | | | | | | |
Net investment income | | | (0.29 | ) | | | (0.29 | ) | | | (0.32 | ) | | | (0.39 | ) | | | (0.35 | ) |
| | | | | |
Net Asset Value: | | | | | | | | | | | | | | | | | | | | |
End of period | | | $9.91 | | | | $9.56 | | | | $9.69 | | | | $9.66 | | | | $9.49 | |
| | | | | |
Total investment return 2 | | | 6.73% | | | | 1.66% | | | | 3.67% | | | | 6.00% | | | | 0.37% | |
| | | | | |
Net assets at end of period (000’s omitted) | | | $348,230 | | | | $313,296 | | | | $247,351 | | | | $196,018 | | | | $160,445 | |
| | | | | |
Ratios: 3 | | | | | | | | | | | | | | | | | | | | |
Expenses | | | 0.80% | | | | 0.80% | | | | 0.80% | | | | 0.80% | | | | 0.80% | |
Net investment income | | | 2.92% | | | | 2.95% | | | | 3.37% | | | | 4.03% | | | | 3.58% | |
| | | | | |
Portfolio turnover rate (excluding short-term securities) | | | 21.22% | | | | 14.33% | | | | 13.80% | | | | 15.72% | | | | 25.41% | |
| 1 | The net investment income per share is based on average shares outstanding for the period. |
| 2 | Total investment return is based on the change in net asset value of a share during the period (not annualized) and assumes reinvestment of distributions at net asset value. |
| 3 | Ratios are annualized for periods less than one year. In addition to fees and expenses which the Fund bears directly, the Fund indirectly bears a pro rata share of the fees and expenses of the acquired funds in which it invests. Such indirect expenses are not included in the above reported expense ratios. |
FINANCIAL HIGHLIGHTS
Per share income and capital changes for a share outstanding throughout the period. See accompanying notes to financial statements.
Sit Minnesota Tax-Free Income Fund
| | | | | | | | | | | | | | | | | | | | |
| | | Years Ended March 31, | |
| | | 2021 | | | 2020 | | | 2019 | | | 2018 | | | 2017 | |
| | | | | |
Net Asset Value: | | | | | | | | | | | | | | | | | | | | |
Beginning of period | | | $10.37 | | | | $10.49 | | | | $10.39 | | | | $10.29 | | | | $10.63 | |
| | | | | |
Operations: | | | | | | | | | | | | | | | | | | | | |
Net investment income 1 | | | 0.30 | | | | 0.30 | | | | 0.32 | | | | 0.32 | | | | 0.32 | |
Net realized and unrealized gains (losses) on investments and futures | | | 0.31 | | | | (0.12 | ) | | | 0.10 | | | | 0.10 | | | | (0.34 | ) |
| | | | | |
Total from operations | | | 0.61 | | | | 0.18 | | | | 0.42 | | | | 0.42 | | | | (0.02 | ) |
| | | | | |
Distributions from: | | | | | | | | | | | | | | | | | | | | |
Net investment income | | | (0.30 | ) | | | (0.30 | ) | | | (0.32 | ) | | | (0.32 | ) | | | (0.32 | ) |
| | | | | |
Net Asset Value: | | | | | | | | | | | | | | | | | | | | |
End of period | | | $10.68 | | | | $10.37 | | | | $10.49 | | | | $10.39 | | | | $10.29 | |
| | | | | |
Total investment return 2 | | | 5.94% | | | | 1.46% | | | | 4.15% | | | | 4.08% | | | | (0.19% | ) |
| | | | | |
Net assets at end of period (000’s omitted) | | | $680,301 | | | | $642,022 | | | | $617,766 | | | | $551,163 | | | | $529,821 | |
| | | | | |
Ratios: 3 | | | | | | | | | | | | | | | | | | | | |
Expenses | | | 0.80% | | | | 0.80% | | | | 0.80% | | | | 0.80% | | | | 0.80% | |
Net investment income | | | 2.83% | | | | 2.80% | | | | 3.12% | | | | 3.05% | | | | 3.06% | |
| | | | | |
Portfolio turnover rate (excluding short-term securities) | | | 12.04% | | | | 10.05% | | | | 9.25% | | | | 12.97% | | | | 16.18% | |
| 1 | The net investment income per share is based on average shares outstanding for the period. |
| 2 | Total investment return is based on the change in net asset value of a share during the period (not annualized) and assumes reinvestment of distributions at net asset value. |
| 3 | Ratios are annualized for periods less than one year. In addition to fees and expenses which the Fund bears directly, the Fund indirectly bears a pro rata share of the fees and expenses of the acquired funds in which it invests. Such indirect expenses are not included in the above reported expense ratios. |
| | | | |
| | | | |
58 | | | SIT MUTUAL FUNDS ANNUAL REPORT | |
[This page intentionally left blank.]
NOTES TO FINANCIAL STATEMENTS
Year Ended March 31, 2021
The Sit Mutual Funds (the Funds) are no-load funds, and are registered under the Investment Company Act of 1940 (as amended) as diversified (except Minnesota Tax-Free Income Fund which is non-diversified), open-end management investment companies, or series thereof. The Sit Quality Income Fund, Sit Tax-Free Income Fund and Minnesota Tax-Free Income Fund are series funds of Sit Mutual Funds II, Inc. Each fund has 10 billion authorized shares of capital stock. Shares in the U.S. Government Securities Fund have a par value of $0.01, and shares in other funds have a par value of $0.001. This report covers the bond funds of the Sit Mutual Funds.
The investment objective for each Fund is as follows:
| | |
| Fund | | Investment Objective |
U.S. Government Securities Fund | | High level of current income and safety of principal. |
Quality Income Fund | | High level of current income and safety of principal. |
Tax-Free Income Fund | | High level of current income that is exempt from federal income tax, consistent with the preservation of capital. |
Minnesota Tax-Free Income Fund | | High level of current income that is exempt from federal regular income tax and Minnesota regular personal income tax, consistent with the preservation of capital. |
The U.S. Government Securities Fund offers Class S and Class Y shares. Both classes of shares have identical voting, dividend and liquidation rights. Income, expenses (other than class specific expenses) and realized and unrealized gains or losses on investments are allocated to each class of shares based upon its relative net assets.
| (2) | Significant Accounting Policies |
The Funds are investment companies and follow accounting and reporting guidance under Financial Accounting Standards Board (“FASB”) Accounting Standards Codification (“ASC”) Topic 946, “Financial Services-Investment Companies”. The following is a summary of significant accounting policies consistently followed by the Funds in the preparation of their financial statements in conformity with U.S. generally accepted accounting principles (“GAAP”).
Investments in Securities
Investment securities are carried at fair value based upon closing market quotations on the last business day of the period. Investments in securities traded on national or international securities exchanges are valued at the last reported sales price prior to the time when assets are valued. Equity securities traded on the over-the-counter market are valued at the last reported sales price or if the last sales price is not available, at the last reported bid price. The sale and bid prices or prices deemed best to reflect fair value quoted by dealers who make markets in these securities are obtained from independent pricing services. Consistent with the Funds’ valuation policies and procedures, the current fair value of certain fixed income securities is provided by an independent pricing service. Fixed income securities for which prices are not available from an independent pricing service but where an active market exists are valued using market quotations obtained from broker-dealers or quotation systems. Securities for which market quotations are not available, such as private placement securities, are valued at fair value according to methods selected in good faith by Sit Investment Associates, Inc. (the “Adviser”) and may include dealer-supplied valuations or other inputs and assumptions that pricing services would typically utilize. Short-term investments of sufficient credit quality with maturities of 60 days or less when acquired, or which subsequently are within 60 days of maturity, are valued at amortized cost, which approximates fair value. Options and futures contracts entered into and held by the Funds are valued at the close of the securities and commodities exchange on which they are traded.
Security transactions are accounted for on the date the securities are purchased or sold. Gains and losses are calculated on the identified-cost basis. Interest, including level-yield amortization of long-term bond premium and discount, is recorded on the accrual basis. Dividends received from closed-end fund holdings are included in Dividend Income and distributions from capital gains, if any, are included in Net Realized Gain (Loss).
| | | | |
| | | | |
60 | | | SIT MUTUAL FUNDS ANNUAL REPORT | |
Delivery and payment for securities which have been purchased by the Funds on a forward commitment or when-issued basis can take place two weeks or more after the transaction date. During this period, such securities are subject to market fluctuations and may increase or decrease in value prior to delivery.
The Minnesota Tax-Free Income Fund concentrates its investments in Minnesota, and therefore may have more credit risk related to the economic conditions in the state of Minnesota than a portfolio with broader geographical diversification.
Derivative Instruments
The Funds apply derivative instrument disclosure standards in order to enable investors to understand how and why the Funds use derivatives, how derivatives are accounted for, and how derivative instruments affect the Funds’ financial statements.
To hedge interest rate risk, the Funds used Treasury options and futures traded on a U.S. exchange. Risks of entering into futures and options contracts include the possibility of an illiquid market and that a change in the value of the option may not correlate with changes in the value of the underlying securities.
The premiums paid for the options represent the cost of the investment and the options are valued daily at their closing price. The Funds recognize a realized gain or loss when the option is sold or expired. Option holdings within the Funds, which may include put options and call options, are subject to loss of value with the passage of time, and may experience a total loss of value upon expiration. With options, there is minimal counterparty risk to the Funds since they are exchange traded.
Upon entering into a futures contract, a Fund is required to deposit either cash or securities in an amount (initial margin) equal to a certain percentage of the contract value. Subsequent payments (variation margin) are made or received by the Fund each day. The variation margin payments are equal to the daily changes in the contract value and are recorded as unrealized gains and losses. The Fund recognizes a realized gain or loss when the contract is closed or expired. With futures contracts, there is minimal counterparty risk to the Fund since futures are exchange traded and the exchange’s clearinghouse, as counterparty to all exchange-traded futures, guarantees the futures against default.
During the year ended March 31, 2021, the average volume of derivative activity, calculated on a quarterly basis (monthly for U.S. Government Securities Fund), was as follows:
| | | | | | | | | | | | | | | | | | | | | | | | |
| | | | | | Average
Cost | | | | | | Average
Premium
Received | | | | | | Average
Notional
Amount | |
U.S. Government Securities Fund | | | | | | | | | | | | | | | | | | | | | | | | |
Purchased put options | | | | | | $ | 89,790 | | | | | | | | — | | | | | | | $ | 10,772,327 | |
Written call options | | | | | | | — | | | | | | | $ | 43,690 | | | | | | | | 12,575,000 | |
| | | | | | |
Quality Income Fund | | | | | | | | | | | | | | | | | | | | | | | | |
Written call options | | | | | | | — | | | | | | | | 17,390 | | | | | | | | 3,136,900 | |
Treasury futures - short | | | | | | | — | | | | | | | | — | | | | | | | | 12,059,486 | |
The number of open option contracts and open futures contracts outstanding as of March 31, 2021 also serve as indicators of the volume of activity for the Funds throughout the period.
NOTES TO FINANCIAL STATEMENTS
Year Ended March 31, 2021 (Continued)
Statement of Assets and Liabilities - Values of derivatives as of March 31, 2021
| | | | | | | | | | |
| | | Asset Derivatives Value | | | | Liability Derivatives Value |
Interest rate risk: | | | | | | | | | | |
Quality Income Fund | | | | | | | | | | |
Written call options | | | — | | | | | | $39,688 | 2 |
Treasury futures | | | $416,731 | 1 | | | | | — | |
| | 1 | Statement of Assets and Liabilities location: Variation margin receivable/payable. Includes cumulative appreciation(depreciation) of futures as reported in the Schedule of Investments. | |
| | 2 | Statement of Assets and Liabilities location: Outstanding options written, at fair value. | |
The effect of derivative instruments on the statement of operations for the year ended March 31, 2021:
| | | | | | | | |
| | | Amount of Realized | | Change in Unrealized |
| | | Gain (Loss) on Derivatives 3 | | Appreciation (Depreciation) on Derivatives 4 |
Interest rate risk: | | | | | | | | |
U.S. Government Securities Fund | | | | | | | | |
Purchased put options | | | $731,320 | | | | $285,988 | |
Written call options | | | 357,217 | | | | — | |
| | |
Quality Income Fund | | | | | | | | |
Written call options | | | 78,227 | | | | 47,264 | |
Treasury futures | | | 363,782 | | | | 100,505 | |
| | 3 | Statement of Operations location: Net realized gain (loss) on investments, net realized gain (loss) on written options and net realized gain (loss) on futures, respectively. | |
| | 4 | Statement of Operations location: Net change in unrealized appreciation (depreciation) on investments and net change in unrealized appreciation (depreciation) on futures, respectively. | |
Fair Value Measurements
The inputs and valuation techniques used to measure fair value of the Funds’ net assets are summarized into three levels as described in the hierarchy below:
| | • | | Level 1 – quoted prices in active markets for identical securities. An active market for the security is a market in which transactions occur with sufficient frequency and volume to provide pricing information on an ongoing basis. A quoted price in an active market provides the most reliable evidence of fair value. |
| | • | | Level 2 – debt securities are valued based on evaluated prices received from independent pricing services or from dealers who make markets in such securities. For corporate bonds, U.S. government and government agency obligations, and municipal securities the pricing services utilize matrix pricing which considers yield or price of bonds of comparable quality, coupon, maturity, and type as well as dealer supplied prices. For asset-backed securities and mortgage-backed securities, the pricing services utilize matrix pricing which considers prepayment speed assumptions, attributes of the collateral, yield or price of bonds of comparable quality, coupon, maturity, and type as well as dealer supplied prices. All of these inputs are derived principally from or corroborated by observable market data. An adjustment to any observable input that is significant to the fair value may render the measurement a Level 3 measurement. |
| | • | | Level 3 – significant unobservable inputs, including the Adviser’s own assumptions in determining the fair value of investments. |
The inputs or methodology used for valuing securities are not necessarily an indication of the risk associated with investing in those securities.
| | | | |
| | | | |
62 | | | SIT MUTUAL FUNDS ANNUAL REPORT | |
At the end of each calendar quarter, management evaluates the Level 2 and 3 assets and liabilities for changes in liquidity, including but not limited to: whether a broker is willing to execute at the quoted price, the depth and consistency of prices from third party services, and the existence of contemporaneous, observable trades in the market. Additionally, management evaluates the Level 1 and 2 assets and liabilities on a quarterly basis for changes in listings or delistings on national exchanges. Due to the inherent uncertainty of determining the fair value of investments that do not have a readily available market value, the fair value of the Funds’ investments may fluctuate from period to period. Additionally, the fair value of investments may differ significantly from the values that would have been used had a ready market existed for such investments and may differ materially from the values the Fund may ultimately realize. Further, such investments may be subject to legal and other restrictions on resale or otherwise are less liquid than publicly traded securities.
A summary of the levels for the Funds’ investments as of March 31, 2021 is included with the Funds’ schedules of investments.
Federal Taxes
The Funds’ policy is to comply with the requirements of the Internal Revenue Code applicable to regulated investment companies and to distribute all of their taxable income to shareholders. The Funds have recorded in their financial statements the full benefit of their tax positions taken in connection with the Registered Investment Company (RIC) qualification and distribution requirements of the Internal Revenue Code. Therefore, no income tax provision is required. Also, in order to avoid the payment of any federal excise taxes, the Funds will distribute substantially all of their net investment income and net realized gains on a calendar year basis.
Management has analyzed the Funds’ tax positions taken in federal tax returns for all open tax years and has concluded that as of March 31, 2021, no provision for income tax would be required in the Funds’ financial statements. The Funds’ federal and state income and federal excise tax returns remain subject to examination by the Internal Revenue Service and state departments of revenue until such time as the applicable statute of limitations for audit has expired. For example, U.S. tax returns are generally subject to audit for three years from the date they are filed.
At March 31, 2021, the gross unrealized appreciation (depreciation) on investments and cost of investments on a tax basis for federal income tax purposes were as follows:
| | | | | | | | | | | | | | | | |
| | | Unrealized
Appreciation | | Unrealized
Depreciation | | Net Unrealized
Appreciation
(Depreciation) | | Cost (Proceeds)
of Investments
on a Tax Basis |
U.S. Government Securities - Investments | | | $14,872,962 | | | | ($3,323,859 | ) | | | $11,549,103 | | | | $521,055,026 | |
Quality Income - Investments | | | 1,446,193 | | | | (568,420 | ) | | | 877,773 | | | | 106,870,070 | |
Tax-Free Income - Investments | | | 17,907,145 | | | | (17,504,707 | ) | | | 402,438 | | | | 333,747,775 | |
Minnesota Tax-Free Income - Investments | | | 26,386,264 | | | | (5,719,326 | ) | | | 20,666,938 | | | | 631,586,119 | |
NOTES TO FINANCIAL STATEMENTS
Year Ended March 31, 2021 (Continued)
Net investment income and net realized gains may differ for financial statement and tax purposes. The character of distributions made during the year from net investment income or net realized gains may also differ from its ultimate characterization for tax purposes. The tax character of distributions paid during the fiscal years ended March 31, 2021 and 2020 were as follows:
| | | | | | | | | | | | | | | | | | | | |
Year Ended March 31, 2021: | | | | | | | | | | | | | | | | | | | | |
| | | Ordinary Income | | | Tax-Exempt
Income | | | Long Term
Capital Gain | | | Total | |
U.S. Government Securities | | | $5,957,101 | | | | — | | | | — | | | | $5,957,101 | |
Quality Income | | | 1,043,484 | | | | — | | | | — | | | | 1,043,484 | |
Tax-Free Income* | | | 74,376 | | | | $9,453,231 | | | | — | | | | 9,527,607 | |
Minnesota Tax-Free Income* | | | 13,344 | | | | 18,424,560 | | | | — | | | | 18,437,904 | |
*99.2% and 99.9% of dividends were derived from interest on tax-exempt securities for the Tax-Free Income and Minnesota Tax-Free Income Funds, respectively. | |
| | | | | | | | | | | | | | | | | | | | |
| | | | | |
Year Ended March 31, 2020: | | | | | | | | | | | | | | | | | | | | |
| | | | | | Tax-Exempt | | | Long Term | | | | |
| | | Ordinary Income | | | Income | | | Capital Gain | | | Total | |
U.S. Government Securities | | | $8,592,078 | | | | — | | | | — | | | | $8,592,078 | |
Quality Income | | | 1,540,562 | | | | — | | | | — | | | | 1,540,562 | |
Tax-Free Income* | | | 51,791 | | | | $8,593,961 | | | | — | | | | 8,645,752 | |
Minnesota Tax-Free Income* | | | 21,281 | | | | 18,749,227 | | | | — | | | | 18,770,508 | |
*99.4% and 99.9% of dividends were derived from interest on tax-exempt securities for the Tax-Free Income and Minnesota Tax-Free Income Funds, respectively. | |
As of March 31, 2021, the components of distributable earnings on a tax basis were as follows:
| | | | | | | | | | | | | | | | | | |
| | | | | | | | | | | | Unrealized | | | |
| | | Undistributed | | | Undistributed | | | Accumulated | | | Appreciation | |
| | | Ordinary Income | | | Tax-Exempt Income | | | Gain (Loss) | | | (Depreciation) | |
U.S. Government Securities | | | $86,304 | | | | — | | | | ($16,252,613 | ) | | | $11,549,103 | |
Quality Income | | | 2,200 | | | | — | | | | (401,278 | ) | | | 877,773 | |
Tax-Free Income | | | — | | | | $316,861 | | | | (9,475,083 | ) | | | 402,438 | |
Minnesota Tax-Free Income | | | — | | | | 140,643 | | | | (3,276,482 | ) | | | 20,666,938 | |
Net capital loss carryovers and late year losses, if any, as of March 31, 2021, are available to offset future realized capital gains and thereby reduce future capital gains distributions. The Funds are permitted to carry forward capital losses for an unlimited period. Capital losses that are carried forward retain their character as either short-term or long-term capital losses. The net capital loss carryovers and the late year losses deferred as of March 31, 2021, were as follows:
| | | | | | | | | | | | | | | | |
| | | Unlimited Period of Net
Capital Loss Carryover | | | Late Year
Losses Deferred | | Accumulated
Capital and Other Losses | | | |
| | | Short-Term | | | Long-Term | |
U.S. Government Securities | | | $7,890,798 | | | | $8,361,815 | | | — | | | $16,252,613 | |
Quality Income | | | — | | | | 401,278 | | | — | | | 401,278 | |
Tax-Free Income | | | 1,632,309 | | | | 7,842,774 | | | — | | | 9,475,083 | |
Minnesota Tax-Free Income | | | 1,444,330 | | | | 1,832,152 | | | — | | | 3,276,482 | |
| | | | |
| | | | |
64 | | | SIT MUTUAL FUNDS ANNUAL REPORT | |
For the year ended March 31, 2021, the Funds’ utilized capital losses and expired capital losses as follows:
| | | | | | | | |
| | | Utilized | | | Expired | | |
U.S. Government Securities | | $ | 1,243,344 | | | — |
Quality Income | | | 1,143,549 | | | — |
Distributions
Distributions to shareholders are recorded as of the close of business on the record date. Such distributions are payable in cash or reinvested in additional shares of the Funds’ capital stock. Distributions from net investment income are declared daily and paid monthly for the Funds. Distributions from net realized gains, if any, will be made annually for each of the Funds.
Use of Estimates
The preparation of financial statements in conformity with U.S. generally accepted accounting principles requires management to make certain estimates and assumptions that affect the reported amounts of assets and liabilities and disclosure of contingent assets and liabilities at the date of the financial statements and the reported results for the respective periods. Actual results could differ from those estimates.
Guarantees and Indemnifications
Under each Fund’s organizational documents, its officers and directors are indemnified against certain liabilities arising out of the performance of their duties to each Fund. In addition, certain of each Fund’s contracts with its service providers contain general indemnification clauses. Each Fund’s maximum exposure under these arrangements is unknown since the amount of any future claims that may be made against each Fund cannot be determined and each Fund has no historical basis for predicting the likelihood of any such claims.
| (3) | Investment Security Transactions |
The cost of purchases and proceeds from sales and maturities of investment securities, other than short-term securities, for the year ended March 31, 2021, were as follows:
| | | | | | | | | | | | | | | | | | |
| | | Purchases | | | Proceeds | | | |
| | | U.S. Government | | | Other | | | U.S. Government | | | Other | |
U.S. Government Securities | | | $273,019,813 | | | | $8,189,798 | | | | $172,272,217 | | | | $1,662,953 | |
Quality Income | | | 58,173,755 | | | | 42,852,063 | | | | 33,193,880 | | | | 33,716,132 | |
Tax-Free Income | | | — | | | | 86,456,968 | | | | — | | | | 66,606,587 | |
Minnesota Tax-Free Income | | | — | | | | 76,561,869 | | | | — | | | | 75,825,221 | |
NOTES TO FINANCIAL STATEMENTS
Year Ended March 31, 2021 (Continued)
| (4) | Affiliated Fees and Transactions |
Investment Adviser
The Funds each have entered into an investment management agreement with Sit Investment Associates Inc. (SIA), under which SIA manages the Funds’ assets and provides research, statistical and advisory services, and pays related office rental, executive expenses and executive salaries and with respect to the U.S. Government Securities Fund, an additional separate supervision and administration agreement. SIA also is obligated to pay all of the Funds’ expenses (excluding extraordinary expenses, stock transfer taxes, interest, brokerage commissions, and other transaction charges relating to investing activities). The fee for investment management and advisory services is based on the average daily net assets of the Funds at the annual rate of:
| | | | | | | | | | | | | | |
| | | Advisory
Fees | | | Supervisory and
Administrative Fees | | | Total
Management Fees | | | |
U.S. Government Securities | | | | | | | | | | | | |
Class S 1 | | | 0.20% | | | | 0.60% | | | | 0.80% | |
U.S. Government Securities | | | | | | | | | | | | |
Class Y 2 | | | 0.20% | | | | 0.35% | | | | 0.55% | |
Quality Income | | | 0.90% | | | | — | | | | 0.90% | |
Tax-Free Income | | | 0.80% | | | | — | | | | 0.80% | |
Minnesota Tax-Free Income | | | 0.80% | | | | — | | | | 0.80% | |
| 1 | The supervisory and administrative fee was effective January 1, 2020. Prior to January 1, 2020, the advisory fee was 0.80% and the total management fee was 0.80%. |
| 2 | Sit U.S. Government Securities Fund Class Y shares were first issued on January 1, 2020, and therefore the fees presented reflect the fees provided for in the Investment Management Agreement and Supervision and Administration Agreement. |
Transactions with affiliates
The investment adviser, affiliates of the investment adviser, directors and officers of the Funds as a whole owned the following shares as of March 31, 2021:
| | | | | | | | | | | | | | | |
| | | Shares | | % Shares Outstanding | | |
U.S. Government Securities Class S | | | | 119,632 | | | | | 0.3 | |
U.S. Government Securities Class Y | | | | 1,191,101 | | | | | 10.4 | |
Quality Income | | | | 8,364,312 | | | | | 77.2 | |
Tax-Free Income | | | | 1,122,109 | | | | | 3.2 | |
Minnesota Tax-Free Income | | | | 1,869,684 | | | | | 2.9 | |
| | | | |
| | | | |
66 | | | SIT MUTUAL FUNDS ANNUAL REPORT | |
REPORT OF INDEPENDENT REGISTERED PUBLIC ACCOUNTING FIRM
To the Shareholders and Board of Directors
Sit U.S. Government Securities Fund, Inc.
Sit Mutual Funds II, Inc.:
Opinion on the Financial Statements
We have audited the accompanying statements of assets and liabilities of the Sit U.S. Government Securities Fund and Sit Quality Income Fund, Sit Tax-Free Income Fund, and Sit Minnesota Tax-Free Income Fund (each a series of Sit Mutual Funds II, Inc.) (collectively, the Funds), including the schedules of investments, as of March 31, 2021, the related statements of operations for the year then ended, the statements of changes in net assets for each of the years in the two year period then ended, and the related notes (collectively, the financial statements) and the financial highlights for each of the years in the five year period then ended. In our opinion, the financial statements and financial highlights present fairly, in all material respects, the financial position of the Funds as of March 31, 2021, the results of their operations for the year then ended, the changes in their net assets for each of the years in the two year period then ended, and the financial highlights for each of the years in the five year period then ended, in conformity with U.S. generally accepted accounting principles.
Basis for Opinion
These financial statements and financial highlights are the responsibility of the Funds’ management. Our responsibility is to express an opinion on these financial statements and financial highlights based on our audits. We are a public accounting firm registered with the Public Company Accounting Oversight Board (United States) (PCAOB) and are required to be independent with respect to the Company in accordance with the U.S. federal securities laws and the applicable rules and regulations of the Securities and Exchange Commission and the PCAOB.
We conducted our audits in accordance with the standards of the PCAOB. Those standards require that we plan and perform the audit to obtain reasonable assurance about whether the financial statements and financial highlights are free of material misstatement, whether due to error or fraud. Our audits included performing procedures to assess the risks of material misstatement of the financial statements and financial highlights, whether due to error or fraud, and performing procedures that respond to those risks. Such procedures included examining, on a test basis, evidence regarding the amounts and disclosures in the financial statements and financial highlights. Such procedures also included confirmation of securities owned as of March 31, 2021, by correspondence with custodians and brokers. Our audits also included evaluating the accounting principles used and significant estimates made by management, as well as evaluating the overall presentation of the financial statements and financial highlights. We believe that our audits provide a reasonable basis for our opinion.
\s\KPMG LLP
We have served as the auditor of one or more Sit Mutual Funds investment companies since 1982.
Minneapolis, Minnesota
May 20, 2021
EXPENSE EXAMPLE (Unaudited)
As a shareholder of the Funds, you incur two types of costs: (1) transaction costs, including redemption fees and (2) ongoing costs, including management fees; and other Fund expenses. This Example is intended to help you understand your ongoing costs (in dollars) of investing in the Funds and to compare these costs with the ongoing costs of investing in other mutual funds.
The Example is based on an investment of $1,000 invested at the beginning of the period and held for the entire period October 1, 2020 to March 31, 2021.
Actual Expenses
The first line of the following table provides information about actual account values and actual expenses. You may use the information in this line, together with the amount you invested, to estimate the expenses that you paid over the period. Simply divide your account value by $1,000 (for example, an $8,600 account value divided by $1,000 = 8.6), then multiply the result by the number in the first line under the heading entitled “Expenses Paid During Period” to estimate the expenses you paid on your account during this period.
Hypothetical Example for Comparison Purposes
The second line of the table provides information about hypothetical account values and hypothetical expenses based on the Fund’s actual expense ratio and an assumed rate of return of 5% per year before expenses, which is not the Fund’s actual return. The hypothetical account values and expenses may not be used to estimate the actual ending account balance or expenses you paid for the period. You may use this information to compare the ongoing costs of investing in the Fund and other funds. To do so, compare this 5% hypothetical example with the 5% hypothetical examples that appear in the shareholder reports of the other funds.
Please note that the expenses shown in the table are meant to highlight your ongoing costs only and do not reflect any transactional costs, such as redemption fees. Therefore, the second line of the table is useful in comparing ongoing costs only, and will not help you determine the relative total costs of owning different funds. In addition, if these transactional costs (redemption fees) were included, your costs would have been higher.
| | | | | | | | | | | | | | | |
| | | Beginning
Account
Value
(10/1/20) | | Ending
Account
Value
(3/31/21) | | Expenses
Paid During
Period
(10/1/20-
3/31/21)* |
| U.S. Government Securities Fund |
Actual | | | | | | | | | | | | | | | |
Class S | | | | $1,000 | | | | | $997.80 | | | | | $3.98 | |
Class Y | | | | $1,000 | | | | | $999.20 | | | | | $2.74 | |
Hypothetical | | | | | | | | | | | | | | | |
Class S | | | | $1,000 | | | | | $1,020.94 | | | | | $4.03 | |
Class Y | | | | $1,000 | | | | | $1,022.19 | | | | | $2.77 | |
| Quality Income Fund |
Actual | | | | $1,000 | | | | | $1,011.70 | | | | | $4.51 | |
Hypothetical | | | | $1,000 | | | | | $1,020.44 | | | | | $4.53 | |
| Tax-Free Income Fund |
Actual | | | | $1,000 | | | | | $1,027.00 | | | | | $4.04 | �� |
Hypothetical | | | | $1,000 | | | | | $1,020.94 | | | | | $4.03 | |
| Minnesota Tax-Free Income Fund |
Actual | | | | $1,000 | | | | | $1,018.20 | | | | | $4.03 | |
Hypothetical | | | | $1,000 | | | | | $1,020.94 | | | | | $4.03 | |
*Expenses are equal to the Funds’ annualized expense ratio of 0.80% for the U.S. Government Securities, Class S, Tax-Free Income and Minnesota Tax-Free Funds; 0.55% for the U.S. Government Securities, Class Y; and 0.90% for the Quality Income Fund, multiplied by the average account value over the period, multiplied by 182/365 (to reflect the one-half year period.)
| | | | |
| | | | |
68 | | | SIT MUTUAL FUNDS ANNUAL REPORT | |
FEDERAL TAX INFORMATION (Unaudited)
Sit Bond Funds
For corporate shareholders, the percentage of investment income (dividend income and short-term gains, if any), for each of the Funds that qualify for the dividends-received deductions for the period of April 1, 2020 to March 31, 2021 is as follows:
| | | | | |
| Fund | | Percentage |
| |
U.S. Government Securities Fund | | | | 0.0 | % |
Quality Income Fund | | | | 0.0 | |
Tax-Free Income Fund | | | | 0.0 | |
Minnesota Tax-Free Income Fund | | | | 0.0 | |
For the year ended March 31, 2021, certain dividends paid by the Funds may be subject to a maximum tax rate of 15%, as provided by the Jobs and Growth Tax Relief Reconciliation Act of 2003. Of the distributions made by the following Funds, the corresponding percentages represent the amount of each distribution which may qualify for the 15% dividend income tax rate.
| | | | | |
| Fund | | Percentage |
| |
U.S. Government Securities Fund | | | | 0.0 | % |
Quality Income Fund | | | | 0.0 | |
Tax-Free Income Fund | | | | 0.0 | |
Minnesota Tax-Free Income Fund | | | | 0.0 | |
There were no funds that designated amounts as long-term capital gain dividends during the year ended March 31, 2021. Distributable long-term gains are based on net realized long term gains determined on a tax basis and may differ from such amounts for financial reporting purposes.
For the year ended March 31, 2021, 99.2% and 99.9% of dividends were derived from interest on tax-exempt securities for the Tax-Free Income Fund and Minnesota Tax-Free Income Fund, respectively. This portion of exempt-interest dividends is exempt from federal taxes and should not be included in shareholders’ gross income. Exempt-interest dividends may be subject to state and local taxes. Each shareholder should consult a tax adviser about reporting this income for state and local tax purposes.
INFORMATION ABOUT DIRECTORS AND OFFICERS (Unaudited)
The Sit Mutual Funds are a family of no-load mutual funds. The bond funds described in this Annual Report are the Sit U.S. Government Securities Fund, Sit Tax-Free Income Fund, Sit Minnesota Tax-Free Income Fund, and the Sit Quality Income Fund (the “Funds” or individually, a “Fund”). The Sit U.S. Government Securities Fund and the corporate issuer of the Sit Tax-Free Income Fund, Sit Minnesota Tax-Free Income Fund and Sit Quality Income Fund have a Board of Directors and officers. Pursuant to Minnesota law, the Boards of Directors are responsible for the management of the Funds and the establishment of the Funds’ policies. The officers of the Funds manage the day-to-day operation of the Funds. Information pertaining to the directors and officers of the Funds is set forth below. The business address, unless otherwise noted below, is that of the Funds’ investment adviser – 3300 IDS Center, 80 South Eighth Street, Minneapolis, Minnesota 55402. The Boards have a separate Audit Committee. The Bond Funds’ SAI has additional information about the Fund’s directors and is available without charge upon request by calling the Sit Funds at 800-332-5580.
| | | | | | | | |
Name, Age, and
Position with
the Funds | | Term of
Office (1)
and Length of Time
Served | | Principal Occupations During
Past Five Years | | Number of Funds
Overseen in
Fund Complex | | Other Directorships
Held by Director
During the Past
Five Years (3) |
INTERESTED DIRECTORS: | | | | | | |
Roger J. Sit (2) Age: 59 Chairman and President | | Chairman since 10/08;
Officer since 1998. | | Chairman, President, CEO and Global CIO of Sit Investment Associates, Inc. (the “Adviser”); Chairman and CEO of Sit Fixed Income Advisors II, LLC (“SF”); Chairman of SIA Securities Corp. (the “Distributor”). | | 14 | | TCF Financial Corporation. |
INDEPENDENT DIRECTORS: | | | | | | |
Edward M. Giles Age: 85 Director | | Director since 2012 or the Fund’s inception if later. | | Senior Vice President of Peter B. Cannell & Co., July 2011 to present. | | 14 | | None. |
Sidney L. Jones Age: 87 Director | | Director since 1993 or the Fund’s inception, if later: Director from 1988 to 1989. | | Lecturer, Washington Campus Consortium of 17 Universities. | | 14 | | None. |
Bruce C. Lueck Age: 80 Director | | Director since 2004 or the Fund’s inception, if later. | | Consultant for Zephyr Management, L.P. (investment management) from 2004 to 2017 and committee member of several investment funds and foundations. | | 14 | | None. |
Donald W. Phillips Age: 72 Director | | Director of the International Fund since 1993, and since 1990 or the Fund’s inception if later for all other Funds. | | Chairman and CEO of WP Global Partners Inc., July 2005 to present. | | 14 | | None. |
Barry N. Winslow Age: 73 Director | | Director since 2010 or the Fund’s inception if later. | | Board member, TCF Financial Corporation, July 2014 to July 2019. | | 14 | | TCF Financial Corporation. |
| | | | |
| | | | |
70 | | | SIT MUTUAL FUNDS ANNUAL REPORT | |
| | | | | | | | |
| | | | | |
Name, Age, and Position with the Funds | | Term of Office (1)
and Length of Time
Served | | Principal Occupations During
Past Five Years | | Number of Funds
Overseen in Fund Complex | | Other Directorships
Held by Director
During the Past
Five Years (3) |
OFFICERS: | | | | | | | | |
Mark H. Book Age: 57 Vice President – Investments | | Officer since 2002; Re-Elected by the Boards annually. | | Vice President and Portfolio Manager of SF. | | N/A | | N/A |
Kelly K. Boston Age: 52 Assistant Secretary & Assistant Treasurer | | Officer since 2000; Re-Elected by the Boards annually. | | Staff Attorney of the Adviser; Secretary of the Distributor. | | N/A | | N/A |
Bryce A. Doty Age: 54 Vice President - Investments | | Officer since 1996; Re-Elected by the Boards annually. | | Senior Vice President and Senior Portfolio Manager of SF. | | N/A | | N/A |
Paul J. Junquist Age: 59 Vice President - Investments | | Officer since 1996; Re-Elected by the Boards annually. | | Senior Vice President and Senior Portfolio Manager of SF. | | N/A | | N/A |
Paul E. Rasmussen Age: 60 Vice President, Secretary, Treasurer & Chief Compliance Officer | | Officer since 1994; Re-Elected by the Boards annually. | | Vice President, Secretary, Controller and Chief Compliance Officer of the Adviser; Vice President, Secretary, and Chief Compliance Officer of SF; President and Treasurer of the Distributor. | | N/A | | N/A |
Carla J. Rose Age: 54 Vice President, Assistant Secretary & Assistant Treasurer | | Officer since 2000; Re-Elected by the Boards annually. | | Vice President, Administration & Deputy Controller of the Adviser; Vice President, Controller, Treasurer & Assistant Secretary of SF; Vice President and Assistant Secretary of the Distributor. | | N/A | | N/A |
| 1 | Directors serve until their death, resignation, removal or the next shareholder meeting at which election of directors is an agenda item and a successor is duly elected and qualified. |
| 2 | Director who is deemed to be an “interested person” of the Funds as that term is defined by the Investment Company Act of 1940. Mr. Sit is considered an “interested person” because he is a director and shareholder of Sit Investment Associates, Inc., the Fund’s investment adviser. |
| 3 | Includes only directorships of companies required to report under the Securities Exchange Act of 1934 (i.e., public companies) or other investment companies registered under the 1940 Act. |
ADDITIONAL INFORMATION (Unaudited)
PROXY VOTING
A description of the policies and procedures that Sit Investment uses to vote proxies related to the Funds’ portfolio securities is set forth in the Funds’ Statement of Additional Information, which is available on the Funds’ website at www.sitfunds.com, without charge by calling 800-332-5580 and on the Securities and Exchange Commission’s (SEC) website at www.sec.gov. The Funds’ proxy voting record is available without charge by calling 800-332-5580 and on the SEC’s website at www.sec.gov no later than August 31 for the prior 12 months ending June.
QUARTERLY SCHEDULES OF INVESTMENTS
Each Fund files a complete schedule of investments with the SEC for the first and third quarters of each fiscal year on Form N-PORT. The Funds’ Form N-PORT is available on the SEC’s website at www.sec.gov. Each Fund’s complete schedule of investments, as filed on Form N-PORT, is also available on its website at www.sitfunds.com, or without charge by calling 800-332-5580.
STATEMENT REGARDING LIQUIDITY RISK MANAGEMENT PROGRAM
The Securities and Exchange Commission adopted Rule 22e-4 under the Investment Company Act of 1940, as amended (the “Liquidity Rule”) to promote effective liquidity risk management throughout the open-end investment company industry, thereby reducing the risk that funds will be unable to meet their redemption obligations and mitigating dilution of the interests of fund shareholders.
At their joint meeting held on October 19, 2020, the Boards of Directors (the “Boards”) of the Sit Mutual Funds (the “Funds”) reviewed the Funds’ liquidity risk management program (the “Program”) pursuant to the Liquidity Rule. Sit Investment Associates, Inc. (“SIA”), the investment adviser to the Funds, serves as the Program Administrator and provided the Boards with a report that addressed the operation of the Program and assessed its adequacy and effectiveness of implementation and any material changes to the Program as of September 30, 2020 (the “Report”).
The Report described its liquidity classification methodology and the determination that a Highly Liquid Investment Minimum is not currently necessary for any Fund. The Report also noted that the Program complied with the key factors for consideration under the Liquidity Rule for assessing, managing, and periodically reviewing liquidity risk, as follows:
A. Each Fund’s investment strategy and liquidity of investments during both normal and reasonably foreseeable stressed conditions: SIA reviewed each Fund’s strategy and the determinations that each strategy remains appropriate for an open-end fund. This determination was based on each Fund’s holding’s liquidity, diversification, and average position size.
B. Short-term and long-term cash flow projections during both normal and reasonably foreseeable stressed conditions: The Report indicated that it considered historical net redemption activity and shareholder ownership concentration and distribution channels to determine each Fund’s Reasonably Anticipated Trading Size. It was also noted that each Fund has adopted an in-kind redemption policy which may be utilized to meet large redemption requests.
C. Holdings of cash and cash equivalents, as well as borrowing arrangements: The report reviewed each Fund’s holdings of cash and cash equivalents, available borrowing arrangements if any, and other funding sources.
There were no material changes to the Program during the past year. The Report stated that SIA concluded that the Program is operating as intended and is effective in implementing the requirements of the Liquidity Rule.
| | | | |
| | | | |
72 | | | SIT MUTUAL FUNDS ANNUAL REPORT | |
RE-APPROVAL OF INVESTMENT MANAGEMENT AGREEMENTS
At their joint meeting held on October 19, 2020, the Boards of Directors of the Sit Mutual Funds unanimously approved the continuation for another one year period of the investment management agreements entered into by and between Sit Investment Associates, Inc. (“SIA”) and Sit Mutual Funds II, Inc. dated November 1, 1992; and Sit U.S. Government Securities Fund, Inc. dated November 1, 1992 (the “Agreements”).
The Boards approved the Agreements after a lengthy discussion and consideration of various factors relating to both the Boards’ selection of SIA as the investment adviser and the Boards’ approval of the fees to be paid under the Agreements.
Investment Adviser Criteria. The Directors began their analysis by discussing their criteria for determining the quality of an investment adviser. The Directors’ noted that their analysis is similar to that used by institutional investors in evaluating and selecting investment advisers. The Directors discussed several factors used to determine the overall quality of an investment adviser and the nature, extent and quality of the services performed by SIA, including the following:
Investment Philosophy and Process. The Directors considered SIA’s philosophy of managing assets. With respect to fixed income securities, SIA stresses the consistent attainment of superior risk-adjusted returns using a conservative investment management approach that identifies pricing anomalies in the market and management of portfolio duration.
With respect to fixed income securities, SIA seeks securities with a special emphasis on interest income and significant stability of principal value. SIA’s style seeks to avoid excessive return volatility and generate consistent results over an economic cycle. The Directors noted that the Bond Funds’ objectives are to seek high current income. The Directors reviewed the Bond Funds’ characteristics, and noted that SIA has consistently managed the Bond Funds in this style. The Directors noted that since the Bond Funds emphasize income, they may at times not rank highly in total return comparisons with other funds during certain periods.
The Directors discussed SIA’s consistent and well-defined investment process. With respect to fixed income securities, the portfolio managers are responsible for implementing the strategy set forth in SIA’s duration targets and interest rate projections.
Investment Professionals. The Directors discussed the experience, knowledge and organizational stability of SIA and its investment professionals. The Directors noted that SIA’s senior professionals are actively involved in the investment process and have significant investment industry experience.
The Directors discussed the depth of SIA’s investment staff. The Directors noted that SIA has over 30 investment professionals. Given the investment products offered by SIA and the assets under management, the Directors determined that SIA’s investment staff is well positioned to meet the current needs of its clients, including the Funds, and to accommodate growth in the number of clients and assets under management for the near future. The Directors concluded that the depth of the investment staff, and in particular senior management and investment analysts, is actually greater than the Funds currently require at their present asset size. The Directors noted that SIA has the resources of a $14.9 billion dollar investment firm working for the benefit of the Fund shareholders.
Investment Performance. The Directors reviewed and discussed the Funds’ investment performance on an absolute and comparable basis for various periods as discussed below. The Directors noted that the investment performance of the Funds has generally been competitive with indices and other funds with similar investment styles as the Funds, such as fixed income funds seeking to maximize income.
Corporate Culture. The Directors discussed SIA’s corporate values to operate under the highest ethical and professional standards. SIA’s culture is set and practiced by senior management who insist that all professionals exhibit honesty and integrity. The Board noted that the firm’s values are evident in all of the services provided to the Funds.
Review of Specific Factors. The Directors continued their analysis by reviewing specific information on SIA and the Funds and specific terms of the Agreements, including the following.
ADDITIONAL INFORMATION (Unaudited) (Continued)
Investment Performance. The Directors reviewed investment performance of each Fund for 1 month, 3 months, 6 months, year-to-date, 1 year, 5 years (as applicable), 10 years (as applicable) and since inception, both on an absolute basis and on a comparative basis to indices and mutual funds within the same investment categories. As noted above, the Directors concluded that the investment performance of the Funds has been competitive in relation to their stated objectives and strategies on a comparable basis with funds with similar objectives and strategies.
Fees and Expenses. The Directors noted that the Funds pay SIA a monthly fee and SIA is responsible for all of the Funds’ expenses except interest, brokerage commissions and transaction charges and certain extraordinary expenses. With respect to Sit U.S. Government Securities Fund, SIA’s obligation to bear all the Fund’s expenses (except for supervisory and administrative fees paid to SIA, interest, brokerage commissions and transaction charges and certain extraordinary expenses) is set forth in a separate Supervision and Administration Agreement approved by the Directors. The Directors reviewed fees paid in prior years and the fees to be paid under the Agreements.
The Directors compared each Fund’s expense ratio to the average and median expense ratios of no-load mutual funds within the same Morningstar, Inc. investment category, the average expense ratios for load funds within the Morningstar category, and the average expense ratios for all funds within the Morningstar category. Certain of the Fund’s expense ratios were higher than the averages, and certain of the Fund’s expense ratios were lower than the averages. The Directors noted that the Morningstar no-load categories include funds of various asset sizes, some of which are significantly larger in assets than the Funds. The Directors found that each Fund’s total expense ratio to be within an acceptable range compared to the total expense ratios of other no-load funds within the Fund’s Morningstar category. The Directors concluded that the fees paid by the Funds are reasonable and appropriate.
The Directors reviewed the extent to which the fees to be paid under the Agreements by each Fund may be affected by an increase in the Fund’s assets, which included reviewing each Fund’s current and historical assets and the likelihood and magnitude of future increases in the Fund’s assets. The Directors agreed that it is appropriate that the Funds benefit from improved economies of scale as the Funds’ assets increase. However, the Directors concluded that given the amount of the Funds’ current assets and the likelihood and magnitude of future increases in the Funds’ assets, negotiating a graduated fee structure is unnecessary at this time since the fees to be paid under the current Agreements are reasonable and appropriate.
The Directors reviewed the expenses paid by SIA relating to the operations of the Funds, and SIA’s income with respect to the management of the Funds for the past two calendar years. The Directors concluded that the expenses paid were appropriate.
The Directors reviewed SIA’s investment advisory fee schedule for investment management services provided to other clients. The Directors compared the services provided to the Funds and other clients of SIA, and recognized that the Funds’ expenses are borne by SIA. The Directors concluded that the fees paid by the Funds in relation to the fees paid by other SIA clients were appropriate and reasonable. The Directors also concluded that SIA’s profit margin with respect to the management of the Funds was appropriate.
The Directors discussed the extent to which SIA receives benefits from the relationship with the Funds such as soft dollar arrangements by which brokers provide research services to SIA as a result of brokerage generated by the Funds. The Board concluded that any benefits SIA receives from its relationship with the Funds are well within industry norms and are reflected in the amount of the fees paid by the Funds to SIA and are appropriate and reasonable.
Non-Advisory Services. The Directors considered the quality of non-advisory services which SIA provides to the Funds (and their shareholders) and the quality and depth of SIA’s non-investment personnel who provide such services. Directors concluded that the level of such services and the quality and depth of such personnel are consistent with industry standards.
Finally, the Directors considered the compliance staff and the regulatory history of SIA and the Funds, and concluded that both are consistent with industry standards.
Based on these conclusions, without any single conclusion being dispositive, the Directors determined that renewal of the Agreements was in the interest of each Fund and its shareholders.
| | | | |
| | | | |
74 | | | SIT MUTUAL FUNDS ANNUAL REPORT | |
[This page intentionally left blank.]
[This page intentionally left blank.]

The registrant has adopted a code of ethics that applies to the registrant’s principal executive officer, principal financial officer, principal accounting officer, and persons performing similar functions. The registrant has not made any amendment to its code of ethics during the period covered by this report which must be described herein pursuant to Item 2. The registrant has not granted any waivers from any provisions of the code of ethics during the period covered by this report.
A copy of the registrant’s code of ethics is available without charge upon request by calling the registrant at 612-332-3223 or 1-800-332-5580, or by mail at Sit Mutual Funds, 3300 IDS Center, 80 South Eighth Street, Minneapolis, MN 55402.
| Item 3: | Audit Committee Financial Expert. |
The registrant’s Board of Directors has determined that Mr. Edward M. Giles, Mr. Sidney L. Jones, Mr. Bruce C. Lueck, Mr. Donald W. Phillips, and Mr. Barry N. Winslow are audit committee financial experts serving on its audit committee. Mr. Giles, Mr. Jones, Mr. Lueck, Mr. Phillips, and Mr. Winslow are independent for purposes of this item.
| Item 4: | Principal Accountant Fees and Services. |
(a) – (d) Aggregate fees billed to the registrant for the last two fiscal years for professional services rendered by the registrant’s principal accountant were as follows:
| | | | | | | | | | | | | | | | | | | | | | | | | | | | | | | | |
| | | 2021 | | | 2020 | |
| | | Audit | | | Audit | | | Tax | | | Other | | | Audit | | | Audit | | | Tax | | | Other | |
| | | Fees | | | Related | | | Fees | | | Fees | | | Fees | | | Related | | | Fees | | | Fees | |
Fiscal year ended March 31 | | | | | | | | | | | | | | | | | | | | | | | | | | | | | | | | |
Sit Mutual Funds II, Inc. | | | | | | | | | | | | | | | | | | | | | | | | | | | | | | | | |
Sit Tax-Free Income Fund (series A) | | $ | 34,000 | | | $ | 0 | | | $ | 5,875 | | | $ | 0 | | | $ | 33,000 | | | $ | 0 | | | $ | 5,650 | | | $ | 0 | |
Sit Minnesota Tax-Free Income Fund (series B) | | $ | 32,800 | | | $ | 0 | | | $ | 5,875 | | | $ | 0 | | | $ | 31,800 | | | $ | 0 | | | $ | 5,650 | | | $ | 0 | |
Sit Quality Income Fund (Series E) | | $ | 20,100 | | | $ | 0 | | | $ | 5,875 | | | $ | 0 | | | $ | 19,500 | | | $ | 0 | | | $ | 5,650 | | | $ | 0 | |
| | | | | | | | | | | | | | | | | | | | | | | | | | | | | | | | |
Total Mutual Funds II, Inc. | | $ | 86,900 | | | $ | 0 | | | $ | 17,625 | | | $ | 0 | | | $ | 84,300 | | | $ | 0 | | | $ | 16,950 | | | $ | 0 | |
Audit fees include amounts related to the audit of the registrant’s annual financial statements and services normally provided by the accountant in connection with statutory and regulatory filings. Audit-related fees include amounts reasonably related to the performance of the audit of the registrant’s financial statements, and/or are traditionally performed by the auditor. Tax fees include amounts related to tax compliance, tax planning, and tax advice.
(e) (1) The Audit Committee is required to pre-approve audit and non-audit services performed for the registrant by the independent auditor in order to assure that the provision of such services does not impair the auditor’s independence. The audit committee also is required to pre-approve certain non-audit services performed by the registrant’s independent auditor for the registrant’s investment adviser and certain of the adviser’s affiliates if the services relate directly to the operations and financial reporting of the registrant. Services to be provided by the auditor must receive general pre-approval or specific pre-approval by the audit committee. Any proposed services exceeding pre-approved cost levels will require separate pre-approval by the audit committee.
The audit committee may delegate pre-approval authority to the audit committee chairman. The chairman shall report any pre-approval decisions to the audit committee at its next scheduled meeting. The audit committee does not delegate its responsibility to pre-approve services performed by the independent auditor to management.
(2) No services included in (b) – (d) were approved pursuant to paragraph (c)(7)(i)(C) of Rule 2-01 of Regulation S-X.
(f) Not applicable.
(g) The aggregate fees billed for the most recent fiscal year and the preceding fiscal year by the registrant’s principal accountant for non-audit services rendered to the registrant, its investment adviser, and any entity controlling, controlled by, or under common control with the investment adviser that provides ongoing services to the registrant were $0 and $0 respectively.
(h) The registrant’s audit committee has determined that the provision of non-audit services rendered to the registrant’s investment adviser, and any entity controlling, controlled by, or under common control with the investment adviser that provides ongoing services to the registrant, that were not pre-approved pursuant to paragraph (c)(7)(ii) of Rule 2-01 of Regulation S-X is considered compatible with maintaining the principal accountant’s independence.
| Item 5: | Audit Committee of Listed Registrants. |
Not applicable to open-end investment companies.
| Item 6: | Schedule of Investments. |
The schedule of investments is included as part of the report to shareholders filed under Item 1 of this Form.
| Item 7: | Disclosure of Proxy Voting Policies and Procedures for Closed-End Management Investment Companies. |
Not applicable to open-end investment companies.
| Item 8: | Portfolio Managers of Closed-End Management Investments Companies. |
Not applicable to open-end investment companies.
| Item 9: | Purchases of Equity Securities by Closed-End Management Investment Company and Affiliated Purchasers. |
Not applicable to open-end investment companies.
| Item 10. | Submission of Matters to a vote of Security Holders. |
There have been no material changes to the procedures by which shareholders may recommend nominees to the registrant’s board of directors.
| Item 11: | Controls and Procedures - |
(a) Based on their evaluation of the Registrant’s Disclosure Controls and Procedures as of a date within 90 days of the Filing Date, the Registrant’s Chairman and Treasurer have determined that the Disclosure Controls and Procedures (as defined in Rule 30a-2(c) under the Act) are designed to ensure that information required to be disclosed by the Registrant is recorded, processed, summarized and reported by the filing Date, and that information required to be disclosed in the report is communicated to the Registrant’s management, as appropriate, to allow timely decisions regarding required disclosure.
(b) There were no significant changes in the Registrant’s internal controls or in other factors that could significantly affect these controls subsequent to the date of their evaluation, and there were no corrective actions with regard to significant deficiencies and material weaknesses.
(a) The following exhibits are attached to this Form N-CSR:
(2) A separate certification for each principal executive and principal financial officer of the registrant as required by Rule 30a-2(a) under the Act (17 CFR 270.30a-2)(certification required by Section 302 of the Sarbanes-Oxley Act of 2002).
(b) Certification required by Rule 30a-2(b) under the Act (certification required by Section 906 of the Sarbanes-Oxley Act of 2002).
SIGNATURES
Pursuant to the requirements of the Securities Exchange Act of 1934 and the Investment Company Act of 1940, the registrant has duly caused this report to be signed on its behalf by the undersigned, thereunto duly authorized.
| | | | |
| Sit Mutual Funds II, Inc. | | | | |
| | |
| By (Signature and Title) | | | | /s/ Paul E. Rasmussen |
| | | | Paul E. Rasmussen |
| | | | Vice President, Treasurer |
Date May 27, 2021
Pursuant to the requirements of the Securities Exchange Act of 1934 and the Investment Company Act of 1940, this report has been signed below by the following persons on behalf of the registrant and in the capacities and on the dates indicated.
| | | | |
| By (Signature and Title) | | | | /s/ Paul E. Rasmussen |
| | | | Paul E. Rasmussen |
| | | | Vice President, Treasurer |
Date May 27, 2021
| | | | |
| By (Signature and Title) | | | | /s/ Roger J. Sit |
| | | | Roger J. Sit |
| | | | Chairman |
Date May 27, 2021