UNITED STATES
SECURITIES AND EXCHANGE COMMISSION
Washington, D.C. 20549
Form N-CSR
CERTIFIED SHAREHOLDER REPORT OF REGISTERED
MANAGEMENT INVESTMENT COMPANIES
Investment Company Act File Number: 811-02258
Eaton Vance Series Trust II
(Exact Name of Registrant as Specified in Charter)
Two International Place, Boston, Massachusetts 02110
(Address of Principal Executive Offices)
Maureen A. Gemma
Two International Place, Boston, Massachusetts 02110
(Name and Address of Agent for Services)
(617) 482-8260
(Registrant’s Telephone Number)
October 31
Date of Fiscal Year End
October 31, 2014
Date of Reporting Period
Item 1. Reports to Stockholders

Eaton Vance
Income Fund of Boston
Annual Report
October 31, 2014

Commodity Futures Trading Commission Registration. Effective December 31, 2012, the Commodity Futures Trading Commission (“CFTC”) adopted certain regulatory changes that subject registered investment companies and advisers to regulation by the CFTC if a fund invests more than a prescribed level of its assets in certain CFTC-regulated instruments (including futures, certain options and swap agreements) or markets itself as providing investment exposure to such instruments. The Fund has claimed an exclusion from the definition of the term “commodity pool operator” under the Commodity Exchange Act. Accordingly, neither the Fund nor the adviser with respect to the operation of the Fund is subject to CFTC regulation. Because of its management of other strategies, the Fund’s adviser is registered with the CFTC as a commodity pool operator and a commodity trading advisor.
Fund shares are not insured by the FDIC and are not deposits or other obligations of, or guaranteed by, any depository institution. Shares are subject to investment risks, including possible loss of principal invested.
This report must be preceded or accompanied by a current summary prospectus or prospectus. Before investing, investors should consider carefully the investment objective, risks, and charges and expenses of a mutual fund. This and other important information is contained in the summary prospectus and prospectus, which can be obtained from a financial advisor. Prospective investors should read the prospectus carefully before investing. For further information, please call 1-800-262-1122.
Annual Report October 31, 2014
Eaton Vance
Income Fund of Boston
Table of Contents
| | | | |
Management’s Discussion of Fund Performance | | | 2 | |
| |
Performance | | | 3 | |
| |
Fund Profile | | | 4 | |
| |
Endnotes and Additional Disclosures | | | 5 | |
| |
Fund Expenses | | | 6 | |
| |
Financial Statements | | | 7 | |
| |
Report of Independent Registered Public Accounting Firm | | | 20 and 45 | |
| |
Federal Tax Information | | | 21 | |
| |
Special Meeting of Shareholders | | | 46 | |
| |
Management and Organization | | | 47 | |
| |
Important Notices | | | 50 | |
Eaton Vance
Income Fund of Boston
October 31, 2014
Management’s Discussion of Fund Performance1
Economic and Market Conditions
The U.S. high-yield bond market posted positive returns for the 12-month period ended October 31, 2014, buoyed by favorable economic conditions and continued low interest rates. Volatility, however, increased in the last four months of the period. Although corporate financial fundamentals remained healthy, headlines that were critical of the high-yield market shook investors in late June and July, triggering outflows from the asset class. These outflows caused yields — which were near an all-time low in mid-June — to climb and high-yield bond prices to fall. The backdrop of healthy corporate fundamentals, coupled with light new debt issuance in August and higher overall yields, helped the high-yield market to rally back in the final weeks of the summer. In the fall, however, mounting worries over Ebola and slowing economic growth in Europe, caused yields to begin climbing again until reaching their peaks in mid-October, at which point demand returned strongly, driving yields back down and bond prices up.
Overall economic growth for the period was modest. Growth was strong enough to support high-yield companies without being so strong that it stoked fears of imminent interest rate increases. Many issuers benefited from positive earnings growth, improving balance sheets and interest expense coverage near all-time highs. The supply/demand conditions for high-yield bonds remained favorable on-the-whole, as continued low interest rates, including declining Treasury yields, helped attract investors. Leverage (or debt) metrics stayed relatively constant and, excluding a single issuer default, the default rate on high-yield bonds remained below 2%, versus its historical average of 4%.
Fund Performance
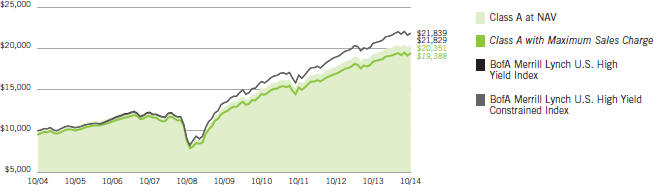
For the fiscal year ended October 31, 2014, Eaton Vance Income Fund of Boston (the Fund) Class A shares at net asset value (NAV) had a total return of 5.34%, compared to the 5.85% gain of its primary benchmark, the BofA Merrill Lynch U.S. High Yield Index2 (the Index).
From a sector perspective, a sizable underweight in banks & thrifts hindered relative performance versus the Index, as this was one of the top-performing sectors in the Index. Easing regulatory overhangs and moderating loan loss reserves helped drive strong gains in the group during the period. By contrast, credit selection in the metals/mining and energy sectors
aided relative performance versus the Index. In the former, the Fund benefited from largely avoiding coal bonds, which performed poorly. The Fund’s underweight in iron ore also aided performance, as the slowing global economy coupled with significant supply additions pressured ore pricing. In energy, the Fund’s bias toward high-growth exploration and production companies focused on natural gas and its avoidance of offshore drillers boosted results relative to the Index. The Fund also gained performance versus the Index in cable/satellite television, gaming and health care, largely because of positive security selection.
During the 12-month period, bonds with longer durations7, or more sensitivity to interest rate changes, outpaced shorter-duration issues. The Fund’s sizable overweight in bonds with durations between zero and two years and underweight in bonds with five- to 10-year durations hampered relative performance versus the Index. However, this was more than offset by strong credit selection, particularly among bonds with two- to five-year durations — which represented nearly 40% of assets — and those with five- to 10-year durations.
Within the Index, higher-quality issues, led by BB-rated bonds6, posted some of the strongest returns, outperforming lower-quality issues. Most of the gains for higher-quality issues came in the last four months of the period as volatility increased. Overall, the Fund’s credit quality allocations had little impact on relative performance versus the Index, although a small cash position and an underweight in the BB-rated segment modestly detracted. The Fund gained performance, however, from credit selection in the CCC-rated segment, where a bias toward higher-coupon, shorter-duration, lower-yielding CCC-rated paper helped drive outperformance as volatility increased. Credit selection in the B-rated category, which represented the Fund’s biggest weighting and on average over 37% of assets during the period, also contributed.
See Endnotes and Additional Disclosures in this report.
Past performance is no guarantee of future results. Returns are historical and are calculated by determining the percentage change in net asset value (NAV) or offering price (as applicable) with all distributions reinvested. Investment return and principal value will fluctuate so that shares, when redeemed, may be worth more or less than their original cost. Performance less than one year is cumulative. Performance is for the stated time period only; due to market volatility, the Fund’s current performance may be lower or higher than quoted. Returns are before taxes unless otherwise noted. For performance as of the most recent month-end, please refer to eatonvance.com.
Eaton Vance
Income Fund of Boston
October 31, 2014
Performance2,3
Portfolio Managers Michael W. Weilheimer, CFA and Stephen C. Concannon, CFA
| | | | | | | | | | | | | | | | | | | | | | | | |
| % Average Annual Total Returns | | | | | Class Inception Date | | | Performance Inception Date | | | One Year | | | Five Years | | | Ten Years | |
Class A at NAV | | | | | | | 06/15/1972 | | | | 06/15/1972 | | | | 5.34 | % | | | 9.63 | % | | | 7.36 | % |
Class A with 4.75% Maximum Sales Charge | | | | | | | — | | | | — | | | | 0.37 | | | | 8.57 | | | | 6.84 | |
Class B at NAV | | | | | | | 06/20/2002 | | | | 06/15/1972 | | | | 4.40 | | | | 8.84 | | | | 6.56 | |
Class B with 5% Maximum Sales Charge | | | | | | | — | | | | — | | | | –0.56 | | | | 8.55 | | | | 6.56 | |
Class C at NAV | | | | | | | 06/21/2002 | | | | 06/15/1972 | | | | 4.57 | | | | 8.87 | | | | 6.57 | |
Class C with 1% Maximum Sales Charge | | | | | | | — | | | | — | | | | 3.57 | | | | 8.87 | | | | 6.57 | |
Class I at NAV | | | | | | | 07/01/1999 | | | | 06/15/1972 | | | | 5.42 | | | | 9.90 | | | | 7.63 | |
Class R at NAV | | | | | | | 01/05/2004 | | | | 06/15/1972 | | | | 5.08 | | | | 9.36 | | | | 7.09 | |
Class R6 at NAV | | | | | | | 07/01/2014 | | | | 06/15/1972 | | | | 5.43 | | | | 9.90 | | | | 7.63 | |
BofA Merrill Lynch U.S. High Yield Index | | | | | | | — | | | | — | | | | 5.85 | % | | | 10.25 | % | | | 8.11 | % |
BofA Merrill Lynch U.S. High Yield Constrained Index | | | | | | | — | | | | — | | | | 5.85 | | | | 10.22 | | | | 8.12 | |
| | | | | | |
| | | | | | | | | | | | | | | | | | | | | | | | |
| % Total Annual Operating Expense Ratios4 | | Class A | | | Class B | | | Class C | | | Class I | | | Class R | | | Class R6 | |
| | | 1.00 | % | | | 1.75 | % | | | 1.75 | % | | | 0.75 | % | | | 1.25 | % | | | 0.67 | % |
Growth of $10,000
This graph shows the change in value of a hypothetical investment of $10,000 in Class A of the Fund for the period indicated. For comparison, the same investment is shown in the indicated index.
| | | | | | | | | | | | | | | | |
| Growth of Investment | | Amount Invested | | | Period Beginning | | | At NAV | | | With Maximum Sales Charge | |
Class B | | $ | 10,000 | | | | 10/31/2004 | | | $ | 18,881 | | | | N.A. | |
Class C | | $ | 10,000 | | | | 10/31/2004 | | | $ | 18,895 | | | | N.A. | |
Class I | | $ | 250,000 | | | | 10/31/2004 | | | $ | 521,674 | | | | N.A. | |
Class R | | $ | 10,000 | | | | 10/31/2004 | | | $ | 19,836 | | | | N.A. | |
Class R6 | | $ | 1,000,000 | | | | 10/31/2004 | | | $ | 2,086,899 | | | | N.A. | |
See Endnotes and Additional Disclosures in this report.
Past performance is no guarantee of future results. Returns are historical and are calculated by determining the percentage change in net asset value (NAV) or offering price (as applicable) with all distributions reinvested. Investment return and principal value will fluctuate so that shares, when redeemed, may be worth more or less than their original cost. Performance less than one year is cumulative. Performance is for the stated time period only; due to market volatility, the Fund’s current performance may be lower or higher than quoted. Returns are before taxes unless otherwise noted. For performance as of the most recent month-end, please refer to eatonvance.com.
Eaton Vance
Income Fund of Boston
October 31, 2014
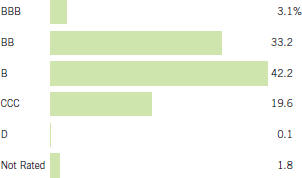
Fund Profile5
Credit Quality (% of bond holdings)6
See Endnotes and Additional Disclosures in this report.
Eaton Vance
Income Fund of Boston
October 31, 2014
Endnotes and Additional Disclosures
| 1 | The views expressed in this report are those of the portfolio manager(s) and are current only through the date stated at the top of this page. These views are subject to change at any time based upon market or other conditions, and Eaton Vance and the Fund(s) disclaim any responsibility to update such views. These views may not be relied upon as investment advice and, because investment decisions are based on many factors, may not be relied upon as an indication of trading intent on behalf of any Eaton Vance fund. This commentary may contain statements that are not historical facts, referred to as “forward looking statements”. The Fund’s actual future results may differ significantly from those stated in any forward looking statement, depending on factors such as changes in securities or financial markets or general economic conditions, the volume of sales and purchases of Fund shares, the continuation of investment advisory, administrative and service contracts, and other risks discussed from time to time in the Fund’s filings with the Securities and Exchange Commission. |
| 2 | BofA Merrill Lynch U.S. High Yield Index is an unmanaged index of below-investment grade U.S. corporate bonds. BofA Merrill Lynch U.S. High Yield Constrained Index is an unmanaged index of below-investment grade U.S. corporate bonds, with issuer exposure capped at 2%. BofA Merrill Lynch® indices not for redistribution or other uses; provided “as is”, without warranties, and with no liability. Eaton Vance has prepared this report, BofAML does not endorse it, or guarantee, review, or endorse Eaton Vance’s products. Unless otherwise stated, index returns do not reflect the effect of any applicable sales charges, commissions, expenses, taxes or leverage, as applicable. It is not possible to invest directly in an index. |
| 3 | Total Returns at NAV do not include applicable sales charges. If sales charges were deducted, the returns would be lower. Total Returns shown with maximum sales charge reflect the stated maximum sales charge. Unless otherwise stated, performance does not reflect the deduction of taxes on Fund distributions or redemptions of Fund shares. |
| | Performance prior to the inception date of a class may be linked to the performance of an older class of the Fund. This linked performance is adjusted for any applicable sales charge, but is not adjusted for class expense differences. If adjusted for such differences, the performance would be different. Performance presented in the financial highlights included in the financial statements is not linked. In the performance table, the performance of Class R6 is linked to Class I. Performance since inception for an index, if presented, is the performance since the Fund’s or oldest share class’ inception, as applicable. |
| 4 | Source: Fund prospectus. |
| 5 | Fund invests in an affiliated investment company (Portfolio) with the same objective(s) and policies as the Fund. References to investments are to the Portfolio’s holdings. |
| 6 | Ratings are based on Moody’s, S&P or Fitch, as applicable. If securities are rated differently by the ratings agencies, the higher rating is applied. Ratings, which are subject to change, apply to the creditworthiness of the issuers of the underlying securities and not to the Fund or its shares. Credit ratings measure the quality of a bond based on the issuer’s creditworthiness, with ratings ranging from AAA, being the highest, to D, being the lowest based on S&P’s measures. Ratings of BBB or higher by S&P or Fitch (Baa or higher by Moody’s) are considered to be investment- grade quality. Credit ratings are based largely on the ratings agency’s analysis at the time of rating. The rating assigned to any particular security is not necessarily a reflection of the issuer’s current financial condition and does not necessarily reflect its assessment of the volatility of a security’s market value or of the liquidity of an investment in the security. Holdings designated as “Not Rated” are not rated by the national ratings agencies stated above. |
| 7 | Duration is a measure of the expected change in price of a bond — in percentage terms — given a one percent change in interest rates, all else being constant. Securities with lower durations tend to be less sensitive to interest-rate changes. |
| | Fund profile subject to change due to active management. |
Eaton Vance
Income Fund of Boston
October 31, 2014
Fund Expenses
Example: As a Fund shareholder, you incur two types of costs: (1) transaction costs, including sales charges (loads) on purchases and redemption fees (if applicable); and (2) ongoing costs, including management fees; distribution and/or service fees; and other Fund expenses. This Example is intended to help you understand your ongoing costs (in dollars) of Fund investing and to compare these costs with the ongoing costs of investing in other mutual funds. The Example is based on an investment of $1,000 invested at the beginning of the period and held for the entire period (May 1, 2014 – October 31, 2014) for Class A, Class C, Class I and Class R and (July 1, 2014 – October 31, 2014) for Class R6. The hypothetical expense Example is based on an investment of $1,000 invested for the one-half year period (May 1, 2014 – October 31, 2014).
Actual Expenses: The first section of the table below provides information about actual account values and actual expenses. You may use the information in this section, together with the amount you invested, to estimate the expenses that you paid over the period. Simply divide your account value by $1,000 (for example, an $8,600 account value divided by $1,000 = 8.6), then multiply the result by the number in the first section under the heading entitled “Expenses Paid During Period” to estimate the expenses you paid on your account during this period.
Hypothetical Example for Comparison Purposes: The second section of the table below provides information about hypothetical account values and hypothetical expenses based on the actual Fund expense ratio and an assumed rate of return of 5% per year (before expenses), which is not the actual Fund return. The hypothetical account values and expenses may not be used to estimate the actual ending account balance or expenses you paid for the period. You may use this information to compare the ongoing costs of investing in your Fund and other funds. To do so, compare this 5% hypothetical example with the 5% hypothetical examples that appear in the shareholder reports of the other funds.
Please note that the expenses shown in the table are meant to highlight your ongoing costs only and do not reflect any transactional costs, such as sales charges (loads) or redemption fees (if applicable). Therefore, the second section of the table is useful in comparing ongoing costs only, and will not help you determine the relative total costs of owning different funds. In addition, if these transactional costs were included, your costs would be higher.
| | | | | | | | | | | | | | | | |
| | | Beginning
Account Value
(5/1/14) | | | Ending
Account Value
(10/31/14) | | | Expenses Paid
During Period
(5/1/14 – 10/31/14) | | | Annualized
Expense
Ratio | |
| | | | |
| | | | | | | | | | | | | | | | |
Actual* | | | | | | | | | | | | | |
Class A | | $ | 1,000.00 | | | $ | 1,013.00 | | | $ | 5.18 | | | | 1.02 | % |
Class B | | $ | 1,000.00 | | | $ | 1,009.30 | | | $ | 8.96 | | | | 1.77 | % |
Class C | | $ | 1,000.00 | | | $ | 1,009.30 | | | $ | 8.91 | | | | 1.76 | % |
Class I | | $ | 1,000.00 | | | $ | 1,014.30 | | | $ | 3.86 | | | | 0.76 | % |
Class R | | $ | 1,000.00 | | | $ | 1,011.80 | | | $ | 6.39 | | | | 1.26 | % |
Class R6 | | $ | 1,000.00 | | | $ | 997.70 | | | $ | 2.32 | | | | 0.69 | % |
| | | | | | | | | | | | | | | | | |
| | | | |
| | | | | | | | | | | | | | | | |
Hypothetical** | | | | | | | | | | | | | |
(5% return per year before expenses) | | | | | | | | | | | | | |
Class A | | $ | 1,000.00 | | | $ | 1,020.10 | | | $ | 5.19 | | | | 1.02 | % |
Class B | | $ | 1,000.00 | | | $ | 1,016.30 | | | $ | 9.00 | | | | 1.77 | % |
Class C | | $ | 1,000.00 | | | $ | 1,016.30 | | | $ | 8.94 | | | | 1.76 | % |
Class I | | $ | 1,000.00 | | | $ | 1,021.40 | | | $ | 3.87 | | | | 0.76 | % |
Class R | | $ | 1,000.00 | | | $ | 1,018.90 | | | $ | 6.41 | | | | 1.26 | % |
Class R6 | | $ | 1,000.00 | | | $ | 1,014.50 | | | $ | 2.34 | | | | 0.69 | % |
| * | Class R6 had not commenced operations on May 1, 2014. Actual expenses are equal to the Fund’s annualized expense ratio for the indicated Class, multiplied by the average account value over the period, multiplied by 184/365 (to reflect the one-half year period); 123/365 for Class R6 (to reflect the period from the commencement of operations on July 1, 2014 to October 31, 2014). The Example assumes that the $1,000 was invested at the net asset value per share determined at the close of business on April 30, 2014 (July 1, 2014 for Class R6). The Example reflects the expenses of both the Fund and the Portfolio. |
| ** | Hypothetical expenses are equal to the Fund’s annualized expense ratio for the indicated Class, multiplied by the average account value over the period, multiplied by 184/365 (to reflect the one-half year period). The Example assumes that the $1,000 was invested at the net asset value per share determined at the close of business on April 30, 2014 (July 1, 2014 for Class R6). The Example reflects the expenses of both the Fund and the Portfolio. |
Eaton Vance
Income Fund of Boston
October 31, 2014
Statement of Assets and Liabilities
| | | | |
| Assets | | October 31, 2014 | |
Investment in Boston Income Portfolio, at value (identified cost, $4,691,240,664) | | $ | 4,828,009,140 | |
Receivable for Fund shares sold | | | 16,569,137 | |
Total assets | | $ | 4,844,578,277 | |
|
| Liabilities | |
Payable for Fund shares redeemed | | $ | 20,599,482 | |
Distributions payable | | | 1,800,348 | |
Payable to affiliates: | | | | |
Distribution and service fees | | | 623,201 | |
Trustees’ fees | | | 42 | |
Accrued expenses | | | 1,377,098 | |
Total liabilities | | $ | 24,400,171 | |
Net Assets | | $ | 4,820,178,106 | |
|
| Sources of Net Assets | |
Paid-in capital | | $ | 4,755,350,119 | |
Accumulated net realized loss from Portfolio | | | (65,943,800 | ) |
Accumulated distributions in excess of net investment income | | | (5,996,689 | ) |
Net unrealized appreciation from Portfolio | | | 136,768,476 | |
Total | | $ | 4,820,178,106 | |
|
| Class A Shares | |
Net Assets | | $ | 1,551,837,543 | |
Shares Outstanding | | | 257,750,695 | |
Net Asset Value and Redemption Price Per Share | | | | |
(net assets ÷ shares of beneficial interest outstanding) | | $ | 6.02 | |
Maximum Offering Price Per Share | | | | |
(100 ÷ 95.25 of net asset value per share) | | $ | 6.32 | |
|
| Class B Shares | |
Net Assets | | $ | 30,328,925 | |
Shares Outstanding | | | 5,036,574 | |
Net Asset Value and Offering Price Per Share* | | | | |
(net assets ÷ shares of beneficial interest outstanding) | | $ | 6.02 | |
|
| Class C Shares | |
Net Assets | | $ | 295,435,792 | |
Shares Outstanding | | | 49,026,629 | |
Net Asset Value and Offering Price Per Share* | | | | |
(net assets ÷ shares of beneficial interest outstanding) | | $ | 6.03 | |
|
| Class I Shares | |
Net Assets | | $ | 2,903,827,314 | |
Shares Outstanding | | | 482,139,123 | |
Net Asset Value, Offering Price and Redemption Price Per Share | | | | |
(net assets ÷ shares of beneficial interest outstanding) | | $ | 6.02 | |
|
| Class R Shares | |
Net Assets | | $ | 37,575,495 | |
Shares Outstanding | | | 6,241,364 | |
Net Asset Value, Offering Price and Redemption Price Per Share | | | | |
(net assets ÷ shares of beneficial interest outstanding) | | $ | 6.02 | |
|
| Class R6 Shares | |
Net Assets | | $ | 1,173,037 | |
Shares Outstanding | | | 194,719 | |
Net Asset Value, Offering Price and Redemption Price Per Share | | | | |
(net assets ÷ shares of beneficial interest outstanding) | | $ | 6.02 | |
On sales of $50,000 or more, the offering price of Class A shares is reduced.
| * | Redemption price per share is equal to the net asset value less any applicable contingent deferred sales charge. |
| | | | |
| | 7 | | See Notes to Financial Statements. |
Eaton Vance
Income Fund of Boston
October 31, 2014
Statement of Operations
| | | | |
| Investment Income | | Year Ended October 31, 2014 | |
Interest and other income allocated from Portfolio (net of foreign taxes, $3,539) | | $ | 301,088,508 | |
Dividends allocated from Portfolio | | | 2,051,005 | |
Expenses allocated from Portfolio | | | (29,102,426 | ) |
Total investment income from Portfolio | | $ | 274,037,087 | |
|
| Expenses | |
Distribution and service fees | | | | |
Class A | | $ | 4,659,715 | |
Class B | | | 354,813 | |
Class C | | | 3,089,936 | |
Class R | | | 176,430 | |
Trustees’ fees and expenses | | | 500 | |
Custodian fee | | | 65,935 | |
Transfer and dividend disbursing agent fees | | | 4,250,500 | |
Legal and accounting services | | | 98,571 | |
Printing and postage | | | 1,628,479 | |
Registration fees | | | 257,224 | |
Miscellaneous | | | 36,390 | |
Total expenses | | $ | 14,618,493 | |
| |
Net investment income | | $ | 259,418,594 | |
|
| Realized and Unrealized Gain (Loss) from Portfolio | |
Net realized gain (loss) — | | | | |
Investment transactions | | $ | 39,102,753 | |
Swap contracts | | | 3,424,916 | |
Net realized gain | | $ | 42,527,669 | |
Change in unrealized appreciation (depreciation) — | | | | |
Investments | | $ | (56,273,065 | ) |
Swap contracts | | | (1,580,316 | ) |
Foreign currency and forward foreign currency exchange contracts | | | (6,629 | ) |
Net change in unrealized appreciation (depreciation) | | $ | (57,860,010 | ) |
| |
Net realized and unrealized loss | | $ | (15,332,341 | ) |
| |
Net increase in net assets from operations | | $ | 244,086,253 | |
| | | | |
| | 8 | | See Notes to Financial Statements. |
Eaton Vance
Income Fund of Boston
October 31, 2014
Statements of Changes in Net Assets
| | | | | | | | |
| | | Year Ended October 31, | |
| Increase (Decrease) in Net Assets | | 2014 | | | 2013 | |
From operations — | | | | | | | | |
Net investment income | | $ | 259,418,594 | | | $ | 254,757,267 | |
Net realized gain from investment transactions and swap contracts | | | 42,527,669 | | | | 96,590,915 | |
Net change in unrealized appreciation (depreciation) from investments, swap contracts and foreign currency and forward foreign currency exchange contracts | | | (57,860,010 | ) | | | 20,405,411 | |
Net increase in net assets from operations | | $ | 244,086,253 | | | $ | 371,753,593 | |
Distributions to shareholders — | | | | | | | | |
From net investment income | | | | | | | | |
Class A | | $ | (109,433,896 | ) | | $ | (114,644,773 | ) |
Class B | | | (1,825,034 | ) | | | (2,504,191 | ) |
Class C | | | (15,870,184 | ) | | | (17,084,224 | ) |
Class I | | | (150,543,465 | ) | | | (130,737,550 | ) |
Class R | | | (1,986,608 | ) | | | (2,094,024 | ) |
Class R6 | | | (4,632 | ) | | | — | |
Total distributions to shareholders | | $ | (279,663,819 | ) | | $ | (267,064,762 | ) |
Transactions in shares of beneficial interest — | | | | | | | | |
Proceeds from sale of shares | | | | | | | | |
Class A | | $ | 412,420,320 | | | $ | 502,257,734 | |
Class B | | | 864,709 | | | | 1,093,832 | |
Class C | | | 41,666,926 | | | | 52,278,234 | |
Class I | | | 1,440,510,066 | | | | 839,798,233 | |
Class R | | | 12,303,451 | | | | 10,613,136 | |
Class R6 | | | 1,177,176 | | | | — | |
Net asset value of shares issued to shareholders in payment of distributions declared | | | | | | | | |
Class A | | | 104,461,297 | | | | 108,252,062 | |
Class B | | | 1,570,251 | | | | 2,135,601 | |
Class C | | | 14,200,905 | | | | 14,862,629 | |
Class I | | | 135,915,337 | | | | 115,142,153 | |
Class R | | | 1,864,855 | | | | 1,924,299 | |
Class R6 | | | 4,632 | | | | — | |
Cost of shares redeemed | | | | | | | | |
Class A | | | (789,709,788 | ) | | | (830,698,679 | ) |
Class B | | | (7,076,728 | ) | | | (11,044,457 | ) |
Class C | | | (66,428,308 | ) | | | (84,083,397 | ) |
Class I | | | (764,403,842 | ) | | | (1,117,670,641 | ) |
Class R | | | (10,760,828 | ) | | | (15,857,097 | ) |
Class R6 | | | (15,453 | ) | | | — | |
Net asset value of shares exchanged | | | | | | | | |
Class A | | | 4,821,112 | | | | 9,677,946 | |
Class B | | | (4,821,112 | ) | | | (9,677,946 | ) |
Net increase (decrease) in net assets from Fund share transactions | | $ | 528,564,978 | | | $ | (410,996,358 | ) |
| | |
Net increase (decrease) in net assets | | $ | 492,987,412 | | | $ | (306,307,527 | ) |
|
| Net Assets | |
At beginning of year | | $ | 4,327,190,694 | | | $ | 4,633,498,221 | |
At end of year | | $ | 4,820,178,106 | | | $ | 4,327,190,694 | |
|
Accumulated distributions in excess of net investment income included in net assets | |
At end of year | | $ | (5,996,689 | ) | | $ | (5,384,733 | ) |
| | | | |
| | 9 | | See Notes to Financial Statements. |
Eaton Vance
Income Fund of Boston
October 31, 2014
Financial Highlights
| | | | | | | | | | | | | | | | | | | | |
| | | Class A | |
| | | Year Ended October 31, | |
| | | 2014 | | | 2013 | | | 2012 | | | 2011 | | | 2010 | |
Net asset value — Beginning of year | | $ | 6.060 | | | $ | 5.920 | | | $ | 5.720 | | | $ | 5.850 | | | $ | 5.400 | |
| | | | | |
| Income (Loss) From Operations | | | | | | | | | | | | | | | | | | | | |
Net investment income(1) | | $ | 0.331 | | | $ | 0.349 | | | $ | 0.355 | | | $ | 0.423 | | | $ | 0.466 | |
Net realized and unrealized gain (loss) | | | (0.014 | ) | | | 0.156 | | | | 0.252 | | | | (0.103 | ) | | | 0.475 | |
| | | | | |
Total income from operations | | $ | 0.317 | | | $ | 0.505 | | | $ | 0.607 | | | $ | 0.320 | | | $ | 0.941 | |
| | | |
| Less Distributions | | | | | | | | | | | | | |
From net investment income | | $ | (0.357 | ) | | $ | (0.365 | ) | | $ | (0.394 | ) | | $ | (0.450 | ) | | $ | (0.491 | ) |
Tax return of capital | | | — | | | | — | | | | (0.013 | ) | | | — | | | | — | |
| | | | | |
Total distributions | | $ | (0.357 | ) | | $ | (0.365 | ) | | $ | (0.407 | ) | | $ | (0.450 | ) | | $ | (0.491 | ) |
| | | | | |
Redemption fees(1)(2) | | $ | — | | | $ | — | | | $ | — | | | $ | 0.000 | (3) | | $ | 0.000 | (3) |
| | | | | |
Net asset value — End of year | | $ | 6.020 | | | $ | 6.060 | | | $ | 5.920 | | | $ | 5.720 | | | $ | 5.850 | |
| | | | | |
Total Return(4) | | | 5.34 | % | | | 8.75 | % | | | 11.00 | % | | | 5.60 | % | | | 17.98 | % |
| | | |
| Ratios/Supplemental Data | | | | | | | | | | | | | |
Net assets, end of year (000’s omitted) | | $ | 1,551,838 | | | $ | 1,830,909 | | | $ | 1,997,735 | | | $ | 1,428,797 | | | $ | 1,494,894 | |
Ratios (as a percentage of average daily net assets):(5) | | | | | | | | | | | | | | | | | | | | |
Expenses(6) | | | 1.00 | % | | | 1.00 | % | | | 1.02 | % | | | 1.02 | % | | | 1.04 | % |
Net investment income | | | 5.45 | % | | | 5.80 | % | | | 6.12 | % | | | 7.25 | % | | | 8.32 | % |
Portfolio Turnover of the Portfolio | | | 43 | % | | | 56 | % | | | 64 | % | | | 70 | % | | | 75 | % |
| (1) | Computed using average shares outstanding. |
| (2) | Redemption fees were discontinued as of January 1, 2011. |
| (3) | Amount is less than $0.0005. |
| (4) | Returns are historical and are calculated by determining the percentage change in net asset value with all distributions reinvested and do not reflect the effect of sales charges. |
| (5) | Includes the Fund’s share of the Portfolio’s allocated expenses. |
| (6) | Excludes the effect of custody fee credits, if any, of less than 0.005%. |
| | | | |
| | 10 | | See Notes to Financial Statements. |
Eaton Vance
Income Fund of Boston
October 31, 2014
Financial Highlights — continued
| | | | | | | | | | | | | | | | | | | | |
| | | Class B | |
| | | Year Ended October 31, | |
| | | 2014 | | | 2013 | | | 2012 | | | 2011 | | | 2010 | |
Net asset value — Beginning of year | | $ | 6.070 | | | $ | 5.930 | | | $ | 5.720 | | | $ | 5.860 | | | $ | 5.410 | |
| | | | | |
| Income (Loss) From Operations | | | | | | | | | | | | | | | | | | | | |
Net investment income(1) | | $ | 0.286 | | | $ | 0.303 | | | $ | 0.317 | | | $ | 0.382 | | | $ | 0.425 | |
Net realized and unrealized gain (loss) | | | (0.023 | ) | | | 0.158 | | | | 0.257 | | | | (0.116 | ) | | | 0.477 | |
| | | | | |
Total income from operations | | $ | 0.263 | | | $ | 0.461 | | | $ | 0.574 | | | $ | 0.266 | | | $ | 0.902 | |
| | | |
| Less Distributions | | | | | | | | | | | | | |
From net investment income | | $ | (0.313 | ) | | $ | (0.321 | ) | | $ | (0.352 | ) | | $ | (0.406 | ) | | $ | (0.452 | ) |
Tax return of capital | | | — | | | | — | | | | (0.012 | ) | | | — | | | | — | |
| | | | | |
Total distributions | | $ | (0.313 | ) | | $ | (0.321 | ) | | $ | (0.364 | ) | | $ | (0.406 | ) | | $ | (0.452 | ) |
| | | | | |
Redemption fees(1)(2) | | $ | — | | | $ | — | | | $ | — | | | $ | 0.000 | (3) | | $ | 0.000 | (3) |
| | | | | |
Net asset value — End of year | | $ | 6.020 | | | $ | 6.070 | | | $ | 5.930 | | | $ | 5.720 | | | $ | 5.860 | |
| | | | | |
Total Return(4) | | | 4.40 | % | | | 7.96 | % | | | 10.38 | % | | | 4.63 | % | | | 17.35 | % |
| | | |
| Ratios/Supplemental Data | | | | | | | | | | | | | |
Net assets, end of year (000’s omitted) | | $ | 30,329 | | | $ | 39,996 | | | $ | 56,321 | | | $ | 76,367 | | | $ | 110,968 | |
Ratios (as a percentage of average daily net assets):(5) | | | | | | | | | | | | | | | | | | | | |
Expenses(6) | | | 1.75 | % | | | 1.75 | % | | | 1.77 | % | | | 1.77 | % | | | 1.79 | % |
Net investment income | | | 4.70 | % | | | 5.04 | % | | | 5.48 | % | | | 6.53 | % | | | 7.59 | % |
Portfolio Turnover of the Portfolio | | | 43 | % | | | 56 | % | | | 64 | % | | | 70 | % | | | 75 | % |
| (1) | Computed using average shares outstanding. |
| (2) | Redemption fees were discontinued as of January 1, 2011. |
| (3) | Amount is less than $0.0005. |
| (4) | Returns are historical and are calculated by determining the percentage change in net asset value with all distributions reinvested and do not reflect the effect of sales charges. |
| (5) | Includes the Fund’s share of the Portfolio’s allocated expenses. |
| (6) | Excludes the effect of custody fee credits, if any, of less than 0.005%. |
| | | | |
| | 11 | | See Notes to Financial Statements. |
Eaton Vance
Income Fund of Boston
October 31, 2014
Financial Highlights — continued
| | | | | | | | | | | | | | | | | | | | |
| | | Class C | |
| | | Year Ended October 31, | |
| | | 2014 | | | 2013 | | | 2012 | | | 2011 | | | 2010 | |
Net asset value — Beginning of year | | $ | 6.070 | | | $ | 5.930 | | | $ | 5.720 | | | $ | 5.860 | | | $ | 5.410 | |
| | | | | |
| Income (Loss) From Operations | | | | | | | | | | | | | | | | | | | | |
Net investment income(1) | | $ | 0.286 | | | $ | 0.303 | | | $ | 0.313 | | | $ | 0.380 | | | $ | 0.424 | |
Net realized and unrealized gain (loss) | | | (0.013 | ) | | | 0.158 | | | | 0.261 | | | | (0.114 | ) | | | 0.478 | |
| | | | | |
Total income from operations | | $ | 0.273 | | | $ | 0.461 | | | $ | 0.574 | | | $ | 0.266 | | | $ | 0.902 | |
| | | |
| Less Distributions | | | | | | | | | | | | | |
From net investment income | | $ | (0.313 | ) | | $ | (0.321 | ) | | $ | (0.352 | ) | | $ | (0.406 | ) | | $ | (0.452 | ) |
Tax return of capital | | | — | | | | — | | | | (0.012 | ) | | | — | | | | — | |
| | | | | |
Total distributions | | $ | (0.313 | ) | | $ | (0.321 | ) | | $ | (0.364 | ) | | $ | (0.406 | ) | | $ | (0.452 | ) |
| | | | | |
Redemption fees(1)(2) | | $ | — | | | $ | — | | | $ | — | | | $ | 0.000 | (3) | | $ | 0.000 | (3) |
| | | | | |
Net asset value — End of year | | $ | 6.030 | | | $ | 6.070 | | | $ | 5.930 | | | $ | 5.720 | | | $ | 5.860 | |
| | | | | |
Total Return(4) | | | 4.57 | % | | | 7.95 | % | | | 10.37 | % | | | 4.63 | % | | | 17.34 | % |
| | | |
| Ratios/Supplemental Data | | | | | | | | | | | | | |
Net assets, end of year (000’s omitted) | | $ | 295,436 | | | $ | 308,296 | | | $ | 318,029 | | | $ | 247,649 | | | $ | 255,375 | |
Ratios (as a percentage of average daily net assets):(5) | | | | | | | | | | | | | | | | | | | | |
Expenses(6) | | | 1.75 | % | | | 1.75 | % | | | 1.77 | % | | | 1.77 | % | | | 1.79 | % |
Net investment income | | | 4.70 | % | | | 5.04 | % | | | 5.39 | % | | | 6.50 | % | | | 7.55 | % |
Portfolio Turnover of the Portfolio | | | 43 | % | | | 56 | % | | | 64 | % | | | 70 | % | | | 75 | % |
| (1) | Computed using average shares outstanding. |
| (2) | Redemption fees were discontinued as of January 1, 2011. |
| (3) | Amount is less than $0.0005. |
| (4) | Returns are historical and are calculated by determining the percentage change in net asset value with all distributions reinvested and do not reflect the effect of sales charges. |
| (5) | Includes the Fund’s share of the Portfolio’s allocated expenses. |
| (6) | Excludes the effect of custody fee credits, if any, of less than 0.005%. |
| | | | |
| | 12 | | See Notes to Financial Statements. |
Eaton Vance
Income Fund of Boston
October 31, 2014
Financial Highlights — continued
| | | | | | | | | | | | | | | | | | | | |
| | | Class I | |
| | | Year Ended October 31, | |
| | | 2014 | | | 2013 | | | 2012 | | | 2011 | | | 2010 | |
Net asset value — Beginning of year | | $ | 6.070 | | | $ | 5.930 | | | $ | 5.720 | | | $ | 5.860 | | | $ | 5.410 | |
| | | | | |
| Income (Loss) From Operations | | | | | | | | | | | | | | | | | | | | |
Net investment income(1) | | $ | 0.345 | | | $ | 0.363 | | | $ | 0.367 | | | $ | 0.434 | | | $ | 0.477 | |
Net realized and unrealized gain (loss) | | | (0.023 | ) | | | 0.157 | | | | 0.265 | | | | (0.109 | ) | | | 0.478 | |
| | | | | |
Total income from operations | | $ | 0.322 | | | $ | 0.520 | | | $ | 0.632 | | | $ | 0.325 | | | $ | 0.955 | |
| | | |
| Less Distributions | | | | | | | | | | | | | |
From net investment income | | $ | (0.372 | ) | | $ | (0.380 | ) | | $ | (0.409 | ) | | $ | (0.465 | ) | | $ | (0.505 | ) |
Tax return of capital | | | — | | | | — | | | | (0.013 | ) | | | — | | | | — | |
| | | | | |
Total distributions | | $ | (0.372 | ) | | $ | (0.380 | ) | | $ | (0.422 | ) | | $ | (0.465 | ) | | $ | (0.505 | ) |
| | | | | |
Redemption fees(1)(2) | | $ | — | | | $ | — | | | $ | — | | | $ | 0.000 | (3) | | $ | 0.000 | (3) |
| | | | | |
Net asset value — End of year | | $ | 6.020 | | | $ | 6.070 | | | $ | 5.930 | | | $ | 5.720 | | | $ | 5.860 | |
| | | | | |
Total Return(4) | | | 5.42 | % | | | 9.01 | % | | | 11.46 | % | | | 5.68 | % | | | 18.47 | % |
| | | |
| Ratios/Supplemental Data | | | | | | | | | | | | | |
Net assets, end of year (000’s omitted) | | $ | 2,903,827 | | | $ | 2,113,533 | | | $ | 2,224,443 | | | $ | 1,179,925 | | | $ | 705,118 | |
Ratios (as a percentage of average daily net assets):(5) | | | | | | | | | | | | | | | | | | | | |
Expenses(6) | | | 0.75 | % | | | 0.75 | % | | | 0.77 | % | | | 0.77 | % | | | 0.79 | % |
Net investment income | | | 5.68 | % | | | 6.04 | % | | | 6.32 | % | | | 7.45 | % | | | 8.49 | % |
Portfolio Turnover of the Portfolio | | | 43 | % | | | 56 | % | | | 64 | % | | | 70 | % | | | 75 | % |
| (1) | Computed using average shares outstanding. |
| (2) | Redemption fees were discontinued as of January 1, 2011. |
| (3) | Amount is less than $0.0005. |
| (4) | Returns are historical and are calculated by determining the percentage change in net asset value with all distributions reinvested. |
| (5) | Includes the Fund’s share of the Portfolio’s allocated expenses. |
| (6) | Excludes the effect of custody fee credits, if any, of less than 0.005%. |
| | | | |
| | 13 | | See Notes to Financial Statements. |
Eaton Vance
Income Fund of Boston
October 31, 2014
Financial Highlights — continued
| | | | | | | | | | | | | | | | | | | | |
| | | Class R | |
| | | Year Ended October 31, | |
| | | 2014 | | | 2013 | | | 2012 | | | 2011 | | | 2010 | |
Net asset value — Beginning of year | | $ | 6.060 | | | $ | 5.920 | | | $ | 5.720 | | | $ | 5.850 | | | $ | 5.400 | |
| | | | | |
| Income (Loss) From Operations | | | | | | | | | | | | | | | | | | | | |
Net investment income(1) | | $ | 0.316 | | | $ | 0.333 | | | $ | 0.342 | | | $ | 0.408 | | | $ | 0.452 | |
Net realized and unrealized gain (loss) | | | (0.014 | ) | | | 0.157 | | | | 0.251 | | | | (0.103 | ) | | | 0.475 | |
| | | | | |
Total income from operations | | $ | 0.302 | | | $ | 0.490 | | | $ | 0.593 | | | $ | 0.305 | | | $ | 0.927 | |
| | | |
| Less Distributions | | | | | | | | | | | | | |
From net investment income | | $ | (0.342 | ) | | $ | (0.350 | ) | | $ | (0.381 | ) | | $ | (0.435 | ) | | $ | (0.477 | ) |
Tax return of capital | | | — | | | | — | | | | (0.012 | ) | | | — | | | | — | |
| | | | | |
Total distributions | | $ | (0.342 | ) | | $ | (0.350 | ) | | $ | (0.393 | ) | | $ | (0.435 | ) | | $ | (0.477 | ) |
| | | | | |
Redemption fees(1)(2) | | $ | — | | | $ | — | | | $ | — | | | $ | 0.000 | (3) | | $ | 0.000 | (3) |
| | | | | |
Net asset value — End of year | | $ | 6.020 | | | $ | 6.060 | | | $ | 5.920 | | | $ | 5.720 | | | $ | 5.850 | |
| | | | | |
Total Return(4) | | | 5.08 | % | | | 8.48 | % | | | 10.73 | % | | | 5.33 | % | | | 17.69 | % |
| | | |
| Ratios/Supplemental Data | | | | | | | | | | | | | |
Net assets, end of year (000’s omitted) | | $ | 37,575 | | | $ | 34,457 | | | $ | 36,971 | | | $ | 31,668 | | | $ | 29,793 | |
Ratios (as a percentage of average daily net assets):(5) | | | | | | | | | | | | | | | | | | | | |
Expenses(6) | | | 1.25 | % | | | 1.25 | % | | | 1.27 | % | | | 1.27 | % | | | 1.29 | % |
Net investment income | | | 5.19 | % | | | 5.54 | % | | | 5.90 | % | | | 6.99 | % | | | 8.05 | % |
Portfolio Turnover of the Portfolio | | | 43 | % | | | 56 | % | | | 64 | % | | | 70 | % | | | 75 | % |
| (1) | Computed using average shares outstanding. |
| (2) | Redemption fees were discontinued as of January 1, 2011. |
| (3) | Amount is less than $0.0005. |
| (4) | Returns are historical and are calculated by determining the percentage change in net asset value with all distributions reinvested. |
| (5) | Includes the Fund’s share of the Portfolio’s allocated expenses. |
| (6) | Excludes the effect of custody fee credits, if any, of less than 0.005%. |
| | | | |
| | 14 | | See Notes to Financial Statements. |
Eaton Vance
Income Fund of Boston
October 31, 2014
Financial Highlights — continued
| | | | |
| | | Class R6 | |
| | | Period Ended October 31, 2014(1) | |
Net asset value — Beginning of period | | $ | 6.160 | |
| |
| Income (Loss) From Operations | | | | |
Net investment income(2) | | $ | 0.114 | |
Net realized and unrealized loss | | | (0.129 | ) |
| |
Total loss from operations | | $ | (0.015 | ) |
|
| Less Distributions | |
From net investment income | | $ | (0.125 | ) |
| |
Total distributions | | $ | (0.125 | ) |
| |
Net asset value — End of period | | $ | 6.020 | |
| |
Total Return(3) | | | (0.23 | )%(4) |
|
| Ratios/Supplemental Data | |
Net assets, end of period (000’s omitted) | | $ | 1,173 | |
Ratios (as a percentage of average daily net assets):(5) | | | | |
Expenses | | | 0.69 | %(6)(7) |
Net investment income | | | 5.67 | %(7) |
Portfolio Turnover of the Portfolio | | | 43 | %(8) |
| (1) | For the period from the commencement of operations, July 1, 2014, to October 31, 2014. |
| (2) | Computed using average shares outstanding. |
| (3) | Returns are historical and are calculated by determining the percentage change in net asset value with all distributions reinvested. |
| (5) | Includes the Fund’s share of the Portfolio’s allocated expenses. |
| (6) | Excludes the effect of custody fee credits, if any, of less than 0.005%. |
| (8) | For the Portfolio’s year ended October 31, 2014. |
| | | | |
| | 15 | | See Notes to Financial Statements. |
Eaton Vance
Income Fund of Boston
October 31, 2014
Notes to Financial Statements
1 Significant Accounting Policies
Eaton Vance Income Fund of Boston (the Fund) is a diversified series of Eaton Vance Series Trust II (the Trust). The Trust is a Massachusetts business trust registered under the Investment Company Act of 1940, as amended (the 1940 Act), as an open-end management investment company. The Fund offers six classes of shares. Class A shares are generally sold subject to a sales charge imposed at time of purchase. Class B and Class C shares are sold at net asset value and are generally subject to a contingent deferred sales charge (see Note 5). Class I, Class R and Class R6 shares are sold at net asset value and are not subject to a sales charge. Class B shares automatically convert to Class A shares eight years after their purchase as described in the Fund’s prospectus. Beginning January 1, 2012, Class B shares are only available for purchase upon exchange from another Eaton Vance fund or through reinvestment of distributions. Each class represents a pro-rata interest in the Fund, but votes separately on class-specific matters and (as noted below) is subject to different expenses. Realized and unrealized gains and losses are allocated daily to each class of shares based on the relative net assets of each class to the total net assets of the Fund. Net investment income, other than class-specific expenses, is allocated daily to each class of shares based upon the ratio of the value of each class’s paid shares to the total value of all paid shares. Sub-accounting, recordkeeping and similar administrative fees payable to financial intermediaries, which are a component of transfer and dividend disbursing agent fees on the Statement of Operations, are not allocated to Class R6 shares. Each class of shares differs in its distribution plan and certain other class-specific expenses. The Fund invests all of its investable assets in interests in Boston Income Portfolio (the Portfolio), a Massachusetts business trust, having the same investment objectives and policies as the Fund. The value of the Fund’s investment in the Portfolio reflects the Fund’s proportionate interest in the net assets of the Portfolio (95.7% at October 31, 2014). The performance of the Fund is directly affected by the performance of the Portfolio. The financial statements of the Portfolio, including the portfolio of investments, are included elsewhere in this report and should be read in conjunction with the Fund’s financial statements.
The following is a summary of significant accounting policies of the Fund. The policies are in conformity with accounting principles generally accepted in the United States of America (U.S. GAAP). The Fund is an investment company and follows accounting and reporting guidance in the Financial Accounting Standards Board (“FASB”) Accounting Standards Codification Topic 946.
A Investment Valuation — Valuation of securities by the Portfolio is discussed in Note 1A of the Portfolio’s Notes to Financial Statements, which are included elsewhere in this report.
B Income — The Fund’s net investment income or loss consists of the Fund’s pro-rata share of the net investment income or loss of the Portfolio, less all actual and accrued expenses of the Fund.
C Federal Taxes — The Fund’s policy is to comply with the provisions of the Internal Revenue Code applicable to regulated investment companies and to distribute to shareholders each year substantially all of its net investment income, and all or substantially all of its net realized capital gains. Accordingly, no provision for federal income or excise tax is necessary.
As of October 31, 2014, the Fund had no uncertain tax positions that would require financial statement recognition, de-recognition, or disclosure. The Fund files a U.S. federal income tax return annually after its fiscal year-end, which is subject to examination by the Internal Revenue Service for a period of three years from the date of filing.
D Expenses — The majority of expenses of the Trust are directly identifiable to an individual fund. Expenses which are not readily identifiable to a specific fund are allocated taking into consideration, among other things, the nature and type of expense and the relative size of the funds.
E Expense Reduction — State Street Bank and Trust Company (SSBT) serves as custodian of the Fund. Pursuant to the custodian agreement, SSBT receives a fee reduced by credits, which are determined based on the average daily cash balance the Fund maintains with SSBT. All credit balances, if any, used to reduce the Fund’s custodian fees are reported as a reduction of expenses in the Statement of Operations.
F Use of Estimates — The preparation of the financial statements in conformity with U.S. GAAP requires management to make estimates and assumptions that affect the reported amounts of assets and liabilities at the date of the financial statements and the reported amounts of income and expense during the reporting period. Actual results could differ from those estimates.
G Indemnifications — Under the Trust’s organizational documents, its officers and Trustees may be indemnified against certain liabilities and expenses arising out of the performance of their duties to the Fund. Under Massachusetts law, if certain conditions prevail, shareholders of a Massachusetts business trust (such as the Trust) could be deemed to have personal liability for the obligations of the Trust. However, the Trust’s Declaration of Trust contains an express disclaimer of liability on the part of Fund shareholders and the By-laws provide that the Trust shall assume the defense on behalf of any Fund shareholders. Moreover, the By-laws also provide for indemnification out of Fund property of any shareholder held personally liable solely by reason of being or having been a shareholder for all loss or expense arising from such liability. Additionally, in the normal course of business, the Fund enters into agreements with service providers that may contain indemnification clauses. The Fund’s maximum exposure under these arrangements is unknown as this would involve future claims that may be made against the Fund that have not yet occurred.
H Other — Investment transactions are accounted for on a trade date basis. Dividends to shareholders are recorded on the ex-dividend date.
Eaton Vance
Income Fund of Boston
October 31, 2014
Notes to Financial Statements — continued
2 Distributions to Shareholders and Income Tax Information
The Fund declares dividends daily to shareholders of record at the time of declaration. Distributions are generally paid monthly. Distributions of realized capital gains (reduced by available capital loss carryforwards from prior years) are made at least annually. Distributions are declared separately for each class of shares. Shareholders may reinvest income and capital gain distributions in additional shares of the same class of the Fund at the net asset value as of the reinvestment date or, at the election of the shareholder, receive distributions in cash. Distributions to shareholders are determined in accordance with income tax regulations, which may differ from U.S. GAAP. As required by U.S. GAAP, only distributions in excess of tax basis earnings and profits are reported in the financial statements as a return of capital. Permanent differences between book and tax accounting relating to distributions are reclassified to paid-in capital. For tax purposes, distributions from short-term capital gains and current year earnings and profits attributable to realized gains are considered to be from ordinary income.
The tax character of distributions declared for the years ended October 31, 2014 and October 31, 2013 was as follows:
| | | | | | | | |
| | | Year Ended October 31, | |
| | | 2014 | | | 2013 | |
| | |
Distributions declared from: | | | | | | | | |
Ordinary income | | $ | 279,663,819 | | | $ | 267,064,762 | |
During the year ended October 31, 2014, accumulated net realized loss was increased by $11,199,895, accumulated distributions in excess of net investment income was decreased by $19,633,269 and paid-in capital was decreased by $8,433,374 due to differences between book and tax accounting, primarily for paydown gain (loss), premium amortization, accretion of market discount, swap contracts, partnership allocations and investments in partnerships. These reclassifications had no effect on the net assets or net asset value per share of the Fund.
As of October 31, 2014, the components of distributable earnings (accumulated losses) and unrealized appreciation (depreciation) on a tax basis were as follows:
| | | | |
Capital loss carryforward | | $ | (45,942,302 | ) |
Net unrealized appreciation | | $ | 112,570,637 | |
Other temporary differences | | $ | (1,800,348 | ) |
The differences between components of distributable earnings (accumulated losses) on a tax basis and the amounts reflected in the Statement of Assets and Liabilities are primarily due to wash sales, partnership allocations, foreign currency transactions, swap contracts, investments in partnerships, the timing of recognizing distributions to shareholders, premium amortization, accretion of market discount and defaulted bond interest.
At October 31, 2014, the Fund, for federal income tax purposes, had a capital loss carryforward of $45,942,302 which will reduce its taxable income arising from future net realized gains on investment transactions, if any, to the extent permitted by the Internal Revenue Code, and thus will reduce the amount of distributions to shareholders, which would otherwise be necessary to relieve the Fund of any liability for federal income or excise tax. Such capital loss carryforward will expire on October 31, 2017 ($43,891,292) and October 31, 2019 ($2,051,010) and its character is short-term. Under tax regulations, capital losses incurred in taxable years beginning after December 2010 are considered deferred capital losses and are treated as arising on the first day of the Fund’s next taxable year, retaining the same short-term or long-term character as when originally deferred. Deferred capital losses are required to be used prior to capital loss carryforwards, which carry an expiration date. As a result of this ordering rule, capital loss carryforwards may be more likely to expire unused.
During the year ended October 31, 2014, a capital loss carryforward of $32,064,206 was utilized to offset net realized gains by the Fund.
3 Transactions with Affiliates
Eaton Vance Management (EVM) serves as the administrator to the Fund, but receives no compensation. The Portfolio has engaged Boston Management and Research (BMR), a subsidiary of EVM, to render investment advisory services. See Note 2 of the Portfolio’s Notes to Financial Statements which are included elsewhere in this report. EVM provides sub-transfer agency and related services to the Fund pursuant to a Sub-Transfer Agency Support Services Agreement. For the year ended October 31, 2014, EVM earned $61,786 from the Fund pursuant to such agreement, which is included in transfer and dividend disbursing agent fees on the Statement of Operations. The Fund was informed that Eaton Vance Distributors, Inc. (EVD), an affiliate of EVM and the Fund’s principal underwriter, received $147,606 as its portion of the sales charge on sales of Class A shares for the year ended October 31, 2014. EVD also received distribution and service fees from Class A, Class B, Class C and Class R shares (see Note 4) and contingent deferred sales charges (see Note 5).
Eaton Vance
Income Fund of Boston
October 31, 2014
Notes to Financial Statements — continued
Trustees and officers of the Fund who are members of EVM’s or BMR’s organizations receive remuneration for their services to the Fund out of the investment adviser fee. Certain officers and Trustees of the Fund and the Portfolio are officers of the above organizations.
4 Distribution Plans
The Fund has in effect a distribution plan for Class A shares (Class A Plan) pursuant to Rule 12b-1 under the 1940 Act. Pursuant to the Class A Plan, the Fund pays EVD a distribution and service fee of 0.25% per annum of its average daily net assets attributable to Class A shares for distribution services and facilities provided to the Fund by EVD, as well as for personal services and/or the maintenance of shareholder accounts. Distribution and service fees paid or accrued to EVD for the year ended October 31, 2014 amounted to $4,659,715 for Class A shares. The Fund also has in effect distribution plans for Class B shares (Class B Plan), Class C shares (Class C Plan) and Class R shares (Class R Plan) pursuant to Rule 12b-1 under the 1940 Act. Pursuant to the Class B and Class C Plans, the Fund pays EVD amounts equal to 0.75% per annum of its average daily net assets attributable to Class B and Class C shares for providing ongoing distribution services and facilities to the Fund. For the year ended October 31, 2014, the Fund paid or accrued to EVD $266,110 and $2,317,452 for Class B and Class C shares, respectively. The Class R Plan requires the Fund to pay EVD an amount equal to 0.50% per annum of its average daily net assets attributable to Class R shares for providing ongoing distribution services and facilities to the Fund. The Trustees of the Trust have currently limited Class R distribution payments to 0.25% per annum of the average daily net assets attributable to Class R shares. For the year ended October 31, 2014, the Fund paid or accrued to EVD $88,215 for Class R shares.
Pursuant to the Class B, Class C and Class R Plans, the Fund also makes payments of service fees to EVD, financial intermediaries and other persons in amounts equal to 0.25% per annum of its average daily net assets attributable to that class. Service fees paid or accrued are for personal services and/or the maintenance of shareholder accounts. They are separate and distinct from the sales commissions and distribution fees payable to EVD. Service fees paid or accrued for the year ended October 31, 2014 amounted to $88,703, $772,484 and $88,215 for Class B, Class C and Class R shares, respectively.
Distribution and service fees are subject to the limitations contained in the Financial Industry Regulatory Authority’s NASD Conduct Rule 2830(d) and for Class B, are further limited to a 5% maximum sales charge as determined in accordance with such rule.
5 Contingent Deferred Sales Charges
A contingent deferred sales charge (CDSC) generally is imposed on redemptions of Class B shares made within six years of purchase and on redemptions of Class C shares made within one year of purchase. Class A shares may be subject to a 1% CDSC if redeemed within 18 months of purchase (depending on the circumstances of purchase). Generally, the CDSC is based upon the lower of the net asset value at date of redemption or date of purchase. No charge is levied on shares acquired by reinvestment of dividends or capital gain distributions. The CDSC for Class B shares is imposed at declining rates that begin at 5% in the case of redemptions in the first and second year after purchase, declining one percentage point each subsequent year. Class C shares are subject to a 1% CDSC if redeemed within one year of purchase. For the year ended October 31, 2014, the Fund was informed that EVD received approximately $30,000, $44,000 and $18,000 of CDSCs paid by Class A, Class B and Class C shareholders, respectively.
6 Investment Transactions
For the year ended October 31, 2014, increases and decreases in the Fund’s investment in the Portfolio aggregated $767,640,580 and $521,769,161, respectively.
7 Shares of Beneficial Interest
The Fund’s Declaration of Trust permits the Trustees to issue an unlimited number of full and fractional shares of beneficial interest (without par value). Such shares may be issued in a number of different series (such as the Fund) and classes. Transactions in Fund shares were as follows:
| | | | | | | | |
| | | Year Ended October 31, | |
| Class A | | 2014 | | | 2013 | |
| | |
Sales | | | 67,902,976 | | | | 83,377,373 | |
Issued to shareholders electing to receive payments of distributions in Fund shares | | | 17,170,286 | | | | 18,005,746 | |
Redemptions | | | (130,021,308 | ) | | | (138,330,386 | ) |
Exchange from Class B shares | | | 792,880 | | | | 1,610,506 | |
| | |
Net decrease | | | (44,155,166 | ) | | | (35,336,761 | ) |
| | |
| | | | | | | | |
Eaton Vance
Income Fund of Boston
October 31, 2014
Notes to Financial Statements — continued
| | | | | | | | |
| | | Year Ended October 31, | |
| Class B | | 2014 | | | 2013 | |
| | |
Sales | | | 142,073 | | | | 181,759 | |
Issued to shareholders electing to receive payments of distributions in Fund shares | | | 258,158 | | | | 355,022 | |
Redemptions | | | (1,164,390 | ) | | | (1,836,143 | ) |
Exchange to Class A shares | | | (792,242 | ) | | | (1,609,961 | ) |
| | |
Net decrease | | | (1,556,401 | ) | | | (2,909,323 | ) |
| | |
| | | | | | | | |
| | | Year Ended October 31, | |
| Class C | | 2014 | | | 2013 | |
| | |
Sales | | | 6,840,510 | | | | 8,674,887 | |
Issued to shareholders electing to receive payments of distributions in Fund shares | | | 2,333,088 | | | | 2,469,126 | |
Redemptions | | | (10,934,715 | ) | | | (13,981,525 | ) |
| | |
Net decrease | | | (1,761,117 | ) | | | (2,837,512 | ) |
| | |
| | | | | | | | |
| | | Year Ended October 31, | |
| Class I | | 2014 | | | 2013 | |
| | |
Sales | | | 237,218,191 | | | | 139,698,526 | |
Issued to shareholders electing to receive payments of distributions in Fund shares | | | 22,356,907 | | | | 19,141,768 | |
Redemptions | | | (125,866,482 | ) | | | (185,799,682 | ) |
| | |
Net increase (decrease) | | | 133,708,616 | | | | (26,959,388 | ) |
| | |
| | | | | | | | |
| | | Year Ended October 31, | |
| Class R | | 2014 | | | 2013 | |
| | |
Sales | | | 2,022,347 | | | | 1,765,898 | |
Issued to shareholders electing to receive payments of distributions in Fund shares | | | 306,750 | | | | 320,068 | |
Redemptions | | | (1,769,504 | ) | | | (2,645,284 | ) |
| | |
Net increase (decrease) | | | 559,593 | | | | (559,318 | ) |
| | |
| | | | | | | | |
| Class R6 | | Period Ended
October 31, 2014(1) | | | | |
| | |
Sales | | | 196,522 | | | | | |
Issued to shareholders electing to receive payments of distributions in Fund shares | | | 769 | | | | | |
Redemptions | | | (2,572 | ) | | | | |
| | |
Net increase | | | 194,719 | | | | | |
| (1) | Class R6 commenced operations on July 1, 2014. |
Eaton Vance
Income Fund of Boston
October 31, 2014
Report of Independent Registered Public Accounting Firm
To the Trustees of Eaton Vance Series Trust II and Shareholders of Eaton Vance Income Fund of Boston:
We have audited the accompanying statement of assets and liabilities of Eaton Vance Income Fund of Boston (the “Fund”) (one of the funds constituting Eaton Vance Series Trust II), as of October 31, 2014, and the related statement of operations for the year then ended, the statements of changes in net assets for each of the two years in the period then ended, and the financial highlights for each of the periods presented. These financial statements and financial highlights are the responsibility of the Fund’s management. Our responsibility is to express an opinion on these financial statements and financial highlights based on our audits.
We conducted our audits in accordance with the standards of the Public Company Accounting Oversight Board (United States). Those standards require that we plan and perform the audit to obtain reasonable assurance about whether the financial statements and financial highlights are free of material misstatement. The Fund is not required to have, nor were we engaged to perform, an audit of its internal control over financial reporting. Our audits included consideration of internal control over financial reporting as a basis for designing audit procedures that are appropriate in the circumstances, but not for the purpose of expressing an opinion on the effectiveness of the Fund’s internal control over financial reporting. Accordingly, we express no such opinion. An audit also includes examining, on a test basis, evidence supporting the amounts and disclosures in the financial statements, assessing the accounting principles used and significant estimates made by management, as well as evaluating the overall financial statement presentation. We believe that our audits provide a reasonable basis for our opinion.
In our opinion, such financial statements and financial highlights referred to above present fairly, in all material respects, the financial position of Eaton Vance Income Fund of Boston as of October 31, 2014, the results of its operations for the year then ended, the changes in its net assets for each of the two years in the period then ended, and the financial highlights for each of the periods presented, in conformity with accounting principles generally accepted in the United States of America.
DELOITTE & TOUCHE LLP
Boston, Massachusetts
December 19, 2014
Eaton Vance
Income Fund of Boston
October 31, 2014
Federal Tax Information (Unaudited)
The Form 1099-DIV you receive in February 2015 will show the tax status of all distributions paid to your account in calendar year 2014. Shareholders are advised to consult their own tax adviser with respect to the tax consequences of their investment in the Fund. As required by the Internal Revenue Code and/or regulations, shareholders must be notified regarding the status of qualified dividend income for individuals.
Qualified Dividend Income. For the fiscal year ended October 31, 2014, the Fund designates approximately $2,051,005, or up to the maximum amount of such dividends allowable pursuant to the Internal Revenue Code, as qualified dividend income eligible for the reduced tax rate of 15%.
Boston Income Portfolio
October 31, 2014
Portfolio of Investments
| | | | | | | | |
| Corporate Bonds & Notes — 88.2% | |
| | |
| | | | | | | | |
| Security | | Principal
Amount
(000’s omitted) | | | Value | |
| | | | | | | | |
| | |
Aerospace — 1.3% | | | | | | | | |
Alliant Techsystems, Inc.,
5.25%, 10/1/21(1) | | $ | 6,870 | | | $ | 7,024,575 | |
GenCorp, Inc., 7.125%, 3/15/21 | | | 12,545 | | | | 13,391,788 | |
Huntington Ingalls Industries, Inc., 7.125%, 3/15/21 | | | 11,745 | | | | 12,684,600 | |
TransDigm, Inc., 6.00%, 7/15/22 | | | 15,200 | | | | 15,447,000 | |
TransDigm, Inc., 6.50%, 7/15/24 | | | 12,120 | | | | 12,544,200 | |
TransDigm, Inc., 7.50%, 7/15/21 | | | 2,415 | | | | 2,620,275 | |
| | | | | | | | | |
| | | $ | 63,712,438 | |
| | | | | | | | | |
| | |
Automotive & Auto Parts — 2.8% | | | | | | | | |
American Axle & Manufacturing, Inc., 5.125%, 2/15/19 | | $ | 3,205 | | | $ | 3,269,100 | |
Chrysler Group, LLC/CG Co-Issuer, Inc., 8.00%, 6/15/19 | | | 11,100 | | | | 11,946,375 | |
Chrysler Group, LLC/CG Co-Issuer, Inc., 8.25%, 6/15/21 | | | 34,910 | | | | 39,186,475 | |
Ford Motor Credit Co., LLC, 12.00%, 5/15/15 | | | 4,785 | | | | 5,067,162 | |
General Motors Financial Co., Inc., 3.25%, 5/15/18 | | | 1,780 | | | | 1,824,500 | |
General Motors Financial Co., Inc., 4.75%, 8/15/17 | | | 1,955 | | | | 2,096,738 | |
General Motors Financial Co., Inc., 6.75%, 6/1/18 | | | 4,760 | | | | 5,420,450 | |
Jaguar Land Rover Automotive PLC, 4.25%, 11/15/19(1) | | | 6,205 | | | | 6,251,537 | |
Navistar International Corp., 8.25%, 11/1/21 | | | 20,620 | | | | 21,274,685 | |
Schaeffler Finance Holding BV, 6.875%, 8/15/18(1)(2) | | | 28,300 | | | | 29,785,750 | |
Schaeffler Holding Finance BV, 6.75%, 11/15/22(1)(2) | | | 11,495 | | | | 12,213,437 | |
| | | | | | | | | |
| | | $ | 138,336,209 | |
| | | | | | | | | |
| | |
Banks & Thrifts — 0.3% | | | | | | | | |
JPMorgan Chase & Co.,
6.75% to 2/1/24, 1/29/49(3) | | $ | 13,955 | | | $ | 14,772,763 | |
| | | | | | | | | |
| | | $ | 14,772,763 | |
| | | | | | | | | |
|
Broadcasting — 1.5% | |
AMC Networks, Inc., 4.75%, 12/15/22 | | $ | 5,720 | | | $ | 5,705,700 | |
AMC Networks, Inc., 7.75%, 7/15/21 | | | 12,520 | | | | 13,709,400 | |
Crown Media Holdings, Inc., 10.50%, 7/15/19 | | | 5,400 | | | | 5,940,000 | |
iHeartCommunications, Inc., 11.25%, 3/1/21 | | | 10,550 | | | | 11,196,187 | |
Media General Financing Sub, Inc., 5.875%, 11/15/22(1)(4) | | | 3,745 | | | | 3,773,088 | |
Sirius XM Radio, Inc., 5.875%, 10/1/20(1) | | | 7,385 | | | | 7,809,637 | |
Sirius XM Radio, Inc., 6.00%, 7/15/24(1) | | | 14,970 | | | | 15,643,650 | |
Starz, LLC/Starz Finance Corp., 5.00%, 9/15/19 | | | 12,575 | | | | 13,015,125 | |
| | | | | | | | | |
| | | $ | 76,792,787 | |
| | | | | | | | | |
| | |
Building Materials — 2.5% | | | | | | | | |
Building Materials Corp. of America, 5.375%, 11/15/24(1)(4) | | $ | 24,930 | | | $ | 25,116,975 | |
HD Supply, Inc., 7.50%, 7/15/20 | | | 18,815 | | | | 20,132,050 | |
HD Supply, Inc., 8.125%, 4/15/19 | | | 4,110 | | | | 4,459,350 | |
Hillman Group, Inc. (The), 6.375%, 7/15/22(1) | | | 14,330 | | | | 14,007,575 | |
| | | | | | | | |
| Security | | Principal
Amount
(000’s omitted) | | | Value | |
| | | | | | | | |
| | |
Building Materials (continued) | | | | | | | | |
Interface, Inc., 7.625%, 12/1/18 | | $ | 2,524 | | | $ | 2,633,289 | |
Interline Brands, Inc.,
10.00%, 11/15/18(2) | | | 17,150 | | | | 17,964,625 | |
Nortek, Inc., 8.50%, 4/15/21 | | | 6,240 | | | | 6,739,200 | |
Nortek, Inc., 10.00%, 12/1/18 | | | 8,590 | | | | 9,083,925 | |
Rexel SA, 5.25%, 6/15/20(1) | | | 13,925 | | | | 14,099,062 | |
Rexel SA, 6.125%, 12/15/19(1) | | | 4,590 | | | | 4,762,125 | |
USG Corp., 5.875%, 11/1/21(1) | | | 7,265 | | | | 7,537,438 | |
| | | | | | | | | |
| | | $ | 126,535,614 | |
| | | | | | | | | |
| | |
Cable / Satellite TV — 5.7% | | | | | | | | |
Altice SA, 7.75%, 5/15/22(1) | | $ | 29,715 | | | $ | 31,200,750 | |
Cablevision Systems Corp., 5.875%, 9/15/22 | | | 10,000 | | | | 10,212,500 | |
Cablevision Systems Corp., 7.75%, 4/15/18 | | | 7,985 | | | | 8,925,234 | |
CCO Holdings, LLC/CCO Holdings Capital Corp., 5.25%, 9/30/22 | | | 12,245 | | | | 12,367,450 | |
CCO Holdings, LLC/CCO Holdings Capital Corp., 5.75%, 1/15/24 | | | 10,385 | | | | 10,657,606 | |
CCO Holdings, LLC/CCO Holdings Capital Corp., 6.50%, 4/30/21 | | | 6,490 | | | | 6,871,288 | |
CCO Holdings, LLC/CCO Holdings Capital Corp., 7.375%, 6/1/20 | | | 12,875 | | | | 13,832,578 | |
CCO Holdings, LLC/CCO Holdings Capital Corp., 8.125%, 4/30/20 | | | 940 | | | | 998,750 | |
CCOH Safari, LLC, 5.50%, 12/1/22(4) | | | 15,600 | | | | 15,736,500 | |
CCOH Safari, LLC, 5.75%, 12/1/24(4) | | | 18,720 | | | | 18,907,200 | |
CSC Holdings, LLC, 5.25%, 6/1/24(1) | | | 6,025 | | | | 6,055,125 | |
CSC Holdings, LLC, 6.75%, 11/15/21 | | | 11,715 | | | | 13,076,869 | |
DISH DBS Corp., 5.875%, 7/15/22 | | | 18,270 | | | | 19,411,875 | |
DISH DBS Corp., 6.75%, 6/1/21 | | | 29,805 | | | | 33,158,062 | |
Numericable Group SA,
4.875%, 5/15/19(1) | | | 7,765 | | | | 7,774,706 | |
Numericable Group SA,
6.00%, 5/15/22(1) | | | 24,600 | | | | 25,184,250 | |
Numericable Group SA,
6.25%, 5/15/24(1) | | | 6,485 | | | | 6,679,550 | |
Unitymedia Hessen GmbH & Co. KG/Unitymedia NRW GmbH, 5.50%, 1/15/23(1) | | | 13,345 | | | | 13,978,888 | |
UPCB Finance V, Ltd.,
7.25%, 11/15/21(1) | | | 10,970 | | | | 12,121,850 | |
UPCB Finance VI, Ltd.,
6.875%, 1/15/22(1) | | | 10,750 | | | | 11,798,125 | |
VTR Finance BV, 6.875%, 1/15/24(1) | | | 8,330 | | | | 8,767,325 | |
| | | | | | | | | |
| | | $ | 287,716,481 | |
| | | | | | | | | |
| | |
Capital Goods — 0.7% | | | | | | | | |
Accudyne Industries Borrower/Accudyne Industries, LLC, 7.75%, 12/15/20(1) | | $ | 11,225 | | | $ | 11,730,125 | |
CNH Industrial Capital, LLC, 6.25%, 11/1/16 | | | 7,295 | | | | 7,750,938 | |
Harbinger Group, Inc., 7.875%, 7/15/19 | | | 11,060 | | | | 12,027,750 | |
Manitowoc Co., Inc. (The), 5.875%, 10/15/22 | | | 3,610 | | | | 3,736,350 | |
| | | | | | | | | |
| | | $ | 35,245,163 | |
| | | | | | | | | |
| | | | |
| | 22 | | See Notes to Financial Statements. |
Boston Income Portfolio
October 31, 2014
Portfolio of Investments — continued
| | | | | | | | |
| Security | | Principal
Amount
(000’s omitted) | | | Value | |
| | | | | | | | |
| | |
Chemicals — 2.0% | | | | | | | | |
Axalta Coating Systems US Holdings, Inc./Axalta Coating Systems Dutch Holding B BV, 7.375%, 5/1/21(1) | | $ | 14,675 | | | $ | 15,959,062 | |
Celanese US Holdings, LLC, 5.875%, 6/15/21 | | | 3,350 | | | | 3,643,125 | |
Chemtura Corp., 5.75%, 7/15/21 | | | 1,220 | | | | 1,223,050 | |
Ineos Finance PLC, 8.375%, 2/15/19(1) | | | 19,515 | | | | 21,003,019 | |
Kraton Polymers, LLC, 6.75%, 3/1/19 | | | 3,425 | | | | 3,555,578 | |
Polymer Group, Inc., 7.75%, 2/1/19 | | | 5,841 | | | | 6,103,845 | |
Rockwood Specialties Group, Inc., 4.625%, 10/15/20 | | | 15,785 | | | | 16,538,734 | |
Tronox Finance, LLC, 6.375%, 8/15/20 | | | 19,955 | | | | 20,728,256 | |
W.R. Grace & Co., 5.125%, 10/1/21(1) | | | 6,250 | | | | 6,527,375 | |
W.R. Grace & Co., 5.625%, 10/1/24(1) | | | 2,500 | | | | 2,643,750 | |
| | | | | | | | | |
| | | $ | 97,925,794 | |
| | | | | | | | | |
| | |
Consumer Products — 1.3% | | | | | | | | |
Alphabet Holding Co., Inc., 7.75%, 11/1/17(2) | | $ | 33,630 | | | $ | 32,663,137 | |
CBC Ammo, LLC/CBC FinCo, Inc., 7.25%, 11/15/21(1) | | | 16,810 | | | | 16,725,950 | |
Spectrum Brands, Inc., 6.375%, 11/15/20 | | | 3,250 | | | | 3,461,250 | |
Spectrum Brands, Inc., 6.625%, 11/15/22 | | | 2,420 | | | | 2,607,550 | |
Spectrum Brands, Inc., 6.75%, 3/15/20 | | | 4,160 | | | | 4,409,600 | |
Tempur Sealy International, Inc., 6.875%, 12/15/20 | | | 6,865 | | | | 7,362,713 | |
| | | | | | | | | |
| | | $ | 67,230,200 | |
| | | | | | | | | |
| | |
Containers — 2.4% | | | | | | | | |
Ardagh Finance Holdings SA, 8.625%, 6/15/19(1)(2) | | $ | 3,460 | | | $ | 3,555,185 | |
Ardagh Packaging Finance PLC/Ardagh Holdings USA, Inc.,
3.234%, 12/15/19(1)(5) | | | 5,475 | | | | 5,386,031 | |
Ardagh Packaging Finance PLC/Ardagh Holdings USA, Inc., 6.00%, 6/30/21(1) | | | 3,315 | | | | 3,277,706 | |
Ardagh Packaging Finance PLC/Ardagh Holdings USA, Inc., 6.25%, 1/31/19(1) | | | 4,055 | | | | 4,095,550 | |
Ardagh Packaging Finance PLC/Ardagh Holdings USA, Inc.,
7.00%, 11/15/20(1) | | | 2,819 | | | | 2,889,596 | |
Beverage Packaging Holdings Luxembourg II SA/Beverage Packaging Holding II Issuer, Inc., 5.625%, 12/15/16(1) | | | 3,815 | | | | 3,834,075 | |
Beverage Packaging Holdings Luxembourg II SA/Beverage Packaging Holding II Issuer, Inc., 6.00%, 6/15/17(1) | | | 5,545 | | | | 5,545,000 | |
Reynolds Group Holdings, Inc., 6.875%, 2/15/21 | | | 13,555 | | | | 14,469,962 | |
Reynolds Group Holdings, Inc., 7.125%, 4/15/19 | | | 8,085 | | | | 8,418,506 | |
Reynolds Group Holdings, Inc., 7.875%, 8/15/19 | | | 5,025 | | | | 5,395,594 | |
Reynolds Group Holdings, Inc., 9.875%, 8/15/19 | | | 35,740 | | | | 39,045,950 | |
Sealed Air Corp., 8.375%, 9/15/21(1) | | | 17,030 | | | | 19,371,625 | |
Signode Industrial Group Lux SA/Signode Industrial Group US, Inc., 6.375%, 5/1/22(1) | | | 6,570 | | | | 6,389,325 | |
| | | | | | | | | |
| | | $ | 121,674,105 | |
| | | | | | | | | |
| | | | | | | | |
| Security | | Principal
Amount
(000’s omitted) | | | Value | |
| | | | | | | | |
| | |
Diversified Financial Services — 3.4% | | | | | | | | |
Alliance Data Systems Corp., 6.375%, 4/1/20(1) | | $ | 5,350 | | | $ | 5,644,250 | |
Ally Financial, Inc., 5.50%, 2/15/17 | | | 16,320 | | | | 17,400,384 | |
Ally Financial, Inc., 6.25%, 12/1/17 | | | 5,890 | | | | 6,434,825 | |
AWAS Aviation Capital, Ltd., 7.00%, 10/17/16(1) | | | 11,796 | | | | 12,061,189 | |
CIT Group, Inc., 5.25%, 3/15/18 | | | 12,025 | | | | 12,716,437 | |
CIT Group, Inc., 5.375%, 5/15/20 | | | 1,275 | | | | 1,367,438 | |
CIT Group, Inc., 5.50%, 2/15/19(1) | | | 5,730 | | | | 6,131,100 | |
Icahn Enterprises, LP/Icahn Enterprises Finance Corp., 3.50%, 3/15/17 | | | 3,730 | | | | 3,720,675 | |
Icahn Enterprises, LP/Icahn Enterprises Finance Corp., 6.00%, 8/1/20 | | | 7,135 | | | | 7,527,425 | |
International Lease Finance Corp., 8.25%, 12/15/20 | | | 16,365 | | | | 19,678,912 | |
International Lease Finance Corp., 8.625%, 9/15/15 | | | 8,255 | | | | 8,678,069 | |
International Lease Finance Corp., 8.625%, 1/15/22 | | | 9,855 | | | | 12,244,838 | |
International Lease Finance Corp., 8.75%, 3/15/17 | | | 5,350 | | | | 6,022,094 | |
Navient Corp., 5.50%, 1/15/19 | | | 19,775 | | | | 20,553,739 | |
Navient Corp., 6.125%, 3/25/24 | | | 1,790 | | | | 1,852,668 | |
Navient Corp., 7.25%, 1/25/22 | | | 4,420 | | | | 4,950,400 | |
Navient Corp., 8.00%, 3/25/20 | | | 10,785 | | | | 12,402,750 | |
Neuberger Berman Group, LLC/Neuberger Berman Finance Corp., 5.625%, 3/15/20(1) | | | 11,090 | | | | 11,644,500 | |
| | | | | | | | | |
| | | $ | 171,031,693 | |
| | | | | | | | | |
| | |
Diversified Media — 1.2% | | | | | | | | |
Clear Channel Worldwide Holdings, Inc., Series A,
6.50%, 11/15/22 | | $ | 6,075 | | | $ | 6,287,625 | |
Clear Channel Worldwide Holdings, Inc., Series B, 6.50%, 11/15/22 | | | 11,805 | | | | 12,277,200 | |
Clear Channel Worldwide Holdings, Inc., Series A, 7.625%, 3/15/20 | | | 2,005 | | | | 2,125,300 | |
IAC/InterActiveCorp, 4.875%, 11/30/18 | | | 13,475 | | | | 13,946,625 | |
National CineMedia, LLC, 6.00%, 4/15/22 | | | 8,240 | | | | 8,384,200 | |
National CineMedia, LLC, 7.875%, 7/15/21 | | | 3,450 | | | | 3,691,500 | |
Nielsen Co. Luxembourg S.a.r.l. (The), 5.50%, 10/1/21(1) | | | 5,585 | | | | 5,822,363 | |
Southern Graphics, Inc., 8.375%, 10/15/20(1) | | | 6,505 | | | | 6,732,675 | |
| | | | | | | | | |
| | | $ | 59,267,488 | |
| | | | | | | | | |
| | |
Energy — 13.2% | | | | | | | | |
American Energy-Permian Basin, LLC/AEPB Finance Corp., 7.125%, 11/1/20(1) | | $ | 9,100 | | | $ | 8,047,812 | |
American Energy-Permian Basin, LLC/AEPB Finance Corp., 7.375%, 11/1/21(1) | | | 6,150 | | | | 5,412,000 | |
AmeriGas Finance LLC/AmeriGas Finance Corp., 6.75%, 5/20/20 | | | 4,795 | | | | 5,130,650 | |
AmeriGas Finance LLC/AmeriGas Finance Corp., 7.00%, 5/20/22 | | | 22,315 | | | | 24,211,775 | |
| | | | |
| | 23 | | See Notes to Financial Statements. |
Boston Income Portfolio
October 31, 2014
Portfolio of Investments — continued
| | | | | | | | |
| Security | | Principal
Amount
(000’s omitted) | | | Value | |
| | | | | | | | |
| | |
Energy (continued) | | | | | | | | |
AmeriGas Partners LP/AmeriGas Finance Corp., 6.25%, 8/20/19 | | $ | 5,490 | | | $ | 5,764,500 | |
Antero Resources Finance Corp., 5.375%, 11/1/21 | | | 13,010 | | | | 13,253,937 | |
Antero Resources Finance Corp., 6.00%, 12/1/20 | | | 2,115 | | | | 2,210,175 | |
Athlon Holdings LP/Athlon Finance Corp., 6.00%, 5/1/22(1) | | | 5,990 | | | | 6,465,456 | |
Berry Petroleum Co., LLC, 6.375%, 9/15/22 | | | 12,555 | | | | 11,738,925 | |
Bonanza Creek Energy, Inc., 6.75%, 4/15/21 | | | 10,040 | | | | 10,115,300 | |
Calfrac Holdings, LP, 7.50%, 12/1/20(1) | | | 2,860 | | | | 2,931,500 | |
California Resources Corp., 5.50%, 9/15/21(1) | | | 9,375 | | | | 9,574,219 | |
California Resources Corp., 6.00%, 11/15/24(1) | | | 9,375 | | | | 9,632,812 | |
Chesapeake Energy Corp., 3.481%, 4/15/19(5) | | | 10,910 | | | | 10,944,803 | |
Chesapeake Energy Corp., 6.125%, 2/15/21 | | | 16,325 | | | | 18,202,375 | |
Chesapeake Energy Corp., 7.25%, 12/15/18 | | | 14,795 | | | | 17,032,744 | |
Concho Resources, Inc., 5.50%, 4/1/23 | | | 27,330 | | | | 29,038,125 | |
Concho Resources, Inc., 6.50%, 1/15/22 | | | 4,730 | | | | 5,132,050 | |
Concho Resources, Inc., 7.00%, 1/15/21 | | | 5,535 | | | | 5,998,556 | |
CrownRock, LP/CrownRock Finance, Inc., 7.125%, 4/15/21(1) | | | 14,435 | | | | 14,362,825 | |
CVR Refining, LLC/Coffeyville Finance, Inc., 6.50%, 11/1/22 | | | 18,895 | | | | 19,178,425 | |
Denbury Resources, Inc., 5.50%, 5/1/22 | | | 4,790 | | | | 4,724,138 | |
Endeavor Energy Resources, LP/EER Finance, Inc., 7.00%, 8/15/21(1) | | | 17,395 | | | | 17,655,925 | |
Energy Transfer Equity, LP, 5.875%, 1/15/24 | | | 13,685 | | | | 14,437,675 | |
EP Energy, LLC/Everest Acquisition Finance, Inc., 6.875%, 5/1/19 | | | 4,205 | | | | 4,394,225 | |
EP Energy, LLC/Everest Acquisition Finance, Inc., 7.75%, 9/1/22 | | | 4,120 | | | | 4,367,200 | |
EP Energy, LLC/Everest Acquisition Finance, Inc., 9.375%, 5/1/20 | | | 13,545 | | | | 14,865,637 | |
Freeport-McMoran Oil & Gas, LLC/FCX Oil & Gas, Inc., 6.875%, 2/15/23 | | | 5,209 | | | | 5,904,089 | |
Gulfport Energy Corp., 7.75%, 11/1/20(1) | | | 10,905 | | | | 11,177,625 | |
Harvest Operations Corp., 6.875%, 10/1/17 | | | 2,710 | | | | 2,777,750 | |
Holly Energy Partners, LP/Holly Energy Finance Corp., 6.50%, 3/1/20 | | | 2,605 | | | | 2,715,713 | |
Kodiak Oil & Gas Corp., 5.50%, 1/15/21 | | | 2,285 | | | | 2,330,700 | |
Kodiak Oil & Gas Corp., 8.125%, 12/1/19 | | | 20,655 | | | | 22,307,400 | |
Laredo Petroleum, Inc., 7.375%, 5/1/22 | | | 22,163 | | | | 23,160,335 | |
MEG Energy Corp., 6.375%, 1/30/23(1) | | | 9,040 | | | | 8,994,800 | |
Memorial Resource Development Corp., 5.875%, 7/1/22(1) | | | 4,875 | | | | 4,765,313 | |
Murphy Oil USA, Inc., 6.00%, 8/15/23 | | | 6,605 | | | | 6,951,763 | |
Oasis Petroleum, Inc., 6.50%, 11/1/21 | | | 3,365 | | | | 3,465,950 | |
Oasis Petroleum, Inc., 6.875%, 3/15/22 | | | 12,145 | | | | 12,691,525 | |
Oasis Petroleum, Inc., 6.875%, 1/15/23 | | | 14,595 | | | | 15,251,775 | |
PBF Holding Co., LLC/PBF Finance Corp., 8.25%, 2/15/20 | | | 8,520 | | | | 8,956,650 | |
Precision Drilling Corp., 6.50%, 12/15/21 | | | 9,435 | | | | 9,718,050 | |
Precision Drilling Corp., 6.625%, 11/15/20 | | | 3,450 | | | | 3,570,750 | |
| | | | | | | | |
| Security | | Principal
Amount
(000’s omitted) | | | Value | |
| | | | | | | | |
| | |
Energy (continued) | | | | | | | | |
Range Resources Corp., 5.00%, 8/15/22 | | $ | 4,700 | | | $ | 4,952,625 | |
Range Resources Corp., 6.75%, 8/1/20 | | | 5,485 | | | | 5,827,813 | |
Rice Energy, Inc., 6.25%, 5/1/22(1) | | | 14,805 | | | | 14,388,609 | |
Rosetta Resources, Inc., 5.625%, 5/1/21 | | | 9,020 | | | | 8,794,500 | |
Rosetta Resources, Inc., 5.875%, 6/1/22 | | | 13,460 | | | | 12,988,900 | |
RSP Permian, Inc., 6.625%, 10/1/22(1) | | | 6,865 | | | | 6,855,046 | |
Sabine Pass Liquefaction, LLC, 5.625%, 2/1/21 | | | 19,500 | | | | 20,523,750 | |
Sabine Pass Liquefaction, LLC, 5.625%, 4/15/23 | | | 2,015 | | | | 2,095,600 | |
Sabine Pass Liquefaction, LLC, 5.625%, 4/15/23(1) | | | 11,975 | | | | 12,454,000 | |
Sabine Pass Liquefaction, LLC, 5.75%, 5/15/24(1) | | | 19,215 | | | | 19,959,581 | |
Sabine Pass LNG, LP, 6.50%, 11/1/20 | | | 12,645 | | | | 13,435,312 | |
Samson Investment Co., 9.75%, 2/15/20 | | | 9,755 | | | | 7,121,150 | |
SESI, LLC, 6.375%, 5/1/19 | | | 11,995 | | | | 12,534,775 | |
Seven Generations Energy, Ltd., 8.25%, 5/15/20(1) | | | 21,740 | | | | 22,935,700 | |
Seventy Seven Energy, Inc., 6.50%, 7/15/22(1) | | | 8,790 | | | | 8,306,550 | |
Seventy Seven Operating, LLC, 6.625%, 11/15/19 | | | 3,875 | | | | 3,855,625 | |
SM Energy Co., 6.50%, 1/1/23 | | | 8,890 | | | | 9,223,375 | |
Tesoro Corp., 5.375%, 10/1/22 | | | 11,035 | | | | 11,421,225 | |
Tesoro Logistics, LP/Tesoro Logistics Finance Corp., 5.50%, 10/15/19(1) | | | 3,100 | | | | 3,193,000 | |
Tesoro Logistics, LP/Tesoro Logistics Finance Corp., 6.25%, 10/15/22(1) | | | 7,445 | | | | 7,724,187 | |
Triangle USA Petroleum Corp., 6.75%, 7/15/22(1) | | | 7,250 | | | | 6,380,000 | |
Ultra Petroleum Corp., 5.75%, 12/15/18(1) | | | 2,715 | | | | 2,701,425 | |
WPX Energy, Inc., 5.25%, 1/15/17 | | | 2,770 | | | | 2,908,500 | |
WPX Energy, Inc., 6.00%, 1/15/22 | | | 4,615 | | | | 4,857,288 | |
| | | | | | | | | |
| | | $ | 665,002,488 | |
| | | | | | | | | |
| | |
Entertainment / Film — 0.2% | | | | | | | | |
Activision Blizzard, Inc.,
6.125%, 9/15/23(1) | | $ | 5,140 | | | $ | 5,576,900 | |
Regal Entertainment Group, 5.75%, 3/15/22 | | | 5,440 | | | | 5,344,800 | |
| | | | | | | | | |
| | | $ | 10,921,700 | |
| | | | | | | | | |
| | |
Environmental — 0.7% | | | | | | | | |
ADS Waste Holdings, Inc., 8.25%, 10/1/20 | | $ | 6,410 | | | $ | 6,746,525 | |
Clean Harbors, Inc., 5.125%, 6/1/21 | | | 3,865 | | | | 3,951,963 | |
Covanta Holding Corp., 5.875%, 3/1/24 | | | 7,990 | | | | 8,289,625 | |
Covanta Holding Corp., 6.375%, 10/1/22 | | | 8,930 | | | | 9,555,100 | |
Darling Ingredients, Inc., 5.375%, 1/15/22 | | | 6,490 | | | | 6,530,562 | |
| | | | | | | | | |
| | | $ | 35,073,775 | |
| | | | | | | | | |
| | |
Food & Drug Retail — 0.2% | | | | | | | | |
Albertsons Holdings, LLC/Saturn Acquisition Merger Sub, Inc., 7.75%, 10/15/22(1) | | $ | 9,355 | | | $ | 9,261,450 | |
| | | | | | | | | |
| | | $ | 9,261,450 | |
| | | | | | | | | |
| | | | |
| | 24 | | See Notes to Financial Statements. |
Boston Income Portfolio
October 31, 2014
Portfolio of Investments — continued
| | | | | | | | |
| Security | | Principal
Amount
(000’s omitted) | | | Value | |
| | | | | | | | |
| | |
Food / Beverage / Tobacco — 1.2% | | | | | | | | |
ASG Consolidated, LLC/ASG Finance, Inc., 15.00%, 5/15/17(1)(2) | | $ | 9,974 | | | $ | 7,280,811 | |
Constellation Brands, Inc., 4.25%, 5/1/23 | | | 15,225 | | | | 15,339,187 | |
Constellation Brands, Inc., 6.00%, 5/1/22 | | | 2,650 | | | | 2,974,625 | |
Cott Beverages, Inc., 5.375%, 7/1/22(1) | | | 12,815 | | | | 12,718,887 | |
Pinnacle Operating Corp., 9.00%, 11/15/20(1) | | | 5,815 | | | | 6,280,200 | |
Post Holdings, Inc., 6.00%, 12/15/22(1) | | | 6,205 | | | | 6,003,338 | |
Post Holdings, Inc., 6.75%, 12/1/21(1) | | | 6,695 | | | | 6,703,369 | |
WhiteWave Foods Co. (The), 5.375%, 10/1/22 | | | 4,380 | | | | 4,609,950 | |
| | | | | | | | | |
| | | $ | 61,910,367 | |
| | | | | | | | | |
| | |
Gaming — 2.8% | | | | | | | | |
Boyd Gaming Corp. Step Coupon HoldCo Note, 6.00% to 11/20/15,
11/20/18(2)(6)(7)(8) | | $ | 608 | | | $ | 658,511 | |
Buffalo Thunder Development Authority, 9.375%, 12/15/14(1)(9) | | | 11,355 | | | | 4,542,000 | |
Caesars Entertainment Operating Co., Inc., 9.00%, 2/15/20 | | | 4,680 | | | | 3,556,800 | |
GLP Capital, LP/GLP Financing II, Inc., 4.875%, 11/1/20 | | | 16,875 | | | | 17,634,375 | |
MGM Resorts International, 7.75%, 3/15/22 | | | 24,755 | | | | 28,592,025 | |
New Cotai, LLC/New Cotai Capital Corp., 10.625%, 5/1/19(1)(2) | | | 12,380 | | | | 13,510,285 | |
Penn National Gaming, Inc., 5.875%, 11/1/21 | | | 6,540 | | | | 6,278,400 | |
Station Casinos, LLC, 7.50%, 3/1/21 | | | 13,965 | | | | 14,663,250 | |
Studio City Finance, Ltd.,
8.50%, 12/1/20(1) | | | 31,655 | | | | 34,503,950 | |
Tunica-Biloxi Gaming Authority, 9.00%, 11/15/15(1) | | | 9,455 | | | | 5,862,100 | |
Waterford Gaming, LLC,
8.625%, 9/15/14(1)(7)(15) | | | 4,631 | | | | 796,532 | |
Wynn Macau, Ltd., 5.25%, 10/15/21(1) | | | 9,535 | | | | 9,582,675 | |
| | | | | | | | | |
| | | $ | 140,180,903 | |
| | | | | | | | | |
| | |
Health Care — 10.9% | | | | | | | | |
Air Medical Group Holdings, Inc., 9.25%, 11/1/18 | | $ | 8,888 | | | $ | 9,321,290 | |
Alere, Inc., 6.50%, 6/15/20 | | | 5,330 | | | | 5,529,875 | |
Alere, Inc., 8.625%, 10/1/18 | | | 7,215 | | | | 7,548,694 | |
Amsurg Corp., 5.625%, 11/30/20 | | | 10,540 | | | | 10,908,900 | |
Amsurg Corp., 5.625%, 7/15/22(1) | | | 9,090 | | | | 9,463,826 | |
Biomet, Inc., 6.50%, 8/1/20 | | | 21,970 | | | | 23,562,825 | |
Capsugel SA, 7.00%, 5/15/19(1)(2) | | | 3,795 | | | | 3,866,156 | |
CHS/Community Health Systems, Inc., 5.125%, 8/15/18 | | | 6,860 | | | | 7,151,550 | |
CHS/Community Health Systems, Inc., 6.875%, 2/1/22 | | | 21,770 | | | | 23,538,812 | |
CHS/Community Health Systems, Inc., 7.125%, 7/15/20 | | | 17,450 | | | | 18,911,437 | |
ConvaTec Finance International SA, 8.25%, 1/15/19(1)(2) | | | 20,485 | | | | 20,935,670 | |
ConvaTec Healthcare E SA, 10.50%, 12/15/18(1) | | | 19,210 | | | | 20,386,612 | |
Endo Finance, LLC & Endo Finco, Inc., 7.00%, 12/15/20(1) | | | 4,473 | | | | 4,735,789 | |
Endo Finance, LLC & Endo Finco, Inc., 7.25%, 1/15/22(1) | | | 1,280 | | | | 1,372,800 | |
| | | | | | | | |
| Security | | Principal
Amount
(000’s omitted) | | | Value | |
| | | | | | | | |
| | |
Health Care (continued) | | | | | | | | |
Fresenius Medical Care US Finance II, Inc., 5.625%, 7/31/19(1) | | $ | 6,375 | | | $ | 6,861,094 | |
Fresenius Medical Care US Finance II, Inc., 5.875%, 1/31/22(1) | | | 5,315 | | | | 5,819,925 | |
Grifols Worldwide Operations, Ltd., 5.25%, 4/1/22(1) | | | 6,580 | | | | 6,760,950 | |
HCA Holdings, Inc., 6.25%, 2/15/21 | | | 18,865 | | | | 20,350,619 | |
HCA, Inc., 6.50%, 2/15/20 | | | 12,235 | | | | 13,703,200 | |
HCA, Inc., 7.50%, 2/15/22 | | | 10,400 | | | | 12,103,000 | |
Hologic, Inc., 6.25%, 8/1/20 | | | 27,285 | | | | 28,819,781 | |
IMS Health, Inc., 6.00%, 11/1/20(1) | | | 9,615 | | | | 9,999,600 | |
INC Research, LLC, 11.50%, 7/15/19(1) | | | 15,760 | | | | 17,730,000 | |
Jaguar Holding Co. I, 9.375%, 10/15/17(1)(2) | | | 4,050 | | | | 4,156,313 | |
Jaguar Holding Co. II/Jaguar Merger Sub, Inc., 9.875%, 1/15/19(1) | | | 9,248 | | | | 10,010,960 | |
Kinetic Concepts, Inc./KCI USA, Inc., 10.50%, 11/1/18 | | | 18,765 | | | | 20,735,325 | |
MPH Acquisition Holdings, LLC, 6.625%, 4/1/22(1) | | | 30,775 | | | | 32,275,281 | |
Opal Acquisition, Inc.,
8.875%, 12/15/21(1) | | | 11,440 | | | | 11,983,400 | |
Pharmaceutical Product Development, Inc., 9.50%, 12/1/19(1) | | | 23,885 | | | | 25,706,231 | |
ResCare, Inc., 10.75%, 1/15/19 | | | 9,675 | | | | 10,376,437 | |
Salix Pharmaceuticals, Ltd., 6.00%, 1/15/21(1) | | | 12,640 | | | | 13,714,400 | |
STHI Holding Corp., 8.00%, 3/15/18(1) | | | 9,840 | | | | 10,344,300 | |
Teleflex, Inc., 5.25%, 6/15/24(1) | | | 4,200 | | | | 4,273,500 | |
Teleflex, Inc., 6.875%, 6/1/19 | | | 1,925 | | | | 2,074,188 | |
Tenet Healthcare Corp., 5.00%, 3/1/19(1) | | | 4,470 | | | | 4,486,763 | |
Tenet Healthcare Corp., 6.00%, 10/1/20 | | | 7,755 | | | | 8,356,013 | |
Tenet Healthcare Corp., 8.125%, 4/1/22 | | | 30,620 | | | | 35,174,725 | |
United Surgical Partners International, Inc., 9.00%, 4/1/20 | | | 8,475 | | | | 9,195,375 | |
Valeant Pharmaceuticals International, Inc., 6.375%, 10/15/20(1) | | | 24,390 | | | | 25,121,700 | |
Valeant Pharmaceuticals International, Inc., 7.50%, 7/15/21(1) | | | 7,980 | | | | 8,568,525 | |
VWR Funding, Inc., 7.25%, 9/15/17 | | | 7,580 | | | | 7,987,425 | |
WellCare Health Plans, Inc., 5.75%, 11/15/20 | | | 17,130 | | | | 17,726,124 | |
| | | | | | | | | |
| | | $ | 551,649,390 | |
| | | | | | | | | |
| | |
Homebuilders / Real Estate — 0.6% | | | | | | | | |
Brookfield Residential Properties, Inc., 6.50%, 12/15/20(1) | | $ | 9,755 | | | $ | 10,437,850 | |
TRI Pointe Holdings, Inc., 4.375%, 6/15/19(1) | | | 9,190 | | | | 9,178,513 | |
TRI Pointe Holdings, Inc., 5.875%, 6/15/24(1) | | | 9,660 | | | | 9,889,425 | |
| | | | | | | | | |
| | | $ | 29,505,788 | |
| | | | | | | | | |
| | | | |
| | 25 | | See Notes to Financial Statements. |
Boston Income Portfolio
October 31, 2014
Portfolio of Investments — continued
| | | | | | | | |
| Security | | Principal
Amount
(000’s omitted) | | | Value | |
| | | | | | | | |
| | |
Hotels — 0.6% | | | | | | | | |
Carlson Travel Holdings, Inc., 7.50%, 8/15/19(1)(2) | | $ | 8,775 | | | $ | 8,818,875 | |
Hilton Worldwide Finance, LLC/Hilton Worldwide Finance Corp., 5.625%, 10/15/21(1) | | | 16,325 | | | | 17,233,078 | |
Playa Resorts Holding B.V., 8.00%, 8/15/20(1) | | | 6,005 | | | | 6,275,225 | |
| | | | | | | | | |
| | | $ | 32,327,178 | |
| | | | | | | | | |
| | |
Insurance — 0.7% | | | | | | | | |
A-S Co-Issuer Subsidiary, Inc./A-S Merger Sub, LLC, 7.875%, 12/15/20(1) | | $ | 9,810 | | | $ | 10,153,350 | |
Hub Holdings, LLC/Hub Holdings Finance, Inc., 8.125%, 7/15/19(1)(2) | | | 9,155 | | | | 9,132,113 | |
USI, Inc., 7.75%, 1/15/21(1) | | | 16,115 | | | | 16,397,012 | |
| | | | | | | | | |
| | | $ | 35,682,475 | |
| | | | | | | | | |
| | |
Leisure — 0.9% | | | | | | | | |
NCL Corp., Ltd., 5.00%, 2/15/18 | | $ | 5,080 | | | $ | 5,105,400 | |
Royal Caribbean Cruises, 7.25%, 6/15/16 | | | 2,185 | | | | 2,370,725 | |
Royal Caribbean Cruises, 7.25%, 3/15/18 | | | 4,390 | | | | 4,949,725 | |
Seven Seas Cruises, S. DE R.L., 9.125%, 5/15/19 | | | 15,870 | | | | 16,941,225 | |
Viking Cruises, Ltd., 8.50%, 10/15/22(1) | | | 16,385 | | | | 17,818,688 | |
| | | | | | | | | |
| | | $ | 47,185,763 | |
| | | | | | | | | |
| | |
Metals / Mining — 1.9% | | | | | | | | |
Alpha Natural Resources, Inc., 7.50%, 8/1/20(1) | | $ | 3,000 | | | $ | 2,407,500 | |
CONSOL Energy, Inc., 5.875%, 4/15/22(1) | | | 11,775 | | | | 11,995,781 | |
Eldorado Gold Corp., 6.125%, 12/15/20(1) | | | 20,705 | | | | 20,601,475 | |
First Quantum Minerals, Ltd., 6.75%, 2/15/20(1) | | | 5,160 | | | | 5,018,100 | |
First Quantum Minerals, Ltd., 7.00%, 2/15/21(1) | | | 3,370 | | | | 3,323,663 | |
IAMGOLD Corp., 6.75%, 10/1/20(1) | | | 7,690 | | | | 6,382,700 | |
Imperial Metals Corp., 7.00%, 3/15/19(1) | | | 5,325 | | | | 5,032,125 | |
KGHM International, Ltd.,
7.75%, 6/15/19(1) | | | 13,250 | | | | 14,111,250 | |
New Gold, Inc., 6.25%, 11/15/22(1) | | | 8,525 | | | | 8,375,812 | |
New Gold, Inc., 7.00%, 4/15/20(1) | | | 4,265 | | | | 4,350,300 | |
Novelis, Inc., 8.375%, 12/15/17 | | | 4,800 | | | | 5,022,000 | |
SunCoke Energy Inc., 7.625%, 8/1/19 | | | 1,753 | | | | 1,841,614 | |
SunCoke Energy Partners, LP/SunCoke Energy Partners Finance Corp., 7.375%, 2/1/20(1) | | | 2,920 | | | | 3,066,000 | |
SunCoke Energy Partners, LP/SunCoke Energy Partners Finance Corp., 7.375%, 2/1/20(1) | | | 5,985 | | | | 6,284,250 | |
| | | | | | | | | |
| | | $ | 97,812,570 | |
| | | | | | | | | |
| | |
Paper — 0.2% | | | | | | | | |
Domtar Corp., 10.75%, 6/1/17 | | $ | 8,205 | | | $ | 9,907,439 | |
| | | | | | | | | |
| | | $ | 9,907,439 | |
| | | | | | | | | |
| | | | | | | | |
| Security | | Principal
Amount
(000’s omitted) | | | Value | |
| | | | | | | | |
| | |
Publishing / Printing — 0.5% | | | | | | | | |
McGraw-Hill Global Education Holdings, LLC/McGraw-Hill Global Education Finance, 9.75%, 4/1/21 | | $ | 18,560 | | | $ | 21,065,600 | |
MHGE Parent, LLC/MHGE Parent Finance, Inc., 8.50%, 8/1/19(1)(2) | | | 5,415 | | | | 5,367,619 | |
| | | | | | | | | |
| | | $ | 26,433,219 | |
| | | | | | | | | |
| | |
Railroad — 0.2% | | | | | | | | |
Florida East Coast Holdings Corp., 6.75%, 5/1/19(1) | | $ | 4,185 | | | $ | 4,328,880 | |
Watco Cos., LLC/Watco Finance Corp., 6.375%, 4/1/23(1) | | | 5,390 | | | | 5,497,800 | |
| | | | | | | | | |
| | | $ | 9,826,680 | |
| | | | | | | | | |
| | |
Restaurants — 0.9% | | | | | | | | |
1011778 B.C. ULC/New Red Finance, Inc., 6.00%, 4/1/22(1) | | $ | 24,115 | | | $ | 24,567,156 | |
NPC International, Inc., 10.50%, 1/15/20 | | | 21,695 | | | | 22,725,513 | |
| | | | | | | | | |
| | | $ | 47,292,669 | |
| | | | | | | | | |
| | |
Services — 6.5% | | | | | | | | |
Algeco Scotsman Global Finance PLC, 10.75%, 10/15/19(1) | | $ | 2,880 | | | $ | 2,851,200 | |
Anna Merger Sub, Inc., 7.75%, 10/1/22(1) | | | 27,315 | | | | 28,202,737 | |
Audatex North America, Inc., 6.00%, 6/15/21(1) | | | 7,815 | | | | 8,303,437 | |
Avis Budget Car Rental, LLC/Avis Budget Finance, Inc., 9.75%, 3/15/20 | | | 20,135 | | | | 22,299,512 | |
BlueLine Rental Finance Corp., 7.00%, 2/1/19(1) | | | 4,425 | | | | 4,679,438 | |
Carlson Wagonlit BV, 6.875%, 6/15/19(1) | | | 22,925 | | | | 23,842,000 | |
FTI Consulting, Inc., 6.00%, 11/15/22 | | | 8,505 | | | | 8,749,519 | |
Hertz Corp. (The), 6.25%, 10/15/22 | | | 9,780 | | | | 10,024,500 | |
IHS, Inc., 5.00%, 11/1/22(1) | | | 9,300 | | | | 9,486,000 | |
Laureate Education, Inc.,
9.75%, 9/1/19(1) | | | 88,220 | | | | 91,307,700 | |
ServiceMaster Co. (The), 7.00%, 8/15/20 | | | 6,689 | | | | 7,107,063 | |
ServiceMaster Co. (The), 8.00%, 2/15/20 | | | 9,828 | | | | 10,540,530 | |
TMS International Corp., 7.625%, 10/15/21(1) | | | 11,465 | | | | 12,038,250 | |
TransUnion Holding Co., Inc., 8.125%, 6/15/18(2) | | | 14,280 | | | | 14,886,900 | |
TransUnion Holding Co., Inc., 9.625%, 6/15/18(2) | | | 17,320 | | | | 17,926,200 | |
United Rentals North America, Inc., 6.125%, 6/15/23 | | | 5,640 | | | | 6,091,200 | |
United Rentals North America, Inc., 7.375%, 5/15/20 | | | 18,280 | | | | 19,925,200 | |
United Rentals North America, Inc., 7.625%, 4/15/22 | | | 16,030 | | | | 17,953,600 | |
United Rentals North America, Inc., 8.25%, 2/1/21 | | | 1,195 | | | | 1,308,525 | |
United Rentals North America, Inc., 8.375%, 9/15/20 | | | 2,650 | | | | 2,881,875 | |
Vander Intermediate Holding II Corp., 9.75%, 2/1/19(1)(2) | | | 8,080 | | | | 8,585,000 | |
| | | | | | | | | |
| | | $ | 328,990,386 | |
| | | | | | | | | |
| | | | |
| | 26 | | See Notes to Financial Statements. |
Boston Income Portfolio
October 31, 2014
Portfolio of Investments — continued
| | | | | | | | |
| Security | | Principal
Amount
(000’s omitted) | | | Value | |
| | | | | | | | |
| | |
Steel — 0.2% | | | | | | | | |
AK Steel Corp., 8.75%, 12/1/18 | | $ | 5,800 | | | $ | 6,358,250 | |
ArcelorMittal, 6.75%, 2/25/22 | | | 3,775 | | | | 4,209,503 | |
| | | | | | | | | |
| | | $ | 10,567,753 | |
| | | | | | | | | |
| | |
Super Retail — 5.3% | | | | | | | | |
Academy, Ltd./Academy Finance Corp., 9.25%, 8/1/19(1) | | $ | 12,105 | | | $ | 12,952,350 | |
Claire’s Stores, Inc., 9.00%, 3/15/19(1) | | | 19,505 | | | | 20,041,387 | |
Dufry Finance SCA, 5.50%, 10/15/20(1) | | | 1,945 | | | | 1,993,820 | |
Hot Topic, Inc., 9.25%, 6/15/21(1) | | | 22,965 | | | | 24,802,200 | |
L Brands, Inc., 6.625%, 4/1/21 | | | 21,680 | | | | 24,661,000 | |
L Brands, Inc., 8.50%, 6/15/19 | | | 12,810 | | | | 15,372,000 | |
Levi Strauss & Co., 6.875%, 5/1/22 | | | 10,830 | | | | 11,831,775 | |
Men’s Wearhouse, Inc. (The), 7.00%, 7/1/22(1) | | | 12,350 | | | | 12,859,438 | |
Michaels FinCo Holdings, LLC/Michaels FinCo, Inc., 7.50%, 8/1/18(1)(2) | | | 6,169 | | | | 6,292,380 | |
Michaels Stores, Inc.,
5.875%, 12/15/20(1) | | | 6,650 | | | | 6,749,750 | |
Neiman Marcus Group, Ltd., LLC, 8.75%, 10/15/21(1)(2) | | | 7,040 | | | | 7,568,000 | |
New Academy Finance Co., LLC/New Academy Finance Corp., 8.00%, 6/15/18(1)(2) | | | 19,425 | | | | 19,594,969 | |
Pantry, Inc. (The), 8.375%, 8/1/20 | | | 8,100 | | | | 8,545,500 | |
Party City Holdings, Inc., 8.875%, 8/1/20 | | | 18,585 | | | | 20,257,650 | |
Petco Animal Supplies, Inc., 9.25%, 12/1/18(1) | | | 10,965 | | | | 11,458,425 | |
Petco Holdings, Inc.,
8.50%, 10/15/17(1)(2) | | | 16,095 | | | | 16,215,712 | |
Phillips-Van Heusen Corp., 7.75%, 11/15/23 | | | 13,090 | | | | 15,900,462 | |
Radio Systems Corp., 8.375%, 11/1/19(1) | | | 7,690 | | | | 8,353,263 | |
rue21, Inc., 9.00%, 10/15/21(1) | | | 14,540 | | | | 10,577,850 | |
Sally Holdings, LLC/Sally Capital, Inc., 5.75%, 6/1/22 | | | 9,940 | | | | 10,635,800 | |
| | | | | | | | | |
| | | $ | 266,663,731 | |
| | | | | | | | | |
| | |
Technology — 5.0% | | | | | | | | |
Alcatel-Lucent USA, Inc.,
4.625%, 7/1/17(1) | | $ | 5,685 | | | $ | 5,805,806 | |
Alcatel-Lucent USA, Inc., 6.75%, 11/15/20(1) | | | 10,240 | | | | 10,598,400 | |
Alcatel-Lucent USA, Inc.,
8.875%, 1/1/20(1) | | | 34,330 | | | | 37,848,825 | |
Avaya, Inc., 9.00%, 4/1/19(1) | | | 12,420 | | | | 12,792,600 | |
Avaya, Inc., 10.50%, 3/1/21(1) | | | 14,546 | | | | 12,818,652 | |
Ceridian, LLC/Comdata, Inc., 8.125%, 11/15/17(1) | | | 7,235 | | | | 7,253,088 | |
CommScope Holding Co., Inc., 6.625%, 6/1/20(1)(2) | | | 8,145 | | | | 8,613,337 | |
First Data Corp., 6.75%, 11/1/20(1) | | | 9,464 | | | | 10,150,140 | |
First Data Corp., 7.375%, 6/15/19(1) | | | 10,635 | | | | 11,299,687 | |
First Data Corp., 10.625%, 6/15/21 | | | 7,039 | | | | 8,147,643 | |
First Data Corp., 11.25%, 1/15/21 | | | 9,513 | | | | 10,987,515 | |
First Data Corp., 11.75%, 8/15/21 | | | 9,484 | | | | 11,166,821 | |
Freescale Semiconductor, Inc., 6.00%, 1/15/22(1) | | | 8,000 | | | | 8,220,000 | |
Infor Software Parent, LLC/Infor Software Parent, Inc., 7.125%, 5/1/21(1)(2) | | | 13,905 | | | | 14,148,337 | |
| | | | | | | | |
| Security | | Principal
Amount
(000’s omitted) | | | Value | |
| | | | | | | | |
| | |
Technology (continued) | | | | | | | | |
Infor US, Inc., 9.375%, 4/1/19 | | $ | 21,375 | | | $ | 23,325,469 | |
Nuance Communications, Inc., 5.375%, 8/15/20(1) | | | 14,265 | | | | 14,407,650 | |
NXP BV/NXP Funding, LLC, 5.75%, 2/15/21(1) | | | 4,505 | | | | 4,775,300 | |
Sensata Technologies B.V., 5.625%, 11/1/24(1) | | | 2,805 | | | | 2,966,288 | |
SunGard Availability Services Capital, Inc., 8.75%, 4/1/22(1) | | | 12,465 | | | | 9,224,100 | |
SunGard Data Systems, Inc., 7.625%, 11/15/20 | | | 6,500 | | | | 6,963,125 | |
Zebra Technologies Corp., 7.25%, 10/15/22(1) | | | 19,875 | | | | 20,968,125 | |
| | | | | | | | | |
| | | $ | 252,480,908 | |
| | | | | | | | | |
| | |
Telecommunications — 8.0% | | | | | | | | |
CenturyLink, Inc., 6.75%, 12/1/23 | | $ | 16,255 | | | $ | 18,104,006 | |
Digicel, Ltd., 6.00%, 4/15/21(1) | | | 14,330 | | | | 14,509,125 | |
Digicel, Ltd., 8.25%, 9/1/17(1) | | | 11,140 | | | | 11,460,275 | |
Equinix, Inc., 7.00%, 7/15/21 | | | 4,815 | | | | 5,266,406 | |
Frontier Communications Corp., 6.25%, 9/15/21 | | | 9,340 | | | | 9,672,738 | |
Frontier Communications Corp., 6.875%, 1/15/25 | | | 9,340 | | | | 9,480,100 | |
Frontier Communications Corp., 7.625%, 4/15/24 | | | 2,695 | | | | 2,910,600 | |
Hughes Satellite Systems Corp., 6.50%, 6/15/19 | | | 13,025 | | | | 14,164,687 | |
Intelsat Jackson Holdings SA, 7.25%, 10/15/20 | | | 10,440 | | | | 11,170,800 | |
Intelsat Luxembourg SA, 7.75%, 6/1/21 | | | 23,765 | | | | 24,923,544 | |
Intelsat Luxembourg SA, 8.125%, 6/1/23 | | | 22,125 | | | | 23,618,437 | |
NII International Telecom SCA, 7.875%, 8/15/19(1)(9) | | | 10,610 | | | | 6,896,500 | |
SBA Communications Corp., 5.625%, 10/1/19 | | | 3,095 | | | | 3,234,275 | |
SBA Telecommunications, Inc., 5.75%, 7/15/20 | | | 5,570 | | | | 5,848,500 | |
Sprint Capital Corp., 8.75%, 3/15/32 | | | 5,050 | | | | 5,668,625 | |
Sprint Communications, Inc., 6.00%, 11/15/22 | | | 1,245 | | | | 1,246,556 | |
Sprint Communications, Inc., 7.00%, 8/15/20 | | | 17,935 | | | | 19,100,775 | |
Sprint Communications, Inc., 9.00%, 11/15/18(1) | | | 28,115 | | | | 33,140,556 | |
Sprint Communications, Inc., 9.125%, 3/1/17 | | | 5,150 | | | | 5,832,375 | |
Sprint Communications, Inc., 9.25%, 4/15/22 | | | 2,000 | | | | 2,360,000 | |
Sprint Corp., 7.25%, 9/15/21(1) | | | 18,505 | | | | 19,615,300 | |
Sprint Corp., 7.875%, 9/15/23(1) | | | 24,990 | | | | 27,114,150 | |
T-Mobile USA, Inc., 6.00%, 3/1/23 | | | 9,365 | | | | 9,669,363 | |
T-Mobile USA, Inc., 6.25%, 4/1/21 | | | 4,980 | | | | 5,216,550 | |
T-Mobile USA, Inc., 6.375%, 3/1/25 | | | 12,170 | | | | 12,535,100 | |
T-Mobile USA, Inc., 6.625%, 4/1/23 | | | 8,800 | | | | 9,328,000 | |
T-Mobile USA, Inc., 6.633%, 4/28/21 | | | 7,860 | | | | 8,311,950 | |
T-Mobile USA, Inc., 6.731%, 4/28/22 | | | 5,245 | | | | 5,566,256 | |
T-Mobile USA, Inc., 6.836%, 4/28/23 | | | 2,620 | | | | 2,780,475 | |
Wind Acquisition Finance SA, 4.75%, 7/15/20(1) | | | 20,545 | | | | 20,134,100 | |
Wind Acquisition Finance SA, 7.375%, 4/23/21(1) | | | 30,620 | | | | 30,007,600 | |
Windstream Corp., 7.75%, 10/1/21 | | | 17,895 | | | | 19,237,125 | |
Windstream Corp., 8.125%, 9/1/18 | | | 2,565 | | | | 2,676,578 | |
| | | | | | | | | |
| | | $ | 400,801,427 | |
| | | | | | | | | |
| | | | |
| | 27 | | See Notes to Financial Statements. |
Boston Income Portfolio
October 31, 2014
Portfolio of Investments — continued
| | | | | | | | |
| Security | | Principal
Amount
(000’s omitted) | | | Value | |
| | | | | | | | |
| | |
Transportation Ex Air / Rail — 0.7% | | | | | | | | |
CEVA Group, PLC, 7.00%, 3/1/21(1) | | $ | 2,540 | | | $ | 2,482,850 | |
CEVA Group, PLC, 9.00%, 9/1/21(1) | | | 9,200 | | | | 8,855,000 | |
XPO Logistics, Inc., 7.875%, 9/1/19(1) | | | 21,485 | | | | 22,666,675 | |
| | | | | | | | | |
| | | | | | $ | 34,004,525 | |
| | | | | | | | | |
| | |
Utilities — 1.7% | | | | | | | | |
AES Corp. (The), 5.50%, 3/15/24 | | $ | 5,440 | | | $ | 5,589,600 | |
Calpine Corp., 5.375%, 1/15/23 | | | 10,255 | | | | 10,370,369 | |
Calpine Corp., 5.75%, 1/15/25 | | | 4,560 | | | | 4,622,700 | |
Dynegy Finance I, Inc./Dynegy Finance II, Inc., 6.75%, 11/1/19(1) | | | 12,470 | | | | 12,922,037 | |
Dynegy Finance I, Inc./Dynegy Finance II, Inc., 7.375%, 11/1/22(1) | | | 12,470 | | | | 13,202,612 | |
Dynegy Finance I, Inc./Dynegy Finance II, Inc., 7.625%, 11/1/24(1) | | | 9,350 | | | | 9,922,688 | |
NRG Energy, Inc., 7.875%, 5/15/21 | | | 7,300 | | | | 7,993,500 | |
NRG Energy, Inc., 8.25%, 9/1/20 | | | 11,225 | | | | 12,193,156 | |
RJS Power Holdings, LLC, 5.125%, 7/15/19(1) | | | 9,085 | | | | 9,107,713 | |
| | | | | | | | | |
| | | | | | $ | 85,924,375 | |
| | | | | | | | | |
| | |
Total Corporate Bonds & Notes
(identified cost $4,304,194,527) | | | | | | $ | 4,449,647,694 | |
| | | | | | | | | |
|
| Senior Floating-Rate Interests — 6.0%(10) | |
| | |
| | | | | | | | |
| Borrower/Tranche Description | | Principal Amount (000’s omitted) | | | Value | |
| | |
Diversified Media — 0.2% | | | | | | | | |
WMG Acquisition Corp., Term Loan, 3.75%, Maturing 7/1/20 | | $ | 9,504 | | | $ | 9,220,857 | |
| | | | | | | | | |
| | | | | | $ | 9,220,857 | |
| | | | | | | | | |
| | |
Energy — 0.3% | | | | | | | | |
EP Energy LLC, Term Loan, 3.50%, Maturing 5/24/18 | | $ | 11,667 | | | $ | 11,426,042 | |
Samson Investment Company, Term Loan - Second Lien, 5.00%, Maturing 9/25/18 | | | 1,900 | | | | 1,767,000 | |
| | | | | | | | | |
| | | | | | $ | 13,193,042 | |
| | | | | | | | | |
| | |
Food & Drug Retail — 0.1% | | | | | | | | |
Rite Aid Corporation, Term Loan - Second Lien, 5.75%, Maturing 8/21/20 | | $ | 6,500 | | | $ | 6,546,039 | |
| | | | | | | | | |
| | | | | | $ | 6,546,039 | |
| | | | | | | | | |
| | | | | | | | |
| Borrower/Tranche Description | | Principal Amount (000’s omitted) | | | Value | |
| | | | | | | | |
| | |
Food / Beverage / Tobacco — 0.1% | | | | | | | | |
New HB Acquisition, LLC, Term Loan, 6.75%, Maturing 4/9/20 | | $ | 4,577 | | | $ | 4,674,261 | |
| | | | | | | | | |
| | | | | | $ | 4,674,261 | |
| | | | | | | | | |
| | |
Hotels — 0.2% | | | | | | | | |
Hilton Worldwide Finance, LLC, Term Loan, 3.50%, Maturing 10/26/20 | | $ | 8,621 | | | $ | 8,548,317 | |
| | | | | | | | | |
| | | | | | $ | 8,548,317 | |
| | | | | | | | | |
| | |
Insurance — 0.2% | | | | | | | | |
Alliant Holdings I, Inc., Term Loan, 4.25%, Maturing 12/20/19 | | $ | 9,606 | | | $ | 9,473,955 | |
| | | | | | | | | |
| | | | | | $ | 9,473,955 | |
| | | | | | | | | |
| | |
Metals / Mining — 0.3% | | | | | | | | |
FMG Resources (August 2006) Pty. Ltd., Term Loan, 3.75%, Maturing 6/30/19 | | $ | 16,338 | | | $ | 15,967,384 | |
| | | | | | | | | |
| | | | | | $ | 15,967,384 | |
| | | | | | | | | |
| | |
Publishing / Printing — 0.3% | | | | | | | | |
Cengage Learning Acquisitions, Inc., Term Loan, 7.00%, Maturing 3/31/20 | | $ | 7,761 | | | $ | 7,783,313 | |
McGraw-Hill Global Education Holdings, LLC, Term Loan, 5.75%, Maturing 3/22/19 | | | 9,492 | | | | 9,524,901 | |
| | | | | | | | | |
| | | | | | $ | 17,308,214 | |
| | | | | | | | | |
| | |
Services — 0.9% | | | | | | | | |
Advantage Sales & Marketing, Inc., Term Loan - Second Lien, 7.50%, Maturing 7/25/22 | | $ | 7,500 | | | $ | 7,478,122 | |
AlixPartners, LLP, Term Loan - Second Lien, 9.00%, Maturing 7/10/21 | | | 14,600 | | | | 14,855,500 | |
Brickman Group Ltd. LLC, Term Loan - Second Lien, 7.50%, Maturing 12/17/21 | | | 19,846 | | | | 19,591,660 | |
Laureate Education, Inc., Term Loan, 5.00%, Maturing 6/15/18 | | | 3,959 | | | | 3,830,645 | |
| | | | | | | | | |
| | | | | | $ | 45,755,927 | |
| | | | | | | | | |
| | |
Super Retail — 1.1% | | | | | | | | |
Albertson’s Holdings LLC, Term Loan, 4.50%, Maturing 8/25/21 | | $ | 15,900 | | | $ | 15,920,972 | |
National Vision, Inc., Term Loan, 4.00%, Maturing 3/12/21 | | | 20,298 | | | | 19,765,177 | |
National Vision, Inc., Term Loan - Second Lien, 6.75%, Maturing 3/11/22 | | | 10,000 | | | | 9,500,000 | |
rue21, Inc., Term Loan, 5.625%, Maturing 10/7/20 | | | 13,761 | | | | 11,306,960 | |
| | | | | | | | | |
| | | | | | $ | 56,493,109 | |
| | | | | | | | | |
| | | | |
| | 28 | | See Notes to Financial Statements. |
Boston Income Portfolio
October 31, 2014
Portfolio of Investments — continued
| | | | | | | | |
| Borrower/Tranche Description | | Principal Amount (000’s omitted) | | | Value | |
| | | | | | | | |
| | |
Technology — 0.4% | | | | | | | | |
SkillSoft Corporation, Term Loan - Second Lien, 9.25%, Maturing 4/28/22 | | $ | 21,800 | | | $ | 20,601,000 | |
| | | | | | | | | |
| | | | | | $ | 20,601,000 | |
| | | | | | | | | |
| | |
Telecommunications — 1.2% | | | | | | | | |
Asurion LLC, Term Loan, 5.00%, Maturing 5/24/19 | | $ | 25,504 | | | $ | 25,542,210 | |
Asurion LLC, Term Loan - Second Lien, 8.50%, Maturing 3/3/21 | | | 33,400 | | | | 34,015,829 | |
| | | | | | | | | |
| | | | | | $ | 59,558,039 | |
| | | | | | | | | |
| | |
Transportation Ex Air / Rail — 0.1% | | | | | | | | |
CEVA Group PLC, Term Loan, 6.50%, Maturing 3/19/21 | | $ | 2,451 | | | $ | 2,340,926 | |
CEVA Intercompany B.V., Term Loan, 6.50%, Maturing 3/19/21 | | | 1,932 | | | | 1,844,904 | |
Ceva Logistics Canada, ULC, Term Loan, 6.50%, Maturing 3/19/21 | | | 333 | | | | 318,087 | |
Ceva Logisitics US Holdings, Inc., Term Loan, 6.50%, Maturing 3/19/21 | | | 2,665 | | | | 2,544,695 | |
| | | | | | | | | |
| | | | | | $ | 7,048,612 | |
| | | | | | | | | |
| | |
Utilities — 0.6% | | | | | | | | |
Energy Future Intermediate Holding Company LLC, DIP Loan, 4.25%, Maturing 6/19/16 | | $ | 17,456 | | | $ | 17,442,427 | |
Texas Competitive Electric Holdings Company, LLC, DIP Loan, 3.75%, Maturing 5/5/16 | | | 4,684 | | | | 4,716,948 | |
Texas Competitive Electric Holdings Company, LLC, Term Loan, 4.646%, Maturing 10/10/17 | | | 8,564 | | | | 6,255,291 | |
| | | | | | | | | |
| | | | | | $ | 28,414,666 | |
| | | | | | | | | |
| |
Total Senior Floating-Rate Interests
(identified cost $306,115,130) | | | $ | 302,803,422 | |
| | | | | | | | | |
|
| Convertible Bonds — 0.4% | |
| | |
| | | | | | | | |
| Security | | Principal
Amount
(000’s omitted) | | | Value | |
| | |
Energy — 0.3% | | | | | | | | |
American Energy - Utica, LLC,
3.50%, 3/1/21(1)(2) | | $ | 15,470 | | | $ | 16,769,016 | |
| | | | | | | | | |
| | | | | | $ | 16,769,016 | |
| | | | | | | | | |
| | | | | | | | |
| Security | | Principal
Amount
(000’s omitted) | | | Value | |
| | | | | | | | |
| | |
Health Care — 0.1% | | | | | | | | |
Hologic, Inc., 0.00%, 12/15/43 | | $ | 5,265 | | | $ | 5,791,500 | |
| | | | | | | | | |
| | | | | | $ | 5,791,500 | |
| | | | | | | | | |
| |
Total Convertible Bonds
(identified cost $21,281,631) | | | $ | 22,560,516 | |
| | | | | | | | | |
|
| Commercial Mortgage-Backed Securities — 0.2% | |
| | |
| | | | | | | | |
| Security | | Principal
Amount
(000’s omitted) | | | Value | |
HILT, Series 2013-HLT, Class EFX, 5.222%, 11/5/30(1)(12) | | $ | 10,515 | | | $ | 10,751,330 | |
| | | | | | | | | |
| |
Total Commercial Mortgage-Backed Securities
(identified cost $10,553,209) | | | $ | 10,751,330 | |
| | | | | | | | | |
| | |
| Common Stocks — 0.3% | | | | | | | | |
| | |
| | | | | | | | |
| Security | | Shares | | | Value | |
| | |
Building Materials — 0.1% | | | | | | | | |
Panolam Holdings Co.(7)(8)(13) | | | 6,997 | | | $ | 6,144,485 | |
| | | | | | | | | |
| | | | | | $ | 6,144,485 | |
| | | | | | | | | |
| | |
Consumer Products — 0.0%(11) | | | | | | | | |
HF Holdings, Inc.(7)(8)(13) | | | 3,400 | | | $ | 83,946 | |
| | | | | | | | | |
| | | | | | $ | 83,946 | |
| | | | | | | | | |
| | |
Energy — 0.1% | | | | | | | | |
Seven Generations Energy, Ltd.,
Class A(13) | | | 270,455 | | | $ | 5,447,255 | |
| | | | | | | | | |
| | | | | | $ | 5,447,255 | |
| | | | | | | | | |
| | |
Gaming — 0.1% | | | | | | | | |
New Cotai Participation Corp.,
Class B(7)(8)(13) | | | 36 | | | $ | 1,139,220 | |
| | | | | | | | | |
| | | | | | $ | 1,139,220 | |
| | | | | | | | | |
| | |
Utilities — 0.0%(11) | | | | | | | | |
NRG Energy, Inc. | | | 32,564 | | | $ | 976,269 | |
| | | | | | | | | |
| | | | | | $ | 976,269 | |
| | | | | | | | | |
| |
Total Common Stocks
(identified cost $10,796,560) | | | $ | 13,791,175 | |
| | | | | | | | | |
| | | | |
| | 29 | | See Notes to Financial Statements. |
Boston Income Portfolio
October 31, 2014
Portfolio of Investments — continued
| | | | | | | | |
| Convertible Preferred Stocks — 0.9% | |
| | |
| | | | | | | | |
| Security | | Shares | | | Value | |
| | | | | | | | |
| | |
Energy — 0.3% | | | | | | | | |
Chesapeake Energy Corp., 4.50% | | | 52,348 | | | $ | 4,880,142 | |
Chesapeake Energy Corp., 5.75%(1) | | | 7,965 | | | | 8,776,434 | |
| | | | | | | | | |
| | | | | | $ | 13,656,576 | |
| | | | | | | | | |
| | |
Health Care — 0.6% | | | | | | | | |
Alere, Inc., 3.00% | | | 91,879 | | | $ | 29,424,250 | |
| | | | | | | | | |
| | | | | | $ | 29,424,250 | |
| | | | | | | | | |
| |
Total Convertible Preferred Stocks
(identified cost $36,636,016) | | | $ | 43,080,826 | |
| | | | | | | | | |
| | |
| Miscellaneous — 0.3% | | | | | | | | |
| | |
| | | | | | | | |
| Security | | Shares | | | Value | |
| | |
Cable / Satellite TV — 0.0%(11) | | | | | | | | |
Adelphia, Inc., Escrow Certificate(13) | | | 10,260,000 | | | $ | 89,775 | |
Adelphia, Inc., Escrow Certificate(13) | | | 5,085,000 | | | | 44,494 | |
| | | | | | | | | |
| | | | | | $ | 134,269 | |
| | | | | | | | | |
|
Energy — 0.0%(11) | |
SemGroup Corp., Escrow Certificate(13) | | | 10,225,000 | | | $ | 204,500 | |
| | | | | | | | | |
| | | | | | $ | 204,500 | |
| | | | | | | | | |
| | |
Gaming — 0.3% | | | | | | | | |
BLB Worldwide Holdings, Inc., Contingent Value Rights, Expires 11/5/17(8)(13) | | | 8,520 | | | $ | 7,029,000 | |
PGP Investors, LLC, Membership
Interests(7)(8)(13) | | | 17,143 | | | | 6,000,001 | |
| | | | | | | | | |
| | | | | | $ | 13,029,001 | |
| | | | | | | | | |
| | |
Utilities — 0.0%(11) | | | | | | | | |
EME Reorganization Trust | | | 9,902,937 | | | $ | 1,287,382 | |
| | | | | | | | | |
| | | | | | $ | 1,287,382 | |
| | | | | | | | | |
| |
Total Miscellaneous
(identified cost $7,980,778) | | | $ | 14,655,152 | |
| | | | | | | | | |
| | | | | | | | |
| Warrants — 0.0%(11) | | | | | | | | |
| | |
| | | | | | | | |
| Security | | Shares | | | Value | |
| | | | | | | | |
| |
Food / Beverage / Tobacco — 0.0%(11) | | | | | |
ASG Consolidated, LLC/ASG Finance, Inc., Expires 5/15/18 | | | 5,575 | | | $ | 585,375 | |
| | | | | | | | | |
| | | | | | $ | 585,375 | |
| | | | | | | | | |
| |
Total Warrants
(identified cost $0) | | | $ | 585,375 | |
| | | | | | | | | |
|
| Short-Term Investments — 3.0% | |
| | |
| | | | | | | | |
| Description | | Interest (000’s omitted) | | | Value | |
Eaton Vance Cash Reserves Fund, LLC, 0.14%(14) | | $ | 153,845 | | | $ | 153,845,087 | |
| | | | | | | | | |
| |
Total Short-Term Investments
(identified cost $153,845,087) | | | $ | 153,845,087 | |
| | | | | | | | | |
| |
Total Investments — 99.3%
(identified cost $4,851,402,938) | | | $ | 5,011,720,577 | |
| | | | | | | | | |
| |
Other Assets, Less Liabilities — 0.7% | | | $ | 33,572,405 | |
| | | | | | | | | |
| |
Net Assets — 100.0% | | | $ | 5,045,292,982 | |
| | | | | | | | | |
The percentage shown for each investment category in the Portfolio of Investments is based on net assets.
| | | | |
| DIP | | – | | Debtor In Possession |
| HILT | | – | | Hilton USA Trust |
| | (1) | Security exempt from registration pursuant to Rule 144A under the Securities Act of 1933. These securities may be sold in certain transactions (normally to qualified institutional buyers) and remain exempt from registration. At October 31, 2014, the aggregate value of these securities is $2,098,693,688 or 41.6% of the Portfolio’s net assets. |
| | (2) | Represents a payment-in-kind security which may pay interest in additional principal at the issuer’s discretion. The interest rate paid in additional principal is generally higher than the indicated cash rate. |
| | (3) | Security converts to floating rate after the indicated fixed-rate coupon period. |
| | (4) | When-issued security/delayed delivery security. |
| | (5) | Variable rate security. The stated interest rate represents the rate in effect at October 31, 2014. |
| | (6) | Multi-step coupon bond. Interest rate represents the rate in effect at October 31, 2014. |
| | (7) | For fair value measurement disclosure purposes, security is categorized as Level 3 (see Note 9). |
| | (8) | Restricted security (see Note 5). |
| | (9) | Currently the issuer is in default with respect to interest payments or has filed for bankruptcy. For a variable rate security, interest rate has been adjusted to reflect non-accrual status. |
| | | | |
| | 30 | | See Notes to Financial Statements. |
Boston Income Portfolio
October 31, 2014
Portfolio of Investments — continued
| (10) | Senior floating-rate interests (Senior Loans) often require prepayments from excess cash flows or permit the borrowers to repay at their election. The degree to which borrowers repay, whether as a contractual requirement or at their election, cannot be predicted with accuracy. As a result, the actual remaining maturity may be substantially less than the stated maturities shown. However, Senior Loans will have an expected average life of approximately two to four years. The stated interest rate represents the weighted average interest rate of all contracts within the senior loan facility and includes commitment fees on unfunded loan commitments, if any. Senior Loans typically have rates of interest which are redetermined either daily, monthly, quarterly or semi-annually by reference to a base lending rate, plus a premium. These base lending rates are primarily the London Interbank Offered Rate (“LIBOR”) and secondarily, the prime rate offered by one or more major United States banks (the “Prime Rate”) and the certificate of deposit (“CD”) rate or other base lending rates used by commercial lenders. |
| (11) | Amount is less than 0.05%. |
| (12) | Weighted average fixed-rate coupon that changes/updates monthly. Rate shown is the rate at October 31, 2014. |
| (13) | Non-income producing security. |
| (14) | Affiliated investment company, available to Eaton Vance portfolios and funds, which invests in high quality, U.S. dollar denominated money market instruments. The rate shown is the annualized seven-day yield as of October 31, 2014. |
| (15) | Defaulted matured security. |
| | | | |
| | 31 | | See Notes to Financial Statements. |
Boston Income Portfolio
October 31, 2014
Statement of Assets and Liabilities
| | | | |
| Assets | | October 31, 2014 | |
Unaffiliated investments, at value (identified cost, $4,697,557,851) | | $ | 4,857,875,490 | |
Affiliated investment, at value (identified cost, $153,845,087) | | | 153,845,087 | |
Cash | | | 1,380,387 | |
Restricted cash* | | | 5,271,521 | |
Interest and dividends receivable | | | 81,748,281 | |
Interest receivable from affiliated investment | | | 30,277 | |
Receivable for investments sold | | | 20,131,768 | |
Receivable for variation margin on open centrally cleared swap contracts | | | 136,383 | |
Receivable for open swap contracts | | | 3,155,762 | |
Premium paid on open swap contracts | | | 630,255 | |
Total assets | | $ | 5,124,205,211 | |
|
| Liabilities | |
Cash collateral due to brokers | | $ | 3,770,000 | |
Payable for investments purchased | | | 9,492,319 | |
Payable for when-issued/delayed delivery securities | | | 62,964,575 | |
Payable for open forward foreign currency exchange contracts | | | 4,321 | |
Premium received on open swap contracts | | | 21,645 | |
Payable to affiliates: | | | | |
Investment adviser fee | | | 2,447,863 | |
Trustees’ fees | | | 5,667 | |
Accrued expenses | | | 205,839 | |
Total liabilities | | $ | 78,912,229 | |
Net Assets applicable to investors’ interest in Portfolio | | $ | 5,045,292,982 | |
|
| Sources of Net Assets | |
Investors’ capital | | $ | 4,881,567,534 | |
Net unrealized appreciation | | | 163,725,448 | |
Total | | $ | 5,045,292,982 | |
| * | Represents restricted cash on deposit at the custodian and broker for open derivative contracts. |
| | | | |
| | 32 | | See Notes to Financial Statements. |
Boston Income Portfolio
October 31, 2014
Statement of Operations
| | | | |
| Investment Income | | Year Ended October 31, 2014 | |
Interest and other income (net of foreign taxes, $5,758) | | $ | 333,848,179 | |
Dividends | | | 2,270,249 | |
Interest allocated from affiliated investment | | | 279,681 | |
Expenses allocated from affiliated investment | | | (33,085 | ) |
Total investment income | | $ | 336,365,024 | |
|
| Expenses | |
Investment adviser fee | | $ | 30,914,224 | |
Trustees’ fees and expenses | | | 68,000 | |
Custodian fee | | | 904,050 | |
Legal and accounting services | | | 218,899 | |
Miscellaneous | | | 151,772 | |
Total expenses | | $ | 32,256,945 | |
Deduct — | | | | |
Reduction of custodian fee | | $ | 1,409 | |
Total expense reductions | | $ | 1,409 | |
| |
Net expenses | | $ | 32,255,536 | |
| |
Net investment income | | $ | 304,109,488 | |
|
| Realized and Unrealized Gain (Loss) | |
Net realized gain (loss) — | | | | |
Investment transactions | | $ | 49,247,398 | |
Investment transactions allocated from affiliated investment | | | 2,948 | |
Swap contracts | | | 3,833,529 | |
Net realized gain | | $ | 53,083,875 | |
Change in unrealized appreciation (depreciation) — | | | | |
Investments | | $ | (64,764,847 | ) |
Swap contracts | | | (1,760,150 | ) |
Foreign currency and forward foreign currency exchange contracts | | | (6,931 | ) |
Net change in unrealized appreciation (depreciation) | | $ | (66,531,928 | ) |
| |
Net realized and unrealized loss | | $ | (13,448,053 | ) |
| |
Net increase in net assets from operations | | $ | 290,661,435 | |
| | | | |
| | 33 | | See Notes to Financial Statements. |
Boston Income Portfolio
October 31, 2014
Statements of Changes in Net Assets
| | | | | | | | |
| | | Year Ended October 31, | |
| Increase (Decrease) in Net Assets | | 2014 | | | 2013 | |
From operations — | | | | | | | | |
Net investment income | | $ | 304,109,488 | | | $ | 301,775,408 | |
Net realized gain from investment transactions and swap contracts | | | 53,083,875 | | | | 112,290,393 | |
Net change in unrealized appreciation (depreciation) from investments, swap contracts, foreign currency and forward foreign currency exchange contracts | | | (66,531,928 | ) | | | 24,159,401 | |
Net increase in net assets from operations | | $ | 290,661,435 | | | $ | 438,225,202 | |
Capital transactions — | | | | | | | | |
Contributions | | $ | 840,043,826 | | | $ | 399,710,683 | |
Withdrawals | | | (967,264,329 | ) | | | (1,300,831,479 | ) |
Net decrease in net assets from capital transactions | | $ | (127,220,503 | ) | | $ | (901,120,796 | ) |
| | |
Net increase (decrease) in net assets | | $ | 163,440,932 | | | $ | (462,895,594 | ) |
| | |
| Net Assets | | | | | | | | |
At beginning of year | | $ | 4,881,852,050 | | | $ | 5,344,747,644 | |
At end of year | | $ | 5,045,292,982 | | | $ | 4,881,852,050 | |
| | | | |
| | 34 | | See Notes to Financial Statements. |
Boston Income Portfolio
October 31, 2014
Supplementary Data
| | | | | | | | | | | | | | | | | | | | |
| | | Year Ended October 31, | |
| Ratios/Supplemental Data | | 2014 | | | 2013 | | | 2012 | | | 2011 | | | 2010 | |
Ratios (as a percentage of average daily net assets): | | | | | | | | | | | | | | | | | | | | |
Expenses(1) | | | 0.62 | % | | | 0.62 | % | | | 0.62 | % | | | 0.63 | % | | | 0.64 | % |
Net investment income | | | 5.81 | % | | | 6.15 | % | | | 6.49 | % | | | 7.60 | % | | | 8.67 | % |
Portfolio Turnover | | | 43 | % | | | 56 | % | | | 64 | % | | | 70 | % | | | 75 | % |
| | | | | |
Total Return | | | 5.74 | % | | | 9.17 | % | | | 11.44 | % | | | 6.01 | % | | | 18.44 | % |
| | | | | |
Net assets, end of year (000’s omitted) | | $ | 5,045,293 | | | $ | 4,881,852 | | | $ | 5,344,748 | | | $ | 3,296,550 | | | $ | 2,910,146 | |
| (1) | Excludes the effect of custody fee credits, if any, of less than 0.005%. |
| | | | |
| | 35 | | See Notes to Financial Statements. |
Boston Income Portfolio
October 31, 2014
Notes to Financial Statements
1 Significant Accounting Policies
Boston Income Portfolio (the Portfolio) is a Massachusetts business trust registered under the Investment Company Act of 1940, as amended (the 1940 Act), as a diversified, open-end management investment company. The Portfolio’s investment objective is to provide a high level of current income. The Portfolio’s secondary objectives are to seek growth of income and capital. The Declaration of Trust permits the Trustees to issue interests in the Portfolio. At October 31, 2014, Eaton Vance Income Fund of Boston, Eaton Vance Multi-Strategy All Market Fund, Eaton Vance Short Duration Strategic Income Fund and Eaton Vance International (Cayman Islands) Short Duration Strategic Income Fund held an interest of 95.7%, 0.1%, 3.4% and 0.8%, respectively, in the Portfolio.
The following is a summary of significant accounting policies of the Portfolio. The policies are in conformity with accounting principles generally accepted in the United States of America (U.S. GAAP). The Portfolio is an investment company and follows accounting and reporting guidance in the Financial Accounting Standards Board (“FASB”) Accounting Standards Codification Topic 946.
A Investment Valuation — The following methodologies are used to determine the market value or fair value of investments.
Debt Obligations. Debt obligations (including short-term obligations with a remaining maturity of more than sixty days) are generally valued on the basis of valuations provided by third party pricing services, as derived from such services’ pricing models. Inputs to the models may include, but are not limited to, reported trades, executable bid and asked prices, broker/dealer quotations, prices or yields of securities with similar characteristics, interest rates, anticipated prepayments, benchmark curves or information pertaining to the issuer, as well as industry and economic events. The pricing services may use a matrix approach, which considers information regarding securities with similar characteristics to determine the valuation for a security. Short-term obligations purchased with a remaining maturity of sixty days or less are generally valued at amortized cost, which approximates market value.
Senior Floating-Rate Loans. Interests in senior floating-rate loans (Senior Loans) for which reliable market quotations are readily available are valued generally at the average mean of bid and ask quotations obtained from a third party pricing service. Other Senior Loans are valued at fair value by the investment adviser under procedures approved by the Trustees. In fair valuing a Senior Loan, the investment adviser utilizes one or more of the valuation techniques described in (i) through (iii) below to assess the likelihood that the borrower will make a full repayment of the loan underlying such Senior Loan relative to yields on other Senior Loans issued by companies of comparable credit quality. If the investment adviser believes that there is a reasonable likelihood of full repayment, the investment adviser will determine fair value using a matrix pricing approach that considers the yield on the Senior Loan. If the investment adviser believes there is not a reasonable likelihood of full repayment, the investment adviser will determine fair value using analyses that include, but are not limited to: (i) a comparison of the value of the borrower’s outstanding equity and debt to that of comparable public companies; (ii) a discounted cash flow analysis; or (iii) when the investment adviser believes it is likely that a borrower will be liquidated or sold, an analysis of the terms of such liquidation or sale. In certain cases, the investment adviser will use a combination of analytical methods to determine fair value, such as when only a portion of a borrower’s assets are likely to be sold. In conducting its assessment and analyses for purposes of determining fair value of a Senior Loan, the investment adviser will use its discretion and judgment in considering and appraising relevant factors. Fair value determinations are made by the portfolio managers of the Portfolio based on information available to such managers. The portfolio managers of other funds managed by the investment adviser that invest in Senior Loans may not possess the same information about a Senior Loan borrower as the portfolio managers of the Portfolio. At times, the fair value of a Senior Loan determined by the portfolio managers of other funds managed by the investment adviser that invest in Senior Loans may vary from the fair value of the same Senior Loan determined by the portfolio managers of the Portfolio. The fair value of each Senior Loan is periodically reviewed and approved by the investment adviser’s Valuation Committee and by the Trustees based upon procedures approved by the Trustees. Junior Loans (i.e., subordinated loans and second lien loans) are valued in the same manner as Senior Loans.
Equity Securities. Equity securities listed on a U.S. securities exchange generally are valued at the last sale or closing price on the day of valuation or, if no sales took place on such date, at the mean between the closing bid and asked prices therefore on the exchange where such securities are principally traded. Equity securities listed on the NASDAQ Global or Global Select Market generally are valued at the NASDAQ official closing price. Unlisted or listed securities for which closing sales prices or closing quotations are not available are valued at the mean between the latest available bid and asked prices or, in the case of preferred equity securities that are not listed or traded in the over-the-counter market, by a third party pricing service that will use various techniques that consider factors including, but not limited to, prices or yields of securities with similar characteristics, benchmark yields, broker/dealer quotes, quotes of underlying common stock, issuer spreads, as well as industry and economic events.
Derivatives. Forward foreign currency exchange contracts are generally valued at the mean of the average bid and average asked prices that are reported by currency dealers to a third party pricing service at the valuation time. Such third party pricing service valuations are supplied for specific settlement periods and the Portfolio’s forward foreign currency exchange contracts are valued at an interpolated rate between the closest preceding and subsequent settlement period reported by the third party pricing service. Swaps (other than centrally cleared) are normally valued using valuations provided by a third party pricing service. Such pricing service valuations are based on the present value of fixed and projected floating rate cash flows over the term of the swap contract, and in the case of credit default swaps, based on credit spread quotations obtained from broker/dealers and expected default recovery rates determined by the pricing service using proprietary models. Future cash flows on swaps are discounted to their present value using swap rates provided by electronic data services or by broker/dealers. Centrally cleared swaps are valued at the daily settlement price provided by the central clearing counterparty.
Foreign Securities and Currencies. Foreign securities and currencies are valued in U.S. dollars, based on foreign currency exchange rate quotations supplied by a third party pricing service. The pricing service uses a proprietary model to determine the exchange rate. Inputs to the model include reported trades and implied bid/ask spreads.
Boston Income Portfolio
October 31, 2014
Notes to Financial Statements — continued
Affiliated Fund. The Portfolio may invest in Eaton Vance Cash Reserves Fund, LLC (Cash Reserves Fund), an affiliated investment company managed by Eaton Vance Management (EVM). The value of the Portfolio’s investment in Cash Reserves Fund reflects the Portfolio’s proportionate interest in its net assets. Cash Reserves Fund generally values its investment securities utilizing the amortized cost valuation technique in accordance with Rule 2a-7 under the 1940 Act. This technique involves initially valuing a portfolio security at its cost and thereafter assuming a constant amortization to maturity of any discount or premium. If amortized cost is determined not to approximate fair value, Cash Reserves Fund may value its investment securities in the same manner as debt obligations described above.
Fair Valuation. Investments for which valuations or market quotations are not readily available or are deemed unreliable are valued at fair value using methods determined in good faith by or at the direction of the Trustees of the Portfolio in a manner that fairly reflects the security’s value, or the amount that the Portfolio might reasonably expect to receive for the security upon its current sale in the ordinary course. Each such determination is based on a consideration of relevant factors, which are likely to vary from one pricing context to another. These factors may include, but are not limited to, the type of security, the existence of any contractual restrictions on the security’s disposition, the price and extent of public trading in similar securities of the issuer or of comparable companies or entities, quotations or relevant information obtained from broker/dealers or other market participants, information obtained from the issuer, analysts, and/or the appropriate stock exchange (for exchange-traded securities), an analysis of the company’s or entity’s financial condition, and an evaluation of the forces that influence the issuer and the market(s) in which the security is purchased and sold.
B Investment Transactions — Investment transactions for financial statement purposes are accounted for on a trade date basis. Realized gains and losses on investments sold are determined on the basis of identified cost.
C Income — Interest income is recorded on the basis of interest accrued, adjusted for amortization of premium or accretion of discount. Fees associated with loan amendments are recognized immediately. Dividend income is recorded on the ex-dividend date for dividends received in cash and/or securities. Withholding taxes on foreign interest and capital gains have been provided for in accordance with the Portfolio’s understanding of the applicable countries’ tax rules and rates.
D Federal Taxes — The Portfolio has elected to be treated as a partnership for federal tax purposes. No provision is made by the Portfolio for federal or state taxes on any taxable income of the Portfolio because each investor in the Portfolio is ultimately responsible for the payment of any taxes on its share of taxable income. Since at least one of the Portfolio’s investors is a regulated investment company that invests all or substantially all of its assets in the Portfolio, the Portfolio normally must satisfy the applicable source of income and diversification requirements (under the Internal Revenue Code) in order for its investors to satisfy them. The Portfolio will allocate, at least annually among its investors, each investor’s distributive share of the Portfolio’s net investment income, net realized capital gains and any other items of income, gain, loss, deduction or credit.
As of October 31, 2014, the Portfolio had no uncertain tax positions that would require financial statement recognition, de-recognition, or disclosure. The Portfolio files a U.S. federal income tax return annually after its fiscal year-end, which is subject to examination by the Internal Revenue Service for a period of three years from the date of filing.
E Expense Reduction — State Street Bank and Trust Company (SSBT) serves as custodian of the Portfolio. Pursuant to the custodian agreement, SSBT receives a fee reduced by credits, which are determined based on the average daily cash balance the Portfolio maintains with SSBT. All credit balances, if any, used to reduce the Portfolio’s custodian fees are reported as a reduction of expenses in the Statement of Operations.
F Foreign Currency Translation — Investment valuations, other assets, and liabilities initially expressed in foreign currencies are translated each business day into U.S. dollars based upon current exchange rates. Purchases and sales of foreign investment securities and income and expenses denominated in foreign currencies are translated into U.S. dollars based upon currency exchange rates in effect on the respective dates of such transactions. Recognized gains or losses on investment transactions attributable to changes in foreign currency exchange rates are recorded for financial statement purposes as net realized gains and losses on investments. That portion of unrealized gains and losses on investments that results from fluctuations in foreign currency exchange rates is not separately disclosed.
G Use of Estimates — The preparation of the financial statements in conformity with U.S. GAAP requires management to make estimates and assumptions that affect the reported amounts of assets and liabilities at the date of the financial statements and the reported amounts of income and expense during the reporting period. Actual results could differ from those estimates.
H Indemnifications — Under the Portfolio’s organizational documents, its officers and Trustees may be indemnified against certain liabilities and expenses arising out of the performance of their duties to the Portfolio. Under Massachusetts law, if certain conditions prevail, interestholders in the Portfolio could be deemed to have personal liability for the obligations of the Portfolio. However, the Portfolio’s Declaration of Trust contains an express disclaimer of liability on the part of Portfolio interestholders and the By-laws provide that the Portfolio shall assume the defense on behalf of any Portfolio interestholder. Moreover, the By-laws also provide for indemnification out of Portfolio property of any interestholder held personally liable solely by reason of being or having been an interestholder for all loss or expense arising from such liability. Additionally, in the normal course of business, the Portfolio enters into agreements with service providers that may contain indemnification clauses. The Portfolio’s maximum exposure under these arrangements is unknown as this would involve future claims that may be made against the Portfolio that have not yet occurred.
I Forward Foreign Currency Exchange Contracts — The Portfolio may enter into forward foreign currency exchange contracts for the purchase or sale of a specific foreign currency at a fixed price on a future date. The forward foreign currency exchange contracts are adjusted by the daily exchange rate of the
Boston Income Portfolio
October 31, 2014
Notes to Financial Statements — continued
underlying currency and any gains or losses are recorded as unrealized until such time as the contracts have been closed. Risks may arise upon entering these contracts from the potential inability of counterparties to meet the terms of their contracts and from movements in the value of a foreign currency relative to the U.S. dollar.
J Credit Default Swaps — Swap contracts are privately negotiated agreements between the Portfolio and a counterparty. Certain swap contracts may be centrally cleared (“centrally cleared swaps”), whereby all payments are made or received by the Portfolio pursuant to the contract are with a central clearing party (CCP) rather than the original counterparty. The CCP guarantees the performance of the original parties to the contract. When the Portfolio is the buyer of a credit default swap contract, the Portfolio is entitled to receive the par (or other agreed-upon) value of a referenced debt obligation (or basket of debt obligations) from the counterparty or CCP in the case of a centrally cleared swap to the contract if a credit event by a third party, such as a U.S. or foreign corporate issuer, on the debt obligation occurs. In return, the Portfolio pays the counterparty a periodic stream of payments over the term of the contract provided that no credit event has occurred. If no credit event occurs, the Portfolio would have spent the stream of payments and received no proceeds from the contract. When the Portfolio is the seller of a credit default swap contract, it receives the stream of payments, but is obligated to pay to the buyer of the protection an amount up to the notional amount of the swap and in certain instances take delivery of securities of the reference entity upon the occurrence of a credit event, as defined under the terms of that particular swap agreement. Credit events are contract specific but may include bankruptcy, failure to pay, restructuring, obligation acceleration and repudiation/moratorium. If the Portfolio is a seller of protection and a credit event occurs, the maximum potential amount of future payments that the Portfolio could be required to make would be an amount equal to the notional amount of the agreement. This potential amount would be partially offset by any recovery value of the respective referenced obligation, or net amount received from the settlement of a buy protection credit default swap agreement entered into by the Portfolio for the same referenced obligation. As the seller, the Portfolio may create economic leverage to its portfolio because, in addition to its total net assets, the Portfolio is subject to investment exposure on the notional amount of the swap. The interest fee paid or received on the swap contract, which is based on a specified interest rate on a fixed notional amount, is accrued daily as a component of unrealized appreciation (depreciation) and is recorded as realized gain upon receipt or realized loss upon payment. The Portfolio also records an increase or decrease to unrealized appreciation (depreciation) in an amount equal to the daily valuation. For centrally cleared swaps, the daily change in valuation is recorded as a receivable or payable for variation margin and settled in cash with the CCP daily. All upfront payments, if any, are amortized over the life of the swap contract as realized gains or losses. Those upfront payments that are paid or received, typically for non-centrally cleared swaps, are recorded as other assets or other liabilities, respectively, net of amortization. For financial reporting purposes, unamortized upfront payments, if any, are netted with unrealized appreciation or depreciation on swap contracts to determine the market value of swaps as presented in Notes 6 and 9. The Portfolio segregates assets in the form of cash or liquid securities in an amount equal to the notional amount of the credit default swaps of which it is the seller. The Portfolio segregates assets in the form of cash or liquid securities in an amount equal to any unrealized depreciation of the credit default swaps of which it is the buyer, marked to market on a daily basis. Upon entering into centrally cleared swaps, the Portfolio is required to deposit with the CCP, either in cash or securities, an amount equal to a certain percentage of the notional amount (initial margin), which is subject to adjustment. These transactions involve certain risks, including the risk that the seller may be unable to fulfill the transaction. In the case of centrally cleared swaps, counterparty risk is minimal due to protections provided by the CCP.
K When-Issued Securities and Delayed Delivery Transactions — The Portfolio may purchase or sell securities on a delayed delivery or when-issued basis. Payment and delivery may take place after the customary settlement period for that security. At the time the transaction is negotiated, the price of the security that will be delivered is fixed. The Portfolio maintains security positions for these commitments such that sufficient liquid assets will be available to make payments upon settlement. Securities purchased on a delayed delivery or when-issued basis are marked-to-market daily and begin earning interest on settlement date. Losses may arise due to changes in the market value of the underlying securities or if the counterparty does not perform under the contract.
2 Investment Adviser Fee and Other Transactions with Affiliates
The investment adviser fee is earned by Boston Management and Research (BMR), a subsidiary of EVM, as compensation for investment advisory services rendered to the Portfolio. Pursuant to the investment advisory agreement and subsequent fee reduction agreements between the Portfolio and BMR, the fee is computed at an annual rate of 0.625% of the Portfolio’s average daily net assets up to $1.5 billion, 0.60% from $1.5 billion up to $2 billion, 0.575% from $2 billion up to $5 billion, 0.555% from $5 billion up to $10 billion, and 0.535% of average daily net assets of $10 billion or more, and is payable monthly. The fee reductions cannot be terminated without the consent of a majority of Trustees and a majority of interestholders of the Portfolio. For the year ended October 31, 2014, the Portfolio’s investment adviser fee amounted to $30,914,224 or 0.59% of the Portfolio’s average daily net assets. The Portfolio invests its cash in Cash Reserves Fund. EVM does not currently receive a fee for advisory services provided to Cash Reserves Fund.
Trustees and officers of the Portfolio who are members of EVM’s or BMR’s organizations receive remuneration for their services to the Portfolio out of the investment adviser fee. Trustees of the Portfolio who are not affiliated with the investment adviser may elect to defer receipt of all or a percentage of their annual fees in accordance with the terms of the Trustees Deferred Compensation Plan. For the year ended October 31, 2014, no significant amounts have been deferred. Certain officers and Trustees of the Portfolio are officers of the above organizations.
3 Purchases and Sales of Investments
Purchases and sales of investments, other than short-term obligations and including maturities, paydowns and principal repayments on Senior Loans, aggregated $2,375,600,051 and $2,146,203,030, respectively, for the year ended October 31, 2014.
Boston Income Portfolio
October 31, 2014
Notes to Financial Statements — continued
4 Federal Income Tax Basis of Investments
The cost and unrealized appreciation (depreciation) of investments of the Portfolio at October 31, 2014, as determined on a federal income tax basis, were as follows:
| | | | |
| |
Aggregate cost | | $ | 4,868,890,616 | |
| |
Gross unrealized appreciation | | $ | 195,886,113 | |
Gross unrealized depreciation | | | (53,056,152 | ) |
| |
Net unrealized appreciation | | $ | 142,829,961 | |
5 Restricted Securities
At October 31, 2014, the Portfolio owned the following securities (representing 0.4% of net assets) which were restricted as to public resale and not registered under the Securities Act of 1933 (excluding Rule 144A securities). The Portfolio has various registration rights (exercisable under a variety of circumstances) with respect to these securities. The value of these securities is determined based on valuations provided by brokers when available, or if not available, they are valued at fair value using methods determined in good faith by or at the direction of the Trustees.
| | | | | | | | | | | | | | | | |
| Description | | Date of Acquisition | | | Principal
Amount/Shares | | | Cost | | | Value | |
| | | | |
Corporate Bonds & Notes | | | | | | | | | | | | | | | | |
Boyd Gaming Corp. Step Coupon HoldCo Note,
6.00% to 11/20/15, 11/20/18 | |
| 11/30/12,
5/20/14 |
| | $ | 608,066 | | | $ | 550,544 | | | $ | 658,511 | |
| | | | |
Total Corporate Bonds & Notes | | | | | | | | | | $ | 550,544 | | | $ | 658,511 | |
| | | | |
Common Stocks | | | | | | | | | | | | | | | | |
HF Holdings, Inc. | | | 10/27/09 | | | | 3,400 | | | $ | 182,613 | | | $ | 83,946 | |
New Cotai Participation Corp., Class B | | | 4/12/13 | | | | 36 | | | | 1,111,500 | | | | 1,139,220 | |
Panolam Holdings Co. | | | 12/30/09 | | | | 6,997 | | | | 3,844,852 | | | | 6,144,485 | |
| | | | |
Total Common Stocks | | | | | | | | | | $ | 5,138,965 | | | $ | 7,367,651 | |
| | | | |
Miscellaneous | | | | | | | | | | | | | | | | |
BLB Worldwide Holdings, Inc., Contingent Value Rights, Expires 11/5/17 | | | 11/22/10 | | | | 8,520 | | | $ | 149,100 | | | $ | 7,029,000 | |
PGP Investors, LLC, Membership Interests | | | 10/23/12 | | | | 17,143 | | | | 6,000,000 | | | | 6,000,001 | |
| | | | |
Total Miscellaneous | | | | | | | | | | $ | 6,149,100 | | | $ | 13,029,001 | |
| | | | |
Total Restricted Securities | | | | | | | | | | $ | 11,838,609 | | | $ | 21,055,163 | |
6 Financial Instruments
The Portfolio may trade in financial instruments with off-balance sheet risk in the normal course of its investing activities. These financial instruments may include forward foreign currency exchange contracts and swap contracts and may involve, to a varying degree, elements of risk in excess of the amounts recognized for financial statement purposes. The notional or contractual amounts of these instruments represent the investment the Portfolio has in particular classes of financial instruments and do not necessarily represent the amounts potentially subject to risk. The measurement of the risks associated with these instruments is meaningful only when all related and offsetting transactions are considered.
Boston Income Portfolio
October 31, 2014
Notes to Financial Statements — continued
A summary of obligations under these financial instruments at October 31, 2014 is as follows:
| | | | | | | | | | | | | | | | | | |
| Forward Foreign Currency Exchange Contracts | |
| | | | | | |
| | | | | | | | | | | | | | | | | | |
| Settlement Date | | Deliver | | In Exchange For | | Counterparty | | Unrealized
Appreciation | | | Unrealized
(Depreciation) | | | Net
Unrealized
(Depreciation) | |
| | | | | | |
| 11/28/14 | | Canadian Dollar
5,680,000 | | United States Dollar
5,032,294 | | JPMorgan Chase Bank, N.A. | | $ | — | | | $ | (4,321 | ) | | $ | (4,321 | ) |
| | | | | | |
| | | | | | | | | $ | — | | | $ | (4,321 | ) | | $ | (4,321 | ) |
| | | | | | | | | | | | | | | | | | | | | | | | |
| Credit Default Swaps — Sell Protection | |
| | | | | | | | |
| | | | | | | | | | | | | | | | | | | | | | | | |
| Counterparty | | Reference Entity | | Credit
Rating* | | Notional
Amount**
(000’s omitted) | | Receive
Annual
Fixed Rate | | Termination
Date | | | Market
Value | | | Unamortized
Upfront
Payments
Received
(Paid) | | | Net
Unrealized
Appreciation | |
| | | | | | | | |
| Bank of America, N.A. | | Amkor Technology, Inc. | | B2/B+ | | $ 3,850 | | 5.00%(1) | | | 6/20/15 | | | $ | 135,013 | | | $ | 21,645 | | | $ | 156,658 | |
| Bank of America, N.A. | | Ford Motor Co. | | Baa3/BBB- | | 5,000 | | 5.00(1) | | | 3/20/17 | | | | 553,844 | | | | (73,623 | ) | | | 480,221 | |
| Credit Suisse International | | Ford Motor Co. | | Baa3/BBB- | | 4,000 | | 5.00(1) | | | 12/20/16 | | | | 405,812 | | | | (3,445 | ) | | | 402,367 | |
| Deutsche Bank AG | | Ford Motor Co. | | Baa3/BBB- | | 3,900 | | 5.00(1) | | | 9/20/16 | | | | 355,582 | | | | (64,812 | ) | | | 290,770 | |
| Deutsche Bank AG | | Ford Motor Co. | | Baa3/BBB- | | 3,900 | | 5.00(1) | | | 9/20/16 | | | | 355,582 | | | | (115,993 | ) | | | 239,589 | |
| Deutsche Bank AG | | Ford Motor Co. | | Baa3/BBB- | | 7,900 | | 5.00(1) | | | 12/20/16 | | | | 801,479 | | | | (170,797 | ) | | | 630,682 | |
| Goldman Sachs International | | Ford Motor Co. | | Baa3/BBB- | | 3,900 | | 5.00(1) | | | 9/20/16 | | | | 355,582 | | | | (75,061 | ) | | | 280,521 | |
| Goldman Sachs International | | Ford Motor Co. | | Baa3/BBB- | | 7,900 | | 5.00(1) | | | 12/20/16 | | | | 801,478 | | | | (126,524 | ) | | | 674,954 | |
| | | | | | | | |
Total | | | | | | $40,350 | | | | | | | | $ | 3,764,372 | | | $ | (608,610 | ) | | $ | 3,155,762 | |
| | | | | | | | | | | | | | | | | | | | | | | | |
| Centrally Cleared Credit Default Swaps — Sell Protection | |
| | | | | | | | |
| | | | | | | | | | | | | | | | | | | | | | | | |
| Counterparty | | Reference Entity | | Notional
Amount**
(000’s omitted) | | Receive
Annual
Fixed Rate | | Termination
Date | | Current
Market
Annual
Fixed Rate*** | | | Market
Value | | | Unamortized
Upfront
Payments | | | Net
Unrealized
Appreciation | |
| | | | | | | | |
| ICE Clear Credit | | Markit CDX North
America High
Yield Index | | $30,500 | | 5.00%(1) | | 12/20/19 | | | 3.43 | % | | $ | 2,299,870 | | | $ | (2,040,892 | ) | | $ | 258,978 | |
| | | | | | | | |
| | | | | | | | | | | | | | | $ | 2,299,870 | | | $ | (2,040,892 | ) | | $ | 258,978 | |
| * | Credit ratings are those of Moody’s Investors Service, Inc. and Standard & Poor’s Corp. The credit rating of the reference debt obligation (together with the unrealized appreciation or depreciation on the swap) are a representative measure of the current payment/performance risk of the credit default swap. A lower credit rating increases the probability of the occurrence of a credit event. |
| ** | If the Portfolio is the seller of credit protection, the notional amount is the maximum potential amount of future payments the Portfolio could be required to make if a credit event, as defined in the credit default swap agreement, were to occur. At October 31, 2014, such maximum potential amount for all open credit default swaps in which the Portfolio is the seller was $70,850,000. |
Boston Income Portfolio
October 31, 2014
Notes to Financial Statements — continued
| *** | Current market annual fixed rates, utilized in determining the net unrealized appreciation or depreciation as of period end, serve as an indicator of the market’s perception of the current status of the payment/performance risk associated with the credit derivative. The current market annual fixed rate of a particular reference entity reflects the cost, as quoted by the pricing vendor, of selling protection against default of that entity as of period end and may include upfront payments required to be made to enter into the agreement. The higher the fixed rate, the greater the market perceived risk of a credit event involving the reference entity. A rate identified as “Defaulted” indicates a credit event has occurred for the reference entity. |
| (1) | Upfront payment is exchanged with the counterparty as a result of the standardized trading coupon. |
At October 31, 2014, the Portfolio had sufficient cash and/or securities to cover commitments under these contracts.
In the normal course of pursing its investment objectives, the Portfolio is subject to the following risks:
Credit Risk: The Portfolio enters into credit default swap contracts to manage its credit risk, to gain exposure to a credit in which it may otherwise invest, or to enhance return.
Foreign Exchange Risk: The Portfolio holds foreign currency denominated investments. The value of these investments and related receivables and payables may change due to future changes in foreign currency exchange rates. To hedge against this risk, the Portfolio enters into forward foreign currency exchange contracts.
The Portfolio enters into swap contracts (other than centrally cleared swaps) and forward foreign currency exchange contracts that may contain provisions whereby the counterparty may terminate the contract under certain conditions, including but not limited to a decline in the Portfolio’s net assets below a certain level over a certain period of time, which would trigger a payment by the Portfolio for those swaps and forward foreign currency exchange contracts in a liability position. At October 31, 2014, the fair value of derivatives with credit-related contingent features in a net liability position was $4,321. At October 31, 2014, there were no assets pledged by the Portfolio for such liability.
The over-the-counter (OTC) derivatives in which the Portfolio invests are subject to the risk that the counterparty to the contract fails to perform its obligations under the contract. To mitigate this risk, the Portfolio has entered into an International Swaps and Derivatives Association, Inc. Master Agreement (“ISDA Master Agreement”) or similar agreement with substantially all its derivative counterparties. An ISDA Master Agreement is a bilateral agreement between the Portfolio and the counterparty that governs certain OTC derivatives and typically contains, among other things, set-off provisions in the event of a default and/or termination event as defined under the relevant ISDA Master Agreement. Under an ISDA Master Agreement, the Portfolio may, under certain circumstances, offset with the counterparty certain derivative financial instruments’ payables and/or receivables with collateral held and/or posted and create one single net payment. The provisions of the ISDA Master Agreement typically permit a single net payment in the event of default including the bankruptcy or insolvency of the counterparty. However, bankruptcy or insolvency laws of a particular jurisdiction may impose restrictions on or prohibitions against the right of offset in bankruptcy or insolvency. Certain ISDA Master Agreements allow the counterparties to OTC derivatives to terminate derivative contracts prior to maturity in the event the Portfolio’s net assets decline by a stated percentage or the Portfolio fails to meet the terms of its ISDA Master Agreements, which would cause the counterparty to accelerate payment by the Portfolio of any net liability owed to it.
The collateral requirements for derivatives traded under an ISDA Master Agreement are governed by a Credit Support Annex to the ISDA Master Agreement. Collateral requirements are determined at the close of business each day and are typically based on changes in market values for each transaction under an ISDA Master Agreement and netted into one amount for such agreement. Generally, the amount of collateral due from or to the counterparty is subject to a minimum transfer threshold amount before a transfer is required, which may vary by counterparty. Collateral pledged for the benefit of the Portfolio and/or counterparty is held in segregated accounts by the Portfolio’s custodian and cannot be sold, re-pledged, assigned or otherwise used while pledged. The portion of such collateral representing cash, if any, is reflected as restricted cash and, in the case of cash pledged by a counterparty for the benefit of the Portfolio, a corresponding liability on the Statement of Assets and Liabilities. Securities pledged by the Portfolio as collateral, if any, are identified as such in the Portfolio of Investments. The carrying amount of the liability for cash collateral due to brokers at October 31, 2014 approximated its fair value. If measured at fair value, such liability would have been considered as Level 2 in the fair value hierarchy (see Note 9) at October 31, 2014.
Boston Income Portfolio
October 31, 2014
Notes to Financial Statements — continued
The fair value of open derivative instruments (not considered to be hedging instruments for accounting disclosure purposes) by risk exposure at October 31, 2014 was as follows:
| | | | | | | | | | |
| | | | | Fair Value | |
| Risk | | Derivative | | Asset
Derivative | | | Liability
Derivative | |
| | | |
Credit | | Swap contracts | | $ | 3,764,372 | (1) | | $ | — | |
Credit | | Swap contracts (centrally cleared) | | | 258,978 | (2) | | | — | |
Foreign Exchange | | Forward foreign currency exchange contracts | | | — | | | | (4,321 | )(3) |
| | | |
Total | | | | $ | 4,023,350 | | | $ | (4,321 | ) |
| | |
Derivatives not subject to master netting or similar agreements | | $ | 258,978 | | | $ | — | |
| | |
Total Derivatives subject to master netting or similar agreements | | $ | 3,764,372 | | | $ | (4,321 | ) |
| (1) | Statement of Assets and Liabilities location: Receivable for open swap contracts; Premium paid/received on open swap contracts. |
| (2) | Amount represents cumulative unrealized appreciation on centrally cleared swap contracts in the Swap Contracts table above. Only the current day’s variation margin on open centrally cleared swap contracts is reported within the Statement of Assets and Liabilities as Receivable for variation margin on open centrally cleared swap contracts. |
| (3) | Statement of Assets and Liabilities location: Payable for open forward foreign currency exchange contracts; Net unrealized appreciation. |
During the current reporting period, the Portfolio adopted the new disclosure requirements for offsetting assets and liabilities, pursuant to which an entity is required to disclose both gross and net information for assets and liabilities related to derivatives, repurchase and reverse repurchase agreements, and securities lending and securities borrowing transactions that are eligible for offset or subject to an enforceable master netting or similar agreement. The Portfolio’s derivative assets and liabilities at fair value by type, which are reported gross in the Statement of Assets and Liabilities, are presented in the table above. The following tables present the Portfolio’s derivative assets and liabilities by counterparty, net of amounts available for offset under a master netting agreement and net of the related collateral received by the Portfolio for assets and pledged by the Portfolio for liabilities as of October 31, 2014.
| | | | | | | | | | | | | | | | | | | | |
| Counterparty | | Derivative
Assets Subject to
Master Netting
Agreement | | | Derivatives
Available
for Offset | | | Non-cash
Collateral
Received(a) | | | Cash
Collateral
Received(a) | | | Net Amount of Derivative Assets(b) | |
| | | | | |
Bank of America, N.A. | | $ | 688,857 | | | $ | — | | | $ | — | | | $ | (688,857 | ) | | $ | — | |
Credit Suisse International | | | 405,812 | | | | — | | | | (405,812 | ) | | | — | | | | — | |
Deutsche Bank AG | | | 1,512,643 | | | | — | | | | — | | | | (1,512,643 | ) | | | — | |
Goldman Sachs International | | | 1,157,060 | | | | — | | | | — | | | | (1,157,060 | ) | | | — | |
| | | | | |
| | | $ | 3,764,372 | | | $ | — | | | $ | (405,812 | ) | | $ | (3,358,560 | ) | | $ | — | |
| | | | | |
| | | | | | | | | | | | | | | | | | | | |
| Counterparty | | Derivative
Liabilities Subject to
Master Netting
Agreement | | | Derivatives
Available
for Offset | | | Non-cash
Collateral
Pledged(a) | | | Cash
Collateral
Pledged(a) | | | Net Amount of Derivative Liabilities(c) | |
| | | | | |
JPMorgan Chase Bank, N.A. | | $ | (4,321 | ) | | $ | — | | | $ | — | | | $ | — | | | $ | (4,321 | ) |
| (a) | In some instances, the actual collateral received and/or pledged may be more than the amount shown due to over collateralization. |
| (b) | Net amount represents the net amount due from the counterparty in the event of default. |
| (c) | Net amount represents the net amount payable to the counterparty in the event of default. |
Boston Income Portfolio
October 31, 2014
Notes to Financial Statements — continued
The effect of derivative instruments (not considered to be hedging instruments for accounting disclosure purposes) on the Statement of Operations by risk exposure for the year ended October 31, 2014 was as follows:
| | | | | | | | | | |
| Risk | | Derivative | | Realized Gain (Loss)
on Derivatives Recognized
in Income(1) | | | Change in Unrealized
Appreciation (Depreciation) on
Derivatives Recognized in Income(2) | |
| | | |
Credit | | Swap contracts | | $ | 3,833,529 | | | $ | (1,760,150 | ) |
Foreign Exchange | | Forward foreign currency exchange contracts | | | — | | | | (4,321 | ) |
| | | |
Total | | | | $ | 3,833,529 | | | $ | (1,764,471 | ) |
| (1) | Statement of Operations location: Net realized gain (loss) – Swap contracts. |
| (2) | Statement of Operations location: Change in unrealized appreciation (depreciation) – Swap contracts and Foreign currency and forward foreign currency exchange contracts, respectively. |
The average notional amounts of derivative contracts outstanding during the year ended October 31, 2014, which are indicative of the volume of these derivative types, were as follows:
| | | | |
Forward
Foreign Currency
Exchange Contracts | | Swap
Contracts | |
| $387,000 | | $ | 70,081,000 | |
7 Line of Credit
The Portfolio participates with other portfolios and funds managed by EVM and its affiliates in a $750 million unsecured line of credit agreement with a group of banks. Borrowings are made by the Portfolio solely to facilitate the handling of unusual and/or unanticipated short-term cash requirements. Interest is charged to the Portfolio based on its borrowings at an amount above either the Eurodollar rate or Federal Funds rate. In addition, a fee computed at an annual rate of 0.08% on the daily unused portion of the line of credit is allocated among the participating portfolios and funds at the end of each quarter. Because the line of credit is not available exclusively to the Portfolio, it may be unable to borrow some or all of its requested amounts at any particular time. The Portfolio did not have any significant borrowings or allocated fees during the year ended October 31, 2014.
8 Credit Risk
The Portfolio primarily invests in lower rated and comparable quality unrated high yield securities. These investments have different risks than investments in debt securities rated investment grade. Risk of loss upon default by the borrower is significantly greater with respect to such debt than with other debt securities because these securities are generally unsecured and are more sensitive to adverse economic conditions, such as recession or increasing interest rates, than are investment grade issuers.
9 Fair Value Measurements
Under generally accepted accounting principles for fair value measurements, a three-tier hierarchy to prioritize the assumptions, referred to as inputs, is used in valuation techniques to measure fair value. The three-tier hierarchy of inputs is summarized in the three broad levels listed below.
| Ÿ | | Level 1 – quoted prices in active markets for identical investments |
| Ÿ | | Level 2 – other significant observable inputs (including quoted prices for similar investments, interest rates, prepayment speeds, credit risk, etc.) |
| Ÿ | | Level 3 – significant unobservable inputs (including a fund’s own assumptions in determining the fair value of investments) |
In cases where the inputs used to measure fair value fall in different levels of the fair value hierarchy, the level disclosed is determined based on the lowest level input that is significant to the fair value measurement in its entirety. The inputs or methodology used for valuing securities are not necessarily an indication of the risk associated with investing in those securities.
Boston Income Portfolio
October 31, 2014
Notes to Financial Statements — continued
At October 31, 2014, the hierarchy of inputs used in valuing the Portfolio’s investments and open derivative instruments, which are carried at value, were as follows:
| | | | | | | | | | | | | | | | |
| Asset Description | | Level 1 | | | Level 2 | | | Level 3* | | | Total | |
| | | | |
Corporate Bonds & Notes | | $ | — | | | $ | 4,448,192,651 | | | $ | 1,455,043 | | | $ | 4,449,647,694 | |
Senior Floating-Rate Interests | | | — | | | | 302,803,422 | | | | — | | | | 302,803,422 | |
Convertible Bonds | | | — | | | | 22,560,516 | | | | — | | | | 22,560,516 | |
Commercial Mortgage-Backed Securities | | | — | | | | 10,751,330 | | | | — | | | | 10,751,330 | |
Common Stocks | | | 6,423,524 | | | | — | | | | 7,367,651 | | | | 13,791,175 | |
Convertible Preferred Stocks | | | 4,880,142 | | | | 38,200,684 | | | | — | | | | 43,080,826 | |
Miscellaneous | | | 1,287,382 | | | | 7,367,769 | | | | 6,000,001 | | | | 14,655,152 | |
Warrants | | | — | | | | 585,375 | | | | — | | | | 585,375 | |
Short-Term Investments | | | — | | | | 153,845,087 | | | | — | | | | 153,845,087 | |
| | | | |
Total Investments | | $ | 12,591,048 | | | $ | 4,984,306,834 | | | $ | 14,822,695 | | | $ | 5,011,720,577 | |
| | | | |
Swap Contracts | | $ | — | | | $ | 4,023,350 | | | $ | — | | | $ | 4,023,350 | |
| | | | |
Total | | $ | 12,591,048 | | | $ | 4,988,330,184 | | | $ | 14,822,695 | | | $ | 5,015,743,927 | |
| | | | |
Liability Description | | | | | | | | | | | | | | | | |
| | | | |
Forward Foreign Currency Exchange Contracts | | $ | — | | | $ | (4,321 | ) | | $ | — | | | $ | (4,321 | ) |
| | | | |
Total | | $ | — | | | $ | (4,321 | ) | | $ | — | | | $ | (4,321 | ) |
| * | None of the unobservable inputs for Level 3 assets, individually or collectively, had a material impact on the Portfolio. |
Level 3 investments at the beginning and/or end of the period in relation to net assets were not significant and accordingly, a reconciliation of Level 3 assets for the year ended October 31, 2014 is not presented.
At October 31, 2014, there were no investments transferred between Level 1 and Level 2 during the year then ended.
Boston Income Portfolio
October 31, 2014
Report of Independent Registered Public Accounting Firm
To the Trustees and Investors of Boston Income Portfolio:
We have audited the accompanying statement of assets and liabilities of Boston Income Portfolio (the “Portfolio”), including the portfolio of investments, as of October 31, 2014, and the related statement of operations for the year then ended, the statements of changes in net assets for each of the two years in the period then ended, and the supplementary data for each of the five years in the period then ended. These financial statements and supplementary data are the responsibility of the Portfolio’s management. Our responsibility is to express an opinion on these financial statements and supplementary data based on our audits.
We conducted our audits in accordance with the standards of the Public Company Accounting Oversight Board (United States). Those standards require that we plan and perform the audit to obtain reasonable assurance about whether the financial statements and supplementary data are free of material misstatement. The Portfolio is not required to have, nor were we engaged to perform, an audit of its internal control over financial reporting. Our audits included consideration of internal control over financial reporting as a basis for designing audit procedures that are appropriate in the circumstances, but not for the purpose of expressing an opinion on the effectiveness of the Portfolio’s internal control over financial reporting. Accordingly, we express no such opinion. An audit also includes examining, on a test basis, evidence supporting the amounts and disclosures in the financial statements, assessing the accounting principles used and significant estimates made by management, as well as evaluating the overall financial statement presentation. Our procedures included confirmation of securities and senior loans owned as of October 31, 2014, by correspondence with the custodian, brokers, and selling or agent banks; where replies were not received from brokers and selling or agent banks, we performed other auditing procedures. We believe that our audits provide a reasonable basis for our opinion.
In our opinion, such financial statements and supplementary data referred to above present fairly, in all material respects, the financial position of Boston Income Portfolio as of October 31, 2014, the results of its operations for the year then ended, the changes in its net assets for each of the two years in the period then ended, and the supplementary data for each of the five years in the period then ended, in conformity with accounting principles generally accepted in the United States of America.
DELOITTE & TOUCHE LLP
Boston, Massachusetts
December 19, 2014
Eaton Vance Income Fund of Boston
Boston Income Portfolio
October 31, 2014
Special Meeting of Shareholders (Unaudited)
Eaton Vance Income Fund of Boston
The Fund held a Special Meeting of Shareholders on May 29, 2014 to elect five Trustees. The results of the vote were as follows:
| | | | | | | | |
| | | Number of Shares(1) | |
| Nominee for Trustee | | For | | | Withheld | |
Scott E. Eston | | | 720,436,844 | | | | 7,017,286 | |
Cynthia E. Frost | | | 720,211,814 | | | | 7,242,316 | |
George J. Gorman | | | 720,205,074 | | | | 7,249,056 | |
Valerie A. Mosley | | | 720,656,950 | | | | 6,797,180 | |
Harriett Tee Taggart | | | 720,427,243 | | | | 7,026,887 | |
Each nominee was also elected a Trustee of the Portfolio.
| (1) | Excludes fractional shares. |
Boston Income Portfolio
The Portfolio held a Special Meeting of Interestholders on May 29, 2014 to elect five Trustees. The results of the vote were as follows:
| | | | | | | | |
| | | Interest in the Portfolio | |
| Nominee for Trustee | | For | | | Withheld | |
Scott E. Eston | | | 99.02 | % | | | 0.98 | % |
Cynthia E. Frost | | | 98.98 | % | | | 1.02 | % |
George J. Gorman | | | 98.98 | % | | | 1.02 | % |
Valerie A. Mosley | | | 99.04 | % | | | 0.96 | % |
Harriett Tee Taggart | | | 99.02 | % | | | 0.98 | % |
Eaton Vance
Income Fund of Boston
October 31, 2014
Management and Organization
Fund Management. The Trustees of Eaton Vance Series Trust II (the Trust) and Boston Income Portfolio (the Portfolio) are responsible for the overall management and supervision of the Trust’s and Portfolio’s affairs. The Trustees and officers of the Trust and the Portfolio are listed below. Except as indicated, each individual has held the office shown or other offices in the same company for the last five years. Trustees and officers of the Trust and the Portfolio hold indefinite terms of office. The “Noninterested Trustees” consist of those Trustees who are not “interested persons” of the Trust and the Portfolio, as that term is defined under the 1940 Act. The business address of each Trustee and officer is Two International Place, Boston, Massachusetts 02110. As used below, “EVC” refers to Eaton Vance Corp., “EV” refers to Eaton Vance, Inc., “EVM” refers to Eaton Vance Management, “BMR” refers to Boston Management and Research and “EVD” refers to Eaton Vance Distributors, Inc. EVC and EV are the corporate parent and trustee, respectively, of EVM and BMR. EVD is the Fund’s principal underwriter, the Portfolio’s placement agent and a wholly-owned subsidiary of EVC. Each officer affiliated with Eaton Vance may hold a position with other Eaton Vance affiliates that is comparable to his or her position with EVM listed below. Each Trustee oversees 180 portfolios in the Eaton Vance Complex (including all master and feeder funds in a master feeder structure). Each officer serves as an officer of certain other Eaton Vance funds. Each Trustee and officer serves until his or her successor is elected.
| | | | | | |
| Name and Year of Birth | | Position(s) with the Trust
and the
Portfolio | | Trustee Since(1) | | Principal Occupation(s) and Directorships During Past Five Years and Other Relevant Experience |
Interested Trustee |
| | | |
Thomas E. Faust Jr. 1958 | | Trustee | | 2007 | | Chairman, Chief Executive Officer and President of EVC, Director and President of EV, Chief Executive Officer and President of EVM and BMR, and Director of EVD. Trustee and/or officer of 180 registered investment companies. Mr. Faust is an interested person because of his positions with EVM, BMR, EVD, EVC and EV, which are affiliates of the Trust and the Portfolio. Directorships in the Last Five Years.(2) Director of EVC and Hexavest Inc. |
| | | |
| | | | | | |
Noninterested Trustees |
| | | |
Scott E. Eston 1956 | | Trustee | | 2011 | | Private investor. Formerly held various positions at Grantham, Mayo, Van Otterloo and Co., L.L.C. (investment management firm) (1997-2009), including Chief Operating Officer (2002-2009), Chief Financial Officer (1997-2009) and Chairman of the Executive Committee (2002-2008); President and Principal Executive Officer, GMO Trust (open-end registered investment company) (2006-2009). Former Partner, Coopers and Lybrand L.L.P. (now PricewaterhouseCoopers) (public accounting firm) (1987-1997). Directorships in the Last Five Years.(2) None. |
| | | |
Cynthia E. Frost(3) 1961 | | Trustee | | 2014 | | Private investor. Formerly, Chief Investment Officer of Brown University (university endowment) (2000-2012); Portfolio Strategist for Duke Management Company (university endowment manager) (1995-2000); Managing Director, Cambridge Associates (1989-1995); Consultant, Bain and Company (1987-1989); Senior Equity Analyst, BA Investment Management Company (1983-1985). Directorships in the Last Five Years. None. |
| | | |
George J. Gorman(3) 1952 | | Trustee | | 2014 | | Principal at George J. Gorman LLC (consulting firm). Formerly, Senior Partner at Ernst & Young LLP (public accounting firm) (1974-2009). Directorships in the Last Five Years. Formerly, Trustee of the Bank of America Money Market Funds Series Trust (2011-2014) and of the Ashmore Funds (2010-2014). |
| | | |
Valerie A. Mosley(4) 1960 | | Trustee | | 2014 | | Chairwoman and Chief Executive Officer of Valmo Ventures (a consulting and investment firm). Former Partner and Senior Vice President, Portfolio Manager and Investment Strategist at Wellington Management Company, LLP (investment management firm) (1992-2012). Former Chief Investment Officer, PG Corbin Asset Management (1990-1992). Formerly worked in institutional corporate bond sales at Kidder Peabody (1986-1990). Directorships in the Last Five Years.(2) Director of Dynex Capital, Inc. (mortgage REIT) (since 2013). |
Eaton Vance
Income Fund of Boston
October 31, 2014
Management and Organization — continued
| | | | | | |
| Name and Year of Birth | | Position(s) with the Trust
and the
Portfolio | | Trustee Since(1) | | Principal Occupation(s) and Directorships During Past Five Years and Other Relevant Experience |
Noninterested Trustees (continued) |
| | | |
William H. Park 1947 | | Trustee | | 2003 | | Consultant and private investor. Formerly, Chief Financial Officer, Aveon Group L.P. (investment management firm) (2010-2011). Formerly, Vice Chairman, Commercial Industrial Finance Corp. (specialty finance company) (2006-2010). Formerly, President and Chief Executive Officer, Prizm Capital Management, LLC (investment management firm) (2002-2005). Formerly, Executive Vice President and Chief Financial Officer, United Asset Management Corporation (investment management firm) (1982-2001). Formerly, Senior Manager, Price Waterhouse (now PricewaterhouseCoopers) (an independent registered public accounting firm) (1972-1981). Directorships in the Last Five Years.(2) None. |
| | | |
Ronald A. Pearlman 1940 | | Trustee | | 2003 | | Lawyer and consultant. Formerly, Professor of Law, Georgetown University Law Center (1999-2014). Formerly, Partner, Covington & Burling LLP (law firm) (1991-2000). Formerly, Chief of Staff, Joint Committee on Taxation, U.S. Congress (1988-1990). Formerly, Deputy Assistant Secretary (Tax Policy) and Assistant Secretary (Tax Policy), U.S. Department of the Treasury (1983-1985). Directorships in the Last Five Years.(2) None. |
| | | |
Helen Frame Peters 1948 | | Trustee | | 2008 | | Professor of Finance, Carroll School of Management, Boston College. Formerly, Dean, Carroll School of Management, Boston College (2000-2002). Formerly, Chief Investment Officer, Fixed Income, Scudder Kemper Investments (investment management firm) (1998-1999). Formerly, Chief Investment Officer, Equity and Fixed Income, Colonial Management Associates (investment management firm) (1991-1998). Directorships in the Last Five Years.(2) Formerly, Director of BJ’s Wholesale Club, Inc. (wholesale club retailer) (2004-2011). Formerly, Trustee of SPDR Index Shares Funds and SPDR Series Trust (exchange traded funds) (2000-2009). Formerly, Director of Federal Home Loan Bank of Boston (a bank for banks) (2007-2009). |
| | | |
Harriett Tee Taggart 1948 | | Trustee | | 2011 | | Managing Director, Taggart Associates (a professional practice firm). Formerly, Partner and Senior Vice President, Wellington Management Company, LLP (investment management firm) (1983-2006). Directorships in the Last Five Years.(2) Director of Albemarle Corporation (chemicals manufacturer) (since 2007) and The Hanover Group (specialty property and casualty insurance company) (since 2009). Formerly, Director of Lubrizol Corporation (specialty chemicals) (2007-2011). |
| | | |
Ralph F. Verni 1943 | | Chairman of the Board and Trustee | | 2007 (Chairman) 2005 (Trustee) | | Consultant and private investor. Formerly, Chief Investment Officer (1982-1992), Chief Financial Officer (1988-1990) and Director (1982-1992), New England Life. Formerly, Chairperson, New England Mutual Funds (1982-1992). Formerly, President and Chief Executive Officer, State Street Management & Research (1992-2000). Formerly, Chairperson, State Street Research Mutual Funds (1992-2000). Formerly, Director, W.P. Carey, LLC (1998-2004) and First Pioneer Farm Credit Corp. (2002-2006). Directorships in the Last Five Years.(2) None. |
| | | |
| | | | | | |
Principal Officers who are not Trustees |
| Name and Year of Birth | | Position(s)
with the Trust
and the
Portfolio | | Officer
Since(5) | | Principal Occupation(s) During Past Five Years |
Michael W. Weilheimer 1961 | | President | | 1995 | | Vice President of EVM and BMR. |
| | | |
Payson F. Swaffield 1956 | | Vice President of the Portfolio | | 2003 | | Vice President and Chief Income Investment Officer of EVM and BMR. |
| | | |
Maureen A. Gemma 1960 | | Vice President, Secretary and Chief Legal Officer | | 2005 | | Vice President of EVM and BMR. |
Eaton Vance
Income Fund of Boston
October 31, 2014
Management and Organization — continued
| | | | | | |
| Name and Year of Birth | | Position(s)
with the Trust
and the Portfolio | | Officer
Since(5) | | Principal Occupation(s) During Past Five Years |
Principal Officers who are not Trustees (continued) |
| | | |
James F. Kirchner 1967 | | Treasurer | | 2007 | | Vice President of EVM and BMR. |
| | | |
Paul M. O’Neil 1953 | | Chief Compliance Officer | | 2004 | | Vice President of EVM and BMR. |
| (1) | Year first appointed to serve as Trustee for a fund in the Eaton Vance family of funds. Each Trustee has served continuously since appointment unless indicated otherwise. |
| (2) | During their respective tenures, the Trustees (except for Ms. Frost and Mr. Gorman) also served as Board members of one or more of the following funds (which operated in the years noted): eUnitsTM 2 Year U.S. Market Participation Trust: Upside to Cap / Buffered Downside (launched in 2012 and terminated in 2014); eUnitsTM 2 Year U.S. Market Participation Trust II: Upside to Cap / Buffered Downside (launched in 2012 and terminated in 2014); Eaton Vance Credit Opportunities Fund (launched in 2005 and terminated in 2010); Eaton Vance Insured Florida Plus Municipal Bond Fund (launched in 2002 and terminated in 2009); and Eaton Vance National Municipal Income Trust (launched in 1998 and terminated in 2009). However, Ms. Mosley did not serve as a Board member of eUnitsTM 2 Year U.S. Market Participation Trust: Upside to Cap / Buffered Downside (launched in 2012 and terminated in 2014). |
| (3) | Ms. Frost and Mr. Gorman began serving as Trustees effective May 29, 2014. |
| (4) | Ms. Mosley began serving as a Trustee effective January 1, 2014. |
| (5) | Year first elected to serve as officer of a fund in the Eaton Vance family of funds when the officer has served continuously. Otherwise, year of most recent election as an officer of a fund in the Eaton Vance family of funds. Titles may have changed since initial election. |
The SAI for the Fund includes additional information about the Trustees and officers of the Fund and the Portfolio and can be obtained without charge on Eaton Vance’s website at www.eatonvance.com or by calling 1-800-262-1122.
Eaton Vance Funds
IMPORTANT NOTICES
Privacy. The Eaton Vance organization is committed to ensuring your financial privacy. Each of the financial institutions identified below has in effect the following policy (“Privacy Policy”) with respect to nonpublic personal information about its customers:
| Ÿ | | Only such information received from you, through application forms or otherwise, and information about your Eaton Vance fund transactions will be collected. This may include information such as name, address, social security number, tax status, account balances and transactions. |
| Ÿ | | None of such information about you (or former customers) will be disclosed to anyone, except as permitted by law (which includes disclosure to employees necessary to service your account). In the normal course of servicing a customer’s account, Eaton Vance may share information with unaffiliated third parties that perform various required services such as transfer agents, custodians and broker-dealers. |
| Ÿ | | Policies and procedures (including physical, electronic and procedural safeguards) are in place that are designed to protect the confidentiality of such information. |
| Ÿ | | We reserve the right to change our Privacy Policy at any time upon proper notification to you. Customers may want to review our Privacy Policy periodically for changes by accessing the link on our homepage: www.eatonvance.com. |
Our pledge of privacy applies to the following entities within the Eaton Vance organization: the Eaton Vance Family of Funds, Eaton Vance Management, Eaton Vance Investment Counsel, Eaton Vance Distributors, Inc., Eaton Vance Trust Company, Eaton Vance Management’s Real Estate Investment Group and Boston Management and Research. In addition, our Privacy Policy applies only to those Eaton Vance customers who are individuals and who have a direct relationship with us. If a customer’s account (i.e., fund shares) is held in the name of a third-party financial advisor/broker-dealer, it is likely that only such advisor’s privacy policies apply to the customer. This notice supersedes all previously issued privacy disclosures. For more information about Eaton Vance’s Privacy Policy, please call 1-800-262-1122.
Delivery of Shareholder Documents. The Securities and Exchange Commission (SEC) permits funds to deliver only one copy of shareholder documents, including prospectuses, proxy statements and shareholder reports, to fund investors with multiple accounts at the same residential or post office box address. This practice is often called “householding” and it helps eliminate duplicate mailings to shareholders. Eaton Vance, or your financial advisor, may household the mailing of your documents indefinitely unless you instruct Eaton Vance, or your financial advisor, otherwise. If you would prefer that your Eaton Vance documents not be householded, please contact Eaton Vance at 1-800-262-1122, or contact your financial advisor. Your instructions that householding not apply to delivery of your Eaton Vance documents will be effective within 30 days of receipt by Eaton Vance or your financial advisor.
Portfolio Holdings. Each Eaton Vance Fund and its underlying Portfolio(s) (if applicable) will file a schedule of portfolio holdings on Form N-Q with the SEC for the first and third quarters of each fiscal year. The Form N-Q will be available on the Eaton Vance website at www.eatonvance.com, by calling Eaton Vance at 1-800-262-1122 or in the EDGAR database on the SEC’s website at www.sec.gov. Form N-Q may also be reviewed and copied at the SEC’s public reference room in Washington, D.C. (call 1-800-732-0330 for information on the operation of the public reference room).
Proxy Voting. From time to time, funds are required to vote proxies related to the securities held by the funds. The Eaton Vance Funds or their underlying Portfolios (if applicable) vote proxies according to a set of policies and procedures approved by the Funds’ and Portfolios’ Boards. You may obtain a description of these policies and procedures and information on how the Funds or Portfolios voted proxies relating to portfolio securities during the most recent 12-month period ended June 30, without charge, upon request, by calling 1-800-262-1122 and by accessing the SEC’s website at www.sec.gov.
This Page Intentionally Left Blank
This Page Intentionally Left Blank
Investment Adviser of Boston Income Portfolio
Boston Management and Research
Two International Place
Boston, MA 02110
Administrator of Eaton Vance Income Fund of Boston
Eaton Vance Management
Two International Place
Boston, MA 02110
Principal Underwriter*
Eaton Vance Distributors, Inc.
Two International Place
Boston, MA 02110
(617) 482-8260
Custodian
State Street Bank and Trust Company
State Street Financial Center, One Lincoln Street
Boston, MA 02111
Transfer Agent
BNY Mellon Investment Servicing (US) Inc.
Attn: Eaton Vance Funds
P.O. Box 9653
Providence, RI 02940-9653
(800) 262-1122
Independent Registered Public Accounting Firm
Deloitte & Touche LLP
200 Berkeley Street
Boston, MA 02116-5022
Fund Offices
Two International Place
Boston, MA 02110
| * | FINRA BrokerCheck. Investors may check the background of their Investment Professional by contacting the Financial Industry Regulatory Authority (FINRA). FINRA BrokerCheck is a free tool to help investors check the professional background of current and former FINRA-registered securities firms and brokers. FINRA BrokerCheck is available by calling 1-800-289-9999 and at www.FINRA.org. The FINRA BrokerCheck brochure describing this program is available to investors at www.FINRA.org. |
443 10.31.14
Item 2. Code of Ethics
The registrant has adopted a code of ethics applicable to its Principal Executive Officer, Principal Financial Officer and Principal Accounting Officer. The registrant undertakes to provide a copy of such code of ethics to any person upon request, without charge, by calling 1-800-262-1122.
Item 3. Audit Committee Financial Expert
The registrant’s Board has designated William H. Park, an independent trustee, as its audit committee financial expert. Mr. Park is a certified public accountant who is a consultant and private investor. Previously, he served as the Chief Financial Officer of Aveon Group, L.P. (an investment management firm), as the Vice Chairman of Commercial Industrial Finance Corp. (specialty finance company), as President and Chief Executive Officer of Prizm Capital Management, LLC (investment management firm), as Executive Vice President and Chief Financial Officer of United Asset Management Corporation (an institutional investment management firm) and as a Senior Manager at Price Waterhouse (now PricewaterhouseCoopers) (an independent registered public accounting firm).
Item 4. Principal Accountant Fees and Services
(a)-(d)
Eaton Vance Income Fund of Boston (the “Fund”) is a series of Eaton Vance Series Trust II (the “Trust”), a Massachusetts business trust, which, including the Fund, contains a total of 2 series (the “Series”). The Trust is registered under the Investment Company Act of 1940 as an open-end management investment company. This Form N-CSR relates to the Fund’s annual report.
The following table presents the aggregate fees billed to the fund for the fund’s fiscal years ended October 31, 2013 and October 31, 2014 by the fund’s principal accountant, Deloitte & Touche LLP (“D&T”), for professional services rendered for the audit of the fund’s annual financial statements and fees billed for other services rendered by D&T during such periods.
| | | | | | | | |
Eaton Vance Income Fund of Boston Fiscal Years Ended | | 10/31/13 | | | 10/31/14 | |
Audit Fees | | $ | 17,320 | | | $ | 22,820 | |
Audit-Related Fees(1) | | $ | 0 | | | $ | 0 | |
Tax Fees(2) | | $ | 12,870 | | | $ | 13,780 | |
All Other Fees(3) | | $ | 0 | | | $ | 0 | |
| | | | | | | | |
Total | | $ | 30,190 | | | $ | 36,600 | |
| | | | | | | | |
| (1) | Audit-related fees consist of the aggregate fees billed for assurance and related services that are reasonably related to the performance of the audit of financial statements and are not reported under the category of audit fees. |
| (2) | Tax fees consist of the aggregate fees billed for professional services rendered by the principal accountant relating to tax compliance, tax advice, and tax planning and specifically include fees for tax return preparation and other tax related compliance/planning matters. |
| (3) | All other fees consist of the aggregate fees billed for products and services provided by the principal accountant other than audit, audit-related, and tax services. |
The various Series comprising the Trust have differing fiscal year ends (October 31 or June 30). The following table presents the aggregate audit, audit-related, tax, and other fees billed to all of the Series in the Trust by D&T for the last two fiscal years of each Series.
| | | | | | | | | | | | | | | | |
Fiscal Years Ended | | 6/30/13 | | | 10/31/13 | | | 6/30/14 | | | 10/31/14 | |
Audit Fees | | $ | 74,770 | | | $ | 17,320 | | | $ | 75,070 | | | $ | 22,820 | |
Audit-Related Fees(1) | | $ | 0 | | | $ | 0 | | | $ | 0 | | | $ | 0 | |
Tax Fees(2) | | $ | 30,030 | | | $ | 12,870 | | | $ | 12,625 | | | $ | 13,780 | |
All Other Fees(3) | | $ | 0 | | | $ | 0 | | | $ | 0 | | | $ | 0 | |
| | | | | | | | | | | | | | | | |
Total | | $ | 104,800 | (4) | | $ | 30,190 | | | $ | 87,695 | (4) | | $ | 36,600 | |
| | | | | | | | | | | | | | | | |
| (1) | Audit-related fees consist of the aggregate fees billed for assurance and related services that are reasonably related to the performance of the audit of financial statements and are not reported under the category of audit fees. |
| (2) | Tax fees consist of the aggregate fees billed for professional services rendered by the principal accountant relating to tax compliance, tax advice, and tax planning and specifically include fees for tax return preparation and other tax related compliance/planning matters. |
| (3) | All other fees consist of the aggregate fees billed for products and services provided by the principal accountant other than audit, audit-related, and tax services. |
| (4) | Fees are paid by the Fund’s administrator pursuant to the terms of its administrative services agreement. |
(e)(1) The registrant’s audit committee has adopted policies and procedures relating to the pre-approval of services provided by the registrant’s principal accountant (the “Pre-Approval Policies”). The Pre-Approval Policies establish a framework intended to assist the audit committee in the proper discharge of its pre-approval responsibilities. As a general matter, the Pre-Approval Policies (i) specify certain types of audit, audit-related, tax, and other services determined to be pre-approved by the audit committee; and (ii) delineate specific procedures governing the mechanics of the pre-approval process, including the approval and monitoring of audit and non-audit service fees. Unless a service is specifically pre-approved under the Pre-Approval Policies, it must be separately pre-approved by the audit committee.
The Pre-Approval Policies and the types of audit and non-audit services pre-approved therein must be reviewed and ratified by the registrant’s audit committee at least annually. The registrant’s audit committee maintains full responsibility for the appointment, compensation, and oversight of the work of the registrant’s principal accountant.
(e)(2) No services described in paragraphs (b)-(d) above were approved by the registrant’s audit committee pursuant to the “de minimis exception” set forth in Rule 2-01(c)(7)(i)(C) of Regulation S-X.
(f) Not applicable.
(g) The following table presents (i) the aggregate non-audit fees (i.e., fees for audit-related, tax, and other services) billed for services rendered to all of the Series in the Trust by D&T for the last two fiscal years of each series; and (ii) the aggregate non-audit fees (i.e., fees for audit-related, tax, and other services) billed to the Eaton Vance organization by D&T for the last two fiscal years of each Series.
| | | | | | | | | | | | | | | | |
Fiscal Years Ended | | 6/30/13 | | | 10/31/13 | | | 6/30/14 | | | 10/31/14 | |
Registrant(1) | | $ | 30,030 | | | $ | 12,870 | | | $ | 12,625 | | | $ | 13,780 | |
Eaton Vance(2) | | $ | 261,151 | | | $ | 526,385 | | | $ | 336,473 | | | $ | 99,750 | |
| (1) | Includes all of the Series of the Trust. During the fiscal years reported above, certain of the Funds were “feeder” funds in a “master-feeder” fund structure or funds of funds. |
| (2) | Various subsidiaries of Eaton Vance Corp. act in either an investment advisory and/or service provider capacity with respect to the Series and/or their respective “master” funds (if applicable). |
(h) The registrant’s audit committee has considered whether the provision by the registrant’s principal accountant of non-audit services to the registrant’s investment adviser and any entity controlling, controlled by, or under common control with the adviser that provides ongoing services to the registrant that were not pre-approved pursuant to Rule 2-01(c)(7)(ii) of Regulation S-X is compatible with maintaining the principal accountant’s independence.
Item 5. Audit Committee of Listed Registrants
Not applicable.
Item 6. Schedule of Investments
Please see schedule of investments contained in the Report to Stockholders included under Item 1 of this Form N-CSR.
Item 7. Disclosure of Proxy Voting Policies and Procedures for Closed-End Management Investment Companies
Not applicable.
Item 8. Portfolio Managers of Closed-End Management Investment Companies
Not applicable.
Item 9. Purchases of Equity Securities by Closed-End Management Investment Company and Affiliated Purchasers
Not applicable.
Item 10. Submission of Matters to a Vote of Security Holders
No material changes.
Item 11. Controls and Procedures
(a) It is the conclusion of the registrant’s principal executive officer and principal financial officer that the effectiveness of the registrant’s current disclosure controls and procedures (such disclosure controls and procedures having been evaluated within 90 days of the date of this filing) provide reasonable assurance that the information required to be disclosed by the registrant has been recorded, processed, summarized and reported within the time period specified in the Commission’s rules and forms and that the information required to be disclosed by the registrant has been accumulated and communicated to the registrant’s principal executive officer and principal financial officer in order to allow timely decisions regarding required disclosure.
(b) There have been no changes in the registrant’s internal controls over financial reporting during the second fiscal quarter of the period covered by this report that has materially affected, or is reasonably likely to materially affect, the registrant’s internal control over financial reporting.
Item 12. Exhibits
| | |
(a)(1) | | Registrant’s Code of Ethics – Not applicable (please see Item 2). |
| |
(a)(2)(i) | | Treasurer’s Section 302 certification. |
| |
(a)(2)(ii) | | President’s Section 302 certification. |
| |
(b) | | Combined Section 906 certification. |
Signatures
Pursuant to the requirements of the Securities Exchange Act of 1934 and the Investment Company Act of 1940, the registrant has duly caused this report to be signed on its behalf by the undersigned, thereunto duly authorized.
| | |
| Eaton Vance Series Trust II |
| |
| By: | | /s/ Michael W. Weilheimer |
| | Michael W. Weilheimer |
| | President |
| |
| Date: | | December 17, 2014 |
Pursuant to the requirements of the Securities Exchange Act of 1934 and the Investment Company Act of 1940, this report has been signed below by the following persons on behalf of the registrant and in the capacities and on the dates indicated.
| | |
| By: | | /s/ James F. Kirchner |
| | James F. Kirchner |
| | Treasurer |
| |
| Date: | | December 17, 2014 |
| |
| By: | | /s/ Michael W. Weilheimer |
| | Michael W. Weilheimer |
| | President |
| |
| Date: | | December 17, 2014 |