UNITED STATES
SECURITIES AND EXCHANGE COMMISSION
Washington, D.C. 20549
Form N-CSR
CERTIFIED SHAREHOLDER REPORT OF REGISTERED
MANAGEMENT INVESTMENT COMPANIES
Investment Company Act File Number: 811-02258
Eaton Vance Series Trust II
(Exact Name of Registrant as Specified in Charter)
Two International Place, Boston, Massachusetts 02110
(Address of Principal Executive Offices)
Maureen A. Gemma
Two International Place, Boston, Massachusetts 02110
(Name and Address of Agent for Services)
(617) 482-8260
(Registrant’s Telephone Number)
June 30
Date of Fiscal Year End
June 30, 2016
Date of Reporting Period
Item 1. Reports to Stockholders

Parametric Tax-Managed Emerging Markets Fund
Annual Report
June 30, 2016

Commodity Futures Trading Commission Registration. Effective December 31, 2012, the Commodity Futures Trading Commission (“CFTC”) adopted certain regulatory changes that subject registered investment companies and advisers to regulation by the CFTC if a fund invests more than a prescribed level of its assets in certain CFTC-regulated instruments (including futures, certain options and swap agreements) or markets itself as providing investment exposure to such instruments. The Fund has claimed an exclusion from the definition of the term “commodity pool operator” under the Commodity Exchange Act. Accordingly, neither the Fund nor the adviser with respect to the operation of the Fund is subject to CFTC regulation. Because of its management of other strategies, the Fund’s adviser is registered with the CFTC as a commodity pool operator and a commodity trading advisor.
Fund shares are not insured by the FDIC and are not deposits or other obligations of, or guaranteed by, any depository institution. Shares are subject to investment risks, including possible loss of principal invested.
This report must be preceded or accompanied by a current summary prospectus or prospectus. Before investing, investors should consider carefully the investment objective, risks, and charges and expenses of a mutual fund. This and other important information is contained in the summary prospectus and prospectus, which can be obtained from a financial advisor. Prospective investors should read the prospectus carefully before investing. For further information, please call 1-800-260-0761.
Annual Report June 30, 2016
Parametric Tax-Managed Emerging Markets Fund
Table of Contents
| | | | |
Management’s Discussion of Fund Performance | | | 2 | |
| |
Performance | | | 3 | |
| |
Fund Profile | | | 4 | |
| |
Endnotes and Additional Disclosures | | | 5 | |
| |
Fund Expenses | | | 6 | |
| |
Financial Statements | | | 7 | |
| |
Report of Independent Registered Public Accounting Firm | | | 37 | |
| |
Federal Tax Information | | | 38 | |
| |
Board of Trustees’ Contract Approval | | | 39 | |
| |
Management and Organization | | | 42 | |
| |
Important Notices | | | 45 | |
Parametric Tax-Managed Emerging Markets Fund
June 30, 2016
Management’s Discussion of Fund Performance1
Economic and Market Conditions
For the 12-month period ended June 30, 2016, emerging-market equities were generally characterized by dramatic volatility, fed by country-specific themes such as political unrest, fiscal challenges and unstable currency values.
The 12-month period started with investors pessimistic about the emerging-market asset class as a whole. This was partially due to Brazil’s market experiencing a sharp decline in government corruption scandals, China’s strong run from the first half of 2015 reversing over July and August, and Greece’s confrontation with Europe resulting in its markets being closed for an extended period. The remainder of 2015 was punishing to the asset class, as the continuing decline in commodity prices and growing concerns about the economic slowdown in China negatively impacted a large number of emerging economies. These worries continued to dominate market activity until mid-February 2016, when market sentiment improved on an upswing in commodity prices and a decision by the U.S. Federal Reserve (the Fed) to delay its planned interest-rate hikes.
The remainder of the 12-month period was generally positive, with major Index constituent Brazil leading the rally amid a resolution to the political turmoil of the past year and signs that the Brazilian economy was on the mend. South Africa and Russia also delivered double-digit gains on the back of rising commodity prices. The period ended with the surprise outcome of the Brexit vote, which initially drove many investors to sell riskier assets. However, the sell-off was short-lived, as most investors believed Brexit-related uncertainty would further delay any near-term rate increases by the Fed.
Frontier markets (as measured by the MSCI Frontier Markets Index2) generally delivered similar returns as emerging markets (as measured by the MSCI Emerging Markets Index). Country returns in the frontier markets were wide-ranging. Oil exporters such as Kazakhstan and Nigeria dropped significantly, while countries with improving prospects (e.g., Pakistan and Argentina) saw more modest losses or even gains.
Fund Performance
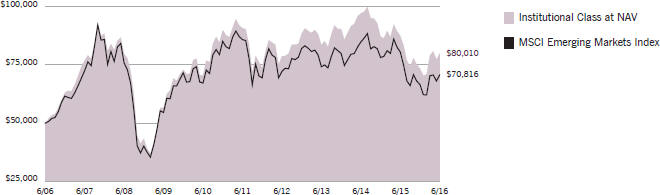
For the 12-month period ended June 30, 2016, Parametric Tax-Managed Emerging Markets Fund (the Fund) had a total return of –8.64% for Institutional Class shares at net asset value (NAV), outperforming the Fund’s benchmark, the MSCI
Emerging Markets Index (the Index), which had a total return of –12.05% for the same period.
The largest contributor to relative Fund performance versus the Index was the Fund’s underweight position in China, whose equity market fell on reduced trade flows, slowing economic growth and worries about further currency devaluations. In addition, the Fund’s overweight position in Hungary was a large contributor to relative Fund performance, as Hungary’s economy grew in response to a series of wide-ranging political reforms. Finally, the Fund’s overweight position in Russia benefited relative Fund performance versus the Index, as Russia’s market continued to rebound from its collapse in 2014.
The largest detractor from the Fund’s relative performance versus the Index was its underweight position in Korea, whose equity market outperformed the broader Index amid healthy demand from the developed world for its technology exports. The Fund’s overweights in Kazakhstan and Nigeria also hurt relative Fund performance versus the Index, as both of these energy exporters experienced capital flight due to the decline in energy prices. Finally, the Fund’s underweight position in Taiwan also hampered relative Fund performance versus the Index.
See Endnotes and Additional Disclosures in this report.
Past performance is no guarantee of future results. Returns are historical and are calculated by determining the percentage change in net asset value (NAV) or offering price (as applicable) with all distributions reinvested. Investment return and principal value will fluctuate so that shares, when redeemed, may be worth more or less than their original cost. Performance less than or equal to one year is cumulative. Performance is for the stated time period only; due to market volatility, the Fund’s current performance may be lower or higher than quoted. Returns are before taxes unless otherwise noted. For performance as of the most recent month-end, please refer to eatonvance.com.
Parametric Tax-Managed Emerging Markets Fund
June 30, 2016
Performance2,3
Portfolio Managers Thomas C. Seto and Timothy W. Atwill, Ph.D., CFA, each of Parametric Portfolio Associates LLC
| | | | | | | | | | | | | | | | | | | | |
| % Average Annual Total Returns | | Class
Inception Date | | | Performance
Inception Date | | | One Year | | | Five Years | | | Ten Years | |
Institutional Class at NAV | | | 06/30/1998 | | | | 06/30/1998 | | | | –8.64 | % | | | –2.51 | % | | | 4.81 | % |
Institutional Class at NAV with redemption fee | | | — | | | | — | | | | –10.43 | | | | –2.87 | | | | 4.64 | |
MSCI Emerging Markets Index | | | — | | | | — | | | | –12.05 | % | | | –3.78 | % | | | 3.54 | % |
| | | | | |
| | | | | | | | | | | | | | | | | | | | |
| % After-Tax Returns with Redemption Fee | | Class
Inception Date | | | Performance
Inception Date | | | One Year | | | Five Years | | | Ten Years | |
Institutional Class After Taxes on Distributions | | | 06/30/1998 | | | | 06/30/1998 | | | | –10.63 | % | | | –3.06 | % | | | 4.43 | % |
Institutional Class After Taxes on Distributions and Sale of Fund Shares | | | — | | | | — | | | | –5.35 | | | | –1.91 | | | | 3.98 | |
| | | | | |
| | | | | | | | | | | | | | | | | | | | |
| % Total Annual Operating Expense Ratio4 | | | | | | | | | | | | | | Institutional
Class | |
| | | | | | | | | | | | | | | | | | | 0.95 | % |
Growth of $50,000
This graph shows the change in value of a hypothetical investment of $50,000 in Institutional Class of the Fund for the period indicated. For comparison, the same investment is shown in the indicated index.
See Endnotes and Additional Disclosures in this report.
Past performance is no guarantee of future results. Returns are historical and are calculated by determining the percentage change in net asset value (NAV) or offering price (as applicable) with all distributions reinvested. Investment return and principal value will fluctuate so that shares, when redeemed, may be worth more or less than their original cost. Performance less than or equal to one year is cumulative. Performance is for the stated time period only; due to market volatility, the Fund’s current performance may be lower or higher than quoted. Returns are before taxes unless otherwise noted. For performance as of the most recent month-end, please refer to eatonvance.com.
Parametric Tax-Managed Emerging Markets Fund
June 30, 2016
Fund Profile
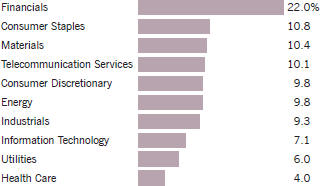
Sector Allocation (% of net assets)5
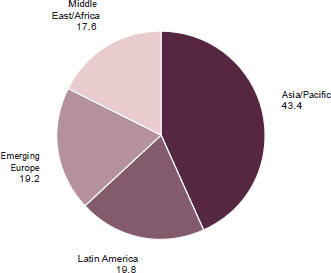
Geographic Allocation (% of common stocks)
Top 10 Holdings (% of net assets)5
| | | | |
| |
China Mobile, Ltd. | | | 0.9 | % |
| |
Sberbank of Russia PJSC | | | 0.9 | |
| |
Naspers, Ltd., Class N | | | 0.8 | |
| |
America Movil SAB de CV, Series L | | | 0.8 | |
| |
MTN Group, Ltd. | | | 0.7 | |
| |
Gazprom PJSC ADR | | | 0.7 | |
| |
Cielo SA | | | 0.7 | |
| |
Taiwan Semiconductor Manufacturing Co., Ltd. | | | 0.6 | |
| |
Telekomunikasi Indonesia Tbk PT | | | 0.6 | |
| |
Grupo Televisa SAB, Series CPO | | | 0.6 | |
| | | | | |
| |
Total | | | 7.3 | % |
| | | | | |
See Endnotes and Additional Disclosures in this report.
Parametric Tax-Managed Emerging Markets Fund
June 30, 2016
Endnotes and Additional Disclosures
| 1 | The views expressed in this report are those of the portfolio manager(s) and are current only through the date stated at the top of this page. These views are subject to change at any time based upon market or other conditions, and Eaton Vance and the Fund(s) disclaim any responsibility to update such views. These views may not be relied upon as investment advice and, because investment decisions are based on many factors, may not be relied upon as an indication of trading intent on behalf of any Eaton Vance fund. This commentary may contain statements that are not historical facts, referred to as “forward looking statements”. The Fund’s actual future results may differ significantly from those stated in any forward looking statement, depending on factors such as changes in securities or financial markets or general economic conditions, the volume of sales and purchases of Fund shares, the continuation of investment advisory, administrative and service contracts, and other risks discussed from time to time in the Fund’s filings with the Securities and Exchange Commission. |
| 2 | MSCI Frontier Markets Index is an unmanaged index that measures the performance of stock markets with less-developed economies and financial markets than emerging markets, and that typically have more restrictions on foreign stock ownership. MSCI Emerging Markets Index is an unmanaged index of emerging markets common stocks. MSCI indexes are net of foreign withholding taxes. Source: MSCI. MSCI data may not be reproduced or used for any other purpose. MSCI provides no warranties, has not prepared or approved this report, and has no liability hereunder. Unless otherwise stated, index returns do not reflect the effect of any applicable sales charges, commissions, expenses, taxes or leverage, as applicable. It is not possible to invest directly in an index. |
| 3 | Institutional Class shares are offered at net asset value (NAV). Institutional Class shares are subject to a 2% redemption fee at the time of exchange or redemption. Returns are historical and are calculated by determining the percentage change in NAV with all distributions reinvested. Unless otherwise stated, performance does not reflect the deduction of taxes on Fund distributions or redemptions of Fund shares. Performance since inception for an index, if presented, is the performance since the Fund’s or oldest share class’ inception, as applicable. After-tax returns are calculated using certain assumptions, including using the highest historical individual federal income tax rates, and do not reflect the impact of state/local taxes. Actual after-tax returns depend on a shareholder’s tax situation and the actual characterization of distributions and may differ from those shown. After-tax returns are not relevant to shareholders who hold shares in tax-deferred accounts or shares held by nontaxable entities. Return After Taxes on Distributions may be the same as Return Before Taxes for the same period because no taxable distributions were made during that period. Return After Taxes on Distributions and Sale of Fund Shares may be greater than or equal to Return After Taxes on Distributions for the same period because of losses realized on the sale of Fund shares. The Fund’s after-tax returns also may reflect foreign tax credits passed by the Fund to its shareholders. |
| 4 | Source: Fund prospectus. The expense ratios for the current reporting period can be found in the Financial Highlights section of this report. |
| 5 | Excludes cash and cash equivalents. |
| | Fund profile subject to change due to active management. |
Important Notice to Shareholders
| | Effective September 1, 2016, Parametric Tax-Managed Emerging Markets Fund is eliminating the redemption fee applicable to redemptions and exchanges of its shares. Redemptions and exchanges of Fund shares occurring on or after September 1, 2016 will not be subject to a redemption fee. Fund shares that are redeemed or exchanged prior to September 1, 2016 will continue to be subject to the redemption fee as described in the Prospectus. |
Parametric Tax-Managed Emerging Markets Fund
June 30, 2016
Fund Expenses
Example: As a Fund shareholder, you incur two types of costs: (1) transaction costs, including sales charges (loads) on purchases and redemption fees (if applicable); and (2) ongoing costs, including management fees and other Fund expenses. This Example is intended to help you understand your ongoing costs (in dollars) of Fund investing and to compare these costs with the ongoing costs of investing in other mutual funds. The Example is based on an investment of $1,000 invested at the beginning of the period and held for the entire period (January 1, 2016 – June 30, 2016).
Actual Expenses: The first section of the table below provides information about actual account values and actual expenses. You may use the information in this section, together with the amount you invested, to estimate the expenses that you paid over the period. Simply divide your account value by $1,000 (for example, an $8,600 account value divided by $1,000 = 8.6), then multiply the result by the number in the first section under the heading entitled “Expenses Paid During Period” to estimate the expenses you paid on your account during this period.
Hypothetical Example for Comparison Purposes: The second section of the table below provides information about hypothetical account values and hypothetical expenses based on the actual Fund expense ratio and an assumed rate of return of 5% per year (before expenses), which is not the actual Fund return. The hypothetical account values and expenses may not be used to estimate the actual ending account balance or expenses you paid for the period. You may use this information to compare the ongoing costs of investing in your Fund and other funds. To do so, compare this 5% hypothetical example with the 5% hypothetical examples that appear in the shareholder reports of the other funds.
Please note that the expenses shown in the table are meant to highlight your ongoing costs only and do not reflect any transactional costs, such as sales charges (loads) or redemption fees (if applicable). Therefore, the second section of the table is useful in comparing ongoing costs only, and will not help you determine the relative total costs of owning different funds. In addition, if these transactional costs were included, your costs would be higher.
| | | | | | | | | | | | | | | | |
| | | Beginning
Account Value
(1/1/16) | | | Ending
Account Value
(6/30/16) | | | Expenses Paid
During Period*
(1/1/16 – 6/30/16) | | | Annualized
Expense
Ratio | |
| | | | |
| | | | | | | | | | | | | | | | |
Actual | | | | | | | | | | | | | |
Institutional Class | | $ | 1,000.00 | | | $ | 1,088.70 | | | $ | 4.93 | | | | 0.95 | % |
| | | | | | | | | | | | | | | | | |
| | | | |
| | | | | | | | | | | | | | | | |
Hypothetical | | | | | | | | | | | | | |
(5% return per year before expenses) | | | | | | | | | | | | | |
Institutional Class | | $ | 1,000.00 | | | $ | 1,020.10 | | | $ | 4.77 | | | | 0.95 | % |
| * | Expenses are equal to the Fund’s annualized expense ratio for the indicated Class, multiplied by the average account value over the period, multiplied by 182/366 (to reflect the one-half year period). The Example assumes that the $1,000 was invested at the net asset value per share determined at the close of business on December 31, 2015. |
Parametric Tax-Managed Emerging Markets Fund
June 30, 2016
Portfolio of Investments
| | | | | | | | |
| Common Stocks — 98.6% | |
| | |
| | | | | | | | |
| Security | | Shares | | | Value | |
| | | | | | | | |
|
Argentina — 0.7% | |
Adecoagro SA(1) | | | 128,000 | | | $ | 1,404,160 | |
Arcos Dorados Holdings, Inc., Class A(1) | | | 500,800 | | | | 2,388,816 | |
Banco Macro SA, Class B | | | 130,676 | | | | 973,664 | |
Banco Macro SA, Class B ADR | | | 300 | | | | 22,266 | |
Cresud SA ADR(1) | | | 18,460 | | | | 260,840 | |
Grupo Financiero Galicia SA, Class B ADR | | | 44,000 | | | | 1,343,760 | |
IRSA Inversiones y Representaciones SA(1) | | | 119,544 | | | | 198,644 | |
Ledesma SAAI | | | 259,501 | | | | 274,248 | |
MercadoLibre, Inc. | | | 25,900 | | | | 3,643,353 | |
Molinos Rio de la Plata SA, Class B | | | 93,310 | | | | 517,872 | |
Pampa Energia SA ADR(1) | | | 120,400 | | | | 3,291,736 | |
Petrobras Argentina SA ADR | | | 86,719 | | | | 544,595 | |
Siderar SAIC | | | 2,005,200 | | | | 995,603 | |
Telecom Argentina SA ADR | | | 96,500 | | | | 1,768,845 | |
Telecom Argentina SA, Class B | | | 229,824 | | | | 857,735 | |
Transportadora de Gas del Sur SA | | | 252,923 | | | | 334,541 | |
YPF SA ADR | | | 101,600 | | | | 1,950,720 | |
| | | | | | | | | |
| | | $ | 20,771,398 | |
| | | | | | | | | |
|
Bahrain — 0.7% | |
Ahli United Bank BSC | | | 16,821,512 | | | $ | 10,604,687 | |
Al Salam Bank-Bahrain BSC | | | 21,545,754 | | | | 5,303,360 | |
GFH Financial Group BSC(1) | | | 10,441,939 | | | | 2,323,021 | |
Ithmaar Bank BSC(1) | | | 16,428,969 | | | | 1,939,250 | |
| | | | | | | | | |
| | | $ | 20,170,318 | |
| | | | | | | | | |
|
Bangladesh — 0.7% | |
Aftab Automobiles, Ltd. | | | 378,354 | | | $ | 237,006 | |
Al-Arafah Islami Bank, Ltd. | | | 688,493 | | | | 116,958 | |
Bangladesh Export Import Co., Ltd.(1) | | | 4,605,129 | | | | 1,410,506 | |
BBVA Banco Frances SA | | | 76,594 | | | | 531,754 | |
Beximco Pharmaceuticals, Ltd. | | | 522,666 | | | | 559,485 | |
British American Tobacco Bangladesh Co., Ltd. | | | 27,950 | | | | 966,377 | |
BSRM Steels, Ltd. | | | 1,250,000 | | | | 1,463,814 | |
City Bank, Ltd. (The) | | | 889,331 | | | | 277,687 | |
Grameenphone, Ltd. | | | 656,933 | | | | 2,127,377 | |
Heidelberger Cement Bangladesh, Ltd. | | | 103,700 | | | | 690,323 | |
Islami Bank Bangladesh, Ltd. | | | 1,587,087 | | | | 597,109 | |
Jamuna Oil Co., Ltd. | | | 212,850 | | | | 491,783 | |
Khulna Power Co., Ltd. | | | 614,695 | | | | 507,456 | |
Lankabangla Finance, Ltd. | | | 594,464 | | | | 214,385 | |
Malek Spinning Mills, Ltd. | | | 1,020,000 | | | | 213,677 | |
Meghna Petroleum, Ltd. | | | 210,100 | | | | 463,115 | |
National Bank, Ltd.(1) | | | 4,384,609 | | | | 453,135 | |
| | | | | | | | |
| Security | | Shares | | | Value | |
| | | | | | | | |
|
Bangladesh (continued) | |
Olympic Industries, Ltd. | | | 334,530 | | | $ | 1,479,302 | |
Padma Oil Co., Ltd. | | | 175,100 | | | | 415,392 | |
People’s Leasing and Financial Services, Ltd.(1) | | | 665,379 | | | | 73,865 | |
Pubali Bank, Ltd. | | | 1,779,933 | | | | 455,214 | |
Social Islami Bank, Ltd. | | | 2,576,175 | | | | 431,479 | |
Southeast Bank, Ltd. | | | 1,909,500 | | | | 387,345 | |
Square Pharmaceuticals, Ltd. | | | 515,155 | | | | 1,749,830 | |
Summit Power, Ltd. | | | 1,464,390 | | | | 633,448 | |
Titas Gas Transmission & Distribution Co., Ltd. | | | 1,570,295 | | | | 969,752 | |
United Airways Bangladesh, Ltd.(1) | | | 7,278,815 | | | | 603,061 | |
United Commercial Bank, Ltd. | | | 1,270,726 | | | | 272,170 | |
| | | | | | | | | |
| | | $ | 18,792,805 | |
| | | | | | | | | |
|
Botswana — 0.4% | |
Barclays Bank of Botswana, Ltd. | | | 1,308,506 | | | $ | 556,741 | |
Botswana Insurance Holdings, Ltd. | | | 801,726 | | | | 1,223,573 | |
First National Bank of Botswana, Ltd. | | | 7,511,600 | | | | 2,308,828 | |
Letshego Holdings, Ltd. | | | 16,310,999 | | | | 3,722,143 | |
Sechaba Breweries Holdings, Ltd. | | | 1,086,400 | | | | 2,867,448 | |
Sefalana Holding Co. | | | 991,000 | | | | 1,210,940 | |
Standard Chartered Bank Botswana, Ltd. | | | 850,790 | | | | 633,320 | |
| | | | | | | | | |
| | | $ | 12,522,993 | |
| | | | | | | | | |
|
Brazil — 6.6% | |
AMBEV SA | | | 1,736,625 | | | $ | 10,298,760 | |
B2W Cia Digital(1) | | | 263,000 | | | | 769,604 | |
Banco Bradesco SA ADR, PFC Shares | | | 195,814 | | | | 1,529,307 | |
Banco Bradesco SA, PFC Shares | | | 1,105,274 | | | | 8,663,823 | |
Banco do Brasil SA | | | 312,199 | | | | 1,669,700 | |
Bombril SA, PFC Shares(1) | | | 39,000 | | | | 19,183 | |
Braskem SA, PFC Shares | | | 301,200 | | | | 1,785,278 | |
BRF SA | | | 289,766 | | | | 4,070,958 | |
BRF SA ADR | | | 25,600 | | | | 356,608 | |
CCR SA | | | 887,700 | | | | 4,642,580 | |
Centrais Eletricas Brasileiras SA, PFC Shares | | | 468,682 | | | | 2,569,340 | |
CETIP SA - Mercados Organizados | | | 155,700 | | | | 2,122,499 | |
Cia Brasileira de Distribuicao ADR, PFC Shares | | | 14,300 | | | | 208,065 | |
Cia Brasileira de Distribuicao, PFC Shares | | | 43,256 | | | | 628,985 | |
Cia de Saneamento Basico do Estado de Sao Paulo | | | 125,400 | | | | 1,135,209 | |
Cia de Saneamento Basico do Estado de Sao Paulo ADR | | | 127,400 | | | | 1,141,504 | |
Cia de Transmissao de Energia Eletrica Paulista, PFC Shares | | | 65,463 | | | | 1,273,679 | |
Cia Energetica de Minas Gerais SA, PFC Shares | | | 662,453 | | | | 1,501,310 | |
Cia Energetica de Sao Paulo, Class B, PFC Shares | | | 91,500 | | | | 338,963 | |
Cia Hering | | | 155,800 | | | | 719,756 | |
| | | | |
| | 7 | | See Notes to Financial Statements. |
Parametric Tax-Managed Emerging Markets Fund
June 30, 2016
Portfolio of Investments — continued
| | | | | | | | |
| Security | | Shares | | | Value | |
| | | | | | | | |
|
Brazil (continued) | |
Cia Paranaense de Energia, PFC Shares | | | 134,100 | | | $ | 1,219,812 | |
Cia Siderurgica Nacional SA(1) | | | 147,100 | | | | 358,099 | |
Cia Siderurgica Nacional SA ADR(1) | | | 62,200 | | | | 152,390 | |
Cielo SA | | | 1,825,032 | | | | 19,237,177 | |
Contax Participacoes SA, PFC Shares | | | 1,510 | | | | 3,023 | |
Cosan SA Industria e Comercio | | | 137,900 | | | | 1,429,956 | |
CPFL Energia SA | | | 659,191 | | | | 4,225,241 | |
Cyrela Brazil Realty SA Empreendimentos e Participacoes | | | 115,024 | | | | 368,458 | |
Duratex SA | | | 335,583 | | | | 887,979 | |
EcoRodovias Infraestrutura e Logistica SA | | | 146,900 | | | | 383,221 | |
EDP-Energias do Brasil SA | | | 418,300 | | | | 1,773,572 | |
Eletropaulo Metropolitana SA, Class B, PFC Shares | | | 205,868 | | | | 541,539 | |
Embraer SA | | | 974,432 | | | | 5,308,520 | |
Embraer SA ADR | | | 26,152 | | | | 568,021 | |
Equatorial Energia SA | | | 260,300 | | | | 3,942,221 | |
Estacio Participacoes SA | | | 275,300 | | | | 1,453,503 | |
Even Construtora e Incorporadora SA | | | 652,400 | | | | 779,882 | |
Ez Tec Empreendimentos e Participacoes SA | | | 143,494 | | | | 714,723 | |
Fibria Celulose SA | | | 24,585 | | | | 164,778 | |
Fibria Celulose SA ADR | | | 54,900 | | | | 371,124 | |
Gafisa SA | | | 845,200 | | | | 539,383 | |
Gerdau SA ADR | | | 170,900 | | | | 311,038 | |
Gerdau SA, PFC Shares | | | 227,900 | | | | 417,872 | |
Gol Linhas Aereas Inteligentes SA, PFC Shares | | | 242,400 | | | | 260,337 | |
Hypermarcas SA | | | 88,100 | | | | 640,119 | |
Itau Unibanco Holding SA ADR, PFC Shares | | | 149,976 | | | | 1,415,773 | |
Itau Unibanco Holding SA, PFC Shares | | | 963,305 | | | | 9,086,369 | |
Itausa-Investimentos Itau SA, PFC Shares | | | 2,472,022 | | | | 5,840,876 | |
JBS SA | | | 444,227 | | | | 1,382,894 | |
Klabin SA | | | 255,400 | | | | 1,225,996 | |
Klabin SA, PFC Shares | | | 981,500 | | | | 705,807 | |
Kroton Educacional SA | | | 1,111,932 | | | | 4,707,616 | |
Light SA | | | 123,900 | | | | 434,689 | |
Localiza Rent a Car SA | | | 295,025 | | | | 3,168,559 | |
Lojas Americanas SA, PFC Shares | | | 965,090 | | | | 4,831,008 | |
Lojas Renner SA | | | 575,500 | | | | 4,244,185 | |
Marcopolo SA, PFC Shares(1) | | | 786,900 | | | | 587,915 | |
MRV Engenharia e Participacoes SA | | | 553,800 | | | | 1,863,642 | |
Multiplus SA | | | 91,200 | | | | 1,026,330 | |
Natura Cosmeticos SA | | | 82,900 | | | | 658,080 | |
Odontoprev SA | | | 579,500 | | | | 2,401,129 | |
Oi SA ADR(1) | | | 315,800 | | | | 115,267 | |
Oi SA, PFC Shares(1) | | | 888,684 | | | | 365,179 | |
PDG Realty SA Empreendimentos e Participacoes(1) | | | 26,432 | | | | 20,324 | |
Petroleo Brasileiro SA(1) | | | 275,200 | | | | 986,070 | |
| | | | | | | | |
| Security | | Shares | | | Value | |
| | | | | | | | |
|
Brazil (continued) | |
Petroleo Brasileiro SA ADR(1) | | | 187,400 | | | $ | 1,088,794 | |
Petroleo Brasileiro SA, PFC Shares(1) | | | 2,589,800 | | | | 7,594,532 | |
Prumo Logistica SA(1) | | | 82,880 | | | | 164,867 | |
Qualicorp SA | | | 577,500 | | | | 3,345,664 | |
Randon SA Implementos e Participacoes, PFC Shares | | | 198,512 | | | | 200,842 | |
Rumo Logistica Operadora Multimodal SA(1) | | | 6,160 | | | | 9,396 | |
Suzano Papel e Celulose SA, PFC Shares | | | 371,100 | | | | 1,308,895 | |
Telefonica Brasil SA ADR | | | 298,900 | | | | 4,065,040 | |
Telefonica Brasil SA, PFC Shares | | | 214,905 | | | | 2,943,629 | |
Tim Participacoes SA | | | 1,725,444 | | | | 3,674,015 | |
Totvs SA | | | 238,900 | | | | 2,271,272 | |
Tractebel Energia SA | | | 222,400 | | | | 2,652,350 | |
Transmissora Alianca de Energia Electrica SA | | | 166,500 | | | | 995,175 | |
Ultrapar Participacoes SA | | | 333,048 | | | | 7,372,613 | |
Usinas Siderurgicas de Minas Gerais SA, Class A, PFC Shares | | | 226,900 | | | | 139,150 | |
Vale SA ADR, PFC Shares | | | 337,600 | | | | 1,353,776 | |
Vale SA, PFC Shares | | | 1,863,092 | | | | 7,557,230 | |
Weg SA | | | 903,920 | | | | 3,866,345 | |
| | | | | | | | | |
| | | $ | 187,168,392 | |
| | | | | | | | | |
|
Bulgaria — 0.1% | |
Albena Invest Holding PLC | | | 19,550 | | | $ | 89,107 | |
Bulgartabak Holding | | | 3,450 | | | | 63,908 | |
CB First Investment Bank AD(1) | | | 54,000 | | | | 70,945 | |
Chimimport AD(1) | | | 825,588 | | | | 594,289 | |
Corporate Commercial Bank AD(1)(2) | | | 19,900 | | | | 0 | |
Industrial Holding Bulgaria PLC(1) | | | 576,865 | | | | 276,147 | |
Petrol AD(1) | | | 76,205 | | | | 14,340 | |
Sopharma AD | | | 303,500 | | | | 449,732 | |
| | | | | | | | | |
| | | $ | 1,558,468 | |
| | | | | | | | | |
|
Chile — 3.0% | |
AES Gener SA | | | 1,713,702 | | | $ | 839,303 | |
Aguas Andinas SA, Series A | | | 2,872,891 | | | | 1,649,403 | |
Almendral SA | | | 7,092,000 | | | | 433,958 | |
Antarchile SA, Series A | | | 114,800 | | | | 1,049,352 | |
Banco de Chile | | | 33,756,375 | | | | 3,609,860 | |
Banco de Chile ADR | | | 3,854 | | | | 247,196 | |
Banco de Credito e Inversiones | | | 59,355 | | | | 2,572,835 | |
Banco Santander Chile ADR | | | 118,249 | | | | 2,290,483 | |
Banmedica SA | | | 286,194 | | | | 518,879 | |
Besalco SA | | | 823,600 | | | | 290,081 | |
Cap SA | | | 186,746 | | | | 637,652 | |
Cencosud SA | | | 2,448,892 | | | | 6,978,810 | |
Cia Cervecerias Unidas SA ADR | | | 119,300 | | | | 2,784,462 | |
| | | | |
| | 8 | | See Notes to Financial Statements. |
Parametric Tax-Managed Emerging Markets Fund
June 30, 2016
Portfolio of Investments — continued
| | | | | | | | |
| Security | | Shares | | | Value | |
| | | | | | | | |
|
Chile (continued) | |
Cia Sud Americana de Vapores SA(1) | | | 10,829,733 | | | $ | 217,454 | |
Colbun SA | | | 5,553,984 | | | | 1,345,040 | |
Embotelladora Andina SA, Series A ADR | | | 25,100 | | | | 482,673 | |
Embotelladora Andina SA, Series A, PFC Shares | | | 202,478 | | | | 642,423 | |
Embotelladora Andina SA, Series B ADR | | | 49,672 | | | | 1,053,046 | |
Empresa Nacional de Electricidad SA ADR | | | 67,659 | | | | 1,876,184 | |
Empresa Nacional de Telecomunicaciones SA | | | 323,187 | | | | 2,929,741 | |
Empresas CMPC SA | | | 2,309,849 | | | | 4,784,943 | |
Empresas COPEC SA | | | 1,098,567 | | | | 9,626,725 | |
Endesa Americas SA ADR | | | 67,659 | | | | 930,988 | |
Enersis Americas SA | | | 4,683,503 | | | | 802,714 | |
Enersis Americas SA ADR | | | 140,171 | | | | 1,202,667 | |
Enersis Chile SA | | | 4,683,503 | | | | 551,937 | |
Enersis Chile SA ADR | | | 140,171 | | | | 817,197 | |
Engie Energia Chile SA | | | 253,400 | | | | 430,708 | |
Forus SA | | | 64,662 | | | | 195,390 | |
Inversiones Aguas Metropolitanas SA | | | 613,640 | | | | 977,188 | |
Itau CorpBanca | | | 145,664,426 | | | | 1,236,621 | |
Latam Airlines Group SA(1) | | | 211,093 | | | | 1,396,921 | |
Latam Airlines Group SA ADR(1) | | | 300,348 | | | | 1,982,297 | |
Masisa SA | | | 5,792,050 | | | | 194,884 | |
Parque Arauco SA | | | 818,312 | | | | 1,653,006 | |
Quinenco SA | | | 490,001 | | | | 951,314 | |
Ripley Corp. SA | | | 1,626,000 | | | | 808,240 | |
SACI Falabella | | | 1,438,742 | | | | 10,951,286 | |
Salfacorp SA | | | 1,303,900 | | | | 811,644 | |
Sigdo Koppers SA | | | 879,641 | | | | 1,129,662 | |
Sociedad Matriz SAAM SA | | | 6,677,681 | | | | 494,363 | |
Sociedad Quimica y Minera de Chile SA ADR | | | 196,100 | | | | 4,847,592 | |
Sociedad Quimica y Minera de Chile SA, Series A | | | 20,950 | | | | 560,249 | |
Sonda SA | | | 2,937,360 | | | | 5,347,715 | |
Vina Concha y Toro SA | | | 146,373 | | | | 231,101 | |
Vina Concha y Toro SA ADR | | | 26,701 | | | | 847,490 | |
| | | | | | | | | |
| | | $ | 86,213,677 | |
| | | | | | | | | |
|
China — 8.2% | |
Agile Property Holdings, Ltd. | | | 486,000 | | | $ | 259,696 | |
Agricultural Bank of China, Ltd., Class H | | | 1,705,000 | | | | 626,458 | |
Air China, Ltd., Class H | | | 1,770,000 | | | | 1,209,971 | |
Aluminum Corp. of China, Ltd., Class H(1) | | | 2,306,000 | | | | 733,564 | |
Angang Steel Co., Ltd., Class H(1) | | | 1,148,000 | | | | 513,755 | |
Anhui Conch Cement Co., Ltd., Class H | | | 1,014,000 | | | | 2,457,761 | |
ANTA Sports Products, Ltd. | | | 887,000 | | | | 1,789,737 | |
Baidu, Inc. ADR(1) | | | 29,700 | | | | 4,904,955 | |
Bank of China, Ltd., Class H | | | 5,324,000 | | | | 2,146,682 | |
Bank of Communications, Ltd., Class H | | | 2,201,300 | | | | 1,400,274 | |
| | | | | | | | |
| Security | | Shares | | | Value | |
| | | | | | | | |
|
China (continued) | |
BBMG Corp., Class H | | | 2,269,000 | | | $ | 684,355 | |
Beijing Capital International Airport Co., Ltd., Class H | | | 596,000 | | | | 648,337 | |
Beijing Enterprises Holdings, Ltd. | | | 223,500 | | | | 1,271,400 | |
Beijing Enterprises Water Group, Ltd. | | | 916,000 | | | | 555,911 | |
BOE Technology Group Co., Ltd., Class B | | | 1,686,360 | | | | 401,886 | |
BYD Co., Ltd., Class H(1) | | | 575,000 | | | | 3,468,297 | |
China Agri-Industries Holdings, Ltd.(1) | | | 2,380,000 | | | | 783,596 | |
China Bluechemical, Ltd., Class H | | | 1,348,000 | | | | 237,735 | |
China Cinda Asset Management Co., Ltd., Class H | | | 3,202,000 | | | | 1,085,777 | |
China CITIC Bank Corp., Ltd., Class H | | | 1,627,000 | | | | 993,102 | |
China Coal Energy Co., Ltd., Class H(1) | | | 2,861,000 | | | | 1,502,722 | |
China Communications Construction Co., Ltd., Class H | | | 1,677,000 | | | | 1,818,016 | |
China Communications Services Corp., Ltd., Class H | | | 2,166,000 | | | | 1,135,227 | |
China Construction Bank Corp., Class H | | | 6,290,580 | | | | 4,201,731 | |
China COSCO Holdings Co., Ltd., Class H(1) | | | 2,729,150 | | | | 968,902 | |
China Dongxiang Group Co., Ltd. | | | 3,981,000 | | | | 705,886 | |
China Eastern Airlines Corp., Ltd., Class H(1) | | | 1,436,000 | | | | 721,868 | |
China Everbright International, Ltd. | | | 1,156,000 | | | | 1,292,578 | |
China Everbright, Ltd. | | | 456,000 | | | | 884,786 | |
China Gas Holdings, Ltd. | | | 546,000 | | | | 835,747 | |
China High Speed Transmission Equipment Group Co., Ltd. | | | 672,000 | | | | 541,402 | |
China International Marine Containers Co., Ltd., Class B | | | 413,812 | | | | 511,311 | |
China Life Insurance Co., Ltd., Class H | | | 654,000 | | | | 1,410,103 | |
China Longyuan Power Group Corp., Ltd., Class H | | | 2,413,000 | | | | 2,004,962 | |
China Mengniu Dairy Co., Ltd. | | | 1,600,000 | | | | 2,799,058 | |
China Merchants Bank Co., Ltd., Class H | | | 332,500 | | | | 748,429 | |
China Merchants Holdings (International) Co., Ltd. | | | 790,000 | | | | 2,114,829 | |
China Merchants Shekou Industrial Zone Holdings Co., Ltd. | | | 935,251 | | | | 2,019,836 | |
China Minsheng Banking Corp., Ltd., Class H | | | 864,100 | | | | 839,422 | |
China Mobile, Ltd. | | | 2,309,900 | | | | 26,719,175 | |
China National Building Material Co., Ltd., Class H | | | 2,156,000 | | | | 948,192 | |
China Oilfield Services, Ltd., Class H | | | 756,000 | | | | 587,369 | |
China Overseas Land & Investment, Ltd. | | | 376,360 | | | | 1,199,780 | |
China Pacific Insurance (Group) Co., Ltd., Class H | | | 282,800 | | | | 958,451 | |
China Petroleum & Chemical Corp., Class H | | | 12,211,800 | | | | 8,808,717 | |
China Railway Construction Corp., Ltd., Class H | | | 947,500 | | | | 1,196,122 | |
China Railway Group, Ltd., Class H | | | 2,265,000 | | | | 1,702,345 | |
China Resources Beer Holdings Co., Ltd. | | | 688,000 | | | | 1,500,231 | |
China Resources Land, Ltd. | | | 291,111 | | | | 685,988 | |
China Resources Power Holdings Co., Ltd. | | | 1,443,000 | | | | 2,165,582 | |
China Shenhua Energy Co., Ltd., Class H | | | 1,654,500 | | | | 3,077,205 | |
China Shipping Container Lines Co., Ltd., Class H(1) | | | 3,803,000 | | | | 794,002 | |
China Shipping Development Co., Ltd., Class H | | | 1,778,000 | | | | 1,010,496 | |
| | | | |
| | 9 | | See Notes to Financial Statements. |
Parametric Tax-Managed Emerging Markets Fund
June 30, 2016
Portfolio of Investments — continued
| | | | | | | | |
| Security | | Shares | | | Value | |
| | | | | | | | |
|
China (continued) | |
China Southern Airlines Co., Ltd., Class H | | | 2,064,500 | | | $ | 1,170,669 | |
China Taiping Insurance Holdings Co., Ltd.(1) | | | 277,000 | | | | 521,276 | |
China Telecom Corp., Ltd., Class H | | | 7,572,000 | | | | 3,405,254 | |
China Travel International Investment Hong Kong, Ltd. | | | 1,660,000 | | | | 482,950 | |
China Unicom (Hong Kong), Ltd. | | | 2,590,290 | | | | 2,707,736 | |
China Vanke Co., Ltd., Class H | | | 102,117 | | | | 201,662 | |
China Yurun Food Group, Ltd.(1) | | | 926,000 | | | | 139,298 | |
Chongqing Changan Automobile Co., Ltd., Class B | | | 1,301,443 | | | | 1,823,039 | |
CITIC, Ltd. | | | 628,000 | | | | 919,653 | |
CNOOC, Ltd. | | | 7,777,500 | | | | 9,718,116 | |
Cosco Pacific, Ltd. | | | 1,128,000 | | | | 1,124,759 | |
Country Garden Holdings Co., Ltd. | | | 1,582,000 | | | | 669,043 | |
CSPC Pharmaceutical Group, Ltd. | | | 2,036,000 | | | | 1,811,181 | |
Ctrip.com International, Ltd. ADR(1) | | | 128,600 | | | | 5,298,320 | |
Datang International Power Generation Co., Ltd., Class H | | | 3,276,000 | | | | 926,290 | |
Dazhong Transportation Group Co., Ltd., Class B | | | 950,812 | | | | 756,373 | |
Dongfeng Motor Group Co., Ltd., Class H | | | 1,748,000 | | | | 1,842,482 | |
Golden Eagle Retail Group, Ltd. | | | 516,000 | | | | 575,442 | |
Great Wall Motor Co., Ltd., Class H | | | 2,510,250 | | | | 2,092,204 | |
Guangdong Investment, Ltd. | | | 2,088,000 | | | | 3,203,735 | |
Guangzhou Automobile Group Co., Ltd., Class H | | | 1,750,857 | | | | 2,094,212 | |
Guangzhou R&F Properties Co., Ltd., Class H | | | 670,400 | | | | 849,869 | |
Hangzhou Steam Turbine Co., Ltd., Class B | | | 426,359 | | | | 442,771 | |
Hengan International Group Co., Ltd. | | | 248,000 | | | | 2,075,576 | |
Huaneng Power International, Inc., Class H | | | 3,084,000 | | | | 1,919,542 | |
Industrial & Commercial Bank of China, Ltd., Class H | | | 4,715,000 | | | | 2,629,406 | |
Inner Mongolia Eerduosi Resources Co., Ltd., Class B | | | 392,000 | | | | 341,782 | |
Inner Mongolia Yitai Coal Co., Ltd., Class B | | | 424,000 | | | | 319,972 | |
Jiangsu Expressway Co., Ltd., Class H | | | 796,000 | | | | 1,111,602 | |
Jiangxi Copper Co., Ltd., Class H | | | 1,055,000 | | | | 1,183,967 | |
Kingboard Chemical Holdings, Ltd. | | | 421,200 | | | | 839,678 | |
Kunlun Energy Co., Ltd. | | | 1,678,000 | | | | 1,398,588 | |
Lee & Man Paper Manufacturing, Ltd. | | | 876,000 | | | | 654,438 | |
Lenovo Group, Ltd. | | | 2,596,000 | | | | 1,577,936 | |
Li Ning Co., Ltd.(1) | | | 1,892,312 | | | | 926,153 | |
Lonking Holdings, Ltd. | | | 2,438,000 | | | | 358,114 | |
Maanshan Iron & Steel Co., Ltd., Class H(1) | | | 1,389,000 | | | | 300,248 | |
NetEase, Inc. ADR | | | 11,000 | | | | 2,125,420 | |
New Oriental Education & Technology Group, Inc. ADR | | | 135,000 | | | | 5,653,800 | |
Nine Dragons Paper Holdings, Ltd. | | | 1,412,000 | | | | 1,086,242 | |
Parkson Retail Group, Ltd. | | | 1,024,000 | | | | 90,358 | |
PetroChina Co., Ltd., Class H | | | 10,100,300 | | | | 6,961,513 | |
PICC Property & Casualty Co., Ltd., Class H | | | 342,000 | | | | 540,102 | |
Ping An Insurance (Group) Co. of China, Ltd., Class H | | | 297,500 | | | | 1,318,126 | |
Poly Property Group Co., Ltd.(1) | | | 970,000 | | | | 249,930 | |
| | | | | | | | |
| Security | | Shares | | | Value | |
| | | | | | | | |
|
China (continued) | |
Qingling Motors Co., Ltd., Class H | | | 1,448,966 | | | $ | 448,485 | |
Qinqin Foodstuffs Group Cayman Co., Ltd.(1) | | | 49,600 | | | | 70,601 | |
Semiconductor Manufacturing International Corp.(1) | | | 12,412,000 | | | | 999,774 | |
Shandong Weigao Group Medical Polymer Co., Ltd., Class H | | | 1,712,000 | | | | 976,560 | |
Shanghai Diesel Engine Co., Ltd., Class B | | | 854,400 | | | | 743,037 | |
Shanghai Electric Group Co., Ltd., Class H(1) | | | 1,644,000 | | | | 693,435 | |
Shanghai Haixin Group Co., Ltd., Class B | | | 545,000 | | | | 427,471 | |
Shanghai Industrial Holdings, Ltd. | | | 291,000 | | | | 662,317 | |
Shanghai Jin Jiang International Hotels Development Co., Ltd., Class B | | | 574,800 | | | | 1,472,390 | |
Shanghai Zhenhua Heavy Industry Co., Ltd., Class B(1) | | | 863,200 | | | | 413,128 | |
Shimao Property Holdings, Ltd. | | | 532,000 | | | | 677,081 | |
Sihuan Pharmaceutical Holdings Group, Ltd. | | | 5,255,000 | | | | 1,003,778 | |
SINA Corp.(1) | | | 25,700 | | | | 1,333,059 | |
Sino Biopharmaceutical, Ltd. | | | 3,540,000 | | | | 2,323,386 | |
Sino-Ocean Group Holding, Ltd. | | | 1,370,500 | | | | 598,434 | |
Sinopec Oilfield Service Corp., Class H(1) | | | 4,801,500 | | | | 923,785 | |
Sinopec Shanghai Petrochemical Co., Ltd., Class H | | | 3,136,000 | | | | 1,451,073 | |
Sinopharm Group Co., Ltd., Class H | | | 975,600 | | | | 4,686,476 | |
Sohu.com, Inc.(1) | | | 8,700 | | | | 329,382 | |
Tencent Holdings, Ltd. | | | 727,800 | | | | 16,714,452 | |
Tingyi (Cayman Islands) Holding Corp. | | | 1,184,000 | | | | 1,127,360 | |
Travelsky Technology, Ltd., Class H | | | 1,218,000 | | | | 2,345,180 | |
Tsingtao Brewery Co., Ltd., Class H | | | 874,000 | | | | 3,038,592 | |
Want Want China Holdings, Ltd. | | | 3,531,000 | | | | 2,490,578 | |
Weichai Power Co., Ltd., Class H | | | 453,600 | | | | 467,039 | |
Yangzijiang Shipbuilding Holdings, Ltd. | | | 1,652,000 | | | | 1,108,007 | |
Yantai Changyu Pioneer Wine Co., Ltd., Class B | | | 135,132 | | | | 409,365 | |
Yanzhou Coal Mining Co., Ltd., Class H | | | 1,488,000 | | | | 967,533 | |
Zhejiang Expressway Co., Ltd., Class H | | | 870,000 | | | | 820,787 | |
Zhuzhou CRRC Times Electric Co., Ltd. | | | 288,000 | | | | 1,595,853 | |
Zijin Mining Group Co., Ltd., Class H | | | 3,148,000 | | | | 1,057,443 | |
ZTE Corp., Class H | | | 708,739 | | | | 903,326 | |
| | | | | | | | | |
| | | $ | 234,301,713 | |
| | | | | | | | | |
|
Colombia — 1.6% | |
Almacenes Exito SA | | | 569,955 | | | $ | 2,770,869 | |
Avianca Holdings SA, PFC Shares | | | 614,449 | | | | 471,217 | |
Banco Davivienda SA, PFC Shares | | | 190,600 | | | | 1,754,039 | |
Banco de Bogota SA | | | 69,328 | | | | 1,388,518 | |
Bancolombia SA | | | 86,292 | | | | 703,128 | |
Bancolombia SA ADR, PFC Shares | | | 127,200 | | | | 4,441,824 | |
Bolsa de Valores de Colombia | | | 85,691,900 | | | | 528,079 | |
Celsia SA ESP | | | 833,260 | | | | 1,098,318 | |
Cementos Argos SA | | | 509,458 | | | | 2,079,082 | |
| | | | |
| | 10 | | See Notes to Financial Statements. |
Parametric Tax-Managed Emerging Markets Fund
June 30, 2016
Portfolio of Investments — continued
| | | | | | | | |
| Security | | Shares | | | Value | |
| | | | | | | | |
|
Colombia (continued) | |
Cementos Argos SA, PFC Shares | | | 190,626 | | | $ | 717,897 | |
Cemex Latam Holdings SA(1) | | | 266,452 | | | | 1,149,414 | |
Corporacion Financiera Colombiana SA | | | 158,082 | | | | 2,065,275 | |
Ecopetrol SA(1) | | | 4,549,600 | | | | 2,172,874 | |
Ecopetrol SA ADR | | | 425,800 | | | | 4,070,648 | |
Empresa de Energia de Bogota SA | | | 2,602,208 | | | | 1,590,257 | |
Empresa de Telecommunicaciones de Bogota SA | | | 2,267,738 | | | | 455,741 | |
Fabricato SA(1) | | | 34,115,900 | | | | 176,368 | |
Grupo Argos SA | | | 466,160 | | | | 2,952,526 | |
Grupo Argos SA, PFC Shares | | | 147,122 | | | | 897,578 | |
Grupo Aval Acciones y Valores SA | | | 1,723,100 | | | | 684,314 | |
Grupo Aval Acciones y Valores SA, PFC Shares | | | 3,247,601 | | | | 1,311,994 | |
Grupo de Inversiones Suramericana SA | | | 365,800 | | | | 4,796,556 | |
Grupo Nutresa SA | | | 414,015 | | | | 3,557,761 | |
Grupo Odinsa SA(1) | | | 53,817 | | | | 160,205 | |
Interconexion Electrica SA | | | 945,400 | | | | 2,893,611 | |
Organizacion Terpel SA | | | 13,768 | | | | 47,137 | |
| | | | | | | | | |
| | | $ | 44,935,230 | |
| | | | | | | | | |
|
Croatia — 0.8% | |
AD Plastik DD | | | 51,587 | | | $ | 851,003 | |
Adris Grupa DD, PFC Shares | | | 45,976 | | | | 2,562,209 | |
Atlantic Grupa DD | | | 16,581 | | | | 1,985,245 | |
Atlantska Plovidba DD(1) | | | 15,437 | | | | 306,485 | |
Ericsson Nikola Tesla DD | | | 5,610 | | | | 834,360 | |
Hrvatski Telekom DD | | | 326,234 | | | | 6,800,952 | |
Koncar-Elektroindustrija DD | | | 7,227 | | | | 701,729 | |
Kras DD | | | 3,067 | | | | 215,070 | |
Ledo DD | | | 1,049 | | | | 1,516,049 | |
Petrokemija DD(1) | | | 17,450 | | | | 31,893 | |
Podravka Prehrambena Industrija DD(1) | | | 53,292 | | | | 2,577,757 | |
Privredna Banka Zagreb DD | | | 3,310 | | | | 292,429 | |
Valamar Riviera DD | | | 685,752 | | | | 2,514,396 | |
Zagrebacka Banka DD(1) | | | 30,550 | | | | 176,537 | |
| | | | | | | | | |
| | | $ | 21,366,114 | |
| | | | | | | | | |
|
Czech Republic — 1.2% | |
CEZ AS | | | 716,870 | | | $ | 12,229,822 | |
Komercni Banka AS | | | 365,455 | | | | 13,702,391 | |
New World Resources PLC, Class A(1)(2) | | | 860,500 | | | | 1,235 | |
Pegas Nonwovens SA | | | 48,000 | | | | 1,572,228 | |
Philip Morris CR AS | | | 6,490 | | | | 3,280,763 | |
Unipetrol AS | | | 417,401 | | | | 3,001,560 | |
| | | | | | | | | |
| | | $ | 33,787,999 | |
| | | | | | | | | |
| | | | | | | | |
| Security | | Shares | | | Value | |
| | | | | | | | |
|
Egypt — 1.3% | |
Alexandria Mineral Oils Co. | | | 121,900 | | | $ | 412,351 | |
Arab Cotton Ginning(1) | | | 1,880,400 | | | | 522,648 | |
Citadel Capital SAE(1) | | | 1,600,000 | | | | 177,669 | |
Commercial International Bank Egypt SAE | | | 2,285,293 | | | | 10,202,953 | |
Eastern Tobacco | | | 97,097 | | | | 1,967,363 | |
Egypt Kuwait Holding Co. SAE | | | 1,277,058 | | | | 525,714 | |
Egyptian Financial & Industrial Co.(1) | | | 137,064 | | | | 103,259 | |
Egyptian Financial Group-Hermes Holding
Co.(1) | | | 1,822,174 | | | | 2,170,926 | |
Egyptian International Pharmaceuticals EIPICO | | | 153,932 | | | | 1,345,820 | |
Egyptian Resorts Co.(1) | | | 4,213,900 | | | | 329,765 | |
El Ezz Aldekhela Steel Alexandria(1) | | | 4,750 | | | | 113,250 | |
ElSewedy Electric Co. | | | 384,121 | | | | 1,871,326 | |
Ezz Steel(1) | | | 1,677,500 | | | | 1,348,701 | |
Ghabbour Auto(1) | | | 345,862 | | | | 86,389 | |
Global Telecom Holding SAE(1) | | | 9,908,210 | | | | 3,525,555 | |
Juhayna Food Industries | | | 2,665,536 | | | | 2,029,862 | |
Maridive & Oil Services SAE(1) | | | 787,652 | | | | 229,900 | |
Medinet Nasr for Housing and Development SAE(1) | | | 922,844 | | | | 1,245,040 | |
Misr Cement (Qena) | | | 18,251 | | | | 184,024 | |
Nile Cotton Ginning Co.(1)(2) | | | 125,000 | | | | 0 | |
Orascom Telecom Media and Technology Holding SAE(1) | | | 13,585,310 | | | | 842,176 | |
Oriental Weavers Co. | | | 1,278,405 | | | | 759,404 | |
Pioneers Holding(1) | | | 734,900 | | | | 800,374 | |
Sidi Kerir Petrochemicals Co. | | | 957,400 | | | | 1,246,639 | |
Six of October Development & Investment
Co.(1) | | | 275,153 | | | | 311,188 | |
South Valley Cement(1) | | | 485,000 | | | | 260,920 | |
Suez Cement Co.(1) | | | 138,000 | | | | 192,938 | |
Talaat Moustafa Group | | | 3,963,160 | | | | 2,182,007 | |
Telecom Egypt | | | 1,449,600 | | | | 1,328,883 | |
| | | | | | | | | |
| | | $ | 36,317,044 | |
| | | | | | | | | |
|
Estonia — 0.4% | |
AS Baltika(1) | | | 226,000 | | | $ | 63,736 | |
AS Merko Ehitus | | | 75,000 | | | | 662,526 | |
AS Tallink Grupp | | | 5,354,470 | | | | 5,431,801 | |
AS Tallinna Kaubamaja Grupp | | | 202,800 | | | | 1,529,600 | |
AS Tallinna Vesi | | | 35,235 | | | | 536,028 | |
Nordecon AS | | | 223,282 | | | | 272,587 | |
Olympic Entertainment Group AS(1) | | | 803,899 | | | | 1,732,155 | |
| | | | | | | | | |
| | | $ | 10,228,433 | |
| | | | | | | | | |
|
Ghana — 0.1% | |
Aluworks Ghana, Ltd.(1) | | | 5,176,100 | | | $ | 122,333 | |
CAL Bank, Ltd. | | | 4,406,554 | | | | 891,742 | |
Ghana Commercial Bank, Ltd. | | | 1,384,370 | | | | 1,075,292 | |
| | | | |
| | 11 | | See Notes to Financial Statements. |
Parametric Tax-Managed Emerging Markets Fund
June 30, 2016
Portfolio of Investments — continued
| | | | | | | | |
| Security | | Shares | | | Value | |
| | | | | | | | |
|
Ghana (continued) | |
Produce Buying Co., Ltd.(1) | | | 650,000 | | | $ | 10,493 | |
Societe Generale Ghana, Ltd. | | | 814,000 | | | | 158,566 | |
Standard Chartered Bank of Ghana, Ltd. | | | 242,700 | | | | 873,794 | |
Total Petroleum Ghana, Ltd. | | | 20,964 | | | | 21,189 | |
Unilever Ghana, Ltd. | | | 249,000 | | | | 533,845 | |
| | | | | | | | | |
| | | $ | 3,687,254 | |
| | | | | | | | | |
|
Greece — 1.2% | |
Aegean Airlines SA | | | 64,124 | | | $ | 443,230 | |
Aegean Marine Petroleum Network, Inc. | | | 90,611 | | | | 498,360 | |
Alpha Bank AE(1) | | | 108,673 | | | | 203,627 | |
Athens Water Supply & Sewage Co. SA (The) | | | 227,849 | | | | 1,416,178 | |
Costamare, Inc. | | | 108,479 | | | | 832,034 | |
Diana Shipping, Inc.(1) | | | 190,420 | | | | 462,721 | |
DryShips, Inc.(1) | | | 57,520 | | | | 32,384 | |
Ellaktor SA(1) | | | 292,801 | | | | 434,117 | |
Eurobank Ergasias SA(1) | | | 119,755 | | | | 75,807 | |
FF Group | | | 63,075 | | | | 1,180,549 | |
GasLog, Ltd. | | | 111,416 | | | | 1,446,180 | |
GEK Terna Holding Real Estate Construction
SA(1) | | | 120,661 | | | | 238,106 | |
Hellenic Exchanges - Athens Stock Exchange SA | | | 114,224 | | | | 547,756 | |
Hellenic Petroleum SA(1) | | | 132,875 | | | | 564,850 | |
Hellenic Telecommunications Organization SA | | | 777,120 | | | | 7,100,292 | |
Intralot SA(1) | | | 260,400 | | | | 259,722 | |
JUMBO SA(1) | | | 198,150 | | | | 2,606,809 | |
Marfin Investment Group Holdings SA(1) | | | 485,263 | | | | 65,999 | |
Metka SA | | | 43,400 | | | | 344,533 | |
Motor Oil (Hellas) Corinth Refineries SA | | | 170,500 | | | | 1,865,478 | |
Mytilineos Holdings SA | | | 452,870 | | | | 1,925,860 | |
National Bank of Greece SA(1) | | | 126,296 | | | | 28,019 | |
Navios Maritime Acquisition Corp. | | | 191,284 | | | | 300,316 | |
Navios Maritime Holdings, Inc. | | | 87,850 | | | | 71,158 | |
OPAP SA | | | 402,600 | | | | 2,805,927 | |
Public Power Corp. SA | | | 914,808 | | | | 2,518,673 | |
StealthGas, Inc.(1) | | | 81,587 | | | | 308,399 | |
Terna Energy SA | | | 126,318 | | | | 340,279 | |
Titan Cement Co. SA | | | 220,407 | | | | 4,547,391 | |
Tsakos Energy Navigation, Ltd. | | | 201,900 | | | | 946,911 | |
Viohalco SA(1) | | | 184,517 | | | | 243,279 | |
| | | | | | | | | |
| | | $ | 34,654,944 | |
| | | | | | | | | |
|
Hungary — 1.1% | |
Magyar Telekom Telecommunications PLC | | | 3,522,211 | | | $ | 5,524,237 | |
Magyar Telekom Telecommunications PLC ADR | | | 26,400 | | | | 202,884 | |
MOL Hungarian Oil & Gas Rt. | | | 159,342 | | | | 9,224,459 | |
| | | | | | | | |
| Security | | Shares | | | Value | |
| | | | | | | | |
|
Hungary (continued) | |
OTP Bank PLC | | | 324,291 | | | $ | 7,256,779 | |
Richter Gedeon Nyrt. | | | 429,647 | | | | 8,545,721 | |
| | | | | | | | | |
| | | $ | 30,754,080 | |
| | | | | | | | | |
|
India — 5.8% | |
ABB India, Ltd. | | | 33,400 | | | $ | 604,491 | |
ACC, Ltd. | | | 54,200 | | | | 1,306,778 | |
Adani Enterprises, Ltd. | | | 119,200 | | | | 154,472 | |
Adani Ports and Special Economic Zone, Ltd. | | | 719,546 | | | | 2,216,232 | |
Adani Power, Ltd.(1) | | | 518,864 | | | | 238,060 | |
Aditya Birla Fashion and Retail, Ltd.(1) | | | 137,831 | | | | 292,810 | |
Aditya Birla Nuvo, Ltd. | | | 26,506 | | | | 483,282 | |
Ambuja Cements, Ltd. | | | 566,900 | | | | 2,156,072 | |
Apollo Hospitals Enterprise, Ltd. | | | 61,400 | | | | 1,199,262 | |
Ashok Leyland, Ltd. | | | 820,626 | | | | 1,203,057 | |
Asian Paints, Ltd. | | | 243,000 | | | | 3,596,804 | |
Axis Bank, Ltd. | | | 157,800 | | | | 1,253,909 | |
Bajaj Auto, Ltd. | | | 42,600 | | | | 1,707,556 | |
Bajaj Holdings & Investment, Ltd. | | | 11,100 | | | | 273,379 | |
Balrampur Chini Mills, Ltd.(1) | | | 262,700 | | | | 490,589 | |
Bharat Forge, Ltd. | | | 43,136 | | | | 487,446 | |
Bharat Heavy Electricals, Ltd. | | | 370,300 | | | | 705,825 | |
Bharat Petroleum Corp., Ltd. | | | 61,200 | | | | 978,161 | |
Bharti Airtel, Ltd. | | | 1,940,801 | | | | 10,494,325 | |
Biocon, Ltd. | | | 78,400 | | | | 864,935 | |
Bosch, Ltd. | | | 3,900 | | | | 1,308,155 | |
Cairn India, Ltd. | | | 157,100 | | | | 329,219 | |
Century Textiles & Industries, Ltd. | | | 50,000 | | | | 491,629 | |
Cipla, Ltd. | | | 207,400 | | | | 1,543,043 | |
Coal India, Ltd. | | | 372,500 | | | | 1,732,251 | |
Colgate-Palmolive (India), Ltd. | | | 46,200 | | | | 629,446 | |
Container Corp. of India, Ltd. | | | 69,900 | | | | 1,482,039 | |
Cummins India, Ltd. | | | 79,700 | | | | 997,966 | |
Dabur India, Ltd. | | | 278,000 | | | | 1,271,545 | |
Divi’s Laboratories, Ltd. | | | 49,800 | | | | 828,990 | |
Dr. Reddy’s Laboratories, Ltd. | | | 24,300 | | | | 1,226,820 | |
Dr. Reddy’s Laboratories, Ltd. ADR | | | 12,700 | | | | 650,621 | |
GAIL (India), Ltd. | | | 418,540 | | | | 2,393,664 | |
GAIL (India), Ltd. GDR(3) | | | 25,050 | | | | 807,834 | |
GlaxoSmithKline Pharmaceuticals, Ltd. | | | 8,000 | | | | 411,632 | |
Glenmark Pharmaceuticals, Ltd. | | | 114,000 | | | | 1,356,022 | |
Grasim Industries, Ltd. GDR(3) | | | 13,300 | | | | 918,140 | |
Great Eastern Shipping Co., Ltd. (The) | | | 56,700 | | | | 264,175 | |
HCL Technologies, Ltd. | | | 193,371 | | | | 2,096,803 | |
HDFC Bank, Ltd. | | | 198,400 | | | | 4,019,023 | |
Hero MotoCorp, Ltd. | | | 51,542 | | | | 2,417,199 | |
| | | | |
| | 12 | | See Notes to Financial Statements. |
Parametric Tax-Managed Emerging Markets Fund
June 30, 2016
Portfolio of Investments — continued
| | | | | | | | |
| Security | | Shares | | | Value | |
| | | | | | | | |
|
India (continued) | |
Hindalco Industries, Ltd. | | | 436,910 | | | $ | 803,209 | |
Hindustan Petroleum Corp., Ltd. | | | 67,300 | | | | 995,156 | |
Hindustan Unilever, Ltd. | | | 546,109 | | | | 7,279,023 | |
Hindustan Zinc, Ltd. | | | 244,148 | | | | 656,530 | |
Housing Development Finance Corp., Ltd. | | | 257,575 | | | | 4,794,935 | |
ICICI Bank, Ltd. | | | 532,035 | | | | 1,903,031 | |
Idea Cellular, Ltd. | | | 1,449,679 | | | | 2,295,053 | |
Indian Hotels Co., Ltd.(1) | | | 173,820 | | | | 331,668 | |
Indian Oil Corp., Ltd. | | | 221,900 | | | | 1,455,811 | |
Infosys, Ltd. | | | 422,490 | | | | 7,338,933 | |
ITC, Ltd. | | | 1,025,100 | | | | 5,621,450 | |
Jindal Steel & Power, Ltd.(1) | | | 90,000 | | | | 91,413 | |
JSW Energy, Ltd. | | | 1,158,270 | | | | 1,437,675 | |
JSW Steel, Ltd. | | | 60,200 | | | | 1,314,636 | |
Kotak Mahindra Bank, Ltd. | | | 204,617 | | | | 2,315,101 | |
Larsen & Toubro, Ltd. | | | 112,578 | | | | 2,509,809 | |
Larsen & Toubro, Ltd. GDR(3) | | | 72,000 | | | | 1,604,391 | |
LIC Housing Finance, Ltd. | | | 62,800 | | | | 462,451 | |
Lupin, Ltd. | | | 97,200 | | | | 2,231,044 | |
Mahindra & Mahindra, Ltd. | | | 140,600 | | | | 2,982,518 | |
Maruti Suzuki India, Ltd. | | | 43,700 | | | | 2,724,771 | |
Mphasis, Ltd. | | | 37,500 | | | | 319,010 | |
Nestle India, Ltd. | | | 12,100 | | | | 1,174,470 | |
NHPC, Ltd. | | | 1,887,800 | | | | 703,843 | |
NTPC, Ltd. | | | 2,100,300 | | | | 4,854,233 | |
Oil & Natural Gas Corp., Ltd. | | | 625,242 | | | | 2,012,688 | |
Oracle Financial Services Software, Ltd. | | | 4,000 | | | | 205,677 | |
Petronet LNG, Ltd. | | | 216,300 | | | | 949,044 | |
Piramal Enterprises, Ltd. | | | 41,782 | | | | 892,591 | |
Power Grid Corporation of India, Ltd. | | | 1,419,700 | | | | 3,435,283 | |
Reliance Communications, Ltd.(1) | | | 1,408,559 | | | | 1,069,790 | |
Reliance Industries, Ltd. | | | 516,780 | | | | 7,442,925 | |
Reliance Infrastructure, Ltd. | | | 171,400 | | | | 1,391,786 | |
Reliance Power, Ltd. | | | 546,400 | | | | 416,243 | |
Siemens, Ltd. | | | 72,300 | | | | 1,411,264 | |
State Bank of India GDR(3) | | | 49,600 | | | | 1,573,035 | |
Steel Authority of India, Ltd. | | | 60,000 | | | | 40,479 | |
Sun Pharmaceutical Industries, Ltd. | | | 378,100 | | | | 4,294,907 | |
Tata Chemicals, Ltd. | | | 58,600 | | | | 375,854 | |
Tata Communications, Ltd. | | | 47,000 | | | | 336,272 | |
Tata Consultancy Services, Ltd. | | | 100,507 | | | | 3,801,590 | |
Tata Global Beverages, Ltd. | | | 156,000 | | | | 304,514 | |
Tata Motors, Ltd.(1) | | | 305,826 | | | | 2,090,199 | |
Tata Power Co., Ltd. | | | 1,002,648 | | | | 1,094,755 | |
Tata Steel, Ltd. | | | 149,900 | | | | 721,287 | |
Tech Mahindra, Ltd. | | | 143,648 | | | | 1,085,768 | |
| | | | | | | | |
| Security | | Shares | | | Value | |
| | | | | | | | |
|
India (continued) | |
Titan Co., Ltd. | | | 248,000 | | | $ | 1,499,981 | |
UltraTech Cement, Ltd. | | | 58,091 | | | | 2,944,011 | |
United Spirits, Ltd.(1) | | | 21,533 | | | | 794,440 | |
UPL, Ltd. | | | 237,900 | | | | 1,950,813 | |
Vedanta, Ltd. | | | 499,740 | | | | 987,136 | |
Voltas, Ltd. | | | 224,100 | | | | 1,075,759 | |
Wipro, Ltd. | | | 199,798 | | | | 1,661,809 | |
Zee Entertainment Enterprises, Ltd. | | | 316,895 | | | | 2,147,952 | |
| | | | | | | | | |
| | | $ | 164,091,677 | |
| | | | | | | | | |
|
Indonesia — 3.3% | |
Adaro Energy Tbk PT | | | 28,006,600 | | | $ | 1,820,104 | |
AKR Corporindo Tbk PT | | | 4,660,500 | | | | 2,263,054 | |
Aneka Tambang Persero Tbk PT(1) | | | 8,587,500 | | | | 473,803 | |
Astra Argo Lestari Tbk PT(1) | | | 654,000 | | | | 733,691 | |
Astra International Tbk PT | | | 16,668,000 | | | | 9,396,777 | |
Bank Central Asia Tbk PT | | | 7,245,500 | | | | 7,336,488 | |
Bank Danamon Indonesia Tbk PT | | | 3,237,181 | | | | 869,803 | |
Bank Mandiri Tbk PT | | | 3,497,000 | | | | 2,530,621 | |
Bank Negara Indonesia Persero Tbk PT | | | 7,849,000 | | | | 3,110,472 | |
Bank Pan Indonesia Tbk PT(1) | | | 6,253,772 | | | | 366,251 | |
Bank Rakyat Indonesia Tbk PT | | | 3,508,300 | | | | 2,886,742 | |
Charoen Pokphand Indonesia Tbk PT | | | 4,000,700 | | | | 1,145,243 | |
Gudang Garam Tbk PT | | | 498,500 | | | | 2,608,243 | |
Hanson International Tbk PT(1) | | | 17,636,400 | | | | 1,048,705 | |
Indah Kiat Pulp & Paper Corp. Tbk PT | | | 3,326,500 | | | | 231,960 | |
Indo Tambangraya Megah Tbk PT | | | 1,269,200 | | | | 907,438 | |
Indocement Tunggal Prakarsa Tbk PT | | | 2,045,500 | | | | 2,630,588 | |
Indofood CBP Sukses Makmur Tbk PT | | | 1,273,000 | | | | 1,673,498 | |
Indofood Sukses Makmur Tbk PT | | | 4,544,500 | | | | 2,500,469 | |
Indosat Tbk PT(1) | | | 1,322,500 | | | | 639,734 | |
Jasa Marga (Persero) Tbk PT | | | 3,247,500 | | | | 1,302,836 | |
Kalbe Farma Tbk PT | | | 45,305,200 | | | | 5,272,312 | |
Lippo Karawaci Tbk PT | | | 26,506,000 | | | | 2,302,686 | |
Matahari Putra Prima Tbk PT | | | 5,148,000 | | | | 607,102 | |
Medco Energi Internasional Tbk PT(1) | | | 698,500 | | | | 79,740 | |
Pembangunan Perumahan Persero Tbk PT | | | 4,793,000 | | | | 1,420,693 | |
Perusahaan Gas Negara Persero Tbk PT | | | 19,152,100 | | | | 3,414,954 | |
Perusahaan Perkebunan London Sumatra Indonesia Tbk PT | | | 7,099,000 | | | | 746,143 | |
Semen Indonesia Persero Tbk PT | | | 4,703,500 | | | | 3,350,206 | |
Sigmagold Inti Perkasa Tbk PT(1) | | | 27,503,000 | | | | 841,146 | |
Surya Semesta Internusa Tbk PT | | | 3,178,000 | | | | 149,845 | |
Tambang Batubara Bukit Asam Tbk PT | | | 2,159,900 | | | | 1,270,637 | |
Telekomunikasi Indonesia Tbk PT | | | 58,725,800 | | | | 17,867,061 | |
Unilever Indonesia Tbk PT | | | 1,100,700 | | | | 3,761,892 | |
| | | | |
| | 13 | | See Notes to Financial Statements. |
Parametric Tax-Managed Emerging Markets Fund
June 30, 2016
Portfolio of Investments — continued
| | | | | | | | |
| Security | | Shares | | | Value | |
| | | | | | | | |
|
Indonesia (continued) | |
United Tractors Tbk PT | | | 3,148,000 | | | $ | 3,551,784 | |
Vale Indonesia Tbk PT(1) | | | 4,748,000 | | | | 661,792 | |
Wijaya Karya Persero Tbk PT | | | 6,352,000 | | | | 1,429,397 | |
| | | | | | | | | |
| | | $ | 93,203,910 | |
| | | | | | | | | |
|
Jordan — 0.6% | |
Al Eqbal Co. for Investment PLC | | | 28,009 | | | $ | 899,079 | |
Alia The Royal Jordanian Airlines PLC(1) | | | 115,334 | | | | 110,549 | |
Arab Bank PLC | | | 981,144 | | | | 8,440,136 | |
Arab Potash Co. PLC | | | 67,492 | | | | 1,632,817 | |
Bank of Jordan | | | 125,347 | | | | 388,918 | |
Cairo Amman Bank(1) | | | 97,717 | | | | 266,081 | |
Capital Bank of Jordan | | | 470,740 | | | | 597,924 | |
Jordan Ahli Bank | | | 271,280 | | | | 447,438 | |
Jordan Islamic Bank | | | 120,628 | | | | 582,453 | |
Jordan Petroleum Refinery | | | 360,748 | | | | 1,660,389 | |
Jordan Phosphate Mines(1) | | | 76,355 | | | | 348,043 | |
Jordan Steel(1) | | | 269,400 | | | | 171,344 | |
Jordan Telecommunications Co. | | | 200,331 | | | | 608,802 | |
Jordanian Electric Power Co. | | | 445,146 | | | | 1,495,847 | |
| | | | | | | | | |
| | | $ | 17,649,820 | |
| | | | | | | | | |
|
Kazakhstan — 0.5% | |
Halyk Savings Bank of Kazakhstan JSC GDR(3) | | | 716,100 | | | $ | 3,512,592 | |
KAZ Minerals PLC(1) | | | 2,233,589 | | | | 3,965,703 | |
Kazkommertsbank JSC GDR(1)(3) | | | 284,200 | | | | 451,258 | |
KazMunaiGas Exploration Production GDR(3) | | | 632,226 | | | | 4,557,524 | |
Kcell JSC GDR(3) | | | 544,503 | | | | 1,849,688 | |
Nostrum Oil & Gas PLC | | | 178,200 | | | | 722,574 | |
| | | | | | | | | |
| | | $ | 15,059,339 | |
| | | | | | | | | |
|
Kenya — 0.7% | |
ARM Cement, Ltd. | | | 1,677,000 | | | $ | 520,629 | |
Bamburi Cement Co., Ltd. | | | 460,041 | | | | 774,798 | |
Barclays Bank of Kenya, Ltd. | | | 5,636,820 | | | | 540,294 | |
Centum Investment Co., Ltd.(1) | | | 977,680 | | | | 427,150 | |
Co-operative Bank of Kenya, Ltd. (The) | | | 5,182,660 | | | | 829,501 | |
East African Breweries, Ltd. | | | 1,888,140 | | | | 5,145,803 | |
Equity Group Holdings, Ltd. | | | 5,552,900 | | | | 2,115,350 | |
KCB Group, Ltd. | | | 5,752,360 | | | | 1,937,864 | |
KenolKobil, Ltd. | | | 3,645,800 | | | | 375,950 | |
Kenya Airways, Ltd.(1) | | | 2,398,400 | | | | 102,994 | |
Kenya Electricity Generating Co., Ltd. | | | 1,875,100 | | | | 130,179 | |
Kenya Power & Lighting, Ltd. | | | 5,995,293 | | | | 587,448 | |
Nation Media Group, Ltd. | | | 442,376 | | | | 659,936 | |
| | | | | | | | |
| Security | | Shares | | | Value | |
| | | | | | | | |
|
Kenya (continued) | |
NIC Bank, Ltd. | | | 852,975 | | | $ | 307,656 | |
Safaricom, Ltd. | | | 30,869,900 | | | | 5,365,437 | |
Standard Chartered Bank Kenya, Ltd. | | | 278,578 | | | | 536,846 | |
| | | | | | | | | |
| | | $ | 20,357,835 | |
| | | | | | | | | |
|
Kuwait — 1.4% | |
Abyaar Real Estate Development Co. KSC(1) | | | 1,440,000 | | | $ | 110,362 | |
Agility Public Warehousing Co. KSC | | | 1,807,548 | | | | 2,821,033 | |
Ahli United Bank | | | 306,691 | | | | 401,799 | |
Al Ahli Bank of Kuwait KSCP | | | 122,180 | | | | 133,845 | |
Al-Mazaya Holding Co. | | | 551,200 | | | | 215,505 | |
Boubyan Petrochemicals Co. | | | 2,067,187 | | | | 3,565,391 | |
Burgan Bank SAK | | | 921,028 | | | | 993,190 | |
Combined Group Contracting Co. KSC | | | 151,423 | | | | 348,704 | |
Commercial Bank of Kuwait KSCP | | | 994,227 | | | | 1,366,950 | |
Commercial Real Estate Co. KSCC | | | 2,487,729 | | | | 627,307 | |
Gulf Bank | | | 1,477,708 | | | | 1,136,787 | |
Gulf Cable & Electrical Industries Co. KSCP(1) | | | 165,000 | | | | 208,973 | |
Gulf National Holding Co.(1)(2) | | | 681,313 | | | | 0 | |
Kuwait Finance House KSCP | | | 2,907,746 | | | | 4,390,070 | |
Kuwait Food Co. (Americana) SAK | | | 512,500 | | | | 4,186,631 | |
Kuwait International Bank | | | 818,000 | | | | 493,836 | |
Kuwait Portland Cement Co. KSC | | | 212,231 | | | | 669,262 | |
Kuwait Projects Co. Holdings KSC | | | 964,872 | | | | 1,604,971 | |
Kuwait Real Estate Co. KSC(1) | | | 1,720,000 | | | | 302,516 | |
Mabanee Co. SAK | | | 1,009,315 | | | | 2,513,917 | |
Mobile Telecommunications Co. | | | 4,387,600 | | | | 4,874,016 | |
National Bank of Kuwait SAK | | | 2,859,636 | | | | 5,590,257 | |
National Industries Group Holding SAK | | | 3,619,875 | | | | 1,367,528 | |
National Investment Co.(1) | | | 645,000 | | | | 203,376 | |
National Real Estate Co. KPSC(1) | | | 659,614 | | | | 183,918 | |
Qurain Petrochemical Industries Co. KSC | | | 1,460,000 | | | | 938,376 | |
Sultan Center Food Products Co.(1) | | | 2,160,000 | | | | 394,404 | |
| | | | | | | | | |
| | | $ | 39,642,924 | |
| | | | | | | | | |
|
Latvia — 0.0%(4) | |
Grindeks(1) | | | 12,000 | | | $ | 55,278 | |
Latvian Shipping Co.(1) | | | 96,000 | | | | 48,752 | |
| | | | | | | | | |
| | | $ | 104,030 | |
| | | | | | | | | |
|
Lebanon — 0.2% | |
Banque Audi sal-Audi Saradar Group | | | 246,610 | | | $ | 1,542,424 | |
Byblos Bank | | | 838,110 | | | | 1,373,593 | |
Solidere, Class A | | | 281,364 | | | | 2,620,162 | |
Solidere, Class B | | | 5,626 | | | | 52,439 | |
| | | | | | | | | |
| | | $ | 5,588,618 | |
| | | | | | | | | |
| | | | |
| | 14 | | See Notes to Financial Statements. |
Parametric Tax-Managed Emerging Markets Fund
June 30, 2016
Portfolio of Investments — continued
| | | | | | | | |
| Security | | Shares | | | Value | |
| | | | | | | | |
|
Lithuania — 0.1% | |
Apranga PVA | | | 363,680 | | | $ | 1,008,750 | |
Energijos Skirstymo Operatorius AB | | | 370,141 | | | | 348,916 | |
Invalda Privatus Kapitalas AB(2) | | | 32,177 | | | | 0 | |
Klaipedos Nafta AB | | | 1,576,663 | | | | 908,638 | |
Panevezio Statybos Trestas | | | 323,592 | | | | 328,386 | |
Pieno Zvaigzdes | | | 94,000 | | | | 136,527 | |
Rokiskio Suris | | | 177,000 | | | | 272,198 | |
Siauliu Bankas | | | 1,239,550 | | | | 451,963 | |
| | | | | | | | | |
| | | $ | 3,455,378 | |
| | | | | | | | | |
|
Malaysia — 2.9% | |
Aeon Co. (M) Bhd | | | 1,017,000 | | | $ | 659,805 | |
Affin Holdings Bhd | | | 236,000 | | | | 124,336 | |
Alliance Financial Group Bhd | | | 330,800 | | | | 331,175 | |
AMMB Holdings Bhd | | | 276,900 | | | | 305,596 | |
Axiata Group Bhd | | | 1,796,275 | | | | 2,514,091 | |
Batu Kawan Bhd | | | 100,300 | | | | 443,512 | |
Berjaya Corp. Bhd | | | 2,498,100 | | | | 220,511 | |
Berjaya Sports Toto Bhd | | | 468,894 | | | | 353,582 | |
Boustead Holdings Bhd | | | 412,500 | | | | 277,730 | |
British American Tobacco Malaysia Bhd | | | 109,600 | | | | 1,433,408 | |
Bumi Armada Bhd(1) | | | 3,144,800 | | | | 568,055 | |
Bursa Malaysia Bhd | | | 224,600 | | | | 477,877 | |
CIMB Group Holdings Bhd | | | 717,766 | | | | 780,719 | |
Datasonic Group Bhd | | | 1,594,400 | | | | 499,997 | |
Dialog Group Bhd | | | 2,846,250 | | | | 1,089,582 | |
Digi.com Bhd | | | 1,538,000 | | | | 1,825,397 | |
Felda Global Ventures Holdings Bhd | | | 1,136,300 | | | | 427,181 | |
Gamuda Bhd | | | 1,487,900 | | | | 1,795,182 | |
Genting Bhd | | | 1,560,000 | | | | 3,177,562 | |
Genting Malaysia Bhd | | | 2,380,000 | | | | 2,631,485 | |
Genting Plantations Bhd | | | 261,000 | | | | 688,915 | |
Globetronics Technology Bhd | | | 90,100 | | | | 74,600 | |
Hartalega Holdings Bhd | | | 443,000 | | | | 476,082 | |
Hong Leong Bank Bhd | | | 167,700 | | | | 550,092 | |
Hong Leong Financial Group Bhd | | | 136,200 | | | | 497,006 | |
IHH Healthcare Bhd | | | 2,936,300 | | | | 4,810,539 | |
IJM Corp. Bhd | | | 1,497,540 | | | | 1,297,093 | |
IOI Corp. Bhd | | | 2,220,568 | | | | 2,386,200 | |
IOI Properties Group Bhd | | | 842,484 | | | | 491,698 | |
KLCCP Stapled Group | | | 250,000 | | | | 464,177 | |
KNM Group Bhd(1) | | | 7,927,875 | | | | 811,947 | |
Kossan Rubber Industries | | | 458,100 | | | | 779,072 | |
KPJ Healthcare Bhd | | | 403,200 | | | | 423,398 | |
Kuala Lumpur Kepong Bhd | | | 270,750 | | | | 1,565,890 | |
Kulim (Malaysia) Bhd(1) | | | 792,800 | | | | 799,254 | |
| | | | | | | | |
| Security | | Shares | | | Value | |
| | | | | | | | |
|
Malaysia (continued) | |
Lafarge Malaysia Bhd | | | 895,660 | | | $ | 1,739,562 | |
Landmarks Bhd(1) | | | 576,800 | | | | 111,428 | |
Magnum Bhd | | | 617,940 | | | | 352,738 | |
Malayan Banking Bhd | | | 992,786 | | | | 2,008,260 | |
Malaysian Resources Corp. Bhd | | | 853,000 | | | | 225,257 | |
Maxis Bhd | | | 1,255,300 | | | | 1,835,507 | |
Media Prima Bhd | | | 567,300 | | | | 194,192 | |
MISC Bhd | | | 314,240 | | | | 582,022 | |
MMC Corp. Bhd | | | 662,000 | | | | 331,065 | |
Muhibbah Engineering (M) Bhd | | | 1,581,000 | | | | 863,637 | |
My EG Services Bhd | | | 5,924,400 | | | | 2,897,763 | |
Parkson Holdings Bhd(1) | | | 713,599 | | | | 143,604 | |
Petronas Chemicals Group Bhd | | | 3,014,400 | | | | 4,949,927 | |
Petronas Dagangan Bhd | | | 526,600 | | | | 3,054,394 | |
Petronas Gas Bhd | | | 268,500 | | | | 1,469,689 | |
PPB Group Bhd | | | 357,300 | | | | 1,467,903 | |
Press Metal Bhd | | | 930,000 | | | | 852,600 | |
Public Bank Bhd | | | 312,898 | | | | 1,507,685 | |
RHB Bank Bhd | | | 404,959 | | | | 515,166 | |
Sapurakencana Petroleum Bhd | | | 6,435,352 | | | | 2,364,784 | |
Silverlake Axis, Ltd. | | | 1,586,300 | | | | 608,808 | |
Sime Darby Bhd | | | 1,019,709 | | | | 1,921,181 | |
Sunway Bhd | | | 378,040 | | | | 281,381 | |
Sunway REIT | | | 1,028,200 | | | | 423,738 | |
Supermax Corp. Bhd | | | 1,466,700 | | | | 783,893 | |
Ta Ann Holdings Bhd | | | 427,078 | | | | 350,093 | |
Tan Chong Motor Holdings Bhd | | | 219,000 | | | | 104,444 | |
Telekom Malaysia Bhd | | | 1,020,100 | | | | 1,716,983 | |
Tenaga Nasional Bhd | | | 1,724,331 | | | | 6,037,631 | |
Top Glove Corp. Bhd | | | 420,000 | | | | 479,759 | |
UEM Sunrise Bhd | | | 1,112,200 | | | | 285,497 | |
UMW Holdings Bhd | | | 549,600 | | | | 783,274 | |
UMW Oil & Gas Corp. Bhd(1) | | | 1,133,700 | | | | 264,666 | |
Unisem (M) Bhd | | | 3,101,700 | | | | 1,851,283 | |
Wah Seong Corp. Bhd | | | 697,402 | | | | 123,182 | |
YTL Corp. Bhd | | | 2,626,518 | | | | 1,090,145 | |
YTL Power International Bhd | | | 1,597,363 | | | | 558,624 | |
| | | | | | | | | |
| | | $ | 81,184,511 | |
| | | | | | | | | |
|
Mauritius — 0.7% | |
Alteo, Ltd. | | | 352,391 | | | $ | 270,164 | |
CIEL, Ltd. | | | 2,019,231 | | | | 350,119 | |
CIM Financial Services, Ltd. | | | 1,742,485 | | | | 324,659 | |
ENL Land, Ltd. | | | 484,800 | | | | 547,421 | |
Ireland Blyth, Ltd. | | | 64,209 | | | | 225,842 | |
LUX Island Resorts, Ltd. | | | 931,480 | | | | 1,496,347 | |
| | | | |
| | 15 | | See Notes to Financial Statements. |
Parametric Tax-Managed Emerging Markets Fund
June 30, 2016
Portfolio of Investments — continued
| | | | | | | | |
| Security | | Shares | | | Value | |
| | | | | | | | |
|
Mauritius (continued) | |
MCB Group, Ltd. | | | 1,620,906 | | | $ | 9,600,605 | |
New Mauritius Hotels, Ltd. | | | 4,357,728 | | | | 2,473,116 | |
Rogers & Co., Ltd. | | | 608,300 | | | | 478,179 | |
SBM Holdings, Ltd. | | | 150,687,762 | | | | 2,668,028 | |
Terra Mauricia, Ltd. | | | 1,002,180 | | | | 845,117 | |
United Basalt Products, Ltd. | | | 187,150 | | | | 436,291 | |
| | | | | | | | | |
| | | $ | 19,715,888 | |
| | | | | | | | | |
|
Mexico — 5.8% | |
Alfa SAB de CV, Series A | | | 5,949,820 | | | $ | 10,228,488 | |
Alsea SAB de CV | | | 1,445,200 | | | | 5,501,745 | |
America Movil SAB de CV, Series L | | | 36,246,590 | | | | 22,284,182 | |
Arca Continental SAB de CV | | | 288,500 | | | | 2,070,504 | |
Bolsa Mexicana de Valores SAB de CV | | | 915,200 | | | | 1,410,152 | |
Cemex SAB de CV, Series CPO(1) | | | 14,049,729 | | | | 8,691,481 | |
Coca-Cola Femsa SAB de CV, Series L | | | 286,300 | | | | 2,372,451 | |
El Puerto de Liverpool SAB de CV | | | 175,681 | | | | 1,858,807 | |
Empresas ICA SAB de CV(1) | | | 2,075,736 | | | | 373,535 | |
Fibra Uno Administracion SA de CV | | | 1,366,700 | | | | 2,911,682 | |
Fomento Economico Mexicano SAB de CV, Series UBD | | | 1,110,500 | | | | 10,281,626 | |
Genomma Lab Internacional SAB de CV(1) | | | 2,065,500 | | | | 2,118,311 | |
Gentera SAB de CV | | | 2,673,100 | | | | 4,788,392 | |
Gruma SAB de CV, Class B | | | 98,200 | | | | 1,412,637 | |
Grupo Aeroportuario del Pacifico SAB de CV, Class B | | | 347,800 | | | | 3,575,486 | |
Grupo Aeroportuario del Sureste SAB de CV, Class B | | | 254,009 | | | | 4,047,461 | |
Grupo Bimbo SAB de CV, Series A | | | 1,495,508 | | | | 4,690,398 | |
Grupo Carso SAB de CV, Series A1 | | | 1,023,400 | | | | 4,404,260 | |
Grupo Comercial Chedraui SA de CV | | | 208,900 | | | | 520,806 | |
Grupo Elektra SAB de CV | | | 140,026 | | | | 1,947,377 | |
Grupo Financiero Banorte SAB de CV, Class O | | | 2,252,300 | | | | 12,587,960 | |
Grupo Financiero Inbursa SAB de CV, Class O | | | 3,477,016 | | | | 5,912,765 | |
Grupo Mexico SAB de CV, Series B | | | 3,211,035 | | | | 7,524,155 | |
Grupo Televisa SAB, Series CPO | | | 3,289,671 | | | | 17,153,205 | |
Impulsora del Desarrollo y el Empleo en America Latina SA de CV, Series B1(1) | | | 1,134,930 | | | | 1,658,703 | |
Industrias CH SAB de CV, Series B(1)(2) | | | 194,112 | | | | 639,673 | |
Industrias Penoles SAB de CV | | | 137,229 | | | | 3,276,298 | |
Infraestructura Energetica Nova SAB de CV | | | 115,500 | | | | 486,763 | |
Kimberly-Clark de Mexico SAB de CV, Class A | | | 944,910 | | | | 2,232,219 | |
Mexichem SAB de CV | | | 1,478,407 | | | | 3,116,513 | |
Minera Frisco SAB de CV(1) | | | 873,200 | | | | 590,331 | |
Organizacion Soriana SAB de CV, Class B(1) | | | 166,700 | | | | 398,274 | |
Promotora y Operadora de Infraestructura SAB de CV | | | 416,700 | | | | 5,128,707 | |
Telesites SAB de CV(1) | | | 1,812,330 | | | | 1,120,157 | |
Ternium SA ADR | | | 70,322 | | | | 1,340,337 | |
TV Azteca SAB de CV, Series CPO | | | 1,018,565 | | | | 133,153 | |
| | | | | | | | |
| Security | | Shares | | | Value | |
| | | | | | | | |
|
Mexico (continued) | |
Wal-Mart de Mexico SAB de CV, Series V | | | 3,059,664 | | | $ | 7,360,244 | |
| | | | | | | | | |
| | | $ | 166,149,238 | |
| | | | | | | | | |
|
Morocco — 0.7% | |
Attijariwafa Bank | | | 92,000 | | | $ | 3,233,861 | |
Banque Centrale Populaire | | | 85,000 | | | | 1,910,064 | |
Banque Marocaine pour le Commerce et l’Industrie (BMCI) | | | 3,030 | | | | 199,690 | |
BMCE Bank | | | 66,776 | | | | 1,394,832 | |
Delta Holding SA | | | 35,000 | | | | 75,928 | |
Douja Promotion Groupe Addoha SA | | | 232,801 | | | | 863,723 | |
Holcim Maroc SA | | | 6,422 | | | | 1,497,497 | |
Label Vie | | | 3,700 | | | | 402,711 | |
Managem | | | 7,900 | | | | 614,893 | |
Maroc Telecom | | | 470,271 | | | | 5,711,801 | |
Samir(1)(2) | | | 19,247 | | | | 0 | |
Societe Lafarge Ciments SA | | | 11,351 | | | | 2,019,642 | |
Sonasid | | | 5,872 | | | | 259,755 | |
Taqa Morocco | | | 26,192 | | | | 1,722,965 | |
Wafa Assurance | | | 2,560 | | | | 891,248 | |
| | | | | | | | | |
| | | $ | 20,798,610 | |
| | | | | | | | | |
|
Nigeria — 0.5% | |
Access Bank PLC | | | 14,469,911 | | | $ | 293,239 | |
Ashaka Cem PLC | | | 105 | | | | 7 | |
Dangote Cement PLC | | | 2,191,891 | | | | 1,480,635 | |
Dangote Sugar Refinery PLC | | | 4,385,654 | | | | 107,363 | |
Diamond Bank PLC(1) | | | 12,314,600 | | | | 97,887 | |
Ecobank Transnational, Inc.(1) | | | 11,886,485 | | | | 671,941 | |
FBN Holdings PLC | | | 27,727,599 | | | | 381,998 | |
FCMB Group PLC | | | 21,258,724 | | | | 120,984 | |
Fidelity Bank PLC | | | 15,112,844 | | | | 67,881 | |
Flour Mills of Nigeria PLC | | | 1,874,895 | | | | 152,417 | |
Forte Oil PLC | | | 2,086,402 | | | | 1,383,428 | |
Guaranty Trust Bank PLC | | | 20,343,994 | | | | 1,682,990 | |
Guiness Nigeria PLC | | | 856,034 | | | | 318,638 | |
Lafarge Africa PLC | | | 3,897,771 | | | | 979,074 | |
Lekoil, Ltd.(1) | | | 1,110,205 | | | | 266,322 | |
Nestle Nigeria PLC | | | 388,412 | | | | 1,178,475 | |
Nigerian Breweries PLC | | | 4,077,383 | | | | 1,946,585 | |
Oando PLC(1) | | | 14,592,401 | | | | 334,755 | |
PZ Cussons Nigeria PLC | | | 950,083 | | | | 77,762 | |
SEPLAT Petroleum Development Co. PLC(5) | | | 728,540 | | | | 676,327 | |
Skye Bank PLC(1) | | | 17,576,580 | | | | 64,982 | |
Stanbic IBTC Holdings PLC | | | 1,857,245 | | | | 106,839 | |
| | | | |
| | 16 | | See Notes to Financial Statements. |
Parametric Tax-Managed Emerging Markets Fund
June 30, 2016
Portfolio of Investments — continued
| | | | | | | | |
| Security | | Shares | | | Value | |
| | | | | | | | |
|
Nigeria (continued) | |
Transnational Corp. of Nigeria PLC(1) | | | 22,334,373 | | | $ | 141,423 | |
UAC of Nigeria PLC | | | 4,061,181 | | | | 285,003 | |
Unilever Nigeria PLC | | | 2,074,728 | | | | 245,254 | |
United Bank for Africa PLC | | | 25,390,531 | | | | 425,323 | |
Zenith Bank PLC | | | 21,731,635 | | | | 1,218,649 | |
| | | | | | | | | |
| | | $ | 14,706,181 | |
| | | | | | | | | |
|
Oman — 0.8% | |
Al Anwar Ceramic Tiles Co. | | | 166,191 | | | $ | 107,523 | |
Al Maha Petroleum Products Marketing Co., LLC | | | 36,500 | | | | 142,278 | |
Bank Dhofar SAOG | | | 1,838,203 | | | | 1,107,362 | |
Bank Muscat SAOG | | | 2,985,751 | | | | 2,919,242 | |
Bank Sohar SAOG | | | 4,346,210 | | | | 1,946,063 | |
Dhofar International Development & Investment Holding SAOG | | | 316,407 | | | | 338,157 | |
Galfar Engineering & Contracting SAOG(1) | | | 1,569,283 | | | | 448,053 | |
HSBC Bank Oman SAOG | | | 2,331,977 | | | | 594,763 | |
National Bank of Oman SAOG | | | 2,541,393 | | | | 1,574,033 | |
Oman Cables Industry SAOG | | | 112,400 | | | | 531,444 | |
Oman Cement Co. SAOG | | | 956,735 | | | | 1,116,358 | |
Oman Flour Mills Co. SAOG | | | 543,700 | | | | 828,569 | |
Oman Telecommunications Co. SAOG | | | 1,247,060 | | | | 5,264,265 | |
Omani Qatari Telecommunications Co. SAOG | | | 671,100 | | | | 1,293,804 | |
Ominvest | | | 1,392,062 | | | | 2,016,158 | |
Raysut Cement Co. SAOG | | | 523,326 | | | | 1,782,662 | |
Renaissance Services SAOG(1) | | | 1,561,017 | | | | 1,174,858 | |
Sembcorp Salalah Power & Water Co. | | | 414,000 | | | | 258,175 | |
Shell Oman Marketing Co. SAOG | | | 66,100 | | | | 326,356 | |
| | | | | | | | | |
| | | $ | 23,770,123 | |
| | | | | | | | | |
|
Pakistan — 1.5% | |
Adamjee Insurance Co., Ltd. | | | 549,644 | | | $ | 260,110 | |
Attock Petroleum, Ltd. | | | 118,800 | | | | 494,298 | |
Bank Alfalah, Ltd. | | | 1,609,394 | | | | 392,130 | |
Bank of Punjab(1) | | | 2,431,500 | | | | 187,122 | |
Cherat Cement Co., Ltd. | | | 236,000 | | | | 269,964 | |
D.G. Khan Cement Co., Ltd. | | | 528,320 | | | | 965,552 | |
Engro Corp., Ltd. | | | 781,516 | | | | 2,482,485 | |
Engro Fertilizers, Ltd. | | | 706,500 | | | | 436,082 | |
Engro Foods, Ltd.(1) | | | 710,300 | | | | 1,105,738 | |
Fatima Fertilizer Co., Ltd.(1) | | | 952,500 | | | | 308,865 | |
Fauji Cement Co., Ltd. | | | 1,338,000 | | | | 453,929 | |
Fauji Fertilizer Bin Qasim, Ltd. | | | 841,000 | | | | 425,486 | |
Fauji Fertilizer Co., Ltd. | | | 1,608,314 | | | | 1,767,884 | |
Ferozsons Laboratories, Ltd. | | | 32,400 | | | | 321,740 | |
Habib Bank, Ltd. | | | 1,422,633 | | | | 2,681,110 | |
Hub Power Co., Ltd. | | | 3,755,700 | | | | 4,300,593 | |
| | | | | | | | |
| Security | | Shares | | | Value | |
| | | | | | | | |
|
Pakistan (continued) | |
K-Electric, Ltd.(1) | | | 13,181,500 | | | $ | 1,017,407 | |
Kot Addu Power Co., Ltd. | | | 1,728,500 | | | | 1,470,341 | |
Lucky Cement, Ltd. | | | 411,400 | | | | 2,545,468 | |
Maple Leaf Cement Factory, Ltd. | | | 362,000 | | | | 364,284 | |
MCB Bank, Ltd. | | | 1,771,625 | | | | 3,696,401 | |
Millat Tractors, Ltd. | | | 80,629 | | | | 439,596 | |
National Bank of Pakistan | | | 1,144,026 | | | | 632,312 | |
Nishat Mills, Ltd. | | | 2,017,480 | | | | 2,088,356 | |
Oil & Gas Development Co., Ltd. | | | 1,649,900 | | | | 2,188,829 | |
Pak Elektron, Ltd. | | | 1,452,500 | | | | 899,131 | |
Pak Suzuki Motor Co., Ltd. | | | 121,600 | | | | 445,363 | |
Pakistan Oil Fields, Ltd. | | | 272,900 | | | | 905,825 | |
Pakistan Petroleum, Ltd. | | | 1,178,802 | | | | 1,746,913 | |
Pakistan State Oil Co., Ltd. | | | 484,847 | | | | 1,736,763 | |
Pakistan Telecommunication Co., Ltd. | | | 2,767,500 | | | | 397,933 | |
Pioneer Cement, Ltd. | | | 233,500 | | | | 238,867 | |
Searle Co., Ltd. (The) | | | 470,900 | | | | 2,418,741 | |
SUI Southern Gas Co., Ltd.(1) | | | 2,055,152 | | | | 539,258 | |
TRG Pakistan(1) | | | 3,398,587 | | | | 1,089,338 | |
United Bank, Ltd. | | | 835,025 | | | | 1,412,801 | |
| | | | | | | | | |
| | | $ | 43,127,015 | |
| | | | | | | | | |
|
Panama — 0.3% | |
Copa Holdings SA, Class A | | | 152,000 | | | $ | 7,943,520 | |
| | | | | | | | | |
| | | $ | 7,943,520 | |
| | | | | | | | | |
|
Peru — 1.6% | |
Alicorp SAA | | | 3,270,649 | | | $ | 6,416,744 | |
Banco Continental SA | | | 601,670 | | | | 614,920 | |
Cementos Pacasmayo SAA | | | 382,900 | | | | 683,667 | |
Cia de Minas Buenaventura SA ADR(1) | | | 298,256 | | | | 3,564,159 | |
Cia Minera Milpo SA | | | 963,264 | | | | 627,018 | |
Credicorp, Ltd. | | | 88,196 | | | | 13,611,289 | |
Edegel SA | | | 2,765,417 | | | | 2,170,208 | |
Ferreycorp SAA | | | 4,329,744 | | | | 2,054,508 | |
Grana y Montero SAA | | | 1,731,913 | | | | 2,444,359 | |
Intercorp Financial Services, Inc. | | | 61,100 | | | | 1,833,000 | |
Luz del Sur SAA | | | 185,800 | | | | 593,977 | |
Minsur SA(1) | | | 1,266,277 | | | | 458,349 | |
Refineria La Pampilla SA Relapasa(1) | | | 681,460 | | | | 48,919 | |
Sociedad Minera Cerro Verde SAA(1) | | | 40,457 | | | | 749,264 | |
Southern Copper Corp. | | | 268,455 | | | | 7,242,916 | |
Union Andina de Cementos SAA | | | 278,400 | | | | 214,245 | |
Volcan Cia Minera SAA, Class B(1) | | | 4,289,892 | | | | 782,922 | |
| | | | | | | | | |
| | | $ | 44,110,464 | |
| | | | | | | | | |
| | | | |
| | 17 | | See Notes to Financial Statements. |
Parametric Tax-Managed Emerging Markets Fund
June 30, 2016
Portfolio of Investments — continued
| | | | | | | | |
| Security | | Shares | | | Value | |
| | | | | | | | |
|
Philippines — 3.2% | |
Aboitiz Equity Ventures, Inc. | | | 2,284,250 | | | $ | 3,792,928 | |
Aboitiz Power Corp. | | | 3,401,900 | | | | 3,339,379 | |
Alliance Global Group, Inc. | | | 2,897,300 | | | | 914,039 | |
Ayala Corp. | | | 201,738 | | | | 3,650,453 | |
Ayala Land, Inc. | | | 4,584,708 | | | | 3,803,132 | |
Ayala Land, Inc., PFC Shares(2) | | | 3,534,608 | | | | 0 | |
Bank of the Philippine Islands | | | 1,291,856 | | | | 2,674,979 | |
BDO Unibank, Inc. | | | 1,170,320 | | | | 2,795,984 | |
Bloomberry Resorts Corp.(1) | | | 11,682,500 | | | | 1,655,838 | |
Cosco Capital, Inc. | | | 1,868,100 | | | | 309,545 | |
D&L Industries, Inc. | | | 3,610,400 | | | | 769,122 | |
DMCI Holdings, Inc. | | | 2,556,500 | | | | 687,890 | |
Emperador, Inc. | | | 3,420,000 | | | | 526,077 | |
Energy Development Corp. | | | 14,742,350 | | | | 1,739,958 | |
Filinvest Land, Inc. | | | 16,105,546 | | | | 682,438 | |
First Gen Corp. | | | 2,648,860 | | | | 1,407,379 | |
First Philippine Holdings Corp. | | | 403,650 | | | | 582,978 | |
Globe Telecom, Inc. | | | 60,375 | | | | 3,051,998 | |
GMA Holdings, Inc. PDR | | | 1,242,100 | | | | 167,406 | |
GT Capital Holdings, Inc. | | | 54,000 | | | | 1,660,055 | |
International Container Terminal Services, Inc. | | | 551,900 | | | | 723,829 | |
JG Summit Holding, Inc. | | | 2,048,150 | | | | 3,741,690 | |
Jollibee Foods Corp. | | | 1,000,420 | | | | 5,159,458 | |
Lopez Holdings Corp. | | | 8,390,900 | | | | 1,392,386 | |
LT Group, Inc. | | | 1,987,400 | | | | 672,706 | |
Manila Electric Co. | | | 464,684 | | | | 3,069,393 | |
Manila Water Co. | | | 1,474,000 | | | | 850,624 | |
Megaworld Corp. | | | 10,700,000 | | | | 1,064,641 | |
Melco Crown Philippines Resorts Corp.(1) | | | 5,609,200 | | | | 453,958 | |
Metro Pacific Investments Corp. | | | 10,567,300 | | | | 1,573,652 | |
Metropolitan Bank & Trust Co. | | | 804,523 | | | | 1,549,520 | |
Nickel Asia Corp. | | | 9,129,938 | | | | 982,118 | |
Pepsi-Cola Products Philippines, Inc. | | | 1,198,000 | | | | 84,188 | |
Petron Corp. | | | 1,608,800 | | | | 382,278 | |
Philex Mining Corp.(1) | | | 3,645,900 | | | | 656,292 | |
Philex Petroleum Corp.(1) | | | 619,803 | | | | 54,483 | |
Philippine Long Distance Telephone Co. | | | 173,575 | | | | 7,933,576 | |
Puregold Price Club, Inc. | | | 1,403,900 | | | | 1,258,593 | |
Robinsons Land Corp. | | | 1,290,000 | | | | 811,973 | |
Robinsons Retail Holdings, Inc. | | | 841,690 | | | | 1,546,930 | |
San Miguel Corp. | | | 484,300 | | | | 809,555 | |
Semirara Mining & Power Corp. | | | 979,830 | | | | 2,614,702 | |
SM Investments Corp. | | | 224,480 | | | | 4,640,797 | |
SM Prime Holdings, Inc. | | | 7,654,550 | | | | 4,471,801 | |
SSI Group, Inc.(1) | | | 2,093,000 | | | | 145,337 | |
Travellers International Hotel Group, Inc. | | | 3,644,200 | | | | 263,307 | |
| | | | | | | | |
| Security | | Shares | | | Value | |
| | | | | | | | |
|
Philippines (continued) | |
Universal Robina Corp. | | | 1,964,140 | | | $ | 8,711,367 | |
Vista Land & Lifescapes, Inc. | | | 6,128,000 | | | | 699,525 | |
| | | | | | | | | |
| | | $ | 90,530,257 | |
| | | | | | | | | |
|
Poland — 2.6% | |
Agora SA(1) | | | 64,445 | | | $ | 205,878 | |
AmRest Holdings SE(1) | | | 30,208 | | | | 1,677,607 | |
Asseco Poland SA | | | 286,470 | | | | 3,799,388 | |
Bank Handlowy w Warszawie SA | | | 44,485 | | | | 810,279 | |
Bank Millennium SA(1) | | | 697,490 | | | | 828,585 | |
Bank Pekao SA | | | 142,785 | | | | 4,985,235 | |
Boryszew SA | | | 350,000 | | | | 491,393 | |
Budimex SA | | | 50,276 | | | | 2,193,607 | |
CCC SA | | | 45,300 | | | | 1,840,982 | |
Ciech SA | | | 19,100 | | | | 243,123 | |
Cyfrowy Polsat SA(1) | | | 709,480 | | | | 3,969,127 | |
Eurocash SA | | | 288,203 | | | | 3,377,047 | |
Getin Holding SA(1) | | | 392,795 | | | | 84,933 | |
Getin Noble Bank SA(1) | | | 1,591,418 | | | | 174,293 | |
Grupa Azoty SA | | | 6,800 | | | | 118,883 | |
Grupa Lotos SA(1) | | | 176,940 | | | | 1,368,727 | |
Integer.pl SA(1) | | | 3,251 | | | | 29,501 | |
Jastrzebska Spolka Weglowa SA(1) | | | 164,577 | | | | 719,369 | |
KGHM Polska Miedz SA | | | 287,171 | | | | 4,846,509 | |
KOPEX SA | | | 104,700 | | | | 79,824 | |
KRUK SA | | | 6,083 | | | | 311,488 | |
LPP SA | | | 2,402 | | | | 3,081,724 | |
Lubelski Wegiel Bogdanka SA | | | 10,688 | | | | 98,048 | |
mBank SA(1) | | | 24,950 | | | | 1,962,746 | |
Netia SA | | | 610,010 | | | | 638,420 | |
Orange Polska SA | | | 2,339,445 | | | | 3,016,726 | |
Orbis SA | | | 138,180 | | | | 2,132,019 | |
PGE SA | | | 2,045,800 | | | | 6,162,246 | |
PKP Cargo SA(1) | | | 5,094 | | | | 42,776 | |
Polski Koncern Naftowy ORLEN SA | | | 502,664 | | | | 8,829,530 | |
Polskie Gornictwo Naftowe i Gazownictwo SA | | | 2,342,566 | | | | 3,339,646 | |
Powszechna Kasa Oszczednosci Bank Polski
SA(1) | | | 968,082 | | | | 5,738,179 | |
Powszechny Zaklad Ubezpieczen SA | | | 691,000 | | | | 5,035,481 | |
Tauron Polska Energia SA | | | 2,765,200 | | | | 1,994,920 | |
| | | | | | | | | |
| | | $ | 74,228,239 | |
| | | | | | | | | |
|
Qatar — 1.3% | |
Al Meera Consumer Goods Co. | | | 16,300 | | | $ | 950,437 | |
Barwa Real Estate Co. | | | 134,737 | | | | 1,224,812 | |
Doha Bank QSC | | | 79,773 | | | | 776,556 | |
| | | | |
| | 18 | | See Notes to Financial Statements. |
Parametric Tax-Managed Emerging Markets Fund
June 30, 2016
Portfolio of Investments — continued
| | | | | | | | |
| Security | | Shares | | | Value | |
| | | | | | | | |
|
Qatar (continued) | |
Gulf International Services QSC | | | 169,144 | | | $ | 1,707,069 | |
Industries Qatar | | | 204,177 | | | | 5,514,013 | |
Masraf Al Rayan QSC | | | 348,259 | | | | 3,257,832 | |
Ooredoo QSC | | | 124,495 | | | | 3,024,531 | |
Qatar Electricity & Water Co. QSC | | | 50,080 | | | | 2,861,582 | |
Qatar Gas Transport Co., Ltd. | | | 496,791 | | | | 3,143,886 | |
Qatar Insurance Co. | | | 80,354 | | | | 1,624,408 | |
Qatar International Islamic Bank | | | 32,210 | | | | 544,773 | |
Qatar Islamic Bank | | | 69,898 | | | | 1,845,735 | |
Qatar National Bank SAQ | | | 164,143 | | | | 6,324,827 | |
Qatar National Cement Co. QSC | | | 15,195 | | | | 355,772 | |
Qatar Navigation QSC | | | 55,051 | | | | 1,328,490 | |
United Development Co. QSC | | | 183,252 | | | | 967,492 | |
Vodafone Qatar QSC | | | 694,900 | | | | 2,024,194 | |
| | | | | | | | | |
| | | $ | 37,476,409 | |
| | | | | | | | | |
|
Romania — 0.7% | |
Antibiotice SA | | | 1,843,129 | | | $ | 206,542 | |
Banca Transilvania SA | | | 18,039,199 | | | | 9,219,275 | |
BRD-Groupe Societe Generale SA | | | 1,198,197 | | | | 2,882,451 | |
OMV Petrom SA(1) | | | 43,591,503 | | | | 2,566,117 | |
Societatea Nationala de Gaze Naturale ROMGAZ SA | | | 342,084 | | | | 2,108,769 | |
Societatea Nationala Nuclearelectrica SA | | | 322,130 | | | | 397,366 | |
Transelectrica SA | | | 140,400 | | | | 952,790 | |
Transgaz SA Medias | | | 14,233 | | | | 950,279 | |
| | | | | | | | | |
| | | $ | 19,283,589 | |
| | | | | | | | | |
|
Russia — 6.8% | |
Aeroflot PJSC(1) | | | 597,030 | | | $ | 799,065 | |
AK Transneft OJSC, PFC Shares | | | 1,581 | | | | 4,111,286 | |
Alrosa PJSC | | | 1,517,000 | | | | 1,634,529 | |
E.ON Russia JSC | | | 4,102,000 | | | | 176,417 | |
Evraz PLC(1) | | | 772,698 | | | | 1,420,234 | |
Federal Grid PJSC | | | 1,285,220,600 | | | | 3,112,989 | |
Gazprom PJSC ADR | | | 4,533,667 | | | | 19,589,812 | |
Global Ports Investments PLC GDR(1)(3) | | | 30,769 | | | | 86,113 | |
Globaltrans Investment PLC GDR(3) | | | 143,453 | | | | 563,988 | |
Lenta, Ltd. GDR(1)(3) | | | 206,121 | | | | 1,495,378 | |
Lukoil PJSC ADR | | | 342,927 | | | | 14,352,737 | |
Magnit PJSC | | | 106,165 | | | | 14,964,451 | |
Mail.ru Group, Ltd. GDR(1)(3) | | | 271,939 | | | | 4,948,953 | |
MegaFon PJSC GDR(3) | | | 118,415 | | | | 1,236,587 | |
MMC Norilsk Nickel PJSC ADR | | | 872,917 | | | | 11,691,265 | |
Mobile TeleSystems PJSC | | | 3,116,003 | | | | 11,897,240 | |
Mobile TeleSystems PJSC ADR | | | 101,500 | | | | 840,420 | |
| | | | | | | | |
| Security | | Shares | | | Value | |
| | | | | | | | |
|
Russia (continued) | |
Moscow Exchange MICEX-RTS PJSC | | | 1,549,210 | | | $ | 2,723,403 | |
Mosenergo PJSC | | | 12,772,962 | | | | 323,164 | |
Novatek OJSC GDR(3) | | | 63,100 | | | | 6,455,830 | |
Novolipetsk Steel PJSC GDR | | | 130,402 | | | | 1,707,791 | |
PhosAgro OJSC GDR(3) | | | 77,473 | | | | 1,145,765 | |
PIK Group PJSC(1) | | | 113,450 | | | | 440,863 | |
PIK Group PJSC GDR(1)(3) | | | 100,000 | | | | 388,436 | |
Polymetal International PLC | | | 367,589 | | | | 5,151,271 | |
QIWI PLC ADR | | | 72,100 | | | | 944,510 | |
Rosneft PJSC GDR(3) | | | 951,124 | | | | 4,893,328 | |
Rosseti PJSC(1) | | | 78,782,500 | | | | 761,620 | |
Rostelecom PJSC | | | 253,968 | | | | 365,234 | |
Rostelecom PJSC ADR | | | 31,284 | | | | 269,355 | |
RusHydro PJSC | | | 167,096,952 | | | | 1,606,945 | |
Sberbank of Russia PJSC | | | 11,759,800 | | | | 24,516,153 | |
Severstal PJSC GDR(3) | | | 353,123 | | | | 3,888,550 | |
Sistema JSFC | | | 5,094,100 | | | | 1,629,060 | |
Sistema JSFC GDR(3) | | | 166,806 | | | | 1,257,442 | |
Surgutneftegas OJSC ADR | | | 944,396 | | | | 4,819,069 | |
Surgutneftegas OJSC ADR, PFC Shares | | | 229,600 | | | | 1,384,488 | |
Surgutneftegas OJSC, PFC Shares | | | 4,026,217 | | | | 2,417,814 | |
Tatneft PJSC ADR | | | 179,918 | | | | 5,553,871 | |
VimpelCom, Ltd. ADR | | | 976,630 | | | | 3,789,324 | |
VTB Bank PJSC GDR(3) | | | 3,025,174 | | | | 6,259,167 | |
X5 Retail Group NV GDR(1)(3) | | | 296,727 | | | | 5,949,656 | |
Yandex NV, Class A(1) | | | 624,100 | | | | 13,636,585 | |
| | | | | | | | | |
| | | $ | 195,200,158 | |
| | | | | | | | | |
|
Slovenia — 0.7% | |
Cinkarna Celje DD | | | 4,134 | | | $ | 363,059 | |
Gorenje DD | | | 120,554 | | | | 834,174 | |
KRKA DD | | | 146,474 | | | | 9,292,639 | |
Luka Koper | | | 34,436 | | | | 873,571 | |
Petrol | | | 15,934 | | | | 4,671,647 | |
Sava Reinsurance Co. | | | 58,474 | | | | 935,280 | |
Telekom Slovenije DD | | | 27,595 | | | | 2,110,682 | |
Zavarovalnica Triglav DD | | | 64,022 | | | | 1,595,331 | |
| | | | | | | | | |
| | | $ | 20,676,383 | |
| | | | | | | | | |
|
South Africa — 6.3% | |
AECI, Ltd. | | | 108,017 | | | $ | 607,735 | |
African Bank Investments, Ltd.(1)(2) | | | 959,888 | | | | 0 | |
African Rainbow Minerals, Ltd. | | | 33,300 | | | | 209,115 | |
Anglo American Platinum, Ltd.(1) | | | 15,100 | | | | 377,504 | |
AngloGold Ashanti, Ltd.(1) | | | 70,634 | | | | 1,275,545 | |
| | | | |
| | 19 | | See Notes to Financial Statements. |
Parametric Tax-Managed Emerging Markets Fund
June 30, 2016
Portfolio of Investments — continued
| | | | | | | | |
| Security | | Shares | | | Value | |
| | | | | | | | |
|
South Africa (continued) | |
AngloGold Ashanti, Ltd. ADR(1) | | | 79,199 | | | $ | 1,430,334 | |
Aspen Pharmacare Holdings, Ltd. | | | 301,772 | | | | 7,444,424 | |
Assore, Ltd. | | | 24,358 | | | | 295,919 | |
Astral Foods, Ltd. | | | 26,100 | | | | 223,954 | |
Aveng, Ltd.(1) | | | 697,596 | | | | 165,570 | |
AVI, Ltd. | | | 228,000 | | | | 1,286,462 | |
Barclays Africa Group, Ltd. | | | 203,773 | | | | 1,998,641 | |
Barloworld, Ltd. | | | 463,800 | | | | 2,311,079 | |
Bid Corp., Ltd.(1) | | | 455,103 | | | | 8,528,546 | |
Bidvest Group, Ltd. (The) | | | 455,103 | | | | 4,293,463 | |
Clicks Group, Ltd. | | | 218,200 | | | | 1,813,937 | |
DataTec, Ltd. | | | 305,900 | | | | 914,328 | |
Discovery, Ltd. | | | 221,254 | | | | 1,848,276 | |
Exxaro Resources, Ltd. | | | 92,500 | | | | 426,168 | |
FirstRand, Ltd. | | | 1,633,485 | | | | 4,985,212 | |
Fortress Income Fund, Ltd., Class A | | | 278,434 | | | | 299,131 | |
Fortress Income Fund, Ltd., Class B | | | 278,434 | | | | 681,120 | |
Foschini Group, Ltd. (The) | | | 104,323 | | | | 984,923 | |
Gold Fields, Ltd. | | | 255,380 | | | | 1,239,793 | |
Grindrod, Ltd. | | | 350,600 | | | | 273,138 | |
Growthpoint Properties, Ltd. | | | 942,500 | | | | 1,646,592 | |
Harmony Gold Mining Co., Ltd.(1) | | | 38,100 | | | | 135,899 | |
Hosken Consolidated Investments, Ltd. | | | 33,700 | | | | 274,947 | |
Hyprop Investments, Ltd. | | | 65,400 | | | | 575,752 | |
Impala Platinum Holdings, Ltd.(1) | | | 133,586 | | | | 430,404 | |
Imperial Holdings, Ltd. | | | 130,900 | | | | 1,336,715 | |
Investec, Ltd. | | | 156,600 | | | | 960,087 | |
JSE, Ltd. | | | 45,700 | | | | 575,717 | |
Kumba Iron Ore, Ltd.(1) | | | 22,200 | | | | 167,773 | |
Lewis Group, Ltd. | | | 39,800 | | | | 119,551 | |
Liberty Holdings, Ltd. | | | 67,700 | | | | 552,535 | |
Life Healthcare Group Holdings, Ltd. | | | 709,548 | | | | 1,745,722 | |
Massmart Holdings, Ltd. | | | 48,804 | | | | 416,890 | |
MMI Holdings, Ltd. | | | 554,133 | | | | 854,890 | |
Mondi, Ltd. | | | 134,531 | | | | 2,458,985 | |
Montauk Holdings, Ltd.(1) | | | 40,451 | | | | 46,519 | |
Mr Price Group, Ltd. | | | 188,400 | | | | 2,647,072 | |
MTN Group, Ltd. | | | 2,099,580 | | | | 20,404,527 | |
Murray & Roberts Holdings, Ltd. | | | 689,700 | | | | 552,010 | |
Nampak, Ltd. | | | 677,282 | | | | 878,820 | |
Naspers, Ltd., Class N | | | 153,976 | | | | 23,511,363 | |
Nedbank Group, Ltd. | | | 141,600 | | | | 1,797,498 | |
Netcare, Ltd. | | | 659,100 | | | | 1,399,655 | |
Northam Platinum, Ltd.(1) | | | 298,659 | | | | 878,976 | |
Pick’n Pay Holdings, Ltd. | | | 125,270 | | | | 295,021 | |
Pick’n Pay Stores, Ltd. | | | 152,660 | | | | 743,314 | |
| | | | | | | | |
| Security | | Shares | | | Value | |
| | | | | | | | |
|
South Africa (continued) | |
PPC, Ltd. | | | 68,814 | | | $ | 37,557 | |
Rand Merchant Investment Holdings, Ltd. | | | 449,000 | | | | 1,259,108 | |
Redefine Properties, Ltd. | | | 1,959,096 | | | | 1,503,718 | |
Remgro, Ltd. | | | 299,505 | | | | 5,197,046 | |
Reunert, Ltd. | | | 401,800 | | | | 1,716,570 | |
RMB Holdings, Ltd. | | | 520,200 | | | | 1,993,741 | |
Sanlam, Ltd. | | | 1,154,590 | | | | 4,769,848 | |
Santam, Ltd. | | | 27,610 | | | | 429,832 | |
Sappi, Ltd.(1) | | | 593,587 | | | | 2,763,400 | |
Sasol, Ltd. | | | 446,059 | | | | 12,067,571 | |
Shoprite Holdings, Ltd. | | | 419,647 | | | | 4,752,884 | |
Sibanye Gold, Ltd. | | | 1,052,080 | | | | 3,582,166 | |
SPAR Group, Ltd. (The) | | | 79,260 | | | | 1,088,327 | |
Standard Bank Group, Ltd. | | | 784,949 | | | | 6,836,458 | |
Steinhoff International Holdings NV | | | 1,020,600 | | | | 5,876,211 | |
Sun International, Ltd. | | | 33,860 | | | | 198,108 | |
Telkom SA SOC, Ltd. | | | 333,000 | | | | 1,502,559 | |
Tiger Brands, Ltd. | | | 207,487 | | | | 5,111,709 | |
Tongaat Hulett, Ltd. | | | 25,322 | | | | 202,850 | |
Truworths International, Ltd. | | | 299,341 | | | | 1,741,995 | |
Vodacom Group, Ltd. | | | 444,200 | | | | 5,061,509 | |
Wilson Bayly Holmes-Ovcon, Ltd. | | | 111,180 | | | | 952,053 | |
Woolworths Holdings, Ltd. | | | 355,542 | | | | 2,035,854 | |
| | | | | | | | | |
| | | $ | 180,002,625 | |
| | | | | | | | | |
|
South Korea — 6.1% | |
AMOREPACIFIC Corp. | | | 10,613 | | | $ | 4,000,989 | |
AMOREPACIFIC Group | | | 19,571 | | | | 2,871,924 | |
BNK Financial Group, Inc. | | | 55,807 | | | | 393,291 | |
Bukwang Pharmaceutical Co., Ltd. | | | 28,043 | | | | 840,210 | |
Cell Biotech Co., Ltd. | | | 7,242 | | | | 378,277 | |
Celltrion, Inc.(1) | | | 40,466 | | | | 3,401,821 | |
Chabiotech Co., Ltd.(1) | | | 115,772 | | | | 1,569,699 | |
Cheil Worldwide, Inc. | | | 38,050 | | | | 561,614 | |
CJ CheilJedang Corp. | | | 3,500 | | | | 1,185,395 | |
CJ Corp. | | | 7,083 | | | | 1,250,537 | |
CJ Korea Express Corp.(1) | | | 4,378 | | | | 827,775 | |
CJ O Shopping Co., Ltd. | | | 1,122 | | | | 171,650 | |
Coway Co., Ltd. | | | 15,560 | | | | 1,416,778 | |
Daelim Industrial Co., Ltd. | | | 6,870 | | | | 458,287 | |
Daesang Corp. | | | 29,700 | | | | 714,133 | |
Daewoo Engineering & Construction Co., Ltd.(1) | | | 60,100 | | | | 295,169 | |
Daewoo Industrial Development Co., Ltd.(1) | | | 3,501 | | | | 3,602 | |
DGB Financial Group Co., Ltd. | | | 64,880 | | | | 491,292 | |
Dong-A ST Co., Ltd. | | | 2,658 | | | | 314,997 | |
Dongbu Insurance Co., Ltd. | | | 9,442 | | | | 568,319 | |
| | | | |
| | 20 | | See Notes to Financial Statements. |
Parametric Tax-Managed Emerging Markets Fund
June 30, 2016
Portfolio of Investments — continued
| | | | | | | | |
| Security | | Shares | | | Value | |
| | | | | | | | |
|
South Korea (continued) | |
Doosan Corp. | | | 4,600 | | | $ | 373,630 | |
E-MART, Inc. | | | 8,311 | | | | 1,254,153 | |
Green Cross Corp. | | | 2,863 | | | | 471,101 | |
GS Engineering & Construction Corp.(1) | | | 35,833 | | | | 874,603 | |
GS Holdings Corp. | | | 47,154 | | | | 1,958,222 | |
Hana Financial Group, Inc. | | | 64,225 | | | | 1,305,751 | |
Hanjin Kal Corp. | | | 8,977 | | | | 129,344 | |
Hanjin Transportation Co., Ltd. | | | 10,500 | | | | 293,434 | |
Hankook Tire Co., Ltd. | | | 27,617 | | | | 1,228,690 | |
Hanmi Pharmaceutical Co., Ltd. | | | 2,253 | | | | 1,394,379 | |
Hanmi Science Co., Ltd. | | | 22,829 | | | | 3,069,318 | |
Hanwha Chemical Corp. | | | 65,820 | | | | 1,375,266 | |
Hanwha Corp. | | | 27,900 | | | | 866,743 | |
Hotel Shilla Co., Ltd. | | | 12,750 | | | | 756,472 | |
Hyosung Corp. | | | 18,800 | | | | 2,057,735 | |
Hyundai Department Store Co., Ltd. | | | 5,600 | | | | 630,007 | |
Hyundai Development Co. Engineering & Construction | | | 26,580 | | | | 922,130 | |
Hyundai Engineering & Construction Co., Ltd. | | | 26,794 | | | | 783,907 | |
Hyundai Glovis Co., Ltd. | | | 11,450 | | | | 1,715,147 | |
Hyundai Heavy Industries Co., Ltd.(1) | | | 2,393 | | | | 221,555 | |
Hyundai Marine & Fire Insurance Co., Ltd. | | | 14,350 | | | | 365,918 | |
Hyundai Mobis Co., Ltd. | | | 12,626 | | | | 2,777,760 | |
Hyundai Motor Co. | | | 33,990 | | | | 4,020,724 | |
Hyundai Motor Co., Second PFC Shares | | | 3,773 | | | | 316,888 | |
Hyundai Securities Co., Ltd. | | | 48,800 | | | | 267,061 | |
Hyundai Steel Co. | | | 49,615 | | | | 1,996,350 | |
Hyundai Wia Corp. | | | 6,700 | | | | 522,323 | |
InBody Co., Ltd. | | | 11,574 | | | | 412,535 | |
Industrial Bank of Korea | | | 71,500 | | | | 696,660 | |
Kangwon Land, Inc. | | | 36,658 | | | | 1,330,137 | |
KB Financial Group, Inc. | | | 72,400 | | | | 2,058,762 | |
KB Financial Group, Inc. ADR | | | 7,488 | | | | 213,108 | |
KB Insurance Co., Ltd. | | | 23,590 | | | | 574,920 | |
KCC Corp. | | | 1,710 | | | | 568,773 | |
Kia Motors Corp. | | | 64,887 | | | | 2,444,903 | |
KIWOOM Securities Co., Ltd. | | | 8,011 | | | | 501,306 | |
Korea Electric Power Corp. | | | 262,607 | | | | 13,784,759 | |
Korea Gas Corp. | | | 15,047 | | | | 523,144 | |
Korea Investment Holdings Co., Ltd. | | | 10,700 | | | | 394,477 | |
Korea Zinc Co., Ltd. | | | 5,700 | | | | 2,527,660 | |
Korean Air Lines Co., Ltd.(1) | | | 18,577 | | | | 420,206 | |
Korean Reinsurance Co. | | | 52,474 | | | | 558,259 | |
KT Corp. | | | 87,949 | | | | 2,271,461 | |
KT&G Corp. | | | 49,980 | | | | 5,919,380 | |
Kumho Petrochemical Co., Ltd. | | | 4,900 | | | | 256,015 | |
LG Chem, Ltd. | | | 16,004 | | | | 3,654,812 | |
| | | | | | | | |
| Security | | Shares | | | Value | |
| | | | | | | | |
|
South Korea (continued) | |
LG Corp. | | | 45,183 | | | $ | 2,512,708 | |
LG Display Co., Ltd. | | | 33,200 | | | | 768,697 | |
LG Electronics, Inc. | | | 9,019 | | | | 424,765 | |
LG Hausys, Ltd. | | | 4,611 | | | | 514,541 | |
LG Household & Health Care, Ltd. | | | 3,800 | | | | 3,710,908 | |
LG Life Sciences, Ltd.(1) | | | 28,600 | | | | 1,803,175 | |
LG Uplus Corp. | | | 278,220 | | | | 2,642,440 | |
Lotte Chemical Corp. | | | 10,200 | | | | 2,538,652 | |
LOTTE Fine Chemical Co., Ltd. | | | 10,800 | | | | 293,771 | |
Lotte Shopping Co., Ltd. | | | 4,500 | | | | 795,970 | |
LS Corp. | | | 7,030 | | | | 345,429 | |
LS Industrial Systems Co., Ltd. | | | 4,500 | | | | 186,870 | |
Macrogen, Inc.(1) | | | 13,950 | | | | 478,094 | |
Medy-Tox, Inc. | | | 5,201 | | | | 1,967,101 | |
Mirae Asset Daewoo Co., Ltd. | | | 58,559 | | | | 400,453 | |
Mirae Asset Securities Co., Ltd. | | | 20,190 | | | | 408,179 | |
Naver Corp. | | | 3,131 | | | | 1,939,703 | |
NCsoft Corp. | | | 5,300 | | | | 1,091,341 | |
NH Investment & Securities Co., Ltd. | | | 51,222 | | | | 411,012 | |
Nong Shim Co., Ltd. | | | 1,100 | | | | 357,407 | |
OCI Co., Ltd.(1) | | | 1,020 | | | | 80,858 | |
ORION Corp. | | | 1,200 | | | | 984,989 | |
Osstem Implant Co., Ltd.(1) | | | 12,166 | | | | 828,694 | |
POSCO | | | 23,524 | | | | 4,167,288 | |
Posco Daewoo Corp. | | | 10,502 | | | | 230,688 | |
S-Oil Corp. | | | 24,372 | | | | 1,615,111 | |
S1 Corp. | | | 10,130 | | | | 949,744 | |
Samsung C&T Corp. | | | 21,421 | | | | 2,306,147 | |
Samsung Card Co., Ltd. | | | 10,660 | | | | 386,297 | |
Samsung Electro-Mechanics Co., Ltd. | | | 16,480 | | | | 722,089 | |
Samsung Electronics Co., Ltd. | | | 11,354 | | | | 14,139,717 | |
Samsung Fire & Marine Insurance Co., Ltd. | | | 8,763 | | | | 2,012,684 | |
Samsung Heavy Industries Co., Ltd.(1) | | | 9,500 | | | | 76,469 | |
Samsung Life Insurance Co., Ltd. | | | 23,664 | | | | 2,070,849 | |
Samsung SDI Co., Ltd. | | | 7,925 | | | | 750,334 | |
Samsung Securities Co., Ltd. | | | 14,212 | | | | 441,005 | |
Seegene, Inc.(1) | | | 19,291 | | | | 560,319 | |
Shinhan Financial Group Co., Ltd. | | | 102,298 | | | | 3,362,433 | |
Shinsegae Co., Ltd. | | | 2,179 | | | | 370,802 | |
SK Chemicals Co., Ltd. | | | 12,100 | | | | 767,203 | |
SK Holdings Co., Ltd. | | | 6,366 | | | | 1,125,184 | |
SK Hynix, Inc. | | | 58,370 | | | | 1,661,034 | |
SK Innovation Co., Ltd. | | | 67,596 | | | | 8,328,785 | |
SK Telecom Co., Ltd. | | | 33,743 | | | | 6,339,188 | |
SK Telecom Co., Ltd. ADR | | | 19,826 | | | | 414,760 | |
ViroMed Co., Ltd.(1) | | | 12,347 | | | | 1,536,409 | |
| | | | |
| | 21 | | See Notes to Financial Statements. |
Parametric Tax-Managed Emerging Markets Fund
June 30, 2016
Portfolio of Investments — continued
| | | | | | | | |
| Security | | Shares | | | Value | |
| | | | | | | | |
|
South Korea (continued) | |
Woori Bank | | | 20,809 | | | $ | 173,014 | |
Yuhan Corp. | | | 6,770 | | | | 1,809,137 | |
Zyle Daewoo Motor Sales Corp.(1) | | | 4,895 | | | | 5,525 | |
| | | | | | | | | |
| | | $ | 174,583,619 | |
| | | | | | | | | |
|
Sri Lanka — 0.6% | |
Access Engineering PLC | | | 2,960,807 | | | $ | 446,214 | |
Aitken Spence PLC | | | 867,213 | | | | 416,619 | |
Ceylon Tobacco Co. PLC | | | 45,991 | | | | 330,921 | |
Chevron Lubricants Lanka PLC | | | 1,378,614 | | | | 1,411,688 | |
Commercial Bank of Ceylon PLC | | | 2,187,842 | | | | 1,828,881 | |
DFCC Bank PLC | | | 648,984 | | | | 564,302 | |
Dialog Axiata PLC | | | 15,786,381 | | | | 1,150,089 | |
Distilleries Co. of Sri Lanka PLC | | | 1,514,334 | | | | 2,157,661 | |
Hatton National Bank PLC | | | 1,062,432 | | | | 1,548,150 | |
John Keells Holdings PLC | | | 5,326,568 | | | | 4,944,877 | |
National Development Bank PLC | | | 873,545 | | | | 1,018,767 | |
Nations Trust Bank PLC | | | 934,186 | | | | 488,354 | |
Sampath Bank PLC | | | 691,913 | | | | 1,083,059 | |
| | | | | | | | | |
| | | $ | 17,389,582 | |
| | | | | | | | | |
|
Taiwan — 6.2% | |
Acer, Inc.(1) | | | 948,490 | | | $ | 448,045 | |
Advanced Semiconductor Engineering, Inc. | | | 1,298,281 | | | | 1,477,048 | |
Advantech Co., Ltd. | | | 205,428 | | | | 1,566,443 | |
Altek Corp. | | | 206,437 | | | | 138,606 | |
Ambassador Hotel | | | 221,000 | | | | 184,671 | |
AmTRAN Technology Co., Ltd. | | | 376,765 | | | | 236,312 | |
Asia Cement Corp. | | | 1,183,967 | | | | 1,029,204 | |
Asia Optical Co., Inc.(1) | | | 187,913 | | | | 155,272 | |
Asustek Computer, Inc. | | | 216,174 | | | | 1,789,239 | |
AU Optronics Corp. | | | 3,013,925 | | | | 1,043,383 | |
AU Optronics Corp. ADR | | | 33,754 | | | | 117,801 | |
Capital Securities Corp. | | | 605,143 | | | | 154,980 | |
Catcher Technology Co., Ltd. | | | 215,100 | | | | 1,603,824 | |
Cathay Financial Holding Co., Ltd. | | | 2,111,019 | | | | 2,313,834 | |
Cathay Real Estate Development Co., Ltd. | | | 660,000 | | | | 298,970 | |
Chang Hwa Commercial Bank, Ltd. | | | 1,864,579 | | | | 973,583 | |
Cheng Shin Rubber Industry Co., Ltd. | | | 1,781,251 | | | | 3,755,641 | |
Cheng Uei Precision Industry Co., Ltd. | | | 149,516 | | | | 195,593 | |
Chicony Electronics Co., Ltd. | | | 158,924 | | | | 359,659 | |
China Airlines, Ltd.(1) | | | 940,963 | | | | 283,211 | |
China Development Financial Holding Corp. | | | 5,090,106 | | | | 1,234,581 | |
China Life Insurance Co., Ltd. | | | 945,913 | | | | 736,371 | |
China Motor Corp. | | | 1,026,930 | | | | 778,999 | |
| | | | | | | | |
| Security | | Shares | | | Value | |
| | | | | | | | |
|
Taiwan (continued) | |
China Petrochemical Development Corp.(1) | | | 1,522,857 | | | $ | 343,051 | |
China Steel Corp. | | | 6,433,886 | | | | 4,192,166 | |
Chipbond Technology Corp. | | | 240,000 | | | | 308,376 | |
Chong Hong Construction Co., Ltd. | | | 165,761 | | | | 328,009 | |
Chunghwa Telecom Co., Ltd. | | | 2,476,909 | | | | 8,958,148 | |
Clevo Co. | | | 206,579 | | | | 174,785 | |
Compal Electronics, Inc. | | | 1,488,557 | | | | 941,670 | |
Coretronic Corp. | | | 211,734 | | | | 194,427 | |
CTBC Financial Holding Co., Ltd. | | | 5,688,216 | | | | 2,991,791 | |
Delta Electronics, Inc. | | | 434,356 | | | | 2,119,362 | |
E.Sun Financial Holding Co., Ltd. | | | 2,254,674 | | | | 1,335,683 | |
Elan Microelectronics Corp. | | | 142,410 | | | | 159,187 | |
Epistar Corp. | | | 321,439 | | | | 229,322 | |
Eternal Materials Co., Ltd. | | | 320,232 | | | | 331,373 | |
EVA Airways Corp.(1) | | | 1,684,216 | | | | 768,978 | |
Evergreen Marine Corp. | | | 1,171,314 | | | | 436,153 | |
Everlight Chemical Industrial Corp. | | | 361,004 | | | | 239,056 | |
Everlight Electronics Co., Ltd. | | | 103,212 | | | | 168,600 | |
Far Eastern Department Stores, Ltd. | | | 1,496,944 | | | | 809,030 | |
Far Eastern International Bank | | | 993,739 | | | | 282,279 | |
Far Eastern New Century Corp. | | | 2,069,313 | | | | 1,548,558 | |
Far EasTone Telecommunications Co., Ltd. | | | 1,199,364 | | | | 2,904,135 | |
Faraday Technology Corp. | | | 262,329 | | | | 276,727 | |
Feng Hsin Steel Co., Ltd. | | | 172,000 | | | | 217,434 | |
FIH Mobile, Ltd. | | | 1,168,000 | | | | 379,467 | |
First Financial Holding Co., Ltd. | | | 3,328,566 | | | | 1,750,323 | |
Formosa Chemicals & Fibre Corp. | | | 1,780,214 | | | | 4,494,532 | |
Formosa International Hotels Corp. | | | 40,132 | | | | 229,327 | |
Formosa Petrochemical Corp. | | | 985,153 | | | | 2,686,048 | |
Formosa Plastics Corp. | | | 2,620,853 | | | | 6,355,858 | |
Formosa Taffeta Co., Ltd. | | | 545,000 | | | | 527,727 | |
Formosan Rubber Group, Inc. | | | 450,000 | | | | 211,424 | |
Foxconn Technology Co., Ltd. | | | 336,853 | | | | 795,715 | |
Fubon Financial Holding Co., Ltd. | | | 1,538,833 | | | | 1,814,330 | |
Giant Manufacturing Co., Ltd. | | | 228,093 | | | | 1,422,866 | |
Gintech Energy Corp.(1) | | | 286,877 | | | | 234,998 | |
Goldsun Building Materials Co., Ltd. | | | 617,053 | | | | 157,982 | |
Great Wall Enterprise Co., Ltd. | | | 321,362 | | | | 293,336 | |
Highwealth Construction Corp. | | | 325,556 | | | | 538,594 | |
Hiwin Technologies Corp. | | | 181,280 | | | | 843,091 | |
Hon Hai Precision Industry Co., Ltd. | | | 2,686,942 | | | | 6,922,326 | |
Hotai Motor Co., Ltd. | | | 98,000 | | | | 965,849 | |
HTC Corp. | | | 246,311 | | | | 797,389 | |
Hua Nan Financial Holdings Co., Ltd. | | | 2,672,442 | | | | 1,388,710 | |
Huaku Development Co., Ltd. | | | 187,010 | | | | 320,109 | |
Innolux Corp. | | | 2,855,987 | | | | 964,997 | |
| | | | |
| | 22 | | See Notes to Financial Statements. |
Parametric Tax-Managed Emerging Markets Fund
June 30, 2016
Portfolio of Investments — continued
| | | | | | | | |
| Security | | Shares | | | Value | |
| | | | | | | | |
|
Taiwan (continued) | |
Inotera Memories, Inc.(1) | | | 559,619 | | | $ | 438,260 | |
Inventec Corp. | | | 1,330,753 | | | | 951,501 | |
King Yuan Electronics Co., Ltd. | | | 711,274 | | | | 633,490 | |
Kinsus Interconnect Technology Corp. | | | 166,280 | | | | 365,952 | |
Largan Precision Co., Ltd. | | | 21,042 | | | | 1,946,031 | |
LCY Chemical Corp.(1) | | | 253,644 | | | | 320,451 | |
Lite-On Technology Corp. | | | 747,776 | | | | 1,029,904 | |
Macronix International Corp., Ltd.(1) | | | 1,015,868 | | | | 89,777 | |
MediaTek, Inc. | | | 378,371 | | | | 2,891,341 | |
Mega Financial Holding Co., Ltd. | | | 3,731,240 | | | | 2,822,202 | |
Merida Industry Co., Ltd. | | | 435,907 | | | | 1,845,633 | |
Mitac Holdings Corp. | | | 313,036 | | | | 232,043 | |
Nan Kang Rubber Tire Co., Ltd.(1) | | | 889,819 | | | | 774,061 | |
Nan Ya Plastics Corp. | | | 3,006,303 | | | | 5,727,077 | |
Nanya Technology Corp. | | | 311,276 | | | | 383,145 | |
Novatek Microelectronics Corp., Ltd. | | | 263,479 | | | | 987,489 | |
Oriental Union Chemical Corp. | | | 453,200 | | | | 276,401 | |
Pegatron Corp. | | | 553,486 | | | | 1,175,564 | |
Phison Electronics Corp. | | | 43,692 | | | | 378,710 | |
Pou Chen Corp. | | | 2,168,764 | | | | 2,919,180 | |
Powertech Technology, Inc. | | | 366,725 | | | | 818,817 | |
President Chain Store Corp. | | | 619,120 | | | | 4,837,403 | |
Quanta Computer, Inc. | | | 905,065 | | | | 1,724,675 | |
Radiant Opto-Electronics Corp. | | | 206,350 | | | | 325,539 | |
Radium Life Tech Co., Ltd. | | | 342,068 | | | | 110,837 | |
Realtek Semiconductor Corp. | | | 165,542 | | | | 516,305 | |
Ruentex Development Co., Ltd. | | | 338,533 | | | | 395,986 | |
Ruentex Industries, Ltd. | | | 1,161,953 | | | | 1,754,010 | |
Sanyang Motor Co., Ltd.(1) | | | 1,509,000 | | | | 971,083 | |
Shin Kong Financial Holding Co., Ltd. | | | 3,270,375 | | | | 643,758 | |
Shin Kong Synthetic Fibers Corp. | | | 965,996 | | | | 258,501 | |
Siliconware Precision Industries Co., Ltd. | | | 613,260 | | | | 935,202 | |
Simplo Technology Co., Ltd. | | | 123,820 | | | | 435,788 | |
Sino-American Silicon Products, Inc. | | | 183,259 | | | | 206,839 | |
SinoPac Financial Holdings Co., Ltd. | | | 3,988,310 | | | | 1,183,615 | |
Solar Applied Materials Technology Corp.(2) | | | 329,817 | | | | 71,568 | |
Synnex Technology International Corp. | | | 651,960 | | | | 707,338 | |
Tainan Spinning Co., Ltd. | | | 1,445,010 | | | | 553,521 | |
Taishin Financial Holding Co., Ltd. | | | 3,522,983 | | | | 1,362,052 | |
Taiwan Business Bank(1) | | | 1,852,887 | | | | 471,831 | |
Taiwan Cement Corp. | | | 1,724,118 | | | | 1,724,442 | |
Taiwan Cooperative Financial Holding Co., Ltd. | | | 2,311,878 | | | | 1,021,799 | |
Taiwan Fertilizer Co., Ltd. | | | 436,000 | | | | 582,073 | |
Taiwan Glass Industry Corp.(1) | | | 252,874 | | | | 108,503 | |
Taiwan Mobile Co., Ltd. | | | 1,170,052 | | | | 4,089,615 | |
Taiwan Semiconductor Manufacturing Co., Ltd. | | | 3,595,873 | | | | 18,122,108 | |
| | | | | | | | |
| Security | | Shares | | | Value | |
| | | | | | | | |
|
Taiwan (continued) | |
Taiwan Tea Corp. | | | 661,346 | | | $ | 307,082 | |
Tatung Co., Ltd.(1) | | | 1,214,645 | | | | 193,374 | |
Teco Electric & Machinery Co., Ltd. | | | 1,226,000 | | | | 1,036,775 | |
Tong Yang Industry Co., Ltd. | | | 379,826 | | | | 565,992 | |
TPK Holding Co., Ltd. | | | 83,515 | | | | 163,106 | |
Transcend Information, Inc. | | | 63,886 | | | | 194,287 | |
Tripod Technology Corp. | | | 152,979 | | | | 298,101 | |
TSRC Corp. | | | 381,087 | | | | 351,532 | |
TTY Biopharm Co., Ltd. | | | 307,255 | | | | 1,090,993 | |
Tung Ho Steel Enterprise Corp. | | | 293,385 | | | | 173,976 | |
U-Ming Marine Transport Corp. | | | 202,000 | | | | 156,472 | |
Uni-President Enterprises Corp. | | | 3,855,626 | | | | 7,615,020 | |
Unimicron Technology Corp. | | | 527,171 | | | | 232,511 | |
United Microelectronics Corp. | | | 3,348,361 | | | | 1,313,165 | |
United Microelectronics Corp. ADR | | | 93,397 | | | | 185,860 | |
Vanguard International Semiconductor Corp. | | | 784,175 | | | | 1,296,203 | |
Walsin Lihwa Corp.(1) | | | 1,085,980 | | | | 296,116 | |
Wan Hai Lines, Ltd. | | | 606,375 | | | | 336,459 | |
Waterland Financial Holdings | | | 1,579,440 | | | | 390,935 | |
Wintek Corp.(1)(2) | | | 706,482 | | | | 0 | |
Wistron Corp. | | | 908,693 | | | | 635,663 | |
WPG Holdings Co., Ltd. | | | 548,136 | | | | 640,173 | |
Yageo Corp. | | | 212,433 | | | | 353,408 | |
Yang Ming Marine Transport(1) | | | 1,116,288 | | | | 273,155 | |
YFY, Inc. | | | 1,451,414 | | | | 438,460 | |
Yieh Phui Enterprise | | | 1,004,233 | | | | 247,079 | |
Yuanta Financial Holding Co., Ltd. | | | 4,019,729 | | | | 1,305,272 | |
Yulon Motor Co., Ltd. | | | 1,212,420 | | | | 1,034,895 | |
| | | | | | | | | |
| | | $ | 176,476,052 | |
| | | | | | | | | |
|
Thailand — 3.0% | |
Advanced Info Service PCL(6) | | | 809,800 | | | $ | 3,648,434 | |
Airports of Thailand PCL(6) | | | 346,800 | | | | 3,856,222 | |
AP Thailand PCL(6) | | | 4,609,660 | | | | 966,625 | |
Bangkok Bank PCL(6) | | | 198,400 | | | | 898,295 | |
Bangkok Dusit Medical Services PCL(6) | | | 6,953,300 | | | | 4,739,598 | |
Bangkok Expressway & Metro PCL(6) | | | 7,754,354 | | | | 1,525,154 | |
Banpu PCL(6) | | | 2,037,000 | | | | 856,243 | |
BEC World PCL(6) | | | 1,693,300 | | | | 1,101,827 | |
Berli Jucker PCL(6) | | | 1,150,000 | | | | 1,336,583 | |
Bumrungrad Hospital PCL(6) | | | 676,700 | | | | 3,523,397 | |
Cal-Comp Electronics (Thailand) PCL(6) | | | 1,957,091 | | | | 149,414 | |
Central Pattana PCL(6) | | | 538,000 | | | | 916,722 | |
Charoen Pokphand Foods PCL(6) | | | 2,464,100 | | | | 2,019,990 | |
CP ALL PCL(6) | | | 2,539,200 | | | | 3,642,327 | |
Delta Electronics (Thailand) PCL(6) | | | 1,516,370 | | | | 2,954,686 | |
| | | | |
| | 23 | | See Notes to Financial Statements. |
Parametric Tax-Managed Emerging Markets Fund
June 30, 2016
Portfolio of Investments — continued
| | | | | | | | |
| Security | | Shares | | | Value | |
| | | | | | | | |
|
Thailand (continued) | |
Electricity Generating PCL(6) | | | 382,000 | | | $ | 2,040,175 | |
Glow Energy PCL(6) | | | 803,700 | | | | 1,965,776 | |
Hana Microelectronics PCL(6) | | | 1,416,900 | | | | 1,194,275 | |
Home Product Center PCL(6) | | | 1,565,760 | | | | 442,640 | |
Indorama Ventures PCL(6) | | | 1,721,800 | | | | 1,428,804 | |
Intouch Holdings PCL(6) | | | 1,520,200 | | | | 2,353,064 | |
IRPC PCL(6) | | | 9,870,200 | | | | 1,342,024 | |
Italian-Thai Development PCL(1)(6) | | | 4,014,629 | | | | 761,997 | |
Kasikornbank PCL(6) | | | 364,900 | | | | 1,771,937 | |
KCE Electronics PCL(6) | | | 328,300 | | | | 780,605 | |
Kiatnakin Bank PCL(6) | | | 555,000 | | | | 688,439 | |
Krung Thai Bank PCL(6) | | | 1,610,225 | | | | 750,055 | |
Land & Houses PCL(6) | | | 896,600 | | | | 231,317 | |
Major Cineplex Group PCL(6) | | | 1,728,400 | | | | 1,628,076 | |
Minor International PCL(6) | | | 3,179,761 | | | | 3,654,849 | |
Precious Shipping PCL(1)(6) | | | 933,750 | | | | 169,330 | |
PTT Exploration & Production PCL(6) | | | 1,033,716 | | | | 2,482,653 | |
PTT Global Chemical PCL(6) | | | 1,519,650 | | | | 2,579,269 | |
PTT PCL(6) | | | 550,700 | | | | 4,939,096 | |
Quality House PCL(6) | | | 9,121,583 | | | | 693,333 | |
Ratchaburi Electricity Generating Holding
PCL(6) | | | 578,300 | | | | 841,053 | |
Samart Corp. PCL(6) | | | 718,600 | | | | 347,213 | |
Siam Cement PCL(6) | | | 285,200 | | | | 3,874,559 | |
Siam City Cement PCL(6) | | | 64,900 | | | | 547,475 | |
Siam Commercial Bank PCL(6) | | | 439,500 | | | | 1,747,227 | |
Sino Thai Engineering & Construction PCL(6) | | | 1,387,400 | | | | 942,812 | |
Superblock PCL(1)(6) | | | 8,463,500 | | | | 436,787 | |
SVI PCL(6) | | | 1,450,800 | | | | 213,123 | |
Thai Airways International PCL(1)(6) | | | 1,290,500 | | | | 887,952 | |
Thai Beverage PCL | | | 5,055,800 | | | | 3,428,291 | |
Thai Oil PCL(6) | | | 812,500 | | | | 1,392,832 | |
Thai Union Group PCL(6) | | | 2,183,692 | | | | 1,371,288 | |
Thanachart Capital PCL(6) | | | 460,200 | | | | 459,392 | |
Thoresen Thai Agencies PCL(6) | | | 2,257,887 | | | | 583,731 | |
TMB Bank PCL(6) | | | 5,321,200 | | | | 328,424 | |
Total Access Communication PCL(6) | | | 790,500 | | | | 727,524 | |
TPI Polene PCL(6) | | | 19,506,000 | | | | 1,248,424 | |
True Corp. PCL(6) | | | 7,849,382 | | | | 1,611,420 | |
TTCL PCL(6) | | | 254,300 | | | | 159,024 | |
TTW PCL(6) | | | 4,040,000 | | | | 1,287,097 | |
| | | | | | | | | |
| | | $ | 86,468,879 | |
| | | | | | | | | |
|
Turkey — 3.1% | |
Akbank TAS | | | 1,569,418 | | | $ | 4,498,136 | |
Akcansa Cimento AS | | | 90,700 | | | | 430,557 | |
Akenerji Elektrik Uretim AS(1) | | | 524,095 | | | | 173,269 | |
| | | | | | | | |
| Security | | Shares | | | Value | |
| | | | | | | | |
|
Turkey (continued) | |
Aksa Akrilik Kimya Sanayii AS | | | 228,054 | | | $ | 610,028 | |
Alarko Holding AS | | | 207,704 | | | | 239,291 | |
Anadolu Anonim Turk Sigorta Sirketi(1) | | | 368,571 | | | | 220,147 | |
Anadolu Efes Biracilik ve Malt Sanayii AS | | | 284,148 | | | | 1,923,417 | |
Arcelik AS | | | 627,359 | | | | 4,130,759 | |
Asya Katilim Bankasi AS(1) | | | 621,338 | | | | 170,218 | |
Aygaz AS | | | 177,606 | | | | 690,160 | |
Bagfas Bandirma Gubre Fabrikalari AS(1) | | | 38,600 | | | | 158,470 | |
BIM Birlesik Magazalar AS | | | 318,192 | | | | 6,205,476 | |
Cimsa Cimento Sanayi ve Ticaret AS | | | 116,200 | | | | 611,850 | |
Coca-Cola Icecek AS | | | 112,100 | | | | 1,369,360 | |
Dogan Sirketler Grubu Holding AS(1) | | | 2,165,468 | | | | 346,330 | |
Dogus Otomotiv Servis ve Ticaret AS | | | 140,556 | | | | 518,877 | |
Eczacibasi Ilac Sanayi ve Ticaret AS | | | 588,300 | | | | 683,946 | |
Enka Insaat ve Sanayi AS | | | 1,750,953 | | | | 2,678,170 | |
Eregli Demir ve Celik Fabrikalari TAS | | | 4,238,583 | | | | 5,995,860 | |
Ford Otomotiv Sanayi AS | | | 189,160 | | | | 2,013,263 | |
Gubre Fabrikalari TAS | | | 386,800 | | | | 766,643 | |
Haci Omer Sabanci Holding AS | | | 1,118,249 | | | | 3,669,886 | |
Ihlas Holding AS(1) | | | 3,341,600 | | | | 372,859 | |
Is Gayrimenkul Yatirim Ortakligi AS | | | 579,695 | | | | 339,213 | |
Kardemir Karabuk Demir Celik Sanayi ve Ticaret AS, Class D | | | 3,600,406 | | | | 1,607,547 | |
KOC Holding AS | | | 1,097,419 | | | | 5,018,770 | |
Koza Altin Isletmeleri AS(1) | | | 122,800 | | | | 544,492 | |
Net Holding AS(1) | | | 282,129 | | | | 288,859 | |
Petkim Petrokimya Holding AS | | | 1,788,061 | | | | 2,389,211 | |
Sekerbank TAS(1) | | | 673,641 | | | | 307,240 | |
Selcuk Ecza Deposu Ticaret ve Sanayi AS | | | 243,000 | | | | 232,749 | |
TAV Havalimanlari Holding AS | | | 212,009 | | | | 910,493 | |
Tekfen Holding AS | | | 409,091 | | | | 1,049,928 | |
Tofas Turk Otomobil Fabrikasi AS | | | 299,386 | | | | 2,461,668 | |
Trakya Cam Sanayii AS | | | 647,826 | | | | 514,566 | |
Tupras-Turkiye Petrol Rafinerileri AS | | | 290,241 | | | | 6,443,300 | |
Turcas Petrol AS | | | 420,874 | | | | 213,870 | |
Turk Hava Yollari AO(1) | | | 748,507 | | | | 1,491,064 | |
Turk Sise ve Cam Fabrikalari AS | | | 1,592,838 | | | | 1,969,445 | |
Turk Telekomunikasyon AS | | | 1,057,800 | | | | 2,229,659 | |
Turkcell Iletisim Hizmetleri AS(1) | | | 1,653,794 | | | | 6,080,187 | |
Turkcell Iletisim Hizmetleri AS ADR(1) | | | 38,494 | | | | 352,220 | |
Turkiye Garanti Bankasi AS | | | 1,812,125 | | | | 4,786,604 | |
Turkiye Halk Bankasi AS | | | 536,500 | | | | 1,596,695 | |
Turkiye Is Bankasi, Class B | | | 1,244,619 | | | | 1,977,160 | |
Turkiye Sinai Kalkinma Bankasi AS | | | 1,719,381 | | | | 795,287 | |
Turkiye Vakiflar Bankasi TAO, Class D | | | 1,021,671 | | | | 1,604,432 | |
Ulker Biskuvi Sanayi AS | | | 204,629 | | | | 1,495,341 | |
| | | | |
| | 24 | | See Notes to Financial Statements. |
Parametric Tax-Managed Emerging Markets Fund
June 30, 2016
Portfolio of Investments — continued
| | | | | | | | |
| Security | | Shares | | | Value | |
| | | | | | | | |
|
Turkey (continued) | |
Vestel Elektronik Sanayi ve Ticaret AS(1) | | | 573,007 | | | $ | 1,290,770 | |
Yapi ve Kredi Bankasi AS(1) | | | 827,536 | | | | 1,147,327 | |
Yazicilar Holding AS | | | 107,100 | | | | 454,872 | |
| | | | | | | | | |
| | | $ | 88,069,941 | |
| | | | | | | | | |
|
Ukraine — 0.3% | |
Astarta Holding NV(1) | | | 105,037 | | | $ | 1,250,868 | |
Avangardco Investments Public, Ltd. GDR(1)(3) | | | 39,181 | | | | 34,372 | |
Ferrexpo PLC | | | 1,159,391 | | | | 502,879 | |
Kernel Holding SA | | | 234,754 | | | | 3,152,833 | |
MHP SA GDR(3) | | | 304,082 | | | | 2,805,997 | |
| | | | | | | | | |
| | | $ | 7,746,949 | |
| | | | | | | | | |
|
United Arab Emirates — 1.4% | |
Abu Dhabi Commercial Bank PJSC | | | 2,035,444 | | | $ | 3,365,890 | |
Abu Dhabi National Hotels | | | 832,200 | | | | 734,104 | |
Agthia Group PJSC | | | 623,000 | | | | 1,313,248 | |
Air Arabia PJSC | | | 6,041,100 | | | | 2,161,232 | |
Ajman Bank PJSC(1) | | | 677,245 | | | | 307,364 | |
Al Waha Capital PJSC | | | 1,401,285 | | | | 753,464 | |
Aldar Properties PJSC | | | 3,816,500 | | | | 2,813,916 | |
Arabtec Holding PJSC(1) | | | 7,431,105 | | | | 2,774,988 | |
Dana Gas PJSC(1) | | | 3,612,782 | | | | 544,243 | |
DP World, Ltd. | | | 416,236 | | | | 6,918,599 | |
Dubai Financial Market PJSC | | | 1,713,500 | | | | 591,856 | |
Dubai Investments PJSC | | | 1,313,593 | | | | 735,608 | |
Dubai Islamic Bank PJSC | | | 1,037,500 | | | | 1,449,859 | |
Emaar Properties PJSC | | | 3,506,022 | | | | 5,963,414 | |
First Gulf Bank PJSC | | | 1,231,388 | | | | 4,233,264 | |
National Bank of Abu Dhabi PJSC | | | 1,606,429 | | | | 4,234,493 | |
National Bank of Ras Al-Khaimah PSC (The) | | | 62,608 | | | | 88,770 | |
National Central Cooling Co. (Tabreed) | | | 1,050,547 | | | | 401,329 | |
Ras Al Khaimah Properties PJSC | | | 1,262,100 | | | | 207,540 | |
Ras Al Khaimah White Cement | | | 732,778 | | | | 243,338 | |
Union National Bank PJSC | | | 1,180,087 | | | | 1,319,473 | |
| | | | | | | | | |
| | | $ | 41,155,992 | |
| | | | | | | | | |
|
Vietnam — 0.8% | |
Bank for Foreign Trade of Vietnam JSC | | | 1,013,311 | | | $ | 2,155,642 | |
Bao Viet Holdings | | | 371,340 | | | | 987,450 | |
Danang Rubber JSC | | | 463,076 | | | | 818,550 | |
Development Investment Construction Corp.(1) | | | 589,411 | | | | 220,259 | |
FPT Corp. | | | 2 | | | | 4 | |
Gemadept Corp. | | | 972,649 | | | | 1,176,104 | |
HAGL JSC(1) | | | 1,153,680 | | | | 379,845 | |
| | | | | | | | |
| Security | | Shares | | | Value | |
| | | | | | | | |
|
Vietnam (continued) | |
Hoa Phat Group JSC | | | 1,459,005 | | | $ | 2,593,277 | |
KIDO Group Corp. | | | 387,216 | | | | 487,872 | |
Kim Long Securities Corp.(1) | | | 1,311,300 | | | | 637,051 | |
Kinh Bac City Development Share Holding Corp.(1) | | | 590,200 | | | | 410,918 | |
Masan Group Corp.(1) | | | 456,400 | | | | 1,362,167 | |
PetroVietnam Construction JSC(1) | | | 870,460 | | | | 86,327 | |
PetroVietnam Drilling & Well Services JSC | | | 749,107 | | | | 1,049,804 | |
PetroVietnam Fertilizer & Chemical JSC | | | 342,540 | | | | 426,057 | |
PetroVietnam Gas JSC | | | 69,600 | | | | 195,920 | |
Pha Lai Thermal Power JSC | | | 754,210 | | | | 488,381 | |
Refrigeration Electrical Engineering Corp. | | | 243,788 | | | | 224,689 | |
Song Da Urban & Industrial Zone Investment and Development JSC(1) | | | 339,950 | | | | 327,280 | |
Tan Tao Investment & Industry JSC(1) | | | 1,048,757 | | | | 202,913 | |
Vietnam Construction and Import-Export JSC | | | 459,600 | | | | 293,286 | |
Vietnam Dairy Products JSC | | | 537,900 | | | | 3,402,165 | |
Vietnam Joint Stock Commercial Bank for Industry and Trade | | | 1,081,023 | | | | 816,981 | |
Vingroup JSC(1) | | | 1,930,416 | | | | 4,278,646 | |
Vinh Son - Song Hinh Hydropower JSC | | | 750,120 | | | | 495,799 | |
| | | | | | | | | |
| | | $ | 23,517,387 | |
| | | | | | | | | |
| |
Total Common Stocks
(identified cost $2,687,002,045) | | | $ | 2,810,696,004 | |
| | | | | | | | | |
| | | | | | | | | | | | |
|
| Equity-Linked Securities(5)(7) — 0.7% | |
| | | |
| | | | | | | | | | | | |
| Security | | Maturity
Date | | | Shares | | | Value | |
| | | | | | | | | | | | |
|
Saudi Arabia — 0.7% | |
Abdullah Al Othaim Markets | | | 7/31/17 | | | | 14,400 | | | $ | 385,343 | |
Al Rajhi Bank | | | 1/22/18 | | | | 126,533 | | | | 1,969,195 | |
Al Tayyar | | | 3/5/18 | | | | 43,582 | | | | 416,539 | |
Alinma Bank | | | 1/22/18 | | | | 182,900 | | | | 637,553 | |
Almarai Co. | | | 7/31/17 | | | | 56,893 | | | | 832,322 | |
Arab National Bank | | | 5/12/17 | | | | 96,000 | | | | 494,592 | |
Bank Albilad | | | 3/5/18 | | | | 38,550 | | | | 185,763 | |
Banque Saudi Fransi | | | 1/22/18 | | | | 65,833 | | | | 394,458 | |
Company for Cooperative Insurance (The) | | | 7/31/17 | | | | 21,600 | | | | 520,427 | |
Dar Al Arkan Real Estate Development | | | 7/20/18 | | | | 70,500 | | | | 122,638 | |
Etihad Etisalat Co. | | | 11/20/17 | | | | 119,020 | | | | 871,006 | |
Fawaz Abdulaziz Alhokair Co. | | | 3/20/17 | | | | 53,700 | | | | 647,815 | |
Fitaihi Holding Group | | | 9/14/18 | | | | 57,200 | | | | 243,612 | |
Jarir Marketing Co. | | | 1/22/18 | | | | 17,100 | | | | 539,654 | |
Mobile Telecommunications Co. | | | 4/30/18 | | | | 47,949 | | | | 100,667 | |
| | | | |
| | 25 | | See Notes to Financial Statements. |
Parametric Tax-Managed Emerging Markets Fund
June 30, 2016
Portfolio of Investments — continued
| | | | | | | | | | | | |
| Security | | Maturity
Date | | | Shares | | | Value | |
| | | | | | | | | | | | |
|
Saudi Arabia (continued) | |
National Industrialization Co. | | | 10/31/16 | | | | 117,783 | | | $ | 410,568 | |
Rabigh Refining and Petrochemicals Co. | | | 7/24/17 | | | | 84,000 | | | | 260,333 | |
Riyad Bank | | | 11/20/17 | | | | 137,000 | | | | 399,026 | |
Sahara Petrochemical Co. | | | 9/14/18 | | | | 101,700 | | | | 286,723 | |
Samba Financial Group | | | 6/29/17 | | | | 89,776 | | | | 477,487 | |
Saudi Airlines Catering Co. | | | 5/28/18 | | | | 14,700 | | | | 385,532 | |
Saudi Arabian Fertilizer Co. | | | 7/31/17 | | | | 24,333 | | | | 385,174 | |
Saudi Arabian Mining Co. | | | 4/30/18 | | | | 45,000 | | | | 443,286 | |
Saudi Basic Industries Corp. | | | 1/22/18 | | | | 91,400 | | | | 1,982,877 | |
Saudi British Bank | | | 1/22/18 | | | | 95,300 | | | | 513,858 | |
Saudi Cable Co. | | | 7/20/18 | | | | 56,000 | | | | 99,655 | |
Saudi Cement Co. | | | 7/20/18 | | | | 20,250 | | | | 339,439 | |
Saudi Ceramic Co. | | | 3/5/18 | | | | 12,000 | | | | 128,128 | |
Saudi Chemical Co. | | | 4/23/18 | | | | 11,900 | | | | 134,832 | |
Saudi Electricity Co. | | | 1/22/18 | | | | 167,000 | | | | 878,203 | |
Saudi Industrial Investment Group | | | 10/9/17 | | | | 49,800 | | | | 178,904 | |
Saudi International Petrochemicals Co. | | | 1/22/18 | | | | 67,870 | | | | 236,126 | |
Saudi Kayan Petrochemical Co. | | | 1/22/18 | | | | 145,500 | | | | 253,104 | |
Saudi Pharmaceutical Industries and Medical Appliances Corp. | | | 2/12/18 | | | | 50,599 | | | | 499,792 | |
Saudi Telecom Co. | | | 4/23/18 | | | | 86,900 | | | | 1,485,612 | |
Savola Group | | | 2/6/17 | | | | 93,100 | | | | 905,942 | |
Yamamah Saudi Cement Co. Ltd. | | | 1/22/18 | | | | 23,300 | | | | 171,755 | |
Yanbu National Petrochemical Co. | | | 7/31/17 | | | | 29,100 | | | | 326,226 | |
| | | | | | | | | | | | | |
| |
Total Equity-Linked Securities
(identified cost $27,682,693) | | | $ | 19,544,166 | |
| | | | | | | | | | | | | |
| | | | | | | | |
| | |
| Rights(1) — 0.0%(4) | | | | | | | | |
| | |
| | | | | | | | |
| Security | | Shares | | | Value | |
| | | | | | | | |
Berli Jucker PCL, Exp. 7/21/16 | | | 1,150,000 | | | $ | 188,176 | |
Empresa Nacional de Telecomunicaciones SA, Exp. 7/22/16 | | | 88,563 | | | | 85,636 | |
Flour Mills of Nigeria PLC | | | 781,206 | | | | 0 | |
| | | | | | | | | |
| |
Total Rights
(identified cost $0) | | | $ | 273,812 | |
| | | | | | | | | |
| | | | | | | | |
|
| Warrants(1) — 0.0%(4) | |
| | |
| | | | | | | | |
| Security | | Shares | | | Value | |
| | | | | | | | |
Banpu PCL, Exp. 6/5/17, Strike THB 5.00 | | | 679,000 | | | $ | 177,769 | |
WCT Holdings Bhd, Exp. 8/27/20, Strike MYR 2.08 | | | 164,118 | | | | 6,920 | |
| | | | | | | | | |
| |
Total Warrants
(identified cost $0) | | | $ | 184,689 | |
| | | | | | | | | |
| | | | | | | | |
| Short-Term Investments — 0.1% | |
| | |
| | | | | | | | |
| Description | | Principal
Amount
(000’s omitted) | | | Value | |
| | | | | | | | |
State Street Bank and Trust Euro Time Deposit, 0.01%, 7/1/16 | | $ | 3,846 | | | $ | 3,845,793 | |
| | | | | | | | | |
| |
Total Short-Term Investments
(identified cost $3,845,793) | | | $ | 3,845,793 | |
| | | | | | | | | |
| |
Total Investments — 99.4%
(identified cost $2,718,530,531) | | | $ | 2,834,544,464 | |
| | | | | | | | | |
| |
Other Assets, Less Liabilities — 0.6% | | | $ | 16,424,809 | |
| | | | | | | | | |
| |
Net Assets — 100.0% | | | $ | 2,850,969,273 | |
| | | | | | | | | |
The percentage shown for each investment category in the Portfolio of Investments is based on net assets.
| (1) | Non-income producing security. |
| (2) | For fair value measurement disclosure purposes, security is categorized as Level 3 (see Note 8). |
| (3) | Security exempt from registration under Regulation S of the Securities Act of 1933, which exempts from registration securities offered and sold outside the United States. Security may not be offered or sold in the United States except pursuant to an exemption from, or in a transaction not subject to, the registration requirements of the Securities Act of 1933. At June 30, 2016, the aggregate value of these securities is $56,684,024 or 2.0% of the Fund’s net assets. |
| (4) | Amount is less than 0.05%. |
| (5) | Security exempt from registration pursuant to Rule 144A under the Securities Act of 1933, as amended. These securities may be sold in certain transactions in reliance on an exemption from registration (normally to qualified institutional buyers). At June 30, 2016, the aggregate value of these securities is $20,220,493 or 0.7% of the Fund’s net assets. |
| (6) | Indicates a foreign registered security. Shares issued to foreign investors in markets that have foreign ownership limits. |
| (7) | Security whose performance, including redemption at maturity, is linked to the price of the underlying equity security. The investment is subject to credit risk of the issuing financial institution (HSBC Bank plc) in addition to the market risk of the underlying security. |
| | | | |
| | 26 | | See Notes to Financial Statements. |
Parametric Tax-Managed Emerging Markets Fund
June 30, 2016
Portfolio of Investments — continued
| | | | | | | | |
| Currency Concentration of Portfolio | |
| | |
| | | | | | | | |
| Currency | | Percentage
of Net Assets | | | Value | |
United States Dollar | | | 10.4 | % | | $ | 297,956,211 | |
Hong Kong Dollar | | | 7.3 | | | | 207,434,248 | |
New Taiwan Dollar | | | 6.2 | | | | 175,792,924 | |
Brazilian Real | | | 6.1 | | | | 174,491,685 | |
South Korean Won | | | 6.1 | | | | 173,955,751 | |
South African Rand | | | 6.0 | | | | 172,696,080 | |
Mexican Peso | | | 5.8 | | | | 164,808,901 | |
Indian Rupee | | | 5.6 | | | | 158,537,656 | |
Indonesian Rupiah | | | 3.3 | | | | 93,203,910 | |
Philippine Peso | | | 3.2 | | | | 90,530,257 | |
New Turkish Lira | | | 3.1 | | | | 87,717,721 | |
Thai Baht | | | 2.9 | | | | 83,406,533 | |
Malaysian Ringgit | | | 2.8 | | | | 80,582,623 | |
Polish Zloty | | | 2.8 | | | | 78,631,940 | |
Euro | | | 2.5 | | | | 70,096,916 | |
Chilean Peso | | | 2.3 | | | | 66,937,038 | |
Russian Ruble | | | 2.0 | | | | 57,948,464 | |
Kuwaiti Dinar | | | 1.8 | | | | 52,186,861 | |
Pakistani Rupee | | | 1.5 | | | | 43,127,015 | |
United Arab Emirates Dirham | | | 1.5 | | | | 41,863,774 | |
Qatari Riyal | | | 1.3 | | | | 37,476,409 | |
Colombian Peso | | | 1.3 | | | | 36,422,758 | |
Egyptian Pound | | | 1.2 | | | | 35,561,430 | |
Czech Koruna | | | 1.2 | | | | 33,787,999 | |
Hungarian Forint | | | 1.1 | | | | 30,551,196 | |
Other currency, less than 1% each | | | 10.1 | | | | 288,838,164 | |
| | | | | | | | | |
Total Investments | | | 99.4 | % | | $ | 2,834,544,464 | |
| | | | | | | | | |
| | | | | | | | |
| Sector Classification of Portfolio | |
| | |
| | | | | | | | |
| Sector | | Percentage
of Net Assets | | | Value | |
Financials | | | 22.0 | % | | $ | 627,118,156 | |
Consumer Staples | | | 10.8 | | | | 307,760,874 | |
Materials | | | 10.4 | | | | 297,425,101 | |
Telecommunication Services | | | 10.1 | | | | 286,761,845 | |
Consumer Discretionary | | | 9.8 | | | | 278,769,110 | |
Energy | | | 9.8 | | | | 278,430,100 | |
Industrials | | | 9.3 | | | | 265,600,196 | |
Information Technology | | | 7.1 | | | | 202,080,061 | |
Utilities | | | 6.0 | | | | 172,585,818 | |
Health Care | | | 4.0 | | | | 114,167,410 | |
Short-Term Investments | | | 0.1 | | | | 3,845,793 | |
| | | | | | | | | |
Total Investments | | | 99.4 | % | | $ | 2,834,544,464 | |
| | | | | | | | | |
Abbreviations:
| | | | |
| ADR | | – | | American Depositary Receipt |
| GDR | | – | | Global Depositary Receipt |
| PCL | | – | | Public Company Ltd. |
| PDR | | – | | Philippine Deposit Receipt |
| PFC Shares | | – | | Preference Shares |
| | |
| | | | |
| Currency Abbreviations: |
| | |
| MYR | | – | | Malaysian Ringgit |
| THB | | – | | Thai Baht |
| | | | |
| | 27 | | See Notes to Financial Statements. |
Parametric Tax-Managed Emerging Markets Fund
June 30, 2016
Statement of Assets and Liabilities
| | | | |
| Assets | | June 30, 2016 | |
Investments, at value (identified cost, $2,718,530,531) | | $ | 2,834,544,464 | |
Cash | | | 425,904 | |
Foreign currency, at value (identified cost, $4,983,980) | | | 4,566,057 | |
Dividends and interest receivable | | | 10,442,570 | |
Receivable for investments sold | | | 4,335,174 | |
Receivable for Fund shares sold | | | 701,757 | |
Tax reclaims receivable | | | 1,159,579 | |
Total assets | | $ | 2,856,175,505 | |
| |
| Liabilities | | | | |
Payable for Fund shares redeemed | | $ | 1,945,851 | |
Payable to affiliates: | | | | |
Investment adviser fee | | | 1,041,578 | |
Administration fee | | | 1,157,309 | |
Accrued foreign capital gains taxes | | | 1,054,427 | |
Accrued expenses | | | 7,067 | |
Total liabilities | | $ | 5,206,232 | |
Net Assets | | $ | 2,850,969,273 | |
| |
| Sources of Net Assets | | | | |
Paid-in capital | | $ | 2,776,958,969 | |
Accumulated net realized loss | | | (52,695,105 | ) |
Accumulated undistributed net investment income | | | 12,264,746 | |
Net unrealized appreciation | | | 114,440,663 | |
Total | | $ | 2,850,969,273 | |
| |
| Institutional Class Shares | | | | |
Net Assets | | $ | 2,850,969,273 | |
Shares Outstanding | | | 68,921,296 | |
Net Asset Value and Offering Price Per Share* | | | | |
(net assets ÷ shares of beneficial interest outstanding) | | $ | 41.37 | |
| * | Redemption price per share is equal to the net asset value less any applicable redemption fee. |
| | | | |
| | 28 | | See Notes to Financial Statements. |
Parametric Tax-Managed Emerging Markets Fund
June 30, 2016
Statement of Operations
| | | | |
| Investment Income | | Year Ended June 30, 2016 | |
Dividends (net of foreign taxes, $10,303,599) | | $ | 86,732,201 | |
Interest | | | 609 | |
Total investment income | | $ | 86,732,810 | |
| |
| Expenses | | | | |
Investment adviser fee | | $ | 13,283,968 | |
Administration fee | | | 14,759,964 | |
Interest expense | | | 72,060 | |
Total expenses | | $ | 28,115,992 | |
| |
Net investment income | | $ | 58,616,818 | |
| |
| Realized and Unrealized Gain (Loss) | | | | |
Net realized gain (loss) — | | | | |
Investment transactions (net of foreign capital gains taxes of $295,425) | | $ | 22,038,562 | |
Foreign currency transactions | | | (3,131,010 | ) |
Net realized gain | | $ | 18,907,552 | |
Change in unrealized appreciation (depreciation) — | | | | |
Investments (including net decrease in accrued foreign capital gains taxes of $1,243,835) | | $ | (442,673,388 | ) |
Foreign currency | | | (113,546 | ) |
Net change in unrealized appreciation (depreciation) | | $ | (442,786,934 | ) |
| |
Net realized and unrealized loss | | $ | (423,879,382 | ) |
| |
Net decrease in net assets from operations | | $ | (365,262,564 | ) |
| | | | |
| | 29 | | See Notes to Financial Statements. |
Parametric Tax-Managed Emerging Markets Fund
June 30, 2016
Statements of Changes in Net Assets
| | | | | | | | |
| | | Year Ended June 30, | |
| Increase (Decrease) in Net Assets | | 2016 | | | 2015 | |
From operations — | | | | | | | | |
Net investment income | | $ | 58,616,818 | | | $ | 65,219,049 | |
Net realized gain (loss) from investment and foreign currency transactions | | | 18,907,552 | | | | (30,563,256 | ) |
Net change in unrealized appreciation (depreciation) from investments and foreign currency | | | (442,786,934 | ) | | | (441,513,321 | ) |
Net decrease in net assets from operations | | $ | (365,262,564 | ) | | $ | (406,857,528 | ) |
Distributions to shareholders — | | | | | | | | |
From net investment income | | $ | (57,084,671 | ) | | $ | (75,586,163 | ) |
Total distributions to shareholders | | $ | (57,084,671 | ) | | $ | (75,586,163 | ) |
Transactions in shares of beneficial interest — | | | | | | | | |
Proceeds from sale of shares | | $ | 306,372,745 | | | $ | 621,528,328 | |
Net asset value of shares issued to shareholders in payment of distributions declared | | | 44,659,318 | | | | 58,716,026 | |
Cost of shares redeemed | | | (787,590,641 | ) | | | (392,182,096 | ) |
Redemption fees | | | 11,906,949 | | | | 6,021,876 | |
Net increase (decrease) in net assets from Fund share transactions | | $ | (424,651,629 | ) | | $ | 294,084,134 | |
| | |
Net decrease in net assets | | $ | (846,998,864 | ) | | $ | (188,359,557 | ) |
| | |
| Net Assets | | | | | | | | |
At beginning of year | | $ | 3,697,968,137 | | | $ | 3,886,327,694 | |
At end of year | | $ | 2,850,969,273 | | | $ | 3,697,968,137 | |
| | |
Accumulated undistributed net investment income
included in net assets | | | | | | | | |
At end of year | | $ | 12,264,746 | | | $ | 11,967,730 | |
| | | | |
| | 30 | | See Notes to Financial Statements. |
Parametric Tax-Managed Emerging Markets Fund
June 30, 2016
Financial Highlights
| | | | | | | | | | | | | | | | | | | | |
| | | Institutional Class | |
| | | Year Ended June 30, | |
| | | 2016 | | | 2015 | | | 2014 | | | 2013 | | | 2012 | |
Net asset value — Beginning of year | | $ | 46.230 | | | $ | 52.430 | | | $ | 45.870 | | | $ | 44.060 | | | $ | 51.610 | |
| | | | | |
| Income (Loss) From Operations | | | | | | | | | | | | | | | | | | | | |
Net investment income(1) | | $ | 0.799 | | | $ | 0.838 | | | $ | 0.805 | | | $ | 0.941 | | | $ | 0.874 | |
Net realized and unrealized gain (loss) | | | (5.019 | ) | | | (6.134 | ) | | | 6.518 | | | | 1.724 | | | | (7.866 | ) |
| | | | | |
Total income (loss) from operations | | $ | (4.220 | ) | | $ | (5.296 | ) | | $ | 7.323 | | | $ | 2.665 | | | $ | (6.992 | ) |
| | | | | |
| Less Distributions | | | | | | | | | | | | | | | | | | | | |
From net investment income | | $ | (0.802 | ) | | $ | (0.981 | ) | | $ | (0.854 | ) | | $ | (0.941 | ) | | $ | (0.631 | ) |
| | | | | |
Total distributions | | $ | (0.802 | ) | | $ | (0.981 | ) | | $ | (0.854 | ) | | $ | (0.941 | ) | | $ | (0.631 | ) |
| | | | | |
Redemption fees(1) | | $ | 0.162 | | | $ | 0.077 | | | $ | 0.091 | | | $ | 0.086 | | | $ | 0.073 | |
| | | | | |
Net asset value — End of year | | $ | 41.370 | | | $ | 46.230 | | | $ | 52.430 | | | $ | 45.870 | | | $ | 44.060 | |
| | | | | |
Total Return(2) | | | (8.64 | )% | | | (9.93 | )% | | | 16.30 | % | | | 6.14 | % | | | (13.32 | )% |
| | | | | |
| Ratios/Supplemental Data | | | | | | | | | | | | | | | | | | | | |
Net assets, end of year (000’s omitted) | | $ | 2,850,969 | | | $ | 3,697,968 | | | $ | 3,886,328 | | | $ | 3,090,101 | | | $ | 2,648,747 | |
Ratios (as a percentage of average daily net assets): | | | | | | | | | | | | | | | | | | | | |
Expenses | | | 0.95 | % | | | 0.95 | % | | | 0.95 | % | | | 0.96 | % | | | 0.96 | % |
Net investment income | | | 1.99 | % | | | 1.71 | % | | | 1.65 | % | | | 1.98 | % | | | 1.94 | % |
Portfolio Turnover | | | 2 | % | | | 10 | % | | | 6 | % | | | 5 | % | | | 4 | % |
| (1) | Computed using average shares outstanding. |
| (2) | Returns are historical and are calculated by determining the percentage change in net asset value with all distributions reinvested. |
| | | | |
| | 31 | | See Notes to Financial Statements. |
Parametric Tax-Managed Emerging Markets Fund
June 30, 2016
Notes to Financial Statements
1 Significant Accounting Policies
Parametric Tax-Managed Emerging Markets Fund (the Fund) is a diversified series of Eaton Vance Series Trust II (the Trust). The Trust is a Massachusetts business trust registered under the Investment Company Act of 1940, as amended (the 1940 Act), as an open-end management investment company. The Fund’s investment objective is to seek long-term, after-tax returns for its shareholders. The Fund offers Institutional Class shares, which are offered at net asset value and are not subject to a sales charge but are subject to a redemption fee (see Note 1J).
The following is a summary of significant accounting policies of the Fund. The policies are in conformity with accounting principles generally accepted in the United States of America (U.S. GAAP). The Fund is an investment company and follows accounting and reporting guidance in the Financial Accounting Standards Board (“FASB”) Accounting Standards Codification Topic 946.
A Investment Valuation — The following methodologies are used to determine the market value or fair value of investments.
Equity Securities. Equity securities listed on a U.S. securities exchange generally are valued at the last sale or closing price on the day of valuation or, if no sales took place on such date, at the mean between the closing bid and asked prices therefore on the exchange where such securities are principally traded. Equity securities listed on the NASDAQ Global or Global Select Market generally are valued at the NASDAQ official closing price. Unlisted or listed securities for which closing sales prices or closing quotations are not available are valued at the mean between the latest available bid and asked prices. Equity-linked securities are generally valued based on the value of the underlying equity security or instrument.
Debt Obligations. Debt obligations (including short-term obligations with a remaining maturity of more than sixty days) are generally valued on the basis of valuations provided by third party pricing services, as derived from such services’ pricing models. Inputs to the models may include, but are not limited to, reported trades, executable bid and asked prices, broker/dealer quotations, prices or yields of securities with similar characteristics, interest rates, anticipated prepayments, benchmark curves or information pertaining to the issuer, as well as industry and economic events. The pricing services may use a matrix approach, which considers information regarding securities with similar characteristics to determine the valuation for a security. Short-term obligations purchased with a remaining maturity of sixty days or less are generally valued at amortized cost, which approximates market value.
Foreign Securities and Currencies. Foreign securities and currencies are valued in U.S. dollars, based on foreign currency exchange rate quotations supplied by a third party pricing service. The pricing service uses a proprietary model to determine the exchange rate. Inputs to the model include reported trades and implied bid/ask spreads. The daily valuation of exchange-traded foreign securities generally is determined as of the close of trading on the principal exchange on which such securities trade. Events occurring after the close of trading on foreign exchanges may result in adjustments to the valuation of foreign securities to more accurately reflect their fair value as of the close of regular trading on the New York Stock Exchange. When valuing foreign equity securities that meet certain criteria, the Fund’s Trustees have approved the use of a fair value service that values such securities to reflect market trading that occurs after the close of the applicable foreign markets of comparable securities or other instruments that have a strong correlation to the fair-valued securities.
Fair Valuation. Investments for which valuations or market quotations are not readily available or are deemed unreliable are valued at fair value using methods determined in good faith by or at the direction of the Trustees of the Fund in a manner that fairly reflects the security’s value, or the amount that the Fund might reasonably expect to receive for the security upon its current sale in the ordinary course. Each such determination is based on a consideration of relevant factors, which are likely to vary from one pricing context to another. These factors may include, but are not limited to, the type of security, the existence of any contractual restrictions on the security’s disposition, the price and extent of public trading in similar securities of the issuer or of comparable companies or entities, quotations or relevant information obtained from broker/dealers or other market participants, information obtained from the issuer, analysts, and/or the appropriate stock exchange (for exchange-traded securities), an analysis of the company’s or entity’s financial condition, and an evaluation of the forces that influence the issuer and the market(s) in which the security is purchased and sold.
B Investment Transactions — Investment transactions for financial statement purposes are accounted for on a trade date basis. Realized gains and losses on investments sold are determined on the basis of identified cost.
C Income — Dividend income is recorded on the ex-dividend date for dividends received in cash and/or securities. However, if the ex-dividend date has passed, certain dividends from foreign securities are recorded as the Fund is informed of the ex-dividend date. Withholding taxes on foreign dividends, interest and capital gains have been provided for in accordance with the Fund’s understanding of the applicable countries’ tax rules and rates. In consideration of recent decisions rendered by European courts, the Fund has filed additional tax reclaims for previously withheld taxes on dividends earned in certain European Union countries. These filings are subject to various administrative and judicial proceedings within these countries. Due to the uncertainty as to the ultimate resolution of these proceedings, the likelihood of receipt of these reclaims, and the potential timing of payment, no amounts are reflected in the financial statements for such outstanding reclaims. Interest income is recorded on the basis of interest accrued, adjusted for amortization of premium or accretion of discount.
D Federal and Other Taxes — The Fund’s policy is to comply with the provisions of the Internal Revenue Code applicable to regulated investment companies and to distribute to shareholders each year substantially all of its net investment income, and all or substantially all of its net realized capital gains. Accordingly, no provision for federal income or excise tax is necessary.
In addition to the requirements of the Internal Revenue Code, the Fund may also be subject to local taxes on the recognition of capital gains in certain countries. In determining the daily net asset value, the Fund estimates the accrual for such taxes, if any, based on the unrealized appreciation on certain
Parametric Tax-Managed Emerging Markets Fund
June 30, 2016
Notes to Financial Statements — continued
portfolio securities and the related tax rates. Taxes attributable to unrealized appreciation are included in the change in unrealized appreciation (depreciation) on investments. Capital gains taxes on securities sold are included in net realized gain (loss) on investments.
As of June 30, 2016, the Fund had no uncertain tax positions that would require financial statement recognition, de-recognition, or disclosure. The Fund files a U.S. federal income tax return annually after its fiscal year-end, which is subject to examination by the Internal Revenue Service for a period of three years from the date of filing.
E Expenses — The majority of expenses of the Trust are directly identifiable to an individual fund. Expenses which are not readily identifiable to a specific fund are allocated taking into consideration, among other things, the nature and type of expense and the relative size of the funds.
F Foreign Currency Translation — Investment valuations, other assets, and liabilities initially expressed in foreign currencies are translated each business day into U.S. dollars based upon current exchange rates. Purchases and sales of foreign investment securities and income and expenses denominated in foreign currencies are translated into U.S. dollars based upon currency exchange rates in effect on the respective dates of such transactions. Recognized gains or losses on investment transactions attributable to changes in foreign currency exchange rates are recorded for financial statement purposes as net realized gains and losses on investments. That portion of unrealized gains and losses on investments that results from fluctuations in foreign currency exchange rates is not separately disclosed.
G Equity-Linked Securities — Equity-linked securities are primarily used as an alternative means to more efficiently and effectively access the securities markets of emerging market countries and may also be known as participation notes, equity swaps, and zero strike calls and warrants. Equity-linked securities are privately issued securities whose investment results are designed to correspond generally to the performance of a specified stock index or “basket” of stocks, or a single stock. The Fund deposits an amount of cash with its custodian (or broker, if legally permitted) in an amount near or equal to the selling price of the underlying security in exchange for an equity-linked security. Upon sale, the Fund receives cash from the broker or custodian equal to the current value of the underlying security, less transactional costs. Aside from market risk of the underlying security, there is the risk that the issuer of an equity-linked security may default on its obligation under the security. In addition, the Fund may be unable to close out such a transaction with the other party or obtain an offsetting position with any other party, at any time prior to the end of the term of the underlying agreement. Income received on equity-linked securities is recorded as dividend income.
H Use of Estimates — The preparation of the financial statements in conformity with U.S. GAAP requires management to make estimates and assumptions that affect the reported amounts of assets and liabilities at the date of the financial statements and the reported amounts of income and expense during the reporting period. Actual results could differ from those estimates.
I Indemnifications — Under the Trust’s organizational documents, its officers and Trustees may be indemnified against certain liabilities and expenses arising out of the performance of their duties to the Fund. Under Massachusetts law, if certain conditions prevail, shareholders of a Massachusetts business trust (such as the Trust) could be deemed to have personal liability for the obligations of the Trust. However, the Trust’s Declaration of Trust contains an express disclaimer of liability on the part of Fund shareholders and the By-laws provide that the Trust shall assume the defense on behalf of any Fund shareholders. Moreover, the By-laws also provide for indemnification out of Fund property of any shareholder held personally liable solely by reason of being or having been a shareholder for all loss or expense arising from such liability. Additionally, in the normal course of business, the Fund enters into agreements with service providers that may contain indemnification clauses. The Fund’s maximum exposure under these arrangements is unknown as this would involve future claims that may be made against the Fund that have not yet occurred.
J Redemption Fees — Fund shares acquired on or after April 1, 2005 are subject to a redemption fee, at the time of exchange or redemption, equal to 2% of the net asset value of the shares exchanged or redeemed. Fund shares purchased prior to April 1, 2005 are subject to a redemption fee equal to 1% of the net asset value of the shares exchanged or redeemed, and were subject to a purchase fee of 1% of the net asset value of the shares purchased at the time they were purchased. Shares acquired on or before June 30, 1998 are not subject to a redemption fee. The redemption fee is accounted for as an addition to paid-in capital.
2 Distributions to Shareholders and Income Tax Information
It is the present policy of the Fund to make at least one distribution annually (normally in December) of all or substantially all of its net investment income and to distribute annually all or substantially all of its net realized capital gains (reduced by available capital loss carryforwards from prior years). Distributions to shareholders are recorded on the ex-dividend date. Shareholders may reinvest income and capital gain distributions in additional shares of the Fund at the net asset value as of the ex-dividend date or, at the election of the shareholder, receive distributions in cash. Distributions to shareholders are determined in accordance with income tax regulations, which may differ from U.S. GAAP. As required by U.S. GAAP, only distributions in excess of tax basis earnings and profits are reported in the financial statements as a return of capital. Permanent differences between book and tax accounting relating to distributions are reclassified to paid-in capital. For tax purposes, distributions from short-term capital gains are considered to be from ordinary income.
Parametric Tax-Managed Emerging Markets Fund
June 30, 2016
Notes to Financial Statements — continued
The tax character of distributions declared for the years ended June 30, 2016 and June 30, 2015 was as follows:
| | | | | | | | |
Distributions declared from: | | | | | | | | |
Ordinary income | | $ | 57,084,671 | | | $ | 75,586,163 | |
During the year ended June 30, 2016, accumulated net realized loss was decreased by $1,235,131 and accumulated undistributed net investment income was decreased by $1,235,131 due to differences between book and tax accounting, primarily for foreign currency gain (loss), foreign capital gains taxes and investments in passive foreign investment companies (PFICs). These reclassifications had no effect on the net assets or net asset value per share of the Fund.
As of June 30, 2016, the components of distributable earnings (accumulated losses) on a tax basis were as follows:
| | | | |
Undistributed ordinary income | | $ | 40,231,063 | |
Capital loss carryforwards and deferred capital losses | | $ | (49,424,836 | ) |
Net unrealized appreciation | | $ | 83,204,077 | |
The differences between components of distributable earnings (accumulated losses) on a tax basis and the amounts reflected in the Statement of Assets and Liabilities are primarily due to wash sales and investments in PFICs.
At June 30, 2016, the Fund, for federal income tax purposes, had capital loss carryforwards of $22,535 and deferred capital losses of $49,402,301 which would reduce its taxable income arising from future net realized gains on investment transactions, if any, to the extent permitted by the Internal Revenue Code, and thus would reduce the amount of distributions to shareholders, which would otherwise be necessary to relieve the Fund of any liability for federal income or excise tax. The capital loss carryforwards will expire on June 30, 2018 and their character is short-term. Under tax regulations, capital losses incurred in taxable years beginning after December 2010 are considered deferred capital losses and are treated as arising on the first day of the Fund’s next taxable year, retaining the same short-term or long-term character as when originally deferred. Deferred capital losses are required to be used prior to capital loss carryforwards, which carry an expiration date. As a result of this ordering rule, capital loss carryforwards may be more likely to expire unused. Of the deferred capital losses at June 30, 2016, $12,608,555 are short-term and $36,793,746 are long-term.
The cost and unrealized appreciation (depreciation) of investments of the Fund at June 30, 2016, as determined on a federal income tax basis, were as follows:
| | | | |
| |
Aggregate cost | | $ | 2,749,767,117 | |
| |
Gross unrealized appreciation | | $ | 684,710,063 | |
Gross unrealized depreciation | | | (599,932,716 | ) |
| |
Net unrealized appreciation | | $ | 84,777,347 | |
3 Investment Adviser Fee and Other Transactions with Affiliates
The investment adviser fee is earned by Eaton Vance Management (EVM) as compensation for management and investment advisory services rendered to the Fund. The fee is computed at an annual rate of 0.45% of the Fund’s average daily net assets and is payable monthly. For the year ended June 30, 2016, the investment adviser fee amounted to $13,283,968. Pursuant to a sub-advisory agreement, EVM has delegated the investment management of the Fund to Parametric Portfolio Associates LLC (Parametric), a majority-owned subsidiary of Eaton Vance Corp. EVM pays Parametric a portion of its investment adviser fee for sub-advisory services provided to the Fund. The administration fee is earned by EVM for administering the business affairs of the Fund and is computed at an annual rate of 0.50% of the Fund’s average daily net assets. For the year ended June 30, 2016, the administration fee amounted to $14,759,964. Pursuant to a sub-administrative services agreement with Parametric, EVM pays Parametric a portion of its administration fee for sub-administrative services provided to the Fund. EVM also pays all ordinary operating expenses of the Fund (excluding the investment adviser and administration fees). EVM serves as the sub-transfer agent of the Fund, at no additional cost to the Fund.
Trustees and officers of the Fund who are members of EVM’s organization receive remuneration for their services to the Fund out of the investment adviser fee. Trustees of the Fund who are not affiliated with EVM may elect to defer receipt of all or a percentage of their annual fees in accordance with the terms of the Trustees Deferred Compensation Plan. For the year ended June 30, 2016, no significant amounts have been deferred. Trustees’ fees incurred by the Fund are paid by EVM. Certain officers and Trustees of the Fund are officers of EVM.
Parametric Tax-Managed Emerging Markets Fund
June 30, 2016
Notes to Financial Statements — continued
4 Purchases and Sales of Investments
Purchases and sales of investments, other than short-term obligations, aggregated $52,364,802 and $455,455,103, respectively, for the year ended June 30, 2016.
5 Shares of Beneficial Interest
The Fund’s Declaration of Trust permits the Trustees to issue an unlimited number of full and fractional shares of beneficial interest (without par value). Transactions in Fund shares were as follows:
| | | | | | | | |
| | | Year Ended June 30, | |
| | | 2016 | | | 2015 | |
| | |
Sales | | | 7,708,481 | | | | 12,824,271 | |
Issued to shareholders electing to receive payments of distributions in Fund shares | | | 1,166,040 | | | | 1,270,360 | |
Redemptions | | | (19,941,971 | ) | | | (8,236,800 | ) |
| | |
Net increase (decrease) | | | (11,067,450 | ) | | | 5,857,831 | |
For the years ended June 30, 2016 and June 30, 2015, the Fund received $11,906,949 and $6,021,876, respectively, in redemption fees.
6 Line of Credit
The Fund participates with other portfolios and funds managed by EVM and its affiliates in a $625 million unsecured line of credit agreement with a group of banks, which is in effect through September 2, 2016. Borrowings are made by the Fund solely to facilitate the handling of unusual and/or unanticipated short-term cash requirements. Interest is charged to the Fund based on its borrowings at an amount above either the Eurodollar rate or Federal Funds rate. In addition, a fee computed at an annual rate of 0.10% on the daily unused portion of the line of credit is allocated among the participating portfolios and funds at the end of each quarter. Because the line of credit is not available exclusively to the Fund, it may be unable to borrow some or all of its requested amounts at any particular time. The Fund did not have any significant borrowings or allocated fees during the year ended June 30, 2016.
7 Risks Associated with Foreign Investments
Investing in securities issued by companies whose principal business activities are outside the United States may involve significant risks not present in domestic investments. For example, there is generally less publicly available information about foreign companies, particularly those not subject to the disclosure and reporting requirements of the U.S. securities laws. Certain foreign issuers are generally not bound by uniform accounting, auditing, and financial reporting requirements and standards of practice comparable to those applicable to domestic issuers. Investments in foreign securities also involve the risk of possible adverse changes in investment or exchange control regulations, expropriation or confiscatory taxation, limitation on the removal of funds or other assets of the Fund, political or financial instability or diplomatic and other developments which could affect such investments. Foreign securities markets, while growing in volume and sophistication, are generally not as developed as those in the United States, and securities of some foreign issuers (particularly those located in developing countries) may be less liquid and more volatile than securities of comparable U.S. companies. In general, there is less overall governmental supervision and regulation of foreign securities markets, broker/dealers and issuers than in the United States. The foregoing risks of foreign investing can be more significant in less developed countries characterized as emerging market countries.
8 Fair Value Measurements
Under generally accepted accounting principles for fair value measurements, a three-tier hierarchy to prioritize the assumptions, referred to as inputs, is used in valuation techniques to measure fair value. The three-tier hierarchy of inputs is summarized in the three broad levels listed below.
| • | | Level 1 – quoted prices in active markets for identical investments |
| • | | Level 2 – other significant observable inputs (including quoted prices for similar investments, interest rates, prepayment speeds, credit risk, etc.) |
| • | | Level 3 – significant unobservable inputs (including a fund’s own assumptions in determining the fair value of investments) |
In cases where the inputs used to measure fair value fall in different levels of the fair value hierarchy, the level disclosed is determined based on the lowest level input that is significant to the fair value measurement in its entirety. The inputs or methodology used for valuing securities are not necessarily an indication of the risk associated with investing in those securities.
Parametric Tax-Managed Emerging Markets Fund
June 30, 2016
Notes to Financial Statements — continued
At June 30, 2016, the hierarchy of inputs used in valuing the Fund’s investments, which are carried at value, were as follows:
| | | | | | | | | | | | | | | | |
| Asset Description | | Level 1 | | | Level 2 | | | Level 3* | | | Total | |
| | | |
Common Stocks | | | | | | | | | | | | |
Asia/Pacific | | $ | 21,767,967 | | | $ | 1,196,887,211 | | | $ | 71,568 | | | $ | 1,218,726,746 | |
Emerging Europe | | | 26,318,249 | | | | 514,795,221 | | | | 1,235 | | | | 541,114,705 | |
Latin America | | | 556,652,246 | | | | — | | | | 639,673 | | | | 557,291,919 | |
Middle East/Africa | | | 11,675,008 | | | | 481,887,626 | | | | 0 | | | | 493,562,634 | |
| | | | |
Total Common Stocks | | $ | 616,413,470 | | | $ | 2,193,570,058 | ** | | $ | 712,476 | | | $ | 2,810,696,004 | |
| | | | |
Equity-Linked Securities | | $ | — | | | $ | 19,544,166 | | | $ | — | | | $ | 19,544,166 | |
Rights | | | 273,812 | | | | — | | | | — | | | | 273,812 | |
Warrants | | | 184,689 | | | | — | | | | — | | | | 184,689 | |
Short-Term Investments | | | — | | | | 3,845,793 | | | | — | | | | 3,845,793 | |
| | | | |
Total Investments | | $ | 616,871,971 | | | $ | 2,216,960,017 | | | $ | 712,476 | | | $ | 2,834,544,464 | |
| * | None of the unobservable inputs for Level 3 assets, individually or collectively, had a material impact on the Fund. |
| ** | Includes foreign equity securities whose values were adjusted to reflect market trading of comparable securities or other correlated instruments that occurred after the close of trading in their applicable foreign markets. |
Level 3 investments at the beginning and/or end of the period in relation to net assets were not significant and accordingly, a reconciliation of Level 3 assets for the year ended June 30, 2016 is not presented. At June 30, 2016, the value of investments transferred between Level 1 and Level 2 during the year then ended was not significant.
Parametric Tax-Managed Emerging Markets Fund
June 30, 2016
Report of Independent Registered Public Accounting Firm
To the Trustees of Eaton Vance Series Trust II and Shareholders of Parametric Tax-Managed Emerging Markets Fund:
We have audited the accompanying statement of assets and liabilities of Parametric Tax-Managed Emerging Markets Fund (the “Fund”) (one of the funds constituting Eaton Vance Series Trust II), including the portfolio of investments, as of June 30, 2016, and the related statement of operations for the year then ended, the statements of changes in net assets for each of the two years in the period then ended, and the financial highlights for each of the five years in the period then ended. These financial statements and financial highlights are the responsibility of the Fund’s management. Our responsibility is to express an opinion on these financial statements and financial highlights based on our audits.
We conducted our audits in accordance with the standards of the Public Company Accounting Oversight Board (United States). Those standards require that we plan and perform the audit to obtain reasonable assurance about whether the financial statements and financial highlights are free of material misstatement. The Fund is not required to have, nor were we engaged to perform, an audit of its internal control over financial reporting. Our audits included consideration of internal control over financial reporting as a basis for designing audit procedures that are appropriate in the circumstances, but not for the purpose of expressing an opinion on the effectiveness of the Fund’s internal control over financial reporting. Accordingly, we express no such opinion. An audit also includes examining, on a test basis, evidence supporting the amounts and disclosures in the financial statements, assessing the accounting principles used and significant estimates made by management, as well as evaluating the overall financial statement presentation. Our procedures included confirmation of securities owned as of June 30, 2016, by correspondence with the custodian and brokers; where replies were not received from brokers, we performed other auditing procedures. We believe that our audits provide a reasonable basis for our opinion.
In our opinion, such financial statements and financial highlights referred to above present fairly, in all material respects, the financial position of Parametric Tax-Managed Emerging Markets Fund as of June 30, 2016, the results of its operations for the year then ended, the changes in its net assets for each of the two years in the period then ended, and the financial highlights for each of the five years in the period then ended, in conformity with accounting principles generally accepted in the United States of America.
DELOITTE & TOUCHE LLP
Boston, Massachusetts
August 18, 2016
Parametric Tax-Managed Emerging Markets Fund
June 30, 2016
Federal Tax Information (Unaudited)
The Form 1099-DIV you receive in February 2017 will show the tax status of all distributions paid to your account in calendar year 2016. Shareholders are advised to consult their own tax adviser with respect to the tax consequences of their investment in the Fund. As required by the Internal Revenue Code and/or regulations, shareholders must be notified regarding the status of qualified dividend income for individuals, the dividends received deduction for corporations and the foreign tax credit.
Qualified Dividend Income. For the fiscal year ended June 30, 2016, the Fund designates approximately $57,354,772, or up to the maximum amount of such dividends allowable pursuant to the Internal Revenue Code, as qualified dividend income eligible for the reduced tax rate of 15%.
Dividends Received Deduction. Corporate shareholders are generally entitled to take the dividends received deduction on the portion of the Fund’s dividend distribution that qualifies under tax law. For the Fund’s fiscal 2016 ordinary income dividends, 0.28% qualifies for the corporate dividends received deduction.
Foreign Tax Credit. For the fiscal year ended June 30, 2016, the Fund paid foreign taxes of $10,596,239 and recognized foreign source income of $97,021,695.
Parametric Tax-Managed Emerging Markets Fund
June 30, 2016
Board of Trustees’ Contract Approval
Overview of the Contract Review Process
The Investment Company Act of 1940, as amended (the “1940 Act”), provides, in substance, that each investment advisory agreement between a fund and its investment adviser will continue in effect from year to year only if its continuation is approved at least annually by the fund’s board of trustees, including by a vote of a majority of the trustees who are not “interested persons” of the fund (“Independent Trustees”), cast in person at a meeting called for the purpose of considering such approval.
At a meeting of the Boards of Trustees (each a “Board”) of the registered investment companies advised, administered and/or distributed by Eaton Vance Management or its affiliates (the “Eaton Vance Funds”) held on April 26, 2016, the Board, including a majority of the Independent Trustees, voted to approve continuation of existing investment advisory and sub-advisory agreements for the Eaton Vance Funds for an additional one-year period. In voting its approval, the Board relied upon the affirmative recommendation of its Contract Review Committee, which is a committee comprised exclusively of Independent Trustees. Prior to making its recommendation, the Contract Review Committee reviewed information furnished by each adviser to the Eaton Vance Funds (including information specifically requested by the Board) for a series of meetings of the Contract Review Committee held between February and April 2016. The Contract Review Committee also considered information received at prior meetings of the Board and its committees, as relevant to its annual evaluation of the investment advisory and sub-advisory agreements.
The information that the Board considered included, among other things, the following (for funds that invest through one or more underlying portfolio(s), references to “each fund” in this section may include information that was considered at the portfolio-level):
Information about Fees, Performance and Expenses
| • | | A report from an independent data provider comparing the advisory and related fees paid by each fund with fees paid by comparable funds as identified by the independent data provider (“comparable funds”); |
| • | | A report from an independent data provider comparing each fund’s total expense ratio and its components to comparable funds; |
| • | | A report from an independent data provider comparing the investment performance of each fund (including, where relevant, yield data, Sharpe ratios and information ratios) to the investment performance of comparable funds over various time periods; |
| • | | Data regarding investment performance in comparison to benchmark indices and customized groups of peer funds identified by the adviser in consultation with the Board; |
| • | | For each fund, comparative information concerning the fees charged and the services provided by each adviser in managing other accounts (including mutual funds, other collective investment funds and institutional accounts) using investment strategies and techniques similar to those used in managing such fund; |
| • | | Profitability analyses for each adviser with respect to each fund; |
Information about Portfolio Management and Trading
| • | | Descriptions of the investment management services provided to each fund, including the investment strategies and processes it employs; |
| • | | The procedures and processes used to determine the fair value of fund assets and actions taken to monitor and test the effectiveness of such procedures and processes; |
| • | | Information about each adviser’s policies and practices with respect to trading, including each adviser’s processes for monitoring best execution of portfolio transactions; |
| • | | Information about the allocation of brokerage transactions and the benefits received by each adviser as a result of brokerage allocation, including information concerning the acquisition of research through client commission arrangements and policies with respect to “soft dollars”; |
| • | | Data relating to portfolio turnover rates of each fund; |
Information about each Adviser
| • | | Reports detailing the financial results and condition of each adviser; |
| • | | Descriptions of the qualifications, education and experience of the individual investment professionals whose responsibilities include portfolio management and investment research for the funds, and information relating to their compensation and responsibilities with respect to managing other mutual funds and investment accounts; |
| • | | The Code of Ethics of each adviser and its affiliates, together with information relating to compliance with and the administration of such codes; |
| • | | Policies and procedures relating to proxy voting and the handling of corporate actions and class actions; |
| • | | Information concerning the resources devoted to compliance efforts undertaken by each adviser and its affiliates (including descriptions of various compliance programs) and their record of compliance; |
| • | | Information concerning the business continuity and disaster recovery plans of each adviser and its affiliates; |
| • | | A description of Eaton Vance Management’s procedures for overseeing third party advisers and sub-advisers, including with respect to regulatory and compliance issues, investment management and other matters; |
Parametric Tax-Managed Emerging Markets Fund
June 30, 2016
Board of Trustees’ Contract Approval — continued
Other Relevant Information
| • | | Information concerning the nature, cost and character of the administrative and other non-investment advisory services provided by Eaton Vance Management and its affiliates; |
| • | | Information concerning management of the relationship with the custodian, subcustodians and fund accountants by each adviser or the funds’ administrator; and |
| • | | The terms of each investment advisory agreement. |
Over the course of the twelve-month period ended April 30, 2016, with respect to one or more funds, the Board met ten times and the Contract Review Committee, the Audit Committee, the Governance Committee, the Portfolio Management Committee and the Compliance Reports and Regulatory Matters Committee, each of which is a Committee comprised solely of Independent Trustees, met seven, sixteen, four, nine and eleven times, respectively. At such meetings, the Trustees participated in investment and performance reviews with the portfolio managers and other investment professionals of each investment adviser relating to each fund, and considered various investment and trading strategies used in pursuing each fund’s investment objective, such as the use of derivative instruments, as well as risk management techniques. The Board and its Committees also evaluated issues pertaining to industry and regulatory developments, compliance procedures, fund governance and other issues with respect to the funds, and received and participated in reports and presentations provided by Eaton Vance Management and other fund advisers with respect to such matters. In addition to the formal meetings of the Board and its Committees, the Independent Trustees hold regular teleconferences in between meetings to discuss, among other topics, matters relating to the continuation of investment advisory and sub-advisory agreements.
For funds that invest through one or more underlying portfolios, the Board considered similar information about the portfolio(s) when considering the approval of investment advisory agreements. In addition, in cases where the fund’s investment adviser has engaged a sub-adviser, the Board considered similar information about the sub-adviser when considering the approval of any sub-advisory agreement.
The Contract Review Committee was assisted throughout the contract review process by Goodwin Procter LLP, independent legal counsel for the Independent Trustees. The members of the Contract Review Committee relied upon the advice of such counsel and their own business judgment in determining the material factors to be considered in evaluating each investment advisory and sub-advisory agreement and the weight to be given to each such factor. The conclusions reached with respect to each investment advisory and sub-advisory agreement were based on a comprehensive evaluation of all the information provided and not any single factor. Moreover, each member of the Contract Review Committee may have placed varying emphasis on particular factors in reaching conclusions with respect to each investment advisory and sub-advisory agreement. In evaluating each investment advisory and sub-advisory agreement, including the specific fee structures and other terms of the agreements, the Contract Review Committee was informed by multiple years of analysis and discussion among the Independent Trustees and the Eaton Vance Funds’ advisers and sub-advisers.
Results of the Process
Based on its consideration of the foregoing, and such other information as it deemed relevant, including the factors and conclusions described below, the Contract Review Committee concluded that the continuation of the investment advisory agreement of Parametric Tax-Managed Emerging Markets Fund (the “Fund”) with Eaton Vance Management (the “Adviser”) and the sub-advisory agreement with Parametric Portfolio Associates LLC (the “Sub-adviser”), an affiliate of the Adviser, including their fee structures, is in the interests of shareholders and, therefore, the Contract Review Committee recommended to the Board approval of each agreement. The Board accepted the recommendation of the Contract Review Committee based on the material factors considered and conclusions reached by the Contract Review Committee with respect to the agreements. Accordingly, the Board, including a majority of the Independent Trustees, voted to approve continuation of the investment advisory agreement and the sub-advisory agreement for the Fund.
Nature, Extent and Quality of Services
In considering whether to approve the investment advisory agreement and the sub-advisory agreement of the Fund, the Board evaluated the nature, extent and quality of services provided to the Fund by the Adviser and the Sub-adviser.
The Board considered the Adviser’s and the Sub-adviser’s management capabilities and investment process with respect to the types of investments held by the Fund, including the education, experience and number of its investment professionals and other personnel who provide portfolio management, investment research, and similar services to the Fund, including recent changes to such personnel. With respect to the Adviser, the Board considered the Adviser’s responsibilities supervising the Sub-adviser. In particular, the Board considered the abilities and experience of such investment professionals in analyzing factors such as special considerations relevant to investing in emerging markets. The Board noted the Adviser’s in-house equity research capabilities and experience in managing funds that seek to maximize after-tax returns. With respect to the Sub-adviser, the Board took into account the resources available to the Sub-adviser in fulfilling its duties under the sub-advisory agreement and the Sub-adviser’s experience in managing equity portfolios. The Board also took into account the resources dedicated to portfolio management and other services, as well as the compensation methods of the Adviser and other factors, such as the reputation and resources of the Adviser to recruit and retain highly qualified research, advisory and supervisory investment professionals. In addition, the Board considered the time and attention devoted to the Eaton Vance Funds, including the Fund, by senior management, as well as the infrastructure, operational capabilities and support staff in place to assist in the portfolio management and operations of the Fund, including the provision of administrative services.
Parametric Tax-Managed Emerging Markets Fund
June 30, 2016
Board of Trustees’ Contract Approval — continued
The Board considered the compliance programs of the Adviser and relevant affiliates thereof, including the Sub-adviser. Among other matters, the Board considered compliance and reporting matters relating to personal trading by investment professionals, selective disclosure of portfolio holdings, late trading, frequent trading, portfolio valuation, business continuity and the allocation of investment opportunities. The Board also considered the responses of the Adviser and its affiliates to requests in recent years from regulatory authorities such as the Securities and Exchange Commission and the Financial Industry Regulatory Authority.
The Board considered shareholder and other administrative services provided or managed by Eaton Vance Management and its affiliates, including transfer agency and accounting services. The Board evaluated the benefits to shareholders of investing in a fund that is a part of a large fund complex offering exposure to a variety of asset classes and investment disciplines, as well as the ability, in many cases, to exchange an investment among different funds without incurring additional sales charges.
After consideration of the foregoing factors, among others, the Board concluded that the nature, extent and quality of services provided by the Adviser and the Sub-adviser, taken as a whole, are appropriate and consistent with the terms of the investment advisory agreement and the sub-advisory agreement.
Fund Performance
The Board compared the Fund’s investment performance to that of comparable funds and appropriate benchmark indices. The Board’s review included comparative performance data for the one-, three-, five- and ten-year periods ended September 30, 2015 for the Fund. The Board concluded that the performance of the Fund was satisfactory.
Management Fees and Expenses
The Board considered contractual fee rates payable by the Fund for advisory and administrative services (referred to collectively as “management fees”). As part of its review, the Board considered the Fund’s management fees and total expense ratio for the one year period ended September 30, 2015, as compared to those of comparable funds, before and after giving effect to any undertaking to waive fees or reimburse expenses. The Board also considered factors that had an impact on Fund expense ratios, as identified by management in response to inquiries from the Contract Review Committee.
After considering the foregoing information, and in light of the nature, extent and quality of the services provided by the Adviser and the Sub-adviser, the Board concluded that the management fees charged for advisory and related services are reasonable.
Profitability and Other “Fall-Out” Benefits
The Board considered the level of profits realized by the Adviser and relevant affiliates thereof, including the Sub-adviser, in providing investment advisory and administrative services to the Fund and to all Eaton Vance Funds as a group. The Board considered the level of profits realized without regard to marketing support or other payments by the Adviser and its affiliates to third parties in respect of distribution services. The Board also considered other direct or indirect fall-out benefits received by the Adviser and its affiliates, including the Sub-adviser, in connection with their relationships with the Fund, including the benefits of research services that may be available to the Adviser or the Sub-adviser as a result of securities transactions effected for the Fund and other investment advisory clients.
The Board concluded that, in light of the foregoing factors and the nature, extent and quality of the services rendered, the profits realized by the Adviser and its affiliates, including the Sub-adviser, are deemed not to be excessive.
Economies of Scale
In reviewing management fees and profitability, the Board also considered the extent to which the Adviser and its affiliates, on the one hand, and the Fund, on the other hand, can expect to realize benefits from economies of scale as the assets of the Fund increase. The Board acknowledged the difficulty in accurately measuring the benefits resulting from economies of scale, if any, with respect to the management of any specific fund or group of funds. The Board reviewed data summarizing the increases and decreases in the assets of the Fund and of all Eaton Vance Funds as a group over various time periods, and evaluated the extent to which the total expense ratio of the Fund and the profitability of the Adviser and its affiliates may have been affected by such increases or decreases. Based upon the foregoing, the Board concluded that the Fund currently shares in any benefits from economies of scale. The Board also concluded that, assuming reasonably foreseeable increases in the assets of the Fund, and in light of the level of the Adviser’s 2015 profits with respect to the Fund, the implementation of breakpoints in the advisory fee schedule is not warranted at this time.
Parametric Tax-Managed Emerging Markets Fund
June 30, 2016
Management and Organization
Fund Management. The Trustees of Eaton Vance Series Trust II (the Trust) are responsible for the overall management and supervision of the Trust’s affairs. The Trustees and officers of the Trust are listed below. Except as indicated, each individual has held the office shown or other offices in the same company for the last five years. Trustees and officers of the Trust hold indefinite terms of office. The “Noninterested Trustees” consist of those Trustees who are not “interested persons” of the Trust, as that term is defined under the 1940 Act. The business address of each Trustee and officer is Two International Place, Boston, Massachusetts 02110. As used below, “EVC” refers to Eaton Vance Corp., “EV” refers to Eaton Vance, Inc., “EVM” refers to Eaton Vance Management, “BMR” refers to Boston Management and Research, “EVMI” refers to Eaton Vance Management (International) Limited and “EVD” refers to Eaton Vance Distributors, Inc. EVC and EV are the corporate parent and trustee, respectively, of EVM and BMR. EVMI is an indirect, wholly-owned subsidiary of EVC. EVD is the Fund’s principal underwriter and a wholly-owned subsidiary of EVC. Each officer affiliated with Eaton Vance may hold a position with other Eaton Vance affiliates that is comparable to his or her position with EVM listed below. Each Trustee oversees 175 portfolios in the Eaton Vance Complex (including all master and feeder funds in a master feeder structure). Each officer serves as an officer of certain other Eaton Vance funds. Each Trustee and officer serves until his or her successor is elected.
| | | | | | |
| Name and Year of Birth | | Position(s) with the Trust | | Trustee Since(1) | | Principal Occupation(s) and Directorships During Past Five Years and Other Relevant Experience |
Interested Trustee | | | | | | |
| | | |
Thomas E. Faust Jr. 1958 | | Trustee | | 2007 | | Chairman, Chief Executive Officer and President of EVC, Director and President of EV, Chief Executive Officer and President of EVM and BMR, and Director of EVD and EVMI. Trustee and/or officer of 175 registered investment companies. Mr. Faust is an interested person because of his positions with EVM, BMR, EVD, EVMI, EVC and EV, which are affiliates of the Trust. Directorships in the Last Five Years.(2) Director of EVC and Hexavest Inc. (investment management firm). |
| | | |
| | | | | | |
Noninterested Trustees | | | | | | |
| | | |
Scott E. Eston 1956 | | Trustee | | 2011 | | Private investor. Formerly held various positions at Grantham, Mayo, Van Otterloo and Co., L.L.C. (investment management firm) (1997-2009), including Chief Operating Officer (2002-2009), Chief Financial Officer (1997-2009) and Chairman of the Executive Committee (2002-2008); President and Principal Executive Officer, GMO Trust (open-end registered investment company) (2006-2009). Former Partner, Coopers and Lybrand L.L.P. (now PricewaterhouseCoopers) (a registered public accounting firm) (1987-1997). Mr. Eston has apprised the Board of Trustees that he intends to retire as a Trustee of all Eaton Vance funds at a mutually convenient time in 2017. Directorships in the Last Five Years.(2) None. |
| | | |
Cynthia E. Frost 1961 | | Trustee | | 2014 | | Private investor. Formerly, Chief Investment Officer of Brown University (university endowment) (2000-2012); Portfolio Strategist for Duke Management Company (university endowment manager) (1995-2000); Managing Director, Cambridge Associates (investment consulting company) (1989-1995); Consultant, Bain and Company (management consulting firm)
(1987-1989); Senior Equity Analyst, BA Investment Management Company (1983-1985). Directorships in the Last Five Years. None. |
| | | |
George J. Gorman 1952 | | Trustee | | 2014 | | Principal at George J. Gorman LLC (consulting firm). Formerly, Senior Partner at Ernst & Young LLP (a registered public accounting firm) (1974-2009). Directorships in the Last Five Years. Formerly, Trustee of the Bank of America Money Market Funds Series Trust (2011-2014) and of the Ashmore Funds (2010-2014). |
| | | |
Valerie A. Mosley 1960 | | Trustee | | 2014 | | Chairwoman and Chief Executive Officer of Valmo Ventures (a consulting and investment firm). Former Partner and Senior Vice President, Portfolio Manager and Investment Strategist at Wellington Management Company, LLP (investment management firm) (1992-2012). Former Chief Investment Officer, PG Corbin Asset Management (1990-1992). Formerly worked in institutional corporate bond sales at Kidder Peabody (1986-1990). Directorships in the Last Five Years.(2) Director of Dynex Capital, Inc. (mortgage REIT) (since 2013). |
Parametric Tax-Managed Emerging Markets Fund
June 30, 2016
Management and Organization — continued
| | | | | | |
| Name and Year of Birth | | Position(s) with the Trust | | Trustee Since(1) | | Principal Occupation(s) and Directorships During Past Five Years and Other Relevant Experience |
Noninterested Trustees (continued) |
| | | |
William H. Park 1947 | | Chairperson of the Board and Trustee | | 2016 (Chairperson) and 2003 (Trustee) | | Private investor. Formerly, Consultant (management and transactional) (2012-2014). Formerly, Chief Financial Officer, Aveon Group L.P. (investment management firm) (2010-2011). Formerly, Vice Chairman, Commercial Industrial Finance Corp. (specialty finance company) (2006-2010). Formerly, President and Chief Executive Officer, Prizm Capital Management, LLC (investment management firm) (2002-2005). Formerly, Executive Vice President and Chief Financial Officer, United Asset Management Corporation (investment management firm) (1982-2001). Formerly, Senior Manager, Price Waterhouse (now PricewaterhouseCoopers) (a registered public accounting firm) (1972-1981). Directorships in the Last Five Years.(2) None. |
| | | |
Helen Frame Peters 1948 | | Trustee | | 2008 | | Professor of Finance, Carroll School of Management, Boston College. Formerly, Dean, Carroll School of Management, Boston College (2000-2002). Formerly, Chief Investment Officer, Fixed Income, Scudder Kemper Investments (investment management firm) (1998-1999). Formerly, Chief Investment Officer, Equity and Fixed Income, Colonial Management Associates (investment management firm) (1991-1998). Directorships in the Last Five Years.(2) Formerly, Director of BJ’s Wholesale Club, Inc. (wholesale club retailer) (2004-2011). Formerly, Trustee of SPDR Index Shares Funds and SPDR Series Trust (exchange traded funds) (2000-2009). Formerly, Director of Federal Home Loan Bank of Boston (a bank for banks) (2007-2009). |
| | | |
Susan J. Sutherland 1957 | | Trustee | | 2015 | | Private investor. Formerly, Associate, Counsel and Partner at Skadden, Arps, Slate, Meagher & Flom LLP (law firm) (1982-2013). Directorships in the Last Five Years. Formerly, Director of Montpelier Re Holdings Ltd. (global provider of customized insurance and reinsurance products) (2013-2015). |
| | | |
Harriett Tee Taggart 1948 | | Trustee | | 2011 | | Managing Director, Taggart Associates (a professional practice firm). Formerly, Partner and Senior Vice President, Wellington Management Company, LLP (investment management firm) (1983-2006). Directorships in the Last Five Years.(2) Director of Albemarle Corporation (chemicals manufacturer) (since 2007) and The Hanover Group (specialty property and casualty insurance company) (since 2009). Formerly, Director of Lubrizol Corporation (specialty chemicals) (2007-2011). |
| | | |
Ralph F. Verni 1943 | | Trustee | | 2005 | | Consultant and private investor. Formerly, Chief Investment Officer (1982-1992), Chief Financial Officer (1988-1990) and Director (1982-1992), New England Life. Formerly, Chairperson, New England Mutual Funds (1982-1992). Formerly, President and Chief Executive Officer, State Street Management & Research (1992-2000). Formerly, Chairperson, State Street Research Mutual Funds (1992-2000). Formerly, Director, W.P. Carey, LLC (1998-2004) and First Pioneer Farm Credit Corp. (financial services cooperative) (2002-2006). Consistent with the Trustee retirement policy, Mr. Verni is currently expected to retire as a Trustee of all Eaton Vance funds effective July 1, 2017. Directorships in the Last Five Years.(2) None. |
| | | |
| | | | | | |
Principal Officers who are not Trustees |
| Name and Year of Birth | | Position(s) with the Trust | | Officer
Since(3) | | Principal Occupation(s) During Past Five Years |
| | | |
Michael W. Weilheimer 1961 | | President | | 1995 | | Vice President of EVM and BMR. |
| | | |
Maureen A. Gemma 1960 | | Vice President, Secretary and Chief Legal Officer | | 2005 | | Vice President of EVM and BMR. |
| | | |
James F. Kirchner 1967 | | Treasurer | | 2007 | | Vice President of EVM and BMR. |
| | | |
Paul M. O’Neil 1953 | | Chief Compliance Officer | | 2004 | | Vice President of EVM and BMR. |
Parametric Tax-Managed Emerging Markets Fund
June 30, 2016
Management and Organization — continued
| (1) | Year first appointed to serve as Trustee for a fund in the Eaton Vance family of funds. Each Trustee has served continuously since appointment unless indicated otherwise. |
| (2) | During their respective tenures, the Trustees (except for Mmes. Frost and Sutherland and Mr. Gorman) also served as Board members of one or more of the following funds (which operated in the years noted): eUnitsTM 2 Year U.S. Market Participation Trust: Upside to Cap / Buffered Downside (launched in 2012 and terminated in 2014); eUnitsTM 2 Year U.S. Market Participation Trust II: Upside to Cap / Buffered Downside (launched in 2012 and terminated in 2014); and Eaton Vance National Municipal Income Trust (launched in 1998 and terminated in 2009). However, Ms. Mosley did not serve as a Board member of eUnitsTM 2 Year U.S. Market Participation Trust: Upside to Cap / Buffered Downside (launched in 2012 and terminated in 2014). |
| (3) | Year first elected to serve as officer of a fund in the Eaton Vance family of funds when the officer has served continuously. Otherwise, year of most recent election as an officer of a fund in the Eaton Vance family of funds. Titles may have changed since initial election. |
The SAI for the Fund includes additional information about the Trustees and officers of the Fund and can be obtained without charge on Eaton Vance’s website at www.eatonvance.com or by calling 1-800-260-0761.
Eaton Vance Funds
IMPORTANT NOTICES
Privacy. The Eaton Vance organization is committed to ensuring your financial privacy. Each of the financial institutions identified below has in effect the following policy (“Privacy Policy”) with respect to nonpublic personal information about its customers:
| • | | Only such information received from you, through application forms or otherwise, and information about your Eaton Vance fund transactions will be collected. This may include information such as name, address, social security number, tax status, account balances and transactions. |
| • | | None of such information about you (or former customers) will be disclosed to anyone, except as permitted by law (which includes disclosure to employees necessary to service your account). In the normal course of servicing a customer’s account, Eaton Vance may share information with unaffiliated third parties that perform various required services such as transfer agents, custodians and broker-dealers. |
| • | | Policies and procedures (including physical, electronic and procedural safeguards) are in place that are designed to protect the confidentiality of such information. |
| • | | We reserve the right to change our Privacy Policy at any time upon proper notification to you. Customers may want to review our Privacy Policy periodically for changes by accessing the link on our homepage: www.eatonvance.com. |
Our pledge of privacy applies to the following entities within the Eaton Vance organization: the Eaton Vance Family of Funds, Eaton Vance Management, Eaton Vance Investment Counsel, Eaton Vance Distributors, Inc., Eaton Vance Trust Company, Eaton Vance Management (International) Limited, Eaton Vance Management’s Real Estate Investment Group and Boston Management and Research. In addition, our Privacy Policy applies only to those Eaton Vance customers who are individuals and who have a direct relationship with us. If a customer’s account (i.e., fund shares) is held in the name of a third-party financial advisor/broker-dealer, it is likely that only such advisor’s privacy policies apply to the customer. This notice supersedes all previously issued privacy disclosures. For more information about Eaton Vance’s Privacy Policy, please call 1-800-262-1122.
Delivery of Shareholder Documents. The Securities and Exchange Commission (SEC) permits funds to deliver only one copy of shareholder documents, including prospectuses, proxy statements and shareholder reports, to fund investors with multiple accounts at the same residential or post office box address. This practice is often called “householding” and it helps eliminate duplicate mailings to shareholders. Eaton Vance, or your financial advisor, may household the mailing of your documents indefinitely unless you instruct Eaton Vance, or your financial advisor, otherwise. If you would prefer that your Eaton Vance documents not be householded, please contact Eaton Vance at 1-800-260-0761, or contact your financial advisor. Your instructions that householding not apply to delivery of your Eaton Vance documents will be effective within 30 days of receipt by Eaton Vance or your financial advisor.
Portfolio Holdings. Each Eaton Vance Fund and its underlying Portfolio(s) (if applicable) will file a schedule of portfolio holdings on Form N-Q with the SEC for the first and third quarters of each fiscal year. The Form N-Q will be available on the Eaton Vance website at www.eatonvance.com, by calling Eaton Vance at 1-800-260-0761 or in the EDGAR database on the SEC’s website at www.sec.gov. Form N-Q may also be reviewed and copied at the SEC’s public reference room in Washington, D.C. (call 1-800-732-0330 for information on the operation of the public reference room).
Proxy Voting. From time to time, funds are required to vote proxies related to the securities held by the funds. The Eaton Vance Funds or their underlying Portfolios (if applicable) vote proxies according to a set of policies and procedures approved by the Funds’ and Portfolios’ Boards. You may obtain a description of these policies and procedures and information on how the Funds or Portfolios voted proxies relating to portfolio securities during the most recent 12-month period ended June 30, without charge, upon request, by calling 1-800-260-0761 and by accessing the SEC’s website at www.sec.gov.
This Page Intentionally Left Blank
This Page Intentionally Left Blank
This Page Intentionally Left Blank
Investment Adviser and Administrator
Eaton Vance Management
Two International Place
Boston, MA 02110
Sub-Adviser
Parametric Portfolio Associates LLC
1918 Eighth Avenue, Suite 3100
Seattle, WA 98101
Principal Underwriter*
Eaton Vance Distributors, Inc.
Two International Place
Boston, MA 02110
(617) 482-8260
Custodian
State Street Bank and Trust Company
State Street Financial Center, One Lincoln Street
Boston, MA 02111
Transfer Agent
BNY Mellon Investment Servicing (US) Inc.
Attn: Eaton Vance Funds
P.O. Box 9653
Providence, RI 02940-9653
(800) 260-0761
Independent Registered Public Accounting Firm
Deloitte & Touche LLP
200 Berkeley Street
Boston, MA 02116-5022
Fund Offices
Two International Place
Boston, MA 02110
| * | FINRA BrokerCheck. Investors may check the background of their Investment Professional by contacting the Financial Industry Regulatory Authority (FINRA). FINRA BrokerCheck is a free tool to help investors check the professional background of current and former FINRA-registered securities firms and brokers. FINRA BrokerCheck is available by calling 1-800-289-9999 and at www.FINRA.org. The FINRA BrokerCheck brochure describing this program is available to investors at www.FINRA.org. |
2050 6.30.16
Item 2. Code of Ethics
The registrant has adopted a code of ethics applicable to its Principal Executive Officer, Principal Financial Officer and Principal Accounting Officer. The registrant undertakes to provide a copy of such code of ethics to any person upon request, without charge, by calling 1-800-262-1122.
Item 3. Audit Committee Financial Expert
The registrant’s Board has designated William H. Park, an independent trustee, as its audit committee financial expert. Mr. Park is a certified public accountant who is a private investor. Previously, he served as a consultant, as the Chief Financial Officer of Aveon Group, L.P. (an investment management firm), as the Vice Chairman of Commercial Industrial Finance Corp. (specialty finance company), as President and Chief Executive Officer of Prizm Capital Management, LLC (investment management firm), as Executive Vice President and Chief Financial Officer of United Asset Management Corporation (an institutional investment management firm) and as a Senior Manager at Price Waterhouse (now PricewaterhouseCoopers) (an independent registered public accounting firm).
Item 4. Principal Accountant Fees and Services
Parametric Tax-Managed Emerging Markets Fund (the “Fund”), is a series of Eaton Vance Series Trust II (the “Trust”), a Massachusetts business trust, which, including the Fund, contains a total of 2 series (the “Series”). The Trust is registered under the Investment Company Act of 1940 as an open-end management investment company. This Form N-CSR relates to the Fund’s annual reports.
Rule 2-01(c)(1)(ii)(A) of Regulation S-X (the “Loan Rule”) prohibits an accounting firm, such as the Trust’s principal accountant, Deloitte & Touche LLP (“D&T”), from having certain financial relationships with their audit clients and affiliated entities. Specifically, the Loan Rule provides, in relevant part, that an accounting firm generally would not be independent if it receives a loan from a lender that is a “record or beneficial owner of more than ten percent of the audit client’s equity securities.” Based on information provided to the Audit Committee of the Board of Trustees (the “Audit Committee”) of the Eaton Vance Family of Funds by D&T, certain relationships between D&T and its affiliates (“Deloitte Entities”) and its lenders who are record owners of shares of one or more funds (the “Funds”) within the Eaton Vance Funds’ investment company complex implicate the Loan Rule, calling into question D&T’s independence with respect to the Funds. The Funds are providing this disclosure to explain the facts and circumstances as well as D&T’s conclusions concerning D&T’s objectivity and impartiality with respect to the audits of the Funds.
D&T advised the Audit Committee that it believes that, in light of the facts surrounding its lending relationships, its ability to exercise objective and impartial judgment on all issues encompassed within D&T’s audit engagement has not been impaired. D&T has advised the Audit Committee that this conclusion is based in part on the following considerations: (1) Deloitte Entity personnel responsible for managing the lending relationships have had no interactions with the audit engagement team; (2) the lending relationships are in good standing and the principal and interest payments are up-to-date; (3) the lending relationships are not significant to the Deloitte Entities or to D&T.
On June 20, 2016, the U.S. Securities and Exchange Commission (the “SEC”) issued no-action relief to another mutual fund complex (see Fidelity Management & Research Company et al., No-Action Letter (June 20, 2016)) related to the auditor independence issue described above. In that letter, the SEC indicated that it would not recommend enforcement action against the fund group if the auditor is not in compliance with the Loan Rule provided that: (1) the auditor has complied with PCAOB Rule 3526(b)(1) and
3526(b)(2); (2) the auditor’s non-compliance under the Loan Rule is with respect to certain lending relationships; and (3) notwithstanding such non-compliance, the auditor has concluded that it is objective and impartial with respect to the issues encompassed within its engagement as auditor of the funds. Based on information provided by D&T, the requirements of the no-action letter appear to be met with respect to D&T’s lending relationships described above. The SEC has indicated that the no-action relief will expire 18 months from its issuance.
(a)-(d)
The following table presents the aggregate fees billed to the Fund for the Fund’s fiscal years ended June 30, 2015 and June 30, 2016 by D&T, for professional services rendered for the audit of the Fund’s annual financial statements and fees billed for other services rendered by the principal accountant during those periods.
Parametric Tax-Managed Emerging Markets Fund
| | | | | | | | |
Fiscal Years Ended | | 6/30/2015 | | | 6/30/2016 | |
Audit Fees | | $ | 78,470 | | | $ | 78,070 | |
Audit-Related Fees(1) | | $ | 0 | | | $ | 0 | |
Tax Fees(2) | | $ | 18,339 | | | $ | 26,814 | |
All Other Fees(3) | | $ | 0 | | | $ | 0 | |
| | | | | | | | |
Total(4) | | $ | 96,809 | | | $ | 104,884 | |
| | | | | | | | |
| (1) | Audit-related fees consist of the aggregate fees billed for assurance and related services that are reasonably related to the performance of the audit of the registrant’s financial statements and are not reported under the category of audit fees. |
| (2) | Tax fees consist of the aggregate fees billed for professional services rendered by the principal accountant relating to tax compliance, tax advice, and tax planning and specifically include fees for tax return preparation and other related tax compliance/planning matters. |
| (3) | All other fees consist of the aggregate fees billed for products and services provided by the registrant’s principal accountant other than audit, audit-related, and tax services. |
| (4) | Fees are paid by the Fund’s administrator pursuant to the terms of its administrative services agreement. |
The Series comprising the Trust have varying fiscal year ends (June 30 and October 31). The following table presents the aggregate audit, audit-related, tax, and other fees billed to all of the Series in the Trust by D&T, for the last two fiscal years of each Series.
| | | | | | | | | | | | | | | | |
Fiscal Years Ended | | 10/31/14 | | | 6/30/15 | | | 10/31/15 | | | 6/30/16 | |
Audit Fees | | $ | 22,820 | | | $ | 78,470 | | | $ | 26,320 | | | $ | 78,070 | |
Audit-Related Fees(1) | | $ | 0 | | | $ | 0 | | | $ | 0 | | | $ | 0 | |
Tax Fees(2) | | $ | 13,780 | | | $ | 18,339 | | | $ | 13,678 | | | $ | 26,814 | |
All Other Fees(3) | | $ | 0 | | | $ | 0 | | | $ | 0 | | | $ | 0 | |
| | | | | | | | | | | | | | | | |
Total | | $ | 36,600 | | | $ | 96,809 | (4) | | $ | 39,998 | | | $ | 104,884 | |
| | | | | | | | | | | | | | | | |
| (1) | Audit-related fees consist of the aggregate fees billed for assurance and related services that are reasonable related to the performance of the audit of financial statements and are not reported under the category of audit fees. |
| (2) | Tax fees consist of the aggregate fees billed for professional services rendered by the principal accountant relating to tax compliance, tax advice, and tax planning and specifically include fees for tax return preparation and other related tax compliance/planning matters. |
| (3) | All other fees consist of the aggregate fees billed for products and services provided by the principal accountant other than audit, audit-related, and tax services. |
| (4) | Fees are paid by the Fund’s administrator pursuant to the terms of its administrative services agreement. |
(e)(1) The registrant’s audit committee has adopted policies and procedures relating to the pre-approval of services provided by the registrant’s principal accountant (the “Pre-Approval Policies”). The Pre-Approval
Policies establish a framework intended to assist the audit committee in the proper discharge of its pre-approval responsibilities. As a general matter, the Pre-Approval Policies (i) specify certain types of audit, audit-related, tax, and other services determined to be pre-approved by the audit committee; and (ii) delineate specific procedures governing the mechanics of the pre-approval process, including the approval and monitoring of audit and non-audit service fees. Unless a service is specifically pre-approved under the Pre-Approval Policies, it must be separately pre-approved by the Audit Committee.
The Pre-Approval Policies and the types of audit and non-audit services pre-approved therein must be reviewed and ratified by the registrant’s audit committee at least annually. The registrant’s audit committee maintains full responsibility for the appointment, compensation, and oversight of the work of the registrant’s principal accountant.
(e)(2) No services described in paragraphs (b)-(d) above were approved by the registrant’s audit committee pursuant to the “de minimis exception” set forth in Rule 2-01 (c)(7)(i)(C) of Regulation S-X.
(f) Not applicable.
(g) The following table presents (i) the aggregate non-audit fees (i.e., fees for audit-related, tax, and other services) billed to all of the Series in the Trust by each Series respective principal accountant for the last two fiscal years of each Series; and (ii) the aggregate non-audit fees (i.e., fees for audit-related, tax, and other services) billed to the Eaton Vance organization by each Series respective principal accountant for the last two fiscal years of each Series.
| | | | | | | | | | | | | | | | |
Fiscal Years Ended | | 10/31/14 | | | 6/30/15 | | | 10/31/15 | | | 6/30/16 | |
Registrant(1) | | $ | 13,780 | | | $ | 18,339 | | | $ | 13,678 | | | $ | 26,814 | |
Eaton Vance(2) | | $ | 99,750 | | | $ | 76,000 | | | $ | 46,000 | | | $ | 56,434 | |
| (1) | Includes all of the Series in the Trust. During the fiscal years reported above, certain of the Funds were “feeder” funds in a “master-feeder” fund structure or funds of funds. |
| (2) | Various subsidiaries of Eaton Vance Corp. act in either an investment advisory and/or service provider capacity with respect to the Series and/or their respective “master” funds (if applicable). |
(h) The registrant’s audit committee has considered whether the provision by the registrant’s principal accountant of non-audit services to the registrant’s investment adviser and any entity controlling, controlled by, or under common control with the adviser that provides ongoing services to the registrant that were not pre-approved pursuant to Rule 2-01(c)(7)(ii) of Regulation S-X is compatible with maintaining the principal accountant’s independence.
Item 5. Audit Committee of Listed Registrants
Not applicable.
Item 6. Schedule of Investments
Please see schedule of investments contained in the Report to Stockholders included under Item 1 of this Form N-CSR.
Item 7. Disclosure of Proxy Voting Policies and Procedures for Closed-End Management Investment Companies
Not applicable.
Item 8. Portfolio Managers of Closed-End Management Investment Companies
Not applicable.
Item 9. Purchases of Equity Securities by Closed-End Management Investment Company and Affiliated Purchasers
Not applicable.
Item 10. Submission of Matters to a Vote of Security Holders
No material changes.
Item 11. Controls and Procedures
(a) It is the conclusion of the registrant’s principal executive officer and principal financial officer that the effectiveness of the registrant’s current disclosure controls and procedures (such disclosure controls and procedures having been evaluated within 90 days of the date of this filing) provide reasonable assurance that the information required to be disclosed by the registrant has been recorded, processed, summarized and reported within the time period specified in the Commission’s rules and forms and that the information required to be disclosed by the registrant has been accumulated and communicated to the registrant’s principal executive officer and principal financial officer in order to allow timely decisions regarding required disclosure.
(b) There have been no changes in the registrant’s internal controls over financial reporting during the second fiscal quarter of the period covered by this report that has materially affected, or is reasonably likely to materially affect, the registrant’s internal control over financial reporting.
Item 12. Exhibits
| | |
| (a)(1) | | Registrant’s Code of Ethics – Not applicable (please see Item 2). |
| (a)(2)(i) | | Treasurer’s Section 302 certification. |
| (a)(2)(ii) | | President’s Section 302 certification. |
| (b) | | Combined Section 906 certification. |
Signatures
Pursuant to the requirements of the Securities Exchange Act of 1934 and the Investment Company Act of 1940, the registrant has duly caused this report to be signed on its behalf by the undersigned, thereunto duly authorized.
Eaton Vance Series Trust II
| | |
| By: | | /s/ Michael W. Weilheimer |
| | Michael W. Weilheimer |
| | President |
| |
| Date: | | August 18, 2016 |
Pursuant to the requirements of the Securities Exchange Act of 1934 and the Investment Company Act of 1940, this report has been signed below by the following persons on behalf of the registrant and in the capacities and on the dates indicated.
| | |
| By: | | /s/ James F. Kirchner |
| | James F. Kirchner |
| | Treasurer |
| |
| Date: | | August 18, 2016 |
| |
| By: | | /s/ Michael W. Weilheimer |
| | Michael W. Weilheimer |
| | President |
| |
| Date: | | August 18, 2016 |