UNITED STATES
SECURITIES AND EXCHANGE COMMISSION
Washington, D.C. 20549
FORM N-CSR
CERTIFIED SHAREHOLDER REPORT OF REGISTERED
MANAGEMENT INVESTMENT COMPANIES
Investment Company Act file number: 811-04041
STATE STREET VARIABLE INSURANCE SERIES FUNDS, INC.
(Exact name of registrant as specified in charter)
1600 Summer Street, Stamford, Connecticut 06905
(Address of principal executive offices) (Zip code)
| | |
| (Name and Address of Agent for Service) | | Copy to: |
| |
Joshua A. Weinberg, Esq. Managing Director and Managing Counsel c/o SSGA Funds Management, Inc. One Iron Street Boston, Massachusetts 02210 | | Christopher E. Palmer, Esq. Goodwin Procter LLP 901 New York Avenue, N.W. Washington, DC 20001 |
Registrant’s telephone number, including area code: 800-242-0134
Date of fiscal year end: December 31
Date of reporting period: June 30, 2018
| Item 1. | Shareholder Reports. |
Semi-Annual Report
June 30, 2018
State Street S&P 500 Index V.I.S. Fund

State Street S&P 500 Index V.I.S. Fund
Semi-Annual Report
June 30, 2018 (Unaudited)
Table of Contents
This report is prepared for Policyholders of certain variable contracts and may be distributed to others only if preceded or accompanied by the variable contract’s current prospectus and the current summary prospectus of the Fund available for investments thereunder.
State Street S&P 500 Index V.I.S. Fund
Fund Information — June 30, 2018 (Unaudited)
Total return performance shown in this report for the Fund takes into account changes in share price and assumes reinvestment of dividends and capital gains distributions, if any. Total returns shown are net of Fund fees and expenses but do not reflect fees and charges associated with the variable contracts such as administrative fees, account charges and surrender charges, which, if reflected, would reduce the Fund’s total returns for all periods shown.
The performance data quoted represents past performance; past performance does not guarantee future results. Investment return and principal value will fluctuate so your shares, when redeemed, may be worth more or less than their original cost. Current performance may be higher or lower than the performance data quoted. Periods less than one year are not annualized. Please call toll-free (800) 242-0134 or visit the Fund’s website at http://www.ssga.com/geam for the most recent month-end performance data.
An investment in the Fund is not a deposit of any bank and is not insured or guaranteed by the Federal Deposit Insurance Corporation (“FDIC”) or any other government agency. An investment in the Fund is subject to risk, including possible loss of principal invested.
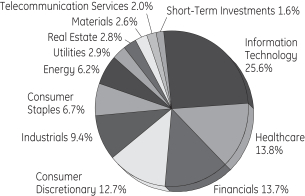
Sector Allocation
Portfolio Composition as a % of Fair Value of $184,870 (in thousands) as of June 30, 2018 (a)(b)
Top Ten Largest Holdings
as of June 30, 2018 (as a % of Fair Value) (a)(b)
| | | | |
Apple Inc. | | | 3.88 | % |
Microsoft Corp. | | | 3.23 | % |
Amazon.com Inc. | | | 2.92 | % |
Facebook Inc., Class A | | | 2.00 | % |
Berkshire Hathaway Inc., Class B | | | 1.54 | % |
JPMorgan Chase & Co. | | | 1.52 | % |
Exxon Mobil Corp. | | | 1.50 | % |
Alphabet Inc., Class A | | | 1.45 | % |
Alphabet Inc., Class C | | | 1.44 | % |
Johnson & Johnson | | | 1.39 | % |
| (a) | Fair Value basis is inclusive of short-term investment in State Street Institutional U.S. Government Money Market Fund Premier Class. |
| (b) | The securities information regarding holdings, allocations and other characteristics is presented to illustrate examples of securities that the Fund has bought and the diversity of areas in which the Fund may invest as of a particular date. It may not be representative of the Fund’s current or future investments and should not be construed as a recommendation to purchase or sell a particular security. |
State Street Global Advisors Funds Distributors, LLC, member of FINRA & SIPC is the principal underwriter and distributor of the State Street V.I.S. Funds and an indirect wholly-owned subsidiary of State Street Corporation. References to State Street may include State Street Corporation and its affiliates. The Funds pay State Street Bank and Trust Company for its services as custodian and Fund Accounting agent, and pay SSGA Funds Management, Inc. for investment advisory and administrative services.
| | | | |
| State Street S&P 500 Index V.I.S. Fund | | | 1 | |
State Street S&P 500 Index V.I.S. Fund
Understanding Your Fund’s Expenses — (Unaudited)
As a shareholder of the Fund, you incur ongoing costs. Ongoing costs include portfolio management fees, professional fees, administrative fees and other Fund expenses. The following example is intended to help you understand your ongoing costs (in dollars) of investing in the Fund and to compare these costs with the ongoing costs of investing in other mutual funds.
To illustrate these ongoing costs, we have provided an example and calculated the expenses paid by investors in the Fund during the period. The information in the following table is based on an investment of $1,000, which is invested at the beginning of the period and held for the entire six-month period ended June 30, 2018.
Actual Expenses
The first section of the table provides information about actual account values and actual expenses. You may use the information in this section, together with the amount you invested, to estimate the expenses that you paid over the period. To do so, simply divide your account value by $1,000 (for example, an $8,600 account value divided by $1,000 = 8.6), then multiply the result by the number given under the heading “Expenses paid during the period” to estimate the expenses you paid on your account during the period.
Hypothetical Example for Comparison Purposes
The second section of the table provides information about hypothetical account values and hypothetical expenses based on the Fund’s actual expense ratio and an assumed rate of return of 5% per year before expenses, which is not the Fund’s actual return. The hypothetical account values and expenses may not be used to estimate the actual ending account balance or expenses you paid for the period. You may use this information to compare the ongoing costs of investing in the Fund and other funds. To do so, compare this 5% hypothetical example with the 5% hypothetical examples that appear in the shareholder reports of other funds.
Please note that the expenses shown in the table are meant to highlight and help you compare ongoing costs only and do not reflect transaction costs, such as sales charges or redemption fees, if any. Therefore, the second section of the table is useful in comparing ongoing costs only, and will not help you determine the relative total costs of owning different funds. Additionally, the expenses shown do not reflect the fees or charges associated with variable contracts through which shares of the Fund are offered.
| | | | | | | | |
| | | Actual
Fund Return | | | Hypothetical
5% Return
(2.5% for
the period) | |
Actual Fund Return | | | | | | | | |
Beginning Account Value January 1, 2018 | | $ | 1,000.00 | | | $ | 1,024.70 | |
Ending Account Value | | | | | | | | |
June 30, 2018 | | $ | 1,000.00 | | | $ | 1,023.06 | |
Expenses paid during the period* | | $ | 1.76 | | | $ | 1.76 | |
| * | Expenses are equal to the Fund’s annualized expense ratio of 0.35% (for the period January 1, 2017-June 30, 2017), multiplied by the average account value over the period, multiplied by 181/365 (to reflect the one-half year period). |
| | |
| 2 | | State Street S&P 500 Index V.I.S. Fund |
State Street S&P 500 Index V.I.S. Fund
Schedule of Investments — June 30, 2018 (Unaudited)
| | | | | | | | |
| | | Number
of Shares | | | Fair Value $ | |
| | | | | | | | |
| | | | | | | | |
| Common Stock - 98.3%† | |
Advertising - 0.1% | | | | | | | | |
Omnicom Group Inc. | | | 1,743 | | | | 132,938 | |
The Interpublic Group of Companies Inc. | | | 2,720 | | | | 63,757 | |
| | | | | | | | |
| | | | 196,695 | |
| | | | | | | | |
|
Aerospace & Defense - 2.6% | |
Arconic Inc. | | | 3,788 | | | | 64,434 | |
General Dynamics Corp. | | | 2,212 | | | | 412,339 | |
Harris Corp. | | | 900 | | | | 130,086 | |
Huntington Ingalls Industries Inc. | | | 400 | | | | 86,716 | |
L3 Technologies Inc. | | | 589 | | | | 113,276 | |
Lockheed Martin Corp. | | | 1,968 | | | | 581,406 | |
Northrop Grumman Corp. | | | 1,397 | | | | 429,857 | |
Raytheon Co. | | | 2,261 | | | | 436,780 | |
Rockwell Collins Inc. | | | 1,236 | | | | 166,464 | |
Textron Inc. | | | 1,925 | | | | 126,877 | |
The Boeing Co. | | | 4,284 | | | | 1,437,325 | |
TransDigm Group Inc. | | | 333 | | | | 114,932 | |
United Technologies Corp. | | | 5,789 | | | | 723,799 | |
| | | | | | | | |
| | | | 4,824,291 | |
| | | | | | | | |
|
Agricultural & Farm Machinery - 0.2% | |
Deere & Co. | | | 2,606 | | | | 364,319 | |
| | | | | | | | |
|
Agricultural Products - 0.1% | |
Archer-Daniels-Midland Co. | | | 4,324 | | | | 198,169 | |
| | | | | | | | |
|
Air Freight & Logistics - 0.7% | |
CH Robinson Worldwide Inc. | | | 1,229 | | | | 102,818 | |
Expeditors International of Washington Inc. | | | 1,399 | | | | 102,267 | |
FedEx Corp. | | | 1,988 | | | | 451,396 | |
United Parcel Service Inc., Class B | | | 5,540 | | | | 588,514 | |
| | | | | | | | |
| | | | 1,244,995 | |
| | | | | | | | |
|
Airlines - 0.4% | |
Alaska Air Group Inc. | | | 1,000 | | | | 60,390 | |
American Airlines Group Inc. | | | 3,098 | | | | 117,600 | |
Delta Air Lines Inc. | | | 5,143 | | | | 254,784 | |
Southwest Airlines Co. | | | 4,249 | | | | 216,189 | |
United Continental Holdings Inc. (a) | | | 1,850 | | | | 129,001 | |
| | | | | | | | |
| | | | 777,964 | |
| | | | | | | | |
|
Alternative Carriers - 0.1% | |
CenturyLink Inc. | | | 7,333 | | | | 136,687 | |
| | | | | | | | |
|
Aluminum - 0.0%* | |
Alcoa Corp. (a) | | | 1 | | | | 47 | |
| | | | | | | | |
| | | | | | | | |
| | | Number
of Shares | | | Fair Value $ | |
| | | | | | | | |
Apparel Retail - 0.5% | |
Foot Locker Inc. | | | 800 | | | | 42,120 | |
L Brands Inc. | | | 2,188 | | | | 80,694 | |
Ross Stores Inc. | | | 2,896 | | | | 245,436 | |
The Gap Inc. | | | 1,676 | | | | 54,286 | |
The TJX Companies Inc. | | | 4,969 | | | | 472,949 | |
| | | | | | | | |
| | | | 895,485 | |
| | | | | | | | |
|
Apparel, Accessories & Luxury Goods - 0.4% | |
Hanesbrands Inc. | | | 2,400 | | | | 52,848 | |
Michael Kors Holdings Ltd. (a) | | | 1,222 | | | | 81,385 | |
PVH Corp. | | | 669 | | | | 100,163 | |
Ralph Lauren Corp. | | | 400 | | | | 50,288 | |
Tapestry Inc. | | | 2,289 | | | | 106,919 | |
Under Armour Inc., Class A (a) | | | 1,700 | | | | 38,216 | |
Under Armour Inc., Class C (a) | | | 1,712 | | | | 36,089 | |
VF Corp. | | | 2,702 | | | | 220,267 | |
| | | | | | | | |
| | | | 686,175 | |
| | | | | | | | |
|
Application Software - 1.5% | |
Adobe Systems Inc. (a) | | | 3,909 | | | | 953,053 | |
ANSYS Inc. (a) | | | 700 | | | | 121,926 | |
Autodesk Inc. (a) | | | 1,648 | | | | 216,036 | |
Cadence Design Systems Inc. (a) | | | 2,200 | | | | 95,282 | |
Citrix Systems Inc. (a) | | | 1,107 | | | | 116,058 | |
Intuit Inc. | | | 1,900 | | | | 388,180 | |
salesforce.com Inc. (a) | | | 5,509 | | | | 751,428 | |
Synopsys Inc. (a) | | | 1,199 | | | | 102,598 | |
Verint Systems Inc. (a) | | | 1 | | | | 44 | |
| | | | | | | | |
| | | | 2,744,605 | |
| | | | | | | | |
|
Asset Management & Custody Banks - 1.1% | |
Affiliated Managers Group Inc. | | | 400 | | | | 59,468 | |
Ameriprise Financial Inc. | | | 1,205 | | | | 168,555 | |
BlackRock Inc. | | | 976 | | | | 487,063 | |
Franklin Resources Inc. | | | 2,600 | | | | 83,330 | |
Invesco Ltd. | | | 3,250 | | | | 86,320 | |
Northern Trust Corp. | | | 1,696 | | | | 174,501 | |
State Street Corp. (b) | | | 2,911 | | | | 270,985 | |
T Rowe Price Group Inc. | | | 1,940 | | | | 225,215 | |
The Bank of New York Mellon Corp. | | | 8,176 | | | | 440,932 | |
| | | | | | | | |
| | | | 1,996,369 | |
| | | | | | | | |
|
Auto Parts & Equipment - 0.1% | |
Aptiv PLC | | | 2,056 | | | | 188,391 | |
BorgWarner Inc. | | | 1,747 | | | | 75,401 | |
| | | | | | | | |
| | | | 263,792 | |
| | | | | | | | |
|
Automobile Manufacturers - 0.4% | |
Ford Motor Co. | | | 31,182 | | | | 345,185 | |
See Notes to Schedule of Investments and Notes to Financial Statements.
| | | | |
| State Street S&P 500 Index V.I.S. Fund | | | 3 | |
State Street S&P 500 Index V.I.S. Fund
Schedule of Investments, continued — June 30, 2018 (Unaudited)
| | | | | | | | |
| | | Number
of Shares | | | Fair Value $ | |
| | | | | | | | |
| | | | | | | | |
General Motors Co. | | | 9,986 | | | | 393,448 | |
| | | | | | | | |
| | | | 738,633 | |
| | | | | | | | |
|
Automotive Retail - 0.3% | |
Advance Auto Parts Inc. | | | 622 | | | | 84,406 | |
AutoZone Inc. (a) | | | 198 | | | | 132,844 | |
CarMax Inc. (a) | | | 1,390 | | | | 101,289 | |
O’Reilly Automotive Inc. (a) | | | 638 | | | | 174,538 | |
| | | | | | | | |
| | | | 493,077 | |
| | | | | | | | |
|
Biotechnology - 2.5% | |
AbbVie Inc. | | | 11,934 | | | | 1,105,685 | |
Alexion Pharmaceuticals Inc. (a) | | | 1,701 | | | | 211,179 | |
Amgen Inc. | | | 5,280 | | | | 974,635 | |
Biogen Inc. (a) | | | 1,658 | | | | 481,218 | |
Celgene Corp. (a) | | | 5,457 | | | | 433,395 | |
Gilead Sciences Inc. | | | 10,205 | | | | 722,922 | |
Incyte Corp. (a) | | | 1,400 | | | | 93,800 | |
Regeneron Pharmaceuticals Inc. (a) | | | 550 | | | | 189,745 | |
Vertex Pharmaceuticals Inc. (a) | | | 1,900 | | | | 322,924 | |
| | | | | | | | |
| | | | 4,535,503 | |
| | | | | | | | |
|
Brewers - 0.1% | |
Molson Coors Brewing Co., Class B | | | 1,598 | | | | 108,728 | |
| | | | | | | | |
|
Broadcasting - 0.1% | |
CBS Corp., Class B | | | 2,596 | | | | 145,947 | |
Discovery Inc., Class A (a) | | | 1,497 | | | | 41,168 | |
Discovery Inc., Class C (a) | | | 2,636 | | | | 67,218 | |
| | | | | | | | |
| | | | 254,333 | |
| | | | | | | | |
|
Building Products - 0.3% | |
Allegion PLC | | | 733 | | | | 56,705 | |
AO Smith Corp. | | | 1,300 | | | | 76,895 | |
Fortune Brands Home & Security Inc. | | | 1,000 | | | | 53,690 | |
Johnson Controls International PLC | | | 7,042 | | | | 235,555 | |
Masco Corp. | | | 2,542 | | | | 95,121 | |
| | | | | | | | |
| | | | 517,966 | |
| | | | | | | | |
|
Cable & Satellite - 0.9% | |
Charter Communications Inc., Class A (a) | | | 1,500 | | | | 439,815 | |
Comcast Corp., Class A | | | 36,253 | | | | 1,189,461 | |
DISH Network Corp., Class A (a) | | | 2,100 | | | | 70,581 | |
| | | | | | | | |
| | | | 1,699,857 | |
| | | | | | | | |
|
Casinos & Gaming - 0.1% | |
MGM Resorts International | | | 4,200 | | | | 121,926 | |
| | | | | | | | |
| | | Number
of Shares | | | Fair Value $ | |
| | | | | | | | |
Wynn Resorts Ltd. | | | 591 | | | | 98,898 | |
| | | | | | | | |
| | | | 220,824 | |
| | | | | | | | |
|
Commodity Chemicals - 0.2% | |
LyondellBasell Industries N.V., Class A | | | 2,610 | | | | 286,709 | |
| | | | | | | | |
|
Communications Equipment - 1.0% | |
Cisco Systems Inc. | | | 37,161 | | | | 1,599,038 | |
F5 Networks Inc. (a) | | | 400 | | | | 68,980 | |
Juniper Networks Inc. | | | 2,800 | | | | 76,776 | |
Motorola Solutions Inc. | | | 1,244 | | | | 144,764 | |
| | | | | | | | |
| | | | 1,889,558 | |
| | | | | | | | |
|
Computer & Electronics Retail - 0.1% | |
Best Buy Company Inc. | | | 1,895 | | | | 141,329 | |
| | | | | | | | |
|
Construction & Engineering - 0.1% | |
Fluor Corp. | | | 1,178 | | | | 57,463 | |
Jacobs Engineering Group Inc. | | | 850 | | | | 53,966 | |
Quanta Services Inc. (a) | | | 1,200 | | | | 40,080 | |
| | | | | | | | |
| | | | 151,509 | |
| | | | | | | | |
|
Construction Machinery & Heavy Trucks - 0.5% | |
Caterpillar Inc. | | | 4,808 | | | | 652,301 | |
Cummins Inc. | | | 1,256 | | | | 167,048 | |
PACCAR Inc. | | | 2,703 | | | | 167,478 | |
| | | | | | | | |
| | | | 986,827 | |
| | | | | | | | |
|
Construction Materials - 0.1% | |
Martin Marietta Materials Inc. | | | 500 | | | | 111,665 | |
Vulcan Materials Co. | | | 973 | | | | 125,575 | |
| | | | | | | | |
| | | | 237,240 | |
| | | | | | | | |
|
Consumer Electronics - 0.0%* | |
Garmin Ltd. | | | 1,000 | | | | 61,000 | |
| | | | | | | | |
|
Consumer Finance - 0.7% | |
American Express Co. | | | 5,758 | | | | 564,284 | |
Capital One Financial Corp. | | | 3,773 | | | | 346,739 | |
Discover Financial Services | | | 2,677 | | | | 188,487 | |
Synchrony Financial | | | 5,358 | | | | 178,850 | |
| | | | | | | | |
| | | | 1,278,360 | |
| | | | | | | | |
|
Copper - 0.1% | |
Freeport-McMoRan Inc. | | | 10,498 | | | | 181,195 | |
| | | | | | | | |
|
Data Processing & Outsourced Services - 3.2% | |
Alliance Data Systems Corp. | | | 425 | | | | 99,110 | |
Automatic Data Processing Inc. | | | 3,485 | | | | 467,478 | |
Broadridge Financial Solutions Inc. | | | 900 | | | | 103,590 | |
Fidelity National Information Services Inc. | | | 2,600 | | | | 275,678 | |
See Notes to Schedule of Investments and Notes to Financial Statements.
| | |
| 4 | | State Street S&P 500 Index V.I.S. Fund |
State Street S&P 500 Index V.I.S. Fund
Schedule of Investments, continued — June 30, 2018 (Unaudited)
| | | | | | | | |
| | | Number
of Shares | | | Fair Value $ | |
| | | | | | | | |
| | | | | | | | |
Fiserv Inc. (a) | | | 3,358 | | | | 248,794 | |
FleetCor Technologies Inc. (a) | | | 700 | | | | 147,455 | |
Global Payments Inc. | | | 1,263 | | | | 140,812 | |
Mastercard Inc., Class A | | | 7,212 | | | | 1,417,302 | |
Paychex Inc. | | | 2,534 | | | | 173,199 | |
PayPal Holdings Inc. (a) | | | 8,960 | | | | 746,099 | |
The Western Union Co. | | | 3,224 | | | | 65,544 | |
Total System Services Inc. | | | 1,302 | | | | 110,045 | |
Visa Inc., Class A | | | 14,020 | | | | 1,856,949 | |
| | | | | | | | |
| | | | 5,852,055 | |
| | | | | | | | |
|
Department Stores - 0.1% | |
Kohl’s Corp. | | | 1,273 | | | | 92,802 | |
Macy’s Inc. | | | 2,334 | | | | 87,361 | |
Nordstrom Inc. | | | 992 | | | | 51,366 | |
| | | | | | | | |
| | | | 231,529 | |
| | | | | | | | |
|
Distillers & Vintners - 0.2% | |
Brown-Forman Corp., Class B | | | 1,925 | | | | 94,344 | |
Constellation Brands Inc., Class A | | | 1,279 | | | | 279,935 | |
| | | | | | | | |
| | | | 374,279 | |
| | | | | | | | |
|
Distributors - 0.1% | |
Genuine Parts Co. | | | 1,145 | | | | 105,099 | |
LKQ Corp. (a) | | | 2,452 | | | | 78,219 | |
| | | | | | | | |
| | | | 183,318 | |
| | | | | | | | |
|
Diversified Banks - 4.8% | |
Bank of America Corp. | | | 74,691 | | | | 2,105,539 | |
Citigroup Inc. | | | 20,117 | | | | 1,346,230 | |
JPMorgan Chase & Co. | | | 27,014 | | | | 2,814,859 | |
U.S. Bancorp | | | 12,449 | | | | 622,699 | |
Wells Fargo & Co. | | | 34,643 | | | | 1,920,608 | |
| | | | | | | | |
| | | | 8,809,935 | |
| | | | | | | | |
|
Diversified Chemicals - 0.7% | |
DowDuPont Inc. | | | 18,425 | | | | 1,214,576 | |
Eastman Chemical Co. | | | 1,118 | | | | 111,755 | |
| | | | | | | | |
| | | | 1,326,331 | |
| | | | | | | | |
|
Diversified Support Services - 0.1% | |
Cintas Corp. | | | 664 | | | | 122,886 | |
Copart Inc. (a) | | | 1,600 | | | | 90,496 | |
| | | | | | | | |
| | | | 213,382 | |
| | | | | | | | |
|
Drug Retail - 0.2% | |
Walgreens Boots Alliance Inc. | | | 6,613 | | | | 396,879 | |
| | | | | | | | |
|
Electric Utilities - 1.8% | |
Alliant Energy Corp. | | | 1,600 | | | | 67,712 | |
American Electric Power Company Inc. | | | 3,883 | | | | 268,898 | |
| | | | | | | | |
| | | Number
of Shares | | | Fair Value $ | |
| | | | | | | | |
Duke Energy Corp. | | | 5,404 | | | | 427,348 | |
Edison International | | | 2,742 | | | | 173,486 | |
Entergy Corp. | | | 1,553 | | | | 125,467 | |
Evergy Inc. | | | 2,199 | | | | 123,474 | |
Eversource Energy | | | 2,630 | | | | 154,144 | |
Exelon Corp. | | | 7,834 | | | | 333,729 | |
FirstEnergy Corp. | | | 3,754 | | | | 134,806 | |
NextEra Energy Inc. | | | 3,702 | | | | 618,345 | |
PG&E Corp. | | | 4,254 | | | | 181,050 | |
Pinnacle West Capital Corp. | | | 900 | | | | 72,504 | |
PPL Corp. | | | 5,737 | | | | 163,791 | |
The Southern Co. | | | 8,058 | | | | 373,166 | |
Xcel Energy Inc. | | | 3,780 | | | | 172,671 | |
| | | | | | | | |
| | | | 3,390,591 | |
| | | | | | | | |
|
Electrical Components & Equipment - 0.5% | |
AMETEK Inc. | | | 1,800 | | | | 129,888 | |
Eaton Corporation PLC | | | 3,345 | | | | 250,005 | |
Emerson Electric Co. | | | 5,126 | | | | 354,412 | |
Rockwell Automation Inc. | | | 1,019 | | | | 169,388 | |
| | | | | | | | |
| | | | 903,693 | |
| | | | | | | | |
|
Electronic Components - 0.2% | |
Amphenol Corp., Class A | | | 2,400 | | | | 209,160 | |
Corning Inc. | | | 6,434 | | | | 176,999 | |
| | | | | | | | |
| | | | 386,159 | |
| | | | | | | | |
|
Electronic Equipment & Instruments - 0.0%* | |
FLIR Systems Inc. | | | 1,100 | | | | 57,167 | |
| | | | | | | | |
|
Electronic Manufacturing Services - 0.2% | |
IPG Photonics Corp. (a) | | | 300 | | | | 66,189 | |
TE Connectivity Ltd. | | | 2,854 | | | | 257,031 | |
| | | | | | | | |
| | | | 323,220 | |
| | | | | | | | |
|
Environmental & Facilities Services - 0.2% | |
Republic Services Inc. | | | 1,915 | | | | 130,909 | |
Stericycle Inc. (a) | | | 800 | | | | 52,232 | |
Waste Management Inc. | | | 3,103 | | | | 252,398 | |
| | | | | | | | |
| | | | 435,539 | |
| | | | | | | | |
|
Fertilizers & Agricultural Chemicals - 0.1% | |
CF Industries Holdings Inc. | | | 1,685 | | | | 74,814 | |
FMC Corp. | | | 1,122 | | | | 100,094 | |
The Mosaic Co. | | | 2,500 | | | | 70,125 | |
| | | | | | | | |
| | | | 245,033 | |
| | | | | | | | |
|
Financial Exchanges & Data - 0.9% | |
Cboe Global Markets Inc. | | | 800 | | | | 83,256 | |
CME Group Inc. | | | 2,674 | | | | 438,322 | |
Intercontinental Exchange Inc. | | | 4,655 | | | | 342,375 | |
Moody’s Corp. | | | 1,329 | | | | 226,674 | |
See Notes to Schedule of Investments and Notes to Financial Statements.
| | | | |
| State Street S&P 500 Index V.I.S. Fund | | | 5 | |
State Street S&P 500 Index V.I.S. Fund
Schedule of Investments, continued — June 30, 2018 (Unaudited)
| | | | | | | | |
| | | Number
of Shares | | | Fair Value $ | |
| | | | | | | | |
| | | | | | | | |
MSCI Inc. | | | 700 | | | | 115,801 | |
Nasdaq Inc. | | | 968 | | | | 88,350 | |
S&P Global Inc. | | | 2,026 | | | | 413,081 | |
| | | | | | | | |
| | | | 1,707,859 | |
| | | | | | | | |
|
Food Distributors - 0.1% | |
Sysco Corp. | | | 3,749 | | | | 256,019 | |
| | | | | | | | |
|
Food Retail - 0.1% | |
The Kroger Co. | | | 6,090 | | | | 173,261 | |
| | | | | | | | |
|
Footwear - 0.4% | |
NIKE Inc., Class B | | | 10,142 | | | | 808,115 | |
| | | | | | | | |
|
General Merchandise Stores - 0.4% | |
Dollar General Corp. | | | 2,100 | | | | 207,060 | |
Dollar Tree Inc. (a) | | | 1,948 | | | | 165,580 | |
Target Corp. | | | 4,295 | | | | 326,935 | |
| | | | | | | | |
| | | | 699,575 | |
| | | | | | | | |
|
Gold - 0.1% | |
Newmont Mining Corp. | | | 4,419 | | | | 166,640 | |
| | | | | | | | |
|
Health Care REITs - 0.2% | |
HCP Inc. | | | 4,074 | | | | 105,191 | |
Ventas Inc. | | | 2,629 | | | | 149,721 | |
Welltower Inc. | | | 3,100 | | | | 194,339 | |
| | | | | | | | |
| | | | 449,251 | |
| | | | | | | | |
|
Healthcare Distributors - 0.3% | |
AmerisourceBergen Corp. | | | 1,261 | | | | 107,525 | |
Cardinal Health Inc. | | | 2,668 | | | | 130,278 | |
Henry Schein Inc. (a) | | | 1,098 | | | | 79,759 | |
McKesson Corp. | | | 1,489 | | | | 198,633 | |
| | | | | | | | |
| | | | | | | 516,195 | |
| | | | | | | | |
| |
Healthcare Equipment - 2.8% | | | | | |
Abbott Laboratories | | | 13,614 | | | | 830,318 | |
ABIOMED Inc. (a) | | | 300 | | | | 122,715 | |
Baxter International Inc. | | | 3,777 | | | | 278,894 | |
Becton Dickinson and Co. | | | 2,083 | | | | 499,003 | |
Boston Scientific Corp. (a) | | | 10,899 | | | | 356,397 | |
Danaher Corp. | | | 4,900 | | | | 483,532 | |
Edwards Lifesciences Corp. (a) | | | 1,600 | | | | 232,912 | |
Hologic Inc. (a) | | | 2,400 | | | | 95,400 | |
IDEXX Laboratories Inc. (a) | | | 700 | | | | 152,558 | |
Intuitive Surgical Inc. (a) | | | 869 | | | | 415,799 | |
Medtronic PLC | | | 10,606 | | | | 907,980 | |
ResMed Inc. | | | 1,200 | | | | 124,296 | |
Stryker Corp. | | | 2,581 | | | | 435,828 | |
Varian Medical Systems Inc. (a) | | | 634 | | | | 72,098 | |
Zimmer Biomet Holdings Inc. | | | 1,640 | | | | 182,762 | |
| | | | | | | | |
| | | | | | | 5,190,492 | |
| | | | | | | | |
| | | | | | | | |
| | | Number
of Shares | | | Fair Value $ | |
| | | | | | | | |
Healthcare Facilities - 0.2% | | | | | |
HCA Healthcare Inc. | | | 2,191 | | | | 224,797 | |
Universal Health Services Inc., Class B | | | 758 | | | | 84,471 | |
| | | | | | | | |
| | | | | | | 309,268 | |
| | | | | | | | |
| |
Healthcare Services - 0.7% | | | | | |
CVS Health Corp. | | | 8,189 | | | | 526,962 | |
DaVita Inc. (a) | | | 1,158 | | | | 80,412 | |
Envision Healthcare Corp. (a) | | | 1,085 | | | | 47,751 | |
Express Scripts Holding Co. (a) | | | 4,488 | | | | 346,518 | |
Laboratory Corporation of America Holdings (a) | | | 800 | | | | 143,624 | |
Quest Diagnostics Inc. | | | 1,000 | | | | 109,940 | |
| | | | | | | | |
| | | | | | | 1,255,207 | |
| | | | | | | | |
| |
Healthcare Supplies - 0.2% | | | | | |
Align Technology Inc. (a) | | | 600 | | | | 205,284 | |
DENTSPLY SIRONA Inc. | | | 2,032 | | | | 88,940 | |
The Cooper Companies Inc. | | | 415 | | | | 97,712 | |
| | | | | | | | |
| | | | | | | 391,936 | |
| | | | | | | | |
| |
Healthcare Technology - 0.1% | | | | | |
Cerner Corp. (a) | | | 2,400 | | | | 143,496 | |
| | | | | | | | |
| |
Home Building - 0.2% | | | | | |
D.R. Horton Inc. | | | 2,900 | | | | 118,900 | |
Lennar Corp., Class A | | | 2,100 | | | | 110,250 | |
PulteGroup Inc. | | | 2,235 | | | | 64,256 | |
| | | | | | | | |
| | | | | | | 293,406 | |
| | | | | | | | |
| |
Home Entertainment Software - 0.5% | | | | | |
Activision Blizzard Inc. | | | 6,100 | | | | 465,552 | |
Electronic Arts Inc. (a) | | | 2,438 | | | | 343,807 | |
Take-Two Interactive Software Inc. (a) | | | 900 | | | | 106,524 | |
| | | | | | | | |
| | | | | | | 915,883 | |
| | | | | | | | |
| |
Home Furnishings - 0.1% | | | | | |
Leggett & Platt Inc. | | | 1,000 | | | | 44,640 | |
Mohawk Industries Inc. (a) | | | 500 | | | | 107,135 | |
| | | | | | | | |
| | | | | | | 151,775 | |
| | | | | | | | |
| |
Home Improvement Retail - 1.3% | | | | | |
Lowe’s Companies Inc. | | | 6,531 | | | | 624,168 | |
The Home Depot Inc. | | | 9,174 | | | | 1,789,847 | |
| | | | | | | | |
| | | | | | | 2,414,015 | |
| | | | | | | | |
| |
Hotel & Resort REITs - 0.1% | | | | | |
Host Hotels & Resorts Inc. | | | 5,617 | | | | 118,350 | |
| | | | | | | | |
See Notes to Schedule of Investments and Notes to Financial Statements.
| | |
| 6 | | State Street S&P 500 Index V.I.S. Fund |
State Street S&P 500 Index V.I.S. Fund
Schedule of Investments, continued — June 30, 2018 (Unaudited)
| | | | | | | | |
| | | Number
of Shares | | | Fair Value $ | |
| | | | | | | | |
| | | | | | | | |
Hotels, Resorts & Cruise Lines - 0.5% | | | | | |
Carnival Corp. | | | 3,300 | | | | 189,123 | |
Hilton Worldwide Holdings Inc. | | | 2,100 | | | | 166,236 | |
Marriott International Inc., Class A | | | 2,382 | | | | 301,561 | |
Norwegian Cruise Line Holdings Ltd. (a) | | | 1,500 | | | | 70,875 | |
Royal Caribbean Cruises Ltd. | | | 1,263 | | | | 130,847 | |
| | | | | | | | |
| | | | | | | 858,642 | |
| | | | | | | | |
| |
Household Appliances - 0.0%* | | | | | |
Whirlpool Corp. | | | 551 | | | | 80,573 | |
| | | | | | | | |
| |
Household Products - 1.4% | | | | | |
Church & Dwight Company Inc. | | | 1,838 | | | | 97,708 | |
Colgate-Palmolive Co. | | | 7,053 | | | | 457,105 | |
Kimberly-Clark Corp. | | | 2,812 | | | | 296,216 | |
The Clorox Co. | | | 1,045 | | | | 141,336 | |
The Procter & Gamble Co. | | | 19,796 | | | | 1,545,276 | |
| | | | | | | | |
| | | | | | | 2,537,641 | |
| | | | | | | | |
| |
Housewares & Specialties - 0.0%* | | | | | |
Newell Brands Inc. | | | 3,534 | | | | 91,142 | |
| | | | | | | | |
|
Human Resource & Employment Services - 0.0%* | |
Robert Half International Inc. | | | 875 | | | | 56,963 | |
| | | | | | | | |
| |
Hypermarkets & Super Centers - 0.9% | | | | | |
Costco Wholesale Corp. | | | 3,509 | | | | 733,311 | |
Walmart Inc. | | | 11,301 | | | | 967,930 | |
| | | | | | | | |
| | | | | | | 1,701,241 | |
| | | | | | | | |
|
Independent Power Producers & Energy Traders - 0.1% | |
AES Corp. | | | 5,500 | | | | 73,755 | |
NRG Energy Inc. | | | 2,538 | | | | 77,917 | |
| | | | | | | | |
| | | | | | | 151,672 | |
| | | | | | | | |
|
Industrial Conglomerates - 1.6% | |
3M Co. | | | 4,691 | | | | 922,813 | |
General Electric Co. | | | 69,062 | | | | 939,934 | |
Honeywell International Inc. | | | 5,891 | | | | 848,599 | |
Roper Technologies Inc. | | | 803 | | | | 221,556 | |
| | | | | | | | |
| | | | | | | 2,932,902 | |
| | | | | | | | |
| |
Industrial Gases - 0.3% | | | | | |
Air Products & Chemicals Inc. | | | 1,741 | | | | 271,126 | |
Praxair Inc. | | | 2,314 | | | | 365,959 | |
| | | | | | | | |
| | | | | | | 637,085 | |
| | | | | | | | |
| |
Industrial Machinery - 0.7% | | | | | |
Dover Corp. | | | 1,309 | | | | 95,819 | |
Flowserve Corp. | | | 900 | | | | 36,360 | |
| | | | | | | | |
| | | Number
of Shares | | | Fair Value $ | |
| | | | | | | | |
Fortive Corp. | | | 2,500 | | | | 192,775 | |
Illinois Tool Works Inc. | | | 2,460 | | | | 340,808 | |
Ingersoll-Rand PLC | | | 2,000 | | | | 179,460 | |
Parker-Hannifin Corp. | | | 1,034 | | | | 161,149 | |
Pentair PLC | | | 1,407 | | | | 59,207 | |
Snap-on Inc. | | | 509 | | | | 81,806 | |
Stanley Black & Decker Inc. | | | 1,099 | | | | 145,958 | |
Xylem Inc. | | | 1,281 | | | | 86,314 | |
| | | | | | | | |
| | | | | | | 1,379,656 | |
| | | | | | | | |
| |
Industrial REITs - 0.2% | | | | | |
Duke Realty Corp. | | | 3,100 | | | | 89,993 | |
Prologis Inc. REIT | | | 4,029 | | | | 264,665 | |
| | | | | | | | |
| | | | | | | 354,658 | |
| | | | | | | | |
| |
Insurance Brokers - 0.5% | | | | | |
Aon PLC | | | 1,934 | | | | 265,287 | |
Arthur J Gallagher & Co. | | | 1,427 | | | | 93,154 | |
Marsh & McLennan Companies Inc. | | | 4,109 | | | | 336,815 | |
Willis Towers Watson PLC | | | 1,058 | | | | 160,393 | |
| | | | | | | | |
| | | | | | | 855,649 | |
| | | | | | | | |
| |
Integrated Oil & Gas - 2.8% | | | | | |
Chevron Corp. | | | 15,049 | | | | 1,902,645 | |
Exxon Mobil Corp. | | | 33,535 | | | | 2,774,350 | |
Occidental Petroleum Corp. | | | 6,157 | | | | 515,218 | |
| | | | | | | | |
| | | | | | | 5,192,213 | |
| | | | | | | | |
|
Integrated Telecommunication Services - 1.9% | |
AT&T Inc. | | | 57,166 | | | | 1,835,600 | |
Verizon Communications Inc. | | | 32,592 | | | | 1,639,704 | |
| | | | | | | | |
| | | | | | | 3,475,304 | |
| | | | | | | | |
|
Internet & Direct Marketing Retail - 4.1% | |
Amazon.com Inc. (a) | | | 3,175 | | | | 5,396,865 | |
Booking Holdings Inc. (a) | | | 373 | | | | 756,105 | |
Expedia Group Inc. | | | 850 | | | | 102,161 | |
Netflix Inc. (a) | | | 3,428 | | | | 1,341,822 | |
TripAdvisor Inc. (a) | | | 650 | | | | 36,212 | |
| | | | | | | | |
| | | | | | | 7,633,165 | |
| | | | | | | | |
| |
Internet Software & Services - 5.2% | | | | | |
Akamai Technologies Inc. (a) | | | 1,333 | | | | 97,615 | |
Alphabet Inc., Class A (a) | | | 2,367 | | | | 2,672,793 | |
Alphabet Inc., Class C (a,c) | | | 2,386 | | | | 2,661,941 | |
eBay Inc. (a) | | | 7,560 | | | | 274,126 | |
Facebook Inc., Class A (a) | | | 18,985 | | | | 3,689,165 | |
Twitter Inc. (a) | | | 5,100 | | | | 222,717 | |
VeriSign Inc. (a) | | | 662 | | | | 90,972 | |
| | | | | | | | |
| | | | | | | 9,709,329 | |
| | | | | | | | |
See Notes to Schedule of Investments and Notes to Financial Statements.
| | | | |
| State Street S&P 500 Index V.I.S. Fund | | | 7 | |
State Street S&P 500 Index V.I.S. Fund
Schedule of Investments, continued — June 30, 2018 (Unaudited)
| | | | | | | | |
| | | Number
of Shares | | | Fair Value $ | |
| | | | | | | | |
| | | | | | | | |
Investment Banking & Brokerage - 1.0% | |
E*TRADE Financial Corp. (a) | | | 2,040 | | �� | | 124,766 | |
Morgan Stanley | | | 10,929 | | | | 518,035 | |
Raymond James Financial Inc. | | | 1,100 | | | | 98,285 | |
The Charles Schwab Corp. | | | 9,611 | | | | 491,122 | |
The Goldman Sachs Group Inc. | | | 2,803 | | | | 618,258 | |
| | | | | | | | |
| | | | | | | 1,850,466 | |
| | | | | | | | |
|
IT Consulting & Other Services - 1.3% | |
Accenture PLC, Class A | | | 5,045 | | | | 825,312 | |
Cognizant Technology Solutions Corp., Class A | | | 4,519 | | | | 356,956 | |
DXC Technology Co. | | | 2,324 | | | | 187,338 | |
Gartner Inc. (a) | | | 800 | | | | 106,320 | |
International Business Machines Corp. | | | 6,745 | | | | 942,276 | |
| | | | | | | | |
| | | | | | | 2,418,202 | |
| | | | | | | | |
|
Leisure Products - 0.1% | |
Hasbro Inc. | | | 996 | | | | 91,941 | |
Mattel Inc. | | | 3,296 | | | | 54,120 | |
| | | | | | | | |
| | | | | | | 146,061 | |
| | | | | | | | |
|
Life & Health Insurance - 0.7% | |
Aflac Inc. | | | 6,348 | | | | 273,091 | |
Brighthouse Financial Inc. (a) | | | 841 | | | | 33,699 | |
Lincoln National Corp. | | | 1,759 | | | | 109,498 | |
MetLife Inc. | | | 7,860 | | | | 342,696 | |
Principal Financial Group Inc. | | | 2,111 | | | | 111,777 | |
Prudential Financial Inc. | | | 3,401 | | | | 318,028 | |
Torchmark Corp. | | | 966 | | | | 78,642 | |
Unum Group | | | 1,589 | | | | 58,777 | |
| | | | | | | | |
| | | | | | | 1,326,208 | |
| | | | | | | | |
|
Life Sciences Tools & Services - 0.9% | |
Agilent Technologies Inc. | | | 2,538 | | | | 156,950 | |
Illumina Inc. (a) | | | 1,201 | | | | 335,427 | |
IQVIA Holdings Inc. (a) | | | 1,200 | | | | 119,784 | |
Mettler-Toledo International Inc. (a) | | | 207 | | | | 119,776 | |
PerkinElmer Inc. | | | 1,011 | | | | 74,036 | |
Thermo Fisher Scientific Inc. | | | 3,228 | | | | 668,648 | |
Waters Corp. (a) | | | 584 | | | | 113,057 | |
| | | | | | | | |
| | | | | | | 1,587,678 | |
| | | | | | | | |
|
Managed Healthcare - 2.0% | |
Aetna Inc. (c) | | | 2,627 | | | | 482,055 | |
Anthem Inc. | | | 1,981 | | | | 471,537 | |
Centene Corp. (a) | | | 1,600 | | | | 197,136 | |
Cigna Corp. | | | 1,909 | | | | 324,435 | |
Humana Inc. | | | 1,027 | | | | 305,666 | |
| | | | | | | | |
| | | Number
of Shares | | | Fair Value $ | |
| | | | | | | | |
UnitedHealth Group Inc. | | | 7,548 | | | | 1,851,826 | |
| | | | | | | | |
| | | | | | | 3,632,655 | |
| | | | | | | | |
|
Metal & Glass Containers - 0.1% | |
Ball Corp. | | | 2,682 | | | | 95,345 | |
| | | | | | | | |
|
Motorcycle Manufacturers - 0.0%* | |
Harley-Davidson Inc. | | | 1,535 | | | | 64,593 | |
| | | | | | | | |
|
Movies & Entertainment - 1.0% | |
The Walt Disney Co. | | | 11,815 | | | | 1,238,330 | |
Twenty-First Century Fox Inc., Class A | | | 8,190 | | | | 406,961 | |
Twenty-First Century Fox Inc., Class B | | | 3,392 | | | | 167,124 | |
Viacom Inc., Class B | | | 2,846 | | | | 85,835 | |
| | | | | | | | |
| | | | | | | 1,898,250 | |
| | | | | | | | |
|
Multi-Line Insurance - 0.4% | |
American International Group Inc. | | | 7,287 | | | | 386,357 | |
Assurant Inc. | | | 500 | | | | 51,745 | |
Loews Corp. | | | 1,862 | | | | 89,897 | |
The Hartford Financial Services Group Inc. | | | 2,944 | | | | 150,527 | |
| | | | | | | | |
| | | | | | | 678,526 | |
| | | | | | | | |
|
Multi-Sector Holdings - 1.6% | |
Berkshire Hathaway Inc., Class B (a) | | | 15,222 | | | | 2,841,186 | |
Jefferies Financial Group Inc. | | | 2,200 | | | | 50,028 | |
| | | | | | | | |
| | | | | | | 2,891,214 | |
| | | | | | | | |
|
Multi-Utilities - 0.9% | |
Ameren Corp. | | | 1,942 | | | | 118,171 | |
CenterPoint Energy Inc. | | | 3,718 | | | | 103,026 | |
CMS Energy Corp. | | | 2,400 | | | | 113,472 | |
Consolidated Edison Inc. | | | 2,555 | | | | 199,239 | |
Dominion Energy Inc. | | | 4,982 | | | | 339,673 | |
DTE Energy Co. | | | 1,366 | | | | 141,558 | |
NiSource Inc. | | | 2,515 | | | | 66,094 | |
Public Service Enterprise Group Inc. | | | 4,192 | | | | 226,955 | |
SCANA Corp. | | | 1,100 | | | | 42,372 | |
Sempra Energy | | | 2,132 | | | | 247,546 | |
WEC Energy Group Inc. | | | 2,474 | | | | 159,944 | |
| | | | | | | | |
| | | | | | | 1,758,050 | |
| | | | | | | | |
|
Office REITs - 0.2% | |
Alexandria Real Estate Equities Inc. | | | 800 | | | | 100,936 | |
Boston Properties Inc. | | | 1,298 | | | | 162,795 | |
SL Green Realty Corp. | | | 800 | | | | 80,424 | |
See Notes to Schedule of Investments and Notes to Financial Statements.
| | |
| 8 | | State Street S&P 500 Index V.I.S. Fund |
State Street S&P 500 Index V.I.S. Fund
Schedule of Investments, continued — June 30, 2018 (Unaudited)
| | | | | | | | |
| | | Number
of Shares | | | Fair Value $ | |
| | | | | | | | |
| | | | | | | | |
Vornado Realty Trust | | | 1,511 | | | | 111,693 | |
| | | | | | | | |
| | | | | | | 455,848 | |
| | | | | | | | |
|
Oil & Gas Drilling - 0.0%* | |
Helmerich & Payne Inc. | | | 900 | | | | 57,384 | |
| | | | | | | | |
|
Oil & Gas Equipment & Services - 0.7% | |
Baker Hughes a GE Co. | | | 2,981 | | | | 98,463 | |
Halliburton Co. | | | 6,850 | | | | 308,661 | |
National Oilwell Varco Inc. | | | 2,846 | | | | 123,516 | |
Schlumberger Ltd. | | | 10,971 | | | | 735,386 | |
TechnipFMC PLC | | | 3,386 | | | | 107,472 | |
| | | | | | | | |
| | | | | | | 1,373,498 | |
| | | | | | | | |
|
Oil & Gas Exploration & Production - 1.6% | |
Anadarko Petroleum Corp. | | | 4,057 | | | | 297,175 | |
Apache Corp. | | | 2,948 | | | | 137,819 | |
Cabot Oil & Gas Corp. | | | 3,600 | | | | 85,680 | |
Cimarex Energy Co. | | | 700 | | | | 71,218 | |
Concho Resources Inc. (a) | | | 1,200 | | | | 166,020 | |
ConocoPhillips | | | 9,340 | | | | 650,251 | |
Devon Energy Corp. | | | 4,192 | | | | 184,280 | |
EOG Resources Inc. | | | 4,500 | | | | 559,935 | |
EQT Corp. | | | 2,014 | | | | 111,133 | |
Hess Corp. | | | 2,049 | | | | 137,058 | |
Marathon Oil Corp. | | | 7,042 | | | | 146,896 | |
Newfield Exploration Co. (a) | | | 1,300 | | | | 39,325 | |
Noble Energy Inc. | | | 3,700 | | | | 130,536 | |
Pioneer Natural Resources Co. | | | 1,400 | | | | 264,936 | |
| | | | | | | | |
| | | | | | | 2,982,262 | |
| | | | | | | | |
|
Oil & Gas Refining & Marketing - 0.7% | |
Andeavor | | | 1,114 | | | | 146,135 | |
HollyFrontier Corp. | | | 1,300 | | | | 88,959 | |
Marathon Petroleum Corp. | | | 3,690 | | | | 258,890 | |
Phillips 66 | | | 3,361 | | | | 377,474 | |
Valero Energy Corp. | | | 3,428 | | | | 379,925 | |
| | | | | | | | |
| | | | | | | 1,251,383 | |
| | | | | | | | |
|
Oil & Gas Storage & Transportation - 0.3% | |
Kinder Morgan Inc. | | | 14,304 | | | | 252,752 | |
ONEOK Inc. | | | 3,000 | | | | 209,490 | |
The Williams Companies Inc. | | | 6,871 | | | | 186,273 | |
| | | | | | | | |
| | | | | | | 648,515 | |
| | | | | | | | |
|
Packaged Foods & Meats - 1.0% | |
Campbell Soup Co. | | | 1,615 | | | | 65,472 | |
Conagra Brands Inc. | | | 3,254 | | | | 116,265 | |
General Mills Inc. | | | 4,436 | | | | 196,337 | |
Hormel Foods Corp. | | | 2,400 | | | | 89,304 | |
Kellogg Co. | | | 1,890 | | | | 132,054 | |
| | | | | | | | |
| | | Number
of Shares | | | Fair Value $ | |
| | | | | | | | |
McCormick & Company Inc. | | | 900 | | | | 104,481 | |
Mondelez International Inc., Class A | | | 11,435 | | | | 468,835 | |
The Hershey Co. | | | 1,216 | | | | 113,161 | |
The JM Smucker Co. | | | 947 | | | | 101,784 | |
The Kraft Heinz Co. | | | 4,795 | | | | 301,222 | |
Tyson Foods Inc., Class A | | | 2,362 | | | | 162,624 | |
| | | | | | | | |
| | | | | | | 1,851,539 | |
| | | | | | | | |
| | |
Paper Packaging - 0.3% | | | | | | | | |
Avery Dennison Corp. | | | 692 | | | �� | 70,653 | |
International Paper Co. | | | 3,430 | | | | 178,634 | |
Packaging Corporation of America | | | 800 | | | | 89,432 | |
Sealed Air Corp. | | | 1,331 | | | | 56,501 | |
WestRock Co. | | | 2,175 | | | | 124,019 | |
| | | | | | | | |
| | | | | | | 519,239 | |
| | | | | | | | |
|
Personal Products - 0.2% | |
Coty Inc., Class A | | | 3,445 | | | | 48,574 | |
The Estee Lauder Companies Inc., Class A | | | 1,779 | | | | 253,846 | |
| | | | | | | | |
| | | | | | | 302,420 | |
| | | | | | | | |
|
Pharmaceuticals - 4.3% | |
Allergan PLC (c) | | | 2,651 | | | | 441,975 | |
Bristol-Myers Squibb Co. | | | 12,787 | | | | 707,632 | |
Eli Lilly & Co. | | | 7,654 | | | | 653,116 | |
Johnson & Johnson | | | 21,212 | | | | 2,573,864 | |
Merck & Company Inc. | | | 21,268 | | | | 1,290,968 | |
Mylan N.V. (a) | | | 3,904 | | | | 141,090 | |
Nektar Therapeutics (a) | | | 1,300 | | | | 63,479 | |
Perrigo Company PLC | | | 975 | | | | 71,087 | |
Pfizer Inc. | | | 46,286 | | | | 1,679,256 | |
Zoetis Inc. | | | 3,846 | | | | 327,641 | |
| | | | | | | | |
| | | | | | | 7,950,108 | |
| | | | | | | | |
|
Property & Casualty Insurance - 0.8% | |
Chubb Ltd. | | | 3,661 | | | | 465,021 | |
Cincinnati Financial Corp. | | | 1,092 | | | | 73,011 | |
The Allstate Corp. | | | 2,786 | | | | 254,278 | |
The Progressive Corp. | | | 4,573 | | | | 270,493 | |
The Travelers Companies Inc. | | | 2,067 | | | | 252,877 | |
XL Group Ltd. | | | 1,956 | | | | 109,438 | |
| | | | | | | | |
| | | | 1,425,118 | |
| | | | | | | | |
|
Publishing - 0.0%* | |
News Corp., Class A | | | 3,400 | | | | 52,700 | |
| | | | | | | | |
|
Railroads - 0.9% | |
CSX Corp. | | | 6,773 | | | | 431,982 | |
Kansas City Southern | | | 900 | | | | 95,364 | |
See Notes to Schedule of Investments and Notes to Financial Statements.
| | | | |
| State Street S&P 500 Index V.I.S. Fund | | | 9 | |
State Street S&P 500 Index V.I.S. Fund
Schedule of Investments, continued — June 30, 2018 (Unaudited)
| | | | | | | | |
| | | Number
of Shares | | | Fair Value $ | |
| | | | | | | | |
| | | | | | | | |
Norfolk Southern Corp. | | | 2,145 | | | | 323,616 | |
Union Pacific Corp. | | | 6,081 | | | | 861,556 | |
| | | | | | | | |
| | | | 1,712,518 | |
| | | | | | | | |
|
Real Estate Services - 0.1% | |
CBRE Group Inc., Class A (a) | | | 2,573 | | | | 122,835 | |
| | | | | | | | |
|
Regional Banks - 1.3% | |
BB&T Corp. | | | 6,237 | | | | 314,594 | |
Citizens Financial Group Inc. | | | 4,000 | | | | 155,600 | |
Comerica Inc. | | | 1,356 | | | | 123,288 | |
Fifth Third Bancorp | | | 5,350 | | | | 153,545 | |
Huntington Bancshares Inc. | | | 8,234 | | | | 121,534 | |
KeyCorp | | | 8,028 | | | | 156,867 | |
M&T Bank Corp. | | | 1,190 | | | | 202,478 | |
People’s United Financial Inc. | | | 3,200 | | | | 57,888 | |
Regions Financial Corp. | | | 8,668 | | | | 154,117 | |
SunTrust Banks Inc. | | | 3,829 | | | | 252,791 | |
SVB Financial Group (a) | | | 400 | | | | 115,504 | |
The PNC Financial Services Group Inc. | | | 3,739 | | | | 505,139 | |
Zions Bancorporation | | | 1,500 | | | | 79,035 | |
| | | | | | | | |
| | | | 2,392,380 | |
| | | | | | | | |
|
Reinsurance - 0.0%* | |
Everest Re Group Ltd. | | | 300 | | | | 69,144 | |
| | | | | | | | |
|
Research & Consulting Services - 0.3% | |
Equifax Inc. | | | 846 | | | | 105,843 | |
IHS Markit Ltd. (a) | | | 2,800 | | | | 144,452 | |
Nielsen Holdings PLC | | | 2,928 | | | | 90,563 | |
Verisk Analytics Inc. (a) | | | 1,200 | | | | 129,168 | |
| | | | | | | | |
| | | | 470,026 | |
| | | | | | | | |
|
Residential REITs - 0.4% | |
Apartment Investment & Management Co., Class A | | | 1,477 | | | | 62,477 | |
AvalonBay Communities Inc. | | | 972 | | | | 167,077 | |
Equity Residential | | | 2,808 | | | | 178,842 | |
Essex Property Trust Inc. | | | 500 | | | | 119,535 | |
Mid-America Apartment Communities Inc. | | | 900 | | | | 90,603 | |
UDR Inc. | | | 1,900 | | | | 71,326 | |
| | | | | | | | |
| | | | 689,860 | |
| | | | | | | | |
|
Restaurants - 1.0% | |
Chipotle Mexican Grill Inc. (a) | | | 160 | | | | 69,019 | |
Darden Restaurants Inc. | | | 1,029 | | | | 110,165 | |
McDonald’s Corp. | | | 6,188 | | | | 969,598 | |
Starbucks Corp. | | | 10,824 | | | | 528,752 | |
Yum! Brands Inc. | | | 2,574 | | | | 201,338 | |
| | | | | | | | |
| | | | 1,878,872 | |
| | | | | | | | |
| | | | | | | | |
| | | Number
of Shares | | | Fair Value $ | |
| | | | | | | | |
Retail REITs - 0.5% | |
Federal Realty Investment Trust | | | 600 | | | | 75,930 | |
GGP Inc. | | | 5,300 | | | | 108,279 | |
Kimco Realty Corp. | | | 3,931 | | | | 66,788 | |
Realty Income Corp. | | | 2,400 | | | | 129,096 | |
Regency Centers Corp. | | | 1,299 | | | | 80,642 | |
Simon Property Group Inc. | | | 2,479 | | | | 421,901 | |
The Macerich Co. | | | 744 | | | | 42,281 | |
| | | | | | | | |
| | | | | | | 924,917 | |
| | | | | | | | |
|
Semiconductor Equipment - 0.4% | |
Applied Materials Inc. | | | 7,856 | | | | 362,869 | |
KLA-Tencor Corp. | | | 1,178 | | | | 120,780 | |
Lam Research Corp. | | | 1,347 | | | | 232,829 | |
| | | | | | | | |
| | | | 716,478 | |
| | | | | | | | |
|
Semiconductors - 3.6% | |
Advanced Micro Devices Inc. (a) | | | 6,600 | | | | 98,934 | |
Analog Devices Inc. | | | 2,787 | | | | 267,329 | |
Broadcom Inc. | | | 3,284 | | | | 796,830 | |
Intel Corp. | | | 37,004 | | | | 1,839,469 | |
Microchip Technology Inc. | | | 1,800 | | | | 163,710 | |
Micron Technology Inc. (a) | | | 9,226 | | | | 483,811 | |
NVIDIA Corp. | | | 4,838 | | | | 1,146,122 | |
Qorvo Inc. (a) | | | 1,100 | | | | 88,187 | |
QUALCOMM Inc. | | | 11,568 | | | | 649,196 | |
Skyworks Solutions Inc. | | | 1,500 | | | | 144,975 | |
Texas Instruments Inc. | | | 7,709 | | | | 849,917 | |
Xilinx Inc. | | | 2,087 | | | | 136,198 | |
| | | | | | | | |
| | | | 6,664,678 | |
| | | | | | | | |
|
Soft Drinks - 1.5% | |
Monster Beverage Corp. (a) | | | 3,338 | | | | 191,268 | |
PepsiCo Inc. | | | 11,154 | | | | 1,214,336 | |
The Coca-Cola Co. | | | 30,270 | | | | 1,327,642 | |
| | | | | | | | |
| | | | 2,733,246 | |
| | | | | | | | |
|
Specialized Consumer Services - 0.0%* | |
H&R Block Inc. | | | 1,579 | | | | 35,970 | |
| | | | | | | | |
|
Specialized REITs - 1.2% | |
American Tower Corp. | | | 3,391 | | | | 488,880 | |
Crown Castle International Corp. | | | 3,300 | | | | 355,806 | |
Digital Realty Trust Inc. | | | 1,700 | | | | 189,686 | |
Equinix Inc. | | | 646 | | | | 277,709 | |
Extra Space Storage Inc. | | | 1,000 | | | | 99,810 | |
Iron Mountain Inc. | | | 1,886 | | | | 66,029 | |
Public Storage | | | 1,230 | | | | 279,038 | |
SBA Communications Corp. (a) | | | 900 | | | | 148,608 | |
Weyerhaeuser Co. | | | 6,167 | | | | 224,849 | |
| | | | | | | | |
| | | | 2,130,415 | |
| | | | | | | | |
See Notes to Schedule of Investments and Notes to Financial Statements.
| | |
| 10 | | State Street S&P 500 Index V.I.S. Fund |
State Street S&P 500 Index V.I.S. Fund
Schedule of Investments, continued — June 30, 2018 (Unaudited)
| | | | | | | | |
| | | Number
of Shares | | | Fair Value $ | |
| | | | | | | | |
| | | | | | | | |
Specialty Chemicals - 0.5% | |
Albemarle Corp. | | | 900 | | | | 84,897 | |
Ecolab Inc. | | | 2,102 | | | | 294,974 | |
International Flavors & Fragrances Inc. | | | 647 | | | | 80,202 | |
PPG Industries Inc. | | | 2,010 | | | | 208,497 | |
The Sherwin-Williams Co. | | | 663 | | | | 270,219 | |
| | | | | | | | |
| | | | 938,789 | |
| | | | | | | | |
|
Specialty Stores - 0.1% | |
Tiffany & Co. | | | 704 | | | | 92,647 | |
Tractor Supply Co. | | | 837 | | | | 64,022 | |
Ulta Salon Cosmetics & Fragrance Inc. (a) | | | 400 | | | | 93,384 | |
| | | | | | | | |
| | | | 250,053 | |
| | | | | | | | |
|
Steel - 0.1% | |
Nucor Corp. | | | 2,559 | | | | 159,938 | |
| | | | | | | | |
|
Systems Software - 4.0% | |
CA Inc. | | | 2,703 | | | | 96,362 | |
Microsoft Corp. | | | 60,649 | | | | 5,980,598 | |
Oracle Corp. | | | 23,497 | | | | 1,035,278 | |
Red Hat Inc. (a) | | | 1,400 | | | | 188,118 | |
Symantec Corp. | | | 4,672 | | | | 96,476 | |
| | | | | | | | |
| | | | 7,396,832 | |
| | | | | | | | |
|
Technology Hardware, Storage & Peripherals - 4.4% | |
Apple Inc. | | | 38,767 | | | | 7,176,159 | |
Hewlett Packard Enterprise Co. | | | 12,019 | | | | 175,598 | |
HP Inc. | | | 12,900 | | | | 292,701 | |
NetApp Inc. | | | 2,170 | | | | 170,410 | |
Seagate Technology PLC | | | 2,132 | | | | 120,394 | |
Western Digital Corp. | | | 2,477 | | | | 191,745 | |
Xerox Corp. | | | 1,811 | | | | 43,464 | |
| | | | | | | | |
| | | | 8,170,471 | |
| | | | | | | | |
| | | | | | | | |
| | | Number
of Shares | | | Fair Value $ | |
| | | | | | | | |
Tires & Rubber - 0.0%* | |
The Goodyear Tire & Rubber Co. | | | 2,019 | | | | 47,023 | |
| | | | | | | | |
|
Tobacco - 1.0% | |
Altria Group Inc. | | | 14,839 | | | | 842,707 | |
Philip Morris International Inc. | | | 12,183 | | | | 983,655 | |
| | | | | | | | |
| | | | 1,826,362 | |
| | | | | | | | |
|
Trading Companies & Distributors - 0.2% | |
Fastenal Co. | | | 2,200 | | | | 105,886 | |
United Rentals Inc. (a) | | | 700 | | | | 103,334 | |
WW Grainger Inc. | | | 382 | | | | 117,809 | |
| | | | | | | | |
| | | | 327,029 | |
| | | | | | | | |
|
Trucking - 0.0%* | |
JB Hunt Transport Services Inc. | | | 720 | | | | 87,516 | |
| | | | | | | | |
|
Water Utilities - 0.1% | |
American Water Works Company Inc. | | | 1,400 | | | | 119,531 | |
| | | | | | | | |
| |
Total Common Stock
(Cost $76,506,022) | | | | 181,932,074 | |
| | | | | | | | |
|
| Short-Term Investments - 1.6% | |
State Street Institutional U.S. Government Money Market Fund - Class G Shares 1.86% (Cost $2,937,871) (d,e) | | | 2,937,871 | | | | 2,937,871 | |
| | | | | | | | |
| |
Total Investments
(Cost $79,439,893) | | | | 184,869,945 | |
| |
| Other Assets and Liabilities, net - 0.1% | | | | 213,526 | |
| | | | | | | | |
| |
| NET ASSETS - 100.0% | | | | 185,083,471 | |
| | | | | | | | |
Other Information:
The Fund had the following long futures contracts open at June 30, 2018:
| | | | | | | | | | | | | | | | | | | | |
| Description | | Expiration
date | | | Number of
Contracts | | | Notional
Amount | | | Value | | | Unrealized
Depreciation | |
| | | | | | | | | | | | | | | | | | | | |
S&P 500 Emini Index Futures | | | September 2018 | | | | 22 | | | | 3,064,094 | | | $ | 2,993,760 | | | $ | (70,334 | ) |
| | | | | | | | | | | | | | | | | | | | |
See Notes to Schedule of Investments and Notes to Financial Statements.
| | | | |
| State Street S&P 500 Index V.I.S. Fund | | | 11 | |
State Street S&P 500 Index V.I.S. Fund
Notes to Schedule of Investments — June 30, 2018 (Unaudited)
The views expressed in this document reflect our judgment as of the publication date and are subject to change at any time without notice. The securities cited may not be representative of the Fund’s future investments and should not be construed as a recommendation to purchase or sell a particular security. See the Fund’s summary prospectus and statutory prospectus for complete descriptions of investment objectives, policies, risks and permissible investments.
| (a) | Non-income producing security. |
| (b) | State Street Corp. is the parent company of State Street Bank & Trust Co., the Fund’s sub-administrator, custodian and accounting agent. |
| (c) | At June 30, 2018, all or a portion of this security was pledged to cover collateral requirements for futures. |
| (d) | Sponsored by SSGA Funds Management, Inc., the Fund’s investment adviser and administrator, and an affiliate of State Street Bank & Trust Co., the Fund’s sub-administrator, custodian and accounting agent. |
| (e) | Coupon amount represents effective yield. |
| † | Percentages are based on net assets as of June 30, 2018. |
Abbreviations:
REIT Real Estate Investment Trust
The following table presents the Fund’s investments measured at fair value on a recurring basis at June 30, 2018:
| | | | | | | | | | | | | | | | |
| Investments | | Level 1 | | | Level 2 | | | Level 3 | | | Total | |
| | | | | | | | | | | | | | | | |
Investments in Securities | | | | | | | | | | | | | | | | |
Common Stock | | $ | 181,932,074 | | | $ | — | | | $ | — | | | $ | 181,932,074 | |
Short-Term Investments | | | 2,937,871 | | | | — | | | | — | | | | 2,937,871 | |
| | | | | | | | | | | | | | | | |
Total Investments in Securities | | $ | 184,869,945 | | | $ | — | | | $ | — | | | $ | 184,869,945 | |
| | | | | | | | | | | | | | | | |
Other Financial Instruments | | | | | | | | | | | | | | | | |
Long Futures Contracts - Unrealized Depreciation | | $ | (70,334 | ) | | $ | — | | | $ | — | | | $ | (70,334 | ) |
| | | | | | | | | | | | | | | | |
| | | | | | | | | | | | | | | | | | | | | | | | | | | | | | | | | | | | |
| | | Number
of Shares
Held at
12/31/17 | | | Value At
12/31/17 | | | Cost of
Purchases | | | Proceeds
from
Shares
Sold | | | Realized
Gain
(Loss) | | | Change in
Unrealized
Appreciation/ Depreciation | | | Number
of Shares
Held at
6/30/18 | | | Value at
6/30/18 | | | Dividend
Income | |
State Street Corp. | | | 3,111 | | | $ | 303,665 | | | $ | — | | | $ | 20,315 | | | $ | 6,151 | | | $ | (18,516 | ) | | | 2,911 | | | $ | 270,985 | | | $ | 2,445 | |
State Street Institutional U.S. Government Money Market Fund - Class G Shares | | | 2,080,142 | | | | 2,080,142 | | | | 11,739,588 | | | | 10,881,859 | | | | — | | | | — | | | | 2,937,871 | | | $ | 2,937,871 | | | | 15,649 | |
| | | | | | | | | | | | | | | | | | | | | | | | | | | | | | | | | | | | |
TOTAL | | | | | | $ | 2,383,807 | | | $ | 11,739,588 | | | $ | 10,902,174 | | | $ | 6,151 | | | $ | (18,516 | ) | | | | | | $ | 3,208,856 | | | $ | 18,094 | |
| | | | | | | | | | | | | | | | | | | | | | | | | | | | | | | | | | | | |
See Notes to Schedule of Investments and Notes to Financial Statements.
| | |
| 12 | | State Street S&P 500 Index V.I.S. Fund |
State Street S&P 500 Index V.I.S. Fund
Financial Highlights
Selected data based on a share outstanding throughout the periods indicated
| | | | | | | | | | | | | | | | | | | | | | | | |
| | | 6/30/18† | | | 12/31/17 | | | 12/31/16 | | | 12/31/15* | | | 12/31/14* | | | 12/31/13* | |
| Inception date | | | — | | | | — | | | | — | | | | — | | | | — | | | | 4/15/85 | |
| | | | | | |
Net asset value, beginning of period | | $ | 44.09 | | | $ | 38.22 | | | $ | 36.16 | | | $ | 36.60 | | | $ | 32.83 | | | $ | 25.29 | |
| | | | | | | | | | | | | | | | | | | | | | | | |
| | | | |
Income/(loss) from investment operations: | | | | | | | | | | | | | | | | | |
Net investment income | | | 0.35 | (a) | | | 0.71 | (a) | | | 0.72 | | | | 0.69 | | | | 0.61 | | | | 0.55 | |
Net realized and unrealized gains/(losses) on investments | | | 0.74 | | | | 7.52 | | | | 3.49 | | | | (0.28 | ) | | | 3.76 | | | | 7.53 | |
| | | | | | | | | | | | | | | | | | | | | | | | |
Total income from investment operations | | | 1.09 | | | | 8.23 | | | | 4.21 | | | | 0.41 | | | | 4.37 | | | | 8.08 | |
| | | | | | | | | | | | | | | | | | | | | | | | |
| | | | | | |
Less distributions from: | | | | | | | | | | | | | | | | | | | | | | | | |
Net investment income | | | — | | | | 0.79 | | | | 0.73 | | | | 0.85 | | | | 0.60 | | | | 0.54 | |
Net realized gains | | | — | | | | 1.57 | | | | 1.42 | | | | — | | | | — | | | | — | |
| | | | | | | | | | | | | | | | | | | | | | | | |
Total distributions | | | — | | | | 2.36 | | | | 2.15 | | | | 0.85 | | | | 0.60 | | | | 0.54 | |
| | | | | | | | | | | | | | | | | | | | | | | | |
Net asset value, end of period | | $ | 45.18 | | | $ | 44.09 | | | $ | 38.22 | | | $ | 36.16 | | | $ | 36.60 | | | $ | 32.83 | |
| | | | | | | | | | | | | | | | | | | | | | | | |
Total return(b) | | | 2.47 | % | | | 21.50 | % | | | 11.61 | % | | | 1.07 | % | | | 13.28 | % | | | 31.97 | % |
| | | | |
Ratios/Supplemental Data: | | | | | | | | | | | | | | | | | |
Net assets, end of period (in thousands) | | $ | 185,083 | | | $ | 194,117 | | | $ | 180,761 | | | $ | 179,395 | | | $ | 203,262 | | | $ | 206,556 | |
| | | | | |
Ratios to average net assets: | | | | | | | | | | | | | | | | | | | | | |
Net expenses | | | 0.35 | %** | | | 0.32 | % | | | 0.34 | %(d) | | | 0.37 | %(d) | | | 0.41 | %(c)(d) | | | 0.35 | %(c)(d) |
Gross expenses | | | 0.35 | %** | | | 0.32 | % | | | 0.37 | % | | | 0.42 | % | | | 0.46 | % | | | 0.40 | % |
Net investment income | | | 1.58 | %** | | | 1.69 | % | | | 1.86 | % | | | 1.72 | % | | | 1.65 | % | | | 1.75 | % |
Portfolio turnover rate | | | 1 | % | | | 2 | % | | | 2 | % | | | 2 | % | | | 2 | % | | | 3 | % |
Notes to Financial Highlights
| (a) | | Per share values have been calculated using the average share method. |
| (b) | | Total returns are historical and assume changes in share price, reinvestment of dividends and capital gains distributions and do not include the effect of insurance contract charges. Past performance does not guarantee future results. |
| (c) | | Includes contractual management fee waiver related to the Fund’s investments in the GE Institutional Money Market Fund (the “Money Market Fund”). The fee waiver agreement was terminated effective June 30, 2014 with the closure of the Money Market Fund. |
| (d) | | Reflects a contractual arrangement with GE Asset Management Incorporated, the Fund’s investment adviser and administrator prior to July 1, 2016, to limit the advisory and administrative fee charged to the Fund to 0.30% of the average daily net assets of the Fund. |
| * | | Beginning with the year ended December 31, 2016, the Fund was audited by Ernst & Young LLP. The previous years were audited by another independent registered public accounting firm. |
| ** | | Annualized for periods less than one year. |
The accompanying Notes are an integral part of these financial statements.
State Street S&P 500 Index V.I.S. Fund
Statement of Assets and Liabilities — June 30, 2018 (Unaudited)
| | | | |
| | | | |
Assets | | | | |
Investments in securities, at fair value (cost $76,333,629) | | $ | 181,661,091 | |
Investments in affiliated securities, at fair value (cost $168,393) | | | 270,985 | |
Short-term affiliated investments, at fair value | | | 2,937,871 | |
Cash | | | 1,054 | |
Cash collateral on deposit with broker for Future Contracts | | | 195,766 | |
Receivable for investments sold | | | 182,909 | |
Income receivables | | | 150,854 | |
Income receivable from affiliated investments | | | 3,334 | |
Other assets | | | 16 | |
| | | | |
Total assets | | | 185,403,880 | |
| | | | |
| |
Liabilities | | | | |
Payable for investments purchased | | | 90,500 | |
Payable for fund shares redeemed | | | 84,542 | |
Payable for Accumulated variation margin on Futures | | | 70,285 | |
Payable to the Adviser | | | 38,706 | |
Payable to the Custodian | | | 11,873 | |
Accrued other expenses | | | 24,503 | |
| | | | |
Total liabilities | | | 320,409 | |
| | | | |
| | | | |
Net Assets | | $ | 185,083,471 | |
| | | | |
| |
Net Assets Consist of: | | | | |
Capital paid in | | $ | 76,592,026 | |
Undistributed (distributions in excess of) net investment income | | | 1,476,552 | |
Accumulated net realized gain | | | 1,655,173 | |
Net unrealized appreciation (depreciation) on: | | | | |
Unaffiliated Investments | | | 105,327,462 | |
Affiliated investments | | | 102,592 | |
Futures | | | (70,334 | ) |
| | | | |
Net Assets | | $ | 185,083,471 | |
| | | | |
| | | | |
Shares outstanding ($0.01 par value; unlimited shares authorized) | | | 4,096,963 | |
Net asset value per share | | $ | 45.18 | |
The accompanying Notes are an integral part of these financial statements.
| | |
| 14 | | Statements of Assets and Liabilities |
State Street S&P 500 Index V.I.S. Fund
Statements of Operations — For the period ended June 30, 2018 (Unaudited)
| | | | |
| | | | |
Investment Income | | | | |
Income | | | | |
Dividend | | $ | 1,797,686 | |
Income from affiliated investments | | | 18,094 | |
| | | | |
Total income | | | 1,815,780 | |
| | | | |
| |
Expenses | | | | |
Advisory and administration fees | | | 238,875 | |
Directors’ fees | | | 14,461 | |
Custody and accounting expenses | | | 24,416 | |
Professional fees | | | 20,211 | |
Other expenses | | | 27,964 | |
| | | | |
Total expenses | | | 325,927 | |
| | | | |
Net investment income | | $ | 1,489,853 | |
| | | | |
| |
Net Realized and Unrealized Gain (Loss) on Investments | | | | |
Realized gain (loss) on: | | | | |
Unaffiliated investments | | $ | 6,642,668 | |
Affiliated investments | | | 6,151 | |
Futures | | | 139,732 | |
Increase (decrease) in unrealized appreciation/depreciation on: | | | | |
Unaffiliated investments | | | (3,424,602 | ) |
Affiliated investments | | | (18,516 | ) |
Futures | | | (111,716 | ) |
| | | | |
| |
Net realized and unrealized gain (loss) on investments | | | 3,233,717 | |
| | | | |
Net increase in net assets resulting from operations | | $ | 4,723,570 | |
| | | | |
The accompanying Notes are an integral part of these financial statements.
| | | | |
| Statements of Operations | | | 15 | |
State Street S&P 500 Index V.I.S. Fund
Statements of Changes in Net Assets
| | | | | | | | |
| | | Six Months Ended
June 30, 2018(a) | | | Year Ended
December 31, 2017 | |
| | | | | | | | |
Increase (Decrease) in Net Assets | | | | | | | | |
| | |
Operations: | | | | | | | | |
Net investment income | | $ | 1,489,853 | | | $ | 3,149,646 | |
Net realized gain (loss) on | | | 6,788,551 | | | | 7,133,916 | |
Net increase (decrease) in unrealized appreciation/depreciation on investments and futures | | | (3,554,834 | ) | | | 26,115,746 | |
| | | | | | | | |
Net increase (decrease) from operations | | | 4,723,570 | | | | 36,399,308 | |
| | | | | | | | |
|
Distributions to shareholders from: | |
Net investment income | | | — | | | | (3,286,275 | ) |
Net realized gains | | | — | | | | (6,559,166 | ) |
| | | | | | | | |
Total distributions | | | — | | | | (9,845,441 | ) |
| | | | | | | | |
Increase (decrease) in assets from operations and distributions | | | 4,723,570 | | | | 26,553,867 | |
| | | | | | | | |
|
Share transactions: | |
Proceeds from sale of shares | | | 1,554,571 | | | | 3,059,520 | |
Value of distributions reinvested | | | — | | | | 9,845,441 | |
Cost of shares redeemed | | | (15,312,038 | ) | | | (26,102,452 | ) |
| | | | | | | | |
Net increase (decrease) from share transactions | | | (13,757,467 | ) | | | (13,197,491 | ) |
| | | | | | | | |
| | |
Total increase (decrease) in net assets | | | (9,033,897 | ) | | | 13,356,376 | |
|
Net Assets | |
Beginning of period | | | 194,117,368 | | | | 180,760,992 | |
| | | | | | | | |
| | |
End of period | | $ | 185,083,471 | | | $ | 194,117,368 | |
| | | | | | | | |
| | |
Undistributed (distributions in excess of) net investment income, end of period | | $ | 1,476,552 | | | $ | (13,301 | ) |
| | |
Changes in Fund Shares | | | | | | | | |
Shares sold | | | 34,370 | | | | 73,043 | |
Issued for distributions reinvested | | | — | | | | 222,798 | |
Shares redeemed | | | (340,359 | ) | | | (622,096 | ) |
| | | | | | | | |
Net decrease in fund shares | | | (305,989 | ) | | | (326,255 | ) |
| | | | | | | | |
The accompanying Notes are an integral part of these financial statements.
| | |
| 16 | | Statements of Changes in Net Assets |
State Street S&P 500 Index V.I.S. Fund
Notes to Financial Statements — June 30, 2018 (Unaudited)
| 1. | | Organization of the Company |
State Street Variable Insurance Series Funds, Inc. (the “Company”) was incorporated under the laws of the Commonwealth of Virginia on May 14, 1984 and is registered under the Investment Company Act of 1940, as amended (the “1940 Act”), as an open-end management investment company. The Company is currently composed of the following seven investment portfolios (collectively, the “Funds”); State Street U.S. Equity V.I.S. Fund, State Street S&P 500 Index V.I.S. Fund (the “Fund”), State Street Premier Growth Equity V.I.S. Fund, State Street Small-Cap Equity V.I.S. Fund, State Street Total Return V.I.S. Fund, State Street Income V.I.S. Fund and State Street Real Estate Securities V.I.S. Fund. Each Fund is an investment company and accordingly follows the investment company accounting and reporting guidance of the Financial Accounting Standards Board (“FASB”) Accounting Standard Codification (“ASC”) Topic 946 Financial Services — Investment Companies. Each Fund is a diversified investment company within the meaning of the 1940 Act.
Shares of the Funds of the Company are offered only to insurance company separate accounts that fund certain variable life insurance contracts and variable annuity contracts.
The Company currently offers one share class (Class 1) of the Fund as an investment option for variable life insurance and variable annuity contracts.
Under the Company’s organizational documents, its officers and directors are indemnified against certain liabilities arising out of the performance of their duties to the Company. Additionally, in the normal course of business, the Company enters into contracts with service providers that contain general indemnification clauses. The Company’s maximum exposure under these arrangements is unknown as this would involve future claims that may be made against the Company that have not yet occurred.
| 2. | | Summary of Significant Accounting Policies |
The following is a summary of significant accounting policies followed by the Company in the preparation of its financial statements:
The preparation of financial statements in accordance with U.S. generally accepted accounting principles (“U.S. GAAP”) requires management to make estimates and assumptions that affect the reported amounts and disclosures in the financial statements. Actual results could differ from those estimates. The Fund is an investment company under U.S. GAAP and follows the accounting and reporting guidance applicable to investment companies.
Security Valuation The Fund’s investments are valued at fair value each day that the New York Stock Exchange (“NYSE”) is open and, for financial reporting purposes, as of the report date should the reporting period end on a day that the NYSE is not open. Fair value is generally defined as the price a fund would receive to sell an asset or pay to transfer a liability in an orderly transaction between market participants at the measurement date. By its nature, a fair value price is a good faith estimate of the valuation in a current sale and may not reflect an actual market price. The investments of the Fund are valued pursuant to the policy and procedures developed by the Oversight Committee (the “Committee”) and approved by the Company’s Board of Directors (the “Board”). The Committee provides oversight of the valuation of investments for the Fund. The Board has responsibility for determining the fair value of investments.
Valuation techniques used to value the Fund’s investments by major category are as follows:
| | • | | Equity investments traded on a recognized securities exchange for which market quotations are readily available are valued at the last sale price or official closing price, as applicable, on the primary market or exchange on which they trade. Equity investments traded on a recognized exchange for which there were no sales on that day are valued at the last published sale price or at fair value. |
| | • | | Investments in registered investment companies (including money market funds) or other unitized pooled investment vehicles that are not traded on an exchange are valued at that day’s published net asset value (“NAV”) per share or unit. |
In the event prices or quotations are not readily available or that the application of these valuation methods results in a price for an investment that is deemed to be not representative of the fair value of such investment, fair value will be determined in good faith by the Committee, in accordance with the valuation policy and procedures approved by the Board.
| | | | |
| Notes to Financial Statements | | | 17 | |
State Street S&P 500 Index V.I.S. Fund
Notes to Financial Statements, continued — June 30, 2018 (Unaudited)
The Fund values its assets and liabilities at fair value using a fair value hierarchy consisting of three broad levels that prioritize the inputs to valuation techniques giving the highest priority to readily available unadjusted quoted prices in active markets for identical assets or liabilities (Level 1 measurements) and the lowest priority to unobservable inputs (Level 3 measurements) when market prices are not readily available or reliable. The categorization of a value determined for an investment within the hierarchy is based upon the pricing transparency of the investment and is not necessarily an indication of the risk associated with investing in it.
The three levels of the fair value hierarchy are as follows:
| | • | | Level 1 — Unadjusted quoted prices in active markets for an identical asset or liability; |
| | • | | Level 2 — Inputs other than quoted prices included within Level 1 that are observable for the asset or liability either directly or indirectly, including quoted prices for similar assets or liabilities in active markets, quoted prices for identical or similar assets or liabilities in markets that are not considered to be active, inputs other than quoted prices that are observable for the asset or liability (such as exchange rates, financing terms, interest rates, yield curves, volatilities, prepayment speeds, loss severities, credit risks and default rates) or other market-corroborated inputs; and |
| | • | | Level 3 — Unobservable inputs for the asset or liability, including the Committee’s assumptions used in determining the fair value of investments. |
The value of the Fund’s investments according to the fair value hierarchy as of June 30, 2018 is disclosed in the Fund’s Schedule of Investments.
Changes in valuation techniques may result in transfers in or out of an assigned level within the fair value hierarchy. Transfers between different levels of the fair value hierarchy are recognized at the beginning of the reporting period. The Fund had no material transfers between levels for the six-month period ended June 30, 2018.
Investment Transactions and Income Recognition Investment transactions are accounted for on trade date for financial reporting purposes. Realized gains and losses from the sale or disposition of investments and foreign exchange transactions, if any, are determined using the identified cost method.
Dividend income and capital gain distributions, if any, are recognized on the ex-dividend date, net of any foreign taxes withheld at source, if any.
Interest income is recorded daily on an accrual basis. All premiums and discounts are amortized/accreted for financial reporting purposes.
Non-cash dividends received in the form of stock are recorded as dividend income at fair value.
Expenses Certain expenses, which are directly identifiable to a specific Fund, are applied to the Fund within the Company. Other expenses which cannot be attributed to a specific Fund are allocated in such a manner as deemed equitable, taking into consideration the nature and type of expense and the relative net assets of the Fund within the Company.
Distributions The Fund declares and pays any dividends from net investment income annually.
Net realized capital gains, if any, are distributed annually, unless additional distributions are required for compliance with applicable tax regulations. The amount and character of income and capital gains to be distributed are determined in accordance with applicable tax regulations which may differ from net investment income and realized gains recognized for U.S. GAAP purposes.
| 3. | | Derivative Financial Instruments |
Futures Contracts The Fund may enter into futures contracts to meet the Fund’s objectives. A futures contract is a standardized, exchange-traded agreement to buy or sell a financial instrument at a set price on a future date. Upon entering into a futures contract, the Fund is required to deposit with the broker, cash or securities in an amount equal to the minimum initial margin requirements of the clearing house. Subsequent payments are made or received by the Fund equal to the daily change in the contract value and are recorded as variation margin receivable or payable with a corresponding offset to unrealized gains or losses. The Fund recognizes a realized gain or loss when the contract is closed.
| | |
| 18 | | Notes to Financial Statements |
State Street S&P 500 Index V.I.S. Fund
Notes to Financial Statements, continued — June 30, 2018 (Unaudited)
Losses may arise if the value of a futures contract decreases due to unfavorable changes in the market rates or values of the underlying instrument during the term of the contract or if the counterparty does not perform under the contract. The use of futures contracts also involves the risk that the movements in the price of the futures contracts do not correlate the movement of the assets underlying such contracts.
For the six-month period ended June 30, 2018 the Fund entered into futures contracts for cash equitization.
The following tables summarize the value of the Fund’s derivative instruments as of June 30, 2018 and the related location in the accompanying Statements of Assets and Liabilities and Statements of Operations, presented by primary underlying risk exposure:
Liability Derivatives
| | | | | | | | | | | | | | | | | | | | | | | | |
| | | Interest
Rate
Contracts
Risk | | | Foreign
Exchange
Contracts
Risk | | | Credit
Contracts
Risk | | | Equity
Contracts
Risk | | | Commodity
Contracts
Risk | | | Total | |
| | | | | | | | | | | | | | | | | | | | | | | | |
State Street S&P 500 Index V.I.S. Fund | |
Futures Contracts | | $ | — | | | $ | — | | | $ | — | | | $ | (70,285 | ) | | $ | — | | | $ | (70,285 | ) |
Net Realized Gain (Loss)
| | | | | | | | | | | | | | | | | | | | | | | | |
| | | Interest
Rate
Contracts
Risk | | | Foreign
Exchange
Contracts
Risk | | | Credit
Contracts
Risk | | | Equity
Contracts
Risk | | | Commodity
Contracts
Risk | | | Total | |
| | | | | | | | | | | | | | | | | | | | | | | | |
State Street S&P 500 Index V.I.S. Fund | |
Futures Contracts | | $ | — | | | $ | — | | | $ | — | | | $ | 139,732 | | | $ | — | | | $ | 139,732 | |
Net Change in Unrealized Appreciation (Depreciation)
| | | | | | | | | | | | | | | | | | | | | | | | |
| | | Interest
Rate
Contracts
Risk | | | Foreign
Exchange
Contracts
Risk | | | Credit
Contracts
Risk | | | Equity
Contracts
Risk | | | Commodity
Contracts
Risk | | | Total | |
| | | | | | | | | | | | | | | | | | | | | | | | |
State Street S&P 500 Index V.I.S. Fund | |
Futures Contracts | | $ | — | | | $ | — | | | $ | — | | | $ | (111,716 | ) | | $ | — | | | $ | (111,716 | ) |
| 4. | | Fees and Transactions with Affiliates |
Advisory Fee SSGA Funds Management, Inc. (the “Advisor” or “SSGA FM”), a registered investment adviser, was retained by the Board to act as investment adviser and administrator of the Fund. SSGA FM’s compensation for investment advisory and administrative services (“Management Fee”) is paid monthly based on the average daily net assets of the Fund at an annualized rate of 0.25%.
Administrator, Sub-Administrator and Custodian Fees State Street Bank and Trust Company (“State Street”) serves as the sub-administrator and custodian to the Funds. Amounts paid by the Fund to State Street for performing such services are included in advisory and administration and custody and accounting expenses, respectively.
Due to Custodian In certain circumstances, the Funds may have cash overdraft with the custodian. The Due to Custodian amount, if any, reflects cash overdrawn with State Street as custodian who is an affiliate of the Funds.
Other Transactions with affiliates The Fund may invest in affiliated entities, including securities issued by State Street, affiliated funds, or entities deemed to be affiliates as a result of the Fund owning more than five percent of the entity’s voting securities or outstanding shares. Amounts relating to these transactions during the period ended June 30, 2018 are disclosed in the Schedule of Investments.
The fees and expenses of the Company’s directors who are not “interested persons” of the Company, as defined in the 1940 Act (“Independent Directors”) are paid directly by the Fund. The Independent Directors are reimbursed for travel and other out-of-pocket expenses in connection with meeting attendance and industry seminars.
| | | | |
| Notes to Financial Statements | | | 19 | |
State Street S&P 500 Index V.I.S. Fund
Notes to Financial Statements, continued — June 30, 2018 (Unaudited)
| 6. | | Investment Transactions |
Purchases and sales of investments (excluding in-kind transactions, short term investments and derivative contracts) for the six-month period ended June 30, 2018 were as follows:
| | | | | | | | |
| Purchases | | Sales |
| | $ | 1,629,024 | | | | $ | 14,281,110 | |
The Fund has qualified and intends to continue to qualify as a regulated investment company under Subchapter M of the Internal Revenue Code of 1986, as amended. The Fund will not be subject to federal income taxes to the extent it distributes its taxable income, including any net realized capital gains, for each fiscal year. Therefore, no provision for federal income tax is required.
The Fund files federal and various state and local tax returns as required. No income tax returns are currently under examination. Generally, the federal returns are subject to examination by the Internal Revenue Service for a period of three years from date of filing, while the state returns may remain open for an additional year depending upon jurisdiction. SSGA FM has analyzed the Fund’s tax positions taken on tax returns for all open years and does not believe there are any uncertain tax positions that would require recognition of a tax liability.
Distributions to shareholders are recorded on ex-dividend date. Income dividends and gain distributions are determined in accordance with income tax rules and regulations, which may differ from generally accepted accounting principles.
As of June 30, 2018, gross unrealized appreciation and gross unrealized depreciation of investments and other financial instruments based on cost for federal income tax purposes were as follows:
| | | | | | | | | | | | | | | | | | |
Tax
Cost | | Gross
Unrealized
Appreciation | | Gross
Unrealized
Depreciation | | Net Unrealized
Appreciation
(Depreciation) |
| | | | | | | | | | | | | | | | | | | |
| | $ | 85,210,397 | | | | $ | 102,511,018 | | | | $ | 2,921,804 | | | | $ | 99,589,214 | |
The Fund and other affiliated funds (each a “Participant” and collectively, the “Participants”) participate in a $500 million revolving credit facility provided by a syndication of banks under which the Participants may borrow to fund shareholder redemptions. This agreement expires in October 2018 unless otherwise extended or renewed.
The Participants are charged an annual commitment fee which is calculated based on the unused portion of the shared credit line. Commitment fees are allocated among each of the Participants based on relative net assets. Commitment fees are ordinary fund operating expenses paid by the Adviser. A Participant incurs and pays the interest expense related to its borrowing. Interest is calculated at a rate per annum equal to the sum of 1% plus the greater of the New York Fed Bank Rate and 1-month LIBOR rate.
The Fund had no outstanding loans as of June 30, 2018.
Concentration Risk As a result of the Fund’s ability to invest a large percentage of its assets in obligations of issuers within the same country, state, region, currency or economic sector, an adverse economic, business or political development may affect the value of the Fund’s investments more than if the Fund were more broadly diversified.
Market and Credit Risk In the normal course of business, the Fund trades financial instruments and enters into financial transactions where risk of potential loss exists due to changes in the general economic conditions and fluctuations of the market (market risk). Additionally, the Fund may also be exposed to credit risk in the event that an issuer or guarantor fails to perform or that an institution or entity with which the Fund has unsettled or open transactions defaults.
Management has evaluated the impact of all subsequent events on the Fund through the date on which the financial statements were available to be issued and has determined that there were no subsequent events requiring adjustment or disclosure in the financial statements.
| | |
| 20 | | Notes to Financial Statements |
State Street Variable Insurance Series Funds, Inc.
Other Information (Unaudited)
Proxy Voting Policies and Procedures and Record
The Fund has adopted the proxy voting policies of SSGA FM. A description of the policies and procedures that the Fund has adopted to determine how to vote proxies relating to portfolio securities is available (i) without charge, upon request, by calling 1-800-242-0134, (ii) on the Fund’s website at http://www.ssga.com/geam, (iii) on the SEC’s website at www.sec.gov, and (iv) at the SEC’s public reference room. Information on the operation of the public reference room may be obtained by calling 1-800-SEC-0330. Information regarding how the Fund voted proxies, if any, during the most recent 12-month period ended June 30 is available by August 31 of each year without charge (1) by calling 1-800-242-0134 (toll free), and (2) on the website of the SEC at www.sec.gov.
Quarterly Portfolio Schedule
The Fund files its complete schedule of investments with the SEC for the first and third quarters of each fiscal year on Form N-Q. The Fund’s Forms N-Q are available (i) without charge, upon request, by calling 1-800-242-013, (ii) on the Fund’s website at http://www.ssga.com/geam, (iii) on the SEC’s website at www.sec.gov, and (iv) at the SEC’s public reference room. Information on the operation of the public reference room may be obtained by calling 1-800-SEC-0330.
State Street S&P 500 Index V.I.S. Funds
Other Information (Unaudited), continued
Disclosure for the Board of Directors’ Consideration of the Renewal of the Investment Advisory and Administration Agreement with SSGA Funds Management, Inc. on behalf of the State Street S&P 500 Index V.I.S. Fund
At meetings of the Board of Directors (the “Board”) of State Street Variable Insurance Series Funds, Inc. (the “V.I.S. Funds”) held on May 16, 2018 and June 5, 2018 (the “Board Meetings”), the Board members, including the Board members who are not “interested persons” (as defined in the Investment Company Act of 1940, as amended (the “1940 Act”)) of the V.I.S. Funds (“Independent Board Members”), considered and unanimously approved the continuance for an additional year of the investment advisory and administration agreement (the “Investment Advisory and Administration Agreement”) between SSGA Funds Management, Inc. (“SSGA FM” or the “Adviser”) and the V.I.S. Funds on behalf of each of its series portfolios, including the State Street S&P 500 Index V.I.S. Fund (the “Fund”).
In considering whether to approve the continuance for an additional year of the Investment Advisory and Administration Agreement, the Board members considered and discussed a substantial amount of information and analysis provided, at the Board’s request, by the Adviser. The Board members also considered detailed information regarding performance and expenses of other investment companies, including those with similar investment strategies and sizes, which was prepared by an independent third party provider, Broadridge Financial Solutions, Inc. (“Broadridge”). The Board members reviewed the fees charged by the Adviser for other mutual funds and investment products other than mutual funds that employ a similar investment strategy as the Fund. The Board had the opportunity to ask questions and request additional information in connection with its considerations.
Before approving the continuance of the Investment Advisory and Administration Agreement, the Independent Board Members reviewed the information provided with management of the Adviser and with their independent legal counsel. The Board also reviewed a memorandum prepared by independent legal counsel discussing the legal standards for the consideration of the proposed continuance. The Independent Board Members discussed the proposed continuance of the Investment Advisory and Administration Agreement in detail during private sessions in advance of, and at, the Board Meetings with their independent legal counsel at which no representatives of the Adviser were present. The Independent Board Members and their independent legal counsel requested, and received and considered, additional information from the Adviser following the May 16, 2018 Board Meeting and prior to the June 5, 2018 Board Meeting.
In advance of the Board Meetings, and in response to their detailed requests, the Board members received from the Adviser written responses to their inquiries, which included substantial exhibits and other materials related to the Adviser’s business and the services it provides to the Fund. The Directors took into account their multi-year experience as Directors and particularly their previous consideration of these types of agreements.
During the Board Meetings, the Board members had an opportunity to discuss this information with SSGA FM representatives, including senior executives, representatives from the legal, compliance and finance departments, and investment personnel. The Board members posed questions to these representatives and engaged in significant discussions.
In reaching its determinations relating to the continuance of the Investment Advisory and Administration Agreement, the Board considered those factors it deemed relevant, including the factors discussed below. In its deliberations, the Board did not identify any single factor that was dispositive and each Director may have attributed different weights to the various factors. The Directors evaluated the information provided to them, as well as the presentations and discussions that occurred at the Board Meetings, for the Fund, and their determinations were made separately in respect of the Fund from other series portfolios of the V.I.S Funds.
The material factors and conclusions that formed the basis for the Board’s determinations to approve the continuance of the Investment Advisory and Administration Agreement with the Adviser on behalf of the Fund are as discussed below.
The Nature, Extent and Quality of Services Provided.
The Board reviewed the services provided to the Fund by the Adviser. The Board considered the Adviser’s management capabilities and investment process, including the education, experience and number of investment professionals and other personnel who provide portfolio management and similar services to the Fund. The Board evaluated, where relevant, the abilities and experience of such investment personnel. The Board considered the extensive experience and resources committed by the Adviser to risk management, including with respect to investment risk, liquidity risk, operational risk, counterparty risk and model risk. The Board also considered the significant risks assumed by the Adviser in connection with the services provided to the Fund, including operational, enterprise, regulatory, litigation and compliance risks. The Board also took into account the compensation paid to recruit and retain investment personnel, and the time and attention devoted to the Fund by senior management.
State Street S&P 500 Index V.I.S. Funds
Other Information (Unaudited), continued
The Board had previously reviewed the compliance programs of SSGA FM and various affiliated service providers (“Affiliated Service Providers”). Among other things, the Board considered compliance and reporting matters relating to personal trading by investment personnel, late trading, portfolio valuation, business continuity and the voting of proxies.
In light of the foregoing and other relevant information, the Board, including the Independent Board Members, concluded that the services provided by the Adviser continue to be satisfactory.
Investment Performance.
The Board members considered the investment performance of the Fund for various periods. The Board members reviewed detailed comparisons of the performance of the Fund with the relevant securities index and peer and category groupings of mutual funds prepared by Broadridge with respect to various periods. The Board members also engaged in detailed discussions with SSGA FM management about its investment processes and performance results. These discussions focused on the Fund’s investment objective, the number and experience of portfolio management personnel, the Fund’s investment style and approach employed, the likely market cycles for the Fund’s investment style and the reasons for the Fund’s generally competitive performance.
Taking these factors into consideration, the Board, including the Independent Board Members, concluded that the Fund’s performance was acceptable overall.
Cost of the Services Provided And Profits Realized From The Relationship with the Fund.
The Directors considered the management fees paid to the Adviser by the Fund. The Board reviewed the level of profits realized by the Adviser and the Affiliated Service Providers in providing investment advisory and other services to the Fund. Information also was presented regarding the financial condition of the Adviser for various past periods. The Directors also considered the Adviser’s statements concerning its significant investment in supporting registered investment companies. The Board also considered the various risks borne by SSGA FM and the Affiliated Service Providers in connection with their various roles in servicing the Fund, including enterprise, litigation, business, operational and entrepreneurial risk.
The Board concluded that the profitability of the Adviser with respect to the Fund, and the profitability range of each of the Affiliated Service Providers with respect to its services to the Fund, were reasonable in relation to the services provided.
The Extent to Which Economies of Scale Would Be Realized as the Fund Grows and Whether Fee Levels Would Reflect Such Economies of Scale.
The Board considered the extent to which the Adviser and the Affiliated Service Providers, on the one hand, and the Fund, on the other hand, can expect to realize benefits from economies of scale as the assets of the Fund increase. The Board acknowledged the difficulty in accurately measuring the benefits resulting from the economies of scale with respect to the management of the Fund. The Board concluded that, in light of, among other considerations, the current size of the Fund, the level of profitability of the Adviser and the Affiliated Service Providers with respect to the Fund, and/or the comparative management fee and expense ratio of the Fund, it does not appear that the Adviser or the Affiliated Service Providers has realized benefits from economies of scale in managing the assets of the Fund to such an extent that previously agreed management fees should be reduced or that breakpoints in such fees should be implemented for the Fund at this time.
Comparison of Services to be Rendered and Fees to be Paid.
The Board discussed the services provided to the Fund by the Adviser, and the fees charged to the Fund for those services. As part of its review, the Board considered the Fund’s management fee and total expense ratio, including the portion attributable to administrative services provided by SSGA FM, as compared to the expense ratios of a group of comparable mutual funds selected by Broadridge, and the related Broadridge analysis for the Fund. The Board also considered the comparability of the fees charged and the services provided to the Fund by the Adviser to the fees charged and services provided to other clients of the Adviser. Among other information, the Board considered that the Fund’s advisory fee and expense ratios were within the applicable Broadridge peer group ranges.
In light of the foregoing, the Board, including the Independent Board Members, determined that the management fees, considered in relation to the services provided to the Fund, supported the Board’s approval of the continuance of the Investment Advisory and Administration Agreement.
State Street S&P 500 Index V.I.S. Funds
Other Information (Unaudited), continued
Fall-Out Benefits.
The Board considered actual and potential financial benefits that the Adviser could derive from its relationship with the Fund, including the custody, fund accounting and sub-administration services being provided to the Fund by affiliates of the Adviser and, to the extent applicable, soft dollar commission benefits generated through Fund portfolio transactions. The Board noted, however, that the Fund benefits from the vast array of resources available through SSGA FM, and that the Fund represents only a small portion of the assets managed by SSGA FM.
Conclusion.
No single factor was determinative to the Board’s decision. Based on their discussion and such other matters as were deemed relevant, the Directors, including the Independent Board Members, approved the continuance of the Investment Advisory and Administration Agreement for the Fund.
Directors
John R. Costantino, Chairman
R. Sheldon Johnson
Donna M. Rapaccioli
Jeanne M. La Porta
Officers
Jeanne M. La Porta, President
Arthur Jensen, Treasurer
Brian Harris, Chief Compliance Officer and Anti-Money Laundering Officer
Bruce S. Rosenberg, Assistant Treasurer
Ann M. Carpenter, Assistant Treasurer
Chad C. Hallett, Assistant Treasurer
Darlene Anderson-Vasquez, Assistant Treasurer
Daniel G. Plourde, Assistant Treasurer
Jesse Hallee, Secretary
Investment Adviser and Administrator
SSGA Funds Management, Inc.
1600 Summer Street
P.O. Box 7900
Stamford, CT 06904-7900
Custodian and Sub-Administrator
State Street Bank and Trust Company
One Lincoln Street
Boston, Massachusetts 02111
Distributor
State Street Global Advisors Funds Distributors, LLC
One Iron Street
Boston, MA 02210
Independent Registered Public Accounting Firm
Ernst & Young LLP
200 Clarendon Street
Boston, Massachusetts 02116
Semi-Annual Report
June 30, 2018
State Street Small-Cap Equity V.I.S. Fund

State Street Small-Cap Equity V.I.S. Fund
Semi-Annual Report
June 30, 2018 (Unaudited)
Table of Contents
This report is prepared for Policyholders of certain variable contracts and may be distributed to others only if preceded or accompanied by the variable contract’s current prospectus and the current summary prospectus of the Fund available for investments thereunder.
State Street Small-Cap Equity V.I.S. Fund
Fund Information — June 30, 2018 (Unaudited)
Total return performance shown in this report for the Fund takes into account changes in share price and assumes reinvestment of dividends and capital gains distributions, if any. Total returns shown are net of Fund fees and expenses but do not reflect fees and charges associated with the variable contracts such as administrative fees, account charges and surrender charges, which, if reflected, would reduce the Fund’s total returns for all periods shown.
The performance data quoted represents past performance; past performance does not guarantee future results. Investment return and principal value will fluctuate so your shares, when redeemed, may be worth more or less than their original cost. Current performance may be higher or lower than the performance data quoted. Periods less than one year are not annualized. Please call toll-free (800) 242-0134 or visit the Fund’s website at http://www.ssga.com/geam for the most recent month-end performance data.
An investment in the Fund is not a deposit of any bank and is not insured or guaranteed by the Federal Deposit Insurance Corporation (“FDIC”) or any other government agency. An investment in the Fund is subject to risk, including possible loss of principal invested.
Sector Allocation
Portfolio Composition as a % of Fair Value of $40,395 (in thousands) as of June 30, 2018 (a)(b)
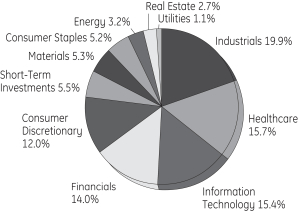
Top Ten Largest Holdings
as of June 30, 2018 (as a % of Fair Value) (a)(b)
| | | | |
John Wiley & Sons Inc., Class A | | | 1.25 | % |
Ritchie Bros Auctioneers Inc. | | | 1.10 | % |
Blackbaud Inc. | | | 1.08 | % |
Integra LifeSciences Holdings Corp. | | | 1.06 | % |
Actuant Corp., Class A | | | 1.00 | % |
Darling Ingredients Inc. | | | 0.94 | % |
Woodward Inc. | | | 0.93 | % |
Welbilt Inc. | | | 0.91 | % |
Newfield Exploration Co. | | | 0.87 | % |
Sensient Technologies Corp. | | | 0.86 | % |
| (a) | Fair Value basis is inclusive of short-term investment in State Street Institutional U.S. Government Money Market Fund - Class G Shares. |
| (b) | The securities information regarding holdings, allocations and other characteristics is presented to illustrate examples of securities that the Fund has bought and the diversity of areas in which the Fund may invest as of a particular date. It may not be representative of the Fund’s current or future investments and should not be construed as a recommendation to purchase or sell a particular security. |
State Street Global Advisors Funds Distributors, LLC, member of FINRA & SIPC is the principal underwriter and distributor of the State Street V.I.S. Funds and an indirect wholly-owned subsidiary of State Street Corporation. References to State Street may include State Street Corporation and its affiliates. The Funds pay State Street Bank and Trust Company for its services as custodian and Fund Accounting agent, and pay SSGA Funds Management, Inc. for investment advisory and administrative services.
| | | | |
| State Street Small-Cap Equity V.I.S. Fund | | | 1 | |
State Street Small-Cap Equity V.I.S. Fund
Understanding Your Fund’s Expenses — June 30, 2018 (Unaudited)
As a shareholder of the Fund, you incur ongoing costs. Ongoing costs include portfolio management fees, professional fees, administrative fees and other Fund expenses. The following example is intended to help you understand your ongoing costs (in dollars) of investing in the Fund and to compare these costs with the ongoing costs of investing in other mutual funds.
To illustrate these ongoing costs, we have provided an example and calculated the expenses paid by investors in the Fund during the period. The information in the following table is based on an investment of $1,000, which is invested at the beginning of the period and held for the entire six-month period ended June 30, 2018.
Actual Expenses
The first section of the table provides information about actual account values and actual expenses. You may use the information in this section, together with the amount you invested, to estimate the expenses that you paid over the period. To do so, simply divide your account value by $1,000 (for example, an $8,600 account value divided by $1,000 = 8.6), then multiply the result by the number given under the heading “Expenses paid during the period” to estimate the expenses you paid on your account during the period.
Hypothetical Example for Comparison Purposes
The second section of the table provides information about hypothetical account values and hypothetical expenses based on the Fund’s actual expense ratio and an assumed rate of return of 5% per year before expenses, which is not the Fund’s actual return. The hypothetical account values and expenses may not be used to estimate the actual ending account balance or expenses you paid for the period. You may use this information to compare the ongoing costs of investing in the Fund and other funds. To do so, compare this 5% hypothetical example with the 5% hypothetical examples that appear in the shareholder reports of other funds.
Please note that the expenses shown in the table are meant to highlight and help you compare ongoing costs only and do not reflect transaction costs, such as sales charges or redemption fees, if any. Therefore, the second section of the table is useful in comparing ongoing costs only, and will not help you determine the relative total costs of owning different funds. Additionally, the expenses shown do not reflect the fees or charges associated with variable contracts through which shares of the Fund are offered.
January 1, 2018 – June 30, 2018
| | | | | | | | |
| | | Actual
Fund Return | | | Hypothetical
5% Return
(2.5% for
the period) | |
Account value at the beginning of the period | | $ | 1,000.00 | | | $ | 1,000.00 | |
Account value at the end of the period | | $ | 1,076.00 | | | $ | 1,018.25 | |
Expenses paid during the period* | | $ | 6.79 | | | $ | 6.61 | |
| * | Expenses are equal to the Fund’s annualized expense ratio of 1.32% (for the period January 1, 2018-June 30, 2018), multiplied by the average account value over the period, multiplied by 181/365 (to reflect the one-half year period). |
| | |
| 2 | | State Street Small-Cap Equity V.I.S. Fund |
State Street Small-Cap Equity V.I.S. Fund
Schedule of Investments — June 30, 2018 (Unaudited)
| | | | | | | | |
| | | Number
of Shares | | | Fair
Value
$ | |
| | | | | | | | |
| Common Stock - 94.5%† | |
Aerospace & Defense - 0.7% | |
Esterline Technologies Corp. (a) | | | 287 | | | | 21,180 | |
Teledyne Technologies Inc. (a) | | | 1,279 | | | | 254,598 | |
| | | | | | | | |
| | | | 275,778 | |
| | | | | | | | |
|
Agricultural & Farm Machinery - 0.5% | |
AGCO Corp. (b) | | | 3,547 | | | | 215,374 | |
| | | | | | | | |
|
Agricultural Products - 0.9% | |
Darling Ingredients Inc. (a) | | | 19,136 | | | | 380,424 | |
| | | | | | | | |
|
Air Freight & Logistics - 0.2% | |
Air Transport Services Group Inc. (a) | | | 700 | | | | 15,813 | |
Forward Air Corp. | | | 500 | | | | 29,540 | |
Hub Group Inc., Class A (a) | | | 668 | | | | 33,266 | |
| | | | | | | | |
| | | | 78,619 | |
| | | | | | | | |
|
Airlines - 0.0%* | |
Hawaiian Holdings Inc. | | | 450 | | | | 16,178 | |
| | | | | | | | |
|
Apparel Retail - 0.6% | |
American Eagle Outfitters Inc. | | | 448 | | | | 10,416 | |
Burlington Stores Inc. (a) | | | 564 | | | | 84,899 | |
Chico’s FAS Inc. | | | 1,399 | | | | 11,388 | |
The Buckle Inc. | | | 4,676 | | | | 125,784 | |
The Children’s Place Inc. | | | 250 | | | | 30,200 | |
| | | | | | | | |
| | | | 262,687 | |
| | | | | | | | |
|
Apparel, Accessories & Luxury Goods - 0.5% | |
G-III Apparel Group Ltd. (a) | | | 4,238 | | | | 188,167 | |
| | | | | | | | |
|
Application Software - 3.7% | |
ACI Worldwide Inc. (a)(b) | | | 9,904 | | | | 244,332 | |
Blackbaud Inc. (b) | | | 4,268 | | | | 437,257 | |
Blackline Inc. (a) | | | 1,645 | | �� | | 71,442 | |
Fair Isaac Corp. (a) | | | 142 | | | | 27,451 | |
Guidewire Software Inc. (a) | | | 1,950 | | | | 173,121 | |
Paylocity Holding Corp. (a) | | | 1,949 | | | | 114,718 | |
RealPage Inc. (a) | | | 3,329 | | | | 183,428 | |
SS&C Technologies Holdings Inc. | | | 4,323 | | | | 224,364 | |
Zix Corp. (a) | | | 5,300 | | | | 28,567 | |
| | | | | | | | |
| | | | 1,504,680 | |
| | | | | | | | |
|
Asset Management & Custody Banks - 1.0% | |
BrightSphere Investment Group PLC | | | 1,457 | | | | 20,777 | |
Cohen & Steers Inc. | | | 788 | | | | 32,867 | |
Financial Engines Inc. | | | 7,650 | | | | 343,485 | |
| | | | | | | | |
| | | | 397,129 | |
| | | | | | | | |
| | | | | | | | |
| | | Number
of Shares | | | Fair
Value
$ | |
Auto Parts & Equipment - 0.8% | |
American Axle & Manufacturing Holdings Inc. (a) | | | 1,130 | | | | 17,583 | |
Cooper-Standard Holdings Inc. (a) | | | 372 | | | | 48,609 | |
Gentherm Inc. (a) | | | 716 | | | | 28,139 | |
LCI Industries | | | 624 | | | | 56,254 | |
Standard Motor Products Inc. | | | 1,797 | | | | 86,867 | |
Stoneridge Inc. (a) | | | 1,771 | | | | 62,233 | |
Tenneco Inc. | | | 336 | | | | 14,770 | |
Tower International Inc. | | | 756 | | | | 24,041 | |
| | | | | | | | |
| | | | 338,496 | |
| | | | | | | | |
|
Automobile Manufacturers - 0.6% | |
Thor Industries Inc. | | | 2,187 | | | | 212,992 | |
Winnebago Industries Inc. | | | 1,189 | | | | 48,273 | |
| | | | | | | | |
| | | | 261,265 | |
| | | | | | | | |
|
Automotive Retail - 1.3% | |
America’s Car-Mart Inc. (a) | | | 721 | | | | 44,630 | |
Asbury Automotive Group Inc. (a) | | | 329 | | | | 22,553 | |
Group 1 Automotive Inc. | | | 1,696 | | | | 106,848 | |
Monro Inc. | | | 1,216 | | | | 70,650 | |
Murphy USA Inc. (a) | | | 3,704 | | | | 275,170 | |
| | | | | | | | |
| | | | 519,851 | |
| | | | | | | | |
|
Biotechnology - 0.7% | |
Repligen Corp. (a) | | | 6,015 | | | | 282,946 | |
| | | | | | | | |
|
Brewers - 0.4% | |
Craft Brew Alliance Inc. (a) | | | 557 | | | | 11,502 | |
The Boston Beer Company Inc., Class A (a) | | | 500 | | | | 149,850 | |
| | | | | | | | |
| | | | 161,352 | |
| | | | | | | | |
|
Building Products - 0.7% | |
American Woodmark Corp. (a) | | | 217 | | | | 19,866 | |
Apogee Enterprises Inc. | | | 515 | | | | 24,808 | |
Builders FirstSource Inc. (a) | | | 2,949 | | | | 53,937 | |
Continental Building Products Inc. (a) | | | 584 | | | | 18,425 | |
Masonite International Corp. (a) | | | 198 | | | | 14,226 | |
NCI Building Systems Inc. (a) | | | 1,277 | | | | 26,817 | |
Patrick Industries Inc. (a) | | | 400 | | | | 22,740 | |
Trex Company Inc. (a) | | | 680 | | | | 42,561 | |
Universal Forest Products Inc. | | | 1,646 | | | | 60,277 | |
| | | | | | | | |
| | | | 283,657 | |
| | | | | | | | |
|
Commercial Printing - 0.1% | |
Deluxe Corp. | | | 338 | | | | 22,379 | |
| | | | | | | | |
|
Commodity Chemicals - 0.2% | |
AdvanSix Inc. (a) | | | 887 | | | | 32,491 | |
See Notes to Schedule of Investments and Notes to Financial Statements.
| | | | |
| State Street Small-Cap Equity V.I.S. Fund | | | 3 | |
State Street Small-Cap Equity V.I.S. Fund
Schedule of Investments, continued — June 30, 2018 (Unaudited)
| | | | | | | | |
| | | Number
of Shares | | | Fair
Value
$ | |
| | | | | | | | |
Koppers Holdings Inc. (a) | | | 490 | | | | 18,791 | |
Trinseo S.A. | | | 541 | | | | 38,384 | |
| | | | | | | | |
| | | | 89,666 | |
| | | | | | | | |
|
Communications Equipment - 0.3% | |
ADTRAN Inc. | | | 1,372 | | | | 20,374 | |
Ciena Corp. (a) | | | 1,272 | | | | 33,721 | |
Extreme Networks Inc. (a) | | | 2,600 | | | | 20,696 | |
Lumentum Holdings Inc. (a) | | | 560 | | | | 32,424 | |
NETGEAR Inc. (a) | | | 152 | | | | 9,500 | |
Plantronics Inc. | | | 198 | | | | 15,097 | |
| | | | | | | | |
| | | | 131,812 | |
| | | | | | | | |
|
Construction & Engineering - 1.2% | |
Aegion Corp. (a) | | | 10,621 | | | | 273,491 | |
Dycom Industries Inc. (a) | | | 2,130 | | | | 201,306 | |
EMCOR Group Inc. | | | 301 | | | | 22,930 | |
| | | | | | | | |
| | | | 497,727 | |
| | | | | | | | |
|
Construction Machinery & Heavy Trucks - 1.8% | |
Alamo Group Inc. | | | 449 | | | | 40,572 | |
Astec Industries Inc. | | | 847 | | | | 50,651 | |
Federal Signal Corp. | | | 12,188 | | | | 283,858 | |
The Greenbrier Companies Inc. | | | 423 | | | | 22,313 | |
Trinity Industries Inc. | | | 8,526 | | | | 292,101 | |
Wabash National Corp. | | | 2,100 | | | | 39,186 | |
| | | | | | | | |
| | | | 728,681 | |
| | | | | | | | |
|
Construction Materials - 0.1% | |
Summit Materials Inc., Class A (a) | | | 1,073 | | | | 28,166 | |
| | | | | | | | |
|
Consumer Electronics - 0.0%* | |
ZAGG Inc. (a) | | | 1,000 | | | | 17,300 | |
| | | | | | | | |
|
Consumer Finance - 0.2% | |
Enova International Inc. (a) | | | 2,163 | | | | 79,058 | |
| | | | | | | | |
|
Data Processing & Outsourced Services - 1.6% | |
Broadridge Financial Solutions Inc. | | | 1,708 | | | | 196,591 | |
Cass Information Systems Inc. | | | 256 | | | | 17,618 | |
CoreLogic Inc. (a) | | | 3,491 | | | | 181,183 | |
CSG Systems International Inc. | | | 1,640 | | | | 67,027 | |
EVERTEC Inc. | | | 1,333 | | | | 29,126 | |
MAXIMUS Inc. | | | 351 | | | | 21,801 | |
Travelport Worldwide Ltd. | | | 6,636 | | | | 123,031 | |
| | | | | | | | |
| | | | 636,377 | |
| | | | | | | | |
|
Distributors - 0.5% | |
LKQ Corp. (a) | | | 6,648 | | | | 212,071 | |
| | | | | | | | |
| | | | | | | | |
| | | Number
of Shares | | | Fair
Value
$ | |
Diversified Metals & Mining - 0.3% | |
Compass Minerals International Inc. | | | 1,660 | | | | 109,145 | |
Materion Corp. | | | 337 | | | | 18,249 | |
| | | | | | | | |
| | | | 127,394 | |
| | | | | | | | |
|
Diversified Real Estate Activities - 0.1% | |
The RMR Group Inc., Class A | | | 350 | | | | 27,458 | |
| | | | | | | | |
|
Diversified REITs - 0.1% | |
American Assets Trust Inc. | | | 763 | | | | 29,215 | |
| | | | | | | | |
|
Diversified Support Services - 1.7% | |
Healthcare Services Group Inc. | | | 4,456 | | | | 192,455 | |
Ritchie Bros Auctioneers Inc. | | | 12,950 | | | | 441,854 | |
UniFirst Corp. | | | 199 | | | | 35,203 | |
| | | | | | | | |
| | | | | | | 669,512 | |
| | | | | | | | |
|
Education Services - 0.4% | |
Grand Canyon Education Inc. (a) | | | 300 | | | | 33,483 | |
K12 Inc. (a) | | | 8,960 | | | | 146,675 | |
| | | | | | | | |
| | | | | | | 180,158 | |
| | | | | | | | |
|
Electric Utilities - 0.8% | |
ALLETE Inc. | | | 393 | | | | 30,422 | |
IDACORP Inc. | | | 3,040 | | | | 280,410 | |
Spark Energy Inc., Class A | | | 1,300 | | | | 12,675 | |
| | | | | | | | |
| | | | | | | 323,507 | |
| | | | | | | | |
|
Electrical Components & Equipment - 0.2% | |
Atkore International Group Inc. (a) | | | 820 | | | | 17,031 | |
EnerSys | | | 369 | | | | 27,542 | |
Regal Beloit Corp. | | | 576 | | | | 47,117 | |
| | | | | | | | |
| | | | | | | 91,690 | |
| | | | | | | | |
|
Electronic Components - 1.2% | |
Belden Inc. | | | 3,259 | | | | 199,190 | |
Littelfuse Inc. | | | 1,080 | | | | 246,434 | |
Vishay Intertechnology Inc. | | | 879 | | | | 20,393 | |
| | | | | | | | |
| | | | | | | 466,017 | |
| | | | | | | | |
|
Electronic Equipment & Instruments - 0.6% | |
Control4 Corp. (a) | | | 2,240 | | | | 54,454 | |
National Instruments Corp. | | | 1,334 | | | | 56,001 | |
Zebra Technologies Corp., Class A (a) | | | 894 | | | | 128,066 | |
| | | | | | | | |
| | | | | | | 238,521 | |
| | | | | | | | |
|
Electronic Manufacturing Services - 0.3% | |
KEMET Corp. (a) | | | 1,135 | | | | 27,410 | |
Methode Electronics Inc. | | | 477 | | | | 19,223 | |
See Notes to Schedule of Investments and Notes to Financial Statements.
| | |
| 4 | | State Street Small-Cap Equity V.I.S. Fund |
State Street Small-Cap Equity V.I.S. Fund
Schedule of Investments, continued — June 30, 2018 (Unaudited)
| | | | | | | | |
| | | Number
of Shares | | | Fair
Value
$ | |
| | | | | | | | |
Plexus Corp. (a) | | | 342 | | | | 20,363 | |
Sanmina Corp. (a) | | | 1,052 | | | | 30,824 | |
TTM Technologies Inc. (a) | | | 1,407 | | | | 24,805 | |
| | | | | | | | |
| | | | | | | 122,625 | |
| | | | | | | | |
|
Environmental & Facilities Services - 0.9% | |
Casella Waste Systems Inc., Class A (a) | | | 800 | | | | 20,488 | |
Clean Harbors Inc. (a) | | | 6,050 | | | | 336,077 | |
| | | | | | | | |
| | | | | | | 356,565 | |
| | | | | | | | |
| |
Food Distributors - 0.8% | | | | | |
Performance Food Group Co. (a) | | | 4,643 | | | | 170,398 | |
SpartanNash Co. | | | 5,975 | | | | 152,482 | |
| | | | | | | | |
| | | | | | | 322,880 | |
| | | | | | | | |
| |
Food Retail - 0.1% | | | | | |
Casey’s General Stores Inc. | | | 219 | | | | 23,013 | |
Sprouts Farmers Market Inc. (a) | | | 1,300 | | | | 28,691 | |
| | | | | | | | |
| | | | | | | 51,704 | |
| | | | | | | | |
| |
Footwear - 1.0% | | | | | |
Deckers Outdoor Corp. (a) | | | 1,257 | | | | 141,903 | |
Skechers U.S.A. Inc., Class A (a) | | | 703 | | | | 21,097 | |
Wolverine World Wide Inc. | | | 6,797 | | | | 236,331 | |
| | | | | | | | |
| | | | | | | 399,331 | |
| | | | | | | | |
| |
Forest Products - 0.1% | | | | | |
Boise Cascade Co. | | | 809 | | | | 36,162 | |
Louisiana-Pacific Corp. | | | 905 | | | | 24,634 | |
| | | | | | | | |
| | | | | | | 60,796 | |
| | | | | | | | |
| |
Gas Utilities - 0.2% | | | | | |
Chesapeake Utilities Corp. | | | 164 | | | | 13,112 | |
South Jersey Industries Inc. | | | 1,476 | | | | 49,401 | |
Spire Inc. | | | 292 | | | | 20,630 | |
| | | | | | | | |
| | | | | | | 83,143 | |
| | | | | | | | |
| |
General Merchandise Stores - 0.0%* | | | | | |
Big Lots Inc. | | | 411 | | | | 17,172 | |
| | | | | | | | |
| |
Health Care REITs - 0.1% | | | | | |
CareTrust REIT Inc. | | | 1,418 | | | | 23,666 | |
| | | | | | | | |
| |
Healthcare Distributors - 0.0%* | | | | | |
Owens & Minor Inc. | | | 600 | | | | 10,026 | |
| | | | | | | | |
| |
Healthcare Equipment - 5.1% | | | | | |
Cantel Medical Corp. | | | 550 | | | | 54,098 | |
Cardiovascular Systems Inc. (a) | | | 7,000 | | | | 226,380 | |
CONMED Corp. | | | 3,850 | | | | 281,820 | |
| | | | | | | | |
| | | Number
of Shares | | | Fair
Value
$ | |
Hill-Rom Holdings Inc. | | | 3,443 | | | | 300,712 | |
Insulet Corp. (a) | | | 2,650 | | | | 227,105 | |
Integra LifeSciences Holdings Corp. (a) | | | 6,650 | | | | 428,326 | |
LivaNova PLC (a) | | | 288 | | | | 28,748 | |
Masimo Corp. (a) | | | 900 | | | | 87,885 | |
NuVasive Inc. (a) | | | 4,700 | | | | 244,964 | |
Orthofix International N.V. (a) | | | 624 | | | | 35,456 | |
Penumbra Inc. (a) | | | 950 | | | | 131,242 | |
Varex Imaging Corp. (a) | | | 400 | | | | 14,836 | |
| | | | | | | | |
| | | | | | | 2,061,572 | |
| | | | | | | | |
| |
Healthcare Facilities - 0.6% | | | | | |
Acadia Healthcare Company Inc. (a)(b) | | | 3,747 | | | | 153,290 | |
Encompass Health Corp. | | | 389 | | | | 26,343 | |
Select Medical Holdings Corp. (a) | | | 1,587 | | | | 28,804 | |
Tenet Healthcare Corp. (a) | | | 482 | | | | 16,181 | |
| | | | | | | | |
| | | | | | | 224,618 | |
| | | | | | | | |
| |
Healthcare Services - 1.3% | | | | | |
Addus HomeCare Corp. (a) | | | 400 | | | | 22,900 | |
Amedisys Inc. (a) | | | 500 | | | | 42,730 | |
AMN Healthcare Services Inc. (a) | | | 577 | | | | 33,812 | |
BioTelemetry Inc. (a) | | | 2,585 | | | | 116,325 | |
Chemed Corp. | | | 95 | | | | 30,572 | |
Diplomat Pharmacy Inc. (a) | | | 3,354 | | | | 85,728 | |
LHC Group Inc. (a) | | | 400 | | | | 34,236 | |
MEDNAX Inc. (a) | | | 3,382 | | | | 146,373 | |
RadNet Inc. (a) | | | 2,200 | | | | 33,000 | |
| | | | | | | | |
| | | | | | | 545,676 | |
| | | | | | | | |
| |
Healthcare Supplies - 1.1% | | | | | |
Avanos Medical Inc. (a) | | | 3,050 | | | | 174,613 | |
Endologix Inc. (a) | | | 10,728 | | | | 60,720 | |
ICU Medical Inc. (a) | | | 550 | | | | 161,508 | |
Lantheus Holdings Inc. (a) | | | 1,500 | | | | 21,825 | |
Merit Medical Systems Inc. (a) | | | 747 | | | | 38,246 | |
| | | | | | | | |
| | | | | | | 456,912 | |
| | | | | | | | |
| |
Healthcare Technology - 2.1% | | | | | |
HMS Holdings Corp. (a) | | | 9,880 | | | | 213,606 | |
Medidata Solutions Inc. (a) | | | 3,250 | | | | 261,820 | |
Omnicell Inc. (a) | | | 4,209 | | | | 220,762 | |
Quality Systems Inc. (a) | | | 396 | | | | 7,722 | |
Teladoc Inc. (a) | | | 2,250 | | | | 130,612 | |
| | | | | | | | |
| | | | | | | 834,522 | |
| | | | | | | | |
| |
Home Building - 0.3% | | | | | |
KB Home | | | 870 | | | | 23,699 | |
LGI Homes Inc. (a) | | | 517 | | | | 29,846 | |
TopBuild Corp. (a) | | | 973 | | | | 76,225 | |
| | | | | | | | |
| | | | | | | 129,770 | |
| | | | | | | | |
See Notes to Schedule of Investments and Notes to Financial Statements.
| | | | |
| State Street Small-Cap Equity V.I.S. Fund | | | 5 | |
State Street Small-Cap Equity V.I.S. Fund
Schedule of Investments, continued — June 30, 2018 (Unaudited)
| | | | | | | | |
| | | Number
of Shares | | | Fair
Value
$ | |
| | | | | | | | |
Home Furnishing Retail - 0.6% | | | | | |
Aaron’s Inc. (b) | | | 4,629 | | | | 201,130 | |
RH (a) | | | 304 | | | | 42,469 | |
| | | | | | | | |
| | | | | | | 243,599 | |
| | | | | | | | |
| |
Hotel & Resort REITs - 0.4% | | | | | |
Ashford Hospitality Trust Inc. | | | 1,799 | | | | 14,572 | |
Chatham Lodging Trust | | | 1,290 | | | | 27,374 | |
RLJ Lodging Trust | | | 5,701 | | | | 125,707 | |
| | | | | | | | |
| | | | | | | 167,653 | |
| | | | | | | | |
| |
Hotels, Resorts & Cruise Lines - 0.7% | | | | | |
Extended Stay America Inc. | | | 12,267 | | | | 265,090 | |
| | | | | | | | |
| |
Household Appliances - 0.7% | | | | | |
Helen of Troy Ltd. (a) | | | 2,847 | | | | 280,287 | |
| | | | | | | | |
| |
Housewares & Specialties - 0.0%* | | | | | |
Tupperware Brands Corp. | | | 254 | | | | 10,475 | |
| | | | | | | | |
|
Human Resource & Employment Services - 0.4% | |
Insperity Inc. | | | 673 | | | | 64,103 | |
Kforce Inc. | | | 900 | | | | 30,870 | |
TriNet Group Inc. (a) | | | 706 | | | | 39,494 | |
TrueBlue Inc. (a) | | | 768 | | | | 20,697 | |
| | | | | | | | |
| | | | | | | 155,164 | |
| | | | | | | | |
| |
Industrial Machinery - 7.3% | | | | | |
Actuant Corp., Class A (b) | | | 13,808 | | | | 405,265 | |
Altra Industrial Motion Corp. | | | 851 | | | | 36,678 | |
Barnes Group Inc. | | | 3,274 | | | | 192,839 | |
Briggs & Stratton Corp. | | | 68 | | | | 1,197 | |
Crane Co. | | | 1,637 | | | | 131,173 | |
Franklin Electric Company Inc. | | | 693 | | | | 31,254 | |
Harsco Corp. (a) | | | 662 | | | | 14,630 | |
Hillenbrand Inc. | | | 545 | | | | 25,697 | |
John Bean Technologies Corp. | | | 2,700 | | | | 240,030 | |
Kennametal Inc. | | | 747 | | | | 26,817 | |
LB Foster Co., Class A (a) | | | 801 | | | | 18,383 | |
Lydall Inc. (a) | | | 3,750 | | | | 163,688 | |
Mueller Industries Inc. | | | 5,426 | | | | 160,121 | |
Standex International Corp. | | | 1,900 | | | | 194,180 | |
The Timken Co. | | | 6,977 | | | | 303,848 | |
TriMas Corp. (a) | | | 4,600 | | | | 135,240 | |
Watts Water Technologies Inc., Class A | | | 1,739 | | | | 136,338 | |
Welbilt Inc. (a) | | | 16,450 | | | | 367,000 | |
Woodward Inc. | | | 4,885 | | | | 375,461 | |
| | | | | | | | |
| | | | | | | 2,959,839 | |
| | | | | | | | |
| |
Industrial REITs - 0.3% | | | | | |
Gramercy Property Trust | | | 1,727 | | | | 47,182 | |
Rexford Industrial Realty Inc. | | | 626 | | | | 19,650 | |
| | | | | | | | |
| | | Number
of Shares | | | Fair
Value
$ | |
STAG Industrial Inc. | | | 1,689 | | | | 45,991 | |
| | | | | | | | |
| | | | | | | 112,823 | |
| | | | | | | | |
| |
Internet Software & Services - 3.7% | | | | | |
Care.com Inc. (a) | | | 1,399 | | | | 29,211 | |
Cornerstone OnDemand Inc. (a) | | | 4,814 | | | | 228,328 | |
LogMeIn Inc. | | | 2,300 | | | | 237,475 | |
MINDBODY Inc., Class A (a) | | | 2,200 | | | | 84,920 | |
New Relic Inc. (a) | | | 3,050 | | | | 306,799 | |
NIC Inc. | | | 5,391 | | | | 83,830 | |
Okta Inc. (a) | | | 4,650 | | | | 234,221 | |
Q2 Holdings Inc. (a) | | | 2,300 | | | | 131,215 | |
Stamps.com Inc. (a) | | | 145 | | | | 36,692 | |
Yext Inc. (a) | | | 5,300 | | | | 102,502 | |
| | | | | | | | |
| | | | | | | 1,475,193 | |
| | | | | | | | |
| |
Investment Banking & Brokerage - 1.0% | | | | | |
BGC Partners Inc., Class A | | | 1,800 | | | | 20,376 | |
Evercore Inc., Class A | | | 260 | | | | 27,417 | |
Greenhill & Company Inc. | | | 764 | | | | 21,698 | |
Houlihan Lokey Inc. | | | 890 | | | | 45,586 | |
Piper Jaffray Cos. | | | 557 | | | | 42,805 | |
Raymond James Financial Inc. | | | 2,340 | | | | 209,079 | |
Stifel Financial Corp. | | | 747 | | | | 39,031 | |
| | | | | | | | |
| | | | | | | 405,992 | |
| | | | | | | | |
| |
IT Consulting & Other Services - 0.2% | | | | | |
Perficient Inc. (a) | | | 1,087 | | | | 28,664 | |
Science Applications International Corp. | | | 276 | | | | 22,337 | |
The Hackett Group Inc. | | | 1,200 | | | | 19,284 | |
| | | | | | | | |
| | | | | | | 70,285 | |
| | | | | | | | |
| |
Leisure Products - 0.8% | | | | | |
Malibu Boats Inc., Class A (a) | | | 700 | | | | 29,358 | |
MCBC Holdings Inc. (a) | | | 1,100 | | | | 31,845 | |
Polaris Industries Inc. | | | 1,992 | | | | 243,383 | |
| | | | | | | | |
| | | | | | | 304,586 | |
| | | | | | | | |
| |
Life & Health Insurance - 0.1% | | | | | |
Trupanion Inc. (a) | | | 1,017 | | | | 39,256 | |
| | | | | | | | |
| |
Life Sciences Tools & Services - 1.8% | | | | | |
Bruker Corp. | | | 4,888 | | | | 141,948 | |
Cambrex Corp. (a) | | | 1,285 | | | | 67,205 | |
ICON PLC (a) | | | 1,811 | | | | 240,012 | |
PRA Health Sciences Inc. (a) | | | 350 | | | | 32,676 | |
Syneos Health Inc. (a) | | | 5,185 | | | | 243,176 | |
| | | | | | | | |
| | | | | | | 725,017 | |
| | | | | | | | |
Managed Healthcare - 0.8% | | | | | |
Centene Corp. (a) | | | 1,695 | | | | 208,841 | |
HealthEquity Inc. (a) | | | 950 | | | | 71,345 | |
See Notes to Schedule of Investments and Notes to Financial Statements.
| | |
| 6 | | State Street Small-Cap Equity V.I.S. Fund |
State Street Small-Cap Equity V.I.S. Fund
Schedule of Investments, continued — June 30, 2018 (Unaudited)
| | | | | | | | |
| | | Number
of Shares | | | Fair
Value
$ | |
| | | | | | | | |
Magellan Health Inc. (a) | | | 300 | | | | 28,785 | |
| | | | | | | | |
| | | | | | | 308,971 | |
| | | | | | | | |
| |
Marine - 0.1% | | | | | |
Kirby Corp. (a) | | | 228 | | | | 19,061 | |
Matson Inc. | | | 697 | | | | 26,751 | |
| | | | | | | | |
| | | | | | | 45,812 | |
| | | | | | | | |
| |
Multi-Line Insurance - 0.4% | | | | | |
Horace Mann Educators Corp. | | | 2,761 | | | | 123,141 | |
National General Holdings Corp. | | | 900 | | | | 23,697 | |
| | | | | | | | |
| | | | | | | 146,838 | |
| | | | | | | | |
| |
Multi-Utilities - 0.1% | | | | | |
Black Hills Corp. | | | 692 | | | | 42,357 | |
| | | | | | | | |
| |
Office REITs - 0.7% | | | | | |
Brandywine Realty Trust | | | 2,162 | | | | 36,495 | |
Corporate Office Properties Trust | | | 1,044 | | | | 30,266 | |
Cousins Properties Inc. | | | 23,460 | | | | 227,327 | |
| | | | | | | | |
| | | | | | | 294,088 | |
| | | | | | | | |
| |
Office Services & Supplies - 0.8% | | | | | |
Herman Miller Inc. | | | 600 | | | | 20,340 | |
HNI Corp. | | | 519 | | | | 19,307 | |
Knoll Inc. | | | 771 | | | | 16,044 | |
MSA Safety Inc. | | | 2,602 | | | | 250,677 | |
Steelcase Inc., Class A | | | 1,344 | | | | 18,144 | |
| | | | | | | | |
| | | | | | | 324,512 | |
| | | | | | | | |
| |
Oil & Gas Drilling - 0.0%* | | | | | |
Nabors Industries Ltd. | | | 2,918 | | | | 18,704 | |
| | | | | | | | |
| |
Oil & Gas Equipment & Services - 1.0% | | | | | |
C&J Energy Services Inc. (a) | | | 1,265 | | | | 29,854 | |
Cactus Inc., Class A (a) | | | 821 | | �� | | 27,742 | |
Dril-Quip Inc. (a) | | | 1,205 | | | | 61,937 | |
Forum Energy Technologies Inc. (a) | | | 5,887 | | | | 72,704 | |
Keane Group Inc. (a) | | | 689 | | | | 9,419 | |
Natural Gas Services Group Inc. (a) | | | 834 | | | | 19,682 | |
Oil States International Inc. (a) | | | 5,501 | | | | 176,582 | |
| | | | | | | | |
| | | | | | | 397,920 | |
| | | | | | | | |
|
Oil & Gas Exploration & Production - 2.1% | |
Callon Petroleum Co. (a) | | | 3,966 | | | | 42,595 | |
Carrizo Oil & Gas Inc. (a) | | | 4,946 | | | | 137,746 | |
Gulfport Energy Corp. (a) | | | 2,600 | | | | 32,682 | |
Newfield Exploration Co. (a) | | | 11,658 | | | | 352,655 | |
Oasis Petroleum Inc. (a) | | | 3,154 | | | | 40,907 | |
| | | | | | | | |
| | | Number
of Shares | | | Fair
Value
$ | |
PDC Energy Inc. (a) | | | 372 | | | | 22,488 | |
Ring Energy Inc. (a) | | | 2,465 | | | | 31,108 | |
SM Energy Co. | | | 7,516 | | | | 193,086 | |
| | | | | | | | |
| | | | | | | 853,267 | |
| | | | | | | | |
| |
Oil & Gas Refining & Marketing - 0.1% | | | | | |
Par Pacific Holdings Inc. (a) | | | 1,567 | | | | 27,234 | |
| | | | | | | | |
| |
Packaged Foods & Meats - 2.5% | | | | | |
B&G Foods Inc. | | | 7,600 | | | | 227,240 | |
Calavo Growers Inc. | | | 125 | | | | 12,019 | |
Hostess Brands Inc. (a) | | | 11,850 | | | | 161,160 | |
J&J Snack Foods Corp. | | | 500 | | | | 76,235 | |
Sanderson Farms Inc. | | | 1,922 | | | | 202,098 | |
The Simply Good Foods Co. (a) | | | 7,650 | | | | 110,466 | |
TreeHouse Foods Inc. (a) | | | 4,050 | | | | 212,666 | |
| | | | | | | | |
| | | | | | | 1,001,884 | |
| | | | | | | | |
| |
Paper Products - 0.1% | | | | | |
Neenah Inc. | | | 484 | | | | 41,067 | |
| | | | | | | | |
| |
Personal Products - 0.4% | | | | | |
elf Beauty Inc. (a) | | | 9,100 | | | | 138,684 | |
USANA Health Sciences Inc. (a) | | | 306 | | | | 35,282 | |
| | | | | | | | |
| | | | | | | 173,966 | |
| | | | | | | | |
| |
Pharmaceuticals - 2.2% | | | | | |
Catalent Inc. (a) | | | 5,103 | | | | 213,765 | |
Depomed Inc. (a) | | | 2,500 | | | | 16,675 | |
Horizon Pharma PLC (a) | | | 1,600 | | | | 26,496 | |
Innoviva Inc. (a) | | | 1,500 | | | | 20,700 | |
Phibro Animal Health Corp., Class A | | | 700 | | | | 32,235 | |
Prestige Brands Holdings Inc. (a) | | | 8,040 | | | | 308,575 | |
Supernus Pharmaceuticals Inc. (a) | | | 4,200 | | | | 251,370 | |
| | | | | | | | |
| | | | | | | 869,816 | |
| | | | | | | | |
| |
Property & Casualty Insurance - 2.1% | | | | | |
AMERISAFE Inc. | | | 2,227 | | | | 128,609 | |
Argo Group International Holdings Ltd. | | | 4,906 | | | | 285,284 | |
James River Group Holdings Ltd. | | | 1,650 | | | | 64,828 | |
RLI Corp. | | | 1,963 | | | | 129,931 | |
The Navigators Group Inc. | | | 3,850 | | | | 219,450 | |
Universal Insurance Holdings Inc. | | | 416 | | | | 14,602 | |
| | | | | | | | |
| | | | | | | 842,704 | |
| | | | | | | | |
| |
Publishing - 1.2% | | | | | |
John Wiley & Sons Inc., Class A (b) | | | 8,082 | | | | 504,317 | |
| | | | | | | | |
See Notes to Schedule of Investments and Notes to Financial Statements.
| | | | |
| State Street Small-Cap Equity V.I.S. Fund | | | 7 | |
State Street Small-Cap Equity V.I.S. Fund
Schedule of Investments, continued — June 30, 2018 (Unaudited)
| | | | | | | | |
| | | Number
of Shares | | | Fair
Value
$ | |
| | | | | | | | |
Railroads - 0.7% | | | | | |
Genesee & Wyoming Inc., Class A (a) | | | 3,366 | | | | 273,723 | |
| | | | | | | | |
| |
Regional Banks - 8.9% | | | | | |
1st Source Corp. | | | 505 | | | | 26,982 | |
BankUnited Inc. | | | 287 | | | | 11,724 | |
Banner Corp. | | | 712 | | | | 42,813 | |
Bryn Mawr Bank Corp. | | | 2,550 | | | | 118,065 | |
Cadence BanCorp | | | 1,061 | | | | 30,631 | |
Camden National Corp. | | | 581 | | | | 26,558 | |
Cathay General Bancorp | | | 973 | | | | 39,397 | |
Chemical Financial Corp. | | | 764 | | | | 42,532 | |
Columbia Banking System Inc. | | | 975 | | | | 39,877 | |
Community Bank System Inc. | | | 2,650 | | | | 156,535 | |
Cullen/Frost Bankers Inc. | | | 1,758 | | | | 190,286 | |
CVB Financial Corp. | | | 6,800 | | | | 152,456 | |
Enterprise Financial Services Corp. | | | 681 | | | | 36,740 | |
Equity Bancshares Inc., Class A (a) | | | 469 | | | | 19,454 | |
First Financial Bankshares Inc. | | | 1,900 | | | | 96,710 | |
First Interstate BancSystem Inc., Class A | | | 1,013 | | | | 42,749 | |
Fulton Financial Corp. | | | 9,855 | | | | 162,607 | |
German American Bancorp Inc. | | | 3,100 | | | | 111,135 | |
Home BancShares Inc. | | | 2,063 | | | | 46,541 | |
IBERIABANK Corp. | | | 2,684 | | | | 203,447 | |
Independent Bank Corp. | | | 1,950 | | | | 152,880 | |
Lakeland Financial Corp. | | | 332 | | | | 15,999 | |
LegacyTexas Financial Group Inc. | | | 1,270 | | | | 49,555 | |
Origin Bancorp Inc. | | | 748 | | | | 30,623 | |
Pinnacle Financial Partners Inc. | | | 632 | | | | 38,773 | |
Prosperity Bancshares Inc. | | | 4,586 | | | | 313,499 | |
Renasant Corp. | | | 6,478 | | | | 294,879 | |
Sandy Spring Bancorp Inc. | | | 360 | | | | 14,764 | |
Simmons First National Corp., Class A | | | 1,112 | | | | 33,249 | |
South State Corp. | | | 194 | | | | 16,733 | |
Stock Yards Bancorp Inc. | | | 2,350 | | | | 89,652 | |
UMB Financial Corp. | | | 3,100 | | | | 236,313 | |
Umpqua Holdings Corp. | | | 1,692 | | | | 38,222 | |
Union Bankshares Corp. | | | 882 | | | | 34,292 | |
United Community Banks Inc. | | | 1,244 | | | | 38,153 | |
Washington Trust Bancorp Inc. | | | 2,300 | | | | 133,630 | |
Westamerica Bancorporation | | | 2,978 | | | | 168,287 | |
Western Alliance Bancorp (a) | | | 4,444 | | | | 251,575 | |
Wintrust Financial Corp. | | | 331 | | | | 28,814 | |
| | | | | | | | |
| | | | | | | 3,577,131 | |
| | | | | | | | |
| |
Reinsurance - 0.0%* | | | | | |
Maiden Holdings Ltd. | | | 1,187 | | | | 9,199 | |
| | | | | | | | |
| | | | | | | | |
| | | Number
of Shares | | | Fair
Value
$ | |
Research & Consulting Services - 0.3% | | | | | |
Resources Connection Inc. | | | 7,628 | | | | 128,913 | |
| | | | | | | | |
| |
Residential REITs - 0.6% | | | | | |
Education Realty Trust Inc. | | | 6,147 | | | | 255,101 | |
| | | | | | | | |
| |
Restaurants - 1.5% | | | | | |
BJ’s Restaurants Inc. | | | 600 | | | | 36,000 | |
Bloomin’ Brands Inc. | | | 500 | | | | 10,050 | |
Brinker International Inc. | | | 562 | | | | 26,751 | |
Cracker Barrel Old Country Store Inc. | | | 545 | | | | 85,134 | |
Dave & Buster’s Entertainment Inc. (a) | | | 400 | | | | 19,040 | |
El Pollo Loco Holdings Inc. (a) | | | 3,950 | | | | 45,030 | |
Papa John’s International Inc. | | | 2,650 | | | | 134,408 | |
Red Robin Gourmet Burgers Inc. (a) | | | 418 | | | | 19,479 | |
Ruth’s Hospitality Group Inc. | | | 1,000 | | | | 28,050 | |
Texas Roadhouse Inc. | | | 2,001 | | | | 131,086 | |
The Cheesecake Factory Inc. | | | 1,464 | | | | 80,608 | |
| | | | | | | | |
| | | | | | | 615,636 | |
| | | | | | | | |
| |
Retail REITs - 0.1% | | | | | |
Retail Opportunity Investments Corp. | | | 2,217 | | | | 42,478 | |
| | | | | | | | |
| |
Security & Alarm Services - 0.8% | | | | | |
The Brink’s Co. | | | 4,203 | | | | 335,189 | |
| | | | | | | | |
| |
Semiconductor Equipment - 0.7% | | | | | |
Advanced Energy Industries Inc. (a) | | | 450 | | | | 26,140 | |
Amkor Technology Inc. (a) | | | 2,100 | | | | 18,039 | |
Entegris Inc. | | | 700 | | | | 23,730 | |
FormFactor Inc. (a) | | | 1,500 | | | | 19,950 | |
Ichor Holdings Ltd. (a) | | | 600 | | | | 12,732 | |
MKS Instruments Inc. | | | 400 | | | | 38,280 | |
Rudolph Technologies Inc. (a) | | | 3,273 | | | | 96,881 | |
Ultra Clean Holdings Inc. (a) | | | 1,000 | | | | 16,600 | |
Versum Materials Inc. | | | 465 | | | | 17,275 | |
| | | | | | | | |
| | | | | | | 269,627 | |
| | | | | | | | |
| |
Semiconductors - 0.6% | | | | | |
Semtech Corp. (a) | | | 4,241 | | | | 199,539 | |
SMART Global Holdings Inc. (a) | | | 800 | | | | 25,496 | |
| | | | | | | | |
| | | | | | | 225,035 | |
| | | | | | | | |
| |
Specialized REITs - 0.4% | | | | | |
CoreSite Realty Corp. | | | 924 | | | | 102,398 | |
PotlatchDeltic Corp. | | | 831 | | | | 42,256 | |
| | | | | | | | |
| | | | 144,654 | |
| | | | | | | | |
See Notes to Schedule of Investments and Notes to Financial Statements.
| | |
| 8 | | State Street Small-Cap Equity V.I.S. Fund |
State Street Small-Cap Equity V.I.S. Fund
Schedule of Investments, continued — June 30, 2018 (Unaudited)
| | | | | | | | |
| | | Number
of Shares | | | Fair
Value
$ | |
| | | | | | | | |
Specialty Chemicals - 4.0% | | | | | |
Chase Corp. | | | 190 | | | | 22,278 | |
Ferro Corp. (a) | | | 1,336 | | | | 27,856 | |
HB Fuller Co. | | | 6,016 | | | | 322,939 | |
Ingevity Corp. (a) | | | 2,327 | | | | 188,161 | |
Innospec Inc. | | | 2,300 | | | | 176,065 | |
KMG Chemicals Inc. | | | 741 | | | | 54,671 | |
Minerals Technologies Inc. | | | 374 | | | | 28,181 | |
PolyOne Corp. | | | 5,332 | | | | 230,449 | |
PQ Group Holdings Inc. (a) | | | 638 | | | | 11,484 | |
Quaker Chemical Corp. | | | 1,452 | | | | 224,871 | |
Sensient Technologies Corp. | | | 4,846 | | | | 346,731 | |
| | | | | | | | |
| | | | | | | 1,633,686 | |
| | | | | | | | |
| |
Specialty Stores - 0.2% | | | | | |
Hibbett Sports Inc. (a) | | | 2,200 | | | | 50,380 | |
Sally Beauty Holdings Inc. (a) | | | 1,392 | | | | 22,314 | |
| | | | | | | | |
| | | | | | | 72,694 | |
| | | | | | | | |
| |
Steel - 0.4% | | | | | |
Carpenter Technology Corp. | | | 899 | | | | 47,261 | |
Commercial Metals Co. | | | 4,716 | | | | 99,555 | |
Worthington Industries Inc. | | | 523 | | | | 21,950 | |
| | | | | | | | |
| | | | | | | 168,766 | |
| | | | | | | | |
| |
Systems Software - 1.2% | | | | | |
OneSpan Inc. (a) | | | 1,428 | | | | 28,060 | |
Progress Software Corp. | | | 600 | | | | 23,292 | |
Qualys Inc. (a) | | | 2,950 | | | | 248,685 | |
Talend S.A. ADR (a) | | | 2,700 | | | | 168,156 | |
| | | | | | | | |
| | | | | | | 468,193 | |
| | | | | | | | |
| |
Technology Distributors - 0.3% | | | | | |
ePlus Inc. (a) | | | 320 | | | | 30,112 | |
SYNNEX Corp. | | | 230 | | | | 22,197 | |
Tech Data Corp. (a) | | | 632 | | | | 51,900 | |
| | | | | | | | |
| | | | | | | 104,209 | |
| | | | | | | | |
|
Technology Hardware, Storage & Peripherals - 1.3% | |
Diebold Nixdorf Inc. | | | 14,993 | | | | 179,166 | |
NCR Corp. (a) | | | 828 | | | | 24,824 | |
Pure Storage Inc., Class A (a) | | | 12,650 | | | | 302,082 | |
| | | | | | | | |
| | | | | | | 506,072 | |
| | | | | | | | |
| |
Thrifts & Mortgage Finance - 0.3% | | | | | |
Dime Community Bancshares Inc. | | | 909 | | | | 17,725 | |
Essent Group Ltd. (a) | | | 622 | | | | 22,280 | |
HomeStreet Inc. (a) | | | 785 | | | | 21,156 | |
Kearny Financial Corp. | | | 914 | | | | 12,293 | |
NMI Holdings Inc., Class A (a) | | | 1,200 | | | | 19,560 | |
| | | | | | | | |
| | | Number
of Shares | | | Fair
Value
$ | |
Walker & Dunlop Inc. | | | 495 | | | | 27,547 | |
Washington Federal Inc. | | | 623 | | | | 20,372 | |
| | | | | | | | |
| | | | | | | 140,933 | |
| | | | | | | | |
| |
Tires & Rubber - 0.1% | | | | | |
Cooper Tire & Rubber Co. | | | 1,322 | | | | 34,769 | |
| | | | | | | | |
| |
Trading Companies & Distributors - 0.8% | | | | | |
Applied Industrial Technologies Inc. | | | 3,594 | | | | 252,119 | |
BMC Stock Holdings Inc. (a) | | | 1,000 | | | | 20,850 | |
CAI International Inc. (a) | | | 761 | | | | 17,686 | |
GMS Inc. (a) | | | 637 | | | | 17,256 | |
| | | | | | | | |
| | | | | | | 307,911 | |
| | | | | | | | |
| |
Trucking - 0.7% | | | | | |
Avis Budget Group Inc. (a) | | | 600 | | | | 19,500 | |
Marten Transport Ltd. | | | 1,298 | | | | 30,438 | |
Old Dominion Freight Line Inc. | | | 1,181 | | | | 175,922 | |
Saia Inc. (a) | | | 546 | | | | 44,144 | |
| | | | | | | | |
| | | | | | | 270,004 | |
| | | | | | | | |
| |
Water Utilities - 0.0%* | | | | | |
SJW Group | | | 55 | | | | 3,643 | |
| | | | | | | | |
| | |
Total Common Stock
(Cost $27,545,898) | | | | | | | 38,160,572 | |
| | | | | | | | |
|
| Short-Term Investments - 5.5% | |
State Street Institutional U.S. Government Money Market Fund - Class G Shares 1.86% (Cost $2,234,828) (c)(d) | | | 2,234,828 | | | | 2,234,828 | |
| | | | | | | | |
| | |
Total Investments
(Cost $29,780,726) | | | | | | | 40,395,400 | |
| |
| Liabilities in Excess of Other Assets, net - (0.0)%* | | | | (18,482 | ) |
| | | | | | | | |
| | |
| NET ASSETS - 100.0% | | | | | | | 40,376,918 | |
| | | | | | | | |
See Notes to Schedule of Investments and Notes to Financial Statements.
| | | | |
| State Street Small-Cap Equity V.I.S. Fund | | | 9 | |
State Street Small-Cap Equity V.I.S. Fund
Schedule of Investments, continued — June 30, 2018 (Unaudited)
Other Information:
The Fund had the following long futures contracts open at June 30, 2018:
| | | | | | | | | | | | | | | | | | | | |
| Description | | Expiration
date | | | Number of
Contracts | | | Notional
Amount | | | Value | | | Unrealized
Depreciation | |
| | | | | | | | | | | | | | | | | | | | |
CME E-mini Russell 2000 Index Futures | | | September 2018 | | | | 6 | | | | 502,574 | | | $ | 494,250 | | | $ | (8,324 | ) |
| | | | | | | | | | | | | | | | | | | | |
During the period ended June 30, 2018, the Fund had average notional values of $615,338 on long futures contracts.
See Notes to Schedule of Investments and Notes to Financial Statements.
| | |
| 10 | | State Street Small-Cap Equity V.I.S. Fund |
State Street Small-Cap Equity V.I.S. Fund
Notes to Schedule of Investments — June 30, 2018 (Unaudited)
The views expressed in this document reflect our judgment as of the publication date and are subject to change at any time without notice. The securities cited may not be representative of the Fund’s future investments and should not be construed as a recommendation to purchase or sell a particular security. See the Fund’s summary prospectus and statutory prospectus for complete descriptions of investment objectives, policies, risks and permissible investments.
| (a) | Non-income producing security. |
| (b) | At June 30, 2018, all or a portion of this security was pledged to cover collateral requirements for futures. |
| (c) | Sponsored by SSGA Funds Management, Inc., the Fund’s investment adviser and administrator, and an affiliate of State Street Bank & Trust Co., the Fund’s sub-administrator, custodian and accounting agent. |
| (d) | Coupon amount represents effective yield. |
| † | Percentages are based on net assets as of June 30, 2018. |
Abbreviations:
ADR American Depositary Receipt
REIT Real Estate Investment Trust
The following table presents the Fund’s investments measured at fair value on a recurring basis at June 30, 2018:
| | | | | | | | | | | | | | | | |
| Investments | | Level 1 | | | Level 2 | | | Level 3 | | | Total | |
| | | | | | | | | | | | | | | | |
Investments in Securities | | | | | | | | | | | | | | | | |
Common Stock | | $ | 38,160,572 | | | $ | — | | | $ | — | | | $ | 38,160,572 | |
Short-Term Investments | | | 2,234,828 | | | | — | | | | — | | | | 2,234,828 | |
| | | | | | | | | | | | | | | | |
Total Investments in Securities | | $ | 40,395,400 | | | $ | — | | | $ | — | | | $ | 40,395,400 | |
| | | | | | | | | | | | | | | | |
Other Financial Instruments | | | | | | | | | | | | | | | | |
Long Futures Contracts - Unrealized Depreciation | | $ | (8,324 | ) | | $ | — | | | $ | — | | | $ | (8,324 | ) |
| | | | | | | | | | | | | | | | |
| | | | | | | | | | | | | | | | | | | | | | | | | | | | | | | | | | | | | | | | |
| | | Number
of Shares
Held at
12/31/17 | | | Value At
12/31/17 | | | Cost of
Purchases | | | Proceeds
from
Shares
Sold | | | Realized
Gain
(Loss) | | | Change in
Unrealized
Appreciation/
Depreciation | | | Number
of Shares
Held at
6/30/18 | | | Value At
6/30/18 | | | Dividend
Income | | | Capital
Gains
Distributions | |
State Street Institutional U.S. Government Money Market Fund - Class G Shares | | | 2,619,140 | | | $ | 2,619,140 | | | $ | 6,847,376 | | | $ | 7,231,688 | | | $ | — | | | $ | — | | | | 2,234,828 | | | $ | 2,234,828 | | | $ | 15,784 | | | $ | — | |
Notes to Schedule of Investments
| | | | |
| State Street Small-Cap Equity V.I.S. Fund | | | 11 | |
State Street Small-Cap Equity V.I.S. Fund
Financial Highlights
Selected data based on a share outstanding throughout the periods indicated
| | | | | | | | | | | | | | | | | | | | | | | | |
| | | 6/30/18† | | | 12/31/17 | | | 12/31/16 | | | 12/31/15* | | | 12/31/14* | | | 12/31/13* | |
| Inception date | | | | | | | | | | | | | | | | | | | | | | | 4/28/00 | |
| | | | | | |
Net asset value, beginning of period | | $ | 14.73 | | | $ | 14.40 | | | $ | 12.20 | | | $ | 14.39 | | | $ | 16.26 | | | $ | 13.37 | |
| | | | | | | | | | | | | | | | | | | | | | | | |
| | | | | |
Income/(loss) from investment operations: | | | | | | | | | | | | | | | | | | | | | |
Net investment loss | | | (0.02 | )(a) | | | (0.02 | )(a) | | | (0.03 | ) | | | (0.04 | ) | | | (0.06 | ) | | | (0.03 | ) |
Net realized and unrealized gains/(losses) on investments | | | 1.14 | | | | 1.86 | | | | 2.93 | | | | (0.52 | ) | | | 0.67 | | | | 4.96 | |
| | | | | | | | | | | | | | | | | | | | | | | | |
Total income/(loss) from investment operations | | | 1.12 | | | | 1.84 | | | | 2.90 | | | | (0.56 | ) | | | 0.61 | | | | 4.93 | |
| | | | | | | | | | | | | | | | | | | | | | | | |
|
Less distributions from: | |
Net investment income | | | — | | | | — | | | | — | | | | — | | | | — | | | | — | |
Net realized gains | | | — | | | | 1.51 | | | | 0.70 | | | | 1.63 | | | | 2.48 | | | | 2.04 | |
| | | | | | | | | | | | | | | | | | | | | | | | |
Total distributions | | | — | | | | 1.51 | | | | 0.70 | | | | 1.63 | | | | 2.48 | | | | 2.04 | |
| | | | | | | | | | | | | | | | | | | | | | | | |
Net asset value, end of period | | $ | 15.85 | | | $ | 14.73 | | | $ | 14.40 | | | $ | 12.20 | | | $ | 14.39 | | | $ | 16.26 | |
| | | | | | | | | | | | | | | | | | | | | | | | |
Total Return(b) | | | 7.60 | % | | | 12.71 | % | | | 23.77 | % | | | (4.12 | )% | | | 3.77 | % | | | 36.89 | % |
|
Ratios/Supplemental Data: | |
Net assets, end of period (in thousands) | | $ | 40,377 | | | $ | 40,711 | | | $ | 42,320 | | | $ | 38,359 | | | $ | 43,460 | | | $ | 50,248 | |
| | | | | | |
Ratios to average net assets: | | | | | | | | | | | | | | | | | | | | | | | | |
Net expenses | | | 1.32 | %** | | | 1.25 | % | | | 1.40 | % | | | 1.36 | % | | | 1.33 | %(c) | | | 1.27 | %(c)(d) |
Gross expenses | | | 1.32 | %** | | | 1.25 | % | | | 1.40 | % | | | 1.36 | % | | | 1.33 | % | | | 1.28 | % |
Net investment loss | | | (0.28 | )%** | | | (0.13 | )% | | | (0.22 | )% | | | (0.30 | )% | | | (0.35 | )% | | | (0.23 | )% |
Portfolio turnover rate | | | 16 | % | | | 32 | % | | | 36 | % | | | 42 | % | | | 37 | % | | | 39 | % |
Notes to Financial Highlights
| (a) | | Per share values have been calculated using the average share method. |
| (b) | | Total returns are historical and assume changes in share price, reinvestment of dividends and capital gains distributions and do not include the effect of insurance contract charges. Past performance does not guarantee future results. |
| (c) | | Includes contractual management fee waiver related to the Fund’s investments in the GE Institutional Money Market Fund (the “Money Market Fund”). The fee waiver agreement was terminated effective June 30, 2014 with the closure of the Money Market Fund. |
| (d) | | Reflects a voluntary reimbursement of other operating expenses by GE Asset Management, Inc., the Fund’s investment adviser and administrator prior to July 1, 2016. |
| * | | Beginning with the year ended December 31, 2016, the Fund was audited by Ernst & Young LLP. The previous years were audited by another independent registered public accounting firm. |
| ** | | Annualized for periods less than one year. |
The accompanying Notes are an integral part of these financial statements.
State Street Small-Cap Equity V.I.S. Fund
Statement of Assets and Liabilities — June 30, 2018 (Unaudited)
| | | | |
| | | | |
| | | | |
Assets | | | | |
Investments in securities, at fair value (cost $27,545,898) | | $ | 38,160,572 | |
Short-term affiliated investments, at fair value | | | 2,234,828 | |
Cash collateral on deposit with broker for future contracts | | | 87,306 | |
Receivable for investments sold | | | 105,522 | |
Income receivables | | | 26,625 | |
Receivable for fund shares sold | | | 104 | |
Income receivable from affiliated investments | | | 3,473 | |
Other assets | | | 4 | |
| | | | |
Total assets | | | 40,618,434 | |
| | | | |
| |
Liabilities | | | | |
Payable for investments purchased | | | 149,017 | |
Payable for fund shares redeemed | | | 7,327 | |
Payable for accumulated variation margin on futures | | | 8,310 | |
Payable to the Adviser | | | 32,064 | |
Payable to the Custodian | | | 22,576 | |
Accrued other expenses | | | 22,222 | |
| | | | |
Total liabilities | | | 241,516 | |
| | | | |
| | | | |
Net Assets | | $ | 40,376,918 | |
| | | | |
| |
Net Assets Consist of: | | | | |
Capital paid in | | $ | 27,106,591 | |
Undistributed (distributions in excess of) net investment income | | | (55,521 | ) |
Accumulated net realized gain | | | 2,719,498 | |
Net unrealized appreciation (depreciation) on: | | | | |
Unaffiliated Investments | | | 10,614,674 | |
Futures | | | (8,324 | ) |
| | | | |
Net Assets | | $ | 40,376,918 | |
| | | | |
| | | | |
Shares outstanding ($0.01 par value; unlimited shares authorized) | | | 2,546,901 | |
Net asset value per share | | $ | 15.85 | |
The accompanying Notes are an integral part of these financial statements.
| | | | |
| Statement of Assets and Liabilities | | | 13 | |
State Street Small-Cap Equity V.I.S. Fund
Statement of Operations — For the period ended June 30, 2018 (Unaudited)
| | | | |
| | | | |
| | | | |
Investment Income | | | | |
Income | | | | |
Dividend | | $ | 189,022 | |
Interest | | | 232 | |
Income from affiliated investments | | | 15,784 | |
Less: Foreign taxes withheld | | | (666 | ) |
| | | | |
Total income | | | 204,372 | |
| | | | |
| |
Expenses | | | | |
Advisory and administration fees | | | 188,006 | |
Directors’ fees | | | 3,224 | |
Custody and accounting expenses | | | 42,160 | |
Professional fees | | | 17,087 | |
Other expenses | | | 9,416 | |
| | | | |
Total Expenses | | | 259,893 | |
| | | | |
Net investment loss | | $ | (55,521 | ) |
| | | | |
| |
Net Realized and Unrealized Gain (Loss) on Investments | | | | |
Realized gain (loss) on: | | | | |
Unaffiliated investments | | $ | 2,540,889 | |
Futures | | | 102,525 | |
Increase (decrease) in unrealized appreciation/depreciation on: | | | | |
Unaffiliated investments | | | 345,610 | |
Futures | | | (14,024 | ) |
| | | | |
| |
Net realized and unrealized gain (loss) on investments | | | 2,975,000 | |
| | | | |
Net increase in net assets resulting from operations | | $ | 2,919,479 | |
| | | | |
The accompanying Notes are an integral part of these financial statements.
| | |
| 14 | | Statement of Operations |
State Street Small-Cap Equity V.I.S. Fund
Statements of Changes in Net Assets
| | | | | | | | |
| | | Six Months
Ended June 30,
2018* | | | Year Ended December 31,
2017 | |
| | | | | | | | |
Increase (Decrease) in Net Assets | | | | | | | | |
| | |
Operations: | | | | | | | | |
Net investment loss | | $ | (55,521 | ) | | $ | (52,152 | ) |
Net realized gain (loss) on investments and futures | | | 2,643,414 | | | | 3,516,588 | |
Net increase (decrease) in unrealized appreciation/depreciation on investments and futures | | | 331,586 | | | | 1,434,489 | |
| | | | | | | | |
Net increase (decrease) from operations | | | 2,919,479 | | | | 4,898,925 | |
| | | | | | | | |
| | |
Distributions to shareholders from: | | | | | | | | |
Net realized gains | | | — | | | | (3,784,875 | ) |
| | | | | | | | |
Total distributions | | | — | | | | (3,784,875 | ) |
| | | | | | | | |
Increase (decrease) in assets from operations and distributions | | | 2,919,479 | | | | 1,114,050 | |
| | | | | | | | |
| | |
Share transactions: | | | | | | | | |
Proceeds from sale of shares | | | 163,218 | | | | 1,538,799 | |
Value of distributions reinvested | | | — | | | | 3,784,875 | |
Cost of shares redeemed | | | (3,417,149 | ) | | | (8,046,695 | ) |
| | | | | | | | |
Net increase (decrease) from share transactions | | | (3,253,931 | ) | | | (2,723,021 | ) |
| | | | | | | | |
| | |
Total increase (decrease) in net assets | | | (334,452 | ) | | | (1,608,971 | ) |
| | |
Net Assets | | | | | | | | |
Beginning of period | | | 40,711,370 | | | | 42,320,341 | |
| | | | | | | | |
| | |
End of period | | $ | 40,376,918 | | | $ | 40,711,370 | |
| | | | | | | | |
| | |
Undistributed (distributions in excess of) net investment income, end of period | | $ | (55,521 | ) | | $ | — | |
| | |
Changes in Fund Shares | | | | | | | | |
Shares sold | | | 11,061 | | | | 103,389 | |
Issued for distributions reinvested | | | — | | | | 255,908 | |
Shares redeemed | | | (227,173 | ) | | | (535,089 | ) |
| | | | | | | | |
Net decrease in fund shares | | | (216,112 | ) | | | (175,792 | ) |
| | | | | | | | |
The accompanying Notes are an integral part of these financial statements.
| | | | |
| Statements of Changes in Net Assets | | | 15 | |
State Street Small-Cap Equity V.I.S. Fund
Notes to Financial Statements — June 30, 2018 (Unaudited)
| 1. | | Organization of the Company |
State Street Variable Insurance Series Funds, Inc. (the “Company”) was incorporated under the laws of the Commonwealth of Virginia on May 14, 1984 and is registered under the Investment Company Act of 1940, as amended (the “1940 Act”), as an open-end management investment company. The Company is currently composed of the following seven investment portfolios (collectively, the “Funds”): State Street U.S. Equity V.I.S. Fund, State Street S&P 500 Index V.I.S. Fund, State Street Premier Growth Equity V.I.S. Fund, State Street Small-Cap Equity V.I.S. Fund (the “Fund”), State Street Total Return V.I.S. Fund, State Street Income V.I.S. Fund and State Street Real Estate Securities V.I.S. Fund. Each Fund is a diversified investment company within the meaning of the 1940 Act.
Shares of the Funds of the Company are offered only to insurance company separate accounts that fund certain variable life insurance contracts and variable annuity contracts.
The Company currently offers one share class (Class 1) of the Fund as an investment option for variable life insurance and variable annuity contracts.
Under the Company’s organizational documents, its officers and directors are indemnified against certain liabilities arising out of the performance of their duties to the Company. Additionally, in the normal course of business, the Company enters into contracts with service providers that contain general indemnification clauses. The Company’s maximum exposure under these arrangements is unknown as this would involve future claims that may be made against the Company that have not yet occurred.
| 2. | | Summary of Significant Accounting Policies |
The following is a summary of significant accounting policies followed by the Company in the preparation of its financial statements:
The preparation of financial statements in accordance with U.S. generally accepted accounting principles (“U.S. GAAP”) requires management to make estimates and assumptions that affect the reported amounts and disclosures in the financial statements. Actual results could differ from those estimates. The Fund is an investment company under U.S. GAAP and follows the accounting and reporting guidance applicable to investment companies.
Security Valuation The Fund’s investments are valued at fair value each day that the New York Stock Exchange (“NYSE”) is open and, for financial reporting purposes, as of the report date should the reporting period end on a day that the NYSE is not open. Fair value is generally defined as the price a fund would receive to sell an asset or pay to transfer a liability in an orderly transaction between market participants at the measurement date. By its nature, a fair value price is a good faith estimate of the valuation in a current sale and may not reflect an actual market price. The investments of the Fund are valued pursuant to the policy and procedures developed by the Oversight Committee (the “Committee”) and approved by the Company’s Board of Directors (the “Board”). The Committee provides oversight of the valuation of investments for the Fund. The Board has responsibility for determining the fair value of investments.
Valuation techniques used to value the Fund’s investments by major category are as follows:
| | • | | Equity investments traded on a recognized securities exchange for which market quotations are readily available are valued at the last sale price or official closing price, as applicable, on the primary market or exchange on which they trade. Equity investments traded on a recognized exchange for which there were no sales on that day are valued at the last published sale price or at fair value. |
| | • | | Investments in registered investment companies (including money market funds) or other unitized pooled investment vehicles that are not traded on an exchange are valued at that day’s published net asset value (“NAV”) per share or unit. |
| | • | | Exchange-traded futures contracts are valued at the closing settlement price on the primary market on which they are traded most extensively. Exchange-traded futures contracts traded on a recognized exchange for which there were no sales on that day are valued at the last reported sale price obtained from independent pricing services or brokers or at fair value. |
In the event prices or quotations are not readily available or that the application of these valuation methods results in a price for an investment that is deemed to be not representative of the fair value of such investment, fair value will be determined in good faith by the Committee, in accordance with the valuation policy and procedures approved by the Board.
| | |
| 16 | | Notes to Financial Statements |
State Street Small-Cap Equity V.I.S. Fund
Notes to Financial Statements, continued — June 30, 2018 (Unaudited)
The Fund values its assets and liabilities at fair value using a fair value hierarchy consisting of three broad levels that prioritize the inputs to valuation techniques giving the highest priority to readily available unadjusted quoted prices in active markets for identical assets or liabilities (Level 1 measurements) and the lowest priority to unobservable inputs (Level 3 measurements) when market prices are not readily available or reliable. The categorization of a value determined for an investment within the hierarchy is based upon the pricing transparency of the investment and is not necessarily an indication of the risk associated with investing in it.
The three levels of the fair value hierarchy are as follows:
| | • | | Level 1 — Unadjusted quoted prices in active markets for an identical asset or liability; |
| | • | | Level 2 — Inputs other than quoted prices included within Level 1 that are observable for the asset or liability either directly or indirectly, including quoted prices for similar assets or liabilities in active markets, quoted prices for identical or similar assets or liabilities in markets that are not considered to be active, inputs other than quoted prices that are observable for the asset or liability (such as exchange rates, financing terms, interest rates, yield curves, volatilities, prepayment speeds, loss severities, credit risks and default rates) or other market-corroborated inputs; and |
| | • | | Level 3 — Unobservable inputs for the asset or liability, including the Committee’s assumptions used in determining the fair value of investments. |
The value of the Fund’s investments according to the fair value hierarchy as of June 30, 2018 is disclosed in the Fund’s Schedule of Investments.
Changes in valuation techniques may result in transfers in or out of an assigned level within the fair value hierarchy. Transfers between different levels of the fair value hierarchy are recognized at the beginning of the reporting period. The Fund had no material transfers between levels for the six-month period ended June 30, 2018.
Investment Transactions and Income Recognition Investment transactions are accounted for on trade date for financial reporting purposes. Realized gains and losses from the sale or disposition of investments and foreign exchange transactions, if any, are determined using the identified cost method. Dividend income and capital gain distributions, if any, are recognized on the ex-dividend date, net of any foreign taxes withheld at source, if any. Interest income is recorded daily on an accrual basis. All premiums and discounts are amortized/accreted for financial reporting purposes. Non-cash dividends received in the form of stock are recorded as dividend income at fair value.
Expenses Certain expenses, which are directly identifiable to a specific Fund, are applied to the Fund within the Company. Other expenses which cannot be attributed to a specific Fund are allocated in such a manner as deemed equitable, taking into consideration the nature and type of expense and the relative net assets of the Fund within the Company.
Foreign Taxes The Fund may be subject to foreign taxes (a portion of which may be reclaimable) on income, stock dividends, realized and unrealized capital gains on investments or certain foreign currency transactions. Foreign taxes are recorded in accordance with SSGA Funds Management, Inc.’s (the “Adviser” or “SSGA FM”) understanding of the applicable foreign tax regulations and rates that exist in the foreign jurisdictions in which the Fund invests. These foreign taxes, if any, are paid by the Fund and are reflected in the Statement of Operations, if applicable. Foreign taxes payable or deferred as of June 30, 2018, if any, are disclosed in the Fund’s Statement of Assets and Liabilities.
Distributions The Fund declares and pays any dividends from net investment income annually. Net realized capital gains, if any, are distributed annually, unless additional distributions are required for compliance with applicable tax regulations. The amount and character of income and capital gains to be distributed are determined in accordance with applicable tax regulations which may differ from net investment income and realized gains recognized for U.S. GAAP purposes.
| 3. | | Derivative Financial Instruments |
Futures Contracts The Fund may enter into futures contracts to meet the Fund’s objectives. A futures contract is a standardized, exchange-traded agreement to buy or sell a financial instrument at a set price on a future date. Upon entering into a futures contract, the Fund is required to deposit with the broker, cash or securities in an amount equal to the minimum initial margin requirements of the clearing house. Subsequent payments are made or received by the Fund equal to the daily
| | | | |
| Notes to Financial Statements | | | 17 | |
State Street Small-Cap Equity V.I.S. Fund
Notes to Financial Statements, continued — June 30, 2018 (Unaudited)
change in the contract value and are recorded as variation margin receivable or payable with a corresponding offset to unrealized gains or losses. The Fund recognizes a realized gain or loss when the contract is closed.
Losses may arise if the value of a futures contract decreases due to unfavorable changes in the market rates or values of the underlying instrument during the term of the contract or if the counterparty does not perform under the contract. The use of futures contracts also involves the risk that the movements in the price of the futures contracts do not correlate with the movement of the assets underlying such contracts.
For the six-month period ended June 30, 2018 the Fund entered into futures contracts for cash equitization.
The following tables summarize the value of the Fund’s derivative instruments as of June 30, 2018 and the related location in the accompanying Statement of Assets and Liabilities and Statement of Operations, presented by primary underlying risk exposure:
Liability Derivatives
| | | | | | | | | | | | | | | | | | | | | | | | |
| | | Interest
Rate
Contracts
Risk | | | Foreign
Exchange
Contracts
Risk | | | Credit
Contracts
Risk | | | Equity
Contracts
Risk | | | Commodity
Contracts
Risk | | | Total | |
| | | | | | | | | | | | | | | | | | | | | | | | |
Futures Contracts | | $ | — | | | $ | — | | | $ | — | | | $ | (8,310 | ) | | $ | — | | | $ | (8,310 | ) |
Net Realized Gain (Loss)
| | | | | | | | | | | | | | | | | | | | | | | | |
| �� | | Interest
Rate
Contracts
Risk | | | Foreign
Exchange
Contracts
Risk | | | Credit
Contracts
Risk | | | Equity
Contracts
Risk | | | Commodity
Contracts
Risk | | | Total | |
| | | | | | | | | | | | | | | | | | | | | | | | |
Futures Contracts | | $ | — | | | $ | — | | | $ | — | | | $ | 102,525 | | | $ | — | | | $ | 102,525 | |
Net Change in Unrealized Appreciation (Depreciation)
| | | | | | | | | | | | | | | | | | | | | | | | |
| | | Interest
Rate
Contracts
Risk | | | Foreign
Exchange
Contracts
Risk | | | Credit
Contracts
Risk | | | Equity
Contracts
Risk | | | Commodity
Contracts
Risk | | | Total | |
| | | | | | | | | | | | | | | | | | | | | | | | |
Futures Contracts | | $ | — | | | $ | — | | | $ | — | | | $ | (14,024 | ) | | $ | — | | | $ | (14,024 | ) |
| 4. | | Fees and Transactions with Affiliates |
Advisory Fee SSGA FM, a registered investment adviser, was retained by the Board to act as investment adviser and administrator of the Fund. SSGA FM’s compensation for investment advisory and administrative services (“Management Fee”) is paid monthly based on the average daily net assets of the Fund at an annualized rate of 0.95%.
Administrator, Sub-Administrator and Custodian Fees State Street Bank and Trust Company (“State Street”) serves as the sub-administrator and custodian to the Funds. Amounts paid by the Fund to State Street for performing such services are included in advisory and administration and custody and accounting expenses, respectively.
Due to Custodian In certain circumstances, the Funds may have cash overdraft with the custodian. The Due to Custodian amount, if any, reflects cash overdrawn with State Street as custodian who is an affiliate of the Funds.
Other Transactions with Affiliates The Fund may invest in affiliated entities, including securities issued by State Street, affiliated funds, or entities deemed to be affiliates as a result of the Fund owning more than five percent of the entity’s voting securities or outstanding shares. Amounts relating to these transactions during the six-month period ended June 30, 2018 are disclosed in the Schedule of Investments.
Pursuant to investment sub-advisory agreements with SSGA FM, the assets of the Fund are allocated to and managed by each of the following sub-advisers: (i) Palisade Capital Management, L.L.C.; (ii) Champlain Investment Partners, LLC;
| | |
| 18 | | Notes to Financial Statements |
State Street Small-Cap Equity V.I.S. Fund
Notes to Financial Statements, continued — June 30, 2018 (Unaudited)
(iii) GlobeFlex Capital, L.P.; (iv) Kennedy Capital Management, Inc. and (v) SouthernSun Asset Management, LLC. SSGA FM is responsible for allocating the Fund’s assets among the sub-advisers in its discretion (“Allocated Assets”), and for managing the Fund’s cash position, while each sub-adviser is responsible for the day-to-day management of their portion of the Allocated Assets, under the general supervision and oversight of SSGA FM and the Board. For their services, SSGA FM pays each sub-adviser an investment sub-advisory fee, which is calculated as a percentage of the average daily net assets of the respective Allocated Assets that it manages.
The fees and expenses of the Company’s directors who are not “interested persons” of the Company, as defined in the 1940 Act (“Independent Directors”) are paid directly by the Fund. The Independent Directors are reimbursed for travel and other out-of-pocket expenses in connection with meeting attendance and industry seminars.
| 7. | | Investment Transactions |
Purchases and sales of investments (excluding in-kind transactions, short term investments and derivative contracts) for the six-month period ended June 30, 2018 were as follows:
| | | | | | | | |
| Non-U.S. Government Securities |
| Purchases | | Sales |
| | | | | | | | | |
| | $ | 6,173,085 | | | | $ | 9,124,140 | |
The Fund has qualified and intends to continue to qualify as a regulated investment company under Subchapter M of the Internal Revenue Code of 1986, as amended. The Fund will not be subject to federal income taxes to the extent it distributes its taxable income, including any net realized capital gains, for each fiscal year. Therefore, no provision for federal income tax is required.
The Fund files federal and various state and local tax returns as required. No income tax returns are currently under examination. Generally, the federal returns are subject to examination by the Internal Revenue Service for a period of three years from date of filing, while the state returns may remain open for an additional year depending upon jurisdiction. SSGA FM has analyzed the Fund’s tax positions taken on tax returns for all open years and does not believe there are any uncertain tax positions that would require recognition of a tax liability.
Distributions to shareholders are recorded on ex-dividend date. Income dividends and gain distributions are determined in accordance with income tax rules and regulations, which may differ from generally accepted accounting principles.
As of June 30, 2018, gross unrealized appreciation and gross unrealized depreciation of investments and other financial instruments based on cost for federal income tax purposes were as follows:
| | | | | | | | | | | | | | | | | | |
Tax
Cost | | Gross
Unrealized
Appreciation | | Gross
Unrealized
Depreciation | | Net
Unrealized
Appreciation
(Depreciation) |
| | | | | | | | | | | | | | | | | | | |
| | $ | 30,214,797 | | | | $ | 11,024,830 | | | | $ | 852,551 | | | | $ | 10,172,279 | |
The Fund and other affiliated funds (each, a “Participant” and collectively, the “Participants”) participate in a $500 million revolving credit facility provided by a syndication of banks under which the Participants may borrow to fund shareholder redemptions. This agreement expires in October 2018 unless otherwise extended or renewed.
The Participants are charged an annual commitment fee which is calculated based on the unused portion of the shared credit line. Commitment fees are allocated among each of the Participants based on relative net assets. Commitment fees are ordinary fund operating expenses paid by the Adviser. A Participant incurs and pays the interest expense related to its borrowing.
| | | | |
| Notes to Financial Statements | | | 19 | |
State Street Small-Cap Equity V.I.S. Fund
Notes to Financial Statements, continued — June 30, 2018 (Unaudited)
Interest is calculated at a rate per annum equal to the sum of 1% plus the greater of the New York Fed Bank Rate and 1-month LIBOR rate.
The Fund had no outstanding loans as of June 30, 2018.
Concentration Risk As a result of the Fund’s ability to invest a large percentage of its assets in obligations of issuers within the same country, state, region, currency or economic sector, an adverse economic, business or political development may affect the value of the Fund’s investments more than if the Fund were more broadly diversified.
Market and Credit Risk In the normal course of business, the Fund trades financial instruments and enters into financial transactions where risk of potential loss exists due to changes in the general economic conditions and fluctuations of the market (market risk). Additionally, the Fund may also be exposed to credit risk in the event that an issuer or guarantor fails to perform or that an institution or entity with which the Fund has unsettled or open transactions defaults.
Management has evaluated the impact of all subsequent events on the Fund through the date on which the financial statements were available to be issued and has determined that there were no subsequent events requiring adjustment or disclosure in the financial statements.
| | |
| 20 | | Notes to Financial Statements |
State Street Small-Cap Equity V.I.S. Fund
Other Information (Unaudited)
Proxy Voting Policies and Procedures and Record
The Fund has adopted the proxy voting policies of SSGA FM. A description of the policies and procedures that the Fund has adopted to determine how to vote proxies relating to portfolio securities is available (i) without charge, upon request, by calling 1-800-242-0134, (ii) on the Fund’s website at http://www.ssga.com/geam, (iii) on the SEC’s website at www.sec.gov, and (iv) at the SEC’s public reference room. Information on the operation of the public reference room may be obtained by calling 1-800-SEC-0330. Information regarding how the Fund voted proxies, if any, during the most recent 12-month period ended June 30 is available by August 31 of each year without charge (1) by calling 1-800-242-0134 (toll free), and (2) on the website of the SEC at www.sec.gov.
Quarterly Portfolio Schedule
The Fund files its complete schedule of investments with the SEC for the first and third quarters of each fiscal year on Form N-Q. The Fund’s Forms N-Q are available (i) without charge, upon request, by calling 1-800-242-013, (ii) on the Fund’s website at http://www.ssga.com/geam, (iii) on the SEC’s website at www.sec.gov, and (iv) at the SEC’s public reference room. Information on the operation of the public reference room may be obtained by calling 1-800-SEC-0330.
State Street Small-Cap Equity V.I.S. Fund
Other Information (Unaudited), continued
Disclosure for the Board of Directors’ Consideration of the Renewal of the Investment Advisory and Administration Agreement with SSGA Funds Management, Inc. and the Sub-Advisory Agreements with each of Champlain Investment Partners, LLC, GlobeFlex Capital, L.P., Kennedy Capital Management, Inc., Palisade Capital Management, LLC and SouthernSun Asset Management, LLC on behalf of the State Street Small-Cap Equity V.I.S. Fund
At meetings of the Board of Directors (the “Board”) of State Street Variable Insurance Series Funds, Inc. (the “V.I.S. Funds”) held on May 16, 2018 and June 5, 2018 (the “Board Meetings”), the Board members, including the Board members who are not “interested persons” (as defined in the Investment Company Act of 1940, as amended (the “1940 Act”)) of the V.I.S. Funds (“Independent Board Members”), considered and unanimously approved the continuance for an additional year of the investment advisory and administration agreement (the “Investment Advisory and Administration Agreement”) between SSGA Funds Management, Inc. (“SSGA FM” or the “Adviser”) and the V.I.S. Funds on behalf of each of its series portfolios, including the State Street Small-Cap Equity V.I.S. Fund (the “Fund”), and the sub-advisory agreements (each, a “Small-Cap Sub-Advisory Agreement”) by and among SSGA FM, the V.I.S. Funds on behalf of the Fund and each of Champlain Investment Partners, LLC, GlobeFlex Capital, L.P., Kennedy Capital Management, Inc., Palisade Capital Management, LLC and SouthernSun Asset Management, LLC (collectively, the “Small-Cap Equity Fund Sub-Advisers”).
In considering whether to approve the continuance for an additional year of the Investment Advisory and Administration Agreement and the Small-Cap Sub-Advisory Agreements, the Board members considered and discussed a substantial amount of information and analysis provided, at the Board’s request, by the Adviser and each of the Small-Cap Equity Fund Sub-Advisers. The Board members also considered detailed information regarding performance and expenses of other investment companies, including those with similar investment strategies and sizes, which was prepared by an independent third party provider, Broadridge Financial Solutions, Inc. (“Broadridge”). The Board members reviewed the fees charged by the Adviser for other mutual funds and investment products other than mutual funds that employ a similar investment strategy as the Fund. The Board had the opportunity to ask questions and request additional information in connection with its considerations.
Before approving the continuance of the Investment Advisory and Administration Agreement and the Small-Cap Sub-Advisory Agreements, the Independent Board Members reviewed the information provided with management of the Adviser and with their independent legal counsel. The Board also reviewed a memorandum prepared by independent legal counsel discussing the legal standards for the consideration of the proposed continuances. The Independent Board Members discussed the proposed continuances of the Investment Advisory and Administration Agreement and the Small-Cap Sub-Advisory Agreements in detail during private sessions in advance of, and at, the Board Meetings with their independent legal counsel at which no representatives of the Adviser or any of the Small-Cap Equity Fund Sub-Advisers were present. The Independent Board Members and their independent legal counsel requested, and received and considered, additional information from the Adviser and each of the Small-Cap Equity Fund Sub-Advisers following the May 16, 2018 Board Meeting and prior to the June 5, 2018 Board Meeting.
In advance of the Board Meetings, and in response to their detailed requests, the Board members received from the Adviser written responses to their inquiries, which included substantial exhibits and other materials related to the Adviser’s business and the services it provides to the Fund. Also in advance of the Board Meetings, the Board members received from each of the Small-Cap Equity Fund Sub-Advisers a written response to a letter of inquiry prepared by SSGA FM at the Board’s request, which included substantial exhibits and other materials related to the business of, and services provided by, each of the Small-Cap Equity Fund Sub-Advisers. The Directors took into account their multi-year experience as Directors and particularly their previous consideration of these types of agreements.
During the Board Meetings, the Board members had an opportunity to discuss this information with SSGA FM representatives, including senior executives, representatives from the legal, compliance and finance departments, and investment personnel. The Board members also had an opportunity to hear presentations by representatives of each of the Small-Cap Equity Fund Sub-Advisers. The Board members posed questions to these representatives and engaged in significant discussions.
In reaching its determinations relating to the continuances of the Investment Advisory and Administration Agreement and the Small-Cap Sub-Advisory Agreements, the Board considered those factors it deemed relevant, including the factors discussed below. In its deliberations, the Board did not identify any single factor that was dispositive and each Director may have attributed different weights to the various factors. The Directors evaluated the information provided to them, as well as the presentations and
State Street Small-Cap Equity V.I.S. Fund
Other Information (Unaudited), continued
discussions that occurred at the Board Meetings, for the Fund, and their determinations were made separately in respect of the Fund from other series portfolios of the V.I.S Funds.
The material factors and conclusions that formed the basis for the Board’s determinations to approve the continuances of the Investment Advisory and Administration Agreement and the Small-Cap Sub-Advisory Agreements on behalf of the Fund are as discussed below.
The Nature, Extent and Quality of Services Provided.
The Board reviewed the services provided to the Fund by the Adviser and each of the Small-Cap Equity Fund Sub-Advisers. In connection with their consideration of the Adviser’s services, the Board considered the Adviser’s management capabilities, including the education, experience and number of investment professionals and other personnel who provide portfolio management and similar services to the Fund. The Board evaluated, where relevant, the abilities and experience of such investment personnel. The Board also considered the Adviser’s processes used for overseeing multiple sub-advisers. The Board considered the extensive experience and resources committed by the Adviser to risk management, including with respect to investment risk, liquidity risk, operational risk, counterparty risk and model risk. The Board also considered the significant risks assumed by the Adviser in connection with the services provided to the Fund, including operational, enterprise, regulatory, litigation and compliance risks. The Board also took into account the compensation paid to recruit and retain investment personnel, and the time and attention devoted to the Fund by senior management.
The Board had previously reviewed the compliance programs of SSGA FM and various affiliated service providers (“Affiliated Service Providers”). Among other things, the Board considered compliance and reporting matters relating to personal trading by investment personnel, selective disclosure of portfolio holdings, late trading, portfolio valuation and business continuity.
In connection with their consideration of the services provided by each of the Small-Cap Equity Fund Sub-Advisers, the Board considered each Small-Cap Equity Fund Sub-Adviser’s attributes relating to its investment philosophy oriented toward long-term performance, its process for selecting investments, its experienced professionals, access to significant technological resources and a favorable history and reputation. The Board also considered the review process undertaken by SSGA FM and SSGA FM’s favorable assessment of the nature and quality of the investment sub-advisory services provided by each Small-Cap Equity Fund Sub-Adviser to the Fund.
In light of the foregoing and other relevant information, the Board, including the Independent Board Members, concluded that the services provided by the Adviser and each of the Small-Cap Equity Fund Sub-Advisers continue to be satisfactory.
Investment Performance.
The Board members considered the investment performance of the Fund for various periods. The Board members reviewed detailed comparisons of the performance of the Fund with the relevant securities index and peer and category groupings of mutual funds prepared by Broadridge with respect to various periods. The Board members also engaged in detailed discussions with SSGA FM management and representatives of each of the Small-Cap Equity Fund Sub-Advisers about their investment processes and performance results. These discussions focused on the Fund’s investment objective, the Adviser’s allocation process among the Small-Cap Equity Fund Sub-Advisers, the number and experience of portfolio management and supporting research personnel, the Fund’s investment style and approach employed, the likely market cycles for the Fund’s investment style and the Fund’s recent relative underperformance but competitive performance over the longer term. The Board also considered the Fund’s multi-manager structure and how each Small-Cap Equity Fund Sub-Adviser’s approach to small-cap investing fits within the Fund’s overall strategy, and the Fund’s relatively stronger performance over the long term.
Taking these factors into consideration, the Board, including the Independent Board Members, concluded that the Fund’s performance was acceptable overall.
Cost of the Services Provided And Profits Realized From The Relationships with the Fund.
The Directors considered the management fees paid to the Adviser by the Fund as well as the fees paid to each of the Small-Cap Equity Fund Sub-Advisers by the Adviser, which would reduce the net management fees retained by the Adviser. The Board reviewed the level of profits realized by the Adviser, the Affiliated Service Providers and each Small-Cap Equity Fund Sub-Adviser in providing investment advisory and other services to the Fund. Information also was presented regarding the financial condition of
State Street Small-Cap Equity V.I.S. Fund
Other Information (Unaudited), continued
the Adviser and each Small-Cap Equity Fund Sub-Adviser for various past periods. The Directors also considered the Adviser’s statements concerning its significant investment in supporting registered investment companies. The Board also considered the various risks borne by SSGA FM, the Affiliated Service Providers and each of the Small-Cap Equity Fund Sub-Advisers in connection with their various roles in servicing the Fund, including enterprise, litigation, business, operational and entrepreneurial risk.
The Board concluded that the profitability of the Adviser and each of the Small-Cap Equity Fund Sub-Advisers with respect to the Fund, and the profitability range of each of the Affiliated Service Providers with respect to its services to the Fund, were reasonable in relation to the services provided.
The Extent to Which Economies of Scale Would Be Realized as the Fund Grows and Whether Fee Levels Would Reflect Such Economies of Scale.
The Board considered the extent to which the Adviser and the Affiliated Service Providers, on the one hand, and the Fund, on the other hand, can expect to realize benefits from economies of scale as the assets of the Fund increase. The Board acknowledged the difficulty in accurately measuring the benefits resulting from the economies of scale with respect to the management of the Fund. The Board concluded that, in light of, among other considerations, the current size of the Fund, the level of profitability of the Adviser and the Affiliated Service Providers with respect to the Fund, and/or the comparative management fee and expense ratio of the Fund, it does not appear that the Adviser or the Affiliated Service Providers has realized benefits from economies of scale in managing the assets of the Fund to such an extent that previously agreed management fees should be reduced or that breakpoints in such fees should be implemented for the Fund at this time.
Comparison of Services to be Rendered and Fees to be Paid.
The Board discussed the respective services provided to the Fund by each of the Adviser and each of the Small-Cap Equity Fund Sub-Advisers, and the fees charged to the Fund for those services. As part of its review, the Board considered the Fund’s management fee and total expense ratio, including the portion attributable to administrative services provided by SSGA FM, as compared to the expense ratios of a group of comparable mutual funds selected by Broadridge, and the related Broadridge analysis for the Fund. The Board also considered the comparability of the fees charged and the services provided to the Fund by the Adviser to the fees charged and services provided to other clients of the Adviser. Among other information, the Board considered that the Fund’s advisory fee was among the highest, and the expense ratios were the highest, in the applicable Broadridge peer group ranges. The Board members also reviewed comparative mutual fund and/or other account fee information for Small-Cap Equity Fund Sub-Adviser clients provided by each of the Small-Cap Equity Fund Sub-Advisers.
In light of the foregoing, the Board, including the Independent Board Members, determined that the management fees and sub-advisory fees, considered in relation to the services provided to the Fund, supported the Board’s approval of the continuance of the Investment Advisory and Administration Agreement and the Small-Cap Sub-Advisory Agreements.
Fall-Out Benefits.
The Board considered actual and potential financial benefits that the Adviser and each of the Small-Cap Equity Fund Sub-Advisers could derive from their respective relationships with the Fund, including the custody, fund accounting and sub-administration services being provided to the Fund by affiliates of the Adviser and, to the extent applicable, soft dollar commission benefits generated through Fund portfolio transactions. The Board noted, however, that the Fund benefits from the vast array of resources available through SSGA FM, and that the Fund represents only a small portion of the assets managed by SSGA FM.
Conclusion.
No single factor was determinative to the Board’s decision. Based on their discussion and such other matters as were deemed relevant, the Directors, including the Independent Board Members, approved the continuance of the Investment Advisory and Administration Agreement and the Small-Cap Sub-Advisory Agreements for the Fund.
Directors
John R. Costantino, Chairman
R. Sheldon Johnson
Donna M. Rapaccioli
Jeanne M. La Porta
Officers
Jeanne M. La Porta, President
Arthur Jensen, Treasurer
Brian Harris, Chief Compliance Officer and Anti-Money Laundering Officer
Bruce S. Rosenberg, Assistant Treasurer
Ann M. Carpenter, Assistant Treasurer
Chad C. Hallett, Assistant Treasurer
Darlene Anderson-Vasquez, Assistant Treasurer
Daniel G. Plourde, Assistant Treasurer
Jesse Hallee, Secretary
Investment Adviser and Administrator
SSGA Funds Management, Inc.
1600 Summer Street
P.O. Box 7900
Stamford, CT 06904-7900
Custodian and Sub-Administrator
State Street Bank and Trust Company
One Lincoln Street
Boston, Massachusetts 02111
Distributor
State Street Global Advisors Funds Distributors, LLC
One Iron Street
Boston, MA 02210
Independent Registered Public Accounting Firm
Ernst & Young LLP
200 Clarendon Street
Boston, Massachusetts 02116
Semi-Annual Report
June 30, 2018
State Street U.S. Equity V.I.S. Fund

State Street U.S. Equity V.I.S Fund
Semi-Annual Report
June 30, 2018 (Unaudited)
Table of Contents
This report is prepared for Policyholders of certain variable contracts and may be distributed to others only if preceded or accompanied by the variable contract’s current prospectus and the current summary prospectus of the Fund available for investments thereunder.
State Street U.S. Equity V.I.S. Fund
Fund Information — June 30, 2018 (Unaudited)
Total return performance shown in this report for the Fund takes into account changes in share price and assumes reinvestment of dividends and capital gains distributions, if any. Total returns shown are net of Fund fees and expenses but do not reflect fees and charges associated with the variable contracts such as administrative fees, account charges and surrender charges, which, if reflected, would reduce the Fund’s total returns for all periods shown.
The performance data quoted represents past performance; past performance does not guarantee future results. Investment return and principal value will fluctuate so your shares, when redeemed, may be worth more or less than their original cost. Current performance may be higher or lower than the performance data quoted. Periods less than one year are not annualized. Please call toll-free (800) 242-0134 or visit the Fund’s website at http://www.ssga.com/geam for the most recent month-end performance data.
An investment in the Fund is not a deposit of any bank and is not insured or guaranteed by the Federal Deposit Insurance Corporation (“FDIC”) or any other government agency. An investment in the Fund is subject to risk, including possible loss of principal invested.
Sector Allocation
Portfolio Composition as a % of Fair Value of $27,499 (in thousands) as of June 30, 2018 (a)(b)
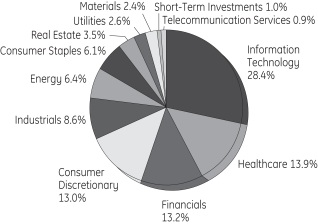
Top Ten Largest Holdings
as of June 30, 2018 (as a % of Fair Value) (a)(b)
| | | | |
Apple Inc. | | | 4.07 | % |
Microsoft Corp. | | | 4.04 | % |
Visa Inc., Class A | | | 3.28 | % |
JPMorgan Chase & Co. | | | 3.21 | % |
Amazon.com Inc. | | | 3.17 | % |
Alphabet Inc., Class A | | | 2.57 | % |
PepsiCo Inc. | | | 2.36 | % |
Facebook Inc., Class A | | | 2.31 | % |
Broadcom Inc. | | | 1.97 | % |
Chevron Corp. | | | 1.89 | % |
| (a) | Fair Value basis is inclusive of short-term investment in State Street Institutional U.S. Government Money Market Fund - Class G Shares. |
| (b) | The securities information regarding holdings, allocations and other characteristics is presented to illustrate examples of securities that the Fund has bought and the diversity of areas in which the Fund may invest as of a particular date. It may not be representative of the Fund’s current or future investments and should not be construed as a recommendation to purchase or sell a particular security. |
State Street Global Advisors Funds Distributors, LLC, member of FINRA & SIPC is the principal underwriter and distributor of the State Street V.I.S. Funds and an indirect wholly-owned subsidiary of State Street Corporation. References to State Street may include State Street Corporation and its affiliates. The Funds pay State Street Bank and Trust Company for its services as custodian and Fund Accounting agent, and pay SSGA Funds Management, Inc. for investment advisory and administrative services.
| | | | |
| State Street U.S. Equity V.I.S. Fund | | | 1 | |
State Street U.S. Equity V.I.S. Fund
Understanding Your Fund’s Expenses — June 30, 2018 (Unaudited)
As a shareholder of the Fund, you incur ongoing costs. Ongoing costs include portfolio management fees, professional fees, administrative fees and other Fund expenses. The following example is intended to help you understand your ongoing costs (in dollars) of investing in the Fund and to compare these costs with the ongoing costs of investing in other mutual funds.
To illustrate these ongoing costs, we have provided an example and calculated the expenses paid by investors in the Fund during the period. The information in the following table is based on an investment of $1,000, which is invested at the beginning of the period and held for the entire six-month period ended June 30, 2018.
Actual Expenses
The first section of the table provides information about actual account values and actual expenses. You may use the information in this section, together with the amount you invested, to estimate the expenses that you paid over the period. To do so, simply divide your account value by $1,000 (for example, an $8,600 account value divided by $1,000 = 8.6), then multiply the result by the number given under the heading “Expenses paid during the period” to estimate the expenses you paid on your account during the period.
Hypothetical Example for Comparison Purposes
The second section of the table provides information about hypothetical account values and hypothetical expenses based on the Fund’s actual expense ratio and an assumed rate of return of 5% per year before expenses, which is not the Fund’s actual return. The hypothetical account values and expenses may not be used to estimate the actual ending account balance or expenses you paid for the period. You may use this information to compare the ongoing costs of investing in the Fund and other funds. To do so, compare this 5% hypothetical example with the 5% hypothetical examples that appear in the shareholder reports of other funds.
Please note that the expenses shown in the table are meant to highlight and help you compare ongoing costs only and do not reflect transaction costs, such as sales charges or redemption fees, if any. Therefore, the second section of the table is useful in comparing ongoing costs only, and will not help you determine the relative total costs of owning different funds. Additionally, the expenses shown do not reflect the fees or charges associated with variable contracts through which shares of the Fund are offered.
January 1, 2018 – June 30, 2018
| | | | | | | | |
| | | Actual
Fund Return | | | Hypothetical
5% Return
(2.5% for
the period) | |
Account value at the beginning of the period | | $ | 1,000.00 | | | $ | 1,000.00 | |
Account value at the end of the period | | $ | 1,031.40 | | | $ | 1,020.68 | |
Expenses paid during the period* | | $ | 4.18 | | | $ | 4.16 | |
| * | Expenses are equal to the Fund’s annualized expense ratio of 0.83% (for the period January 1, 2018-June 30, 2018), multiplied by the average account value over the period, multiplied by 181/365 (to reflect the one-half year period). |
| | |
| 2 | | State Street U.S. Equity V.I.S. Fund |
State Street U.S. Equity V.I.S. Fund
Schedule of Investments — June 30, 2018 (Unaudited)
| | | | | | | | |
| | | Number
of Shares | | | Fair
Value
$ | |
| | | | | | | | |
| Common Stock - 98.9%† | |
Aerospace & Defense - 1.7% | |
General Dynamics Corp. | | | 733 | | | | 136,639 | |
Hexcel Corp. | | | 1,178 | | | | 78,196 | |
Raytheon Co. | | | 875 | | | | 169,032 | |
The Boeing Co. | | | 261 | | | | 87,568 | |
| | | | | | | | |
| | | | | | | 471,435 | |
| | | | | | | | |
|
Air Freight & Logistics - 0.5% | |
FedEx Corp. | | | 247 | | | | 56,084 | |
United Parcel Service Inc., Class B | | | 788 | | | | 83,709 | |
| | | | | | | | |
| | | | | | | 139,793 | |
| | | | | | | | |
|
Airlines - 0.3% | |
Alaska Air Group Inc. | | | 550 | | | | 33,214 | |
JetBlue Airways Corp. (a) | | | 2,663 | | | | 50,544 | |
| | | | | | | | |
| | | | | | | 83,758 | |
| | | | | | | | |
|
Apparel, Accessories & Luxury Goods - 0.1% | |
PVH Corp. | | | 205 | | | | 30,693 | |
| | | | | | | | |
| | |
Application Software - 1.8% | | | | | | | | |
Adobe Systems Inc. (a) | | | 419 | | | | 102,156 | |
Intuit Inc. | | | 580 | | | | 118,497 | |
salesforce.com Inc. (a) | | | 1,966 | | | | 268,163 | |
| | | | | | | | |
| | | | | | | 488,816 | |
| | | | | | | | |
|
Asset Management & Custody Banks - 0.6% | |
Ameriprise Financial Inc. | | | 424 | | | | 59,309 | |
BlackRock Inc. | | | 208 | | | | 103,800 | |
| | | | | | | | |
| | | | | | | 163,109 | |
| | | | | | | | |
|
Auto Parts & Equipment - 0.2% | |
Aptiv PLC | | | 627 | | | | 57,452 | |
| | | | | | | | |
|
Automobile Manufacturers - 0.1% | |
General Motors Co. | | | 979 | | | | 38,573 | |
| | | | | | | | |
|
Automotive Retail - 0.5% | |
AutoZone Inc. (a) | | | 198 | | | | 132,844 | |
| | | | | | | | |
|
Biotechnology - 4.0% | |
Alexion Pharmaceuticals Inc. (a) | | | 812 | | | | 100,810 | |
Biogen Inc. (a) | | | 1,369 | | | | 397,338 | |
Gilead Sciences Inc. | | | 6,088 | | | | 431,274 | |
Vertex Pharmaceuticals Inc. (a) | | | 1,058 | | | | 179,818 | |
| | | | | | | | |
| | | | | | | 1,109,240 | |
| | | | | | | | |
|
Building Products - 0.4% | |
Allegion PLC | | | 1,314 | | | | 101,651 | |
| | | | | | | | |
| | | | | | | | |
| | | Number
of Shares | | | Fair
Value
$ | |
Cable & Satellite - 2.5% | |
Charter Communications Inc., Class A (a) | | | 1,047 | | | | 306,991 | |
Comcast Corp., Class A | | | 11,931 | | | | 391,456 | |
| | | | | | | | |
| | | | | | | 698,447 | |
| | | | | | | | |
|
Communications Equipment - 0.6% | |
Cisco Systems Inc. | | | 3,680 | | | | 158,350 | |
| | | | | | | | |
|
Construction Materials - 0.1% | |
Vulcan Materials Co. | | | 182 | | | | 23,489 | |
| | | | | | | | |
|
Consumer Finance - 0.5% | |
American Express Co. | | | 1,012 | | | | 99,176 | |
Discover Financial Services | | | 656 | | | | 46,189 | |
| | | | | | | | |
| | | | | | | 145,365 | |
| | | | | | | | |
|
Data Processing & Outsourced Services - 3.8% | |
Mastercard Inc., Class A | | | 796 | | | | 156,430 | |
Visa Inc., Class A | | | 6,807 | | | | 901,587 | |
| | | | | | | | |
| | | | | | | 1,058,017 | |
| | | | | | | | |
|
Diversified Banks - 4.6% | |
Bank of America Corp. | | | 11,113 | | | | 313,276 | |
JPMorgan Chase & Co. | | | 8,469 | | | | 882,470 | |
U.S. Bancorp | | | 1,617 | | | | 80,882 | |
| | | | | | | | |
| | | | | | | 1,276,628 | |
| | | | | | | | |
|
Diversified Chemicals - 0.5% | |
DowDuPont Inc. | | | 2,056 | | | | 135,532 | |
| | | | | | | | |
|
Electric Utilities - 1.5% | |
American Electric Power Company Inc. | | | 913 | | | | 63,225 | |
Duke Energy Corp. | | | 369 | | | | 29,181 | |
Edison International | | | 513 | | | | 32,457 | |
Exelon Corp. | | | 2,274 | | | | 96,872 | |
NextEra Energy Inc. | | | 896 | | | | 149,659 | |
PG&E Corp. | | | 760 | | | | 32,346 | |
| | | | | | | | |
| | | | | | | 403,740 | |
| | | | | | | | |
|
Electrical Components & Equipment - 0.2% | |
Rockwell Automation Inc. | | | 340 | | | | 56,518 | |
| | | | | | | | |
|
Electronic Components - 0.8% | |
Corning Inc. | | | 7,587 | | | | 208,718 | |
| | | | | | | | |
|
Environmental & Facilities Services - 0.3% | |
Republic Services Inc. | | | 1,067 | | | | 72,940 | |
| | | | | | | | |
See Notes to Schedule of Investments and Notes to Financial Statements.
| | | | |
| State Street U.S. Equity V.I.S. Fund | | | 3 | |
State Street U.S. Equity V.I.S. Fund
Schedule of Investments, continued — June 30, 2018 (Unaudited)
| | | | | | | | |
| | | Number
of Shares | | | Fair
Value
$ | |
| | | | | | | | |
Financial Exchanges & Data - 1.9% | |
CME Group Inc. | | | 2,088 | | | | 342,265 | |
S&P Global Inc. | | | 915 | | | | 186,559 | |
| | | | | | | | |
| | | | | | | 528,824 | |
| | | | | | | | |
|
Footwear - 0.7% | |
NIKE Inc., Class B | | | 2,458 | | | | 195,853 | |
| | | | | | | | |
|
Gold - 0.1% | |
Newmont Mining Corp. | | | 696 | | | | 26,246 | |
| | | | | | | | |
|
Healthcare Distributors - 0.4% | |
Henry Schein Inc. (a) | | | 1,511 | | | | 109,759 | |
| | | | | | | | |
|
Healthcare Equipment - 1.8% | |
Boston Scientific Corp. (a) | | | 8,836 | | | | 288,937 | |
Hologic Inc. (a) | | | 1,758 | | | | 69,881 | |
Medtronic PLC | | | 1,702 | | | | 145,708 | |
| | | | | | | | |
| | | | | | | 504,526 | |
| | | | | | | | |
|
Healthcare Services - 0.3% | |
DaVita Inc. (a) | | | 1,003 | | | | 69,648 | |
| | | | | | | | |
|
Healthcare Supplies - 0.6% | |
The Cooper Companies Inc. | | | 666 | | | | 156,810 | |
| | | | | | | | |
|
Home Entertainment Software - 0.5% | |
Activision Blizzard Inc. | | | 917 | | | | 69,985 | |
Electronic Arts Inc. (a) | | | 434 | | | | 61,203 | |
| | | | | | | | |
| | | | | | | 131,188 | |
| | | | | | | | |
|
Home Improvement Retail - 1.0% | |
The Home Depot Inc. | | | 1,463 | | | | 285,431 | |
| | | | | | | | |
|
Hotels, Resorts & Cruise Lines - 0.3% | |
Marriott International Inc., Class A | | | 654 | | | | 82,796 | |
| | | | | | | | |
|
Household Products - 0.8% | |
The Procter & Gamble Co. | | | 2,795 | | | | 218,178 | |
| | | | | | | | |
|
Hypermarkets & Super Centers - 0.4% | |
Walmart Inc. | | | 1,395 | | | | 119,482 | |
| | | | | | | | |
|
Independent Power Producers & Energy Traders - 0.1% | |
NRG Energy Inc. | | | 542 | | | | 16,639 | |
| | | | | | | | |
|
Industrial Conglomerates - 1.1% | |
Honeywell International Inc. | | | 1,180 | | | | 169,979 | |
Roper Technologies Inc. | | | 495 | | | | 136,575 | |
| | | | | | | | |
| | | | | | | 306,554 | |
| | | | | | | | |
| | | | | | | | |
| | | Number
of Shares | | | Fair
Value
$ | |
Industrial Gases - 0.1% | |
Air Products & Chemicals Inc. | | | 209 | | | | 32,548 | |
| | | | | | | | |
|
Industrial Machinery - 2.3% | |
Ingersoll-Rand PLC | | | 3,673 | | | | 329,578 | |
Xylem Inc. | | | 4,646 | | | | 313,048 | |
| | | | | | | | |
| | | | | | | 642,626 | |
| | | | | | | | |
|
Insurance Brokers - 0.3% | |
Marsh & McLennan Companies Inc. | | | 1,006 | | | | 82,462 | |
| | | | | | | | |
|
Integrated Oil & Gas - 2.9% | |
Chevron Corp. | | | 4,103 | | | | 518,742 | |
Exxon Mobil Corp. | | | 3,493 | | | | 288,976 | |
| | | | | | | | |
| | | | | | | 807,718 | |
| | | | | | | | |
|
Integrated Telecommunication Services - 0.7% | |
AT&T Inc. | | | 1,914 | | | | 61,458 | |
Verizon Communications Inc. | | | 2,460 | | | | 123,763 | |
| | | | | | | | |
| | | | | | | 185,221 | |
| | | | | | | | |
|
Internet & Direct Marketing Retail - 4.6% | |
Amazon.com Inc. (a) | | | 513 | | | | 871,997 | |
Booking Holdings Inc. (a) | | | 104 | | | | 210,817 | |
Netflix Inc. (a) | | | 436 | | | | 170,664 | |
| | | | | | | | |
| | | | | | | 1,253,478 | |
| | | | | | | | |
|
Internet Software & Services - 6.4% | |
Alphabet Inc., Class A (a) | | | 627 | | | | 708,002 | |
Alphabet Inc., Class C (a)(b) | | | 365 | | | | 407,213 | |
Facebook Inc., Class A (a) | | | 3,266 | | | | 634,649 | |
| | | | | | | | |
| | | | | | | 1,749,864 | |
| | | | | | | | |
|
Investment Banking & Brokerage - 1.0% | |
The Charles Schwab Corp. | | | 5,587 | | | | 285,496 | |
| | | | | | | | |
|
IT Consulting & Other Services - 0.7% | |
Accenture PLC, Class A | | | 526 | | | | 86,048 | |
International Business Machines Corp. | | | 730 | | | | 101,981 | |
| | | | | | | | |
| | | | | | | 188,029 | |
| | | | | | | | |
|
Life & Health Insurance - 0.3% | |
Prudential Financial Inc. | | | 863 | | | | 80,699 | |
| | | | | | | | |
|
Life Sciences Tools & Services - 0.7% | |
Illumina Inc. (a) | | | 22 | | | | 6,145 | |
IQVIA Holdings Inc. (a) | | | 1,311 | | | | 130,864 | |
Thermo Fisher Scientific Inc. | | | 216 | | | | 44,742 | |
| | | | | | | | |
| | | | | | | 181,751 | |
| | | | | | | | |
See Notes to Schedule of Investments and Notes to Financial Statements.
| | |
| 4 | | State Street U.S. Equity V.I.S. Fund |
State Street U.S. Equity V.I.S. Fund
Schedule of Investments, continued — June 30, 2018 (Unaudited)
| | | | | | | | |
| | | Number
of Shares | | | Fair
Value
$ | |
| | | | | | | | |
Managed Healthcare - 1.6% | |
Humana Inc. | | | 372 | | | | 110,719 | |
UnitedHealth Group Inc. | | | 1,318 | | | | 323,358 | |
| | | | | | | | |
| | | | | | | 434,077 | |
| | | | | | | | |
|
Metal & Glass Containers - 0.2% | |
Ball Corp. | | | 1,372 | | | | 48,775 | |
| | | | | | | | |
|
Movies & Entertainment - 1.3% | |
The Walt Disney Co. | | | 3,529 | | | | 369,875 | |
| | | | | | | | |
|
Multi-Line Insurance - 0.3% | |
American International Group Inc. | | | 828 | | | | 43,901 | |
The Hartford Financial Services Group Inc. | | | 973 | | | | 49,749 | |
| | | | | | | | |
| | | | | | | 93,650 | |
| | | | | | | | |
|
Multi-Sector Holdings - 1.1% | |
Berkshire Hathaway Inc., Class B (a) | | | 1,633 | | | | 304,799 | |
| | | | | | | | |
|
Multi-Utilities - 1.1% | |
Dominion Energy Inc. | | | 631 | | | | 43,022 | |
Sempra Energy | | | 2,202 | | | | 255,674 | |
| | | | | | | | |
| | | | | | | 298,696 | |
| | | | | | | | |
|
Oil & Gas Equipment & Services - 1.3% | |
Schlumberger Ltd. | | | 5,202 | | | | 348,690 | |
| | | | | | | | |
|
Oil & Gas Exploration & Production - 1.9% | |
Concho Resources Inc. (a) | | | 496 | | | | 68,622 | |
ConocoPhillips | | | 1,456 | | | | 101,367 | |
Diamondback Energy Inc. | | | 1,841 | | | | 242,220 | |
EOG Resources Inc. | | | 620 | | | | 77,146 | |
Pioneer Natural Resources Co. | | | 142 | | | | 26,872 | |
| | | | | | | | |
| | | | | | | 516,227 | |
| | | | | | | | |
|
Oil & Gas Refining & Marketing - 0.3% | |
Valero Energy Corp. | | | 865 | | | | 95,868 | |
| | | | | | | | |
|
Packaged Foods & Meats - 2.0% | |
Mondelez International Inc., Class A | | | 11,122 | | | | 456,002 | |
The Kraft Heinz Co. | | | 1,355 | | | | 85,121 | |
| | | | | | | | |
| | | | | | | 541,123 | |
| | | | | | | | |
|
Paper Packaging - 0.1% | |
Packaging Corporation of America | | | 290 | | | | 32,419 | |
| | | | | | | | |
|
Pharmaceuticals - 4.5% | |
Allergan PLC | | | 2,439 | | | | 406,630 | |
Johnson & Johnson | | | 3,406 | | | | 413,284 | |
| | | | | | | | |
| | | Number
of Shares | | | Fair
Value
$ | |
Mylan N.V. (a) | | | 4,042 | | | | 146,078 | |
Pfizer Inc. | | | 7,755 | | | | 281,351 | |
| | | | | | | | |
| | | | | | | 1,247,343 | |
| | | | | | | | |
|
Property & Casualty Insurance - 0.8% | |
Chubb Ltd. | | | 1,788 | | | | 227,112 | |
| | | | | | | | |
|
Railroads - 0.5% | |
Union Pacific Corp. | | | 1,021 | | | | 144,655 | |
| | | | | | | | |
|
Regional Banks - 1.6% | |
First Republic Bank | | | 4,526 | | | | 438,072 | |
| | | | | | | | |
|
Research & Consulting Services - 0.1% | |
Verisk Analytics Inc. (a) | | | 273 | | | | 29,386 | |
| | | | | | | | |
|
Restaurants - 1.3% | |
McDonald’s Corp. | | | 815 | | | | 127,702 | |
Starbucks Corp. | | | 4,882 | | | | 238,486 | |
| | | | | | | | |
| | | | | | | 366,188 | |
| | | | | | | | |
|
Semiconductor Equipment - 2.0% | |
Applied Materials Inc. | | | 10,403 | | | | 480,515 | |
Lam Research Corp. | | | 337 | | | | 58,250 | |
| | | | | | | | |
| | | | | | | 538,765 | |
| | | | | | | | |
|
Semiconductors - 2.9% | |
Broadcom Inc. | | | 2,231 | | | | 541,330 | |
Intel Corp. | | | 2,390 | | | | 118,807 | |
NVIDIA Corp. | | | 603 | | | | 142,850 | |
| | | | | | | | |
| | | | | | | 802,987 | |
| | | | | | | | |
|
Soft Drinks - 2.4% | |
PepsiCo Inc. | | | 5,962 | | | | 649,083 | |
| | | | | | | | |
|
Specialized REITs - 3.5% | |
American Tower Corp. (b) | | | 3,034 | | | | 437,412 | |
Equinix Inc. | | | 757 | | | | 325,427 | |
Extra Space Storage Inc. | | | 1,988 | | | | 198,422 | |
| | | | | | | | |
| | | | | | | 961,261 | |
| | | | | | | | |
|
Specialty Chemicals - 1.3% | |
Albemarle Corp. | | | 2,530 | | | | 238,655 | |
Ecolab Inc. | | | 232 | | | | 32,556 | |
The Sherwin-Williams Co. | | | 198 | | | | 80,699 | |
| | | | | | | | |
| | | | | | | 351,910 | |
| | | | | | | | |
|
Specialty Stores - 0.2% | |
Signet Jewelers Ltd. | | | 452 | | | | 25,199 | |
Ulta Salon Cosmetics & Fragrance Inc. (a) | | | 179 | | | | 41,789 | |
| | | | | | | | |
| | | | | | | 66,988 | |
| | | | | | | | |
See Notes to Schedule of Investments and Notes to Financial Statements.
| | | | |
| State Street U.S. Equity V.I.S. Fund | | | 5 | |
State Street U.S. Equity V.I.S. Fund
Schedule of Investments, continued — June 30, 2018 (Unaudited)
| | | | | | | | |
| | | Number
of Shares | | | Fair
Value
$ | |
| | | | | | | | |
Steel - 0.1% | |
Steel Dynamics Inc. | | | 368 | | | | 16,910 | |
| | | | | | | | |
|
Systems Software - 4.9% | |
Microsoft Corp. | | | 11,265 | | | | 1,110,842 | |
Oracle Corp. | | | 3,422 | | | | 150,773 | |
Proofpoint Inc. (a) | | | 646 | | | | 74,490 | |
ServiceNow Inc. (a) | | | 140 | | | | 24,146 | |
| | | | | | | | |
| | | | | | | 1,360,251 | |
| | | | | | | | |
|
Technology Hardware, Storage & Peripherals - 4.1% | |
Apple Inc. | | | 6,052 | | | | 1,120,286 | |
| | | | | | | | |
|
Tobacco - 0.6% | |
Philip Morris International Inc. | | | 1,950 | | | | 157,443 | |
| | | | | | | | |
|
Trading Companies & Distributors - 1.1% | |
United Rentals Inc. (a) | | | 2,060 | | | | 304,097 | |
| | | | | | | | |
|
Wireless Telecommunication Services - 0.2% | |
T-Mobile US Inc. (a) | | | 838 | | | | 50,071 | |
| | | | | | | | |
| |
Total Common Stock
(Cost $21,599,490) | | | | 27,213,941 | |
| | | | | | | | |
| | | | | | | | |
| | | Number
of Shares | | | Fair
Value
$ | |
| Short-Term Investments - 1.0% | | | | | |
State Street Institutional U.S. Government Money Market Fund - Class G Shares 1.86% (Cost $285,515) (c)(d) | | | 285,515 | | | | 285,515 | |
| | | | | | | | |
| | |
Total Investments
(Cost $21,885,005) | | | | | | | 27,499,456 | |
| |
Other Assets and Liabilities,
net - 0.1% | | | | 15,829 | |
| | | | | | | | |
| | |
| NET ASSETS - 100.0% | | | | | | | 27,515,285 | |
| | | | | | | | |
Other Information:
The Fund had the following short futures contracts open at June 30, 2018:
| | | | | | | | | | | | | | | | | | | | |
| Description | | Expiration
date | | | Number of
Contracts | | | Notional
Amount | | | Value | | | Unrealized
Appreciation | |
| | | | | | | | | | | | | | | | | | | | |
S&P 500 Emini Index Futures | | | September 2018 | | | | 2 | | | | (276,658 | ) | | $ | (272,160 | ) | | $ | 4,498 | |
| | | | | | | | | | | | | | | | | | | | |
During the period ended June 30, 2018, the Fund had average notional values of $232,234 and $152,598 on long and short futures contracts, respectively.
See Notes to Schedule of Investments and Notes to Financial Statements.
| | |
| 6 | | State Street U.S. Equity V.I.S. Fund |
State Street U.S. Equity V.I.S. Fund
Notes to Schedule of Investments — June 30, 2018 (Unaudited)
The views expressed in this document reflect our judgment as of the publication date and are subject to change at any time without notice. The securities cited may not be representative of the Fund’s future investments and should not be construed as a recommendation to purchase or sell a particular security. See the Fund’s summary prospectus and statutory prospectus for complete descriptions of investment objectives, policies, risks and permissible investments.
| (a) | Non-income producing security. |
| (b) | At June 30, 2018, all or a portion of this security was pledged to cover collateral requirements for futures. |
| (c) | Sponsored by SSGA Funds Management, Inc., the Fund’s investment adviser and administrator, and an affiliate of State Street Bank & Trust Co., the Fund’s sub-administrator, custodian and accounting agent. |
| (d) | Coupon amount represents effective yield. |
| † | Percentages are based on net assets as of June 30, 2018. |
Abbreviations:
REIT Real Estate Investment Trust
The following table presents the Fund’s investments measured at fair value on a recurring basis at June 30, 2018:
| | | | | | | | | | | | | | | | |
| Investments | | Level 1 | | | Level 2 | | | Level 3 | | | Total | |
| | | | | | | | | | | | | | | | |
Investments in Securities | | | | | | | | | | | | | | | | |
Common Stock | | $ | 27,213,941 | | | $ | — | | | $ | — | | | $ | 27,213,941 | |
Short-Term Investments | | | 285,515 | | | | — | | | | — | | | | 285,515 | |
| | | | | | | | | | | | | | | | |
Total Investments in Securities | | $ | 27,499,456 | | | $ | — | | | $ | — | | | $ | 27,499,456 | |
| | | | | | | | | | | | | | | | |
Other Financial Instruments | | | | | | | | | | | | | | | | |
Short Futures Contracts - Unrealized Appreciation | | $ | 4,498 | | | $ | — | | | $ | — | | | $ | 4,498 | |
| | | | | | | | | | | | | | | | |
| | | | | | | | | | | | | | | | | | | | | | | | | | | | | | | | | | | | |
| | | Number
of Shares
Held at
12/31/17 | | | Value At
12/31/17 | | | Cost of
Purchases | | | Proceeds
from
Shares
Sold | | | Realized
Gain
(Loss) | | | Change in
Unrealized
Appreciation/
Depreciation | | | Number
of Shares
Held at
6/30/18 | | | Value At
6/30/18 | | | Dividend
Income | |
State Street Institutional U.S. Government Money Market Fund - Class G Shares | | | 1,034,501 | | | $ | 1,034,501 | | | $ | 1,687,918 | | | $ | 2,436,904 | | | $ | — | | | $ | — | | | | 285,515 | | | $ | 285,515 | | | $ | 5,291 | |
Notes to Schedule of Investments
| | | | |
| State Street U.S. Equity V.I.S. Fund | | | 7 | |
State Street U.S. Equity V.I.S. Fund
Financial Highlights
Selected data based on a share outstanding throughout the periods indicated
| | | | | | | | | | | | | | | | | | | | | | | | |
| | | 6/30/18† | | | 12/31/17 | | | 12/31/16 | | | 12/31/15* | | | 12/31/14* | | | 12/31/13* | |
| Inception date | | | | | | | | | | | | | | | | | | | | | | | 1/3/95 | |
| | | | | | |
Net asset value, beginning of period | | $ | 44.20 | | | $ | 42.02 | | | $ | 42.25 | | | $ | 48.44 | | | $ | 46.63 | | | $ | 35.14 | |
| | | | | | | | | | | | | | | | | | | | | | | | |
| | | | |
Income/(loss) from investment operations: | | | | | | | | | | | | | | | | | |
Net investment income | | | 0.16 | (a) | | | 0.35 | (a) | | | 0.55 | | | | 0.53 | | | | 0.50 | | | | 0.42 | |
Net realized and unrealized gains/(losses) on investments | | | 1.23 | | | | 8.03 | | | | 3.41 | | | | (1.56 | ) | | | 5.48 | | | | 11.49 | |
| | | | | | | | | | | | | | | | | | | | | | | | |
Total income/(loss) from investment operations | | | 1.39 | | | | 8.38 | | | | 3.96 | | | | (1.03 | ) | | | 5.98 | | | | 11.91 | |
| | | | | | | | | | | | | | | | | | | | | | | | |
| | | | | | |
Less distributions from: | | | | | | | | | | | | | | | | | | | | | | | | |
Net investment income | | | — | | | | 0.38 | | | | 0.54 | | | | 0.53 | | | | 0.46 | | | | 0.42 | |
Net realized gains | | | — | | | | 5.82 | | | | 3.65 | | | | 4.63 | | | | 3.71 | | | | — | |
| | | | | | | | | | | | | | | | | | | | | | | | |
Total distributions | | | — | | | | 6.20 | | | | 4.19 | | | | 5.16 | | | | 4.17 | | | | 0.42 | |
| | | | | | | | | | | | | | | | | | | | | | | | |
Net asset value, end of period | | $ | 45.59 | | | $ | 44.20 | | | $ | 42.02 | | | $ | 42.25 | | | $ | 48.44 | | | $ | 46.63 | |
| | | | | | | | | | | | | | | | | | | | | | | | |
Total Return(b) | | | 3.14 | % | | | 19.91 | % | | | 9.31 | % | | | (2.30 | )% | | | 12.77 | % | | | 33.91 | % |
| | | | | | |
Ratios/Supplemental Data: | | | | | | | | | | | | | | | | | | | | | | | | |
Net assets, end of period (in thousands) | | $ | 27,515 | | | $ | 28,308 | | | $ | 27,336 | | | $ | 31,405 | | | $ | 35,178 | | | $ | 34,234 | |
| | | | | | |
Ratios to average net assets: | | | | | | | | | | | | | | | | | | | | | | | | |
Net expenses | | | 0.83 | %** | | | 0.85 | % | | | 0.83 | % | | | 0.76 | % | | | 0.77 | %(c) | | | 0.80 | %(c) |
Gross expenses | | | 0.83 | %** | | | 0.85 | % | | | 0.83 | % | | | 0.76 | % | | | 0.77 | % | | | 0.80 | % |
Net investment income | | | 0.70 | %** | | | 0.75 | % | | | 1.16 | % | | | 1.04 | % | | | 0.99 | % | | | 0.95 | % |
Portfolio turnover rate | | | 23 | % | | | 80 | % | | | 37 | % | | | 37 | % | | | 43 | % | | | 40 | % |
Notes to Financial Highlights
| (a) | | Per share values have been calculated using the average share method. |
| (b) | | Total returns are historical and assume changes in share price, reinvestment of dividends and capital gains distributions and do not include the effect of insurance contract charges. Past performance does not guarantee future results. |
| (c) | | Includes contractual management fee waiver related to the Fund’s investments in the GE Institutional Money Market Fund (the “Money Market Fund”). The fee waiver agreement was terminated effective June 30, 2014 with the closure of the Money Market Fund. |
| * | | Beginning with the year ended December 31, 2016, the Fund was audited by Ernst & Young LLP. The previous years were audited by another independent registered public accounting firm. |
| ** | | Annualized for periods less than one year. |
The accompanying Notes are an integral part of these financial statements.
State Street U.S. Equity V.I.S. Fund
Statement of Assets and Liabilities — June 30, 2018 (Unaudited)
| | | | |
| | | | |
Assets | | | | |
Investments in securities, at fair value (cost $21,599,490) | | $ | 27,213,941 | |
Short-term affiliated investments, at fair value | | | 285,515 | |
Cash | | | 1,699 | |
Income receivables | | | 16,727 | |
Receivable for fund shares sold | | | 50,236 | |
Income receivable from affiliated investments | | | 602 | |
Receivable for accumulated variation margin on futures | | | 4,713 | |
Other assets | | | 3 | |
| | | | |
Total Assets | | | 27,573,436 | |
| | | | |
| |
Liabilities | | | | |
Net cash collateral on futures contracts due to broker | | | 4,715 | |
Payable for investments purchased | | | 11,456 | |
Payable for fund shares redeemed | | | 215 | |
Payable to the Adviser | | | 12,594 | |
Payable to the Custodian | | | 10,384 | |
Accrued other expenses | | | 18,787 | |
| | | | |
Total liabilities | | | 58,151 | |
| | | | |
| | | | |
Net Assets | | $ | 27,515,285 | |
| | | | |
| |
Net Assets Consist of: | | | | |
Capital paid in | | $ | 20,720,210 | |
Undistributed (distributions in excess of) net investment income | | | 97,755 | |
Accumulated net realized gain | | | 1,078,371 | |
Net unrealized appreciation (depreciation) on: | | | | |
Unaffiliated Investments | | | 5,614,451 | |
Futures | | | 4,498 | |
| | | | |
Net Assets | | $ | 27,515,285 | |
| | | | |
Shares outstanding ($0.01 par value; unlimited shares authorized) | | | 603,503 | |
Net asset value per share | | $ | 45.59 | |
The accompanying Notes are an integral part of these financial statements.
| | | | |
| Statement of Assets and Liabilities | | | 9 | |
State Street U.S. Equity V.I.S. Fund
Statement of Operations — For the period ended June 30, 2018 (Unaudited)
| | | | |
| | | | |
Investment Income | | | | |
Income | | | | |
Dividend | | $ | 209,171 | |
Income from affiliated investments | | | 5,291 | |
| | | | |
Total income | | | 214,462 | |
| | | | |
| |
Expenses | | | | |
Advisory and administration fees | | | 77,433 | |
Directors’ fees | | | 2,209 | |
Custody and accounting expenses | | | 16,682 | |
Professional fees | | | 14,360 | |
Other expenses | | | 6,023 | |
| | | | |
Total Expenses | | | 116,707 | |
| | | | |
Net investment income | | $ | 97,755 | |
| | | | |
| |
Net Realized and Unrealized Gain (Loss) on Investments | | | | |
Realized gain (loss) on: | | | | |
Unaffiliated investments | | $ | 869,883 | |
Futures | | | (473 | ) |
Increase (decrease) in unrealized appreciation/depreciation on: | | | | |
Unaffiliated investments | | | (90,260 | ) |
Futures | | | 4,027 | |
| | | | |
| |
Net realized and unrealized gain (loss) on investments | | | 783,177 | |
| | | | |
Net increase in net assets resulting from operations | | $ | 880,932 | |
| | | | |
The accompanying Notes are an integral part of these financial statements.
| | |
| 10 | | Statement of Operations |
State Street U.S. Equity V.I.S. Fund
Statements of Changes in Net Assets
| | | | | | | | |
| | | Six Months
Ended June 30,
2018* | | | Year Ended December 31,
2017 | |
Increase (Decrease) in Net Assets | | | | | | | | |
| | |
Operations: | | | | | | | | |
Net investment income | | $ | 97,755 | | | $ | 212,471 | |
Net realized gain (loss) on investments and futures | | | 869,410 | | | | 3,495,066 | |
Net increase (decrease) in unrealized appreciation/depreciation on investments and futures | | | (86,233 | ) | | | 1,432,584 | |
| | | | | | | | |
Net increase (decrease) from operations | | | 880,932 | | | | 5,140,121 | |
| | | | | | | | |
| | |
Distributions to shareholders from: | | | | | | | | |
Net investment income | | | — | | | | (212,881 | ) |
Net realized gains | | | — | | | | (3,271,930 | ) |
| | | | | | | | |
Total distributions | | | — | | | | (3,484,811 | ) |
| | | | | | | | |
Increase (decrease) in assets from operations and distributions | | | 880,932 | | | | 1,655,310 | |
| | | | | | | | |
| | |
Share transactions: | | | | | | | | |
Proceeds from sale of shares | | | 165,465 | | | | 272,095 | |
Value of distributions reinvested | | | — | | | | 3,484,811 | |
Cost of shares redeemed | | | (1,839,028 | ) | | | (4,440,611 | ) |
| | | | | | | | |
Net increase (decrease) from share transactions | | | (1,673,563 | ) | | | (683,705 | ) |
| | | | | | | | |
| | |
Total increase (decrease) in net assets | | | (792,631 | ) | | | 971,605 | |
| | |
Net Assets | | | | | | | | |
Beginning of period | | | 28,307,916 | | | | 27,336,311 | |
| | | | | | | | |
| | |
End of period | | $ | 27,515,285 | | | $ | 28,307,916 | |
| | | | | | | | |
| | |
Undistributed (distributions in excess of) net investment income, end of period | | $ | 97,755 | | | $ | — | |
| | |
Changes in Fund Shares | | | | | | | | |
Shares sold | | | 3,699 | | | | 5,950 | |
Issued for distributions reinvested | | | — | | | | 78,699 | |
Shares redeemed | | | (40,626 | ) | | | (94,827 | ) |
| | | | | | | | |
Net decrease in fund shares | | | (36,927 | ) | | | (10,178 | ) |
| | | | | | | | |
The accompanying Notes are an integral part of these financial statements.
| | | | |
| Statements of Changes in Net Assets | | | 11 | |
State Street U.S. Equity V.I.S. Fund
Notes to Financial Statements — June 30, 2018 (Unaudited)
| 1. | | Organization of the Company |
State Street Variable Insurance Series Funds, Inc. (the “Company”) was incorporated under the laws of the Commonwealth of Virginia on May 14, 1984 and is registered under the Investment Company Act of 1940, as amended (the “1940 Act”), as an open-end management investment company. The Company is currently composed of the following seven investment portfolios (collectively, the “Funds”): State Street U.S. Equity V.I.S. Fund (the “Fund”), State Street S&P 500 Index V.I.S. Fund, State Street Premier Growth Equity V.I.S. Fund, State Street Small-Cap Equity V.I.S. Fund, State Street Total Return V.I.S. Fund, State Street Income V.I.S. Fund and State Street Real Estate Securities V.I.S. Fund. Each Fund is a diversified investment company within the meaning of the 1940 Act.
Shares of the Funds of the Company are offered only to insurance company separate accounts that fund certain variable life insurance contracts and variable annuity contracts.
The Company currently offers one share class (Class 1) of the Fund as an investment option for variable life insurance and variable annuity contracts.
Under the Company’s organizational documents, its officers and directors are indemnified against certain liabilities arising out of the performance of their duties to the Company. Additionally, in the normal course of business, the Company enters into contracts with service providers that contain general indemnification clauses. The Company’s maximum exposure under these arrangements is unknown as this would involve future claims that may be made against the Company that have not yet occurred.
| 2. | | Summary of Significant Accounting Policies |
The following is a summary of significant accounting policies followed by the Company in the preparation of its financial statements:
The preparation of financial statements in accordance with U.S. generally accepted accounting principles (“U.S. GAAP”) requires management to make estimates and assumptions that affect the reported amounts and disclosures in the financial statements. Actual results could differ from those estimates. The Fund is an investment company under U.S. GAAP and follows the accounting and reporting guidance applicable to investment companies.
Security Valuation The Fund’s investments are valued at fair value each day that the New York Stock Exchange (“NYSE”) is open and, for financial reporting purposes, as of the report date should the reporting period end on a day that the NYSE is not open. Fair value is generally defined as the price a fund would receive to sell an asset or pay to transfer a liability in an orderly transaction between market participants at the measurement date. By its nature, a fair value price is a good faith estimate of the valuation in a current sale and may not reflect an actual market price. The investments of the Fund are valued pursuant to the policy and procedures developed by the Oversight Committee (the “Committee”) and approved by the Company’s Board of Directors (the “Board”). The Committee provides oversight of the valuation of investments for the Fund. The Board has responsibility for determining the fair value of investments.
Valuation techniques used to value the Fund’s investments by major category are as follows:
| | • | | Equity investments (including preferred stocks) traded on a recognized securities exchange for which market quotations are readily available are valued at the last sale price or official closing price, as applicable, on the primary market or exchange on which they trade. Equity investments traded on a recognized exchange for which there were no sales on that day are valued at the last published sale price or at fair value. |
| | • | | Exchange-traded futures contracts are valued at the closing settlement price on the primary market on which they are traded most extensively. Exchange-traded futures contracts traded on a recognized exchange for which there were no sales on that day are valued at the last reported sale price obtained from independent pricing services or brokers or at fair value. |
| | • | | Investments in registered investment companies (including money market funds) or other unitized pooled investment vehicles that are not traded on an exchange are valued at that day’s published net asset value per share or unit. |
| | |
| 12 | | Notes to Financial Statements |
State Street U.S. Equity V.I.S. Fund
Notes to Financial Statements, continued — June 30, 2018 (Unaudited)
In the event prices or quotations are not readily available or that the application of these valuation methods results in a price for an investment that is deemed to be not representative of the fair value of such investment, fair value will be determined in good faith by the Committee, in accordance with the valuation policy and procedures approved by the Board.
The Fund values its assets and liabilities at fair value using a fair value hierarchy consisting of three broad levels that prioritize the inputs to valuation techniques giving the highest priority to readily available unadjusted quoted prices in active markets for identical assets or liabilities (Level 1 measurements) and the lowest priority to unobservable inputs (Level 3 measurements) when market prices are not readily available or reliable. The categorization of a value determined for an investment within the hierarchy is based upon the pricing transparency of the investment and is not necessarily an indication of the risk associated with investing in it.
The three levels of the fair value hierarchy are as follows:
| | • | | Level 1 — Unadjusted quoted prices in active markets for an identical asset or liability; |
| | • | | Level 2 — Inputs other than quoted prices included within Level 1 that are observable for the asset or liability either directly or indirectly, including quoted prices for similar assets or liabilities in active markets, quoted prices for identical or similar assets or liabilities in markets that are not considered to be active, inputs other than quoted prices that are observable for the asset or liability (such as exchange rates, financing terms, interest rates, yield curves, volatilities, prepayment speeds, loss severities, credit risks and default rates) or other market-corroborated inputs; and |
| | • | | Level 3 — Unobservable inputs for the asset or liability, including the Committee’s assumptions used in determining the fair value of investments. |
The value of the Fund’s investments according to the fair value hierarchy as of June 30, 2018 is disclosed in the Fund’s Schedule of Investments.
Changes in valuation techniques may result in transfers in or out of an assigned level within the fair value hierarchy. Transfers between different levels of the fair value hierarchy are recognized at the beginning of the reporting period. The Fund had no material transfers between levels for the six-month period ended June 30, 2018.
Investment Transactions and Income Recognition Investment transactions are accounted for on trade date for financial reporting purposes. Realized gains and losses from the sale or disposition of investments and foreign exchange transactions, if any, are determined using the identified cost method. Dividend income and capital gain distributions, if any, are recognized on the ex-dividend date, net of any foreign taxes withheld at source, if any. Interest income is recorded daily on an accrual basis. All premiums and discounts are amortized/accreted for financial reporting purposes. Non-cash dividends received in the form of stock are recorded as dividend income at fair value.
Expenses Certain expenses, which are directly identifiable to a specific Fund, are applied to the Fund within the Company. Other expenses which cannot be attributed to a specific Fund are allocated in such a manner as deemed equitable, taking into consideration the nature and type of expense and the relative net assets of the Fund within the Company.
Foreign Currency Translation The accounting records of the Fund are maintained in U.S. dollars. Foreign currencies as well as investment securities and other assets and liabilities denominated in a foreign currency are translated to U.S. dollars using exchange rates at period end. Purchases and sales of securities, income receipts and expense payments denominated in foreign currencies are translated into U.S. dollars at the prevailing exchange rate on the respective dates of the transactions.
The effects of exchange rate fluctuations on investments are included with the net realized and unrealized gain (loss) on investment securities. Other foreign currency transactions resulting in realized and unrealized gain (loss) are disclosed separately.
Foreign Taxes The Fund may be subject to foreign taxes (a portion of which may be reclaimable) on income, stock dividends, realized and unrealized capital gains on investments or certain foreign currency transactions. Foreign taxes are recorded in accordance with SSGA Funds Management, Inc.’s (the “Adviser” or “SSGA FM”) understanding of the applicable foreign tax regulations and rates that exist in the foreign jurisdictions in which the Fund invests. These foreign taxes, if any, are paid by the Fund and are reflected in the Statement of Operations, if applicable. Foreign taxes payable or deferred as of June 30, 2018, if any, are disclosed in the Fund’s Statement of Assets and Liabilities.
| | | | |
| Notes to Financial Statements | | | 13 | |
State Street U.S. Equity V.I.S. Fund
Notes to Financial Statements, continued — June 30, 2018 (Unaudited)
Distributions The Fund declares and pays any dividends from net investment income annually. Net realized capital gains, if any, are distributed annually, unless additional distributions are required for compliance with applicable tax regulations. The amount and character of income and capital gains to be distributed are determined in accordance with applicable tax regulations which may differ from net investment income and realized gains recognized for U.S. GAAP purposes.
| 3. | | Derivative Financial Instruments |
Futures Contracts The Fund may enter into futures contracts to meet the Fund’s objectives. A futures contract is a standardized, exchange-traded agreement to buy or sell a financial instrument at a set price on a future date. Upon entering into a futures contract, the Fund is required to deposit with the broker, cash or securities in an amount equal to the minimum initial margin requirements of the clearing house. Subsequent payments are made or received by the Fund equal to the daily change in the contract value and are recorded as variation margin receivable or payable with a corresponding offset to unrealized gains or losses. The Fund recognizes a realized gain or loss when the contract is closed.
Losses may arise if the value of a futures contract decreases due to unfavorable changes in the market rates or values of the underlying instrument during the term of the contract or if the counterparty does not perform under the contract. The use of futures contracts also involves the risk that the movements in the price of the futures contracts do not correlate with the movement of the assets underlying such contracts.
For the six-month period ended June 30, 2018 the Fund entered into futures contracts for cash equitization.
The following tables summarize the value of the Fund’s derivative instruments as of June 30, 2018 and the related location in the accompanying Statement of Assets and Liabilities and Statement of Operations, presented by primary underlying risk exposure:
Asset Derivatives
| | | | | | | | | | | | | | | | | | | | | | | | |
| | | Interest
Rate
Contracts
Risk | | | Foreign
Exchange
Contracts
Risk | | | Credit
Contracts
Risk | | | Equity
Contracts
Risk | | | Commodity
Contracts
Risk | | | Total | |
| | | | | | | | | | | | | | | | | | | | | | | | |
Futures Contracts | | $ | — | | | $ | — | | | $ | — | | | $ | 4,713 | | | $ | — | | | $ | 4,713 | |
Net Realized Gain (Loss)
| | | | | | | | | | | | | | | | | | | | | | | | |
| | | Interest
Rate
Contracts
Risk | | | Foreign
Exchange
Contracts
Risk | | | Credit
Contracts
Risk | | | Equity
Contracts
Risk | | | Commodity
Contracts
Risk | | | Total | |
| | | | | | | | | | | | | | | | | | | | | | | | |
Futures Contracts | | $ | — | | | $ | — | | | $ | — | | | $ | (473 | ) | | $ | — | | | $ | (473 | ) |
Net Change in Unrealized Appreciation (Depreciation)
| | | | | | | | | | | | | | | | | | | | | | | | |
| | | Interest
Rate
Contracts
Risk | | | Foreign
Exchange
Contracts
Risk | | | Credit
Contracts
Risk | | | Equity
Contracts
Risk | | | Commodity
Contracts
Risk | | | Total | |
| | | | | | | | | | | | | | | | | | | | | | | | |
Futures Contracts | | $ | — | | | $ | — | | | $ | — | | | $ | 4,027 | | | $ | — | | | $ | 4,027 | |
| 4. | | Fees and Transactions with Affiliates |
Advisory Fee SSGA FM, a registered investment adviser, was retained by the Board to act as investment adviser and administrator of the Fund. SSGA FM’s compensation for investment advisory and administrative services (“Management Fee”) is paid monthly based on the average daily net assets of the Fund at an annualized rate of 0.55%.
| | |
| 14 | | Notes to Financial Statements |
State Street U.S. Equity V.I.S. Fund
Notes to Financial Statements, continued — June 30, 2018 (Unaudited)
Administrator, Sub-Administrator and Custodian Fees State Street Bank and Trust Company (“State Street”) serves as the sub-administrator and custodian to the Funds. Amounts paid by the Fund to State Street for performing such services are included in advisory and administration and custody and accounting expenses, respectively.
Due to Custodian In certain circumstances, the Funds may have cash overdraft with the custodian. The Due to Custodian amount, if any, reflects cash overdrawn with State Street as custodian who is an affiliate of the Funds.
Other Transactions with Affiliates The Fund may invest in affiliated entities, including securities issued by State Street, affiliated funds, or entities deemed to be affiliates as a result of the Fund owning more than five percent of the entity’s voting securities or outstanding shares. Amounts relating to these transactions during the six-month period ended June 30, 2018 are disclosed in the Schedule of Investments.
The fees and expenses of the Company’s directors who are not “interested persons” of the Company, as defined in the 1940 Act (“Independent Directors”) are paid directly by the Fund. The Independent Directors are reimbursed for travel and other out-of-pocket expenses in connection with meeting attendance and industry seminars.
| 6. | | Investment Transactions |
Purchases and sales of investments (excluding in-kind transactions, short term investments and derivative contracts) for the six-month period ended June 30, 2018 were as follows:
| | | | | | | | |
| Non-U.S. Government Securities |
| Purchases | | Sales |
| | | | | | | | | |
| | $ | 6,327,766 | | | | $ | 7,119,742 | |
The Fund has qualified and intends to continue to qualify as a regulated investment company under Subchapter M of the Internal Revenue Code of 1986, as amended. The Fund will not be subject to federal income taxes to the extent it distributes its taxable income, including any net realized capital gains, for each fiscal year. Therefore, no provision for federal income tax is required.
The Fund files federal and various state and local tax returns as required. No income tax returns are currently under examination. Generally, the federal returns are subject to examination by the Internal Revenue Service for a period of three years from date of filing, while the state returns may remain open for an additional year depending upon jurisdiction. SSGA FM has analyzed the Fund’s tax positions taken on tax returns for all open years and does not believe there are any uncertain tax positions that would require recognition of a tax liability.
Distributions to shareholders are recorded on ex-dividend date. Income dividends and gain distributions are determined in accordance with income tax rules and regulations, which may differ from generally accepted accounting principles.
As of June 30, 2018, gross unrealized appreciation and gross unrealized depreciation of investments and other financial instruments based on cost for federal income tax purposes were as follows:
| | | | | | | | | | | | | | | | | | |
Tax
Cost | | Gross
Unrealized
Appreciation | | Gross
Unrealized
Depreciation | | Net
Unrealized
Appreciation
(Depreciation) |
| | | | | | | | | | | | | | | | | | | |
| | $ | 22,010,467 | | | | $ | 6,006,326 | | | | $ | 512,839 | | | | $ | 5,493,487 | |
The Fund and other affiliated funds (each, a “Participant” and collectively, the “Participants”) participate in a $500 million revolving credit facility provided by a syndication of banks under which the Participants may borrow to fund shareholder redemptions. This agreement expires in October 2018 unless otherwise extended or renewed.
| | | | |
| Notes to Financial Statements | | | 15 | |
State Street U.S. Equity V.I.S. Fund
Notes to Financial Statements, continued — June 30, 2018 (Unaudited)
The Participants are charged an annual commitment fee which is calculated based on the unused portion of the shared credit line. Commitment fees are allocated among each of the Participants based on relative net assets. Commitment fees are ordinary fund operating expenses paid by the Adviser. A Participant incurs and pays the interest expense related to its borrowing. Interest is calculated at a rate per annum equal to the sum of 1% plus the greater of the New York Fed Bank Rate and 1-month LIBOR rate.
The Fund had no outstanding loans as of June 30, 2018.
Concentration Risk As a result of the Fund’s ability to invest a large percentage of its assets in obligations of issuers within the same country, state, region, currency or economic sector, an adverse economic, business or political development may affect the value of the Fund’s investments more than if the Fund were more broadly diversified.
Market and Credit Risk In the normal course of business, the Fund trades financial instruments and enters into financial transactions where risk of potential loss exists due to changes in the general economic conditions and fluctuations of the market (market risk). Additionally, the Fund may also be exposed to credit risk in the event that an issuer or guarantor fails to perform or that an institution or entity with which the Fund has unsettled or open transactions defaults.
Management has evaluated the impact of all subsequent events on the Fund through the date on which the financial statements were available to be issued and has determined that there were no subsequent events requiring adjustment or disclosure in the financial statements.
| | |
| 16 | | Notes to Financial Statements |
State Street U.S. Equity V.I.S. Fund
Other Information (Unaudited)
Proxy Voting Policies and Procedures and Record
The Fund has adopted the proxy voting policies of SSGA FM. A description of the policies and procedures that the Fund has adopted to determine how to vote proxies relating to portfolio securities is available (i) without charge, upon request, by calling 1-800-242-0134, (ii) on the Fund’s website at http://www.ssga.com/geam, (iii) on the SEC’s website at www.sec.gov, and (iv) at the SEC’s public reference room. Information on the operation of the public reference room may be obtained by calling 1-800-SEC-0330. Information regarding how the Fund voted proxies, if any, during the most recent 12-month period ended June 30 is available by August 31 of each year without charge (1) by calling 1-800-242-0134 (toll free), and (2) on the website of the SEC at www.sec.gov.
Quarterly Portfolio Schedule
The Fund files its complete schedule of investments with the SEC for the first and third quarters of each fiscal year on Form N-Q. The Fund’s Forms N-Q are available (i) without charge, upon request, by calling 1-800-242-013, (ii) on the Fund’s website at http://www.ssga.com/geam, (iii) on the SEC’s website at www.sec.gov, and (iv) at the SEC’s public reference room. Information on the operation of the public reference room may be obtained by calling 1-800-SEC-0330.
State Street U.S. Equity V.I.S. Fund
Other Information (Unaudited), continued
Disclosure for the Board of Directors’ Consideration of the Renewal of the Investment Advisory and Administration Agreement with SSGA Funds Management, Inc. on behalf of the State Street U.S. Equity V.I.S. Fund
At meetings of the Board of Directors (the “Board”) of State Street Variable Insurance Series Funds, Inc. (the “V.I.S. Funds”) held on May 16, 2018 and June 5, 2018 (the “Board Meetings”), the Board members, including the Board members who are not “interested persons” (as defined in the Investment Company Act of 1940, as amended (the “1940 Act”)) of the V.I.S. Funds (“Independent Board Members”), considered and unanimously approved the continuance for an additional year of the investment advisory and administration agreement (the “Investment Advisory and Administration Agreement”) between SSGA Funds Management, Inc. (“SSGA FM” or the “Adviser”) and the V.I.S. Funds on behalf of each of its series portfolios, including the State Street U.S. Equity V.I.S. Fund (the “Fund”).
In considering whether to approve the continuance for an additional year of the Investment Advisory and Administration Agreement, the Board members considered and discussed a substantial amount of information and analysis provided, at the Board’s request, by the Adviser. The Board members also considered detailed information regarding performance and expenses of other investment companies, including those with similar investment strategies and sizes, which was prepared by an independent third party provider, Broadridge Financial Solutions, Inc. (“Broadridge”). The Board members reviewed the fees charged by the Adviser for other mutual funds and investment products other than mutual funds that employ a similar investment strategy as the Fund. The Board had the opportunity to ask questions and request additional information in connection with its considerations.
Before approving the continuance of the Investment Advisory and Administration Agreement, the Independent Board Members reviewed the information provided with management of the Adviser and with their independent legal counsel. The Board also reviewed a memorandum prepared by independent legal counsel discussing the legal standards for the consideration of the proposed continuance. The Independent Board Members discussed the proposed continuance of the Investment Advisory and Administration Agreement in detail during private sessions in advance of, and at, the Board Meetings with their independent legal counsel at which no representatives of the Adviser were present. The Independent Board Members and their independent legal counsel requested, and received and considered, additional information from the Adviser following the May 16, 2018 Board Meeting and prior to the June 5, 2018 Board Meeting.
In advance of the Board Meetings, and in response to their detailed requests, the Board members received from the Adviser written responses to their inquiries, which included substantial exhibits and other materials related to the Adviser’s business and the services it provides to the Fund. The Directors took into account their multi-year experience as Directors and particularly their previous consideration of these types of agreements.
During the Board Meetings, the Board members had an opportunity to discuss this information with SSGA FM representatives, including senior executives, representatives from the legal, compliance and finance departments, and investment personnel. The Board members posed questions to these representatives and engaged in significant discussions.
In reaching its determinations relating to the continuance of the Investment Advisory and Administration Agreement, the Board considered those factors it deemed relevant, including the factors discussed below. In its deliberations, the Board did not identify any single factor that was dispositive and each Director may have attributed different weights to the various factors. The Directors evaluated the information provided to them, as well as the presentations and discussions that occurred at the Board Meetings, for the Fund, and their determinations were made separately in respect of the Fund from other series portfolios of the V.I.S Funds.
The material factors and conclusions that formed the basis for the Board’s determinations to approve the continuance of the Investment Advisory and Administration Agreement with the Adviser on behalf of the Fund are as discussed below.
The Nature, Extent and Quality of Services Provided.
The Board reviewed the services provided to the Fund by the Adviser. The Board considered the Adviser’s management capabilities and investment process with respect to the types of investments held by the Fund, including the education, experience and number of investment professionals and other personnel who provide portfolio management, investment research, and similar services to the Fund. The Board evaluated, where relevant, the abilities and experience of such investment personnel in analyzing particular markets, industries and specific issuers of securities in these markets and industries. The Board also considered the substantial expertise of the Adviser in developing and applying proprietary quantitative models for managing the Fund. The Board
State Street U.S. Equity V.I.S. Fund
Other Information (Unaudited), continued
considered the extensive experience and resources committed by the Adviser to risk management, including with respect to investment risk, liquidity risk, operational risk, counterparty risk and model risk. The Board also considered the significant risks assumed by the Adviser in connection with the services provided to the Fund, including operational, enterprise, regulatory, litigation and compliance risks. The Board also took into account the compensation paid to recruit and retain investment personnel, and the time and attention devoted to the Fund by senior management.
The Board had previously reviewed the compliance programs of SSGA FM and various affiliated service providers (“Affiliated Service Providers”). Among other things, the Board considered compliance and reporting matters relating to personal trading by investment personnel, selective disclosure of portfolio holdings, late trading, frequent trading, portfolio valuation, business continuity, the allocation of investment opportunities and the voting of proxies.
In light of the foregoing and other relevant information, the Board, including the Independent Board Members, concluded that the services provided by the Adviser continue to be satisfactory.
Investment Performance.
The Board members considered the investment performance of the Fund for various periods. The Board members reviewed detailed comparisons of the performance of the Fund with the relevant securities index and peer and category groupings of mutual funds prepared by Broadridge with respect to various periods. The Board members also engaged in detailed discussions with SSGA FM management about its investment processes and performance results. These discussions focused on the Fund’s investment objective, the number and experience of portfolio management and supporting research personnel, the Fund’s investment style and approach employed, the likely market cycles for the Fund’s investment style and the Fund’s relative underperformance in the measurement periods shown. The Board members discussed the Adviser’s investment approach with respect to the Fund and reasons for the Fund’s relative underperformance in the measurement periods shown.
Taking these factors into consideration, the Board, including the Independent Board Members, expressed concern about the Fund’s performance and agreed to closely monitor performance.
Cost of the Services Provided And Profits Realized From The Relationship with the Fund.
The Directors considered the management fees paid to the Adviser by the Fund. The Board reviewed the level of profits realized by the Adviser and the Affiliated Service Providers in providing investment advisory and other services to the Fund. Information also was presented regarding the financial condition of the Adviser for various past periods. The Directors also considered the Adviser’s statements concerning its significant investment in supporting registered investment companies. The Board also considered the various risks borne by SSGA FM and the Affiliated Service Providers in connection with their various roles in servicing the Fund, including enterprise, litigation, business, operational and entrepreneurial risk.
The Board concluded that the profitability of the Adviser with respect to the Fund, and the profitability range of each of the Affiliated Service Providers with respect to its services to the Fund, were reasonable in relation to the services provided.
The Extent to Which Economies of Scale Would Be Realized as the Fund Grows and Whether Fee Levels Would Reflect Such Economies of Scale.
The Board considered the extent to which the Adviser and the Affiliated Service Providers, on the one hand, and the Fund, on the other hand, can expect to realize benefits from economies of scale as the assets of the Fund increase. The Board acknowledged the difficulty in accurately measuring the benefits resulting from the economies of scale with respect to the management of the Fund. The Board concluded that, in light of, among other considerations, the current size of the Fund, the level of profitability of the Adviser and the Affiliated Service Providers with respect to the Fund, and/or the comparative management fee and expense ratio of the Fund, it does not appear that the Adviser or the Affiliated Service Providers has realized benefits from economies of scale in managing the assets of the Fund to such an extent that previously agreed management fees should be reduced or that breakpoints in such fees should be implemented for the Fund at this time.
Comparison of Services to be Rendered and Fees to be Paid.
The Board discussed the services provided to the Fund by the Adviser, and the fees charged to the Fund for those services. As part of its review, the Board considered the Fund’s management fee and total expense ratio, including the portion attributable to
State Street U.S. Equity V.I.S. Fund
Other Information (Unaudited), continued
administrative services provided by SSGA FM, as compared to the expense ratios of a group of comparable mutual funds selected by Broadridge, and the related Broadridge analysis for the Fund. The Board also considered the comparability of the fees charged and the services provided to the Fund by the Adviser to the fees charged and services provided to other clients of the Adviser. Among other information, the Board considered that, although the net and gross expense ratios were among the highest in the applicable Broadridge peer group ranges, the Fund’s advisory fee was within the applicable Broadridge peer group range.
In light of the foregoing, the Board, including the Independent Board Members, determined that the management fees, considered in relation to the services provided to the Fund, supported the Board’s approval of the continuance of the Investment Advisory and Administration Agreement.
Fall-Out Benefits.
The Board considered actual and potential financial benefits that the Adviser could derive from its relationship with the Fund, including the custody, fund accounting and sub-administration services being provided to the Fund by affiliates of the Adviser and, to the extent applicable, soft dollar commission benefits generated through Fund portfolio transactions. The Board noted, however, that the Fund benefits from the vast array of resources available through SSGA FM, and that the Fund represents only a small portion of the assets managed by SSGA FM.
Conclusion.
No single factor was determinative to the Board’s decision. Based on their discussion and such other matters as were deemed relevant, the Directors, including the Independent Board Members, approved the continuance of the Investment Advisory and Administration Agreement for the Fund.
Directors
John R. Costantino, Chairman
R. Sheldon Johnson
Donna M. Rapaccioli
Jeanne M. La Porta
Officers
Jeanne M. La Porta, President
Arthur Jensen, Treasurer
Brian Harris, Chief Compliance Officer and Anti-Money Laundering Officer
Bruce S. Rosenberg, Assistant Treasurer
Ann M. Carpenter, Assistant Treasurer
Chad C. Hallett, Assistant Treasurer
Darlene Anderson-Vasquez, Assistant Treasurer
Daniel G. Plourde, Assistant Treasurer
Jesse Hallee, Secretary
Investment Adviser and Administrator
SSGA Funds Management, Inc.
1600 Summer Street
P.O. Box 7900
Stamford, CT 06904-7900
Custodian and Sub-Administrator
State Street Bank and Trust Company
One Lincoln Street
Boston, Massachusetts 02111
Distributor
State Street Global Advisors Funds Distributors, LLC
One Iron Street
Boston, MA 02210
Independent Registered Public Accounting Firm
Ernst & Young LLP
200 Clarendon Street
Boston, Massachusetts 02116
Semi-Annual Report
June 30, 2018
State Street Premier Growth Equity V.I.S. Fund

State Street Premier Growth Equity V.I.S. Fund
Semi-Annual Report
June 30, 2018 (Unaudited)
Table of Contents
This report is prepared for Policyholders of certain variable contracts and may be distributed to others only if preceded or accompanied by the variable contract’s current prospectus and the current summary prospectus of the Fund available for investments thereunder.
State Street Premier Growth Equity V.I.S. Fund
Fund Information — June 30, 2018 (Unaudited)
Total return performance shown in this report for the Fund takes into account changes in share price and assumes reinvestment of dividends and capital gains distributions, if any. Total returns shown are net of Fund fees and expenses but do not reflect fees and charges associated with the variable contracts such as administrative fees, account charges and surrender charges, which, if reflected, would reduce the Fund’s total returns for all periods shown.
The performance data quoted represents past performance; past performance does not guarantee future results. Investment return and principal value will fluctuate so your shares, when redeemed, may be worth more or less than their original cost. Current performance may be higher or lower than the performance data quoted. Periods less than one year are not annualized. Please call toll-free (800) 242-0134 or visit the Fund’s website at http://www.ssga.com/geam for the most recent month-end performance data.
An investment in the Fund is not a deposit of any bank and is not insured or guaranteed by the Federal Deposit Insurance Corporation (“FDIC”) or any other government agency. An investment in the Fund is subject to risk, including possible loss of principal invested.
Sector Allocation
Portfolio Composition as a % of Fair Value of $36,332 (in thousands) as of June 30, 2018 (a)(b)
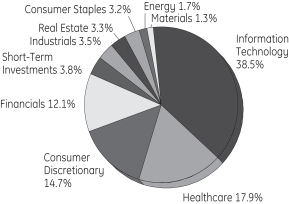
Top Ten Largest Holdings
as of June 30, 2018 (as a % of Fair Value) (a)(b)
| | | | |
Apple Inc. | | | 6.19 | % |
Microsoft Corp. | | | 5.45 | % |
Alphabet Inc., Class C | | | 5.18 | % |
Amazon.com Inc. | | | 5.17 | % |
Visa Inc., Class A | | | 4.83 | % |
CME Group Inc. | | | 3.78 | % |
Facebook Inc., Class A | | | 3.74 | % |
The Charles Schwab Corp. | | | 3.73 | % |
United Rentals Inc. | | | 3.46 | % |
American Tower Corp. | | | 3.29 | % |
| (a) | Fair Value basis is inclusive of short-term investment in State Street Institutional U.S. Government Money Market Fund - Class G shares. |
| (b) | The securities information regarding holdings, allocations and other characteristics is presented to illustrate examples of securities that the Fund has bought and the diversity of areas in which the Fund may invest as of a particular date. It may not be representative of the Fund’s current or future investments and should not be construed as a recommendation to purchase or sell a particular security. |
State Street Global Advisors Funds Distributors, LLC, member of FINRA & SIPC is the principal underwriter and distributor of the State Street V.I.S. Funds and an indirect wholly-owned subsidiary of State Street Corporation. References to State Street may include State Street Corporation and its affiliates. The Funds pay State Street Bank and Trust Company for its services as custodian and Fund Accounting agent, and pay SSGA Funds Management, Inc. for investment advisory and administrative services.
| | | | |
| State Street Premier Growth Equity V.I.S. Fund | | | 1 | |
State Street Premier Growth Equity V.I.S. Fund
Understanding Your Fund’s Expenses — June 30, 2018 (Unaudited)
As a shareholder of the Fund, you incur ongoing costs. Ongoing costs include portfolio management fees, professional fees, administrative fees and other Fund expenses. The following example is intended to help you understand your ongoing costs (in dollars) of investing in the Fund and to compare these costs with the ongoing costs of investing in other mutual funds.
To illustrate these ongoing costs, we have provided an example and calculated the expenses paid by investors in the Fund during the period. The information in the following table is based on an investment of $1,000, which is invested at the beginning of the period and held for the entire six-month period ended June 30, 2018.
Actual Expenses
The first section of the table provides information about actual account values and actual expenses. You may use the information in this section, together with the amount you invested, to estimate the expenses that you paid over the period. To do so, simply divide your account value by $1,000 (for example, an $8,600 account value divided by $1,000 = 8.6), then multiply the result by the number given under the heading “Expenses paid during the period” to estimate the expenses you paid on your account during the period.
Hypothetical Example for Comparison Purposes
The second section of the table provides information about hypothetical account values and hypothetical expenses based on the Fund’s actual expense ratio and an assumed rate of return of 5% per year before expenses, which is not the Fund’s actual return. The hypothetical account values and expenses may not be used to estimate the actual ending account balance or expenses you paid for the period. You may use this information to compare the ongoing costs of investing in the Fund and other funds. To do so, compare this 5% hypothetical example with the 5% hypothetical examples that appear in the shareholder reports of other funds.
Please note that the expenses shown in the table are meant to highlight and help you compare ongoing costs only and do not reflect transaction costs, such as sales charges or redemption fees, if any. Therefore, the second section of the table is useful in comparing ongoing costs only, and will not help you determine the relative total costs of owning different funds. Additionally, the expenses shown do not reflect the fees or charges associated with variable contracts through which shares of the Fund are offered.
January 1, 2018 – June 30, 2018
| | | | | | | | |
| | | Actual
Fund Return | | | Hypothetical
5% Return
(2.5% for
the period) | |
Account value at the beginning of the period | | $ | 1,000.00 | | | $ | 1,000.00 | |
Account value at the end of the period | | $ | 1,056.60 | | | $ | 1,020.53 | |
Expenses paid during the period* | | $ | 4.39 | | | $ | 4.31 | |
| * | Expenses are equal to the Fund’s annualized expense ratio of 0.86% (for the period January 1, 2018-June 30, 2018), multiplied by the average account value over the period, multiplied by 181/365 (to reflect the one-half year period). |
| | |
| 2 | | State Street Premier Growth Equity V.I.S. Fund |
State Street Premier Growth Equity V.I.S. Fund
Schedule of Investments — June 30, 2018 (Unaudited)
| | | | | | | | |
| | | Number
of Shares | | | Fair
Value $ | |
| | | | | | | | |
| Common Stock - 96.3%† | |
Application Software - 4.5% | | | | | | | | |
Intuit Inc. | | | 2,302 | | | | 470,310 | |
salesforce.com Inc. (a) | | | 8,472 | | | | 1,155,581 | |
| | | | | | | | |
| | | | | | | 1,625,891 | |
| | | | | | | | |
|
Biotechnology - 6.7% | |
Alexion Pharmaceuticals Inc. (a) | | | 8,472 | | | | 1,051,799 | |
Biogen Inc. (a) | | | 1,827 | | | | 530,268 | |
Vertex Pharmaceuticals Inc. (a) | | | 4,973 | | | | 845,211 | |
| | | | | | | | |
| | | | | | | 2,427,278 | |
| | | | | | | | |
|
Cable & Satellite - 6.2% | |
Charter Communications Inc., Class A (a) | | | 3,186 | | | | 934,167 | |
Comcast Corp., Class A | | | 18,233 | | | | 598,225 | |
Liberty Global PLC, Class C (a) | | | 27,625 | | | | 735,101 | |
| | | | | | | | |
| | | | | | | 2,267,493 | |
| | | | | | | | |
|
Data Processing & Outsourced Services - 5.0% | |
Mastercard Inc., Class A | | | 368 | | | | 72,319 | |
Visa Inc., Class A | | | 13,260 | | | | 1,756,287 | |
| | | | | | | | |
| | | | | | | 1,828,606 | |
| | | | | | | | |
|
Financial Exchanges & Data - 6.5% | |
CME Group Inc. | | | 8,380 | | | | 1,373,650 | |
S&P Global Inc. | | | 4,880 | | | | 994,983 | |
| | | | | | | | |
| | | | | | | 2,368,633 | |
| | | | | | | | |
|
Healthcare Distributors - 1.9% | |
Henry Schein Inc. (a) | | | 9,595 | | | | 696,981 | |
| | | | | | | | |
|
Healthcare Equipment - 4.3% | |
Boston Scientific Corp. (a) | | | 31,861 | | | | 1,041,855 | |
Medtronic PLC | | | 6,207 | | | | 531,381 | |
| | | | | | | | |
| | | | | | | 1,573,236 | |
| | | | | | | | |
|
Healthcare Supplies - 2.3% | |
The Cooper Companies Inc. | | | 3,592 | | | | 845,736 | |
| | | | | | | | |
|
Internet & Direct Marketing Retail - 5.2% | |
Amazon.com Inc. (a) | | | 1,105 | | | | 1,878,279 | |
| | | | | | | | |
|
Internet Software & Services - 11.9% | |
Alibaba Group Holding Ltd. ADR (a) | | | 2,947 | | | | 546,757 | |
Alphabet Inc., Class A (a) | | | 460 | | | | 519,428 | |
Alphabet Inc., Class C (a) | | | 1,686 | | | | 1,880,986 | |
Facebook Inc., Class A (a) | | | 6,998 | | | | 1,359,851 | |
| | | | | | | | |
| | | | | | | 4,307,022 | |
| | | | | | | | |
| | | | | | | | |
| | | Number
of Shares | | | Fair
Value $ | |
Investment Banking & Brokerage - 3.7% | |
The Charles Schwab Corp. | | | 26,520 | | | | 1,355,172 | |
| | | | | | | | |
|
Movies & Entertainment - 2.7% | |
The Walt Disney Co. | | | 9,209 | | | | 965,195 | |
| | | | | | | | |
|
Oil & Gas Equipment & Services - 1.7% | |
Schlumberger Ltd. | | | 9,172 | | | | 614,799 | |
| | | | | | | | |
|
Pharmaceuticals - 2.7% | |
Allergan PLC | | | 5,857 | | | | 976,479 | |
| | | | | | | | |
|
Regional Banks - 1.9% | |
First Republic Bank | | | 6,998 | | | | 677,337 | |
| | | | | | | | |
|
Restaurants - 0.7% | |
Starbucks Corp. | | | 4,972 | | | | 242,882 | |
| | | | | | | | |
|
Semiconductor Equipment - 2.8% | |
Applied Materials Inc. (b) | | | 22,100 | | | | 1,020,799 | |
| | | | | | | | |
|
Semiconductors - 2.7% | |
Broadcom Inc. | | | 4,052 | | | | 983,177 | |
| | | | | | | | |
|
Soft Drinks - 3.2% | |
PepsiCo Inc. | | | 10,633 | | | | 1,157,615 | |
| | | | | | | | |
|
Specialized REITs - 3.3% | |
American Tower Corp. | | | 8,288 | | | | 1,194,881 | |
| | | | | | | | |
|
Specialty Chemicals - 1.3% | |
Albemarle Corp. | | | 4,972 | | | | 469,009 | |
| | | | | | | | |
|
Systems Software - 5.4% | |
Microsoft Corp. | | | 20,074 | | | | 1,979,497 | |
| | | | | | | | |
|
Technology Hardware, Storage & Peripherals - 6.2% | |
Apple Inc. | | | 12,140 | | | | 2,247,235 | |
| | | | | | | | |
|
Trading Companies & Distributors - 3.5% | |
United Rentals Inc. (a) | | | 8,527 | | | | 1,258,756 | |
| | | | | | | | |
| |
Total Common Stock
(Cost $21,730,778) | | | | 34,961,988 | |
| | | | | | | | |
|
| Short-Term Investments - 3.8% | |
State Street Institutional U.S. Government Money Market Fund - Class G Shares 1.86%
(Cost $1,370,393) (c)(d) | | | 1,370,393 | | | | 1,370,393 | |
| | |
Total Investments
(Cost $23,101,171) | | | | | | | 36,332,381 | |
| |
| Liabilities in Excess of Other Assets, net - (0.1)% | | | | (38,552 | ) |
| | | | | | | | |
| |
| NET ASSETS - 100.0% | | | | 36,293,829 | |
| | | | | | | | |
See Notes to Schedule of Investments and Notes to Financial Statements.
| | | | |
| State Street Premier Growth Equity V.I.S. Fund | | | 3 | |
State Street Premier Growth Equity V.I.S. Fund
Schedule of Investments, continued — June 30, 2018 (Unaudited)
Other Information:
The Fund had the following long futures contracts open at June 30, 2018:
| | | | | | | | | | | | | | | | | | | | |
| Description | | Expiration
date | | | Number of
Contracts | | | Notional
Amount | | |
Value | | | Unrealized
Depreciation | |
| | | | | | | | | | | | | | | | | | | | |
S&P 500 Emini Index Futures | | | September 2018 | | | | 3 | | | | 415,844 | | | $ | 408,250 | | | $ | (7,594 | ) |
| | | | | | | | | | | | | | | | | | | | |
During the period ended June 30, 2018, the Fund had average notional values of $272,076 and $97,097 on long and short futures contracts, respectively.
See Notes to Schedule of Investments and Notes to Financial Statements.
| | |
| 4 | | State Street Premier Growth Equity V.I.S. Fund |
State Street Premier Growth Equity V.I.S. Fund
Notes to Schedule of Investments — June 30, 2018 (Unaudited)
The views expressed in this document reflect our judgment as of the publication date and are subject to change at any time without notice. The securities cited may not be representative of the Fund’s future investments and should not be construed as a recommendation to purchase or sell a particular security. See the Fund’s summary prospectus and statutory prospectus for complete descriptions of investment objectives, policies, risks and permissible investments.
| (a) | Non-income producing security. |
| (b) | At June 30, 2018, all or a portion of this security was pledged to cover collateral requirements for futures. |
| (c) | Sponsored by SSGA Funds Management, Inc., the Fund’s investment adviser and administrator, and an affiliate of State Street Bank & Trust Co., the Fund’s sub-administrator, custodian and accounting agent. |
| (d) | Coupon amount represents effective yield. |
| † | Percentages are based on net assets as of June 30, 2018. |
Abbreviations:
ADR - American Depositary Receipt
REIT - Real Estate Investment Trust
The following table presents the Fund’s investments measured at fair value on a recurring basis at June 30, 2018:
| | | | | | | | | | | | | | | | |
| Investments | | Level 1 | | | Level 2 | | | Level 3 | | | Total | |
| | | | | | | | | | | | | | | | |
Investments in Securities | | | | | | | | | | | | | | | | |
Common Stock | | $ | 34,961,988 | | | $ | — | | | $ | — | | | $ | 34,961,988 | |
Short-Term Investments | | | 1,370,393 | | | | — | | | | — | | | | 1,370,393 | |
| | | | | | | | | | | | | | | | |
Total Investments in Securities | | $ | 36,332,381 | | | $ | — | | | $ | — | | | $ | 36,332,381 | |
| | | | | | | | | | | | | | | | |
Other Financial Instruments | | | | | | | | | | | | | | | | |
Long Futures Contracts - Unrealized Depreciation | | $ | (7,594 | ) | | $ | — | | | $ | — | | | $ | (7,594 | ) |
| | | | | | | | | | | | | | | | |
Affiliate Table
| | | | | | | | | | | | | | | | | | | | | | | | | | | | | | | | | | | | | | | | |
| | | Number
of Shares
Held at
12/31/17 | | | Value At
12/31/17 | | | Cost of
Purchases | | | Proceeds
from
Shares Sold | | | Realized
Gain
(Loss) | | | Change in
Unrealized
Appreciation/ Depreciation | | | Number of Shares
Held at
6/30/18 | | | Value at
6/30/18 | | | Dividend
Income | | | Capital
Gains
Distributions | |
| | | | | | | | | | | | | | | | | | | | | | | | | | | | | | | | | | | | | | | | |
State Street Institutional U.S. Government Money Market Fund - Class G Shares | | | 1,093,520 | | | $ | 1,093,520 | | | $ | 3,692,153 | | | $ | 3,415,280 | | | | — | | | | — | | | | 1,370,393 | | | $ | 1,370,393 | | | $ | 7,145 | | | | — | |
Notes to Schedule of Investments
| | | | |
| State Street Premier Growth Equity V.I.S. Fund | | | 5 | |
State Street Premier Growth Equity V.I.S. Fund
Financial Highlights
Selected data based on a share outstanding throughout the periods indicated
| | | | | | | | | | | | | | | | | | | | | | | | |
| | | 6/30/18† | | | 12/31/17 | | | 12/31/16 | | | 12/31/15* | | | 12/31/14* | | | 12/31/13* | |
| Inception date | | | | | | | | | | | | | | | | | | | | | | | 12/12/97 | |
| | | | | | |
Net asset value, beginning of period | | $ | 99.23 | | | $ | 86.08 | | | $ | 94.07 | | | $ | 106.58 | | | $ | 107.84 | | | $ | 85.99 | |
| | | | | | | | | | | | | | | | | | | | | | | | |
| | | | |
Income/(loss) from investment operations: | | | | | | | | | | | | | | | | | |
Net investment income | | | 0.03 | (a) | | | 0.32 | (a) | | | 0.50 | | | | 0.52 | | | | 0.63 | | | | 0.58 | |
Net realized and unrealized gains/(losses) on investments | | | 5.59 | | | | 24.10 | | | | 1.90 | | | | 3.25 | | | | 14.71 | | | | 29.35 | |
| | | | | | | | | | | | | | | | | | | | | | | | |
Total income from investment operations | | | 5.62 | | | | 24.42 | | | | 2.40 | | | | 3.77 | | | | 15.34 | | | | 29.93 | |
| | | | | | | | | | | | | | | | | | | | | | | | |
| | | | | | |
Less distributions from: | | | | | | | | | | | | | | | | | | | | | | | | |
Net investment income | | | — | | | | 0.34 | | | | 0.48 | | | | 0.53 | | | | 0.58 | | | | 0.58 | |
Net realized gains | | | — | | | | 10.93 | | | | 9.91 | | | | 15.75 | | | | 16.02 | | | | 7.50 | |
| | | | | | | | | | | | | | | | | | | | | | | | |
Total distributions | | | — | | | | 11.27 | | | | 10.39 | | | | 16.28 | | | | 16.60 | | | | 8.08 | |
| | | | | | | | | | | | | | | | | | | | | | | | |
Net asset value, end of period | | $ | 104.85 | | | $ | 99.23 | | | $ | 86.08 | | | $ | 94.07 | | | $ | 106.58 | | | $ | 107.84 | |
| | | | | | | | | | | | | | | | | | | | | | | | |
Total Return(b) | | | 5.66 | % | | | 28.34 | % | | | 2.47 | % | | | 3.30 | % | | | 14.05 | % | | | 34.88 | % |
| | | | | | |
Ratios/Supplemental Data: | | | | | | | | | | | | | | | | | | | | | | | | |
Net assets, end of period (in thousands) | | $ | 36,294 | | | $ | 36,404 | | | $ | 33,219 | | | $ | 36,858 | | | $ | 39,944 | | | $ | 40,852 | |
| | | | | | |
Ratios to average net assets: | | | | | | | | | | | | | | | | | | | | | | | | |
Net expenses | | | 0.86 | %** | | | 0.85 | % | | | 0.84 | % | | | 0.81 | % | | | 0.81 | %(c) | | | 0.83 | %(c) |
Gross expenses | | | 0.86 | %** | | | 0.85 | % | | | 0.84 | % | | | 0.81 | % | | | 0.81 | % | | | 0.83 | % |
Net investment income | | | 0.05 | %** | | | 0.31 | % | | | 0.52 | % | | | 0.46 | % | | | 0.52 | % | | | 0.54 | % |
Portfolio turnover rate | | | 11 | % | | | 21 | % | | | 22 | % | | | 19 | % | | | 19 | % | | | 21 | % |
Notes to Financial Highlights
| (a) | | Per share values have been calculated using the average share method. |
| (b) | | Total returns are historical and assume changes in share price, reinvestment of dividends and capital gains distributions and do not include the effect of insurance contract charges. Past performance does not guarantee future results. |
| (c) | | Includes contractual management fee waiver related to the Fund’s investments in the GE Institutional Money Market Fund (the “Money Market Fund”). The fee waiver agreement was terminated effective June 30, 2014 with the closure of the Money Market Fund. |
| * | | Beginning with the year ended December 31, 2016, the Fund was audited by Ernst & Young LLP. The previous years were audited by another independent registered public accounting firm. |
| ** | | Annualized for periods less than one year. |
The accompanying Notes are an integral part of these financial statements.
State Street Premier Growth Equity V.I.S. Fund
Statement of Assets and Liabilities — June 30, 2018 (Unaudited)
| | | | |
| | | | |
Assets | | | | |
Investments in securities, at fair value (cost $21,730,778) | | $ | 34,961,988 | |
Short-term affiliated investments, at fair value | | | 1,370,393 | |
Cash | | | 315 | |
Cash collateral on deposit with broker for future contracts | | | 7,912 | |
Income receivables | | | 12,816 | |
Income receivable from affiliated investments | | | 1,621 | |
Other assets | | | 3 | |
| | | | |
Total assets | | | 36,355,048 | |
| | | | |
| |
Liabilities | | | | |
Payable for fund shares redeemed | | | 12,184 | |
Payable for accumulated variation margin on futures | | | 7,913 | |
Payable to the Adviser | | | 18,811 | |
Payable to the Custodian | | | 5,257 | |
Accrued other expenses | | | 17,054 | |
| | | | |
Total liabilities | | | 61,219 | |
| | | | |
| | | | |
Net Assets | | $ | 36,293,829 | |
| | | | |
| |
Net Assets Consist Of: | | | | |
Capital paid in | | $ | 20,779,054 | |
Undistributed (distributions in excess of) net investment income | | | 8,918 | |
Accumulated net realized gain | | | 2,282,241 | |
Net unrealized appreciation (depreciation) on: | | | | |
Unaffiliated Investments | | | 13,231,210 | |
Futures | | | (7,594 | ) |
| | | | |
Net Assets | | $ | 36,293,829 | |
| | | | |
| | | | |
Shares outstanding ($0.01 par value; unlimited shares authorized) | | | 346,134 | |
Net asset value per share | | $ | 104.85 | |
The accompanying Notes are an integral part of these financial statements.
| | | | |
| Statement of Assets and Liabilities | | | 7 | |
State Street Premier Growth Equity V.I.S. Fund
Statement of Operations — For the period ended June 30, 2018 (Unaudited)
| | | | |
| | | | |
| | | | |
Investment Income | |
Income | |
Dividend | | $ | 158,813 | |
Income from affiliated investments | | | 7,145 | |
| | | | |
Total income | | | 165,958 | |
| | | | |
| |
Expenses | | | | |
Advisory and administration fees | | | 119,018 | |
Directors’ fees | | | 2,769 | |
Custody and accounting expenses | | | 10,871 | |
Professional fees | | | 14,835 | |
Other expenses | | | 9,547 | |
| | | | |
Total expenses | | | 157,040 | |
| | | | |
Net investment income | | $ | 8,918 | |
| | | | |
| |
Net Realized and Unrealized Gain (Loss) on Investments | | | | |
Realized gain (loss) on: | | | | |
Unaffiliated investments | | $ | 2,173,617 | |
Futures | | | 14,068 | |
Increase (decrease) in unrealized appreciation/depreciation on: | |
Unaffiliated investments | | | (161,868 | ) |
Futures | | | (7,423 | ) |
| | | | |
| |
Net realized and unrealized gain (loss) on investments | | | 2,018,394 | |
| | | | |
Net increase in net assets resulting from operations | | $ | 2,027,312 | |
| | | | |
The accompanying Notes are an integral part of these financial statements.
| | |
| 8 | | Statement of Operations |
State Street Premier Growth Equity V.I.S. Fund
Statements of Changes in Net Assets
| | | | | | | | |
| | | Six Months
Ended June 30,
2018* | | | Year Ended December 31,
2017 | |
| | | | | | | | |
Increase (Decrease) in Net Assets | | | | | |
| | |
Operations: | | | | | | | | |
Net investment income | | $ | 8,918 | | | $ | 112,102 | |
Net realized gain (loss) on investments and futures | | | 2,187,685 | | | | 3,745,553 | |
Net increase (decrease) in unrealized appreciation/depreciation on investments and futures | | | (169,291 | ) | | | 4,967,942 | |
| | | | | | | | |
Net increase (decrease) from operations | | | 2,027,312 | | | | 8,825,597 | |
| | | | | | | | |
| |
Distributions to shareholders from: | | | | | |
Net investment income | | | — | | | | (112,086 | ) |
Net realized gains | | | — | | | | (3,610,073 | ) |
| | | | | | | | |
Total distributions | | | — | | | | (3,722,159 | ) |
| | | | | | | | |
Increase (decrease) in assets from operations and distributions | | | 2,027,312 | | | | 5,103,438 | |
| | | | | | | | |
| |
Share transactions: | | | | | |
Proceeds from sale of shares | | | 112,808 | | | | 664,651 | |
Value of distributions reinvested | | | — | | | | 3,722,159 | |
Cost of shares redeemed | | | (2,250,238 | ) | | | (6,305,076 | ) |
| | | | | | | | |
Net increase (decrease) from share transactions | | | (2,137,430 | ) | | | (1,918,266 | ) |
| | | | | | | | |
| | |
Total increase (decrease) in net assets | | | (110,118 | ) | | | 3,185,172 | |
| | |
Net Assets | | | | | | | | |
Beginning of period | | | 36,403,947 | | | | 33,218,775 | |
| | | | | | | | |
| | |
End of period | | $ | 36,293,829 | | | $ | 36,403,947 | |
| | | | | | | | |
| | |
Undistributed (distributions in excess of) net investment income, end of period | | $ | 8,918 | | | $ | — | |
| | |
Changes in Fund Shares | | | | | | | | |
Shares sold | | | 1,098 | | | | 6,781 | |
Issued for distributions reinvested | | | — | | | | 37,435 | |
Shares redeemed | | | (21,844 | ) | | | (63,263 | ) |
| | | | | | | | |
Net decrease in fund shares | | | (20,746 | ) | | | (19,047 | ) |
| | | | | | | | |
The accompanying Notes are an integral part of these financial statements.
| | | | |
| Statements of Changes in Net Assets | | | 9 | |
State Street Premier Growth Equity V.I.S. Fund
Notes to Financial Statements — June 30, 2018 (Unaudited)
| 1. | | Organization of the Company |
State Street Variable Insurance Series Funds, Inc. (the “Company”) was incorporated under the laws of the Commonwealth of Virginia on May 14, 1984 and is registered under the Investment Company Act of 1940, as amended (the “1940 Act”), as an open-end management investment company. The Company is currently composed of the following seven investment portfolios (collectively, the “Funds”): State Street U.S. Equity V.I.S. Fund, State Street S&P 500 Index V.I.S. Fund, State Street Premier Growth Equity V.I.S. Fund (the “Fund”), State Street Small-Cap Equity V.I.S. Fund, State Street Total Return V.I.S. Fund, State Street Income V.I.S. Fund and State Street Real Estate Securities V.I.S. Fund. Each Fund is a diversified investment company within the meaning of the 1940 Act.
Shares of the Funds of the Company are offered only to insurance company separate accounts that fund certain variable life insurance contracts and variable annuity contracts.
The Company currently offers one share class (Class 1) of the Fund as an investment option for variable life insurance and variable annuity contracts.
Under the Company’s organizational documents, its officers and directors are indemnified against certain liabilities arising out of the performance of their duties to the Company. Additionally, in the normal course of business, the Company enters into contracts with service providers that contain general indemnification clauses. The Company’s maximum exposure under these arrangements is unknown as this would involve future claims that may be made against the Company that have not yet occurred.
| 2. | | Summary of Significant Accounting Policies |
The following is a summary of significant accounting policies followed by the Company in the preparation of its financial statements:
The preparation of financial statements in accordance with U.S. generally accepted accounting principles (“U.S. GAAP”) requires management to make estimates and assumptions that affect the reported amounts and disclosures in the financial statements. Actual results could differ from those estimates. The Fund is an investment company under U.S. GAAP and follows the accounting and reporting guidance applicable to investment companies.
Security Valuation The Fund’s investments are valued at fair value each day that the New York Stock Exchange (“NYSE”) is open and, for financial reporting purposes, as of the report date should the reporting period end on a day that the NYSE is not open. Fair value is generally defined as the price a fund would receive to sell an asset or pay to transfer a liability in an orderly transaction between market participants at the measurement date. By its nature, a fair value price is a good faith estimate of the valuation in a current sale and may not reflect an actual market price. The investments of the Fund are valued pursuant to the policy and procedures developed by the Oversight Committee (the “Committee”) and approved by the Company’s Board of Directors (the “Board”). The Committee provides oversight of the valuation of investments for the Fund. The Board has responsibility for determining the fair value of investments.
Valuation techniques used to value the Fund’s investments by major category are as follows:
| | • | | Equity investments (including preferred stocks) traded on a recognized securities exchange for which market quotations are readily available are valued at the last sale price or official closing price, as applicable, on the primary market or exchange on which they trade. Equity investments traded on a recognized exchange for which there were no sales on that day are valued at the last published sale price or at fair value. |
| | • | | Investments in registered investment companies (including money market funds) or other unitized pooled investment vehicles that are not traded on an exchange are valued at that day’s published net asset value (“NAV”) per share or unit. |
| | • | | Exchange-traded futures contracts are valued at the closing settlement price on the primary market on which they are traded most extensively. Exchange-traded futures contracts traded on a recognized exchange for which there were no sales on that day are valued at the last reported sale price obtained from independent pricing services or brokers or at fair value. |
| | |
| 10 | | Notes to Financial Statements |
State Street Premier Growth Equity V.I.S. Fund
Notes to Financial Statements, continued — June 30, 2018 (Unaudited)
In the event prices or quotations are not readily available or that the application of these valuation methods results in a price for an investment that is deemed to be not representative of the fair value of such investment, fair value will be determined in good faith by the Committee, in accordance with the valuation policy and procedures approved by the Board.
The Fund values its assets and liabilities at fair value using a fair value hierarchy consisting of three broad levels that prioritize the inputs to valuation techniques giving the highest priority to readily available unadjusted quoted prices in active markets for identical assets or liabilities (Level 1 measurements) and the lowest priority to unobservable inputs (Level 3 measurements) when market prices are not readily available or reliable. The categorization of a value determined for an investment within the hierarchy is based upon the pricing transparency of the investment and is not necessarily an indication of the risk associated with investing in it.
The three levels of the fair value hierarchy are as follows:
| | • | | Level 1 — Unadjusted quoted prices in active markets for an identical asset or liability; |
| | • | | Level 2 — Inputs other than quoted prices included within Level 1 that are observable for the asset or liability either directly or indirectly, including quoted prices for similar assets or liabilities in active markets, quoted prices for identical or similar assets or liabilities in markets that are not considered to be active, inputs other than quoted prices that are observable for the asset or liability (such as exchange rates, financing terms, interest rates, yield curves, volatilities, prepayment speeds, loss severities, credit risks and default rates) or other market-corroborated inputs; and |
| | • | | Level 3 — Unobservable inputs for the asset or liability, including the Committee’s assumptions used in determining the fair value of investments. |
The value of the Fund’s investments according to the fair value hierarchy as of June 30, 2018 is disclosed in the Fund’s Schedule of Investments.
Changes in valuation techniques may result in transfers in or out of an assigned level within the fair value hierarchy. Transfers between different levels of the fair value hierarchy are recognized at the beginning of the reporting period. The Fund had no material transfers between levels for the six-month period ended June 30, 2018.
Investment Transactions and Income Recognition Investment transactions are accounted for on trade date for financial reporting purposes. Realized gains and losses from the sale or disposition of investments and foreign exchange transactions, if any, are determined using the identified cost method. Dividend income and capital gain distributions, if any, are recognized on the ex-dividend date, net of any foreign taxes withheld at source, if any. Interest income is recorded daily on an accrual basis. All premiums and discounts are amortized/accreted for financial reporting purposes. Non-cash dividends received in the form of stock are recorded as dividend income at fair value.
Expenses Certain expenses, which are directly identifiable to a specific Fund, are applied to the Fund within the Company. Other expenses which cannot be attributed to a specific Fund are allocated in such a manner as deemed equitable, taking into consideration the nature and type of expense and the relative net assets of the Fund within the Company.
Distributions The Fund declares and pays any dividends from net investment income annually. Net realized capital gains, if any, are distributed annually, unless additional distributions are required for compliance with applicable tax regulations. The amount and character of income and capital gains to be distributed are determined in accordance with applicable tax regulations which may differ from net investment income and realized gains recognized for U.S. GAAP purposes.
| 3. | | Derivative Financial Instruments |
Futures Contracts The Fund may enter into futures contracts to meet the Fund’s objectives. A futures contract is a standardized, exchange-traded agreement to buy or sell a financial instrument at a set price on a future date. Upon entering into a futures contract, the Fund is required to deposit with the broker, cash or securities in an amount equal to the minimum initial margin requirements of the clearing house. Subsequent payments are made or received by the Fund equal to the daily change in the contract value and are recorded as variation margin receivable or payable with a corresponding offset to unrealized gains or losses. The Fund recognizes a realized gain or loss when the contract is closed.
| | | | |
| Notes to Financial Statements | | | 11 | |
State Street Premier Growth Equity V.I.S. Fund
Notes to Financial Statements, continued — June 30, 2018 (Unaudited)
Losses may arise if the value of a futures contract decreases due to unfavorable changes in the market rates or values of the underlying instrument during the term of the contract or if the counterparty does not perform under the contract. The use of futures contracts also involves the risk that the movements in the price of the futures contracts do not correlate with the movement of the assets underlying such contracts.
For the six-month period ended June 30, 2018 the Fund entered into futures contracts for cash equitization.
The following tables summarize the value of the Fund’s derivative instruments as of June 30, 2018 and the related location in the accompanying Statement of Assets and Liabilities and Statement of Operations, presented by primary underlying risk exposure:
Liability Derivatives
| | | | | | | | | | | | | | | | | | | | | | | | |
| | | Interest
Rate
Contracts
Risk | | | Foreign
Exchange
Contracts
Risk | | | Credit
Contracts
Risk | | | Equity
Contracts
Risk | | | Commodity
Contracts
Risk | | | Total | |
| | | | | | | | | | | | | | | | | | | | | | | | |
Futures Contracts | | $ | — | | | $ | — | | | $ | — | | | $ | (7,913 | ) | | $ | — | | | $ | (7,913 | ) |
Net Realized Gain (Loss)
| | | | | | | | | | | | | | | | | | | | | | | | |
| | | Interest
Rate
Contracts
Risk | | | Foreign
Exchange
Contracts
Risk | | | Credit
Contracts
Risk | | | Equity
Contracts
Risk | | | Commodity
Contracts
Risk | | | Total | |
| | | | | | | | | | | | | | | | | | | | | | | | |
Futures Contracts | | $ | — | | | $ | — | | | $ | — | | | $ | 14,068 | | | $ | — | | | $ | 14,068 | |
Net Change in Unrealized Appreciation (Depreciation)
| | | | | | | | | | | | | | | | | | | | | | | | |
| | | Interest
Rate
Contracts
Risk | | | Foreign
Exchange
Contracts
Risk | | | Credit
Contracts
Risk | | | Equity
Contracts
Risk | | | Commodity
Contracts
Risk | | | Total | |
| | | | | | | | | | | | | | | | | | | | | | | | |
Futures Contracts | | $ | — | | | $ | — | | | $ | — | | | $ | (7,423 | ) | | $ | — | | | $ | (7,423 | ) |
| 4. | | Fees and Transactions with Affiliates |
Advisory Fee SSGA Funds Management, Inc. (the “Adviser” or “SSGA FM”), a registered investment adviser, was retained by the Board to act as investment adviser and administrator of the Fund. SSGA FM’s compensation for investment advisory and administrative services (“Management Fee”) is paid monthly based on the average daily net assets of the Fund at an annualized rate of 0.25%.
Administrator, Sub-Administrator and Custodian Fees State Street Bank and Trust Company (“State Street”) serves as the sub-administrator and custodian to the Funds. Amounts paid by the Fund to State Street for performing such services are included in advisory and administration and custody and accounting expenses, respectively.
Due to Custodian In certain circumstances, the Funds may have cash overdraft with the custodian. The Due to Custodian amount, if any, reflects cash overdrawn with State Street as custodian who is an affiliate of the Funds.
The fees and expenses of the Company’s directors who are not “interested persons” of the Company, as defined in the 1940 Act (“Independent Directors”) are paid directly by the Fund. The Independent Directors are reimbursed for travel and other out-of-pocket expenses in connection with meeting attendance and industry seminars.
| | |
| 12 | | Notes to Financial Statements |
State Street Premier Growth Equity V.I.S. Fund
Notes to Financial Statements, continued — June 30, 2018 (Unaudited)
| 6. | | Investment Transactions |
Purchases and sales of investments (excluding in-kind transactions, short term investments and derivative contracts) for the six-month period ended June 30, 2018 were as follows:
| | | | | | | | |
| Non-U.S. Government Securities |
| Purchases | | Sales |
| | | | | | | | | |
| | $ | 3,965,813 | | | | $ | 6,320,621 | |
The Fund has qualified and intends to continue to qualify as a regulated investment company under Subchapter M of the Internal Revenue Code of 1986, as amended. The Fund will not be subject to federal income taxes to the extent it distributes its taxable income, including any net realized capital gains, for each fiscal year. Therefore, no provision for federal income tax is required.
The Fund files federal and various state and local tax returns as required. No income tax returns are currently under examination. Generally, the federal returns are subject to examination by the Internal Revenue Service for a period of three years from date of filing, while the state returns may remain open for an additional year depending upon jurisdiction. SSGA FM has analyzed the Fund’s tax positions taken on tax returns for all open years and does not believe there are any uncertain tax positions that would require recognition of a tax liability.
Distributions to shareholders are recorded on ex-dividend date. Income dividends and gain distributions are determined in accordance with income tax rules and regulations, which may differ from generally accepted accounting principles.
As of June 30, 2018, gross unrealized appreciation and gross unrealized depreciation of investments and other financial instruments based on cost for federal income tax purposes were as follows:
| | | | | | | | | | | | | | | | | | |
Tax
Cost | | Gross
Unrealized
Appreciation | | Gross
Unrealized
Depreciation | | Net Unrealized
Appreciation
(Depreciation) |
| | | | | | | | | | | | | | | | | | | |
| | $ | 23,321,450 | | | | $ | 13,553,539 | | | | $ | 550,202 | | | | $ | 13,003,337 | |
The Fund and other affiliated funds (each, a “Participant” and collectively, the “Participants”) participate in a $500 million revolving credit facility provided by a syndication of banks under which the Participants may borrow to fund shareholder redemptions. This agreement expires in October 2018 unless otherwise extended or renewed.
The Participants are charged an annual commitment fee which is calculated based on the unused portion of the shared credit line. Commitment fees are allocated among each of the Participants based on relative net assets. Commitment fees are ordinary fund operating expenses paid by the Adviser. A Participant incurs and pays the interest expense related to its borrowing. Interest is calculated at a rate per annum equal to the sum of 1% plus the greater of the New York Fed Bank Rate and 1-month LIBOR rate.
The Fund had no outstanding loans as of June 30, 2018.
Concentration Risk As a result of the Fund’s ability to invest a large percentage of its assets in obligations of issuers within the same country, state, region, currency or economic sector, an adverse economic, business or political development may affect the value of the Fund’s investments more than if the Fund were more broadly diversified.
Market and Credit Risk In the normal course of business, the Fund trades financial instruments and enters into financial transactions where risk of potential loss exists due to changes in the general economic conditions and fluctuations of the market (market risk). Additionally, the Fund may also be exposed to credit risk in the event that an issuer or guarantor fails to perform or that an institution or entity with which the Fund has unsettled or open transactions defaults.
| | | | |
| Notes to Financial Statements | | | 13 | |
State Street Premier Growth Equity V.I.S. Fund
Notes to Financial Statements, continued — June 30, 2018 (Unaudited)
Management has evaluated the impact of all subsequent events on the Fund through the date on which the financial statements were available to be issued and has determined that there were no subsequent events requiring adjustment or disclosure in the financial statements.
| | |
| 14 | | Notes to Financial Statements |
State Street Premier Growth Equity V.I.S. Fund
Other Information (Unaudited)
Proxy Voting Policies and Procedures and Record
The Fund has adopted the proxy voting policies of SSGA FM. A description of the policies and procedures that the Fund has adopted to determine how to vote proxies relating to portfolio securities is available (i) without charge, upon request, by calling 1-800-242-0134, (ii) on the Fund’s website at http://www.ssga.com/geam, (iii) on the SEC’s website at www.sec.gov, and (iv) at the SEC’s public reference room. Information on the operation of the public reference room may be obtained by calling 1-800-SEC-0330. Information regarding how the Fund voted proxies, if any, during the most recent 12-month period ended June 30 is available by August 31 of each year without charge (1) by calling 1-800-242-0134 (toll free), and (2) on the website of the SEC at www.sec.gov.
Quarterly Portfolio Schedule
The Fund files its complete schedule of investments with the SEC for the first and third quarters of each fiscal year on Form N-Q. The Fund’s Forms N-Q are available (i) without charge, upon request, by calling 1-800-242-013, (ii) on the Fund’s website at http://www.ssga.com/geam, (iii) on the SEC’s website at www.sec.gov, and (iv) at the SEC’s public reference room. Information on the operation of the public reference room may be obtained by calling 1-800-SEC-0330.
State Street Premier Growth Equity V.I.S. Fund
Other Information (Unaudited), continued
Disclosure for the Board of Directors’ Consideration of the Renewal of the Investment Advisory and Administration Agreement with SSGA Funds Management, Inc. on behalf of the State Street Premier Growth Equity V.I.S. Fund
At meetings of the Board of Directors (the “Board”) of State Street Variable Insurance Series Funds, Inc. (the “V.I.S. Funds”) held on May 16, 2018 and June 5, 2018 (the “Board Meetings”), the Board members, including the Board members who are not “interested persons” (as defined in the Investment Company Act of 1940, as amended (the “1940 Act”)) of the V.I.S. Funds (“Independent Board Members”), considered and unanimously approved the continuance for an additional year of the investment advisory and administration agreement (the “Investment Advisory and Administration Agreement”) between SSGA Funds Management, Inc. (“SSGA FM” or the “Adviser”) and the V.I.S. Funds on behalf of each of its series portfolios, including the State Street Premier Growth Equity V.I.S. Fund (the “Fund”).
In considering whether to approve the continuance for an additional year of the Investment Advisory and Administration Agreement, the Board members considered and discussed a substantial amount of information and analysis provided, at the Board’s request, by the Adviser. The Board members also considered detailed information regarding performance and expenses of other investment companies, including those with similar investment strategies and sizes, which was prepared by an independent third party provider, Broadridge Financial Solutions, Inc. (“Broadridge”). The Board members reviewed the fees charged by the Adviser for other mutual funds and investment products other than mutual funds that employ a similar investment strategy as the Fund. The Board had the opportunity to ask questions and request additional information in connection with its considerations.
Before approving the continuance of the Investment Advisory and Administration Agreement, the Independent Board Members reviewed the information provided with management of the Adviser and with their independent legal counsel. The Board also reviewed a memorandum prepared by independent legal counsel discussing the legal standards for the consideration of the proposed continuance. The Independent Board Members discussed the proposed continuance of the Investment Advisory and Administration Agreement in detail during private sessions in advance of, and at, the Board Meetings with their independent legal counsel at which no representatives of the Adviser were present. The Independent Board Members and their independent legal counsel requested, and received and considered, additional information from the Adviser following the May 16, 2018 Board Meeting and prior to the June 5, 2018 Board Meeting.
In advance of the Board Meetings, and in response to their detailed requests, the Board members received from the Adviser written responses to their inquiries, which included substantial exhibits and other materials related to the Adviser’s business and the services it provides to the Fund. The Directors took into account their multi-year experience as Directors and particularly their previous consideration of these types of agreements.
During the Board Meetings, the Board members had an opportunity to discuss this information with SSGA FM representatives, including senior executives, representatives from the legal, compliance and finance departments, and investment personnel. The Board members posed questions to these representatives and engaged in significant discussions.
In reaching its determinations relating to the continuance of the Investment Advisory and Administration Agreement, the Board considered those factors it deemed relevant, including the factors discussed below. In its deliberations, the Board did not identify any single factor that was dispositive and each Director may have attributed different weights to the various factors. The Directors evaluated the information provided to them, as well as the presentations and discussions that occurred at the Board Meetings, for the Fund, and their determinations were made separately in respect of the Fund from other series portfolios of the V.I.S Funds.
The material factors and conclusions that formed the basis for the Board’s determinations to approve the continuance of the Investment Advisory and Administration Agreement with the Adviser on behalf of the Fund are as discussed below.
The Nature, Extent and Quality of Services Provided.
The Board reviewed the services provided to the Fund by the Adviser. The Board considered the Adviser’s management capabilities and investment process with respect to the types of investments held by the Fund, including the education, experience and number of investment professionals and other personnel who provide portfolio management, investment research, and similar services to the Fund. The Board evaluated, where relevant, the abilities and experience of such investment personnel in analyzing particular markets, industries and specific issuers of securities in these markets and industries. The Board also considered the substantial expertise of the Adviser in developing and applying proprietary quantitative models for managing the Fund. The Board
State Street Premier Growth Equity V.I.S. Fund
Other Information (Unaudited), continued
considered the extensive experience and resources committed by the Adviser to risk management, including with respect to investment risk, liquidity risk, operational risk, counterparty risk and model risk. The Board also considered the significant risks assumed by the Adviser in connection with the services provided to the Fund, including operational, enterprise, regulatory, litigation and compliance risks. The Board also took into account the compensation paid to recruit and retain investment personnel, and the time and attention devoted to the Fund by senior management.
The Board had previously reviewed the compliance programs of SSGA FM and various affiliated service providers (“Affiliated Service Providers”). Among other things, the Board considered compliance and reporting matters relating to personal trading by investment personnel, selective disclosure of portfolio holdings, late trading, frequent trading, portfolio valuation, business continuity, the allocation of investment opportunities and the voting of proxies.
In light of the foregoing and other relevant information, the Board, including the Independent Board Members, concluded that the services provided by the Adviser continue to be satisfactory.
Investment Performance.
The Board members considered the investment performance of the Fund for various periods. The Board members reviewed detailed comparisons of the performance of the Fund with the relevant securities indices and peer and category groupings of mutual funds prepared by Broadridge with respect to various periods. The Board members also engaged in detailed discussions with SSGA FM management about its investment processes and performance results. These discussions focused on the Fund’s investment objective, the number and experience of portfolio management and supporting research personnel, the Fund’s investment style and approach employed, the likely market cycles for the Fund’s investment style and the Fund’s relative underperformance in recent periods but strong performance over the longer term.
Taking these factors into consideration, the Board, including the Independent Board Members, concluded that the Fund’s performance was acceptable overall.
Cost of the Services Provided And Profits Realized From The Relationship with the Fund.
The Directors considered the management fees paid to the Adviser by the Fund. The Board reviewed the level of profits realized by the Adviser and the Affiliated Service Providers in providing investment advisory and other services to the Fund. Information also was presented regarding the financial condition of the Adviser for various past periods. The Directors also considered the Adviser’s statements concerning its significant investment in supporting registered investment companies. The Board also considered the various risks borne by SSGA FM and the Affiliated Service Providers in connection with their various roles in servicing the Fund, including enterprise, litigation, business, operational and entrepreneurial risk.
The Board concluded that the profitability of the Adviser with respect to the Fund, and the profitability range of each of the Affiliated Service Providers with respect to its services to the Fund, were reasonable in relation to the services provided.
The Extent to Which Economies of Scale Would Be Realized as the Fund Grows and Whether Fee Levels Would Reflect Such Economies of Scale.
The Board considered the extent to which the Adviser and the Affiliated Service Providers, on the one hand, and the Fund, on the other hand, can expect to realize benefits from economies of scale as the assets of the Fund increase. The Board acknowledged the difficulty in accurately measuring the benefits resulting from the economies of scale with respect to the management of the Fund. The Board concluded that, in light of, among other considerations, the current size of the Fund, the level of profitability of the Adviser and the Affiliated Service Providers with respect to the Fund, and/or the comparative management fee and expense ratio of the Fund, it does not appear that the Adviser or the Affiliated Service Providers has realized benefits from economies of scale in managing the assets of the Fund to such an extent that previously agreed management fees should be reduced or that breakpoints in such fees should be implemented for the Fund at this time.
Comparison of Services to be Rendered and Fees to be Paid.
The Board discussed the services provided to the Fund by the Adviser, and the fees charged to the Fund for those services. As part of its review, the Board considered the Fund’s management fee and total expense ratio, including the portion attributable to administrative services provided by SSGA FM, as compared to the expense ratios of a group of comparable mutual funds selected
State Street Premier Growth Equity V.I.S. Fund
Other Information (Unaudited), continued
by Broadridge, and the related Broadridge analysis for the Fund. The Board also considered the comparability of the fees charged and the services provided to the Fund by the Adviser to the fees charged and services provided to other clients of the Adviser. Among other information, the Board considered that the Fund’s advisory fee and expense ratios generally were within the applicable Broadridge peer group ranges.
In light of the foregoing, the Board, including the Independent Board Members, determined that the management fees, considered in relation to the services provided to the Fund, supported the Board’s approval of the continuance of the Investment Advisory and Administration Agreement.
Fall-Out Benefits.
The Board considered actual and potential financial benefits that the Adviser could derive from its relationship with the Fund, including the custody, fund accounting and sub-administration services being provided to the Fund by affiliates of the Adviser and, to the extent applicable, soft dollar commission benefits generated through Fund portfolio transactions. The Board noted, however, that the Fund benefits from the vast array of resources available through SSGA FM, and that the Fund represents only a small portion of the assets managed by SSGA FM.
Conclusion.
No single factor was determinative to the Board’s decision. Based on their discussion and such other matters as were deemed relevant, the Directors, including the Independent Board Members, approved the continuance the Investment Advisory and Administration Agreement for the Fund.
Directors
John R. Costantino, Chairman
R. Sheldon Johnson
Donna M. Rapaccioli
Jeanne M. La Porta
Officers
Jeanne M. La Porta, President
Arthur Jensen, Treasurer
Brian Harris, Chief Compliance Officer and Anti-Money Laundering Officer
Bruce S. Rosenberg, Assistant Treasurer
Ann M. Carpenter, Assistant Treasurer
Chad C. Hallett, Assistant Treasurer
Darlene Anderson-Vasquez, Assistant Treasurer
Daniel G. Plourde, Assistant Treasurer
Jesse Hallee, Secretary
Investment Adviser and Administrator
SSGA Funds Management, Inc.
1600 Summer Street
P.O. Box 7900
Stamford, CT 06904-7900
Custodian and Sub-Administrator
State Street Bank and Trust Company
One Lincoln Street
Boston, Massachusetts 02111
Distributor
State Street Global Advisors Funds Distributors, LLC
One Iron Street
Boston, MA 02210
Independent Registered Public Accounting Firm
Ernst & Young LLP
200 Clarendon Street
Boston, Massachusetts 02116
Semi-Annual Report
June 30, 2018
State Street Income V.I.S. Fund

State Street Income V.I.S. Fund
Semi-Annual Report
June 30, 2018 (Unaudited)
Table of Contents
This report is prepared for Policyholders of certain variable contracts and may be distributed to others only if preceded or accompanied by the variable contract’s current prospectus and the current summary prospectus of the Fund available for investments thereunder.
State Street Income V.I.S. Fund
Fund Information — June 30, 2018 (Unaudited)
Total return performance shown in this report for the Fund takes into account changes in share price and assumes reinvestment of dividends and capital gains distributions, if any. Total returns shown are net of Fund fees and expenses but do not reflect fees and charges associated with the variable contracts such as administrative fees, account charges and surrender charges, which, if reflected, would reduce the Fund’s total returns for all periods shown.
The performance data quoted represents past performance; past performance does not guarantee future results. Investment return and principal value will fluctuate so your shares, when redeemed, may be worth more or less than their original cost. Current performance may be higher or lower than the performance data quoted. Periods less than one year are not annualized. Please call toll-free (800) 242-0134 or visit the Fund’s website at http://www.ssga.com/geam for the most recent month-end performance data.
An investment in the Fund is not a deposit of any bank and is not insured or guaranteed by the Federal Deposit Insurance Corporation (“FDIC”) or any other government agency. An investment in the Fund is subject to risk, including possible loss of principal invested.
Sector Allocation
Portfolio Composition as a % of Fair Value of $20,196 (in thousands) as of June 30, 2018 (a)(b)
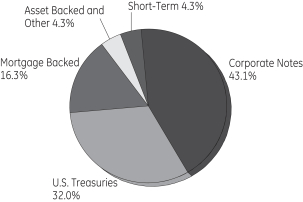
Quality Ratings
as of June 30, 2018 as a % of Fair Value (a)(b)
| | | | |
Moody’s / S&P /Rating* | | Percentage of
Fair Value | |
Aaa / AAA | | | 14.30 | % |
Aa / AA | | | 47.66 | % |
A / A | | | 8.36 | % |
Baa / BBB | | | 20.29 | % |
Ba / BB and lower | | | 8.77 | % |
NR / Other | | | 0.62 | % |
| | | | |
| | | 100.00 | % |
| | | | |
| (a) | Fair Value basis is inclusive of short-term investment in State Street Institutional U.S. Government Money Market Fund – Class G Shares. |
| (b) | The securities information regarding holdings, allocations and other characteristics is presented to illustrate examples of securities that the Fund has bought and the diversity of areas in which the Fund may invest as of a particular date. It may not be representative of the Fund’s current or future investments and should not be construed as a recommendation to purchase or sell a particular security. |
| * | Moody’s Investor Services, Inc. (“Moody’s”) and S&P Global Ratings (“S&P”) are nationally recognized statistical rating organizations. The quality ratings represent the lower of Moody’s or S&P credit ratings. When a rating from only one of the rating agencies is available, that rating is used. Securities not rated by Moody’s or S&P are categorized as not rated. Credit quality measures a bond issuer’s ability to repay interest and principal in a timely manner. Credit quality ratings assigned by a rating agency are subject to change periodically and are not absolute standards of quality. In formulating investment decisions for the Fund, SSGA Funds Management, Inc. develops its own analysis of the credit quality and risks associated with individual debt instruments, rather than relying exclusively on rating agency ratings. |
State Street Global Advisors Funds Distributors, LLC, member of FINRA & SIPC is the principal underwriter and distributor of the State Street V.I.S. Funds and an indirect wholly-owned subsidiary of State Street Corporation. References to State Street may include State Street Corporation and its affiliates. The Funds pay State Street Bank and Trust Company for its services as custodian and Fund Accounting agent, and pay SSGA Funds Management, Inc. for investment advisory and administrative services.
| | | | |
| State Street Income V.I.S. Fund | | | 1 | |
State Street Income V.I.S. Fund
Understanding Your Fund’s Expenses — June 30, 2018 (Unaudited)
As a shareholder of the Fund, you incur ongoing costs. Ongoing costs include portfolio management fees, professional fees, administrative fees and other Fund expenses. The following example is intended to help you understand your ongoing costs (in dollars) of investing in the Fund and to compare these costs with the ongoing costs of investing in other mutual funds.
To illustrate these ongoing costs, we have provided an example and calculated the expenses paid by investors in the Fund during the period. The information in the following table is based on an investment of $1,000, which is invested at the beginning of the period and held for the entire six-month period ended June 30, 2018.
Actual Expenses
The first section of the table provides information about actual account values and actual expenses. You may use the information in this section, together with the amount you invested, to estimate the expenses that you paid over the period. To do so, simply divide your account value by $1,000 (for example, an $8,600 account value divided by $1,000 = 8.6), then multiply the result by the number given under the heading “Expenses paid during the period” to estimate the expenses you paid on your account during the period.
Hypothetical Example for Comparison Purposes
The second section of the table provides information about hypothetical account values and hypothetical expenses based on the Fund’s actual expense ratio and an assumed rate of return of 5% per year before expenses, which is not the Fund’s actual return. The hypothetical account values and expenses may not be used to estimate the actual ending account balance or expenses you paid for the period. You may use this information to compare the ongoing costs of investing in the Fund and other funds. To do so, compare this 5% hypothetical example with the 5% hypothetical examples that appear in the shareholder reports of other funds.
Please note that the expenses shown in the table are meant to highlight and help you compare ongoing costs only and do not reflect transaction costs, such as sales charges or redemption fees, if any. Therefore, the second section of the table is useful in comparing ongoing costs only, and will not help you determine the relative total costs of owning different funds. Additionally, the expenses shown do not reflect the fees or charges associated with variable contracts through which shares of the Fund are offered.
| | | | | | | | |
| | | Actual
Fund Return | | | Hypothetical
5% Return
(2.5% for
the period) | |
Actual Fund Return | | | | | | | | |
Beginning Account value January 1, 2018 | | $ | 1,000.00 | | | $ | 1,000.00 | |
Ending Account value June 30, 2018 | | $ | 974.80 | | | $ | 1,017.60 | |
Expenses Paid During Period* | | $ | 7.10 | | | $ | 7.25 | |
| * | Expenses are equal to the Fund’s annualized expense ratio of 1.45% (for the period January 1, 2018-June 30, 2018), multiplied by the average account value over the period, multiplied by 181/365 (to reflect the one-half year period). |
| | |
| 2 | | State Street Income V.I.S. Fund |
State Street Income V.I.S. Fund
Schedule of Investments — June 30, 2018 (Unaudited)
| | | | | | | | |
| | | Principal
Amount $ | | | Fair Value $ | |
| | | | | | | | |
| Bonds and Notes - 97.6%† | |
U.S. Treasuries - 32.6% | |
U.S. Treasury Bonds | |
2.75% 11/15/42 | | | 55,000 | | | | 52,861 | |
3.13% 05/15/48 | | | 409,000 | | | | 420,428 | |
3.75% 11/15/43 (a) | | | 149,000 | | | | 169,331 | |
4.50% 02/15/36 (a) | | | 210,400 | | | | 257,290 | |
U.S. Treasury Notes | |
1.38% 12/15/19 (a) | | | 726,400 | | | | 715,061 | |
1.50% 11/30/19 - 02/28/23 | | | 1,542,000 | | | | 1,503,866 | |
1.50% 08/15/20 (a) | | | 567,000 | | | | 554,730 | |
2.25% 03/31/20 - 11/15/25 | | | 2,380,400 | | | | 2,355,573 | |
2.88% 05/15/28 | | | 427,900 | | | | 428,833 | |
| | | | | | | | |
| | | | | | | 6,457,973 | |
| | | | | | | | |
|
| Agency Mortgage Backed - 12.5% | |
Federal Home Loan Mortgage Corp. | |
4.50% 06/01/33 - 02/01/35 (a) | | | 4,270 | | | | 4,466 | |
5.00% 07/01/35 - 06/01/41 (a) | | | 133,844 | | | | 142,229 | |
5.50% 05/01/20 - 01/01/38 (a) | | | 48,079 | | | | 51,491 | |
6.00% 07/01/19 - 11/01/37 (a) | | | 125,861 | | | | 137,348 | |
6.50% 02/01/29 (a) | | | 62 | | | | 69 | |
6.93% 06/01/26 (a)(b) | | | 60,000 | | | | 76,107 | |
7.00% 06/01/29 - 08/01/36 (a) | | | 26,795 | | | | 28,975 | |
7.50% 01/01/30 - 09/01/33 (a) | | | 4,226 | | | | 4,420 | |
8.00% 11/01/30 (a) | | | 5,150 | | | | 5,649 | |
8.50% 04/01/30 (a) | | | 5,922 | | | | 6,945 | |
Federal National Mortgage Assoc. | |
3.50% 11/01/42 - 08/01/45 (a) | | | 68,705 | | | | 68,865 | |
4.00% 05/01/19 - 03/01/41 (a) | | | 165,905 | | | | 170,584 | |
4.50% 05/01/19 - 01/01/41 (a) | | | 308,988 | | | | 324,417 | |
5.00% 03/01/34 - 08/01/35 (a) | | | 53,083 | | | | 56,726 | |
5.50% 06/01/20 - 01/01/39 (a) | | | 178,428 | | | | 192,131 | |
6.00% 10/01/19 - 07/01/35 (a) | | | 186,255 | | | | 202,733 | |
6.50% 01/01/19 - 08/01/34 (a) | | | 27,783 | | | | 30,547 | |
7.00% 01/01/30 - 02/01/34 (a) | | | 7,976 | | | | 8,416 | |
7.50% 11/01/22 - 12/01/33 (a) | | | 21,048 | | | | 22,041 | |
8.00% 08/01/25 - 10/01/31 (a) | | | 9,469 | | | | 10,223 | |
9.00% 12/01/22 (a) | | | 344 | | | | 362 | |
Federal National Mortgage Assoc.
1.60% + 12 month USD LIBOR
3.97% 04/01/37 (a)(c) | | | 955 | | | | 975 | |
Federal National Mortgage Assoc. TBA
3.00% TBA (d) | | | 218,232 | | | | 216,951 | |
3.50% TBA (d) | | | 249,084 | | | | 252,061 | |
Government National Mortgage Assoc.
4.00% 01/20/41 - 04/20/43 (a) | | | 148,763 | | | | 153,793 | |
4.50% 08/15/33 - 03/20/41 (a) | | | 110,217 | | | | 115,719 | |
6.00% 04/15/27 - 04/15/34 (a) | | | 90,859 | | | | 100,133 | |
6.50% 04/15/19 - 08/15/34 (a) | | | 42,859 | | | | 47,212 | |
7.00% 01/15/28 - 10/15/36 (a) | | | 29,132 | | | | 30,711 | |
| | | | | | | | |
| | | Principal
Amount $ | | | Fair Value $ | |
7.50% 11/15/31 (a) | | | 238 | | | | 239 | |
9.00% 12/15/21 (a) | | | 176 | | | | 185 | |
Government National Mortgage Assoc.
1.50% + 1 year CMT
3.13% 12/20/24 (a)(c) | | | 892 | | | | 902 | |
3.38% 02/20/23 - 02/20/26 (a)(c) | | | 2,710 | | | | 2,742 | |
| | | | | | | | |
| | | | | | | 2,466,367 | |
| | | | | | | | |
|
| Agency Collateralized Mortgage Obligations - 0.4% | |
Federal Home Loan Mortgage Corp.
0.08% 09/25/43 (a)(c)(e) | | | 475,243 | | | | 1,105 | |
Federal Home Loan Mortgage Corp. REMIC
3.50% 09/15/29 - 11/15/30 (a)(e) | | | 54,422 | | | | 4,207 | |
5.50% 06/15/33 (a)(e) | | | 21,911 | | | | 4,306 | |
7.50% 07/15/27 (a)(e) | | | 2,082 | | | | 300 | |
Federal Home Loan Mortgage Corp. REMIC
6.60% - 1 month USD LIBOR
4.53% 08/15/25 (a)(c)(e) | | | 25,077 | | | | 1,501 | |
Federal Home Loan Mortgage Corp. STRIPS
1.47% 08/01/27 (f)(g) | | | 256 | | | | 232 | |
8.00% 02/01/23 (e) | | | 282 | | | | 37 | |
8.00% 07/01/24 (a)(e) | | | 504 | | | | 78 | |
Federal National Mortgage Assoc. REMIC
0.51% 12/25/22 (a)(f)(g) | | | 18 | | | | 18 | |
1.16% 12/25/42 (a)(c)(e) | | | 26,273 | | | | 1,013 | |
5.00% 09/25/40 (a)(e) | | | 24,242 | | | | 2,552 | |
7.00% 09/25/20 (a) | | | 73 | | | | 75 | |
8.00% 05/25/22 (a)(e) | | | 1 | | | | 9 | |
Federal National Mortgage Assoc. REMIC
6.00% - 1 month USD LIBOR
3.91% 07/25/38 (a)(c)(e) | | | 7,760 | | | | 774 | |
Federal National Mortgage Assoc. REMIC
6.20% - 1 month USD LIBOR
4.11% 06/25/48 (c)(e) | | | 171,170 | | | | 26,269 | |
Federal National Mortgage Assoc. STRIPS
1.87% 12/25/34 (a)(f)(g) | | | 18,381 | | | | 15,473 | |
4.50% 08/25/35 - 01/25/36 (a)(e) | | | 23,046 | | | | 4,142 | |
5.00% 03/25/38 - 05/25/38 (a)(e) | | | 13,012 | | | | 2,640 | |
5.50% 12/25/33 (a)(e) | | | 5,556 | | | | 1,259 | |
6.00% 01/25/35 (a)(e) | | | 9,153 | | | | 1,774 | |
7.50% 11/25/23 (a)(e) | | | 3,700 | | | | 498 | |
8.00% 08/25/23 - 07/25/24 (a)(e) | | | 1,561 | | | | 266 | |
8.50% 07/25/22 (a)(e) | | | 23 | | | | 2 | |
9.00% 05/25/22 (a)(e) | | | 22 | | | | 2 | |
See Notes to Schedule of Investments and Notes to Financial Statements.
| | | | |
| State Street Income V.I.S. Fund | | | 3 | |
State Street Income V.I.S. Fund
Schedule of Investments, continued — June 30, 2018 (Unaudited)
| | | | | | | | |
| | | Principal
Amount $ | | | Fair Value $ | |
| | | | | | | | |
Government National Mortgage Assoc. REMIC
4.50% 08/16/39 (a)(e) | | | 16,891 | | | | 1,420 | |
5.00% 09/20/38 (a)(e) | | | 6,197 | | | | 179 | |
Government National Mortgage Assoc. REMIC
6.80% - 1 month USD LIBOR
4.71% 01/16/40 (a)(c)(e) | | | 26,269 | | | | 4,298 | |
| | | | | | | | |
| | | | | | | 74,429 | |
| | | | | | | | |
|
| Asset Backed - 2.2% | |
American Express Credit Account Master Trust 2017-6
2.04% 05/15/23 (a) | | | 124,437 | | | | 121,943 | |
BA Credit Card Trust 2017-A2
1.84% 01/17/23 (a) | | | 74,000 | | | | 72,393 | |
BA Credit Card Trust 2018-A1
2.70% 07/17/23 | | | 44,000 | | | | 43,715 | |
Citibank Credit Card Issuance Trust 2016-A1
1.75% 11/19/21 (a) | | | 200,000 | | | | 197,058 | |
| | | | | | | | |
| | | | | | | 435,109 | |
| | | | | | | | |
|
| Corporate Notes - 44.0% | |
21st Century Fox America Inc.
3.38% 11/15/26 (a) | | | 7,000 | | | | 6,708 | |
4.50% 02/15/21 (a) | | | 7,000 | | | | 7,196 | |
4.75% 11/15/46 (a) | | | 4,000 | | | | 4,138 | |
6.65% 11/15/37 (a) | | | 10,000 | | | | 12,385 | |
Abbott Laboratories
2.90% 11/30/21 (a) | | | 15,000 | | | | 14,765 | |
3.75% 11/30/26 (a) | | | 18,000 | | | | 17,684 | |
4.90% 11/30/46 (a) | | | 8,000 | | | | 8,612 | |
AbbVie Inc.
2.00% 11/06/18 (a) | | | 23,000 | | | | 22,947 | |
3.20% 05/14/26 (a) | | | 8,000 | | | | 7,476 | |
4.45% 05/14/46 (a) | | | 8,000 | | | | 7,647 | |
Acadia Healthcare Company Inc.
6.50% 03/01/24 (a) | | | 17,000 | | | | 17,382 | |
Activision Blizzard Inc.
2.30% 09/15/21 (a) | | | 37,000 | | | | 35,760 | |
AES Corp.
4.88% 05/15/23 (a) | | | 31,000 | | | | 30,922 | |
Aetna Inc.
3.50% 11/15/24 (a) | | | 16,000 | | | | 15,549 | |
Aflac Inc.
4.00% 10/15/46 (a) | | | 5,000 | | | | 4,699 | |
Alexandria Real Estate Equities Inc.
4.70% 07/01/30 (a) | | | 7,000 | | | | 7,075 | |
| | | | | | | | |
| | | Principal
Amount $ | | | Fair Value $ | |
Alimentation Couche-Tard Inc.
2.70% 07/26/22 (a)(h) | | | 10,000 | | | | 9,621 | |
3.55% 07/26/27 (a)(h) | | | 10,000 | | | | 9,458 | |
4.50% 07/26/47 (a)(h) | | | 6,000 | | | | 5,646 | |
Allergan Finance LLC
3.25% 10/01/22 (a) | | | 12,000 | | | | 11,662 | |
Allergan Funding SCS
3.00% 03/12/20 (a) | | | 24,000 | | | | 23,882 | |
3.45% 03/15/22 (a) | | | 12,000 | | | | 11,811 | |
4.55% 03/15/35 (a) | | | 7,000 | | | | 6,646 | |
4.75% 03/15/45 (a) | | | 5,000 | | | | 4,773 | |
Allergan Sales LLC
5.00% 12/15/21 (a)(h) | | | 24,000 | | | | 24,832 | |
Altria Group Inc.
2.95% 05/02/23 (a) | | | 11,000 | | | | 10,693 | |
4.50% 05/02/43 (a) | | | 3,000 | | | | 2,888 | |
Amazon.com Inc. | | | | | | | | |
2.80% 08/22/24 (a) | | | 9,000 | | | | 8,674 | |
3.15% 08/22/27 (a) | | | 8,000 | | | | 7,674 | |
3.88% 08/22/37 (a) | | | 6,000 | | | | 5,863 | |
4.05% 08/22/47 (a) | | | 7,000 | | | | 6,826 | |
4.25% 08/22/57 (a) | | | 7,000 | | | | 6,898 | |
Ameren Corp.
3.65% 02/15/26 | | | 7,000 | | | | 6,798 | |
American Axle & Manufacturing Inc.
6.25% 04/01/25 (a) | | | 16,000 | | | | 15,800 | |
American Campus Communities Operating Partnership LP
4.13% 07/01/24 (a) | | | 8,000 | | | | 7,965 | |
American Express Credit Corp.
2.25% 05/05/21 (a) | | | 17,000 | | | | 16,545 | |
American International Group Inc. | | | | | | | | |
4.50% 07/16/44 (a) | | | 13,000 | | | | 12,123 | |
6.40% 12/15/20 (a) | | | 7,000 | | | | 7,502 | |
American International Group Inc. (5.75% fixed rate until 04/01/28; 2.87% + 3 month USD LIBOR thereafter)
5.75% 04/01/48 (a)(c) | | | 10,000 | | | | 9,810 | |
American Tower Corp. (REIT)
| | | | | | | | |
3.38% 10/15/26 (a) | | | 9,000 | | | | 8,355 | |
3.40% 02/15/19 (a) | | | 36,000 | | | | 36,106 | |
American Water Capital Corp.
2.95% 09/01/27 (a) | | | 12,000 | | | | 11,278 | |
Amgen Inc. | | | | | | | | |
2.20% 05/22/19 (a) | | | 38,000 | | | | 37,791 | |
2.65% 05/11/22 (a) | | | 15,000 | | | | 14,550 | |
3.20% 11/02/27 (a) | | | 11,000 | | | | 10,300 | |
4.56% 06/15/48 (a) | | | 8,000 | | | | 7,836 | |
AMN Healthcare Inc.
5.13% 10/01/24 (a)(h) | | | 23,000 | | | | 22,310 | |
See Notes to Schedule of Investments and Notes to Financial Statements.
| | |
| 4 | | State Street Income V.I.S. Fund |
State Street Income V.I.S. Fund
Schedule of Investments, continued — June 30, 2018 (Unaudited)
| | | | | | | | |
| | | Principal
Amount $ | | | Fair Value $ | |
| | | | | | | | |
Anadarko Petroleum Corp. | | | | | | | | |
4.85% 03/15/21 (a) | | | 3,000 | | | | 3,092 | |
6.20% 03/15/40 (a) | | | 9,000 | | | | 10,130 | |
6.60% 03/15/46 (a) | | | 3,000 | | | | 3,615 | |
Andeavor Logistics LP/Tesoro Logistics Finance Corp. | | | | | | | | |
5.20% 12/01/47 (a) | | | 5,000 | | | | 4,851 | |
5.25% 01/15/25 (a) | | | 66,000 | | | | 67,597 | |
5.50% 10/15/19 (a) | | | 24,000 | | | | 24,540 | |
6.25% 10/15/22 (a) | | | 16,000 | | | | 16,570 | |
Anheuser-Busch InBev Finance Inc. 3.65% 02/01/26 (a) | | | 4,000 | | | | 3,917 | |
4.70% 02/01/36 (a) | | | 9,000 | | | | 9,108 | |
4.90% 02/01/46 (a) | | | 10,000 | | | | 10,286 | |
Anheuser-Busch InBev Worldwide Inc. | | | | | | | | |
2.50% 07/15/22 (a) | | | 31,000 | | | | 29,948 | |
4.00% 04/13/28 (a) | | | 6,000 | | | | 5,983 | |
4.38% 04/15/38 (a) | | | 9,000 | | | | 8,755 | |
4.60% 04/15/48 (a) | | | 9,000 | | | | 8,861 | |
4.75% 04/15/58 (a) | | | 7,000 | | | | 6,878 | |
Anthem Inc.
3.30% 01/15/23 (a) | | | 12,000 | | | | 11,693 | |
Apache Corp.
5.10% 09/01/40 (a) | | | 9,000 | | | | 8,857 | |
Apple Inc. | | | | | | | | |
2.50% 02/09/22 (a) | | | 9,000 | | | | 8,827 | |
2.85% 05/11/24 (a) | | | 13,000 | | | | 12,577 | |
3.35% 02/09/27 (a) | | | 9,000 | | | | 8,795 | |
3.45% 02/09/45 (a) | | | 9,000 | | | | 8,058 | |
3.85% 08/04/46 (a) | | | 9,000 | | | | 8,561 | |
4.25% 02/09/47 (a) | | | 7,000 | | | | 7,117 | |
Applied Materials Inc. | | | | | | | | |
3.30% 04/01/27 (a) | | | 2,000 | | | | 1,940 | |
4.35% 04/01/47 (a) | | | 5,000 | | | | 5,000 | |
Aptiv PLC
4.40% 10/01/46 (a) | | | 9,000 | | | | 8,395 | |
Aramark Services Inc. | | | | | | | | |
5.00% 02/01/28 (a)(h) | | | 10,000 | | | | 9,525 | |
5.13% 01/15/24 (a) | | | 21,000 | | | | 21,000 | |
Archer-Daniels-Midland Co.
2.50% 08/11/26 (a) | | | 14,000 | | | | 12,878 | |
Arconic Inc. | | | | | | | | |
5.13% 10/01/24 (a) | | | 16,000 | | | | 15,840 | |
6.15% 08/15/20 (a) | | | 5,000 | | | | 5,200 | |
Ascension Health
4.85% 11/15/53 (a) | | | 10,000 | | | | 11,246 | |
AstraZeneca PLC | | | | | | | | |
2.38% 11/16/20 (a) | | | 8,000 | | | | 7,848 | |
3.38% 11/16/25 (a) | | | 10,000 | | | | 9,672 | |
| | | | | | | | |
| | | Principal
Amount $ | | | Fair Value $ | |
AT&T Inc. | | | | | | | | |
3.00% 06/30/22 (a) | | | 10,000 | | | | 9,702 | |
4.10% 02/15/28 (a)(h) | | | 15,000 | | | | 14,328 | |
4.45% 04/01/24 (a) | | | 15,000 | | | | 15,171 | |
4.50% 05/15/35 (a) | | | 18,000 | | | | 16,632 | |
4.75% 05/15/46 (a) | | | 8,000 | | | | 7,137 | |
4.80% 06/15/44 (a) | | | 9,000 | | | | 8,150 | |
5.25% 03/01/37 (a) | | | 11,000 | | | | 10,843 | |
5.45% 03/01/47 (a) | | | 8,000 | | | | 7,840 | |
Athene Holding Ltd.
4.13% 01/12/28 (a) | | | 10,000 | | | | 9,215 | |
Avangrid Inc.
3.15% 12/01/24 (a) | | | 20,000 | | | | 19,195 | |
Bank of America Corp. | | | | | | | | |
2.65% 04/01/19 (a) | | | 23,000 | | | | 22,976 | |
3.95% 04/21/25 (a) | | | 17,000 | | | | 16,648 | |
4.25% 10/22/26 (a) | | | 8,000 | | | | 7,898 | |
Bank of America Corp. (2.37% fixed rate until 07/21/20; 0.66% + 3 month USD LIBOR thereafter)
2.37% 07/21/21 (a)(c) | | | 14,000 | | | | 13,719 | |
Bank of America Corp. (3.12% fixed rate until 01/20/22; 1.16% + 3 month USD LIBOR thereafter)
3.12% 01/20/23 (a)(c) | | | 18,000 | | | | 17,697 | |
Bank of America Corp. (3.37% fixed rate until 01/23/25; 0.81% + 3 month USD LIBOR thereafter)
3.37% 01/23/26 (a)(c) | | | 27,000 | | | | 25,961 | |
Bank of America Corp. (3.42% fixed rate until 12/20/27; 1.04% + 3 month USD LIBOR thereafter)
3.42% 12/20/28 (a)(c) | | | 9,000 | | | | 8,482 | |
Bank of America Corp. (3.95% fixed rate until 01/23/48; 1.19% + 3 month USD LIBOR thereafter)
3.95% 01/23/49 (a)(c) | | | 13,000 | | | | 11,747 | |
Bank of America Corp. (4.24% fixed rate until 04/24/37; 1.81% + 3 month USD LIBOR thereafter)
4.24% 04/24/38 (a)(c) | | | 19,000 | | | | 18,436 | |
Bank of America Corp. 3.63% + 3 month USD LIBOR
5.99% 12/31/49 (a)(c) | | | 11,000 | | | | 11,045 | |
Barrick North America Finance LLC
5.70% 05/30/41 (a) | | | 5,000 | | | | 5,457 | |
BAT Capital Corp. | | | | | | | | |
2.30% 08/14/20 (a)(h) | | | 11,000 | | | | 10,761 | |
2.76% 08/15/22 (a)(h) | | | 9,000 | | | | 8,629 | |
3.56% 08/15/27 (a)(h) | | | 8,000 | | | | 7,450 | |
See Notes to Schedule of Investments and Notes to Financial Statements.
| | | | |
| State Street Income V.I.S. Fund | | | 5 | |
State Street Income V.I.S. Fund
Schedule of Investments, continued — June 30, 2018 (Unaudited)
| | | | | | | | |
| | | Principal
Amount $ | | | Fair Value $ | |
| | | | | | | | |
4.39% 08/15/37 (a)(h) | | | 7,000 | | | | 6,551 | |
4.54% 08/15/47 (a)(h) | | | 6,000 | | | | 5,613 | |
Baxalta Inc.
2.88% 06/23/20 (a) | | | 16,000 | | | | 15,817 | |
Becton Dickinson and Co. | | | | | | | | |
2.89% 06/06/22 (a) | | | 14,000 | | | | 13,500 | |
3.70% 06/06/27 (a) | | | 25,000 | | | | 23,685 | |
3.73% 12/15/24 (a) | | | 2,000 | | | | 1,953 | |
4.67% 06/06/47 (a) | | | 3,000 | | | | 2,914 | |
4.69% 12/15/44 (a) | | | 2,000 | | | | 1,937 | |
Berkshire Hathaway Energy Co. | | | | | | | | |
2.40% 02/01/20 (a) | | | 17,000 | | | | 16,852 | |
3.25% 04/15/28 (a) | | | 8,000 | | | | 7,624 | |
3.80% 07/15/48 (a) | | | 7,000 | | | | 6,403 | |
6.13% 04/01/36 (a) | | | 9,000 | | | | 11,111 | |
Berry Global Inc.
5.13% 07/15/23 (a) | | | 25,000 | | | | 24,782 | |
Biogen Inc.
2.90% 09/15/20 (a) | | | 7,000 | | | | 6,963 | |
BNP Paribas S.A.
5.00% 01/15/21 (a) | | | 7,000 | | | | 7,274 | |
Boston Scientific Corp.
4.00% 03/01/28 (a) | | | 11,000 | | | | 10,759 | |
BP Capital Markets PLC | | | | | | | | |
2.52% 01/15/20 (a) | | | 7,000 | | | | 6,955 | |
3.22% 11/28/23 (a) | | | 21,000 | | | | 20,613 | |
3.28% 09/19/27 (a) | | | 10,000 | | | | 9,622 | |
Brighthouse Financial Inc.
3.70% 06/22/27 (a) | | | 2,000 | | | | 1,780 | |
Broadcom Corp./Broadcom Cayman Finance Ltd. | | | | | | | | |
2.20% 01/15/21 (a) | | | 7,000 | | | | 6,779 | |
2.65% 01/15/23 (a) | | | 5,000 | | | | 4,715 | |
3.13% 01/15/25 (a) | | | 7,000 | | | | 6,491 | |
3.88% 01/15/27 (a) | | | 6,000 | | | | 5,683 | |
Brown-Forman Corp.
4.00% 04/15/38 (a) | | | 4,000 | | | | 3,987 | |
Buckeye Partners LP
5.60% 10/15/44 (a) | | | 10,000 | | | | 8,965 | |
Bunge Limited Finance Corp.
3.75% 09/25/27 (a) | | | 7,000 | | | | 6,585 | |
Campbell Soup Co.
3.30% 03/15/21 (a) | | | 18,000 | | | | 17,924 | |
Canadian Natural Resources Ltd. | | | | | | | | |
3.85% 06/01/27 (a) | | | 5,000 | | | | 4,876 | |
4.95% 06/01/47 (a) | | | 4,000 | | | | 4,165 | |
Capital One Financial Corp. | | | | | | | | |
3.75% 07/28/26 (a) | | | 9,000 | | | | 8,370 | |
4.20% 10/29/25 (a) | | | 9,000 | | | | 8,748 | |
Cardinal Health Inc. | | | | | | | | |
2.62% 06/15/22 (a) | | | 6,000 | | | | 5,750 | |
| | | | | | | | |
| | | Principal
Amount $ | | | Fair Value $ | |
3.08% 06/15/24 (a) | | | 8,000 | | | | 7,546 | |
3.41% 06/15/27 (a) | | | 3,000 | | | | 2,753 | |
4.37% 06/15/47 (a) | | | 4,000 | | | | 3,519 | |
Caterpillar Financial Services Corp.
2.55% 11/29/22 (a) | | | 21,000 | | | | 20,315 | |
Caterpillar Inc.
3.80% 08/15/42 (a) | | | 6,000 | | | | 5,733 | |
Catholic Health Initiatives | | | | | | | | |
2.60% 08/01/18 (a) | | | 15,000 | | | | 15,000 | |
4.35% 11/01/42 (a) | | | 16,000 | | | | 15,146 | |
CBL & Associates LP
4.60% 10/15/24 (a) | | | 15,000 | | | | 12,338 | |
CBS Corp. | | | | | | | | |
2.50% 02/15/23 (a) | | | 9,000 | | | | 8,458 | |
2.90% 01/15/27 (a) | | | 9,000 | | | | 8,014 | |
CCO Holdings LLC/CCO Holdings Capital Corp. | | | | | | | | |
5.00% 02/01/28 (a)(h) | | | 23,000 | | | | 21,075 | |
5.88% 04/01/24 (a)(h) | | | 15,000 | | | | 15,037 | |
Celgene Corp. | | | | | | | | |
3.45% 11/15/27 (a) | | | 2,000 | | | | 1,841 | |
4.55% 02/20/48 (a) | | | 8,000 | | | | 7,296 | |
5.00% 08/15/45 (a) | | | 7,000 | | | | 6,816 | |
Cenovus Energy Inc. | | | | | | | | |
4.25% 04/15/27 (a) | | | 3,000 | | | | 2,891 | |
5.40% 06/15/47 (a) | | | 3,000 | | | | 2,947 | |
CenterPoint Energy Inc.
2.50% 09/01/22 (a) | | | 12,000 | | | | 11,523 | |
CenturyLink Inc.
5.80% 03/15/22 (a) | | | 30,000 | | | | 29,700 | |
Cequel Communications Holdings I LLC/Cequel Capital Corp.
5.13% 12/15/21 (a)(h) | | | 22,000 | | | | 21,864 | |
CF Industries Inc. | | | | | | | | |
5.15% 03/15/34 (a) | | | 15,000 | | | | 13,912 | |
7.13% 05/01/20 (a) | | | 16,000 | | | | 16,870 | |
Charles River Laboratories International Inc.
5.50% 04/01/26 (a)(h) | | | 18,000 | | | | 17,977 | |
Charter Communications Operating LLC/Charter Communications Operating Capital | | | | | | | | |
3.58% 07/23/20 (a) | | | 24,000 | | | | 23,969 | |
4.91% 07/23/25 (a) | | | 9,000 | | | | 9,088 | |
5.38% 05/01/47 (a) | | | 9,000 | | | | 8,273 | |
5.75% 04/01/48 (a) | | | 5,000 | | | | 4,839 | |
6.38% 10/23/35 (a) | | | 5,000 | | | | 5,234 | |
6.48% 10/23/45 (a) | | | 7,000 | | | | 7,384 | |
Chevron Corp. | | | | | | | | |
2.42% 11/17/20 (a) | | | 7,000 | | | | 6,921 | |
3.19% 06/24/23 (a) | | | 10,000 | | | | 9,944 | |
See Notes to Schedule of Investments and Notes to Financial Statements.
| | |
| 6 | | State Street Income V.I.S. Fund |
State Street Income V.I.S. Fund
Schedule of Investments, continued — June 30, 2018 (Unaudited)
| | | | | | | | |
| | | Principal
Amount $ | | | Fair Value $ | |
| | | | | | | | |
Chevron Phillips Chemical Company LLC/Chevron Phillips Chemical Company LP
3.70% 06/01/28 (a)(h) | | | 16,000 | | | | 15,828 | |
Church & Dwight Company Inc.
2.45% 08/01/22 (a) | | | 7,000 | | | | 6,706 | |
Cigna Corp. | | | | | | | | |
3.25% 04/15/25 (a) | | | 15,000 | | | | 14,113 | |
3.88% 10/15/47 (a) | | | 8,000 | | | | 6,825 | |
Cimarex Energy Co.
3.90% 05/15/27 (a) | | | 2,000 | | | | 1,924 | |
Cinemark USA Inc.
4.88% 06/01/23 (a) | | | 18,000 | | | | 17,597 | |
Cisco Systems Inc.
2.20% 02/28/21 (a) | | | 28,000 | | | | 27,454 | |
Citigroup Inc. | | | | | | | | |
2.05% 12/07/18 (a) | | | 41,000 | | | | 40,900 | |
2.40% 02/18/20 (a) | | | 18,000 | | | | 17,776 | |
2.70% 10/27/22 (a) | | | 12,000 | | | | 11,525 | |
2.90% 12/08/21 (a) | | | 16,000 | | | | 15,672 | |
4.40% 06/10/25 (a) | | | 7,000 | | | | 6,974 | |
4.45% 09/29/27 (a) | | | 6,000 | | | | 5,897 | |
4.75% 05/18/46 (a) | | | 9,000 | | | | 8,605 | |
Citigroup Inc. (2.88% fixed rate until 07/24/22; 0.95% + 3 month USD LIBOR thereafter)
2.88% 07/24/23 (a)(c) | | | 11,000 | | | | 10,608 | |
Citigroup Inc. (3.88% fixed rate until 01/24/38; 1.17% + 3 month USD LIBOR thereafter)
3.88% 01/24/39 (a)(c) | | | 7,000 | | | | 6,376 | |
Citigroup Inc. (4.28% fixed rate until 04/24/47; 1.84% + 3 month USD LIBOR thereafter)
4.28% 04/24/48 (a)(c) | | | 14,000 | | | | 13,293 | |
CME Group Inc.
3.75% 06/15/28 (a) | | | 15,000 | | | | 15,134 | |
CMS Energy Corp.
4.88% 03/01/44 (a) | | | 21,000 | | | | 22,314 | |
CNA Financial Corp. | | | | | | | | |
3.45% 08/15/27 (a) | | | 9,000 | | | | 8,382 | |
5.88% 08/15/20 (a) | | | 32,000 | | | | 33,599 | |
CNH Industrial Capital LLC | | | | | | | | |
3.38% 07/15/19 (a) | | | 10,000 | | | | 9,981 | |
4.38% 11/06/20 (a) | | | 8,000 | | | | 8,095 | |
4.88% 04/01/21 (a) | | | 10,000 | | | | 10,263 | |
CNH Industrial N.V.
4.50% 08/15/23 (a) | | | 17,000 | | | | 17,092 | |
Columbia Pipeline Group Inc.
3.30% 06/01/20 (a) | | | 11,000 | | | | 10,947 | |
Comcast Corp. | | | | | | | | |
3.38% 08/15/25 (a) | | | 9,000 | | | | 8,619 | |
| | | | | | | | |
| | | Principal
Amount $ | | | Fair Value $ | |
3.97% 11/01/47 (a) | | | 17,000 | | | | 14,965 | |
4.20% 08/15/34 (a) | | | 10,000 | | | | 9,543 | |
4.60% 08/15/45 (a) | | | 6,000 | | | | 5,785 | |
Concho Resources Inc. | | | | | | | | |
3.75% 10/01/27 (a) | | | 5,000 | | | | 4,809 | |
4.30% 08/15/28 (a)(d) | | | 15,000 | | | | 15,059 | |
4.88% 10/01/47 (a) | | | 6,000 | | | | 6,057 | |
ConocoPhillips Co.
5.95% 03/15/46 (a) | | | 5,000 | | | | 6,236 | |
Consolidated Edison Company of New York Inc.
2.90% 12/01/26 (a) | | | 14,000 | | | | 13,101 | |
Constellation Brands Inc. | | | | | | | | |
2.70% 05/09/22 (a) | | | 9,000 | | | | 8,707 | |
4.50% 05/09/47 (a) | | | 5,000 | | | | 4,782 | |
Continental Resources Inc.
4.50% 04/15/23 (a) | | | 8,000 | | | | 8,114 | |
Corning Inc.
4.38% 11/15/57 (a) | | | 8,000 | | | | 7,036 | |
Corporation Andina de Fomento | | | | | | | | |
2.20% 07/18/20 (a) | | | 16,000 | | | | 15,705 | |
4.38% 06/15/22 (a) | | | 69,000 | | | | 71,587 | |
Crane Co.
4.20% 03/15/48 (a) | | | 5,000 | | | | 4,751 | |
Crown Americas LLC/Crown Americas Capital Corp. VI
4.75% 02/01/26 (a)(h) | | | 5,000 | | | | 4,747 | |
CSX Corp.
4.50% 08/01/54 (a) | | | 11,000 | | | | 10,478 | |
CVS Health Corp. | | | | | | | | |
2.25% 08/12/19 (a) | | | 17,000 | | | | 16,869 | |
3.13% 03/09/20 (a) | | | 51,000 | | | | 50,959 | |
3.35% 03/09/21 (a) | | | 51,000 | | | | 50,952 | |
3.70% 03/09/23 (a) | | | 13,000 | | | | 12,905 | |
3.88% 07/20/25 (a) | | | 9,000 | | | | 8,794 | |
4.10% 03/25/25 (a) | | | 13,000 | | | | 12,935 | |
4.30% 03/25/28 (a) | | | 13,000 | | | | 12,821 | |
4.78% 03/25/38 (a) | | | 13,000 | | | | 12,837 | |
5.05% 03/25/48 (a) | | | 8,000 | | | | 8,130 | |
D.R. Horton Inc.
2.55% 12/01/20 (a) | | | 16,000 | | | | 15,670 | |
Daimler Finance North America LLC
2.38% 08/01/18 (a)(h) | | | 150,000 | | | | 149,960 | |
Dana Financing Luxembourg Sarl
6.50% 06/01/26 (a)(h) | | | 15,000 | | | | 15,225 | |
Dell International LLC/EMC Corp. | | | | | | | | |
3.48% 06/01/19 (a)(h) | | | 32,000 | | | | 32,084 | |
5.45% 06/15/23 (a)(h) | | | 9,000 | | | | 9,418 | |
6.02% 06/15/26 (a)(h) | | | 9,000 | | | | 9,457 | |
8.10% 07/15/36 (a)(h) | | | 2,000 | | | | 2,338 | |
8.35% 07/15/46 (a)(h) | | | 6,000 | | | | 7,240 | |
See Notes to Schedule of Investments and Notes to Financial Statements.
| | | | |
| State Street Income V.I.S. Fund | | | 7 | |
State Street Income V.I.S. Fund
Schedule of Investments, continued — June 30, 2018 (Unaudited)
| | | | | | | | |
| | | Principal
Amount $ | | | Fair Value $ | |
| | | | | | | | |
Deutsche Bank AG
2.70% 07/13/20 (a) | | | 16,000 | | | | 15,581 | |
Devon Energy Corp. | | | | | | | | |
4.00% 07/15/21 (a) | | | 20,000 | | | | 20,284 | |
5.00% 06/15/45 (a) | | | 8,000 | | | | 8,128 | |
Diageo Investment Corp.
2.88% 05/11/22 (a) | | | 20,000 | | | | 19,692 | |
Discovery Communications LLC | | | | | | | | |
2.20% 09/20/19 (a) | | | 13,000 | | | | 12,865 | |
3.95% 03/20/28 (a) | | | 9,000 | | | | 8,528 | |
5.00% 09/20/37 (a) | | | 5,000 | | | | 4,831 | |
5.20% 09/20/47 (a) | | | 2,000 | | | | 1,934 | |
Dollar Tree Inc. | | | | | | | | |
3.70% 05/15/23 (a) | | | 13,000 | | | | 12,881 | |
4.00% 05/15/25 (a) | | | 13,000 | | | | 12,712 | |
Dominion Energy Inc. | | | | | | | | |
2.50% 12/01/19 (a) | | | 16,000 | | | | 15,865 | |
2.58% 07/01/20 (a) | | | 11,000 | | | | 10,843 | |
3.63% 12/01/24 (a) | | | 8,000 | | | | 7,849 | |
DTE Energy Co. | | | | | | | | |
2.85% 10/01/26 (a) | | | 11,000 | | | | 10,038 | |
3.85% 12/01/23 (a) | | | 9,000 | | | | 9,040 | |
Duke Energy Corp.
3.75% 09/01/46 (a) | | | 5,000 | | | | 4,422 | |
Duke Energy Progress LLC
4.15% 12/01/44 (a) | | | 11,000 | | | | 10,917 | |
Duke Realty LP | | | | | | | | |
3.25% 06/30/26 (a) | | | 8,000 | | | | 7,517 | |
3.38% 12/15/27 (a) | | | 7,000 | | | | 6,522 | |
Duquesne Light Holdings Inc.
3.62% 08/01/27 (a)(h) | | | 13,000 | | | | 12,315 | |
Eastman Chemical Co.
3.60% 08/15/22 (a) | | | 9,000 | | | | 8,980 | |
Eaton Corp.
3.10% 09/15/27 (a) | | | 8,000 | | | | 7,478 | |
Ecolab Inc. | | | | | | | | |
3.25% 12/01/27 (a) | | | 8,000 | | | | 7,652 | |
3.95% 12/01/47 (a) | | | 6,000 | | | | 5,736 | |
Ecopetrol S.A. | | | | | | | | |
5.88% 05/28/45 (a) | | | 16,000 | | | | 15,125 | |
7.63% 07/23/19 | | | 7,000 | | | | 7,314 | |
Edison International
4.13% 03/15/28 (a) | | | 9,000 | | | | 8,862 | |
EI du Pont de Nemours & Co. 0.53% + 3 month USD LIBOR
2.89% 05/01/20 (a)(c) | | | 13,000 | | | | 13,044 | |
Electricite de France S.A.
2.15% 01/22/19 (a)(h) | | | 46,000 | | | | 45,861 | |
Eli Lilly & Co.
3.70% 03/01/45 (a) | | | 4,000 | | | | 3,784 | |
EMC Corp.
2.65% 06/01/20 (a) | | | 39,000 | | | | 37,783 | |
| | | | | | | | |
| | | Principal
Amount $ | | | Fair Value $ | |
Emera US Finance LP
4.75% 06/15/46 (a) | | | 5,000 | | | | 4,929 | |
Enbridge Energy Partners LP
5.50% 09/15/40 (a) | | | 6,000 | | | | 6,276 | |
Encana Corp.
3.90% 11/15/21 (a) | | | 16,000 | | | | 16,100 | |
Energy Transfer Equity LP
5.88% 01/15/24 (a) | | | 56,000 | | | | 57,470 | |
Energy Transfer Partners LP | | | | | | | | |
4.20% 09/15/23 (a) | | | 6,000 | | | | 6,006 | |
4.95% 06/15/28 (a) | | | 5,000 | | | | 4,999 | |
5.80% 06/15/38 (a) | | | 9,000 | | | | 8,926 | |
6.00% 06/15/48 (a) | | | 9,000 | | | | 9,028 | |
6.50% 02/01/42 (a) | | | 12,000 | | | | 12,485 | |
Energy Transfer Partners LP/Regency Energy Finance Corp.
4.50% 11/01/23 (a) | | | 8,000 | | | | 8,071 | |
Entergy Louisiana LLC | | | | | | | | |
3.05% 06/01/31 (a) | | | 11,000 | | | | 10,029 | |
4.00% 03/15/33 (a) | | | 5,000 | | | | 5,004 | |
Enterprise Products Operating LLC | | | | | | | | |
3.95% 02/15/27 (a) | | | 11,000 | | | | 10,924 | |
4.25% 02/15/48 (a) | | | 12,000 | | | | 11,155 | |
Enterprise Products Operating LLC (5.25% fixed rate until 08/16/27; 3.03% + 3 month USD LIBOR thereafter)
5.25% 08/16/77 (a)(c) | | | 7,000 | | | | 6,509 | |
Envision Healthcare Corp.
6.25% 12/01/24 (a)(h) | | | 16,000 | | | | 17,040 | |
EOG Resources Inc.
4.10% 02/01/21 (a) | | | 16,000 | | | | 16,326 | |
EPR Properties
4.95% 04/15/28 (a) | | | 8,000 | | | | 7,807 | |
EQT Corp.
3.90% 10/01/27 (a) | | | 8,000 | | | | 7,464 | |
EQT Midstream Partners LP | | | | | | | | |
4.75% 07/15/23 (a) | | | 7,000 | | | | 6,995 | |
5.50% 07/15/28 (a) | | | 7,000 | | | | 7,019 | |
ERP Operating LP
4.50% 07/01/44 (a) | | | 9,000 | | | | 9,144 | |
Exelon Corp. | | | | | | | | |
3.50% 06/01/22 (a) | | | 11,000 | | | | 10,884 | |
4.45% 04/15/46 (a) | | | 9,000 | | | | 8,771 | |
Express Scripts Holding Co. | | | | | | | | |
3.40% 03/01/27 (a) | | | 9,000 | | | | 8,239 | |
4.80% 07/15/46 (a) | | | 6,000 | | | | 5,714 | |
Exxon Mobil Corp.
2.22% 03/01/21 (a) | | | 11,000 | | | | 10,715 | |
FedEx Corp.
4.10% 02/01/45 (a) | | | 2,000 | | | | 1,823 | |
See Notes to Schedule of Investments and Notes to Financial Statements.
| | |
| 8 | | State Street Income V.I.S. Fund |
State Street Income V.I.S. Fund
Schedule of Investments, continued — June 30, 2018 (Unaudited)
| | | | | | | | |
| | | Principal
Amount $ | | | Fair Value $ | |
| | | | | | | | |
FirstEnergy Corp. | | | | | | | | |
3.90% 07/15/27 (a) | | | 6,000 | | | | 5,828 | |
4.85% 07/15/47 (a) | | | 7,000 | | | | 7,169 | |
Florida Power & Light Co.
4.13% 02/01/42 (a) | | | 17,000 | | | | 17,162 | |
Ford Motor Co.
4.35% 12/08/26 (a) | | | 14,000 | | | | 13,705 | |
Frontier Communications Corp.
7.13% 03/15/19 (a) | | | 26,000 | | | | 26,195 | |
GameStop Corp.
6.75% 03/15/21 (a)(h) | | | 40,000 | | | | 40,400 | |
General Dynamics Corp. | | | | | | | | |
2.13% 08/15/26 (a) | | | 9,000 | | | | 8,078 | |
2.88% 05/11/20 (a) | | | 18,000 | | | | 17,982 | |
3.00% 05/11/21 (a) | | | 24,000 | | | | 23,920 | |
3.38% 05/15/23 (a) | | | 15,000 | | | | 15,031 | |
3.50% 05/15/25 (a) | | | 12,000 | | | | 11,997 | |
3.75% 05/15/28 (a) | | | 12,000 | | | | 12,119 | |
General Mills Inc. | | | | | | | | |
3.20% 04/16/21 (a) | | | 15,000 | | | | 14,926 | |
3.70% 10/17/23 (a) | | | 11,000 | | | | 10,884 | |
4.55% 04/17/38 (a) | | | 3,000 | | | | 2,870 | |
4.70% 04/17/48 (a) | | | 8,000 | | | | 7,614 | |
General Motors Co.
5.20% 04/01/45 (a) | | | 5,000 | | | | 4,613 | |
General Motors Financial Company Inc. | | | | | | | | |
2.35% 10/04/19 (a) | | | 17,000 | | | | 16,857 | |
3.15% 01/15/20 (a) | | | 22,000 | | | | 21,965 | |
3.20% 07/13/20 (a) | | | 9,000 | | | | 8,951 | |
3.55% 04/09/21 (a) | | | 24,000 | | | | 23,938 | |
5.25% 03/01/26 (a) | | | 21,000 | | | | 21,716 | |
Georgia-Pacific LLC
3.60% 03/01/25 (a)(h) | | | 5,000 | | | | 4,977 | |
Gilead Sciences Inc. | | | | | | | | |
2.55% 09/01/20 (a) | | | 7,000 | | | | 6,915 | |
2.95% 03/01/27 (a) | | | 3,000 | | | | 2,805 | |
3.50% 02/01/25 (a) | | | 8,000 | | | | 7,887 | |
3.65% 03/01/26 (a) | | | 6,000 | | | | 5,924 | |
4.15% 03/01/47 (a) | | | 9,000 | | | | 8,601 | |
GlaxoSmithKline Capital Inc. | | | | | | | | |
3.38% 05/15/23 (a) | | | 15,000 | | | | 14,997 | |
3.63% 05/15/25 (a) | | | 12,000 | | | | 11,996 | |
3.88% 05/15/28 (a) | | | 8,000 | | | | 8,072 | |
GlaxoSmithKline Capital PLC
3.13% 05/14/21 (a) | | | 12,000 | | | | 12,011 | |
Glencore Funding LLC
2.50% 01/15/19 (a)(h) | | | 33,000 | | | | 32,904 | |
Goldman Sachs Bank USA
3.20% 06/05/20 (a) | | | 13,000 | | | | 13,062 | |
H&E Equipment Services Inc.
5.63% 09/01/25 (a) | | | 23,000 | | | | 22,597 | |
| | | | | | | | |
| | | Principal
Amount $ | | | Fair Value $ | |
Halliburton Co. | | | | | | | | |
3.80% 11/15/25 (a) | | | 11,000 | | | | 10,917 | |
5.00% 11/15/45 (a) | | | 8,000 | | | | 8,517 | |
HCA Inc.
4.75% 05/01/23 (a) | | | 40,000 | | | | 39,800 | |
Hess Corp. | | | | | | | | |
5.60% 02/15/41 (a) | | | 6,000 | | | | 6,068 | |
5.80% 04/01/47 (a) | | | 4,000 | | | | 4,142 | |
Hewlett Packard Enterprise Co.
6.35% 10/15/45 (a) | | | 7,000 | | | | 6,950 | |
Highwoods Realty LP
4.13% 03/15/28 (a) | | | 9,000 | | | | 8,836 | |
Hilcorp Energy I LP/Hilcorp Finance Co.
5.75% 10/01/25 (a)(h) | | | 24,000 | | | | 24,000 | |
HSBC Holdings PLC (6.50% fixed rate until 03/23/28; 3.61% + USD 5 year Mid-Market Swap Rate thereafter)
6.50% 12/31/99 (a)(c) | | | 15,000 | | | | 14,389 | |
Hyundai Capital America
3.10% 04/05/22 (a)(h) | | | 7,000 | | | | 6,829 | |
Icahn Enterprises LP/Icahn Enterprises Finance Corp.
6.00% 08/01/20 (a) | | | 24,000 | | | | 24,346 | |
Ingersoll-Rand Luxembourg Finance S.A.
3.55% 11/01/24 (a) | | | 13,000 | | | | 12,794 | |
Intel Corp. | | | | | | | | |
2.60% 05/19/26 (a) | | | 16,000 | | | | 14,929 | |
2.88% 05/11/24 (a) | | | 7,000 | | | | 6,782 | |
International Paper Co.
4.40% 08/15/47 (a) | | | 9,000 | | | | 8,220 | |
Interstate Power & Light Co.
3.40% 08/15/25 (a) | | | 9,000 | | | | 8,751 | |
j2 Cloud Services LLC/j2 Global Co-Obligor Inc.
6.00% 07/15/25 (a)(h) | | | 14,000 | | | | 14,175 | |
Jabil Inc.
3.95% 01/12/28 (a) | | | 10,000 | | | | 9,550 | |
JBS USA LUX S.A./JBS USA Finance Inc.
6.75% 02/15/28 (a)(h) | | | 15,000 | | | | 14,119 | |
Jefferies Group LLC | | | | | | | | |
5.13% 01/20/23 (a) | | | 15,000 | | | | 15,603 | |
6.50% 01/20/43 (a) | | | 16,000 | | | | 16,582 | |
Johnson & Johnson | | | | | | | | |
2.63% 01/15/25 (a) | | | 24,000 | | | | 23,002 | |
3.63% 03/03/37 (a) | | | 9,000 | | | | 8,803 | |
Johnson Controls International PLC
4.50% 02/15/47 (a) | | | 7,000 | | | | 6,750 | |
JPMorgan Chase & Co. | | | | | | | | |
2.30% 08/15/21 (a) | | | 31,000 | | | | 30,002 | |
See Notes to Schedule of Investments and Notes to Financial Statements.
| | | | |
| State Street Income V.I.S. Fund | | | 9 | |
State Street Income V.I.S. Fund
Schedule of Investments, continued — June 30, 2018 (Unaudited)
| | | | | | | | |
| | | Principal
Amount $ | | | Fair Value $ | |
| | | | | | | | |
2.55% 10/29/20 (a) | | | 20,000 | | | | 19,662 | |
3.30% 04/01/26 (a) | | | 11,000 | | | | 10,504 | |
3.63% 12/01/27 (a) | | | 9,000 | | | | 8,470 | |
JPMorgan Chase & Co. (3.51% fixed rate until 01/23/28; 0.95% + 3 month USD LIBOR thereafter)
3.51% 01/23/29 (a)(c) | | | 9,000 | | | | 8,517 | |
JPMorgan Chase & Co. (3.88% fixed rate until 07/24/37; 1.36% + 3 month USD LIBOR thereafter)
3.88% 07/24/38 (a)(c) | | | 8,000 | | | | 7,378 | |
JPMorgan Chase & Co. (3.90% fixed rate until 01/23/48; 1.22% + 3 month USD LIBOR thereafter)
3.90% 01/23/49 (a)(c) | | | 5,000 | | | | 4,501 | |
JPMorgan Chase & Co. (4.01% fixed rate until 04/23/28; 1.12% + 3 month USD LIBOR thereafter)
4.01% 04/23/29 (a)(c) | | | 27,000 | | | | 26,654 | |
JPMorgan Chase & Co. (4.03% fixed rate until 07/24/47; 1.46% + 3 month USD LIBOR thereafter)
4.03% 07/24/48 (a)(c) | | | 7,000 | | | | 6,383 | |
JPMorgan Chase & Co. (4.63% fixed rate until 11/01/22; 2.58% + 3 month USD LIBOR thereafter)
4.63% 12/31/99 (a)(c) | | | 13,000 | | | | 12,019 | |
JPMorgan Chase & Co. (6.10% fixed rate until 10/01/24; 3.33% + 3 month USD LIBOR thereafter)
6.10% 10/29/49 (a)(c) | | | 48,000 | | | | 49,565 | |
JPMorgan Chase & Co.
3.47% + 3 month USD LIBOR
5.83% 12/29/49 (a)(c) | | | 15,000 | | | | 15,136 | |
Kinder Morgan Energy Partners LP | | | | | | | | |
3.50% 03/01/21 (a) | | | 7,000 | | | | 6,986 | |
5.30% 09/15/20 (a) | | | 8,000 | | | | 8,315 | |
6.38% 03/01/41 (a) | | | 9,000 | | | | 9,630 | |
Kinder Morgan Inc. | | | | | | | | |
3.05% 12/01/19 (a) | | | 8,000 | | | | 7,985 | |
4.30% 03/01/28 (a) | | | 15,000 | | | | 14,590 | |
5.05% 02/15/46 (a) | | | 9,000 | | | | 8,509 | |
5.55% 06/01/45 (a) | | | 13,000 | | | | 13,100 | |
Kraft Heinz Foods Co.
4.38% 06/01/46 (a) | | | 8,000 | | | | 6,930 | |
| | | | | | | | |
| | | Principal
Amount $ | | | Fair Value $ | |
Kreditanstalt fuer Wiederaufbau
4.50% 07/16/18 (a) | | | 85,000 | | | | 85,074 | |
L Brands Inc.
5.25% 02/01/28 (a) | | | 15,000 | | | | 13,295 | |
Lamb Weston Holdings Inc.
4.63% 11/01/24 (a)(h) | | | 23,000 | | | | 22,396 | |
Lee Enterprises Inc.
9.50% 03/15/22 (a)(h) | | | 27,000 | | | | 28,198 | |
Lennar Corp.
4.75% 05/30/25 - 11/29/27 (a) | | | 34,000 | | | | 32,191 | |
Levi Strauss & Co.
5.00% 05/01/25 (a) | | | 26,000 | | | | 25,904 | |
Lincoln National Corp. | | | | | | | | |
3.63% 12/12/26 (a) | | | 10,000 | | | | 9,518 | |
3.80% 03/01/28 (a) | | | 8,000 | | | | 7,632 | |
4.35% 03/01/48 (a) | | | 9,000 | | | | 8,331 | |
Lithia Motors Inc.
5.25% 08/01/25 (a)(h) | | | 19,000 | | | | 18,525 | |
LYB International Finance BV
4.88% 03/15/44 (a) | | | 7,000 | | | | 6,961 | |
Macy’s Retail Holdings Inc.
4.30% 02/15/43 (a) | | | 6,000 | | | | 4,669 | |
Maple Escrow Subsidiary Inc. | | | | | | | | |
3.55% 05/25/21 (a)(h) | | | 51,000 | | | | 51,026 | |
4.06% 05/25/23 (a)(h) | | | 15,000 | | | | 15,053 | |
4.60% 05/25/28 (a)(h) | | | 12,000 | | | | 12,044 | |
5.09% 05/25/48 (a)(h) | | | 12,000 | | | | 12,091 | |
Marathon Oil Corp. | | | | | | | | |
2.70% 06/01/20 (a) | | | 19,000 | | | | 18,752 | |
3.85% 06/01/25 (a) | | | 9,000 | | | | 8,863 | |
Marathon Petroleum Corp.
3.63% 09/15/24 (a) | | | 9,000 | | | | 8,801 | |
Marsh & McLennan Companies Inc.
3.50% 03/10/25 (a) | | | 13,000 | | | | 12,738 | |
Masco Corp.
3.50% 11/15/27 (a) | | | 6,000 | | | | 5,534 | |
McDonald’s Corp. | | | | | | | | |
3.70% 01/30/26 (a) | | | 7,000 | | | | 6,954 | |
4.88% 12/09/45 (a) | | | 8,000 | | | | 8,388 | |
Medtronic Inc. | | | | | | | | |
2.50% 03/15/20 (a) | | | 18,000 | | | | 17,869 | |
4.63% 03/15/45 (a) | | | 8,000 | | | | 8,484 | |
Memorial Sloan-Kettering Cancer Center
4.13% 07/01/52 (a) | | | 18,000 | | | | 18,154 | |
Merck & Company Inc.
2.75% 02/10/25 (a) | | | 13,000 | | | | 12,427 | |
MetLife Inc. | | | | | | | | |
4.05% 03/01/45 (a) | | | 3,000 | | | | 2,791 | |
4.72% 12/15/44 (a) | | | 11,000 | | | | 11,293 | |
MGM Resorts International | | | | | | | | |
4.63% 09/01/26 (a) | | | 16,000 | | | | 14,821 | |
See Notes to Schedule of Investments and Notes to Financial Statements.
| | |
| 10 | | State Street Income V.I.S. Fund |
State Street Income V.I.S. Fund
Schedule of Investments, continued — June 30, 2018 (Unaudited)
| | | | | | | | |
| | | Principal
Amount $ | | | Fair Value $ | |
| | | | | | | | |
5.75% 06/15/25 (a) | | | 20,000 | | | | 19,926 | |
6.63% 12/15/21 (a) | | | 17,000 | | | | 17,914 | |
Microsoft Corp. | | | | | | | | |
1.55% 08/08/21 (a) | | | 16,000 | | | | 15,348 | |
2.40% 08/08/26 (a) | | | 14,000 | | | | 12,943 | |
3.45% 08/08/36 (a) | | | 9,000 | | | | 8,639 | |
4.00% 02/12/55 (a) | | | 9,000 | | | | 8,978 | |
4.10% 02/06/37 (a) | | | 8,000 | | | | 8,314 | |
4.25% 02/06/47 (a) | | | 9,000 | | | | 9,531 | |
4.50% 02/06/57 (a) | | | 5,000 | | | | 5,423 | |
Molina Healthcare Inc.
4.88% 06/15/25 (a)(h) | | | 32,000 | | | | 31,000 | |
Molson Coors Brewing Co.
| | | | | | | | |
2.10% 07/15/21 (a) | | | 11,000 | | | | 10,548 | |
4.20% 07/15/46 (a) | | | 8,000 | | | | 7,163 | |
Monsanto Co.
4.70% 07/15/64 (a) | | | 5,000 | | | | 4,388 | |
Morgan Stanley | | | | | | | | |
2.45% 02/01/19 (a) | | | 54,000 | | | | 53,906 | |
2.63% 11/17/21 (a) | | | 26,000 | | | | 25,289 | |
2.65% 01/27/20 (a) | | | 25,000 | | | | 24,820 | |
2.75% 05/19/22 (a) | | | 14,000 | | | | 13,575 | |
3.70% 10/23/24 (a) | | | 9,000 | | | | 8,886 | |
3.95% 04/23/27 (a) | | | 26,000 | | | | 24,822 | |
5.00% 11/24/25 (a) | | | 16,000 | | | | 16,566 | |
Morgan Stanley (3.77% fixed rate until 01/24/28; 1.14% + 3 month USD LIBOR thereafter)
3.77% 01/24/29 (a)(c) | | | 9,000 | | | | 8,678 | |
Morgan Stanley (3.97% fixed rate until 07/22/37; 1.46% + 3 month USD LIBOR thereafter)
3.97% 07/22/38 (a)(c) | | | 9,000 | | | | 8,296 | |
MPLX LP | | | | | | | | |
3.38% 03/15/23 (a) | | | 9,000 | | | | 8,800 | |
4.50% 04/15/38 (a) | | | 8,000 | | | | 7,403 | |
4.70% 04/15/48 (a) | | | 8,000 | | | | 7,427 | |
5.20% 03/01/47 (a) | | | 4,000 | | | | 3,939 | |
Murphy Oil Corp.
5.75% 08/15/25 (a) | | | 56,000 | | | | 55,720 | |
Mylan Inc. | | | | | | | | |
4.55% 04/15/28 (a)(h) | | | 12,000 | | | | 11,722 | |
5.20% 04/15/48 (a)(h) | | | 7,000 | | | | 6,765 | |
Mylan N.V. | | | | | | | | |
3.15% 06/15/21 (a) | | | 9,000 | | | | 8,902 | |
3.95% 06/15/26 (a) | | | 8,000 | | | | 7,645 | |
National Retail Properties Inc.
4.00% 11/15/25 (a) | | | 14,000 | | | | 13,723 | |
Navient Corp. | | | | | | | | |
6.75% 06/15/26 (a) | | | 15,000 | | | | 14,658 | |
8.00% 03/25/20 (a) | | | 31,000 | | | | 32,705 | |
| | | | | | | | |
| | | Principal
Amount $ | | | Fair Value $ | |
Newell Brands Inc. | | | | | | | | |
3.85% 04/01/23 (a) | | | 9,000 | | | | 8,866 | |
5.50% 04/01/46 (a) | | | 8,000 | | | | 7,833 | |
Newfield Exploration Co.
5.38% 01/01/26 (a) | | | 23,000 | | | | 23,517 | |
Newmont Mining Corp.
4.88% 03/15/42 (a) | | | 9,000 | | | | 9,000 | |
Nexen Energy ULC
6.40% 05/15/37 (a) | | | 9,000 | | | | 11,019 | |
NGPL PipeCo LLC
4.88% 08/15/27 (a)(h) | | | 2,000 | | | | 1,975 | |
Noble Energy Inc.
| | | | | | | | |
3.90% 11/15/24 (a) | | | 13,000 | | | | 12,817 | |
5.05% 11/15/44 (a) | | | 3,000 | | | | 2,998 | |
Nordstrom Inc.
5.00% 01/15/44 (a) | | | 2,000 | | | | 1,840 | |
Northern States Power Co.
2.20% 08/15/20 (a) | | | 45,000 | | | | 44,308 | |
Northrop Grumman Corp. | | | | | | | | |
2.08% 10/15/20 (a) | | | 7,000 | | | | 6,841 | |
2.55% 10/15/22 (a) | | | 7,000 | | | | 6,748 | |
2.93% 01/15/25 (a) | | | 8,000 | | | | 7,594 | |
3.25% 01/15/28 (a) | | | 8,000 | | | | 7,531 | |
3.85% 04/15/45 (a) | | | 6,000 | | | | 5,456 | |
4.03% 10/15/47 (a) | | | 8,000 | | | | 7,488 | |
Novartis Capital Corp.
3.00% 11/20/25 (a) | | | 3,000 | | | | 2,892 | |
NRG Energy Inc.
6.25% 07/15/22 (a) | | | 26,000 | | | | 26,757 | |
Nucor Corp. | | | | | | | | |
3.95% 05/01/28 (a) | | | 12,000 | | | | 11,983 | |
4.13% 09/15/22 (a) | | | 8,000 | | | | 8,216 | |
Nutrien Ltd. | | | | | | | | |
4.00% 12/15/26 (a) | | | 5,000 | | | | 4,830 | |
4.90% 06/01/43 (a) | | | 6,000 | | | | 5,968 | |
Occidental Petroleum Corp. | | | | | | | | |
4.10% 02/15/47 (a) | | | 8,000 | | | | 7,843 | |
4.20% 03/15/48 (a) | | | 5,000 | | | | 4,979 | |
Olin Corp.
5.00% 02/01/30 (a) | | | 23,000 | | | | 21,735 | |
Omnicom Group Inc./Omnicom Capital Inc.
3.63% 05/01/22 (a) | | | 13,000 | | | | 12,934 | |
Oncor Electric Delivery Company LLC
3.80% 09/30/47 (a) | | | 2,000 | | | | 1,911 | |
Oracle Corp. | | | | | | | | |
1.90% 09/15/21 (a) | | | 16,000 | | | | 15,387 | |
2.40% 09/15/23 (a) | | | 8,000 | | | | 7,590 | |
3.25% 11/15/27 (a) | | | 9,000 | | | | 8,618 | |
3.80% 11/15/37 (a) | | | 5,000 | | | | 4,729 | |
4.00% 07/15/46 - 11/15/47 (a) | | | 14,000 | | | | 13,216 | |
See Notes to Schedule of Investments and Notes to Financial Statements.
| | | | |
| State Street Income V.I.S. Fund | | | 11 | |
State Street Income V.I.S. Fund
Schedule of Investments, continued — June 30, 2018 (Unaudited)
| | | | | | | | |
| | | Principal
Amount $ | | | Fair Value $ | |
| | | | | | | | |
Oshkosh Corp.
5.38% 03/01/25 (a) | | | 10,000 | | | | 10,250 | |
Owens Corning
4.40% 01/30/48 (a) | | | 5,000 | | | | 4,169 | |
Pacific Gas & Electric Co.
3.40% 08/15/24 (a) | | | 68,000 | | | | 63,885 | |
PacifiCorp
6.25% 10/15/37 (a) | | | 8,000 | | | | 10,244 | |
Packaging Corporation of America
3.40% 12/15/27 (a) | | | 5,000 | | | | 4,720 | |
Parker-Hannifin Corp.
3.25% 03/01/27 (a) | | | 34,000 | | | | 32,800 | |
Party City Holdings Inc.
6.13% 08/15/23 (a)(h) | | | 8,000 | | | | 8,040 | |
Penske Automotive Group Inc.
5.38% 12/01/24 (a) | | | 19,000 | | | | 18,810 | |
PepsiCo Inc.
3.45% 10/06/46 (a) | | | 6,000 | | | | 5,359 | |
Petroleos Mexicanos | | | | | | | | |
5.35% 02/12/28 (a)(h) | | | 10,000 | | | | 9,450 | |
5.63% 01/23/46 (a) | | | 10,000 | | | | 8,504 | |
6.35% 02/12/48 (a)(h) | | | 10,000 | | | | 9,010 | |
6.38% 01/23/45 (a) | | | 12,000 | | | | 11,016 | |
6.50% 03/13/27 (a) | | | 25,000 | | | | 25,589 | |
6.75% 09/21/47 (a) | | | 20,000 | | | | 18,871 | |
Pfizer Inc. | | | | | | | | |
3.00% 12/15/26 (a) | | | 9,000 | | | | 8,653 | |
4.13% 12/15/46 (a) | | | 9,000 | | | | 9,073 | |
4.40% 05/15/44 (a) | | | 6,000 | | | | 6,251 | |
Philip Morris International Inc.
4.13% 03/04/43 (a) | | | 9,000 | | | | 8,346 | |
Phillips 66
3.90% 03/15/28 (a) | | | 13,000 | | | | 12,745 | |
Phillips 66 Partners LP | | | | | | | | |
3.75% 03/01/28 (a) | | | 7,000 | | | | 6,551 | |
4.68% 02/15/45 (a) | | | 8,000 | | | | 7,473 | |
Pilgrim’s Pride Corp.
5.88% 09/30/27 (a)(h) | | | 15,000 | | | | 13,950 | |
Plains All American Pipeline LP/PAA Finance Corp. | | | | | | | | |
4.70% 06/15/44 (a) | | | 8,000 | | | | 7,040 | |
5.75% 01/15/20 (a) | | | 8,000 | | | | 8,260 | |
PPL Capital Funding Inc.
3.10% 05/15/26 (a) | | | 23,000 | | | | 21,414 | |
Precision Castparts Corp.
4.38% 06/15/45 (a) | | | 12,000 | | | | 12,457 | |
Prudential Financial Inc. (4.50% fixed rate until 09/15/27; 2.38% + 3 month USD LIBOR thereafter)
4.50% 09/15/47 (a)(c) | | | 8,000 | | | | 7,344 | |
| | | | | | | | |
| | | Principal
Amount $ | | | Fair Value $ | |
Prudential Financial Inc. (5.38% fixed rate until 05/15/25; 3.03% + 3 month USD LIBOR thereafter)
5.38% 05/15/45 (a)(c) | | | 15,000 | | | | 14,908 | |
Public Service Company of Colorado
3.70% 06/15/28 (a) | | | 15,000 | | | | 15,087 | |
Public Service Electric & Gas Co.
2.38% 05/15/23 (a) | | | 47,000 | | | | 44,868 | |
PulteGroup Inc.
5.50% 03/01/26 (a) | | | 20,000 | | | | 19,900 | |
QUALCOMM Inc. | | | | | | | | |
2.90% 05/20/24 (a) | | | 2,000 | | | | 1,889 | |
3.00% 05/20/22 (a) | | | 5,000 | | | | 4,923 | |
3.25% 05/20/27 (a) | | | 2,000 | | | | 1,864 | |
4.30% 05/20/47 (a) | | | 5,000 | | | | 4,662 | |
Range Resources Corp.
5.00% 08/15/22 (a) | | | 23,000 | | | | 22,741 | |
Realty Income Corp.
3.00% 01/15/27 (a) | | | 9,000 | | | | 8,244 | |
Republic Services Inc.
3.38% 11/15/27 (a) | | | 6,000 | | | | 5,686 | |
Reynolds American Inc.
4.45% 06/12/25 (a) | | | 8,000 | | | | 8,047 | |
Rio Tinto Finance USA PLC
4.13% 08/21/42 (a) | | | 8,000 | | | | 7,878 | |
Rockwell Collins Inc.
3.50% 03/15/27 (a) | | | 7,000 | | | | 6,664 | |
Rogers Communications Inc.
5.00% 03/15/44 (a) | | | 6,000 | | | | 6,238 | |
RPM International Inc.
3.75% 03/15/27 (a) | | | 9,000 | | | | 8,598 | |
RSP Permian Inc.
5.25% 01/15/25 (a) | | | 18,000 | | | | 19,255 | |
Ryder System Inc.
2.45% 09/03/19 (a) | | | 53,000 | | | | 52,662 | |
Sabine Pass Liquefaction LLC | | | | | | | | |
4.20% 03/15/28 (a) | | | 8,000 | | | | 7,714 | |
5.00% 03/15/27 (a) | | | 6,000 | | | | 6,123 | |
salesforce.com Inc. | | | | | | | | |
3.25% 04/11/23 (a) | | | 13,000 | | | | 12,928 | |
3.70% 04/11/28 (a) | | | 17,000 | | | | 16,865 | |
Santander Holdings USA Inc. | | | | | | | | |
2.65% 04/17/20 (a) | | | 27,000 | | | | 26,751 | |
3.70% 03/28/22 (a) | | | 27,000 | | | | 26,617 | |
4.40% 07/13/27 (a) | | | 8,000 | | | | 7,655 | |
Schlumberger Holdings Corp.
3.00% 12/21/20 (a)(h) | | | 10,000 | | | | 9,940 | |
Select Income REIT
4.25% 05/15/24 (a) | | | 11,000 | | | | 10,511 | |
Sempra Energy | | | | | | | | |
3.80% 02/01/38 (a) | | | 6,000 | | | | 5,446 | |
4.00% 02/01/48 (a) | | | 6,000 | | | | 5,400 | |
See Notes to Schedule of Investments and Notes to Financial Statements.
| | |
| 12 | | State Street Income V.I.S. Fund |
State Street Income V.I.S. Fund
Schedule of Investments, continued — June 30, 2018 (Unaudited)
| | | | | | | | |
| | | Principal
Amount $ | | | Fair Value $ | |
| | | | | | | | |
Shell International Finance BV | | | | | | | | |
3.25% 05/11/25 (a) | | | 9,000 | | | | 8,818 | |
3.40% 08/12/23 (a) | | | 9,000 | | | | 9,014 | |
3.75% 09/12/46 (a) | | | 7,000 | | | | 6,528 | |
4.13% 05/11/35 (a) | | | 9,000 | | | | 9,131 | |
Shire Acquisitions Investments Ireland DAC | | | | | | | | |
2.40% 09/23/21 (a) | | | 7,000 | | | | 6,701 | |
2.88% 09/23/23 (a) | | | 7,000 | | | | 6,590 | |
3.20% 09/23/26 (a) | | | 5,000 | | | | 4,573 | |
Simon Property Group LP
3.38% 06/15/27 (a) | | | 10,000 | | | | 9,604 | |
Sinclair Television Group Inc.
5.38% 04/01/21 (a) | | | 29,000 | | | | 29,217 | |
Smithfield Foods Inc. | | | | | | | | |
2.70% 01/31/20 (a)(h) | | | 8,000 | | | | 7,885 | |
4.25% 02/01/27 (a)(h) | | | 13,000 | | | | 12,509 | |
South Carolina Electric & Gas Co.
4.10% 06/15/46 (a) | | | 2,000 | | | | 1,819 | |
Southern California Edison Co.
2.40% 02/01/22 (a) | | | 20,000 | | | | 19,323 | |
Southern Copper Corp.
5.88% 04/23/45 (a) | | | 8,000 | | | | 8,526 | |
Southwestern Electric Power Co.
2.75% 10/01/26 (a) | | | 11,000 | | | | 10,087 | |
Spectra Energy Partners LP | | | | | | | | |
3.38% 10/15/26 (a) | | | 2,000 | | | | 1,854 | |
4.50% 03/15/45 (a) | | | 5,000 | | | | 4,631 | |
Sprint Corp.
7.63% 02/15/25 (a) | | | 50,000 | | | | 51,250 | |
Standard Industries Inc.
5.38% 11/15/24 (a)(h) | | | 52,000 | | | | 51,350 | |
Suncor Energy Inc.
4.00% 11/15/47 (a) | | | 3,000 | | | | 2,823 | |
Sysco Corp.
3.25% 07/15/27 (a) | | | 8,000 | | | | 7,500 | |
T-Mobile USA Inc.
4.50% 02/01/26 (a) | | | 29,000 | | | | 27,080 | |
Tampa Electric Co.
4.35% 05/15/44 (a) | | | 18,000 | | | | 18,318 | |
Target Corp.
2.50% 04/15/26 (a) | | | 11,000 | | | | 10,115 | |
Teachers Insurance & Annuity Association of America
4.90% 09/15/44 (a)(h) | | | 9,000 | | | | 9,474 | |
Teck Resources Ltd.
4.75% 01/15/22 (a) | | | 14,000 | | | | 14,029 | |
Tenet Healthcare Corp. | | | | | | | | |
4.75% 06/01/20 (a) | | | 16,000 | | | | 16,040 | |
6.00% 10/01/20 (a) | | | 44,000 | | | | 45,210 | |
Teva Pharmaceutical Finance Netherlands III BV | | | | | | | | |
1.70% 07/19/19 (a) | | | 46,000 | | | | 44,942 | |
| | | | | | | | |
| | | Principal
Amount $ | | | Fair Value $ | |
2.20% 07/21/21 (a) | | | 8,000 | | | | 7,420 | |
2.80% 07/21/23 (a) | | | 31,000 | | | | 26,727 | |
Texas Instruments Inc.
4.15% 05/15/48 (a) | | | 7,000 | | | | 7,105 | |
The Allstate Corp.
4.20% 12/15/46 (a) | | | 8,000 | | | | 7,857 | |
The Allstate Corp. (5.75% fixed rate until 08/15/23; 2.94% + 3 month USD LIBOR thereafter)
5.75% 08/15/53 (a)(c) | | | 25,000 | | | | 25,720 | |
The Bank of New York Mellon Corp. (2.66% fixed rate until 05/16/22; 0.63% + 3 month USD LIBOR thereafter)
2.66% 05/16/23 (a)(c) | | | 15,000 | | | | 14,553 | |
The Bank of New York Mellon Corp. (4.63% fixed rate until 09/20/26; 3.13% + 3 month USD LIBOR thereafter)
4.63% 12/29/49 (a)(c) | | | 45,000 | | | | 42,581 | |
The Bank of Nova Scotia (4.65% fixed rate until 10/12/22; 2.65% + 3 month USD LIBOR thereafter)
4.65% 12/31/99 (a)(c) | | | 21,000 | | | | 19,013 | |
The Boeing Co. | | | | | | | | |
3.25% 03/01/28 (a) | | | 9,000 | | | | 8,780 | |
3.55% 03/01/38 (a) | | | 11,000 | | | | 10,596 | |
The Dow Chemical Co.
4.25% 10/01/34 (a) | | | 11,000 | | | | 10,626 | |
The George Washington University
4.13% 09/15/48 | | | 8,000 | | | | 8,125 | |
The Goldman Sachs Group Inc. | | | | | | | | |
2.30% 12/13/19 (a) | | | 51,000 | | | | 50,435 | |
2.35% 11/15/21 (a) | | | 24,000 | | | | 23,105 | |
2.63% 04/25/21 (a) | | | 26,000 | | | | 25,421 | |
2.90% 07/19/18 (a) | | | 30,000 | | | | 30,006 | |
3.85% 01/26/27 (a) | | | 8,000 | | | | 7,686 | |
4.25% 10/21/25 (a) | | | 4,000 | | | | 3,938 | |
4.80% 07/08/44 (a) | | | 8,000 | | | | 7,977 | |
5.15% 05/22/45 (a) | | | 13,000 | | | | 12,891 | |
The Goldman Sachs Group Inc. (2.91% fixed rate until 06/05/22; 1.05% + 3 month USD LIBOR thereafter)
2.91% 06/05/23 (a)(c) | | | 24,000 | | | | 23,166 | |
The Goldman Sachs Group Inc. (3.81% fixed rate until 04/23/28; 1.16% + 3 month USD LIBOR thereafter)
3.81% 04/23/29 (a)(c) | | | 8,000 | | | | 7,608 | |
See Notes to Schedule of Investments and Notes to Financial Statements.
| | | | |
| State Street Income V.I.S. Fund | | | 13 | |
State Street Income V.I.S. Fund
Schedule of Investments, continued — June 30, 2018 (Unaudited)
| | | | | | | | |
| | | Principal
Amount $ | | | Fair Value $ | |
| | | | | | | | |
The Goldman Sachs Group Inc. (4.02% fixed rate until 10/31/37; 1.37% + 3 month USD LIBOR thereafter)
4.02% 10/31/38 (a)(c) | | | 8,000 | | | | 7,278 | |
The Goldman Sachs Group Inc. (4.22% fixed rate until 05/01/28; 1.30% + 3 month USD LIBOR thereafter)
4.22% 05/01/29 (a)(c) | | | 12,000 | | | | 11,829 | |
The Hartford Financial Services Group Inc.
2.13% + 3 month USD LIBOR
4.47% 02/12/47 (a)(c)(h) | | | 10,000 | | | | 9,488 | |
The Home Depot Inc. | | | | | | | | |
3.35% 09/15/25 (a) | | | 4,000 | | | | 3,936 | |
3.50% 09/15/56 (a) | | | 9,000 | | | | 7,698 | |
3.90% 06/15/47 (a) | | | 9,000 | | | | 8,625 | |
The Kroger Co. | | | | | | | | |
2.95% 11/01/21 (a) | | | 24,000 | | | | 23,652 | |
4.65% 01/15/48 (a) | | | 6,000 | | | | 5,667 | |
The Men’s Wearhouse Inc.
7.00% 07/01/22 (a) | | | 11,000 | | | | 11,344 | |
The Mosaic Co.
5.63% 11/15/43 (a) | | | 5,000 | | | | 5,031 | |
The Nielsen Company Luxembourg Sarl
5.00% 02/01/25 (a)(h) | | | 16,000 | | | | 15,240 | |
The Sherwin-Williams Co. | | | | | | | | |
2.25% 05/15/20 (a) | | | 11,000 | | | | 10,830 | |
2.75% 06/01/22 (a) | | | 7,000 | | | | 6,781 | |
The Southern Co. | | | | | | | | |
1.85% 07/01/19 (a) | | | 45,000 | | | | 44,573 | |
4.40% 07/01/46 (a) | | | 8,000 | | | | 7,815 | |
The Toronto-Dominion Bank (3.63% fixed rate until 09/15/26; 2.21% + USD 5 year Swap Rate thereafter)
3.63% 09/15/31 (a)(c) | | | 26,000 | | | | 24,439 | |
The Walt Disney Co.
4.13% 06/01/44 (a) | | | 8,000 | | | | 7,713 | |
Time Warner Cable LLC
4.50% 09/15/42 (a) | | | 5,000 | | | | 4,136 | |
6.55% 05/01/37 (a) | | | 9,000 | | | | 9,515 | |
Transcontinental Gas Pipe Line Company LLC
4.00% 03/15/28 (a)(h) | | | 8,000 | | | | 7,832 | |
Tyco Electronics Group S.A.
2.35% 08/01/19 (a) | | | 35,000 | | | | 34,819 | |
3.13% 08/15/27 (a) | | | 9,000 | | | | 8,424 | |
Tyson Foods Inc. | | | | | | | | |
2.65% 08/15/19 (a) | | | 7,000 | | | | 6,972 | |
4.55% 06/02/47 (a) | | | 4,000 | | | | 3,829 | |
| | | | | | | | |
| | | Principal
Amount $ | | | Fair Value $ | |
U.S. Bancorp (5.13% fixed rate until 01/15/21; 3.49% + 3 month USD LIBOR thereafter)
5.13% 12/29/49 (a)(c) | | | 45,000 | | | | 46,181 | |
Union Pacific Corp.
3.20% 06/08/21 (a) | | | 19,000 | | | | 19,042 | |
3.50% 06/08/23 (a) | | | 18,000 | | | | 18,023 | |
3.60% 09/15/37 (a) | | | 4,000 | | | | 3,657 | |
4.10% 09/15/67 (a) | | | 6,000 | | | | 5,265 | |
United Rentals North America Inc.
4.88% 01/15/28 (a) | | | 15,000 | | | | 13,870 | |
United Technologies Corp.
4.50% 06/01/42 (a) | | | 4,000 | | | | 3,939 | |
UnitedHealth Group Inc.
4.75% 07/15/45 (a) | | | 8,000 | | | | 8,576 | |
Vale Overseas Ltd.
4.38% 01/11/22 (a) | | | 4,000 | | | | 4,060 | |
6.25% 08/10/26 (a) | | | 14,000 | | | | 15,191 | |
6.88% 11/10/39 (a) | | | 8,000 | | | | 9,038 | |
Vale S.A.
5.63% 09/11/42 (a) | | | 5,000 | | | | 5,071 | |
Valeant Pharmaceuticals International Inc.
7.00% 03/15/24 (a)(h) | | | 44,000 | | | | 46,134 | |
Ventas Realty LP
3.25% 10/15/26 (a) | | | 23,000 | | | | 21,335 | |
Verizon Communications Inc. | | | | | | | | |
3.38% 02/15/25 (a) | | | 8,000 | | | | 7,674 | |
4.33% 09/21/28 (h) | | | 13,000 | | | | 12,907 | |
4.40% 11/01/34 (a) | | | 11,000 | | | | 10,369 | |
4.67% 03/15/55 (a) | | | 8,000 | | | | 7,095 | |
4.86% 08/21/46 (a) | | | 15,000 | | | | 14,046 | |
5.01% 04/15/49 (a) | | | 7,000 | | | | 6,816 | |
5.25% 03/16/37 (a) | | | 9,000 | | | | 9,250 | |
Viacom Inc. | | | | | | | | |
3.45% 10/04/26 (a) | | | 9,000 | | | | 8,216 | |
5.25% 04/01/44 (a) | | | 3,000 | | | | 2,839 | |
Virginia Electric & Power Co.
4.00% 11/15/46 (a) | | | 9,000 | | | | 8,623 | |
Visa Inc. | | | | | | | | |
3.15% 12/14/25 (a) | | | 8,000 | | | | 7,737 | |
4.30% 12/14/45 (a) | | | 9,000 | | | | 9,340 | |
Vodafone Group PLC | | | | | | | | |
4.38% 05/30/28 (a) | | | 17,000 | | | | 16,797 | |
5.25% 05/30/48 (a) | | | 5,000 | | | | 4,978 | |
Vornado Realty LP
3.50% 01/15/25 (a) | | | 8,000 | | | | 7,679 | |
Vulcan Materials Co.
3.90% 04/01/27 (a) | | | 8,000 | | | | 7,657 | |
Wabtec Corp.
3.45% 11/15/26 (a) | | | 2,000 | | | | 1,835 | |
Walgreens Boots Alliance Inc.
4.65% 06/01/46 (a) | | | 6,000 | | | | 5,536 | |
See Notes to Schedule of Investments and Notes to Financial Statements.
| | |
| 14 | | State Street Income V.I.S. Fund |
State Street Income V.I.S. Fund
Schedule of Investments, continued — June 30, 2018 (Unaudited)
| | | | | | | | |
| | | Principal
Amount $ | | | Fair Value $ | |
| | | | | | | | |
Walmart Inc. | | | | | | | | |
3.63% 12/15/47 (a) | | | 8,000 | | | | 7,458 | |
3.70% 06/26/28 (a) | | | 17,000 | | | | 17,162 | |
3.95% 06/28/38 (a) | | | 7,000 | | | | 7,028 | |
4.05% 06/29/48 (a) | | | 7,000 | | | | 7,054 | |
Warner Media LLC
5.35% 12/15/43 (a) | | | 9,000 | | | | 8,786 | |
WEC Energy Group Inc.
3.55% 06/15/25 (a) | | | 15,000 | | | | 14,758 | |
WellCare Health Plans Inc.
5.25% 04/01/25 (a) | | | 19,000 | | | | 18,905 | |
Wells Fargo & Co. | | | | | | | | |
2.63% 07/22/22 (a) | | | 24,000 | | | | 23,082 | |
3.90% 05/01/45 (a) | | | 4,000 | | | | 3,632 | |
4.75% 12/07/46 (a) | | | 11,000 | | | | 10,617 | |
Wells Fargo & Co. (5.88% fixed rate until 06/15/25; 3.99% + 3 month USD LIBOR thereafter)
5.88% 12/29/49 (a)(c) | | | 28,000 | | | | 28,875 | |
Wells Fargo & Co. (5.90% fixed rate until 06/15/24; 3.11% + 3 month USD LIBOR thereafter)
5.90% 12/29/49 (a)(c) | | | 26,000 | | | | 26,097 | |
Wells Fargo & Co. 3.77% + 3 month USD LIBOR
6.11% 03/29/49 (a)(c) | | | 16,000 | | | | 16,204 | |
Western Digital Corp.
4.75% 02/15/26 (a) | | | 10,000 | | | | 9,717 | |
Western Gas Partners LP | | | | | | | | |
4.00% 07/01/22 (a) | | | 33,000 | | | | 32,708 | |
5.38% 06/01/21 (a) | | | 12,000 | | | | 12,445 | |
Westlake Chemical Corp. | | | | | | | | |
3.60% 08/15/26 (a) | | | 7,000 | | | | 6,647 | |
4.38% 11/15/47 (a) | | | 2,000 | | | | 1,845 | |
5.00% 08/15/46 (a) | | | 7,000 | | | | 7,081 | |
WestRock Co.
3.00% 09/15/24 (a)(h) | | | 8,000 | | | | 7,581 | |
William Lyon Homes Inc.
5.88% 01/31/25 (a) | | | 10,000 | | | | 9,375 | |
Williams Partners LP | | | | | | | | |
3.75% 06/15/27 (a) | | | 7,000 | | | | 6,614 | |
4.85% 03/01/48 (a) | | | 9,000 | | | | 8,622 | |
4.90% 01/15/45 (a) | | | 7,000 | | | | 6,714 | |
5.40% 03/04/44 (a) | | | 4,000 | | | | 4,111 | |
Willis North America Inc.
3.60% 05/15/24 (a) | | | 12,000 | | | | 11,619 | |
WPP Finance 2010
3.75% 09/19/24 (a) | | | 14,000 | | | | 13,548 | |
Wynn Las Vegas LLC/Wynn Las Vegas Capital Corp.
5.25% 05/15/27 (a)(h) | | | 18,000 | | | | 16,830 | |
Xilinx Inc.
2.95% 06/01/24 (a) | | | 9,000 | | | | 8,552 | |
| | | | | | | | |
| | | Principal
Amount $ | | | Fair Value $ | |
XPO Logistics Inc.
6.50% 06/15/22 (a)(h) | | | 17,000 | | | | 17,405 | |
Yamana Gold Inc.
4.63% 12/15/27 (a) | | | 10,000 | | | | 9,607 | |
Zoetis Inc.
3.00% 09/12/27 (a) | | | 7,000 | | | | 6,483 | |
| | | | | | | | |
| | | | | | | 8,703,834 | |
| | | | | | | | |
|
Non-Agency Collateralized Mortgage Obligations - 3.8% | |
BANK 2018-BNK10
4.16% 02/15/61 (a)(c) | | | 16,831 | | | | 16,475 | |
BANK 2018-BNK11
4.50% 03/15/61 (c) | | | 12,000 | | | | 12,296 | |
BANK 2018-BNK12
4.55% 05/15/61 (c) | | | 17,333 | | | | 17,231 | |
BXP Trust 2017-GM
3.38% 06/13/39 (a)(h) | | | 61,000 | | | | 59,250 | |
Citigroup Commercial Mortgage Trust 2016-P6 | | | | | | | | |
3.72% 12/10/49 (a)(c) | | | 98,309 | | | | 98,341 | |
4.03% 12/10/49 (a)(c) | | | 31,273 | | | | 31,688 | |
Citigroup Commercial Mortgage Trust 2018-C5
4.51% 06/10/51 | | | 21,000 | | | | 21,654 | |
COMM 2014-CR14 Mortgage Trust
4.53% 02/10/47 (a)(c) | | | 25,000 | | | | 26,025 | |
GS Mortgage Securities Trust 2016-GS3
2.85% 10/10/49 (a) | | | 68,000 | | | | 63,915 | |
GS Mortgage Securities Trust 2017-GS5
3.67% 03/10/50 (a) | | | 39,990 | | | | 39,885 | |
GS Mortgage Securities Trust 2017-GS8
3.47% 11/10/50 (a) | | | 63,977 | | | | 62,454 | |
GS Mortgage Securities Trust 2018-GS9
4.14% 03/10/51 (c) | | | 25,000 | | | | 25,427 | |
JPMBB Commercial Mortgage Securities Trust 2013-C12
4.17% 07/15/45 (a)(c) | | | 15,000 | | | | 15,228 | |
LB-UBS Commercial Mortgage Trust 2007-C6 | | | | | | | | |
6.11% 07/15/40 (a)(c) | | | 1,780 | | | | 1,780 | |
6.11% 07/15/40 (a)(h) | | | 3,545 | | | | 3,544 | |
MASTR Alternative Loan Trust 2003-5
5.00% 08/25/18 (a)(e)** | | | 788 | | | | — | |
Morgan Stanley Bank of America Merrill Lynch Trust 2015-C20
1.52% 02/15/48 (a)(c)(e) | | | 315,935 | | | | 19,706 | |
See Notes to Schedule of Investments and Notes to Financial Statements.
| | | | |
| State Street Income V.I.S. Fund | | | 15 | |
State Street Income V.I.S. Fund
Schedule of Investments, continued — June 30, 2018 (Unaudited)
| | | | | | | | |
| | | Principal
Amount $ | | | Fair Value $ | |
| | | | | | | | |
Morgan Stanley Bank of America Merrill Lynch Trust 2015-C21
1.09% 03/15/48 (a)(c)(e) | | | 382,083 | | | | 17,865 | |
Morgan Stanley Capital I Trust 2006-IQ11
6.37% 10/15/42 (a)(c) | | | 50,000 | | | | 51,075 | |
Morgan Stanley Capital I Trust 2006-T21
5.27% 10/12/52 (a)(c) | | | 9,937 | | | | 9,999 | |
Morgan Stanley Capital I Trust 2016-UBS9
1.38% 03/15/49 (a)(c)(e) | | | 306,366 | | | | 20,445 | |
Wells Fargo Commercial Mortgage Trust 2017-RB1
3.64% 03/15/50 (a) | | | 43,392 | | | | 42,987 | |
Wells Fargo Commercial Mortgage Trust 2018-C44
4.69% 05/15/51 | | | 12,000 | | | | 12,341 | |
WFRBS Commercial Mortgage Trust 2013-C17
4.26% 12/15/46 (a) | | | 25,000 | | | | 25,544 | |
WFRBS Commercial Mortgage Trust 2014-LC14
4.35% 03/15/47 (a)(c) | | | 58,000 | | | | 59,723 | |
| | | | | | | | |
| | | | | | | 754,878 | |
| | | | | | | | |
|
Sovereign Bonds - 0.3% | |
Government of Mexico | | | | | | | | |
4.00% 10/02/23 | | | 14,000 | | | | 14,057 | |
4.75% 03/08/44 (a) | | | 20,000 | | | | 18,796 | |
Government of Peru
5.63% 11/18/50 (a) | | | 11,000 | | | | 12,807 | |
Government of Uruguay
5.10% 06/18/50 | | | 14,040 | | | | 13,819 | |
| | | | | | | | |
| | | | | | | 59,479 | |
| | | | | | | | |
|
Municipal Bonds and Notes - 1.8% | |
American Municipal Power Inc.
6.27% 02/15/50 (a) | | | 15,000 | | | | 19,132 | |
Commonwealth of Massachusetts
5.00% 01/01/45 | | | 35,000 | | | | 40,340 | |
Metropolitan St. Louis Sewer District
5.00% 05/01/47 | | | 35,000 | | | | 40,421 | |
New Jersey Transportation Trust Fund Authority
6.88% 12/15/39 (a) | | | 15,000 | | | | 15,405 | |
New York City Water & Sewer System
5.00% 06/15/40 | | | 100,000 | | | | 115,815 | |
Port Authority of New York &
New Jersey
4.46% 10/01/62 (a) | | | 40,000 | | | | 42,483 | |
| | | | | | | | |
| | | Principal
Amount $ | | | Fair Value $ | |
State of California | | | | | | | | |
4.60% 04/01/38 | | | 15,000 | | | | 15,712 | |
5.70% 11/01/21 (a) | | | 40,000 | | | | 43,478 | |
State of Illinois
5.10% 06/01/33 (a) | | | 10,000 | | | | 9,464 | |
The University of Texas System
3.35% 08/15/47 (a) | | | 10,000 | | | | 9,196 | |
| | | | | | | | |
| | | | | | | 351,446 | |
| | | | | | | | |
|
FNMA (TBA) - 0.0%* | |
Lehman
5.50% TBA (a)(i)(j) | | | 50,705 | | | | 1,095 | |
| | | | | | | | |
| |
Total Bonds and Notes
(Cost $19,449,740) | | | | 19,304,610 | |
| | | | | | | | |
| | |
| | | Number of Shares | | | | |
| | |
| Domestic Equity - 0.1% | | | | | | | | |
Preferred Stock - 0.1% | | | | | | | | |
Wells Fargo & Co.
3.09% + 3 month USD LIBOR
(Cost $23,300) (a)(c) | | | 932 | | | | 24,139 | |
| | | | | | | | |
| | |
| | | Principal
Amount | | | | |
| | |
| Purchased Options - 0.0%* | | | | | | | | |
Purchased Option - 0.0%* | | | | | | | | |
10 Yr. U.S. Treasury Notes Futures Options (Strike price 120.50 USD, expiration date 08/24/2018)
(Cost $5,085) | | | 12,000 | | | | 6,750 | |
| | | | | | | | |
| | |
Total Investments in Securities
(Cost $19,478,125) | | | | | | | 19,335,499 | |
| | | | | | | | |
| |
| Short-Term Investments - 4.3% | | | | | |
State Street Institutional U.S. Government Money Market Fund - Class G Shares 1.86%
(Cost $860,845) (a)(f)(k) | | | 860,845 | | | | 860,845 | |
| | | | | | | | |
| |
Total Investments
(Cost $20,338,970) | | | | 20,196,344 | |
| |
Liabilities in Excess of Other Assets,
net - (2.0)% | | | | (409,336 | ) |
| | | | | | | | |
| | |
| NET ASSETS - 100.0% | | | | | | | 19,787,008 | |
| | | | | | | | |
See Notes to Schedule of Investments and Notes to Financial Statements.
| | |
| 16 | | State Street Income V.I.S. Fund |
State Street Income V.I.S. Fund
Schedule of Investments, continued — June 30, 2018 (Unaudited)
Other Information:
Centrally Cleared Credit Default Swaps - Buy Protection
| | | | | | | | | | | | | | | | | | | | | | | | | | |
Reference Entity | | Counterparty | | Notional
Amount
(000s omitted) | | | Contract
annual
Fixed Rate/ Payment
Frequency | | | Termination
Date | | | Market
Value | | | Unamortized
Upfront
Payments
Received | | | Unrealized
Appreciation | |
| | | | | | | | | | | | | | | | | | | | | | | | | | |
Markit CDX North America Investment Grade Index | | CME Group, Inc. | | $ | 529 | | |
| 1.00%/
Quaterly |
| | | 12/20/22 | | | $ | (9,097 | ) | | $ | (9,970 | ) | | $ | 873 | |
| | | | | | | | | | | | | | | | | | | | | | | | | | |
Centrally Cleared Interest Rate Swaps
| | | | | | | | | | | | | | | | | | | | | | | | | | | | | | | | |
| Counterparty | | Notional
Amount
(000s
omitted) | | | Fund
Pays/ Receives
Fixed
Rate/
Payment
Frequency | | | Floating Rate | | | Contract
annual
Fixed
Rate | | | Termination
Date | | | Market
Value | | | Unamortized
Upfront
Payments
Received | | | Unrealized
Depreciation | |
| | | | | | | | | | | | | | | | | | | | | | | | | | | | | | | | |
CME Group, Inc. | | $ | 883 | | |
| Receives/
Quarterly |
| |
| 3 Month U.S. Dollar
LIBOR |
| | | 3.05% | | | | 11/19/21 | | | $ | (3,245 | ) | | $ | — | | | $ | (3,245 | ) |
CME Group, Inc. | | $ | 884 | | |
| Receives/
Quarterly |
| |
| 3 Month U.S. Dollar
LIBOR |
| | | 3.06% | | | | 11/19/21 | | | $ | (3,359 | ) | | $ | — | | | $ | (3,359 | ) |
| | | | | | | | | | | | | | | | | | | | | | | | | | | | | | | | |
| | | | | | | | | | | | | | | | | | | | | | | | | | | | | | $ | (6,604 | ) |
| | | | | | | | | | | | | | | | | | | | | | | | | | | | | | | | |
The Fund had the following long futures contracts open at June 30, 2018:
| | | | | | | | | | | | | | | | | | | | |
| Description | | Expiration
date | | | Number of
Contracts | | | Notional
Amount | | | Value | | | Unrealized
Appreciation | |
| | | | | | | | | | | | | | | | | | | | |
Ultra Long-Term U.S. Treasury Bond Futures | | | September 2018 | | | | 4 | | | | 613,255 | | | $ | 638,250 | | | $ | 24,995 | |
2 Yr. U.S. Treasury Notes Futures | | | September 2018 | | | | 14 | | | | 2,960,448 | | | | 2,965,593 | | | | 5,145 | |
5 Yr. U.S. Treasury Notes Futures | | | September 2018 | | | | 10 | | | | 1,128,769 | | | | 1,136,172 | | | | 7,403 | |
10 Yr. U.S. Treasury Ultra Futures | | | September 2018 | | | | 18 | | | | 2,140,026 | | | | 2,163,375 | | | | 23,349 | |
| | | | | | | | | | | | | | | | | | | | |
| | | | | | | | | | | | | | | | | | $ | 60,892 | |
| | | | | | | | | | | | | | | | | | | | |
The Fund had the following short futures contracts open at June 30, 2018:
| | | | | | | | | | | | | | | | | | | | |
| Description | | Expiration
date | | | Number of
Contracts | | | Notional
Amount | | | Value | | | Unrealized
Depreciation | |
| | | | | | | | | | | | | | | | | | | | |
U.S. Long Bond Futures | | | September 2018 | | | | 5 | | | | (713,702 | ) | | $ | (725,000 | ) | | $ | (11,298 | ) |
10 Yr. U.S. Treasury Ultra Futures | | | September 2018 | | | | 6 | | | | (763,019 | ) | | | (769,406 | ) | | | (6,387 | ) |
| | | | | | | | | | | | | | | | | | | | |
| | | | | | | | | | | | | | | | | | $ | (17,685 | ) |
| | | | | | | | | | | | | | | | | | | | |
| | | | | | | | | | | | | | | | | | $ | 43,207 | |
| | | | | | | | | | | | | | | | | | | | |
See Notes to Schedule of Investments and Notes to Financial Statements.
| | | | |
| State Street Income V.I.S. Fund | | | 17 | |
State Street Income V.I.S. Fund
Schedule of Investments, continued — June 30, 2018 (Unaudited)
The Fund had the following open Purchased Options contracts at June 30, 2018:
Purchased Options
| | | | | | | | | | | | | | | | | | | | | | | | | | | | | | | | |
| Description | | Counterparty | | | Strike
Price | | | Expiration
Date | | | Number of
Contracts | | | Notional
Amount | | | Market
Value | | | Premiums
Paid
(Received)
by Fund | | | Unrealized
Appreciation/
(Depreciation) | |
| | | | | | | | | | | | | | | | | | | | | | | | | | | | | | | | |
Calls | | | | | | | | | | | | | | | | | | | | | | | | | | | | | | | | |
10 Yr. U.S. Treasury Note Futures - September 2018 | | | Goldman Sachs & Co. | | | | 120.50 | | | | 8/24/2018 | | | | 12 | | | $ | 12,000 | | | $ | 6,750 | | | $ | 5,085 | | | $ | 1,665 | |
| | | | | | | | | | | | | | | | | | | | | | | | | | | | | | | | |
Total purchased option contracts | | | | | | | | | | | | | | | | | | | | | | | | | | | | | | $ | 1,665 | |
| | | | | | | | | | | | | | | | | | | | | | | | | | | | | | | | |
The Fund had the following open Written Options contracts at June 30, 2018:
Written Options
| | | | | | | | | | | | | | | | | | | | | | | | | | | | | | | | |
| Description | | Counterparty | | | Strike
Price | | | Expiration
Date | | | Number
of
Contracts | | | Notional
Amount | | | Market
Value | | | Premiums
Paid
(Received)
by Fund | | | Unrealized
Appreciation/
(Depreciation) | |
| | | | | | | | | | | | | | | | | | | | | | | | | | | | | | | | |
Calls | | | | | | | | | | | | | | | | | | | | | | | | | | | | | | | | |
U.S. Treasury Bond Futures - September 2018 | | | Goldman Sachs & Co. | | | | 145 | | | | 8/24/2018 | | | | (5 | ) | | $ | (5,000 | ) | | $ | (7,188 | ) | | $ | (5,414 | ) | | $ | (1,774 | ) |
| | | | | | | | | | | | | | | | | | | | | | | | | | | | | | | | |
Total written option contracts | | | | | | | | | | | | | | | | | | | | | | | | | | | | | | $ | (1,774 | ) |
| | | | | | | | | | | | | | | | | | | | | | | | | | | | | | | | |
During the period ended June 30, 2018 average notional values related to derivative contracts were as follows:
| | | | | | | | | | | | | | | | | | | | | | | | |
| | | Purchased Call Options | | | Written Call Options | | | Long Futures Contracts | | | Short Futures Contracts | | | Credit Default Swap Contracts | | | Interest Rate Swap Contracts | |
| | | | | | | | | | | | | | | | | | | | | | | | |
Average Notional Value | | $ | 1,811 | | | $ | 1,807 | | | $ | 5,564,685 | | | $ | 3,062,979 | | | $ | 447,723 | | | $ | 1,938,235 | |
See Notes to Schedule of Investments and Notes to Financial Statements.
| | |
| 18 | | State Street Income V.I.S. Fund |
State Street Income V.I.S. Fund
Notes to Schedule of Investments — June 30, 2018 (Unaudited)
The views expressed in this document reflect our judgment as of the publication date and are subject to change at any time without notice. The securities cited may not be representative of the Fund’s future investments and should not be construed as a recommendation to purchase or sell a particular security. See the Fund’s summary prospectus and statutory prospectus for complete descriptions of investment objectives, policies, risks and permissible investments.
| (a) | At June 30, 2018, all or a portion of this security was pledged to cover collateral requirements for futures, swaps and/or TBA’s. |
| (c) | Variable Rate Security - Interest rate shown is rate in effect at June 30, 2018. For securities based on a published reference rate and spread, the reference rate and spread are indicated in the description above. |
| (d) | Settlement is on a delayed delivery or when-issued basis with final maturity to be announced (TBA) in the future. |
| (e) | Interest only security. These securities represent the right to receive the monthly interest payments on an underlying pool of mortgages. Payments of principal on the pool reduce the value of the “interest only” holding. |
| (f) | Coupon amount represents effective yield. |
| (g) | Principal only security. These securities represent the right to receive the monthly principal payments on an underlying pool of mortgages. No payments of interest on the pool are passed through to the “principal only” holder. |
| (h) | Pursuant to Rule 144A of the Securities Act of 1933, as amended, these securities may be resold in transactions exempt from registration, normally to qualified institutional buyers. At June 30, 2018, these securities amounted to $1,208,208 or 6.11% of the net assets of the State Street Income V.I.S. Fund. These securities have been determined to be liquid using procedures established by the State Street Variable Insurance Series Funds, Inc.’s Board of Directors (the “Board”). |
| (i) | Security is in default. |
| (j) | Security is fair valued by the Oversight Committee, in accordance with the procedures approved by the Board. Security value is determined based on level 3 inputs. |
| (k) | Sponsored by SSGA Funds Management, Inc., the Fund’s investment adviser and administrator, and an affiliate of State Street Bank & Trust Co., the Fund’s sub-administrator, custodian and accounting agent. |
| † | Percentages are based on net assets as of June 30, 2018. |
| ** | Amount is less than $0.50. |
Abbreviations:
CMT - Constant Maturity Treasury
LIBOR - London Interbank Offered Rate
REIT - Real Estate Investment Trust
REMIC - Real Estate Mortgage Investment Conduit
STRIPS - Separate Trading of Registered Interest and Principal of Security
TBA - To Be Announced
The following table presents the Fund’s investments measured at fair value on a recurring basis at June 30, 2018:
| | | | | | | | | | | | | | | | |
| Investments | | Level 1 | | | Level 2 | | | Level 3 | | | Total | |
| | | | | | | | | | | | | | | | |
Investments in Securities | | | | | | | | | | | | | | | | |
U.S. Treasuries | | $ | — | | | $ | 6,457,973 | | | $ | — | | | $ | 6,457,973 | |
Agency Mortgage Backed | | | — | | | | 2,466,367 | | | | — | | | | 2,466,367 | |
Agency Collateralized Mortgage Obligations | | | — | | | | 74,429 | | | | — | | | | 74,429 | |
Asset Backed | | | — | | | | 435,109 | | | | — | | | | 435,109 | |
Corporate Notes | | | — | | | | 8,703,834 | | | | — | | | | 8,703,834 | |
Non-Agency Collateralized Mortgage Obligations | | | — | | | | 754,878 | | | | — | | | | 754,878 | |
Sovereign Bonds | | | — | | | | 59,479 | | | | — | | | | 59,479 | |
Municipal Bonds and Notes | | | — | | | | 351,446 | | | | — | | | | 351,446 | |
FNMA (TBA) | | | — | | | | — | | | | 1,095 | | | | 1,095 | |
Preferred Stock | | | 24,139 | | | | — | | | | — | | | | 24,139 | |
Purchased Options | | | 6,750 | | | | — | | | | — | | | | 6,750 | |
Short-Term Investments | | | 860,845 | | | | — | | | | — | | | | 860,845 | |
| | | | | | | | | | | | | | | | |
Total Investments in Securities | | $ | 891,734 | | | $ | 19,303,515 | | | $ | 1,095 | | | $ | 20,196,344 | |
| | | | | | | | | | | | | | | | |
See Notes to Schedule of Investments and Notes to Financial Statements.
| | | | |
| State Street Income V.I.S. Fund | | | 19 | |
State Street Income V.I.S. Fund
Notes to Schedule of Investments, continued — June 30, 2018 (Unaudited)
| | | | | | | | | | | | | | | | |
| Investments | | Level 1 | | | Level 2 | | | Level 3 | | | Total | |
| | | | | | | | | | | | | | | | |
Other Financial Instruments | | | | | | | | | | | | | | | | |
Written Options - Unrealized Depreciation | | $ | (1,774 | ) | | $ | | | | $ | | | | $ | (1,774 | ) |
Credit Default Swap Contracts - Unrealized Appreciation | | | — | | | | 873 | | | | — | | | | 873 | |
Credit Default Swap Contracts - Unrealized Depreciation | | | — | | | | (6,604 | ) | | | — | | | | (6,604 | ) |
Long Futures Contracts - Unrealized Appreciation | | | 60,892 | | | | — | | | | — | | | | 60,892 | |
Short Futures Contracts - Unrealized Depreciation | | | (17,685 | ) | | | — | | | | — | | | | (17,685 | ) |
| | | | | | | | | | | | | | | | |
Total Other Financial Instruments | | $ | 41,433 | | | $ | (5,731 | ) | | $ | — | | | $ | 35,702 | |
| | | | | | | | | | | | | | | | |
Affiliate Table
| | | | | | | | | | | | | | | | | | | | | | | | | | | | | | | | | | | | |
| | | Number
of Shares
Held at
12/31/17 | | | Value At
12/31/17 | | | Cost of
Purchases | | | Proceeds
from
Shares
Sold | | | Realized
Gain
(Loss) | | | Change in
Unrealized
Appreciation/ Depreciation | | | Number
of Shares
Held at
6/30/18 | | | Value at
6/30/18 | | | Dividend
Income | |
State Street Institutional U.S. Government Money Market Fund - Class G Shares | | | 587,481 | | | $ | 587,481 | | | $ | 4,245,844 | | | $ | 3,972,480 | | | | — | | | | — | | | | 860,845 | | | $ | 860,845 | | | $ | 5,142 | |
See Notes to Schedule of Investments and Notes to Financial Statements.
| | |
| 20 | | State Street Income V.I.S. Fund |
State Street Income V.I.S. Fund
Financial Highlights
Selected data based on a share outstanding throughout the periods indicated
| | | | | | | | | | | | | | | | | | | | | | | | |
| | | 6/30/18† | | | 12/31/17 | | | 12/31/16 | | | 12/31/15* | | | 12/31/14* | | | 12/31/13* | |
| Inception date | | | — | | | | — | | | | — | | | | — | | | | — | | | | 1/3/95 | |
| | | | | | |
Net asset value, beginning of period | | $ | 11.49 | | | $ | 11.37 | | | $ | 11.25 | | | $ | 11.56 | | | $ | 11.25 | | | $ | 11.71 | |
| | | | | | | | | | | | | | | | | | | | | | | | |
| | | | | |
Income/(loss) from investment operations: | | | | | | | | | | | | | | | | | | | | | |
Net investment income | | | 0.09 | (a) | | | 0.19 | (a) | | | 0.24 | | | | 0.25 | | | | 0.27 | | | | 0.30 | |
Net realized and unrealized gains/(losses) on investments | | | (0.38 | ) | | | 0.18 | | | | 0.09 | | | | (0.30 | ) | | | 0.31 | | | | (0.46 | ) |
| | | | | | | | | | | | | | | | | | | | | | | | |
Total income/(loss) from investment operations | | | (0.29 | ) | | | 0.37 | | | | 0.33 | | | | (0.05 | ) | | | 0.58 | | | | (0.16 | ) |
| | | | | | | | | | | | | | | | | | | | | | | | |
| | | | | | |
Less distributions from: | | | | | | | | | | | | | | | | | | | | | | | | |
Net investment income | | | — | | | | 0.25 | | | | 0.21 | | | | 0.26 | | | | 0.27 | | | | 0.30 | |
| | | | | | | | | | | | | | | | | | | | | | | | |
Total distributions | | | — | | | | 0.25 | | | | 0.21 | | | | 0.26 | | | | 0.27 | | | | 0.30 | |
| | | | | | | | | | | | | | | | | | | | | | | | |
Net asset value, end of period | | $ | 11.20 | | | $ | 11.49 | | | $ | 11.37 | | | $ | 11.25 | | | $ | 11.56 | | | $ | 11.25 | |
| | | | | | | | | | | | | | | | | | | | | | | | |
Total Return(b) | | | (2.52 | )% | | | 3.25 | % | | | 2.98 | % | | | (0.42 | )% | | | 5.12 | % | | | (1.34 | )% |
| | | | | | |
Ratios/Supplemental Data: | | | | | | | | | | | | | | | | | | | | | | | | |
Net assets, end of period (in thousands) | | $ | 19,787 | | | $ | 21,847 | | | $ | 25,582 | | | $ | 28,375 | | | $ | 32,668 | | | $ | 34,788 | |
| | | | | | |
Ratios to average net assets: | | | | | | | | | | | | | | | | | | | | | | | | |
Net expenses | | | 1.45 | %** | | | 1.36 | % | | | 1.15 | % | | | 1.06 | %(d) | | | 0.91 | %(c) | | | 0.79 | %(c) |
Gross expenses | | | 1.45 | %** | | | 1.36 | % | | | 1.15 | % | | | 1.11 | % | | | 0.91 | % | | | 0.80 | % |
Net investment income | | | 1.67 | %** | | | 1.62 | % | | | 1.98 | % | | | 2.06 | % | | | 2.14 | % | | | 2.41 | % |
Portfolio turnover rate | | | 82 | % | | | 255 | % | | | 220 | % | | | 241 | % | | | 282 | % | | | 256 | % |
Notes to Financial Highlights
| (a) | | Per share values have been calculated using the average share method. |
| (b) | | Total returns are historical and assume changes in share price, reinvestment of dividends and capital gains distributions and do not include the effect of insurance contract charges. Past performance does not guarantee future results. |
| (c) | | Includes contractual management fee waiver related to the Fund’s investments in the GE Institutional Money Market Fund (the “Money Market Fund”). The fee waiver agreement was terminated effective June 30, 2014 with the closure of the Money Market Fund. |
| (d) | | Reflects a voluntary reimbursement of other operating expenses by GE Asset Management, Inc., the Fund’s investment adviser and administrator prior to July 1, 2016. |
| * | | Beginning with the year ended December 31, 2016, the Fund was audited by Ernst & Young LLP. The previous years were audited by another independent registered public accounting firm. |
| ** | | Annualized for periods less than one year. |
The accompanying Notes are an integral part of these financial statements.
State Street Income V.I.S. Fund
Statement of Assets and Liabilities — June 30, 2018 (Unaudited)
| | | | |
| | | | |
Assets | | | | |
Investments in securities, at fair value (cost $19,478,125) | | $ | 19,335,499 | |
Short-term affiliated investments, at fair value | | | 860,845 | |
Cash collateral on deposit with broker for Swap Contracts | | | 27,420 | |
Receivable for investments sold | | | 9,627 | |
Income receivables | | | 140,919 | |
Income receivable from affiliated investments | | | 1,086 | |
Receivable for accumulated variation margin on futures | | | 44,395 | |
Other assets | | | 2 | |
| | | | |
Total assets | | | 20,419,793 | |
| | | | |
| |
Liabilities | | | | |
Due to custodian | | | 1,113 | |
Net cash collateral on futures contracts due to broker | | | 44,371 | |
Payable for investments purchased | | | 491,084 | |
Payable for fund shares redeemed | | | 10,653 | |
Payable for Accumulated variation margin on Swaps | | | 15,863 | |
Payable to the Adviser | | | 8,157 | |
Payable to the Custodian | | | 35,756 | |
Accrued other expenses | | | 18,600 | |
Written options (premiums received $5,414) | | | 7,188 | |
| | | | |
Total liabilities | | | 632,785 | |
| | | | |
| | | | |
Net Assets | | $ | 19,787,008 | |
| | | | |
| |
Net Assets Consist of: | | | | |
Capital paid in | | $ | 20,200,608 | |
Undistributed (distributions in excess of) net investment income | | | 178,335 | |
Accumulated net realized loss | | | (485,011 | ) |
Net unrealized appreciation (depreciation) on: | | | | |
Unaffiliated Investments | | | (142,626 | ) |
Futures | | | 43,207 | |
Options written | | | (1,774 | ) |
Swap contracts | | | (5,731 | ) |
| | | | |
Net Assets | | $ | 19,787,008 | |
| | | | |
| | | | |
Shares outstanding ($0.01 par value; unlimited shares authorized) | | | 1,766,432 | |
Net asset value per share | | $ | 11.20 | |
The accompanying Notes are an integral part of these financial statements.
| | |
| 22 | | Statement of Assets and Liabilities |
State Street Income V.I.S. Fund
Statement of Operations — For the period ended June 30, 2018 (Unaudited)
| | | | |
| | | | |
Investment Income | | | | |
Income | | | | |
Dividend | | $ | 639 | |
Interest | | | 312,412 | |
Income from affiliated investments | | | 5,142 | |
| | | | |
Total income | | | 318,193 | |
| | | | |
| |
Expenses | | | | |
Advisory and administration fees | | | 51,302 | |
Directors’ fees | | | 1,807 | |
Custody and accounting expenses | | | 71,120 | |
Professional fees | | | 16,031 | |
Other expenses | | | 7,925 | |
| | | | |
Total expenses | | | 148,185 | |
| | | | |
Net investment income | | $ | 170,008 | |
| | | | |
| |
Net Realized and Unrealized Gain (Loss) on Investments | | | | |
Realized gain (loss) on: | | | | |
Unaffiliated investments | | $ | (225,248 | ) |
Futures | | | (135,777 | ) |
Written options | | | 3,174 | |
Swap contracts | | | 21,723 | |
Increase (decrease) in unrealized appreciation/depreciation on: | |
Unaffiliated investments | | | (411,997 | ) |
Futures | | | 46,315 | |
Written option contracts | | | (1,774 | ) |
Swap contracts | | | 562 | |
| | | | |
| |
Net realized and unrealized gain (loss) on investments | | | (703,022 | ) |
| | | | |
Net Decrease in Net Assets Resulting from Operations | | $ | (533,014 | ) |
| | | | |
The accompanying Notes are an integral part of these financial statements.
| | | | |
| Statement of Operations | | | 23 | |
State Street Income V.I.S. Fund
Statements of Changes in Net Assets
| | | | | | | | |
| | | Six Months Ended June 30,
2018(a) | | | Year Ended December 31,
2017 | |
| | | | | | | | |
Increase (Decrease) in Net Assets | | | | | | | | |
| | |
Operations: | | | | | | | | |
Net investment income | | $ | 170,008 | | | $ | 378,325 | |
Net realized gain (loss) on investments, futures, written options and swap contracts | | | (336,128 | ) | | | 128,953 | |
Net increase (decrease) in unrealized appreciation/depreciation on investments, futures, written options and swap contracts | | | (366,894 | ) | | | 266,491 | |
| | | | | | | | |
Net increase (decrease) from operations | | | (533,014 | ) | | | 773,769 | |
| | | | | | | | |
| | |
Distributions to shareholders from: | | | | | | | | |
Net investment income | | | — | | | | (460,900 | ) |
| | | | | | | | |
Total distributions | | | — | | | | (460,900 | ) |
| | | | | | | | |
Increase (decrease) in assets from operations and distributions | | | (533,014 | ) | | | 312,869 | |
| | | | | | | | |
| | |
Share transactions: | | | | | | | | |
Proceeds from sale of shares | | | 193,954 | | | | 352,577 | |
Value of distributions reinvested | | | — | | | | 460,900 | |
Cost of shares redeemed | | | (1,720,944 | ) | | | (4,860,905 | ) |
| | | | | | | | |
Net increase (decrease) from share transactions | | | (1,526,990 | ) | | | (4,047,428 | ) |
| | | | | | | | |
| | |
Total increase (decrease) in net assets | | | (2,060,004 | ) | | | (3,734,559 | ) |
| | |
Net Assets | | | | | | | | |
Beginning of period | | | 21,847,012 | | | | 25,581,571 | |
| | | | | | | | |
| | |
End of period | | $ | 19,787,008 | | | $ | 21,847,012 | |
| | | | | | | | |
| | |
Undistributed (distributions in excess of) net investment income, end of period | | $ | 178,335 | | | $ | 8,327 | |
| | |
Changes in Fund Shares | | | | | | | | |
Shares sold | | | 17,177 | | | | 30,432 | |
Issued for distributions reinvested | | | — | | | | 40,253 | |
Shares redeemed | | | (152,646 | ) | | | (419,395 | ) |
| | | | | | | | |
Net decrease in fund shares | | | (135,469 | ) | | | (348,710 | ) |
| | | | | | | | |
The accompanying Notes are an integral part of these financial statements.
| | |
| 24 | | Statements of Changes in Net Assets |
State Street Income V.I.S. Fund
Notes to Financial Statements — June 30, 2018 (Unaudited)
| 1. | | Organization of the Company |
State Street Variable Insurance Series Funds, Inc. (the “Company”) was incorporated under the laws of the Commonwealth of Virginia on May 14, 1984 and is registered under the Investment Company Act of 1940, as amended (the “1940 Act”), as an open-end management investment company. The Company is currently composed of the following seven investment portfolios (collectively, the “Funds”): State Street U.S. Equity V.I.S. Fund, State Street S&P 500 Index V.I.S. Fund, State Street Premier Growth Equity V.I.S. Fund, State Street Small-Cap Equity V.I.S. Fund, State Street Total Return V.I.S. Fund, State Street Income V.I.S. Fund (the “Fund”) and State Street Real Estate Securities V.I.S. Fund. Each Fund is an investment company and accordingly follows the investment company accounting and reporting guidance of the Financial Accounting Standards Board (“FASB”) Accounting Standard Codification (“ASC”) Topic 946 Financial Services—Investment Companies. Each Fund is a diversified investment company within the meaning of the 1940 Act.
Shares of the Funds of the Company are offered only to insurance company separate accounts that fund certain variable life insurance contracts and variable annuity contracts.
The Company currently offers one share class (Class 1) of the Fund as an investment option for variable life insurance and variable annuity contracts.
Under the Company’s organizational documents, its officers and directors are indemnified against certain liabilities arising out of the performance of their duties to the Company. Additionally, in the normal course of business, the Company enters into contracts with service providers that contain general indemnification clauses. The Company’s maximum exposure under these arrangements is unknown as this would involve future claims that may be made against the Company that have not yet occurred.
| 2. | | Summary of Significant Accounting Policies |
The following is a summary of significant accounting policies followed by the Company in the preparation of its financial statements:
The preparation of financial statements in accordance with U.S. generally accepted accounting principles (“U.S. GAAP”) requires management to make estimates and assumptions that affect the reported amounts and disclosures in the financial statements. Actual results could differ from those estimates. The Fund is an investment company under U.S. GAAP and follows the accounting and reporting guidance applicable to investment companies.
Security Valuation The Fund’s investments are valued at fair value each day that the New York Stock Exchange (“NYSE”) is open and, for financial reporting purposes, as of the report date should the reporting period end on a day that the NYSE is not open. Fair value is generally defined as the price a fund would receive to sell an asset or pay to transfer a liability in an orderly transaction between market participants at the measurement date. By its nature, a fair value price is a good faith estimate of the valuation in a current sale and may not reflect an actual market price. The investments of the Fund are valued pursuant to the policy and procedures developed by the Oversight Committee (the “Committee”) and approved by the Company’s Board of Directors (the “Board”). The Committee provides oversight of the valuation of investments for the Fund. The Board has responsibility for determining the fair value of investments.
Valuation techniques used to value the Fund’s investments by major category are as follows:
| | • | | Equity investments (including preferred stocks) traded on a recognized securities exchange for which market quotations are readily available are valued at the last sale price or official closing price, as applicable, on the primary market or exchange on which they trade. Equity investments traded on a recognized exchange for which there were no sales on that day are valued at the last published sale price or at fair value. |
| | • | | Government and municipal fixed income securities are generally valued using quotations from independent pricing services or brokers. Certain government inflation-indexed securities may require a calculated fair valuation as the cumulative inflation is contained within the price provided by the pricing service or broker. For these securities, the inflation component of the price is “cleaned” from the pricing service or broker price utilizing the published inflation factors in order to ensure proper accrual of income. |
| | | | |
| Notes to Financial Statements | | | 25 | |
State Street Income V.I.S. Fund
Notes to Financial Statements, continued — June 30, 2018 (Unaudited)
| | • | | Debt obligations (including short term investments and convertible debt securities) are valued using quotations from independent pricing services or brokers or are generally valued at the last reported evaluated prices. |
| | • | | Exchange-traded futures contracts are valued at the closing settlement price on the primary market on which they are traded most extensively. Exchange-traded futures contracts traded on a recognized exchange for which there were no sales on that day are valued at the last reported sale price obtained from independent pricing services or brokers or at fair value. |
| | • | | Swap agreements are valued daily based upon prices supplied by Board approved pricing vendors or through brokers. Depending on the product and terms of the transaction, the value of agreements is determined using a series of techniques including valuation models that incorporate a number of market data factors, such as discounted cash flows, yields, curves, trades and values of the underlying reference instruments. In the event SSGA Funds Management, Inc. (the “Adviser” or “SSGA FM”) is unable to obtain an independent, third–party valuation the agreements will be fair valued. |
| | • | | Options on futures are priced at their last sale price on the principal market on which they are traded on the valuation date. If there were no sales on that day, options on futures are valued at either the last reported sale or official closing price on their primary exchange determined in accordance with the valuation policy and procedures approved by the Board. |
In the event prices or quotations are not readily available or that the application of these valuation methods results in a price for an investment that is deemed to be not representative of the fair value of such investment, fair value will be determined in good faith by the Committee, in accordance with the valuation policy and procedures approved by the Board.
The Fund values its assets and liabilities at fair value using a fair value hierarchy consisting of three broad levels that prioritize the inputs to valuation techniques giving the highest priority to readily available unadjusted quoted prices in active markets for identical assets or liabilities (Level 1 measurements) and the lowest priority to unobservable inputs (Level 3 measurements) when market prices are not readily available or reliable. The categorization of a value determined for an investment within the hierarchy is based upon the pricing transparency of the investment and is not necessarily an indication of the risk associated with investing in it.
The three levels of the fair value hierarchy are as follows:
| | • | | Level 1 — Unadjusted quoted prices in active markets for an identical asset or liability; |
| | • | | Level 2 — Inputs other than quoted prices included within Level 1 that are observable for the asset or liability either directly or indirectly, including quoted prices for similar assets or liabilities in active markets, quoted prices for identical or similar assets or liabilities in markets that are not considered to be active, inputs other than quoted prices that are observable for the asset or liability (such as exchange rates, financing terms, interest rates, yield curves, volatilities, prepayment speeds, loss severities, credit risks and default rates) or other market-corroborated inputs; and |
| | • | | Level 3 — Unobservable inputs for the asset or liability, including the Committee’s assumptions used in determining the fair value of investments. |
The value of the Fund’s investments according to the fair value hierarchy as of June 30, 2018 is disclosed in the Fund’s Schedule of Investments.
Changes in valuation techniques may result in transfers in or out of an assigned level within the fair value hierarchy. Transfers between different levels of the fair value hierarchy are recognized at the beginning of the reporting period. The Fund had no material transfers between levels for the six-month period ended June 30, 2018.
Investment Transactions and Income Recognition Investment transactions are accounted for on trade date for financial reporting purposes. Realized gains and losses from the sale or disposition of investments and foreign exchange transactions, if any, are determined using the identified cost method.
Dividend income and capital gain distributions, if any, are recognized on the ex-dividend date, net of any foreign taxes withheld at source, if any.
Interest income is recorded daily on an accrual basis. All premiums and discounts are amortized/accreted for financial reporting purposes.
| | |
| 26 | | Notes to Financial Statements |
State Street Income V.I.S. Fund
Notes to Financial Statements, continued — June 30, 2018 (Unaudited)
Non-cash dividends received in the form of stock are recorded as dividend income at fair value.
Expenses Certain expenses, which are directly identifiable to a specific Fund, are applied to the Fund within the Company. Other expenses which cannot be attributed to a specific Fund are allocated in such a manner as deemed equitable, taking into consideration the nature and type of expense and the relative net assets of the Fund within the Company.
Foreign Currency Translation The accounting records of the Fund are maintained in U.S. dollars. Foreign currencies as well as investment securities and other assets and liabilities denominated in a foreign currency are translated to U.S. dollars using exchange rates at period end. Purchases and sales of securities, income receipts and expense payments denominated in foreign currencies are translated into U.S. dollars at the prevailing exchange rate on the respective dates of the transactions.
The effects of exchange rate fluctuations on investments are included with the net realized and unrealized gain (loss) on investment securities. Other foreign currency transactions resulting in realized and unrealized gain (loss) are disclosed separately.
Foreign Taxes The Fund may be subject to foreign taxes (a portion of which may be reclaimable) on income, stock dividends, realized and unrealized capital gains on investments or certain foreign currency transactions. Foreign taxes are recorded in accordance with SSGA FM’s understanding of the applicable foreign tax regulations and rates that exist in the foreign jurisdictions in which the Fund invests. These foreign taxes, if any, are paid by the Fund and are reflected in the Statement of Operations, if applicable. Foreign taxes payable or deferred as of June 30, 2018, if any, are disclosed in the Fund’s Statements of Assets and Liabilities.
Distributions The Fund declares and pays any dividends from net investment income annually.
Net realized capital gains, if any, are distributed annually, unless additional distributions are required for compliance with applicable tax regulations. The amount and character of income and capital gains to be distributed are determined in accordance with applicable tax regulations which may differ from net investment income and realized gains recognized for U.S. GAAP purposes.
| 3. | | Securities and Other Investments |
Delayed Delivery Transactions and When-Issued Securities During the period, the Fund transacted in securities on a delayed delivery or when-issued basis. Payment and delivery may take place after the customary settlement period for that security. The price of the underlying securities and the date when the securities will be delivered and paid for are fixed at the time the transaction is negotiated. The securities purchased on a delayed delivery or when-issued basis are identified as such in the Fund’s Schedule of Investments. The Fund may receive compensation for interest forgone in the purchase of a delayed delivery or when-issued security. With respect to such purchase commitments, the Fund identifies securities as segregated in its records with a value at least equal to the amount of the commitment. Losses may arise due to changes in the value of the underlying securities or if the counterparty does not perform under the contract’s terms, or if the issuer does not issue the securities due to political, economic or other factors.
To-Be-Announced Transactions The Fund may seek to obtain exposure to U.S. agency mortgage pass-through securities through the use of “to-be-announced” or “TBA transactions.” “TBA” refers to a commonly used mechanism for the forward settlement of U.S. agency mortgage pass-through securities. In a TBA transaction, the buyer and seller decide on general trade parameters, such as agency, settlement date, coupon, and price.
The Fund may use TBA transactions to “roll over” such agreements prior to the settlement date. This type of TBA transaction is sometimes known as a “TBA roll.” In a TBA roll, the Fund generally will sell the obligation to purchase the pools stipulated in the TBA agreement prior to the settlement date and will enter into a new TBA agreement for future delivery of pools of mortgage pass-through securities. The Fund may also enter into TBA agreements and settle such transactions on the stipulated settlement date by accepting actual receipt or delivery of the pools of mortgage pass-through securities.
Default by or bankruptcy of a counterparty to a TBA transaction would expose the Fund to possible loss because of adverse market action, expenses or delays in connection with the purchase or sale of the pools of mortgage pass-through securities specified in the TBA transaction. To minimize this risk, the Fund will enter into TBA transactions only with established counterparties. The Fund’s use of “TBA rolls” may impact portfolio turnover, transaction costs and capital gain distributions to shareholders.
| | | | |
| Notes to Financial Statements | | | 27 | |
State Street Income V.I.S. Fund
Notes to Financial Statements, continued — June 30, 2018 (Unaudited)
| 4. | | Derivative Financial Instruments |
Futures Contracts The Fund may enter into futures contracts to meet the Fund’s objectives. A futures contract is a standardized, exchange-traded agreement to buy or sell a financial instrument at a set price on a future date. Upon entering into a futures contract, the Fund is required to deposit with the broker, cash or securities in an amount equal to the minimum initial margin requirements of the clearing house. Subsequent payments are made or received by the Fund equal to the daily change in the contract value and are recorded as variation margin receivable or payable with a corresponding offset to unrealized gains or losses. The Fund recognizes a realized gain or loss when the contract is closed.
Losses may arise if the value of a futures contract decreases due to unfavorable changes in the market rates or values of the underlying instrument during the term of the contract or if the counterparty does not perform under the contract. The use of futures contracts also involves the risk that the movements in the price of the futures contracts do not correlate with the movement of the assets underlying such contracts.
For the six-month period ended June 30, 2018 the Fund entered into futures contracts to manage interest rate exposure.
Options on Futures Contracts The Fund may purchase and write options, including options on futures contracts, subject to certain limitations. Writing puts and buying calls tend to increase the Fund’s exposure to the underlying instrument while buying puts and writing calls tend to decrease a Fund’s exposure to the underlying instrument. The Fund will not enter into a transaction involving options for speculative purposes. The Fund’s risks in using these contracts include changes in the value of the underlying instruments, non-performance of the counterparties under the contracts’ terms and changes in the liquidity of the secondary market for the contracts.
When the Fund writes an option, the amount of the premium received is recorded as a liability and is subsequently adjusted to the current fair value of the option written. Premiums received from writing options that expire unexercised are treated by the Fund on the expiration date as realized gain from investments. The difference between the premium and the amount paid on effecting a closing purchase transaction, including brokerage commissions, is also treated as a realized gain, or if the premium is less than the amount paid for the closing purchase, as a realized loss. When an option is exercised, the proceeds from the sale of the underlying instrument or the cost basis of the securities purchased is adjusted by the original premium received or paid. In return for a premium paid, call and put options on futures contracts give the holder the right, but not the obligation, to purchase or sell, respectively, a position in a particular futures contract at a specified exercise price.
For the period ended June 30, 2018, the Fund purchased and wrote options in order to hedge against changes in market conditions and interest rates.
Credit Default Swaps During the period ended June 30, 2018, the Fund engaged in credit default swaps to manage credit risk. When the Fund is the buyer in a credit default swap contract, the Fund is entitled to receive the par (or other agreed upon) value (full notional value) of a referenced debt obligation (or basket of debt obligations) from the counterparty (or central clearing party (“CCP”) in the case of a centrally cleared swap) to the contract if a credit event by a third party, such as a U.S. or foreign corporate issuer or sovereign issuer, on the debt obligation occurs. In return, the Fund pays the counterparty a periodic stream of payments over the term of the contract provided that no credit event has occurred. If no credit event occurs, the Fund loses its investment and recovers nothing. However, if a credit event occurs, the Fund receives full notional value for a referenced debt obligation that may have little or no value. When the Fund is the seller of a credit default swap, it receives a fixed rate of income throughout the term of the contract, provided there is no credit event. If a credit event occurs, the Fund is obligated to pay the notional amount of the swap and in certain instances take delivery of securities of the reference entity upon the occurrence of a credit event, as defined under the terms of that particular swap agreement. Credit events are contract specific but may include bankruptcy, failure to pay, restructuring, obligation acceleration and repudiation/moratorium. If the Fund is a seller of protection and a credit event occurs, the maximum potential amount of future payments that the Fund could be required to make would be an amount equal to the notional amount of the agreement. This potential amount would be partially offset by any recovery value of the respective referenced obligation, or net amount received from the settlement of a buy protection credit default swap agreement entered into by the Fund for the same referenced obligation.
As the seller, the Fund may create economic leverage to its portfolio because, in addition to its total net assets, the Fund is subject to investment exposure on the notional amount of the swap. The interest fee paid or received on the swap, which is based on a specified interest rate on a fixed notional amount, is accrued daily as a component of unrealized appreciation
| | |
| 28 | | Notes to Financial Statements |
State Street Income V.I.S. Fund
Notes to Financial Statements, continued — June 30, 2018 (Unaudited)
(depreciation) and is recorded as realized gain upon receipt or realized loss upon payment. The Fund also records an increase or decrease to unrealized appreciation (depreciation) in an amount equal to the daily valuation. For centrally cleared swaps, the daily change in valuation is recorded as a receivable or payable for variation margin and settled in cash with the CCP daily. All upfront payments, if any, are amortized over the life of the swap as realized gains or losses. Those upfront payments that are paid or received, typically for non-centrally cleared swaps, are recorded as other assets or other liabilities, respectively, net of amortization. For financial reporting purposes, unamortized upfront payments, if any, are netted with unrealized appreciation or depreciation on swaps to determine the market value of swaps. The Fund segregates assets in the form of cash or liquid securities in an amount equal to the notional amount of the credit default swaps of which it is the seller. The Fund segregates assets in the form of cash or liquid securities in an amount equal to any unrealized depreciation of the credit default swaps of which it is the buyer, marked to market on a daily basis. Credit default swaps involve greater risks than if the Fund had invested in the referenced debt obligation directly. If the Fund is a buyer of a credit default swap and no credit event occurs, the Fund will not earn any return on its investment. If the Fund is a seller of a credit default swap, the Fund’s risk of loss may be the entire notional amount of the swap. Swaps may also subject the Fund to the risk that the counterparty to the transaction may not fulfill its obligation. In the case of centrally cleared swaps, counterparty risk is minimal due to protections provided by the CCP.
Interest Rate Swaps Interest rate swaps involve the exchange by the Fund with another party of their respective commitments to pay or receive interest, such as an exchange of fixed rate payments for floating rate payments.
During the period ended June 30, 2018, the Fund entered into interest rate swaps in order to manage exposure to interest rates.
The following tables summarize the value of the Fund’s derivative instruments as of June 30, 2018 and the related location in the accompanying Statement of Assets and Liabilities and Statement of Operations, presented by primary underlying risk exposure:
Asset Derivatives
| | | | | | | | | | | | | | | | | | | | | | | | |
| | | Interest
Rate
Contracts
Risk | | | Foreign
Exchange
Contracts
Risk | | | Credit
Contracts
Risk | | | Equity
Contracts
Risk | | | Commodity
Contracts
Risk | | | Total | |
| | | | | | | | | | | | | | | | | | | | | | | | |
State Street Income V.I.S. Fund | |
Futures Contracts | | $ | 62,076 | | | $ | — | | | $ | — | | | $ | — | | | $ | — | | | $ | 62,076 | |
Swap Contracts(a) | | $ | — | | | $ | — | | | $ | 873 | | | $ | — | | | $ | — | | | $ | 873 | |
Purchased Option Contracts(b) | | | 1,665 | | | | — | | | | — | | | | — | | | | — | | | | 1,665 | |
| | (a) | Unrealized appreciation on swap contracts. |
| | (b) | Options purchased are included in investments in securities. |
Liability Derivatives
| | | | | | | | | | | | | | | | | | | | | | | | |
| | | Interest
Rate
Contracts
Risk | | | Foreign
Exchange
Contracts
Risk | | | Credit
Contracts
Risk | | | Equity
Contracts
Risk | | | Commodity
Contracts
Risk | | | Total | |
| | | | | | | | | | | | | | | | | | | | | | | | |
State Street Income V.I.S. Fund | |
Futures Contracts | | $ | (17,681 | ) | | $ | — | | | $ | — | | | $ | — | | | $ | — | | | $ | (17,681 | ) |
Swap Contracts(a) | | | (6,604 | ) | | | — | | | | — | | | | — | | | | — | | | | (6,604 | ) |
Written Option Contracts(b) | | | (1,774 | ) | | | — | | | | — | | | | — | | | | — | | | | (1,774 | ) |
| | (a) | Unrealized depreciation on swap contracts. |
| | (b) | Unrealized depreciation on written option contracts. |
| | | | |
| Notes to Financial Statements | | | 29 | |
State Street Income V.I.S. Fund
Notes to Financial Statements, continued — June 30, 2018 (Unaudited)
Net Realized Gain (Loss)
| | | | | | | | | | | | | | | | | | | | | | | | |
| | | Interest
Rate
Contracts
Risk | | | Foreign
Exchange
Contracts
Risk | | | Credit
Contracts
Risk | | | Equity
Contracts
Risk | | | Commodity
Contracts
Risk | | | Total | |
| | | | | | | | | | | | | | | | | | | | | | | | |
State Street Income V.I.S. Fund | |
Futures Contracts | | $ | (135,777 | ) | | $ | — | | | $ | — | | | $ | — | | | $ | — | | | $ | (135,777 | ) |
Swap Contracts | | | 21,623 | | | | — | | | | 100 | | | | — | | | | — | | | | 21,723 | |
Purchased Option Contracts(a) | | | (5,679 | ) | | | — | | | | — | | | | — | | | | — | | | | (5,679 | ) |
Written Option Contracts | | | 3,174 | | | | — | | | | — | | | | — | | | | — | | | | 3,174 | |
| | (a) | Options purchased are included in net realized gain (loss) from investments. |
Net Change in Unrealized Appreciation (Depreciation)
| | | | | | | | | | | | | | | | | | | | | | | | |
| | | Interest
Rate
Contracts
Risk | | | Foreign
Exchange
Contracts
Risk | | | Credit
Contracts
Risk | | | Equity
Contracts
Risk | | | Commodity
Contracts
Risk | | | Total | |
| | | | | | | | | | | | | | | | | | | | | | | | |
State Street Income V.I.S. Fund | |
Futures Contracts | | $ | 46,315 | | | $ | — | | | $ | — | | | $ | — | | | $ | — | | | $ | 46,315 | |
Swap Contracts | | | (1,726 | ) | | | — | | | | 2,288 | | | | — | | | | — | | | | 562 | |
Purchased Option Contracts(a) | | | 1,665 | | | | — | | | | — | | | | — | | | | — | | | | (1,665 | ) |
Written Option Contracts | | | (1,774 | ) | | | — | | | | — | | | | — | | | | — | | | | (1,774 | ) |
| | (a) | Options purchased are included in unrealized appreciation (depreciation) from investments. |
| 5. | | Fees and Transactions with Affiliates |
Advisory Fee SSGA FM, a registered investment adviser, was retained by the Board to act as investment adviser and administrator of the Fund. SSGA FM’s compensation for investment advisory and administrative services (“Management Fee”) is paid monthly based on the average daily net assets of the Fund at an annualized rate of 0.50%.
Administrator, Sub-Administrator and Custodian Fees State Street Bank and Trust Company (“State Street”) serves as the sub-administrator and custodian to the Funds. Amounts paid by the Fund to State Street for performing such services are included in advisory and administration and custody and accounting expenses, respectively.
Due to Custodian In certain circumstances, the Funds may have cash overdraft with the custodian. The Due to Custodian amount, if any, reflects cash overdrawn with State Street as custodian who is an affiliate of the Funds. As of June 30, 2018, the Fund had a cash overdraft related to derivative activity.
Other Transactions with Affiliates The Fund may invest in affiliated entities, including securities issued by State Street, affiliated funds, or entities deemed to be affiliates as a result of the Fund owning more than five percent of the entity’s voting securities or outstanding shares. Amounts relating to these transactions during the six-month period ended June 30, 2018 are disclosed in the Schedule of Investments.
The fees and expenses of the Company’s directors who are not “interested persons” of the Company, as defined in the 1940 Act (“Independent Directors”) are paid directly by the Fund. The Independent Directors are reimbursed for travel and other out-of-pocket expenses in connection with meeting attendance and industry seminars.
| | |
| 30 | | Notes to Financial Statements |
State Street Income V.I.S. Fund
Notes to Financial Statements, continued — June 30, 2018 (Unaudited)
| 7. | | Investment Transactions |
Purchases and sales of investments (excluding in-kind transactions, short term investments and derivative contracts) for the six-month period ended June 30, 2018 were as follows:
| | | | | | | | |
| U.S. Government Securities |
| Purchases | | Sales |
| | $ | 14,377,029 | | | | $ | 16,667,281 | |
|
| Non-U.S. Government Securities |
| Purchases | | Sales |
| | $ | 14,958,427 | | | | $ | 14,155,005 | |
The Fund has qualified and intends to continue to qualify as a regulated investment company under Subchapter M of the Internal Revenue Code of 1986, as amended. The Fund will not be subject to federal income taxes to the extent it distributes its taxable income, including any net realized capital gains, for each fiscal year. Therefore, no provision for federal income tax is required.
The Fund files federal and various state and local tax returns as required. No income tax returns are currently under examination. Generally, the federal returns are subject to examination by the Internal Revenue Service for a period of three years from date of filing, while the state returns may remain open for an additional year depending upon jurisdiction. SSGA FM has analyzed the Fund’s tax positions taken on tax returns for all open years and does not believe there are any uncertain tax positions that would require recognition of a tax liability.
Distributions to shareholders are recorded on ex-dividend date. Income dividends and gain distributions are determined in accordance with income tax rules and regulations, which may differ from generally accepted accounting principles.
As of June 30, 2018, gross unrealized appreciation and gross unrealized depreciation of investments and other financial instruments based on cost for federal income tax purposes were as follows:
| | | | | | | | | | | | | | | | |
| | | Cost of
Investments
for Tax
Purposes | | | Gross Tax
Appreciation | | | Gross Tax
Depreciation | | | Net Tax
Appreciation/
(Depreciation) | |
| | | | | | | | | | | | | | | | |
State Street Income V.I.S. Fund | | $ | 20,342,438 | | | $ | 186,503 | | | $ | 296,895 | | | $ | (110,392 | ) |
The Fund and other affiliated funds (each, a “Participant” and collectively, the “Participants”) participate in a $500 million revolving credit facility provided by a syndication of banks under which the Participants may borrow to fund shareholder redemptions. This agreement expires in October 2018 unless otherwise extended or renewed.
The Participants are charged an annual commitment fee which is calculated based on the unused portion of the shared credit line. Commitment fees are allocated among each of the Participants based on relative net assets. Commitment fees are ordinary fund operating expenses paid by the Adviser. A Participant incurs and pays the interest expense related to its borrowing. Interest is calculated at a rate per annum equal to the sum of 1% plus the greater of the New York Fed Bank Rate and 1-month LIBOR rate.
The Fund had no outstanding loans as of June 30, 2018.
Concentration Risk As a result of the Fund’s ability to invest a large percentage of its assets in obligations of issuers within the same country, state, region, currency or economic sector, an adverse economic, business or political development may affect the value of the Fund’s investments more than if the Fund was more broadly diversified.
Foreign and Emerging Markets Risk Investing in foreign markets involves risks and considerations not typically associated with investing in the U.S. Foreign securities may be subject to risk of loss because of government regulation,
| | | | |
| Notes to Financial Statements | | | 31 | |
State Street Income V.I.S. Fund
Notes to Financial Statements, continued — June 30, 2018 (Unaudited)
economic, political and social instability in the countries in which the Fund invests. Foreign markets may be less liquid than investments in the U.S. and may be subject to the risks of currency fluctuations. To the extent that the Fund invests in securities of issuers located in emerging markets, these risks may be even more pronounced.
Market and Credit Risk In the normal course of business, the Fund trades financial instruments and enters into financial transactions where risk of potential loss exists due to changes in the general economic conditions and fluctuations of the market (market risk). Additionally, the Fund may also be exposed to credit risk in the event that an issuer or guarantor fails to perform or that an institution or entity with which the Fund has unsettled or open transactions defaults.
| 11. | | Recent Accounting Pronouncement |
In March 2017, the FASB issued Accounting Standards Update (“ASU”) No. 2017-08, Receivables — Nonrefundable Fees and Other Costs (Subtopic 310-20): Premium Amortization on Purchased Callable Debt Securities. The amendments in the ASU shorten the amortization period for certain callable debt securities, held at a premium, to be amortized to the earliest call date. The ASU does not require an accounting change for securities held at a discount; which continues to be amortized to maturity. The ASU is effective for fiscal years and interim periods within those fiscal years beginning after December 15, 2018. Management is currently evaluating the impact, if any, of applying this provision.
Management has evaluated the impact of all subsequent events on the Fund through the date on which the financial statements were available to be issued and has determined that there were no subsequent events requiring adjustment or disclosure in the financial statements.
| | |
| 32 | | Notes to Financial Statements |
State Street Income V.I.S. Fund
Other Information (Unaudited)
Proxy Voting Policies and Procedures and Record
The Fund has adopted the proxy voting policies of SSGA FM. A description of the policies and procedures that the Fund has adopted to determine how to vote proxies relating to portfolio securities is available (i) without charge, upon request, by calling 1-800-242-0134, (ii) on the Fund’s website at http://www.ssga.com/geam, (iii) on the SEC’s website at www.sec.gov, and (iv) at the SEC’s public reference room. Information on the operation of the public reference room may be obtained by calling 1-800-SEC-0330. Information regarding how the Fund voted proxies, if any, during the most recent 12-month period ended June 30 is available by August 31 of each year without charge (1) by calling 1-800-242-0134 (toll free), and (2) on the website of the SEC at www.sec.gov.
Quarterly Portfolio Schedule
The Fund files its complete schedule of investments with the SEC for the first and third quarters of each fiscal year on Form N-Q. The Fund’s Forms N-Q are available (i) without charge, upon request, by calling 1-800-242-013, (ii) on the Fund’s website at http://www.ssga.com/geam, (iii) on the SEC’s website at www.sec.gov, and (iv) at the SEC’s public reference room. Information on the operation of the public reference room may be obtained by calling 1-800-SEC-0330.
State Street Income V.I.S. Fund
Other Information (Unaudited), continued
Disclosure for the Board of Directors’ Consideration of the Renewal of the Investment Advisory and Administration Agreement with SSGA Funds Management, Inc. on behalf of the State Street Income V.I.S. Fund
At meetings of the Board of Directors (the “Board”) of State Street Variable Insurance Series Funds, Inc. (the “V.I.S. Funds”) held on May 16, 2018 and June 5, 2018 (the “Board Meetings”), the Board members, including the Board members who are not “interested persons” (as defined in the Investment Company Act of 1940, as amended (the “1940 Act”)) of the V.I.S. Funds (“Independent Board Members”), considered and unanimously approved the continuance for an additional year of the investment advisory and administration agreement (the “Investment Advisory and Administration Agreement”) between SSGA Funds Management, Inc. (“SSGA FM” or the “Adviser”) and the V.I.S. Funds on behalf of each of its series portfolios, including the State Street Income V.I.S. Fund (the “Fund”).
In considering whether to approve the continuance for an additional year of the Investment Advisory and Administration Agreement, the Board members considered and discussed a substantial amount of information and analysis provided, at the Board’s request, by the Adviser. The Board members also considered detailed information regarding performance and expenses of other investment companies, including those with similar investment strategies and sizes, which was prepared by an independent third party provider, Broadridge Financial Solutions, Inc. (“Broadridge”). The Board members reviewed the fees charged by the Adviser for other mutual funds and investment products other than mutual funds that employ a similar investment strategy as the Fund. The Board had the opportunity to ask questions and request additional information in connection with its considerations.
Before approving the continuance of the Investment Advisory and Administration Agreement, the Independent Board Members reviewed the information provided with management of the Adviser and with their independent legal counsel. The Board also reviewed a memorandum prepared by independent legal counsel discussing the legal standards for the consideration of the proposed continuance. The Independent Board Members discussed the proposed continuance of the Investment Advisory and Administration Agreement in detail during private sessions in advance of, and at, the Board Meetings with their independent legal counsel at which no representatives of the Adviser were present. The Independent Board Members and their independent legal counsel requested, and received and considered, additional information from the Adviser following the May 16, 2018 Board Meeting and prior to the June 5, 2018 Board Meeting.
In advance of the Board Meetings, and in response to their detailed requests, the Board members received from the Adviser written responses to their inquiries, which included substantial exhibits and other materials related to the Adviser’s business and the services it provides to the Fund. The Directors took into account their multi-year experience as Directors and particularly their previous consideration of these types of agreements.
During the Board Meetings, the Board members had an opportunity to discuss this information with SSGA FM representatives, including senior executives, representatives from the legal, compliance and finance departments, and investment personnel. The Board members posed questions to these representatives and engaged in significant discussions.
In reaching its determinations relating to the continuance of the Investment Advisory and Administration Agreement, the Board considered those factors it deemed relevant, including the factors discussed below. In its deliberations, the Board did not identify any single factor that was dispositive and each Director may have attributed different weights to the various factors. The Directors evaluated the information provided to them, as well as the presentations and discussions that occurred at the Board Meetings, for the Fund, and their determinations were made separately in respect of the Fund from other series portfolios of the V.I.S Funds.
The material factors and conclusions that formed the basis for the Board’s determinations to approve the continuance of the Investment Advisory and Administration Agreement with the Adviser on behalf of the Fund are as discussed below.
The Nature, Extent and Quality of Services Provided.
The Board reviewed the services provided to the Fund by the Adviser. The Board considered the Adviser’s management capabilities and investment process with respect to the types of investments held by the Fund, including the education, experience and number of investment professionals and other personnel who provide portfolio management, investment research, and similar services to the Fund. The Board evaluated, where relevant, the abilities and experience of such investment personnel in analyzing particular markets, industries and specific issuers of securities in these markets and industries. The Board also considered the extensive experience and resources committed by the Adviser to the evaluation of a portfolio’s quality distribution and sector and
State Street Income V.I.S. Fund
Other Information (Unaudited), continued
interest rate exposure. The Board considered the extensive experience and resources committed by the Adviser to risk management, including with respect to investment risk, liquidity risk, operational risk, counterparty risk and model risk. The Board also considered the significant risks assumed by the Adviser in connection with the services provided to the Fund, including operational, enterprise, regulatory, litigation and compliance risks. The Board also took into account the compensation paid to recruit and retain investment personnel, and the time and attention devoted to the Fund by senior management.
The Board had previously reviewed the compliance programs of SSGA FM and various affiliated service providers (“Affiliated Service Providers”). Among other things, the Board considered compliance and reporting matters relating to personal trading by investment personnel, selective disclosure of portfolio holdings, late trading, frequent trading, portfolio valuation, business continuity, the allocation of investment opportunities and the voting of proxies.
In light of the foregoing and other relevant information, the Board, including the Independent Board Members, concluded that the services provided by the Adviser continue to be satisfactory.
Investment Performance.
The Board members considered the investment performance of the Fund for various periods. The Board members reviewed detailed comparisons of the performance of the Fund with the relevant securities index and peer and category groupings of mutual funds prepared by Broadridge with respect to various periods. The Board members also engaged in detailed discussions with SSGA FM management about its investment processes and performance results. These discussions focused on the Fund’s investment objective, the number and experience of portfolio management and supporting research personnel, the Fund’s investment style and approach employed, the likely market cycles for the Fund’s investment style and the Fund’s relative underperformance in the measurement periods shown. The Board members discussed the Adviser’s investment approach with respect to the Fund and reasons for the Fund’s relative underperformance in the measurement periods shown.
Taking these factors into consideration, the Board, including the Independent Board Members, expressed concern about the Fund’s performance and agreed to closely monitor performance.
Cost of the Services Provided And Profits Realized From The Relationship with the Fund.
The Directors considered the management fees paid to the Adviser by the Fund. The Board reviewed the level of profits realized by the Adviser and the Affiliated Service Providers in providing investment advisory and other services to the Fund. Information also was presented regarding the financial condition of the Adviser for various past periods. The Directors also considered the Adviser’s statements concerning its significant investment in supporting registered investment companies. The Board also considered the various risks borne by SSGA FM and the Affiliated Service Providers in connection with their various roles in servicing the Fund, including enterprise, litigation, business, operational and entrepreneurial risk.
The Board concluded that the profitability of the Adviser with respect to the Fund, and the profitability range of each of the Affiliated Service Providers with respect to its services to the Fund, were reasonable in relation to the services provided.
The Extent to Which Economies of Scale Would Be Realized as the Fund Grows and Whether Fee Levels Would Reflect Such Economies of Scale.
The Board considered the extent to which the Adviser and the Affiliated Service Providers, on the one hand, and the Fund, on the other hand, can expect to realize benefits from economies of scale as the assets of the Fund increase. The Board acknowledged the difficulty in accurately measuring the benefits resulting from the economies of scale with respect to the management of the Fund. The Board concluded that, in light of, among other considerations, the current size of the Fund, the level of profitability of the Adviser and the Affiliated Service Providers with respect to the Fund, and/or the comparative management fee and expense ratio of the Fund, it does not appear that the Adviser or the Affiliated Service Providers has realized benefits from economies of scale in managing the assets of the Fund to such an extent that previously agreed management fees should be reduced or that breakpoints in such fees should be implemented for the Fund at this time.
Comparison of Services to be Rendered and Fees to be Paid.
The Board discussed the services provided to the Fund by the Adviser, and the fees charged to the Fund for those services. As part of its review, the Board considered the Fund’s management fee and total expense ratio, including the portion attributable to
State Street Income V.I.S. Fund
Other Information (Unaudited), continued
administrative services provided by SSGA FM, as compared to the expense ratios of a group of comparable mutual funds selected by Broadridge, and the related Broadridge analysis for the Fund. The Board also considered the comparability of the fees charged and the services provided to the Fund by the Adviser to the fees charged and services provided to other clients of the Adviser. Among other information, the Board considered that the Fund’s advisory fee and expense ratios were the highest or among the highest in the applicable Broadridge peer group ranges.
In light of the foregoing, the Board, including the Independent Board Members, determined that the management fees, considered in relation to the services provided to the Fund, supported the Board’s approval of the continuance of the Investment Advisory and Administration Agreement.
Fall-Out Benefits.
The Board considered actual and potential financial benefits that the Adviser could derive from its relationship with the Fund, including the custody, fund accounting and sub-administration services being provided to the Fund by affiliates of the Adviser and, to the extent applicable, soft dollar commission benefits generated through Fund portfolio transactions. The Board noted, however, that the Fund benefits from the vast array of resources available through SSGA FM, and that the Fund represents only a small portion of the assets managed by SSGA FM.
Conclusion.
No single factor was determinative to the Board’s decision. Based on their discussion and such other matters as were deemed relevant, the Directors, including the Independent Board Members, approved the continuance of the Investment Advisory and Administration Agreement with the Adviser for the Fund.
Directors
John R. Costantino, Chairman
R. Sheldon Johnson
Donna M. Rapaccioli
Jeanne M. La Porta
Officers
Jeanne M. La Porta, President
Arthur Jensen, Treasurer
Brian Harris, Chief Compliance Officer and Anti-Money Laundering Officer
Bruce S. Rosenberg, Assistant Treasurer
Ann M. Carpenter, Assistant Treasurer
Chad C. Hallett, Assistant Treasurer
Darlene Anderson-Vasquez, Assistant Treasurer
Daniel G. Plourde, Assistant Treasurer
Jesse Hallee, Secretary
Investment Adviser and Administrator
SSGA Funds Management, Inc.
1600 Summer Street
P.O. Box 7900
Stamford, CT 06904-7900
Custodian and Sub-Administrator
State Street Bank and Trust Company
One Lincoln Street
Boston, Massachusetts 02111
Distributor
State Street Global Advisors Funds Distributors, LLC
One Iron Street
Boston, MA 02210
Independent Registered Public Accounting Firm
Ernst & Young LLP
200 Clarendon Street
Boston, Massachusetts 02116
Semi-Annual Report
June 30, 2018
State Street Real Estate Securities V.I.S. Fund

State Street Real Estate Securities V.I.S. Fund
Semi-Annual Report
June 30, 2018
Table of Contents
This report is prepared for Policyholders of certain variable contracts and may be distributed to others only if preceded or accompanied by the variable contract’s current prospectus and the current summary prospectus of the Fund available for investments thereunder.
State Street Real Estate Securities V.I.S. Fund
Fund Information — June 30, 2018 (Unaudited)
Total return performance shown in this report for the Fund takes into account changes in share price and assumes reinvestment of dividends and capital gains distributions, if any. Total returns shown are net of Fund fees and expenses but do not reflect fees and charges associated with the variable contracts such as administrative fees, account charges and surrender charges, which, if reflected, would reduce the Fund’s total returns for all periods shown.
The performance data quoted represents past performance; past performance does not guarantee future results. Investment return and principal value will fluctuate so your shares, when redeemed, may be worth more or less than their original cost. Current performance may be higher or lower than the performance data quoted. Periods less than one year are not annualized. Please call toll-free
(800) 242-0134 or visit the Fund’s website at http://www.ssga.com/geam for the most recent month-end performance data.
An investment in the Fund is not a deposit of any bank and is not insured or guaranteed by the Federal Deposit Insurance Corporation (“FDIC”) or any other government agency. An investment in the Fund is subject to risk, including possible loss of principal invested.
Sector Allocation
Portfolio Compositions as a % of Fair Value of $57,044 (in thousands) on June 30, 2018 (a)
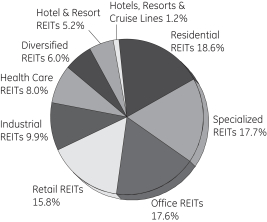
Top Ten Largest Holdings
as of June 30, 2018 (as a % of Investments) (a)
| | | | |
Simon Property Group Inc. | | | 6.97 | % |
Equinix Inc. | | | 5.76 | % |
AvalonBay Communities Inc. | | | 5.04 | % |
Prologis Inc. REIT | | | 4.56 | % |
Boston Properties Inc. | | | 3.95 | % |
Ventas Inc. | | | 3.02 | % |
CubeSmart | | | 2.96 | % |
Alexandria Real Estate Equities Inc. | | | 2.89 | % |
Kilroy Realty Corp. | | | 2.84 | % |
Healthcare Trust of America Inc., Class A | | | 2.75 | % |
| (a) | The securities information regarding holdings, allocations and other characteristics is presented to illustrate examples of securities that the Fund has bought and the diversity of areas in which the Fund may invest as of a particular date. It may not be representative of the Fund’s current or future investments and should not be construed as a recommendation to purchase or sell a particular security. |
State Street Global Advisors Funds Distributors, LLC, member of FINRA & SIPC is the principal underwriter and distributor of the State Street V.I.S. Funds and an indirect wholly-owned subsidiary of State Street Corporation. References to State Street may include State Street Corporation and its affiliates. The Funds pay State Street Bank and Trust Company for its services as custodian and Fund Accounting agent, and pay SSGA Funds Management, Inc. for investment advisory and administrative services.
| | | | |
| State Street Real Estate Securities V.I.S. Fund | | | 1 | |
State Street Real Estate Securities V.I.S. Fund
Understanding Your Fund’s Expenses — June 30, 2018 (Unaudited)
As a shareholder of the Fund, you incur ongoing costs. Ongoing costs include portfolio management fees, professional fees, administrative fees and other Fund expenses. The following example is intended to help you understand your ongoing costs (in dollars) of investing in the Fund and to compare these costs with the ongoing costs of investing in other mutual funds.
To illustrate these ongoing costs, we have provided an example and calculated the expenses paid by investors in the Fund during the period. The information in the following table is based on an investment of $1,000, which is invested at the beginning of the period and held for the entire six-month period ended June 30, 2018.
Actual Expenses
The first section of the table provides information about actual account values and actual expenses. You may use the information in this section, together with the amount you invested, to estimate the expenses that you paid over the period. To do so, simply divide your account value by $1,000 (for example, an $8,600 account value divided by $1,000 = 8.6), then multiply the result by the number given under the heading “Expenses paid during the period” to estimate the expenses you paid on your account during the period.
Hypothetical Example for Comparison Purposes
The second section of the table provides information about hypothetical account values and hypothetical expenses based on the Fund’s actual expense ratio and an assumed rate of return of 5% per year before expenses, which is not the Fund’s actual return. The hypothetical account values and expenses may not be used to estimate the actual ending account balance or expenses you paid for the period. You may use this information to compare the ongoing costs of investing in the Fund and other funds. To do so, compare this 5% hypothetical example with the 5% hypothetical examples that appear in the shareholder reports of other funds.
Please note that the expenses shown in the table are meant to highlight and help you compare ongoing costs only and do not reflect transaction costs, such as sales charges or redemption fees, if any. Therefore, the second section of the table is useful in comparing ongoing costs only, and will not help you determine the relative total costs of owning different funds. Additionally, the expenses shown do not reflect the fees or charges associated with variable contracts through which shares of the Fund are offered.
| | | | | | | | |
| | | Actual
Fund Return | | | Hypothetical
5% Return
(2.5% for
the period) | |
Actual Fund Return | | | | | | | | |
Beginning Account Value January 1, 2018 | | $ | 1,000.00 | | | $ | 1,000.00 | |
Ending Account Value June 30, 2018 | | $ | 1,007.30 | | | $ | 1,019.44 | |
Expenses Paid During Period* | | $ | 5.38 | | | $ | 5.41 | |
| * | Expenses are equal to the Fund’s annualized expense ratio of 1.08% (for the period January 1, 2018-June 30, 2018), multiplied by the average account value over the period, multiplied by 181/365 (to reflect the one-half year period). |
| | |
| 2 | | State Street Real Estate Securities V.I.S. Fund |
State Street Real Estate Securities V.I.S. Fund
Schedule of Investments — June 30, 2018 (Unaudited)
| | | | | | | | |
| | | Number of Shares | | | Fair Value $ | |
| | | | | | | | |
| Common Stock (REITs) - 99.4%† | |
Alternate Housing - 6.6% | |
American Homes 4 Rent, Class A | | | 68,890 | | | | 1,527,980 | |
Invitation Homes Inc. | | | 41,180 | | | | 949,611 | |
Sun Communities Inc. | | | 13,650 | | | | 1,336,062 | |
| | | | | | | | |
| | | | | | | 3,813,653 | |
| | | | | | | | |
|
Diversified - 3.9% | |
Forest City Realty Trust Inc., Class A | | | 31,600 | | | | 720,796 | |
JBG SMITH Properties | | | 3,930 | | | | 143,327 | |
VEREIT Inc. | | | 185,340 | | | | 1,378,930 | |
| | | | | | | | |
| | | | | | | 2,243,053 | |
| | | | | | | | |
|
Freestanding - 1.6% | |
Realty Income Corp. | | | 7,010 | | | | 377,068 | |
STORE Capital Corp. | | | 19,590 | | | | 536,766 | |
| | | | | | | | |
| | | | | | | 913,834 | |
| | | | | | | | |
|
Healthcare - 7.9% | |
HCP Inc. | | | 48,970 | | | | 1,264,405 | |
Healthcare Trust of America Inc., Class A | | | 58,210 | | | | 1,569,342 | |
Ventas Inc. | | | 30,300 | | | | 1,725,585 | |
| | | | | | | | |
| | | | | | | 4,559,332 | |
| | | | | | | | |
|
Hotel - 6.4% | |
Chesapeake Lodging Trust | | | 16,560 | | | | 523,958 | |
Hilton Worldwide Holdings Inc. | | | 8,400 | | | | 664,944 | |
Park Hotels & Resorts Inc. | | | 42,130 | | | | 1,290,442 | |
Sunstone Hotel Investors Inc. | | | 70,000 | | | | 1,163,400 | |
| | | | | | | | |
| | | | | | | 3,642,744 | |
| | | | | | | | |
|
Industrial - 11.2% | |
Americold Realty Trust | | | 19,290 | | | | 424,766 | |
DCT Industrial Trust Inc. | | | 14,410 | | | | 961,579 | |
Duke Realty Corp. | | | 35,820 | | | | 1,039,855 | |
Liberty Property Trust | | | 17,390 | | | | 770,899 | |
Prologis Inc. REIT | | | 39,600 | | | | 2,601,324 | |
STAG Industrial Inc. | | | 22,940 | | | | 624,656 | |
| | | | | | | | |
| | | | | | | 6,423,079 | |
| | | | | | | | |
|
Multifamily - 11.9% | |
AvalonBay Communities Inc. | | | 16,732 | | | | 2,876,063 | |
Camden Property Trust | | | 16,940 | | | | 1,543,742 | |
Essex Property Trust Inc. | | | 1,600 | | | | 382,512 | |
Mid-America Apartment Communities Inc. | | | 7,080 | | | | 712,744 | |
UDR Inc. | | | 34,500 | | | | 1,295,130 | |
| | | | | | | | |
| | | | | | | 6,810,191 | |
| | | | | | | | |
| | | | | | | | |
| | | Number of Shares | | | Fair Value $ | |
Office - 18.3% | |
Alexandria Real Estate Equities Inc. | | | 13,050 | | | | 1,646,519 | |
Boston Properties Inc. | | | 17,980 | | | | 2,255,052 | |
Brandywine Realty Trust | | | 25,450 | | | | 429,596 | |
Columbia Property Trust Inc. | | | 4,200 | | | | 95,382 | |
Cousins Properties Inc. | | | 57,220 | | | | 554,462 | |
Easterly Government Properties Inc. | | | 7,740 | | | | 152,942 | |
Highwoods Properties Inc. | | | 24,630 | | | | 1,249,480 | |
Hudson Pacific Properties Inc. | | | 17,340 | | | | 614,356 | |
Kilroy Realty Corp. | | | 21,410 | | | | 1,619,452 | |
Mack-Cali Realty Corp. | | | 44,430 | | | | 901,040 | |
Paramount Group Inc. | | | 22,765 | | | | 350,581 | |
VICI Properties Inc. | | | 29,130 | | | | 601,243 | |
| | | | | | | | |
| | | | | | | 10,470,105 | |
| | | | | | | | |
|
Regional Malls - 9.4% | |
GGP Inc. | | | 40,400 | | | | 825,372 | |
Simon Property Group Inc. | | | 23,360 | | | | 3,975,639 | |
Taubman Centers Inc. | | | 3,620 | | | | 212,711 | |
The Macerich Co. | | | 7,010 | | | | 398,378 | |
| | | | | | | | |
| | | | | | | 5,412,100 | |
| | | | | | | | |
|
Self Storage - 6.0% | |
CubeSmart | | | 52,420 | | | | 1,688,972 | |
Extra Space Storage Inc. | | | 8,830 | | | | 881,322 | |
Public Storage | | | 3,937 | | | | 893,148 | |
| | | | | | | | |
| | | | | | | 3,463,442 | |
| | | | | | | | |
|
Shopping Centers - 5.6% | |
Federal Realty Investment Trust | | | 2,170 | | | | 274,614 | |
Kimco Realty Corp. | | | 33,540 | | | | 569,845 | |
Regency Centers Corp. | | | 23,730 | | | | 1,473,158 | |
Urban Edge Properties | | | 11,960 | | | | 273,525 | |
Weingarten Realty Investors | | | 20,805 | | | | 641,002 | |
| | | | | | | | |
| | | | | | | 3,232,144 | |
| | | | | | | | |
|
Specialty - 10.6% | |
CyrusOne Inc. | | | 23,860 | | | | 1,392,470 | |
Equinix Inc. | | | 7,640 | | | | 3,284,360 | |
Iron Mountain Inc. | | | 36,490 | | | | 1,277,515 | |
QTS Realty Trust Inc., Class A | | | 2,685 | | | | 106,057 | |
| | | | | | | | |
| | | | | | | 6,060,402 | |
| | | | | | | | |
| |
Total Common Stock (REITs)
(Cost $52,405,022) | | | | 57,044,079 | |
| | | | | | | | |
| |
Total Investments
(Cost $52,405,022) | | | | 57,044,079 | |
| |
| Other Assets and Liabilities, net - 0.6% | | | | 325,359 | |
| | | | | | | | |
| | |
| NET ASSETS - 100.0% | | | | | | | 57,369,438 | |
| | | | | | | | |
See Notes to Schedule of Investments and Notes to Financial Statements.
| | | | |
| State Street Real Estate Securities V.I.S. Fund | | | 3 | |
State Street Real Estate Securities V.I.S. Fund
Notes to Schedule of Investments — June 30, 2018 (Unaudited)
The views expressed in this document reflect our judgment as of the publication date and are subject to change at any time without notice. The securities cited may not be representative of the Fund’s future investments and should not be construed as a recommendation to purchase or sell a particular security. See the Fund’s summary prospectus and statutory prospectus
for complete descriptions of investment objectives, policies, risks and permissible investments.
| † | Percentages are based on net assets as of June 30, 2018. |
Abbreviations:
REIT - Real Estate Investment Trust
The following table presents the Fund’s investments measured at fair value on a recurring basis at June 30, 2018:
| | | | | | | | | | | | | | | | |
| Investments | | Level 1 | | | Level 2 | | | Level 3 | | | Total | |
| | | | | | | | | | | | | | | | |
Investments in Securities | |
Common Stock | | $ | 57,044,079 | | | $ | — | | | $ | — | | | $ | 57,044,079 | |
| | | | | | | | | | | | | | | | |
Total Investments in Securities | | $ | 57,044,079 | | | $ | — | | | $ | — | | | $ | 57,044,079 | |
| | | | | | | | | | | | | | | | |
Affiliate Table
| | | | | | | | | | | | | | | | | | | | | | | | | | | | | | | | | | | | |
| | | Number of Shares
Held at
12/31/17 | | | Value At
12/31/17 | | | Cost of
Purchases | | | Proceeds from
Shares Sold | | | Realized
Gain (Loss) | | | Change in
Unrealized
Appreciation/ Depreciation | | | Number of Shares Held at
6/30/18 | | | Value at
6/30/18 | | | Dividend
Income | |
| | | | | | | | | | | | | | | | | | | | | | | | | | | | | | | | | | | | |
State Street Institutional U.S. Government Money Market Fund - Class G Shares | | | 327,393 | | | $ | 327,393 | | | $ | 4,597,027 | | | $ | 4,924,420 | | | $ | — | | | $ | — | | | | — | | | $ | — | | | $ | 1,164 | |
See Notes to Schedule of Investments and Notes to Financial Statements.
| | |
| 4 | | State Street Real Estate Securities V.I.S. Fund |
State Street Real Estate Securities V.I.S. Fund
Financial Highlights
Selected data based on a share outstanding throughout the periods indicated
| | | | | | | | | | | | | | | | | | | | | | | | |
| | | 6/30/18† | | | 12/31/17 | | | 12/31/16 | | | 12/31/15* | | | 12/31/14* | | | 12/31/13* | |
| Inception date | | | — | | | | — | | | | — | | | | — | | | | — | | | | 5/1/95 | |
| | | | | | |
Net asset value, beginning of period | | $ | 12.32 | | | $ | 12.37 | | | $ | 13.30 | | | $ | 14.74 | | | $ | 12.68 | | | $ | 13.27 | |
| | | | | | | | | | | | | | | | | | | | | | | | |
| | | |
Income/(loss) from investment operations: | | | | | | | | | | | | | |
Net investment income | | | 0.16 | (a) | | | 0.15 | (a) | | | 0.31 | | | | 0.29 | | | | 0.28 | | | | 0.19 | |
Net realized and unrealized gains/(losses) on investments | | | (0.07 | ) | | | 0.57 | | | | 0.71 | | | | 0.41 | | | | 3.79 | | | | 0.16 | |
| | | | | | | | | | | | | | | | | | | | | | | | |
Total income from investment operations | | | 0.09 | | | | 0.72 | | | | 1.02 | | | | 0.70 | | | | 4.07 | | | | 0.35 | |
| | | | | | | | | | | | | | | | | | | | | | | | |
| | | | | | |
Less distributions from: | | | | | | | | | | | | | | | | | | | | | | | | |
Net investment income | | | — | | | | 0.22 | | | | 0.35 | | | | 0.28 | | | | 0.29 | | | | 0.20 | |
Net realized gains | | | — | | | | 0.55 | | | | 1.60 | | | | 1.86 | | | | 1.72 | | | | 0.74 | |
| | | | | | | | | | | | | | | | | | | | | | | | |
Total distributions | | | — | | | | 0.77 | | | | 1.95 | | | | 2.14 | | | | 2.01 | | | | 0.94 | |
| | | | | | | | | | | | | | | | | | | | | | | | |
Net asset value, end of period | | $ | 12.41 | | | $ | 12.32 | | | $ | 12.37 | | | $ | 13.30 | | | $ | 14.74 | | | $ | 12.68 | |
| | | | | | | | | | | | | | | | | | | | | | | | |
Total Return(b) | | | 0.73 | % | | | 5.84 | % | | | 8.00 | % | | | 4.56 | % | | | 31.90 | % | | | 2.60 | % |
| | | |
Ratios/Supplemental Data: | | | | | | | | | | | | | |
Net assets, end of period (in thousands) | | $ | 57,369 | | | $ | 61,685 | | | $ | 72,483 | | | $ | 78,912 | | | $ | 91,007 | | | $ | 102,603 | |
Ratios to average net assets: | | | | | | | | | | | | | | | | | | | | | | | | |
Net expenses | | | 1.08 | %** | | | 1.01 | % | | | 0.97 | % | | | 0.95 | % | | | 0.94 | %(c) | | | 0.96 | %(c) |
Gross expenses | | | 1.08 | %** | | | 1.01 | % | | | 0.97 | % | | | 0.95 | % | | | 0.94 | % | | | 0.96 | % |
Net investment income | | | 2.80 | %** | | | 1.16 | % | | | 1.95 | % | | | 1.80 | % | | | 1.57 | % | | | 1.50 | % |
Portfolio turnover rate | | | 31 | % | | | 73 | % | | | 67 | % | | | 57 | % | | | 53 | % | | | 82 | % |
Notes to Financial Highlights
| (a) | | Per share values have been calculated using the average share method. |
| (b) | | Total returns are historical and assume changes in share price, reinvestment of dividends and capital gains distributions and do not include the effect of insurance contract charges. Past performance does not guarantee future results. |
| (c) | | Includes contractual management fee waiver related to the Fund’s investments in the GE Institutional Money Market Fund (the “Money Market Fund”). The fee waiver agreement was terminated effective June 30, 2014 with the closure of the Money Market Fund. |
| * | | Beginning with the year ended December 31, 2016, the Fund was audited by Ernst & Young LLP. The previous years were audited by another independent registered public accounting firm. |
| ** | | Annualized for periods less than one year. |
The accompanying Notes are an integral part of these financial statements.
State Street Real Estate Securities V.I.S. Fund
Statement of Assets and Liabilities — June 30, 2018 (Unaudited)
| | | | |
| | | | |
Assets | | | | |
Investments in securities, at fair value (cost $52,077,324) | | $ | 57,044,079 | |
Receivable for investments sold | | | 344,787 | |
Income receivables | | | 277,032 | |
Income receivable from affiliated investments | | | 148 | |
Other assets | | | 6 | |
| | �� | | |
Total assets | | | 57,666,052 | |
| | | | |
| |
Liabilities | | | | |
Due to custodian | | | 30,615 | |
Payable for investments purchased | | | 124,605 | |
Payable for fund shares redeemed | | | 74,922 | |
Payable to the Adviser | | | 39,778 | |
Payable to the Custodian | | | 9,054 | |
Accrued other expenses | | | 17,640 | |
| | | | |
Total liabilities | | | 296,614 | |
| | | | |
| | | | |
Net Assets | | $ | 57,369,438 | |
| | | | |
| |
Net Assets Consist of: | | | | |
Capital paid in | | $ | 52,747,808 | |
Undistributed (distributions in excess of) net investment income | | | 789,582 | |
Accumulated net realized loss | | | (1,134,707 | ) |
Net unrealized appreciation (depreciation) on: | | | | |
Unaffiliated Investments | | | 4,966,755 | |
| | | | |
Net Assets | | $ | 57,369,438 | |
| | | | |
Shares outstanding ($0.01 par value; unlimited shares authorized) | | | 4,623,814 | |
Net asset value per share | | $ | 12.41 | |
The accompanying Notes are an integral part of these financial statements.
| | |
| 6 | | Statement of Assets and Liabilities |
State Street Real Estate Securities V.I.S. Fund
Statement of Operations — For the period ended June 30, 2018 (Unaudited)
| | | | |
| | | | |
Investment Income | | | | |
Income | | | | |
Dividend | | $ | 1,091,568 | |
Income from affiliated investments | | | 1,164 | |
| | | | |
Total income | | | 1,092,732 | |
| | | | |
| |
Expenses | | | | |
Advisory and administration fees | | | 240,490 | |
Directors’ fees | | | 5,907 | |
Custody and accounting expenses | | | 17,241 | |
Professional fees | | | 15,912 | |
Printing and shareholder reports | | | 19,055 | |
Other expenses | | | 4,545 | |
| | | | |
Total Expenses | | | 303,150 | |
| | | | |
Net investment income | | $ | 789,582 | |
| | | | |
| |
Net Realized and Unrealized Gain (Loss) on Investments | | | | |
Realized gain (loss) on investments | | $ | (1,384,167 | ) |
Increase (decrease) in unrealized appreciation/(depreciation) on investments | | | 722,290 | |
| | | | |
| |
Net realized and unrealized gain (loss) on investments | | | (661,877 | ) |
| | | | |
Net Increase in Net Assets Resulting from Operations | | $ | 127,705 | |
| | | | |
The accompanying Notes are an integral part of these financial statements.
| | | | |
| Statement of Operations | | | 7 | |
State Street Real Estate Securities V.I.S. Fund
Statements of Changes in Net Assets
| | | | | | | | |
| | | Six Months Ended June 30, 2018(a) | | | Year Ended December 31,
2017 | |
| | | | | | | | |
Increase (Decrease) in Net Assets | | | | | | | | |
| | |
Operations: | | | | | | | | |
Net investment income | | $ | 789,582 | | | $ | 778,423 | |
Net realized gain (loss) on investments | | | (1,384,167 | ) | | | 2,190,292 | |
Net increase (decrease) in unrealized appreciation/depreciation on investments | | | 722,290 | | | | 873,041 | |
| | | | | | | | |
Net increase (decrease) from operations | | | 127,705 | | | | 3,841,756 | |
| | | | | | | | |
| | |
Distributions to shareholders from: | | | | | | | | |
Net investment income | | | — | | | | (1,040,860 | ) |
Net realized gains | | | — | | | | (2,570,772 | ) |
| | | | | | | | |
Total distributions | | | — | | | | (3,611,632 | ) |
| | | | | | | | |
Increase (decrease) in assets from operations and distributions | | | 127,705 | | | | 230,124 | |
| | | | | | | | |
| | |
Share transactions: | | | | | | | | |
Proceeds from sale of shares | | | 1,409,247 | | | | 1,252,390 | |
Value of distributions reinvested | | | — | | | | 3,611,632 | |
Cost of shares redeemed | | | (5,852,412 | ) | | | (15,891,981 | ) |
| | | | | | | | |
Net increase (decrease) from share transactions | | | (4,443,165 | ) | | | (11,027,959 | ) |
| | | | | | | | |
| | |
Total increase (decrease) in net assets | | | (4,315,460 | ) | | | (10,797,835 | ) |
| | |
Net Assets | | | | | | | | |
Beginning of period | | | 61,684,898 | | | | 72,482,733 | |
| | | | | | | | |
| | |
End of period | | $ | 57,369,438 | | | $ | 61,684,898 | |
| | | | | | | | |
| | |
Undistributed (distributions in excess of) net investment income, end of period | | $ | 789,582 | | | $ | — | |
| | |
Changes in Fund Shares | | | | | | | | |
Shares sold | | | 122,788 | | | | 100,497 | |
Issued for distributions reinvested | | | — | | | | 295,551 | |
Shares redeemed | | | (505,471 | ) | | | (1,250,950 | ) |
| | | | | | | | |
Net decrease in fund shares | | | (382,683 | ) | | | (854,902 | ) |
| | | | | | | | |
The accompanying Notes are an integral part of these financial statements.
| | |
| 8 | | Statements of Changes in Net Assets |
State Street Real Estate Securities V.I.S. Fund
Notes to Financial Statements — June 30, 2018
| 1. | | Organization of the Company |
State Street Variable Insurance Series Funds, Inc. (the “Company”) was incorporated under the laws of the Commonwealth of Virginia on May 14, 1984 and is registered under the Investment Company Act of 1940, as amended (the “1940 Act”), as an open-end management investment company. The Company is currently composed of the following seven investment portfolios (collectively, the “Funds”): State Street U.S. Equity V.I.S. Fund, State Street S&P 500 Index V.I.S. Fund, State Street Premier Growth Equity V.I.S. Fund, State Street Small-Cap Equity V.I.S. Fund, State Street Total Return V.I.S. Fund, State Street Income V.I.S. Fund and State Street Real Estate Securities V.I.S. Fund (the “Fund”). Each Fund is a diversified investment company within the meaning of the 1940 Act.
Shares of the Funds of the Company are offered only to insurance company separate accounts that fund certain variable life insurance contracts and variable annuity contracts.
The Company currently offers one share class (Class 1) of the Fund as an investment option for variable life insurance and variable annuity contracts.
Under the Company’s organizational documents, its officers and directors are indemnified against certain liabilities arising out of the performance of their duties to the Company. Additionally, in the normal course of business, the Company enters into contracts with service providers that contain general indemnification clauses. The Company’s maximum exposure under these arrangements is unknown as this would involve future claims that may be made against the Company that have not yet occurred.
| 2. | | Summary of Significant Accounting Policies |
The following is a summary of significant accounting policies followed by the Company in the preparation of its financial statements:
The preparation of financial statements in accordance with U.S. generally accepted accounting principles (“U.S. GAAP”) requires management to make estimates and assumptions that affect the reported amounts and disclosures in the financial statements. Actual results could differ from those estimates. The Fund is an investment company under U.S. GAAP and follows the accounting and reporting guidance applicable to investment companies.
Security Valuation The Fund’s investments are valued at fair value each day that the New York Stock Exchange (“NYSE”) is open and, for financial reporting purposes, as of the report date should the reporting period end on a day that the NYSE is not open. Fair value is generally defined as the price a fund would receive to sell an asset or pay to transfer a liability in an orderly transaction between market participants at the measurement date. By its nature, a fair value price is a good faith estimate of the valuation in a current sale and may not reflect an actual market price. The investments of the Fund are valued pursuant to the policy and procedures developed by the Oversight Committee (the “Committee”) and approved by the Company’s Board of Directors (the “Board”). The Committee provides oversight of the valuation of investments for the Fund. The Board has responsibility for determining the fair value of investments.
Valuation techniques used to value the Fund’s investments by major category are as follows:
| | • | | Equity investments traded on a recognized securities exchange for which market quotations are readily available are valued at the last sale price or official closing price, as applicable, on the primary market or exchange on which they trade. Equity investments traded on a recognized exchange for which there were no sales on that day are valued at the last published sale price or at fair value. |
In the event prices or quotations are not readily available or that the application of these valuation methods results in a price for an investment that is deemed to be not representative of the fair value of such investment, fair value will be determined in good faith by the Committee, in accordance with the valuation policy and procedures approved by the Board.
The Fund values its assets and liabilities at fair value using a fair value hierarchy consisting of three broad levels that prioritize the inputs to valuation techniques giving the highest priority to readily available unadjusted quoted prices in active markets for identical assets or liabilities (Level 1 measurements) and the lowest priority to unobservable inputs (Level 3 measurements) when market prices are not readily available or reliable. The categorization of a value determined for an investment within the hierarchy is based upon the pricing transparency of the investment and is not necessarily an indication of the risk associated with investing in it.
| | | | |
| Notes to Financial Statements | | | 9 | |
State Street Real Estate Securities V.I.S. Fund
Notes to Financial Statements, continued — June 30, 2018
The three levels of the fair value hierarchy are as follows:
| | • | | Level 1 — Unadjusted quoted prices in active markets for an identical asset or liability; |
| | • | | Level 2 — Inputs other than quoted prices included within Level 1 that are observable for the asset or liability either directly or indirectly, including quoted prices for similar assets or liabilities in active markets, quoted prices for identical or similar assets or liabilities in markets that are not considered to be active, inputs other than quoted prices that are observable for the asset or liability (such as exchange rates, financing terms, interest rates, yield curves, volatilities, prepayment speeds, loss severities, credit risks and default rates) or other market-corroborated inputs; and |
| | • | | Level 3 — Unobservable inputs for the asset or liability, including the Committee’s assumptions used in determining the fair value of investments. |
The value of the Fund’s investments according to the fair value hierarchy as of June 30, 2018 is disclosed in the Fund’s Schedule of Investments.
Changes in valuation techniques may result in transfers in or out of an assigned level within the fair value hierarchy. Transfers between different levels of the fair value hierarchy are recognized at the beginning of the reporting period. The Fund had no material transfers between levels for the six-month period ended June 30, 2018.
Investment Transactions and Income Recognition Investment transactions are accounted for on trade date for financial reporting purposes. Realized gains and losses from the sale or disposition of investments and foreign exchange transactions, if any, are determined using the identified cost method.
Dividend income and capital gain distributions, if any, are recognized on the ex-dividend date, net of any foreign taxes withheld at source, if any.
Interest income is recorded daily on an accrual basis. All premiums and discounts are amortized/accreted for financial reporting purposes.
Non-cash dividends received in the form of stock are recorded as dividend income at fair value.
Expenses Certain expenses, which are directly identifiable to a specific Fund, are applied to the Fund within the Company. Other expenses which cannot be attributed to a specific Fund are allocated in such a manner as deemed equitable, taking into consideration the nature and type of expense and the relative net assets of the Fund within the Company.
Foreign Currency Translation The accounting records of the Fund are maintained in U.S. dollars. Foreign currencies as well as investment securities and other assets and liabilities denominated in a foreign currency are translated to U.S. dollars using exchange rates at period end. Purchases and sales of securities, income receipts and expense payments denominated in foreign currencies are translated into U.S. dollars at the prevailing exchange rate on the respective dates of the transactions.
The effects of exchange rate fluctuations on investments are included with the net realized and unrealized gain (loss) on investment securities. Other foreign currency transactions resulting in realized and unrealized gain (loss) are disclosed separately.
Foreign Taxes The Fund may be subject to foreign taxes (a portion of which may be reclaimable) on income, stock dividends, realized and unrealized capital gains on investments or certain foreign currency transactions. Foreign taxes are recorded in accordance with SSGA Funds Management, Inc.’s (the “Advisor” or “SSGA FM”) understanding of the applicable foreign tax regulations and rates that exist in the foreign jurisdictions in which the Fund invests. These foreign taxes, if any, are paid by the Fund and are reflected in the Statements of Operations, if applicable. Foreign taxes payable or deferred as of June 30, 2018, if any, are disclosed in the Fund’s Statements of Assets and Liabilities.
Distributions The Fund declares and pays any dividends from net investment income annually.
Net realized capital gains, if any, are distributed annually, unless additional distributions are required for compliance with applicable tax regulations. The amount and character of income and capital gains to be distributed are determined in accordance with applicable tax regulations which may differ from net investment income and realized gains recognized for U.S. GAAP purposes.
| | |
| 10 | | Notes to Financial Statements |
State Street Real Estate Securities V.I.S. Fund
Notes to Financial Statements, continued — June 30, 2018
| 3. | | Fees and Transactions with Affiliates |
Advisory Fee SSGA FM, a registered investment adviser, was retained by the Board to act as investment adviser and administrator of the Fund. SSGA FM’s compensation for investment advisory and administrative services (“Management Fee”) is paid monthly based on the average daily net assets of the Fund. The Management Fee is stated in the following schedule:
| | | | | | | | |
Average Daily Net Assets of the Fund | | Management Fees |
| | First $ | 100 million | | | | | 0.85 | % |
| | Next $ | 100 million | | | | | 0.80 | % |
| | Over $ | 200 million | | | | | 0.75 | % |
Administrator, Sub-Administrator and Custodian Fees State Street Bank and Trust Company (“State Street”) serves as the sub-administrator and custodian to the Funds. Amounts paid by the Fund to State Street for performing such services are included in advisory and administration and custody and accounting expenses, respectively.
Due to Custodian In certain circumstances, the Funds may have cash overdraft with the custodian. The Due to Custodian amount, if any, reflects cash overdrawn with State Street as custodian who is an affiliate of the Funds. As of June 30, 2018, the Fund had a cash overdraft related to fund share redemption activity.
Other Transactions with affiliates The Fund may invest in affiliated entities, including securities issued by State Street, affiliated funds, or entities deemed to be affiliates as a result of the Fund owning more than five percent of the entity’s voting securities or outstanding shares. Amounts relating to these transactions during the period ended June 30, 2018 are disclosed in the Schedule of Investments.
Pursuant to an investment sub-advisory agreement with SSGA FM, CenterSquare Investment Management LLC (“CenterSquare”) is the sub-adviser to the Fund. CenterSquare is responsible for the day-to-day portfolio management of the assets of the Fund, including the responsibility for making decisions to buy, sell or hold a particular security, under the general supervision of SSGA FM and the Board. For its services, SSGA FM pays CenterSquare monthly sub-advisory fees which are calculated as a percentage of the average daily net assets of the Fund.
The fees and expenses of the Company’s directors who are not “interested persons” of the Company, as defined in the 1940 Act (“Independent Directors”) are paid directly by the Fund. The Independent Directors are reimbursed for travel and other out-of-pocket expenses in connection with meeting attendance and industry seminars.
| 6. | | Investment Transactions |
Purchases and sales of investments (excluding in-kind transactions, short term investments and derivative contracts) for the six-month ended, June 30, 2018 were as follows:
| | | | | | | | |
| Non-U.S. Government Securities |
| Purchases | | Sales |
| | | | | | | | | |
| | | $17,884,637 | | | | $ | 21,139,288 | |
The Fund has qualified and intends to continue to qualify as a regulated investment company under Subchapter M of the Internal Revenue Code of 1986, as amended. The Fund will not be subject to federal income taxes to the extent it distributes its taxable income, including any net realized capital gains, for each fiscal year. Therefore, no provision for federal income tax is required.
The Fund files federal and various state and local tax returns as required. No income tax returns are currently under examination. Generally, the federal returns are subject to examination by the Internal Revenue Service for a period of three years from date of filing, while the state returns may remain open for an additional year depending upon jurisdiction. SSGA FM has analyzed the Fund’s tax positions taken on tax returns for all open years and does not believe there are any uncertain tax positions that would require recognition of a tax liability.
| | | | |
| Notes to Financial Statements | | | 11 | |
State Street Real Estate Securities V.I.S. Fund
Notes to Financial Statements, continued — June 30, 2018
Distributions to shareholders are recorded on ex-dividend date. Income dividends and gain distributions are determined in accordance with income tax rules and regulations, which may differ from generally accepted accounting principles.
As of June 30, 2018, gross unrealized appreciation and gross unrealized depreciation of investments based on cost for federal income tax purposes were as follows:
| | | | | | | | | | | | | | | | | | |
Tax
Cost | | Gross
Unrealized
Appreciation | | Gross
Unrealized
Depreciation | | Net Unrealized
Appreciation
(Depreciation) |
| | | | | | | | | | | | | | | | | | | |
| | $ | 52,511,042 | | | | $ | 5,622,016 | | | | $ | 1,088,979 | | | | $ | 4,533,037 | |
The Fund and other affiliated funds (each a “Participant” and collectively, the “Participants”) participate in a $500 million revolving credit facility provided by a syndication of banks under which the Participants may borrow to fund shareholder redemptions. This agreement expires in October 2018 unless otherwise extended or renewed.
The Participants are charged an annual commitment fee which is calculated based on the unused portion of the shared credit line. Commitment fees are allocated among each of the Participants based on relative net assets. Commitment fees are ordinary fund operating expenses paid by the Adviser. A Participant incurs and pays the interest expense related to its borrowing. Interest is calculated at a rate per annum equal to the sum of 1% plus the greater of the New York Fed Bank Rate and 1-month LIBOR rate.
The Fund had no outstanding loans as of June 30, 2018.
Concentration Risk As a result of the Fund’s ability to invest a large percentage of its assets in obligations of issuers within the same country, state, region, currency or economic sector, an adverse economic, business or political development may affect the value of the Fund’s investments more than if the Fund were more broadly diversified.
Market and Credit Risk In the normal course of business, the Fund trades financial instruments and enters into financial transactions where risk of potential loss exists due to changes in the general economic conditions and fluctuations of the market (market risk). Additionally, the Fund may also be exposed to credit risk in the event that an issuer or guarantor fails to perform or that an institution or entity with which the Fund has unsettled or open transactions defaults.
Management has evaluated the impact of all subsequent events on the Fund through the date on which the financial statements were available to be issued and has determined that there were no subsequent events requiring adjustment or disclosure in the financial statements.
| | |
| 12 | | Notes to Financial Statements |
State Street Real Estate Securities V.I.S. Fund
Other Information (Unaudited)
Proxy Voting Policies and Procedures and Record
The Fund has adopted the proxy voting policies of SSGA FM. A description of the policies and procedures that the Fund has adopted to determine how to vote proxies relating to portfolio securities is available (i) without charge, upon request, by calling 1-800-242-0134, (ii) on the Fund’s website at http://www.ssga.com/geam, (iii) on the SEC’s website at www.sec.gov, and (iv) at the SEC’s public reference room. Information on the operation of the public reference room may be obtained by calling 1-800-SEC-0330. Information regarding how the Fund voted proxies, if any, during the most recent 12-month period ended June 30 is available by August 31 of each year without charge (1) by calling 1-800-242-0134 (toll free), and (2) on the website of the SEC at www.sec.gov.
Quarterly Portfolio Schedule
The Fund files its complete schedule of investments with the SEC for the first and third quarters of each fiscal year on Form N-Q. The Fund’s Forms N-Q are available (i) without charge, upon request, by calling 1-800-242-013, (ii) on the Fund’s website at http://www.ssga.com/geam, (iii) on the SEC’s website at www.sec.gov, and (iv) at the SEC’s public reference room. Information on the operation of the public reference room may be obtained by calling 1-800-SEC-0330.
State Street Real Estate Securities V.I.S. Fund
Other Information (Unaudited), continued
Disclosure for the Board of Directors’ Consideration of the Renewal of the Investment Advisory and Administration Agreement with SSGA Funds Management, Inc. and the Sub-Advisory Agreement with CenterSquare Investment Management LLC on behalf of the State Street Real Estate Securities V.I.S. Fund
At meetings of the Board of Directors (the “Board”) of State Street Variable Insurance Series Funds, Inc. (the “V.I.S. Funds”) held on May 16, 2018 and June 5, 2018 (the “Board Meetings”), the Board members, including the Board members who are not “interested persons” (as defined in the Investment Company Act of 1940, as amended (the “1940 Act”)) of the V.I.S. Funds (“Independent Board Members”), considered and unanimously approved the continuance for an additional year of the investment advisory and administration agreement (the “Investment Advisory and Administration Agreement”) between SSGA Funds Management, Inc. (“SSGA FM” or the “Adviser”) and the V.I.S. Funds on behalf of each of its series portfolios, including the State Street Real Estate Securities V.I.S. Fund (the “Fund”), and the sub-advisory agreement by and among SSGA FM, the V.I.S. Funds on behalf of the Fund and CenterSquare Investment Management LLC (“CenterSquare”) (the “Sub-Advisory Agreement”).
In considering whether to approve the continuance for an additional year of the Investment Advisory and Administration Agreement and the Sub-Advisory Agreement, the Board members considered and discussed a substantial amount of information and analysis provided, at the Board’s request, by the Adviser and CenterSquare. The Board members also considered detailed information regarding performance and expenses of other investment companies, including those with similar investment strategies and sizes, which was prepared by an independent third party provider, Broadridge Financial Solutions, Inc. (“Broadridge”). The Board members reviewed the fees charged by the Adviser for other mutual funds and investment products other than mutual funds that employ a similar investment strategy as the Fund. The Board had the opportunity to ask questions and request additional information in connection with its considerations.
Before approving the continuance of the Investment Advisory and Administration Agreement and the Sub-Advisory Agreement, the Independent Board Members reviewed the information provided with management of the Adviser and with their independent legal counsel. The Board also reviewed a memorandum prepared by independent legal counsel discussing the legal standards for the consideration of the proposed continuances. The Independent Board Members discussed the proposed continuances of the Investment Advisory and Administration Agreement and the Sub-Advisory Agreement in detail during private sessions in advance of, and at, the Board Meetings with their independent legal counsel at which no representatives of the Adviser or CenterSquare were present. The Independent Board Members and their independent legal counsel requested, and received and considered, additional information from the Adviser and CenterSquare following the May 16, 2018 Board Meeting and prior to the June 5, 2018 Board Meeting.
In advance of the Board Meetings, and in response to their detailed requests, the Board members received from the Adviser written responses to their inquiries, which included substantial exhibits and other materials related to the Adviser’s business and the services it provides to the Fund. Also in advance of the Board Meetings, the Board members received from CenterSquare a written response to a letter of inquiry prepared by SSGA FM at the Board’s request, which included substantial exhibits and other materials related to the business of, and services provided by, CenterSquare. The Directors took into account their multi-year experience as Directors and particularly their previous consideration of these types of agreements.
During the Board Meetings, the Board members had an opportunity to discuss this information with SSGA FM representatives, including senior executives, representatives from the legal, compliance and finance departments, and investment personnel. The Board members also had an opportunity to hear presentations by representatives of CenterSquare. The Board members posed questions to these representatives and engaged in significant discussions.
In reaching its determinations relating to the continuances of the Investment Advisory and Administration Agreement and the Sub-Advisory Agreement, the Board considered those factors it deemed relevant, including the factors discussed below. In its deliberations, the Board did not identify any single factor that was dispositive and each Director may have attributed different weights to the various factors. The Directors evaluated the information provided to them, as well as the presentations and discussions that occurred at the Board Meetings, for the Fund, and their determinations were made separately in respect of the Fund from other series portfolios of the V.I.S Funds.
State Street Real Estate Securities V.I.S. Fund
Other Information (Unaudited), continued
The material factors and conclusions that formed the basis for the Board’s determinations to approve the continuances of the Investment Advisory and Administration Agreement and the Sub-Advisory Agreement on behalf of the Fund are as discussed below.
The Nature, Extent and Quality of Services Provided.
The Board reviewed the services provided to the Fund by the Adviser and CenterSquare. In connection with their consideration of the Adviser’s services, the Board considered the Adviser’s management capabilities, including the education, experience and number of investment professionals and other personnel who provide services to the Fund. The Board evaluated, where relevant, the abilities and experience of such personnel. The Board also considered the Adviser’s processes used for overseeing sub-advisers. The Board considered the extensive experience and resources committed by the Adviser to risk management, including with respect to investment risk, liquidity risk, operational risk, counterparty risk and model risk. The Board also considered the significant risks assumed by the Adviser in connection with the services provided to the Fund, including operational, enterprise, regulatory, litigation and compliance risks. The Board also took into account the compensation paid to recruit and retain investment personnel, and the time and attention devoted to the Fund by senior management.
The Board had previously reviewed the compliance programs of SSGA FM and various affiliated service providers (“Affiliated Service Providers”). Among other things, the Board considered compliance and reporting matters relating to personal trading by investment personnel, selective disclosure of portfolio holdings, late trading, portfolio valuation and business continuity.
In connection with their consideration of the services provided by CenterSquare, the Board considered CenterSquare’s attributes relating to its investment philosophy oriented toward long-term performance, its process for selecting investments, its experienced professionals, access to significant technological resources and a favorable history and reputation. The Board also considered the review process undertaken by SSGA FM and SSGA FM’s favorable assessment of the nature and quality of the investment sub-advisory services provided by CenterSquare to the Fund.
In light of the foregoing and other relevant information, the Board, including the Independent Board Members, concluded that the services provided by the Adviser and CenterSquare continue to be satisfactory.
Investment Performance.
The Board members considered the investment performance of the Fund for various periods. The Board members reviewed detailed comparisons of the performance of the Fund with the relevant securities index and peer and category groupings of mutual funds prepared by Broadridge with respect to various periods. The Board members also engaged in detailed discussions with SSGA FM management and representatives of CenterSquare about their investment processes and performance results. These discussions focused on the Fund’s investment objective, the number and experience of portfolio management and supporting research personnel, the Fund’s investment style and approach employed, the likely market cycles for the Fund’s investment style and the Fund’s generally strong performance.
Taking these factors into consideration, the Board, including the Independent Board Members, concluded that the Fund’s performance was acceptable overall.
Cost of the Services Provided And Profits Realized From The Relationships with the Fund.
The Directors considered the management fees paid to the Adviser by the Fund as well as the fees paid to CenterSquare by the Adviser, which would reduce the net management fees retained by the Adviser. The Board reviewed the level of profits realized by the Adviser, the Affiliated Service Providers and CenterSquare in providing investment advisory and other services to the Fund. Information also was presented regarding the financial condition of the Adviser and CenterSquare for various past periods. The Directors also considered the Adviser’s statements concerning its significant investment in supporting registered investment companies. The Board also considered the various risks borne by SSGA FM, the Affiliated Service Providers and CenterSquare in connection with their various roles in servicing the Fund, including enterprise, litigation, business, operational and entrepreneurial risk.
The Board concluded that the profitability of the Adviser and CenterSquare with respect to the Fund, and the profitability range of each of the Affiliated Service Providers with respect to its services to the Fund, were reasonable in relation to the services provided.
State Street Real Estate Securities V.I.S. Fund
Other Information (Unaudited), continued
The Extent to Which Economies of Scale Would Be Realized as the Fund Grows and Whether Fee Levels Would Reflect Such Economies of Scale.
The Board considered the extent to which the Adviser and the Affiliated Service Providers, on the one hand, and the Fund, on the other hand, can expect to realize benefits from economies of scale as the assets of the Fund increase. The Board acknowledged the difficulty in accurately measuring the benefits resulting from the economies of scale with respect to the management of the Fund. The Board concluded that, in light of, among other considerations, the current size of the Fund, the level of profitability of the Adviser and the Affiliated Service Providers with respect to the Fund, and/or the comparative management fee and expense ratio of the Fund, it does not appear that the Adviser or the Affiliated Service Providers has realized benefits from economies of scale in managing the assets of the Fund to such an extent that previously agreed management fees (or breakpoints in such fees) should be reduced at this time.
Comparison of Services to be Rendered and Fees to be Paid.
The Board discussed the respective services provided to the Fund by each of the Adviser and CenterSquare, and the fees charged to the Fund for those services. As part of its review, the Board considered the Fund’s management fee and total expense ratio, including the portion attributable to administrative services provided by SSGA FM, as compared to the expense ratios of a group of comparable mutual funds selected by Broadridge, and the related Broadridge analysis for the Fund. The Board also considered the comparability of the fees charged and the services provided to the Fund by the Adviser to the fees charged and services provided to other clients of the Adviser. Among other information, the Board considered that the Fund’s advisory fees and expense ratios were among the highest in the applicable Broadridge peer group range. The Board members also reviewed comparative mutual fund and/or other account fee information for CenterSquare clients provided by CenterSquare.
In light of the foregoing, the Board, including the Independent Board Members, determined that the management fees and sub-advisory fees, considered in relation to the services provided to the Fund, supported the Board’s approval of the continuance of the Investment Advisory and Administration Agreement and the Sub-Advisory Agreement.
Fall-Out Benefits.
The Board considered actual and potential financial benefits that the Adviser and CenterSquare could derive from their respective relationships with the Fund, including the custody, fund accounting and sub-administration services being provided to the Fund by affiliates of the Adviser and, to the extent applicable, soft dollar commission benefits generated through Fund portfolio transactions. The Board noted, however, that the Fund benefits from the vast array of resources available through SSGA FM, and that the Fund represents only a small portion of the assets managed by SSGA FM.
Conclusion.
No single factor was determinative to the Board’s decision. Based on their discussion and such other matters as were deemed relevant, the Directors, including the Independent Board Members, approved the continuance of the Investment Advisory and Administration Agreement and the Sub-Advisory Agreement for the Fund.
Directors
John R. Costantino, Chairman
R. Sheldon Johnson
Donna M. Rapaccioli
Jeanne M. La Porta
Officers
Jeanne M. La Porta, President
Arthur Jensen, Treasurer
Brian Harris, Chief Compliance Officer and Anti-Money Laundering Officer
Bruce S. Rosenberg, Assistant Treasurer
Ann M. Carpenter, Assistant Treasurer
Chad C. Hallett, Assistant Treasurer
Darlene Anderson-Vasquez, Assistant Treasurer
Daniel G. Plourde, Assistant Treasurer
Jesse Hallee, Secretary
Investment Adviser and Administrator
SSGA Funds Management, Inc.
1600 Summer Street
P.O. Box 7900
Stamford, CT 06904-7900
Custodian and Sub-Administrator
State Street Bank and Trust Company
One Lincoln Street
Boston, Massachusetts 02111
Distributor
State Street Global Advisors Funds Distributors, LLC
One Iron Street
Boston, MA 02210
Independent Registered Public Accounting Firm
Ernst & Young LLP
200 Clarendon Street
Boston, Massachusetts 02116
Semi-Annual Report
June 30, 2018
State Street Total Return V.I.S. Fund

State Street Total Return V.I.S Fund
Semi-Annual Report
June 30, 2018 (Unaudited)
Table of Contents
This report is prepared for Policyholders of certain variable contracts and may be distributed to others only if preceded or accompanied by the variable contract’s current prospectus and the current summary prospectus of the Fund available for investments thereunder.
State Street Total Return V.I.S. Fund
Fund Information — June 30, 2018 (Unaudited)
Total return performance shown in this report for the Fund takes into account changes in share price and assumes reinvestment of dividends and capital gains distributions, if any. Total returns shown are net of Fund fees and expenses but do not reflect fees and charges associated with the variable contracts such as administrative fees, account charges and surrender charges, which, if reflected, would reduce the Fund’s total returns for all periods shown.
The performance data quoted represents past performance; past performance does not guarantee future results. Investment return and principal value will fluctuate so your shares, when redeemed, may be worth more or less than their original cost. Current performance may be higher or lower than the performance data quoted. Periods less than one year are not annualized. Please call toll-free (800) 242-0134 or visit the Fund’s website at http://www.ssga.com/geam for the most recent month-end performance data.
An investment in the Fund is not a deposit of any bank and is not insured or guaranteed by the Federal Deposit Insurance Corporation (“FDIC”) or any other government agency. An investment in the Fund is subject to risk, including possible loss of principal invested.
Sector Allocation
Portfolio Composition as a % of Fair Value of $2,158,061 (in thousands) as of June 30, 2018 (a)(b)
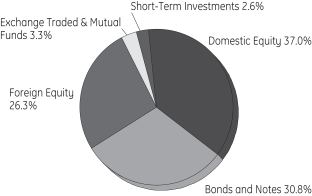
Top Ten Largest Equity Holdings
as of June 30, 2018 (as a % of Fair Value) (a)(b)
| | | | |
Apple Inc. | | | 1.41 | % |
Microsoft Corp. | | | 1.17 | % |
Amazon.com Inc. | | | 1.06 | % |
Facebook Inc., Class A | | | 0.72 | % |
Berkshire Hathaway Inc., Class B | | | 0.56 | % |
JPMorgan Chase & Co. | | | 0.55 | % |
Exxon Mobil Corp. | | | 0.54 | % |
Alphabet Inc., Class C | | | 0.53 | % |
Alphabet Inc., Class A | | | 0.52 | % |
Johnson & Johnson | | | 0.50 | % |
| (a) | Fair Value basis is inclusive of short-term investment in State Street Institutional U.S. Government Money Market Fund – Class G Shares. |
| (b) | The securities information regarding holdings, allocations and other characteristics is presented to illustrate examples of securities that the Fund has bought and the diversity of areas in which the Fund may invest as of a particular date. It may not be representative of the Fund’s current or future investments and should not be construed as a recommendation to purchase or sell a particular security. |
State Street Global Advisors Funds Distributors, LLC, member of FINRA & SIPC is the principal underwriter and distributor of the State Street V.I.S. Funds and an indirect wholly-owned subsidiary of State Street Corporation. References to State Street may include State Street Corporation and its affiliates. The Funds pay State Street Bank and Trust Company for its services as custodian and Fund Accounting agent, and pay SSGA Funds Management, Inc. for investment advisory and administrative services.
| | | | |
| State Street Total Return V.I.S. Fund | | | 1 | |
State Street Total Return V.I.S. Fund
Understanding Your Fund’s Expenses — June 30, 2018 (Unaudited)
As a shareholder of the Fund, you incur ongoing costs. Ongoing costs include portfolio management fees, professional fees, administrative fees and other Fund expenses. The following example is intended to help you understand your ongoing costs (in dollars) of investing in the Fund and to compare these costs with the ongoing costs of investing in other mutual funds.
To illustrate these ongoing costs, we have provided an example and calculated the expenses paid by investors in the Fund during the period. The information in the following table is based on an investment of $1,000, which is invested at the beginning of the period and held for the entire six-month period ended June 30, 2018.
Actual Expenses
The first section of the table provides information about actual account values and actual expenses. You may use the information in this section, together with the amount you invested, to estimate the expenses that you paid over the period. To do so, simply divide your account value by $1,000 (for example, an $8,600 account value divided by $1,000 = 8.6), then multiply the result by the number given under the heading “Expenses paid during the period” to estimate the expenses you paid on your account during the period.
Hypothetical Example for Comparison Purposes
The second section of the table provides information about hypothetical account values and hypothetical expenses based on the Fund’s actual expense ratio and an assumed rate of return of 5% per year before expenses, which is not the Fund’s actual return. The hypothetical account values and expenses may not be used to estimate the actual ending account balance or expenses you paid for the period. You may use this information to compare the ongoing costs of investing in the Fund and other funds. To do so, compare this 5% hypothetical example with the 5% hypothetical examples that appear in the shareholder reports of other funds.
Please note that the expenses shown in the table are meant to highlight and help you compare ongoing costs only and do not reflect transaction costs, such as sales charges or redemption fees, if any. Therefore, the second section of the table is useful in comparing ongoing costs only, and will not help you determine the relative total costs of owning different funds. Additionally, the expenses shown do not reflect the fees or charges associated with variable contracts through which shares of the Fund are offered.
| | | | | | | | |
Class 1 | | Actual
Fund Return | | | Hypothetical
5% Return
(2.5% for
the period) | |
Actual Fund Return Beginning Account Value January 1, 2018 | | $ | 1,000.00 | | | $ | 1,000.00 | |
Ending Account Value June 30, 2018 | | $ | 992.50 | | | $ | 1,021.70 | |
Expenses paid during the period* | | $ | 3.11 | | | $ | 3.16 | |
| | | | | | | | |
Class 3 | | Actual
Fund Return | | | Hypothetical
5% Return
(2.5% for
the period) | |
Actual Fund Return Beginning Account Value January 1, 2018 | | $ | 1,000.00 | | | $ | 1,000.00 | |
Ending Account Value June 30, 2018 | | $ | 991.40 | | | $ | 1,020.43 | |
Expenses paid during the period* | | $ | 4.35 | | | $ | 4.41 | |
| * | Expenses are equal to the Fund’s annualized expense ratio of 0.63% for Investment Class shares and 0.88% for Service Class shares (for the period January 1, 2018-June 30, 2018), multiplied by the average account value over the period, multiplied by 181/365 (to reflect the one-half year period). |
| | |
| 2 | | State Street Total Return V.I.S. Fund |
State Street Total Return V.I.S. Fund
Summary Schedule of Investments — June 30, 2018 (Unaudited)
| | | | | | | | |
| | | Number
of Shares | | |
Fair
Value $ | |
| | | | | | | | |
| | | | | | | | |
| Equity Securities - 63.5%† | |
Consumer Discretionary - 7.8% | |
Amazon.com Inc. (a) | | | 13,415 | | | | 22,802,817 | |
Comcast Corp., Class A | | | 152,989 | | | | 5,019,569 | |
Netflix Inc. | | | 14,498 | | | | 5,674,952 | |
The Home Depot Inc. | | | 38,447 | | | | 7,501,010 | |
The Walt Disney Co. | | | 49,435 | | | | 5,181,282 | |
Other Securities | | | 6,556,344 | | | | 121,847,645 | |
| | | | | | | | |
| | | | | | | 168,027,275 | |
| | | | | | | | |
|
Consumer Staples - 4.9% | |
China Huishan Dairy Holdings Company Ltd. (a)(f) | | | 55,000 | | | | — | |
PepsiCo Inc. | | | 47,208 | | | | 5,139,535 | |
Nestle S.A. | | | 81,695 | | | | 6,326,951 | |
The Coca-Cola Co. | | | 127,811 | | | | 5,605,790 | |
The Procter & Gamble Co. | | | 83,702 | | | | 6,533,778 | |
Other Securities | | | 4,678,952 | | | | 83,395,296 | |
| | | | | | | | |
| | | | | | | 107,001,350 | |
| | | | | | | | |
|
Energy - 4.3% | |
Chevron Corp. | | | 63,788 | | | | 8,064,717 | |
Exxon Mobil Corp. | | | 141,307 | | | | 11,690,328 | |
Other Securities | | | 6,602,316 | | | | 72,453,249 | |
| | | | | | | | |
| | | | | | | 92,208,294 | |
| | | | | | | | |
|
Financials - 11.0% | |
Bank of America Corp. | | | 314,098 | | | | 8,854,423 | |
Berkshire Hathaway Inc., Class B (a) | | | 64,243 | | | | 11,990,956 | |
Citigroup Inc. | | | 84,832 | | | | 5,676,957 | |
HSBC Holdings PLC | | | 528,900 | | | | 4,962,680 | |
JPMorgan Chase & Co. | | | 113,478 | | | | 11,824,408 | |
State Street Corp. (b) | | | 12,236 | | | | 1,139,049 | |
Wells Fargo & Co. | | | 146,606 | | | | 8,127,837 | |
Other Securities | | | 38,064,029 | | | | 184,647,781 | |
| | | | | | | | |
| | | | | | | 237,224,091 | |
| | | | | | | | |
|
Healthcare - 7.4% | |
AbbVie Inc. | | | 50,420 | | | | 4,671,413 | |
Johnson & Johnson | | | 89,493 | | | | 10,859,081 | |
Merck & Company Inc. | | | 89,812 | | | | 5,451,588 | |
Novartis AG | | | 58,331 | | | | 4,422,335 | |
Pfizer Inc. | | | 194,779 | | | | 7,066,585 | |
UnitedHealth Group Inc. | | | 32,011 | | | | 7,853,579 | |
Other Securities | | | 3,175,544 | | | | 119,319,671 | |
| | | | | | | | |
| | | | | | | 159,644,252 | |
| | | | | | | | |
|
Industrials - 6.8% | |
The Boeing Co. | | | 18,229 | | | | 6,116,012 | |
Other Securities | | | 7,245,844 | | | | 139,785,097 | |
| | | | | | | | |
| | | | | | | 145,901,109 | |
| | | | | | | | |
| | | | | | | | |
| | | Number
of Shares
or Principal Amount ($) | | | Fair
Value $ | |
| | | | | | | | |
Information Technology - 12.6% | |
Alphabet Inc., Class A (a) | | | 9,934 | | | | 11,217,373 | |
Alphabet Inc., Class C (a) | | | 10,163 | | | | 11,338,351 | |
Apple Inc. | | | 163,887 | | | | 30,337,123 | |
Cisco Systems Inc. | | | 156,534 | | | | 6,735,658 | |
Facebook Inc., Class A (a) | | | 79,972 | | | | 15,540,159 | |
Hanergy Thin Film Power Group Ltd. (a)(f) | | | 342,000 | | | | — | |
Intel Corp. | | | 155,440 | | | | 7,726,922 | |
Microsoft Corp. | | | 256,085 | | | | 25,252,542 | |
Tencent Holdings Ltd. | | | 153,300 | | | | 7,694,847 | |
Visa Inc., Class A | | | 59,457 | | | | 7,875,080 | |
Mastercard Inc., Class A | | | 30,552 | | | | 6,004,079 | |
Alibaba Group Holding Ltd. ADR (a) | | | 31,013 | | | | 5,753,842 | |
Samsung Electronics Company Ltd. | | | 126,342 | | | | 5,288,340 | |
NVIDIA Corp. | | | 20,281 | | | | 4,804,569 | |
Taiwan Semiconductor Manufacturing Company Ltd. | | | 646,000 | | | | 4,587,271 | |
Oracle Corp. | | | 99,786 | | | | 4,396,571 | |
Other Securities | | | 5,090,940 | | | | 118,106,156 | |
| | | | | | | | |
| | | | | | | 272,658,883 | |
| | | | | | | | |
|
Materials - 3.1% | |
Ferroglobe PLC (a)(f) | | | 1,316 | | | | — | |
DowDuPont Inc. | | | 77,254 | | | | 5,092,584 | |
Other Securities | | | 5,215,114 | | | | 62,720,841 | |
| | | | | | | | |
| | | | | | | 67,813,425 | |
| | | | | | | | |
|
Real Estate - 2.0% | |
Other Securities | | | 5,271,193 | | | | 43,422,562 | |
| | | | | | | | |
| | | | | | | 43,422,562 | |
| | | | | | | | |
|
Telecommunication Services - 1.7% | |
AT&T Inc. | | | 242,291 | | | | 7,779,964 | |
Verizon Communications Inc. | | | 137,840 | | | | 6,934,730 | |
Other Securities | | | 6,679,177 | | | | 21,120,028 | |
| | | | | | | | |
| | | | | | | 35,834,722 | |
| | | | | | | | |
|
Utilities - 1.9% | |
Other Securities | | | 5,841,575 | | | | 41,061,981 | |
| | | | | | | | |
| | | | | | | 41,061,981 | |
| | | | | | | | |
| |
Total Equity Securities
(Cost $931,988,855) | | | | 1,370,797,944 | |
| | | | | | | | |
|
| Bonds and Notes - 30.8% | |
U.S. Treasuries - 11.3% | |
U.S. Treasury Bonds | | | | | | | | |
2.25% 08/15/46 | | | 1,600,000 | | | | 1,377,328 | |
2.50% 02/15/45 - 05/15/46 | | | 4,510,000 | | | | 4,101,329 | |
See Notes to Summary Schedule of Investments and Notes to Financial Statements.
| | | | |
| State Street Total Return V.I.S. Fund | | | 3 | |
State Street Total Return V.I.S. Fund
Summary Schedule of Investments, continued — June 30, 2018 (Unaudited)
| | | | | | | | |
| | | Principal Amount ($) | | | Fair
Value $ | |
| | | | | | | | |
| | | | | | | | |
2.75% 11/15/42 - 11/15/47 | | | 3,650,000 | | | | 3,487,262 | |
2.88% 08/15/45 - 11/15/46 | | | 1,800,000 | | | | 1,763,548 | |
3.00% 05/15/42 - 02/15/48 | | | 12,500,000 | | | | 12,547,616 | |
3.13% 08/15/44 - 05/15/48 | | | 2,500,000 | | | | 2,566,550 | |
3.38% 05/15/44 | | | 1,900,000 | | | | 2,034,805 | |
3.63% 08/15/43 - 02/15/44 | | | 1,740,000 | | | | 1,939,547 | |
3.75% 11/15/43 | | | 1,400,000 | | | | 1,591,030 | |
4.25% 05/15/39 - 11/15/40 | | | 2,000,000 | | | | 2,417,890 | |
4.38% 02/15/38 - 11/15/39 | | | 2,000,000 | | | | 2,441,940 | |
4.50% 02/15/36 | | | 2,000,000 | | | | 2,445,720 | |
4.63% 02/15/40 | | | 500,000 | | | | 634,435 | |
5.25% 02/15/29 | | | 200,000 | | | | 243,566 | |
5.50% 08/15/28 | | | 1,450,000 | | | | 1,785,196 | |
6.00% 02/15/26 | | | 1,827,000 | | | | 2,225,067 | |
6.38% 08/15/27 | | | 200,000 | | | | 256,706 | |
7.63% 11/15/22 - 02/15/25 | | | 500,000 | | | | 618,528 | |
7.88% 02/15/21 | | | 2,000,000 | | | | 2,265,880 | |
8.75% 05/15/20 | | | 3,000,000 | | | | 3,342,810 | |
U.S. Treasury Notes | | | | | | | | |
1.00% 10/15/19 | | | 3,500,000 | | | | 3,436,440 | |
1.13% 03/31/20 - 09/30/21 | | | 6,500,000 | | | | 6,235,796 | |
1.25% 10/31/19 - 10/31/21 | | | 6,500,000 | | | | 6,275,585 | |
1.38% 07/31/19 - 05/31/21 | | | 15,500,000 | | | | 15,171,165 | |
1.50% 11/30/19 - 08/15/26 | | | 10,400,000 | | | | 10,067,678 | |
1.63% 08/31/19 - 05/15/26 | | | 19,540,000 | | | | 18,806,757 | |
1.75% 11/30/19 - 09/30/22 | | | 12,600,000 | | | | 12,305,510 | |
1.88% 12/15/20 - 09/30/22 | | | 23,000,000 | | | | 22,341,750 | |
2.00% 07/31/20 - 11/15/26 | | | 25,844,000 | | | | 24,977,830 | |
2.13% 08/31/20 - 11/30/23 | | | 8,600,000 | | | | 8,443,432 | |
2.25% 03/31/21 - 11/15/27 | | | 21,690,000 | | | | 20,934,284 | |
2.38% 12/31/20 - 05/15/27 | | | 14,000,000 | | | | 13,742,560 | |
2.50% 03/31/23 - 01/31/25 | | | 10,500,000 | | | | 10,340,675 | |
2.63% 08/15/20 - 02/28/23 | | | 5,885,000 | | | | 5,881,403 | |
2.75% 05/31/23 - 02/15/28 | | | 5,500,000 | | | | 5,482,425 | |
3.13% 05/15/21 | | | 1,500,000 | | | | 1,520,865 | |
3.38% 11/15/19 | | | 5,000,000 | | | | 5,060,350 | |
3.63% 02/15/20 - 02/15/21 | | | 2,700,000 | | | | 2,753,312 | |
| | | | | | | | |
| | | | | | | 243,864,570 | |
| | | | | | | | |
|
U.S. Government Sponsored Agency - 0.0%* | |
Tennessee Valley Authority | | | | | | | | |
3.50% 12/15/42 | | | 1,000,000 | | | | 1,002,760 | |
| | | | | | | | |
|
Agency Mortgage Backed - 9.1% | |
Federal Home Loan Banks | | | | | | | | |
1.38% 11/15/19 | | | 1,200,000 | | | | 1,182,132 | |
1.50% 10/21/19 | | | 1,000,000 | | | | 987,360 | |
Federal Home Loan Mortgage Corp. | | | | | | | | |
1.13% 08/12/21 | | | 1,137,000 | | | | 1,084,482 | |
1.25% 10/02/19 | | | 1,500,000 | | | | 1,477,095 | |
| | | | | | | | |
| | | Principal Amount ($) | | | Fair
Value $ | |
| | | | | | | | |
2.38% 01/13/22 | | | 2,100,000 | | | | 2,073,603 | |
2.50% 07/01/28 - 02/01/32 | | | 3,539,747 | | | | 3,456,165 | |
2.51% 11/25/22 | | | 300,000 | | | | 292,939 | |
3.00% 05/01/30 - 03/01/47 | | | 13,895,996 | | | | 13,600,979 | |
3.50% 03/01/26 - 11/01/47 | | | 12,530,416 | | | | 12,509,749 | |
4.00% 06/01/42 - 08/01/47 | | | 6,395,642 | | | | 6,543,625 | |
4.50% 05/01/42 - 01/01/45 | | | 88,212 | | | | 92,655 | |
5.00% 12/01/22 - 06/01/41 | | | 1,888,660 | | | | 1,990,322 | |
5.50% 01/01/38 - 04/01/39 | | | 394,015 | | | | 424,499 | |
6.00% 06/01/37 - 11/01/37 | | | 380,461 | | | | 415,808 | |
6.25% 07/15/32 | | | 250,000 | | | | 334,625 | |
Federal Home Loan Mortgage Corp. 1.50% + 12 month USD LIBOR | | | | | | | | |
4.01% 06/01/43 (c) | | | 131,290 | | | | 135,463 | |
Federal Home Loan Mortgage Corp. 1.60% + 12 month USD LIBOR | | | | | | | | |
2.51% 08/01/43 (c) | | | 196,474 | | | | 194,440 | |
Federal Home Loan Mortgage Corp. 1.65% + 12 month USD LIBOR | | | | | | | | |
2.45% 05/01/43 (c) | | | 524,202 | | | | 517,895 | |
Federal National Mortgage Assoc. | | | | | | | | |
1.50% 07/30/20 | | | 500,000 | | | | 488,825 | |
1.88% 09/24/26 | | | 1,000,000 | | | | 911,730 | |
2.13% 04/24/26 | | | 700,000 | | | | 656,943 | |
2.50% 02/01/28 - 11/01/31 | | | 5,754,591 | | | | 5,638,992 | |
2.68% 05/25/21 (c) | | | 92,904 | | | | 91,929 | |
3.00% 01/01/28 - 05/01/47 | | | 26,270,550 | | | | 25,724,129 | |
3.50% 01/01/27 - 06/01/48 | | | 29,697,795 | | | | 29,712,512 | |
4.00% 10/01/41 - 01/01/48 | | | 12,810,593 | | | | 13,108,514 | |
4.50% 11/01/18 - 03/01/46 | | | 7,259,471 | | | | 7,631,235 | |
5.00% 12/01/39 - 06/01/41 | | | 1,810,622 | | | | 1,929,594 | |
5.50% 12/01/35 - 04/01/38 | | | 2,561,553 | | | | 2,771,993 | |
6.00% 03/01/34 - 08/01/37 | | | 1,769,640 | | | | 1,933,281 | |
6.63% 11/15/30 | | | 100,000 | | | | 134,325 | |
Federal National Mortgage Assoc. 1.53% + 12 month USD LIBOR | | | | | | | | |
3.90% 04/01/43 (c) | | | 79,936 | | | | 82,281 | |
Federal National Mortgage Assoc. | | | | | | | | |
4.00% TBA (d) | | | 3,350,000 | | | | 3,415,331 | |
Government National Mortgage Assoc. | | | | | | | | |
2.50% 05/20/45 | | | 270,472 | | | | 257,436 | |
3.00% 10/15/42 - 06/20/47 | | | 16,294,377 | | | | 16,002,278 | |
3.50% 03/20/45 - 06/20/48 | | | 17,652,871 | | | | 17,766,694 | |
See Notes to Summary Schedule of Investments and Notes to Financial Statements.
| | |
| 4 | | State Street Total Return V.I.S. Fund |
State Street Total Return V.I.S. Fund
Summary Schedule of Investments, continued — June 30, 2018 (Unaudited)
| | | | | | | | |
| | | Principal Amount ($) | | | Fair
Value $ | |
| | | | | | | | |
| | | | | | | | |
4.00% 12/20/40 - 02/20/48 | | | 13,753,893 | | | | 14,157,625 | |
4.50% 05/20/40 | | | 1,376,304 | | | | 1,447,059 | |
5.00% 08/15/41 | | | 2,185,405 | | | | 2,315,853 | |
3.50% TBA (d) | | | 2,500,000 | | | | 2,509,619 | |
| | | | | | | | |
| | | | | | | 196,002,014 | |
| | | | | | | | |
|
Agency Collateralized Mortgage Obligations – 0.2% | |
Federal Home Loan Mortgage Corp. | | | | | | | | |
2.37% 05/25/22 | | | 600,000 | | | | 585,030 | |
2.60% 10/25/23 | | | 103,971 | | | | 102,613 | |
2.75% 01/25/26 | | | 300,000 | | | | 289,162 | |
2.87% 12/25/21 | | | 800,000 | | | | 794,311 | |
3.06% 07/25/23 (c) | | | 600,000 | | | | 597,937 | |
3.30% 04/25/23 (c) | | | 100,000 | | | | 100,756 | |
3.39% 03/25/24 | | | 200,000 | | | | 201,806 | |
3.49% 01/25/24 | | | 300,000 | | | | 305,295 | |
3.53% 07/25/23 (c) | | | 800,000 | | | | 813,743 | |
3.97% 01/25/21 (c) | | | 200,000 | | | | 204,204 | |
4.25% 01/25/20 | | | 100,000 | | | | 101,230 | |
4.33% 10/25/20 (c) | | | 450,000 | | | | 461,738 | |
Federal National Mortgage Assoc. | | | | | | | | |
2.78% 06/25/21 (c) | | | 328,675 | | | | 326,447 | |
| | | | | | | | |
| | | | | | | 4,884,272 | |
| | | | | | | | |
| |
Asset Backed – 0.4% | | | | | |
Other Securities | | | 3,565,000 | | | | 3,516,601 | |
| | | | | | | | |
| |
Corporate Notes – 9.1% | | | | | |
Amazon.com Inc. | | | | | | | | |
1.90% 08/21/20 | | | 100,000 | | | | 97,948 | |
3.15% 08/22/27 | | | 100,000 | | | | 95,930 | |
3.88% 08/22/37 | | | 100,000 | | | | 97,709 | |
4.25% 08/22/57 | | | 100,000 | | | | 98,546 | |
4.80% 12/05/34 | | | 250,000 | | | | 273,555 | |
Apple Inc. | | | | | | | | |
1.10% 08/02/19 | | | 250,000 | | | | 246,238 | |
1.80% 11/13/19 | | | 50,000 | | | | 49,463 | |
2.00% 11/13/20 | | | 50,000 | | | | 49,058 | |
2.25% 02/23/21 | | | 200,000 | | | | 196,398 | |
2.40% 01/13/23 | | | 50,000 | | | | 48,326 | |
2.50% 02/09/22 | | | 300,000 | | | | 294,219 | |
2.75% 01/13/25 | | | 50,000 | | | | 47,761 | |
3.00% 11/13/27 | | | 100,000 | | | | 94,968 | |
3.25% 02/23/26 | | | 160,000 | | | | 156,051 | |
3.75% 11/13/47 | | | 50,000 | | | | 47,072 | |
4.38% 05/13/45 | | | 465,000 | | | | 478,573 | |
4.50% 02/23/36 | | | 300,000 | | | | 322,353 | |
4.65% 02/23/46 | | | 185,000 | | | | 199,077 | |
| | | | | | | | |
| | | Principal Amount ($) | | | Fair
Value $ | |
| | | | | | | | |
Microsoft Corp. | | | | | | | | |
1.10% 08/08/19 | | | 200,000 | | | | 196,810 | |
1.55% 08/08/21 | | | 300,000 | | | | 287,775 | |
2.40% 02/06/22 - 08/08/26 | | | 500,000 | | | | 478,440 | |
2.88% 02/06/24 | | | 300,000 | | | | 294,042 | |
3.45% 08/08/36 | | | 200,000 | | | | 191,976 | |
3.50% 02/12/35 | | | 65,000 | | | | 63,103 | |
3.75% 05/01/43 | | | 300,000 | | | | 292,926 | |
4.45% 11/03/45 | | | 425,000 | | | | 460,700 | |
Other Securities | | | 188,293,851 | | | | 186,989,797 | |
| | | | | | | | |
| | | | | | | 192,148,814 | |
| | | | | | | | |
|
Non-Agency Collateralized Mortgage Obligations - 0.6% | |
Other Securities | | | 7,823,712 | | | | 7,873,754 | |
| | | | | | | | |
|
Sovereign Bonds - 0.7% | |
Other Securities | | | 10,027,000 | | | | 10,195,412 | |
| | | | | | | | |
|
Municipal Bonds and Notes - 0.5% | |
Other Securities | | | 4,180,000 | | | | 5,068,078 | |
| | | | | | | | |
| | |
FNMA (TBA) - 0.2% | | | | | | | | |
Lehman | | | | | | | | |
5.50% TBA (e)(f) | | | 378,353 | | | | 8,172 | |
| | | | | | | | |
| |
Total Bonds and Notes
(Cost $680,493,893) | | | | 664,564,447 | |
| | | | | | | | |
|
| Exchange Traded Funds - 3.3% | |
Exchange Traded & Mutual Funds - 3.3% | |
SPDR Bloomberg Barclays High Yield Bond ETF
(Cost $72,005,250) (g) | | | 2,022,863 | | | | 71,771,179 | |
| | | | | | | | |
| |
Total Investments in Securities
(Cost $1,684,487,998) | | | | 2,107,133,570 | |
| | | | | | | | |
|
| Short-Term Investments - 2.4% | |
State Street Institutional U.S. Government Money Market Fund - Class G Shares 1.86%
(Cost $50,928,408) (g)(h) | | | 50,927,408 | | | | 50,927,408 | |
| | | | | | | | |
| |
Total Investments
(Cost $1,735,416,406) | | | | 2,158,060,978 | |
| |
| Liabilities in Excess of Other Assets, net - (0.0)% | | | | (406,788 | ) |
| | | | | | | | |
| | |
| NET ASSETS - 100.0% | | | | | | | 2,157,654,190 | |
| | | | | | | | |
See Notes to Summary Schedule of Investments and Notes to Financial Statements.
| | | | |
| State Street Total Return V.I.S. Fund | | | 5 | |
State Street Total Return V.I.S. Fund
Summary Schedule of Investments, continued — June 30, 2018 (Unaudited)
Other Information:
The Fund had the following long futures contracts open at June 30, 2018:
| | | | | | | | | | | | | | | | |
| Description | | Expiration
date | | | Number of
Contracts | | | Current
Notional
Value | | | Unrealized
Depreciation | |
| | | | | | | | | | | | | | | | |
CME E-mini Russell 2000 Index Futures | | | September 2018 | | | | 10 | | | $ | 823,750 | | | $ | (17,178 | ) |
MSCI EAFE Mini Index Futures | | | September 2018 | | | | 9 | | | | 879,930 | | | | (26,455 | ) |
MSCI Emerging Markets Index Futures | | | September 2018 | | | | 91 | | | | 4,838,015 | | | | (382,753 | ) |
S&P 500 Emini Index Futures | | | September 2018 | | | | 31 | | | | 4,218,480 | | | | (97,920 | ) |
S&P Mid 400 Emini Index Futures | | | September 2018 | | | | 2 | | | | 391,220 | | | | (8,959 | ) |
| | | | | | | | | | | | | | | | |
| | | | | | | | | | $ | (533,265 | ) |
| | | | | | | | | | | | | | | | |
During the period ended June 30, 2018, the Fund had an average notional value of $12,205,234 on long futures contracts.
See Notes to Summary Schedule of Investments and Notes to Financial Statements.
| | |
| 6 | | State Street Total Return V.I.S. Fund |
State Street Total Return V.I.S. Fund
Notes to Summary Schedule of Investments — June 30, 2018 (Unaudited)
The Summary Schedule of Investments does not reflect the complete portfolio holdings. It includes the Fund’s 50 largest holdings and each investment of any issuer that exceeds 1% of the Fund’s net assets. “Other Securities” represent all issues not required to be disclosed under the rules adopted by the U.S. Securities and Exchange Commission (“SEC”). In certain instances, securities for which footnotes listed above may otherwise apply are included in the Other Securities caption. The complete schedule of portfolio holdings is available (i) without charge, upon request, by calling (800) 242-0134; and ii) on the SEC’s website at http://www.sec.gov
| (a) | Non-income producing security. |
| (b) | State Street Corporation is the parent company of SSGA Funds Management, Inc., the Fund’s investment adviser and administrator, and State Street Bank & Trust Co., the Fund’s sub-administrator, custodian and accounting agent. |
| (c) | Variable Rate Security - Interest rate shown is rate in effect at June 30, 2018. For securities based on a published reference rate and spread, the reference rate and spread are indicated in the description above. |
| (d) | Settlement is on a delayed delivery or when-issued basis with final maturity to be announced (TBA) in the future. |
| (e) | Security is in default |
| (f) | Security is fair valued by the Oversight Committee, in accordance with the procedures approved by the State Street Variable Insurance Series Funds, Inc.’s Board of Directors. Security value is determined based on level 3 inputs. |
| (g) | Sponsored by SSGA Funds Management, Inc., the Fund’s investment adviser and administrator, and an affiliate of State Street Bank & Trust Co., the Fund’s sub-administrator, custodian and accounting agent. |
| (h) | Coupon amount represents effective yield. |
| † | Percentages are based on net assets as of June 30, 2018. |
Abbreviations:
ADR - American Depositary Receipt
GDR - Global Depositary Receipt
LIBOR - London Interbank Offered Rate
MBIA - Municipal Bond Investors Assurance Corporation
NVDR - Non-Voting Depositary Receipt
REIT - Real Estate Investment Trust
SPDR - Standard and Poor’s Depositary Receipt
TBA - To Be Announced
| | | | | | | | | | | | | | | | |
| Investments | | Level 1 | | | Level 2 | | | Level 3 | | | Total | |
| | | | | | | | | | | | | | | | |
Investments in Securities | | | | | | | | | | | | | | | | |
Domestic Equity | | $ | 802,268,572 | | | $ | 434,360 | | | $ | — | | | $ | 802,702,932 | |
Foreign Equity | | | 567,833,957 | | | | 261,055 | | | | — | | | | 568,095,012 | |
U.S. Treasuries | | | — | | | | 243,864,570 | | | | — | | | | 243,864,570 | |
U.S. Government Sponsored Agencies | | | — | | | | 1,002,760 | | | | — | | | | 1,002,760 | |
Agency Collateralized Mortgage Obligations | | | — | | | | 4,884,272 | | | | — | | | | 4,884,272 | |
Agency Mortgage Backed | | | — | | | | 196,002,014 | | | | — | | | | 196,002,014 | |
Asset Backed | | | — | | | | 3,516,601 | | | | — | | | | 3,516,601 | |
Corporate Notes | | | — | | | | 192,148,814 | | | | — | | | | 192,148,814 | |
Non-Agency Collateralized Mortgage Obligations | | | — | | | | 7,873,754 | | | | — | | | | 7,873,754 | |
Sovereign Bonds | | | — | | | | 10,195,412 | | | | — | | | | 10,195,412 | |
Municipal Bonds and Notes | | | — | | | | 5,068,078 | | | | — | | | | 5,068,078 | |
FNMA (TBA) | | | — | | | | — | | | | 8,172 | | | | 8,172 | |
Exchange Traded & Mutual Funds | | | 71,771,179 | | | | — | | | | — | | | | 71,771,179 | |
Short-Term Investments | | | 50,927,408 | | | | — | | | | — | | | | 50,927,408 | |
| | | | | | | | | | | | | | | | |
Total Investments in Securities | | $ | 1,492,801,116 | | | $ | 665,251,690 | | | $ | 8,172 | | | $ | 2,158,060,978 | |
| | | | | | | | | | | | | | | | |
| | | | |
Other Financial Instruments | | | | | | | | | | | | | | | | |
Long Futures Contracts - Unrealized Depreciation | | $ | (533,265 | ) | | $ | — | | | $ | — | | | $ | (533,265 | ) |
| | | | | | | | | | | | | | | | |
See Notes to Summary Schedule of Investments and Notes to Financial Statements.
| | | | |
| State Street Total Return V.I.S. Fund | | | 7 | |
State Street Total Return V.I.S. Fund
Notes to Summary Schedule of Investments, continued — June 30, 2018 (Unaudited)
The Fund was invested in the following countries/territories at June 30, 2018 (unaudited):
| | | | |
| Country/Territory | | Percentage
(based on
Fair Value) | |
| | | | |
United States | | | 71.02% | |
Japan | | | 4.38% | |
United Kingdom | | | 3.56% | |
Canada | | | 2.08% | |
China | | | 1.99% | |
France | | | 1.97% | |
Germany | | | 1.93% | |
Switzerland | | | 1.64% | |
Australia | | | 1.34% | |
South Korea | | | 0.94% | |
Netherlands | | | 0.74% | |
Taiwan | | | 0.72% | |
Hong Kong | | | 0.68% | |
Spain | | | 0.57% | |
Ireland | | | 0.55% | |
India | | | 0.54% | |
Supranational | | | 0.48% | |
Sweden | | | 0.48% | |
South Africa | | | 0.43% | |
Brazil | | | 0.39% | |
Italy | | | 0.39% | |
Mexico | | | 0.37% | |
Denmark | | | 0.29% | |
Singapore | | | 0.21% | |
Russian Federation | | | 0.21% | |
Belgium | | | 0.20% | |
Finland | | | 0.18% | |
Norway | | | 0.17% | |
Malaysia | | | 0.15% | |
Thailand | | | 0.14% | |
Indonesia | | | 0.12% | |
| | | | |
| Country/Territory | | Percentage
(based on
Fair Value) | |
| | | | |
Philippines | | | 0.11% | |
Chile | | | 0.10% | |
Colombia | | | 0.10% | |
Poland | | | 0.09% | |
Israel | | | 0.09% | |
Bermuda | | | 0.06% | |
Luxembourg | | | 0.06% | |
Austria | | | 0.06% | |
Turkey | | | 0.05% | |
Qatar | | | 0.05% | |
Cayman Islands | | | 0.05% | |
Peru | | | 0.05% | |
New Zealand | | | 0.04% | |
United Arab Emirates | | | 0.04% | |
Hungary | | | 0.03% | |
Portugal | | | 0.03% | |
Uruguay | | | 0.02% | |
Iraq | | | 0.02% | |
Greece | | | 0.02% | |
Panama | | | 0.02% | |
Guernsey | | | 0.01% | |
Czech Republic | | | 0.01% | |
Isle Of Man | | | 0.01% | |
Egypt | | | 0.01% | |
Uae | | | 0.01% | |
Romania | | | 0.00% | ** |
Jersey | | | 0.00% | ** |
Puerto Rico | | | 0.00% | ** |
Monaco | | | 0.00% | ** |
Virgin Islands | | | 0.00% | ** |
| | | | |
| | | 100.00% | |
| | | | |
The Fund’s % share of investment in the various categories, based on Fair Value, is as follows at June 30, 2018 (unaudited):
| | | | | | | | | | | | |
| Industry | | Domestic | | | Foreign | | | Total | |
| | | | | | | | | | | | |
Diversified Banks | | | 1.72% | | | | 3.40% | | | | 5.12% | |
Exchange Traded Funds | | | 3.33% | | | | 0.00% | | | | 3.33% | |
Pharmaceuticals | | | 1.53% | | | | 1.44% | | | | 2.97% | |
Internet Software & Services | | | 1.90% | | | | 0.91% | | | | 2.81% | |
Integrated Oil & Gas | | | 1.01% | | | | 1.23% | | | | 2.24% | |
Technology Hardware, Storage & Peripherals | | | 1.58% | | | | 0.46% | | | | 2.04% | |
Semiconductors | | | 1.32% | | | | 0.45% | | | | 1.77% | |
Internet & Direct Marketing Retail | | | 1.50% | | | | 0.10% | | | | 1.60% | |
Systems Software | | | 1.45% | | | | 0.05% | | | | 1.50% | |
Data Processing & Outsourced Services | | | 1.13% | | | | 0.13% | | | | 1.26% | |
Healthcare Equipment | | | 0.85% | | | | 0.41% | | | | 1.26% | |
Aerospace & Defense | | | 0.95% | | | | 0.31% | | | | 1.26% | |
Biotechnology | | | 0.90% | | | | 0.32% | | | | 1.22% | |
Integrated Telecommunication Services | | | 0.68% | | | | 0.47% | | | | 1.15% | |
Electric Utilities | | | 0.66% | | | | 0.41% | | | | 1.07% | |
See Notes to Summary Schedule of Investments and Notes to Financial Statements.
| | |
| 8 | | State Street Total Return V.I.S. Fund |
State Street Total Return V.I.S. Fund
Notes to Summary Schedule of Investments, continued — June 30, 2018 (Unaudited)
| | | | | | | | | | | | |
| Industry | | Domestic | | | Foreign | | | Total | |
| | | | | | | | | | | | |
Packaged Foods & Meats | | | 0.36% | | | | 0.63% | | | | 0.99% | |
Industrial Conglomerates | | | 0.57% | | | | 0.37% | | | | 0.94% | |
Life & Health Insurance | | | 0.26% | | | | 0.64% | | | | 0.90% | |
Oil & Gas Exploration & Production | | | 0.61% | | | | 0.28% | | | | 0.89% | |
Automobile Manufacturers | | | 0.15% | | | | 0.71% | | | | 0.86% | |
Application Software | | | 0.54% | | | | 0.29% | | | | 0.83% | |
Regional Banks | | | 0.47% | | | | 0.29% | | | | 0.76% | |
Managed Healthcare | | | 0.70% | | | | 0.03% | | | | 0.73% | |
IT Consulting & Other Services | | | 0.31% | | | | 0.39% | | | | 0.70% | |
Industrial Machinery | | | 0.26% | | | | 0.43% | | | | 0.69% | |
Household Products | | | 0.50% | | | | 0.18% | | | | 0.68% | |
Multi-Sector Holdings | | | 0.57% | | | | 0.11% | | | | 0.68% | |
Tobacco | | | 0.36% | | | | 0.28% | | | | 0.64% | |
Railroads | | | 0.35% | | | | 0.29% | | | | 0.64% | |
Soft Drinks | | | 0.54% | | | | 0.06% | | | | 0.60% | |
Asset Management & Custody Banks | | | 0.38% | | | | 0.17% | | | | 0.55% | |
Cable & Satellite | | | 0.32% | | | | 0.23% | | | | 0.55% | |
Multi-Utilities | | | 0.34% | | | | 0.21% | | | | 0.55% | |
Apparel, Accessories & Luxury Goods | | | 0.14% | | | | 0.40% | | | | 0.54% | |
Multi-Line Insurance | | | 0.13% | | | | 0.39% | | | | 0.52% | |
Restaurants | | | 0.40% | | | | 0.12% | | | | 0.52% | |
Specialty Chemicals | | | 0.18% | | | | 0.33% | | | | 0.51% | |
Property & Casualty Insurance | | | 0.17% | | | | 0.34% | | | | 0.51% | |
Personal Products | | | 0.06% | | | | 0.44% | | | | 0.50% | |
Financial Exchanges & Data | | | 0.34% | | | | 0.15% | | | | 0.49% | |
Home Improvement Retail | | | 0.47% | | | | 0.01% | | | | 0.48% | |
Communications Equipment | | | 0.37% | | | | 0.11% | | | | 0.48% | |
Diversified Chemicals | | | 0.26% | | | | 0.22% | | | | 0.48% | |
Wireless Telecommunication Services | | | 0.00% | | | | 0.47% | | | | 0.47% | |
Diversified Metals & Mining | | | 0.00% | | | | 0.47% | | | | 0.47% | |
Hypermarkets & Super Centers | | | 0.33% | | | | 0.12% | | | | 0.45% | |
Specialized REITs | | | 0.44% | | | | 0.00% | | | | 0.44% | |
Investment Banking & Brokerage | | | 0.36% | | | | 0.08% | | | | 0.44% | |
Oil & Gas Refining & Marketing | | | 0.24% | | | | 0.18% | | | | 0.42% | |
Movies & Entertainment | | | 0.37% | | | | 0.05% | | | | 0.42% | |
Electrical Components & Equipment | | | 0.18% | | | | 0.21% | | | | 0.39% | |
Life Sciences Tools & Services | | | 0.29% | | | | 0.09% | | | | 0.38% | |
Trading Companies & Distributors | | | 0.06% | | | | 0.29% | | | | 0.35% | |
Retail REITs | | | 0.16% | | | | 0.18% | | | | 0.34% | |
Healthcare Services | | | 0.25% | | | | 0.09% | | | | 0.34% | |
Construction Machinery & Heavy Trucks | | | 0.19% | | | | 0.15% | | | | 0.34% | |
Food Retail | | | 0.03% | | | | 0.30% | | | | 0.33% | |
Oil & Gas Storage & Transportation | | | 0.12% | | | | 0.21% | | | | 0.33% | |
Oil & Gas Equipment & Services | | | 0.25% | | | | 0.08% | | | | 0.33% | |
Semiconductor Equipment | | | 0.14% | | | | 0.18% | | | | 0.32% | |
Air Freight & Logistics | | | 0.24% | | | | 0.07% | | | | 0.31% | |
Apparel Retail | | | 0.17% | | | | 0.14% | | | | 0.31% | |
Electronic Components | | | 0.08% | | | | 0.23% | | | | 0.31% | |
Consumer Finance | | | 0.26% | | | | 0.03% | | | | 0.29% | |
Construction & Engineering | | | 0.04% | | | | 0.24% | | | | 0.28% | |
Auto Parts & Equipment | | | 0.01% | | | | 0.27% | | | | 0.28% | |
Steel | | | 0.03% | | | | 0.25% | | | | 0.28% | |
Brewers | | | 0.02% | | | | 0.25% | | | | 0.27% | |
Building Products | | | 0.09% | | | | 0.18% | | | | 0.27% | |
See Notes to Summary Schedule of Investments and Notes to Financial Statements.
| | | | |
| State Street Total Return V.I.S. Fund | | | 9 | |
State Street Total Return V.I.S. Fund
Notes to Summary Schedule of Investments, continued — June 30, 2018 (Unaudited)
| | | | | | | | | | | | |
| Industry | | Domestic | | | Foreign | | | Total | |
| | | | | | | | | | | | |
Commodity Chemicals | | | 0.06% | | | | 0.20% | | | | 0.26% | |
Research & Consulting Services | | | 0.07% | | | | 0.19% | | | | 0.26% | |
Distillers & Vintners | | | 0.08% | | | | 0.17% | | | | 0.25% | |
Home Entertainment Software | | | 0.18% | | | | 0.07% | | | | 0.25% | |
Industrial Gases | | | 0.12% | | | | 0.13% | | | | 0.25% | |
Hotels, Resorts & Cruise Lines | | | 0.17% | | | | 0.07% | | | | 0.24% | |
Diversified Real Estate Activities | | | 0.00% | | | | 0.24% | | | | 0.24% | |
Construction Materials | | | 0.05% | | | | 0.19% | | | | 0.24% | |
Airlines | | | 0.16% | | | | 0.06% | | | | 0.22% | |
Casinos & Gaming | | | 0.04% | | | | 0.16% | | | | 0.20% | |
Diversified Capital Markets | | | 0.00% | | | | 0.20% | | | | 0.20% | |
Footwear | | | 0.16% | | | | 0.04% | | | | 0.20% | |
Electronic Equipment & Instruments | | | 0.01% | | | | 0.18% | | | | 0.19% | |
General Merchandise Stores | | | 0.13% | | | | 0.06% | | | | 0.19% | |
Healthcare Supplies | | | 0.09% | | | | 0.09% | | | | 0.18% | |
Insurance Brokers | | | 0.08% | | | | 0.09% | | | | 0.17% | |
Consumer Electronics | | | 0.00% | | | | 0.15% | | | | 0.15% | |
Residential REITs | | | 0.15% | | | | 0.00% | | | | 0.15% | |
Home Building | | | 0.05% | | | | 0.10% | | | | 0.15% | |
Electronic Manufacturing Services | | | 0.01% | | | | 0.14% | | | | 0.15% | |
Gold | | | 0.03% | | | | 0.11% | | | | 0.14% | |
Gas Utilities | | | 0.01% | | | | 0.13% | | | | 0.14% | |
Real Estate Development | | | 0.00% | | | | 0.14% | | | | 0.14% | |
Office REITs | | | 0.08% | | | | 0.06% | | | | 0.14% | |
Paper Packaging | | | 0.09% | | | | 0.04% | | | | 0.13% | |
Real Estate Operating Companies | | | 0.00% | | | | 0.13% | | | | 0.13% | |
Healthcare Distributors | | | 0.10% | | | | 0.03% | | | | 0.13% | |
Industrial REITs | | | 0.07% | | | | 0.06% | | | | 0.13% | |
Fertilizers & Agricultural Chemicals | | | 0.06% | | | | 0.07% | | | | 0.13% | |
Department Stores | | | 0.05% | | | | 0.07% | | | | 0.12% | |
Healthcare Facilities | | | 0.06% | | | | 0.06% | | | | 0.12% | |
Reinsurance | | | 0.00% | | | | 0.12% | | | | 0.12% | |
Advertising | | | 0.04% | | | | 0.07% | | | | 0.11% | |
Automotive Retail | | | 0.09% | | | | 0.02% | | | | 0.11% | |
Diversified REITs | | | 0.00% | | | | 0.11% | | | | 0.11% | |
Thrifts & Mortgage Finance | | | 0.00% | | | | 0.11% | | | | 0.11% | |
Agricultural & Farm Machinery | | | 0.07% | | | | 0.04% | | | | 0.11% | |
Health Care REITs | | | 0.11% | | | | 0.00% | | | | 0.11% | |
Environmental & Facilities Services | | | 0.08% | | | | 0.03% | | | | 0.11% | |
Human Resource & Employment Services | | | 0.01% | | | | 0.09% | | | | 0.10% | |
Drug Retail | | | 0.08% | | | | 0.02% | | | | 0.10% | |
Other Diversified Financial Services | | | 0.00% | | | | 0.09% | | | | 0.09% | |
Specialty Stores | | | 0.07% | | | | 0.02% | | | | 0.09% | |
Paper Products | | | 0.00% | | | | 0.09% | | | | 0.09% | |
Broadcasting | | | 0.05% | | | | 0.04% | | | | 0.09% | |
Diversified Support Services | | | 0.04% | | | | 0.05% | | | | 0.09% | |
Tires & Rubber | | | 0.01% | | | | 0.07% | | | | 0.08% | |
Airport Services | | | 0.00% | | | | 0.08% | | | | 0.08% | |
Leisure Products | | | 0.03% | | | | 0.04% | | | | 0.07% | |
Heavy Electrical Equipment | | | 0.00% | | | | 0.07% | | | | 0.07% | |
Food Distributors | | | 0.05% | | | | 0.02% | | | | 0.07% | |
Agricultural Products | | | 0.04% | | | | 0.03% | | | | 0.07% | |
Trucking | | | 0.02% | | | | 0.05% | | | | 0.07% | |
Copper | | | 0.04% | | | | 0.03% | | | | 0.07% | |
See Notes to Summary Schedule of Investments and Notes to Financial Statements.
| | |
| 10 | | State Street Total Return V.I.S. Fund |
State Street Total Return V.I.S. Fund
Notes to Summary Schedule of Investments, continued — June 30, 2018 (Unaudited)
| | | | | | | | | | | | |
| Industry | | Domestic | | | Foreign | | | Total | |
| | | | | | | | | | | | |
Water Utilities | | | 0.02% | | | | 0.04% | | | | 0.06% | |
Independent Power Producers & Energy Traders | | | 0.02% | | | | 0.04% | | | | 0.06% | |
Healthcare Technology | | | 0.04% | | | | 0.02% | | | | 0.06% | |
Highways & Railtracks | | | 0.00% | | | | 0.06% | | | | 0.06% | |
Household Appliances | | | 0.01% | | | | 0.05% | | | | 0.06% | |
Education Services | | | 0.00% | | | | 0.05% | | | | 0.05% | |
Hotel & Resort REITs | | | 0.05% | | | | 0.00% | | | | 0.05% | |
Publishing | | | 0.01% | | | | 0.04% | | | | 0.05% | |
Distributors | | | 0.04% | | | | 0.01% | | | | 0.05% | |
Security & Alarm Services | | | 0.00% | | | | 0.04% | | | | 0.04% | |
Computer & Electronics Retail | | | 0.03% | | | | 0.01% | | | | 0.04% | |
Alternative Carriers | | | 0.03% | | | | 0.01% | | | | 0.04% | |
Marine | | | 0.00% | | | | 0.04% | | | | 0.04% | |
Leisure Facilities | | | 0.00% | | | | 0.04% | | | | 0.04% | |
Metal & Glass Containers | | | 0.02% | | | | 0.02% | | | | 0.04% | |
Coal & Consumable Fuels | | | 0.00% | | | | 0.04% | | | | 0.04% | |
Home Furnishings | | | 0.03% | | | | 0.00% | | | | 0.03% | |
Real Estate Services | | | 0.02% | | | | 0.01% | | | | 0.03% | |
Home Furnishing Retail | | | 0.00% | | | | 0.03% | | | | 0.03% | |
Aluminum | | | 0.00% | | | | 0.03% | | | | 0.03% | |
Motorcycle Manufacturers | | | 0.01% | | | | 0.02% | | | | 0.03% | |
Oil & Gas Drilling | | | 0.01% | | | | 0.02% | | | | 0.03% | |
Marine Ports & Services | | | 0.00% | | | | 0.03% | | | | 0.03% | |
Commercial Printing | | | 0.00% | | | | 0.02% | | | | 0.02% | |
Technology Distributors | | | 0.00% | | | | 0.02% | | | | 0.02% | |
Housewares & Specialties | | | 0.02% | | | | 0.00% | | | | 0.02% | |
Mortgage REITs | | | 0.02% | | | | 0.00% | | | | 0.02% | |
Office Services & Supplies | | | 0.00% | | | | 0.02% | | | | 0.02% | |
Specialized Consumer Services | | | 0.02% | | | | 0.00% | | | | 0.02% | |
Renewable Electricity | | | 0.00% | | | | 0.01% | | | | 0.01% | |
Silver | | | 0.00% | | | | 0.01% | | | | 0.01% | |
Specialized Finance | | | 0.00% | | | | 0.01% | | | | 0.01% | |
Forest Products | | | 0.00% | | | | 0.01% | | | | 0.01% | |
Precious Metals & Minerals | | | 0.00% | | | | 0.01% | | | | 0.01% | |
Textiles | | | 0.00% | | | | 0.01% | | | | 0.01% | |
| | | | | | | | | | | | |
| | | | | | | | | | | 66.85% | |
| | | | | | | | | | | | |
| | | | |
| Sector | | Percentage
(based on
Fair Value) | |
| | | | |
U.S. Treasuries | | | 11.30% | |
Agency Mortgage Backed | | | 9.08% | |
Corporate Notes | | | 8.90% | |
Sovereign Bonds | | | 0.47% | |
Non-Agency Collateralized Mortgage Obligations | | | 0.37% | |
Municipal Bonds and Notes | | | 0.23% | |
Agency Collateralized Mortgage Obligations | | | 0.23% | |
Asset Backed | | | 0.16% | |
U.S. Government Sponsored Agencies | | | 0.05% | |
FNMA (TBA) | | | 0.00% | |
| | | | |
| | | 30.79% | |
| | | | |
| | | | |
| Sector | | Percentage
(based on
Fair Value) | |
| | | | |
Short-Term Investments | | | | |
Short-Term Investments | | | 2.36% | |
| | | | |
| | | 2.36% | |
| | | | |
| | | 100.00% | |
| | | | |
See Notes to Summary Schedule of Investments and Notes to Financial Statements.
| | | | |
| State Street Total Return V.I.S. Fund | | | 11 | |
State Street Total Return V.I.S. Fund
Notes to Summary Schedule of Investments, continued — June 30, 2018 (Unaudited)
Affiliate Table
| | | | | | | | | | | | | | | | | | | | | | | | | | | | | | | | | | | | | | | | |
| | | Number
of Shares
Held at
12/31/17 | | | Value At
12/31/17 | | | Cost of
Purchases | | | Proceeds
from
Shares Sold | | | Realized
Gain
(Loss) | | | Change in
Unrealized
Appreciation/
Depreciation | | | Number
of Shares
Held at
6/30/18 | | | Value at
6/30/18 | | | Dividend
Income | | | Capital
Gains
Distributions | |
SPDR Bloomberg Barclays High Yield Bond ETF | | | 2,022,863 | | | $ | 74,279,529 | | | $ | — | | | $ | — | | | $ | — | | | $ | (2,508,350 | ) | | | 2,022,863 | | | $ | 71,771,179 | | | $ | 1,624,804 | | | $ | — | |
State Street Corp. | | | 13,036 | | | | 1,272,444 | | | | — | | | | 83,607 | | | | 51,400 | | | | (101,188 | ) | | | 12,236 | | | | 1,139,049 | | | | 10,446 | | | | — | |
State Street Institutional U.S. Government Money Market Fund - Class G Shares | | | 93,039,371 | | | | 93,039,371 | | | | 179,843,440 | | | | 221,955,403 | | | | — | | | | — | | | | 50,927,408 | | | | 50,927,408 | | | | 461,837 | | | | — | |
| | | | | | | | | | | | | | | | | | | | | | | | | | | | | | | | | | | | | | | | |
TOTAL | | | | | | $ | 168,591,344 | | | $ | 179,843,440 | | | $ | 222,039,010 | | | $ | 51,400 | | | $ | (2,609,538 | ) | | | | | | $ | 123,837,636 | | | $ | 2,097,087 | | | $ | — | |
| | | | | | | | | | | | | | | | | | | | | | | | | | | | | | | | | | | | | | | | |
See Notes to Summary Schedules of Investments and Notes to Financial Statements.
| | |
| 12 | | State Street Total Return V.I.S. Fund |
State Street Total Return V.I.S. Fund
Financial Highlights
Selected data based on a share outstanding throughout the periods indicated
| | | | | | | | | | | | | | | | | | | | | | | | |
| | | Class 1 | |
| | | 6/30/18† | | | 12/31/17 | | | 12/31/16 | | | 12/31/15* | | | 12/31/14* | | | 12/31/13* | |
| Inception date | | | — | | | | — | | | | — | | | | — | | | | — | | | | 7/1/85 | |
| | | | | | |
Net asset value, beginning of period | | $ | 19.94 | | | $ | 18.08 | | | $ | 17.66 | | | $ | 18.81 | | | $ | 18.71 | | | $ | 17.35 | |
| | | | | | | | | | | | | | | | | | | | | | | | |
| |
Income/(loss) from investment operations: | | | | | |
Net investment income | | | 0.20 | | | | 0.36 | (a) | | | 0.35 | | | | 0.31 | | | | 0.35 | | | | 0.29 | |
Net realized and unrealized gains/(losses) on investments | | | (0.35 | ) | | | 2.46 | | | | 0.77 | | | | (0.52 | ) | | | 0.65 | | | | 2.29 | |
| | | | | | | | | | | | | | | | | | | | | | | | |
Total income/(loss) from investment operations | | | (0.15 | ) | | | 2.82 | | | | 1.12 | | | | (0.21 | ) | | | 1.00 | | | | 2.58 | |
| | | | | | | | | | | | | | | | | | | | | | | | |
| | | | | | |
Less distributions from: | | | | | | | | | | | | | | | | | | | | | | | | |
Net investment income | | | — | | | | 0.41 | | | | 0.35 | | | | 0.34 | | | | 0.34 | | | | 0.29 | |
Net realized gains | | | — | | | | 0.55 | | | | 0.35 | | | | 0.60 | | | | 0.56 | | | | 0.93 | |
| | | | | | | | | | | | | | | | | | | | | | | | |
Total distributions | | | — | | | | 0.96 | | | | 0.70 | | | | 0.94 | | | | 0.90 | | | | 1.22 | |
| | | | | | | | | | | | | | | | | | | | | | | | |
Net asset value, end of period | | $ | 19.79 | | | $ | 19.94 | | | $ | 18.08 | | | $ | 17.66 | | | $ | 18.81 | | | $ | 18.71 | |
| | | | | | | | | | | | | | | | | | | | | | | | |
Total Return(b) | | | (0.75 | )% | | | 15.58 | % | | | 6.35 | % | | | (1.13 | )% | | | 5.32 | % | | | 14.93 | % |
| | | | | | |
Ratios/Supplemental Data: | | | | | | | | | | | | | | | | | | | | | | | | |
Net assets, end of period (in thousands) | | $ | 805,840 | | | $ | 856,665 | | | $ | 797,448 | | | $ | 807,584 | | | $ | 941,344 | | | $ | 1,046,388 | |
| | | | | | |
Ratios to average net assets: | | | | | | | | | | | | | | | | | | | | | | | | |
Net expenses | | | 0.63 | %** | | | 0.62 | % | | | 0.60 | % | | | 0.61 | % | | | 0.62 | %(c) | | | 0.60 | %(c) |
Gross expenses | | | 0.63 | %** | | | 0.62 | % | | | 0.60 | % | | | 0.61 | % | | | 0.62 | % | | | 0.61 | % |
Net investment income | | | 2.05 | %** | | | 1.83 | % | | | 1.85 | % | | | 1.56 | % | | | 1.66 | % | | | 1.50 | % |
Portfolio turnover rate | | | 8 | % | | | 15 | % | | | 45 | % | | | 70 | % | | | 78 | % | | | 175 | % |
Notes to Financial Highlights
| (a) | | Per share values have been calculated using the average share method. |
| (b) | | Total returns are historical and assume changes in share price, reinvestment of dividends and capital gains distributions and do not include the effect of insurance contract charges. Past performance does not guarantee future results. |
| (c) | | Includes contractual management fee waiver related to the Fund’s investments in the GE Institutional Money Market Fund (the “Money Market Fund”). The fee waiver agreement was terminated effective June 30, 2014 with the closure of the Money Market Fund. |
| ** | | Annualized for periods less than one year. |
| * | | Beginning with the year ended December 31, 2016, the Fund was audited by Ernst & Young LLP. The previous years were audited by another independent registered public accounting firm. |
The accompanying Notes are an integral part of these financial statements.
State Street Total Return V.I.S. Fund
Financial Highlights, continued
Selected data based on a share outstanding throughout the fiscal years indicated
| | | | | | | | | | | | | | | | | | | | | | | | |
| | | Class 3 | |
| | | 6/30/18† | | | 12/31/17 | | | 12/31/16 | | | 12/31/15* | | | 12/31/14* | | | 12/31/13* | |
| Inception date | | | — | | | | — | | | | — | | | | — | | | | — | | | | 5/1/06 | |
| | | | | | |
Net asset value, beginning of period | | $ | 19.88 | | | $ | 18.03 | | | $ | 17.61 | | | $ | 18.75 | | | $ | 18.65 | | | $ | 17.30 | |
| | | | | | | | | | | | | | | | | | | | | | | | |
| |
Income/(loss) from investment operations: | | | | | |
Net investment income | | | 0.18 | * | | | 0.31 | * | | | 0.30 | | | | 0.27 | | | | 0.28 | | | | 0.24 | |
Net realized and unrealized gains/(losses) on investments | | | (0.35 | ) | | | 2.44 | | | | 0.77 | | | | (0.51 | ) | | | 0.67 | | | | 2.28 | |
| | | | | | | | | | | | | | | | | | | | | | | | |
Total income/(loss) from investment operations | | | (0.17 | ) | | | 2.75 | | | | 1.07 | | | | (0.24 | ) | | | 0.95 | | | | 2.52 | |
| | | | | | | | | | | | | | | | | | | | | | | | |
| | | | | | |
Less distributions from: | | | | | | | | | | | | | | | | | | | | | | | | |
Net investment income | | | — | | | | 0.35 | | | | 0.30 | | | | 0.30 | | | | 0.29 | | | | 0.24 | |
Net realized gains | | | — | | | | 0.55 | | | | 0.35 | | | | 0.60 | | | | 0.56 | | | | 0.93 | |
| | | | | | | | | | | | | | | | | | | | | | | | |
Total distributions | | | — | | | | 0.90 | | | | 0.65 | | | | 0.90 | | | | 0.85 | | | | 1.17 | |
| | | | | | | | | | | | | | | | | | | | | | | | |
Net asset value, end of period | | $ | 19.71 | | | $ | 19.88 | | | $ | 18.03 | | | $ | 17.61 | | | $ | 18.75 | | | $ | 18.65 | |
| | | | | | | | | | | | | | | | | | | | | | | | |
Total Return(a) | | | (0.86 | )% | | | 15.26 | % | | | 6.08 | % | | | (1.34 | )% | | | 5.07 | % | | | 14.64 | % |
| | | | | | |
Ratios/Supplemental Data: | | | | | | | | | | | | | | | | | | | | | | | | |
Net assets, end of period (in thousands) | | $ | 1,351,814 | | | $ | 1,464,061 | | | $ | 1,508,428 | | | $ | 1,633,723 | | | $ | 1,842,997 | | | $ | 1,937,910 | |
| | | | | | |
Ratios to average net assets: | | | | | | | | | | | | | | | | | | | | | | | | |
Net expenses | | | 0.88 | %** | | | 0.87 | % | | | 0.85 | % | | | 0.86 | % | | | 0.87 | %(b) | | | 0.85 | %(b) |
Gross expenses | | | 0.88 | %** | | | 0.87 | % | | | 0.85 | % | | | 0.86 | % | | | 0.87 | % | | | 0.86 | % |
Net investment income | | | 1.80 | %** | | | 1.59 | % | | | 1.60 | % | | | 1.31 | % | | | 1.40 | % | | | 1.25 | % |
Portfolio turnover rate | | | 8 | % | | | 15 | % | | | 45 | % | | | 70 | % | | | 78 | % | | | 175 | % |
Notes to Financial Highlights
| (a) | | Total returns are historical and assume changes in share price, reinvestment of dividends and capital gains distributions and do not include the effect of insurance contract charges. Past performance does not guarantee future results. |
| (b) | | Includes contractual management fee waiver related to the Fund’s investments in the GE Institutional Money Market Fund (the “Money Market Fund”). The fee waiver agreement was terminated effective June 30, 2014 with the closure of the Money Market Fund. |
| * | | Per share values have been calculated using the average share method. |
| ** | | Annualized for periods less than one year. |
| * | | Beginning with the year ended December 31, 2016, the Fund was audited by Ernst & Young LLP. The previous years were audited by another independent registered public accounting firm. |
The accompanying Notes are an integral part of these financial statements.
State Street Total Return V.I.S. Fund
Statement of Assets and Liabilities — June 30, 2018 (Unaudited)
| | | | |
Assets | | | | |
Investments in securities, at fair value (cost $1,611,991,149) | | $ | 2,034,223,342 | |
Investments in affiliated securities, at fair value (cost $72,497,849) | | | 72,910,228 | |
Short-term affiliated investments, at fair value | | | 50,927,408 | |
Cash collateral on deposit with broker for future contracts | | | 1,222,021 | |
Foreign currency (cost $3,093,651) | | | 3,035,202 | |
Receivable for investments sold | | | 9,446,234 | |
Income receivables | | | 6,841,953 | |
Receivable for fund shares sold | | | 11,822 | |
Income receivable from affiliated investments | | | 77,474 | |
Other assets | | | 211 | |
| | | | |
Total assets | | | 2,178,695,895 | |
| | | | |
| |
Liabilities | | | | |
Due to custodian | | | 899,117 | |
Payable for investments purchased | | | 16,303,354 | |
Payable for fund shares redeemed | | | 845,053 | |
Payable for accumulated variation margin on futures | | | 529,554 | |
Payable to the Adviser | | | 629,790 | |
Payable to the Custodian | | | 236,431 | |
Accrued other expenses | | | 1,251,151 | |
Distribution and service fees | | | 282,144 | |
Accrued foreign capital gains tax | | | 65,111 | |
| | | | |
Total liabilities | | | 21,041,705 | |
| | | | |
| | | | |
Net Assets | | $ | 2,157,654,190 | |
| | | | |
| |
Net Assets Consist of: | | | | |
Capital paid in | | $ | 1,691,736,151 | |
Undistributed (distributions in excess of) net investment income | | | 18,634,388 | |
Accumulated net realized gain | | | 25,304,565 | |
Net unrealized appreciation (depreciation) on: | | | | |
Unaffiliated Investments | | | 422,167,082 | |
Affiliated investments | | | 412,379 | |
Futures | | | (533,265 | ) |
Foreign currency related transactions | | | (67,110 | ) |
| | | | |
Net Assets | | $ | 2,157,654,190 | |
| | | | |
| | | | |
Class 1 | | | | |
Net Assets | | $ | 805,840,474 | |
Shares outstanding ($0.01 par value, unlimited shares authorized) | | | 40,716,550 | |
Net asset value per share | | $ | 19.79 | |
| | | | |
Class 3 | | | | |
Net Assets | | $ | 1,351,813,716 | |
Shares outstanding ($0.01 par value, unlimited shares authorized) | | | 68,595,205 | |
Net asset value per share | | $ | 19.71 | |
The accompanying Notes are an integral part of these financial statements.
| | | | |
| Statement of Assets and Liabilities | | | 15 | |
State Street Total Return V.I.S. Fund
Statement of Operations — For the period ended June 30, 2018 (Unaudited)
| | | | |
Investment Income | | | | |
Income | | | | |
Dividend | | $ | 19,912,622 | |
Interest | | | 9,178,572 | |
Income from affiliated investments | | | 2,097,087 | |
Less: Foreign taxes withheld | | | (1,203,426 | ) |
| | | | |
Total income | | | 29,984,855 | |
| | | | |
| |
Expenses | | | | |
Advisory and administration fees | | | 3,950,690 | |
Distribution and service fees | | | | |
Class 1 | | | 830,114 | |
Class 3 | | | 3,165,729 | |
Directors’ fees | | | 179,109 | |
Custody and accounting expenses | | | 416,749 | |
Professional fees | | | 145,091 | |
Other expenses | | | 137,025 | |
| | | | |
Total Expenses | | | 8,824,507 | |
| | | | |
Net investment income | | $ | 21,160,348 | |
| | | | |
|
Net Realized and Unrealized Gain (Loss) on Investments | |
Realized gain (loss) on: | |
Unaffiliated investments | | $ | 27,871,505 | |
Affiliated investments | | | 51,400 | |
Futures | | | 536,577 | |
Foreign currency transactions | | | (92,463 | ) |
Increase (decrease) in unrealized appreciation/depreciation on: | |
Unaffiliated investments | | | (63,250,095 | )* |
Affiliated investrments | | | (2,609,538 | ) |
Futures | | | (869,058 | ) |
Foreign currency translations | | | (101,031 | ) |
| | | | |
| |
Net realized and unrealized gain (loss) on investments | | | (38,462,703 | ) |
| | | | |
Net Decrease in Net Assets Resulting from Operations | | $ | (17,302,355 | ) |
| | | | |
| ** | | Includes $13,911 of net realized gains from foreign capital tax gain. |
| * | | Includes change in accrued foreign capital gains tax of $9,133. |
The accompanying Notes are an integral part of these financial statements.
| | |
| 16 | | Statement of Operations |
State Street Total Return V.I.S. Fund
Statements of Changes in Net Assets
| | | | | | | | |
| | | Six Months Ended June 30, 2018*(a) | | | Year Ended December 31,
2017 | |
Increase (Decrease) in Net Assets | | | | | | | | |
| | |
Operations: | | | | | | | | |
Net investment income | | $ | 21,160,348 | | | $ | 38,873,989 | |
Net realized gain (loss) on investments, futures, swap contracts, options contracts, and foreign currency related transactions | | | 28,367,019 | | | | 69,761,604 | |
Net increase (decrease) in unrealized appreciation/depreciation on investments, futures and foreign currency transactions | | | (66,829,722 | ) | | | 223,146,132 | |
| | | | | | | | |
Net increase (decrease) from operations | | | (17,302,355 | ) | | | 331,781,725 | |
| | | | | | | | |
|
Distributions to shareholders from: | |
Net investment income | | | | | | | | |
Class 1 | | | — | | | | (16,742,272 | ) |
Class 3 | | | — | | | | (24,919,903 | ) |
Net realized gains | | | | | | | | |
Class 1 | | | — | | | | (22,419,435 | ) |
Class 3 | | | — | | | | (38,500,904 | ) |
| | | | | | | | |
Total distributions | | | — | | | | (102,582,514 | ) |
| | | | | | | | |
Increase (decrease) in assets from operations and distributions | | | (17,302,355 | ) | | | 229,199,211 | |
| | | | | | | | |
|
Share transactions: | |
Proceeds from sale of shares | | | | | | | | |
Class 1 | | | 10,286,940 | | | | 24,414,624 | |
Class 3 | | | 19,370,557 | | | | 14,991,248 | |
Value of distributions reinvested | | | | | | | | |
Class 1 | | | — | | | | 39,161,707 | |
Class 3 | | | — | | | | 63,420,807 | |
Cost of shares redeemed | | | | | | | | |
Class 1 | | | (55,235,826 | ) | | | (85,382,636 | ) |
Class 3 | | | (120,190,750 | ) | | | (270,955,830 | ) |
| | | | | | | | |
Net increase (decrease) from share transactions | | | (145,769,079 | ) | | | (214,350,080 | ) |
| | | | | | | | |
| | |
Total increase (decrease) in net assets | | | (163,071,434 | ) | | | 14,849,131 | |
|
Net Assets | |
Beginning of period | | | 2,320,725,624 | | | | 2,305,876,493 | |
| | | | | | | | |
| | |
End of period | | $ | 2,157,654,190 | | | $ | 2,320,725,624 | |
| | | | | | | | |
| | |
Undistributed (distributions in excess of) net investment income, end of period | | $ | 18,634,388 | | | $ | (2,525,960 | ) |
|
Changes in Fund Shares | |
Class 1 | |
Shares sold | | | 515,186 | | | | 1,257,149 | |
Issued for distributions reinvested | | | — | | | | 1,970,896 | |
Shares redeemed | | | (2,766,796 | ) | | | (4,366,225 | ) |
| | | | | | | | |
Net increase (decrease) in fund shares | | | (2,251,610 | ) | | | (1,138,180 | ) |
| | | | | | | | |
|
Class 3 | |
Shares sold | | | 972,182 | | | | 760,162 | |
Issued for distributions reinvested | | | — | | | | 3,201,454 | |
Shares redeemed | | | (6,033,499 | ) | | | (13,986,760 | ) |
| | | | | | | | |
Net decrease in fund shares | | | (5,061,317 | ) | | | (10,025,144 | ) |
| | | | | | | | |
The accompanying Notes are an integral part of these financial statements.
| | | | |
| Statements of Changes in Net Assets | | | 17 | |
State Street Total Return V.I.S. Fund
Notes to Financial Statements — June 30, 2018 (Unaudited)
| 1. | | Organization of the Company |
State Street Variable Insurance Series Funds, Inc. (the “Company”) was incorporated under the laws of the Commonwealth of Virginia on May 14, 1984 and is registered under the Investment Company Act of 1940, as amended (the “1940 Act”), as an open-end management investment company. The Company is currently composed of the following seven investment portfolios (collectively, the “Funds”): State Street U.S. Equity V.I.S. Fund, State Street S&P 500 Index V.I.S. Fund, State Street Premier Growth Equity V.I.S. Fund, State Street Small-Cap Equity V.I.S. Fund, State Street Total Return V.I.S. Fund (the “Fund”), State Street Income V.I.S. Fund and State Street Real Estate Securities V.I.S. Fund. Each Fund is a diversified investment company within the meaning of the 1940 Act
Shares of the Funds of the Company are offered only to insurance company separate accounts that fund certain variable life insurance contracts and variable annuity contracts.
The Company currently offers two share classes of the Fund as investment options for variable life insurance and variable annuity contracts — Class 1 and Class 3. Class 3 shares were first offered on May 1, 2006, and Fund shares outstanding prior to May 1, 2006 were designated as Class 1 shares. Each class of shares has different fees and expenses, and as a result, each class of shares will have different share price and performance. Not all variable contracts offer every class of the Fund’s shares.
Under the Company’s organizational documents, its officers and directors are indemnified against certain liabilities arising out of the performance of their duties to the Company. Additionally, in the normal course of business, the Company enters into contracts with service providers that contain general indemnification clauses. The Company’s maximum exposure under these arrangements is unknown as this would involve future claims that may be made against the Company that have not yet occurred.
| 2. | | Summary of Significant Accounting Policies |
The following is a summary of significant accounting policies followed by the Company in the preparation of its financial statements:
The preparation of financial statements in accordance with U.S. generally accepted accounting principles (“U.S. GAAP”) requires management to make estimates and assumptions that affect the reported amounts and disclosures in the financial statements. Actual results could differ from those estimates. The Fund is an investment company under U.S. GAAP and follows the accounting and reporting guidance applicable to investment companies.
Security Valuation The Fund’s investments are valued at fair value each day that the New York Stock Exchange (“NYSE”) is open and, for financial reporting purposes, as of the report date should the reporting period end on a day that the NYSE is not open. Fair value is generally defined as the price a fund would receive to sell an asset or pay to transfer a liability in an orderly transaction between market participants at the measurement date. By its nature, a fair value price is a good faith estimate of the valuation in a current sale and may not reflect an actual market price. The investments of the Fund are valued pursuant to the policy and procedures developed by the Oversight Committee (the “Committee”) and approved by the Company’s Board of Directors (the “Board”). The Committee provides oversight of the valuation of investments for the Fund. The Board has responsibility for determining the fair value of investments.
Valuation techniques used to value the Fund’s investments by major category are as follows:
| | • | | Equity investments (including preferred stocks and registered investment companies that are exchange traded funds) traded on a recognized securities exchange for which market quotations are readily available are valued at the last sale price or official closing price, as applicable, on the primary market or exchange on which they trade. Equity investments traded on a recognized exchange for which there were no sales on that day are valued at the last published sale price or at fair value. |
| | • | | Investments in registered investment companies (including money market funds) or other unitized pooled investment vehicles that are not traded on an exchange are valued at that day’s published net asset value (“NAV”) per share or unit. |
| | • | | Government and municipal fixed income securities are generally valued using quotations from independent pricing services or brokers. Certain government inflation-indexed securities may require a calculated fair valuation as the cumulative inflation is contained within the price provided by the pricing service or broker. For these securities, the inflation component of the price is “cleaned” from the pricing service or broker price utilizing the published inflation factors in order to ensure proper accrual of income. |
| | |
| 18 | | Notes to Financial Statements |
State Street Total Return V.I.S. Fund
Notes to Financial Statements, continued — June 30, 2018 (Unaudited)
| | • | | Debt obligations (including short term investments and convertible debt securities) are valued using quotations from independent pricing services or brokers or are generally valued at the last reported evaluated prices. |
| | • | | Exchange-traded futures contracts are valued at the closing settlement price on the primary market on which they are traded most extensively. Exchange-traded futures contracts traded on a recognized exchange for which there were no sales on that day are valued at the last reported sale price obtained from independent pricing services or brokers or at fair value. |
In the event prices or quotations are not readily available or that the application of these valuation methods results in a price for an investment that is deemed to be not representative of the fair value of such investment, fair value will be determined in good faith by the Committee, in accordance with the valuation policy and procedures approved by the Board.
A “significant event” is an event that the Board believes, with a reasonably high degree of certainty, has caused the closing market prices of a Fund’s portfolio securities to no longer reflect their value at the time of the Fund’s net asset value calculation. Fair value may be determined using an independent fair value service under valuation procedures approved by the Board. The independent fair value service takes into account multiple factors including, but not limited to, movements in the U.S. securities markets, certain depositary receipts, futures contracts and foreign currency exchange rates that have occurred subsequent to the close of foreign securities exchanges. The use of the independent fair value service or alternative fair valuation methods would result in the investments being classified within Level 2 of the fair value hierarchy. At March 31, 2018, the independent fair value service was used for certain foreign securities in the State Street Total Return V.I.S. Fund, and these securities were classified within Level 2 of the fair value hierarchy.
The Fund values its assets and liabilities at fair value using a fair value hierarchy consisting of three broad levels that prioritize the inputs to valuation techniques giving the highest priority to readily available unadjusted quoted prices in active markets for identical assets or liabilities (Level 1 measurements) and the lowest priority to unobservable inputs (Level 3 measurements) when market prices are not readily available or reliable. The categorization of a value determined for an investment within the hierarchy is based upon the pricing transparency of the investment and is not necessarily an indication of the risk associated with investing in it.
The three levels of the fair value hierarchy are as follows:
| | • | | Level 1 — Unadjusted quoted prices in active markets for an identical asset or liability; |
| | • | | Level 2 — Inputs other than quoted prices included within Level 1 that are observable for the asset or liability either directly or indirectly, including quoted prices for similar assets or liabilities in active markets, quoted prices for identical or similar assets or liabilities in markets that are not considered to be active, inputs other than quoted prices that are observable for the asset or liability (such as exchange rates, financing terms, interest rates, yield curves, volatilities, prepayment speeds, loss severities, credit risks and default rates) or other market-corroborated inputs; and |
| | • | | Level 3 — Unobservable inputs for the asset or liability, including the Committee’s assumptions used in determining the fair value of investments. |
The value of the Fund’s investments according to the fair value hierarchy as of June 30, 2018 is disclosed in the Fund’s Summary Schedule of Investments.
Changes in valuation techniques may result in transfers in or out of an assigned level within the fair value hierarchy. Transfers between different levels of the fair value hierarchy are recognized at the beginning of the reporting period. The Fund had no material transfers between levels for the six-month period ended June 30, 2018.
Investment Transactions and Income Recognition Investment transactions are accounted for on trade date for financial reporting purposes. Realized gains and losses from the sale or disposition of investments and foreign exchange transactions, if any, are determined using the identified cost method.
Dividend income and capital gain distributions, if any, are recognized on the ex-dividend date, net of any foreign taxes withheld at source, if any.
Interest income is recorded daily on an accrual basis. All premiums and discounts are amortized/accreted for financial reporting purposes.
Non-cash dividends received in the form of stock are recorded as dividend income at fair value.
| | | | |
| Notes to Financial Statements | | | 19 | |
State Street Total Return V.I.S. Fund
Notes to Financial Statements, continued — June 30, 2018 (Unaudited)
Expenses Certain expenses, which are directly identifiable to a specific Fund, are applied to the Fund within the Company. Other expenses which cannot be attributed to a specific Fund are allocated in such a manner as deemed equitable, taking into consideration the nature and type of expense and the relative net assets of the Fund within the Company.
Foreign Currency Translation The accounting records of the Fund are maintained in U.S. dollars. Foreign currencies as well as investment securities and other assets and liabilities denominated in a foreign currency are translated to U.S. dollars using exchange rates at period end. Purchases and sales of securities, income receipts and expense payments denominated in foreign currencies are translated into U.S. dollars at the prevailing exchange rate on the respective dates of the transactions.
The effects of exchange rate fluctuations on investments are included with the net realized and unrealized gain (loss) on investment securities. Other foreign currency transactions resulting in realized and unrealized gain (loss) are disclosed separately.
Foreign Taxes The Fund may be subject to foreign taxes (a portion of which may be reclaimable) on income, stock dividends, realized and unrealized capital gains on investments or certain foreign currency transactions. Foreign taxes are recorded in accordance with SSGA Funds Management, Inc.’s (the “Adviser” or “SSGA FM”) understanding of the applicable foreign tax regulations and rates that exist in the foreign jurisdictions in which the Fund invests. These foreign taxes, if any, are paid by the Fund and are reflected in the Statement of Operations, if applicable. Foreign taxes payable or deferred as of June 30, 2018, if any, are disclosed in the Fund’s Statement of Assets and Liabilities.
Distributions The Fund declares and pays any dividends from net investment income annually.
Net realized capital gains, if any, are distributed annually, unless additional distributions are required for compliance with applicable tax regulations. The amount and character of income and capital gains to be distributed are determined in accordance with applicable tax regulations which may differ from net investment income and realized gains recognized for U.S. GAAP purposes.
| 3. | | Securities and Other Investments |
Delayed Delivery Transactions and When-Issued Securities During the six-month period ended June 30, 2018, the Fund transacted in securities on a delayed delivery or when-issued basis. Payment and delivery may take place after the customary settlement period for that security. The price of the underlying securities and the date when the securities will be delivered and paid for are fixed at the time the transaction is negotiated. The securities purchased on a delayed delivery or when-issued basis are identified as such in the Fund’s Summary Schedule of Investments. The Fund may receive compensation for interest forgone in the purchase of a delayed delivery or when-issued security. With respect to such purchase commitments, the Fund identifies securities as segregated in its records with a value at least equal to the amount of the commitment. Losses may arise due to changes in the value of the underlying securities or if the counterparty does not perform under the contract’s terms, or if the issuer does not issue the securities due to political, economic or other factors.
To-Be-Announced Transactions The Fund may seek to obtain exposure to U.S. agency mortgage pass-through securities through the use of “to-be-announced” or “TBA transactions.” “TBA” refers to a commonly used mechanism for the forward settlement of U.S. agency mortgage pass-through securities. In a TBA transaction, the buyer and seller decide on general trade parameters, such as agency, settlement date, coupon, and price.
The Fund may use TBA transactions to “roll over” such agreements prior to the settlement date. This type of TBA transaction is sometimes known as a “TBA roll.” In a TBA roll, the Fund generally will sell the obligation to purchase the pools stipulated in the TBA agreement prior to the settlement date and will enter into a new TBA agreement for future delivery of pools of mortgage pass-through securities. The Fund may also enter into TBA agreements and settle such transactions on the stipulated settlement date by accepting actual receipt or delivery of the pools of mortgage pass-through securities.
Default by or bankruptcy of a counterparty to a TBA transaction would expose the Fund to possible loss because of adverse market action, expenses or delays in connection with the purchase or sale of the pools of mortgage pass-through securities specified in the TBA transaction. To minimize this risk, the Fund will enter into TBA transactions only with established counterparties. The Fund’s use of “TBA rolls” may impact portfolio turnover, transaction costs and capital gain distributions to shareholders.
| 4. | | Derivative Financial Instruments |
Futures Contracts The Fund may enter into futures contracts to meet the Fund’s objectives. A futures contract is a standardized, exchange-traded agreement to buy or sell a financial instrument at a set price on a future date. Upon entering
| | |
| 20 | | Notes to Financial Statements |
State Street Total Return V.I.S. Fund
Notes to Financial Statements, continued — June 30, 2018 (Unaudited)
into a futures contract, the Fund is required to deposit with the broker, cash or securities in an amount equal to the minimum initial margin requirements of the clearing house. Subsequent payments are made or received by the Fund equal to the daily change in the contract value and are recorded as variation margin receivable or payable with a corresponding offset to unrealized gains or losses. The Fund recognizes a realized gain or loss when the contract is closed.
Losses may arise if the value of a futures contract decreases due to unfavorable changes in the market rates or values of the underlying instrument during the term of the contract or if the counterparty does not perform under the contract. The use of futures contracts also involves the risk that the movements in the price of the futures contracts do not correlate with the movement of the assets underlying such contracts.
For the six-month period ended June 30, 2018 the Fund entered into futures contracts for cash equitization.
The following tables summarize the value of the Fund’s derivative instruments as of June 30, 2018 and the related location in the accompanying Statement of Assets and Liabilities and Statement of Operations, presented by primary underlying risk exposure:
Liability Derivatives
| | | | | | | | | | | | | | | | | | | | | | | | |
| | | Interest
Rate
Contracts
Risk | | | Foreign
Exchange
Contracts
Risk | | | Credit
Contracts
Risk | | | Equity
Contracts
Risk | | | Commodity
Contracts
Risk | | | Total | |
| | | | | | | | | | | | | | | | | | | | | | | | |
State Street Total Return V.I.S. Fund | |
Futures Contracts | | $ | — | | | $ | — | | | $ | — | | | $ | (529,554 | ) | | $ | — | | | $ | (529,554 | ) |
Net Realized Gain (Loss)
| | | | | | | | | | | | | | | | | | | | | | | | |
| | | Interest
Rate
Contracts
Risk | | | Foreign
Exchange
Contracts
Risk | | | Credit
Contracts
Risk | | | Equity
Contracts
Risk | | | Commodity
Contracts
Risk | | | Total | |
| | | | | | | | | | | | | | | | | | | | | | | | |
State Street Total Return V.I.S. Fund | |
Futures Contracts | | $ | — | | | $ | — | | | $ | — | | | $ | 536,577 | | | $ | — | | | $ | 536,577 | |
Net Change in Unrealized Appreciation (Depreciation)
| | | | | | | | | | | | | | | | | | | | | | | | |
| | | Interest
Rate
Contracts
Risk | | | Foreign
Exchange
Contracts
Risk | | | Credit
Contracts
Risk | | | Equity
Contracts
Risk | | | Commodity
Contracts
Risk | | | Total | |
| | | | | | | | | | | | | | | | | | | | | | | | |
State Street Total Return V.I.S. Fund | |
Futures Contracts | | $ | — | | | $ | — | | | $ | — | | | $ | (869,058 | ) | | $ | — | | | $ | (869,058 | ) |
| 5. | | Fees and Transactions with Affiliates |
Advisory Fee SSGA FM, a registered investment adviser, was retained by the Board to act as investment adviser and administrator of the Fund. SSGA FM’s compensation for investment advisory and administrative services (“Management Fee”) is paid monthly based on the average daily net assets of the Fund at an annualized rate of 0.35%.
Investor Service Plan — Class 1 and Class 3 Shares The Company adopted an Investor Service Plan (the “Service Plan”) on December 9, 2005 for Class 1 shares and on May 1, 2009 for Class 3 shares of the Fund. The Service Plan was not adopted pursuant to Rule 12b-1 under the 1940 Act. Each Service Plan provides that during any fiscal year, the amount of compensation paid under the Service Plan by the State Street Total Return V.I.S. Fund Class 1 or Class 3 shares may not exceed the annual rate of 0.20% of the average daily net assets of the Fund attributable to each such class shares.
Distribution and Shareholder Service (12b-1) Fees The Company has adopted a Distribution and Service (12b-1) Plan (the “12b-1 Plan”) pursuant to Rule 12b-1 under the 1940 Act with respect to each of Class 1 and Class 3 shares of the Fund. Under the 12b-1 Plan for Class 1 shares that became effective May 1, 2009, payments made under the Class 1 Investor Service Plan are covered in the event that any portion of compensation paid pursuant to the Class 1 Investor Service Plan is
| | | | |
| Notes to Financial Statements | | | 21 | |
State Street Total Return V.I.S. Fund
Notes to Financial Statements, continued — June 30, 2018 (Unaudited)
determined to be an indirect use of the assets attributable to the Class 1 shares to finance distribution of such shares. Under the 12b-1 Plan for Class 3 shares, the Company, on behalf of the Fund, may have compensated State Street Global Advisors Funds Distributors, LLC (“SSGA FD”, formerly known as State Street Global Markets, LLC), the distributor of the shares of the Fund for certain sales services provided by SSGA FD or other broker dealers and investor services provided by SSGA FD or other service providers relating to the Fund’s Class 3 shares, including services to owners or prospective owners of variable contracts issued by insurance companies that offer Class 3 shares as an investment option under such variable contracts. The amount of compensation paid under the 12b-1 Plan for Class 3 shares may not exceed 0.25%, of the average daily net assets of the Fund attributable to such share class. The 12b-1 Plan continues in effect from year to year for so long as such continuance is approved annually by the Board, including by those Directors who are not interested persons of the Company and who have no direct or indirect financial interest in the operation of the 12b-1 Plan or in any agreement related to it. In addition, the Class 3 12b-1 Plan covers payments made under the Class 3 Investor Service Plan in the event that any portion of compensation paid pursuant to the Class 3 Investor Service Plan is determined to be an indirect use of the assets attributable to the Class 3 shares to finance distribution of such shares.
Administrator, Sub-Administrator and Custodian Fees State Street Bank and Trust Company (“State Street”) serves as the sub-administrator and custodian to the Funds. Amounts paid by the Fund to State Street for performing such services are included in advisory and administration and custody and accounting expenses, respectively.
Due to Custodian In certain circumstances, the Funds may have cash overdraft with the custodian. The Due to Custodian amount, if any, reflects cash overdrawn with State Street as custodian who is an affiliate of the Funds. As of June 30, 2018, the Fund had a cash overdraft related to fund share redemption activity.
Other Transactions with affiliates The Fund may invest in affiliated entities, including securities issued by State Street, affiliated funds, or entities deemed to be affiliates as a result of the Fund owning more than five percent of the entity’s voting securities or outstanding shares. Amounts relating to these transactions during the six-month period ended June, 30, 2018 are disclosed in the Summary Schedule of Investments.
The fees and expenses of the Company’s directors who are not “interested persons” of the Company, as defined in the 1940 Act (“Independent Directors”) are paid directly by the Fund. The Independent Directors are reimbursed for travel and other out-of-pocket expenses in connection with meeting attendance and industry seminars.
| 7. | | Investment Transactions |
Purchases and sales of investments (excluding in-kind transactions, short term investments and derivative contracts) for the six-month period ended June 30, 2018 were as follows:
| | | | | | | | |
| U.S. Government Securities |
| Purchases | | Sales |
| | | | | | | | | |
| | $ | 154,190,233 | | | | $ | 112,915,285 | |
| | | | | | | | |
| Non-U.S. Government Securities |
| Purchases | | Sales |
| | | | | | | | | |
| | $ | 53,689,717 | | | | $ | 150,112,792 | |
The Fund has qualified and intends to continue to qualify as a regulated investment company under Subchapter M of the Internal Revenue Code of 1986, as amended. The Fund will not be subject to federal income taxes to the extent it distributes its taxable income, including any net realized capital gains, for each fiscal year. Therefore, no provision for federal income tax is required.
The Fund files federal and various state and local tax returns as required. No income tax returns are currently under examination. Generally, the federal returns are subject to examination by the Internal Revenue Service for a period of three years from date of filing, while the state returns may remain open for an additional year depending upon jurisdiction. SSGA FM
| | |
| 22 | | Notes to Financial Statements |
State Street Total Return V.I.S. Fund
Notes to Financial Statements, continued — June 30, 2018 (Unaudited)
has analyzed the Fund’s tax positions taken on tax returns for all open years and does not believe there are any uncertain tax positions that would require recognition of a tax liability.
Distributions to shareholders are recorded on ex-dividend date. Income dividends and gain distributions are determined in accordance with income tax rules and regulations, which may differ from generally accepted accounting principles.
As of June 30, 2018, gross unrealized appreciation and gross unrealized depreciation of investments and other financial instruments based on cost for federal income tax purposes were as follows:
| | | | | | | | | | | | | | | | | | |
Tax
Cost | | Gross
Unrealized
Appreciation | | Gross
Unrealized
Depreciation | | Net Unrealized
Appreciation
(Depreciation) |
| | | | | | | | | | | | | | | | | | | |
| | $ | 1,745,907,338 | | | | $ | 498,585,328 | | | | $ | 86,964,953 | | | | $ | 411,620,375 | |
The Fund and other affiliated funds (each, a “Participant” and collectively, the “Participants”) participate in a $500 million revolving credit facility provided by a syndication of banks under which the Participants may borrow to fund shareholder redemptions. This agreement expires in October 2018 unless otherwise extended or renewed.
The Participants are charged an annual commitment fee which is calculated based on the unused portion of the shared credit line. Commitment fees are allocated among each of the Participants based on relative net assets. Commitment fees are ordinary fund operating expenses paid by the Adviser. A Participant incurs and pays the interest expense related to its borrowing. Interest is calculated at a rate per annum equal to the sum of 1% plus the greater of the New York Fed Bank Rate and 1-month LIBOR rate.
The Fund had no outstanding loans as of June 30, 2018.
Concentration Risk As a result of the Fund’s ability to invest a large percentage of its assets in obligations of issuers within the same country, state, region, currency or economic sector, an adverse economic, business or political development may affect the value of the Fund’s investments more than if the Fund was more broadly diversified.
Foreign and Emerging Markets Risk Investing in foreign markets involves risks and considerations not typically associated with investing in the U.S. Foreign securities may be subject to risk of loss because of government regulation, economic, political and social instability in the countries in which the Fund invests. Foreign markets may be less liquid than investments in the U.S. and may be subject to the risks of currency fluctuations. To the extent that the Fund invests in securities of issuers located in emerging markets, these risks may be even more pronounced.
Market and Credit Risk In the normal course of business, the Fund trades financial instruments and enters into financial transactions where risk of potential loss exists due to changes in the general economic conditions and fluctuations of the market (market risk). Additionally, the Fund may also be exposed to credit risk in the event that an issuer or guarantor fails to perform or that an institution or entity with which the Fund has unsettled or open transactions defaults.
| 11. | | Recent Accounting Pronouncement |
In March 2017, the Financial Accounting Standards Board issued Accounting Standards Update (“ASU”) No. 2017-08, Receivables — Nonrefundable Fees and Other Costs (Subtopic 310-20): Premium Amortization on Purchased Callable Debt Securities. The amendments in the ASU shorten the amortization period for certain callable debt securities, held at a premium, to be amortized to the earliest call date. The ASU does not require an accounting change for securities held at a discount; which continues to be amortized to maturity. The ASU is effective for fiscal years and interim periods within those fiscal years beginning after December 15, 2018. Management is currently evaluating the impact, if any, of applying this provision.
Management has evaluated the impact of all subsequent events on the Fund through the date on which the financial statements were available to be issued and has determined that there were no subsequent events requiring adjustment or disclosure in the financial statements.
| | | | |
| Notes to Financial Statements | | | 23 | |
State Street Total Return V.I.S. Fund
Other Information (Unaudited)
Proxy Voting Policies and Procedures and Record
The Fund has adopted the proxy voting policies of SSGA FM. A description of the policies and procedures that the Fund has adopted to determine how to vote proxies relating to portfolio securities is available (i) without charge, upon request, by calling 1-800-242-0134, (ii) on the Fund’s website at http://www.ssga.com/geam, (iii) on the SEC’s website at www.sec.gov, and (iv) at the SEC’s public reference room. Information on the operation of the public reference room may be obtained by calling 1-800-SEC-0330. Information regarding how the Fund voted proxies, if any, during the most recent 12-month period ended June 30 is available by August 31 of each year without charge (1) by calling 1-800-242-0134 (toll free), and (2) on the website of the SEC at www.sec.gov.
Quarterly Portfolio Schedule
The Fund files its complete schedule of investments with the SEC for the first and third quarters of each fiscal year on Form N-Q. The Fund’s Forms N-Q are available (i) without charge, upon request, by calling 1-800-242-013, (ii) on the Fund’s website at http://www.ssga.com/geam, (iii) on the SEC’s website at www.sec.gov, and (iv) at the SEC’s public reference room. Information on the operation of the public reference room may be obtained by calling 1-800-SEC-0330.
State Street Total Return V.I.S. Fund
Other Information (Unaudited), continued
Disclosure for the Board of Directors’ Consideration of the Renewal of the Investment Advisory and Administration Agreement with SSGA Funds Management, Inc. on behalf of the State Street Total Return V.I.S. Fund
At meetings of the Board of Directors (the “Board”) of State Street Variable Insurance Series Funds, Inc. (the “V.I.S. Funds”) held on May 16, 2018 and June 5, 2018 (the “Board Meetings”), the Board members, including the Board members who are not “interested persons” (as defined in the Investment Company Act of 1940, as amended (the “1940 Act”)) of the V.I.S. Funds (“Independent Board Members”), considered and unanimously approved the continuance for an additional year of the investment advisory and administration agreement (the “Investment Advisory and Administration Agreement”) between SSGA Funds Management, Inc. (“SSGA FM” or the “Adviser”) and the V.I.S. Funds on behalf of each of its series portfolios, including the State Street Total Return V.I.S. Fund (the “Fund”).
In considering whether to approve the continuance for an additional year of the Investment Advisory and Administration Agreement, the Board members considered and discussed a substantial amount of information and analysis provided, at the Board’s request, by the Adviser. The Board members also considered detailed information regarding performance and expenses of other investment companies, including those with similar investment strategies and sizes, which was prepared by an independent third party provider, Broadridge Financial Solutions, Inc. (“Broadridge”). The Board members reviewed the fees charged by the Adviser for other mutual funds and investment products other than mutual funds that employ a similar investment strategy as the Fund. The Board had the opportunity to ask questions and request additional information in connection with its considerations.
Before approving the continuance of the Investment Advisory and Administration Agreement, the Independent Board Members reviewed the information provided with management of the Adviser and with their independent legal counsel. The Board also reviewed a memorandum prepared by independent legal counsel discussing the legal standards for the consideration of the proposed continuance. The Independent Board Members discussed the proposed continuance of the Investment Advisory and Administration Agreement in detail during private sessions in advance of, and at, the Board Meetings with their independent legal counsel at which no representatives of the Adviser were present. The Independent Board Members and their independent legal counsel requested, and received and considered, additional information from the Adviser following the May 16, 2018 Board Meeting and prior to the June 5, 2018 Board Meeting.
In advance of the Board Meetings, and in response to their detailed requests, the Board members received from the Adviser written responses to their inquiries, which included substantial exhibits and other materials related to the Adviser’s business and the services it provides to the Fund. The Directors took into account their multi-year experience as Directors and particularly their previous consideration of these types of agreements.
During the Board Meetings, the Board members had an opportunity to discuss this information with SSGA FM representatives, including senior executives, representatives from the legal, compliance and finance departments, and investment personnel. The Board members posed questions to these representatives and engaged in significant discussions.
In reaching its determinations relating to the continuance of the Investment Advisory and Administration Agreement, the Board considered those factors it deemed relevant, including the factors discussed below. In its deliberations, the Board did not identify any single factor that was dispositive and each Director may have attributed different weights to the various factors. The Directors evaluated the information provided to them, as well as the presentations and discussions that occurred at the Board Meetings, for the Fund, and their determinations were made separately in respect of the Fund from other series portfolios of the V.I.S Funds.
The material factors and conclusions that formed the basis for the Board’s determinations to approve the continuance of the Investment Advisory and Administration Agreement with the Adviser on behalf of the Fund are as discussed below.
The Nature, Extent and Quality of Services Provided.
The Board reviewed the services provided to the Fund by the Adviser. The Board considered the Adviser’s management capabilities and investment process with respect to the types of investments held by the Fund, including the education, experience and number of investment professionals and other personnel who provide portfolio management, investment research, and similar services to the Fund. The Board evaluated, where relevant, the abilities and experience of such investment personnel in analyzing particular markets, industries and specific issuers of securities in these markets and industries. The Board also considered the substantial expertise of the Adviser in developing and applying proprietary quantitative models for managing the Fund and the
State Street Total Return V.I.S. Fund
Other Information (Unaudited), continued
extensive experience and resources committed by the Adviser to the evaluation of a portfolio’s quality distribution and sector and interest rate exposure. The Board considered the extensive experience and resources committed by the Adviser to risk management, including with respect to investment risk, liquidity risk, operational risk, counterparty risk and model risk. The Board also considered the significant risks assumed by the Adviser in connection with the services provided to the Fund, including operational, enterprise, regulatory, litigation and compliance risks. The Board also took into account the compensation paid to recruit and retain investment personnel, and the time and attention devoted to the Fund by senior management.
The Board had previously reviewed the compliance programs of SSGA FM and various affiliated service providers (“Affiliated Service Providers”). Among other things, the Board considered compliance and reporting matters relating to personal trading by investment personnel, selective disclosure of portfolio holdings, late trading, frequent trading, portfolio valuation, business continuity, the allocation of investment opportunities and the voting of proxies.
In light of the foregoing and other relevant information, the Board, including the Independent Board Members, concluded that the services provided by the Adviser continue to be satisfactory.
Investment Performance.
The Board members considered the investment performance of the Fund for various periods. The Board members reviewed detailed comparisons of the performance of the Fund with the relevant securities indices and peer and category groupings of mutual funds prepared by Broadridge with respect to various periods. The Board members also engaged in detailed discussions with SSGA FM management about its investment processes and performance results. These discussions focused on the Fund’s investment objective, the number and experience of portfolio management and supporting research personnel, the Fund’s investment style and approach employed, the likely market cycles for the Fund’s investment style and the Fund’s competitive recent performance.
Taking these factors into consideration, the Board, including the Independent Board Members, concluded that the Fund’s performance was acceptable overall.
Cost of the Services Provided And Profits Realized From The Relationship with the Fund.
The Directors considered the management fees paid to the Adviser by the Fund. The Board reviewed the level of profits realized by the Adviser and the Affiliated Service Providers in providing investment advisory and other services to the Fund. Information also was presented regarding the financial condition of the Adviser for various past periods. The Directors also considered the Adviser’s statements concerning its significant investment in supporting registered investment companies. The Board also considered the various risks borne by SSGA FM and the Affiliated Service Providers in connection with their various roles in servicing the Fund, including enterprise, litigation, business, operational and entrepreneurial risk.
The Board concluded that the profitability of the Adviser with respect to the Fund, and the profitability range of each of the Affiliated Service Providers with respect to its services to the Fund, were reasonable in relation to the services provided.
The Extent to Which Economies of Scale Would Be Realized as the Fund Grows and Whether Fee Levels Would Reflect Such Economies of Scale.
The Board considered the extent to which the Adviser and the Affiliated Service Providers, on the one hand, and the Fund, on the other hand, can expect to realize benefits from economies of scale as the assets of the Fund increase. The Board acknowledged the difficulty in accurately measuring the benefits resulting from the economies of scale with respect to the management of the Fund. The Board concluded that, in light of, among other considerations, the current size of the Fund, the level of profitability of the Adviser and the Affiliated Service Providers with respect to the Fund, and/or the comparative management fee and expense ratio of the Fund, it does not appear that the Adviser or the Affiliated Service Providers has realized benefits from economies of scale in managing the assets of the Fund to such an extent that previously agreed management fees should be reduced or that breakpoints in such fees should be implemented for the Fund at this time.
Comparison of Services to be Rendered and Fees to be Paid.
The Board discussed the services provided to the Fund by the Adviser, and the fees charged to the Fund for those services. As part of its review, the Board considered the Fund’s management fee and total expense ratio, including the portion attributable to administrative services provided by SSGA FM, as compared to the expense ratios of a group of comparable mutual funds selected
State Street Total Return V.I.S. Fund
Other Information (Unaudited), continued
by Broadridge, and the related Broadridge analysis for the Fund. The Board also considered the comparability of the fees charged and the services provided to the Fund by the Adviser to the fees charged and services provided to other clients of the Adviser. Among other information, the Board considered that the Fund’s expense ratios and advisory fee were lower than the Broadridge peer group and category medians.
In light of the foregoing, the Board, including the Independent Board Members, determined that the management fees, considered in relation to the services provided to the Fund, supported the Board’s approval of the continuance of the Investment Advisory and Administration Agreement.
Fall-Out Benefits.
The Board considered actual and potential financial benefits that the Adviser could derive from its relationship with the Fund, including the custody, fund accounting and sub-administration services being provided to the Fund by affiliates of the Adviser and, to the extent applicable, soft dollar commission benefits generated through Fund portfolio transactions. The Board noted, however, that the Fund benefits from the vast array of resources available through SSGA FM, and that the Fund represents only a small portion of the assets managed by SSGA FM.
Conclusion.
No single factor was determinative to the Board’s decision. Based on their discussion and such other matters as were deemed relevant, the Directors, including the Independent Board Members, approved the continuance of the Investment Advisory and Administration Agreement for the Fund.
Directors
John R. Costantino, Chairman
R. Sheldon Johnson
Donna M. Rapaccioli
Jeanne M. La Porta
Officers
Jeanne M. La Porta, President
Arthur Jensen, Treasurer
Brian Harris, Chief Compliance Officer and Anti-Money Laundering Officer
Bruce S. Rosenberg, Assistant Treasurer
Ann M. Carpenter, Assistant Treasurer
Chad C. Hallett, Assistant Treasurer
Darlene Anderson-Vasquez, Assistant Treasurer
Daniel G. Plourde, Assistant Treasurer
Jesse Hallee, Secretary
Investment Adviser and Administrator
SSGA Funds Management, Inc.
1600 Summer Street
P.O. Box 7900
Stamford, CT 06904-7900
Custodian and Sub-Administrator
State Street Bank and Trust Company
One Lincoln Street
Boston, Massachusetts 02111
Distributor
State Street Global Advisors Funds Distributors, LLC
One Iron Street
Boston, MA 02210
Independent Registered Public Accounting Firm
Ernst & Young LLP
200 Clarendon Street
Boston, Massachusetts 02116
Not applicable to this filing.
| Item 3. | Audit Committee Financial Expert. |
Not applicable to this filing.
| Item 4. | Principal Accountant Fees and Services. |
Not applicable to this filing.
| Item 5. | Audit Committee of Listed Registrants. |
Not applicable to the Registrant.
| Item 6. | Schedule of Investments. |
| (a) | The Schedule of Investments for the State Street Total Return V.I.S. Fund is listed below. The Schedules of Investments for the State Street U.S. Equity V.I.S. Fund, State Street S&P 500 Index V.I.S. Fund, State Street Premier Growth V.I.S. Fund, State Street Small-Cap Equity V.I.S. Fund, State Street Income V.I.S. Fund and State Street Real Estate Securities V.I.S. Fund and a Summary Schedule of Investments for the State Street Total Return V.I.S. Fund are included as part of the report to shareholders filed under Item 1 of this Form N-CSR. |
| | |
| State Street Total Return V.I.S. Fund | | |
| Schedule of Investments | | June 30, 2018 (Unaudited) |
|
State Street Total Return V.I.S. Fund
| | | | | | | | |
| | | Number
of Shares | | | Fair
Value | |
Domestic Equity – 37.2% † | |
Common Stock – 37.2% | |
Advertising – 0.0% * | |
Clear Channel Outdoor Holdings Inc., Class A | | | 823 | | | $ | 3,539 | |
Emerald Expositions Events Inc. | | | 493 | | | | 10,156 | |
Fluent Inc. | | | 233 | | | | 571 | (a) |
MDC Partners Inc., Class A | | | 1,024 | | | | 4,710 | (a) |
National CineMedia Inc. | | | 1,224 | | | | 10,282 | |
Omnicom Group Inc. | | | 7,799 | | | | 594,830 | |
The Interpublic Group of Companies Inc. | | | 13,224 | | | | 309,970 | |
| | | | | | | 934,058 | |
Aerospace & Defense – 1.0% | |
AAR Corp. | | | 611 | | | | 28,405 | |
Aerojet Rocketdyne Holdings Inc. | | | 1,305 | | | | 38,485 | (a) |
Aerovironment Inc. | | | 401 | | | | 28,643 | (a) |
Arconic Inc. | | | 14,123 | | | | 240,232 | |
Astronics Corp. | | | 348 | | | | 12,518 | (a) |
Axon Enterprise Inc. | | | 973 | | | | 61,474 | (a) |
Cubic Corp. | | | 436 | | | | 27,991 | |
Curtiss-Wright Corp. | | | 294 | | | | 34,992 | |
Ducommun Inc. | | | 204 | | | | 6,750 | (a) |
Engility Holdings Inc. | | | 359 | | | | 11,000 | (a) |
Esterline Technologies Corp. | | | 645 | | | | 47,601 | (a) |
General Dynamics Corp. | | | 9,309 | | | | 1,735,291 | |
Harris Corp. | | | 3,942 | | | | 569,777 | |
Huntington Ingalls Industries Inc. | | | 1,500 | | | | 325,185 | |
KLX Inc. | | | 1,271 | | | | 91,385 | (a) |
Kratos Defense & Security Solutions Inc. | | | 1,634 | | | | 18,807 | (a) |
L3 Technologies Inc. | | | 2,692 | | | | 517,725 | |
Lockheed Martin Corp. | | | 8,334 | | | | 2,462,114 | |
Maxar Technologies Ltd. | | | 1,052 | | | | 53,147 | |
Mercury Systems Inc. | | | 854 | | | | 32,503 | (a) |
Moog Inc., Class A | | | 597 | | | | 46,542 | |
National Presto Industries Inc. | | | 99 | | | | 12,276 | |
Northrop Grumman Corp. | | | 5,787 | | | | 1,780,660 | |
Raytheon Co. | | | 9,501 | | | | 1,835,403 | |
Rockwell Collins Inc. | | | 5,502 | | | | 741,009 | |
Sparton Corp. | | | 188 | | | | 3,570 | (a) |
Teledyne Technologies Inc. | | | 239 | | | | 47,575 | (a) |
Textron Inc. | | | 8,798 | | | | 579,876 | |
The Boeing Co. | | | 18,229 | | | | 6,116,012 | |
The KeyW Holding Corp. | | | 721 | | | | 6,302 | (a) |
TransDigm Group Inc. | | | 1,664 | | | | 574,313 | |
Triumph Group Inc. | | | 925 | | | | 18,130 | |
United Technologies Corp. | | | 24,882 | | | | 3,110,997 | |
Vectrus Inc. | | | 210 | | | | 6,472 | (a) |
Wesco Aircraft Holdings Inc. | | | 810 | | | | 9,113 | (a) |
| | | | | | | 21,232,275 | |
Agricultural & Farm Machinery – 0.1% | |
AGCO Corp. | | | 446 | | | | 27,081 | |
Deere & Co. | | | 10,873 | | | | 1,520,046 | |
Lindsay Corp. | | | 186 | | | | 18,040 | |
The Toro Co. | | | 716 | | | | 43,139 | |
Titan International Inc. | | | 888 | | | | 9,528 | |
| | | | | | | 1,617,834 | |
Agricultural Products – 0.1% | |
Alico Inc. | | | 66 | | | | 2,092 | |
Archer-Daniels-Midland Co. | | | 18,704 | | | | 857,204 | |
Darling Ingredients Inc. | | | 3,039 | | | | 60,415 | (a) |
Fresh Del Monte Produce Inc. | | | 575 | | | | 25,616 | |
Ingredion Inc. | | | 475 | | | | 52,583 | |
Limoneira Co. | | | 240 | | | | 5,907 | |
| | | | | | | 1,003,817 | |
Air Freight & Logistics – 0.2% | |
Air Transport Services Group Inc. | | | 1,090 | | | | 24,623 | (a) |
Atlas Air Worldwide Holdings Inc. | | | 444 | | | | 31,835 | (a) |
CH Robinson Worldwide Inc. | | | 4,808 | | | | 402,237 | |
Echo Global Logistics Inc. | | | 539 | | | | 15,766 | (a) |
| | | | | | | | |
| | | Number
of Shares | | | Fair
Value | |
Expeditors International of Washington Inc. | | | 6,050 | | | $ | 442,255 | |
FedEx Corp. | | | 8,161 | | | | 1,853,037 | |
Forward Air Corp. | | | 550 | | | | 32,494 | |
Hub Group Inc., Class A | | | 582 | | | | 28,984 | (a) |
Radiant Logistics Inc. | | | 505 | | | | 1,974 | (a) |
United Parcel Service Inc., Class B | | | 22,943 | | | | 2,437,235 | |
| | | | | | | 5,270,440 | |
Airlines – 0.2% | |
Alaska Air Group Inc. | | | 4,066 | | | | 245,546 | |
Allegiant Travel Co. | | | 229 | | | | 31,820 | |
American Airlines Group Inc. | | | 14,228 | | | | 540,095 | |
Delta Air Lines Inc. | | | 21,537 | | | | 1,066,943 | |
Hawaiian Holdings Inc. | | | 866 | | | | 31,133 | |
JetBlue Airways Corp. | | | 2,132 | | | | 40,465 | (a) |
SkyWest Inc. | | | 946 | | | | 49,097 | |
Southwest Airlines Co. | | | 18,133 | | | | 922,607 | |
Spirit Airlines Inc. | | | 1,276 | | | | 46,383 | (a) |
United Continental Holdings Inc. | | | 7,861 | | | | 548,147 | (a) |
| | | | | | | 3,522,236 | |
Alternative Carriers – 0.0% * | |
CenturyLink Inc. | | | 31,723 | | | | 591,317 | |
Cogent Communications Holdings Inc. | | | 781 | | | | 41,705 | |
Iridium Communications Inc. | | | 1,804 | | | | 29,044 | (a) |
ORBCOMM Inc. | | | 1,307 | | | | 13,201 | (a) |
pdvWireless Inc. | | | 200 | | | | 4,990 | (a) |
Vonage Holdings Corp. | | | 4,110 | | | | 52,978 | (a) |
| | | | | | | 733,235 | |
Aluminum – 0.0% * | |
Century Aluminum Co. | | | 820 | | | | 12,915 | (a) |
Kaiser Aluminum Corp. | | | 307 | | | | 31,962 | |
| | | | | | | 44,877 | |
Apparel Retail – 0.2% | |
Abercrombie & Fitch Co., Class A | | | 1,276 | | | | 31,236 | |
American Eagle Outfitters Inc. | | | 4,088 | | | | 95,046 | |
Ascena Retail Group Inc. | | | 3,466 | | | | 13,812 | (a) |
Boot Barn Holdings Inc. | | | 265 | | | | 5,499 | (a) |
Caleres Inc. | | | 794 | | | | 27,306 | |
Chico’s FAS Inc. | | | 2,209 | | | | 17,981 | |
Citi Trends Inc. | | | 159 | | | | 4,363 | |
DSW Inc., Class A | | | 1,217 | | | | 31,423 | |
Express Inc. | | | 1,136 | | | | 10,394 | (a) |
Foot Locker Inc. | | | 3,938 | | | | 207,336 | |
Francesca’s Holdings Corp. | | | 734 | | | | 5,542 | (a) |
Genesco Inc. | | | 370 | | | | 14,689 | (a) |
Guess? Inc. | | | 1,045 | | | | 22,363 | |
L Brands Inc. | | | 8,458 | | | | 311,931 | |
Ross Stores Inc. | | | 12,616 | | | | 1,069,206 | |
Shoe Carnival Inc. | | | 216 | | | | 7,009 | |
Tailored Brands Inc. | | | 884 | | | | 22,560 | |
The Buckle Inc. | | | 451 | | | | 12,132 | |
The Cato Corp., Class A | | | 442 | | | | 10,882 | |
The Children’s Place Inc. | | | 298 | | | | 35,998 | |
The Gap Inc. | | | 7,007 | | | | 226,957 | |
The TJX Companies Inc. | | | 21,070 | | | | 2,005,443 | |
Tilly’s Inc., Class A | | | 209 | | | | 3,166 | |
Urban Outfitters Inc. | | | 527 | | | | 23,478 | (a) |
Zumiez Inc. | | | 363 | | | | 9,093 | (a) |
| | | | | | | 4,224,845 | |
Apparel, Accessories & Luxury Goods – 0.1% | |
Carter’s Inc. | | | 319 | | | | 34,577 | |
Fossil Group Inc. | | | 824 | | | | 22,141 | (a) |
G-III Apparel Group Ltd. | | | 778 | | | | 34,543 | (a) |
Hanesbrands Inc. | | | 11,180 | | | | 246,184 | |
Michael Kors Holdings Ltd. | | | 5,240 | | | | 348,984 | (a) |
Movado Group Inc. | | | 304 | | | | 14,683 | |
Oxford Industries Inc. | | | 305 | | | | 25,309 | |
Perry Ellis International Inc. | | | 249 | | | | 6,765 | (a) |
PVH Corp. | | | 2,588 | | | | 387,475 | |
Ralph Lauren Corp. | | | 1,818 | | | | 228,559 | |
Superior Group of Companies Inc. | | | 159 | | | | 3,293 | |
Tapestry Inc. | | | 9,509 | | | | 444,165 | |
Under Armour Inc., Class A | | | 6,888 | | | | 154,842 | (a) |
Under Armour Inc., Class C | | | 6,931 | | | | 146,106 | (a) |
Vera Bradley Inc. | | | 408 | | | | 5,728 | (a) |
VF Corp. | | | 11,009 | | | | 897,454 | |
| | | | 3,000,808 | |
See Notes to Schedules of Investments and Notes to Financial Statements.
| | |
| State Street Total Return V.I.S. Fund | | |
| Schedule of Investments | | June 30, 2018 (Unaudited) |
|
| | | | | | | | |
| | | Number
of Shares | | | Fair
Value | |
Application Software – 0.6% | |
8x8 Inc. | | | 1,583 | | | $ | 31,739 | (a) |
ACI Worldwide Inc. | | | 2,913 | | | | 71,864 | (a) |
Adobe Systems Inc. | | | 16,342 | | | | 3,984,343 | (a,b) |
Agilysys Inc. | | | 301 | | | | 4,666 | (a) |
Altair Engineering Inc., Class A | | | 479 | | | | 16,372 | (a) |
American Software Inc., Class A | | | 521 | | | | 7,591 | |
ANSYS Inc. | | | 2,900 | | | | 505,122 | (a) |
Asure Software Inc. | | | 226 | | | | 3,605 | (a) |
Autodesk Inc. | | | 7,223 | | | | 946,863 | (a) |
Avaya Holdings Corp. | | | 1,953 | | | | 39,216 | (a) |
Blackbaud Inc. | | | 1,216 | | | | 124,579 | |
Blackline Inc. | | | 609 | | | | 26,449 | (a) |
Bottomline Technologies de Inc. | | | 687 | | | | 34,233 | (a) |
Cadence Design Systems Inc. | | | 9,700 | | | | 420,107 | (a) |
CDK Global Inc. | | | 819 | | | | 53,276 | |
Citrix Systems Inc. | | | 4,278 | | | | 448,506 | (a) |
Digimarc Corp. | | | 187 | | | | 5,012 | (a) |
Ebix Inc. | | | 434 | | | | 33,092 | |
Ellie Mae Inc. | | | 632 | | | | 65,627 | (a) |
Everbridge Inc. | | | 496 | | | | 23,520 | (a) |
Fair Isaac Corp. | | | 198 | | | | 38,277 | (a) |
Glu Mobile Inc. | | | 2,085 | | | | 13,365 | (a) |
HubSpot Inc. | | | 669 | | | | 83,893 | (a) |
Intuit Inc. | | | 8,181 | | | | 1,671,419 | |
Manhattan Associates Inc. | | | 460 | | | | 21,625 | (a) |
MicroStrategy Inc., Class A | | | 179 | | | | 22,867 | (a) |
Mitek Systems Inc. | | | 595 | | | | 5,295 | (a) |
MobileIron Inc. | | | 892 | | | | 3,969 | (a) |
Model N Inc. | | | 444 | | | | 8,258 | (a) |
Monotype Imaging Holdings Inc. | | | 658 | | | | 13,357 | |
Park City Group Inc. | | | 224 | | | | 1,770 | (a) |
Paylocity Holding Corp. | | | 543 | | | | 31,961 | (a) |
PROS Holdings Inc. | | | 506 | | | | 18,504 | (a) |
PTC Inc. | | | 771 | | | | 72,328 | (a) |
QAD Inc., Class A | | | 189 | | | | 9,478 | |
salesforce.com Inc. | | | 23,605 | | | | 3,219,722 | (a) |
Synopsys Inc. | | | 4,900 | | | | 419,293 | (a) |
Telenav Inc. | | | 652 | | | | 3,651 | (a) |
The Ultimate Software Group Inc. | | | 194 | | | | 49,918 | (a) |
Tyler Technologies Inc. | | | 236 | | | | 52,416 | (a) |
Upland Software Inc. | | | 310 | | | | 10,655 | (a) |
Verint Systems Inc. | | | 1,182 | | | | 52,422 | (a) |
VirnetX Holding Corp. | | | 988 | | | | 3,359 | (a) |
Workiva Inc. | | | 439 | | | | 10,712 | (a) |
Zix Corp. | | | 1,087 | | | | 5,859 | (a) |
| | | | | | | 12,690,155 | |
Asset Management & Custody Banks – 0.4% | |
Affiliated Managers Group Inc. | | | 1,905 | | | | 283,216 | |
Ameriprise Financial Inc. | | | 4,793 | | | | 670,445 | |
Arlington Asset Investment Corp., Class A | | | 390 | | | | 4,021 | |
Artisan Partners Asset Management Inc., Class A | | | 844 | | | | 25,447 | |
BlackRock Inc. | | | 4,137 | | | | 2,064,529 | |
Cohen & Steers Inc. | | | 401 | | | | 16,726 | |
Diamond Hill Investment Group Inc. | | | 54 | | | | 10,499 | |
Eaton Vance Corp. | | | 800 | | | | 41,752 | |
Federated Investors Inc., Class B | | | 2,439 | | | | 56,877 | |
Financial Engines Inc. | | | 1,181 | | | | 53,027 | |
Franklin Resources Inc. | | | 10,686 | | | | 342,486 | |
GAMCO Investors Inc., Class A | | | 65 | | | | 1,739 | |
Hamilton Lane Inc., Class A | | | 261 | | | | 12,520 | |
Invesco Ltd. | | | 14,064 | | | | 373,540 | |
Legg Mason Inc. | | | 564 | | | | 19,588 | |
Northern Trust Corp. | | | 6,928 | | | | 712,822 | |
Pzena Investment Management Inc., Class A | | | 243 | | | | 2,238 | |
Safeguard Scientifics Inc. | | | 435 | | | | 5,568 | (a) |
SEI Investments Co. | | | 884 | | | | 55,268 | |
Silvercrest Asset Management Group Inc., Class A | | | 195 | | | | 3,179 | |
State Street Corp. | | | 12,236 | | | | 1,139,049 | (c) |
| | | | | | | | |
| | | Number
of Shares | | | Fair
Value | |
T Rowe Price Group Inc. | | | 8,037 | | | $ | 933,015 | |
The Bank of New York Mellon Corp. | | | 33,654 | | | | 1,814,960 | |
Virtus Investment Partners Inc. | | | 127 | | | | 16,250 | |
Waddell & Reed Financial Inc., Class A | | | 1,396 | | | | 25,086 | |
Westwood Holdings Group Inc. | | | 172 | | | | 10,241 | |
WisdomTree Investments Inc. | | | 1,977 | | | | 17,951 | |
| | | | | | | 8,712,039 | |
Auto Parts & Equipment – 0.0% * | |
American Axle & Manufacturing Holdings Inc. | | | 2,083 | | | | 32,411 | (a) |
BorgWarner Inc. | | | 6,803 | | | | 293,617 | |
Cooper-Standard Holdings Inc. | | | 313 | | | | 40,900 | (a) |
Dana Inc. | | | 3,690 | | | | 74,501 | |
Dorman Products Inc. | | | 503 | | | | 34,360 | (a) |
Fox Factory Holding Corp. | | | 664 | | | | 30,909 | (a) |
Gentex Corp. | | | 1,832 | | | | 42,173 | |
Gentherm Inc. | | | 694 | | | | 27,274 | (a) |
LCI Industries | | | 432 | | | | 38,945 | |
Modine Manufacturing Co. | | | 946 | | | | 17,264 | (a) |
Motorcar Parts of America Inc. | | | 367 | | | | 6,866 | (a) |
Shiloh Industries Inc. | | | 381 | | | | 3,315 | (a) |
Standard Motor Products Inc. | | | 399 | | | | 19,288 | |
Stoneridge Inc. | | | 528 | | | | 18,554 | (a) |
Superior Industries International Inc. | | | 503 | | | | 9,004 | |
Tenneco Inc. | | | 948 | | | | 41,674 | |
Tower International Inc. | | | 306 | | | | 9,731 | |
| | | | | | | 740,786 | |
Automobile Manufacturers – 0.2% | |
Ford Motor Co. | | | 131,410 | | | | 1,454,709 | |
General Motors Co. | | | 41,923 | | | | 1,651,766 | |
Thor Industries Inc. | | | 329 | | | | 32,041 | |
Winnebago Industries Inc. | | | 541 | | | | 21,965 | |
| | | | | | | 3,160,481 | |
Automotive Retail – 0.1% | |
Advance Auto Parts Inc. | | | 2,329 | | | | 316,045 | |
America’s Car-Mart Inc. | | | 109 | | | | 6,747 | (a) |
Asbury Automotive Group Inc. | | | 355 | | | | 24,335 | (a) |
AutoNation Inc. | | | 396 | | | | 19,238 | (a) |
AutoZone Inc. | | | 821 | | | | 550,834 | (a) |
Camping World Holdings Inc., Class A | | | 562 | | | | 14,039 | |
CarMax Inc. | | | 5,728 | | | | 417,399 | (a) |
Carvana Co. | | | 461 | | | | 19,178 | (a) |
Group 1 Automotive Inc. | | | 357 | | | | 22,491 | |
Lithia Motors Inc., Class A | | | 441 | | | | 41,705 | |
Monro Inc. | | | 596 | | | | 34,628 | |
Murphy USA Inc. | | | 783 | | | | 58,169 | (a) |
O’Reilly Automotive Inc. | | | 2,721 | | | | 744,384 | (a) |
Sonic Automotive Inc., Class A | | | 477 | | | | 9,826 | |
| | | | | | | 2,279,018 | |
Biotechnology – 1.0% | |
AbbVie Inc. | | | 50,420 | | | | 4,671,413 | (b) |
Abeona Therapeutics Inc. | | | 457 | | | | 7,312 | (a) |
ACADIA Pharmaceuticals Inc. | | | 1,851 | | | | 28,265 | (a) |
Acceleron Pharma Inc. | | | 689 | | | | 33,430 | (a) |
Achaogen Inc. | | | 549 | | | | 4,754 | (a) |
Achillion Pharmaceuticals Inc. | | | 2,351 | | | | 6,653 | (a) |
Acorda Therapeutics Inc. | | | 735 | | | | 21,095 | (a) |
Adamas Pharmaceuticals Inc. | | | 434 | | | | 11,210 | (a) |
Aduro Biotech Inc. | | | 1,274 | | | | 8,918 | (a) |
Adverum Biotechnologies Inc. | | | 1,144 | | | | 6,063 | (a) |
Aeglea BioTherapeutics Inc. | | | 374 | | | | 3,957 | (a) |
Agenus Inc. | | | 1,467 | | | | 3,330 | (a) |
Aimmune Therapeutics Inc. | | | 818 | | | | 21,996 | (a) |
Akebia Therapeutics Inc. | | | 825 | | | | 8,234 | (a) |
Albireo Pharma Inc. | | | 191 | | | | 6,781 | (a) |
Alder Biopharmaceuticals Inc. | | | 948 | | | | 14,978 | (a) |
Aldeyra Therapeutics Inc. | | | 387 | | | | 3,077 | (a) |
Alexion Pharmaceuticals Inc. | | | 7,396 | | | | 918,213 | (a) |
Allena Pharmaceuticals Inc. | | | 273 | | | | 3,557 | (a) |
AMAG Pharmaceuticals Inc. | | | 546 | | | | 10,647 | (a) |
Amgen Inc. | | | 22,258 | | | | 4,108,604 | |
Amicus Therapeutics Inc. | | | 3,510 | | | | 54,826 | (a) |
AnaptysBio Inc. | | | 327 | | | | 23,230 | (a) |
Apellis Pharmaceuticals Inc. | | | 696 | | | | 15,312 | (a) |
Ardelyx Inc. | | | 639 | | | | 2,364 | (a) |
See Notes to Schedules of Investments and Notes to Financial Statements.
| | |
| State Street Total Return V.I.S. Fund | | |
| Schedule of Investments | | June 30, 2018 (Unaudited) |
|
| | | | | | | | |
| | | Number
of Shares | | | Fair
Value | |
Arena Pharmaceuticals Inc. | | | 866 | | | $ | 37,758 | (a) |
ArQule Inc. | | | 1,752 | | | | 9,689 | (a) |
Array BioPharma Inc. | | | 3,774 | | | | 63,328 | (a) |
Arrowhead Pharmaceuticals Inc. | | | 1,651 | | | | 22,454 | (a) |
Arsanis Inc. | | | 84 | | | | 305 | (a) |
Atara Biotherapeutics Inc. | | | 761 | | | | 27,967 | (a) |
Athenex Inc. | | | 813 | | | | 15,171 | (a) |
Athersys Inc. | | | 1,530 | | | | 3,014 | (a) |
Audentes Therapeutics Inc. | | | 606 | | | | 23,155 | (a) |
AVEO Pharmaceuticals Inc. | | | 2,222 | | | | 5,022 | (a) |
Avid Bioservices Inc. | | | 1,163 | | | | 4,559 | (a) |
Bellicum Pharmaceuticals Inc. | | | 820 | | | | 6,052 | (a) |
BioCryst Pharmaceuticals Inc. | | | 1,493 | | | | 8,555 | (a) |
Biogen Inc. | | | 7,008 | | | | 2,034,002 | (a) |
Biohaven Pharmaceutical Holding Company Ltd. | | | 445 | | | | 17,586 | (a) |
BioSpecifics Technologies Corp. | | | 109 | | | | 4,890 | (a) |
BioTime Inc. | | | 1,269 | | | | 2,614 | (a) |
Blueprint Medicines Corp. | | | 768 | | | | 48,753 | (a) |
Calithera Biosciences Inc. | | | 580 | | | | 2,900 | (a) |
Calyxt Inc. | | | 151 | | | | 2,819 | (a) |
Cara Therapeutics Inc. | | | 451 | | | | 8,637 | (a) |
CareDx Inc. | | | 643 | | | | 7,870 | (a) |
CASI Pharmaceuticals Inc. | | | 900 | | | | 7,407 | (a) |
Catalyst Pharmaceuticals Inc. | | | 1,641 | | | | 5,120 | (a) |
Celgene Corp. | | | 23,720 | | | | 1,883,842 | (a) |
Cellular Biomedicine Group Inc. | | | 258 | | | | 5,044 | (a) |
ChemoCentryx Inc. | | | 422 | | | | 5,558 | (a) |
Chimerix Inc. | | | 862 | | | | 4,103 | (a) |
Clovis Oncology Inc. | | | 819 | | | | 37,240 | (a) |
Cohbar Inc. | | | 491 | | | | 3,216 | (a) |
Coherus Biosciences Inc. | | | 910 | | | | 12,740 | (a) |
Concert Pharmaceuticals Inc. | | | 333 | | | | 5,604 | (a) |
Corbus Pharmaceuticals Holdings Inc. | | | 839 | | | | 4,237 | (a) |
Corvus Pharmaceuticals Inc. | | | 90 | | | | 988 | (a) |
CTI BioPharma Corp. | | | 1,097 | | | | 5,463 | (a) |
Cue Biopharma Inc. | | | 207 | | | | 2,455 | (a) |
Cytokinetics Inc. | | | 675 | | | | 5,603 | (a) |
CytomX Therapeutics Inc. | | | 739 | | | | 16,894 | (a) |
Deciphera Pharmaceuticals Inc. | | | 152 | | | | 5,981 | (a) |
Denali Therapeutics Inc. | | | 292 | | | | 4,453 | (a) |
Dicerna Pharmaceuticals Inc. | | | 878 | | | | 10,756 | (a) |
Dyax Corp. | | | 4,362 | | | | 10,687 | |
Dynavax Technologies Corp. | | | 1,128 | | | | 17,202 | (a) |
Eagle Pharmaceuticals Inc. | | | 202 | | | | 15,283 | (a) |
Editas Medicine Inc. | | | 855 | | | | 30,635 | (a) |
Emergent BioSolutions Inc. | | | 829 | | | | 41,856 | (a) |
Enanta Pharmaceuticals Inc. | | | 313 | | | | 36,277 | (a) |
Epizyme Inc. | | | 812 | | | | 11,003 | (a) |
Esperion Therapeutics Inc. | | | 439 | | | | 17,204 | (a) |
Exelixis Inc. | | | 1,870 | | | | 40,242 | (a) |
Fate Therapeutics Inc. | | | 709 | | | | 8,040 | (a) |
FibroGen Inc. | | | 1,330 | | | | 83,258 | (a) |
Five Prime Therapeutics Inc. | | | 541 | | | | 8,553 | (a) |
Flexion Therapeutics Inc. | | | 604 | | | | 15,613 | (a) |
Fortress Biotech Inc. | | | 629 | | | | 1,874 | (a) |
Foundation Medicine Inc. | | | 270 | | | | 36,909 | (a) |
G1 Therapeutics Inc. | | | 391 | | | | 16,993 | (a) |
Genomic Health Inc. | | | 374 | | | | 18,850 | (a) |
Geron Corp. | | | 2,688 | | | | 9,220 | (a) |
Gilead Sciences Inc. | | | 43,227 | | | | 3,062,201 | |
Global Blood Therapeutics Inc. | | | 933 | | | | 42,172 | (a) |
GlycoMimetics Inc. | | | 668 | | | | 10,775 | (a) |
Halozyme Therapeutics Inc. | | | 2,220 | | | | 37,451 | (a) |
Heron Therapeutics Inc. | | | 1,112 | | | | 43,201 | (a) |
Homology Medicines Inc. | | | 235 | | | | 4,794 | (a) |
Idera Pharmaceuticals Inc. | | | 1,813 | | | | 2,393 | (a) |
Immune Design Corp. | | | 226 | | | | 1,028 | (a) |
ImmunoGen Inc. | | | 2,423 | | | | 23,576 | (a) |
Immunomedics Inc. | | | 2,444 | | | | 57,850 | (a) |
Incyte Corp. | | | 6,100 | | | | 408,700 | (a) |
Inovio Pharmaceuticals Inc. | | | 1,336 | | | | 5,237 | (a) |
Insmed Inc. | | | 1,431 | | | | 33,843 | (a) |
Insys Therapeutics Inc. | | | 475 | | | | 3,439 | (a) |
Intellia Therapeutics Inc. | | | 636 | | | | 17,401 | (a) |
Intercept Pharmaceuticals Inc. | | | 410 | | | | 34,403 | (a) |
| | | | | | | | |
| | | Number
of Shares | | | Fair
Value | |
Intrexon Corp. | | | 1,320 | | | $ | 18,401 | (a) |
Invitae Corp. | | | 1,265 | | | | 9,298 | (a) |
Iovance Biotherapeutics Inc. | | | 1,334 | | | | 17,075 | (a) |
Ironwood Pharmaceuticals Inc. | | | 2,435 | | | | 46,557 | (a) |
Jounce Therapeutics Inc. | | | 269 | | | | 2,061 | (a) |
Kadmon Holdings Inc. | | | 1,486 | | | | 5,929 | (a) |
Karyopharm Therapeutics Inc. | | | 930 | | | | 15,801 | (a) |
Keryx Biopharmaceuticals Inc. | | | 1,588 | | | | 5,971 | (a) |
Kindred Biosciences Inc. | | | 398 | | | | 4,239 | (a) |
Kura Oncology Inc. | | | 361 | | | | 6,570 | (a) |
La Jolla Pharmaceutical Co. | | | 419 | | | | 12,222 | (a) |
Lexicon Pharmaceuticals Inc. | | | 843 | | | | 10,116 | (a) |
Ligand Pharmaceuticals Inc. | | | 387 | | | | 80,175 | (a) |
Loxo Oncology Inc. | | | 490 | | | | 85,005 | (a) |
MacroGenics Inc. | | | 640 | | | | 13,216 | (a) |
Madrigal Pharmaceuticals Inc. | | | 109 | | | | 30,486 | (a) |
MannKind Corp. | | | 2,986 | | | | 5,673 | (a) |
MediciNova Inc. | | | 593 | | | | 4,720 | (a) |
Mersana Therapeutics Inc. | | | 270 | | | | 4,822 | (a) |
MiMedx Group Inc. | | | 1,829 | | | | 11,687 | (a) |
Minerva Neurosciences Inc. | | | 371 | | | | 3,061 | (a) |
Miragen Therapeutics Inc. | | | 239 | | | | 1,532 | (a) |
Mirati Therapeutics Inc. | | | 348 | | | | 17,156 | (a) |
Momenta Pharmaceuticals Inc. | | | 1,309 | | | | 26,769 | (a) |
Myriad Genetics Inc. | | | 1,220 | | | | 45,591 | (a) |
NantKwest Inc. | | | 332 | | | | 1,016 | (a) |
Natera Inc. | | | 525 | | | | 9,881 | (a) |
NewLink Genetics Corp. | | | 438 | | | | 2,085 | (a) |
Novavax Inc. | | | 5,417 | | | | 7,259 | (a) |
OPKO Health Inc. | | | 6,066 | | | | 28,510 | (a) |
Organovo Holdings Inc. | | | 1,876 | | | | 2,626 | (a) |
Palatin Technologies Inc. | | | 4,489 | | | | 4,353 | (a) |
PDL BioPharma Inc. | | | 2,959 | | | | 6,924 | (a) |
Pieris Pharmaceuticals Inc. | | | 649 | | | | 3,290 | (a) |
PolarityTE Inc. | | | 186 | | | | 4,378 | (a) |
Portola Pharmaceuticals Inc. | | | 1,210 | | | | 45,702 | (a) |
Progenics Pharmaceuticals Inc. | | | 1,405 | | | | 11,296 | (a) |
PTC Therapeutics Inc. | | | 845 | | | | 28,502 | (a) |
Puma Biotechnology Inc. | | | 520 | | | | 30,758 | (a) |
Ra Pharmaceuticals Inc. | | | 158 | | | | 1,572 | (a) |
Radius Health Inc. | | | 721 | | | | 21,248 | (a) |
Recro Pharma Inc. | | | 253 | | | | 1,270 | (a) |
Regeneron Pharmaceuticals Inc. | | | 2,612 | | | | 901,114 | (a) |
REGENXBIO Inc. | | | 512 | | | | 36,736 | (a) |
Repligen Corp. | | | 678 | | | | 31,893 | (a) |
Retrophin Inc. | | | 726 | | | | 19,791 | (a) |
Rhythm Pharmaceuticals Inc. | | | 151 | | | | 4,720 | (a) |
Rigel Pharmaceuticals Inc. | | | 2,728 | | | | 7,720 | (a) |
Rocket Pharmaceuticals Inc. | | | 420 | | | | 8,245 | (a) |
Sangamo Therapeutics Inc. | | | 1,906 | | | | 27,065 | (a) |
Savara Inc. | | | 518 | | | | 5,864 | (a) |
Selecta Biosciences Inc. | | | 265 | | | | 3,511 | (a) |
Seres Therapeutics Inc. | | | 358 | | | | 3,079 | (a) |
Solid Biosciences Inc. | | | 164 | | | | 5,843 | (a) |
Sorrento Therapeutics Inc. | | | 1,702 | | | | 12,254 | (a) |
Spark Therapeutics Inc. | | | 586 | | | | 48,497 | (a) |
Spectrum Pharmaceuticals Inc. | | | 1,852 | | | | 38,818 | (a) |
Spring Bank Pharmaceuticals Inc. | | | 262 | | | | 3,105 | (a) |
Stemline Therapeutics Inc. | | | 529 | | | | 8,490 | (a) |
Syndax Pharmaceuticals Inc. | | | 130 | | | | 913 | (a) |
Synergy Pharmaceuticals Inc. | | | 4,284 | | | | 7,454 | (a) |
Synlogic Inc. | | | 369 | | | | 3,627 | (a) |
Syros Pharmaceuticals Inc. | | | 278 | | | | 2,838 | (a) |
T2 Biosystems Inc. | | | 557 | | | | 4,311 | (a) |
TG Therapeutics Inc. | | | 947 | | | | 12,453 | (a) |
Tocagen Inc. | | | 328 | | | | 3,064 | (a) |
Tyme Technologies Inc. | | | 1,007 | | | | 3,182 | (a) |
Ultragenyx Pharmaceutical Inc. | | | 870 | | | | 66,877 | (a) |
United Therapeutics Corp. | | | 287 | | | | 32,474 | (a) |
Vanda Pharmaceuticals Inc. | | | 982 | | | | 18,707 | (a) |
Veracyte Inc. | | | 223 | | | | 2,083 | (a) |
Verastem Inc. | | | 1,062 | | | | 7,307 | (a) |
Vericel Corp. | | | 741 | | | | 7,188 | (a) |
Vertex Pharmaceuticals Inc. | | | 8,554 | | | | 1,453,838 | (a) |
Viking Therapeutics Inc. | | | 862 | | | | 8,180 | (a) |
Vital Therapies Inc. | | | 696 | | | | 4,768 | (a) |
See Notes to Schedules of Investments and Notes to Financial Statements.
| | |
| State Street Total Return V.I.S. Fund | | |
| Schedule of Investments | | June 30, 2018 (Unaudited) |
|
| | | | | | | | |
| | | Number
of Shares | | | Fair
Value | |
Voyager Therapeutics Inc. | | | 431 | | | $ | 8,422 | (a) |
Xencor Inc. | | | 866 | | | | 32,051 | (a) |
Zafgen Inc. | | | 528 | | | | 5,401 | (a) |
ZIOPHARM Oncology Inc. | | | 2,449 | | | | 7,396 | (a) |
| | | | | | | 22,144,268 | |
Brewers – 0.0% * | |
Craft Brew Alliance Inc. | | | 250 | | | | 5,163 | (a) |
Molson Coors Brewing Co., Class B | | | 6,369 | | | | 433,347 | |
The Boston Beer Company Inc., Class A | | | 212 | | | | 63,536 | (a) |
| | | | | | | 502,046 | |
Broadcasting – 0.1% | |
AMC Networks Inc., Class A | | | 304 | | | | 18,909 | (a) |
CBS Corp., Class B | | | 11,553 | | | | 649,510 | |
Discovery Inc., Class A | | | 5,819 | | | | 160,023 | (a) |
Discovery Inc., Class C | | | 10,531 | | | | 268,540 | (a) |
Entercom Communications Corp., Class A | | | 2,426 | | | | 18,316 | |
Entravision Communications Corp., Class A | | | 1,320 | | | | 6,600 | |
Gray Television Inc. | | | 1,455 | | | | 22,989 | (a) |
Hemisphere Media Group Inc. | | | 394 | | | | 5,161 | (a) |
Media General Inc. | | | 2,076 | | | | 208 | |
Nexstar Media Group Inc. | | | 830 | | | | 60,922 | |
Saga Communications Inc., Class A | | | 76 | | | | 2,926 | |
Sinclair Broadcast Group Inc., Class A | | | 1,343 | | | | 43,177 | |
TEGNA Inc. | | | 5,531 | | | | 60,011 | |
The EW Scripps Co., Class A | | | 743 | | | | 9,949 | |
| | | | | | | 1,327,241 | |
Building Products – 0.1% | |
AAON Inc. | | | 717 | | | | 23,840 | |
Advanced Drainage Systems Inc. | | | 840 | | | | 23,982 | |
American Woodmark Corp. | | | 265 | | | | 24,261 | (a) |
AO Smith Corp. | | | 5,000 | | | | 295,750 | |
Apogee Enterprises Inc. | | | 458 | | | | 22,062 | |
Armstrong Flooring Inc. | | | 247 | | | | 3,468 | (a) |
Builders FirstSource Inc. | | | 2,025 | | | | 37,037 | (a) |
Continental Building Products Inc. | | | 708 | | | | 22,337 | (a) |
CSW Industrials Inc. | | | 290 | | | | 15,327 | (a) |
Fortune Brands Home & Security Inc. | | | 5,069 | | | | 272,155 | |
Gibraltar Industries Inc. | | | 527 | | | | 19,762 | (a) |
Griffon Corp. | | | 440 | | | | 7,832 | |
Insteel Industries Inc. | | | 351 | | | | 11,723 | |
JELD-WEN Holding Inc. | | | 1,254 | | | | 35,852 | (a) |
Johnson Controls International PLC | | | 31,052 | | | | 1,038,689 | |
Lennox International Inc. | | | 249 | | | | 49,837 | |
Masco Corp. | | | 10,423 | | | | 390,029 | |
Masonite International Corp. | | | 512 | | | | 36,787 | (a) |
NCI Building Systems Inc. | | | 800 | | | | 16,800 | (a) |
Patrick Industries Inc. | | | 435 | | | | 24,730 | (a) |
PGT Innovations Inc. | | | 834 | | | | 17,389 | (a) |
Quanex Building Products Corp. | | | 689 | | | | 12,368 | |
Simpson Manufacturing Company Inc. | | | 719 | | | | 44,715 | |
Trex Company Inc. | | | 1,094 | | | | 68,473 | (a) |
Universal Forest Products Inc. | | | 1,118 | | | | 40,941 | |
| | | | | | | 2,556,146 | |
Cable & Satellite – 0.3% | |
Altice USA Inc., Class A | | | 5,334 | | | | 90,999 | |
Cable One Inc. | | | 32 | | | | 23,465 | |
Charter Communications Inc., Class A | | | 6,179 | | | | 1,811,745 | (a) |
Comcast Corp., Class A | | | 152,989 | | | | 5,019,569 | |
DISH Network Corp., Class A | | | 7,700 | | | | 258,797 | (a) |
Loral Space & Communications Inc. | | | 261 | | | | 9,814 | (a) |
MSG Networks Inc., Class A | | | 1,142 | | | | 27,351 | (a) |
WideOpenWest Inc. | | | 393 | | | | 3,796 | (a) |
| | | | | | | 7,245,536 | |
Casinos & Gaming – 0.1% | |
Boyd Gaming Corp. | | | 2,066 | | | | 71,607 | |
Century Casinos Inc. | | | 441 | | | | 3,859 | (a) |
Churchill Downs Inc. | | | 292 | | | | 86,578 | |
Eldorado Resorts Inc. | | | 1,223 | | | | 47,819 | (a) |
Empire Resorts Inc. | | | 39 | | | | 772 | (a) |
Golden Entertainment Inc. | | | 334 | | | | 9,015 | (a) |
MGM Resorts International | | | 16,800 | | | | 487,704 | |
Monarch Casino & Resort Inc. | | | 216 | | | | 9,515 | (a) |
| | | | | | | | |
| | | Number
of Shares | | | Fair
Value | |
Penn National Gaming Inc. | | | 1,494 | | | $ | 50,183 | (a) |
Pinnacle Entertainment Inc. | | | 938 | | | | 31,639 | (a) |
PlayAGS Inc. | | | 224 | | | | 6,064 | (a) |
Red Rock Resorts Inc., Class A | | | 1,295 | | | | 43,382 | |
Scientific Games Corp., Class A | | | 1,371 | | | | 67,385 | (a) |
Wynn Resorts Ltd. | | | 2,687 | | | | 449,643 | |
| | | | | | | 1,365,165 | |
Coal & Consumable Fuels – 0.0% * | |
Arch Coal Inc., Class A | | | 353 | | | | 27,686 | |
Cloud Peak Energy Inc. | | | 1,400 | | | | 4,886 | (a) |
CONSOL Energy Inc. | | | 533 | | | | 20,440 | (a) |
NACCO Industries Inc., Class A | | | 76 | | | | 2,565 | |
Peabody Energy Corp. | | | 1,495 | | | | 67,993 | |
| | | | | | | 123,570 | |
Commercial Printing – 0.0% * | |
Brady Corp., Class A | | | 879 | | | | 33,885 | |
Deluxe Corp. | | | 1,203 | | | | 79,651 | |
Ennis Inc. | | | 346 | | | | 7,041 | |
LSC Communications Inc. | | | 633 | | | | 9,913 | |
Multi-Color Corp. | | | 226 | | | | 14,611 | |
Quad/Graphics Inc. | | | 579 | | | | 12,061 | |
RR Donnelley & Sons Co. | | | 1,328 | | | | 7,649 | |
| | | | | | | 164,811 | |
Commodity Chemicals – 0.1% | |
AdvanSix Inc. | | | 567 | | | | 20,769 | (a) |
Cabot Corp. | | | 402 | | | | 24,832 | |
Hawkins Inc. | | | 192 | | | | 6,787 | |
Koppers Holdings Inc. | | | 330 | | | | 12,655 | (a) |
Kronos Worldwide Inc. | | | 464 | | | | 10,454 | |
LyondellBasell Industries N.V., Class A | | | 10,865 | | | | 1,193,520 | |
Olin Corp. | | | 1,126 | | | | 32,339 | |
Trecora Resources | | | 399 | | | | 5,925 | (a) |
Tredegar Corp. | | | 513 | | | | 12,056 | |
Trinseo S.A. | | | 805 | | | | 57,115 | |
Tronox Ltd., Class A | | | 1,754 | | | | 34,519 | |
Valvoline Inc. | | | 1,302 | | | | 28,084 | |
| | | | | | | 1,439,055 | |
Communications Equipment – 0.4% | |
Acacia Communications Inc. | | | 524 | | | | 18,240 | (a) |
ADTRAN Inc. | | | 867 | | | | 12,875 | |
Aerohive Networks Inc. | | | 476 | | | | 1,890 | (a) |
Applied Optoelectronics Inc. | | | 335 | | | | 15,042 | (a) |
CalAmp Corp. | | | 560 | | | | 13,121 | (a) |
Calix Inc. | | | 830 | | | | 6,474 | (a) |
Casa Systems Inc. | | | 151 | | | | 2,466 | (a) |
Ciena Corp. | | | 3,625 | | | | 96,099 | (a) |
Cisco Systems Inc. | | | 156,534 | | | | 6,735,658 | |
Clearfield Inc. | | | 229 | | | | 2,530 | (a) |
Comtech Telecommunications Corp. | | | 451 | | | | 14,378 | |
Digi International Inc. | | | 520 | | | | 6,864 | (a) |
Extreme Networks Inc. | | | 2,073 | | | | 16,501 | (a) |
F5 Networks Inc. | | | 2,012 | | | | 346,969 | (a) |
Finisar Corp. | | | 2,042 | | | | 36,756 | (a) |
Harmonic Inc. | | | 1,543 | | | | 6,558 | (a) |
Infinera Corp. | | | 2,600 | | | | 25,818 | (a) |
InterDigital Inc. | | | 872 | | | | 70,545 | |
Juniper Networks Inc. | | | 10,903 | | | | 298,960 | |
KVH Industries Inc. | | | 306 | | | | 4,100 | (a) |
Lumentum Holdings Inc. | | | 1,574 | | | | 91,135 | (a) |
Motorola Solutions Inc. | | | 5,434 | | | | 632,355 | |
NETGEAR Inc. | | | 584 | | | | 36,500 | (a) |
NetScout Systems Inc. | | | 2,097 | | | | 62,281 | (a) |
Oclaro Inc. | | | 3,137 | | | | 28,013 | (a) |
Plantronics Inc. | | | 809 | | | | 61,686 | |
Quantenna Communications Inc. | | | 658 | | | | 10,225 | (a) |
Ribbon Communications Inc. | | | 960 | | | | 6,835 | (a) |
ViaSat Inc. | | | 1,381 | | | | 90,759 | (a) |
Viavi Solutions Inc. | | | 4,240 | | | | 43,418 | (a) |
| | | | | | | 8,795,051 | |
Computer & Electronics Retail – 0.0% * | |
Best Buy Company Inc. | | | 8,168 | | | | 609,170 | |
Conn’s Inc. | | | 296 | | | | 9,768 | (a) |
GameStop Corp., Class A | | | 1,888 | | | | 27,508 | |
Rent-A-Center Inc. | | | 811 | | | | 11,938 | |
| | | | | | | 658,384 | |
See Notes to Schedules of Investments and Notes to Financial Statements.
| | |
| State Street Total Return V.I.S. Fund | | |
| Schedule of Investments | | June 30, 2018 (Unaudited) |
|
| | | | | | | | |
| | | Number
of Shares | | | Fair
Value | |
Construction & Engineering – 0.1% | |
AECOM | | | 1,061 | | | $ | 35,045 | (a) |
Aegion Corp. | | | 574 | | | | 14,781 | (a) |
Ameresco Inc., Class A | | | 412 | | | | 4,944 | (a) |
Argan Inc. | | | 270 | | | | 11,057 | |
Comfort Systems USA Inc. | | | 638 | | | | 29,220 | |
Dycom Industries Inc. | | | 765 | | | | 72,300 | (a) |
EMCOR Group Inc. | | | 1,457 | | | | 110,994 | |
Fluor Corp. | | | 4,533 | | | | 221,120 | |
Granite Construction Inc. | | | 1,134 | | | | 63,118 | |
Great Lakes Dredge & Dock Corp. | | | 1,192 | | | | 6,258 | (a) |
HC2 Holdings Inc. | | | 645 | | | | 3,773 | (a) |
IES Holdings Inc. | | | 156 | | | | 2,613 | (a) |
Infrastructure and Energy Alternatives Inc. | | | 406 | | | | 3,780 | (a) |
Jacobs Engineering Group Inc. | | | 3,790 | | | | 240,627 | |
KBR Inc. | | | 3,553 | | | | 63,670 | |
MasTec Inc. | | | 1,201 | | | | 60,951 | (a) |
MYR Group Inc. | | | 279 | | | | 9,893 | (a) |
Northwest Pipe Co. | | | 217 | | | | 4,203 | (a) |
NV5 Global Inc. | | | 147 | | | | 10,187 | (a) |
Orion Group Holdings Inc. | | | 522 | | | | 4,312 | (a) |
Primoris Services Corp. | | | 677 | | | | 18,435 | |
Quanta Services Inc. | | | 4,428 | | | | 147,895 | (a) |
Sterling Construction Company Inc. | | | 489 | | | | 6,372 | (a) |
Tutor Perini Corp. | | | 630 | | | | 11,624 | (a) |
Valmont Industries Inc. | | | 151 | | | | 22,763 | |
Willscot Corp. | | | 663 | | | | 9,812 | (a) |
| | | | | | | 1,189,747 | |
Construction Machinery & Heavy Trucks – 0.2% | |
Alamo Group Inc. | | | 157 | | | | 14,187 | |
American Railcar Industries Inc. | | | 157 | | | | 6,198 | |
Astec Industries Inc. | | | 387 | | | | 23,143 | |
Blue Bird Corp. | | | 305 | | | | 6,817 | (a) |
Caterpillar Inc. | | | 19,915 | | | | 2,701,868 | |
Commercial Vehicle Group Inc. | | | 566 | | | | 4,154 | (a) |
Cummins Inc. | | | 5,086 | | | | 676,438 | |
Douglas Dynamics Inc. | | | 355 | | | | 17,040 | |
Federal Signal Corp. | | | 1,052 | | | | 24,501 | |
FreightCar America Inc. | | | 248 | | | | 4,164 | |
Manitex International Inc. | | | 335 | | | | 4,181 | (a) |
Meritor Inc. | | | 1,578 | | | | 32,459 | (a) |
Miller Industries Inc. | | | 220 | | | | 5,621 | |
Navistar International Corp. | | | 919 | | | | 37,422 | (a) |
Oshkosh Corp. | | | 489 | | | | 34,386 | |
PACCAR Inc. | | | 12,047 | | | | 746,432 | |
REV Group Inc. | | | 422 | | | | 7,178 | |
Spartan Motors Inc. | | | 666 | | | | 10,057 | |
Terex Corp. | | | 490 | | | | 20,673 | |
The Greenbrier Companies Inc. | | | 595 | | | | 31,386 | |
The Manitowoc Company Inc. | | | 678 | | | | 17,533 | (a) |
Trinity Industries Inc. | | | 995 | | | | 34,089 | |
Twin Disc Inc. | | | 199 | | | | 4,939 | (a) |
Wabash National Corp. | | | 1,098 | | | | 20,489 | |
Wabtec Corp. | | | 568 | | | | 55,993 | |
| | | | | | | 4,541,348 | |
Construction Materials – 0.1% | |
Eagle Materials Inc. | | | 321 | | | | 33,695 | |
Forterra Inc. | | | 361 | | | | 3,513 | (a) |
Martin Marietta Materials Inc. | | | 2,155 | | | | 481,276 | |
Summit Materials Inc., Class A | | | 2,080 | | | | 54,600 | (a) |
United States Lime & Minerals Inc. | | | 38 | | | | 3,188 | |
US Concrete Inc. | | | 286 | | | | 15,015 | (a) |
Vulcan Materials Co. | | | 4,476 | | | | 577,673 | |
| | | | 1,168,960 | |
Consumer Electronics – 0.0% * | |
GoPro Inc., Class A | | | 2,032 | | | | 13,086 | (a) |
Roku Inc. | | | 811 | | | | 34,565 | (a) |
Turtle Beach Corp. | | | 180 | | | | 3,658 | (a) |
Universal Electronics Inc. | | | 262 | | | | 8,659 | (a) |
Vuzix Corp. | | | 548 | | | | 4,082 | (a) |
ZAGG Inc. | | | 406 | | | | 7,024 | (a) |
| | | | | | | 71,074 | |
Consumer Finance – 0.3% | |
American Express Co. | | | 23,985 | | | | 2,350,530 | |
| | | | | | | | |
| | | Number
of Shares | | | Fair
Value | |
Capital One Financial Corp. | | | 16,175 | | | $ | 1,486,483 | |
Curo Group Holdings Corp. | | | 156 | | | | 3,892 | (a) |
Discover Financial Services | | | 11,682 | | | | 822,530 | |
Elevate Credit Inc. | | | 468 | | | | 3,959 | (a) |
Encore Capital Group Inc. | | | 433 | | | | 15,848 | (a) |
Enova International Inc. | | | 538 | | | | 19,664 | (a) |
EZCORP Inc., Class A | | | 762 | | | | 9,182 | (a) |
FirstCash Inc. | | | 823 | | | | 73,947 | |
Green Dot Corp., Class A | | | 883 | | | | 64,803 | (a) |
LendingClub Corp. | | | 5,689 | | | | 21,561 | (a) |
Navient Corp. | | | 1,746 | | | | 22,750 | |
Nelnet Inc., Class A | | | 339 | | | | 19,801 | |
PRA Group Inc. | | | 810 | | | | 31,226 | (a) |
Regional Management Corp. | | | 114 | | | | 3,992 | (a) |
SLM Corp. | | | 2,853 | | | | 32,667 | (a) |
Synchrony Financial | | | 24,021 | | | | 801,821 | |
World Acceptance Corp. | | | 119 | | | | 13,210 | (a) |
| | | | | | | 5,797,866 | |
Copper – 0.0% * | |
Freeport-McMoRan Inc. | | | 44,048 | | | | 760,268 | |
Southern Copper Corp. | | | 1,879 | | | | 88,069 | |
| | | | | | | 848,337 | |
Data Processing & Outsourced Services – 1.2% | |
Alliance Data Systems Corp. | | | 1,559 | | | | 363,559 | |
Automatic Data Processing Inc. | | | 14,821 | | | | 1,988,089 | |
Broadridge Financial Solutions Inc. | | | 4,000 | | | | 460,400 | |
Cardtronics PLC, Class A | | | 646 | | | | 15,620 | (a) |
Cass Information Systems Inc. | | | 190 | | | | 13,076 | |
Convergys Corp. | | | 2,319 | | | | 56,676 | |
CoreLogic Inc. | | | 546 | | | | 28,337 | (a) |
CSG Systems International Inc. | | | 587 | | | | 23,991 | |
Everi Holdings Inc. | | | 1,206 | | | | 8,683 | (a) |
Exela Technologies Inc. | | | 1,027 | | | | 4,878 | (a) |
ExlService Holdings Inc. | | | 597 | | | | 33,796 | (a) |
Fidelity National Information Services Inc. | | | 11,178 | | | | 1,185,203 | |
Fiserv Inc. | | | 13,886 | | | | 1,028,814 | (a) |
FleetCor Technologies Inc. | | | 3,000 | | | | 631,950 | (a) |
Global Payments Inc. | | | 5,303 | | | | 591,231 | |
Information Services Group Inc. | | | 600 | | | | 2,460 | (a) |
Jack Henry & Associates Inc. | | | 517 | | | | 67,396 | |
Mastercard Inc., Class A | | | 30,552 | | | | 6,004,079 | |
MAXIMUS Inc. | | | 1,640 | | | | 101,860 | |
MoneyGram International Inc. | | | 597 | | | | 3,994 | (a) |
Paychex Inc. | | | 10,862 | | | | 742,418 | |
PayPal Holdings Inc. | | | 37,413 | | | | 3,115,381 | (a) |
PRGX Global Inc. | | | 471 | | | | 4,569 | (a) |
Sabre Corp. | | | 1,699 | | | | 41,863 | |
Sykes Enterprises Inc. | | | 653 | | | | 18,793 | (a) |
Syntel Inc. | | | 641 | | | | 20,570 | (a) |
The Western Union Co. | | | 15,645 | | | | 318,063 | |
Total System Services Inc. | | | 5,581 | | | | 471,706 | |
TTEC Holdings Inc. | | | 263 | | | | 9,087 | |
Visa Inc., Class A | | | 59,457 | | | | 7,875,080 | |
WEX Inc. | | | 264 | | | | 50,287 | (a) |
| | | | | | | 25,281,909 | |
Department Stores – 0.1% | |
Dillard’s Inc., Class A | | | 318 | | | | 30,051 | |
JC Penney Company Inc. | | | 5,875 | | | | 13,748 | (a) |
Kohl’s Corp. | | | 5,518 | | | | 402,262 | |
Macy’s Inc. | | | 10,075 | | | | 377,107 | |
Nordstrom Inc. | | | 4,154 | | | | 215,094 | |
Sears Holdings Corp. | | | 223 | | | | 529 | (a) |
| | | | | | | 1,038,791 | |
Distillers & Vintners – 0.1% | |
Brown-Forman Corp., Class B | | | 8,307 | | | | 407,126 | |
Constellation Brands Inc., Class A | | | 5,508 | | | | 1,205,536 | |
MGP Ingredients Inc. | | | 249 | | | | 22,114 | |
| | | | | | | 1,634,776 | |
Distributors – 0.0% * | |
Core-Mark Holding Company Inc. | | | 820 | | | | 18,614 | |
Genuine Parts Co. | | | 5,037 | | | | 462,346 | |
LKQ Corp. | | | 10,450 | | | | 333,355 | (a) |
Pool Corp. | | | 268 | | | | 40,602 | |
Weyco Group Inc. | | | 129 | | | | 4,696 | |
| | | | 859,613 | |
See Notes to Schedules of Investments and Notes to Financial Statements.
| | |
| State Street Total Return V.I.S. Fund | | |
| Schedule of Investments | | June 30, 2018 (Unaudited) |
|
| | | | | | | | |
| | | Number
of Shares | | | Fair
Value | |
Diversified Banks – 1.7% | |
Bank of America Corp. | | | 314,098 | | | $ | 8,854,423 | |
Citigroup Inc. | | | 84,832 | | | | 5,676,957 | |
JPMorgan Chase & Co. | | | 113,478 | | | | 11,824,408 | |
U.S. Bancorp | | | 52,311 | | | | 2,616,596 | |
Wells Fargo & Co. | | | 146,606 | | | | 8,127,837 | |
| | | | 37,100,221 | |
Diversified Chemicals – 0.3% | |
DowDuPont Inc. | | | 77,254 | | | | 5,092,584 | |
Eastman Chemical Co. | | | 4,668 | | | | 466,613 | |
LSB Industries Inc. | | | 420 | | | | 2,226 | (a) |
The Chemours Co. | | | 1,175 | | | | 52,123 | |
| | | | 5,613,546 | |
Diversified Metals & Mining – 0.0% * | |
Compass Minerals International Inc. | | | 814 | | | | 53,520 | |
Materion Corp. | | | 358 | | | | 19,386 | |
| | | | 72,906 | |
Diversified Real Estate Activities – 0.0% * | |
Consolidated-Tomoka Land Co. | | | 80 | | | | 4,921 | |
Tejon Ranch Co. | | | 336 | | | | 8,165 | (a) |
The RMR Group Inc., Class A | | | 135 | | | | 10,591 | |
The St Joe Co. | | | 605 | | | | 10,859 | (a) |
| | | | 34,536 | |
Diversified REITs – 0.0% * | |
Alexander & Baldwin Inc. | | | 1,707 | | | | 40,115 | |
American Assets Trust Inc. | | | 670 | | | | 25,654 | |
Armada Hoffler Properties Inc. | | | 847 | | | | 12,620 | |
Gladstone Commercial Corp. | | | 448 | | | | 8,611 | |
Global Net Lease Inc. | | | 1,288 | | | | 26,314 | |
iStar Inc. | | | 1,279 | | | | 13,800 | (a) |
Lexington Realty Trust | | | 4,034 | | | | 35,217 | |
Liberty Property Trust | | | 970 | | | | 43,000 | |
One Liberty Properties Inc. | | | 273 | | | | 7,210 | |
PS Business Parks Inc. | | | 371 | | | | 47,673 | |
Washington Real Estate Investment Trust | | | 1,402 | | | | 42,523 | |
| | | | 302,737 | |
Diversified Support Services – 0.1% | |
Cintas Corp. | | | 2,869 | | | | 530,966 | |
Copart Inc. | | | 6,700 | | | | 378,952 | (a) |
Healthcare Services Group Inc. | | | 1,857 | | | | 80,204 | |
Matthews International Corp., Class A | | | 585 | | | | 34,398 | |
McGrath RentCorp. | | | 454 | | | | 28,725 | |
Mobile Mini Inc. | | | 792 | | | | 37,145 | |
UniFirst Corp. | | | 283 | | | | 50,063 | |
Viad Corp. | | | 374 | | | | 20,289 | |
VSE Corp. | | | 166 | | | | 7,931 | |
| | | | 1,168,673 | |
Drug Retail – 0.1% | |
Rite Aid Corp. | | | 19,677 | | | | 34,041 | (a) |
Walgreens Boots Alliance Inc. | | | 28,463 | | | | 1,708,207 | |
| | | | 1,742,248 | |
Education Services – 0.0% * | |
Adtalem Global Education Inc. | | | 1,503 | | | | 72,294 | (a) |
American Public Education Inc. | | | 312 | | | | 13,135 | (a) |
Cambium Learning Group Inc. | | | 198 | | | | 2,208 | (a) |
Capella Education Co. | | | 199 | | | | 19,641 | |
Career Education Corp. | | | 1,167 | | | | 18,871 | (a) |
Chegg Inc. | | | 1,974 | | | | 54,858 | (a) |
Graham Holdings Co.,
Class B | | | 30 | | | | 17,583 | |
Houghton Mifflin Harcourt Co. | | | 1,959 | | | | 14,986 | (a) |
K12 Inc. | | | 679 | | | | 11,115 | (a) |
Laureate Education Inc., Class A | | | 787 | | | | 11,278 | (a) |
Strayer Education Inc. | | | 197 | | | | 22,263 | |
| | | | 258,232 | |
Electric Utilities – 0.7% | |
ALLETE Inc. | | | 1,292 | | | | 100,014 | |
Alliant Energy Corp. | | | 7,871 | | | | 333,101 | |
American Electric Power Company Inc. | | | 16,632 | | | | 1,151,766 | |
Duke Energy Corp. | | | 23,344 | | | | 1,846,043 | |
Edison International | | | 11,028 | | | | 697,742 | |
| | | | | | | | |
| | | Number
of Shares | | | Fair
Value | |
El Paso Electric Co. | | | 755 | | | $ | 44,620 | |
Entergy Corp. | | | 6,194 | | | | 500,413 | |
Evergy Inc. | | | 9,100 | | | | 510,965 | |
Eversource Energy | | | 10,833 | | | | 634,922 | |
Exelon Corp. | | | 31,816 | | | | 1,355,362 | |
FirstEnergy Corp. | | | 15,322 | | | | 550,213 | |
Hawaiian Electric Industries Inc. | | | 741 | | | | 25,416 | |
IDACORP Inc. | | | 1,267 | | | | 116,868 | |
MGE Energy Inc. | | | 652 | | | | 41,109 | |
NextEra Energy Inc. | | | 15,681 | | | | 2,619,197 | |
OGE Energy Corp. | | | 1,312 | | | | 46,196 | |
Otter Tail Corp. | | | 715 | | | | 34,034 | |
PG&E Corp. | | | 16,835 | | | | 716,498 | |
Pinnacle West Capital Corp. | | | 3,526 | | | | 284,055 | |
PNM Resources Inc. | | | 2,014 | | | | 78,345 | |
Portland General Electric Co. | | | 1,656 | | | | 70,811 | |
PPL Corp. | | | 23,637 | | | | 674,836 | |
Spark Energy Inc., Class A | | | 198 | | | | 1,930 | |
The Southern Co. | | | 33,536 | | | | 1,553,052 | |
Xcel Energy Inc. | | | 16,933 | | | | 773,499 | |
| | | | 14,761,007 | |
Electrical Components & Equipment – 0.2% | |
Acuity Brands Inc. | | | 268 | | | | 31,053 | |
Allied Motion Technologies Inc. | | | 124 | | | | 5,937 | |
AMETEK Inc. | | | 7,523 | | | | 542,860 | |
Atkore International Group Inc. | | | 621 | | | | 12,898 | (a) |
Eaton Corporation PLC | | | 14,455 | | | | 1,080,367 | |
Emerson Electric Co. | | | 21,095 | | | | 1,458,508 | |
Encore Wire Corp. | | | 333 | | | | 15,801 | |
Energous Corp. | | | 298 | | | | 4,419 | (a) |
EnerSys | | | 1,067 | | | | 79,641 | |
Enphase Energy Inc. | | | 1,717 | | | | 11,555 | (a) |
Generac Holdings Inc. | | | 1,125 | | | | 58,196 | (a) |
Hubbell Inc. | | | 372 | | | | 39,335 | |
Plug Power Inc. | | | 3,634 | | | | 7,341 | (a) |
Powell Industries Inc. | | | 173 | | | | 6,026 | |
Preformed Line Products Co. | | | 47 | | | | 4,173 | |
Regal Beloit Corp. | | | 300 | | | | 24,540 | |
Rockwell Automation Inc. | | | 4,249 | | | | 706,311 | |
Sunrun Inc. | | | 1,606 | | | | 21,119 | (a) |
Thermon Group Holdings Inc. | | | 503 | | | | 11,504 | (a) |
Vicor Corp. | | | 332 | | | | 14,459 | (a) |
Vivint Solar Inc. | | | 358 | | | | 1,772 | (a) |
| | | | 4,137,815 | |
Electronic Components – 0.1% | |
Amphenol Corp., Class A | | | 9,808 | | | | 854,767 | |
AVX Corp. | | | 790 | | | | 12,379 | |
Bel Fuse Inc., Class B | | | 184 | | | | 3,846 | |
Belden Inc. | | | 1,014 | | | | 61,976 | |
Corning Inc. | | | 27,793 | | | | 764,585 | |
II-VI Inc. | | | 1,148 | | | | 49,881 | (a) |
Knowles Corp. | | | 1,530 | | | | 23,409 | (a) |
Littelfuse Inc. | | | 165 | | | | 37,650 | |
Rogers Corp. | | | 324 | | | | 36,113 | (a) |
Vishay Intertechnology Inc. | | | 3,335 | | | | 77,372 | |
| | | | 1,921,978 | |
Electronic Equipment & Instruments – 0.0% * | |
Badger Meter Inc. | | | 504 | | | | 22,529 | |
Cognex Corp. | | | 1,154 | | | | 51,480 | |
Coherent Inc. | | | 164 | | | | 25,653 | (a) |
Control4 Corp. | | | 403 | | | | 9,797 | (a) |
Daktronics Inc. | | | 742 | | | | 6,314 | |
Electro Scientific Industries Inc. | | | 523 | | | | 8,248 | (a) |
FARO Technologies Inc. | | | 266 | | | | 14,457 | (a) |
Fitbit Inc., Class A | | | 3,895 | | | | 25,434 | (a) |
FLIR Systems Inc. | | | 4,785 | | | | 248,676 | |
Iteris Inc. | | | 554 | | | | 2,681 | (a) |
Itron Inc. | | | 634 | | | | 38,072 | (a) |
Keysight Technologies Inc. | | | 1,234 | | | | 72,843 | (a) |
Mesa Laboratories Inc. | | | 60 | | | | 12,665 | |
MTS Systems Corp. | | | 335 | | | | 17,638 | |
Napco Security Technologies Inc. | | | 280 | | | | 4,102 | (a) |
National Instruments Corp. | | | 714 | | | | 29,974 | |
nLight Inc. | | | 149 | | | | 4,926 | (a) |
Novanta Inc. | | | 611 | | | | 38,065 | (a) |
OSI Systems Inc. | | | 314 | | | | 24,282 | (a) |
See Notes to Schedules of Investments and Notes to Financial Statements.
| | |
| State Street Total Return V.I.S. Fund | | |
| Schedule of Investments | | June 30, 2018 (Unaudited) |
|
| | | | | | | | |
| | | Number
of Shares | | | Fair Value | |
PAR Technology Corp. | | | 262 | | | $ | 4,632 | (a) |
Trimble Inc. | | | 1,681 | | | | 55,204 | (a) |
VeriFone Systems Inc. | | | 2,682 | | | | 61,203 | (a) |
Vishay Precision Group Inc. | | | 158 | | | | 6,028 | (a) |
Zebra Technologies Corp., Class A | | | 354 | | | | 50,710 | (a) |
| | | | 835,613 | |
Electronic Manufacturing Services – 0.0% * | |
Benchmark Electronics Inc. | | | 900 | | | | 26,235 | |
CTS Corp. | | | 622 | | | | 22,392 | |
IPG Photonics Corp. | | | 1,300 | | | | 286,819 | (a) |
Jabil Inc. | | | 1,151 | | | | 31,837 | |
KEMET Corp. | | | 999 | | | | 24,126 | (a) |
Kimball Electronics Inc. | | | 360 | | | | 6,588 | (a) |
Maxwell Technologies Inc. | | | 632 | | | | 3,286 | (a) |
Methode Electronics Inc. | | | 630 | | | | 25,389 | |
Park Electrochemical Corp. | | | 391 | | | | 9,067 | |
Plexus Corp. | | | 611 | | | | 36,379 | (a) |
Sanmina Corp. | | | 1,266 | | | | 37,094 | (a) |
TTM Technologies Inc. | | | 1,758 | | | | 30,993 | (a) |
| | | | 540,205 | |
Environmental & Facilities Services – 0.1% | |
ABM Industries Inc. | | | 1,237 | | | | 36,096 | |
Advanced Disposal Services Inc. | | | 1,359 | | | | 33,676 | (a) |
Casella Waste Systems Inc., Class A | | | 628 | | | | 16,083 | (a) |
CECO Environmental Corp. | | | 591 | | | | 3,629 | |
Clean Harbors Inc. | | | 346 | | | | 19,220 | (a) |
Covanta Holding Corp. | | | 2,199 | | | | 36,283 | |
Heritage-Crystal Clean Inc. | | | 258 | | | | 5,186 | (a) |
Republic Services Inc. | | | 7,446 | | | | 509,009 | |
Rollins Inc. | | | 638 | | | | 33,546 | |
SP Plus Corp. | | | 435 | | | | 16,182 | (a) |
Stericycle Inc. | | | 2,942 | | | | 192,083 | (a) |
Team Inc. | | | 581 | | | | 13,421 | (a) |
Tetra Tech Inc. | | | 1,028 | | | | 60,138 | |
US Ecology Inc. | | | 367 | | | | 23,378 | |
Waste Management Inc. | | | 13,475 | | | | 1,096,056 | |
| | | | 2,093,986 | |
Fertilizers & Agricultural Chemicals – 0.1% | |
AgroFresh Solutions Inc. | | | 436 | | | | 3,056 | (a) |
American Vanguard Corp. | | | 568 | | | | 13,036 | |
CF Industries Holdings Inc. | | | 7,939 | | | | 352,492 | |
FMC Corp. | | | 4,566 | | | | 407,333 | |
Intrepid Potash Inc. | | | 1,283 | | | | 5,260 | (a) |
The Mosaic Co. | | | 11,937 | | | | 334,833 | |
The Scotts Miracle-Gro Co., Class A | | | 256 | | | | 21,289 | |
| | | | 1,137,299 | |
Financial Exchanges & Data – 0.3% | |
Cboe Global Markets Inc. | | | 3,900 | | | | 405,873 | |
CME Group Inc. | | | 11,369 | | | | 1,863,606 | |
Donnelley Financial Solutions Inc. | | | 501 | | | | 8,702 | (a) |
FactSet Research Systems Inc. | | | 260 | | | | 51,506 | |
Intercontinental Exchange Inc. | | | 19,230 | | | | 1,414,367 | |
MarketAxess Holdings Inc. | | | 252 | | | | 49,861 | |
Moody’s Corp. | | | 5,562 | | | | 948,655 | |
MSCI Inc. | | | 3,000 | | | | 496,290 | |
Nasdaq Inc. | | | 3,760 | | | | 343,175 | |
S&P Global Inc. | | | 8,408 | | | | 1,714,307 | |
| | | | 7,296,342 | |
Food Distributors – 0.1% | |
Performance Food Group Co. | | | 1,885 | | | | 69,180 | (a) |
SpartanNash Co. | | | 659 | | | | 16,818 | |
Sysco Corp. | | | 16,177 | | | | 1,104,727 | |
The Andersons Inc. | | | 466 | | | | 15,937 | |
The Chefs’ Warehouse Inc. | | | 390 | | | | 11,115 | (a) |
United Natural Foods Inc. | | | 1,238 | | | | 52,813 | (a) |
| | | | 1,270,590 | |
Food Retail – 0.0% * | |
Casey’s General Stores Inc. | | | 256 | | | | 26,900 | |
Ingles Markets Inc., Class A | | | 277 | | | | 8,809 | |
Natural Grocers by Vitamin Cottage Inc. | | | 188 | | | | 2,395 | (a) |
Smart & Final Stores Inc. | | | 456 | | | | 2,531 | (a) |
Sprouts Farmers Market Inc. | | | 808 | | | | 17,832 | (a) |
SUPERVALU Inc. | | | 598 | | | | 12,271 | (a) |
The Kroger Co. | | | 25,968 | | | | 738,790 | |
Village Super Market Inc., Class A | | | 143 | | | | 4,213 | |
Weis Markets Inc. | | | 188 | | | | 10,028 | |
| | | | 823,769 | |
| | | | | | | | |
| | | Number
of Shares | | | Fair Value | |
Footwear – 0.2% | |
Crocs Inc. | | | 1,245 | | | $ | 21,924 | (a) |
Deckers Outdoor Corp. | | | 791 | | | | 89,296 | (a) |
NIKE Inc., Class B | | | 42,972 | | | | 3,424,009 | |
Rocky Brands Inc. | | | 153 | | | | 4,590 | |
Skechers U.S.A. Inc., Class A | | | 886 | | | | 26,589 | (a) |
Steven Madden Ltd. | | | 1,077 | | | | 57,189 | |
Wolverine World Wide Inc. | | | 1,711 | | | | 59,491 | |
| | | | 3,683,088 | |
Forest Products – 0.0% * | |
Boise Cascade Co. | | | 666 | | | | 29,770 | |
Louisiana-Pacific Corp. | | | 3,675 | | | | 100,034 | |
| | | | 129,804 | |
Gas Utilities – 0.0% * | |
Atmos Energy Corp. | | | 742 | | | | 66,884 | |
Chesapeake Utilities Corp. | | | 295 | | | | 23,585 | |
National Fuel Gas Co. | | | 565 | | | | 29,922 | |
New Jersey Resources Corp. | | | 2,186 | | | | 97,824 | |
Northwest Natural Gas Co. | | | 500 | | | | 31,900 | |
ONE Gas Inc. | | | 1,308 | | | | 97,760 | |
RGC Resources Inc. | | | 154 | | | | 4,494 | |
South Jersey Industries Inc. | | | 1,595 | | | | 53,385 | |
Southwest Gas Holdings Inc. | | | 1,209 | | | | 92,210 | |
Spire Inc. | | | 913 | | | | 64,504 | |
UGI Corp. | | | 1,159 | | | | 60,349 | |
WGL Holdings Inc. | | | 1,287 | | | | 114,221 | |
| | | | 737,038 | |
General Merchandise Stores – 0.1% | |
Big Lots Inc. | | | 1,041 | | | | 43,493 | |
Dollar General Corp. | | | 8,516 | | | | 839,677 | |
Dollar Tree Inc. | | | 7,948 | | | | 675,580 | (a) |
Ollie’s Bargain Outlet Holdings Inc. | | | 1,250 | | | | 90,625 | (a) |
Target Corp. | | | 17,590 | | | | 1,338,951 | |
| | | | 2,988,326 | |
Gold – 0.0% * | |
Gold Resource Corp. | | | 1,024 | | | | 6,748 | |
Newmont Mining Corp. | | | 17,225 | | | | 649,555 | |
Royal Gold Inc. | | | 437 | | | | 40,571 | |
Tahoe Resources Inc. | | | 5,844 | | | | 28,752 | |
| | | | 725,626 | |
Health Care REITs – 0.1% | |
CareTrust REIT Inc. | | | 1,402 | | | | 23,399 | |
Community Healthcare Trust Inc. | | | 257 | | | | 7,677 | |
Global Medical REIT Inc. | | | 302 | | | | 2,676 | |
HCP Inc. | | | 15,538 | | | | 401,191 | |
Healthcare Realty Trust Inc. | | | 3,141 | | | | 91,340 | |
LTC Properties Inc. | | | 708 | | | | 30,260 | |
MedEquities Realty Trust Inc. | | | 402 | | | | 4,430 | |
Medical Properties Trust Inc. | | | 2,417 | | | | 33,935 | |
National Health Investors Inc. | | | 747 | | | | 55,039 | |
New Senior Investment Group Inc. | | | 1,086 | | | | 8,221 | |
Omega Healthcare Investors Inc. | | | 1,314 | | | | 40,734 | |
Physicians Realty Trust | | | 3,394 | | | | 54,100 | |
Quality Care Properties Inc. | | | 2,371 | | | | 51,000 | (a) |
Sabra Health Care REIT Inc. | | | 4,498 | | | | 97,742 | |
Senior Housing Properties Trust | | | 1,592 | | | | 28,799 | |
Universal Health Realty Income Trust REIT | | | 248 | | | | 15,867 | |
Ventas Inc. | | | 11,452 | | | | 652,192 | |
Welltower Inc. | | | 12,080 | | | | 757,295 | |
| | | | 2,355,897 | |
Healthcare Distributors – 0.1% | |
AmerisourceBergen Corp. | | | 5,450 | | | | 464,721 | |
Cardinal Health Inc. | | | 10,318 | | | | 503,828 | |
Henry Schein Inc. | | | 4,818 | | | | 349,980 | (a) |
McKesson Corp. | | | 6,677 | | | | 890,712 | |
Owens & Minor Inc. | | | 1,119 | | | | 18,698 | |
Patterson Companies Inc. | | | 2,068 | | | | 46,882 | |
PetIQ Inc. | | | 135 | | | | 3,626 | (a) |
| | | | 2,278,447 | |
See Notes to Schedules of Investments and Notes to Financial Statements.
| | |
| State Street Total Return V.I.S. Fund | | |
| Schedule of Investments | | June 30, 2018 (Unaudited) |
|
| | | | | | | | |
| | | Number
of Shares | | | Fair
Value | |
Healthcare Equipment – 0.9% | |
Abaxis Inc. | | | 411 | | | $ | 34,117 | |
Abbott Laboratories | | | 58,032 | | | | 3,539,372 | (b) |
ABIOMED Inc. | | | 1,400 | | | | 572,670 | (a) |
Accuray Inc. | | | 1,606 | | | | 6,585 | (a) |
AngioDynamics Inc. | | | 690 | | | | 15,346 | (a) |
AtriCure Inc. | | | 633 | | | | 17,123 | (a) |
AxoGen Inc. | | | 626 | | | | 31,456 | (a) |
Baxter International Inc. | | | 16,471 | | | | 1,216,219 | |
Becton Dickinson and Co. | | | 8,895 | | | | 2,130,886 | |
Boston Scientific Corp. | | | 45,618 | | | | 1,491,709 | (a) |
Cantel Medical Corp. | | | 240 | | | | 23,606 | |
Cardiovascular Systems Inc. | | | 515 | | | | 16,655 | (a) |
CONMED Corp. | | | 472 | | | | 34,550 | |
CryoLife Inc. | | | 678 | | | | 18,882 | (a) |
CryoPort Inc. | | | 515 | | | | 8,127 | (a) |
Cutera Inc. | | | 215 | | | | 8,664 | (a) |
CytoSorbents Corp. | | | 591 | | | | 6,737 | (a) |
Danaher Corp. | | | 20,370 | | | | 2,010,112 | |
Edwards Lifesciences Corp. | | | 7,123 | | | | 1,036,895 | (a) |
FONAR Corp. | | | 141 | | | | 3,743 | (a) |
GenMark Diagnostics Inc. | | | 807 | | | | 5,149 | (a) |
Glaukos Corp. | | | 622 | | | | 25,278 | (a) |
Globus Medical Inc., Class A | | | 1,817 | | | | 91,686 | (a) |
Helius Medical Technologies Inc. | | | 362 | | | | 3,446 | (a) |
Heska Corp. | | | 121 | | | | 12,559 | (a) |
Hill-Rom Holdings Inc. | | | 440 | | | | 38,430 | |
Hologic Inc. | | | 9,541 | | | | 379,255 | (a) |
IDEXX Laboratories Inc. | | | 2,800 | | | | 610,232 | (a) |
Inogen Inc. | | | 327 | | | | 60,930 | (a) |
Integer Holdings Corp. | | | 559 | | | | 36,139 | (a) |
Integra LifeSciences Holdings Corp. | | | 462 | | | | 29,757 | (a) |
IntriCon Corp. | | | 130 | | | | 5,239 | (a) |
Intuitive Surgical Inc. | | | 3,717 | | | | 1,778,510 | (a) |
Invacare Corp. | | | 640 | | | | 11,904 | |
iRhythm Technologies Inc. | | | 444 | | | | 36,022 | (a) |
K2M Group Holdings Inc. | | | 768 | | | | 17,280 | (a) |
LeMaitre Vascular Inc. | | | 275 | | | | 9,207 | |
Masimo Corp. | | | 311 | | | | 30,369 | (a) |
Natus Medical Inc. | | | 580 | | | | 20,010 | (a) |
Nevro Corp. | | | 507 | | | | 40,484 | (a) |
NuVasive Inc. | | | 1,295 | | | | 67,495 | (a) |
Nuvectra Corp. | | | 292 | | | | 5,995 | (a) |
NxStage Medical Inc. | | | 1,196 | | | | 33,368 | (a) |
Orthofix International N.V. | | | 318 | | | | 18,069 | (a) |
Pulse Biosciences Inc. | | | 173 | | | | 2,619 | (a) |
ResMed Inc. | | | 4,800 | | | | 497,184 | |
Rockwell Medical Inc. | | | 970 | | | | 4,782 | (a) |
SeaSpine Holdings Corp. | | | 274 | | | | 3,458 | (a) |
Stryker Corp. | | | 10,656 | | | | 1,799,372 | |
Surmodics Inc. | | | 199 | | | | 10,985 | (a) |
Tactile Systems Technology Inc. | | | 331 | | | | 17,212 | (a) |
Tandem Diabetes Care Inc. | | | 858 | | | | 18,893 | (a) |
Teleflex Inc. | | | 303 | | | | 81,268 | |
TransEnterix Inc. | | | 3,058 | | | | 13,333 | (a) |
Varex Imaging Corp. | | | 713 | | | | 26,445 | (a) |
Varian Medical Systems Inc. | | | 3,063 | | | | 348,324 | (a) |
ViewRay Inc. | | | 666 | | | | 4,609 | (a) |
Zimmer Biomet Holdings Inc. | | | 6,943 | | | | 773,728 | |
| | | | 19,192,479 | |
Healthcare Facilities – 0.1% | |
AAC Holdings Inc. | | | 202 | | | | 1,893 | (a) |
Acadia Healthcare Company Inc. | | | 539 | | | | 22,050 | (a) |
Brookdale Senior Living Inc. | | | 3,507 | | | | 31,879 | (a) |
Capital Senior Living Corp. | | | 504 | | | | 5,378 | (a) |
Community Health Systems Inc. | | | 1,800 | | | | 5,976 | (a) |
Encompass Health Corp. | | | 667 | | | | 45,169 | |
Genesis Healthcare Inc. | | | 651 | | | | 1,491 | (a) |
HCA Healthcare Inc. | | | 9,145 | | | | 938,277 | |
Kindred Healthcare Inc. | | | 1,691 | | | | 15,219 | (a) |
LifePoint Health Inc. | | | 919 | | | | 44,847 | (a) |
National HealthCare Corp. | | | 223 | | | | 15,695 | |
Quorum Health Corp. | | | 687 | | | | 3,435 | (a) |
Select Medical Holdings Corp. | | | 1,935 | | | | 35,120 | (a) |
Surgery Partners Inc. | | | 372 | | | | 5,543 | (a) |
Tenet Healthcare Corp. | | | 2,090 | | | | 70,161 | (a) |
| | | | | | | | |
| | | Number
of Shares | | | Fair
Value | |
The Ensign Group Inc. | | | 868 | | | $ | 31,092 | |
Universal Health Services Inc., Class B | | | 2,949 | | | | 328,636 | |
US Physical Therapy Inc. | | | 232 | | | | 22,272 | |
| | | | 1,624,133 | |
Healthcare Services – 0.3% | |
Addus HomeCare Corp. | | | 151 | | | | 8,645 | (a) |
Amedisys Inc. | | | 503 | | | | 42,986 | (a) |
American Renal Associates Holdings Inc. | | | 175 | | | | 2,760 | (a) |
AMN Healthcare Services Inc. | | | 877 | | | | 51,392 | (a) |
Apollo Medical Holdings Inc. | | | 494 | | | | 12,775 | (a) |
BioScrip Inc. | | | 1,987 | | | | 5,822 | (a) |
BioTelemetry Inc. | | | 541 | | | | 24,345 | (a) |
Chemed Corp. | | | 105 | | | | 33,790 | |
Civitas Solutions Inc. | | | 301 | | | | 4,936 | (a) |
CorVel Corp. | | | 131 | | | | 7,074 | (a) |
Cross Country Healthcare Inc. | | | 643 | | | | 7,234 | (a) |
CVS Health Corp. | | | 33,698 | | | | 2,168,466 | |
DaVita Inc. | | | 4,706 | | | | 326,785 | (a) |
Diplomat Pharmacy Inc. | | | 1,069 | | | | 27,324 | (a) |
Envision Healthcare Corp. | | | 4,383 | | | | 192,896 | (a) |
Express Scripts Holding Co. | | | 18,729 | | | | 1,446,066 | (a) |
Laboratory Corporation of America Holdings | | | 3,324 | | | | 596,758 | (a) |
LHC Group Inc. | | | 574 | | | | 49,129 | (a) |
MEDNAX Inc. | | | 622 | | | | 26,920 | (a) |
National Research Corp., Class A | | | 159 | | | | 5,946 | |
Quest Diagnostics Inc. | | | 4,552 | | | | 500,447 | |
R1 RCM Inc. | | | 1,899 | | | | 16,483 | (a) |
RadNet Inc. | | | 744 | | | | 11,160 | (a) |
The Providence Service Corp. | | | 188 | | | | 14,767 | (a) |
Tivity Health Inc. | | | 755 | | | | 26,576 | (a) |
| | | | 5,611,482 | |
Healthcare Supplies – 0.1% | |
Align Technology Inc. | | | 2,400 | | | | 821,136 | (a) |
Anika Therapeutics Inc. | | | 281 | | | | 8,992 | (a) |
Antares Pharma Inc. | | | 2,720 | | | | 7,018 | (a) |
Atrion Corp. | | | 27 | | | | 16,184 | |
Avanos Medical Inc. | | | 1,177 | | | | 67,383 | (a) |
Cerus Corp. | | | 2,029 | | | | 13,533 | (a) |
DENTSPLY SIRONA Inc. | | | 7,934 | | | | 347,271 | |
Endologix Inc. | | | 1,626 | | | | 9,203 | (a) |
Haemonetics Corp. | | | 1,332 | | | | 119,454 | (a) |
ICU Medical Inc. | | | 102 | | | | 29,952 | (a) |
Lantheus Holdings Inc. | | | 733 | | | | 10,665 | (a) |
Meridian Bioscience Inc. | | | 634 | | | | 10,081 | |
Merit Medical Systems Inc. | | | 863 | | | | 44,186 | (a) |
Neogen Corp. | | | 929 | | | | 74,497 | (a) |
OraSure Technologies Inc. | | | 1,042 | | | | 17,162 | (a) |
OrthoPediatrics Corp. | | | 157 | | | | 4,182 | (a) |
Quidel Corp. | | | 611 | | | | 40,632 | (a) |
RTI Surgical Inc. | | | 1,167 | | | | 5,368 | (a) |
Senseonics Holdings Inc. | | | 1,400 | | | | 5,754 | (a) |
Sientra Inc. | | | 465 | | | | 9,072 | (a) |
STAAR Surgical Co. | | | 789 | | | | 24,459 | (a) |
The Cooper Companies Inc. | | | 1,702 | | | | 400,736 | |
Utah Medical Products Inc. | | | 69 | | | | 7,600 | |
West Pharmaceutical Services Inc. | | | 493 | | | | 48,950 | |
| | | | 2,143,470 | |
Healthcare Technology – 0.1% | |
Allscripts Healthcare Solutions Inc. | | | 4,479 | | | | 53,748 | (a) |
Castlight Health Inc., Class B | | | 806 | | | | 3,426 | (a) |
Cerner Corp. | | | 10,486 | | | | 626,958 | (a) |
Computer Programs & Systems Inc. | | | 227 | | | | 7,468 | |
Cotiviti Holdings Inc. | | | 691 | | | | 30,494 | (a) |
Evolent Health Inc. Class A | | | 1,268 | | | | 26,691 | (a) |
HealthStream Inc. | | | 513 | | | | 14,010 | |
HMS Holdings Corp. | | | 1,476 | | | | 31,911 | (a) |
Inovalon Holdings Inc., Class A | | | 1,187 | | | | 11,781 | (a) |
Inspire Medical Systems Inc. | | | 167 | | | | 5,955 | (a) |
Medidata Solutions Inc. | | | 1,465 | | | | 118,021 | (a) |
Omnicell Inc. | | | 684 | | | | 35,876 | (a) |
Quality Systems Inc. | | | 866 | | | | 16,887 | (a) |
Simulations Plus Inc. | | | 252 | | | | 5,607 | |
Tabula Rasa HealthCare Inc. | | | 330 | | | | 21,064 | (a) |
Teladoc Inc. | | | 1,147 | | | | 66,583 | (a) |
Vocera Communications Inc. | | | 498 | | | | 14,885 | (a) |
| | | | 1,091,365 | |
See Notes to Schedules of Investments and Notes to Financial Statements.
| | |
| State Street Total Return V.I.S. Fund | | |
| Schedule of Investments | | June 30, 2018 (Unaudited) |
|
| | | | | | | | |
| | | Number
of Shares | | | Fair
Value | |
Heavy Electrical Equipment – 0.0% * | |
AZZ Inc. | | | 467 | | | $ | 20,291 | |
Babcock & Wilcox Enterprises Inc. | | | 522 | | | | 1,242 | (a) |
TPI Composites Inc. | | | 298 | | | | 8,714 | (a) |
| | | | 30,247 | |
Home Building – 0.1% | |
AV Homes Inc. | | | 240 | | | | 5,136 | (a) |
Beazer Homes USA Inc. | | | 640 | | | | 9,440 | (a) |
Cavco Industries Inc. | | | 160 | | | | 33,224 | (a) |
Century Communities Inc. | | | 496 | | | | 15,649 | (a) |
D.R. Horton Inc. | | | 11,715 | | | | 480,315 | |
Green Brick Partners Inc. | | | 472 | | | | 4,626 | (a) |
Hovnanian Enterprises Inc., Class A | | | 2,473 | | | | 4,031 | (a) |
Installed Building Products Inc. | | | 401 | | | | 22,676 | (a) |
KB Home | | | 2,178 | | | | 59,329 | |
Lennar Corp., Class A | | | 9,391 | | | | 493,027 | |
LGI Homes Inc. | | | 309 | | | | 17,839 | (a) |
M/I Homes Inc. | | | 473 | | | | 12,525 | (a) |
MDC Holdings Inc. | | | 856 | | | | 26,339 | |
Meritage Homes Corp. | | | 679 | | | | 29,842 | (a) |
NVR Inc. | | | 22 | | | | 65,348 | (a) |
PICO Holdings Inc. | | | 421 | | | | 4,905 | (a) |
PulteGroup Inc. | | | 9,281 | | | | 266,829 | |
Skyline Champion Corp. | | | 150 | | | | 5,256 | |
Taylor Morrison Home Corp., Class A | | | 2,090 | | | | 43,430 | (a) |
The New Home Company Inc. | | | 290 | | | | 2,891 | (a) |
Toll Brothers Inc. | | | 954 | | | | 35,288 | |
TopBuild Corp. | | | 658 | | | | 51,548 | (a) |
TRI Pointe Group Inc. | | | 3,643 | | | | 59,599 | (a) |
William Lyon Homes, Class A | | | 483 | | | | 11,206 | (a) |
| | | | 1,760,298 | |
Home Entertainment Software – 0.2% | |
Activision Blizzard Inc. | | | 25,222 | | | | 1,924,943 | (b) |
Electronic Arts Inc. | | | 10,302 | | | | 1,452,788 | (a) |
Rosetta Stone Inc. | | | 383 | | | | 6,140 | (a) |
Take-Two Interactive Software Inc. | | | 3,700 | | | | 437,932 | (a) |
| | | | 3,821,803 | |
Home Furnishing Retail – 0.0% * | |
Aaron’s Inc. | | | 1,726 | | | | 74,995 | |
At Home Group Inc. | | | 508 | | | | 19,888 | (a) |
Bed Bath & Beyond Inc. | | | 3,408 | | | | 67,904 | |
Haverty Furniture Companies Inc. | | | 344 | | | | 7,430 | |
Kirkland’s Inc. | | | 300 | | | | 3,492 | (a) |
Pier 1 Imports Inc. | | | 1,653 | | | | 3,934 | |
RH | | | 358 | | | | 50,013 | (a) |
Sleep Number Corp. | | | 597 | | | | 17,325 | (a) |
Williams-Sonoma Inc. | | | 521 | | | | 31,979 | |
| | | | 276,960 | |
Home Furnishings – 0.0% * | |
Bassett Furniture Industries Inc. | | | 206 | | | | 5,675 | |
Ethan Allen Interiors Inc. | | | 362 | | | | 8,869 | |
Flexsteel Industries Inc. | | | 129 | | | | 5,147 | |
Hooker Furniture Corp. | | | 228 | | | | 10,693 | |
La-Z-Boy Inc. | | | 822 | | | | 25,153 | |
Leggett & Platt Inc. | | | 4,543 | | | | 202,800 | |
Mohawk Industries Inc. | | | 2,156 | | | | 461,966 | (a) |
Tempur Sealy International Inc. | | | 320 | | | | 15,376 | (a) |
| | | | 735,679 | |
Home Improvement Retail – 0.5% | |
Lowe’s Companies Inc. | | | 27,336 | | | | 2,612,501 | |
Lumber Liquidators Holdings Inc. | | | 532 | | | | 12,954 | (a) |
The Home Depot Inc. | | | 38,447 | | | | 7,501,010 | |
Tile Shop Holdings Inc. | | | 650 | | | | 5,005 | |
| | | | 10,131,470 | |
Hotel & Resort REITs – 0.1% | |
Ashford Hospitality Trust Inc. | | | 1,574 | | | | 12,749 | |
Braemar Hotels & Resorts Inc. | | | 450 | | | | 5,139 | |
Chatham Lodging Trust | | | 758 | | | | 16,085 | |
Chesapeake Lodging Trust | | | 1,111 | | | | 35,152 | |
CorePoint Lodging Inc. | | | 732 | | | | 18,959 | (a) |
DiamondRock Hospitality Co. | | | 3,726 | | | | 45,755 | |
Hersha Hospitality Trust | | | 653 | | | | 14,007 | |
| | | | | | | | |
| | | Number
of Shares | | | Fair
Value | |
Hospitality Properties Trust | | | 1,088 | | | $ | 31,128 | |
Host Hotels & Resorts Inc. | | | 23,469 | | | | 494,492 | |
LaSalle Hotel Properties | | | 2,789 | | | | 95,467 | |
Pebblebrook Hotel Trust | | | 1,267 | | | | 49,160 | |
RLJ Lodging Trust | | | 3,217 | | | | 70,935 | |
Ryman Hospitality Properties Inc. | | | 828 | | | | 68,848 | |
Summit Hotel Properties Inc. | | | 1,735 | | | | 24,828 | |
Sunstone Hotel Investors Inc. | | | 4,175 | | | | 69,388 | |
Xenia Hotels & Resorts Inc. | | | 2,001 | | | | 48,744 | |
| | | | 1,100,836 | |
Hotels, Resorts & Cruise Lines – 0.2% | |
BBX Capital Corp. | | | 1,293 | | | | 11,676 | |
Bluegreen Vacations Corp. | | | 173 | | | | 4,117 | |
Carnival Corp. | | | 13,669 | | | | 783,370 | |
Hilton Worldwide Holdings Inc. | | | 9,400 | | | | 744,104 | |
ILG Inc. | | | 2,666 | | | | 88,058 | |
Lindblad Expeditions Holdings Inc. | | | 299 | | | | 3,962 | (a) |
Marriott International Inc., Class A | | | 9,952 | | | | 1,259,923 | |
Marriott Vacations Worldwide Corp. | | | 399 | | | | 45,071 | |
Norwegian Cruise Line Holdings Ltd. | | | 6,500 | | | | 307,125 | (a) |
Red Lion Hotels Corp. | | | 265 | | | | 3,087 | (a) |
Royal Caribbean Cruises Ltd. | | | 5,654 | | | | 585,755 | |
Wyndham Destinations Inc. | | | 659 | | | | 29,174 | |
Wyndham Hotels & Resorts Inc. | | | 659 | | | | 38,769 | |
| | | | 3,904,191 | |
Household Appliances – 0.0% * | |
Hamilton Beach Brands Holding Co., Class A | | | 38 | | | | 1,104 | |
Helen of Troy Ltd. | | | 681 | | | | 67,044 | (a) |
iRobot Corp. | | | 505 | | | | 38,264 | (a) |
Whirlpool Corp. | | | 2,031 | | | | 296,993 | |
| | | | 403,405 | |
Household Products – 0.5% | |
Central Garden & Pet Co. | | | 194 | | | | 8,435 | (a) |
Central Garden & Pet Co., Class A | | | 642 | | | | 25,982 | (a) |
Church & Dwight Company Inc. | | | 8,442 | | | | 448,777 | |
Colgate-Palmolive Co. | | | 28,902 | | | | 1,873,139 | |
Energizer Holdings Inc. | | | 393 | | | | 24,743 | |
HRG Group Inc. | | | 2,237 | | | | 29,282 | (a) |
Kimberly-Clark Corp. | | | 11,619 | | | | 1,223,945 | |
Oil-Dri Corporation of America | | | 99 | | | | 4,172 | |
The Clorox Co. | | | 4,426 | | | | 598,616 | |
The Procter & Gamble Co. | | | 83,702 | | | | 6,533,778 | |
WD-40 Co. | | | 246 | | | | 35,978 | |
| | | | 10,806,847 | |
Housewares & Specialties – 0.0% * | |
Lifetime Brands Inc. | | | 220 | | | | 2,783 | |
Newell Brands Inc. | | | 16,278 | | | | 419,810 | |
Tupperware Brands Corp. | | | 1,306 | | | | 53,859 | |
| | | | 476,452 | |
Human Resource & Employment Services – 0.0% * | |
ASGN Inc. | | | 938 | | | | 73,342 | (a) |
Barrett Business Services Inc. | | | 142 | | | | 13,713 | |
BG Staffing Inc. | | | 166 | | | | 3,860 | |
GP Strategies Corp. | | | 257 | | | | 4,523 | (a) |
Heidrick & Struggles International Inc. | | | 278 | | | | 9,730 | |
Insperity Inc. | | | 709 | | | | 67,532 | |
Kelly Services Inc., Class A | | | 582 | | | | 13,066 | |
Kforce Inc. | | | 416 | | | | 14,269 | |
Korn/Ferry International | | | 1,046 | | | | 64,779 | |
ManpowerGroup Inc. | | | 442 | | | | 38,039 | |
Robert Half International Inc. | | | 4,283 | | | | 278,823 | |
TriNet Group Inc. | | | 812 | | | | 45,423 | (a) |
TrueBlue Inc. | | | 734 | | | | 19,781 | (a) |
WageWorks Inc. | | | 712 | | | | 35,600 | (a) |
| | | | 682,480 | |
Hypermarkets & Super Centers – 0.3% | |
Costco Wholesale Corp. | | | 14,650 | | | | 3,061,557 | |
PriceSmart Inc. | | | 414 | | | | 37,467 | |
Walmart Inc. | | | 48,422 | | | | 4,147,344 | |
| | | | 7,246,368 | |
Independent Power Producers & Energy Traders – 0.0% * | |
AES Corp. | | | 20,666 | | | | 277,131 | |
Atlantic Power Corp. | | | 2,442 | | | | 5,372 | (a) |
NRG Energy Inc. | | | 10,124 | | | | 310,807 | |
NRG Yield Inc., Class A | | | 688 | | | | 11,731 | |
NRG Yield Inc., Class C | | | 1,100 | | | | 18,920 | |
| | | | 623,961 | |
See Notes to Schedules of Investments and Notes to Financial Statements.
| | |
| State Street Total Return V.I.S. Fund | | |
| Schedule of Investments | | June 30, 2018 (Unaudited) |
|
| | | | | | | | |
| | | Number
of Shares | | | Fair
Value | |
Industrial Conglomerates – 0.6% | |
3M Co. | | | 19,763 | | | $ | 3,887,777 | (b) |
Carlisle Companies Inc. | | | 403 | | | | 43,649 | |
General Electric Co. | | | 288,811 | | | | 3,930,718 | |
Honeywell International Inc. | | | 24,989 | | | | 3,599,665 | |
Raven Industries Inc. | | | 648 | | | | 24,916 | |
Roper Technologies Inc. | | | 3,457 | | | | 953,821 | |
| | | | 12,440,546 | |
Industrial Gases – 0.1% | |
Air Products & Chemicals Inc. | | | 7,387 | | | | 1,150,377 | |
Praxair Inc. | | | 9,526 | | | | 1,506,537 | |
| | | | 2,656,914 | |
Industrial Machinery – 0.3% | |
Actuant Corp., Class A | | | 1,128 | | | | 33,107 | |
Albany International Corp., Class A | | | 520 | | | | 31,278 | |
Altra Industrial Motion Corp. | | | 505 | | | | 21,765 | |
Barnes Group Inc. | | | 912 | | | | 53,717 | |
Briggs & Stratton Corp. | | | 740 | | | | 13,031 | |
Chart Industries Inc. | | | 526 | | | | 32,444 | (a) |
CIRCOR International Inc. | | | 256 | | | | 9,462 | |
Columbus McKinnon Corp. | | | 393 | | | | 17,040 | |
Crane Co. | | | 342 | | | | 27,404 | |
DMC Global Inc. | | | 281 | | | | 12,617 | |
Donaldson Company Inc. | | | 872 | | | | 39,345 | |
Dover Corp. | | | 5,113 | | | | 374,272 | |
Energy Recovery Inc. | | | 693 | | | | 5,599 | (a) |
EnPro Industries Inc. | | | 370 | | | | 25,881 | |
ESCO Technologies Inc. | | | 459 | | | | 26,484 | |
Evoqua Water Technologies Corp. | | | 1,424 | | | | 29,192 | (a) |
Flowserve Corp. | | | 4,491 | | | | 181,436 | |
Fortive Corp. | | | 10,026 | | | | 773,105 | |
Franklin Electric Company Inc. | | | 866 | | | | 39,057 | |
Gencor Industries Inc. | | | 118 | | | | 1,906 | (a) |
Global Brass & Copper Holdings Inc. | | | 420 | | | | 13,167 | |
Graco Inc. | | | 1,109 | | | | 50,149 | |
Graham Corp. | | | 195 | | | | 5,033 | |
Harsco Corp. | | | 1,442 | | | | 31,868 | (a) |
Hillenbrand Inc. | | | 1,165 | | | | 54,930 | |
Hurco Companies Inc. | | | 128 | | | | 5,728 | |
Hyster-Yale Materials Handling Inc. | | | 189 | | | | 12,143 | |
IDEX Corp. | | | 509 | | | | 69,468 | |
Illinois Tool Works Inc. | | | 10,182 | | | | 1,410,614 | |
Ingersoll-Rand PLC | | | 8,277 | | | | 742,695 | |
ITT Inc. | | | 584 | | | | 30,526 | |
John Bean Technologies Corp. | | | 582 | | | | 51,740 | |
Kadant Inc. | | | 180 | | | | 17,307 | |
Kennametal Inc. | | | 2,057 | | | | 73,846 | |
LB Foster Co., Class A | | | 188 | | | | 4,315 | (a) |
Lincoln Electric Holdings Inc. | | | 414 | | | | 36,333 | |
Lydall Inc. | | | 332 | | | | 14,492 | (a) |
Milacron Holdings Corp. | | | 1,224 | | | | 23,170 | (a) |
Mueller Industries Inc. | | | 955 | | | | 28,182 | |
Mueller Water Products Inc., Class A | | | 2,803 | | | | 32,851 | |
NN Inc. | | | 530 | | | | 10,017 | |
Nordson Corp. | | | 337 | | | | 43,274 | |
Omega Flex Inc. | | | 58 | | | | 4,588 | |
Park-Ohio Holdings Corp. | | | 172 | | | | 6,416 | |
Parker-Hannifin Corp. | | | 4,495 | | | | 700,546 | |
Proto Labs Inc. | | | 502 | | | | 59,713 | (a) |
RBC Bearings Inc. | | | 438 | | | | 56,419 | (a) |
Rexnord Corp. | | | 1,939 | | | | 56,347 | (a) |
Snap-on Inc. | | | 1,926 | | | | 309,547 | |
SPX Corp. | | | 719 | | | | 25,201 | (a) |
SPX FLOW Inc. | | | 725 | | | | 31,733 | (a) |
Standex International Corp. | | | 226 | | | | 23,097 | |
Stanley Black & Decker Inc. | | | 5,201 | | | | 690,745 | |
Sun Hydraulics Corp. | | | 498 | | | | 23,999 | |
Tennant Co. | | | 301 | | | | 23,779 | |
The Eastern Co. | | | 130 | | | | 3,647 | |
The Gorman-Rupp Co. | | | 355 | | | | 12,425 | |
The Timken Co. | | | 463 | | | | 20,164 | |
TriMas Corp. | | | 822 | | | | 24,167 | (a) |
Watts Water Technologies Inc., Class A | | | 518 | | | | 40,611 | |
Woodward Inc. | | | 1,362 | | | | 104,683 | |
Xylem Inc. | | | 6,099 | | | | 410,951 | |
| | | | 7,138,768 | |
| | | | | | | | |
| | | Number
of Shares | | | Fair
Value | |
Industrial REITs – 0.1% | |
Americold Realty Trust | | | 952 | | | $ | 20,963 | |
DCT Industrial Trust Inc. | | | 619 | | | | 41,306 | |
Duke Realty Corp. | | | 11,700 | | | | 339,651 | |
EastGroup Properties Inc. | | | 638 | | | | 60,967 | |
First Industrial Realty Trust Inc. | | | 3,122 | | | | 104,088 | |
Gramercy Property Trust | | | 2,962 | | | | 80,922 | |
Industrial Logistics Properties Trust | | | 366 | | | | 8,180 | |
Innovative Industrial Properties Inc. | | | 141 | | | | 5,164 | |
Monmouth Real Estate Investment Corp. | | | 1,271 | | | | 21,010 | |
Prologis Inc. REIT | | | 17,445 | | | | 1,145,962 | |
Rexford Industrial Realty Inc. | | | 1,501 | | | | 47,116 | |
STAG Industrial Inc. | | | 1,732 | | | | 47,162 | |
Terreno Realty Corp. | | | 993 | | | | 37,406 | |
| | | | 1,959,897 | |
Insurance Brokers – 0.1% | |
Arthur J Gallagher & Co. | | | 6,123 | | | | 399,709 | |
Brown & Brown Inc. | | | 1,523 | | | | 42,233 | |
Crawford & Co., Class B | | | 241 | | | | 2,085 | |
eHealth Inc. | | | 378 | | | | 8,354 | (a) |
Goosehead Insurance Inc., Class A | | | 211 | | | | 5,267 | (a) |
Health Insurance Innovations Inc., Class A | | | 212 | | | | 6,858 | (a) |
Marsh & McLennan Companies Inc. | | | 16,758 | | | | 1,373,653 | |
| | | | 1,838,159 | |
Integrated Oil & Gas – 1.0% | |
Chevron Corp. | | | 63,788 | | | | 8,064,717 | |
Exxon Mobil Corp. | | | 141,307 | | | | 11,690,328 | |
Occidental Petroleum Corp. | | | 25,454 | | | | 2,129,991 | |
| | | | 21,885,036 | |
Integrated Telecommunication Services – 0.7% | |
AT&T Inc. | | | 242,291 | | | | 7,779,964 | |
ATN International Inc. | | | 208 | | | | 10,976 | |
Cincinnati Bell Inc. | | | 678 | | | | 10,645 | (a) |
Consolidated Communications Holdings Inc. | | | 1,301 | | | | 16,080 | |
Frontier Communications Corp. | | | 1,489 | | | | 7,981 | |
Hawaiian Telcom Holdco Inc. | | | 118 | | | | 3,413 | (a) |
Ooma Inc. | | | 385 | | | | 5,448 | (a) |
Verizon Communications Inc. | | | 137,840 | | | | 6,934,730 | |
Windstream Holdings Inc. | | | 728 | | | | 3,836 | |
| | | | 14,773,073 | |
Internet & Direct Marketing Retail – 1.5% | |
1-800-Flowers.com Inc., Class A | | | 571 | | | | 7,166 | (a) |
Amazon.com Inc. | | | 13,415 | | | | 22,802,817 | (a) |
Booking Holdings Inc. | | | 1,614 | | | | 3,271,723 | (a) |
Duluth Holdings Inc. | | | 194 | | | | 4,615 | (a) |
Expedia Group Inc. | | | 3,947 | | | | 474,390 | |
Gaia Inc. | | | 99 | | | | 2,005 | (a) |
Groupon Inc. | | | 8,237 | | | | 35,419 | (a) |
Lands’ End Inc. | | | 116 | | | | 3,236 | (a) |
Liberty Expedia Holdings Inc., Class A | | | 1,014 | | | | 44,555 | (a) |
Liberty TripAdvisor Holdings Inc., Class A | | | 1,346 | | | | 21,671 | (a) |
Netflix Inc. | | | 14,498 | | | | 5,674,952 | (a) |
Nutrisystem Inc. | | | 559 | | | | 21,522 | |
Overstock.com Inc. | | | 400 | | | | 13,460 | (a) |
PetMed Express Inc. | | | 354 | | | | 15,594 | |
Shutterfly Inc. | | | 613 | | | | 55,188 | (a) |
TripAdvisor Inc. | | | 3,684 | | | | 205,236 | (a) |
| | | | 32,653,549 | |
Internet Software & Services – 2.0% | |
Akamai Technologies Inc. | | | 5,839 | | | | 427,590 | (a) |
Alarm.com Holdings Inc. | | | 582 | | | | 23,501 | (a) |
Alphabet Inc., Class A | | | 9,934 | | | | 11,217,373 | (a) |
Alphabet Inc., Class C | | | 10,163 | | | | 11,338,351 | (a) |
Alteryx Inc., Class A | | | 532 | | | | 20,301 | (a) |
Amber Road Inc. | | | 359 | | | | 3,378 | (a) |
Appfolio Inc. Class A | | | 282 | | | | 17,244 | (a) |
Apptio Inc., Class A | | | 639 | | | | 23,132 | (a) |
Benefitfocus Inc. | | | 387 | | | | 13,003 | (a) |
See Notes to Schedules of Investments and Notes to Financial Statements.
| | |
| State Street Total Return V.I.S. Fund | | |
| Schedule of Investments | | June 30, 2018 (Unaudited) |
|
| | | | | | | | |
| | | Number
of Shares | | | Fair
Value | |
Blucora Inc. | | | 879 | | | $ | 32,523 | (a) |
Box Inc., Class A | | | 2,355 | | | | 58,851 | (a) |
Brightcove Inc. | | | 606 | | | | 5,848 | (a) |
Carbonite Inc. | | | 464 | | | | 16,194 | (a) |
Care.com Inc. | | | 393 | | | | 8,206 | (a) |
Cargurus Inc. | | | 922 | | | | 32,030 | (a) |
Cars.com Inc. | | | 1,735 | | | | 49,257 | (a) |
ChannelAdvisor Corp. | | | 467 | | | | 6,561 | (a) |
Cision Ltd. | | | 770 | | | | 11,511 | (a) |
Cloudera Inc. | | | 1,790 | | | | 24,416 | (a) |
Cornerstone OnDemand Inc. | | | 992 | | | | 47,050 | (a) |
Coupa Software Inc. | | | 985 | | | | 61,306 | (a) |
eBay Inc. | | | 31,114 | | | | 1,128,194 | (a) |
eGain Corp. | | | 388 | | | | 5,859 | (a) |
Endurance International Group Holdings Inc. | | | 1,366 | | | | 13,592 | (a) |
Envestnet Inc. | | | 822 | | | | 45,169 | (a) |
Etsy Inc. | | | 2,203 | | | | 92,944 | (a) |
Facebook Inc., Class A | | | 79,972 | | | | 15,540,159 | (a) |
Five9 Inc. | | | 987 | | | | 34,121 | (a) |
Gogo Inc. | | | 1,134 | | | | 5,511 | (a) |
GTT Communications Inc. | | | 655 | | | | 29,475 | (a) |
Hortonworks Inc. | | | 1,296 | | | | 23,613 | (a) |
Instructure Inc. | | | 591 | | | | 25,147 | (a) |
Internap Corp. | | | 378 | | | | 3,939 | (a) |
j2 Global Inc. | | | 1,195 | | | | 103,499 | |
Leaf Group Ltd. | | | 380 | | | | 4,123 | (a) |
Limelight Networks Inc. | | | 2,125 | | | | 9,499 | (a) |
Liquidity Services Inc. | | | 496 | | | | 3,249 | (a) |
LivePerson Inc. | | | 1,066 | | | | 22,493 | (a) |
LogMeIn Inc. | | | 343 | | | | 35,415 | |
MINDBODY Inc., Class A | | | 726 | | | | 28,024 | (a) |
New Relic Inc. | | | 818 | | | | 82,283 | (a) |
NIC Inc. | | | 1,158 | | | | 18,007 | |
Pandora Media Inc. | | | 4,784 | | | | 37,698 | (a) |
Q2 Holdings Inc. | | | 683 | | | | 38,965 | (a) |
QuinStreet Inc. | | | 753 | | | | 9,563 | (a) |
Quotient Technology Inc. | | | 1,287 | | | | 16,860 | (a) |
Reis Inc. | | | 170 | | | | 3,706 | |
SendGrid Inc. | | | 152 | | | | 4,031 | (a) |
ShotSpotter Inc. | | | 152 | | | | 5,765 | (a) |
Shutterstock Inc. | | | 344 | | | | 16,326 | (a) |
SPS Commerce Inc. | | | 293 | | | | 21,530 | (a) |
Stamps.com Inc. | | | 320 | | | | 80,976 | (a) |
TechTarget Inc. | | | 355 | | | | 10,082 | (a) |
Telaria Inc. | | | 992 | | | | 4,008 | (a) |
The Meet Group Inc. | | | 837 | | | | 3,750 | (a) |
The Trade Desk Inc., Class A | | | 585 | | | | 54,873 | (a) |
TrueCar Inc. | | | 1,749 | | | | 17,647 | (a) |
Twitter Inc. | | | 21,600 | | | | 943,272 | (a) |
VeriSign Inc. | | | 2,852 | | | | 391,922 | (a) |
Veritone Inc. | | | 166 | | | | 2,792 | (a) |
Web.com Group Inc. | | | 680 | | | | 17,578 | (a) |
XO Group Inc. | | | 468 | | | | 14,976 | (a) |
Yelp Inc. | | | 1,503 | | | | 58,887 | (a) |
Yext Inc. | | | 1,526 | | | | 29,513 | (a) |
| | | | 42,476,661 | |
Investment Banking & Brokerage – 0.4% | |
B. Riley Financial Inc. | | | 394 | | | | 8,885 | |
Cowen Inc. | | | 531 | | | | 7,354 | (a) |
E*TRADE Financial Corp. | | | 8,825 | | | | 539,737 | (a) |
Evercore Inc., Class A | | | 274 | | | | 28,893 | |
GAIN Capital Holdings Inc. | | | 226 | | | | 1,706 | |
Greenhill & Company Inc. | | | 426 | | | | 12,098 | |
Houlihan Lokey Inc. | | | 561 | | | | 28,735 | |
Interactive Brokers Group Inc., Class A | | | 476 | | | | 30,659 | |
INTL. FCStone Inc. | | | 288 | | | | 14,893 | (a) |
Investment Technology Group Inc. | | | 531 | | | | 11,109 | |
Ladenburg Thalmann Financial Services Inc. | | | 2,143 | | | | 7,286 | |
Moelis & Co., Class A | | | 727 | | | | 42,639 | |
Morgan Stanley | | | 45,841 | | | | 2,172,863 | |
Oppenheimer Holdings Inc., Class A | | | 105 | | | | 2,940 | |
Piper Jaffray Cos. | | | 241 | | | | 18,521 | |
PJT Partners Inc., Class A | | | 341 | | | | 18,206 | |
Raymond James Financial Inc. | | | 4,300 | | | | 384,205 | |
| | | | | | | | |
| | | Number
of Shares | | | Fair
Value | |
Stifel Financial Corp. | | | 1,768 | | | $ | 92,378 | |
The Charles Schwab Corp. | | | 39,853 | | | | 2,036,488 | |
The Goldman Sachs Group Inc. | | | 11,747 | | | | 2,591,036 | |
| | | | 8,050,631 | |
IT Consulting & Other Services – 0.3% | |
Acxiom Corp. | | | 1,983 | | | | 59,391 | (a) |
CACI International Inc., Class A | | | 454 | | | | 76,522 | (a) |
Cognizant Technology Solutions Corp., Class A | | | 19,782 | | | | 1,562,580 | |
ConvergeOne Holdings Inc. | | | 544 | | | | 5,108 | |
DXC Technology Co. | | | 9,735 | | | | 784,738 | |
Gartner Inc. | | | 3,000 | | | | 398,700 | (a) |
International Business Machines Corp. | | | 28,437 | | | | 3,972,649 | |
Leidos Holdings Inc. | | | 954 | | | | 56,286 | |
ManTech International Corp., Class A | | | 499 | | | | 26,766 | |
Perficient Inc. | | | 588 | | | | 15,506 | (a) |
Perspecta Inc. | | | 3,616 | | | | 74,309 | |
PFSweb Inc. | | | 356 | | | | 3,460 | (a) |
Presidio Inc. | | | 571 | | | | 7,480 | (a) |
Science Applications International Corp. | | | 1,075 | | | | 87,000 | |
ServiceSource International Inc. | | | 1,215 | | | | 4,787 | (a) |
Teradata Corp. | | | 790 | | | | 31,719 | (a) |
The Hackett Group Inc. | | | 447 | | | | 7,183 | |
Unisys Corp. | | | 769 | | | | 9,920 | (a) |
Virtusa Corp. | | | 481 | | | | 23,415 | (a) |
| | | | 7,207,519 | |
Leisure Facilities – 0.0% * | |
Drive Shack Inc. | | | 843 | | | | 6,508 | (a) |
International Speedway Corp., Class A | | | 545 | | | | 24,362 | |
Planet Fitness Inc., Class A | | | 1,635 | | | | 71,842 | (a) |
RCI Hospitality Holdings Inc. | | | 99 | | | | 3,133 | |
SeaWorld Entertainment Inc. | | | 894 | | | | 19,507 | (a) |
Six Flags Entertainment Corp. | | | 523 | | | | 36,636 | |
Speedway Motorsports Inc. | | | 234 | | | | 4,062 | |
Town Sports International Holdings Inc. | | | 340 | | | | 4,947 | (a) |
| | | | 170,997 | |
Leisure Products – 0.0% * | |
Acushnet Holdings Corp. | | | 586 | | | | 14,334 | |
American Outdoor Brands Corp. | | | 996 | | | | 11,982 | (a) |
Brunswick Corp. | | | 578 | | | | 37,269 | |
Callaway Golf Co. | | | 1,758 | | | | 33,349 | |
Clarus Corp. | | | 534 | | | | 4,405 | (a) |
Escalade Inc. | | | 203 | | | | 2,862 | |
Hasbro Inc. | | | 3,903 | | | | 360,286 | |
Johnson Outdoors Inc., Class A | | | 98 | | | | 8,284 | |
Malibu Boats Inc., Class A | | | 367 | | | | 15,392 | (a) |
Marine Products Corp. | | | 125 | | | | 2,223 | |
Mattel Inc. | | | 10,299 | | | | 169,110 | |
MCBC Holdings Inc. | | | 265 | | | | 7,672 | (a) |
Nautilus Inc. | | | 617 | | | | 9,687 | (a) |
Polaris Industries Inc. | | | 386 | | | | 47,161 | |
Sturm Ruger & Company Inc. | | | 325 | | | | 18,200 | |
Vista Outdoor Inc. | | | 1,083 | | | | 16,776 | (a) |
| | | | 758,992 | |
Life & Health Insurance – 0.3% | |
Aflac Inc. | | | 26,130 | | | | 1,124,113 | |
American Equity Investment Life Holding Co. | | | 1,661 | | | | 59,796 | |
Brighthouse Financial Inc. | | | 3,324 | | | | 133,193 | (a) |
Citizens Inc. | | | 936 | | | | 7,291 | (a) |
CNO Financial Group Inc. | | | 4,213 | | | | 80,216 | |
FBL Financial Group Inc., Class A | | | 194 | | | | 15,277 | |
Genworth Financial Inc., Class A | | | 12,882 | | | | 57,969 | (a) |
Independence Holding Co. | | | 26 | | | | 864 | |
Lincoln National Corp. | | | 7,518 | | | | 467,995 | |
MetLife Inc. | | | 34,073 | | | | 1,485,583 | |
National Western Life Group Inc., Class A | | | 43 | | | | 13,212 | |
Primerica Inc. | | | 1,103 | | | | 109,859 | |
Principal Financial Group Inc. | | | 8,904 | | | | 471,467 | |
Prudential Financial Inc. | | | 13,952 | | | | 1,304,651 | |
Torchmark Corp. | | | 3,556 | | | | 289,494 | |
Trupanion Inc. | | | 416 | | | $ | 16,058 | (a) |
Unum Group | | | 7,647 | | | | 282,863 | |
| | | | 5,919,901 | |
See Notes to Schedules of Investments and Notes to Financial Statements.
| | |
| State Street Total Return V.I.S. Fund | | |
| Schedule of Investments | | June 30, 2018 (Unaudited) |
|
| | | | | | | | |
| | | Number
of Shares | | | Fair
Value | |
Life Sciences Tools & Services – 0.3% | |
Accelerate Diagnostics Inc. | | | 464 | | | $ | 10,347 | (a) |
Agilent Technologies Inc. | | | 10,595 | | | | 655,195 | |
Bio-Rad Laboratories Inc., Class A | | | 134 | | | | 38,664 | (a) |
Bio-Techne Corp. | | | 250 | | | | 36,987 | |
Cambrex Corp. | | | 598 | | | | 31,275 | (a) |
Charles River Laboratories International Inc. | | | 314 | | | | 35,250 | (a) |
Codexis Inc. | | | 984 | | | | 14,170 | (a) |
Enzo Biochem Inc. | | | 798 | | | | 4,142 | (a) |
Fluidigm Corp. | | | 587 | | | | 3,499 | (a) |
Harvard Bioscience Inc. | | | 807 | | | | 4,317 | (a) |
Illumina Inc. | | | 4,928 | | | | 1,376,341 | (a) |
IQVIA Holdings Inc. | | | 5,000 | | | | 499,100 | (a) |
Luminex Corp. | | | 785 | | | | 23,181 | |
Medpace Holdings Inc. | | | 236 | | | | 10,148 | (a) |
Mettler-Toledo International Inc. | | | 854 | | | | 494,150 | (a) |
NanoString Technologies Inc. | | | 296 | | | | 4,049 | (a) |
NeoGenomics Inc. | | | 1,061 | | | | 13,910 | (a) |
Pacific Biosciences of California Inc. | | | 1,928 | | | | 6,844 | (a) |
PerkinElmer Inc. | | | 3,746 | | | | 274,320 | |
PRA Health Sciences Inc. | | | 332 | | | | 30,995 | (a) |
Syneos Health Inc. | | | 1,422 | | | | 66,692 | (a) |
Thermo Fisher Scientific Inc. | | | 13,442 | | | | 2,784,376 | |
Waters Corp. | | | 2,662 | | | | 515,337 | (a) |
| | | | 6,933,289 | |
Managed Healthcare – 0.7% | |
Aetna Inc. | | | 10,955 | | | | 2,010,242 | |
Anthem Inc. | | | 8,542 | | | | 2,033,252 | |
Centene Corp. | | | 6,828 | | | | 841,278 | (a) |
Cigna Corp. | | | 8,100 | | | | 1,376,595 | |
HealthEquity Inc. | | | 1,000 | | | | 75,100 | (a) |
Humana Inc. | | | 4,637 | | | | 1,380,110 | |
Magellan Health Inc. | | | 459 | | | | 44,041 | (a) |
Molina Healthcare Inc. | | | 313 | | | | 30,655 | (a) |
UnitedHealth Group Inc. | | | 32,011 | | | | 7,853,579 | |
WellCare Health Plans Inc. | | | 298 | | | | 73,380 | (a) |
| | | | 15,718,232 | |
Marine – 0.0% * | |
Eagle Bulk Shipping Inc. | | | 895 | | | | 4,869 | (a) |
Kirby Corp. | | | 356 | | | | 29,762 | (a) |
Matson Inc. | | | 769 | | | | 29,514 | |
Scorpio Bulkers Inc. | | | 1,043 | | | | 7,405 | |
| | | | 71,550 | |
Metal & Glass Containers – 0.0% * | |
AptarGroup Inc. | | | 414 | | | | 38,659 | |
Ball Corp. | | | 12,052 | | | | 428,449 | |
Greif Inc., Class A | | | 662 | | | | 35,013 | |
Greif Inc., Class B | | | 112 | | | | 6,451 | |
Myers Industries Inc. | | | 439 | | | | 8,429 | |
Owens-Illinois Inc. | | | 1,082 | | | | 18,188 | (a) |
Silgan Holdings Inc. | | | 514 | | | | 13,791 | |
| | | | 548,980 | |
Mortgage REITs – 0.0% * | |
AG Mortgage Investment Trust Inc. | | | 510 | | | | 9,583 | |
Anworth Mortgage Asset Corp. | | | 2,001 | | | | 9,945 | |
Apollo Commercial Real Estate Finance Inc. | | | 2,299 | | | | 42,026 | |
Arbor Realty Trust Inc. | | | 1,075 | | | | 11,212 | |
Ares Commercial Real Estate Corp. | | | 547 | | | | 7,554 | |
ARMOUR Residential REIT Inc. | | | 699 | | | | 15,944 | |
Blackstone Mortgage Trust Inc., Class A | | | 1,894 | | | | 59,528 | |
Capstead Mortgage Corp. | | | 1,767 | | | | 15,815 | |
Cherry Hill Mortgage Investment Corp. | | | 222 | | | | 3,965 | |
Colony Credit Real Estate Inc. | | | 1,577 | | | | 32,691 | |
CYS Investments Inc. | | | 2,818 | | | | 21,135 | |
Dynex Capital Inc. | | | 967 | | | | 6,315 | |
Exantas Capital Corp. | | | 613 | | | | 6,240 | |
Granite Point Mortgage Trust Inc. | | | 787 | | | | 14,441 | |
Great Ajax Corp. | | | 272 | | | | 3,558 | |
| | | | | | | | |
| | | Number
of Shares | | | Fair
Value | |
Hannon Armstrong Sustainable Infrastructure Capital Inc. | | | 936 | | | $ | 18,486 | |
Invesco Mortgage Capital Inc. | | | 1,987 | | | | 31,593 | |
KKR Real Estate Finance Trust Inc. | | | 196 | | | | 3,877 | |
Ladder Capital Corp. | | | 1,642 | | | | 25,648 | |
MTGE Investment Corp. | | | 848 | | | | 16,621 | |
New York Mortgage Trust Inc. | | | 2,225 | | | | 13,372 | |
Orchid Island Capital Inc. | | | 1,087 | | | | 8,174 | |
PennyMac Mortgage Investment Trust | | | 1,054 | | | | 20,015 | |
Redwood Trust Inc. | | | 1,374 | | | | 22,630 | |
Sutherland Asset Management Corp. | | | 320 | | | | 5,200 | |
TPG RE Finance Trust Inc. | | | 614 | | | | 12,477 | |
Western Asset Mortgage Capital Corp. | | | 844 | | | | 8,795 | |
| | | | 446,840 | |
Motorcycle Manufacturers – 0.0% * | |
Harley-Davidson Inc. | | | 5,762 | | | | 242,465 | |
Movies & Entertainment – 0.4% | |
AMC Entertainment Holdings Inc., Class A | | | 823 | | | | 13,086 | |
Cinemark Holdings Inc. | | | 713 | | | | 25,012 | |
Liberty Media Corp.-Liberty Braves, Class A | | | 189 | | | | 4,859 | (a) |
Liberty Media Corp.-Liberty Braves, Class C | | | 635 | | | | 16,421 | (a) |
Live Nation Entertainment Inc. | | | 908 | | | | 44,102 | (a) |
LiveXLive Media Inc. | | | 193 | | | | 1,114 | (a) |
Reading International Inc., Class A | | | 333 | | | | 5,311 | (a) |
The Marcus Corp. | | | 370 | | | | 12,025 | |
The Walt Disney Co. | | | 49,435 | | | | 5,181,282 | |
Twenty-First Century Fox Inc., Class A | | | 34,894 | | | | 1,733,883 | |
Twenty-First Century Fox Inc., Class B | | | 14,714 | | | | 724,959 | |
Viacom Inc., Class B | | | 11,703 | | | | 352,962 | |
World Wrestling Entertainment Inc., Class A | | | 785 | | | | 57,164 | |
| | | | 8,172,180 | |
Multi-Line Insurance – 0.1% | |
American Financial Group Inc. | | | 468 | | | | 50,230 | |
American International Group Inc. | | | 30,271 | | | | 1,604,968 | |
Assurant Inc. | | | 1,569 | | | | 162,376 | |
Horace Mann Educators Corp. | | | 771 | | | | 34,387 | |
Kemper Corp. | | | 1,066 | | | | 80,643 | |
Loews Corp. | | | 8,297 | | | | 400,579 | |
National General Holdings Corp. | | | 1,157 | | | | 30,464 | |
The Hartford Financial Services Group Inc. | | | 12,246 | | | | 626,138 | |
| | | | 2,989,785 | |
Multi-Sector Holdings – 0.6% | |
Berkshire Hathaway Inc., Class B | | | 64,243 | | | | 11,990,956 | (a) |
Cannae Holdings Inc. | | | 1,283 | | | | 23,800 | (a) |
Jefferies Financial Group Inc. | | | 10,667 | | | | 242,567 | |
| | | | 12,257,323 | |
Multi-Utilities – 0.4% | |
Ameren Corp. | | | 8,249 | | | | 501,952 | |
Avista Corp. | | | 1,214 | | | | 63,929 | |
Black Hills Corp. | | | 1,356 | | | | 83,001 | |
CenterPoint Energy Inc. | | | 14,767 | | | | 409,194 | |
CMS Energy Corp. | | | 9,613 | | | | 454,503 | |
Consolidated Edison Inc. | | | 10,460 | | | | 815,671 | |
Dominion Energy Inc. | | | 21,988 | | | | 1,499,142 | |
DTE Energy Co. | | | 5,959 | | | | 617,531 | |
MDU Resources Group Inc. | | | 1,292 | | | | 37,054 | |
NiSource Inc. | | | 10,814 | | | | 284,192 | |
NorthWestern Corp. | | | 1,245 | | | | 71,276 | |
Public Service Enterprise Group Inc. | | | 16,961 | | | | 918,268 | |
SCANA Corp. | | | 4,859 | | | | 187,169 | |
Sempra Energy | | | 8,691 | | | | 1,009,112 | |
Unitil Corp. | | | 278 | | | | 14,189 | |
Vectren Corp. | | | 559 | | | | 39,940 | |
WEC Energy Group Inc. | | | 10,178 | | | | 658,008 | |
| | | | 7,664,131 | |
Office REITs – 0.1% | |
Alexandria Real Estate Equities Inc. | | | 3,400 | | | | 428,978 | |
Boston Properties Inc. | | | 5,064 | | | | 635,127 | |
Corporate Office Properties Trust | | | 665 | | | | 19,278 | |
Cousins Properties Inc. | | | 10,599 | | | | 102,704 | |
See Notes to Schedules of Investments and Notes to Financial Statements.
| | |
| State Street Total Return V.I.S. Fund | | |
| Schedule of Investments | | June 30, 2018 (Unaudited) |
|
| | | | | | | | |
| | | Number
of Shares | | | Fair
Value | |
Douglas Emmett Inc. | | | 1,078 | | | $ | 43,314 | |
Easterly Government Properties Inc. | | | 879 | | | | 17,369 | |
Franklin Street Properties Corp. | | | 1,965 | | | | 16,820 | |
Government Properties Income Trust | | | 1,790 | | | | 28,371 | |
Highwoods Properties Inc. | | | 682 | | | | 34,598 | |
JBG SMITH Properties | | | 626 | | | | 22,830 | |
Kilroy Realty Corp. | | | 665 | | | | 50,301 | |
Mack-Cali Realty Corp. | | | 2,261 | | | | 45,853 | |
NorthStar Realty Europe Corp. | | | 712 | | | | 10,317 | |
Piedmont Office Realty Trust Inc., Class A | | | 2,386 | | | | 47,553 | |
Select Income REIT | | | 1,110 | | | | 24,942 | |
SL Green Realty Corp. | | | 2,835 | | | | 285,003 | |
Tier REIT Inc. | | | 857 | | | | 20,379 | |
Vornado Realty Trust | | | 5,867 | | | | 433,689 | |
| | | | 2,267,426 | |
Office Services & Supplies – 0.0% * | |
ACCO Brands Corp. | | | 1,861 | | | | 25,775 | |
Essendant Inc. | | | 742 | | | | 9,809 | |
Herman Miller Inc. | | | 1,463 | | | | 49,596 | |
HNI Corp. | | | 1,088 | | | | 40,474 | |
Interface Inc. | | | 1,078 | | | | 24,740 | |
Kimball International Inc., Class B | | | 532 | | | | 8,597 | |
Knoll Inc. | | | 871 | | | | 18,126 | |
MSA Safety Inc. | | | 864 | | | | 83,238 | |
NL Industries Inc. | | | 176 | | | | 1,531 | (a) |
Pitney Bowes Inc. | | | 4,800 | | | | 41,136 | |
Steelcase Inc., Class A | | | 1,417 | | | | 19,129 | |
| | | | 322,151 | |
Oil & Gas Drilling – 0.0% * | | | | | | | | |
Diamond Offshore Drilling Inc. | | | 1,629 | | | | 33,981 | (a) |
Helmerich & Payne Inc. | | | 3,684 | | | | 234,892 | |
Independence Contract Drilling Inc. | | | 607 | | | | 2,501 | (a) |
Nabors Industries Ltd. | | | 2,430 | | | | 15,576 | |
Patterson-UTI Energy Inc. | | | 1,503 | | | | 27,054 | |
Pioneer Energy Services Corp. | | | 1,279 | | | | 7,482 | (a) |
Rowan Companies PLC, Class A | | | 3,130 | | | | 50,768 | (a) |
Unit Corp. | | | 864 | | | | 22,084 | (a) |
| | | | 394,338 | |
Oil & Gas Equipment & Services – 0.3% | |
Apergy Corp. | | | 522 | | | | 21,793 | (a) |
Archrock Inc. | | | 2,395 | | | | 28,740 | |
Baker Hughes a GE Co. | | | 14,441 | | | | 476,986 | |
Basic Energy Services Inc. | | | 330 | | | | 3,666 | (a) |
Bristow Group Inc. | | | 464 | | | | 6,547 | |
C&J Energy Services Inc. | | | 1,213 | | | | 28,627 | (a) |
Cactus Inc., Class A | | | 421 | | | | 14,226 | (a) |
CARBO Ceramics Inc. | | | 394 | | | | 3,613 | (a) |
Covia Holdings Corp. | | | 587 | | | | 10,895 | (a) |
Dawson Geophysical Co. | | | 492 | | | | 3,887 | (a) |
Dril-Quip Inc. | | | 963 | | | | 49,498 | (a) |
Era Group Inc. | | | 402 | | | | 5,206 | (a) |
Exterran Corp. | | | 630 | | | | 15,775 | (a) |
Forum Energy Technologies Inc. | | | 1,477 | | | | 18,241 | (a) |
FTS International Inc. | | | 410 | | | | 5,838 | (a) |
Halliburton Co. | | | 29,434 | | | | 1,326,296 | |
Helix Energy Solutions Group Inc. | | | 2,658 | | | | 22,141 | (a) |
ION Geophysical Corp. | | | 231 | | | | 5,613 | (a) |
Keane Group Inc. | | | 965 | | | | 13,192 | (a) |
Key Energy Services Inc. | | | 236 | | | | 3,833 | (a) |
Liberty Oilfield Services Inc., Class A | | | 268 | | | | 5,017 | (a) |
Mammoth Energy Services Inc. | | | 152 | | | | 5,162 | (a) |
Matrix Service Co. | | | 535 | | | | 9,817 | (a) |
McDermott International Inc. | | | 4,533 | | | | 89,073 | (a) |
National Oilwell Varco Inc. | | | 13,065 | | | | 567,021 | |
Natural Gas Services Group Inc. | | | 245 | | | | 5,782 | (a) |
NCS Multistage Holdings Inc. | | | 209 | | | | 3,037 | (a) |
Newpark Resources Inc. | | | 1,688 | | | | 18,315 | (a) |
Nine Energy Service Inc. | | | 147 | | | | 4,869 | (a) |
Oceaneering International Inc. | | | 2,474 | | | | 62,988 | |
Oil States International Inc. | | | 1,115 | | | | 35,791 | (a) |
PHI Inc. | | | 280 | | | | 2,848 | (a) |
ProPetro Holding Corp. | | | 1,350 | | | | 21,168 | (a) |
RigNet Inc. | | | 255 | | | | 2,627 | (a) |
Schlumberger Ltd. | | | 46,233 | | | | 3,098,998 | |
SEACOR Holdings Inc. | | | 315 | | | | 18,040 | (a) |
| | | | | | | | |
| | | Number
of Shares | | | Fair
Value | |
SEACOR Marine Holdings Inc. | | | 316 | | | $ | 7,296 | (a) |
Select Energy Services Inc., Class A | | | 886 | | | | 12,874 | (a) |
Smart Sand Inc. | | | 228 | | | | 1,211 | (a) |
Solaris Oilfield Infrastructure Inc., Class A | | | 531 | | | | 7,588 | (a) |
Superior Energy Services Inc. | | | 3,562 | | | | 34,694 | (a) |
TETRA Technologies Inc. | | | 1,871 | | | | 8,326 | (a) |
Tidewater Inc. | | | 466 | | | | 13,481 | (a) |
U.S. Silica Holdings Inc. | | | 1,461 | | | | 37,533 | |
| | | | 6,138,169 | |
Oil & Gas Exploration & Production – 0.6% | |
Abraxas Petroleum Corp. | | | 2,099 | | | | 6,066 | (a) |
Alta Mesa Resources Inc. | | | 1,871 | | | | 12,741 | (a) |
Anadarko Petroleum Corp. | | | 17,060 | | | | 1,249,645 | |
Apache Corp. | | | 12,963 | | | | 606,020 | |
Bonanza Creek Energy Inc. | | | 341 | | | | 12,914 | (a) |
Cabot Oil & Gas Corp. | | | 15,127 | | | | 360,023 | |
California Resources Corp. | | | 780 | | | | 35,443 | (a) |
Callon Petroleum Co. | | | 5,740 | | | | 61,648 | (a) |
Carrizo Oil & Gas Inc. | | | 1,461 | | | | 40,689 | (a) |
Chesapeake Energy Corp. | | | 6,029 | | | | 31,592 | (a) |
Cimarex Energy Co. | | | 3,293 | | | | 335,030 | |
CNX Resources Corp. | | | 1,311 | | | | 23,309 | (a) |
Concho Resources Inc. | | | 4,826 | | | | 667,677 | (a) |
ConocoPhillips | | | 39,125 | | | | 2,723,882 | |
Denbury Resources Inc. | | | 8,245 | | | | 39,658 | (a) |
Devon Energy Corp. | | | 17,464 | | | | 767,717 | |
Earthstone Energy Inc., Class A | | | 427 | | | | 3,779 | (a) |
Eclipse Resources Corp. | | | 1,210 | | | | 1,936 | (a) |
Energen Corp. | | | 645 | | | | 46,969 | (a) |
Energy XXI Gulf Coast Inc. | | | 560 | | | | 4,950 | (a) |
EOG Resources Inc. | | | 19,117 | | | | 2,378,728 | |
EP Energy Corp., Class A | | | 772 | | | | 2,316 | (a) |
EQT Corp. | | | 8,200 | | | | 452,476 | |
Evolution Petroleum Corp. | | | 511 | | | | 5,033 | |
Gulfport Energy Corp. | | | 4,322 | | | | 54,327 | (a) |
Halcon Resources Corp. | | | 2,397 | | | | 10,523 | (a) |
Hess Corp. | | | 8,770 | | | | 586,625 | |
HighPoint Resources Corp. | | | 1,797 | | | | 10,926 | (a) |
Isramco Inc. | | | 13 | | | | 1,598 | (a) |
Jagged Peak Energy Inc. | | | 1,063 | | | | 13,840 | (a) |
Laredo Petroleum Inc. | �� | | 2,940 | | | | 28,283 | (a) |
Lilis Energy Inc. | | | 955 | | | | 4,966 | (a) |
Marathon Oil Corp. | | | 27,752 | | | | 578,907 | |
Matador Resources Co. | | | 2,512 | | | | 75,486 | (a) |
Midstates Petroleum Company Inc. | | | 211 | | | | 2,872 | (a) |
Murphy Oil Corp. | | | 1,067 | | | | 36,033 | |
Newfield Exploration Co. | | | 6,811 | | | | 206,033 | (a) |
Noble Energy Inc. | | | 16,620 | | | | 586,354 | |
Northern Oil and Gas Inc. | | | 2,267 | | | | 7,141 | (a) |
Oasis Petroleum Inc. | | | 6,724 | | | | 87,210 | (a) |
Panhandle Oil and Gas Inc., Class A | | | 297 | | | | 5,673 | |
PDC Energy Inc. | | | 1,226 | | | | 74,112 | (a) |
Penn Virginia Corp. | | | 202 | | | | 17,148 | (a) |
Pioneer Natural Resources Co. | | | 5,667 | | | | 1,072,423 | |
QEP Resources Inc. | | | 1,615 | | | | 19,800 | (a) |
Range Resources Corp. | | | 1,474 | | | | 24,660 | |
Resolute Energy Corp. | | | 411 | | | | 12,823 | (a) |
Ring Energy Inc. | | | 1,110 | | | | 14,008 | (a) |
Sanchez Energy Corp. | | | 1,125 | | | | 5,085 | (a) |
SandRidge Energy Inc. | | | 438 | | | | 7,770 | (a) |
SilverBow Resources Inc. | | | 159 | | | | 4,592 | (a) |
SM Energy Co. | | | 678 | | | | 17,418 | |
Southwestern Energy Co. | | | 14,460 | | | | 76,638 | (a) |
SRC Energy Inc. | | | 4,500 | | | | 49,590 | (a) |
Talos Energy Inc. | | | 369 | | | | 11,856 | (a) |
Tellurian Inc. | | | 1,554 | | | | 12,929 | (a) |
Ultra Petroleum Corp. | | | 1,931 | | | | 4,461 | (a) |
W&T Offshore Inc. | | | 1,772 | | | | 12,670 | (a) |
WildHorse Resource Development Corp. | | | 444 | | | | 11,260 | (a) |
WPX Energy Inc. | | | 2,633 | | | | 47,473 | (a) |
Zion Oil & Gas Inc. | | | 900 | | | | 3,649 | (a) |
| | | | 13,667,403 | |
See Notes to Schedules of Investments and Notes to Financial Statements.
| | |
| State Street Total Return V.I.S. Fund | | |
| Schedule of Investments | | June 30, 2018 (Unaudited) |
|
| | | | | | | | |
| | | Number
of Shares | | | Fair
Value | |
Oil & Gas Refining & Marketing – 0.3% | |
Adams Resources & Energy Inc. | | | 39 | | | $ | 1,677 | |
Andeavor | | | 4,504 | | | | 590,835 | |
Clean Energy Fuels Corp. | | | 1,753 | | | | 6,468 | (a) |
CVR Energy Inc. | | | 240 | | | | 8,878 | |
Delek US Holdings Inc. | | | 1,544 | | | | 77,462 | |
Green Plains Inc. | | | 727 | | | | 13,304 | |
HollyFrontier Corp. | | | 5,900 | | | | 403,737 | |
Marathon Petroleum Corp. | | | 15,203 | | | | 1,066,642 | |
Par Pacific Holdings Inc. | | | 602 | | | | 10,463 | (a) |
PBF Energy Inc., Class A | | | 733 | | | | 30,735 | |
Phillips 66 | | | 13,990 | | | | 1,571,217 | |
Renewable Energy Group Inc. | | | 729 | | | | 13,013 | (a) |
REX American Resources Corp. | | | 114 | | | | 9,230 | (a) |
Valero Energy Corp. | | | 14,425 | | | | 1,598,723 | |
World Fuel Services Corp. | | | 1,715 | | | | 35,003 | |
| | | | 5,437,387 | |
Oil & Gas Storage & Transportation – 0.1% | |
Dorian LPG Ltd. | | | 557 | | | | 4,255 | (a) |
GasLog Ltd. | | | 649 | | | | 12,396 | |
International Seaways Inc. | | | 354 | | | | 8,192 | (a) |
Kinder Morgan Inc. | | | 63,888 | | | | 1,128,901 | |
Nordic American Tankers Ltd. | | | 1,750 | | | | 4,690 | |
ONEOK Inc. | | | 13,557 | | | | 946,685 | |
Overseas Shipholding Group Inc., Class A | | | 385 | | | | 1,494 | (a) |
SemGroup Corp., Class A | | | 1,480 | | | | 37,592 | |
Ship Finance International Ltd. | | | 1,579 | | | | 23,606 | |
The Williams Companies Inc. | | | 27,100 | | | | 734,681 | |
| | | | 2,902,492 | |
Packaged Foods & Meats – 0.4% | |
B&G Foods Inc. | | | 1,161 | | | | 34,714 | |
Cal-Maine Foods Inc. | | | 587 | | | | 26,914 | (a) |
Calavo Growers Inc. | | | 282 | | | | 27,114 | |
Campbell Soup Co. | | | 6,585 | | | | 266,956 | |
Conagra Brands Inc. | | | 12,742 | | | | 455,272 | |
Dean Foods Co. | | | 1,723 | | | | 18,109 | |
Farmer Brothers Co. | | | 161 | | | | 4,918 | (a) |
Flowers Foods Inc. | | | 1,219 | | | | 25,392 | |
Freshpet Inc. | | | 458 | | | | 12,572 | (a) |
General Mills Inc. | | | 19,388 | | | | 858,113 | |
Hormel Foods Corp. | | | 9,208 | | | | 342,630 | |
Hostess Brands Inc. | | | 1,866 | | | | 25,377 | (a) |
J&J Snack Foods Corp. | | | 258 | | | | 39,337 | |
John B Sanfilippo & Son Inc. | | | 171 | | | | 12,731 | |
Kellogg Co. | | | 8,602 | | | | 601,022 | |
Lamb Weston Holdings Inc. | | | 967 | | | | 66,249 | |
Lancaster Colony Corp. | | | 481 | | | | 66,580 | |
Landec Corp. | | | 537 | | | | 8,001 | (a) |
McCormick & Company Inc. | | | 4,191 | | | | 486,533 | |
Mondelez International Inc., Class A | | | 49,106 | | | | 2,013,346 | |
Post Holdings Inc. | | | 442 | | | | 38,021 | (a) |
Sanderson Farms Inc. | | | 516 | | | | 54,257 | |
Seneca Foods Corp., Class A | | | 129 | | | | 3,483 | (a) |
The Hain Celestial Group Inc. | | | 693 | | | | 20,651 | (a) |
The Hershey Co. | | | 4,472 | | | | 416,164 | |
The JM Smucker Co. | | | 3,864 | | | | 415,303 | |
The Kraft Heinz Co. | | | 19,540 | | | | 1,227,503 | |
The Simply Good Foods Co. | | | 1,163 | | | | 16,794 | (a) |
Tootsie Roll Industries Inc. | | | 456 | | | | 14,068 | |
TreeHouse Foods Inc. | | | 368 | | | | 19,324 | (a) |
Tyson Foods Inc., Class A | | | 9,647 | | | | 664,196 | |
| | | | 8,281,644 | |
Paper Packaging – 0.1% | |
Avery Dennison Corp. | | | 3,016 | | | | 307,933 | |
Bemis Company Inc. | | | 595 | | | | 25,115 | |
International Paper Co. | | | 13,729 | | | | 715,006 | |
Packaging Corporation of America | | | 3,200 | | | | 357,728 | |
Sealed Air Corp. | | | 5,691 | | | | 241,583 | |
Sonoco Products Co. | | | 662 | | | | 34,755 | |
UFP Technologies Inc. | | | 127 | | | | 3,918 | (a) |
WestRock Co. | | | 8,833 | | | | 503,658 | |
| | | | 2,189,696 | |
Paper Products – 0.0% * | |
Clearwater Paper Corp. | | | 284 | | | | 6,560 | (a) |
Domtar Corp. | | | 429 | | | | 20,481 | |
KapStone Paper and Packaging Corp. | | | 1,630 | | | | 56,235 | |
| | | | | | | | |
| | | Number
of Shares | | | Fair
Value | |
Neenah Inc. | | | 299 | | | $ | 25,370 | |
PH Glatfelter Co. | | | 705 | | | | 13,811 | |
Schweitzer-Mauduit International Inc. | | | 545 | | | | 23,827 | |
Verso Corp., Class A | | | 672 | | | | 14,623 | (a) |
| | | | 160,907 | |
Personal Products – 0.1% | |
Coty Inc., Class A | | | 16,101 | | | | 227,024 | |
Edgewell Personal Care Co. | | | 1,368 | | | | 69,029 | (a) |
elf Beauty Inc. | | | 392 | | | | 5,974 | (a) |
Inter Parfums Inc. | | | 320 | | | | 17,120 | |
Medifast Inc. | | | 219 | | | | 35,075 | |
Natural Health Trends Corp. | | | 150 | | | | 3,753 | |
Nature’s Sunshine Products Inc. | | | 183 | | | | 1,711 | (a) |
Nu Skin Enterprises Inc., Class A | | | 365 | | | | 28,540 | |
Revlon Inc., Class A | | | 37 | | | | 649 | (a) |
The Estee Lauder Companies Inc., Class A | | | 7,387 | | | | 1,054,051 | |
USANA Health Sciences Inc. | | | 239 | | | | 27,557 | (a) |
| | | | 1,470,483 | |
Pharmaceuticals – 1.6% | |
Aclaris Therapeutics Inc. | | | 382 | | | | 7,628 | (a) |
Aerie Pharmaceuticals Inc. | | | 663 | | | | 44,786 | (a) |
Akcea Therapeutics Inc. | | | 278 | | | | 6,591 | (a) |
Akorn Inc. | | | 2,412 | | | | 40,015 | (a) |
Allergan PLC | | | 10,990 | | | | 1,832,253 | |
Amneal Pharmaceuticals Inc. | | | 1,631 | | | | 26,765 | (a) |
Amphastar Pharmaceuticals Inc. | | | 712 | | | | 10,865 | (a) |
Ampio Pharmaceuticals Inc. | | | 1,600 | | | | 3,520 | (a) |
ANI Pharmaceuticals Inc. | | | 159 | | | | 10,621 | (a) |
Aratana Therapeutics Inc. | | | 671 | | | | 2,852 | (a) |
Assembly Biosciences Inc. | | | 266 | | | | 10,430 | (a) |
Bristol-Myers Squibb Co. | | | 54,538 | | | | 3,018,133 | |
Catalent Inc. | | | 888 | | | | 37,198 | (a) |
Clearside Biomedical Inc. | | | 440 | | | | 4,704 | (a) |
Collegium Pharmaceutical Inc. | | | 466 | | | | 11,114 | (a) |
Corcept Therapeutics Inc. | | | 1,722 | | | | 27,070 | (a) |
Corium International Inc. | | | 376 | | | | 3,012 | (a) |
Cymabay Therapeutics Inc. | | | 1,136 | | | | 15,245 | (a) |
Depomed Inc. | | | 1,223 | | | | 8,157 | (a) |
Dermira Inc. | | | 722 | | | | 6,642 | (a) |
Dova Pharmaceuticals Inc. | | | 243 | | | | 7,271 | (a) |
Durect Corp. | | | 2,560 | | | | 3,994 | (a) |
Eli Lilly & Co. | | | 32,018 | | | | 2,732,096 | |
Eloxx Pharmaceuticals Inc. | | | 433 | | | | 7,391 | (a) |
Endocyte Inc. | | | 1,245 | | | | 17,181 | (a) |
Evolus Inc. | | | 122 | | | | 3,415 | (a) |
Horizon Pharma PLC | | | 3,070 | | | | 50,839 | (a) |
Innovate Biopharmaceuticals Inc. | | | 200 | | | | 4,714 | (a) |
Innoviva Inc. | | | 1,290 | | | | 17,802 | (a) |
Intersect ENT Inc. | | | 515 | | | | 19,287 | (a) |
Intra-Cellular Therapies Inc. | | | 859 | | | | 15,178 | (a) |
Johnson & Johnson | | | 89,493 | | | | 10,859,081 | |
Kala Pharmaceuticals Inc. | | | 152 | | | | 2,087 | (a) |
Lannett Company Inc. | | | 560 | | | | 7,616 | (a) |
Mallinckrodt PLC | | | 2,109 | | | | 39,354 | (a) |
Marinus Pharmaceuticals Inc. | | | 784 | | | | 5,543 | (a) |
Melinta Therapeutics Inc. | | | 173 | | | | 1,099 | (a) |
Menlo Therapeutics Inc. | | | 141 | | | | 1,145 | (a) |
Merck & Company Inc. | | | 89,812 | | | | 5,451,588 | |
Mylan N.V. | | | 17,190 | | | | 621,247 | (a) |
MyoKardia Inc. | | | 575 | | | | 28,549 | (a) |
Nektar Therapeutics | | | 5,400 | | | | 263,682 | (a) |
Neos Therapeutics Inc. | | | 456 | | | | 2,850 | (a) |
Ocular Therapeutix Inc. | | | 319 | | | | 2,153 | (a) |
Odonate Therapeutics Inc. | | | 154 | | | | 3,400 | (a) |
Omeros Corp. | | | 777 | | | | 14,095 | (a) |
Optinose Inc. | | | 329 | | | | 9,205 | (a) |
Pacira Pharmaceuticals Inc. | | | 701 | | | | 22,467 | (a) |
Paratek Pharmaceuticals Inc. | | | 362 | | | | 3,692 | (a) |
Pfizer Inc. | | | 194,779 | | | | 7,066,582 | |
Phibro Animal Health Corp., Class A | | | 379 | | | | 17,453 | |
Prestige Brands Holdings Inc. | | | 1,340 | | | | 51,429 | (a) |
Reata Pharmaceuticals Inc., Class A | | | 312 | | | | 10,911 | (a) |
Revance Therapeutics Inc. | | | 627 | | | | 17,211 | (a) |
Sienna Biopharmaceuticals Inc. | | | 315 | | | | 4,785 | (a) |
SIGA Technologies Inc. | | | 1,064 | | | | 6,320 | (a) |
See Notes to Schedules of Investments and Notes to Financial Statements.
| | |
| State Street Total Return V.I.S. Fund | | |
| Schedule of Investments | | June 30, 2018 (Unaudited) |
|
| | | | | | | | |
| | | Number
of Shares | | | Fair
Value | |
Supernus Pharmaceuticals Inc. | | | 858 | | | $ | 51,351 | (a) |
Teligent Inc. | | | 826 | | | | 2,858 | (a) |
Tetraphase Pharmaceuticals Inc. | | | 738 | | | | 2,635 | (a) |
The Medicines Co. | | | 1,281 | | | | 47,013 | (a) |
TherapeuticsMD Inc. | | | 3,005 | | | | 18,751 | (a) |
WaVe Life Sciences Ltd. | | | 339 | | | | 12,967 | (a) |
Zoetis Inc. | | | 16,366 | | | | 1,394,219 | |
Zogenix Inc. | | | 631 | | | | 27,890 | (a) |
| | | | 34,077,997 | |
Property & Casualty Insurance – 0.2% | |
Ambac Financial Group Inc. | | | 710 | | | | 14,094 | (a) |
AMERISAFE Inc. | | | 326 | | | | 18,827 | |
AmtTust Financial Services Inc. | | | 2,080 | | | | 30,306 | |
Baldwin & Lyons Inc., Class B | | | 179 | | | | 4,368 | |
Cincinnati Financial Corp. | | | 4,871 | | | | 325,675 | |
Donegal Group Inc., Class A | | | 163 | | | | 2,218 | |
EMC Insurance Group Inc. | | | 168 | | | | 4,667 | |
Employers Holdings Inc. | | | 565 | | | | 22,713 | |
FedNat Holding Co. | | | 257 | | | | 5,929 | |
First American Financial Corp. | | | 743 | | | | 38,428 | |
Hallmark Financial Services Inc. | | | 283 | | | | 2,824 | (a) |
HCI Group Inc. | | | 123 | | | | 5,113 | |
Heritage Insurance Holdings Inc. | | | 375 | | | | 6,251 | |
Infinity Property & Casualty Corp. | | | 182 | | | | 25,908 | |
Investors Title Co. | | | 28 | | | | 5,170 | |
Kingstone Companies Inc. | | | 127 | | | | 2,146 | |
Kinsale Capital Group Inc. | | | 372 | | | | 20,408 | |
MBIA Inc. | | | 1,632 | | | | 14,753 | (a) |
Mercury General Corp. | | | 247 | | | | 11,253 | |
NI Holdings Inc. | | | 236 | | | | 4,000 | (a) |
Old Republic International Corp. | | | 1,648 | | | | 32,812 | |
ProAssurance Corp. | | | 993 | | | | 35,202 | |
RLI Corp. | | | 729 | | | | 48,253 | |
Safety Insurance Group Inc. | | | 264 | | | | 22,546 | |
Selective Insurance Group Inc. | | | 1,075 | | | | 59,125 | |
State Auto Financial Corp. | | | 310 | | | | 9,272 | |
Stewart Information Services Corp. | | | 374 | | | | 16,108 | |
The Allstate Corp. | | | 11,716 | | | | 1,069,319 | |
The Hanover Insurance Group Inc. | | | 283 | | | | 33,835 | |
The Navigators Group Inc. | | | 369 | | | | 21,033 | |
The Progressive Corp. | | | 19,572 | | | | 1,157,684 | |
The Travelers Companies Inc. | | | 8,936 | | | | 1,093,230 | |
Tiptree Inc. | | | 455 | | | | 3,094 | |
United Fire Group Inc. | | | 357 | | | | 19,460 | |
United Insurance Holdings Corp. | | | 350 | | | | 6,853 | |
Universal Insurance Holdings Inc. | | | 553 | | | | 19,410 | |
WR Berkley Corp. | | | 631 | | | | 45,691 | |
| | | | 4,257,978 | |
Publishing – 0.0% * | |
Daily Journal Corp. | | | 22 | | | | 5,064 | (a) |
Gannett Company Inc. | | | 1,848 | | | | 19,774 | |
John Wiley & Sons Inc., Class A | | | 300 | | | | 18,720 | |
Meredith Corp. | | | 1,001 | | | | 51,051 | |
New Media Investment Group Inc. | | | 1,134 | | | | 20,956 | |
News Corp., Class A | | | 13,100 | | | | 203,050 | |
News Corp., Class B | | | 4,475 | | | | 70,929 | |
Scholastic Corp. | | | 536 | | | | 23,750 | |
The New York Times Co., Class A | | | 3,266 | | | | 84,589 | |
tronc Inc. | | | 370 | | | | 6,394 | (a) |
| | | | 504,277 | |
Railroads – 0.3% | |
CSX Corp. | | | 28,955 | | | | 1,846,750 | |
Genesee & Wyoming Inc., Class A | | | 397 | | | | 32,284 | (a) |
Kansas City Southern | | | 3,546 | | | | 375,734 | |
Norfolk Southern Corp. | | | 9,374 | | | | 1,414,255 | |
Union Pacific Corp. | | | 25,947 | | | | 3,676,171 | |
| | | | 7,345,194 | |
Real Estate Development – 0.0% * | |
Forestar Group Inc. | | | 230 | | | | 4,773 | (a) |
Stratus Properties Inc. | | | 122 | | | | 3,727 | (a) |
| | | | 8,500 | |
Real Estate Operating Companies – 0.0% * | |
FRP Holdings Inc. | | | 127 | | | | 8,223 | (a) |
Kennedy-Wilson Holdings Inc. | | | 2,331 | | | | 49,301 | |
Trinity Place Holdings Inc. | | | 367 | | | | 2,404 | (a) |
| | | | 59,928 | |
| | | | | | | | |
| | | Number
of Shares | | | Fair
Value | |
Real Estate Services – 0.0% * | |
CBRE Group Inc., Class A | | | 10,380 | | | $ | 495,541 | (a) |
HFF Inc. REIT, Class A | | | 681 | | | | 23,392 | |
Jones Lang LaSalle Inc. | | | 301 | | | | 49,963 | |
Marcus & Millichap Inc. | | | 308 | | | | 12,015 | (a) |
Newmark Group Inc., Class A | | | 421 | | | | 5,991 | |
RE/MAX Holdings Inc., Class A | | | 330 | | | | 17,309 | |
Redfin Corp. | | | 1,391 | | | | 32,118 | (a) |
| | | | 636,329 | |
Regional Banks – 0.7% | |
1st Constitution Bancorp | | | 172 | | | | 3,939 | |
1st Source Corp. | | | 250 | | | | 13,358 | |
Access National Corp. | | | 290 | | | | 8,294 | |
ACNB Corp. | | | 119 | | | | 4,052 | |
Allegiance Bancshares Inc. | | | 220 | | | | 9,537 | (a) |
American National Bankshares Inc. | | | 166 | | | | 6,640 | |
Ameris Bancorp. | | | 744 | | | | 39,692 | |
Ames National Corp. | | | 174 | | | | 5,368 | |
Arrow Financial Corp. | | | 233 | | | | 8,481 | |
Associated Banc-Corp. | | | 1,147 | | | | 31,313 | |
Atlantic Capital Bancshares Inc. | | | 346 | | | | 6,799 | (a) |
Banc of California Inc. | | | 770 | | | | 15,054 | |
BancFirst Corp. | | | 314 | | | | 18,589 | |
BancorpSouth Bank | | | 2,315 | | | | 76,279 | |
Bank of Commerce Holdings | | | 360 | | | | 4,590 | |
Bank of Hawaii Corp. | | | 282 | | | | 23,524 | |
Bank of Marin Bancorp. | | | 119 | | | | 9,621 | |
Bank of the Ozarks Inc. | | | 810 | | | | 36,482 | |
Bankwell Financial Group Inc. | | | 110 | | | | 3,537 | |
Banner Corp. | | | 600 | | | | 36,078 | |
Bar Harbor Bankshares | | | 289 | | | | 8,754 | |
Baycom Corp. | | | 222 | | | | 5,495 | (a) |
BB&T Corp. | | | 25,854 | | | | 1,304,076 | |
BCB Bancorp Inc. | | | 177 | | | | 2,655 | |
Berkshire Hills Bancorp Inc. | | | 745 | | | | 30,247 | |
Blue Hills Bancorp Inc. | | | 327 | | | | 7,259 | |
Boston Private Financial Holdings Inc. | | | 1,529 | | | | 24,311 | |
Bridge Bancorp Inc. | | | 247 | | | | 8,880 | |
Brookline Bancorp Inc. | | | 1,394 | | | | 25,928 | |
Bryn Mawr Bank Corp. | | | 334 | | | | 15,464 | |
Business First Bancshares Inc. | | | 205 | | | | 5,402 | |
Byline Bancorp Inc. | | | 304 | | | | 6,791 | (a) |
C&F Financial Corp. | | | 62 | | | | 3,878 | |
Cadence BanCorp | | | 847 | | | | 24,453 | |
Cambridge Bancorp | | | 77 | | | | 6,664 | |
Camden National Corp. | | | 304 | | | | 13,896 | |
Capital City Bank Group Inc. | | | 221 | | | | 5,222 | |
Capstar Financial Holdings Inc. | | | 163 | | | | 3,020 | (a) |
Carolina Financial Corp. | | | 377 | | | | 16,181 | |
Cathay General Bancorp | | | 1,951 | | | | 78,996 | |
CB Financial Services Inc. | | | 108 | | | | 3,715 | |
CBTX Inc. | | | 365 | | | | 12,063 | |
CenterState Bank Corp. | | | 1,538 | | | | 45,863 | |
Central Pacific Financial Corp. | | | 492 | | | | 14,096 | |
Central Valley Community Bancorp | | | 178 | | | | 3,766 | |
Century Bancorp Inc., Class A | | | 55 | | | | 4,202 | |
Chemical Financial Corp. | | | 1,791 | | | | 99,705 | |
Chemung Financial Corp. | | | 55 | | | | 2,756 | |
Citizens & Northern Corp. | | | 239 | | | | 6,181 | |
Citizens Financial Group Inc. | | | 15,985 | | | | 621,816 | |
City Holding Co. | | | 248 | | | | 18,657 | |
Civista Bancshares Inc. | | | 224 | | | | 5,430 | |
CNB Financial Corp. | | | 281 | | | | 8,447 | |
CoBiz Financial Inc. | | | 753 | | | | 16,174 | |
Codorus Valley Bancorp Inc. | | | 166 | | | | 5,093 | |
Columbia Banking System Inc. | | | 1,356 | | | | 55,460 | |
Comerica Inc. | | | 5,904 | | | | 536,792 | |
Commerce Bancshares Inc. | | | 627 | | | | 40,573 | |
Community Bank System Inc. | | | 932 | | | | 55,053 | |
Community Bankers Trust Corp. | | | 495 | | | | 4,430 | (a) |
Community Trust Bancorp Inc. | | | 243 | | | | 12,138 | |
ConnectOne Bancorp Inc. | | | 572 | | | | 14,243 | |
County Bancorp Inc. | | | 84 | | | | 2,310 | |
See Notes to Schedules of Investments and Notes to Financial Statements.
| | |
| State Street Total Return V.I.S. Fund | | |
Schedule of Investments | | June 30, 2018 (Unaudited) |
| | | | | | | | |
| | | Number
of Shares | | | Fair
Value | |
Cullen/Frost Bankers Inc. | | | 385 | | | $ | 41,672 | |
Customers Bancorp Inc. | | | 487 | | | | 13,821 | (a) |
CVB Financial Corp. | | | 1,930 | | | | 43,271 | |
Eagle Bancorp Inc. | | | 576 | | | | 35,309 | (a) |
East West Bancorp Inc. | | | 967 | | | | 63,048 | |
Enterprise Bancorp Inc. | | | 170 | | | | 6,873 | |
Enterprise Financial Services Corp. | | | 384 | | | | 20,717 | |
Equity Bancshares Inc., Class A | | | 224 | | | | 9,292 | (a) |
Esquire Financial Holdings Inc. | | | 140 | | | | 3,695 | (a) |
Evans Bancorp Inc. | | | 105 | | | | 4,841 | |
Farmers & Merchants Bancorp Inc./Archbold | | | 168 | | | | 6,779 | |
Farmers Capital Bank Corp. | | | 144 | | | | 7,502 | |
Farmers National Banc Corp. | | | 506 | | | | 8,071 | |
FB Financial Corp. | | | 243 | | | | 9,895 | |
FCB Financial Holdings Inc., Class A | | | 789 | | | | 46,393 | (a) |
Fidelity D&D Bancorp Inc. | | | 65 | | | | 4,029 | |
Fidelity Southern Corp. | | | 420 | | | | 10,672 | |
Fifth Third Bancorp | | | 22,950 | | | | 658,665 | |
Financial Institutions Inc. | | | 280 | | | | 9,212 | |
First Bancorp Inc. | | | 207 | | | | 5,842 | |
First Bancorp/Southern Pines NC | | | 555 | | | | 22,705 | |
First Bank | | | 360 | | | | 5,004 | |
First Busey Corp. | | | 729 | | | | 23,124 | |
First Business Financial Services Inc. | | | 163 | | | | 4,238 | |
First Choice Bancorp | | | 136 | | | | 4,156 | |
First Commonwealth Financial Corp. | | | 1,786 | | | | 27,701 | |
First Community Bancshares Inc. | | | 315 | | | | 10,036 | |
First Community Corp. | | | 165 | | | | 4,142 | |
First Connecticut Bancorp Inc. | | | 275 | | | | 8,415 | |
First Financial Bancorp. | | | 1,668 | | | | 51,124 | |
First Financial Bankshares Inc. | | | 1,203 | | | | 61,233 | |
First Financial Corp. | | | 201 | | | | 9,115 | |
First Financial Northwest Inc. | | | 175 | | | | 3,416 | |
First Foundation Inc. | | | 516 | | | | 9,567 | (a) |
First Horizon National Corp. | | | 2,159 | | | | 38,517 | |
First Internet Bancorp | | | 105 | | | | 3,581 | |
First Interstate BancSystem Inc., Class A | | | 621 | | | | 26,206 | |
First Merchants Corp. | | | 920 | | | | 42,688 | |
First Mid-Illinois Bancshares Inc. | | | 238 | | | | 9,353 | |
First Midwest Bancorp Inc. | | | 1,793 | | | | 45,668 | |
First Northwest Bancorp | | | 210 | | | | 3,354 | (a) |
First United Corp. | | | 160 | | | | 3,272 | |
Flushing Financial Corp. | | | 432 | | | | 11,275 | |
FNB Bancorp | | | 98 | | | | 3,594 | |
FNB Corp. | | | 2,172 | | | | 29,148 | |
Franklin Financial Network Inc. | | | 187 | | | | 7,031 | (a) |
Fulton Financial Corp. | | | 4,396 | | | | 72,534 | |
German American Bancorp Inc. | | | 326 | | | | 11,687 | |
Glacier Bancorp Inc. | | | 1,573 | | | | 60,844 | |
Great Southern Bancorp Inc. | | | 216 | | | | 12,355 | |
Great Western Bancorp Inc. | | | 1,102 | | | | 46,273 | |
Green Bancorp Inc. | | | 425 | | | | 9,180 | |
Guaranty Bancorp | | | 473 | | | | 14,095 | |
Guaranty Bancshares Inc. | | | 143 | | | | 4,710 | |
Hancock Whitney Corp. | | | 2,148 | | | | 100,204 | |
Hanmi Financial Corp. | | | 566 | | | | 16,046 | |
HarborOne Bancorp Inc. | | | 291 | | | | 5,512 | (a) |
Heartland Financial USA Inc. | | | 552 | | | | 30,277 | |
Heritage Commerce Corp. | | | 777 | | | | 13,201 | |
Heritage Financial Corp. | | | 641 | | | | 22,339 | |
Hilltop Holdings Inc. | | | 1,328 | | | | 29,309 | |
Home BancShares Inc. | | | 3,987 | | | | 89,947 | |
HomeTrust Bancshares Inc. | | | 322 | | | | 9,064 | (a) |
Hope Bancorp Inc. | | | 2,303 | | | | 41,062 | |
Horizon Bancorp Inc. | | | 716 | | | | 14,814 | |
Howard Bancorp Inc. | | | 167 | | | | 3,006 | (a) |
Huntington Bancshares Inc. | | | 36,760 | | | | 542,578 | |
IBERIABANK Corp. | | | 1,037 | | | | 78,605 | |
Independent Bank Corp. | | | 404 | | | | 10,302 | |
Independent Bank Corp. | | | 484 | | | | 37,946 | |
Independent Bank Group Inc. | | | 398 | | | | 26,586 | |
International Bancshares Corp. | | | 1,311 | | | | 56,111 | |
Investar Holding Corp. | | | 186 | | | | 5,143 | |
Investors Bancorp Inc. | | | 4,639 | | | | 59,333 | |
| | | | | | | | |
| | | Number
of Shares | | | Fair
Value | |
KeyCorp | | | 35,495 | | | $ | 693,572 | |
Lakeland Bancorp Inc. | | | 788 | | | | 15,642 | |
Lakeland Financial Corp. | | | 448 | | | | 21,589 | |
LCNB Corp. | | | 180 | | | | 3,546 | |
LegacyTexas Financial Group Inc. | | | 835 | | | | 32,582 | |
Live Oak Bancshares Inc. | | | 398 | | | | 12,199 | |
M&T Bank Corp. | | | 4,861 | | | | 827,099 | |
Macatawa Bank Corp. | | | 536 | | | | 6,507 | |
MB Financial Inc. | | | 2,106 | | | | 98,350 | |
MBT Financial Corp. | | | 362 | | | | 3,855 | |
Mercantile Bank Corp. | | | 320 | | | | 11,827 | |
Metropolitan Bank Holding Corp. | | | 73 | | | | 3,831 | (a) |
Mid Penn Bancorp Inc. | | | 110 | | | | 3,839 | |
Middlefield Banc Corp. | | | 71 | | | | 3,600 | |
Midland States Bancorp Inc. | | | 409 | | | | 14,012 | |
MidSouth Bancorp Inc. | | | 270 | | | | 3,578 | |
MidWestOne Financial Group Inc. | | | 166 | | | | 5,607 | |
MutualFirst Financial Inc. | | | 105 | | | | 3,964 | |
MVB Financial Corp. | | | 199 | | | | 3,592 | |
National Bank Holdings Corp., Class A | | | 463 | | | | 17,867 | |
National Bankshares Inc. | | | 137 | | | | 6,357 | |
National Commerce Corp. | | | 290 | | | | 13,427 | (a) |
NBT Bancorp Inc. | | | 800 | | | | 30,520 | |
Nicolet Bankshares Inc. | | | 151 | | | | 8,322 | (a) |
Northeast Bancorp | | | 134 | | | | 2,921 | |
Northrim BanCorp Inc. | | | 136 | | | | 5,379 | |
Norwood Financial Corp. | | | 133 | | | | 4,791 | |
Oak Valley Bancorp | | | 165 | | | | 3,774 | |
OFG Bancorp | | | 644 | | | | 9,048 | |
Ohio Valley Banc Corp. | | | 31 | | | | 1,626 | |
Old Line Bancshares Inc. | | | 310 | | | | 10,822 | |
Old National Bancorp | | | 2,808 | | | | 52,229 | |
Old Second Bancorp Inc. | | | 574 | | | | 8,266 | |
Opus Bank | | | 333 | | | | 9,557 | |
Origin Bancorp Inc. | | | 319 | | | | 13,060 | |
Orrstown Financial Services Inc. | | | 172 | | | | 4,472 | |
Pacific Mercantile Bancorp | | | 74 | | | | 722 | (a) |
Pacific Premier Bancorp Inc. | | | 854 | | | | 32,580 | (a) |
PacWest Bancorp | | | 840 | | | | 41,513 | |
Park National Corp. | | | 240 | | | | 26,741 | |
Parke Bancorp Inc. | | | 162 | | | | 3,831 | |
Peapack Gladstone Financial Corp. | | | 317 | | | | 10,965 | |
Penns Woods Bancorp Inc. | | | 95 | | | | 4,254 | |
People’s United Financial Inc. | | | 11,949 | | | | 216,157 | |
People’s Utah Bancorp | | | 262 | | | | 9,353 | |
Peoples Bancorp Inc. | | | 321 | | | | 12,127 | |
Peoples Bancorp of North Carolina Inc. | | | 121 | | | | 3,876 | |
Peoples Financial Services Corp. | | | 138 | | | | 6,489 | |
Pinnacle Financial Partners Inc. | | | 497 | | | | 30,491 | |
Preferred Bank | | | 242 | | | | 14,873 | |
Premier Financial Bancorp Inc. | | | 238 | | | | 4,443 | |
Prosperity Bancshares Inc. | | | 465 | | | | 31,787 | |
QCR Holdings Inc. | | | 235 | | | | 11,151 | |
RBB Bancorp | | | 275 | | | | 8,833 | |
Regions Financial Corp. | | | 38,475 | | | | 684,085 | |
Reliant Bancorp Inc. | | | 162 | | | | 4,544 | |
Renasant Corp. | | | 899 | | | | 40,922 | |
Republic Bancorp Inc., Class A | | | 191 | | | | 8,652 | |
Republic First Bancorp Inc. | | | 678 | | | | 5,322 | (a) |
S&T Bancorp Inc. | | | 617 | | | | 26,679 | |
Sandy Spring Bancorp Inc. | | | 615 | | | | 25,221 | |
SB One Bancorp | | | 158 | | | | 4,693 | |
Seacoast Banking Corporation of Florida | | | 787 | | | | 24,853 | (a) |
Select Bancorp Inc. | | | 269 | | | | 3,623 | (a) |
ServisFirst Bancshares Inc. | | | 869 | | | | 36,263 | |
Shore Bancshares Inc. | | | 250 | | | | 4,755 | |
Sierra Bancorp | | | 237 | | | | 6,693 | |
Signature Bank | | | 355 | | | | 45,397 | (a) |
Simmons First National Corp., Class A | | | 1,681 | | | | 50,262 | |
SmartFinancial Inc. | | | 166 | | | | 4,276 | (a) |
South State Corp. | | | 677 | | | | 58,391 | |
Southern First Bancshares Inc. | | | 112 | | | | 4,950 | (a) |
Southern National Bancorp of Virginia Inc. | | | 238 | | | | 4,246 | |
Southside Bancshares Inc. | | | 631 | | | | 21,252 | |
See Notes to Schedules of Investments and Notes to Financial Statements.
| | |
| State Street Total Return V.I.S. Fund | | |
Schedule of Investments | | June 30, 2018 (Unaudited) |
| | | | | | | | |
| | | Number
of Shares | | | Fair
Value | |
State Bank Financial Corp. | | | 703 | | | $ | 23,480 | |
Sterling Bancorp | | | 1,497 | | | | 35,179 | |
Stock Yards Bancorp Inc. | | | 341 | | | | 13,009 | |
Summit Financial Group Inc. | | | 166 | | | | 4,455 | |
SunTrust Banks Inc. | | | 15,498 | | | | 1,023,178 | |
SVB Financial Group | | | 1,800 | | | | 519,768 | (a) |
Synovus Financial Corp. | | | 784 | | | | 41,419 | |
TCF Financial Corp. | | | 1,115 | | | | 27,451 | |
Texas Capital Bancshares Inc. | | | 326 | | | | 29,829 | (a) |
The Bancorp Inc. | | | 713 | | | | 7,458 | (a) |
The Bank of Princeton | | | 131 | | | | 4,356 | (a) |
The Community Financial Corp. | | | 74 | | | | 2,617 | |
The First Bancshares Inc. | | | 161 | | | | 5,788 | |
The First of Long Island Corp. | | | 429 | | | | 10,661 | |
The PNC Financial Services Group Inc. | | | 15,769 | | | | 2,130,392 | |
Tompkins Financial Corp. | | | 249 | | | | 21,384 | |
TowneBank | | | 1,230 | | | | 39,483 | |
Trico Bancshares | | | 321 | | | | 12,021 | |
TriState Capital Holdings Inc. | | | 439 | | | | 11,458 | (a) |
Triumph Bancorp Inc. | | | 458 | | | | 18,664 | (a) |
Trustmark Corp. | | | 1,719 | | | | 56,091 | |
UMB Financial Corp. | | | 1,134 | | | | 86,445 | |
Umpqua Holdings Corp. | | | 1,457 | | | | 32,914 | |
Union Bankshares Corp. | | | 1,218 | | | | 47,356 | |
Union Bankshares Inc. | | | 78 | | | | 4,048 | |
United Bankshares Inc. | | | 2,589 | | | | 94,240 | |
United Community Banks Inc. | | | 1,459 | | | | 44,748 | |
United Security Bancshares | | | 315 | | | | 3,528 | |
Unity Bancorp Inc. | | | 52 | | | | 1,183 | |
Univest Corporation of Pennsylvania | | | 499 | | | | 13,723 | |
Valley National Bancorp | | | 7,739 | | | | 94,106 | |
Veritex Holdings Inc. | | | 450 | | | | 13,982 | (a) |
Washington Trust Bancorp Inc. | | | 257 | | | | 14,932 | |
Webster Financial Corp. | | | 612 | | | | 38,984 | |
WesBanco Inc. | | | 832 | | | | 37,473 | |
West Bancorporation Inc. | | | 325 | | | | 8,174 | |
Westamerica Bancorporation | | | 461 | | | | 26,051 | |
Wintrust Financial Corp. | | | 378 | | | | 32,905 | |
Zions Bancorporation | | | 6,671 | | | | 351,495 | |
| | | | 14,939,009 | |
Reinsurance – 0.0% * | |
Alleghany Corp. | | | 102 | | | | 58,647 | |
Enstar Group Ltd. | | | 224 | | | | 46,435 | (a) |
Greenlight Capital Re Ltd., Class A | | | 583 | | | | 8,279 | (a) |
Maiden Holdings Ltd. | | | 1,195 | | | | 9,261 | |
Reinsurance Group of America Inc. | | | 428 | | | | 57,130 | |
WMIH Corp. | | | 4,068 | | | | 5,451 | (a) |
| | | | 185,203 | |
Renewable Electricity – 0.0% * | |
Ormat Technologies Inc. | | | 708 | | | | 37,659 | |
Pattern Energy Group Inc. | | | 1,522 | | | | 28,537 | |
TerraForm Power Inc., Class A | | | 1,409 | | | | 16,485 | |
| | | | 82,681 | |
Research & Consulting Services – 0.1% | |
Acacia Research Corp. | | | 1,007 | | | | 4,179 | (a) |
CBIZ Inc. | | | 981 | | | | 22,563 | (a) |
CRA International Inc. | | | 109 | | | | 5,547 | |
Equifax Inc. | | | 4,105 | | | | 513,576 | |
Exponent Inc. | | | 908 | | | | 43,856 | |
Forrester Research Inc. | | | 194 | | | | 8,138 | |
Franklin Covey Co. | | | 207 | | | | 5,082 | (a) |
FTI Consulting Inc. | | | 648 | | | | 39,191 | (a) |
Hill International Inc. | | | 639 | | | | 3,770 | (a) |
Huron Consulting Group Inc. | | | 429 | | | | 17,546 | (a) |
ICF International Inc. | | | 311 | | | | 22,097 | |
InnerWorkings Inc. | | | 764 | | | | 6,639 | (a) |
Mistras Group Inc. | | | 343 | | | | 6,476 | (a) |
Navigant Consulting Inc. | | | 822 | | | | 18,199 | (a) |
Nielsen Holdings PLC | | | 11,589 | | | | 358,448 | |
Resources Connection Inc. | | | 510 | | | | 8,619 | |
The Dun & Bradstreet Corp. | | | 244 | | | | 29,927 | |
Verisk Analytics Inc. | | | 5,204 | | | | 560,159 | (a) |
Willdan Group Inc. | | | 143 | | | | 4,429 | (a) |
| | | | 1,678,441 | |
| | | | | | | | |
| | | Number
of Shares | | | Fair
Value | |
Residential REITs – 0.2% | |
American Campus Communities Inc. | | | 903 | | | $ | 38,721 | |
Apartment Investment & Management Co., Class A | | | 5,370 | | | | 227,151 | |
AvalonBay Communities Inc. | | | 4,707 | | | | 809,086 | |
Bluerock Residential Growth REIT Inc. | | | 381 | | | | 3,398 | |
Camden Property Trust | | | 621 | | | | 56,592 | |
Clipper Realty Inc. | | | 342 | | | | 2,921 | |
Education Realty Trust Inc. | | | 1,901 | | | | 78,891 | |
Equity Residential | | | 12,003 | | | | 764,471 | |
Essex Property Trust Inc. | | | 2,159 | | | | 516,152 | |
Independence Realty Trust Inc. | | | 1,539 | | | | 15,867 | |
Investors Real Estate Trust | | | 1,834 | | | | 10,142 | |
Mid-America Apartment Communities Inc. | | | 3,900 | | | | 392,613 | |
NexPoint Residential Trust Inc. | | | 224 | | | | 6,373 | |
Preferred Apartment Communities Inc., Class A | | | 643 | | | | 10,925 | |
UDR Inc. | | | 8,682 | | | | 325,922 | |
UMH Properties Inc. | | | 493 | | | | 7,568 | |
| | | | 3,266,793 | |
Restaurants – 0.4% | |
Biglari Holdings Inc., Class A | | | 2 | | | | 1,900 | (a) |
Biglari Holdings Inc., Class B | | | 20 | | | | 3,670 | (a) |
BJ’s Restaurants Inc. | | | 346 | | | | 20,760 | |
Bloomin’ Brands Inc. | | | 1,569 | | | | 31,537 | |
Bojangles’ Inc. | | | 197 | | | | 2,837 | (a) |
Brinker International Inc. | | | 1,098 | | | | 52,265 | |
Carrols Restaurant Group Inc. | | | 676 | | | | 10,039 | (a) |
Chipotle Mexican Grill Inc. | | | 766 | | | | 330,429 | (a) |
Chuy’s Holdings Inc. | | | 327 | | | | 10,039 | (a) |
Cracker Barrel Old Country Store Inc. | | | 515 | | | | 80,448 | |
Darden Restaurants Inc. | | | 4,105 | | | | 439,481 | |
Dave & Buster’s Entertainment Inc. | | | 744 | | | | 35,414 | (a) |
Del Frisco’s Restaurant Group Inc. | | | 392 | | | | 4,939 | (a) |
Del Taco Restaurants Inc. | | | 463 | | | | 6,565 | (a) |
Denny’s Corp. | | | 1,005 | | | | 16,010 | (a) |
Dine Brands Global Inc. | | | 319 | | | | 23,861 | |
Domino’s Pizza Inc. | | | 281 | | | | 79,290 | |
Dunkin’ Brands Group Inc. | | | 548 | | | | 37,850 | |
El Pollo Loco Holdings Inc. | | | 410 | | | | 4,674 | (a) |
Fiesta Restaurant Group Inc. | | | 381 | | | | 10,935 | (a) |
J. Alexander’s Holdings Inc. | | | 273 | | | | 3,044 | (a) |
Jack in the Box Inc. | | | 744 | | | | 63,329 | |
McDonald’s Corp. | | | 26,277 | | | | 4,117,343 | |
Nathan’s Famous Inc. | | | 58 | | | | 5,458 | |
Noodles & Co. | | | 224 | | | | 2,755 | (a) |
Papa John’s International Inc. | | | 514 | | | | 26,070 | |
Potbelly Corp. | | | 479 | | | | 6,203 | (a) |
Red Robin Gourmet Burgers Inc. | | | 236 | | | | 10,998 | (a) |
Ruth’s Hospitality Group Inc. | | | 455 | | | | 12,763 | |
Shake Shack Inc., Class A | | | 463 | | | | 30,641 | (a) |
Sonic Corp. | | | 580 | | | | 19,964 | |
Starbucks Corp. | | | 46,192 | | | | 2,256,479 | |
Texas Roadhouse Inc. | | | 1,646 | | | | 107,829 | |
The Cheesecake Factory Inc. | | | 1,090 | | | | 60,015 | |
The Habit Restaurants Inc., Class A | | | 276 | | | | 2,760 | (a) |
The Wendy’s Co. | | | 1,225 | | | | 21,046 | |
Wingstop Inc. | | | 546 | | | | 28,458 | |
Yum China Holdings Inc. | | | 10,767 | | | | 414,099 | |
Yum! Brands Inc. | | | 10,868 | | | | 850,095 | |
Zoe’s Kitchen Inc. | | | 384 | | | | 3,748 | (a) |
| | | | 9,246,040 | |
Retail REITs – 0.2% | |
Acadia Realty Trust | | | 1,503 | | | | 41,137 | |
Agree Realty Corp. | | | 514 | | | | 27,124 | |
Alexander’s Inc. | | | 33 | | | | 12,627 | |
CBL & Associates Properties Inc. | | | 3,125 | | | | 17,406 | |
Cedar Realty Trust Inc. | | | 1,656 | | | | 7,816 | |
Federal Realty Investment Trust | | | 2,458 | | | | 311,060 | |
Getty Realty Corp. | | | 530 | | | | 14,930 | |
GGP Inc. | | | 21,430 | | | | 437,815 | |
Kimco Realty Corp. | | | 14,587 | | | | 247,833 | |
Kite Realty Group Trust | | | 1,558 | | | | 26,611 | |
National Retail Properties Inc. | | | 1,027 | | | | 45,147 | |
See Notes to Schedules of Investments and Notes to Financial Statements.
| | |
| State Street Total Return V.I.S. Fund | | |
| Schedule of Investments | | June 30, 2018 (Unaudited) |
|
| | | | | | | | |
| | | Number
of Shares | | | Fair
Value | |
Pennsylvania Real Estate Investment Trust | | | 1,077 | | | $ | 11,836 | |
Ramco-Gershenson Properties Trust | | | 1,457 | | | | 19,247 | |
Realty Income Corp. | | | 9,697 | | | | 521,602 | |
Regency Centers Corp. | | | 4,800 | | | | 297,984 | |
Retail Opportunity Investments Corp. | | | 2,075 | | | | 39,757 | |
Saul Centers Inc. | | | 185 | | | | 9,912 | |
Seritage Growth Properties REIT, Class A | | | 609 | | | | 25,840 | |
Simon Property Group Inc. | | | 10,234 | | | | 1,741,724 | |
Spirit MTA REIT | | | 867 | | | | 8,930 | (a) |
Tanger Factory Outlet Centers Inc. | | | 2,320 | | | | 54,497 | |
Taubman Centers Inc. | | | 396 | | | | 23,269 | |
The Macerich Co. | | | 3,553 | | | | 201,917 | |
Urban Edge Properties | | | 2,758 | | | | 63,075 | |
Urstadt Biddle Properties Inc., Class A | | | 522 | | | | 11,813 | |
Washington Prime Group Inc. | | | 3,324 | | | | 26,958 | |
Weingarten Realty Investors | | | 776 | | | | 23,909 | |
Whitestone REIT | | | 546 | | | | 6,814 | |
| | | | | | | 4,278,590 | |
Security & Alarm Services – 0.0% * | |
The Brink’s Co. | | | 1,262 | | | | 100,644 | |
Semiconductor Equipment – 0.2% | |
Advanced Energy Industries Inc. | | | 730 | | | | 42,406 | (a) |
Amkor Technology Inc. | | | 1,943 | | | | 16,690 | (a) |
Applied Materials Inc. | | | 33,746 | | | | 1,558,728 | |
Axcelis Technologies Inc. | | | 551 | | | | 10,910 | (a) |
AXT Inc. | | | 705 | | | | 4,970 | (a) |
Brooks Automation Inc. | | | 1,222 | | | | 39,862 | |
Cabot Microelectronics Corp. | | | 473 | | | | 50,876 | |
Cohu Inc. | | | 530 | | | | 12,990 | |
Entegris Inc. | | | 2,618 | | | | 88,750 | |
FormFactor Inc. | | | 1,340 | | | | 17,822 | (a) |
Ichor Holdings Ltd. | | | 363 | | | | 7,703 | (a) |
KLA-Tencor Corp. | | | 5,333 | | | | 546,792 | |
Lam Research Corp. | | | 5,343 | | | | 923,538 | |
MKS Instruments Inc. | | | 363 | | | | 34,739 | |
Nanometrics Inc. | | | 367 | | | | 12,995 | (a) |
PDF Solutions Inc. | | | 397 | | | | 4,756 | (a) |
Photronics Inc. | | | 1,258 | | | | 10,033 | (a) |
Rudolph Technologies Inc. | | | 600 | | | | 17,760 | (a) |
Teradyne Inc. | | | 1,265 | | | | 48,159 | |
Ultra Clean Holdings Inc. | | | 556 | | | | 9,230 | (a) |
Veeco Instruments Inc. | | | 885 | | | | 12,611 | (a) |
Versum Materials Inc. | | | 709 | | | | 26,339 | |
Xcerra Corp. | | | 1,063 | | | | 14,850 | (a) |
Xperi Corp. | | | 822 | | | | 13,234 | |
| | | | | | | 3,526,743 | |
Semiconductors – 1.3% | |
Adesto Technologies Corp. | | | 418 | | | | 3,511 | (a) |
Advanced Micro Devices Inc. | | | 26,100 | | | | 391,239 | (a) |
Alpha & Omega Semiconductor Ltd. | | | 384 | | | | 5,468 | (a) |
Ambarella Inc. | | | 586 | | | | 22,625 | (a) |
Analog Devices Inc. | | | 12,220 | | | | 1,172,142 | |
Aquantia Corp. | | | 452 | | | | 5,234 | (a) |
ASE Technology Holding Company Ltd. | | | 77,858 | | | | 182,844 | |
Broadcom Inc. | | | 13,679 | | | | 3,319,073 | |
CEVA Inc. | | | 394 | | | | 11,899 | (a) |
Cirrus Logic Inc. | | | 1,577 | | | | 60,446 | (a) |
Cree Inc. | | | 2,512 | | | | 104,424 | (a) |
Cypress Semiconductor Corp. | | | 2,356 | | | | 36,707 | |
Diodes Inc. | | | 750 | | | | 25,853 | (a) |
First Solar Inc. | | | 534 | | | | 28,120 | (a) |
Impinj Inc. | | | 341 | | | | 7,540 | (a) |
Inphi Corp. | | | 795 | | | | 25,925 | (a) |
Integrated Device Technology Inc. | | | 3,311 | | | | 105,555 | (a) |
Intel Corp. | | | 155,440 | | | | 7,726,922 | |
Kopin Corp. | | | 1,142 | | | | 3,266 | (a) |
Lattice Semiconductor Corp. | | | 1,815 | | | | 11,906 | (a) |
MACOM Technology Solutions Holdings Inc. | | | 768 | | | | 17,695 | (a) |
MaxLinear Inc. | | | 1,106 | | | | 17,243 | (a) |
Microchip Technology Inc. | | | 7,662 | | | | 696,859 | |
Micron Technology Inc. | | | 38,578 | | | | 2,023,030 | (a) |
Monolithic Power Systems Inc. | | | 255 | | | | 34,086 | |
NeoPhotonics Corp. | | | 622 | | | | 3,875 | (a) |
| | | | | | | | |
| | | Number
of Shares | | | Fair
Value | |
NVE Corp. | | | 70 | | | $ | 8,525 | |
NVIDIA Corp. | | | 20,281 | | | | 4,804,569 | |
Power Integrations Inc. | | | 534 | | | | 39,009 | |
Qorvo Inc. | | | 4,167 | | | | 334,068 | (a) |
QUALCOMM Inc. | | | 49,375 | | | | 2,770,925 | |
Rambus Inc. | | | 1,954 | | | | 24,503 | (a) |
Semtech Corp. | | | 1,206 | | | | 56,742 | (a) |
Sigma Designs Inc. | | | 683 | | | | 4,166 | (a) |
Silicon Laboratories Inc. | | | 1,076 | | | | 107,170 | (a) |
Skyworks Solutions Inc. | | | 5,984 | | | | 578,354 | |
SMART Global Holdings Inc. | | | 172 | | | | 5,482 | (a) |
SunPower Corp. | | | 1,132 | | | | 8,682 | (a) |
Synaptics Inc. | | | 838 | | | | 42,210 | (a) |
Texas Instruments Inc. | | | 32,588 | | | | 3,592,827 | |
Xilinx Inc. | | | 8,559 | | | | 558,560 | |
| | | | | | | 28,979,279 | |
Silver – 0.0% * | |
Coeur Mining Inc. | | | 3,191 | | | | 24,252 | (a) |
Hecla Mining Co. | | | 6,938 | | | | 24,144 | |
| | | | | | | 48,396 | |
Soft Drinks – 0.5% | |
Coca-Cola Bottling Company Consolidated | | | 85 | | | | 11,486 | |
Monster Beverage Corp. | | | 13,733 | | | | 786,901 | (a) |
National Beverage Corp. | | | 212 | | | | 22,663 | (a) |
PepsiCo Inc. | | | 47,208 | | | | 5,139,535 | |
Primo Water Corp. | | | 424 | | | | 7,416 | (a) |
The Coca-Cola Co. | | | 127,811 | | | | 5,605,790 | |
| | | | | | | 11,573,791 | |
Specialized Consumer Services – 0.0% * | |
Carriage Services Inc. | | | 295 | | | | 7,242 | |
H&R Block Inc. | | | 7,188 | | | | 163,743 | |
Regis Corp. | | | 542 | | | | 8,965 | (a) |
Service Corporation International | | | 1,236 | | | | 44,236 | |
Sotheby’s | | | 930 | | | | 50,536 | (a) |
Weight Watchers International Inc. | | | 713 | | | | 72,084 | (a) |
| | | | 346,806 | |
Specialized Finance – 0.0% * | |
Marlin Business Services Corp. | | | 174 | | | | 5,194 | |
NewStar Financial Inc. | | | 492 | | | | 242 | |
On Deck Capital Inc. | | | 923 | | | | 6,461 | (a) |
| | | | 11,897 | |
Specialized REITs – 0.5% | |
American Tower Corp. | | | 14,830 | | | | 2,138,041 | |
CatchMark Timber Trust Inc., Class A | | | 789 | | | | 10,044 | |
CoreCivic Inc. | | | 2,990 | | | | 71,431 | |
CorEnergy Infrastructure Trust Inc. | | | 246 | | | | 9,250 | |
CoreSite Realty Corp. | | | 224 | | | | 24,824 | |
Crown Castle International Corp. | | | 13,995 | | | | 1,508,941 | |
CyrusOne Inc. | | | 651 | | | | 37,992 | |
Digital Realty Trust Inc. | | | 7,039 | | | | 785,412 | |
EPR Properties | | | 424 | | | | 27,471 | |
Equinix Inc. | | | 2,613 | | | | 1,123,303 | |
Extra Space Storage Inc. | | | 4,349 | | | | 434,074 | |
Farmland Partners Inc. | | | 684 | | | | 6,019 | |
Four Corners Property Trust Inc. | | | 1,022 | | | | 25,172 | |
Gladstone Land Corp. | | | 304 | | | | 3,852 | |
InfraREIT Inc. | | | 810 | | | | 17,958 | (a) |
Iron Mountain Inc. | | | 9,170 | | | | 321,042 | |
Jernigan Capital Inc. | | | 175 | | | | 3,335 | |
Lamar Advertising Co., Class A | | | 559 | | | | 38,185 | |
Life Storage Inc. | | | 310 | | | | 30,166 | |
National Storage Affiliates Trust | | | 839 | | | | 25,858 | |
PotlatchDeltic Corp. | | | 1,534 | | | | 78,004 | |
Public Storage | | | 5,040 | | | | 1,143,374 | |
QTS Realty Trust Inc., Class A | | | 885 | | | | 34,957 | |
Rayonier Inc. | | | 858 | | | | 33,196 | |
Safety Income and Growth Inc. | | | 192 | | | | 3,642 | |
SBA Communications Corp. | | | 3,900 | | | | 643,968 | (a) |
The GEO Group Inc. | | | 3,049 | | | | 83,969 | |
Uniti Group Inc. | | | 1,124 | | | | 22,514 | (a) |
Weyerhaeuser Co. | | | 25,239 | | | | 920,214 | |
| | | | | | | 9,606,208 | |
See Notes to Schedules of Investments and Notes to Financial Statements.
| | |
| State Street Total Return V.I.S. Fund | | |
| Schedule of Investments | | June 30, 2018 (Unaudited) |
|
| | | | | | | | |
| | | Number
of Shares | | | Fair
Value | |
Specialty Chemicals – 0.2% | |
A Schulman Inc. | | | 482 | | | $ | 21,449 | |
Advanced Emissions Solutions Inc. | | | 162 | | | | 1,840 | |
Albemarle Corp. | | | 3,774 | | | | 356,001 | |
Ashland Global Holdings Inc. | | | 416 | | | | 32,523 | |
Balchem Corp. | | | 595 | | | | 58,393 | |
Chase Corp. | | | 141 | | | | 16,532 | |
Ecolab Inc. | | | 8,626 | | | | 1,210,487 | |
Ferro Corp. | | | 1,478 | | | | 30,816 | (a) |
Flotek Industries Inc. | | | 1,049 | | | | 3,388 | (a) |
FutureFuel Corp. | | | 511 | | | | 7,159 | |
GCP Applied Technologies Inc. | | | 1,273 | | | | 36,853 | (a) |
HB Fuller Co. | | | 942 | | | | 50,567 | |
Ingevity Corp. | | | 785 | | | | 63,475 | (a) |
Innophos Holdings Inc. | | | 313 | | | | 14,899 | |
Innospec Inc. | | | 453 | | | | 34,677 | |
International Flavors & Fragrances Inc. | | | 2,567 | | | | 318,205 | |
KMG Chemicals Inc. | | | 242 | | | | 17,855 | |
Kraton Corp. | | | 518 | | | | 23,900 | (a) |
Minerals Technologies Inc. | | | 893 | | | | 67,288 | |
NewMarket Corp. | | | 62 | | | | 25,079 | |
OMNOVA Solutions Inc. | | | 854 | | | | 8,882 | (a) |
PolyOne Corp. | | | 2,027 | | | | 87,607 | |
PPG Industries Inc. | | | 8,339 | | | | 865,004 | |
PQ Group Holdings Inc. | | | 538 | | | | 9,684 | (a) |
Quaker Chemical Corp. | | | 244 | | | | 37,788 | |
Rayonier Advanced Materials Inc. | | | 987 | | | | 16,868 | |
RPM International Inc. | | | 902 | | | | 52,605 | |
Sensient Technologies Corp. | | | 1,074 | | | | 76,845 | |
Stepan Co. | | | 361 | | | | 28,162 | |
The Sherwin-Williams Co. | | | 2,724 | | | | 1,110,221 | |
Valhi Inc. | | | 555 | | | | 2,642 | |
| | | | | | | 4,687,694 | |
Specialty Stores – 0.1% | |
Barnes & Noble Education Inc. | | | 802 | | | | 4,523 | (a) |
Barnes & Noble Inc. | | | 1,102 | | | | 6,998 | |
Big 5 Sporting Goods Corp. | | | 360 | | | | 2,736 | |
Dick’s Sporting Goods Inc. | | | 515 | | | | 18,154 | |
Five Below Inc. | | | 1,373 | | | | 134,156 | (a) |
GNC Holdings Inc., Class A | | | 1,348 | | | | 4,745 | (a) |
Hibbett Sports Inc. | | | 290 | | | | 6,641 | (a) |
MarineMax Inc. | | | 400 | | | | 7,580 | (a) |
National Vision Holdings Inc. | | | 644 | | | | 23,551 | (a) |
Office Depot Inc. | | | 9,455 | | | | 24,110 | |
Party City Holdco Inc. | | | 541 | | | | 8,250 | (a) |
Sally Beauty Holdings Inc. | | | 3,111 | | | | 49,869 | (a) |
Signet Jewelers Ltd. | | | 1,492 | | | | 83,179 | |
Sportsman’s Warehouse Holdings Inc. | | | 518 | | | | 2,652 | (a) |
The Container Store Group Inc. | | | 311 | | | | 2,616 | (a) |
The Michaels Companies Inc. | | | 727 | | | | 13,937 | (a) |
Tiffany & Co. | | | 3,442 | | | | 452,967 | |
Tractor Supply Co. | | | 4,279 | | | | 327,301 | |
Ulta Salon Cosmetics & Fragrance Inc. | | | 1,970 | | | | 459,916 | (a) |
Winmark Corp. | | | 43 | | | | 6,383 | |
| | | | | | | 1,640,264 | |
Steel – 0.1% | |
AK Steel Holding Corp. | | | 5,474 | | | | 23,757 | (a) |
Allegheny Technologies Inc. | | | 3,171 | | | | 79,655 | (a) |
Carpenter Technology Corp. | | | 1,173 | | | | 61,665 | |
Cleveland-Cliffs Inc. | | | 5,539 | | | | 46,694 | (a) |
Commercial Metals Co. | | | 2,966 | | | | 62,612 | |
Haynes International Inc. | | | 251 | | | | 9,222 | |
Nucor Corp. | | | 10,775 | | | | 673,437 | |
Olympic Steel Inc. | | | 182 | | | | 3,715 | |
Reliance Steel & Aluminum Co. | | | 490 | | | | 42,895 | |
Ryerson Holding Corp. | | | 218 | | | | 2,431 | (a) |
Schnitzer Steel Industries Inc., Class A | | | 419 | | | | 14,120 | |
Steel Dynamics Inc. | | | 1,575 | | | | 72,371 | |
SunCoke Energy Inc. | | | 1,247 | | | | 16,710 | (a) |
Synalloy Corp. | | | 191 | | | | 3,810 | |
TimkenSteel Corp. | | | 613 | | | | 10,023 | (a) |
United States Steel Corp. | | | 1,163 | | | | 40,414 | |
Universal Stainless & Alloy Products Inc. | | | 162 | | | | 3,835 | (a) |
Warrior Met Coal Inc. | | | 607 | | | | 16,735 | |
Worthington Industries Inc. | | | 1,100 | | | | 46,167 | |
| | | | | | | 1,230,268 | |
| | | | | | | | |
| | | Number
of Shares | | | Fair
Value | |
Systems Software – 1.5% | |
A10 Networks Inc. | | | 886 | | | $ | 5,520 | (a) |
CA Inc. | | | 10,505 | | | | 374,503 | |
Carbon Black Inc. | | | 172 | | | | 4,472 | (a) |
CommVault Systems Inc. | | | 1,011 | | | | 66,574 | (a) |
ForeScout Technologies Inc. | | | 550 | | | | 18,843 | (a) |
Fortinet Inc. | | | 968 | | | | 60,432 | (a) |
Imperva Inc. | | | 653 | | | | 31,507 | (a) |
Microsoft Corp. | | | 256,085 | | | | 25,252,542 | |
OneSpan Inc. | | | 609 | | | | 11,967 | (a) |
Oracle Corp. | | | 99,786 | | | | 4,396,571 | |
Progress Software Corp. | | | 849 | | | | 32,958 | |
Qualys Inc. | | | 625 | | | | 52,688 | (a) |
Rapid7 Inc. | | | 684 | | | | 19,302 | (a) |
Red Hat Inc. | | | 5,896 | | | | 792,246 | (a) |
SailPoint Technologies Holding Inc. | | | 685 | | | | 16,810 | (a) |
SecureWorks Corp., Class A | | | 103 | | | | 1,282 | (a) |
Symantec Corp. | | | 20,792 | | | | 429,355 | |
TiVo Corp. | | | 2,124 | | | | 28,568 | |
Varonis Systems Inc. | | | 518 | | | | 38,591 | (a) |
Zscaler Inc. | | | 275 | | | | 9,831 | (a) |
| | | | | | | 31,644,562 | |
Technology Distributors – 0.0% * | |
Anixter International Inc. | | | 506 | | | | 32,030 | (a) |
Arrow Electronics Inc. | | | 577 | | | | 43,436 | (a) |
Avnet Inc. | | | 783 | | | | 33,583 | |
ePlus Inc. | | | 257 | | | | 24,184 | (a) |
Insight Enterprises Inc. | | | 628 | | | | 30,728 | (a) |
PC Connection Inc. | | | 218 | | | | 7,238 | |
ScanSource Inc. | | | 417 | | | | 16,805 | (a) |
SYNNEX Corp. | | | 754 | | | | 72,768 | |
Tech Data Corp. | | | 950 | | | | 78,014 | (a) |
| | | | | | | 338,786 | |
Technology Hardware, Storage & Peripherals – 1.6% | |
3D Systems Corp. | | | 2,017 | | | | 27,855 | (a) |
Apple Inc. | | | 163,887 | | | | 30,337,123 | |
Avid Technology Inc. | | | 661 | | | | 3,437 | (a) |
Cray Inc. | | | 721 | | | | 17,737 | (a) |
Diebold Nixdorf Inc. | | | 1,458 | | | | 17,423 | |
Eastman Kodak Co. | | | 343 | | | | 1,303 | (a) |
Electronics For Imaging Inc. | | | 796 | | | | 25,918 | (a) |
Hewlett Packard Enterprise Co. | | | 51,110 | | | | 746,717 | |
HP Inc. | | | 54,128 | | | | 1,228,164 | |
Immersion Corp. | | | 589 | | | | 9,094 | (a) |
NCR Corp. | | | 790 | | | | 23,684 | (a) |
NetApp Inc. | | | 8,703 | | | | 683,447 | |
Stratasys Ltd. | | | 823 | | | | 15,752 | (a) |
Super Micro Computer Inc. | | | 617 | | | | 14,592 | (a) |
USA Technologies Inc. | | | 1,005 | | | | 14,070 | (a) |
Western Digital Corp. | | | 9,822 | | | | 760,321 | |
Xerox Corp. | | | 7,342 | | | | 176,208 | |
| | | | | | | 34,102,845 | |
Textiles – 0.0% * | |
Culp Inc. | | | 217 | | | | 5,327 | |
Unifi Inc. | | | 314 | | | | 9,954 | (a) |
| | | | | | | 15,281 | |
Thrifts & Mortgage Finance – 0.0% * | |
BankFinancial Corp. | | | 310 | | | | 5,472 | |
Beneficial Bancorp Inc. | | | 1,236 | | | | 20,023 | |
BofI Holding Inc. | | | 1,102 | | | | 45,083 | (a) |
BSB Bancorp Inc. | | | 153 | | | | 5,263 | (a) |
Capitol Federal Financial Inc. | | | 2,418 | | | | 31,821 | |
Charter Financial Corp. | | | 269 | | | | 6,496 | |
Columbia Financial Inc. | | | 956 | | | | 15,822 | (a) |
Dime Community Bancshares Inc. | | | 630 | | | | 12,285 | |
Entegra Financial Corp. | | | 165 | | | | 4,835 | (a) |
ESSA Bancorp Inc. | | | 149 | | | | 2,359 | |
Federal Agricultural Mortgage Corp., Class C | | | 170 | | | | 15,212 | |
First Defiance Financial Corp. | | | 175 | | | | 11,736 | |
Flagstar Bancorp Inc. | | | 563 | | | | 19,288 | (a) |
FS Bancorp Inc. | | | 72 | | | | 4,554 | |
Greene County Bancorp Inc. | | | 77 | | | | 2,610 | |
Hingham Institution for Savings | | | 25 | | | | 5,493 | |
Home Bancorp Inc. | | | 113 | | | | 5,260 | |
See Notes to Schedules of Investments and Notes to Financial Statements.
| | |
| State Street Total Return V.I.S. Fund | | |
| Schedule of Investments | | June 30, 2018 (Unaudited) |
|
| | | | | | | | |
| | | Number
of Shares | | | Fair
Value | |
HomeStreet Inc. | | | 467 | | | $ | 12,586 | (a) |
Impac Mortgage Holdings Inc. | | | 161 | | | | 1,534 | (a) |
Kearny Financial Corp. | | | 1,677 | | | | 22,556 | |
LendingTree Inc. | | | 197 | | | | 42,119 | (a) |
Luther Burbank Corp. | | | 287 | | | | 3,302 | |
Malvern Bancorp Inc. | | | 148 | | | | 3,604 | (a) |
Merchants Bancorp | | | 324 | | | | 9,244 | |
Meridian Bancorp Inc. | | | 860 | | | | 16,469 | |
Meta Financial Group Inc. | | | 164 | | | | 15,974 | |
MGIC Investment Corp. | | | 6,857 | | | | 73,507 | (a) |
Nationstar Mortgage Holdings Inc. | | | 487 | | | | 8,537 | (a) |
New York Community Bancorp Inc. | | | 3,302 | | | | 36,454 | |
NMI Holdings Inc., Class A | | | 998 | | | | 16,267 | (a) |
Northfield Bancorp Inc. | | | 841 | | | | 13,977 | |
Northwest Bancshares Inc. | | | 1,668 | | | | 29,007 | |
OceanFirst Financial Corp. | | | 895 | | | | 26,814 | |
Ocwen Financial Corp. | | | 2,018 | | | | 7,991 | (a) |
OP Bancorp | | | 295 | | | | 3,752 | (a) |
Oritani Financial Corp. | | | 742 | | | | 12,020 | |
PCSB Financial Corp. | | | 343 | | | | 6,815 | |
PennyMac Financial Services Inc., Class A | | | 403 | | | | 7,919 | (a) |
PHH Corp. | | | 554 | | | | 6,016 | (a) |
Provident Financial Services Inc. | | | 1,114 | | | | 30,668 | |
Prudential Bancorp Inc. | | | 215 | | | | 4,150 | |
Radian Group Inc. | | | 4,000 | | | | 64,880 | |
Riverview Bancorp Inc. | | | 396 | | | | 3,342 | |
SI Financial Group Inc. | | | 213 | | | | 3,142 | |
Southern Missouri Bancorp Inc. | | | 117 | | | | 4,565 | |
Sterling Bancorp Inc. | | | 315 | | | | 4,208 | |
Territorial Bancorp Inc. | | | 149 | | | | 4,619 | |
Timberland Bancorp Inc. | | | 115 | | | | 4,294 | |
TrustCo Bank Corp. | | | 1,687 | | | | 15,014 | |
United Community Financial Corp. | | | 912 | | | | 10,023 | |
United Financial Bancorp Inc. | | | 800 | | | | 14,016 | |
Walker & Dunlop Inc. | | | 520 | | | | 28,938 | |
Washington Federal Inc. | | | 2,134 | | | | 69,782 | |
Waterstone Financial Inc. | | | 497 | | | | 8,474 | |
Western New England Bancorp Inc. | | | 301 | | | | 3,311 | |
WSFS Financial Corp. | | | 507 | | | | 27,023 | |
| | | | | | | 890,525 | |
Tires & Rubber – 0.0% * | |
Cooper Tire & Rubber Co. | | | 935 | | | | 24,591 | |
The Goodyear Tire & Rubber Co. | | | 8,001 | | | | 186,343 | |
| | | | | | | 210,934 | |
Tobacco – 0.4% | |
22nd Century Group Inc. | | | 2,503 | | | | 6,157 | (a) |
Altria Group Inc. | | | 63,339 | | | | 3,597,022 | |
Philip Morris International Inc. | | | 51,735 | | | | 4,177,084 | |
Turning Point Brands Inc. | | | 96 | | | | 3,063 | |
Universal Corp. | | | 441 | | | | 29,128 | |
Vector Group Ltd. | | | 1,826 | | | | 34,840 | |
| | | | | | | 7,847,294 | |
Trading Companies & Distributors – 0.1% | |
Aircastle Ltd. | | | 803 | | | | 16,461 | |
Applied Industrial Technologies Inc. | | | 709 | | | | 49,736 | |
Beacon Roofing Supply Inc. | | | 1,265 | | | | 53,914 | (a) |
BlueLinx Holdings Inc. | | | 183 | | | | 6,868 | (a) |
BMC Stock Holdings Inc. | | | 1,131 | | | | 23,581 | (a) |
CAI International Inc. | | | 316 | | | | 7,344 | (a) |
DXP Enterprises Inc. | | | 258 | | | | 9,856 | (a) |
EnviroStar Inc. | | | 89 | | | | 3,587 | |
Fastenal Co. | | | 9,835 | | | | 473,359 | |
Foundation Building Materials Inc. | | | 298 | | | | 4,583 | (a) |
GATX Corp. | | | 946 | | | | 70,222 | |
GMS Inc. | | | 589 | | | | 15,956 | (a) |
H&E Equipment Services Inc. | | | 528 | | | | 19,858 | |
Herc Holdings Inc. | | | 453 | | | | 25,522 | (a) |
Kaman Corp. | | | 516 | | | | 35,960 | |
Lawson Products Inc. | | | 125 | | | | 3,044 | (a) |
MRC Global Inc. | | | 1,578 | | | | 34,195 | (a) |
MSC Industrial Direct Company Inc., Class A | | | 298 | | | | 25,285 | |
Nexeo Solutions Inc. | | | 585 | | | | 5,341 | (a) |
NOW Inc. | | | 2,480 | | | | 33,058 | (a) |
Rush Enterprises Inc., Class A | | | 568 | | | | 24,640 | (a) |
| | | | | | | | |
| | | Number
of Shares | | | Fair
Value | |
Rush Enterprises Inc.,
Class B | | | 55 | | | $ | 2,414 | (a) |
SiteOne Landscape Supply Inc. | | | 739 | | | | 62,054 | (a) |
Systemax Inc. | | | 220 | | | | 7,553 | |
Textainer Group Holdings Ltd. | | | 467 | | | | 7,425 | (a) |
Titan Machinery Inc. | | | 349 | | | | 5,427 | (a) |
United Rentals Inc. | | | 2,851 | | | | 420,865 | (a) |
Veritiv Corp. | | | 160 | | | | 6,376 | (a) |
Watsco Inc. | | | 211 | | | | 37,617 | |
Willis Lease Finance Corp. | | | 81 | | | | 2,559 | (a) |
WW Grainger Inc. | | | 1,712 | | | | 527,981 | |
| | | | | | | 2,022,641 | |
Trucking – 0.0% * | |
ArcBest Corp. | | | 491 | | | | 22,439 | |
Avis Budget Group Inc. | | | 1,757 | | | | 57,102 | (a) |
Covenant Transportation Group Inc., Class A | | | 237 | | | | 7,465 | (a) |
Daseke Inc. | | | 833 | | | | 8,272 | (a) |
Heartland Express Inc. | | | 743 | | | | 13,783 | |
Hertz Global Holdings Inc. | | | 1,036 | | | | 15,892 | (a) |
JB Hunt Transport Services Inc. | | | 2,827 | | | | 343,622 | |
Knight-Swift Transportation Holdings Inc. | | | 842 | | | | 32,173 | |
Landstar System Inc. | | | 278 | | | | 30,358 | |
Marten Transport Ltd. | | | 760 | | | | 17,822 | |
Old Dominion Freight Line Inc. | | | 459 | | | | 68,373 | |
Ryder System Inc. | | | 359 | | | | 25,798 | |
Saia Inc. | | | 443 | | | | 35,816 | (a) |
Universal Logistics Holdings Inc. | | | 169 | | | | 4,436 | |
USA Truck Inc. | | | 182 | | | | 4,271 | (a) |
Werner Enterprises Inc. | | | 1,198 | | | | 44,985 | |
YRC Worldwide Inc. | | | 655 | | | | 6,583 | (a) |
| | | | | | | 739,190 | |
Water Utilities – 0.0% * | |
American States Water Co. | | | 684 | | | | 39,098 | |
American Water Works Company Inc. | | | 5,898 | | | | 503,571 | |
Aqua America Inc. | | | 1,178 | | | | 41,442 | |
AquaVenture Holdings Ltd. | | | 266 | | | | 4,144 | (a) |
Artesian Resources Corp., Class A | | | 156 | | | | 6,048 | |
Cadiz Inc. | | | 396 | | | | 5,188 | (a) |
California Water Service Group | | | 899 | | | | 35,016 | |
Connecticut Water Service Inc. | | | 216 | | | | 14,109 | |
Middlesex Water Co. | | | 318 | | | | 13,410 | |
Pure Cycle Corp. | | | 398 | | | | 3,801 | (a) |
SJW Group | | | 327 | | | | 21,654 | |
The York Water Co. | | | 260 | | | | 8,268 | |
| | | | | | | 695,749 | |
Wireless Telecommunication Services – 0.0% * | |
Boingo Wireless Inc. | | | 716 | | | | 16,175 | (a) |
NII Holdings Inc. | | | 1,887 | | | | 7,359 | (a) |
Shenandoah Telecommunications Co. | | | 822 | | | | 26,879 | |
Spok Holdings Inc. | | | 415 | | | | 6,246 | |
Telephone & Data Systems Inc. | | | 640 | | | | 17,549 | |
| | | | | | | 74,208 | |
Total Domestic Equity (Cost $455,174,236) | | | | | | | 802,702,932 | |
Foreign Equity – 26.3% | |
Common Stock – 26.0% | |
Advertising – 0.1% | |
Cheil Worldwide Inc. | | | 2,021 | | | | 37,446 | |
CyberAgent Inc. | | | 2,400 | | | | 144,305 | |
Dentsu Inc. | | | 5,600 | | | | 265,427 | |
Hakuhodo DY Holdings Inc. | | | 5,200 | | | | 83,470 | |
JCDecaux S.A. | | | 2,402 | | | | 80,376 | |
Publicis Groupe S.A. | | | 5,956 | | | | 409,865 | |
WPP PLC | | | 32,825 | | | | 517,013 | |
| | | | | | | 1,537,902 | |
Aerospace & Defense – 0.3% | |
Airbus SE | | | 15,367 | | | | 1,798,840 | |
AviChina Industry & Technology Company Ltd., Class H | | | 76,000 | | | | 45,239 | |
BAE Systems PLC | | | 87,174 | | | | 744,412 | |
Bombardier Inc., Class B | | | 51,880 | | | | 205,083 | (a) |
See Notes to Schedules of Investments and Notes to Financial Statements.
| | |
| State Street Total Return V.I.S. Fund | | |
| Schedule of Investments | | June 30, 2018 (Unaudited) |
|
| | | | | | | | |
| | | Number
of Shares | | | Fair
Value | |
CAE Inc. | | | 5,733 | | | $ | 119,022 | |
Dassault Aviation S.A. | | | 59 | | | | 112,421 | |
Embraer S.A. | | | 15,700 | | | | 98,997 | |
Korea Aerospace Industries Ltd. | | | 1,660 | | | | 61,366 | (a) |
Leonardo S.p.A. | | | 11,422 | | | | 112,901 | |
Meggitt PLC | | | 20,323 | | | | 132,359 | |
MTU Aero Engines AG | | | 1,383 | | | | 265,783 | |
Rolls-Royce Holdings PLC | | | 46,946 | | | | 612,491 | (a) |
Safran S.A. | | | 8,953 | | | | 1,087,643 | |
Singapore Technologies Engineering Ltd. | | | 44,000 | | | | 106,168 | |
Thales S.A. | | | 2,781 | | | | 358,302 | |
| | | | 5,861,027 | |
Agricultural & Farm Machinery – 0.0% * | |
CNH Industrial N.V. | | | 29,906 | | | | 317,603 | |
Kubota Corp. | | | 27,782 | | | | 437,178 | |
| | | | 754,781 | |
Agricultural Products – 0.0% * | |
Charoen Pokphand Indonesia Tbk PT | | | 289,500 | | | | 74,345 | |
Felda Global Ventures Holdings Bhd | | | 47,900 | | | | 17,905 | |
Genting Plantations Bhd | | | 8,500 | | | | 19,885 | |
Golden Agri-Resources Ltd. | | | 218,900 | | | | 48,966 | |
IOI Corporation Bhd | | | 60,300 | | | | 67,771 | |
Kuala Lumpur Kepong Bhd | | | 18,200 | | | | 108,853 | |
Sime Darby Plantation Bhd | | | 71,462 | | | | 94,292 | |
Wilmar International Ltd. | | | 30,800 | | | | 69,122 | |
| | | | 501,139 | |
Air Freight & Logistics – 0.1% | |
Bollore S.A. | | | 21,662 | | | | 100,761 | |
Deutsche Post AG | | | 26,560 | | | | 867,354 | |
Hyundai Glovis Company Ltd. | | | 540 | | | | 55,962 | |
Royal Mail PLC | | | 25,601 | | | | 170,824 | |
Yamato Holdings Company Ltd. | | | 8,900 | | | | 262,263 | |
| | | | 1,457,164 | |
Airlines – 0.1% | |
Air China Ltd., Class H | | | 28,000 | | | | 27,053 | |
AirAsia Group Bhd | | | 48,500 | | | | 35,899 | |
ANA Holdings Inc. | | | 3,200 | | | | 117,553 | |
China Airlines Ltd. | | | 104,000 | | | | 32,474 | (a) |
China Southern Airlines Company Ltd., H Shares | | | 52,000 | | | | 40,895 | |
Deutsche Lufthansa AG | | | 6,973 | | | | 167,711 | |
easyJet PLC | | | 3,724 | | | | 82,255 | |
Eva Airways Corp. | | | 80,650 | | | | 39,018 | |
International Consolidated Airlines Group S.A. | | | 18,877 | | | | 165,784 | |
Japan Airlines Company Ltd. | | | 2,900 | | | | 102,841 | |
Korean Air Lines Company Ltd. | | | 1,954 | | | | 49,529 | |
Latam Airlines Group S.A. | | | 11,360 | | | | 113,107 | |
Singapore Airlines Ltd. | | | 13,700 | | | | 107,410 | |
Turk Hava Yollari AO | | | 23,896 | | | | 70,626 | (a) |
| | | | 1,152,155 | |
Airport Services – 0.1% | |
Aena SME S.A. | | | 1,879 | | | | 341,140 | (d) |
Aeroports de Paris | | | 773 | | | | 174,817 | |
Airports of Thailand PCL NVDR | | | 124,100 | | | | 235,989 | |
Auckland International Airport Ltd. | | | 33,997 | | | | 156,060 | |
Beijing Capital International Airport Company Ltd.,
Class H | | | 64,000 | | | | 67,463 | |
Fraport AG Frankfurt Airport Services Worldwide | | | 1,434 | | | | 138,328 | |
Grupo Aeroportuario del Pacifico SAB de C.V.,
Class B | | | 10,700 | | | | 100,104 | |
Grupo Aeroportuario del Sureste SAB de C.V.,
Class B | | | 4,855 | | | | 77,897 | |
Japan Airport Terminal Company Ltd. | | | 1,400 | | | | 65,598 | |
Malaysia Airports Holdings Bhd | | | 36,000 | | | | 78,426 | |
SATS Ltd. | | | 11,000 | | | | 40,337 | |
Sydney Airport | | | 31,381 | | | | 166,011 | |
TAV Havalimanlari Holding AS | | | 6,264 | | | | 30,683 | |
| | | | 1,672,853 | |
Alternative Carriers – 0.0% * | | | | | |
Iliad S.A. | | | 770 | | | | 121,681 | |
Intelsat S.A. | | | 780 | | | | 12,995 | (a) |
| | | | 134,676 | |
| | | | | | | | |
| | | Number
of Shares | | | Fair
Value | |
Aluminum – 0.0% * | |
Alumina Ltd. | | | 63,034 | | | $ | 130,403 | |
Aluminum Corporation of China Ltd., Class H | | | 152,000 | | | | 67,035 | (a) |
Hindalco Industries Ltd. | | | 39,321 | | | | 132,285 | |
Norsk Hydro ASA | | | 39,840 | | | | 238,491 | |
| | | | 568,214 | |
Apparel Retail – 0.1% | |
ABC-Mart Inc. | | | 1,000 | | | | 54,710 | |
Fast Retailing Company Ltd. | | | 1,500 | | | | 689,433 | |
Hennes & Mauritz AB,
Class B | | | 25,361 | | | | 378,459 | |
Industria de Diseno Textil S.A. | | | 28,442 | | | | 971,651 | |
Mr Price Group Ltd. | | | 8,676 | | | | 143,222 | |
Shimamura Company Ltd. | | | 800 | | | | 70,419 | |
The Foschini Group Ltd. | | | 7,946 | | | | 100,874 | |
Truworths International Ltd. | | | 16,496 | | | | 92,973 | |
| | | | 2,501,741 | |
Apparel, Accessories & Luxury Goods – 0.4% | |
Adidas AG | | | 5,144 | | | | 1,122,799 | |
Burberry Group PLC | | | 11,879 | | | | 338,758 | |
Cie Financiere Richemont S.A. | | | 13,743 | | | | 1,164,269 | |
Gildan Activewear Inc. | | | 6,442 | | | | 181,343 | |
Hermes International | | | 841 | | | | 514,325 | |
HUGO BOSS AG | | | 1,603 | | | | 145,534 | |
Kering S.A. | | | 2,047 | | | | 1,155,792 | |
Li & Fung Ltd. | | | 134,000 | | | | 49,190 | |
LPP S.A. | | | 33 | | | | 74,789 | |
Luxottica Group S.p.A. | | | 4,387 | | | | 283,044 | |
LVMH Moet Hennessy Louis Vuitton SE | | | 7,412 | | | | 2,468,088 | |
Moncler S.p.A. | | | 4,359 | | | | 198,485 | |
Pandora A/S | | | 2,776 | | | | 193,926 | |
Shenzhou International Group Holdings Ltd. | | | 16,000 | | | | 197,516 | |
The Swatch Group AG | | | 808 | | | | 383,351 | |
The Swatch Group AG | | | 1,309 | | | | 113,176 | |
| | | | 8,584,385 | |
Application Software – 0.2% | |
Constellation Software Inc. | | | 573 | | | | 444,108 | |
Dassault Systemes SE | | | 3,526 | | | | 494,014 | |
Kingdee International Software Group Company Ltd. | | | 68,000 | | | | 69,600 | |
Kingsoft Corporation Ltd. | | | 27,000 | | | | 81,907 | |
LINE Corp. | | | 500 | | | | 20,832 | (a) |
Micro Focus International PLC ADR | | | 12,240 | | | | 211,385 | |
Nice Ltd. | | | 1,516 | | | | 156,381 | (a) |
Open Text Corp. | | | 7,724 | | | | 271,686 | |
SAP SE | | | 25,933 | | | | 2,996,017 | |
Temenos AG | | | 1,484 | | | | 224,181 | (a) |
The Sage Group PLC | | | 29,849 | | | | 247,720 | |
| | | | 5,217,831 | |
Asset Management & Custody Banks – 0.1% | |
3i Group PLC | | | 26,863 | | | | 319,406 | |
Amundi S.A. | | | 1,515 | | | | 104,963 | (d) |
BrightSphere Investment Group PLC | | | 1,405 | | | | 20,035 | |
Brookfield Asset Management Inc., Class A | | | 22,039 | | | | 893,489 | |
China Cinda Asset Management Company Ltd., Class H | | | 246,000 | | | | 79,017 | |
China Huarong Asset Management Company Ltd. | | | 248,000 | | | | 71,756 | (d) |
CI Financial Corp. | | | 7,514 | | | | 134,977 | |
Coronation Fund Managers Ltd. | | | 10,031 | | | | 42,675 | |
Hargreaves Lansdown PLC | | | 6,626 | | | | 172,466 | |
IGM Financial Inc. | | | 2,320 | | | | 67,213 | |
Janus Henderson Group PLC | | | 1,218 | | | | 37,429 | |
Julius Baer Group Ltd. | | | 5,835 | | | | 342,478 | (a) |
Partners Group Holding AG | | | 451 | | | | 330,432 | |
Quilter PLC | | | 1 | | | | 1 | (a,d) |
SBI Holdings Inc. | | | 4,900 | | | | 126,255 | |
Schroders PLC | | | 3,183 | | | | 132,711 | |
St. James’s Place PLC | | | 14,401 | | | | 218,173 | |
| | | | 3,093,476 | |
Auto Parts & Equipment – 0.2% | |
Aisin Seiki Company Ltd. | | | 4,658 | | | | 212,368 | |
Aptiv PLC | | | 8,948 | | | | 819,905 | |
See Notes to Schedules of Investments and Notes to Financial Statements.
| | |
| State Street Total Return V.I.S. Fund | | |
| Schedule of Investments | | June 30, 2018 (Unaudited) |
|
| | | | | | | | |
| | | Number
of Shares | | | Fair
Value | |
Bharat Forge Ltd. | | | 8,872 | | | $ | 79,338 | |
Bosch Ltd. | | | 136 | | | | 34,757 | |
China First Capital Group Ltd. | | | 102,000 | | | | 65,006 | (a) |
Continental AG | | | 2,869 | | | | 655,034 | |
Delphi Technologies PLC | | | 596 | | | | 27,094 | |
Denso Corp. | | | 11,857 | | | | 579,335 | |
Faurecia S.A. | | | 1,920 | | | | 137,012 | |
Hanon Systems | | | 6,000 | | | | 57,066 | |
Hyundai Mobis Company Ltd. | | | 1,811 | | | | 344,488 | |
Koito Manufacturing Company Ltd. | | | 2,955 | | | | 195,284 | |
Linamar Corp. | | | 1,000 | | | | 43,947 | |
Magna International Inc. | | | 8,881 | | | | 516,205 | |
Minth Group Ltd. | | | 22,000 | | | | 92,958 | |
Motherson Sumi Systems Ltd. | | | 9,738 | | | | 40,464 | |
NGK Spark Plug Company Ltd. | | | 5,000 | | | | 142,644 | |
NOK Corp. | | | 2,000 | | | | 38,713 | |
Stanley Electric Company Ltd. | | | 4,000 | | | | 136,505 | |
Sumitomo Electric Industries Ltd. | | | 19,500 | | | | 290,480 | |
Toyoda Gosei Company Ltd. | | | 2,500 | | | | 63,400 | |
Toyota Industries Corp. | | | 4,309 | | | | 241,583 | |
Valeo S.A. | | | 6,560 | | | | 358,601 | |
| | | | 5,172,187 | |
Automobile Manufacturers – 0.7% | |
Astra International Tbk PT | | | 501,200 | | | | 230,839 | |
Bayerische Motoren Werke AG | | | 8,717 | | | | 790,082 | |
Brilliance China Automotive Holdings Ltd. | | | 90,000 | | | | 162,438 | |
BYD Company Ltd., Class H | | | 19,500 | | | | 118,186 | |
Daimler AG | | | 23,976 | | | | 1,543,265 | |
Dongfeng Motor Group Company Ltd., Class H | | | 74,000 | | | | 78,287 | |
Ferrari N.V. | | | 3,488 | | | | 474,436 | |
Fiat Chrysler Automobiles N.V. | | | 27,307 | | | | 520,765 | (a) |
Ford Otomotiv Sanayi AS | | | 2,547 | | | | 34,081 | |
Geely Automobile Holdings Ltd. | | | 138,000 | | | | 357,953 | |
Great Wall Motor Company Ltd., Class H | | | 86,000 | | | | 65,771 | |
Guangzhou Automobile Group Company Ltd., Class H | | | 84,000 | | | | 82,121 | |
Honda Motor Company Ltd. | | | 42,976 | | | | 1,262,140 | |
Hyundai Motor Co. | | | 4,288 | | | | 482,857 | |
Isuzu Motors Ltd. | | | 14,900 | | | | 197,945 | |
Kia Motors Corp. | | | 6,439 | | | | 178,235 | |
Mahindra & Mahindra Ltd. | | | 22,838 | | | | 299,229 | |
Maruti Suzuki India Ltd. | | | 2,782 | | | | 358,357 | |
Mazda Motor Corp. | | | 15,400 | | | | 189,085 | |
Mitsubishi Motors Corp. | | | 15,700 | | | | 125,158 | |
Nissan Motor Company Ltd. | | | 60,000 | | | | 583,939 | |
Peugeot S.A. | | | 15,358 | | | | 350,735 | |
Renault S.A. | | | 5,007 | | | | 425,759 | |
Subaru Corp. | | | 15,900 | | | | 462,940 | |
Suzuki Motor Corp. | | | 9,300 | | | | 513,677 | |
Tata Motors Ltd. | | | 33,690 | | | | 132,419 | (a) |
Tofas Turk Otomobil Fabrikasi AS | | | 4,588 | | | | 24,096 | |
Toyota Motor Corp. | | | 60,521 | | | | 3,917,624 | |
UMW Holdings Bhd | | | 21,300 | | | | 31,479 | |
Volkswagen AG | | | 856 | | | | 141,418 | |
| | | | 14,135,316 | |
Automotive Retail – 0.0% * | |
Hotai Motor Company Ltd. | | | 9,000 | | | | 79,260 | |
USS Company Ltd. | | | 4,800 | | | | 91,350 | |
| | | | 170,610 | |
Biotechnology – 0.2% | |
3SBio Inc. | | | 37,000 | | | | 84,041 | (d) |
Arbutus Biopharma Corp. | | | 768 | | | | 5,606 | (a) |
Celltrion Inc. | | | 2,089 | | | | 568,875 | (a) |
CSL Ltd. | | | 11,922 | | | | 1,696,706 | |
Genmab A/S | | | 1,508 | | | | 232,716 | (a) |
Grifols S.A. | | | 8,144 | | | | 245,130 | |
Nymox Pharmaceutical Corp. | | | 566 | | | | 1,902 | (a) |
Prothena Corporation PLC | | | 737 | | | | 10,746 | (a) |
Shire PLC | | | 23,888 | | | | 1,345,102 | |
SillaJen Inc. | | | 1,318 | | | | 86,684 | (a) |
| | | | 4,277,508 | |
| | | | | | | | |
| | | Number
of Shares | | | Fair
Value | |
Brewers – 0.3% | |
AMBEV S.A. | | | 129,211 | | | $ | 603,840 | |
Anadolu Efes Biracilik Ve Malt Sanayii AS | | | 8,317 | | | | 42,845 | |
Anheuser-Busch InBev S.A. | | | 20,797 | | | | 2,100,354 | |
Asahi Group Holdings Ltd. | | | 9,312 | | | | 476,844 | |
Carlsberg A/S, Class B | | | 2,787 | | | | 328,247 | |
China Resources Beer Holdings Company Ltd. | | | 48,000 | | | | 233,103 | |
Cia Cervecerias Unidas S.A. | | | 3,906 | | | | 49,052 | |
Heineken Holding N.V. | | | 2,878 | | | | 275,873 | |
Heineken N.V. | | | 6,681 | | | | 670,991 | |
Kirin Holdings Company Ltd. | | | 21,373 | | | | 571,735 | |
Tsingtao Brewery Company Ltd., Class H | | | 14,000 | | | | 76,911 | |
| | | | 5,429,795 | |
Broadcasting – 0.0% * | |
Astro Malaysia Holdings Bhd | | | 30,600 | | | | 12,044 | |
Central European Media Enterprises Ltd., Class A | | | 1,533 | | | | 6,362 | (a) |
ITV PLC | | | 94,573 | | | | 217,256 | |
ProSiebenSat.1 Media SE | | | 6,341 | | | | 160,877 | |
RTL Group S.A. | | | 1,073 | | | | 72,787 | |
Zee Entertainment Enterprises Ltd. | | | 13,471 | | | | 106,948 | |
| | | | 576,274 | |
Building Products – 0.2% | |
Allegion PLC | | | 3,051 | | | | 236,025 | |
Asahi Glass Company Ltd. | | | 5,360 | | | | 208,806 | |
Assa Abloy AB, Class B | | | 26,624 | | | | 568,133 | |
Caesarstone Ltd. | | | 396 | | | | 5,980 | |
Cie de Saint-Gobain | | | 12,890 | | | | 575,953 | |
Daikin Industries Ltd. | | | 6,700 | | | | 802,681 | |
Geberit AG | | | 1,006 | | | | 431,498 | |
KCC Corp. | | | 194 | | | | 57,095 | |
LIXIL Group Corp. | | | 7,200 | | | | 144,046 | |
TOTO Ltd. | | | 3,600 | | | | 167,056 | |
| | | | 3,197,273 | |
Cable & Satellite – 0.2% | |
Cyfrowy Polsat S.A. | | | 6,693 | | | | 41,367 | |
Eutelsat Communications S.A. | | | 5,802 | | | | 120,342 | |
Grupo Televisa SAB | | | 63,924 | | | | 245,149 | |
Liberty Latin America Ltd., Class A | | | 833 | | | | 15,927 | (a) |
Liberty Latin America Ltd., Class C | | | 2,118 | | | | 41,047 | (a) |
Naspers Ltd., Class N | | | 12,026 | | | | 3,057,774 | |
SES S.A. | | | 9,814 | | | | 179,781 | |
Shaw Communications Inc., Class B | | | 12,497 | | | | 254,415 | |
Sky PLC | | | 27,727 | | | | 535,005 | |
Telenet Group Holding N.V. | | | 1,308 | | | | 61,086 | (a) |
| | | | 4,551,893 | |
Casinos & Gaming – 0.1% | |
Aristocrat Leisure Ltd. | | | 14,952 | | | | 341,361 | |
Crown Resorts Ltd. | | | 12,361 | | | | 123,294 | |
Galaxy Entertainment Group Ltd. | | | 60,000 | | | | 464,600 | |
Genting Bhd | | | 64,500 | | | | 134,285 | |
Genting Malaysia Bhd | | | 109,600 | | | | 132,405 | |
Genting Singapore Ltd. | | | 165,000 | | | | 147,635 | |
GVC Holdings PLC | | | 13,177 | | | | 182,842 | |
Kangwon Land Inc. | | | 4,050 | | | | 95,027 | |
Melco Resorts & Entertainment Ltd. ADR | | | 7,165 | | | | 200,620 | |
MGM China Holdings Ltd. | | | 20,800 | | | | 48,252 | |
OPAP S.A. | | | 4,860 | | | | 54,927 | |
Paddy Power Betfair PLC | | | 2,176 | | | | 241,356 | |
Sands China Ltd. | | | 67,200 | | | | 359,322 | |
SJM Holdings Ltd. | | | 82,000 | | | | 102,011 | |
Tabcorp Holdings Ltd. | | | 48,924 | | | | 161,218 | |
Wynn Macau Ltd. | | | 42,000 | | | | 135,174 | |
| | | | 2,924,329 | |
Coal & Consumable Fuels – 0.0% * | |
Adaro Energy Tbk PT | | | 538,500 | | | | 67,266 | |
Banpu PCL NVDR | | | 38,000 | | | | 22,366 | |
Cameco Corp. | | | 8,409 | | | | 94,545 | |
China Shenhua Energy Company Ltd. | | | 96,500 | | | | 229,028 | |
Coal India Ltd. | | | 18,723 | | | | 72,239 | |
Energy Fuels Inc. | | | 1,732 | | | | 3,932 | (a) |
See Notes to Schedules of Investments and Notes to Financial Statements.
| | |
| State Street Total Return V.I.S. Fund | | |
| Schedule of Investments | | June 30, 2018 (Unaudited) |
|
| | | | | | | | |
| | | Number
of Shares | | | Fair
Value | |
Exxaro Resources Ltd. | | | 4,703 | | | $ | 43,131 | |
United Tractors Tbk PT | | | 33,500 | | | | 73,873 | |
Uranium Energy Corp. | | | 3,122 | | | | 5,026 | (a) |
Yanzhou Coal Mining Company Ltd., Class H | | | 38,000 | | | | 49,695 | |
| | | | 661,101 | |
Commercial Printing – 0.0% * | |
Cimpress N.V. | | | 408 | | | | 59,144 | (a) |
Dai Nippon Printing Company Ltd. | | | 7,400 | | | | 165,617 | |
Toppan Printing Company Ltd. | | | 16,000 | | | | 125,383 | |
| | | | 350,144 | |
Commodity Chemicals – 0.2% | |
Asahi Kasei Corp. | | | 34,400 | | | | 437,279 | |
Formosa Chemicals & Fibre Corp. | | | 80,540 | | | | 320,961 | |
Formosa Plastics Corp. | | | 115,960 | | | | 427,883 | |
Hanwha Chemical Corp. | | | 3,760 | | | | 73,716 | |
Hyosung Corp. | | | 768 | | | | 92,339 | |
Indorama Ventures PCL NVDR | | | 55,500 | | | | 91,718 | |
Kaneka Corp. | | | 8,000 | | | | 71,719 | |
Kumho Petrochemical Company Ltd. | | | 572 | | | | 59,792 | |
Kuraray Company Ltd. | | | 9,221 | | | | 127,037 | |
LG Chem Ltd. | | | 1,269 | | | | 379,732 | |
Lotte Chemical Corp. | | | 473 | | | | 147,693 | |
Methanex Corp. | | | 1,527 | | | | 107,910 | |
Mexichem SAB de C.V. | | | 22,840 | | | | 66,734 | |
Mitsui Chemicals Inc. | | | 5,200 | | | | 138,491 | |
Nan Ya Plastics Corp. | | | 128,850 | | | | 368,523 | |
Orica Ltd. | | | 11,069 | | | | 145,165 | |
Petronas Chemicals Group Bhd | | | 69,900 | | | | 145,528 | |
PTT Global Chemical PCL NVDR | | | 62,900 | | | | 138,597 | |
Sinopec Shanghai Petrochemical Company Ltd., Class H | | | 129,000 | | | | 78,596 | |
Teijin Ltd. | | | 4,700 | | | | 86,222 | |
Toray Industries Inc. | | | 39,800 | | | | 314,045 | |
Tosoh Corp. | | | 7,924 | | | | 122,832 | |
| | | | 3,942,512 | |
Communications Equipment – 0.1% | |
ARRIS International PLC | | | 1,141 | | | | 27,892 | (a) |
Nokia Oyj | | | 146,979 | | | | 846,015 | |
Telefonaktiebolaget LM Ericsson, Class B | | | 81,886 | | | | 633,962 | |
ZTE Corp., Class H | | | 29,280 | | | | 44,486 | (a) |
| | | | 1,552,355 | |
Computer & Electronics Retail – 0.0% * | |
GOME Retail Holdings Ltd. | | | 456,000 | | | | 46,498 | (a) |
Hikari Tsushin Inc. | | | 500 | | | | 87,889 | |
Yamada Denki Company Ltd. | | | 17,200 | | | | 85,561 | |
| | | | 219,948 | |
Construction & Engineering – 0.2% | |
ACS Actividades de Construccion y Servicios S.A. | | | 5,751 | | | | 232,996 | |
Bouygues S.A. | | | 6,436 | | | | 277,355 | |
China Communications Construction Company Ltd., Class H | | | 117,000 | | | | 113,041 | |
China Railway Construction Corporation Ltd., Class H | | | 73,500 | | | | 74,480 | |
China Railway Group Ltd., Class H | | | 149,000 | | | | 112,432 | |
China State Construction International Holdings Ltd. | | | 34,250 | | | | 35,143 | |
CIMIC Group Ltd. | | | 2,648 | | | | 82,759 | |
Daelim Industrial Company Ltd. | | | 460 | | | | 31,575 | |
Daewoo Engineering & Construction Company Ltd. | | | 5,220 | | | | 27,493 | (a) |
Eiffage S.A. | | | 2,147 | | | | 233,577 | |
Ferrovial S.A. | | | 11,951 | | | | 245,231 | |
Gamuda Bhd | | | 63,600 | | | | 51,485 | |
GS Engineering & Construction Corp. | | | 2,019 | | | | 83,332 | |
HDC Hyundai Development Company-Engineering & Construction | | | 1,410 | | | | 68,191 | (a) |
HOCHTIEF AG | | | 448 | | | | 80,970 | |
Hyundai Engineering & Construction Company Ltd. | | | 1,499 | | | | 77,337 | |
IJM Corporation Bhd | | | 83,000 | | | | 36,779 | |
JGC Corp. | | | 5,100 | | | | 102,815 | |
Kajima Corp. | | | 27,000 | | | | 209,146 | |
| | | | | | | | |
| | | Number
of Shares | | | Fair
Value | |
Larsen & Toubro Ltd. | | | 14,392 | | | $ | 267,843 | |
Obayashi Corp. | | | 17,000 | | | | 176,960 | |
Shimizu Corp. | | | 15,800 | | | | 163,898 | |
Skanska AB, Class B | | | 10,011 | | | | 182,181 | |
SNC-Lavalin Group Inc. | | | 4,467 | | | | 197,160 | |
Taisei Corp. | | | 4,900 | | | | 270,293 | |
Vinci S.A. | | | 13,213 | | | | 1,270,555 | |
WSP Global Inc. | | | 2,400 | | | | 126,290 | |
| | | | 4,831,317 | |
Construction Machinery & Heavy Trucks – 0.1% | |
Alstom S.A. | | | 4,476 | | | | 205,694 | |
CRRC Corporation Ltd., Class H | | | 103,950 | | | | 80,691 | |
Eicher Motors Ltd. | | | 358 | | | | 149,389 | |
Epiroc AB A Shares | | | 17,986 | | | | 188,968 | (a) |
Epiroc AB B Shares | | | 10,231 | | | | 93,779 | (a) |
Hino Motors Ltd. | | | 4,900 | | | | 52,333 | |
Hitachi Construction Machinery Company Ltd. | | | 2,700 | | | | 87,753 | |
Hyundai Heavy Industries Company Ltd. | | | 740 | | | | 67,725 | (a) |
KION Group AG | | | 1,793 | | | | 129,038 | |
Komatsu Ltd. | | | 24,600 | | | | 703,587 | |
MAN SE | | | 853 | | | | 96,555 | |
Samsung Heavy Industries Company Ltd. | | | 7,691 | | | | 49,272 | (a) |
Volvo AB, Class B | | | 41,905 | | | | 670,780 | |
Weichai Power Company Ltd., Class H | | | 72,000 | | | | 99,298 | |
Yangzijiang Shipbuilding Holdings Ltd. | | | 42,700 | | | | 28,341 | |
| | | | 2,703,203 | |
Construction Materials – 0.2% | |
Ambuja Cements Ltd. | | | 22,724 | | | | 68,804 | |
Anhui Conch Cement Company Ltd., Class H | | | 30,500 | | | | 174,942 | |
Asia Cement Corp. | | | 78,030 | | | | 85,737 | |
Boral Ltd. | | | 34,115 | | | | 164,594 | |
Cementos Argos S.A. | | | 13,625 | | | | 45,463 | |
Cemex SAB de C.V. | | | 404,612 | | | | 268,839 | (a) |
China National Building Material Company Ltd., Class H | | | 62,000 | | | | 61,404 | |
China Resources Cement Holdings Ltd. | | | 68,000 | | | | 68,906 | |
CRH PLC | | | 24,334 | | | | 862,279 | |
Fletcher Building Ltd. | | | 30,991 | | | | 145,828 | |
Grasim Industries Ltd. | | | 8,290 | | | | 121,824 | |
Grupo Argos S.A. | | | 11,233 | | | | 75,958 | |
HeidelbergCement AG | | | 4,028 | | | | 338,985 | |
Imerys S.A. | | | 1,254 | | | | 101,390 | |
Indocement Tunggal Prakarsa Tbk PT | | | 55,500 | | | | 52,866 | |
James Hardie Industries PLC | | | 11,037 | | | | 184,948 | |
LafargeHolcim Ltd. | | | 11,715 | | | | 570,796 | (a) |
Semen Indonesia Persero Tbk PT | | | 110,500 | | | | 54,942 | |
Taiheiyo Cement Corp. | | | 3,400 | | | | 111,886 | |
Taiwan Cement Corp. | | | 83,000 | | | | 115,291 | |
The Siam Cement PCL | | | 7,500 | | | | 93,269 | |
The Siam Cement PCL NVDR | | | 2,600 | | | | 32,490 | |
Titan Cement Company S.A. | | | 1,510 | | | | 38,257 | |
UltraTech Cement Ltd. | | | 1,319 | | | | 73,513 | |
| | | | 3,913,211 | |
Consumer Electronics – 0.2% | |
Casio Computer Company Ltd. | | | 5,100 | | | | 82,970 | |
Garmin Ltd. | | | 3,307 | | | | 201,727 | |
LG Electronics Inc. | | | 2,888 | | | | 215,078 | |
Nikon Corp. | | | 10,100 | | | | 160,757 | |
Panasonic Corp. | | | 58,900 | | | | 794,178 | |
Sharp Corp. | | | 3,700 | | | | 90,191 | |
Sony Corp. | | | 33,100 | | | | 1,692,578 | |
| | | | 3,237,479 | |
Consumer Finance – 0.0% * | |
Acom Company Ltd. | | | 16,000 | | | | 61,536 | |
AEON Financial Service Company Ltd. | | | 2,900 | | | | 61,893 | |
Bajaj Finance Ltd. | | | 4,737 | | | | 158,765 | |
Credit Saison Company Ltd. | | | 3,600 | | | | 56,682 | |
Mahindra & Mahindra Financial Services Ltd. | | | 10,172 | | | | 69,726 | |
See Notes to Schedules of Investments and Notes to Financial Statements.
| | |
| State Street Total Return V.I.S. Fund | | |
Schedule of Investments | | June 30, 2018 (Unaudited) |
| | | | | | | | |
| | | Number
of Shares | | | Fair
Value | |
Samsung Card Company Ltd. | | | 1,450 | | | $ | 49,830 | |
Shriram Transport Finance Company Ltd. | | | 4,730 | | | | 89,709 | |
| | | | 548,141 | |
Copper – 0.0% * | |
Antofagasta PLC | | | 12,579 | | | | 164,413 | |
First Quantum Minerals Ltd. | | | 18,044 | | | | 265,698 | |
Jiangxi Copper Company Ltd., Class H | | | 29,000 | | | | 36,964 | |
KGHM Polska Miedz S.A. | | | 3,476 | | | | 81,702 | |
Lundin Mining Corp. | | | 16,300 | | | | 90,580 | |
| | | | 639,357 | |
Data Processing & Outsourced Services – 0.1% | |
Amadeus IT Group S.A. | | | 11,424 | | | | 901,655 | |
Cielo S.A. | | | 35,804 | | | | 153,735 | |
Computershare Ltd. | | | 12,912 | | | | 175,823 | |
EVERTEC Inc. | | | 1,035 | | | | 22,615 | |
GDS Holdings Ltd. ADR | | | 2,000 | | | | 80,180 | (a) |
Travelport Worldwide Ltd. | | | 2,170 | | | | 40,232 | |
TravelSky Technology Ltd. H Shares | | | 31,000 | | | | 90,288 | |
Wirecard AG | | | 3,185 | | | | 512,988 | |
| | | | 1,977,516 | |
Department Stores – 0.1% | |
El Puerto de Liverpool SAB de C.V. | | | 6,900 | | | | 44,737 | |
Hyundai Department Store Company Ltd. | | | 375 | | | | 38,863 | |
Isetan Mitsukoshi Holdings Ltd. | | | 9,800 | | | | 122,450 | |
J Front Retailing Company Ltd. | | | 5,900 | | | | 89,860 | |
Lojas Renner S.A. | | | 18,194 | | | | 138,888 | |
Lotte Shopping Company Ltd. | | | 398 | | | | 74,993 | |
Marks & Spencer Group PLC | | | 39,027 | | | | 152,051 | |
Marui Group Company Ltd. | | | 5,300 | | | | 111,680 | |
Matahari Department Store Tbk PT | | | 50,000 | | | | 30,705 | |
Next PLC | | | 4,041 | | | | 322,775 | |
SACI Falabella | | | 17,913 | | | | 164,915 | |
Shinsegae Inc. | | | 156 | | | | 56,199 | |
Takashimaya Company Ltd. | | | 10,000 | | | | 85,587 | |
Woolworths Holdings Ltd. | | | 22,109 | | | | 89,444 | |
| | | | 1,523,147 | |
Distillers & Vintners – 0.2% | |
Diageo PLC | | | 65,049 | | | | 2,337,680 | |
Treasury Wine Estates Ltd. | | | 18,140 | | | | 233,074 | |
Remy Cointreau S.A. | | | 529 | | | | 68,557 | |
United Spirits Ltd. | | | 7,660 | | | | 74,342 | (a) |
Davide Campari-Milano S.p.A. | | | 16,679 | | | | 137,191 | |
Pernod Ricard S.A. | | | 5,731 | | | | 936,103 | |
| | | | 3,786,947 | |
Distributors – 0.0% * | |
Imperial Holdings Ltd. | | | 4,295 | | | | 61,384 | |
Jardine Cycle & Carriage Ltd. | | | 2,744 | | | | 64,037 | |
| | | | 125,421 | |
Diversified Banks – 3.3% | |
ABN AMRO Group N.V. | | | 9,910 | | | | 257,095 | (d) |
Abu Dhabi Commercial Bank PJSC | | | 59,604 | | | | 114,562 | |
Agricultural Bank of China Ltd., Class H | | | 810,000 | | | | 378,908 | |
AIB Group PLC | | | 20,251 | | | | 109,945 | |
Akbank Turk AS | | | 57,989 | | | | 95,188 | |
Alior Bank S.A. | | | 1,742 | | | | 31,127 | (a) |
Alliance Bank Malaysia Bhd | | | 47,100 | | | | 47,106 | |
Alpha Bank AE | | | 47,969 | | | | 107,252 | (a) |
AMMB Holdings Bhd | | | 71,600 | | | | 66,469 | |
Aozora Bank Ltd. | | | 3,000 | | | | 114,161 | |
Australia & New Zealand Banking Group Ltd. | | | 77,556 | | | | 1,618,215 | |
Axis Bank Ltd. | | | 46,613 | | | | 347,514 | |
Banco Bilbao Vizcaya Argentaria S.A. | | | 180,593 | | | | 1,280,712 | |
Banco Bradesco S.A. | | | 28,943 | | | | 183,404 | |
Banco de Chile | | | 420,853 | | | | 65,082 | |
Banco de Credito e Inversiones S.A. | | | 1,123 | | | | 74,989 | |
Banco de Sabadell S.A. | | | 147,393 | | | | 247,033 | |
Banco do Brasil S.A. | | | 23,600 | | | | 175,739 | |
Banco Santander Brasil S.A. | | | 9,921 | | | | 75,554 | |
Banco Santander Chile | | | 1,613,068 | | | | 127,030 | |
Banco Santander Mexico S.A. Institucion de Banca Multiple Grupo Financiero Santand, B Shares | | | 38,960 | | | | 53,180 | |
| | | | | | | | |
| | | Number
of Shares | | | Fair
Value | |
Banco Santander S.A. | | | 429,800 | | | $ | 2,304,326 | |
Bangkok Bank PCL | | | 3,000 | | | | 17,975 | |
Bangkok Bank PCL NVDR | | | 1,300 | | | | 7,671 | |
Bank Central Asia Tbk PT | | | 271,500 | | | | 406,871 | |
Bank Danamon Indonesia Tbk PT | | | 32,900 | | | | 14,636 | |
Bank Handlowy w Warszawie S.A. | | | 1,235 | | | | 23,354 | |
Bank Hapoalim BM | | | 32,415 | | | | 219,167 | |
Bank Leumi Le-Israel BM | | | 35,948 | | | | 212,120 | |
Bank Mandiri Persero Tbk PT | | | 464,000 | | | | 221,800 | |
Bank Millennium S.A. | | | 17,468 | | | | 37,419 | (a) |
Bank Negara Indonesia Persero Tbk PT | | | 189,400 | | | | 93,180 | |
Bank of China Ltd., Class H | | | 2,182,000 | | | | 1,081,898 | |
Bank of Communications Company Ltd., Class H | | | 209,000 | | | | 160,104 | |
Bank of Ireland Group PLC | | | 24,711 | | | | 192,871 | |
Bank of Montreal | | | 16,898 | | | | 1,305,390 | |
Bank of the Philippine Islands | | | 32,585 | | | | 54,036 | |
Bank Polska Kasa Opieki S.A. | | | 5,497 | | | | 165,911 | |
Bank Rakyat Indonesia Persero Tbk PT | | | 1,547,000 | | | | 306,593 | |
Bank Zachodni WBK S.A. | | | 987 | | | | 87,945 | |
Bankia S.A. | | | 29,006 | | | | 108,608 | |
Bankinter S.A. | | | 17,977 | | | | 175,091 | |
Barclays Africa Group Ltd. | | | 16,356 | | | | 190,920 | |
Barclays PLC | | | 461,577 | | | | 1,151,761 | |
BDO Unibank Inc. | | | 67,230 | | | | 158,099 | |
BNP Paribas S.A. | | | 29,592 | | | | 1,837,723 | |
BOC Hong Kong Holdings Ltd. | | | 101,500 | | | | 478,038 | |
CaixaBank S.A. | | | 90,794 | | | | 392,860 | |
Canadian Imperial Bank of Commerce | | | 11,448 | | | | 995,244 | |
Chang Hwa Commercial Bank Ltd. | | | 140,805 | | | | 81,744 | |
China CITIC Bank Corporation Ltd., Class H | | | 253,000 | | | | 158,338 | |
China Construction Bank Corp., Class H | | | 2,542,000 | | | | 2,349,069 | |
China Development Financial Holding Corp. | | | 406,000 | | | | 148,479 | |
China Merchants Bank Company Ltd., Class H | | | 98,231 | | | | 362,476 | |
China Minsheng Banking Corporation Ltd., Class H | | | 206,640 | | | | 147,761 | |
CIMB Group Holdings Bhd | | | 133,920 | | | | 180,682 | |
Commercial International Bank Egypt SAE | | | 34,995 | | | | 166,818 | |
Commerzbank AG | | | 28,904 | | | | 277,096 | (a) |
Commonwealth Bank of Australia | | | 46,599 | | | | 2,508,890 | |
Credicorp Ltd. | | | 1,951 | | | | 439,209 | |
Credit Agricole S.A. | | | 32,280 | | | | 430,968 | |
CTBC Financial Holding Company Ltd. | | | 486,661 | | | | 350,368 | |
Danske Bank A/S | | | 20,112 | | | | 629,534 | |
DBS Group Holdings Ltd. | | | 46,973 | | | | 916,723 | |
DNB ASA | | | 25,499 | | | | 498,379 | |
Doha Bank QPSC | | | 5,128 | | | | 37,675 | |
Dubai Islamic Bank PJSC | | | 75,198 | | | | 99,700 | |
E.Sun Financial Holding Company Ltd. | | | 257,132 | | | | 179,217 | |
Erste Group Bank AG | | | 9,051 | | | | 377,788 | (a) |
Eurobank Ergasias S.A. | | | 2,173 | | | | 2,271 | (a) |
First Abu Dhabi Bank PJSC | | | 35,661 | | | | 117,959 | |
First Financial Holding Company Ltd. | | | 210,166 | | | | 142,002 | |
Grupo Financiero Banorte SAB de C.V., Class O | | | 67,000 | | | | 399,053 | |
Grupo Financiero Inbursa SAB de C.V., Class O | | | 64,600 | | | | 91,367 | |
Hana Financial Group Inc. | | | 8,259 | | | | 317,540 | |
Hang Seng Bank Ltd. | | | 21,600 | | | | 540,176 | |
Hong Leong Bank Bhd | | | 22,500 | | | | 101,374 | |
Hong Leong Financial Group Bhd | | | 8,200 | | | | 36,539 | |
HSBC Holdings PLC | | | 528,900 | | | | 4,962,680 | |
Hua Nan Financial Holdings Company Ltd. | | | 146,710 | | | | 85,413 | |
ICICI Bank Ltd. | | | 51,903 | | | | 208,627 | |
Industrial & Commercial Bank of China Ltd., Class H | | | 1,827,000 | | | | 1,366,969 | |
Industrial Bank of Korea | | | 6,426 | | | | 88,794 | |
ING Groep N.V. | | | 101,277 | | | | 1,457,737 | |
Intesa Sanpaolo S.p.A. | | | 18,145 | | | | 55,039 | |
Intesa Sanpaolo S.p.A. | | | 365,624 | | | | 1,061,448 | |
See Notes to Schedules of Investments and Notes to Financial Statements.
| | |
| State Street Total Return V.I.S. Fund | | |
Schedule of Investments | | June 30, 2018 (Unaudited) |
| | | | | | | | |
| | | Number
of Shares | | | Fair
Value | |
Itau CorpBanca | | | 5,524,790 | | | $ | 54,192 | |
Japan Post Bank Company Ltd. | | | 10,500 | | | | 122,286 | |
Kasikornbank PCL | | | 38,000 | | | | 229,399 | |
Kasikornbank PCL NVDR | | | 15,300 | | | | 89,592 | |
KB Financial Group Inc. | | | 10,750 | | | | 509,287 | |
KBC Group N.V. | | | 7,067 | | | | 545,561 | |
Komercni Banka AS | | | 2,365 | | | | 99,295 | |
Krung Thai Bank PCL NVDR | | | 138,400 | | | | 69,764 | |
Lloyds Banking Group PLC | | | 1,895,961 | | | | 1,578,232 | |
Malayan Banking Bhd | | | 108,351 | | | | 241,406 | |
Masraf Al Rayan QSC | | | 10,608 | | | | 101,768 | |
mBank S.A. | | | 587 | | | | 62,683 | |
Mega Financial Holding Company Ltd. | | | 315,192 | | | | 278,094 | |
Metropolitan Bank & Trust Co. | | | 21,790 | | | | 29,969 | |
Mitsubishi UFJ Financial Group Inc. | | | 309,500 | | | | 1,763,422 | |
Mizrahi Tefahot Bank Ltd. | | | 4,951 | | | | 90,849 | |
Mizuho Financial Group Inc. | | | 651,328 | | | | 1,096,670 | |
National Australia Bank Ltd. | | | 70,879 | | | | 1,435,433 | |
National Bank of Canada | | | 9,663 | | | | 463,665 | |
National Bank of Greece S.A. | | | 1,560 | | | | 479 | (a) |
Nedbank Group Ltd. | | | 5,488 | | | | 99,932 | |
Nordea Bank AB | | | 81,543 | | | | 786,444 | |
OTP Bank Nyrt | | | 7,068 | | | | 255,998 | |
Oversea-Chinese Banking Corporation Ltd. | | | 81,675 | | | | 697,247 | |
Piraeus Bank S.A. | | | 42 | | | | 143 | (a) |
Powszechna Kasa Oszczednosci Bank Polski S.A. | | | 28,491 | | | | 281,489 | (a) |
Public Bank Bhd | | | 81,840 | | | | 473,272 | |
Qatar Islamic Bank SAQ | | | 1,140 | | | | 36,320 | |
Qatar National Bank QPSC | | | 11,647 | | | | 486,225 | |
Raiffeisen Bank International AG | | | 5,172 | | | | 158,754 | |
RHB Bank Bhd | | | 34,822 | | | | 47,067 | |
Royal Bank of Canada | | | 37,913 | | | | 2,853,022 | |
Royal Bank of Scotland Group PLC | | | 99,516 | | | | 336,480 | (a) |
Sberbank of Russia PJSC ADR | | | 72,140 | | | | 1,041,341 | |
Shinhan Financial Group Company Ltd. | | | 11,463 | | | | 445,355 | |
SinoPac Financial Holdings Company Ltd. | | | 335,791 | | | | 121,151 | |
Skandinaviska Enskilda Banken AB, Class A | | | 40,362 | | | | 384,220 | |
Societe Generale S.A. | | | 21,025 | | | | 886,542 | |
Standard Bank Group Ltd. | | | 36,859 | | | | 515,979 | |
Standard Chartered PLC | | | 72,950 | | | | 667,059 | |
State Bank of India | | | 47,012 | | | | 177,955 | (a) |
Sumitomo Mitsui Financial Group Inc. | | | 35,100 | | | | 1,364,516 | |
Sumitomo Mitsui Trust Holdings Inc. | | | 9,200 | | | | 364,877 | |
Svenska Handelsbanken AB, Class A | | | 40,945 | | | | 455,677 | |
Swedbank AB, Class A | | | 25,743 | | | | 551,923 | |
Taishin Financial Holding Company Ltd. | | | 280,597 | | | | 132,529 | |
Taiwan Business Bank | | | 168,187 | | | | 51,909 | |
Taiwan Cooperative Financial Holding Company Ltd. | | | 167,699 | | | | 98,182 | |
The Bank of East Asia Ltd. | | | 26,966 | | | | 107,755 | |
The Bank of Nova Scotia | | | 32,059 | | | | 1,814,187 | |
The Bank of NT Butterfield & Son Ltd. | | | 957 | | | | 43,754 | |
The Commercial Bank PQSC | | | 4,833 | | | | 50,560 | |
The Siam Commercial Bank PCL NVDR | | | 60,100 | | | | 214,967 | |
The Toronto-Dominion Bank | | | 48,415 | | | | 2,800,484 | |
TMB Bank PCL NVDR | | | 250,000 | | | | 17,356 | |
Turkiye Garanti Bankasi AS | | | 68,113 | | | | 124,593 | |
Turkiye Halk Bankasi AS | | | 25,730 | | | | 41,562 | |
Turkiye Is Bankasi A/S , Class C | | | 27,410 | | | | 34,104 | |
Turkiye Vakiflar Bankasi Tao, Class D | | | 28,976 | | | | 31,056 | |
UniCredit S.p.A. | | | 54,203 | | | | 904,719 | |
United Overseas Bank Ltd. | | | 34,621 | | | | 679,470 | |
VTB Bank PJSC GDR | | | 85,999 | | | | 130,976 | |
Westpac Banking Corp. | | | 89,940 | | | | 1,947,048 | |
Woori Bank | | | 10,759 | | | | 157,355 | |
Yapi ve Kredi Bankasi AS | | | 67,070 | | | | 36,308 | (a) |
Yes Bank Ltd. | | | 46,710 | | | | 231,556 | |
| | | | 71,349,242 | |
Diversified Capital Markets – 0.2% | |
China Everbright Ltd. | | | 14,000 | | | | 25,696 | |
Credit Suisse Group AG | | | 65,476 | | | | 985,816 | (a) |
| | | | | | | | |
| | | Number
of Shares | | | Fair
Value | |
Deutsche Bank AG | | | 54,090 | | | $ | 582,395 | |
Investec Ltd. | | | 5,853 | | | | 41,021 | |
Investec PLC | | | 16,536 | | | | 117,454 | |
Macquarie Group Ltd. | | | 8,330 | | | | 761,019 | |
Mirae Asset Daewoo Company Ltd. | | | 10,004 | | | | 76,477 | |
Natixis S.A. | | | 27,108 | | | | 192,369 | |
UBS Group AG | | | 96,687 | | | | 1,492,249 | (a) |
| | | | 4,274,496 | |
Diversified Chemicals – 0.2% | |
Arkema S.A. | | | 2,022 | | | | 239,384 | |
BASF SE | | | 24,646 | | | | 2,356,997 | |
Daicel Corp. | | | 6,900 | | | | 76,373 | |
Incitec Pivot Ltd. | | | 43,657 | | | | 117,089 | |
Lanxess AG | | | 2,671 | | | | 208,318 | |
Mitsubishi Chemical Holdings Corp. | | | 36,605 | | | | 306,482 | |
Mitsubishi Gas Chemical Company Inc. | | | 5,100 | | | | 115,569 | |
Nissan Chemical Industries Ltd. | | | 3,600 | | | | 168,031 | |
OCI Company Ltd. | | | 643 | | | | 59,425 | |
Sasol Ltd. | | | 14,767 | | | | 541,777 | |
Solvay S.A. | | | 2,202 | | | | 278,048 | |
Sumitomo Chemical Company Ltd. | | | 41,000 | | | | 232,456 | |
| | | | 4,699,949 | |
Diversified Metals & Mining – 0.5% | |
Anglo American PLC | | | 27,320 | | | | 611,302 | |
BHP Billiton Ltd. | | | 85,117 | | | | 2,132,555 | |
BHP Billiton PLC | | | 55,449 | | | | 1,248,904 | |
Boliden AB | | | 7,002 | | | | 227,451 | |
China Molybdenum Company Ltd. H Shares | | | 126,000 | | | | 61,029 | |
Ferroglobe PLC | | | 1,316 | | | | — | (i,**) |
Glencore PLC | | | 303,977 | | | | 1,452,799 | (a) |
Grupo Mexico SAB de C.V., Class B | | | 98,250 | | | | 281,867 | |
Korea Zinc Company Ltd. | | | 215 | | | | 74,464 | |
Mitsubishi Materials Corp. | | | 2,800 | | | | 76,974 | |
MMC Norilsk Nickel PJSC ADR | | | 17,154 | | | | 309,287 | |
Rio Tinto Ltd. | | | 10,604 | | | | 653,733 | |
Rio Tinto PLC | | | 32,372 | | | | 1,795,472 | |
South32 Ltd. | | | 133,360 | | | | 355,704 | |
Sumitomo Metal Mining Company Ltd. | | | 6,560 | | | | 250,993 | |
Teck Resources Ltd.,
Class B | | | 12,981 | | | | 330,483 | |
Turquoise Hill Resources Ltd. | | | 29,112 | | | | 82,327 | (a) |
Vedanta Ltd. | | | 42,022 | | | | 144,867 | |
| | | | 10,090,211 | |
Diversified Real Estate Activities – 0.2% | |
Aldar Properties PJSC | | | 118,736 | | | | 65,297 | |
Ayala Land Inc. | | | 254,600 | | | | 180,809 | |
Barwa Real Estate Co. | | | 6,158 | | | | 57,842 | |
CapitaLand Ltd. | | | 75,000 | | | | 173,817 | |
City Developments Ltd. | | | 11,100 | | | | 88,979 | |
Daito Trust Construction Company Ltd. | | | 1,900 | | | | 308,933 | |
Daiwa House Industry Company Ltd. | | | 15,460 | | | | 527,034 | |
Ezdan Holding Group QSC | | | 23,752 | | | | 53,493 | (a) |
Hang Lung Properties Ltd. | | | 57,000 | | | | 117,554 | |
Henderson Land Development Company Ltd. | | | 36,133 | | | | 191,132 | |
Kerry Properties Ltd. | | | 17,000 | | | | 81,366 | |
LendLease Group | | | 16,540 | | | | 242,090 | |
Mitsubishi Estate Company Ltd. | | | 30,636 | | | | 535,746 | |
Mitsui Fudosan Company Ltd. | | | 24,315 | | | | 586,993 | |
New World Development Company Ltd. | | | 175,842 | | | | 247,442 | |
Nomura Real Estate Holdings Inc. | | | 2,200 | | | | 48,821 | |
Sime Darby Property Bhd | | | 71,462 | | | | 21,229 | |
Sumitomo Realty & Development Company Ltd. | | | 10,000 | | | | 369,160 | |
Sun Hung Kai Properties Ltd. | | | 37,000 | | | | 558,387 | |
Swire Pacific Ltd., Class A | | | 16,000 | | | | 169,474 | |
The Wharf Holdings Ltd. | | | 36,000 | | | | 115,634 | |
Tokyo Tatemono Company Ltd. | | | 4,900 | | | | 67,286 | |
Tokyu Fudosan Holdings Corp. | | | 10,100 | | | | 71,306 | |
UOL Group Ltd. | | | 9,016 | | | | 50,387 | |
Wheelock & Company Ltd. | | | 24,000 | | | | 167,180 | |
| | | | 5,097,391 | |
Diversified REITs – 0.1% | |
Covivio | | | 1,038 | | | | 107,982 | |
Daiwa House REIT Investment Corp. | | | 34 | | | | 80,699 | |
See Notes to Schedules of Investments and Notes to Financial Statements.
| | |
| State Street Total Return V.I.S. Fund | | |
Schedule of Investments | | June 30, 2018 (Unaudited) |
| | | | | | | | |
| | | Number
of Shares | | | Fair
Value | |
Fibra Uno Administracion S.A. de C.V. | | | 80,100 | | | $ | 117,527 | |
Gecina S.A. | | | 1,274 | | | | 213,153 | |
Growthpoint Properties Ltd. | | | 64,536 | | | | 125,670 | |
H&R Real Estate Investment Trust | | | 5,097 | | | | 77,959 | |
ICADE | | | 1,137 | | | | 106,599 | |
Land Securities Group PLC | | | 20,357 | | | | 257,180 | |
Mirvac Group | | | 110,757 | | | | 177,577 | |
Nomura Real Estate Master Fund Inc. | | | 120 | | | | 169,331 | |
Redefine Properties Ltd. | | | 118,780 | | | | 90,907 | |
Stockland | | | 68,792 | | | | 201,783 | |
Suntec Real Estate Investment Trust | | | 65,800 | | | | 83,487 | |
The GPT Group | | | 44,844 | | | | 167,653 | |
United Urban Investment Corp. | | | 89 | | | | 138,122 | |
| | | | 2,115,629 | |
Diversified Support Services – 0.0% * | |
Babcock International Group PLC | | | 6,848 | | | | 73,938 | |
Brambles Ltd. | | | 44,121 | | | | 289,477 | |
Edenred | | | 5,890 | | | | 186,088 | |
ISS A/S | | | 4,094 | | | | 140,690 | |
KEPCO Plant Service & Engineering Company Ltd. | | | 1,248 | | | | 39,921 | |
| | | | 730,114 | |
Drug Retail – 0.0% * | |
Raia Drogasil S.A. | | | 7,400 | | | | 127,712 | |
Sundrug Company Ltd. | | | 2,000 | | | | 81,072 | |
Tsuruha Holdings Inc. | | | 1,000 | | | | 125,401 | |
| | | | 334,185 | |
Education Services – 0.0% * | |
Benesse Holdings Inc. | | | 1,700 | | | | 60,317 | |
Kroton Educacional S.A. | | | 39,716 | | | | 96,209 | |
New Oriental Education & Technology Group Inc. ADR | | | 4,000 | | | | 378,640 | |
TAL Education Group ADR | | | 8,400 | | | | 309,120 | (a) |
| | | | 844,286 | |
Electric Utilities – 0.4% | |
AusNet Services | | | 64,560 | | | | 76,559 | |
CEZ AS | | | 3,979 | | | | 94,110 | |
Chubu Electric Power Company Inc. | | | 17,227 | | | | 258,331 | |
CK Infrastructure Holdings Ltd. | | | 14,500 | | | | 107,473 | |
CLP Holdings Ltd. | | | 45,500 | | | | 490,061 | |
EDP - Energias de Portugal S.A. | | | 64,760 | | | | 257,076 | |
EDP - Energias do Brasil S.A. | | | 9,400 | | | | 33,887 | |
Electricite de France S.A. | | | 11,548 | | | | 158,828 | |
Emera Inc. | | | 2,100 | | | | 68,326 | |
Endesa S.A. | | | 8,555 | | | | 188,731 | |
Enel Americas S.A. | | | 730,486 | | | | 128,685 | |
Enel Chile S.A. | | | 1,021,407 | | | | 101,177 | |
Enel S.p.A. | | | 219,776 | | | | 1,220,644 | |
Fortis Inc. | | | 11,647 | | | | 372,045 | |
Fortum Oyj | | | 12,194 | | | | 291,006 | |
HK Electric Investments & HK Electric Investments Ltd. | | | 40,500 | | | | 38,717 | (d) |
Hydro One Ltd. | | | 6,800 | | | | 103,593 | (d) |
Iberdrola S.A. | | | 156,501 | | | | 1,210,356 | |
Interconexion Electrica S.A. ESP | | | 12,838 | | | | 63,382 | |
Korea Electric Power Corp. | | | 6,435 | | | | 184,764 | |
Kyushu Electric Power Company Inc. | | | 8,800 | | | | 98,197 | |
Orsted A/S | | | 4,922 | | | | 297,719 | (d) |
PGE Polska Grupa Energetyczna S.A. | | | 27,532 | | | | 68,684 | (a) |
Power Assets Holdings Ltd. | | | 38,500 | | | | 269,166 | |
Power Grid Corporation of India Ltd. | | | 36,135 | | | | 98,545 | |
Red Electrica Corp. S.A. | | | 11,878 | | | | 241,861 | |
RusHydro PJSC ADR | | | 52,229 | | | | 54,840 | |
SSE PLC | | | 27,276 | | | | 487,951 | |
Tenaga Nasional Bhd | | | 88,500 | | | | 320,743 | |
Terna Rete Elettrica Nazionale S.p.A. | | | 35,635 | | | | 192,717 | |
The Chugoku Electric Power Company Inc. | | | 7,600 | | | | 98,255 | |
The Kansai Electric Power Company Inc. | | | 17,000 | | | | 248,021 | |
The Tata Power Company Ltd. | | | 40,698 | | | | 43,511 | |
Tohoku Electric Power Company Inc. | | | 13,200 | | | | 161,239 | |
Tokyo Electric Power Company Holdings Inc. | | | 42,100 | | | | 196,123 | (a) |
| | | | 8,325,323 | |
| | | | | | | | |
| | | Number
of Shares | | | Fair
Value | |
Electrical Components & Equipment – 0.2% | |
ABB Ltd. | | | 49,775 | | | $ | 1,088,288 | |
Fuji Electric Company Ltd. | | | 14,000 | | | | 106,676 | |
Legrand S.A. | | | 7,477 | | | | 549,103 | |
Mabuchi Motor Company Ltd. | | | 1,800 | | | | 85,641 | |
Nidec Corp. | | | 5,854 | | | | 878,642 | |
nVent Electric PLC | | | 1,078 | | | | 27,058 | (a) |
OSRAM Licht AG | | | 2,597 | | | | 106,124 | |
Prysmian S.p.A. | | | 5,426 | | | | 135,128 | |
Schneider Electric SE | | | 14,101 | | | | 1,175,832 | |
Teco Electric and Machinery Company Ltd. | | | 64,000 | | | | 48,071 | |
Zhuzhou CRRC Times Electric Company Ltd., Class H | | | 17,000 | | | | 80,824 | |
| | | | 4,281,387 | |
Electronic Components – 0.2% | |
Alps Electric Company Ltd. | | | 5,800 | | | | 149,025 | |
AU Optronics Corp. | | | 177,000 | | | | 74,891 | |
Delta Electronics Inc. | | | 48,000 | | | | 172,393 | |
Hamamatsu Photonics KK | | | 3,700 | | | | 159,003 | |
Hirose Electric Company Ltd. | | | 840 | | | | 104,123 | |
Innolux Corp. | | | 289,212 | | | | 103,871 | |
Kingboard Chemical Holdings Ltd. | | | 22,500 | | | | 82,309 | |
Kyocera Corp. | | | 8,755 | | | | 493,770 | |
Largan Precision Company Ltd. | | | 3,000 | | | | 441,806 | |
LG Display Company Ltd. | | | 5,500 | | | | 90,310 | |
LG Innotek Company Ltd. | | | 512 | | | | 66,383 | |
Murata Manufacturing Company Ltd. | | | 4,903 | | | | 824,212 | |
Nippon Electric Glass Company Ltd. | | | 2,800 | | | | 77,858 | |
Omron Corp. | | | 5,300 | | | | 247,380 | |
Samsung Electro-Mechanics Company Ltd. | | | 1,559 | | | | 207,727 | |
Samsung SDI Company Ltd. | | | 1,484 | | | | 284,949 | |
Sunny Optical Technology Group Company Ltd. | | | 21,000 | | | | 390,800 | |
TDK Corp. | | | 3,300 | | | | 337,255 | |
Yageo Corp. | | | 5,000 | | | | 184,496 | (a) |
Yaskawa Electric Corp. | | | 6,600 | | | | 233,278 | |
Zhen Ding Technology Holding Ltd. | | | 7,350 | | | | 16,248 | |
| | | | 4,742,087 | |
Electronic Equipment & Instruments – 0.2% | |
Hexagon AB, Class B | | | 7,213 | | | | 402,738 | |
Hitachi High-Technologies Corp. | | | 2,400 | | | | 97,937 | |
Hitachi Ltd. | | | 127,000 | | | | 896,161 | |
Ingenico Group S.A. | | | 1,886 | | | | 169,554 | |
Keyence Corp. | | | 2,600 | | | | 1,468,478 | |
Shimadzu Corp. | | | 6,600 | | | | 199,612 | |
Yokogawa Electric Corp. | | | 6,400 | | | | 113,942 | |
| | | | 3,348,422 | |
Electronic Manufacturing Services – 0.1% | |
AAC Technologies Holdings Inc. | | | 20,500 | | | | 288,734 | |
Fabrinet | | | 597 | | | | 22,023 | (a) |
Foxconn Technology Company Ltd. | | | 32,561 | | | | 79,671 | |
Hon Hai Precision Industry Company Ltd. | | | 428,844 | | | | 1,170,272 | |
TE Connectivity Ltd. | | | 11,673 | | | | 1,051,270 | |
| | | | 2,611,970 | |
Environmental & Facilities Services – 0.0% * | |
China Everbright International Ltd. | | | 88,000 | | | | 113,737 | |
Park24 Company Ltd. | | | 3,100 | | | | 84,382 | |
| | | | 198,119 | |
Fertilizers & Agricultural Chemicals – 0.1% | |
Grupa Azoty S.A. | | | 816 | | | | 9,394 | |
Israel Chemicals Ltd. | | | 18,673 | | | | 85,189 | |
K+S AG | | | 4,788 | | | | 118,233 | |
Nutrien Ltd. | | | 17,522 | | | | 952,658 | |
UPL Ltd. | | | 8,010 | | | | 72,343 | |
Yara International ASA | | | 4,842 | | | | 200,799 | |
| | | | 1,438,616 | |
Financial Exchanges & Data – 0.2% | |
ASX Ltd. | | | 5,268 | | | | 250,623 | |
B3 S.A. - Brasil Bolsa Balcao | | | 57,820 | | | | 307,329 | |
Deutsche Boerse AG | | | 5,028 | | | | 670,111 | |
Hong Kong Exchanges & Clearing Ltd. | | | 31,481 | | | | 946,984 | |
Japan Exchange Group Inc. | | | 12,600 | | | | 234,220 | |
See Notes to Schedules of Investments and Notes to Financial Statements.
| | |
| State Street Total Return V.I.S. Fund | | |
Schedule of Investments | | June 30, 2018 (Unaudited) |
| | | | | | | | |
| | | Number
of Shares | | | Fair
Value | |
London Stock Exchange Group PLC | | | 8,489 | | | $ | 501,092 | |
Singapore Exchange Ltd. | | | 23,000 | | | | 120,946 | |
Thomson Reuters Corp. | | | 7,493 | | | | 302,181 | |
| | | | 3,333,486 | |
Food Distributors – 0.0% * | |
Bid Corporation Ltd. | | | 8,193 | | | | 164,569 | |
The SPAR Group Ltd. | | | 6,247 | | | | 84,510 | |
| | | | 249,079 | |
Food Retail – 0.3% | |
Alimentation Couche-Tard Inc., Class B | | | 11,352 | | | | 492,845 | |
BIM Birlesik Magazalar AS | | | 7,874 | | | | 115,415 | |
Casino Guichard Perrachon S.A. | | | 1,265 | | | | 49,109 | |
Colruyt S.A. | | | 1,444 | | | | 82,392 | |
CP ALL PCL NVDR | | | 136,400 | | | | 302,608 | |
Empire Company Ltd., Class A | | | 3,981 | | | | 79,865 | |
FamilyMart UNY Holdings Company Ltd. | | | 2,100 | | | | 221,063 | |
George Weston Ltd. | | | 1,278 | | | | 104,206 | |
ICA Gruppen AB | | | 2,095 | | | | 64,330 | |
J Sainsbury PLC | | | 48,231 | | | | 204,530 | |
Jeronimo Martins SGPS S.A. | | | 7,467 | | | | 107,843 | |
Koninklijke Ahold Delhaize N.V. | | | 32,221 | | | | 771,391 | |
Lawson Inc. | | | 1,200 | | | | 74,969 | |
Loblaw Companies Ltd. | | | 5,200 | | | | 267,224 | |
Magnit PJSC GDR | | | 9,333 | | | | 167,994 | |
Metro Inc. | | | 5,991 | | | | 203,533 | |
Pick n Pay Stores Ltd. | | | 9,438 | | | | 51,493 | |
President Chain Store Corp. | | | 15,000 | | | | 169,982 | |
Seven & I Holdings Company Ltd. | | | 20,200 | | | | 881,020 | |
Shoprite Holdings Ltd. | | | 11,567 | | | | 186,178 | |
Tesco PLC | | | 232,009 | | | | 786,298 | |
WM Morrison Supermarkets PLC | | | 66,803 | | | | 222,256 | |
Woolworths Group Ltd. | | | 33,655 | | | | 758,910 | |
| | | | 6,365,454 | |
Footwear – 0.0% * | |
ANTA Sports Products Ltd. | | | 34,000 | | | | 180,066 | |
Asics Corp. | | | 3,500 | | | | 59,184 | |
Feng TAY Enterprise Company Ltd. | | | 12,320 | | | | 61,825 | |
Pou Chen Corp. | | | 80,000 | | | | 92,888 | |
Puma SE | | | 170 | | | | 99,440 | |
Yue Yuen Industrial Holdings Ltd. | | | 17,500 | | | | 49,408 | |
| | | | 542,811 | |
Forest Products – 0.0% * | |
West Fraser Timber Company Ltd. | | | 1,858 | | | | 127,812 | |
Gas Utilities – 0.1% | |
APA Group | | | 29,541 | | | | 214,990 | |
Beijing Enterprises Holdings Ltd. | | | 19,500 | | | | 94,947 | |
China Gas Holdings Ltd. | | | 39,000 | | | | 156,836 | |
China Resources Gas Group Ltd. | | | 16,000 | | | | 69,339 | |
ENN Energy Holdings Ltd. | | | 22,000 | | | | 216,342 | |
GAIL India Ltd. | | | 24,997 | | | | 124,137 | |
Gas Natural SDG S.A. | | | 9,482 | | | | 251,084 | |
Hong Kong & China Gas Company Ltd. | | | 259,441 | | | | 496,696 | |
Korea Gas Corp. | | | 1,143 | | | | 65,842 | (a) |
Osaka Gas Company Ltd. | | | 9,200 | | | | 190,412 | |
Perusahaan Gas Negara Persero Tbk | | | 118,500 | | | | 16,497 | |
Petronas Gas Bhd | | | 24,000 | | | | 102,785 | |
Toho Gas Company Ltd. | | | 1,400 | | | | 48,472 | |
Tokyo Gas Company Ltd. | | | 9,700 | | | | 257,508 | |
| | | | 2,305,887 | |
General Merchandise Stores – 0.1% | |
Canadian Tire Corporation Ltd., Class A | | | 1,522 | | | | 198,544 | |
Dollarama Inc. | | | 9,093 | | | | 352,259 | |
Don Quijote Holdings Company Ltd. | | | 3,100 | | | | 148,892 | |
Harvey Norman Holdings Ltd. | | | 20,526 | | | | 50,350 | |
Ryohin Keikaku Company Ltd. | | | 700 | | | | 246,468 | |
| | | | 996,513 | |
Gold – 0.1% | |
Agnico Eagle Mines Ltd. | | | 5,834 | | | | 267,297 | |
AngloGold Ashanti Ltd. | | | 14,863 | | | | 121,582 | |
Barrick Gold Corp. | | | 30,839 | | | | 404,872 | |
Cia de Minas Buenaventura S.A. ADR | | | 4,389 | | | | 59,822 | |
Franco-Nevada Corp. | | | 5,022 | | | | 366,309 | |
Gold Fields Ltd. | | | 31,089 | | | | 111,597 | |
Goldcorp Inc. | | | 23,809 | | | | 326,696 | |
| | | | | | | | |
| | | Number
of Shares | | | Fair
Value | |
Kinross Gold Corp. | | | 26,336 | | | $ | 99,102 | (a) |
Klondex Mines Ltd. | | | 1,624 | | | | 3,751 | (a) |
Newcrest Mining Ltd. | | | 20,430 | | | | 329,065 | |
Randgold Resources Ltd. | | | 2,580 | | | | 198,244 | |
Zijin Mining Group Company Ltd., Class H | | | 230,000 | | | | 87,949 | |
| | | | 2,376,286 | |
Healthcare Distributors – 0.0% * | |
Alfresa Holdings Corp. | | | 5,464 | | | | 128,504 | |
Medipal Holdings Corp. | | | 5,400 | | | | 108,619 | |
Shanghai Pharmaceuticals Holding Company Ltd., Class H | | | 22,700 | | | | 62,642 | |
Sinopharm Group Company Ltd., Class H | | | 25,200 | | | | 101,340 | |
Suzuken Company Ltd. | | | 1,700 | | | | 71,981 | |
| | | | 473,086 | |
Healthcare Equipment – 0.4% | |
Cochlear Ltd. | | | 1,449 | | | | 214,301 | |
CYBERDYNE Inc. | | | 2,700 | | | | 31,640 | (a) |
Fisher & Paykel Healthcare Corporation Ltd. | | | 14,354 | | | | 144,706 | |
Koninklijke Philips N.V. | | | 24,427 | | | | 1,038,832 | |
LivaNova PLC | | | 1,190 | | | | 118,786 | (a) |
Medtronic PLC | | | 45,163 | | | | 3,866,404 | |
Novocure Ltd. | | | 1,339 | | | | 41,911 | (a) |
Olympus Corp. | | | 7,300 | | | | 273,507 | |
Oxford Immunotec Global PLC | | | 448 | | | | 5,775 | (a) |
Siemens Healthineers AG | | | 3,548 | | | | 146,457 | (a,d) |
Smith & Nephew PLC | | | 24,417 | | | | 450,667 | |
Sonova Holding AG | | | 1,436 | | | | 257,206 | |
STERIS PLC | | | 565 | | | | 59,331 | |
Straumann Holding AG | | | 307 | | | | 233,431 | |
Sysmex Corp. | | | 4,300 | | | | 401,408 | |
Terumo Corp. | | | 8,458 | | | | 484,885 | |
William Demant Holding A/S | | | 2,839 | | | | 114,245 | (a) |
Wright Medical Group N.V. | | | 1,971 | | | | 51,167 | (a) |
| | | | 7,934,659 | |
Healthcare Facilities – 0.0% * | |
Bangkok Dusit Medical Services PCL NVDR | | | 109,000 | | | | 82,252 | |
Bumrungrad Hospital PCL NVDR | | | 13,000 | | | | 65,333 | |
Healthscope Ltd. | | | 37,679 | | | | 61,524 | |
IHH Healthcare Bhd | | | 53,000 | | | | 80,035 | |
Life Healthcare Group Holdings Ltd. | | | 54,534 | | | | 98,992 | |
Mediclinic International PLC | | | 10,371 | | | | 72,104 | |
Netcare Ltd. | | | 33,031 | | | | 66,562 | |
NMC Health PLC | | | 2,422 | | | | 114,540 | |
Ramsay Health Care Ltd. | | | 3,819 | | | | 152,314 | |
Ryman Healthcare Ltd. | | | 15,299 | | | | 123,987 | |
| | | | 917,643 | |
Healthcare Services – 0.1% | |
Fresenius Medical Care AG & Company KGaA | | | 6,060 | | | | 611,169 | |
Fresenius SE & Company KGaA | | | 10,909 | | | | 876,293 | |
Sonic Healthcare Ltd. | | | 10,002 | | | | 181,276 | |
| | | | 1,668,738 | |
Healthcare Supplies – 0.1% | |
Coloplast A/S, Class B | | | 3,054 | | | | 305,232 | |
ConvaTec Group PLC | | | 38,285 | | | | 107,359 | (d) |
Essilor International Cie Generale d’Optique S.A. | | | 5,373 | | | | 758,436 | |
Hoya Corp. | | | 9,900 | | | | 562,995 | |
Shandong Weigao Group Medical Polymer Company Ltd., Class H | | | 60,000 | | | | 42,445 | |
| | | | 1,776,467 | |
Healthcare Technology – 0.0% * | |
Alibaba Health Information Technology Ltd. | | | 44,000 | | | | 42,455 | (a) |
M3 Inc. | | | 5,100 | | | | 203,282 | |
| | | | 245,737 | |
Heavy Electrical Equipment – 0.1% | |
Bharat Heavy Electricals Ltd. | | | 33,360 | | | | 34,935 | |
Doosan Heavy Industries & Construction Company Ltd. | | | 2,060 | | | | 28,927 | (a) |
Melrose Industries PLC | | | 123,607 | | | | 347,110 | |
See Notes to Schedules of Investments and Notes to Financial Statements.
| | |
| State Street Total Return V.I.S. Fund | | |
Schedule of Investments | | June 30, 2018 (Unaudited) |
| | | | | | | | |
| | | Number
of Shares | | | Fair
Value | |
Mitsubishi Electric Corp. | | | 49,627 | | | $ | 660,633 | |
Shanghai Electric Group Company Ltd., Class H | | | 108,000 | | | | 36,342 | (a) |
Siemens Gamesa Renewable Energy S.A. | | | 7,678 | | | | 103,136 | |
Vestas Wind Systems A/S | | | 5,674 | | | | 351,207 | |
| | | | 1,562,290 | |
Highways & Railtracks – 0.1% | |
Atlantia S.p.A. | | | 11,936 | | | | 352,857 | |
CCR S.A. | | | 36,100 | | | | 94,956 | |
Getlink | | | 12,314 | | | | 168,860 | |
Jasa Marga Persero Tbk PT | | | 86,987 | | | | 25,374 | |
Jiangsu Expressway Company Ltd., Class H | | | 44,000 | | | | 52,438 | |
Promotora y Operadora de Infraestructura SAB de C.V. | | | 4,540 | | | | 40,984 | |
Transurban Group | | | 57,663 | | | | 509,973 | |
Zhejiang Expressway Company Ltd., Class H | | | 52,000 | | | | 46,396 | |
| | | | 1,291,838 | |
Home Building – 0.1% | |
Barratt Developments PLC | | | 24,654 | | | | 167,760 | |
Berkeley Group Holdings PLC | | | 3,513 | | | | 175,550 | |
Iida Group Holdings Company Ltd. | | | 5,300 | | | | 102,253 | |
Persimmon PLC | | | 8,073 | | | | 269,977 | |
Sekisui Chemical Company Ltd. | | | 10,823 | | | | 184,479 | |
Sekisui House Ltd. | | | 17,500 | | | | 309,665 | |
Taylor Wimpey PLC | | | 88,609 | | | | 209,288 | |
| | | | 1,418,972 | |
Home Entertainment Software – 0.1% | |
Konami Holdings Corp. | | | 2,600 | | | | 132,388 | |
NCSoft Corp. | | | 441 | | | | 146,802 | |
Nexon Company Ltd. | | | 10,000 | | | | 145,263 | (a) |
Nintendo Company Ltd. | | | 3,000 | | | | 980,454 | |
UbiSoft Entertainment S.A. | | | 1,569 | | | | 172,161 | (a) |
| | | | 1,577,068 | |
Home Furnishing Retail – 0.0% * | |
Nitori Holdings Company Ltd. | | | 2,200 | | | | 343,213 | |
Home Furnishings – 0.0% * | |
Hanssem Company Ltd. | | | 113 | | | | 10,646 | |
Home Improvement Retail – 0.0% * | |
Home Product Center PCL NVDR | | | 107,359 | | | | 43,423 | |
Kingfisher PLC | | | 60,579 | | | | 237,539 | |
| | | | 280,962 | |
Hotels, Resorts & Cruise Lines – 0.1% | |
Accor S.A. | | | 5,072 | | | | 248,835 | |
Belmond Ltd., Class A | | | 1,687 | | | | 18,810 | (a) |
Carnival PLC | | | 5,217 | | | | 299,410 | |
Flight Centre Travel Group Ltd. | | | 1,226 | | | | 57,656 | |
Huazhu Group Ltd. ADR ADR | | | 800 | | | | 33,592 | |
InterContinental Hotels Group PLC | | | 4,966 | | | | 309,461 | |
Minor International PCL NVDR | | | 48,840 | | | | 47,911 | |
Shangri-La Asia Ltd. | | | 34,000 | | | | 63,966 | |
TUI AG | | | 11,841 | | | | 259,900 | |
| | | | 1,339,541 | |
Household Appliances – 0.0% * | |
Arcelik AS | | | 8,562 | | | | 28,502 | |
Coway Company Ltd. | | | 1,103 | | | | 85,707 | |
Electrolux AB, Class B | | | 6,513 | | | | 148,519 | |
Haier Electronics Group Company Ltd. | | | 31,000 | | | | 106,093 | |
Husqvarna AB, Class B | | | 9,558 | | | | 90,836 | |
Rinnai Corp. | | | 700 | | | | 61,743 | |
SEB S.A. | | | 577 | | | | 100,782 | |
Techtronic Industries Company Ltd. | | | 36,000 | | | | 200,753 | |
| | | | 822,935 | |
Household Products – 0.2% | |
Essity AB, Class B | | | 17,078 | | | | 422,273 | |
Henkel AG & Company KGaA | | | 2,899 | | | | 322,395 | |
Hindustan Unilever Ltd. | | | 19,404 | | | | 464,787 | |
Kimberly-Clark de Mexico SAB de C.V., Class A | | | 32,800 | | | | 55,986 | (a) |
Lion Corp. | | | 7,000 | | | | 128,289 | |
Reckitt Benckiser Group PLC | | | 18,132 | | | | 1,493,541 | |
| | | | | | | | |
| | | Number
of Shares | | | Fair
Value | |
Unicharm Corp. | | | 10,200 | | | $ | 306,925 | |
Unilever Indonesia Tbk PT | | | 40,100 | | | | 129,003 | |
| | | | 3,323,199 | |
Human Resource & Employment Services – 0.1% | |
51job Inc. ADR | | | 800 | | | | 78,112 | (a) |
Adecco Group AG | | | 4,533 | | | | 268,250 | |
Persol Holdings Company Ltd. | | | 5,100 | | | | 113,773 | |
Randstad N.V. | | | 3,215 | | | | 189,260 | |
Recruit Holdings Company Ltd. | | | 28,600 | | | | 791,655 | |
Seek Ltd. | | | 8,596 | | | | 138,519 | |
| | | | 1,579,569 | |
Hypermarkets & Super Centers – 0.1% | |
Aeon Company Ltd. | | | 15,500 | | | | 331,648 | |
Carrefour S.A. | | | 15,763 | | | | 255,265 | |
Cencosud S.A. | | | 43,221 | | | | 106,897 | |
E-MART Inc. | | | 682 | | | | 155,737 | |
METRO AG | | | 5,289 | | | | 65,364 | |
Sun Art Retail Group Ltd. | | | 41,500 | | | | 54,272 | |
Wal-Mart de Mexico SAB de C.V. | | | 139,124 | | | | 370,606 | |
Wesfarmers Ltd. | | | 29,704 | | | | 1,083,294 | |
| | | | 2,423,083 | |
Independent Power Producers & Energy Traders – 0.0% * | |
Aboitiz Power Corp. | | | 66,300 | | | | 43,171 | |
CGN Power Company Ltd.,
Class H | | | 184,000 | | | | 47,610 | (d) |
China Resources Power Holdings Company Ltd. | | | 50,000 | | | | 88,077 | |
Colbun S.A. | | | 260,471 | | | | 54,007 | |
Electric Power Development Company Ltd. | | | 4,300 | | | | 111,028 | |
Glow Energy PCL NVDR | | | 17,700 | | | | 50,621 | |
Huaneng Power International Inc.,
Class H | | | 126,000 | | | | 83,513 | |
NTPC Ltd. | | | 44,321 | | | | 103,274 | |
Uniper SE | | | 5,110 | | | | 152,376 | |
| | | | 733,677 | |
Industrial Conglomerates – 0.4% | |
Aboitiz Equity Ventures Inc. | | | 66,580 | | | | 67,993 | |
Alfa SAB de C.V., Class A | | | 80,824 | | | | 94,987 | |
Alliance Global Group Inc. | | | 117,400 | | | | 25,562 | (a) |
CITIC Ltd. | | | 167,000 | | | | 235,426 | |
CJ Corp. | | | 242 | | | | 30,834 | |
CK Hutchison Holdings Ltd. | | | 75,064 | | | | 796,044 | |
DCC PLC | | | 2,414 | | | | 219,750 | |
DMCI Holdings Inc. | | | 140,000 | | | | 27,545 | |
Far Eastern New Century Corp. | | | 69,916 | | | | 66,273 | |
Fosun International Ltd. | | | 84,500 | | | | 158,974 | |
Grupo Carso SAB de C.V. | | | 7,800 | | | | 26,608 | |
Hanwha Corp. | | | 2,100 | | | | 59,448 | |
Industries Qatar QSC | | | 5,401 | | | | 158,722 | |
Jardine Matheson Holdings Ltd. | | | 5,900 | | | | 372,290 | |
Jardine Strategic Holdings Ltd. | | | 6,200 | | | | 226,176 | |
JG Summit Holdings Inc. | | | 62,960 | | | | 58,987 | |
Keihan Holdings Company Ltd. | | | 2,400 | | | | 86,128 | |
Keppel Corporation Ltd. | | | 34,300 | | | | 179,864 | |
KOC Holding AS | | | 23,474 | | | | 72,863 | |
LG Corp. | | | 2,760 | | | | 178,552 | |
Lotte Corp. | | | 1,125 | | | | 57,840 | (a) |
NWS Holdings Ltd. | | | 37,653 | | | | 65,175 | |
Samsung C&T Corp. | | | 2,265 | | | | 236,763 | |
Seibu Holdings Inc. | | | 5,300 | | | | 89,382 | |
Sembcorp Industries Ltd. | | | 25,600 | | | | 51,632 | |
Shanghai Industrial Holdings Ltd. | | | 20,000 | | | | 46,600 | |
Siemens AG | | | 20,535 | | | | 2,714,523 | |
Siemens Ltd. | | | 2,575 | | | | 36,845 | |
Sime Darby Bhd | | | 71,462 | | | | 43,342 | |
SK Holdings Company Ltd. | | | 875 | | | | 203,342 | (a) |
SM Investments Corp. | | | 6,891 | | | | 112,983 | |
Smiths Group PLC | | | 10,758 | �� | | | 241,171 | |
The Bidvest Group Ltd. | | | 11,502 | | | | 165,327 | |
Toshiba Corp. | | | 179,000 | | | | 538,139 | (a) |
Turkiye Sise ve Cam Fabrikalari A/S | | | 25,511 | | | | 23,555 | |
| | | | 7,769,645 | |
Industrial Gases – 0.1% | |
Air Liquide S.A. | | | 11,258 | | | | 1,415,639 | |
Air Water Inc. | | | 2,800 | | | | 51,417 | |
See Notes to Schedules of Investments and Notes to Financial Statements.
| | |
| State Street Total Return V.I.S. Fund | | |
Schedule of Investments | | June 30, 2018 (Unaudited) |
| | | | | | | | |
| | | Number
of Shares | | | Fair
Value | |
Linde AG | | | 5,077 | | | $ | 1,211,613 | |
Taiyo Nippon Sanso Corp. | | | 2,400 | | | | 34,408 | |
| | | | 2,713,077 | |
Industrial Machinery – 0.4% | |
Alfa Laval AB | | | 7,568 | | | | 179,852 | |
Amada Holdings Company Ltd. | | | 8,600 | | | | 82,689 | |
ANDRITZ AG | | | 2,708 | | | | 143,732 | |
Atlas Copco AB A Shares | | | 17,986 | | | | 524,340 | |
Atlas Copco AB B Shares | | | 10,231 | | | | 268,355 | |
China Conch Venture Holdings Ltd. | | | 53,500 | | | | 195,712 | |
Daifuku Company Ltd. | | | 2,500 | | | | 109,579 | |
FANUC Corp. | | | 5,100 | | | | 1,013,186 | |
GEA Group AG | | | 4,809 | | | | 162,210 | |
Hiwin Technologies Corp. | | | 2,956 | | | | 34,904 | |
Hoshizaki Corp. | | | 1,500 | | | | 151,808 | |
Hyundai Heavy Industries Holdings Company Ltd. | | | 245 | | | | 77,710 | (a) |
IHI Corp. | | | 3,900 | | | | 135,909 | |
JTEKT Corp. | | | 5,600 | | | | 76,241 | |
Kawasaki Heavy Industries Ltd. | | | 4,100 | | | | 120,855 | |
Kone Oyj, Class B | | | 8,624 | | | | 439,611 | |
Kurita Water Industries Ltd. | | | 2,800 | | | | 79,881 | |
Makita Corp. | | | 5,700 | | | | 255,500 | |
Metso Oyj | | | 3,262 | | | | 109,305 | |
MINEBEA MITSUMI Inc. | | | 10,300 | | | | 174,263 | |
MISUMI Group Inc. | | | 8,200 | | | | 239,119 | |
Mitsubishi Heavy Industries Ltd. | | | 7,700 | | | | 280,221 | |
Nabtesco Corp. | | | 3,100 | | | | 95,436 | |
NGK Insulators Ltd. | | | 7,700 | | | | 137,156 | |
NSK Ltd. | | | 9,900 | | | | 102,160 | |
Pentair PLC | | | 5,632 | | | | 236,995 | |
Sandvik AB | | | 30,000 | | | | 533,199 | |
Schindler Holding AG | | | 1,116 | | | | 240,070 | |
Schindler Holding AG | | | 511 | | | | 107,454 | |
SKF AB, Class B | | | 11,126 | | | | 207,322 | |
SMC Corp. | | | 1,500 | | | | 550,219 | |
Sumitomo Heavy Industries Ltd. | | | 3,000 | | | | 101,296 | |
The Weir Group PLC | | | 6,522 | | | | 172,213 | |
THK Company Ltd. | | | 3,300 | | | | 94,592 | |
Wartsila Oyj Abp | | | 10,966 | | | | 215,480 | |
WEG S.A. | | | 17,082 | | | | 72,148 | |
| | | | 7,720,722 | |
Industrial REITs – 0.0% * | |
Ascendas Real Estate Investment Trust | | | 68,150 | | | | 131,952 | |
Goodman Group | | | 41,378 | | | | 294,104 | |
Nippon Prologis REIT Inc. | | | 59 | | | | 122,405 | |
Segro PLC | | | 27,154 | | | | 239,980 | |
| | | | 788,441 | |
Insurance Brokers – 0.1% | |
Aon PLC | | | 8,106 | | | | 1,111,900 | |
Willis Towers Watson PLC | | | 4,363 | | | | 661,431 | |
| | | | 1,773,331 | |
Integrated Oil & Gas – 1.2% | |
BP PLC | | | 526,140 | | | | 4,017,084 | |
Cenovus Energy Inc. | | | 26,809 | | | | 278,188 | |
China Petroleum & Chemical Corp., Class H | | | 721,400 | | | | 644,579 | |
Ecopetrol S.A. | | | 115,657 | | | | 119,123 | |
Eni S.p.A. | | | 68,934 | | | | 1,280,177 | |
Equinor ASA | | | 33,029 | | | | 876,948 | |
Galp Energia SGPS S.A. | | | 13,729 | | | | 261,839 | |
Gazprom PJSC ADR | | | 148,753 | | | | 654,662 | |
Husky Energy Inc. | | | 9,854 | | | | 153,490 | |
Imperial Oil Ltd. | | | 8,144 | | | | 270,548 | |
LUKOIL PJSC ADR | | | 11,883 | | | | 819,095 | |
MOL Hungarian Oil & Gas PLC | | | 12,112 | | | | 116,955 | |
OMV AG | | | 4,339 | | | | 246,056 | |
Origin Energy Ltd. | | | 46,625 | | | | 345,522 | (a) |
PetroChina Company Ltd.,
Class H | | | 530,000 | | | | 403,304 | |
Petroleo Brasileiro S.A. | | | 84,800 | | | | 428,033 | |
Polskie Gornictwo Naftowe i Gazownictwo S.A. | | | 63,407 | | | | 96,704 | |
PTT PCL NVDR | | | 295,000 | | | | 427,407 | |
Repsol S.A. | | | 32,228 | | | | 630,830 | |
| | | | | | | | |
| | | Number
of Shares | | | Fair
Value | |
Rosneft Oil Company PJSC GDR | | | 33,380 | | | $ | 207,624 | |
Royal Dutch Shell PLC, Class A | | | 122,523 | | | | 4,252,698 | |
Royal Dutch Shell PLC, Class B | | | 98,895 | | | | 3,542,913 | |
Suncor Energy Inc. | | | 44,147 | | | | 1,795,480 | |
Surgutneftegas OJSC ADR | | | 3,950 | | | | 19,474 | |
Surgutneftegas OJSC ADR | | | 17,768 | | | | 79,423 | |
Total S.A. | | | 64,877 | | | | 3,954,760 | |
| | | | 25,922,916 | |
Integrated Telecommunication Services – 0.5% | |
BCE Inc. | | | 4,587 | | | | 185,649 | |
Bezeq The Israeli Telecommunication Corporation Ltd. | | | 71,154 | | | | 80,007 | |
Bharti Infratel Ltd. | | | 20,103 | | | | 88,184 | |
BT Group PLC | | | 218,321 | | | | 627,783 | |
China Communications Services Corporation Ltd., Class H | | | 84,000 | | | | 53,213 | |
China Telecom Corporation Ltd.,
Class H | | | 324,000 | | | | 151,563 | |
China Unicom Hong Kong Ltd. | | | 164,000 | | | | 204,858 | |
Chunghwa Telecom Company Ltd. | | | 106,000 | | | | 382,439 | |
Deutsche Telekom AG | | | 88,762 | | | | 1,375,225 | (a) |
Elisa Oyj | | | 3,759 | | | | 174,105 | |
Emirates Telecommunications Group Co. PJSC | | | 34,000 | | | | 149,490 | |
Hellenic Telecommunications Organization S.A. | | | 5,504 | | | | 68,118 | |
HKT Trust & HKT Ltd. | | | 93,280 | | | | 119,610 | |
Koninklijke KPN N.V. | | | 83,487 | | | | 227,117 | |
KT Corp. | | | 1,110 | | | | 27,289 | |
Nippon Telegraph & Telephone Corp. | | | 18,400 | | | | 836,567 | |
Ooredoo QPSC | | | 3,023 | | | | 60,369 | |
Orange Polska S.A. | | | 28,318 | | | | 35,095 | (a) |
Orange S.A. | | | 53,791 | | | | 900,919 | |
PCCW Ltd. | | | 89,000 | | | | 50,141 | |
Proximus SADP | | | 3,944 | | | | 88,919 | |
Singapore Telecommunications Ltd. | | | 208,500 | | | | 470,979 | |
Spark New Zealand Ltd. | | | 39,855 | | | | 100,650 | |
Swisscom AG | | | 672 | | | | 299,945 | |
Telecom Italia S.p.A. | | | 296,323 | | | | 220,523 | (a) |
Telecom Italia S.p.A. | | | 190,334 | | | | 124,357 | |
Telefonica Deutschland Holding AG | | | 18,390 | | | | 72,487 | |
Telefonica S.A. | | | 122,805 | | | | 1,043,671 | |
Telekom Malaysia Bhd | | | 42,600 | | | | 32,798 | |
Telekomunikasi Indonesia Persero Tbk PT | | | 1,277,700 | | | | 334,360 | |
Telenor ASA | | | 19,438 | | | | 398,638 | |
Telia Company AB | | | 69,057 | | | | 316,183 | |
Telstra Corporation Ltd. | | | 115,589 | | | | 223,756 | |
TELUS Corp. | | | 5,760 | | | | 204,487 | |
TPG Telecom Ltd. | | | 9,892 | | | | 37,786 | |
True Corporation PCL NVDR | | | 237,369 | | | | 37,973 | |
| | | | 9,805,253 | |
Internet & Direct Marketing Retail – 0.1% | |
Ctrip.com International Ltd. ADR | | | 11,426 | | | | 544,220 | (a) |
JD.com Inc. ADR | | | 19,658 | | | | 765,679 | (a) |
Rakuten Inc. | | | 25,700 | | | | 173,878 | |
Start Today Company Ltd. | | | 4,400 | | | | 159,491 | |
Vipshop Holdings Ltd. ADR | | | 7,000 | | | | 75,950 | (a) |
Zalando SE | | | 3,266 | | | | 182,539 | (a,d) |
| | | | 1,901,757 | |
Internet Software & Services – 0.9% | |
58.com Inc. ADR | | | 2,400 | | | | 166,416 | (a) |
Alibaba Group Holding Ltd. ADR | | | 31,013 | | | | 5,753,842 | (a) |
Auto Trader Group PLC | | | 22,838 | | | | 128,417 | (d) |
Autohome Inc. ADR | | | 1,100 | | | | 111,100 | |
Baidu Inc. ADR | | | 7,452 | | | | 1,810,836 | (a) |
DeNA Company Ltd. | | | 2,000 | | | | 37,503 | |
Kakaku.com Inc. | | | 3,100 | | | | 70,024 | |
Kakao Corp. | | | 954 | | | | 98,011 | |
Momo Inc. ADR | | | 3,500 | | | | 152,250 | (a) |
NAVER Corp. | | | 780 | | | | 533,997 | |
NetEase Inc. ADR | | | 2,271 | | | | 573,814 | |
REA Group Ltd. | | | 1,262 | | | | 84,730 | |
Shopify Inc., Class A | | | 2,200 | | | | 320,622 | (a) |
SINA Corp. | | | 1,700 | | | | 143,973 | (a) |
Tencent Holdings Ltd. | | | 153,300 | | | | 7,694,847 | |
See Notes to Schedules of Investments and Notes to Financial Statements.
| | |
| State Street Total Return V.I.S. Fund | | |
| Schedule of Investments | | June 30, 2018 (Unaudited) |
|
| | | | | | | | |
| | | Number
of Shares | | | Fair
Value | |
Tucows Inc., Class A | | | 170 | | | $ | 10,310 | (a) |
United Internet AG | | | 3,650 | | | | 209,072 | |
Weibo Corp. ADR | | | 1,170 | | | | 103,849 | (a) |
Yahoo Japan Corp. | | | 38,200 | | | | 126,914 | |
YY Inc. ADR | | | 1,100 | | | | 110,517 | (a) |
| | | | 18,241,044 | |
Investment Banking & Brokerage – 0.1% | |
China Galaxy Securities Company Ltd., Class H | | | 108,000 | | | | 55,477 | |
CITIC Securities Company Ltd., Class H | | | 49,500 | | | | 98,931 | |
Daiwa Securities Group Inc. | | | 40,000 | | | | 232,312 | |
GF Securities Company Ltd. H Shares | | | 48,600 | | | | 70,867 | |
Haitong Securities Company Ltd., Class H | | | 98,000 | | | | 99,056 | |
Huatai Securities Company Ltd. H Shares | | | 52,400 | | | | 83,354 | (d) |
Korea Investment Holdings Company Ltd. | | | 626 | | | | 47,238 | |
Mediobanca Banca di Credito Finanziario S.p.A. | | | 15,176 | | | | 141,077 | |
NH Investment & Securities Company Ltd. | | | 2,669 | | | | 35,802 | |
Nomura Holdings Inc. | | | 96,545 | | | | 469,106 | |
Samsung Securities Company Ltd. | | | 1,372 | | | | 42,779 | |
Yuanta Financial Holding Company Ltd. | | | 219,211 | | | | 99,940 | |
| | | | 1,475,939 | |
IT Consulting & Other Services – 0.4% | |
Accenture PLC, Class A | | | 21,567 | | | | 3,528,146 | (b) |
Atos SE | | | 2,475 | | | | 337,949 | |
Capgemini SE | | | 4,515 | | | | 607,276 | |
CGI Group Inc., Class A | | | 6,285 | | | | 398,041 | (a) |
Fujitsu Ltd. | | | 55,000 | | | | 333,580 | |
HCL Technologies Ltd. | | | 17,282 | | | | 233,634 | |
Infosys Ltd. | | | 47,028 | | | | 897,249 | |
Nomura Research Institute Ltd. | | | 3,110 | | | | 150,776 | |
NTT Data Corp. | | | 15,500 | | | | 178,558 | |
Obic Company Ltd. | | | 1,800 | | | | 149,018 | |
Otsuka Corp. | | | 2,600 | | | | 101,991 | |
Samsung SDS Company Ltd. | | | 841 | | | | 151,297 | |
Tata Consultancy Services Ltd. | | | 25,966 | | | | 700,265 | |
Tech Mahindra Ltd. | | | 9,252 | | | | 88,509 | |
Wipro Ltd. | | | 26,911 | | | | 102,711 | |
| | | | 7,959,000 | |
Leisure Facilities – 0.0% * | |
Merlin Entertainments PLC | | | 22,365 | | | | 114,182 | (d) |
Oriental Land Company Ltd. | | | 5,106 | | | | 535,885 | |
| | | | 650,067 | |
Leisure Products – 0.0% * | |
Bandai Namco Holdings Inc. | | | 5,200 | | | | 214,544 | |
Giant Manufacturing Company Ltd. | | | 10,000 | | | | 42,311 | |
Sankyo Company Ltd. | | | 800 | | | | 31,310 | |
Sega Sammy Holdings Inc. | | | 3,600 | | | | 61,687 | |
Shimano Inc. | | | 2,000 | | | | 293,595 | |
Yamaha Corp. | | | 4,160 | | | | 216,328 | |
| | | | 859,775 | |
Life & Health Insurance – 0.6% | |
Aegon N.V. | | | 45,888 | | | | 275,169 | |
AIA Group Ltd. | | | 324,400 | | | | 2,836,528 | |
Cathay Financial Holding Company Ltd. | | | 205,417 | | | | 362,479 | |
China Life Insurance Company Ltd. | | | 85,666 | | | | 90,194 | |
China Life Insurance Company Ltd., Class H | | | 212,000 | | | | 547,196 | |
China Taiping Insurance Holdings Company Ltd. | | | 40,488 | | | | 126,695 | |
CNP Assurances | | | 5,764 | | | | 131,163 | |
Dai-ichi Life Holdings Inc. | | | 29,400 | | | | 524,483 | |
Discovery Ltd. | | | 11,285 | | | | 121,444 | |
Great-West Lifeco Inc. | | | 8,127 | | | | 199,677 | |
Hanwha Life Insurance Company Ltd. | | | 8,480 | | | | 40,327 | |
Industrial Alliance Insurance & Financial Services Inc. | | | 2,375 | | | | 91,627 | |
Japan Post Holdings Company Ltd. | | | 40,300 | | | | 441,330 | |
Legal & General Group PLC | | | 167,728 | | | | 589,038 | |
Liberty Holdings Ltd. | | | 4,059 | | | | 34,447 | |
| | | | | | | | |
| | | Number
of Shares | | | Fair
Value | |
Manulife Financial Corp. | | | 54,093 | | | $ | 971,285 | |
Medibank Private Ltd. | | | 73,749 | | | | 159,109 | |
MMI Holdings Ltd. | | | 36,164 | | | | 46,622 | |
New China Life Insurance Company Ltd., Class H | | | 23,300 | | | | 96,967 | |
NN Group N.V. | | | 8,548 | | | | 347,711 | |
Old Mutual Ltd. | | | 137,462 | | | | 272,952 | (a) |
Ping An Insurance Group Company of China Ltd., Class H | | | 141,500 | | | | 1,302,194 | |
Poste Italiane S.p.A. | | | 12,446 | | | | 104,190 | (d) |
Power Corporation of Canada | | | 9,624 | | | | 215,387 | |
Power Financial Corp. | | | 7,564 | | | | 176,816 | |
Prudential PLC | | | 69,057 | | | | 1,581,388 | |
Rand Merchant Investment Holdings Ltd. | | | 22,756 | | | | 62,177 | |
Samsung Life Insurance Company Ltd. | | | 2,185 | | | | 192,915 | |
Sanlam Ltd. | | | 42,288 | | | | 216,188 | |
Shin Kong Financial Holding Company Ltd. | | | 265,751 | | | | 102,418 | |
Sony Financial Holdings Inc. | | | 3,800 | | | | 72,593 | |
Sun Life Financial Inc. | | | 16,723 | | | | 671,615 | |
Swiss Life Holding AG | | | 902 | | | | 313,400 | (a) |
T&D Holdings Inc. | | | 13,800 | | | | 207,377 | |
| | | | 13,525,101 | |
Life Sciences Tools & Services – 0.1% | |
Eurofins Scientific SE | | | 326 | | | | 181,328 | |
Genscript Biotech Corp. | | | 26,000 | | | | 71,914 | |
Lonza Group AG | | | 1,995 | | | | 529,415 | (a) |
QIAGEN N.V. | | | 5,790 | | | | 210,916 | (a) |
Samsung Biologics Company Ltd. | | | 423 | | | | 158,269 | (a,d) |
Wuxi Biologics Cayman Inc. | | | 11,500 | | | | 128,039 | (a,d) |
| | | | 1,279,881 | |
Managed Healthcare – 0.0% * | |
Odontoprev S.A. | | | 10,100 | | | | 34,311 | |
Triple-S Management Corp., Class B | | | 349 | | | | 13,632 | (a) |
| | | | 47,943 | |
Marine – 0.0% * | |
AP Moller - Maersk A/S, Class A | | | 91 | | | | 108,019 | |
AP Moller - Maersk A/S, Class B | | | 168 | | | | 209,240 | |
Costamare Inc. | | | 633 | | | | 5,051 | |
Evergreen Marine Corporation Taiwan Ltd. | | | 72,001 | | | | 30,701 | (a) |
Kuehne + Nagel International AG | | | 1,482 | | | | 222,684 | |
MISC Bhd | | | 11,500 | | | | 16,854 | |
Mitsui OSK Lines Ltd. | | | 2,800 | | | | 67,444 | |
Nippon Yusen KK | | | 4,500 | | | | 89,338 | |
Safe Bulkers Inc. | | | 336 | | | | 1,142 | (a) |
| | | | 750,473 | |
Marine Ports & Services – 0.0% * | |
Adani Ports & Special Economic Zone Ltd. | | | 26,135 | | | | 142,338 | |
China Merchants Port Holdings Company Ltd. | | | 47,398 | | | | 96,301 | |
COSCO SHIPPING Ports Ltd. | | | 63,292 | | | | 52,761 | |
DP World Ltd. | | | 6,267 | | | | 144,141 | |
International Container Terminal Services Inc. | | | 26,800 | | | | 38,818 | |
Kamigumi Company Ltd. | | | 4,000 | | | | 83,167 | |
| | | | 557,526 | |
Metal & Glass Containers – 0.0% * | |
CCL Industries Inc., Class B | | | 3,800 | | | | 186,180 | |
Toyo Seikan Group Holdings Ltd. | | | 3,200 | | | | 56,220 | |
| | | | 242,400 | |
Motorcycle Manufacturers – 0.0% * | |
Bajaj Auto Ltd. | | | 3,146 | | | | 129,040 | |
Hero MotoCorp Ltd. | | | 1,341 | | | | 67,985 | |
Yamaha Motor Company Ltd. | | | 6,900 | | | | 173,551 | |
| | | | 370,576 | |
Movies & Entertainment – 0.0% * | |
Alibaba Pictures Group Ltd. | | | 360,000 | | | | 39,462 | (a) |
Eros International PLC | | | 411 | | | | 5,343 | (a) |
IMAX Corp. | | | 1,004 | | | | 22,239 | (a) |
Toho Company Ltd. | | | 3,100 | | | | 103,972 | |
Vivendi S.A. | | | 27,016 | | | | 662,394 | |
| | | | 833,410 | |
See Notes to Schedules of Investments and Notes to Financial Statements.
| | |
| State Street Total Return V.I.S. Fund | | |
Schedule of Investments | | June 30, 2018 (Unaudited) |
| | | | | | | | |
| | | Number
of Shares | | | Fair
Value | |
Multi-Line Insurance – 0.4% | |
Ageas | | | 5,540 | | | $ | 279,492 | |
Allianz SE | | | 11,608 | | | | 2,399,139 | |
Assicurazioni Generali S.p.A. | | | 33,424 | | | | 560,778 | |
Aviva PLC | | | 104,855 | | | | 697,712 | |
AXA S.A. | | | 50,947 | | | | 1,250,039 | |
Baloise Holding AG | | | 1,357 | | | | 197,205 | |
BB Seguridade Participacoes S.A. | | | 19,900 | | | | 126,515 | |
China Pacific Insurance Group Company Ltd., Class H | | | 67,800 | | | | 262,283 | |
Fairfax Financial Holdings Ltd. | | | 773 | | | | 432,885 | |
Gjensidige Forsikring ASA | | | 7,732 | | | | 126,742 | |
Mapfre S.A. | | | 20,481 | | | | 61,814 | |
Porto Seguro S.A. | | | 4,400 | | | | 46,523 | |
Powszechny Zaklad Ubezpieczen S.A. | | | 10,589 | | | | 110,247 | |
Sampo Oyj, Class A | | | 11,378 | | | | 555,287 | |
Sul America S.A. | | | 5,783 | | | | 27,477 | |
Zurich Insurance Group AG | | | 3,981 | | | | 1,179,125 | |
| | | | 8,313,263 | |
Multi-Sector Holdings – 0.1% | |
Ayala Corp. | | | 7,150 | | | | 123,259 | |
Eurazeo S.A. | | | 1,081 | | | | 81,975 | |
EXOR N.V. | | | 2,735 | | | | 184,251 | |
Groupe Bruxelles Lambert S.A. | | | 2,203 | | | | 232,313 | |
Grupo de Inversiones Suramericana S.A. | | | 8,633 | | | | 110,522 | |
GT Capital Holdings Inc. | | | 2,225 | | | | 37,940 | |
Haci Omer Sabanci Holding AS | | | 34,397 | | | | 66,298 | |
Industrivarden AB, Class C | | | 4,939 | | | | 95,898 | |
Investor AB, Class B | | | 12,087 | | | | 493,019 | |
Kinnevik AB, Class B | | | 6,884 | | | | 236,162 | |
L E Lundbergforetagen AB, B Shares | | | 1,568 | | | | 48,235 | |
Metro Pacific Investments Corp. | | | 129,200 | | | | 11,136 | |
Onex Corp. | | | 2,466 | | | | 180,884 | |
Pargesa Holding S.A. | | | 1,294 | | | | 109,598 | |
Remgro Ltd. | | | 15,705 | | | | 234,081 | |
Wendel S.A. | | | 781 | | | | 107,599 | |
| | | | 2,353,170 | |
Multi-Utilities – 0.2% | |
AGL Energy Ltd. | | | 18,361 | | | | 304,964 | |
Atco Ltd., Class I | | | 2,398 | | | | 73,975 | |
Canadian Utilities Ltd., Class A | | | 2,362 | | | | 59,613 | |
Centrica PLC | | | 140,336 | | | | 292,092 | |
E.ON SE | | | 57,219 | | | | 611,543 | |
Engie S.A. | | | 49,145 | | | | 753,390 | |
Innogy SE | | | 4,122 | | | | 176,576 | (d) |
National Grid PLC | | | 91,442 | | | | 1,012,170 | |
RWE AG | | | 13,542 | | | | 308,709 | |
Suez | | | 11,414 | | | | 147,990 | |
Veolia Environnement S.A. | | | 14,239 | | | | 304,732 | |
YTL Corporation Bhd | | | 204,408 | | | | 57,180 | |
| | | | 4,102,934 | |
Office REITs – 0.0% * | |
CapitaLand Commercial Trust | | | 63,313 | | | | 77,081 | |
City Office REIT Inc. | | | 452 | | | | 5,799 | |
Dexus | | | 25,446 | | | | 182,556 | |
Japan Prime Realty Investment Corp. | | | 22 | | | | 79,944 | |
Japan Real Estate Investment Corp. | | | 36 | | | | 190,457 | |
Nippon Building Fund Inc. | | | 32 | | | | 184,607 | |
| | | | 720,444 | |
Office Services & Supplies – 0.0% * | |
Societe BIC S.A. | | | 555 | | | | 51,450 | |
Oil & Gas Drilling – 0.0% * | | | | | | | | |
China Oilfield Services Ltd., Class H | | | 58,000 | | | | 54,781 | |
Ensco PLC, Class A | | | 2,842 | | | | 20,633 | |
Noble Corporation PLC | | | 4,625 | | | | 29,276 | (a) |
Ocean Rig UDW Inc., A Shares | | | 1,028 | | | | 30,305 | (a) |
Transocean Ltd. | | | 2,879 | | | | 38,694 | (a) |
| | | | 173,689 | |
Oil & Gas Equipment & Services – 0.0% * | |
Core Laboratories N.V. | | | 297 | | | | 37,485 | |
Frank’s International N.V. | | | 1,449 | | | | 11,302 | |
John Wood Group PLC | | | 17,318 | | | | 143,541 | |
| | | | | | | | |
| | | Number
of Shares | | | Fair
Value | |
TechnipFMC PLC | | | 13,899 | | | $ | 441,154 | |
Tenaris S.A. | | | 13,599 | | | | 249,515 | |
| | | | 882,997 | |
Oil & Gas Exploration & Production – 0.3% | |
ARC Resources Ltd. | | | 11,975 | | | | 123,624 | |
Canadian Natural Resources Ltd. | | | 29,895 | | | | 1,078,352 | |
CNOOC Ltd. | | | 465,000 | | | | 802,516 | |
Crescent Point Energy Corp. | | | 11,545 | | | | 84,781 | |
Encana Corp. | | | 26,924 | | | | 351,427 | |
Inpex Corp. | | | 24,900 | | | | 258,408 | |
Lundin Petroleum AB | | | 5,364 | | | | 171,305 | |
Novatek PJSC GDR GDR | | | 2,695 | | | | 399,669 | |
Oil & Natural Gas Corporation Ltd. | | | 43,306 | | | | 100,119 | |
Oil Search Ltd. | | | 37,134 | | | | 244,184 | |
PrairieSky Royalty Ltd. | | | 6,224 | | | | 122,781 | |
PTT Exploration & Production PCL NVDR | | | 52,000 | | | | 220,525 | |
Santos Ltd. | | | 50,308 | | | | 233,056 | (a) |
Seven Generations Energy Ltd., Class A | | | 7,200 | | | | 79,310 | (a) |
Tatneft PJSC ADR | | | 7,219 | | | | 456,674 | |
Tourmaline Oil Corp. | | | 6,249 | | | | 111,588 | |
Vermilion Energy Inc. | | | 2,305 | | | | 83,074 | |
Woodside Petroleum Ltd. | | | 23,384 | | | | 612,652 | |
| | | | 5,534,045 | |
Oil & Gas Refining & Marketing – 0.2% | |
Bharat Petroleum Corporation Ltd. | | | 19,440 | | | | 105,918 | |
Caltex Australia Ltd. | | | 7,005 | | | | 168,415 | |
Cosan S.A. Industria e Comercio | | | 5,500 | | | | 50,291 | |
Empresas COPEC S.A. | | | 11,610 | | | | 179,185 | |
Formosa Petrochemical Corp. | | | 29,000 | | | | 116,519 | |
Grupa Lotos S.A. | | | 2,254 | | | | 34,268 | |
GS Holdings Corp. | | | 895 | | | | 43,686 | |
Idemitsu Kosan Company Ltd. | | | 3,200 | | | | 114,115 | |
IRPC PCL NVDR | | | 378,600 | | | | 66,281 | |
JXTG Holdings Inc. | | | 86,750 | | | | 603,213 | |
Neste Oyj | | | 3,682 | | | | 288,888 | |
Petronas Dagangan Bhd | | | 8,900 | | | | 54,640 | |
Polski Koncern Naftowy ORLEN S.A. | | | 9,561 | | | | 214,666 | |
Reliance Industries Ltd. | | | 74,629 | | | | 1,059,227 | |
S-Oil Corp. | | | 1,258 | | | | 123,599 | |
Showa Shell Sekiyu KK | | | 4,200 | | | | 62,679 | |
SK Innovation Company Ltd. | | | 1,627 | | | | 294,889 | |
Thai Oil PCL NVDR | | | 30,500 | | | | 71,578 | |
Tupras Turkiye Petrol Rafinerileri AS | | | 3,135 | | | | 73,906 | |
| | | | 3,725,963 | |
Oil & Gas Storage & Transportation – 0.2% | |
AltaGas Ltd. | | | 4,683 | | | | 96,654 | |
Ardmore Shipping Corp. | | | 614 | | | | 5,035 | (a) |
DHT Holdings Inc. | | | 1,868 | | | | 8,761 | |
Enagas S.A. | | | 6,056 | | | | 177,050 | |
Enbridge Inc. | | | 45,407 | | | | 1,622,357 | |
Frontline Ltd. | | | 1,321 | | | | 7,715 | |
Golar LNG Ltd. | | | 1,672 | | | | 49,257 | |
Inter Pipeline Ltd. | | | 8,548 | | | | 160,115 | |
Keyera Corp. | | | 4,876 | | | | 135,592 | |
Koninklijke Vopak N.V. | | | 1,308 | | | | 60,429 | |
Kunlun Energy Company Ltd. | | | 82,000 | | | | 71,805 | |
Pembina Pipeline Corp. | | | 12,748 | | | | 441,230 | |
Scorpio Tankers Inc. | | | 4,700 | | | | 13,207 | |
Snam S.p.A. | | | 63,134 | | | | 263,594 | |
Teekay Corp. | | | 991 | | | | 7,680 | |
Teekay Tankers Ltd., Class A | | | 2,370 | | | | 2,773 | |
TransCanada Corp. | | | 23,806 | | | | 1,029,370 | |
Ultrapar Participacoes S.A. | | | 9,400 | | | | 112,265 | |
| | | | 4,264,889 | |
Other Diversified Financial Services – 0.1% | |
AMP Ltd. | | | 83,017 | | | | 218,360 | |
Challenger Ltd. | | | 16,883 | | | | 147,568 | |
FGL Holdings | | | 2,690 | | | | 22,569 | (a) |
FirstRand Ltd. | | | 89,181 | | | | 415,706 | |
Fubon Financial Holding Company Ltd. | | | 167,000 | | | | 279,899 | |
ORIX Corp. | | | 34,200 | | | | 540,951 | |
See Notes to Schedules of Investments and Notes to Financial Statements.
| | |
| State Street Total Return V.I.S. Fund | | |
Schedule of Investments | | June 30, 2018 (Unaudited) |
| | | | | | | | |
| | | Number
of Shares | | | Fair
Value | |
RMB Holdings Ltd. | | | 14,855 | | | $ | 82,142 | |
Standard Life Aberdeen PLC | | | 75,166 | | | | 323,218 | |
| | | | 2,030,413 | |
Packaged Foods & Meats – 0.6% | |
a2 Milk Company Ltd. | | | 17,008 | | | | 131,965 | (a) |
Ajinomoto Company Inc. | | | 13,100 | | | | 247,891 | |
Associated British Foods PLC | | | 9,271 | | | | 335,132 | |
Barry Callebaut AG | | | 54 | | | | 96,802 | |
BRF S.A. | | | 12,000 | | | | 56,142 | (a) |
Calbee Inc. | | | 2,400 | | | | 90,245 | |
Charoen Pokphand Foods PCL NVDR | | | 115,100 | | | | 84,075 | |
China Huishan Dairy Holdings Company Ltd. | | | 55,000 | | | | — | (a,i,**) |
China Mengniu Dairy Company Ltd. | | | 77,000 | | | | 261,069 | (a) |
Chocoladefabriken Lindt & Spruengli AG | | | 26 | | | | 168,367 | |
Chocoladefabriken Lindt & Spruengli AG | | | 3 | | | | 227,806 | |
CJ CheilJedang Corp. | | | 140 | | | | 44,280 | |
Danone S.A. | | | 16,395 | | | | 1,203,457 | |
Gruma SAB de C.V., Class B | | | 4,540 | | | | 56,104 | |
Grupo Bimbo SAB de C.V., Class A | | | 35,400 | | | | 69,681 | |
Indofood CBP Sukses Makmur Tbk PT | | | 64,000 | | | | 39,525 | |
Indofood Sukses Makmur Tbk PT | | | 63,900 | | | | 29,654 | |
JBS S.A. | | | 25,900 | | | | 62,606 | |
Kerry Group PLC, Class A | | | 4,207 | | | | 440,105 | |
Kikkoman Corp. | | | 4,000 | | | | 201,869 | |
M Dias Branco S.A. | | | 3,600 | | | | 34,995 | |
Marine Harvest ASA | | | 13,598 | | | | 270,612 | |
MEIJI Holdings Company Ltd. | | | 3,400 | | | | 286,697 | |
Nestle India Ltd. | | | 845 | | | | 120,989 | |
Nestle S.A. | | | 81,695 | | | | 6,326,951 | |
NH Foods Ltd. | | | 2,500 | | | | 101,002 | |
Nisshin Seifun Group Inc. | | | 5,400 | | | | 114,323 | |
Nissin Foods Holdings Company Ltd. | | | 1,600 | | | | 115,704 | |
Orion Corp. | | | 338 | | | | 45,188 | |
Orkla ASA | | | 23,958 | | | | 209,879 | |
Pioneer Foods Group Ltd. | | | 4,038 | | | | 32,970 | |
PPB Group Bhd | | | 17,800 | | | | 86,720 | |
Saputo Inc. | | | 6,496 | | | | 215,554 | |
Standard Foods Corp. | | | 15,916 | | | | 32,209 | |
Tiger Brands Ltd. | | | 4,749 | | | | 114,825 | |
Tingyi Cayman Islands Holding Corp. | | | 46,000 | | | | 106,712 | |
Toyo Suisan Kaisha Ltd. | | | 2,500 | | | | 89,040 | |
Ulker Biskuvi Sanayi AS | | | 3,012 | | | | 11,854 | (a) |
Uni-President Enterprises Corp. | | | 121,303 | | | | 307,947 | |
Universal Robina Corp. | | | 30,200 | | | | 68,472 | |
Want Want China Holdings Ltd. | | | 141,000 | | | | 125,446 | |
WH Group Ltd. | | | 197,500 | | | | 160,861 | (d) |
Yakult Honsha Company Ltd. | | | 2,500 | | | | 167,020 | |
Yamazaki Baking Company Ltd. | | | 4,000 | | | | 104,726 | |
| | | | 13,097,471 | |
Paper Packaging – 0.0% * | |
Amcor Ltd. | | | 30,780 | | | | 327,709 | |
Klabin S.A. | | | 19,600 | | | | 99,849 | |
Smurfit Kappa Group PLC | | | 5,565 | | | | 225,461 | |
| | | | 653,019 | |
Paper Products – 0.1% | | | | | | | | |
Empresas CMPC S.A. | | | 31,429 | | | | 116,038 | |
Fibria Celulose S.A. | | | 5,900 | | | | 111,286 | |
Mondi Ltd. | | | 2,641 | | | | 71,600 | |
Mondi PLC | | | 9,702 | | | | 262,714 | |
Nine Dragons Paper Holdings Ltd. | | | 25,000 | | | | 31,866 | |
Oji Holdings Corp. | | | 22,000 | | | | 136,451 | |
Sappi Ltd. | | | 19,577 | | | | 130,692 | |
Stora Enso Oyj, Class R | | | 15,040 | | | | 294,305 | |
Suzano Papel e Celulose S.A. | | | 9,200 | | | | 107,533 | |
UPM-Kymmene Oyj | | | 13,658 | | | | 488,279 | |
| | | | 1,750,764 | |
Personal Products – 0.4% | |
AMOREPACIFIC Corp. | | | 813 | | | | 235,256 | |
AMOREPACIFIC Group | | | 712 | | | | 78,898 | |
Beiersdorf AG | | | 2,570 | | | | 291,779 | |
Dabur India Ltd. | | | 13,803 | | | | 78,861 | |
Godrej Consumer Products Ltd. | | | 4,735 | | | | 84,707 | |
| | | | | | | | |
| | | Number
of Shares | | | Fair
Value | |
Hengan International Group Company Ltd. | | | 19,500 | | | $ | 187,656 | |
Kao Corp. | | | 12,900 | | | | 984,110 | |
Kobayashi Pharmaceutical Company Ltd. | | | 1,100 | | | | 95,039 | |
Kose Corp. | | | 900 | | | | 193,951 | |
L’Oreal S.A. | | | 6,627 | | | | 1,636,451 | |
LG Household & Health Care Ltd. | | | 236 | | | | 295,609 | |
Marico Ltd. | | | 10,808 | | | | 52,317 | |
Natura Cosmeticos S.A. | | | 3,000 | | | | 23,603 | |
Pola Orbis Holdings Inc. | | | 1,800 | | | | 79,222 | |
Shiseido Company Ltd. | | | 10,355 | | | | 822,492 | |
Unilever N.V. | | | 40,757 | | | | 2,273,890 | |
Unilever PLC | | | 33,265 | | | | 1,841,048 | |
| | | | 9,254,889 | |
Pharmaceuticals – 1.4% | | | | | | | | |
Aspen Pharmacare Holdings Ltd. | | | 11,107 | | | | 209,251 | |
Astellas Pharma Inc. | | | 51,000 | | | | 777,673 | |
AstraZeneca PLC | | | 33,942 | | | | 2,353,971 | |
Aurobindo Pharma Ltd. | | | 9,370 | | | | 83,026 | |
Bayer AG | | | 24,130 | | | | 2,658,122 | |
China Medical System Holdings Ltd. | | | 44,000 | | | | 87,939 | |
China Resources Pharmaceutical Group Ltd. | | | 54,000 | | | | 74,749 | (d) |
Chugai Pharmaceutical Company Ltd. | | | 5,500 | | | | 288,494 | |
Cipla Ltd. | | | 12,861 | | | | 115,752 | |
CSPC Pharmaceutical Group Ltd. | | | 134,000 | | | | 404,795 | |
Daiichi Sankyo Company Ltd. | | | 14,600 | | | | 558,481 | |
Dr Reddy’s Laboratories Ltd. | | | 3,837 | | | | 125,168 | |
Eisai Company Ltd. | | | 6,457 | | | | 454,931 | |
Endo International PLC | | | 4,186 | | | | 39,474 | (a) |
GlaxoSmithKline PLC | | | 130,774 | | | | 2,641,268 | |
Glenmark Pharmaceuticals Ltd. | | | 5,757 | | | | 48,991 | |
H Lundbeck A/S | | | 1,594 | | | | 112,003 | |
Hanmi Pharm Company Ltd. | | | 120 | | | | 45,330 | |
Hisamitsu Pharmaceutical Company Inc. | | | 1,500 | | | | 126,619 | |
Hypera S.A. | | | 8,000 | | | | 57,410 | |
Ipsen S.A. | | | 1,211 | | | | 189,958 | |
Kalbe Farma Tbk PT | | | 295,000 | | | | 25,115 | |
Kyowa Hakko Kirin Company Ltd. | | | 8,000 | | | | 161,278 | |
Lupin Ltd. | | | 6,036 | | | | 79,623 | |
Merck KGaA | | | 3,477 | | | | 339,462 | |
Mitsubishi Tanabe Pharma Corp. | | | 5,900 | | | | 101,951 | |
Novartis AG | | | 58,331 | | | | 4,422,335 | |
Novo Nordisk A/S, Class B | | | 46,638 | | | | 2,163,261 | |
Ono Pharmaceutical Company Ltd. | | | 10,200 | | | | 239,150 | |
Orion Oyj, Class B | | | 2,832 | | | | 76,347 | |
Otsuka Holdings Company Ltd. | | | 10,657 | | | | 516,085 | |
Perrigo Company PLC | | | 4,533 | | | | 330,501 | |
Piramal Enterprises Ltd. | | | 2,252 | | | | 83,365 | |
Recordati S.p.A. | | | 3,367 | | | | 133,895 | |
Richter Gedeon Nyrt | | | 2,156 | | | | 39,389 | |
Roche Holding AG | | | 18,421 | | | | 4,091,597 | |
Sanofi | | | 30,201 | | | | 2,420,681 | |
Santen Pharmaceutical Company Ltd. | | | 10,600 | | | | 184,793 | |
Shanghai Fosun Pharmaceutical Group Company Ltd. H Shares | | | 16,000 | | | | 87,796 | |
Shionogi & Company Ltd. | | | 7,758 | | | | 398,599 | |
Sino Biopharmaceutical Ltd. | | | 177,000 | | | | 271,633 | |
Sumitomo Dainippon Pharma Company Ltd. | | | 3,400 | | | | 71,981 | |
Sun Pharmaceutical Industries Ltd. | | | 26,058 | | | | 214,504 | |
Taisho Pharmaceutical Holdings Company Ltd. | | | 700 | | | | 81,966 | |
Takeda Pharmaceutical Company Ltd. | | | 19,400 | | | | 819,331 | |
Teva Pharmaceutical Industries Ltd. | | | 8,871 | | | | 210,424 | |
Teva Pharmaceutical Industries Ltd. ADR | | | 15,371 | | | | 373,823 | |
Theravance Biopharma Inc. | | | 789 | | | | 17,895 | (a) |
UCB S.A. | | | 3,463 | | | | 272,271 | |
Valeant Pharmaceuticals International Inc. | | | 7,948 | | | | 184,886 | (a) |
Vifor Pharma AG | | | 1,112 | | | | 177,671 | |
Yuhan Corp. | | | 190 | | | | 37,079 | |
| | | | 30,082,092 | |
See Notes to Schedules of Investments and Notes to Financial Statements.
| | |
| State Street Total Return V.I.S. Fund | | |
| Schedule of Investments | | June 30, 2018 (Unaudited) |
|
| | | | | | | | |
| | | Number
of Shares | | | Fair
Value | |
Precious Metals & Minerals – 0.0% * | |
Anglo American Platinum Ltd. | | | 1,523 | | | $ | 39,891 | |
Fresnillo PLC | | | 5,200 | | | | 78,505 | |
Industrias Penoles SAB de C.V. | | | 2,630 | | | | 47,639 | |
| | | | 166,035 | |
Property & Casualty Insurance – 0.3% | |
Admiral Group PLC | | | 6,199 | | | | 156,114 | |
Argo Group International Holdings Ltd. | | | 579 | | | | 33,669 | |
Aspen Insurance Holdings Ltd. | | | 402 | | | | 16,361 | |
Chubb Ltd. | | | 15,374 | | | | 1,952,805 | |
DB Insurance Company Ltd. | | | 1,106 | | | | 58,550 | |
Direct Line Insurance Group PLC | | | 40,658 | | | | 184,064 | |
Global Indemnity Ltd. | | | 165 | | | | 6,432 | |
Hyundai Marine & Fire Insurance Company Ltd. | | | 1,762 | | | | 53,279 | |
Insurance Australia Group Ltd. | | | 58,709 | | | | 370,007 | |
Intact Financial Corp. | | | 3,974 | | | | 281,710 | |
James River Group Holdings Ltd. | | | 417 | | | | 16,384 | |
MS&AD Insurance Group Holdings Inc. | | | 13,400 | | | | 416,644 | |
PICC Property & Casualty Company Ltd., Class H | | | 183,900 | | | | 198,540 | |
Qatar Insurance Co. SAQ | | | 5,654 | | | | 55,127 | |
QBE Insurance Group Ltd. | | | 37,854 | | | | 272,412 | |
RSA Insurance Group PLC | | | 27,906 | | | | 250,311 | |
Samsung Fire & Marine Insurance Company Ltd. | | | 753 | | | | 178,369 | |
Sompo Holdings Inc. | | | 9,260 | | | | 374,530 | |
Suncorp Group Ltd. | | | 36,168 | | | | 389,884 | |
The People’s Insurance Company Group of China Ltd., Class H | | | 224,000 | | | | 105,355 | |
Tokio Marine Holdings Inc. | | | 18,300 | | | | 857,960 | |
Tryg A/S | | | 2,560 | | | | 60,094 | |
XL Group Ltd. | | | 8,729 | | | | 488,388 | |
| | | | 6,776,989 | |
Publishing – 0.0% * | |
Axel Springer SE | | | 1,610 | | | | 116,451 | |
Pearson PLC | | | 20,641 | | | | 241,174 | |
Schibsted ASA, B Shares | | | 3,679 | | | | 103,819 | |
Singapore Press Holdings Ltd. | | | 45,337 | | | | 86,451 | |
| | | | 547,895 | |
Railroads – 0.3% | |
Aurizon Holdings Ltd. | | | 55,818 | | | | 178,574 | |
BTS Group Holdings PCL NVDR | | | 100,000 | | | | 26,562 | |
Canadian National Railway Co. | | | 19,828 | | | | 1,620,818 | |
Canadian Pacific Railway Ltd. | | | 3,792 | | | | 694,491 | |
Central Japan Railway Co. | | | 3,800 | | | | 787,686 | |
Container Corporation Of India Ltd. | | | 3,036 | | | | 28,902 | |
East Japan Railway Co. | | | 8,057 | | | | 772,131 | |
Hankyu Hanshin Holdings Inc. | | | 6,409 | | | | 257,772 | |
Keikyu Corp. | | | 7,000 | | | | 114,765 | |
Keio Corp. | | | 2,400 | | | | 116,138 | |
Keisei Electric Railway Company Ltd. | | | 3,000 | | | | 103,056 | |
Kintetsu Group Holdings Company Ltd. | | | 4,400 | | | | 179,551 | |
Kyushu Railway Co. | | | 5,000 | | | | 153,027 | |
MTR Corporation Ltd. | | | 43,500 | | | | 240,636 | |
Nagoya Railroad Company Ltd. | | | 4,600 | | | | 118,774 | |
Odakyu Electric Railway Company Ltd. | | | 8,900 | | | | 191,073 | |
Rumo S.A. | | | 23,400 | | | | 85,757 | (a) |
Tobu Railway Company Ltd. | | | 5,000 | | | | 153,027 | |
Tokyu Corp. | | | 14,072 | | | | 242,399 | |
West Japan Railway Co. | | | 4,100 | | | | 302,193 | |
| | | | 6,367,332 | |
Real Estate Development – 0.1% | |
Agile Group Holdings Ltd. | | | 50,000 | | | | 85,145 | |
Bumi Serpong Damai Tbk PT | | | 185,500 | | | | 20,259 | |
China Evergrande Group | | | 97,000 | | | | 247,277 | (a) |
China Jinmao Holdings Group Ltd. | | | 114,000 | | | | 57,251 | |
China Overseas Land & Investment Ltd. | | | 94,000 | | | | 309,721 | |
China Resources Land Ltd. | | | 65,777 | | | | 221,759 | |
China Vanke Company Ltd., Class H | | | 32,800 | | | | 114,762 | |
CIFI Holdings Group Company Ltd. | | | 114,000 | | | | 72,508 | |
CK Asset Holdings Ltd. | | | 67,064 | | | | 532,549 | |
Country Garden Holdings Company Ltd. | | | 202,333 | | | | 355,900 | |
| | | | | | | | |
| | | Number
of Shares | | | Fair
Value | |
Emaar Properties PJSC | | | 105,792 | | | $ | 141,703 | |
Fullshare Holdings Ltd. | | | 220,000 | | | | 108,802 | (a) |
Guangzhou R&F Properties Company Ltd., Class H | | | 33,600 | | | | 67,839 | |
Highwealth Construction Corp. | | | 23,400 | | | | 34,730 | |
IOI Properties Group Bhd | | | 93,258 | | | | 36,938 | |
Longfor Properties Company Ltd. | | | 31,500 | | | | 84,919 | |
Ruentex Development Company Ltd. | | | 33,448 | | | | 38,617 | (a) |
Shimao Property Holdings Ltd. | | | 27,500 | | | | 72,207 | |
Sino Land Company Ltd. | | | 85,597 | | | | 139,217 | |
Sino-Ocean Group Holding Ltd. | | | 104,500 | | | | 60,738 | |
Sunac China Holdings Ltd. | | | 51,000 | | | | 178,441 | |
| | | | 2,981,282 | |
Real Estate Operating Companies – 0.1% | |
Aeon Mall Company Ltd. | | | 4,000 | | | | 71,864 | |
BR Malls Participacoes S.A. | | | 18,383 | | | | 46,347 | |
Central Pattana PCL NVDR | | | 44,200 | | | | 93,056 | |
Deutsche Wohnen SE | | | 9,421 | | | | 455,379 | |
First Capital Realty Inc. | | | 5,563 | | | | 87,370 | |
Hang Lung Group Ltd. | | | 15,000 | | | | 42,063 | |
Hongkong Land Holdings Ltd. | | | 27,800 | | | | 198,770 | |
Hulic Company Ltd. | | | 10,000 | | | | 106,803 | |
Hysan Development Company Ltd. | | | 15,000 | | | | 83,743 | |
Multiplan Empreendimentos Imobiliarios S.A. | | | 3,375 | | | | 50,001 | |
NEPI Rockcastle PLC | | | 9,520 | | | | 85,057 | |
SM Prime Holdings Inc. | | | 245,000 | | | | 165,040 | |
SOHO China Ltd. | | | 76,000 | | | | 36,133 | |
Swire Properties Ltd. | | | 30,800 | | | | 113,849 | |
Swiss Prime Site AG | | | 1,899 | | | | 174,323 | (a) |
Vonovia SE | | | 13,757 | | | | 654,687 | |
Wharf Real Estate Investment Company Ltd. | | | 36,000 | | | | 256,276 | |
| | | | 2,720,761 | |
Real Estate Services – 0.0% * | |
Altisource Portfolio Solutions S.A. | | | 115 | | | | 3,355 | (a) |
Regional Banks – 0.1% | |
Bank of Queensland Ltd. | | | 12,904 | | | | 97,153 | |
Bendigo & Adelaide Bank Ltd. | | | 11,341 | | | | 90,831 | |
BNK Financial Group Inc. | | | 7,204 | | | | 60,437 | |
Chongqing Rural Commercial Bank Company Ltd., Class H | | | 92,000 | | | | 54,763 | |
Concordia Financial Group Ltd. | | | 32,500 | | | | 165,485 | |
DGB Financial Group Inc. | | | 3,207 | | | | 29,495 | |
First BanCorp | | | 4,014 | | | | 30,707 | (a) |
Fukuoka Financial Group Inc. | | | 19,000 | | | | 95,545 | |
Mebuki Financial Group Inc. | | | 29,250 | | | | 98,235 | |
Resona Holdings Inc. | | | 59,700 | | | | 319,399 | |
Seven Bank Ltd. | | | 22,000 | | | | 67,332 | |
Shinsei Bank Ltd. | | | 3,300 | | | | 50,826 | |
Suruga Bank Ltd. | | | 4,900 | | | | 43,840 | |
The Bank of Kyoto Ltd. | | | 1,600 | | | | 74,103 | |
The Chiba Bank Ltd. | | | 13,900 | | | | 98,259 | |
The Shizuoka Bank Ltd. | | | 10,300 | | | | 93,083 | |
Yamaguchi Financial Group Inc. | | | 4,000 | | | | 45,068 | |
| | | | 1,514,561 | |
Reinsurance – 0.1% | |
Everest Re Group Ltd. | | | 1,300 | | | | 299,624 | |
Hannover Rueck SE | | | 1,797 | | | | 224,076 | |
Muenchener Rueckversicherungs-Gesellschaft AG | | | 4,086 | | | | 863,719 | |
RenaissanceRe Holdings Ltd. | | | 266 | | | | 32,005 | |
SCOR SE | | | 4,658 | | | | 173,052 | |
Swiss Re AG | | | 8,115 | | | | 700,393 | |
Third Point Reinsurance Ltd. | | | 1,314 | | | | 16,425 | (a) |
| | | | 2,309,294 | |
Renewable Electricity – 0.0% * | |
China Longyuan Power Group Corporation Ltd., Class H | | | 101,000 | | | | 81,362 | |
Engie Brasil Energia S.A. | | | 6,100 | | | | 54,271 | |
Meridian Energy Ltd. | | | 50,908 | | | | 107,538 | |
| | | | 243,171 | |
Research & Consulting Services – 0.2% | |
Bureau Veritas S.A. | | | 6,561 | | | | 175,114 | |
Experian PLC | | | 25,768 | | | | 637,709 | |
See Notes to Schedules of Investments and Notes to Financial Statements.
| | |
| State Street Total Return V.I.S. Fund | | |
| Schedule of Investments | | June 30, 2018 (Unaudited) |
|
| | | | | | | | |
| | | Number
of Shares | | | Fair
Value | |
IHS Markit Ltd. | | | 11,700 | | | $ | 603,603 | (a) |
Intertek Group PLC | | | 4,471 | | | | 337,406 | |
RELX N.V. | | | 24,755 | | | | 527,908 | |
RELX PLC | | | 29,097 | | | | 623,289 | |
SGS S.A. | | | 135 | | | | 359,202 | |
Teleperformance | | | 1,526 | | | | 269,569 | |
Wolters Kluwer N.V. | | | 7,425 | | | | 418,369 | |
| | | | 3,952,169 | |
Residential REITs – 0.0% * | |
Emlak Konut Gayrimenkul Yatirim Ortakligi AS | | | 58,985 | | | | 26,137 | |
Front Yard Residential Corp. | | | 920 | | | | 9,587 | |
| | | | 35,724 | |
Restaurants – 0.1% | |
Compass Group PLC | | | 41,564 | | | | 888,150 | |
Domino’s Pizza Enterprises Ltd. | | | 1,237 | | | | 47,727 | |
Jollibee Foods Corp. | | | 15,290 | | | | 75,351 | |
McDonald’s Holdings Company Japan Ltd. | | | 1,500 | | | | 76,513 | |
Restaurant Brands International Inc. | | | 5,611 | | | | 338,251 | |
Sodexo SA | | | 2,757 | | | | 275,606 | |
Whitbread PLC | | | 5,025 | | | | 262,650 | |
| | | | 1,964,248 | |
Retail REITs – 0.1% | |
CapitaLand Mall Trust | | | 47,900 | | | | 72,720 | |
Hammerson PLC | | | 20,726 | | | | 143,002 | |
Hyprop Investments Ltd. | | | 6,628 | | | | 49,489 | |
Japan Retail Fund Investment Corp. | | | 77 | | | | 138,755 | |
Klepierre S.A. | | | 5,116 | | | | 192,635 | |
Link REIT | | | 62,500 | | | | 570,793 | |
Resilient REIT Ltd. | | | 11,324 | | | | 46,473 | |
RioCan Real Estate Investment Trust | | | 5,179 | | | | 95,080 | |
Scentre Group | | | 137,483 | | | | 445,933 | |
SmartCentres Real Estate Investment Trust | | | 2,900 | | | | 67,306 | |
The British Land Company PLC | | | 26,538 | | | | 235,517 | |
Unibail-Rodamco SE | | | 19,740 | | | | 213,960 | (a) |
Unibail-Rodamco-Westfield | | | 2,839 | | | | 624,982 | |
Vicinity Centres | | | 96,787 | | | | 185,214 | |
| | | | 3,081,859 | |
Security & Alarm Services – 0.0% * | |
G4S PLC | | | 40,283 | | | | 142,373 | |
S-1 Corp. | | | 405 | | | | 35,176 | |
Secom Company Ltd. | | | 5,900 | | | | 453,133 | |
Securitas AB, Class B | | | 8,224 | | | | 135,550 | |
Sohgo Security Services Company Ltd. | | | 1,800 | | | | 84,828 | |
| | | | 851,060 | |
Semiconductor Equipment – 0.2% | |
ASM Pacific Technology Ltd. | | | 9,300 | | | | 117,592 | |
ASML Holding N.V. | | | 10,778 | | | | 2,135,481 | |
Disco Corp. | | | 900 | | | | 153,650 | |
GCL-Poly Energy Holdings Ltd. | | | 394,000 | | | | 37,163 | (a) |
Hanergy Thin Film Power Group Ltd. | | | 64,000 | | | | — | (a,**) |
SUMCO Corp. | | | 6,000 | | | | 121,175 | |
Tokyo Electron Ltd. | | | 4,200 | | | | 721,202 | |
| | | | 3,286,263 | |
Semiconductors – 0.4% | |
Infineon Technologies AG | | | 29,687 | | | | 756,651 | |
MediaTek Inc. | | | 38,352 | | | | 377,375 | |
Novatek Microelectronics Corp. | | | 12,000 | | | | 54,119 | |
NXP Semiconductors N.V. | | | 9,900 | | | | 1,081,773 | (a) |
Phison Electronics Corp. | | | 5,000 | | | | 39,523 | |
Powertech Technology Inc. | | | 27,000 | | | | 78,374 | |
Realtek Semiconductor Corp. | | | 16,160 | | | | 58,834 | |
Renesas Electronics Corp. | | | 12,900 | | | | 126,478 | (a) |
Rohm Company Ltd. | | | 2,600 | | | | 218,300 | |
Semiconductor Manufacturing International Corp. | | | 60,200 | | | | 78,267 | (a) |
SK Hynix Inc. | | | 15,744 | | | | 1,210,642 | |
STMicroelectronics N.V. | | | 15,822 | | | | 353,019 | |
Taiwan Semiconductor Manufacturing Company Ltd. | | | 646,000 | | | | 4,587,271 | |
| | | | | | | | |
| | | Number
of Shares | | | Fair
Value | |
United Microelectronics Corp. | | | 344,000 | | | $ | 191,246 | |
Vanguard International Semiconductor Corp. | | | 19,000 | | | | 43,498 | |
| | | | 9,255,370 | |
Silver – 0.0% * | |
Wheaton Precious Metals Corp. | | | 12,144 | | | | 267,907 | |
Soft Drinks – 0.1% | |
Arca Continental SAB de C.V. | | | 9,800 | | | | 60,957 | |
Coca-Cola Amatil Ltd. | | | 15,783 | | | | 107,284 | |
Coca-Cola Bottlers Japan Holdings Inc. | | | 3,100 | | | | 123,843 | |
Coca-Cola European Partners PLC | | | 5,957 | | | | 241,898 | |
Coca-Cola Femsa SAB de C.V., Class L | | | 11,500 | | | | 65,797 | |
Coca-Cola HBC AG | | | 5,186 | | | | 173,293 | (a) |
Coca-Cola Icecek AS | | | 2,227 | | | | 16,489 | |
Fomento Economico Mexicano SAB de C.V. | | | 52,528 | | | | 467,536 | |
Suntory Beverage & Food Ltd. | | | 3,900 | | | | 166,542 | |
| | | | 1,423,639 | |
Specialized Finance – 0.0% * | |
Banco Latinoamericano de Comercio Exterior S.A., Class E | | | 487 | | | | 11,985 | |
Chailease Holding Company Ltd. | | | 32,718 | | | | 107,313 | |
Far East Horizon Ltd. | | | 53,000 | | | | 51,409 | |
Mitsubishi UFJ Lease & Finance Company Ltd. | | | 12,200 | | | | 75,008 | |
| | | | 245,715 | |
Specialty Chemicals – 0.3% | |
Akzo Nobel N.V. | | | 6,803 | | | | 582,370 | |
Asian Paints Ltd. | | | 7,557 | | | | 139,465 | |
Chr Hansen Holding A/S | | | 2,513 | | | | 232,103 | |
Clariant AG | | | 5,968 | | | | 143,167 | (a) |
Covestro AG | | | 4,248 | | | | 379,025 | (d) |
Croda International PLC | | | 3,878 | | | | 245,859 | |
EMS-Chemie Holding AG | | | 214 | | | | 137,178 | |
Evonik Industries AG | | | 4,312 | | | | 147,661 | |
Givaudan S.A. | | | 248 | | | | 562,461 | |
Hitachi Chemical Company Ltd. | | | 4,000 | | | | 80,711 | |
Johnson Matthey PLC | | | 5,286 | | | | 252,564 | |
JSR Corp. | | | 4,600 | | | | 78,324 | |
Kansai Paint Company Ltd. | | | 6,000 | | | | 124,697 | |
Koninklijke DSM N.V. | | | 4,769 | | | | 479,520 | |
Nippon Paint Holdings Company Ltd. | | | 4,158 | | | | 179,061 | |
Nitto Denko Corp. | | | 4,500 | | | | 340,572 | |
Novozymes A/S, Class B | | | 5,861 | | | | 297,298 | |
Shin-Etsu Chemical Company Ltd. | | | 9,608 | | | | 856,406 | |
Sika AG | | | 3,540 | | | | 489,850 | |
Symrise AG | | | 3,381 | | | | 296,456 | |
Umicore S.A. | | | 5,594 | | | | 321,012 | |
| | | | 6,365,760 | |
Specialty Stores – 0.0% * | |
Dufry AG | | | 1,056 | | | | 134,426 | (a) |
FF Group | | | 1,860 | | | | 10,424 | (a) |
Hotel Shilla Company Ltd. | | | 1,000 | | | | 110,812 | |
Hudson Ltd., Class A | | | 721 | | | | 12,610 | (a) |
JUMBO S.A. | | | 4,127 | | | | 68,037 | |
| | | | 336,309 | |
Steel – 0.2% | |
ArcelorMittal | | | 17,248 | | | | 505,663 | |
BlueScope Steel Ltd. | | | 14,355 | | | | 183,063 | |
China Steel Corp. | | | 312,796 | | | | 243,150 | |
Cia Siderurgica Nacional S.A. | | | 11,500 | | | | 23,494 | (a) |
Eregli Demir ve Celik Fabrikalari TAS | | | 38,107 | | | | 84,845 | |
Fortescue Metals Group Ltd. | | | 41,355 | | | | 134,137 | |
Hitachi Metals Ltd. | | | 8,000 | | | | 83,059 | |
Hyundai Steel Co. | | | 2,772 | | | | 130,827 | |
JFE Holdings Inc. | | | 14,000 | | | | 264,921 | |
JSW Steel Ltd. | | | 28,960 | | | | 138,132 | |
Kobe Steel Ltd. | | | 9,500 | | | | 86,968 | |
Maruichi Steel Tube Ltd. | | | 1,000 | | | | 33,901 | |
Nippon Steel & Sumitomo Metal Corp. | | | 19,400 | | | | 381,029 | |
POSCO | | | 2,011 | | | | 593,647 | |
Severstal PJSC GDR | | | 7,140 | | | | 104,458 | |
Tata Steel Ltd. | | | 11,358 | | | | 94,118 | |
ThyssenKrupp AG | | | 12,709 | | | | 308,935 | |
See Notes to Schedules of Investments and Notes to Financial Statements.
| | |
| State Street Total Return V.I.S. Fund | | |
| Schedule of Investments | | June 30, 2018 (Unaudited) |
|
| | | | | | | | |
| | | Number
of Shares | | | Fair
Value | |
Vale S.A. | | | 86,200 | | | $ | 1,111,051 | |
voestalpine AG | | | 3,277 | | | | 150,938 | |
| | | | 4,656,336 | |
Systems Software – 0.0% * | |
BlackBerry Ltd. | | | 11,499 | | | | 110,842 | (a) |
Check Point Software Technologies Ltd. | | | 3,980 | | | | 388,766 | (a) |
Oracle Corporation Japan | | | 800 | | | | 65,364 | |
Trend Micro Inc. | | | 2,900 | | | | 165,468 | |
| | | | 730,440 | |
Technology Distributors – 0.0% * | |
Synnex Technology International Corp. | | | 50,400 | | | | 76,042 | |
WPG Holdings Ltd. | | | 51,000 | | | | 72,263 | |
| | | | 148,305 | |
Technology Hardware, Storage & Peripherals – 0.4% | |
Acer Inc. | | | 102,084 | | | | 83,372 | (a) |
Advantech Company Ltd. | | | 12,093 | | | | 79,725 | |
Asustek Computer Inc. | | | 19,000 | | | | 173,557 | |
Brother Industries Ltd. | | | 6,800 | | | | 134,324 | |
Canon Inc. | | | 26,173 | | | | 857,980 | |
Catcher Technology Company Ltd. | | | 19,000 | | | | 212,506 | |
Chicony Electronics Company Ltd. | | | 17,514 | | | | 39,465 | |
Compal Electronics Inc. | | | 73,000 | | | | 45,972 | |
FUJIFILM Holdings Corp. | | | 10,609 | | | | 414,342 | |
HTC Corp. | | | 30,000 | | | | 55,988 | (a) |
Inventec Corp. | | | 80,000 | | | | 62,843 | |
Konica Minolta Inc. | | | 11,900 | | | | 110,550 | |
Lenovo Group Ltd. | | | 148,000 | | | | 80,174 | |
Lite-On Technology Corp. | | | 36,669 | | | | 44,380 | |
NEC Corp. | | | 7,600 | | | | 208,586 | |
Pegatron Corp. | | | 59,000 | | | | 121,334 | |
Quanta Computer Inc. | | | 79,000 | | | | 138,626 | |
Ricoh Company Ltd. | | | 16,100 | | | | 147,678 | |
Samsung Electronics Company Ltd. | | | 126,342 | | | | 5,288,340 | |
Seagate Technology PLC | | | 9,795 | | | | 553,124 | |
Seiko Epson Corp. | | | 8,200 | | | | 142,583 | |
Wistron Corp. | | | 92,479 | | | | 68,703 | |
| | | | 9,064,152 | |
Textiles – 0.0% * | |
Eclat Textile Company Ltd. | | | 5,304 | | | | 63,063 | |
Formosa Taffeta Company Ltd. | | | 25,000 | | | | 27,346 | |
Ruentex Industries Ltd. | | | 19,711 | | | | 40,213 | (a) |
| | | | 130,622 | |
Thrifts & Mortgage Finance – 0.1% | |
Essent Group Ltd. | | | 1,778 | | | | 63,688 | (a) |
Housing Development Finance Corporation Ltd. | | | 43,361 | | | | 1,207,577 | |
Indiabulls Housing Finance Ltd. | | | 9,083 | | | | 151,461 | |
LIC Housing Finance Ltd. | | | 11,981 | | | | 81,951 | |
| | | | 1,504,677 | |
Tires & Rubber – 0.1% | |
Bridgestone Corp. | | | 16,661 | | | | 651,759 | |
Cheng Shin Rubber Industry Company Ltd. | | | 65,550 | | | | 98,577 | |
Cie Generale des Etablissements Michelin SCA | | | 4,431 | | | | 539,587 | |
Hankook Tire Company Ltd. | | | 1,864 | | | | 70,412 | |
Nokian Renkaat Oyj | | | 2,727 | | | | 107,744 | |
Sumitomo Rubber Industries Ltd. | | | 4,100 | | | | 65,147 | |
The Yokohama Rubber Company Ltd. | | | 3,500 | | | | 72,771 | |
| | | | 1,605,997 | |
Tobacco – 0.3% | |
British American Tobacco Malaysia Bhd | | | 4,300 | | | | 37,023 | |
British American Tobacco PLC | | | 57,760 | | | | 2,920,669 | |
British American Tobacco PLC ADR | | | 2,827 | | | | 142,622 | |
Gudang Garam Tbk PT | | | 7,700 | | | | 36,136 | |
Hanjaya Mandala Sampoerna Tbk PT | | | 190,000 | | | | 47,467 | |
Imperial Brands PLC | | | 25,046 | | | | 933,150 | |
ITC Ltd. | | | 105,621 | | | | 410,367 | |
Japan Tobacco Inc. | | | 29,200 | | | | 815,907 | |
KT&G Corp. | | | 3,177 | | | | 305,015 | |
Swedish Match AB | | | 4,864 | | | | 241,243 | |
| | | | 5,889,599 | |
| | | | | | | | |
| | | Number
of Shares | | | Fair
Value | |
Trading Companies & Distributors – 0.3% | |
AerCap Holdings N.V. | | | 3,234 | | | $ | 175,121 | (a) |
Ashtead Group PLC | | | 13,914 | | | | 417,549 | |
Brenntag AG | | | 3,895 | | | | 217,012 | |
Bunzl PLC | | | 8,385 | | | | 254,064 | |
Ferguson PLC | | | 6,346 | | | | 515,266 | |
Finning International Inc. | | | 4,230 | | | | 104,347 | |
ITOCHU Corp. | | | 38,573 | | | | 699,095 | |
Marubeni Corp. | | | 39,600 | | | | 302,135 | |
Mitsubishi Corp. | | | 35,496 | | | | 986,383 | |
Mitsui & Company Ltd. | | | 45,800 | | | | 763,919 | |
Posco Daewoo Corp. | | | 2,030 | | | | 38,979 | |
Rexel S.A. | | | 7,899 | | | | 113,575 | |
Sumitomo Corp. | | | 30,670 | | | | 503,944 | |
Toyota Tsusho Corp. | | | 5,600 | | | | 187,568 | |
Travis Perkins PLC | | | 6,480 | | | | 121,698 | |
Triton International Ltd. | | | 884 | | | | 27,104 | |
| | | | 5,427,759 | |
Trucking – 0.0% * | |
ComfortDelGro Corporation Ltd. | | | 50,000 | | | | 86,175 | |
DSV A/S | | | 4,995 | | | | 403,576 | |
Localiza Rent a Car S.A. | | | 16,206 | | | | 99,956 | |
Nippon Express Company Ltd. | | | 2,300 | | | | 166,948 | |
| | | | 756,655 | |
Water Utilities – 0.0% * | |
Aguas Andinas S.A., Class A | | | 77,578 | | | | 42,508 | |
Beijing Enterprises Water Group Ltd. | | | 130,000 | | | | 70,920 | (a) |
Cia de Saneamento Basico do Estado de Sao Paulo | | | 9,700 | | | | 58,718 | |
Consolidated Water Company Ltd. | | | 301 | | | | 3,883 | |
Guangdong Investment Ltd. | | | 92,000 | | | | 146,113 | |
Severn Trent PLC | | | 7,131 | | | | 186,364 | |
United Utilities Group PLC | | | 18,428 | | | | 185,683 | |
| | | | 694,189 | |
Wireless Telecommunication Services – 0.5% | |
Advanced Info Service PCL NVDR | | | 29,800 | | | | 166,405 | |
America Movil SAB de C.V., Class L | | | 921,789 | | | | 777,078 | |
Axiata Group Bhd | | | 99,282 | | | | 93,396 | |
Bharti Airtel Ltd. | | | 29,526 | | | | 164,598 | |
China Mobile Ltd. | | | 166,500 | | | | 1,479,208 | |
DiGi.Com Bhd | | | 96,300 | | | | 98,934 | |
Empresa Nacional de Telecomunicaciones S.A. | | | 4,152 | | | | 38,593 | |
Far EasTone Telecommunications Company Ltd. | | | 32,000 | | | | 82,706 | |
Global Telecom Holding SAE | | | 1,382 | | | | 364 | (a) |
Globe Telecom Inc. | | | 1,235 | | | | 35,638 | |
Idea Cellular Ltd. | | | 24,304 | | | | 21,053 | (a) |
KDDI Corp. | | | 47,317 | | | | 1,294,794 | |
Maxis Bhd | | | 48,900 | | | | 66,096 | |
Millicom International Cellular S.A. | | | 1,697 | | | | 100,348 | |
Mobile TeleSystems PJSC ADR | | | 13,956 | | | | 123,231 | |
MTN Group Ltd. | | | 50,951 | | | | 401,103 | |
NTT DOCOMO Inc. | | | 35,500 | | | | 904,607 | |
PLDT Inc. | | | 1,920 | | | | 46,410 | |
Rogers Communications Inc., Class B | | | 9,699 | | | | 460,379 | |
SK Telecom Company Ltd. | | | 72 | | | | 15,052 | |
SoftBank Group Corp. | | | 22,000 | | | | 1,583,587 | |
Taiwan Mobile Company Ltd. | | | 43,000 | | | | 155,846 | |
Tele2 AB, Class B | | | 8,464 | | | | 99,626 | |
TIM Participacoes S.A. | | | 19,100 | | | | 65,431 | |
Turkcell Iletisim Hizmetleri AS | | | 31,681 | | | | 84,161 | |
Vodacom Group Ltd. | | | 9,090 | | | | 81,434 | |
Vodafone Group PLC | | | 713,971 | | | | 1,732,725 | |
| | | | 10,172,803 | |
Total Common Stock
(Cost $469,720,060) | | | | 561,644,407 | |
|
Preferred Stock – 0.3% | |
|
Auto Parts & Equipment – 0.0% * | |
Schaeffler AG | | | 6,455 | | | | 84,032 | |
Automobile Manufacturers – 0.1% | |
Bayerische Motoren Werke AG | | | 1,658 | | | | 132,215 | |
See Notes to Schedules of Investments and Notes to Financial Statements.
| | |
| State Street Total Return V.I.S. Fund | | |
| Schedule of Investments | | June 30, 2018 (Unaudited) |
|
| | | | | | | | |
| | | Number
of Shares | | | Fair Value | |
Hyundai Motor Co. | | | 746 | | | $ | 60,778 | |
Hyundai Motor Co. | | | 666 | | | | 49,180 | |
Porsche Automobil Holding SE | | | 4,233 | | | | 269,649 | |
Volkswagen AG | | | 4,893 | | | | 812,478 | |
| | | | | | | 1,324,300 | |
Commodity Chemicals – 0.0% * | |
Braskem S.A., Class A | | | 6,100 | | | | 80,479 | |
FUCHS PETROLUB SE | | | 2,446 | | | | 120,630 | |
LG Chem Ltd. | | | 274 | | | | 49,539 | |
| | | | | | | 250,648 | |
Diversified Banks – 0.1% | |
Banco Bradesco S.A. | | | 92,239 | | | | 644,910 | |
Bancolombia S.A. | | | 12,485 | | | | 151,844 | |
Grupo Aval Acciones y Valores S.A. | | | 128,800 | | | | 53,941 | |
Itau Unibanco Holding S.A. | | | 89,197 | | | | 935,231 | |
Itausa - Investimentos Itau S.A. | | | 119,202 | | | | 284,419 | |
| | | | | | | 2,070,345 | |
Electric Utilities – 0.0% * | |
Centrais Eletricas Brasileiras S.A., Class B | | | 8,100 | | | | 28,527 | (a) |
Cia Energetica de Minas Gerais | | | 33,576 | | | | 63,707 | |
| | | | | | | 92,234 | |
Fertilizers & Agricultural Chemicals – 0.0% * | |
Sociedad Quimica y Minera de Chile S.A., Class B | | | 3,310 | | | | 159,830 | |
General Merchandise Stores – 0.0% * | |
Lojas Americanas S.A. | | | 16,686 | | | | 72,297 | |
Healthcare Equipment – 0.0% * | |
Sartorius AG | | | 838 | | | | 125,334 | |
Household Products – 0.0% * | |
Henkel AG & Company KGaA | | | 4,626 | | | | 591,419 | |
Hypermarkets & Super Centers – 0.0% * | |
Cia Brasileira de Distribuicao | | | 4,800 | | | | 97,175 | |
Integrated Oil & Gas – 0.0% * | |
Petroleo Brasileiro S.A. | | | 106,538 | | | | 476,007 | |
Integrated Telecommunication Services – 0.0% * | |
Telefonica Brasil S.A. | | | 11,900 | | | | 141,474 | |
Multi-Sector Holdings – 0.0% * | |
Grupo de Inversiones Suramericana S.A. | | | 3,183 | | | | 38,734 | |
Soft Drinks – 0.0% * | |
Embotelladora Andina S.A., Class B | | | 7,865 | | | | 30,605 | |
Steel – 0.0% * | |
Gerdau S.A. | | | 24,400 | | | | 88,216 | |
Technology Hardware, Storage & Peripherals – 0.1% | |
Samsung Electronics Company Ltd. | | | 23,200 | | | | 783,742 | |
Total Preferred Stock (Cost $7,429,658) | | | | | | | 6,426,392 | |
Rights – 0.0% * | |
Construction & Engineering – 0.0% * | |
ACS Actividades de Construccion y Servicios S.A. | | | 5,751 | | | | 5,922 | (a) |
Diversified Banks – 0.0% * | |
Intesa Sanpaolo S.p.A. | | | 383,769 | | | | — | (a,**) |
Integrated Oil & Gas – 0.0% * | |
Repsol S.A. | | | 32,228 | | | | 18,291 | (a) |
| |
Total Rights
(Cost $24,423) | | | | 24,213 | |
| |
Total Foreign Equity
(Cost $477,174,141) | | | | 568,095,012 | |
| | | | | | | | | | |
| | | Principal
Amount | | | Fair
Value | |
Bonds and Notes – 30.8% | | | | | |
U.S. Treasuries – 11.3% | | | | | |
U.S. Treasury Bonds | | | | | |
2.25% | | 08/15/46 | | $ | 1,600,000 | | | | 1,377,328 | |
| | | | | | | | | | | | |
| | | | Principal
Amount | | | Fair
Value | |
2.50% | | | 02/15/45 - 05/15/46 | | | $ | 4,510,000 | | | $ | 4,101,329 | |
2.75% | | | 11/15/42 - 11/15/47 | | | | 3,650,000 | | | | 3,487,262 | |
2.88% | | | 08/15/45 - 11/15/46 | | | | 1,800,000 | | | | 1,763,548 | |
3.00% | | | 05/15/42 - 02/15/48 | | | | 12,500,000 | | | | 12,547,616 | |
3.13% | | | 08/15/44 - 05/15/48 | | | | 2,500,000 | | | | 2,566,550 | |
3.38% | | | 05/15/44 | | | | 1,900,000 | | | | 2,034,805 | |
3.63% | | | 08/15/43 - 02/15/44 | | | | 1,740,000 | | | | 1,939,547 | |
3.75% | | | 11/15/43 | | | | 1,400,000 | | | | 1,591,030 | |
4.25% | | | 05/15/39 - 11/15/40 | | | | 2,000,000 | | | | 2,417,890 | |
4.38% | | | 02/15/38 - 11/15/39 | | | | 2,000,000 | | | | 2,441,940 | |
4.50% | | | 02/15/36 | | | | 2,000,000 | | | | 2,445,720 | |
4.63% | | | 02/15/40 | | | | 500,000 | | | | 634,435 | |
5.25% | | | 02/15/29 | | | | 200,000 | | | | 243,566 | |
5.50% | | | 08/15/28 | | | | 1,450,000 | | | | 1,785,196 | |
6.00% | | | 02/15/26 | | | | 1,827,000 | | | | 2,225,067 | |
6.38% | | | 08/15/27 | | | | 200,000 | | | | 256,706 | |
7.63% | | | 11/15/22 - 02/15/25 | | | | 500,000 | | | | 618,528 | |
7.88% | | | 02/15/21 | | | | 2,000,000 | | | | 2,265,880 | |
8.75% | | | 05/15/20 | | | | 3,000,000 | | | | 3,342,810 | |
U.S. Treasury Notes | | | | | |
1.00% | | | 10/15/19 | | | | 3,500,000 | | | | 3,436,440 | |
1.13% | | | 03/31/20 - 09/30/21 | | | | 6,500,000 | | | | 6,235,796 | |
1.25% | | | 10/31/19 - 10/31/21 | | | | 6,500,000 | | | | 6,275,585 | |
1.38% | | | 07/31/19 - 05/31/21 | | | | 15,500,000 | | | | 15,171,165 | |
1.50% | | | 11/30/19 - 08/15/26 | | | | 10,400,000 | | | | 10,067,678 | |
1.63% | | | 08/31/19 - 05/15/26 | | | | 19,540,000 | | | | 18,806,757 | |
1.75% | | | 11/30/19 - 09/30/22 | | | | 12,600,000 | | | | 12,305,510 | |
1.88% | | | 12/15/20 - 09/30/22 | | | | 23,000,000 | | | | 22,341,750 | |
2.00% | | | 07/31/20 - 11/15/26 | | | | 25,844,000 | | | | 24,977,830 | |
2.13% | | | 08/31/20 - 11/30/23 | | | | 8,600,000 | | | | 8,443,432 | |
2.25% | | | 03/31/21 - 11/15/27 | | | | 21,690,000 | | | | 20,934,284 | |
2.38% | | | 12/31/20 - 05/15/27 | | | | 14,000,000 | | | | 13,742,560 | |
2.50% | | | 03/31/23 - 01/31/25 | | | | 10,500,000 | | | | 10,340,675 | |
2.63% | | | 08/15/20 - 02/28/23 | | | | 5,885,000 | | | | 5,881,403 | |
2.75% | | | 05/31/23 - 02/15/28 | | | | 5,500,000 | | | | 5,482,425 | |
3.13% | | | 05/15/21 | | | | 1,500,000 | | | | 1,520,865 | |
3.38% | | | 11/15/19 | | | | 5,000,000 | | | | 5,060,350 | |
3.63% | | | 02/15/20 - 02/15/21 | | | | 2,700,000 | | | | 2,753,312 | |
| | | | | | | | | | | 243,864,570 | |
U.S. Government Sponsored Agency – 0.0% * | |
Tennessee Valley Authority | | | | | |
3.50% | | | 12/15/42 | | | | 1,000,000 | | | | 1,002,760 | |
Agency Mortgage Backed – 9.1% | | | | | |
Federal Home Loan Banks | | | | | |
1.38% | | | 11/15/19 | | | | 1,200,000 | | | | 1,182,132 | |
1.50% | | | 10/21/19 | | | | 1,000,000 | | | | 987,360 | |
Federal Home Loan Mortgage Corp. | | | | | |
1.13% | | | 08/12/21 | | | | 1,137,000 | | | | 1,084,482 | |
1.25% | | | 10/02/19 | | | | 1,500,000 | | | | 1,477,095 | |
2.38% | | | 01/13/22 | | | | 2,100,000 | | | | 2,073,603 | |
2.50% | | | 07/01/28 - 02/01/32 | | | | 3,539,747 | | | | 3,456,165 | |
2.51% | | | 11/25/22 | | | | 300,000 | | | | 292,939 | |
3.00% | | | 05/01/30 - 03/01/47 | | | | 13,895,996 | | | | 13,600,979 | |
3.50% | | | 03/01/26 - 11/01/47 | | | | 12,530,416 | | | | 12,509,749 | |
4.00% | | | 06/01/42 - 08/01/47 | | | | 6,395,642 | | | | 6,543,625 | |
4.50% | | | 05/01/42 - 01/01/45 | | | | 88,212 | | | | 92,655 | |
5.00% | | | 12/01/22 - 06/01/41 | | | | 1,888,660 | | | | 1,990,322 | |
5.50% | | | 01/01/38 - 04/01/39 | | | | 394,015 | | | | 424,499 | |
6.00% | | | 06/01/37 - 11/01/37 | | | | 380,461 | | | | 415,808 | |
6.25% | | | 07/15/32 | | | | 250,000 | | | | 334,625 | |
Federal Home Loan Mortgage Corp. 1.50% + 12 month USD LIBOR | | | | | |
4.01% | | | 06/01/43 | | | | 131,290 | | | | 135,463 | (e) |
Federal Home Loan Mortgage Corp. 1.60% + 12 month USD LIBOR | | | | | |
2.51% | | | 08/01/43 | | | | 196,474 | | | | 194,440 | (e) |
Federal Home Loan Mortgage Corp. 1.65% + 12 month USD LIBOR | | | | | |
2.45% | | | 05/01/43 | | | | 524,202 | | | | 517,895 | (e) |
Federal National Mortgage Assoc. | | | | | |
1.50% | | | 07/30/20 | | | | 500,000 | | | | 488,825 | |
1.88% | | | 09/24/26 | | | | 1,000,000 | | | | 911,730 | |
2.13% | | | 04/24/26 | | | | 700,000 | | | | 656,943 | |
2.50% | | | 02/01/28 - 11/01/31 | | | | 5,754,591 | | | | 5,638,992 | |
2.68% | | | 05/25/21 | | | | 92,904 | | | | 91,929 | (e) |
3.00% | | | 01/01/28 - 05/01/47 | | | | 26,270,550 | | | | 25,724,129 | |
3.50% | | | 01/01/27 - 06/01/48 | | | | 29,697,795 | | | | 29,712,512 | |
4.00% | | | 10/01/41 - 01/01/48 | | | | 12,810,593 | | | | 13,108,514 | |
4.50% | | | 11/01/18 - 03/01/46 | | | | 7,259,471 | | | | 7,631,235 | |
See Notes to Schedules of Investments and Notes to Financial Statements.
| | |
| State Street Total Return V.I.S. Fund | | |
| Schedule of Investments | | June 30, 2018 (Unaudited) |
|
| | | | | | | | | | |
| | | | | Principal
Amount | | | Fair
Value | |
5.00% | | 12/01/39 - 06/01/41 | | $ | 1,810,622 | | | $ | 1,929,594 | |
5.50% | | 12/01/35 - 04/01/38 | | | 2,561,553 | | | | 2,771,993 | |
6.00% | | 03/01/34 - 08/01/37 | | | 1,769,640 | | | | 1,933,281 | |
6.63% | | 11/15/30 | | | 100,000 | | | | 134,325 | |
Federal National Mortgage Assoc. 1.53% + 12 month USD LIBOR | |
3.90% | | 04/01/43 | | | 79,936 | | | | 82,281 | (e) |
Federal National Mortgage Assoc. | |
4.00% | | TBA | | | 3,350,000 | | | | 3,415,331 | (f) |
Government National Mortgage Assoc. | |
2.50% | | 05/20/45 | | | 270,472 | | | | 257,436 | |
3.00% | | 10/15/42 - 06/20/47 | | | 16,294,377 | | | | 16,002,278 | |
3.50% | | 03/20/45 - 06/20/48 | | | 17,652,871 | | | | 17,766,694 | |
4.00% | | 12/20/40 - 02/20/48 | | | 13,753,893 | | | | 14,157,625 | |
4.50% | | 05/20/40 | | | 1,376,304 | | | | 1,447,059 | |
5.00% | | 08/15/41 | | | 2,185,405 | | | | 2,315,853 | |
3.50% | | TBA | | | 2,500,000 | | | | 2,509,619 | (f) |
| | | | | | | | | 196,002,014 | |
Agency Collateralized Mortgage Obligations – 0.2% | |
Federal Home Loan Mortgage Corp. | |
2.37% | | 05/25/22 | | | 600,000 | | | | 585,030 | |
2.60% | | 10/25/23 | | | 103,971 | | | | 102,613 | |
2.75% | | 01/25/26 | | | 300,000 | | | | 289,162 | |
2.87% | | 12/25/21 | | | 800,000 | | | | 794,311 | |
3.06% | | 07/25/23 | | | 600,000 | | | | 597,937 | (e) |
3.30% | | 04/25/23 | | | 100,000 | | | | 100,756 | (e) |
3.39% | | 03/25/24 | | | 200,000 | | | | 201,806 | |
3.49% | | 01/25/24 | | | 300,000 | | | | 305,295 | |
3.53% | | 07/25/23 | | | 800,000 | | | | 813,743 | (e) |
3.97% | | 01/25/21 | | | 200,000 | | | | 204,204 | (e) |
4.25% | | 01/25/20 | | | 100,000 | | | | 101,230 | |
4.33% | | 10/25/20 | | | 450,000 | | | | 461,738 | (e) |
Federal National Mortgage Assoc. | |
2.78% | | 06/25/21 | | | 328,675 | | | | 326,447 | (e) |
| | | | | | | | | 4,884,272 | |
Asset Backed – 0.2% | |
American Express Credit Account Master Trust | |
1.93% | | 09/15/22 | | | 500,000 | | | | 492,534 | |
Americredit Automobile Receivables Trust 2018-1 | |
3.50% | | 01/18/24 | | | 75,000 | | | | 75,077 | |
Chase Issuance Trust 2016-A5 | |
1.27% | | 07/15/21 | | | 500,000 | | | | 492,682 | |
Citibank Credit Card Issuance Trust | |
1.92% | | 04/07/22 | | | 500,000 | | | | 491,452 | |
Discover Card Execution Note Trust 2015-A2 | |
1.90% | | 10/17/22 | | | 1,000,000 | | | | 982,470 | |
Drive Auto Receivables Trust 2018-2 | |
4.14% | | 08/15/24 | | | 150,000 | | | | 150,794 | |
Ford Credit Floorplan Master Owner Trust A | |
2.16% | | 09/15/22 | | | 250,000 | | | | 245,396 | |
GM Financial Automobile Leasing Trust 2018-2 | |
3.06% | | 06/21/21 | | | 100,000 | | | | 99,994 | |
Honda Auto Receivables Owner Trust | |
2.60% | | 02/15/22 | | | 180,000 | | | | 179,028 | |
Santander Drive Auto Receivables Trust 2018-2 | |
3.03% | | 09/15/22 | | | 60,000 | | | | 59,632 | |
Santander Drive Auto Receivables Trust 2018-3 | |
3.03% | | 02/15/22 | | | 50,000 | | | | 50,036 | |
Synchrony Credit Card Master Note Trust 2016-2 | |
2.21% | | 05/15/24 | | | 100,000 | | | | 97,478 | |
Toyota Auto Receivables 2018-B Owner Trust | |
2.96% | | 09/15/22 | | | 100,000 | | | | 100,028 | |
| | | | 3,516,601 | |
Corporate Notes – 8.9% | |
21st Century Fox America Inc. | |
3.38% | | 11/15/26 | | | 200,000 | | | | 191,668 | |
4.75% | | 11/15/46 | | | 200,000 | | | | 206,908 | |
6.65% | | 11/15/37 | | | 279,000 | | | | 345,539 | |
3M Co. | |
3.00% | | 08/07/25 | | | 250,000 | | | | 244,005 | |
Abbott Laboratories | |
2.55% | | 03/15/22 | | | 230,000 | | | | 222,907 | |
2.90% | | 11/30/21 | | | 200,000 | | | | 196,866 | |
3.75% | | 11/30/26 | | | 200,000 | | | | 196,490 | |
4.75% | | 11/30/36 | | | 200,000 | | | | 210,578 | |
4.90% | | 11/30/46 | | | 200,000 | | | | 215,312 | |
| | | | | | | | | | |
| | | | | Principal
Amount | | | Fair
Value | |
AbbVie Inc. | |
2.30% | | 05/14/21 | | $ | 200,000 | | | $ | 194,214 | |
4.30% | | 05/14/36 | | | 200,000 | | | | 191,226 | |
4.40% | | 11/06/42 | | | 250,000 | | | | 237,395 | |
4.50% | | 05/14/35 | | | 70,000 | | | | 68,442 | |
4.70% | | 05/14/45 | | | 250,000 | | | | 247,850 | |
Adobe Systems Inc. | |
3.25% | | 02/01/25 | | | 70,000 | | | | 68,652 | |
AerCap Ireland Capital DAC/AerCap Global Aviation Trust | |
3.95% | | 02/01/22 | | | 500,000 | | | | 498,155 | |
Aetna Inc. | |
2.75% | | 11/15/22 | | | 500,000 | | | | 480,010 | |
Aflac Inc. | |
3.63% | | 11/15/24 | | | 250,000 | | | | 248,372 | |
African Development Bank | |
2.13% | | 11/16/22 | | | 500,000 | | | | 484,045 | |
Air Lease Corp. | |
3.88% | | 04/01/21 - 07/03/23 | | | 250,000 | | | | 251,183 | |
Aircastle Ltd. | |
4.13% | | 05/01/24 | | | 20,000 | | | | 19,150 | |
5.00% | | 04/01/23 | | | 20,000 | | | | 20,075 | |
5.13% | | 03/15/21 | | | 20,000 | | | | 20,450 | |
5.50% | | 02/15/22 | | | 20,000 | | | | 20,500 | |
6.25% | | 12/01/19 | | | 20,000 | | | | 20,686 | |
7.63% | | 04/15/20 | | | 10,000 | | | | 10,576 | |
Alabama Power Co. | |
3.70% | | 12/01/47 | | | 100,000 | | | | 92,562 | |
Alexandria Real Estate Equities Inc. | |
3.45% | | 04/30/25 | | | 100,000 | | | | 95,823 | |
4.70% | | 07/01/30 | | | 15,000 | | | | 15,161 | |
Alibaba Group Holding Ltd. | |
3.13% | | 11/28/21 | | | 200,000 | | | | 198,088 | |
4.20% | | 12/06/47 | | | 60,000 | | | | 54,914 | |
Allergan Finance LLC | |
3.25% | | 10/01/22 | | | 500,000 | | | | 485,925 | |
Allergan Funding SCS | |
4.75% | | 03/15/45 | | | 350,000 | | | | 334,096 | |
Alphabet Inc. | |
3.38% | | 02/25/24 | | | 225,000 | | | | 226,966 | |
Altria Group Inc. | |
2.63% | | 09/16/26 | | | 200,000 | | | | 182,306 | |
4.25% | | 08/09/42 | | | 413,000 | | | | 385,251 | |
5.38% | | 01/31/44 | | | 70,000 | | | | 75,729 | |
Amazon.com Inc. | |
1.90% | | 08/21/20 | | | 100,000 | | | | 97,948 | |
3.15% | | 08/22/27 | | | 100,000 | | | | 95,930 | |
3.88% | | 08/22/37 | | | 100,000 | | | | 97,709 | |
4.25% | | 08/22/57 | | | 100,000 | | | | 98,546 | |
4.80% | | 12/05/34 | | | 250,000 | | | | 273,555 | |
America Movil SAB de C.V. | |
3.13% | | 07/16/22 | | | 300,000 | | | | 294,870 | |
American Campus Communities Operating Partnership LP | |
3.63% | | 11/15/27 | | | 30,000 | | | | 28,107 | |
American Electric Power Company Inc. | |
3.20% | | 11/13/27 | | | 100,000 | | | | 93,560 | |
American Express Co. | |
2.20% | | 10/30/20 | | | 220,000 | | | | 214,922 | |
3.00% | | 10/30/24 | | | 200,000 | | | | 191,376 | |
3.38% | | 05/17/21 | | | 50,000 | | | | 50,060 | |
3.40% | | 02/27/23 | | | 100,000 | | | | 98,928 | |
3.63% | | 12/05/24 | | | 250,000 | | | | 246,300 | |
American Financial Group Inc. | |
3.50% | | 08/15/26 | | | 65,000 | | | | 61,039 | |
American Honda Finance Corp. | |
2.15% | | 03/13/20 | | | 200,000 | | | | 197,194 | |
2.60% | | 11/16/22 | | | 100,000 | | | | 97,429 | |
American International Group Inc. | |
4.50% | | 07/16/44 | | | 250,000 | | | | 233,132 | |
4.88% | | 06/01/22 | | | 500,000 | | | | 523,520 | |
American Tower Corp. (REIT) | |
3.50% | | 01/31/23 | | | 300,000 | | | | 295,254 | |
AmerisourceBergen Corp. | |
3.45% | | 12/15/27 | | | 100,000 | | | | 92,221 | |
Amgen Inc. | |
3.20% | | 11/02/27 | | | 200,000 | | | | 187,280 | |
4.66% | | 06/15/51 | | | 205,000 | | | | 202,569 | |
See Notes to Schedules of Investments and Notes to Financial Statements.
| | |
| State Street Total Return V.I.S. Fund | | |
| Schedule of Investments | | June 30, 2018 (Unaudited) |
|
| | | | | | | | | | |
| | | | | Principal
Amount | | | Fair
Value | |
Anadarko Petroleum Corp. | |
6.20% | | 03/15/40 | | $ | 442,000 | | | $ | 497,480 | |
Analog Devices Inc. | |
2.50% | | 12/05/21 | | | 200,000 | | | | 193,954 | |
3.50% | | 12/05/26 | | | 200,000 | | | | 190,822 | |
Andeavor | |
3.80% | | 04/01/28 | | | 30,000 | | | | 28,352 | |
4.50% | | 04/01/48 | | | 25,000 | | | | 22,972 | |
4.75% | | 12/15/23 | | | 50,000 | | | | 51,907 | |
5.13% | | 12/15/26 | | | 50,000 | | | | 52,364 | |
Andeavor Logistics LP/Tesoro Logistics Finance Corp. | |
4.25% | | 12/01/27 | | | 35,000 | | | | 33,615 | |
Anheuser-Busch InBev Finance Inc. | |
2.65% | | 02/01/21 | | | 200,000 | | | | 197,154 | |
3.65% | | 02/01/26 | | | 200,000 | | | | 195,836 | |
3.70% | | 02/01/24 | | | 500,000 | | | | 500,450 | |
4.90% | | 02/01/46 | | | 420,000 | | | | 432,008 | |
Anheuser-Busch InBev Worldwide Inc. | |
2.50% | | 07/15/22 | | | 892,000 | | | | 861,743 | |
3.50% | | 01/12/24 | | | 25,000 | | | | 24,862 | |
4.00% | | 04/13/28 | | | 255,000 | | | | 254,278 | |
4.38% | | 04/15/38 | | | 15,000 | | | | 14,592 | |
4.60% | | 04/15/48 | | | 235,000 | | | | 231,381 | |
4.75% | | 04/15/58 | | | 50,000 | | | | 49,126 | |
Anthem Inc. | |
3.30% | | 01/15/23 | | | 500,000 | | | | 487,205 | |
3.70% | | 08/15/21 | | | 237,000 | | | | 238,697 | |
4.38% | | 12/01/47 | | | 65,000 | | | | 60,259 | |
Apache Corp. | |
5.10% | | 09/01/40 | | | 250,000 | | | | 246,033 | |
Apple Inc. | |
1.10% | | 08/02/19 | | | 250,000 | | | | 246,238 | |
1.80% | | 11/13/19 | | | 50,000 | | | | 49,463 | |
2.00% | | 11/13/20 | | | 50,000 | | | | 49,058 | |
2.25% | | 02/23/21 | | | 200,000 | | | | 196,398 | |
2.40% | | 01/13/23 | | | 50,000 | | | | 48,326 | |
2.50% | | 02/09/22 | | | 300,000 | | | | 294,219 | |
2.75% | | 01/13/25 | | | 50,000 | | | | 47,761 | |
3.00% | | 11/13/27 | | | 100,000 | | | | 94,968 | |
3.25% | | 02/23/26 | | | 160,000 | | | | 156,051 | |
3.75% | | 11/13/47 | | | 50,000 | | | | 47,072 | |
4.38% | | 05/13/45 | | | 465,000 | | | | 478,573 | |
4.50% | | 02/23/36 | | | 300,000 | | | | 322,353 | |
4.65% | | 02/23/46 | | | 185,000 | | | | 199,077 | |
Applied Materials Inc. | |
3.90% | | 10/01/25 | | | 160,000 | | | | 162,650 | |
ArcelorMittal | |
5.25% | | 08/05/20 | | | 25,000 | | | | 25,750 | |
5.50% | | 03/01/21 | | | 25,000 | | | | 26,000 | |
6.13% | | 06/01/25 | | | 20,000 | | | | 21,632 | |
6.25% | | 02/25/22 | | | 25,000 | | | | 26,655 | |
6.75% | | 03/01/41 | | | 20,000 | | | | 22,544 | |
7.00% | | 10/15/39 | | | 40,000 | | | | 45,776 | |
Arch Capital Finance LLC | |
4.01% | | 12/15/26 | | | 100,000 | | | | 98,753 | |
5.03% | | 12/15/46 | | | 200,000 | | | | 209,938 | |
Archer-Daniels-Midland Co. | |
4.02% | | 04/16/43 | | | 370,000 | | | | 360,558 | |
Arrow Electronics Inc. | |
4.00% | | 04/01/25 | | | 40,000 | | | | 39,183 | |
Ascension Health | |
3.95% | | 11/15/46 | | | 25,000 | | | | 24,588 | |
Asian Development Bank | |
1.75% | | 01/10/20 | | | 200,000 | | | | 197,422 | |
2.13% | | 03/19/25 | | | 500,000 | | | | 474,025 | |
2.25% | | 01/20/21 | | | 500,000 | | | | 493,900 | |
2.75% | | 03/17/23 | | | 295,000 | | | | 293,144 | |
Assurant Inc. | |
4.90% | | 03/27/28 | | | 50,000 | | | | 49,968 | |
AstraZeneca PLC | |
6.45% | | 09/15/37 | | | 250,000 | | | | 309,573 | |
AT&T Inc. | |
4.10% | | 02/15/28 | | | 406,000 | | | | 387,799 | (d) |
4.30% | | 02/15/30 | | | 520,000 | | | | 491,478 | (d) |
4.35% | | 06/15/45 | | | 450,000 | | | | 381,555 | |
4.50% | | 05/15/35 - 03/09/48 | | | 395,000 | | | | 345,925 | |
| | | | | | | | | | |
| | | | | Principal
Amount | | | Fair
Value | |
4.75% | | 05/15/46 | | $ | 250,000 | | | $ | 223,035 | |
5.15% | | 03/15/42 | | | 250,000 | | | | 236,522 | |
5.55% | | 08/15/41 | | | 454,000 | | | | 453,764 | |
Australia & New Zealand Banking Group Ltd. | |
2.05% | | 09/23/19 | | | 200,000 | | | | 197,756 | |
3.70% | | 11/16/25 | | | 250,000 | | | | 249,132 | |
AutoNation Inc. | |
3.80% | | 11/15/27 | | | 50,000 | | | | 46,530 | |
AvalonBay Communities Inc. | |
3.20% | | 01/15/28 | | | 40,000 | | | | 37,679 | |
3.45% | | 06/01/25 | | | 115,000 | | | | 112,297 | |
AXA S.A. | |
8.60% | | 12/15/30 | | | 100,000 | | | | 130,447 | |
Baidu Inc. | | | | | | | | | | |
3.88% | | 09/29/23 | | | 200,000 | | | | 198,644 | |
4.38% | | 03/29/28 | | | 200,000 | | | | 197,968 | |
Baker Hughes a GE Company LLC/Baker Hughes Co-Obligor Inc. | |
2.77% | | 12/15/22 | | | 50,000 | | | | 48,550 | |
3.34% | | 12/15/27 | | | 50,000 | | | | 46,654 | |
4.08% | | 12/15/47 | | | 50,000 | | | | 44,899 | |
Banco Santander S.A. | |
3.13% | | 02/23/23 | | | 200,000 | | | | 189,702 | |
3.80% | | 02/23/28 | | | 200,000 | | | | 182,638 | |
4.25% | | 04/11/27 | | | 100,000 | | | | 95,203 | |
Bank of America Corp. | |
2.15% | | 11/09/20 | | | 200,000 | | | | 195,316 | |
3.50% | | 04/19/26 | | | 145,000 | | | | 140,224 | |
3.88% | | 08/01/25 | | | 250,000 | | | | 248,747 | |
3.95% | | 04/21/25 | | | 155,000 | | | | 151,787 | |
4.00% | | 04/01/24 | | | 350,000 | | | | 353,160 | |
4.13% | | 01/22/24 | | | 500,000 | | | | 508,010 | |
4.18% | | 11/25/27 | | | 200,000 | | | | 194,796 | |
6.11% | | 01/29/37 | | | 250,000 | | | | 287,620 | |
Bank of America Corp. (3.42% fixed rate until 12/20/27; 1.04% + 3 month USD LIBOR thereafter) | |
3.42% | | 12/20/28 | | | 1,207,000 | | | | 1,137,573 | (e) |
Bank of America Corp. (3.50% fixed rate until 05/17/21; 0.63% + 3 month USD LIBOR thereafter) | |
3.50% | | 05/17/22 | | | 100,000 | | | | 100,039 | (e) |
Bank of America Corp. (3.55% fixed rate until 03/05/23; 0.78% + 3 month USD LIBOR thereafter) | |
3.55% | | 03/05/24 | | | 100,000 | | | | 98,898 | (e) |
Bank of America Corp. (3.97% fixed rate until 03/05/28; 1.07% + 3 month USD LIBOR thereafter) | |
3.97% | | 03/05/29 | | | 100,000 | | | | 98,443 | (e) |
Bank of Montreal | |
2.10% | | 12/12/19 | | | 200,000 | | | | 197,628 | |
3.10% | | 04/13/21 | | | 90,000 | | | | 89,632 | |
Barclays Bank PLC | |
2.65% | | 01/11/21 | | | 200,000 | | | | 195,488 | |
Barclays PLC | |
3.65% | | 03/16/25 | | | 500,000 | | | | 468,955 | |
Barclays PLC (4.97% fixed rate until 05/16/28; 1.90% + 3 month USD LIBOR thereafter) | |
4.97% | | 05/16/29 | | | 200,000 | | | | 198,110 | (e) |
BAT Capital Corp. | |
2.30% | | 08/14/20 | | | 100,000 | | | | 97,830 | (d) |
2.76% | | 08/15/22 | | | 100,000 | | | | 95,882 | (d) |
3.22% | | 08/15/24 | | | 100,000 | | | | 94,754 | (d) |
3.56% | | 08/15/27 | | | 100,000 | | | | 93,123 | (d) |
4.39% | | 08/15/37 | | | 100,000 | | | | 93,584 | (d) |
Baxalta Inc. | |
4.00% | | 06/23/25 | | | 100,000 | | | | 97,896 | |
Baxter International Inc. | |
2.60% | | 08/15/26 | | | 230,000 | | | | 209,926 | |
BB&T Corp. | |
2.15% | | 02/01/21 | | | 200,000 | | | | 194,986 | |
2.85% | | 10/26/24 | | | 150,000 | | | | 142,344 | |
Becton Dickinson and Co. | |
3.70% | | 06/06/27 | | | 200,000 | | | | 189,480 | |
3.73% | | 12/15/24 | | | 50,000 | | | | 48,828 | |
Bed Bath & Beyond Inc. | |
3.75% | | 08/01/24 | | | 150,000 | | | | 136,153 | |
Berkshire Hathaway Energy Co. | |
6.13% | | 04/01/36 | | | 494,000 | | | | 609,892 | |
See Notes to Schedules of Investments and Notes to Financial Statements.
| | |
| State Street Total Return V.I.S. Fund | | |
| Schedule of Investments | | June 30, 2018 (Unaudited) |
|
| | | | | | | | | | |
| | | | | Principal
Amount | | | Fair
Value | |
Berkshire Hathaway Finance Corp. | |
1.30% | | 08/15/19 | | $ | 350,000 | | | $ | 344,746 | |
3.00% | | 05/15/22 | | | 200,000 | | | | 199,204 | |
Biogen Inc. | |
4.05% | | 09/15/25 | | | 80,000 | | | | 80,359 | |
5.20% | | 09/15/45 | | | 150,000 | | | | 158,670 | |
Boeing Capital Corp. | |
4.70% | | 10/27/19 | | | 250,000 | | | | 256,252 | |
Booking Holdings Inc. | |
2.75% | | 03/15/23 | | | 100,000 | | | | 96,487 | |
3.55% | | 03/15/28 | | | 100,000 | | | | 95,241 | |
Boston Properties LP (REIT) | |
3.85% | | 02/01/23 | | | 250,000 | | | | 251,740 | |
Boston Scientific Corp. | |
4.00% | | 03/01/28 | | | 100,000 | | | | 97,810 | |
4.13% | | 10/01/23 | | | 100,000 | | | | 101,622 | |
BP Capital Markets PLC | |
2.32% | | 02/13/20 | | | 250,000 | | | | 247,545 | |
2.50% | | 11/06/22 | | | 100,000 | | | | 96,544 | |
2.52% | | 01/15/20 | | | 115,000 | | | | 114,267 | |
3.06% | | 03/17/22 | | | 210,000 | | | | 208,469 | |
3.22% | | 11/28/23 | | | 200,000 | | | | 196,312 | |
BPCE S.A. | |
4.00% | | 04/15/24 | | | 250,000 | | | | 250,885 | |
Branch Banking & Trust Co. | |
2.10% | | 01/15/20 | | | 100,000 | | | | 98,526 | |
2.63% | | 01/15/22 | | | 100,000 | | | | 97,555 | |
Bristol-Myers Squibb Co. | |
2.00% | | 08/01/22 | | | 500,000 | | | | 476,745 | |
British Telecommunications PLC | |
9.63% | | 12/15/30 | | | 250,000 | | | | 356,398 | |
Broadcom Corp./Broadcom Cayman Finance Ltd. | |
2.20% | | 01/15/21 | | | 100,000 | | | | 96,845 | |
2.38% | | 01/15/20 | | | 100,000 | | | | 98,684 | |
2.65% | | 01/15/23 | | | 100,000 | | | | 94,303 | |
3.00% | | 01/15/22 | | | 100,000 | | | | 97,254 | |
3.13% | | 01/15/25 | | | 100,000 | | | | 92,730 | |
3.50% | | 01/15/28 | | | 100,000 | | | | 91,044 | |
3.63% | | 01/15/24 | | | 200,000 | | | | 193,592 | |
Broadridge Financial Solutions Inc. | |
3.40% | | 06/27/26 | | | 80,000 | | | | 75,937 | |
Brookfield Finance Inc. | |
3.90% | | 01/25/28 | | | 100,000 | | | | 94,521 | |
Brown-Forman Corp. | |
4.00% | | 04/15/38 | | | 30,000 | | | | 29,901 | |
Buckeye Partners LP | |
4.15% | | 07/01/23 | | | 250,000 | | | | 247,318 | |
Burlington Northern Santa Fe LLC | |
4.05% | | 06/15/48 | | | 75,000 | | | | 72,479 | |
5.75% | | 05/01/40 | | | 500,000 | | | | 596,860 | |
Campbell Soup Co. | |
3.65% | | 03/15/23 | | | 50,000 | | | | 49,072 | |
4.15% | | 03/15/28 | | | 50,000 | | | | 47,623 | |
4.80% | | 03/15/48 | | | 20,000 | | | | 18,070 | |
Canadian Imperial Bank of Commerce | |
2.10% | | 10/05/20 | | | 100,000 | | | | 97,518 | |
2.70% | | 02/02/21 | | | 40,000 | | | | 39,378 | |
Canadian National Railway Co. | |
2.95% | | 11/21/24 | | | 305,000 | | | | 296,823 | |
Canadian Natural Resources Ltd. | |
3.80% | | 04/15/24 | | | 250,000 | | | | 248,097 | |
3.85% | | 06/01/27 | | | 100,000 | | | | 97,512 | |
3.90% | | 02/01/25 | | | 250,000 | | | | 247,205 | |
Canadian Pacific Railway Co. | |
2.90% | | 02/01/25 | | | 250,000 | | | | 238,498 | |
Capital One Financial Corp. | |
2.50% | | 05/12/20 | | | 200,000 | | | | 196,994 | |
3.75% | | 07/28/26 - 03/09/27 | | | 430,000 | | | | 403,317 | |
4.20% | | 10/29/25 | | | 90,000 | | | | 87,476 | |
Cardinal Health Inc. | |
3.20% | | 03/15/23 | | | 500,000 | | | | 486,425 | |
Caterpillar Financial Services Corp. | |
2.00% | | 11/29/19 | | | 25,000 | | | | 24,684 | |
2.10% | | 01/10/20 | | | 100,000 | | | | 98,972 | |
2.55% | | 11/29/22 | | | 50,000 | | | | 48,368 | |
2.90% | | 03/15/21 | | | 100,000 | | | | 99,446 | |
3.25% | | 12/01/24 | | | 350,000 | | | | 344,736 | |
| | | | | | | | | | |
| | | | | Principal
Amount | | | Fair
Value | |
CBS Corp. | |
3.38% | | 03/01/22 | | $ | 250,000 | | | $ | 246,715 | |
4.00% | | 01/15/26 | | | 250,000 | | | | 242,717 | |
Celgene Corp. | |
2.75% | | 02/15/23 | | | 50,000 | | | | 47,773 | |
3.45% | | 11/15/27 | | | 50,000 | | | | 46,033 | |
4.35% | | 11/15/47 | | | 50,000 | | | | 44,120 | |
5.00% | | 08/15/45 | | | 150,000 | | | | 146,061 | |
5.25% | | 08/15/43 | | | 220,000 | | | | 223,626 | |
Celulosa Arauco y Constitucion S.A. | |
3.88% | | 11/02/27 | | | 200,000 | | | | 186,510 | |
Cenovus Energy Inc. | |
3.00% | | 08/15/22 | | | 35,000 | | | | 33,484 | |
4.25% | | 04/15/27 | | | 200,000 | | | | 192,766 | |
4.45% | | 09/15/42 | | | 75,000 | | | | 64,600 | |
5.70% | | 10/15/19 | | | 50,000 | | | | 51,313 | |
CenterPoint Energy Houston Electric LLC | |
4.50% | | 04/01/44 | | | 250,000 | | | | 267,600 | |
Charter Communications Operating LLC/Charter Communications Operating Capital | |
3.58% | | 07/23/20 | | | 200,000 | | | | 199,740 | |
4.46% | | 07/23/22 | | | 200,000 | | | | 202,360 | |
4.91% | | 07/23/25 | | | 235,000 | | | | 237,301 | |
6.48% | | 10/23/45 | | | 250,000 | | | | 263,715 | |
Chevron Corp. | |
2.19% | | 11/15/19 | | | 55,000 | | | | 54,613 | |
2.41% | | 03/03/22 | | | 145,000 | | | | 141,507 | |
2.43% | | 06/24/20 | | | 75,000 | | | | 74,375 | |
2.90% | | 03/03/24 | | | 300,000 | | | | 291,480 | |
2.95% | | 05/16/26 | | | 100,000 | | | | 95,919 | |
Chubb INA Holdings Inc. | |
2.70% | | 03/13/23 | | | 250,000 | | | | 242,060 | |
4.35% | | 11/03/45 | | | 200,000 | | | | 204,262 | |
Cintas Corporation No. 2 | |
3.70% | | 04/01/27 | | | 200,000 | | | | 196,252 | |
Cisco Systems Inc. | |
2.90% | | 03/04/21 | | | 125,000 | | | | 125,042 | |
5.90% | | 02/15/39 | | | 200,000 | | | | 247,462 | |
Citibank NA | |
2.13% | | 10/20/20 | | | 200,000 | | | | 194,754 | |
2.85% | | 02/12/21 | | | 250,000 | | | | 247,192 | |
Citigroup Inc. | |
2.45% | | 01/10/20 | | | 100,000 | | | | 98,892 | |
2.65% | | 10/26/20 | | | 450,000 | | | | 443,002 | |
2.70% | | 10/27/22 | | | 100,000 | | | | 96,043 | |
2.90% | | 12/08/21 | | | 200,000 | | | | 195,898 | |
3.88% | | 03/26/25 | | | 250,000 | | | | 242,467 | |
4.30% | | 11/20/26 | | | 200,000 | | | | 195,714 | |
4.45% | | 09/29/27 | | | 250,000 | | | | 245,690 | |
4.75% | | 05/18/46 | | | 200,000 | | | | 191,222 | |
5.88% | | 01/30/42 | | | 272,000 | | | | 313,156 | |
6.13% | | 08/25/36 | | | 255,000 | | | | 289,267 | |
Citigroup Inc. (3.52% fixed rate until 10/27/27; 1.15% + 3 month USD LIBOR thereafter) | |
3.52% | | 10/27/28 | | | 200,000 | | | | 187,638 | (e) |
Citizens Bank NA | |
2.25% | | 10/30/20 | | | 250,000 | | | | 243,500 | |
CME Group Inc. | |
3.00% | | 03/15/25 | | | 250,000 | | | | 241,507 | |
CNA Financial Corp. | |
5.88% | | 08/15/20 | | | 581,000 | | | | 610,027 | |
CNH Industrial Capital LLC | |
3.38% | | 07/15/19 | | | 15,000 | | | | 14,972 | |
3.88% | | 10/15/21 | | | 15,000 | | | | 14,840 | |
4.38% | | 11/06/20 - 04/05/22 | | | 35,000 | | | | 35,285 | |
4.88% | | 04/01/21 | | | 15,000 | | | | 15,394 | |
CNH Industrial N.V. | |
3.85% | | 11/15/27 | | | 15,000 | | | | 14,008 | |
Colgate-Palmolive Co. | |
3.25% | | 03/15/24 | | | 250,000 | | | | 250,242 | |
Comcast Corp. | |
3.15% | | 02/15/28 | | | 200,000 | | | | 184,790 | |
3.55% | | 05/01/28 | | | 100,000 | | | | 95,419 | |
3.90% | | 03/01/38 | | | 100,000 | | | | 90,889 | |
3.97% | | 11/01/47 | | | 100,000 | | | | 88,032 | |
4.00% | | 08/15/47 - 11/01/49 | | | 350,000 | | | | 308,837 | |
4.05% | | 11/01/52 | | | 100,000 | | | | 86,788 | |
See Notes to Schedules of Investments and Notes to Financial Statements.
| | |
| State Street Total Return V.I.S. Fund | | |
| Schedule of Investments | | June 30, 2018 (Unaudited) |
|
| | | | | | | | | | |
| | | | | Principal
Amount | | | Fair
Value | |
4.25% | | 01/15/33 | | $ | 500,000 | | | $ | 487,985 | |
5.15% | | 03/01/20 | | | 300,000 | | | | 309,465 | |
Commonwealth Bank of Australia | |
2.30% | | 09/06/19 | | | 350,000 | | | | 347,378 | |
Commonwealth Edison Co. | |
4.60% | | 08/15/43 | | | 250,000 | | | | 270,330 | |
4.70% | | 01/15/44 | | | 175,000 | | | | 189,311 | |
Compass Bank | |
3.88% | | 04/10/25 | | | 250,000 | | | | 241,637 | |
Concho Resources Inc. | |
4.30% | | 08/15/28 | | | 25,000 | | | | 25,098 | (f) |
4.85% | | 08/15/48 | | | 25,000 | | | | 25,364 | (f) |
ConocoPhillips | |
6.50% | | 02/01/39 | | | 500,000 | | | | 638,370 | |
Consolidated Edison Company of New York Inc. | |
3.88% | | 06/15/47 | | | 200,000 | | | | 187,636 | |
3.95% | | 03/01/43 | | | 250,000 | | | | 239,123 | |
Constellation Brands Inc. | |
3.50% | | 05/09/27 | | | 100,000 | | | | 94,712 | |
3.88% | | 11/15/19 | | | 15,000 | | | | 15,152 | |
4.75% | | 11/15/24 | | | 200,000 | | | | 207,664 | |
Consumers Energy Co. | |
4.05% | | 05/15/48 | | | 150,000 | | | | 150,069 | |
Continental Resources Inc. | |
3.80% | | 06/01/24 | | | 35,000 | | | | 34,153 | |
4.38% | | 01/15/28 | | | 35,000 | | | | 34,813 | |
4.50% | | 04/15/23 | | | 50,000 | | | | 50,715 | |
4.90% | | 06/01/44 | | | 25,000 | | | | 24,615 | |
5.00% | | 09/15/22 | | | 70,000 | | | | 70,910 | |
Cooperatieve Rabobank UA | |
2.50% | | 01/19/21 | | | 250,000 | | | | 245,067 | |
2.75% | | 01/10/22 | | | 100,000 | | | | 97,516 | |
3.95% | | 11/09/22 | | | 200,000 | | | | 198,514 | |
4.63% | | 12/01/23 | | | 250,000 | | | | 251,677 | |
Corning Inc. | |
2.90% | | 05/15/22 | | | 255,000 | | | | 251,101 | |
Corporation Andina de Fomento | |
2.13% | | 09/27/21 | | | 300,000 | | | | 288,702 | |
4.38% | | 06/15/22 | | | 250,000 | | | | 259,372 | |
Costco Wholesale Corp. | |
2.25% | | 02/15/22 | | | 85,000 | | | | 82,534 | |
3.00% | | 05/18/27 | | | 100,000 | | | | 95,614 | |
Council Of Europe Development Bank | |
2.63% | | 02/13/23 | | | 120,000 | | | | 118,404 | |
Credit Suisse AG | |
3.63% | | 09/09/24 | | | 250,000 | | | | 246,133 | |
Credit Suisse Group Funding Guernsey Ltd. | |
4.88% | | 05/15/45 | | | 250,000 | | | | 248,332 | |
Crown Castle International Corp. | |
3.15% | | 07/15/23 | | | 255,000 | | | | 244,127 | |
3.80% | | 02/15/28 | | | 100,000 | | | | 93,823 | |
CSX Corp. | |
2.60% | | 11/01/26 | | | 200,000 | | | | 180,648 | |
4.10% | | 03/15/44 | | | 318,000 | | | | 297,448 | |
CVS Health Corp. | |
2.75% | | 12/01/22 | | | 500,000 | | | | 479,915 | |
3.35% | | 03/09/21 | | | 95,000 | | | | 94,910 | |
3.38% | | 08/12/24 | | | 250,000 | | | | 241,397 | |
3.70% | | 03/09/23 | | | 115,000 | | | | 114,160 | |
4.10% | | 03/25/25 | | | 300,000 | | | | 298,494 | |
4.30% | | 03/25/28 | | | 110,000 | | | | 108,489 | |
4.78% | | 03/25/38 | | | 95,000 | | | | 93,806 | |
5.05% | | 03/25/48 | | | 415,000 | | | | 421,735 | |
Darden Restaurants Inc. | |
4.55% | | 02/15/48 | | | 15,000 | | | | 13,899 | |
Deere & Co. | | | | | | | | | | |
3.90% | | 06/09/42 | | | 171,000 | | | | 168,240 | |
Dell International LLC/EMC Corp. | |
6.02% | | 06/15/26 | | | 190,000 | | | | 199,656 | (d) |
8.10% | | 07/15/36 | | | 200,000 | | | | 233,834 | (d) |
Delmarva Power & Light Co. | |
4.15% | | 05/15/45 | | | 200,000 | | | | 199,118 | |
Delphi Corp. | | | | | | | | | | |
4.15% | | 03/15/24 | | | 150,000 | | | | 150,123 | |
Delta Air Lines Inc. | |
2.60% | | 12/04/20 | | | 45,000 | | | | 44,040 | |
| | | | | | | | | | |
| | | | | Principal
Amount | | | Fair
Value | |
3.80% | | 04/19/23 | | $ | 30,000 | | | $ | 29,659 | |
4.38% | | 04/19/28 | | | 50,000 | | | | 48,275 | |
Deutsche Bank AG | |
2.95% | | 08/20/20 | | | 250,000 | | | | 242,903 | |
3.30% | | 11/16/22 | | | 100,000 | | | | 93,750 | |
3.38% | | 05/12/21 | | | 250,000 | | | | 242,145 | |
3.95% | | 02/27/23 | | | 100,000 | | | | 95,944 | |
Deutsche Telekom International Finance BV | |
8.75% | | 06/15/30 | | | 250,000 | | | | 332,163 | |
Devon Energy Corp. | |
3.25% | | 05/15/22 | | | 500,000 | | | | 491,635 | |
5.00% | | 06/15/45 | | | 100,000 | | | | 101,601 | |
Diageo Investment Corp. | |
2.88% | | 05/11/22 | | | 500,000 | | | | 492,290 | |
Digital Realty Trust LP | |
4.45% | | 07/15/28 | | | 150,000 | | | | 150,868 | |
Discover Bank | |
4.20% | | 08/08/23 | | | 350,000 | | | | 353,136 | |
Discovery Communications LLC | |
3.25% | | 04/01/23 | | | 325,000 | | | | 314,834 | |
3.45% | | 03/15/25 | | | 135,000 | | | | 128,247 | |
3.90% | | 11/15/24 | | | 250,000 | | | | 245,970 | (d) |
Dollar General Corp. | |
4.13% | | 05/01/28 | | | 70,000 | | | | 68,613 | |
Dollar Tree Inc. | |
3.70% | | 05/15/23 | | | 20,000 | | | | 19,817 | |
4.00% | | 05/15/25 | | | 50,000 | | | | 48,894 | |
4.20% | | 05/15/28 | | | 25,000 | | | | 24,126 | |
Dominion Energy Inc. | |
2.58% | | 07/01/20 | | | 100,000 | | | | 98,572 | |
Dr Pepper Snapple Group Inc. | |
3.13% | | 12/15/23 | | | 200,000 | | | | 191,210 | |
3.43% | | 06/15/27 | | | 200,000 | | | | 185,474 | |
DTE Electric Co. | |
3.70% | | 03/15/45 | | | 145,000 | | | | 135,862 | |
DTE Energy Co. | |
3.85% | | 12/01/23 | | | 250,000 | | | | 251,098 | |
Duke Energy Carolinas LLC | |
3.05% | | 03/15/23 | | | 250,000 | | | | 247,597 | |
3.70% | | 12/01/47 | | | 50,000 | | | | 46,245 | |
3.95% | | 03/15/48 | | | 250,000 | | | | 242,717 | |
Duke Energy Corp. | |
3.05% | | 08/15/22 | | | 139,000 | | | | 136,762 | |
Duke Energy Florida LLC | |
2.10% | | 12/15/19 | | | 15,000 | | | | 14,911 | |
3.20% | | 01/15/27 | | | 300,000 | | | | 288,828 | |
3.40% | | 10/01/46 | | | 200,000 | | | | 176,928 | |
3.80% | | 07/15/28 | | | 50,000 | | | | 50,369 | |
Duke Realty LP | |
3.38% | | 12/15/27 | | | 50,000 | | | | 46,588 | |
Eaton Vance Corp. | |
3.50% | | 04/06/27 | | | 300,000 | | | | 291,843 | |
eBay Inc. | |
3.80% | | 03/09/22 | | | 145,000 | | | | 146,438 | |
Ecolab Inc. | |
2.38% | | 08/10/22 | | | 100,000 | | | | 96,358 | |
3.25% | | 12/01/27 | | | 70,000 | | | | 66,954 | |
Ecopetrol S.A. | |
4.13% | | 01/16/25 | | | 250,000 | | | | 241,970 | |
7.63% | | 07/23/19 | | | 345,000 | | | | 360,487 | |
Edison International | |
4.13% | | 03/15/28 | | | 50,000 | | | | 49,232 | |
EI du Pont de Nemours & Co. | |
2.20% | | 05/01/20 | | | 100,000 | | | | 98,584 | |
Eli Lilly & Co. | |
2.75% | | 06/01/25 | | | 45,000 | | | | 42,839 | |
Emera US Finance LP | |
3.55% | | 06/15/26 | | | 60,000 | | | | 56,629 | |
Emerson Electric Co. | |
2.63% | | 02/15/23 | | | 100,000 | | | | 96,789 | |
Enable Midstream Partners LP | |
4.95% | | 05/15/28 | | | 60,000 | | | | 58,578 | |
Enbridge Energy Partners LP | |
5.88% | | 10/15/25 | | | 125,000 | | | | 135,469 | |
Enbridge Inc. | |
3.50% | | 06/10/24 | | | 65,000 | | | | 62,973 | |
See Notes to Schedules of Investments and Notes to Financial Statements.
| | |
| State Street Total Return V.I.S. Fund | | |
| Schedule of Investments | | June 30, 2018 (Unaudited) |
|
| | | | | | | | | | |
| | | | | Principal
Amount | | | Fair
Value | |
Enel Chile S.A. | |
4.88% | | 06/12/28 | | $ | 50,000 | | | $ | 50,406 | |
Energy Transfer Partners LP | |
4.20% | | 09/15/23 | | | 25,000 | | | | 25,026 | |
4.95% | | 06/15/28 | | | 75,000 | | | | 74,978 | |
6.00% | | 06/15/48 | | | 50,000 | | | | 50,157 | |
6.50% | | 02/01/42 | | | 250,000 | | | | 260,095 | |
EnLink Midstream Partners LP | |
5.60% | | 04/01/44 | | | 150,000 | | | | 131,595 | |
Entergy Louisiana LLC | |
4.05% | | 09/01/23 | | | 250,000 | | | | 255,828 | |
Enterprise Products Operating LLC | |
2.80% | | 02/15/21 | | | 50,000 | | | | 49,413 | |
3.70% | | 02/15/26 | | | 35,000 | | | | 34,328 | |
3.90% | | 02/15/24 | | | 175,000 | | | | 175,702 | |
4.25% | | 02/15/48 | | | 25,000 | | | | 23,239 | |
4.45% | | 02/15/43 | | | 442,000 | | | | 419,436 | |
Enterprise Products Operating LLC (5.38% fixed rate until 02/15/28; 2.57% + 3 month USD LIBOR thereafter) | |
5.38% | | 02/15/78 | | | 50,000 | | | | 45,957 | (e) |
EOG Resources Inc. | |
2.45% | | 04/01/20 | | | 175,000 | | | | 172,987 | |
3.15% | | 04/01/25 | | | 80,000 | | | | 76,911 | |
EPR Properties | |
4.95% | | 04/15/28 | | | 100,000 | | | | 97,586 | |
EQT Corp. | |
3.90% | | 10/01/27 | | | 150,000 | | | | 139,950 | |
Equinor ASA | |
2.45% | | 01/17/23 | | | 750,000 | | | | 722,445 | |
ERP Operating LP (REIT) | |
3.00% | | 04/15/23 | | | 250,000 | | | | 244,260 | |
Essex Portfolio LP | |
3.63% | | 05/01/27 | | | 300,000 | | | | 286,749 | |
European Bank for Reconstruction & Development | |
1.13% | | 08/24/20 | | | 200,000 | | | | 193,452 | |
1.63% | | 05/05/20 | | | 400,000 | | | | 392,508 | |
European Investment Bank | |
1.38% | | 09/15/21 | | | 500,000 | | | | 477,625 | |
1.63% | | 12/15/20 | | | 1,000,000 | | | | 973,590 | |
2.00% | | 12/15/22 | | | 200,000 | | | | 192,470 | |
2.38% | | 05/13/21 | | | 250,000 | | | | 247,027 | |
3.25% | | 01/29/24 | | | 500,000 | | | | 506,745 | |
Eversource Energy | |
2.90% | | 10/01/24 | | | 100,000 | | | | 94,956 | |
3.15% | | 01/15/25 | | | 125,000 | | | | 121,321 | |
Exelon Generation Company LLC | |
2.95% | | 01/15/20 | | | 250,000 | | | | 249,067 | |
Export-Import Bank of Korea | |
2.38% | | 08/12/19 | | | 500,000 | | | | 496,455 | |
Express Scripts Holding Co. | |
4.75% | | 11/15/21 | | | 474,000 | | | | 489,272 | |
Exxon Mobil Corp. | |
2.71% | | 03/06/25 | | | 250,000 | | | | 240,380 | |
3.04% | | 03/01/26 | | | 50,000 | | | | 48,676 | |
3.18% | | 03/15/24 | | | 250,000 | | | | 248,690 | |
FedEx Corp. | |
3.40% | | 02/15/28 | | | 100,000 | | | | 95,124 | |
4.05% | | 02/15/48 | | | 100,000 | | | | 90,069 | |
4.75% | | 11/15/45 | | | 195,000 | | | | 194,589 | |
Fibria Overseas Finance Ltd. | |
4.00% | | 01/14/25 | | | 50,000 | | | | 46,161 | |
Fidelity National Information Services Inc. | |
4.25% | | 05/15/28 | | | 80,000 | | | | 79,837 | |
4.75% | | 05/15/48 | | | 100,000 | | | | 96,477 | |
Fifth Third Bank | |
2.20% | | 10/30/20 | | | 200,000 | | | | 195,486 | |
2.88% | | 10/01/21 | | | 230,000 | | | | 226,998 | |
FirstEnergy Corp. | |
4.25% | | 03/15/23 | | | 30,000 | | | | 30,443 | |
7.38% | | 11/15/31 | | | 55,000 | | | | 71,303 | |
Florida Power & Light Co. | |
4.13% | | 02/01/42 | | | 500,000 | | | | 504,775 | |
FMS Wertmanagement | |
1.75% | | 01/24/20 | | | 200,000 | | | | 197,220 | |
2.00% | | 08/01/22 | | | 200,000 | | | | 193,122 | |
| | | | | | | | | | |
| | | | | Principal
Amount | | | Fair
Value | |
Ford Motor Co. | |
4.35% | | 12/08/26 | | $ | 200,000 | | | $ | 195,784 | |
4.75% | | 01/15/43 | | | 250,000 | | | | 216,130 | |
5.29% | | 12/08/46 | | | 300,000 | | | | 277,947 | |
Ford Motor Credit Company LLC | |
2.46% | | 03/27/20 | | | 250,000 | | | | 246,090 | |
2.60% | | 11/04/19 | | | 250,000 | | | | 247,745 | |
2.68% | | 01/09/20 | | | 100,000 | | | | 99,076 | |
3.22% | | 01/09/22 | | | 250,000 | | | | 244,485 | |
GATX Corp. | |
3.50% | | 03/15/28 | | | 100,000 | | | | 92,272 | |
GE Capital International Funding Company Unlimited Co. | |
2.34% | | 11/15/20 | | | 500,000 | | | | 488,670 | |
General Dynamics Corp. | |
3.00% | | 05/11/21 | | | 50,000 | | | | 49,833 | |
3.38% | | 05/15/23 | | | 50,000 | | | | 50,104 | |
3.75% | | 05/15/28 | | | 55,000 | | | | 55,543 | |
General Electric Co. | |
5.50% | | 01/08/20 | | | 500,000 | | | | 518,110 | |
6.75% | | 03/15/32 | | | 300,000 | | | | 367,749 | |
General Mills Inc. | |
3.65% | | 02/15/24 | | | 250,000 | | | | 246,513 | |
General Motors Co. | |
5.20% | | 04/01/45 | | | 250,000 | | | | 230,632 | |
General Motors Financial Company Inc. | |
2.45% | | 11/06/20 | | | 100,000 | | | | 97,689 | |
3.15% | | 01/15/20 | | | 150,000 | | | | 149,764 | |
3.25% | | 01/05/23 | | | 50,000 | | | | 48,370 | |
3.45% | | 01/14/22 | | | 100,000 | | | | 98,673 | |
3.50% | | 11/07/24 | | | 100,000 | | | | 95,181 | |
3.70% | | 05/09/23 | | | 200,000 | | | | 196,420 | |
3.85% | | 01/05/28 | | | 250,000 | | | | 232,353 | |
4.35% | | 01/17/27 | | | 100,000 | | | | 96,990 | |
4.38% | | 09/25/21 | | | 100,000 | | | | 101,938 | |
5.25% | | 03/01/26 | | | 155,000 | | | | 160,284 | |
Georgia Power Co. | |
4.30% | | 03/15/42 | | | 472,000 | | | | 470,660 | |
Georgia-Pacific LLC | |
8.88% | | 05/15/31 | | | 150,000 | | | | 219,160 | |
Gilead Sciences Inc. | |
3.70% | | 04/01/24 | | | 500,000 | | | | 500,835 | |
4.80% | | 04/01/44 | | | 250,000 | | | | 259,585 | |
GlaxoSmithKline Capital Inc. | |
3.38% | | 05/15/23 | | | 100,000 | | | | 99,978 | |
3.63% | | 05/15/25 | | | 55,000 | | | | 54,981 | |
3.88% | | 05/15/28 | | | 100,000 | | | | 100,895 | |
GlaxoSmithKline Capital PLC | |
3.13% | | 05/14/21 | | | 70,000 | | | | 70,062 | |
Great Plains Energy Inc. | |
4.85% | | 06/01/21 | | | 204,000 | | | | 209,412 | |
Halliburton Co. | |
3.50% | | 08/01/23 | | | 400,000 | | | | 398,712 | |
Harris Corp. | |
3.83% | | 04/27/25 | | | 250,000 | | | | 245,265 | |
4.85% | | 04/27/35 | | | 40,000 | | | | 40,933 | |
HCP Inc. (REIT) | |
2.63% | | 02/01/20 | | | 500,000 | | | | 493,880 | |
Hewlett Packard Enterprise Co. | |
6.35% | | 10/15/45 | | | 250,000 | | | | 248,225 | |
Honeywell International Inc. | |
3.35% | | 12/01/23 | | | 300,000 | | | | 302,391 | |
Hospitality Properties Trust | |
4.65% | | 03/15/24 | | | 250,000 | | | | 250,282 | |
HP Inc. | | | | | | | | | | |
6.00% | | 09/15/41 | | | 262,000 | | | | 266,525 | |
HSBC Bank USA NA | | | | | | | | |
5.88% | | 11/01/34 | | | 500,000 | | | | 568,600 | |
HSBC Holdings PLC | | | | | | | | |
3.90% | | 05/25/26 | | | 250,000 | | | | 244,115 | |
5.10% | | 04/05/21 | | | 500,000 | | | | 522,395 | |
HSBC Holdings PLC (3.95% fixed rate until 05/18/23; 0.99% + 3 month USD LIBOR thereafter) | |
3.95% | | 05/18/24 | | | 200,000 | | | | 199,330 | (e) |
HSBC USA Inc. | | | | | |
2.38% | | 11/13/19 | | | 350,000 | | | | 346,913 | |
Hubbell Inc. | | | | | | | | |
3.50% | | 02/15/28 | | | 50,000 | | | | 47,710 | |
See Notes to Schedules of Investments and Notes to Financial Statements.
| | |
| State Street Total Return V.I.S. Fund | | |
| Schedule of Investments | | June 30, 2018 (Unaudited) |
|
| | | | | | | | | | |
| | | | | Principal
Amount | | | Fair
Value | |
Humana Inc. | |
2.50% | | 12/15/20 | | $ | 50,000 | | | $ | 49,095 | |
2.90% | | 12/15/22 | | | 100,000 | | | | 97,238 | |
Huntington Bancshares Inc. | |
3.15% | | 03/14/21 | | | 250,000 | | | | 248,738 | |
Husky Energy Inc. | |
4.00% | | 04/15/24 | | | 100,000 | | | | 100,022 | |
IBM Credit LLC | |
2.65% | | 02/05/21 | | | 200,000 | | | | 197,990 | |
Illinois Tool Works Inc. | |
2.65% | | 11/15/26 | | | 200,000 | | | | 184,760 | |
3.50% | | 03/01/24 | | | 250,000 | | | | 252,392 | |
Indiana Michigan Power Co. | |
3.85% | | 05/15/28 | | | 25,000 | | | | 24,967 | |
ING Groep N.V. | |
3.95% | | 03/29/27 | | | 200,000 | | | | 195,472 | |
Ingersoll-Rand Global Holding Company Ltd. | |
4.25% | | 06/15/23 | | | 200,000 | | | | 205,874 | |
Intel Corp. | |
2.60% | | 05/19/26 | | | 250,000 | | | | 233,270 | |
4.10% | | 05/11/47 | | | 100,000 | | | | 99,829 | |
Inter-American Development Bank | |
1.25% | | 09/14/21 | | | 400,000 | | | | 380,908 | |
2.13% | | 01/15/25 | | | 200,000 | | | | 190,030 | |
2.38% | | 07/07/27 | | | 200,000 | | | | 190,068 | |
3.00% | | 02/21/24 | | | 500,000 | | | | 501,310 | |
International Bank for Reconstruction & Development | |
0.88% | | 08/15/19 | | | 500,000 | | | | 491,055 | |
1.63% | | 09/04/20 | | | 400,000 | | | | 391,236 | |
1.88% | | 04/21/20 | | | 500,000 | | | | 493,300 | |
2.00% | | 01/26/22 | | | 500,000 | | | | 485,750 | |
2.25% | | 06/24/21 | | | 500,000 | | | | 492,465 | |
2.50% | | 07/29/25 | | | 500,000 | | | | 485,395 | |
International Business Machines Corp. | |
2.50% | | 01/27/22 | | | 300,000 | | | | 293,196 | |
4.00% | | 06/20/42 | | | 500,000 | | | | 488,310 | |
International Finance Corp. | |
2.00% | | 10/24/22 | | | 200,000 | | | | 193,018 | |
2.13% | | 04/07/26 | | | 300,000 | | | | 282,270 | |
International Paper Co. | |
3.65% | | 06/15/24 | | | 500,000 | | | | 493,480 | |
Invesco Finance PLC | |
3.13% | | 11/30/22 | | | 200,000 | | | | 197,304 | |
Jabil Inc. | |
3.95% | | 01/12/28 | | | 200,000 | | | | 190,990 | |
4.70% | | 09/15/22 | | | 223,000 | | | | 229,746 | |
Jefferies Group LLC | |
5.13% | | 01/20/23 | | | 250,000 | | | | 260,053 | |
John Deere Capital Corp. | |
2.35% | | 01/08/21 | | | 100,000 | | | | 98,288 | |
2.70% | | 01/06/23 | | | 100,000 | | | | 97,471 | |
2.88% | | 03/12/21 | | | 50,000 | | | | 49,685 | |
3.05% | | 01/06/28 | | | 100,000 | | | | 95,017 | |
3.45% | | 06/07/23 - 03/13/25 | | | 75,000 | | | | 74,790 | |
Johnson & Johnson | |
1.95% | | 11/10/20 | | | 15,000 | | | | 14,751 | |
2.45% | | 12/05/21 - 03/01/26 | | | 425,000 | | | | 416,206 | |
2.90% | | 01/15/28 | | | 50,000 | | | | 47,783 | |
3.40% | | 01/15/38 | | | 25,000 | | | | 23,624 | |
3.50% | | 01/15/48 | | | 30,000 | | | | 27,962 | |
4.38% | | 12/05/33 | | | 250,000 | | | | 268,855 | |
Johnson Controls International PLC | |
3.63% | | 07/02/24 | | | 80,000 | | | | 78,859 | (g) |
JPMorgan Chase & Co. | |
2.25% | | 01/23/20 | | | 250,000 | | | | 246,772 | |
2.75% | | 06/23/20 | | | 250,000 | | | | 247,935 | |
2.97% | | 01/15/23 | | | 200,000 | | | | 194,718 | |
3.13% | | 01/23/25 | | | 250,000 | | | | 239,237 | |
3.25% | | 09/23/22 | | | 236,000 | | | | 233,619 | |
3.38% | | 05/01/23 | | | 250,000 | | | | 244,115 | |
4.50% | | 01/24/22 | | | 703,000 | | | | 727,345 | |
6.40% | | 05/15/38 | | | 500,000 | | | | 616,665 | |
JPMorgan Chase & Co. (3.51% fixed rate until 06/18/21; 0.61% + 3 month USD LIBOR thereafter) | |
3.51% | | 06/18/22 | | | 100,000 | | | | 100,154 | (e) |
| | | | | | | | | | |
| | | | | Principal
Amount | | | Fair
Value | |
JPMorgan Chase & Co. (3.56% fixed rate until 04/23/23; 0.73% + 3 month USD LIBOR thereafter) | |
3.56% | | 04/23/24 | | $ | 300,000 | | | $ | 297,207 | (e) |
JPMorgan Chase & Co. (3.90% fixed rate until 01/23/48; 1.22% + 3 month USD LIBOR thereafter) | |
3.90% | | 01/23/49 | | | 300,000 | | | | 270,063 | (e) |
JPMorgan Chase Bank NA (2.60% fixed rate until 02/01/20; 0.28% + 3 month USD LIBOR thereafter) | |
2.60% | | 02/01/21 | | | 250,000 | | | | 247,790 | (e) |
Kaiser Foundation Hospitals | |
4.15% | | 05/01/47 | | | 100,000 | | | | 101,150 | |
Kansas City Power & Light Co. | |
4.20% | | 06/15/47 | | | 200,000 | | | | 199,362 | |
Kansas City Southern | |
4.70% | | 05/01/48 | | | 50,000 | | | | 48,481 | |
Kellogg Co. | | | | | | | | | | |
2.65% | | 12/01/23 | | | 200,000 | | | | 190,270 | |
Kennametal Inc. | |
4.63% | | 06/15/28 | | | 25,000 | | | | 24,949 | |
Key Bank | |
3.38% | | 03/07/23 | | | 250,000 | | | | 247,520 | |
KeyCorp | |
2.90% | | 09/15/20 | | | 125,000 | | | | 123,975 | |
Kilroy Realty LP | |
3.45% | | 12/15/24 | | | 50,000 | | | | 48,014 | |
Kimberly-Clark Corp. | |
3.20% | | 07/30/46 | | | 125,000 | | | | 107,742 | |
Kinder Morgan Energy Partners LP | |
5.00% | | 08/15/42 | | | 442,000 | | | | 409,898 | |
Kinder Morgan Inc. | |
4.30% | | 06/01/25 | | | 115,000 | | | | 114,648 | |
5.05% | | 02/15/46 | | | 150,000 | | | | 141,824 | |
5.30% | | 12/01/34 | | | 300,000 | | | | 294,873 | |
KLA-Tencor Corp. | |
4.65% | | 11/01/24 | | | 215,000 | | | | 222,357 | |
Kraft Heinz Foods Co. | |
3.38% | | 06/15/21 | | | 15,000 | | | | 15,041 | |
4.00% | | 06/15/23 | | | 100,000 | | | | 99,790 | |
4.63% | | 01/30/29 | | | 50,000 | | | | 49,647 | |
5.00% | | 06/04/42 | | | 300,000 | | | | 287,472 | |
5.20% | | 07/15/45 | | | 150,000 | | | | 146,185 | |
Kreditanstalt fuer Wiederaufbau | |
1.50% | | 09/09/19 - 06/15/21 | | | 800,000 | | | | 778,020 | |
1.63% | | 05/29/20 | | | 300,000 | | | | 294,084 | |
1.75% | | 03/31/20 - 09/15/21 | | | 700,000 | | | | 683,698 | |
1.88% | | 12/15/20 | | | 150,000 | | | | 146,893 | |
2.00% | | 09/29/22 - 05/02/25 | | | 950,000 | | | | 910,076 | |
2.13% | | 03/07/22 - 06/15/22 | | | 600,000 | | | | 584,094 | |
2.63% | | 04/12/21 | | | 150,000 | | | | 149,317 | |
2.88% | | 04/03/28 | | | 175,000 | | | | 173,064 | |
L3 Technologies Inc. | |
3.85% | | 12/15/26 | | | 200,000 | | | | 192,850 | |
Laboratory Corporation of America Holdings | |
4.00% | | 11/01/23 | | | 200,000 | | | | 202,406 | |
Lam Research Corp. | |
3.80% | | 03/15/25 | | | 115,000 | | | | 114,499 | |
Landwirtschaftliche Rentenbank | |
2.50% | | 11/15/27 | | | 200,000 | | | | 191,344 | |
Leggett & Platt Inc. | |
3.50% | | 11/15/27 | | | 50,000 | | | | 47,093 | |
Lincoln National Corp. | |
3.63% | | 12/12/26 | | | 200,000 | | | | 190,354 | |
4.20% | | 03/15/22 | | | 317,000 | | | | 324,507 | |
Lloyds Bank PLC | |
2.70% | | 08/17/20 | | | 250,000 | | | | 245,630 | |
Lloyds Banking Group PLC | |
3.00% | | 01/11/22 | | | 100,000 | | | | 97,353 | |
4.45% | | 05/08/25 | | | 200,000 | | | | 201,298 | |
4.65% | | 03/24/26 | | | 250,000 | | | | 246,195 | |
Lockheed Martin Corp. | |
3.60% | | 03/01/35 | | | 55,000 | | | | 51,355 | |
4.25% | | 11/15/19 | | | 300,000 | | | | 305,643 | |
4.70% | | 05/15/46 | | | 250,000 | | | | 264,583 | |
Loews Corp. | |
2.63% | | 05/15/23 | | | 400,000 | | | | 385,352 | |
See Notes to Schedules of Investments and Notes to Financial Statements.
| | |
| State Street Total Return V.I.S. Fund | | |
| Schedule of Investments | | June 30, 2018 (Unaudited) |
|
| | | | | | | | | | |
| | | | | Principal
Amount | | | Fair
Value | |
Lowe’s Companies Inc. | | | | | |
2.50% | | 04/15/26 | | $ | 230,000 | | | $ | 210,471 | |
3.12% | | 04/15/22 | | | 200,000 | | | | 199,676 | |
3.38% | | 09/15/25 | | | 30,000 | | | | 29,409 | |
4.05% | | 05/03/47 | | | 100,000 | | | | 94,809 | |
LYB International Finance II BV | | | | | |
3.50% | | 03/02/27 | | | 100,000 | | | | 94,002 | |
LyondellBasell Industries N.V. | | | | | |
6.00% | | 11/15/21 | | | 250,000 | | | | 267,465 | |
Macy’s Retail Holdings Inc. | | | | | |
3.88% | | 01/15/22 | | | 500,000 | | | | 496,595 | |
Maple Escrow Subsidiary Inc. | | | | | |
4.60% | | 05/25/28 | | | 50,000 | | | | 50,182 | (d) |
4.99% | | 05/25/38 | | | 25,000 | | | | 25,164 | (d) |
Markel Corp. | | | | | | | | |
3.50% | | 11/01/27 | | | 50,000 | | | | 46,531 | |
Marriott International Inc. | | | | | |
4.00% | | 04/15/28 | | | 150,000 | | | | 146,673 | |
Marsh & McLennan Companies Inc. | | | | | |
4.20% | | 03/01/48 | | | 100,000 | | | | 97,078 | |
Martin Marietta Materials Inc. | | | | | |
3.50% | | 12/15/27 | | | 50,000 | | | | 46,332 | |
Masco Corp. | | | | | | | | |
3.50% | | 04/01/21 | | | 60,000 | | | | 59,889 | |
4.38% | | 04/01/26 | | | 40,000 | | | | 39,727 | |
Mastercard Inc. | | | | | | | | |
2.00% | | 11/21/21 | | | 200,000 | | | | 194,010 | |
2.95% | | 11/21/26 | | | 200,000 | | | | 191,060 | |
McDonald’s Corp. | | | | | | | | |
3.70% | | 02/15/42 | | | 250,000 | | | | 222,005 | |
McKesson Corp. | | | | | | | | |
3.80% | | 03/15/24 | | | 250,000 | | | | 246,467 | |
Mead Johnson Nutrition Co. | | | | | |
4.13% | | 11/15/25 | | | 110,000 | | | | 112,278 | |
Medtronic Inc. | | | | | | | | |
3.63% | | 03/15/24 | | | 200,000 | | | | 200,704 | |
4.50% | | 03/15/42 | | | 250,000 | | | | 258,498 | |
4.63% | | 03/15/44 - 03/15/45 | | | 400,000 | | | | 422,276 | |
Memorial Sloan-Kettering Cancer Center | | | | | |
4.13% | | 07/01/52 | | | 395,000 | | | | 398,385 | |
Merck & Company Inc. | | | | | | | | |
2.40% | | 09/15/22 | | | 878,000 | | | | 851,493 | |
2.75% | | 02/10/25 | | | 70,000 | | | | 66,915 | |
MetLife Inc. | | | | | | | | |
4.13% | | 08/13/42 | | | 250,000 | | | | 235,683 | |
6.50% | | 12/15/32 | | | 250,000 | | | | 309,625 | |
Microsoft Corp. | | | | | | | | |
1.10% | | 08/08/19 | | | 200,000 | | | | 196,810 | |
1.55% | | 08/08/21 | | | 300,000 | | | | 287,775 | |
2.40% | | 02/06/22 - 08/08/26 | | | 500,000 | | | | 478,440 | |
2.88% | | 02/06/24 | | | 300,000 | | | | 294,042 | |
3.45% | | 08/08/36 | | | 200,000 | | | | 191,976 | |
3.50% | | 02/12/35 | | | 65,000 | | | | 63,103 | |
3.75% | | 05/01/43 | | | 300,000 | | | | 292,926 | |
4.45% | | 11/03/45 | | | 425,000 | | | | 460,700 | |
Mid-America Apartments LP | | | | | |
4.20% | | 06/15/28 | | | 100,000 | | | | 99,904 | |
Mitsubishi UFJ Financial Group Inc. | | | | | |
2.76% | | 09/13/26 | | | 250,000 | | | | 229,840 | |
3.46% | | 03/02/23 | | | 100,000 | | | | 99,088 | |
3.78% | | 03/02/25 | | | 100,000 | | | | 99,647 | |
3.96% | | 03/02/28 | | | 100,000 | | | | 100,410 | |
Mizuho Financial Group Inc. | | | | | | | | |
3.55% | | 03/05/23 | | | 200,000 | | | | 198,656 | |
4.02% | | 03/05/28 | | | 200,000 | | | | 200,496 | |
Molson Coors Brewing Co. | | | | | |
3.00% | | 07/15/26 | | | 95,000 | | | | 86,437 | |
Mondelez International Inc. | | | | | |
4.13% | | 05/07/28 | | | 100,000 | | | | 98,960 | |
Monsanto Co. | | | | | | | | |
3.95% | | 04/15/45 | | | 150,000 | | | | 131,014 | |
4.20% | | 07/15/34 | | | 70,000 | | | | 65,099 | |
Moody’s Corp. | | | | | | | | |
4.88% | | 02/15/24 | | | 250,000 | | | | 262,417 | |
Morgan Stanley | | | | | | | | |
2.38% | | 07/23/19 | | | 350,000 | | | | 348,110 | |
2.63% | | 11/17/21 | | | 200,000 | | | | 194,528 | |
| | | | | | | | | | |
| | | | | Principal
Amount | | | Fair
Value | |
2.80% | | 06/16/20 | | $ | 230,000 | | | $ | 228,109 | |
3.13% | | 01/23/23 - 07/27/26 | | | 350,000 | | | | 330,204 | |
3.95% | | 04/23/27 | | | 250,000 | | | | 238,677 | |
4.00% | | 07/23/25 | | | 95,000 | | | | 94,709 | |
4.10% | | 05/22/23 | | | 250,000 | | | | 251,292 | |
4.35% | | 09/08/26 | | | 250,000 | | | | 246,672 | |
4.88% | | 11/01/22 | | | 250,000 | | | | 259,375 | |
5.50% | | 07/28/21 | | | 398,000 | | | | 421,100 | |
Morgan Stanley (3.74% fixed rate until 04/24/23; 0.84% + 3 month USD LIBOR thereafter) | |
3.74% | | 04/24/24 | | | 160,000 | | | | 159,314 | (e) |
Morgan Stanley (3.77% fixed rate until 01/24/28; 1.14% + 3 month USD LIBOR thereafter) | |
3.77% | | 01/24/29 | | | 100,000 | | | | 96,424 | (e) |
Morgan Stanley (4.46% fixed rate until 04/22/38; 1.43% + 3 month USD LIBOR thereafter) | |
4.46% | | 04/22/39 | | | 100,000 | | | | 98,035 | (e) |
Motorola Solutions Inc. | | | | | | | | |
3.50% | | 09/01/21 | | | 250,000 | | | | 248,040 | |
4.60% | | 02/23/28 | | | 200,000 | | | | 198,818 | |
MPLX LP | | | | | | | | |
4.00% | | 03/15/28 | | | 35,000 | | | | 33,304 | |
4.50% | | 04/15/38 | | | 30,000 | | | | 27,761 | |
4.70% | | 04/15/48 | | | 25,000 | | | | 23,210 | |
4.90% | | 04/15/58 | | | 25,000 | | | | 22,336 | |
MUFG Americas Holdings Corp. | | | | | |
3.00% | | 02/10/25 | | | 250,000 | | | | 239,035 | |
Mylan Inc. | | | | | | | | |
4.55% | | 04/15/28 | | | 100,000 | | | | 97,685 | (d) |
5.20% | | 04/15/48 | | | 100,000 | | | | 96,639 | (d) |
National Australia Bank Ltd. | | | | | |
2.13% | | 05/22/20 | | | 250,000 | | | | 245,295 | |
2.25% | | 01/10/20 | | | 100,000 | | | | 98,745 | |
2.80% | | 01/10/22 | | | 100,000 | | | | 97,745 | |
National Retail Properties Inc. | | | | | |
3.60% | | 12/15/26 | | | 200,000 | | | | 189,442 | |
National Rural Utilities Cooperative Finance Corp. | |
2.90% | | 03/15/21 | | | 70,000 | | | | 69,490 | |
3.40% | | 02/07/28 | | | 200,000 | | | | 194,534 | |
NetApp Inc. | | | | | | | | |
3.38% | | 06/15/21 | | | 210,000 | | | | 208,664 | |
Newmont Mining Corp. | | | | | | | | |
3.50% | | 03/15/22 | | | 250,000 | | | | 248,747 | |
Nexen Energy ULC | | | | | | | | |
6.40% | | 05/15/37 | | | 500,000 | | | | 612,175 | |
NIKE Inc. | | | | | | | | |
2.38% | | 11/01/26 | | | 250,000 | | | | 227,515 | |
NiSource Inc. | | | | | | | | |
2.65% | | 11/17/22 | | | 40,000 | | | | 38,612 | |
3.65% | | 06/15/23 | | | 100,000 | | | | 100,142 | (d) |
4.38% | | 05/15/47 | | | 100,000 | | | | 97,944 | |
Nordic Investment Bank | | | | | | | | |
2.25% | | 02/01/21 | | | 200,000 | | | | 197,468 | |
Norfolk Southern Corp. | | | | | | | | |
3.94% | | 11/01/47 | | | 160,000 | | | | 148,016 | |
4.15% | | 02/28/48 | | | 100,000 | | | | 95,821 | |
Northrop Grumman Corp. | | | | | |
2.08% | | 10/15/20 | | | 160,000 | | | | 156,360 | |
2.55% | | 10/15/22 | | | 100,000 | | | | 96,407 | |
2.93% | | 01/15/25 | | | 150,000 | | | | 142,395 | |
3.25% | | 01/15/28 | | | 165,000 | | | | 155,333 | |
4.03% | | 10/15/47 | | | 175,000 | | | | 163,809 | |
Northwestern University | | | | | | | | |
3.66% | | 12/01/57 | | | 10,000 | | | | 9,570 | |
Novartis Capital Corp. | | | | | | | | |
2.40% | | 09/21/22 | | | 552,000 | | | | 535,628 | |
3.00% | | 11/20/25 | | | 250,000 | | | | 241,012 | |
NSTAR Electric Co. | | | | | | | | |
3.20% | | 05/15/27 | | | 100,000 | | | | 95,960 | |
Nutrien Ltd. | | | | | | | | |
3.63% | | 03/15/24 | | | 250,000 | | | | 242,580 | |
4.00% | | 12/15/26 | | | 200,000 | | | | 193,210 | |
O’Reilly Automotive Inc. | | | | | |
4.35% | | 06/01/28 | | | 100,000 | | | | 99,473 | |
Occidental Petroleum Corp. | | | | | |
3.00% | | 02/15/27 | | | 200,000 | | | | 189,602 | |
See Notes to Schedules of Investments and Notes to Financial Statements.
| | |
| State Street Total Return V.I.S. Fund | | |
Schedule of Investments | | June 30, 2018 (Unaudited) |
| | | | | | | | | | |
| | | | | Principal
Amount | | | Fair
Value | |
3.40% | | 04/15/26 | | $ | 140,000 | | | $ | 136,660 | |
4.10% | | 02/15/47 | | | 200,000 | | | | 196,072 | |
Oesterreichische Kontrollbank AG | | | | | | | | |
1.75% | | 01/24/20 | | | 200,000 | | | | 197,250 | |
Ohio Power Co. | | | | | | | | |
4.15% | | 04/01/48 | | | 100,000 | | | | 100,598 | |
Omega Healthcare Investors Inc. | | | | | | | | |
4.50% | | 04/01/27 | | | 200,000 | | | | 190,914 | |
Omnicom Group Inc./Omnicom Capital Inc. | |
3.63% | | 05/01/22 | | | 200,000 | | | | 198,986 | |
ONEOK Partners LP | | | | | | | | |
6.13% | | 02/01/41 | | | 312,000 | | | | 343,811 | |
Oracle Corp. | | | | | | | | |
1.90% | | 09/15/21 | | | 200,000 | | | | 192,340 | |
2.25% | | 10/08/19 | | | 250,000 | | | | 248,535 | |
2.65% | | 07/15/26 | | | 300,000 | | | | 276,921 | |
3.25% | | 05/15/30 | | | 250,000 | | | | 236,495 | |
3.63% | | 07/15/23 | | | 125,000 | | | | 126,261 | |
4.00% | | 07/15/46 | | | 200,000 | | | | 188,872 | |
4.30% | | 07/08/34 | | | 500,000 | | | | 509,485 | |
Orange S.A. | | | | | | | | |
9.00% | | 03/01/31 | | | 250,000 | | | | 343,177 | |
Owens Corning | | | | | | | | |
4.20% | | 12/15/22 | | | 250,000 | | | | 250,783 | |
PACCAR Financial Corp. | | | | | | | | |
2.05% | | 11/13/20 | | | 50,000 | | | | 48,904 | |
3.10% | | 05/10/21 | | | 20,000 | | | | 20,039 | |
Pacific Gas & Electric Co. | | | | | | | | |
6.05% | | 03/01/34 | | | 411,000 | | | | 443,444 | |
PacifiCorp | | | | | | | | |
6.25% | | 10/15/37 | | | 153,000 | | | | 195,913 | |
Packaging Corporation of America | | | | | |
2.45% | | 12/15/20 | | | 70,000 | | | | 68,690 | |
3.40% | | 12/15/27 | | | 35,000 | | | | 33,041 | |
Parker-Hannifin Corp. | | | | | | | | |
4.20% | | 11/21/34 | | | 350,000 | | | | 356,738 | |
Patterson-UTI Energy Inc. | | | | | |
3.95% | | 02/01/28 | | | 200,000 | | | | 187,456 | (d) |
Pepsi-Cola Metropolitan Bottling Company Inc. | | | | | |
7.00% | | 03/01/29 | | | 150,000 | | | | 191,137 | |
PepsiCo Inc. | | | | | | | | |
1.85% | | 04/30/20 | | | 250,000 | | | | 245,600 | |
2.00% | | 04/15/21 | | | 100,000 | | | | 97,388 | |
2.75% | | 03/01/23 | | | 250,000 | | | | 244,463 | |
3.00% | | 10/15/27 | | | 100,000 | | | | 94,998 | |
4.45% | | 04/14/46 | | | 250,000 | | | | 262,412 | |
Petroleos Mexicanos | | | | | | | | |
4.50% | | 01/23/26 | | | 100,000 | | | | 93,347 | |
5.38% | | 03/13/22 | | | 300,000 | | | | 307,332 | |
5.50% | | 01/21/21 - 06/27/44 | | | 558,000 | | | | 562,870 | |
6.38% | | 01/23/45 | | | 250,000 | | | | 229,492 | |
6.50% | | 03/13/27 - 06/02/41 | | | 567,000 | | | | 565,860 | |
6.75% | | 09/21/47 | | | 113,000 | | | | 106,620 | |
6.88% | | 08/04/26 | | | 250,000 | | | | 262,342 | |
Pfizer Inc. | | | | | | | | |
1.70% | | 12/15/19 | | | 200,000 | | | | 197,156 | |
3.00% | | 12/15/26 | | | 200,000 | | | | 192,284 | |
4.00% | | 12/15/36 | | | 100,000 | | | | 100,437 | |
4.13% | | 12/15/46 | | | 200,000 | | | | 201,616 | |
4.30% | | 06/15/43 | | | 350,000 | | | | 357,686 | |
Philip Morris International Inc. | | | | | | | | |
2.00% | | 02/21/20 | | | 300,000 | | | | 295,266 | |
3.13% | | 03/02/28 | | | 50,000 | | | | 47,342 | |
3.88% | | 08/21/42 | | | 442,000 | | | | 396,806 | |
Phillips 66 | | | | | | | | |
3.90% | | 03/15/28 | | | 50,000 | | | | 49,020 | |
4.88% | | 11/15/44 | | | 45,000 | | | | 46,541 | |
Phillips 66 Partners LP | | | | | | | | |
3.75% | | 03/01/28 | | | 10,000 | | | | 9,358 | |
4.68% | | 02/15/45 | | | 10,000 | | | | 9,341 | |
Pinnacle West Capital Corp. | | | | | | | | |
2.25% | | 11/30/20 | | | 45,000 | | | | 43,834 | |
Plains All American Pipeline LP/PAA Finance Corp. | |
3.85% | | 10/15/23 | | | 200,000 | | | | 195,254 | |
4.50% | | 12/15/26 | | | 200,000 | | | | 196,806 | |
| | | | | | | | | | |
| | | | | Principal
Amount | | | Fair
Value | |
PNC Bank NA | | | | | | | | |
2.00% | | 05/19/20 | | $ | 200,000 | | | $ | 196,024 | |
2.55% | | 12/09/21 | | | 250,000 | | | | 243,592 | |
2.95% | | 02/23/25 | | | 400,000 | | | | 382,968 | |
3.10% | | 10/25/27 | | | 200,000 | | | | 189,238 | |
PPG Industries Inc. | | | | | | | | |
3.75% | | 03/15/28 | | | 50,000 | | | | 49,282 | |
PPL Capital Funding Inc. | | | | | | | | |
3.40% | | 06/01/23 | | | 200,000 | | | | 195,908 | |
PPL Electric Utilities Corp. | | | | | | | | |
4.15% | | 06/15/48 | | | 100,000 | | | | 101,643 | |
President & Fellows of Harvard College | | | | | |
3.15% | | 07/15/46 | | | 50,000 | | | | 44,471 | |
Principal Financial Group Inc. | | | | | | | | |
3.40% | | 05/15/25 | | | 250,000 | | | | 243,425 | |
Prologis LP (REIT) | |
4.25% | | 08/15/23 | | | 250,000 | | | | 257,510 | |
Providence Saint Joseph Health Obligated Group | | | | | |
3.93% | | 10/01/48 | | | 20,000 | | | | 19,066 | |
Prudential Financial Inc. | | | | | | | | |
3.94% | | 12/07/49 | | | 290,000 | | | | 261,307 | |
Public Service Company of Colorado | | | | | |
3.70% | | 06/15/28 | | | 50,000 | | | | 50,290 | |
4.10% | | 06/15/48 | | | 30,000 | | | | 30,112 | |
Public Service Electric & Gas Co. | | | | | | | | |
2.38% | | 05/15/23 | | | 500,000 | | | | 477,315 | |
Puget Energy Inc. | | | | | | | | |
3.65% | | 05/15/25 | | | 300,000 | | | | 291,780 | |
QUALCOMM Inc. | | | | | | | | |
1.85% | | 05/20/19 | | | 200,000 | | | | 199,907 | |
4.30% | | 05/20/47 | | | 100,000 | | | | 93,248 | |
4.65% | | 05/20/35 | | | 150,000 | | | | 151,741 | |
Quest Diagnostics Inc. | | | | | | | | |
3.50% | | 03/30/25 | | | 150,000 | | | | 144,531 | |
4.25% | | 04/01/24 | | | 250,000 | | | | 253,967 | |
Raytheon Co. | | | | | | | | |
3.15% | | 12/15/24 | | | 90,000 | | | | 89,023 | |
Realty Income Corp. (REIT) | | | | | |
4.65% | | 08/01/23 | | | 500,000 | | | | 517,820 | |
Regency Centers LP | | | | | | | | |
4.13% | | 03/15/28 | | | 50,000 | | | | 49,432 | |
RELX Capital Inc. | | | | | | | | |
3.50% | | 03/16/23 | | | 30,000 | | | | 29,789 | |
Republic Services Inc. | | | | | | | | |
5.50% | | 09/15/19 | | | 300,000 | | | | 308,832 | |
Reynolds American Inc. | | | | | | | | |
4.45% | | 06/12/25 | | | 300,000 | | | | 301,770 | |
Rio Tinto Finance USA Ltd. | | | | | | | | |
5.20% | | 11/02/40 | | | 450,000 | | | | 508,586 | |
Rogers Communications Inc. | | | | | | | | |
2.90% | | 11/15/26 | | | 200,000 | | | | 184,798 | |
3.00% | | 03/15/23 | | | 250,000 | | | | 244,030 | |
3.63% | | 12/15/25 | | | 60,000 | | | | 58,708 | |
Roper Technologies Inc. | | | | | | | | |
3.80% | | 12/15/26 | | | 200,000 | | | | 194,930 | |
Royal Bank of Canada | | | | | | | | |
2.15% | | 03/06/20 - 10/26/20 | | | 475,000 | | | | 466,077 | |
2.75% | | 02/01/22 | | | 200,000 | | | | 196,480 | |
Royal Bank of Scotland Group PLC | | | | | | | | |
3.88% | | 09/12/23 | | | 200,000 | | | | 194,430 | |
Royal Bank of Scotland Group PLC (4.89% fixed rate until 05/18/28; 1.75% + 3 month USD LIBOR thereafter) | |
4.89% | | 05/18/29 | | | 200,000 | | | | 199,048 | (e) |
RPM International Inc. | | | | | | | | |
4.25% | | 01/15/48 | | | 50,000 | | | | 45,207 | |
Ryder System Inc. | | | | | | | | |
3.40% | | 03/01/23 | | | 150,000 | | | | 147,868 | |
S&P Global Inc. | | | | | | | | |
4.40% | | 02/15/26 | | | 250,000 | | | | 256,625 | |
Sabine Pass Liquefaction LLC | | | | | | | | |
5.63% | | 02/01/21 - 03/01/25 | | | 310,000 | | | | 326,625 | |
5.75% | | 05/15/24 | | | 135,000 | | | | 143,962 | |
San Diego Gas & Electric Co. | | | | | | | | |
3.60% | | 09/01/23 | | | 500,000 | | | | 502,505 | |
Sanofi | | | | | | | | |
3.63% | | 06/19/28 | | | 100,000 | | | | 99,710 | |
See Notes to Schedules of Investments and Notes to Financial Statements.
| | |
| State Street Total Return V.I.S. Fund | | |
Schedule of Investments | | June 30, 2018 (Unaudited) |
| | | | | | | | | | |
| | | | | Principal
Amount | | | Fair
Value | |
Santander Holdings USA Inc. | | | | | | | | |
2.65% | | 04/17/20 | | $ | 150,000 | | | $ | 148,615 | |
3.40% | | 01/18/23 | | | 50,000 | | | | 48,349 | |
4.40% | | 07/13/27 | | | 50,000 | | | | 47,843 | |
Santander UK Group Holdings PLC (3.37% fixed rate until 01/05/23; 1.08% + 3 month USD LIBOR thereafter) | |
3.37% | | 01/05/24 | | | 200,000 | | | | 192,556 | (e) |
Santander UK PLC | | | | | | | | |
2.38% | | 03/16/20 | | | 250,000 | | | | 246,225 | |
Seagate HDD Cayman | | | | | | | | |
4.75% | | 06/01/23 | | | 250,000 | | | | 247,342 | |
Sempra Energy | | | | | | | | |
4.05% | | 12/01/23 | | | 250,000 | | | | 253,225 | |
Shell International Finance BV | | | | | | | | |
4.00% | | 05/10/46 | | | 250,000 | | | | 242,068 | |
4.13% | | 05/11/35 | | | 250,000 | | | | 253,627 | |
4.38% | | 03/25/20 | | | 500,000 | | | | 512,845 | |
Shire Acquisitions Investments Ireland DAC | |
3.20% | | 09/23/26 | | | 150,000 | | | | 137,200 | |
Simon Property Group LP (REIT) | | | | | | | | |
2.75% | | 02/01/23 | | | 621,000 | | | | 600,706 | |
SL Green Operating Partnership LP | |
3.25% | | 10/15/22 | | | 30,000 | | | | 29,167 | |
South Carolina Electric & Gas Co. | | | | | | | | |
5.10% | | 06/01/65 | | | 150,000 | | | | 151,107 | |
Southern California Edison Co. | | | | | | | | |
3.40% | | 06/01/23 | | | 200,000 | | | | 199,178 | |
3.60% | | 02/01/45 | | | 225,000 | | | | 196,038 | |
Southern Copper Corp. | | | | | | | | |
5.88% | | 04/23/45 | | | 255,000 | | | | 271,779 | |
Southwest Airlines Co. | | | | | | | | |
3.00% | | 11/15/26 | | | 200,000 | | | | 184,460 | |
Southwestern Electric Power Co. | | | | | | | | |
3.85% | | 02/01/48 | | | 100,000 | | | | 92,438 | |
Spectra Energy Partners LP | | | | | | | | |
3.50% | | 03/15/25 | | | 250,000 | | | | 238,452 | |
Stanley Black & Decker Inc. | | | | | | | | |
2.90% | | 11/01/22 | | | 250,000 | | | | 245,140 | |
Starbucks Corp. | | | | | | | | |
2.20% | | 11/22/20 | | | 20,000 | | | | 19,548 | |
3.10% | | 03/01/23 | | | 50,000 | | | | 49,009 | |
3.50% | | 03/01/28 | | | 50,000 | | | | 48,116 | |
3.75% | | 12/01/47 | | | 35,000 | | | | 30,374 | |
Stryker Corp. | | | | | | | | |
3.65% | | 03/07/28 | | | 250,000 | | | | 243,940 | |
Sumitomo Mitsui Banking Corp. | | | | | | | | |
2.45% | | 01/16/20 | | | 250,000 | | | | 247,210 | |
Sumitomo Mitsui Financial Group Inc. | |
2.78% | | 10/18/22 | | | 200,000 | | | | 193,238 | |
3.01% | | 10/19/26 | | | 500,000 | | | | 468,225 | |
3.35% | | 10/18/27 | | | 50,000 | | | | 47,854 | |
Suncor Energy Inc. | |
6.85% | | 06/01/39 | | | 250,000 | | | | 321,217 | |
Sunoco Logistics Partners Operations LP | |
5.95% | | 12/01/25 | | | 250,000 | | | | 267,213 | |
SunTrust Bank | | | | | | | | |
2.25% | | 01/31/20 | | | 100,000 | | | | 98,733 | |
3.00% | | 02/02/23 | | | 100,000 | | | | 97,819 | |
SunTrust Banks Inc. | | | | | | | | |
4.00% | | 05/01/25 | | | 50,000 | | | | 50,251 | |
Svensk Exportkredit AB | | | | | | | | |
1.75% | | 05/18/20 | | | 200,000 | | | | 196,332 | |
Svenska Handelsbanken AB | | | | | | | | |
3.35% | | 05/24/21 | | | 250,000 | | | | 250,053 | |
Synchrony Financial | | | | | | | | |
3.95% | | 12/01/27 | | | 300,000 | | | | 277,011 | |
Sysco Corp. | | | | | | | | |
3.55% | | 03/15/25 | | | 100,000 | | | | 98,099 | |
4.45% | | 03/15/48 | | | 100,000 | | | | 96,912 | |
Tampa Electric Co. | | | | | | | | |
4.30% | | 06/15/48 | | | 50,000 | | | | 49,701 | |
Target Corp. | | | | | | | | |
3.90% | | 11/15/47 | | | 50,000 | | | | 46,379 | |
4.00% | | 07/01/42 | | | 300,000 | | | | 285,666 | |
TC PipeLines LP | | | | | | | | |
3.90% | | 05/25/27 | | | 100,000 | | | | 94,214 | |
| | | | | | | | | | |
| | | | | Principal
Amount | | | Fair
Value | |
TD Ameritrade Holding Corp. | | | | | | | | |
2.95% | | 04/01/22 | | $ | 250,000 | | | $ | 245,438 | |
Telefonica Emisiones SAU | | | | | | | | |
5.88% | | 07/15/19 | | | 500,000 | | | | 514,675 | |
TELUS Corp. | | | | | | | | |
4.60% | | 11/16/48 | | | 50,000 | | | | 49,053 | |
Texas Instruments Inc. | | | | | | | | |
1.75% | | 05/01/20 | | | 250,000 | | | | 245,247 | |
The Allstate Corp. | | | | | | | | |
3.28% | | 12/15/26 | | | 100,000 | | | | 96,279 | |
4.20% | | 12/15/46 | | | 100,000 | | | | 98,207 | |
The Allstate Corp. (5.75% fixed rate until 08/15/23; 2.94% + 3 month USD LIBOR thereafter) | |
5.75% | | 08/15/53 | | | 250,000 | | | | 257,197 | (e) |
The Bank of New York Mellon Corp. | |
2.80% | | 05/04/26 | | | 30,000 | | | | 28,363 | |
3.00% | | 02/24/25 | | | 105,000 | | | | 101,204 | |
3.50% | | 04/28/23 | | | 100,000 | | | | 100,081 | |
The Bank of Nova Scotia | |
2.50% | | 01/08/21 | | | 200,000 | | | | 196,366 | |
3.13% | | 04/20/21 | | | 300,000 | | | | 298,515 | |
The Bank of Nova Scotia (4.65% fixed rate until 10/12/22; 2.65% + 3 month USD LIBOR thereafter) | |
4.65% | | 12/31/99 | | | 200,000 | | | | 181,078 | (e) |
The Board of Trustees of The Leland Stanford Junior University | |
3.65% | | 05/01/48 | | | 200,000 | | | | 197,602 | |
The Boeing Co. | | | | | | | | |
3.38% | | 06/15/46 | | | 150,000 | | | | 135,498 | |
The Charles Schwab Corp. | | | | | | | | |
3.85% | | 05/21/25 | | | 150,000 | | | | 151,715 | |
The Clorox Co. | | | | | | | | |
3.50% | | 12/15/24 | | | 250,000 | | | | 247,957 | |
The Coca-Cola Co. | | | | | | | | |
2.45% | | 11/01/20 | | | 300,000 | | | | 297,612 | |
The Dow Chemical Co. | | | | | | | | |
3.00% | | 11/15/22 | | | 137,000 | | | | 133,463 | |
4.38% | | 11/15/42 | | | 437,000 | | | | 413,533 | |
The George Washington University | | | | | | | | |
4.13% | | 09/15/48 | | | 50,000 | | | | 50,781 | |
The Goldman Sachs Group Inc. | | | | | | | | |
2.30% | | 12/13/19 | | | 200,000 | | | | 197,784 | |
2.75% | | 09/15/20 | | | 750,000 | | | | 741,667 | |
3.00% | | 04/26/22 | | | 100,000 | | | | 97,652 | |
3.50% | | 11/16/26 | | | 250,000 | | | | 235,212 | |
3.85% | | 07/08/24 | | | 250,000 | | | | 247,865 | |
5.75% | | 01/24/22 | | | 500,000 | | | | 535,035 | |
6.25% | | 02/01/41 | | | 350,000 | | | | 409,895 | |
6.75% | | 10/01/37 | | | 400,000 | | | | 474,204 | |
The Goldman Sachs Group Inc. (2.88% fixed rate until 10/31/21; 0.82% + 3 month USD LIBOR thereafter) | |
2.88% | | 10/31/22 | | | 200,000 | | | | 195,276 | (e) |
The Goldman Sachs Group Inc. (4.02% fixed rate until 10/31/37; 1.37% + 3 month USD LIBOR thereafter) | |
4.02% | | 10/31/38 | | | 200,000 | | | | 181,946 | (e) |
The Hartford Financial Services Group Inc. | |
4.40% | | 03/15/48 | | | 100,000 | | | | 96,205 | |
The Hershey Co. | | | | | | | | |
3.38% | | 05/15/23 | | | 50,000 | | | | 50,075 | |
The Home Depot Inc. | | | | | | | | |
2.13% | | 09/15/26 | | | 245,000 | | | | 218,658 | |
2.63% | | 06/01/22 | | | 190,000 | | | | 186,569 | |
4.20% | | 04/01/43 | | | 250,000 | | | | 250,680 | |
4.40% | | 04/01/21 | | | 500,000 | | | | 516,495 | |
The JM Smucker Co. | | | | | | | | |
3.38% | | 12/15/27 | | | 100,000 | | | | 92,975 | |
The Kroger Co. | | | | | | | | |
3.85% | | 08/01/23 | | | 500,000 | | | | 502,725 | |
The Mosaic Co. | | | | | | | | |
3.25% | | 11/15/22 | | | 50,000 | | | | 48,727 | |
4.05% | | 11/15/27 | | | 50,000 | | | | 47,731 | |
The Procter & Gamble Co. | | | | | | | | |
1.70% | | 11/03/21 | | | 200,000 | | | | 192,334 | |
2.45% | | 11/03/26 | | | 200,000 | | | | 184,710 | |
The Progressive Corp. | | | | | | | | |
4.35% | | 04/25/44 | | | 100,000 | | | | 101,303 | |
See Notes to Schedules of Investments and Notes to Financial Statements.
| | |
| State Street Total Return V.I.S. Fund | | |
| Schedule of Investments | | June 30, 2018 (Unaudited) |
|
| | | | | | | | | | |
| | | | | Principal
Amount | | | Fair
Value | |
The Sherwin-Williams Co. | | | | | | | | |
2.75% | | 06/01/22 | | $ | 100,000 | | | $ | 96,866 | |
3.45% | | 06/01/27 | | | 100,000 | | | | 94,663 | |
3.95% | | 01/15/26 | | | 100,000 | | | | 99,420 | |
4.20% | | 01/15/22 | | | 100,000 | | | | 101,765 | |
4.50% | | 06/01/47 | | | 100,000 | | | | 95,637 | |
The Southern Co. (5.50% fixed rate until 03/15/22; 3.63% + 3 month USD LIBOR thereafter) | |
5.50% | | 03/15/57 | | | 400,000 | | | | 412,344 | (e) |
The Toronto-Dominion Bank | | | | | | | | |
1.90% | | 10/24/19 | | | 200,000 | | | | 197,714 | |
2.25% | | 11/05/19 | | | 250,000 | | | | 248,052 | |
3.25% | | 06/11/21 | | | 100,000 | | | | 100,098 | |
The Travelers Companies Inc. | | | | | | | | |
4.00% | | 05/30/47 | | | 200,000 | | | | 192,568 | |
5.35% | | 11/01/40 | | | 150,000 | | | | 173,200 | |
The Walt Disney Co. | | | | | | | | |
2.30% | | 02/12/21 | | | 130,000 | | | | 126,699 | |
3.00% | | 07/30/46 | | | 60,000 | | | | 47,941 | |
3.15% | | 09/17/25 | | | 165,000 | | | | 160,076 | |
The Western Union Co. | | | | | | | | |
3.60% | | 03/15/22 | | | 300,000 | | | | 297,450 | |
Thermo Fisher Scientific Inc. | | | | | | | | |
3.30% | | 02/15/22 | | | 80,000 | | | | 79,582 | |
4.15% | | 02/01/24 | | | 25,000 | | | | 25,403 | |
Thomson Reuters Corp. | | | | | | | | |
4.50% | | 05/23/43 | | | 150,000 | | | | 139,257 | |
Time Warner Cable LLC | | | | | | | | |
4.50% | | 09/15/42 | | | 500,000 | | | | 413,620 | |
Total Capital International S.A. | | | | | | | | |
2.75% | | 06/19/21 | | | 250,000 | | | | 247,845 | |
Total System Services Inc. | | | | | | | | |
4.45% | | 06/01/28 | | | 100,000 | | | | 99,721 | |
Toyota Motor Credit Corp. | | | | | | | | |
1.95% | | 04/17/20 | | | 200,000 | | | | 196,600 | |
2.60% | | 01/11/22 | | | 100,000 | | | | 97,908 | |
2.70% | | 01/11/23 | | | 200,000 | | | | 194,588 | |
3.05% | | 01/11/28 | | | 200,000 | | | | 189,772 | |
TransAlta Corp. | | | | | | | | |
4.50% | | 11/15/22 | | | 373,000 | | | | 369,154 | |
TransCanada PipeLines Ltd. | | | | | | | | |
7.63% | | 01/15/39 | | | 350,000 | | | | 462,602 | |
Transcontinental Gas Pipe Line Company LLC | |
4.00% | | 03/15/28 | | | 100,000 | | | | 97,906 | (d) |
Tyson Foods Inc. | | | | | | | | |
2.65% | | 08/15/19 | | | 250,000 | | | | 249,010 | |
4.88% | | 08/15/34 | | | 70,000 | | | | 71,151 | |
U.S. Bancorp | | | | | | | | |
2.63% | | 01/24/22 | | | 100,000 | | | | 97,927 | |
Unilever Capital Corp. | | | | | | | | |
2.00% | | 07/28/26 | | | 250,000 | | | | 222,910 | |
2.90% | | 05/05/27 | | | 100,000 | | | | 94,781 | |
Union Electric Co. | | | | | | | | |
2.95% | | 06/15/27 | | | 200,000 | | | | 189,062 | |
3.65% | | 04/15/45 | | | 135,000 | | | | 125,208 | |
Union Pacific Corp. | | | | | | | | |
3.00% | | 04/15/27 | | | 300,000 | | | | 283,671 | |
3.50% | | 06/08/23 | | | 50,000 | | | | 50,065 | |
3.95% | | 09/10/28 | | | 30,000 | | | | 30,169 | |
4.38% | | 09/10/38 | | | 15,000 | | | | 15,206 | |
4.50% | | 09/10/48 | | | 30,000 | | | | 30,588 | |
4.80% | | 09/10/58 | | | 25,000 | | | | 25,964 | |
United Airlines 2013-1 Class A Pass Through Trust | |
4.30% | | 08/15/25 | | | 206,851 | | | | 209,520 | |
United Parcel Service Inc. | | | | | | | | |
2.45% | | 10/01/22 | | | 625,000 | | | | 605,231 | |
3.05% | | 11/15/27 | | | 50,000 | | | | 47,655 | |
3.75% | | 11/15/47 | | | 50,000 | | | | 45,994 | |
United Technologies Corp. | | | | | | | | |
4.50% | | 06/01/42 | | | 458,000 | | | | 450,965 | |
UnitedHealth Group Inc. | | | | | | | | |
2.95% | | 10/15/27 | | | 200,000 | | | | 186,782 | |
3.10% | | 03/15/26 | | | 350,000 | | | | 334,316 | |
3.45% | | 01/15/27 | | | 200,000 | | | | 194,974 | |
3.75% | | 10/15/47 | | | 200,000 | | | | 184,308 | |
4.63% | | 07/15/35 | | | 45,000 | | | | 47,498 | |
6.88% | | 02/15/38 | | | 250,000 | | | | 332,117 | |
| | | | | | | | | | |
| | | | | Principal
Amount | | | Fair
Value | |
University of Notre Dame du Lac | | | | | | | | |
3.39% | | 02/15/48 | | $ | 25,000 | | | $ | 23,493 | |
US Bank NA | | | | | | | | |
2.05% | | 10/23/20 | | | 250,000 | | | | 244,123 | |
2.80% | | 01/27/25 | | | 350,000 | | | | 333,060 | |
Vale Overseas Ltd. | | | | | | | | |
6.88% | | 11/10/39 | | | 400,000 | | | | 451,876 | |
Valero Energy Corp. | | | | | | | | |
6.63% | | 06/15/37 | | | 300,000 | | | | 360,396 | |
Valero Energy Partners LP | | | | | | | | |
4.38% | | 12/15/26 | | | 200,000 | | | | 197,318 | |
Ventas Realty LP | | | | | | | | |
4.00% | | 03/01/28 | | | 150,000 | | | | 144,973 | |
VEREIT Operating Partnership LP | | | | | | | | |
4.13% | | 06/01/21 | | | 15,000 | | | | 15,230 | |
4.60% | | 02/06/24 | | | 20,000 | | | | 19,996 | |
4.88% | | 06/01/26 | | | 25,000 | | | | 24,956 | |
Verizon Communications Inc. | | | | | | | | |
3.85% | | 11/01/42 | | | 436,000 | | | | 365,721 | |
4.33% | | 09/21/28 | | | 809,000 | | | | 803,216 | (d) |
4.40% | | 11/01/34 | | | 250,000 | | | | 235,650 | |
4.52% | | 09/15/48 | | | 150,000 | | | | 136,971 | |
4.81% | | 03/15/39 | | | 539,000 | | | | 522,108 | |
5.01% | | 04/15/49 | | | 267,000 | | | | 259,994 | |
Viacom Inc. | | | | | | | | |
5.85% | | 09/01/43 | | | 100,000 | | | | 99,935 | |
Virginia Electric & Power Co. | | | | | | | | |
3.80% | | 04/01/28 | | | 200,000 | | | | 199,308 | |
4.65% | | 08/15/43 | | | 500,000 | | | | 524,825 | |
Visa Inc. | | | | | | | | | | |
4.30% | | 12/14/45 | | | 350,000 | | | | 363,226 | |
Vodafone Group PLC | | | | | | | | |
2.50% | | 09/26/22 | | | 376,000 | | | | 359,445 | |
4.38% | | 05/30/28 - 02/19/43 | | | 305,000 | | | | 278,716 | |
5.25% | | 05/30/48 | | | 50,000 | | | | 49,783 | |
Vornado Realty LP | | | | | | | | |
3.50% | | 01/15/25 | | | 50,000 | | | | 47,992 | |
Vulcan Materials Co. | | | | | | | | |
4.70% | | 03/01/48 | | | 50,000 | | | | 46,803 | (d) |
Wabtec Corp. | | | | | | | | | | |
3.45% | | 11/15/26 | | | 200,000 | | | | 183,518 | |
Walgreens Boots Alliance Inc. | | | | | | | | |
3.45% | | 06/01/26 | | | 55,000 | | | | 51,269 | |
4.50% | | 11/18/34 | | | 155,000 | | | | 146,432 | |
Walmart Inc. | | | | | | | | | | |
1.75% | | 10/09/19 | | | 100,000 | | | | 98,915 | |
1.90% | | 12/15/20 | | | 100,000 | | | | 97,960 | |
2.35% | | 12/15/22 | | | 400,000 | | | | 385,972 | |
2.65% | | 12/15/24 | | | 100,000 | | | | 95,778 | |
3.13% | | 06/23/21 | | | 50,000 | | | | 50,267 | |
3.40% | | 06/26/23 | | | 50,000 | | | | 50,402 | |
3.63% | | 12/15/47 | | | 125,000 | | | | 116,529 | |
3.70% | | 06/26/28 | | | 100,000 | | | | 100,951 | |
3.95% | | 06/28/38 | | | 40,000 | | | | 40,162 | |
4.05% | | 06/29/48 | | | 35,000 | | | | 35,270 | |
Warner Media LLC | |
6.10% | | 07/15/40 | | | 650,000 | | | | 696,806 | |
Waste Management Inc. | |
2.90% | | 09/15/22 | | | 500,000 | | | | 491,585 | |
WEC Energy Group Inc. | |
3.38% | | 06/15/21 | | | 65,000 | | | | 65,253 | |
Wells Fargo & Co. | |
2.15% | | 01/30/20 | | | 620,000 | | | | 610,830 | |
2.50% | | 03/04/21 | | | 240,000 | | | | 234,710 | |
4.13% | | 08/15/23 | | | 250,000 | | | | 251,233 | |
4.40% | | 06/14/46 | | | 250,000 | | | | 229,035 | |
4.65% | | 11/04/44 | | | 150,000 | | | | 143,095 | |
4.75% | | 12/07/46 | | | 200,000 | | | | 193,042 | |
5.61% | | 01/15/44 | | | 569,000 | | | | 609,706 | |
Wells Fargo Bank NA | |
2.15% | | 12/06/19 | | | 250,000 | | | | 247,117 | |
Welltower Inc. | | | | | | | | | | |
4.25% | | 04/15/28 | | | 115,000 | | | | 112,955 | |
Western Gas Partners LP | | | | | | | | |
5.45% | | 04/01/44 | | | 150,000 | | | | 141,939 | |
See Notes to Schedules of Investments and Notes to Financial Statements.
| | |
| State Street Total Return V.I.S. Fund | | |
| Schedule of Investments | | June 30, 2018 (Unaudited) |
|
| | | | | | | | | | |
| | | | | Principal
Amount | | | Fair
Value | |
Westlake Chemical Corp. | | | | | | | | |
4.38% | | 11/15/47 | | $ | 50,000 | | | $ | 46,128 | |
Westpac Banking Corp. | | | | | | | | |
2.00% | | 08/19/21 | | | 500,000 | | | | 479,330 | |
2.80% | | 01/11/22 | | | 100,000 | | | | 97,774 | |
3.35% | | 03/08/27 | | | 200,000 | | | | 191,548 | |
Westpac Banking Corp. (2.24% fixed rate until 11/23/26; 2.24% + 5 Year US ISDA thereafter) | |
4.32% | | 11/23/31 | | | 100,000 | | | | 96,464 | (e) |
Weyerhaeuser Co. (REIT) | | | | | | | | |
7.38% | | 03/15/32 | | | 100,000 | | | | 127,106 | |
Whirlpool Corp. | |
3.70% | | 05/01/25 | | | 250,000 | | | | 245,865 | |
Williams Partners LP | |
4.85% | | 03/01/48 | | | 70,000 | | | | 67,059 | |
5.10% | | 09/15/45 | | | 150,000 | | | | 148,141 | |
5.80% | | 11/15/43 | | | 250,000 | | | | 267,595 | |
Wisconsin Power & Light Co. | |
3.05% | | 10/15/27 | | | 100,000 | | | | 94,475 | |
WPP Finance 2010 | |
5.13% | | 09/07/42 | | | 191,000 | | | | 188,773 | |
Wyndham Destinations Inc. | |
4.25% | | 03/01/22 | | | 25,000 | | | | 24,343 | |
Xcel Energy Inc. | |
3.30% | | 06/01/25 | | | 250,000 | | | | 241,650 | |
4.00% | | 06/15/28 | | | 100,000 | | | | 100,245 | |
Zimmer Biomet Holdings Inc. | |
3.70% | | 03/19/23 | | | 75,000 | | | | 74,540 | |
Zoetis Inc. | | | | | | | | | | |
4.70% | | 02/01/43 | | | 250,000 | | | | 258,197 | |
| | | | | | | | | 192,148,814 | |
Non-Agency Collateralized Mortgage Obligations – 0.4% | |
Benchmark Mortgage Trust | |
4.12% | | 07/15/51 | | | 100,000 | | | | 102,922 | |
CD 2017-CD6 Mortgage Trust | |
3.46% | | 11/13/50 | | | 150,000 | | | | 146,661 | |
Citigroup Commercial Mortgage Trust 2014-GC25 | |
4.02% | | 10/10/47 | | | 800,000 | | | | 809,786 | |
COMM 2012-CR1 Mortgage Trust | |
3.39% | | 05/15/45 | | | 468,712 | | | | 469,884 | |
COMM 2013-CCRE12 Mortgage Trust | |
4.05% | | 10/10/46 | | | 200,000 | | | | 205,701 | |
COMM 2013-CR11 Mortgage Trust | |
4.72% | | 08/10/50 | | | 1,000,000 | | | | 1,045,102 | (e) |
COMM 2013-CR8 Mortgage Trust | |
3.61% | | 06/10/46 | | | 750,000 | | | | 757,309 | (e) |
COMM 2015-PC1 Mortgage Trust | |
3.90% | | 07/10/50 | | | 500,000 | | | | 506,910 | |
JPMBB Commercial Mortgage Securities Trust 2013-C14 | |
3.76% | | 08/15/46 | | | 750,000 | | | | 760,927 | (e) |
Morgan Stanley Bank of America Merrill Lynch Trust 2016-C29 | |
3.14% | | 05/15/49 | | | 500,000 | | | | 493,157 | |
UBS Commercial Mortgage Trust 2017-C4 | |
3.56% | | 10/15/50 | | | 185,000 | | | | 181,693 | |
UBS Commercial Mortgage Trust 2018-C10 | |
4.31% | | 05/15/51 | | | 100,000 | | | | 103,690 | |
Wells Fargo Commercial Mortgage Trust 2012-LC5 | |
4.69% | | 10/15/45 | | | 220,000 | | | | 222,360 | (e) |
Wells Fargo Commercial Mortgage Trust 2017-C41 | |
3.47% | | 11/15/50 | | | 300,000 | | | | 293,373 | |
Wells Fargo Commercial Mortgage Trust 2017-C42 | |
3.59% | | 12/15/50 | | | 400,000 | | | | 396,871 | |
WF-RBS Commercial Mortgage Trust 2012-C10 | |
3.24% | | 12/15/45 | | | 1,200,000 | | | | 1,177,726 | |
WF-RBS Commercial Mortgage Trust 2012-C7 | |
3.43% | | 06/15/45 | | | 200,000 | | | | 199,682 | |
| | | | 7,873,754 | |
Sovereign Bonds – 0.5% | |
Export Development Canada | |
1.63% | | 01/17/20 | | | 200,000 | | | | 196,996 | |
2.50% | | 01/24/23 | | | 200,000 | | | | 196,564 | |
Government of Canada | |
2.00% | | 11/15/22 | | | 125,000 | | | | 120,894 | |
Government of Chile | |
3.63% | | 10/30/42 | | | 350,000 | | | | 326,833 | |
| | | | | | | | | | |
| | | | | Principal
Amount | | | Fair
Value | |
Government of Colombia | |
4.38% | | 07/12/21 | | $ | 300,000 | | | $ | 306,822 | |
5.00% | | 06/15/45 | | | 250,000 | | | | 245,185 | |
6.13% | | 01/18/41 | | | 250,000 | | | | 279,700 | |
Government of Hungary | |
5.38% | | 03/25/24 | | | 300,000 | | | | 319,485 | |
Government of Italy | |
5.38% | | 06/15/33 | | | 250,000 | | | | 269,718 | |
Government of Mexico | |
3.50% | | 01/21/21 | | | 250,000 | | | | 249,788 | |
3.75% | | 01/11/28 | | | 200,000 | | | | 188,950 | |
4.35% | | 01/15/47 | | | 200,000 | | | | 178,386 | |
4.75% | | 03/08/44 | | | 702,000 | | | | 659,733 | |
5.75% | | 10/12/10 | | | 172,000 | | | | 170,067 | |
6.05% | | 01/11/40 | | | 130,000 | | | | 143,048 | |
Government of Panama | |
6.70% | | 01/26/36 | | | 250,000 | | | | 305,592 | |
Government of Peru | |
6.55% | | 03/14/37 | | | 297,000 | | | | 371,158 | |
7.35% | | 07/21/25 | | | 100,000 | | | | 122,131 | |
Government of Philippines | |
3.70% | | 03/01/41 | | | 200,000 | | | | 184,232 | |
4.00% | | 01/15/21 | | | 100,000 | | | | 101,122 | |
7.75% | | 01/14/31 | | | 500,000 | | | | 658,045 | |
Government of Poland | |
3.00% | | 03/17/23 | | | 147,000 | | | | 143,626 | |
3.25% | | 04/06/26 | | | 200,000 | | | | 193,160 | |
5.00% | | 03/23/22 | | | 100,000 | | | | 105,465 | |
6.38% | | 07/15/19 | | | 74,000 | | | | 76,705 | |
Government of Uruguay | |
4.50% | | 08/14/24 | | | 500,000 | | | | 516,390 | |
Indonesia Government International Bond | |
4.10% | | 04/24/28 | | | 200,000 | | | | 193,454 | |
Iraq Government AID Bond | |
2.15% | | 01/18/22 | | | 480,000 | | | | 468,677 | |
Japan Bank for International Cooperation | |
1.50% | | 07/21/21 | | | 400,000 | | | | 381,708 | |
2.13% | | 07/21/20 | | | 400,000 | | | | 393,688 | |
2.38% | | 11/16/22 | | | 200,000 | | | | 193,518 | |
2.88% | | 07/21/27 | | | 200,000 | | | | 193,874 | |
Province of Alberta Canada | |
3.30% | | 03/15/28 | | | 200,000 | | | | 199,462 | |
Province of Manitoba Canada | |
2.13% | | 05/04/22 | | | 200,000 | | | | 192,726 | |
Province of Ontario Canada | |
2.25% | | 05/18/22 | | | 200,000 | | | | 193,758 | |
2.55% | | 02/12/21 | | | 100,000 | | | | 99,007 | |
Province of Quebec Canada | |
2.50% | | 04/20/26 | | | 500,000 | | | | 475,505 | |
2.75% | | 04/12/27 | | | 200,000 | | | | 192,424 | |
The Korea Development Bank | |
2.63% | | 02/27/22 | | | 400,000 | | | | 387,816 | |
| | | | 10,195,412 | |
Municipal Bonds and Notes – 0.2% | |
American Municipal Power Inc. | |
6.27% | | 02/15/50 | | | 200,000 | | | | 255,090 | |
Bay Area Toll Authority | |
6.26% | | 04/01/49 | | | 100,000 | | | | 138,908 | |
Chicago Transit Authority | |
6.90% | | 12/01/40 | | | 75,000 | | | | 97,592 | |
Commonwealth of Massachusetts | |
4.50% | | 08/01/31 | | | 200,000 | | | | 213,398 | |
Dallas Area Rapid Transit | |
5.02% | | 12/01/48 | | | 75,000 | | | | 88,028 | |
6.00% | | 12/01/44 | | | 100,000 | | | | 129,704 | |
East Bay Municipal Utility District | |
5.87% | | 06/01/40 | | | 100,000 | | | | 126,784 | |
Florida Hurricane Catastrophe Fund Finance Corp. | |
3.00% | | 07/01/20 | | | 100,000 | | | | 100,282 | |
Los Angeles Department of Water & Power | |
6.57% | | 07/01/45 | | | 100,000 | | | | 141,247 | |
6.60% | | 07/01/50 | | | 90,000 | | | | 130,278 | |
Los Angeles Unified School District | |
5.76% | | 07/01/29 | | | 110,000 | | | | 128,753 | |
Metropolitan Transportation Authority | |
6.81% | | 11/15/40 | | | 250,000 | | | | 335,527 | |
See Notes to Schedules of Investments and Notes to Financial Statements.
| | |
| State Street Total Return V.I.S. Fund | | |
| Schedule of Investments | | June 30, 2018 (Unaudited) |
|
| | | | | | | | | | | | |
| | | | | | Principal
Amount | | | Fair
Value | |
Municipal Electric Authority of Georgia | |
6.64% | | | 04/01/57 | | | $ | 125,000 | | | $ | 158,049 | |
New York City Water & Sewer System | |
6.01% | | | 06/15/42 | | | | 250,000 | | | | 324,855 | |
North Texas Tollway Authority | |
6.72% | | | 01/01/49 | | | | 100,000 | | | | 141,968 | |
Port Authority of New York & New Jersey | |
4.46% | | | 10/01/62 | | | | 100,000 | | | | 106,207 | |
5.31% | | | 08/01/46 | | | | 200,000 | | | | 216,850 | |
San Diego County Water Authority Financing Corp. | |
6.14% | | | 05/01/49 | | | | 100,000 | | | | 131,996 | |
South Carolina State Public Service Authority | |
6.45% | | | 01/01/50 | | | | 150,000 | | | | 201,775 | |
State of California | |
5.70% | | | 11/01/21 | | | | 605,000 | | | | 657,611 | |
7.55% | | | 04/01/39 | | | | 200,000 | | | | 294,928 | |
State of Illinois | |
5.10% | | | 06/01/33 | | | | 250,000 | | | | 236,590 | |
State of Texas | |
5.52% | | | 04/01/39 | | | | 200,000 | | | | 252,630 | |
University of California | |
4.60% | | | 05/15/31 | | | | 100,000 | | | | 107,877 | |
4.77% | | | 05/15/15 | | | | 100,000 | | | | 103,845 | |
6.58% | | | 05/15/49 | | | | 100,000 | | | | 134,053 | |
University of Texas System | |
4.79% | | | 08/15/46 | | | | 100,000 | | | | 113,253 | |
| | | | 5,068,078 | |
FNMA (TBA) – 0.0% * | | | | | |
Lehman | | | | | | | | | | | | |
5.50% | | | TBA | | | | 378,353 | | | | 8,172 | (h,i) |
Total Bonds and Notes
(Cost $680,493,893) | | | | | | | | 664,564,447 | |
| | | | | | | | | | |
| | | | | Number
of Shares | | | Fair
Value | |
Exchange Traded & Mutual Funds – 3.3% | |
|
Exchange Traded & Mutual Funds – 3.3% | |
SPDR Bloomberg Barclays High Yield Bond ETF
(Cost $72,005,250) | | | 2,022,863 | | | $ | 71,771,179 | (j) |
| | |
Total Investments in Securities
(Cost $1,684,847,520) | | | | | | | 2,107,133,570 | |
| |
Short-Term Investments – 2.4% | | | | | |
| | |
State Street Institutional U.S. Government Money Market Fund - Class G Shares 1.86%
(Cost $50,927,408) | | | 50,927,408 | | | | 50,927,408 | (j,k) |
| | |
Total Investments
(Cost $1,735,774,928) | | | | | | | 2,158,060,978 | |
| |
Liabilities in Excess of Other Assets, net – (0.0)% | | | | (406,788 | ) |
| | | | | | | | |
NET ASSETS – 100.0% | | | | | | $ | 2,157,654,190 | |
| | | | | | | | |
Other Information:
The Fund had the following long futures contracts open at June 30, 2018:
| | | | | | | | | | | | | | | | | | | | |
Description | | Expiration
date | | | Number
of
Contracts | | | Notional
Amount | | |
Value | | | Unrealized
Depreciation | |
CME E-mini Russell 2000 Index Futures | | | September 2018 | | | | 10 | | | | 840,928 | | | $ | 823,750 | | | $ | (17,178 | ) |
MSCI EAFE Mini Index Futures | | | September 2018 | | | | 9 | | | | 906,385 | | | | 879,930 | | | | (26,455 | ) |
MSCI Emerging Markets Index Futures | | | September 2018 | | | | 91 | | | | 5,220,768 | | | | 4,838,015 | | | | (382,753 | ) |
| | | | | |
S&P 500 Emini Index Futures | | | September 2018 | | | | 31 | | | | 4,316,400 | | | | 4,218,480 | | | | (97,920 | ) |
S&P Mid 400 Emini Index Futures | | | September 2018 | | | | 2 | | | | 400,179 | | | | 391,220 | | | | (8,959 | ) |
| | | | | | | | | | | | | | | | | | | | |
| | | | | | | | | | | | | | | | | | $ | (533,265 | ) |
| | | | | | | | | | | | | | | | | | | | |
The views expressed in this document reflect our judgment as of the publication date and are subject to change at any time without notice. The securities cited may not be representative of the Fund’s future investments and should not be construed as a recommendation to purchase or sell a particular security. See the Fund’s summary prospectus and statutory prospectus for complete descriptions of investment objectives, policies, risks and permissible investments.
| (a) | Non-income producing security. |
| (b) | At June 30, 2018, all or a portion of this security was pledged to cover collateral requirements for futures and/or TBA’s. |
| (c) | State Street Corporation is the parent company of SSGA Funds Management, Inc., the Fund’s investment adviser and administrator, and State Street Bank & Trust Co., the Fund’s sub-administrator, custodian and accounting agent. |
See Notes to Schedules of Investments and Notes to Financial Statements.
| | |
| State Street Total Return V.I.S. Fund | | |
| Schedule of Investments | | June 30, 2018 (Unaudited) |
|
| (d) | Pursuant to Rule 144A of the Securities Act of 1933, as amended, these securities may be resold in transactions exempt from registration, normally to qualified institutional buyers. At June 30, 2018, these securities amounted to $6,829,755 or 0.32% of the net assets of the State Street Total Return V.I.S. Fund. These securities have been determined to be liquid using procedures established by the Fund’s Board of Directors . |
| (e) | Variable Rate Security - Interest rate shown is rate in effect at June 30, 2018. For securities based on a published reference rate and spread, the reference rate and spread are indicated in the description above. |
| (f) | Settlement is on a delayed delivery or when-issued basis with final maturity to be announced (TBA) in the future. |
| (h) | Security is in default. |
| (i) | Security is fair valued by the Valuation Committee, in accordance with the procedures approved by the Fund’s Board of Directors . Security value is determined based on level 3 inputs. |
| (j) | Sponsored by SSGA Funds Management, Inc., the Fund’s investment adviser and administrator, and an affiliate of State Street Bank & Trust Co., the Fund’s sub-administrator, custodian and accounting agent. |
| (k) | Coupon amount represents effective yield. |
| † | Percentages are based on net assets as of June 30, 2018. |
| ** | Amount is less than $0.50. |
Abbreviations:
| | |
| ADR | | American Depositary Receipt |
| GDR | | Global Depositary Receipt |
| LIBOR | | London Interbank Offered Rate |
| MBIA | | Municipal Bond Investors Assurance Corporation |
| NVDR | | Non-Voting Depositary Receipt |
| REIT | | Real Estate Investment Trust |
| SPDR | | Standard and Poor’s Depositary Receipt |
| TBA | | To Be Announced |
| | | | | | | | | | | | | | | | |
Investments | | Level 1 | | | Level 2 | | | Level 3 | | | Total | |
Investments in Securities | |
Domestic Equity | | $ | 802,268,572 | | | $ | 434,360 | | | $ | — | | | $ | 802,702,932 | |
Foreign Equity | | | 567,833,957 | | | | 261,055 | | | | — | | | | 568,095,012 | |
U.S. Treasuries | | | — | | | | 243,864,570 | | | | — | | | | 243,864,570 | |
U.S. Government Sponsored Agencies | | | — | | | | 1,002,760 | | | | — | | | | 1,002,760 | |
Agency Mortgage Backed | | | — | | | | 196,002,014 | | | | — | | | | 196,002,014 | |
Agency Collateralized Mortgage Obligations | | | — | | | | 4,884,272 | | | | — | | | | 4,884,272 | |
Asset Backed | | | — | | | | 3,516,601 | | | | — | | | | 3,516,601 | |
Corporate Notes | | | — | | | | 192,148,814 | | | | — | | | | 192,148,814 | |
Non-Agency Collateralized Mortgage Obligations | | | — | | | | 7,873,754 | | | | — | | | | 7,873,754 | |
Sovereign Bonds | | | — | | | | 10,195,412 | | | | — | | | | 10,195,412 | |
Municipal Bonds and Notes | | | — | | | | 5,068,078 | | | | — | | | | 5,068,078 | |
FNMA (TBA) | | | — | | | | — | | | | 8,172 | | | | 8,172 | |
Exchange Traded & Mutual Funds | | | 71,771,179 | | | | — | | | | — | | | | 71,771,179 | |
Short-Term Investments | | | 50,927,408 | | | | — | | | | — | | | | 50,927,408 | |
| | | | | | | | | | | | | | | | |
Total Investments in Securities | | $ | 1,424,508,172 | | | $ | 733,540,605 | | | $ | 8,172 | | | $ | 2,158,056,949 | |
| | | | | | | | | | | | | | | | |
Other Financial Instruments | | | | | | | | | | | | | | | | |
Long Futures Contracts - Unrealized Depreciation | | $ | (533,265 | ) | | $ | — | | | $ | — | | | $ | (533,265 | ) |
| | | | | | | | | | | | | | | | |
The Fund was invested in the following countries/territories at June 30, 2018 (unaudited):
| | | | |
Country/Territory | | Percentage (based on
Fair Value) | |
United States | | | 71.02 | % |
Japan | | | 4.38 | % |
United Kingdom | | | 3.56 | % |
Canada | | | 2.08 | % |
China | | | 1.99 | % |
France | | | 1.97 | % |
Germany | | | 1.93 | % |
Switzerland | | | 1.64 | % |
Australia | | | 1.34 | % |
South Korea | | | 0.94 | % |
Netherlands | | | 0.74 | % |
Taiwan | | | 0.72 | % |
Hong Kong | | | 0.68 | % |
Spain | | | 0.57 | % |
See Notes to Schedules of Investments and Notes to Financial Statements.
| | |
| State Street Total Return V.I.S. Fund | | |
| Schedule of Investments | | June 30, 2018 (Unaudited) |
|
| | | | |
Country/Territory | | Percentage (based on
Fair Value) | |
Ireland | | | 0.55 | % |
India | | | 0.54 | % |
Supranational | | | 0.48 | % |
Sweden | | | 0.48 | % |
South Africa | | | 0.43 | % |
Brazil | | | 0.39 | % |
Italy | | | 0.39 | % |
Mexico | | | 0.37 | % |
Denmark | | | 0.29 | % |
Singapore | | | 0.21 | % |
Russian Federation | | | 0.21 | % |
Belgium | | | 0.20 | % |
Finland | | | 0.18 | % |
Norway | | | 0.17 | % |
Malaysia | | | 0.15 | % |
Thailand | | | 0.14 | % |
Indonesia | | | 0.12 | % |
Philippines | | | 0.11 | % |
Chile | | | 0.10 | % |
Colombia | | | 0.10 | % |
Poland | | | 0.09 | % |
Israel | | | 0.09 | % |
Bermuda | | | 0.06 | % |
Luxembourg | | | 0.06 | % |
Austria | | | 0.06 | % |
Turkey | | | 0.05 | % |
Qatar | | | 0.05 | % |
Cayman Islands | | | 0.05 | % |
Peru | | | 0.05 | % |
New Zealand | | | 0.04 | % |
United Arab Emirates | | | 0.04 | % |
Hungary | | | 0.03 | % |
Portugal | | | 0.03 | % |
Uruguay | | | 0.02 | % |
Iraq | | | 0.02 | % |
Greece | | | 0.02 | % |
Panama | | | 0.02 | % |
Guernsey | | | 0.01 | % |
Czech Republic | | | 0.01 | % |
Isle Of Man | | | 0.01 | % |
Egypt | | | 0.01 | % |
Uae | | | 0.01 | % |
Romania | | | 0.00 | % |
Jersey | | | 0.00 | % |
Puerto Rico | | | 0.00 | % |
Monaco | | | 0.00 | % |
Virgin Islands | | | 0.00 | % |
| | | | |
| | | 100.00 | % |
| | | | |
The Fund’s % share of investment in the various categories, based on Fair Value, is as follows at June 30, 2018 (unaudited):
| | | | | | | | | | | | |
Industry | | Domestic | | | Foreign | | | Total | |
Diversified Banks | | | 1.72 | % | | | 3.40 | % | | | 5.12 | % |
Exchange Traded Funds | | | 3.33 | % | | | 0.00 | % | | | 3.33 | % |
Pharmaceuticals | | | 1.53 | % | | | 1.44 | % | | | 2.97 | % |
Internet Software & Services | | | 1.90 | % | | | 0.91 | % | | | 2.81 | % |
Integrated Oil & Gas | | | 1.01 | % | | | 1.23 | % | | | 2.24 | % |
Technology Hardware, Storage & Peripherals | | | 1.58 | % | | | 0.46 | % | | | 2.04 | % |
Semiconductors | | | 1.32 | % | | | 0.45 | % | | | 1.77 | % |
Internet & Direct Marketing Retail | | | 1.50 | % | | | 0.10 | % | | | 1.60 | % |
Systems Software | | | 1.45 | % | | | 0.05 | % | | | 1.50 | % |
Data Processing & Outsourced Services | | | 1.13 | % | | | 0.13 | % | | | 1.26 | % |
Healthcare Equipment | | | 0.85 | % | | | 0.41 | % | | | 1.26 | % |
Aerospace & Defense | | | 0.95 | % | | | 0.31 | % | | | 1.26 | % |
Biotechnology | | | 0.90 | % | | | 0.32 | % | | | 1.22 | % |
Integrated Telecommunication Services | | | 0.68 | % | | | 0.47 | % | | | 1.15 | % |
Electric Utilities | | | 0.66 | % | | | 0.41 | % | | | 1.07 | % |
Packaged Foods & Meats | | | 0.36 | % | | | 0.63 | % | | | 0.99 | % |
Industrial Conglomerates | | | 0.57 | % | | | 0.37 | % | | | 0.94 | % |
Life & Health Insurance | | | 0.26 | % | | | 0.64 | % | | | 0.90 | % |
Oil & Gas Exploration & Production | | | 0.61 | % | | | 0.28 | % | | | 0.89 | % |
Automobile Manufacturers | | | 0.15 | % | | | 0.71 | % | | | 0.86 | % |
Application Software | | | 0.54 | % | | | 0.29 | % | | | 0.83 | % |
See Notes to Schedules of Investments and Notes to Financial Statements.
| | |
| State Street Total Return V.I.S. Fund | | |
| Schedule of Investments | | June 30, 2018 (Unaudited) |
|
| | | | | | | | | | | | |
Industry | | Domestic | | | Foreign | | | Total | |
Regional Banks | | | 0.47 | % | | | 0.29 | % | | | 0.76 | % |
Managed Healthcare | | | 0.70 | % | | | 0.03 | % | | | 0.73 | % |
IT Consulting & Other Services | | | 0.31 | % | | | 0.39 | % | | | 0.70 | % |
Industrial Machinery | | | 0.26 | % | | | 0.43 | % | | | 0.69 | % |
Household Products | | | 0.50 | % | | | 0.18 | % | | | 0.68 | % |
Multi-Sector Holdings | | | 0.57 | % | | | 0.11 | % | | | 0.68 | % |
Tobacco | | | 0.36 | % | | | 0.28 | % | | | 0.64 | % |
Railroads | | | 0.35 | % | | | 0.29 | % | | | 0.64 | % |
Soft Drinks | | | 0.54 | % | | | 0.06 | % | | | 0.60 | % |
Asset Management & Custody Banks | | | 0.38 | % | | | 0.17 | % | | | 0.55 | % |
Cable & Satellite | | | 0.32 | % | | | 0.23 | % | | | 0.55 | % |
Multi-Utilities | | | 0.34 | % | | | 0.21 | % | | | 0.55 | % |
Apparel, Accessories & Luxury Goods | | | 0.14 | % | | | 0.40 | % | | | 0.54 | % |
Multi-Line Insurance | | | 0.13 | % | | | 0.39 | % | | | 0.52 | % |
Restaurants | | | 0.40 | % | | | 0.12 | % | | | 0.52 | % |
Specialty Chemicals | | | 0.18 | % | | | 0.33 | % | | | 0.51 | % |
Property & Casualty Insurance | | | 0.17 | % | | | 0.34 | % | | | 0.51 | % |
Personal Products | | | 0.06 | % | | | 0.44 | % | | | 0.50 | % |
Financial Exchanges & Data | | | 0.34 | % | | | 0.15 | % | | | 0.49 | % |
Home Improvement Retail | | | 0.47 | % | | | 0.01 | % | | | 0.48 | % |
Communications Equipment | | | 0.37 | % | | | 0.11 | % | | | 0.48 | % |
Diversified Chemicals | | | 0.26 | % | | | 0.22 | % | | | 0.48 | % |
Wireless Telecommunication Services | | | 0.00 | % | | | 0.47 | % | | | 0.47 | % |
Diversified Metals & Mining | | | 0.00 | % | | | 0.47 | % | | | 0.47 | % |
Hypermarkets & Super Centers | | | 0.33 | % | | | 0.12 | % | | | 0.45 | % |
Specialized REITs | | | 0.44 | % | | | 0.00 | % | | | 0.44 | % |
Investment Banking & Brokerage | | | 0.36 | % | | | 0.08 | % | | | 0.44 | % |
Oil & Gas Refining & Marketing | | | 0.24 | % | | | 0.18 | % | | | 0.42 | % |
Movies & Entertainment | | | 0.37 | % | | | 0.05 | % | | | 0.42 | % |
Electrical Components & Equipment | | | 0.18 | % | | | 0.21 | % | | | 0.39 | % |
Life Sciences Tools & Services | | | 0.29 | % | | | 0.09 | % | | | 0.38 | % |
Trading Companies & Distributors | | | 0.06 | % | | | 0.29 | % | | | 0.35 | % |
Retail REITs | | | 0.16 | % | | | 0.18 | % | | | 0.34 | % |
Healthcare Services | | | 0.25 | % | | | 0.09 | % | | | 0.34 | % |
Construction Machinery & Heavy Trucks | | | 0.19 | % | | | 0.15 | % | | | 0.34 | % |
Food Retail | | | 0.03 | % | | | 0.30 | % | | | 0.33 | % |
Oil & Gas Storage & Transportation | | | 0.12 | % | | | 0.21 | % | | | 0.33 | % |
Oil & Gas Equipment & Services | | | 0.25 | % | | | 0.08 | % | | | 0.33 | % |
Semiconductor Equipment | | | 0.14 | % | | | 0.18 | % | | | 0.32 | % |
Air Freight & Logistics | | | 0.24 | % | | | 0.07 | % | | | 0.31 | % |
Apparel Retail | | | 0.17 | % | | | 0.14 | % | | | 0.31 | % |
Electronic Components | | | 0.08 | % | | | 0.23 | % | | | 0.31 | % |
Consumer Finance | | | 0.26 | % | | | 0.03 | % | | | 0.29 | % |
Construction & Engineering | | | 0.04 | % | | | 0.24 | % | | | 0.28 | % |
Auto Parts & Equipment | | | 0.01 | % | | | 0.27 | % | | | 0.28 | % |
Steel | | | 0.03 | % | | | 0.25 | % | | | 0.28 | % |
Brewers | | | 0.02 | % | | | 0.25 | % | | | 0.27 | % |
Building Products | | | 0.09 | % | | | 0.18 | % | | | 0.27 | % |
Commodity Chemicals | | | 0.06 | % | | | 0.20 | % | | | 0.26 | % |
Research & Consulting Services | | | 0.07 | % | | | 0.19 | % | | | 0.26 | % |
Distillers & Vintners | | | 0.08 | % | | | 0.17 | % | | | 0.25 | % |
Home Entertainment Software | | | 0.18 | % | | | 0.07 | % | | | 0.25 | % |
Industrial Gases | | | 0.12 | % | | | 0.13 | % | | | 0.25 | % |
Hotels, Resorts & Cruise Lines | | | 0.17 | % | | | 0.07 | % | | | 0.24 | % |
Diversified Real Estate Activities | | | 0.00 | % | | | 0.24 | % | | | 0.24 | % |
Construction Materials | | | 0.05 | % | | | 0.19 | % | | | 0.24 | % |
Airlines | | | 0.16 | % | | | 0.06 | % | | | 0.22 | % |
Casinos & Gaming | | | 0.04 | % | | | 0.16 | % | | | 0.20 | % |
Diversified Capital Markets | | | 0.00 | % | | | 0.20 | % | | | 0.20 | % |
Footwear | | | 0.16 | % | | | 0.04 | % | | | 0.20 | % |
Electronic Equipment & Instruments | | | 0.01 | % | | | 0.18 | % | | | 0.19 | % |
General Merchandise Stores | | | 0.13 | % | | | 0.06 | % | | | 0.19 | % |
Healthcare Supplies | | | 0.09 | % | | | 0.09 | % | | | 0.18 | % |
Insurance Brokers | | | 0.08 | % | | | 0.09 | % | | | 0.17 | % |
Consumer Electronics | | | 0.00 | % | | | 0.15 | % | | | 0.15 | % |
Residential REITs | | | 0.15 | % | | | 0.00 | % | | | 0.15 | % |
Home Building | | | 0.05 | % | | | 0.10 | % | | | 0.15 | % |
Electronic Manufacturing Services | | | 0.01 | % | | | 0.14 | % | | | 0.15 | % |
Gold | | | 0.03 | % | | | 0.11 | % | | | 0.14 | % |
Gas Utilities | | | 0.01 | % | | | 0.13 | % | | | 0.14 | % |
Real Estate Development | | | 0.00 | % | | | 0.14 | % | | | 0.14 | % |
Office REITs | | | 0.08 | % | | | 0.06 | % | | | 0.14 | % |
Paper Packaging | | | 0.09 | % | | | 0.04 | % | | | 0.13 | % |
Real Estate Operating Companies | | | 0.00 | % | | | 0.13 | % | | | 0.13 | % |
Healthcare Distributors | | | 0.10 | % | | | 0.03 | % | | | 0.13 | % |
Industrial REITs | | | 0.07 | % | | | 0.06 | % | | | 0.13 | % |
Fertilizers & Agricultural Chemicals | | | 0.06 | % | | | 0.07 | % | | | 0.13 | % |
See Notes to Schedules of Investments and Notes to Financial Statements.
| | |
| State Street Total Return V.I.S. Fund | | |
Schedule of Investments | | June 30, 2018 (Unaudited) |
| | | | | | | | | | | | |
Industry | | Domestic | | | Foreign | | | Total | |
Department Stores | | | 0.05 | % | | | 0.07 | % | | | 0.12 | % |
Healthcare Facilities | | | 0.06 | % | | | 0.06 | % | | | 0.12 | % |
Reinsurance | | | 0.00 | % | | | 0.12 | % | | | 0.12 | % |
Advertising | | | 0.04 | % | | | 0.07 | % | | | 0.11 | % |
Automotive Retail | | | 0.09 | % | | | 0.02 | % | | | 0.11 | % |
Diversified REITs | | | 0.00 | % | | | 0.11 | % | | | 0.11 | % |
Thrifts & Mortgage Finance | | | 0.00 | % | | | 0.11 | % | | | 0.11 | % |
Agricultural & Farm Machinery | | | 0.07 | % | | | 0.04 | % | | | 0.11 | % |
Health Care REITs | | | 0.11 | % | | | 0.00 | % | | | 0.11 | % |
Environmental & Facilities Services | | | 0.08 | % | | | 0.03 | % | | | 0.11 | % |
Human Resource & Employment Services | | | 0.01 | % | | | 0.09 | % | | | 0.10 | % |
Drug Retail | | | 0.08 | % | | | 0.02 | % | | | 0.10 | % |
Other Diversified Financial Services | | | 0.00 | % | | | 0.09 | % | | | 0.09 | % |
Specialty Stores | | | 0.07 | % | | | 0.02 | % | | | 0.09 | % |
Paper Products | | | 0.00 | % | | | 0.09 | % | | | 0.09 | % |
Broadcasting | | | 0.05 | % | | | 0.04 | % | | | 0.09 | % |
Diversified Support Services | | | 0.04 | % | | | 0.05 | % | | | 0.09 | % |
Tires & Rubber | | | 0.01 | % | | | 0.07 | % | | | 0.08 | % |
Airport Services | | | 0.00 | % | | | 0.08 | % | | | 0.08 | % |
Leisure Products | | | 0.03 | % | | | 0.04 | % | | | 0.07 | % |
Heavy Electrical Equipment | | | 0.00 | % | | | 0.07 | % | | | 0.07 | % |
Food Distributors | | | 0.05 | % | | | 0.02 | % | | | 0.07 | % |
Agricultural Products | | | 0.04 | % | | | 0.03 | % | | | 0.07 | % |
Trucking | | | 0.02 | % | | | 0.05 | % | | | 0.07 | % |
Copper | | | 0.04 | % | | | 0.03 | % | | | 0.07 | % |
Water Utilities | | | 0.02 | % | | | 0.04 | % | | | 0.06 | % |
Independent Power Producers & Energy Traders | | | 0.02 | % | | | 0.04 | % | | | 0.06 | % |
Healthcare Technology | | | 0.04 | % | | | 0.02 | % | | | 0.06 | % |
Highways & Railtracks | | | 0.00 | % | | | 0.06 | % | | | 0.06 | % |
Household Appliances | | | 0.01 | % | | | 0.05 | % | | | 0.06 | % |
Education Services | | | 0.00 | % | | | 0.05 | % | | | 0.05 | % |
Hotel & Resort REITs | | | 0.05 | % | | | 0.00 | % | | | 0.05 | % |
Publishing | | | 0.01 | % | | | 0.04 | % | | | 0.05 | % |
Distributors | | | 0.04 | % | | | 0.01 | % | | | 0.05 | % |
Security & Alarm Services | | | 0.00 | % | | | 0.04 | % | | | 0.04 | % |
Computer & Electronics Retail | | | 0.03 | % | | | 0.01 | % | | | 0.04 | % |
Alternative Carriers | | | 0.03 | % | | | 0.01 | % | | | 0.04 | % |
Marine | | | 0.00 | % | | | 0.04 | % | | | 0.04 | % |
Leisure Facilities | | | 0.00 | % | | | 0.04 | % | | | 0.04 | % |
Metal & Glass Containers | | | 0.02 | % | | | 0.02 | % | | | 0.04 | % |
Coal & Consumable Fuels | | | 0.00 | % | | | 0.04 | % | | | 0.04 | % |
Home Furnishings | | | 0.03 | % | | | 0.00 | % | | | 0.03 | % |
Real Estate Services | | | 0.02 | % | | | 0.01 | % | | | 0.03 | % |
Home Furnishing Retail | | | 0.00 | % | | | 0.03 | % | | | 0.03 | % |
Aluminum | | | 0.00 | % | | | 0.03 | % | | | 0.03 | % |
Motorcycle Manufacturers | | | 0.01 | % | | | 0.02 | % | | | 0.03 | % |
Oil & Gas Drilling | | | 0.01 | % | | | 0.02 | % | | | 0.03 | % |
Marine Ports & Services | | | 0.00 | % | | | 0.03 | % | | | 0.03 | % |
Commercial Printing | | | 0.00 | % | | | 0.02 | % | | | 0.02 | % |
Technology Distributors | | | 0.00 | % | | | 0.02 | % | | | 0.02 | % |
Housewares & Specialties | | | 0.02 | % | | | 0.00 | % | | | 0.02 | % |
Mortgage REITs | | | 0.02 | % | | | 0.00 | % | | | 0.02 | % |
Office Services & Supplies | | | 0.00 | % | | | 0.02 | % | | | 0.02 | % |
Specialized Consumer Services | | | 0.02 | % | | | 0.00 | % | | | 0.02 | % |
Renewable Electricity | | | 0.00 | % | | | 0.01 | % | | | 0.01 | % |
Silver | | | 0.00 | % | | | 0.01 | % | | | 0.01 | % |
Forest Products | | | 0.00 | % | | | 0.01 | % | | | 0.01 | % |
Specialized Finance | | | 0.00 | % | | | 0.01 | % | | | 0.01 | % |
Precious Metals & Minerals | | | 0.00 | % | | | 0.01 | % | | | 0.01 | % |
Textiles | | | 0.00 | % | | | 0.01 | % | | | 0.01 | % |
| | | | | | | | | | | | |
| | | | | | | | | | | 66.85 | % |
| | | | | | | | | | | | |
| | | | |
Sector | | Percentage (based on
Fair Value) | |
U.S. Treasuries | | | 11.30 | % |
Agency Mortgage Backed | | | 9.08 | % |
Corporate Notes | | | 8.90 | % |
Sovereign Bonds | | | 0.47 | % |
Non-Agency Collateralized Mortgage Obligations | | | 0.37 | % |
Municipal Bonds and Notes | | | 0.23 | % |
Agency Collateralized Mortgage Obligations | | | 0.23 | % |
Asset Backed | | | 0.16 | % |
U.S. Government Sponsored Agencies | | | 0.05 | % |
FNMA (TBA) | | | 0.00 | % |
| | | | |
| | | 30.79 | % |
| | | | |
| |
Short-Term Investments | | | |
Short-Term Investments | | | 2.36 | % |
| | | | |
| | | 2.36 | % |
| | | | |
| | | 100.00 | % |
| | | | |
See Notes to Schedules of Investments and Notes to Financial Statements.
| (b) | Not applicable to the Registrant. |
| Item 7. | Disclosure of Proxy Voting Policies and Procedures for Closed-End Management Investment Companies. |
Not applicable to the Registrant.
| Item 8. | Portfolio Managers of Closed-End Management Investment Companies. |
Not applicable to the Registrant.
| Item 9. | Purchases of Equity Securities by Closed-End Management Investment Company and Affiliated Purchasers. |
Not applicable to the Registrant.
| Item 10. | Submission of Matters to a Vote of Security Holders. |
There were no material changes to the procedures by which shareholders may recommend nominees to the Registrant’s Board of Directors.
| Item 11. | Controls and Procedures. |
(a) The Registrant’s principal executive officer and principal financial officer have concluded that the Registrant’s disclosure controls and procedures (as defined in Rule 30a-3(c) under the Investment Company Act of 1940, as amended (the “1940 Act”)) are effective to provide reasonable assurance that information required to be disclosed by the Registrant on Form N-CSR is recorded, processed, summarized and reported as of a date within 90 days of the filing date of this report, based on their evaluation of these controls and procedures required by Rule 30a-3(b) under the 1940 Act and Rules 13a-15(b) or 15d-15(b) under the Securities Exchange Act of 1934, as amended.
(b) There were no changes in the Registrant’s internal control over financial reporting (as defined in Rule 30a-3(d) under the 1940 Act) that occurred during the Registrant’s last fiscal quarter of the period covered by this Form N-CSR filing that have materially affected, or are reasonably likely to materially affect, the Registrant’s internal control over financial reporting.
| Item 12. | Disclosure of Securities Lending Activities for Closed-End Management Investment Companies. |
| | |
| (a)(1) | | Not applicable; this Form N-CSR is a Semi-Annual Report. |
| |
| (a)(2) | | Certifications of principal executive officer and principal financial and accounting officer of the Registrant as required by Rule 30a-2(a) under the 1940 Act are attached hereto. |
| |
| (a)(3) | | Not applicable to the Registrant. |
| |
| (a)(4) | | Not applicable. |
| |
| (b) | | Certifications of principal executive officer and principal financial and accounting officer of the Registrant as required by Rule 30a-2(b) under the 1940 Act and Section 906 of the Sarbanes-Oxley Act of 2002 are attached hereto. |
SIGNATURES
Pursuant to the requirements of the Securities Exchange Act of 1934 and the Investment Company Act of 1940, the Registrant has duly caused this report to be signed on its behalf by the undersigned, thereunto duly authorized.
Registrant: STATE STREET VARIABLE INSURANCE SERIES FUNDS, INC.
| | |
| By: | | /s/ Jeanne M. La Porta |
| | Jeanne M. La Porta |
| | President |
| |
| Date: | | August 17, 2018 |
Pursuant to the requirements of the Securities Exchange Act of 1934 and the Investment Company Act of 1940, this report has been signed below by the following persons on behalf of the Registrant and in the capacities and on the dates indicated.
| | |
| By: | | /s/ Jeanne M. La Porta |
| | Jeanne M. La Porta |
| | President (Principal Executive Officer) |
| |
| Date: | | August 17, 2018 |
| |
| By: | | /s/ Arthur A. Jensen |
| | Arthur A. Jensen |
| | Treasurer (Principal Financial Officer) |
| |
| Date: | | August 17, 2018 |