Table of Contents
UNITED STATES
SECURITIES AND EXCHANGE COMMISSION
Washington, D.C. 20549
FORMN-CSR
CERTIFIED SHAREHOLDER REPORT OF REGISTERED
MANAGEMENT INVESTMENT COMPANIES
Investment Company Act file number:811-04041
STATE STREET VARIABLE INSURANCE SERIES FUNDS, INC.
(Exact name of registrant as specified in charter)
One Iron Street
Boston, Massachusetts 02210
(Address of principal executive offices)(Zip code)
| (Name and Address of Agent for Service) | Copy to: | |
Sean O’Malley, Esq. Senior Vice President and Deputy General Counsel c/o SSGA Funds Management, Inc. One Iron Street Boston, Massachusetts 02210 | Timothy W. Diggins, Esq. Ropes & Gray LLP 800 Boylston Street Boston, Massachusetts 02199-3600 | |
Registrant’s telephone number, including area code:800-242-0134
Date of fiscal year end: December 31
Date of reporting period: June 30, 2019
Table of Contents
| Item 1. | Shareholder Reports. |
Table of Contents
Semi-Annual Report
June 30, 2019
State Street S&P 500 Index V.I.S. Fund
Beginning on January 1, 2021, as permitted by regulations adopted by the U.S. Securities and Exchange Commission, paper copies of a Fund’s annual and semi-annual shareholder reports will no longer be sent by mail, unless you specifically request paper copies of the reports. Instead, the reports will be made available on a Fund’s website (www.ssga.com/geam), and you will be notified by mail each time a report is posted, and provided with a website link to access the report. If you already elected to receive shareholder reports electronically, you will not be affected by this change and you need not take any action.
You may elect to receive all future reports in paper free of charge. To do so, contact your Insurance Provider. Your election to receive reports in paper will apply to all funds held in your account.

Table of Contents
State Street S&P 500 Index V.I.S. Fund
Semi-Annual Report
June 30, 2019 (Unaudited)
| Page | ||||
| Fund Information | 1 | |||
| Understanding Your Fund’s Expenses | 2 | |||
| Schedule of Investments | 3 | |||
| Financial Statements | ||||
| 13 | ||||
| 14 | ||||
| 15 | ||||
| 16 | ||||
| Notes to Financial Statements | 17 | |||
| Other Information | 22 | |||
This report is prepared for Policyholders of certain variable contracts and may be distributed to others only if preceded or accompanied by the variable contract’s current prospectus and the current summary prospectus of the Fund available for investments thereunder.
Table of Contents
State Street S&P 500 Index V.I.S. Fund
Fund Information — June 30, 2019 (Unaudited)
Total return performance shown in this report for the Fund takes into account changes in share price and assumes reinvestment of dividends and capital gains distributions, if any. Total returns shown are net of Fund fees and expenses but do not reflect fees and charges associated with the variable contracts such as administrative fees, account charges and surrender charges, which, if reflected, would reduce the Fund’s total returns for all periods shown.
The performance data quoted represents past performance; past performance does not guarantee future results. Investment return and principal value will fluctuate so your shares, when redeemed, may be worth more or less than their original cost. Current performance may be higher or lower than the performance data quoted. Periods less than one year are not annualized. Please call toll-free (800) 242-0134 or visit the Fund’s website at http://www.ssga.com/geam for the most recent month-end performance data.
An investment in the Fund is not a deposit of any bank and is not insured or guaranteed by the Federal Deposit Insurance Corporation (“FDIC”) or any other government agency. An investment in the Fund is subject to risk, including possible loss of principal invested.
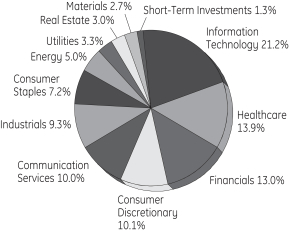
Sector Allocation
Portfolio Composition as a % of Fair Value of $177,097 (in thousands) as of June 30, 2019(a)(b)
Top Ten Largest Holdings
as of June 30, 2019 (as a % of Fair Value)(a)(b)
Microsoft Corp. | 4.14 | % | ||
Apple Inc. | 3.50 | % | ||
Amazon.com Inc. | 3.16 | % | ||
Facebook Inc., Class A | 1.86 | % | ||
Berkshire Hathaway Inc., Class B | 1.67 | % | ||
Johnson & Johnson | 1.50 | % | ||
JPMorgan Chase & Co. | 1.47 | % | ||
Alphabet Inc., Class C | 1.34 | % | ||
Exxon Mobil Corp. | 1.31 | % | ||
Alphabet Inc., Class A | 1.31 | % | ||
| (a) | Fair Value basis is inclusive of short-term investment in State Street Institutional U.S. Government Money Market Fund Class G Shares. |
| (b) | The securities information regarding holdings, allocations and other characteristics is presented to illustrate examples of securities that the Fund has bought and the diversity of areas in which the Fund may invest as of a particular date. It may not be representative of the Fund’s current or future investments and should not be construed as a recommendation to purchase or sell a particular security. |
State Street Global Advisors Funds Distributors, LLC, member of FINRA & SIPC is the principal underwriter and distributor of the State Street V.I.S. Funds and an indirect wholly-owned subsidiary of State Street Corporation. References to State Street may include State Street Corporation and its affiliates. The Funds pay State Street Bank and Trust Company for its services as custodian and Fund Accounting agent, and pay SSGA Funds Management, Inc. for investment advisory and administrative services.
| State Street S&P 500 Index V.I.S. Fund | 1 |
Table of Contents
State Street S&P 500 Index V.I.S. Fund
Understanding Your Fund’s Expenses — June 30, 2019 (Unaudited)
As a shareholder of the Fund, you incur ongoing costs. Ongoing costs include portfolio management fees, professional fees, administrative fees and other Fund expenses. The following example is intended to help you understand your ongoing costs (in dollars) of investing in the Fund and to compare these costs with the ongoing costs of investing in other mutual funds.
To illustrate these ongoing costs, we have provided an example and calculated the expenses paid by investors in the Fund during the period. The information in the following table is based on an investment of $1,000, which is invested at the beginning of the period and held for the entiresix-month period ended June 30, 2019.
Actual Expenses
The first section of the table provides information about actual account values and actual expenses. You may use the information in this section, together with the amount you invested, to estimate the expenses that you paid over the period. To do so, simply divide your account value by $1,000 (for example, an $8,600 account value divided by $1,000 = 8.6), then multiply the result by the number given under the heading “Expenses paid during the period” to estimate the expenses you paid on your account during the period.
Hypothetical Example for Comparison Purposes
The second section of the table provides information about hypothetical account values and hypothetical expenses based on the Fund’s actual expense ratio and an assumed rate of return of 5% per year before expenses, which is not the Fund’s actual return. The hypothetical account values and expenses may not be used to estimate the actual ending account balance or expenses you paid for the period. You may use this information to compare the ongoing costs of investing in the Fund and other funds. To do so, compare this 5% hypothetical example with the 5% hypothetical examples that appear in the shareholder reports of other funds.
Please note that the expenses shown in the table are meant to highlight and help you compare ongoing costs only and do not reflect transaction costs, such as sales charges or redemption fees, if any. Therefore, the second section of the table is useful in comparing ongoing costs only, and will not help you determine the relative total costs of owning different funds. Additionally, the expenses shown do not reflect the fees or charges associated with variable contracts through which shares of the Fund are offered.
| Actual Fund Return | Hypothetical 5% Return (2.5% for the period) | |||||||
Actual Fund Return | ||||||||
Beginning Account Value January 1, 2019 | $ | 1,000.00 | $ | 1,000.00 | ||||
Ending Account Value June 30, 2019 | $ | 1,183.30 | $ | 1,023.11 | ||||
Expenses Paid During Period* | $ | 1.84 | $ | 1.71 | ||||
| * | Expenses are equal to the Fund’s annualized expense ratio of 0.34% (for the period January 1, 2019-June 30, 2019), multiplied by the average account value over the period, multiplied by 181/365 (to reflect theone-half year period). |
| 2 | State Street S&P 500 Index V.I.S. Fund |
Table of Contents
State Street S&P 500 Index V.I.S. Fund
Schedule of Investments — June 30, 2019 (Unaudited)
| Number of Shares | Fair Value $ | |||||||
| Common Stock - 98.7%† |
| |||||||
Advertising - 0.1% |
| |||||||
Omnicom Group Inc. | 1,543 | 126,449 | ||||||
The Interpublic Group of Companies Inc. | 2,720 | 61,445 | ||||||
|
| |||||||
| 187,894 | ||||||||
|
| |||||||
Aerospace & Defense - 2.6% |
| |||||||
Arconic Inc. | 2,788 | 71,986 | ||||||
General Dynamics Corp. | 1,912 | 347,640 | ||||||
Huntington Ingalls Industries Inc. | 300 | 67,422 | ||||||
L3 Technologies Inc. | 589 | 144,405 | ||||||
L3Harris Technologies Inc. | 800 | 151,304 | ||||||
Lockheed Martin Corp. | 1,768 | 642,739 | ||||||
Northrop Grumman Corp. | 1,197 | 386,763 | ||||||
Raytheon Co. | 2,061 | 358,367 | ||||||
Textron Inc. | 1,525 | 80,886 | ||||||
The Boeing Co. | 3,723 | 1,355,209 | ||||||
TransDigm Group Inc. (a) | 333 | 161,105 | ||||||
United Technologies Corp. | 5,852 | 761,930 | ||||||
|
| |||||||
| 4,529,756 | ||||||||
|
| |||||||
Agricultural & Farm Machinery - 0.2% |
| |||||||
Deere & Co. | 2,306 | 382,127 | ||||||
|
| |||||||
Agricultural Products - 0.1% |
| |||||||
Archer-Daniels-Midland Co. | 3,924 | 160,099 | ||||||
|
| |||||||
Air Freight & Logistics - 0.5% |
| |||||||
CH Robinson Worldwide Inc. | 1,029 | 86,796 | ||||||
Expeditors International of Washington Inc. | 1,199 | 90,956 | ||||||
FedEx Corp. | 1,688 | 277,153 | ||||||
United Parcel Service Inc., Class B | 4,976 | 513,871 | ||||||
|
| |||||||
| 968,776 | ||||||||
|
| |||||||
Airlines - 0.4% |
| |||||||
Alaska Air Group Inc. (b) | 1,000 | 63,910 | ||||||
American Airlines Group Inc. | 3,098 | 101,026 | ||||||
Delta Air Lines Inc. | 4,306 | 244,365 | ||||||
Southwest Airlines Co. | 3,734 | 189,613 | ||||||
United Continental Holdings Inc. (a) | 1,650 | 144,457 | ||||||
|
| |||||||
| 743,371 | ||||||||
|
| |||||||
Alternative Carriers - 0.0%* |
| |||||||
CenturyLink Inc. | 7,333 | 86,236 | ||||||
|
| |||||||
Aluminum - 0.0%* |
| |||||||
Alcoa Corp. (a)(b) | 1 | 23 | ||||||
|
| |||||||
| Number of Shares | Fair Value $ | |||||||
Apparel Retail - 0.5% |
| |||||||
Foot Locker Inc. | 800 | 33,536 | ||||||
L Brands Inc. | 1,488 | 38,837 | ||||||
Ross Stores Inc. | 2,696 | 267,227 | ||||||
The Gap Inc. | 1,676 | 30,118 | ||||||
The TJX Companies Inc. | 8,895 | 470,368 | ||||||
|
| |||||||
| 840,086 | ||||||||
|
| |||||||
Apparel, Accessories & Luxury Goods - 0.3% |
| |||||||
Capri Holdings Ltd. (a) | 1,222 | 42,379 | ||||||
Hanesbrands Inc. | 2,400 | 41,328 | ||||||
PVH Corp. | 518 | 49,024 | ||||||
Ralph Lauren Corp. | 400 | 45,436 | ||||||
Tapestry Inc. | 2,289 | 72,630 | ||||||
Under Armour Inc., Class A (a) | 1,700 | 43,095 | ||||||
Under Armour Inc., Class C (a) | 1,712 | 38,006 | ||||||
VF Corp. | 2,402 | 209,815 | ||||||
|
| |||||||
| 541,713 | ||||||||
|
| |||||||
Application Software - 1.7% |
| |||||||
Adobe Inc. (a)(b) | 3,509 | 1,033,927 | ||||||
ANSYS Inc. (a) | 600 | 122,892 | ||||||
Autodesk Inc. (a) | 1,548 | 252,169 | ||||||
Cadence Design Systems Inc. (a) | 1,900 | 134,539 | ||||||
Citrix Systems Inc. | 907 | 89,013 | ||||||
Intuit Inc. | 1,787 | 466,997 | ||||||
salesforce.com Inc. (a) | 5,512 | 836,336 | ||||||
Synopsys Inc. (a) | 999 | 128,561 | ||||||
Verint Systems Inc. (a) | 1 | 54 | ||||||
|
| |||||||
| 3,064,488 | ||||||||
|
| |||||||
Asset Management & Custody Banks - 0.8% |
| |||||||
Affiliated Managers Group Inc. (b) | 400 | 36,856 | ||||||
Ameriprise Financial Inc. | 1,005 | 145,886 | ||||||
BlackRock Inc. | 859 | 403,129 | ||||||
Franklin Resources Inc. | 2,000 | 69,600 | ||||||
Invesco Ltd. | 3,250 | 66,495 | ||||||
Northern Trust Corp. | 1,496 | 134,640 | ||||||
State Street Corp. (c) | 2,611 | 146,373 | ||||||
T Rowe Price Group Inc. | 1,740 | 190,895 | ||||||
The Bank of New York Mellon Corp. | 6,337 | 279,778 | ||||||
|
| |||||||
| 1,473,652 | ||||||||
|
| |||||||
Auto Parts & Equipment - 0.1% |
| |||||||
Aptiv PLC | 1,856 | 150,021 | ||||||
BorgWarner Inc. | 1,347 | 56,547 | ||||||
|
| |||||||
| 206,568 | ||||||||
|
| |||||||
See Notes to Schedule of Investments and Notes to Financial Statements.
| State Street S&P 500 Index V.I.S. Fund | 3 |
Table of Contents
State Street S&P 500 Index V.I.S. Fund
Schedule of Investments, continued — June 30, 2019 (Unaudited)
| Number of Shares | Fair Value $ | |||||||
Automobile Manufacturers - 0.4% |
| |||||||
Ford Motor Co. | 27,626 | 282,614 | ||||||
General Motors Co. | 9,486 | 365,496 | ||||||
|
| |||||||
| 648,110 | ||||||||
|
| |||||||
Automotive Retail - 0.3% |
| |||||||
Advance Auto Parts Inc. (b) | 522 | 80,461 | ||||||
AutoZone Inc. (a) | 186 | 204,501 | ||||||
CarMax Inc. (a) | 1,190 | 103,328 | ||||||
O’Reilly Automotive Inc. (a) | 549 | 202,757 | ||||||
|
| |||||||
| 591,047 | ||||||||
|
| |||||||
Biotechnology - 2.1% |
| |||||||
AbbVie Inc. (b) | 10,463 | 760,869 | ||||||
Alexion Pharmaceuticals Inc. (a)(b) | 1,601 | 209,699 | ||||||
Amgen Inc. | 4,464 | 822,626 | ||||||
Biogen Inc. (a) | 1,358 | 317,595 | ||||||
Celgene Corp. (a) | 4,957 | 458,225 | ||||||
Gilead Sciences Inc. | 9,051 | 611,486 | ||||||
Incyte Corp. (a) | 1,200 | 101,952 | ||||||
Regeneron Pharmaceuticals Inc. (a) | 550 | 172,150 | ||||||
Vertex Pharmaceuticals Inc. (a) | 1,800 | 330,084 | ||||||
|
| |||||||
| 3,784,686 | ||||||||
|
| |||||||
Brewers - 0.0%* |
| |||||||
Molson Coors Brewing Co., Class B | 1,298 | 72,688 | ||||||
|
| |||||||
Broadcasting - 0.2% |
| |||||||
CBS Corp., Class B | 2,596 | 129,540 | ||||||
Discovery Inc., Class A (a) | 1,106 | 33,954 | ||||||
Discovery Inc., Class C (a) | 2,636 | 74,994 | ||||||
Fox Corp., Class A (a) | 2,615 | 95,814 | ||||||
Fox Corp., Class B (a) | 1,130 | 41,279 | ||||||
|
| |||||||
| 375,581 | ||||||||
|
| |||||||
Building Products - 0.3% |
| |||||||
Allegion PLC (b) | 733 | 81,033 | ||||||
AO Smith Corp. (b) | 972 | 45,839 | ||||||
Fortune Brands Home & Security Inc. | 1,000 | 57,130 | ||||||
Johnson Controls International PLC | 5,742 | 237,202 | ||||||
Masco Corp. | 2,224 | 87,270 | ||||||
|
| |||||||
| 508,474 | ||||||||
|
| |||||||
Cable & Satellite - 1.1% |
| |||||||
Charter Communications Inc., Class A (a) | 1,255 | 495,951 | ||||||
Comcast Corp., Class A | 32,285 | 1,365,010 | ||||||
| Number of Shares | Fair Value $ | |||||||
DISH Network Corp., Class A (a) | 1,500 | 57,615 | ||||||
|
| |||||||
| 1,918,576 | ||||||||
|
| |||||||
Casinos & Gaming - 0.1% |
| |||||||
MGM Resorts International | 3,500 | 99,995 | ||||||
Wynn Resorts Ltd. | 751 | 93,116 | ||||||
|
| |||||||
| 193,111 | ||||||||
|
| |||||||
Commodity Chemicals - 0.3% |
| |||||||
Dow Inc. (a) | 5,284 | 260,554 | ||||||
LyondellBasell Industries N.V., Class A | 2,110 | 181,734 | ||||||
|
| |||||||
| 442,288 | ||||||||
|
| |||||||
Communications Equipment - 1.2% |
| |||||||
Arista Networks Inc. (a) | 350 | 90,867 | ||||||
Cisco Systems Inc. | 30,699 | 1,680,156 | ||||||
F5 Networks Inc. (a) | 400 | 58,252 | ||||||
Juniper Networks Inc. | 2,800 | 74,564 | ||||||
Motorola Solutions Inc. | 1,144 | 190,739 | ||||||
|
| |||||||
| 2,094,578 | ||||||||
|
| |||||||
Computer & Electronics Retail - 0.1% |
| |||||||
Best Buy Company Inc. | 1,712 | 119,378 | ||||||
|
| |||||||
Construction & Engineering - 0.1% |
| |||||||
Jacobs Engineering Group Inc. | 850 | 71,731 | ||||||
Quanta Services Inc. | 1,200 | 45,828 | ||||||
|
| |||||||
| 117,559 | ||||||||
|
| |||||||
Construction Machinery & Heavy Trucks - 0.6% |
| |||||||
Caterpillar Inc. | 4,108 | 559,879 | ||||||
Cummins Inc. | 1,056 | 180,935 | ||||||
PACCAR Inc. | 2,403 | 172,199 | ||||||
Wabtec Corp. | 997 | 71,545 | ||||||
|
| |||||||
| 984,558 | ||||||||
|
| |||||||
Construction Materials - 0.1% |
| |||||||
Martin Marietta Materials Inc. | 400 | 92,044 | ||||||
Vulcan Materials Co. | 973 | 133,603 | ||||||
|
| |||||||
| 225,647 | ||||||||
|
| |||||||
Consumer Electronics - 0.0%* |
| |||||||
Garmin Ltd. | 800 | 63,840 | ||||||
|
| |||||||
Consumer Finance - 0.7% |
| |||||||
American Express Co. | 4,958 | 612,016 | ||||||
Capital One Financial Corp. | 3,426 | 310,875 | ||||||
Discover Financial Services | 2,277 | 176,672 | ||||||
Synchrony Financial | 4,777 | 165,619 | ||||||
|
| |||||||
| 1,265,182 | ||||||||
|
| |||||||
See Notes to Schedule of Investments and Notes to Financial Statements.
| 4 | State Street S&P 500 Index V.I.S. Fund |
Table of Contents
State Street S&P 500 Index V.I.S. Fund
Schedule of Investments, continued — June 30, 2019 (Unaudited)
| Number of Shares | Fair Value $ | |||||||
Copper - 0.1% |
| |||||||
Freeport-McMoRan Inc. | 10,498 | 121,882 | ||||||
|
| |||||||
Data Processing & Outsourced Services - 3.9% |
| |||||||
Alliance Data Systems Corp. (b) | 325 | 45,542 | ||||||
Automatic Data Processing Inc. | 3,153 | 521,286 | ||||||
Broadridge Financial Solutions Inc. | 800 | 102,144 | ||||||
Fidelity National Information Services Inc. | 2,300 | 282,164 | ||||||
Fiserv Inc. (a) | 2,858 | 260,535 | ||||||
FleetCor Technologies Inc. (a) | 600 | 168,510 | ||||||
Global Payments Inc. | 1,161 | 185,911 | ||||||
Jack Henry & Associates Inc. | 600 | 80,352 | ||||||
Mastercard Inc., Class A | 6,444 | 1,704,631 | ||||||
Paychex Inc. | 2,334 | 192,065 | ||||||
PayPal Holdings Inc. (a) | 8,443 | 966,386 | ||||||
The Western Union Co. | 3,224 | 64,125 | ||||||
Total System Services Inc. | 1,102 | 141,354 | ||||||
Visa Inc., Class A | 12,427 | 2,156,706 | ||||||
|
| |||||||
| 6,871,711 | ||||||||
|
| |||||||
Department Stores - 0.1% |
| |||||||
Kohl’s Corp. | 1,273 | 60,531 | ||||||
Macy’s Inc. | 2,334 | 50,088 | ||||||
Nordstrom Inc. | 592 | 18,861 | ||||||
|
| |||||||
| 129,480 | ||||||||
|
| |||||||
Distillers & Vintners - 0.2% |
| |||||||
Brown-Forman Corp., Class B | 1,294 | 71,727 | ||||||
Constellation Brands Inc., Class A | 1,179 | 232,192 | ||||||
|
| |||||||
| 303,919 | ||||||||
|
| |||||||
Distributors - 0.1% |
| |||||||
Genuine Parts Co. | 945 | 97,883 | ||||||
LKQ Corp. (a) | 2,452 | 65,248 | ||||||
|
| |||||||
| 163,131 | ||||||||
|
| |||||||
Diversified Banks - 4.3% |
| |||||||
Bank of America Corp. | 63,926 | 1,853,854 | ||||||
Citigroup Inc. | 16,732 | 1,171,742 | ||||||
JPMorgan Chase & Co. | 23,243 | 2,598,567 | ||||||
U.S. Bancorp | 10,649 | 558,008 | ||||||
Wells Fargo & Co. | 29,099 | 1,376,965 | ||||||
|
| |||||||
| 7,559,136 | ||||||||
|
| |||||||
Diversified Chemicals - 0.1% |
| |||||||
Eastman Chemical Co. | 1,118 | 87,014 | ||||||
|
| |||||||
Diversified Support Services - 0.1% |
| |||||||
Cintas Corp. | 564 | 133,832 | ||||||
| Number of Shares | Fair Value $ | |||||||
Copart Inc. (a) | 1,300 | 97,162 | ||||||
|
| |||||||
| 230,994 | ||||||||
|
| |||||||
Drug Retail - 0.2% |
| |||||||
Walgreens Boots Alliance Inc. | 5,713 | 312,330 | ||||||
|
| |||||||
Electric Utilities - 2.0% |
| |||||||
Alliant Energy Corp. (b) | 1,600 | 78,528 | ||||||
American Electric Power Company Inc. | 3,483 | 306,539 | ||||||
Duke Energy Corp. | 5,282 | 466,084 | ||||||
Edison International | 2,442 | 164,615 | ||||||
Entergy Corp. | 1,253 | 128,971 | ||||||
Evergy Inc. | 1,899 | 114,225 | ||||||
Eversource Energy | 2,330 | 176,521 | ||||||
Exelon Corp. | 6,934 | 332,416 | ||||||
FirstEnergy Corp. | 3,754 | 160,709 | ||||||
NextEra Energy Inc. | 3,402 | 696,934 | ||||||
Pinnacle West Capital Corp. | 700 | 65,863 | ||||||
PPL Corp. | 5,037 | 156,197 | ||||||
The Southern Co. | 7,258 | 401,222 | ||||||
Xcel Energy Inc. | 3,780 | 224,872 | ||||||
|
| |||||||
| 3,473,696 | ||||||||
|
| |||||||
Electrical Components & Equipment - 0.5% |
| |||||||
AMETEK Inc. | 1,600 | 145,344 | ||||||
Eaton Corporation PLC | 3,000 | 249,840 | ||||||
Emerson Electric Co. | 4,430 | 295,569 | ||||||
Rockwell Automation Inc. | 819 | 134,177 | ||||||
|
| |||||||
| 824,930 | ||||||||
|
| |||||||
Electronic Components - 0.2% |
| |||||||
Amphenol Corp., Class A | 2,200 | 211,068 | ||||||
Corning Inc. | 5,834 | 193,864 | ||||||
|
| |||||||
| 404,932 | ||||||||
|
| |||||||
Electronic Equipment & Instruments - 0.1% |
| |||||||
FLIR Systems Inc. | 1,100 | 59,510 | ||||||
Keysight Technologies Inc. (a) | 1,400 | 125,734 | ||||||
|
| |||||||
| 185,244 | ||||||||
|
| |||||||
Electronic Manufacturing Services - 0.2% |
| |||||||
IPG Photonics Corp. (a) | 300 | 46,275 | ||||||
TE Connectivity Ltd. | 2,454 | 235,044 | ||||||
|
| |||||||
| 281,319 | ||||||||
|
| |||||||
Environmental & Facilities Services - 0.3% |
| |||||||
Republic Services Inc. | 1,615 | 139,924 | ||||||
Rollins Inc. | 1,200 | 43,044 | ||||||
Waste Management Inc. | 2,703 | 311,845 | ||||||
|
| |||||||
| 494,813 | ||||||||
|
| |||||||
See Notes to Schedule of Investments and Notes to Financial Statements.
| State Street S&P 500 Index V.I.S. Fund | 5 |
Table of Contents
State Street S&P 500 Index V.I.S. Fund
Schedule of Investments, continued — June 30, 2019 (Unaudited)
| Number of Shares | Fair Value $ | |||||||
Fertilizers & Agricultural Chemicals - 0.2% |
| |||||||
CF Industries Holdings Inc. | 1,685 | 78,706 | ||||||
Corteva Inc. (a) | 5,417 | 160,181 | ||||||
FMC Corp. | 981 | 81,374 | ||||||
The Mosaic Co. | 2,500 | 62,575 | ||||||
|
| |||||||
| 382,836 | ||||||||
|
| |||||||
Financial Exchanges & Data - 1.1% |
| |||||||
Cboe Global Markets Inc. | 800 | 82,904 | ||||||
CME Group Inc. | 2,574 | 499,639 | ||||||
Intercontinental Exchange Inc. | 4,013 | 344,877 | ||||||
MarketAxess Holdings Inc. | 300 | 96,426 | ||||||
Moody’s Corp. | 1,219 | 238,083 | ||||||
MSCI Inc. | 600 | 143,274 | ||||||
Nasdaq Inc. | 834 | 80,206 | ||||||
S&P Global Inc. | 1,757 | 400,227 | ||||||
|
| |||||||
| 1,885,636 | ||||||||
|
| |||||||
Food Distributors - 0.1% |
| |||||||
Sysco Corp. | 3,318 | 234,649 | ||||||
|
| |||||||
Food Retail - 0.1% |
| |||||||
The Kroger Co. | 5,490 | 119,188 | ||||||
|
| |||||||
Footwear - 0.4% |
| |||||||
NIKE Inc., Class B | 8,942 | 750,681 | ||||||
|
| |||||||
Gas Utilities - 0.1% |
| |||||||
Atmos Energy Corp. | 900 | 95,004 | ||||||
|
| |||||||
General Merchandise Stores - 0.4% |
| |||||||
Dollar General Corp. | 1,900 | 256,804 | ||||||
Dollar Tree Inc. (a) | 1,692 | 181,704 | ||||||
Target Corp. | 3,695 | 320,024 | ||||||
|
| |||||||
| 758,532 | ||||||||
|
| |||||||
Gold - 0.1% |
| |||||||
Newmont Goldcorp Corp. | 6,011 | 231,243 | ||||||
|
| |||||||
Health Care REITs - 0.3% |
| |||||||
HCP Inc. | 3,274 | 104,703 | ||||||
Ventas Inc. | 2,629 | 179,692 | ||||||
Welltower Inc. | 2,800 | 228,284 | ||||||
|
| |||||||
| 512,679 | ||||||||
|
| |||||||
Healthcare Distributors - 0.3% |
| |||||||
AmerisourceBergen Corp. | 1,061 | 90,461 | ||||||
Cardinal Health Inc. | 2,268 | 106,823 | ||||||
Henry Schein Inc. (a) | 1,098 | 76,750 | ||||||
McKesson Corp. | 1,389 | 186,668 | ||||||
|
| |||||||
| 460,702 | ||||||||
|
| |||||||
| Number of Shares | Fair Value $ | |||||||
Healthcare Equipment - 3.3% |
| |||||||
Abbott Laboratories (b) | 12,514 | 1,052,428 | ||||||
ABIOMED Inc. (a)(b) | 300 | 78,147 | ||||||
Baxter International Inc. | 3,377 | 276,576 | ||||||
Becton Dickinson and Co. | 1,883 | 474,535 | ||||||
Boston Scientific Corp. (a) | 9,799 | 421,161 | ||||||
Danaher Corp. | 4,400 | 628,848 | ||||||
Edwards Lifesciences Corp. (a) | 1,500 | 277,110 | ||||||
Hologic Inc. (a) | 1,900 | 91,238 | ||||||
IDEXX Laboratories Inc. (a) | 622 | 171,255 | ||||||
Intuitive Surgical Inc. (a) | 796 | 417,542 | ||||||
Medtronic PLC | 9,567 | 931,730 | ||||||
ResMed Inc. | 1,070 | 130,572 | ||||||
Stryker Corp. | 2,181 | 448,370 | ||||||
Teleflex Inc. | 300 | 99,345 | ||||||
Varian Medical Systems Inc. (a) | 634 | 86,307 | ||||||
Zimmer Biomet Holdings Inc. | 1,537 | 180,966 | ||||||
|
| |||||||
| 5,766,130 | ||||||||
|
| |||||||
Healthcare Facilities - 0.2% |
| |||||||
HCA Healthcare Inc. | 1,891 | 255,606 | ||||||
Universal Health Services Inc., Class B | 558 | 72,758 | ||||||
|
| |||||||
| 328,364 | ||||||||
|
| |||||||
Healthcare Services - 0.7% |
| |||||||
Cigna Corp. (a) | 2,765 | 435,626 | ||||||
CVS Health Corp. | 9,322 | 507,956 | ||||||
DaVita Inc. (a) | 858 | 48,271 | ||||||
Laboratory Corporation of America Holdings (a) | 700 | 121,030 | ||||||
Quest Diagnostics Inc. | 1,000 | 101,810 | ||||||
|
| |||||||
| 1,214,693 | ||||||||
|
| |||||||
Healthcare Supplies - 0.2% |
| |||||||
Align Technology Inc. (a)(b) | 461 | 126,176 | ||||||
DENTSPLY SIRONA Inc. | 1,532 | 89,408 | ||||||
The Cooper Companies Inc. | 315 | 106,120 | ||||||
|
| |||||||
| 321,704 | ||||||||
|
| |||||||
Healthcare Technology - 0.1% |
| |||||||
Cerner Corp. | 2,400 | 175,920 | ||||||
|
| |||||||
Home Building - 0.1% |
| |||||||
D.R. Horton Inc. | 2,400 | 103,512 | ||||||
Lennar Corp., Class A | 2,100 | 101,766 | ||||||
PulteGroup Inc. | 1,535 | 48,537 | ||||||
|
| |||||||
| 253,815 | ||||||||
|
| |||||||
Home Furnishings - 0.1% |
| |||||||
Leggett & Platt Inc. | 1,000 | 38,370 | ||||||
See Notes to Schedule of Investments and Notes to Financial Statements.
| 6 | State Street S&P 500 Index V.I.S. Fund |
Table of Contents
State Street S&P 500 Index V.I.S. Fund
Schedule of Investments, continued — June 30, 2019 (Unaudited)
| Number of Shares | Fair Value $ | |||||||
Mohawk Industries Inc. (a) | 500 | 73,735 | ||||||
|
| |||||||
| 112,105 | ||||||||
|
| |||||||
Home Improvement Retail - 1.3% |
| |||||||
Lowe’s Companies Inc. | 5,731 | 578,315 | ||||||
The Home Depot Inc. | 7,889 | 1,640,675 | ||||||
|
| |||||||
| 2,218,990 | ||||||||
|
| |||||||
Hotel & Resort REITs - 0.1% |
| |||||||
Host Hotels & Resorts Inc. | 5,617 | 102,342 | ||||||
|
| |||||||
Hotels, Resorts & Cruise Lines - 0.5% |
| |||||||
Carnival Corp. | 2,900 | 134,995 | ||||||
Hilton Worldwide Holdings Inc. | 2,100 | 205,254 | ||||||
Marriott International Inc., Class A | 1,982 | 278,055 | ||||||
Norwegian Cruise Line Holdings Ltd. (a) | 1,500 | 80,445 | ||||||
Royal Caribbean Cruises Ltd. | 1,263 | 153,088 | ||||||
|
| |||||||
| 851,837 | ||||||||
|
| |||||||
Household Appliances - 0.0%* |
| |||||||
Whirlpool Corp. | 462 | 65,770 | ||||||
|
| |||||||
Household Products - 1.7% |
| |||||||
Church & Dwight Company Inc. | 1,838 | 134,284 | ||||||
Colgate-Palmolive Co. | 6,153 | 440,986 | ||||||
Kimberly-Clark Corp. | 2,512 | 334,799 | ||||||
The Clorox Co. | 945 | 144,689 | ||||||
The Procter & Gamble Co. | 17,851 | 1,957,362 | ||||||
|
| |||||||
| 3,012,120 | ||||||||
|
| |||||||
Housewares & Specialties - 0.0%* |
| |||||||
Newell Brands Inc. | 2,334 | 35,990 | ||||||
|
| |||||||
Human Resource & Employment Services - 0.0%* |
| |||||||
Robert Half International Inc. | 875 | 49,884 | ||||||
|
| |||||||
Hypermarkets & Super Centers - 1.1% |
| |||||||
Costco Wholesale Corp. | 3,150 | 832,419 | ||||||
Walmart Inc. | 10,148 | 1,121,252 | ||||||
|
| |||||||
| 1,953,671 | ||||||||
|
| |||||||
Independent Power Producers & Energy Traders - 0.1% |
| |||||||
AES Corp. (b) | 4,826 | 80,884 | ||||||
NRG Energy Inc. | 2,038 | 71,574 | ||||||
|
| |||||||
| 152,458 | ||||||||
|
| |||||||
Industrial Conglomerates - 1.4% |
| |||||||
3M Co. (b) | 4,106 | 711,734 | ||||||
General Electric Co. | 62,594 | 657,237 | ||||||
Honeywell International Inc. | 5,193 | 906,646 | ||||||
| Number of Shares | Fair Value $ | |||||||
Roper Technologies Inc. | 763 | 279,456 | ||||||
|
| |||||||
| 2,555,073 | ||||||||
|
| |||||||
Industrial Gases - 0.6% |
| |||||||
Air Products & Chemicals Inc. (b) | 1,541 | 348,836 | ||||||
Linde PLC | 3,887 | 780,510 | ||||||
|
| |||||||
| 1,129,346 | ||||||||
|
| |||||||
Industrial Machinery - 0.8% |
| |||||||
Dover Corp. | 1,009 | 101,102 | ||||||
Flowserve Corp. | 900 | 47,421 | ||||||
Fortive Corp. | 2,149 | 175,186 | ||||||
Illinois Tool Works Inc. | 2,160 | 325,750 | ||||||
Ingersoll-Rand PLC | 1,800 | 228,006 | ||||||
Parker-Hannifin Corp. | 934 | 158,789 | ||||||
Pentair PLC | 1,146 | 42,631 | ||||||
Snap-on Inc. | 409 | 67,747 | ||||||
Stanley Black & Decker Inc. | 1,099 | 158,926 | ||||||
Xylem Inc. | 1,281 | 107,143 | ||||||
|
| |||||||
| 1,412,701 | ||||||||
|
| |||||||
Industrial REITs - 0.2% |
| |||||||
Duke Realty Corp. | 2,500 | 79,025 | ||||||
Prologis Inc. REIT | 4,457 | 357,006 | ||||||
|
| |||||||
| 436,031 | ||||||||
|
| |||||||
Insurance Brokers - 0.6% |
| |||||||
Aon PLC | 1,734 | 334,627 | ||||||
Arthur J Gallagher & Co. | 1,227 | 107,473 | ||||||
Marsh & McLennan Companies Inc. | 3,526 | 351,719 | ||||||
Willis Towers Watson PLC | 958 | 183,495 | ||||||
|
| |||||||
| 977,314 | ||||||||
|
| |||||||
Integrated Oil & Gas - 2.4% |
| |||||||
Chevron Corp. | 13,593 | 1,691,513 | ||||||
Exxon Mobil Corp. | 30,344 | 2,325,261 | ||||||
Occidental Petroleum Corp. | 5,457 | 274,378 | ||||||
|
| |||||||
| 4,291,152 | ||||||||
|
| |||||||
Integrated Telecommunication Services - 1.9% |
| |||||||
AT&T Inc. | 52,066 | 1,744,732 | ||||||
Verizon Communications Inc. | 29,592 | 1,690,591 | ||||||
|
| |||||||
| 3,435,323 | ||||||||
|
| |||||||
Interactive Home Entertainment - 0.3% |
| |||||||
Activision Blizzard Inc. (b) | 5,400 | 254,880 | ||||||
Electronic Arts Inc. (a) | 2,105 | 213,152 | ||||||
Take-Two Interactive Software Inc. (a) | 800 | 90,824 | ||||||
|
| |||||||
| 558,856 | ||||||||
|
| |||||||
See Notes to Schedule of Investments and Notes to Financial Statements.
| State Street S&P 500 Index V.I.S. Fund | 7 |
Table of Contents
State Street S&P 500 Index V.I.S. Fund
Schedule of Investments, continued — June 30, 2019 (Unaudited)
| Number of Shares | Fair Value $ | |||||||
Interactive Media & Services - 4.6% |
| |||||||
Alphabet Inc., Class A (a)(b) | 2,141 | 2,318,275 | ||||||
Alphabet Inc., Class C (a) | 2,201 | 2,379,083 | ||||||
Facebook Inc., Class A (a) | 17,053 | 3,291,229 | ||||||
TripAdvisor Inc. (a) | 650 | 30,088 | ||||||
Twitter Inc. (a) | 5,100 | 177,990 | ||||||
|
| |||||||
| 8,196,665 | ||||||||
|
| |||||||
Internet & Direct Marketing Retail - 3.7% |
| |||||||
Amazon.com Inc. (a) | 2,953 | 5,591,889 | ||||||
Booking Holdings Inc. (a) | 323 | 605,531 | ||||||
eBay Inc. | 5,960 | 235,420 | ||||||
Expedia Group Inc. | 850 | 113,076 | ||||||
|
| |||||||
| 6,545,916 | ||||||||
|
| |||||||
Internet Services & Infrastructure - 0.1% |
| |||||||
Akamai Technologies Inc. (a)(b) | 1,133 | 90,798 | ||||||
VeriSign Inc. (a) | 724 | 151,432 | ||||||
|
| |||||||
| 242,230 | ||||||||
|
| |||||||
Investment Banking & Brokerage - 0.8% |
| |||||||
E*TRADE Financial Corp. | 1,640 | 73,144 | ||||||
Morgan Stanley | 9,429 | 413,085 | ||||||
Raymond James Financial Inc. | 904 | 76,433 | ||||||
The Charles Schwab Corp. | 8,511 | 342,057 | ||||||
The Goldman Sachs Group Inc. | 2,403 | 491,654 | ||||||
|
| |||||||
| 1,396,373 | ||||||||
|
| |||||||
IT Consulting & Other Services - 1.2% |
| |||||||
Accenture PLC, Class A (b) | 4,545 | 839,780 | ||||||
Cognizant Technology Solutions Corp., Class A | 3,976 | 252,039 | ||||||
DXC Technology Co. | 1,824 | 100,593 | ||||||
Gartner Inc. (a) | 700 | 112,658 | ||||||
International Business Machines Corp. | 6,311 | 870,287 | ||||||
|
| |||||||
| 2,175,357 | ||||||||
|
| |||||||
Leisure Products - 0.0%* |
| |||||||
Hasbro Inc. | 796 | 84,121 | ||||||
|
| |||||||
Life & Health Insurance - 0.7% |
| |||||||
Aflac Inc. (b) | 5,226 | 286,437 | ||||||
Lincoln National Corp. | 1,560 | 100,542 | ||||||
MetLife Inc. | 6,860 | 340,736 | ||||||
Principal Financial Group Inc. | 1,711 | 99,101 | ||||||
Prudential Financial Inc. | 3,001 | 303,101 | ||||||
Torchmark Corp. | 666 | 59,581 | ||||||
Unum Group | 1,589 | 53,311 | ||||||
|
| |||||||
| 1,242,809 | ||||||||
|
| |||||||
| Number of Shares | Fair Value $ | |||||||
Life Sciences Tools & Services - 1.1% |
| |||||||
Agilent Technologies Inc. (b) | 2,322 | 173,384 | ||||||
Illumina Inc. (a) | 1,001 | 368,518 | ||||||
IQVIA Holdings Inc. (a) | 1,100 | 176,990 | ||||||
Mettler-Toledo International Inc. (a) | 179 | 150,360 | ||||||
PerkinElmer Inc. | 711 | 68,498 | ||||||
Thermo Fisher Scientific Inc. | 2,828 | 830,527 | ||||||
Waters Corp. (a) | 484 | 104,176 | ||||||
|
| |||||||
| 1,872,453 | ||||||||
|
| |||||||
Managed Healthcare - 1.5% |
| |||||||
Anthem Inc. | 1,775 | 500,923 | ||||||
Centene Corp. (a) | 3,027 | 158,736 | ||||||
Humana Inc. | 927 | 245,933 | ||||||
UnitedHealth Group Inc. | 6,848 | 1,670,980 | ||||||
WellCare Health Plans Inc. (a) | 300 | 85,521 | ||||||
|
| |||||||
| 2,662,093 | ||||||||
|
| |||||||
Metal & Glass Containers - 0.1% |
| |||||||
Ball Corp. | 2,382 | 166,716 | ||||||
|
| |||||||
Motorcycle Manufacturers - 0.0%* |
| |||||||
Harley-Davidson Inc. | 1,135 | 40,667 | ||||||
|
| |||||||
Movies & Entertainment - 1.7% |
| |||||||
Netflix Inc. (a) | 3,090 | 1,135,019 | ||||||
The Walt Disney Co. | 12,527 | 1,749,270 | ||||||
Viacom Inc., Class B | 2,346 | 70,075 | ||||||
|
| |||||||
| 2,954,364 | ||||||||
|
| |||||||
Multi-Line Insurance - 0.3% |
| |||||||
American International Group Inc. | 6,229 | 331,881 | ||||||
Assurant Inc. | 339 | 36,063 | ||||||
The Hartford Financial Services Group Inc. | 2,544 | 141,752 | ||||||
|
| |||||||
| 509,696 | ||||||||
|
| |||||||
Multi-Sector Holdings - 1.7% |
| |||||||
Berkshire Hathaway Inc., Class B (a) | 13,896 | 2,962,210 | ||||||
Jefferies Financial Group Inc. | 2,200 | 42,306 | ||||||
|
| |||||||
| 3,004,516 | ||||||||
|
| |||||||
Multi-Utilities - 1.1% |
| |||||||
Ameren Corp. | 1,642 | 123,331 | ||||||
CenterPoint Energy Inc. | 3,718 | 106,446 | ||||||
CMS Energy Corp. | 2,000 | 115,820 | ||||||
Consolidated Edison Inc. | 2,255 | 197,718 | ||||||
Dominion Energy Inc. | 5,717 | 442,039 | ||||||
DTE Energy Co. | 1,366 | 174,684 | ||||||
See Notes to Schedule of Investments and Notes to Financial Statements.
| 8 | State Street S&P 500 Index V.I.S. Fund |
Table of Contents
State Street S&P 500 Index V.I.S. Fund
Schedule of Investments, continued — June 30, 2019 (Unaudited)
| Number of Shares | Fair Value $ | |||||||
NiSource Inc. | 2,515 | 72,432 | ||||||
Public Service Enterprise Group Inc. | 3,492 | 205,399 | ||||||
Sempra Energy | 2,000 | 274,880 | ||||||
WEC Energy Group Inc. | 2,323 | 193,669 | ||||||
|
| |||||||
| 1,906,418 | ||||||||
|
| |||||||
Office REITs - 0.2% |
| |||||||
Alexandria Real Estate Equities Inc. (b) | 800 | 112,872 | ||||||
Boston Properties Inc. | 1,098 | 141,642 | ||||||
SL Green Realty Corp. | 600 | 48,222 | ||||||
Vornado Realty Trust | 1,211 | 77,625 | ||||||
|
| |||||||
| 380,361 | ||||||||
|
| |||||||
Oil & Gas Drilling - 0.0%* |
| |||||||
Helmerich & Payne Inc. | 900 | 45,558 | ||||||
|
| |||||||
Oil & Gas Equipment & Services - 0.4% |
| |||||||
Baker Hughes a GE Co. | 3,481 | 85,737 | ||||||
Halliburton Co. | 6,458 | 146,855 | ||||||
National Oilwell Varco Inc. | 2,846 | 63,266 | ||||||
Schlumberger Ltd. | 9,984 | 396,764 | ||||||
TechnipFMC PLC | 3,386 | 87,833 | ||||||
|
| |||||||
| 780,455 | ||||||||
|
| |||||||
Oil & Gas Exploration & Production - 1.2% |
| |||||||
Anadarko Petroleum Corp. | 3,657 | 258,038 | ||||||
Apache Corp. | 2,948 | 85,403 | ||||||
Cabot Oil & Gas Corp. | 3,135 | 71,980 | ||||||
Cimarex Energy Co. | 700 | 41,531 | ||||||
Concho Resources Inc. | 1,500 | 154,770 | ||||||
ConocoPhillips | 8,235 | 502,335 | ||||||
Devon Energy Corp. | 2,992 | 85,332 | ||||||
Diamondback Energy Inc. | 1,100 | 119,867 | ||||||
EOG Resources Inc. | 4,100 | 381,956 | ||||||
Hess Corp. | 1,818 | 115,570 | ||||||
Marathon Oil Corp. | 5,742 | 81,594 | ||||||
Noble Energy Inc. | 3,700 | 82,880 | ||||||
Pioneer Natural Resources Co. | 1,200 | 184,632 | ||||||
|
| |||||||
| 2,165,888 | ||||||||
|
| |||||||
Oil & Gas Refining & Marketing - 0.5% |
| |||||||
HollyFrontier Corp. | 1,300 | 60,164 | ||||||
Marathon Petroleum Corp. | 4,976 | 278,059 | ||||||
Phillips 66 | 2,961 | 276,972 | ||||||
Valero Energy Corp. | 3,028 | 259,227 | ||||||
|
| |||||||
| 874,422 | ||||||||
|
| |||||||
Oil & Gas Storage & Transportation - 0.4% |
| |||||||
Kinder Morgan Inc. | 14,304 | 298,667 | ||||||
ONEOK Inc. | 3,000 | 206,430 | ||||||
| Number of Shares | Fair Value $ | |||||||
The Williams Companies Inc. | 8,571 | 240,331 | ||||||
|
| |||||||
| 745,428 | ||||||||
|
| |||||||
Packaged Foods & Meats - 1.0% |
| |||||||
Campbell Soup Co. | 1,215 | 48,685 | ||||||
Conagra Brands Inc. | 3,254 | 86,296 | ||||||
General Mills Inc. | 4,136 | 217,223 | ||||||
Hormel Foods Corp. | 1,800 | 72,972 | ||||||
Kellogg Co. | 1,890 | 101,247 | ||||||
Lamb Weston Holdings Inc. | 1,100 | 69,696 | ||||||
McCormick & Company Inc. | 900 | 139,509 | ||||||
Mondelez International Inc., Class A | 10,335 | 557,057 | ||||||
The Hershey Co. | 1,016 | 136,174 | ||||||
The JM Smucker Co. | 847 | 97,566 | ||||||
The Kraft Heinz Co. | 4,395 | 136,421 | ||||||
Tyson Foods Inc., Class A | 2,166 | 174,883 | ||||||
|
| |||||||
| 1,837,729 | ||||||||
|
| |||||||
Paper Packaging - 0.3% |
| |||||||
Amcor PLC (a) | 11,782 | 135,375 | ||||||
Avery Dennison Corp. | 492 | 56,915 | ||||||
International Paper Co. | 3,030 | 131,260 | ||||||
Packaging Corporation of America | 685 | 65,294 | ||||||
Sealed Air Corp. | 931 | 39,828 | ||||||
WestRock Co. | 1,775 | 64,734 | ||||||
|
| |||||||
| 493,406 | ||||||||
|
| |||||||
Personal Products - 0.2% |
| |||||||
Coty Inc., Class A | 1,910 | 25,594 | ||||||
The Estee Lauder Companies Inc., Class A | 1,579 | 289,131 | ||||||
|
| |||||||
| 314,725 | ||||||||
|
| |||||||
Pharmaceuticals - 4.5% |
| |||||||
Allergan PLC (b) | 2,249 | 376,550 | ||||||
Bristol-Myers Squibb Co. | 11,687 | 530,005 | ||||||
Eli Lilly & Co. | 6,142 | 680,472 | ||||||
Johnson & Johnson | 19,029 | 2,650,359 | ||||||
Merck & Company Inc. | 18,368 | 1,540,157 | ||||||
Mylan N.V. (a) | 3,904 | 74,332 | ||||||
Nektar Therapeutics (a) | 1,300 | 46,254 | ||||||
Perrigo Company PLC | 975 | 46,430 | ||||||
Pfizer Inc. | 39,735 | 1,721,320 | ||||||
Zoetis Inc. | 3,346 | 379,738 | ||||||
|
| |||||||
| 8,045,617 | ||||||||
|
| |||||||
Property & Casualty Insurance - 0.9% |
| |||||||
Chubb Ltd. | 3,261 | 480,313 | ||||||
Cincinnati Financial Corp. | 1,092 | 113,208 | ||||||
Loews Corp. | 1,862 | 101,795 | ||||||
See Notes to Schedule of Investments and Notes to Financial Statements.
| State Street S&P 500 Index V.I.S. Fund | 9 |
Table of Contents
State Street S&P 500 Index V.I.S. Fund
Schedule of Investments, continued — June 30, 2019 (Unaudited)
| Number of Shares | Fair Value $ | |||||||
The Allstate Corp. (b) | 2,386 | 242,632 | ||||||
The Progressive Corp. | 4,103 | 327,953 | ||||||
The Travelers Companies Inc. | 1,867 | 279,154 | ||||||
|
| |||||||
| 1,545,055 | ||||||||
|
| |||||||
Publishing - 0.0%* |
| |||||||
News Corp., Class A | 3,400 | 45,866 | ||||||
|
| |||||||
Railroads - 1.0% |
| |||||||
CSX Corp. | 5,567 | 430,718 | ||||||
Kansas City Southern | 700 | 85,274 | ||||||
Norfolk Southern Corp. | 1,945 | 387,697 | ||||||
Union Pacific Corp. | 5,080 | 859,079 | ||||||
|
| |||||||
| 1,762,768 | ||||||||
|
| |||||||
Real Estate Services - 0.1% |
| |||||||
CBRE Group Inc., Class A (a) | 2,321 | 119,067 | ||||||
|
| |||||||
Regional Banks - 1.2% |
| |||||||
BB&T Corp. | 5,437 | 267,120 | ||||||
Citizens Financial Group Inc. | 3,400 | 120,224 | ||||||
Comerica Inc. | 1,148 | 83,391 | ||||||
Fifth Third Bancorp | 4,735 | 132,106 | ||||||
First Republic Bank | 1,200 | 117,180 | ||||||
Huntington Bancshares Inc. | 6,934 | 95,828 | ||||||
KeyCorp | 6,928 | 122,972 | ||||||
M&T Bank Corp. | 990 | 168,369 | ||||||
People’s United Financial Inc. | 3,200 | 53,696 | ||||||
Regions Financial Corp. | 7,168 | 107,090 | ||||||
SunTrust Banks Inc. | 3,229 | 202,943 | ||||||
SVB Financial Group (a) | 400 | 89,836 | ||||||
The PNC Financial Services Group Inc. | 3,239 | 444,650 | ||||||
Zions Bancorp NA | 1,500 | 68,970 | ||||||
|
| |||||||
| 2,074,375 | ||||||||
|
| |||||||
Reinsurance - 0.0%* |
| |||||||
Everest Re Group Ltd. | 300 | 74,154 | ||||||
|
| |||||||
Research & Consulting Services - 0.3% |
| |||||||
Equifax Inc. | 846 | 114,413 | ||||||
IHS Markit Ltd. (a) | 2,500 | 159,300 | ||||||
Nielsen Holdings PLC | 2,328 | 52,613 | ||||||
Verisk Analytics Inc. | 1,200 | 175,752 | ||||||
|
| |||||||
| 502,078 | ||||||||
|
| |||||||
Residential REITs - 0.4% |
| |||||||
Apartment Investment & Management Co., Class A | 977 | 48,967 | ||||||
AvalonBay Communities Inc. | 972 | 197,491 | ||||||
Equity Residential | 2,508 | 190,407 | ||||||
Essex Property Trust Inc. | 450 | 131,369 | ||||||
| Number of Shares | Fair Value $ | |||||||
Mid-America Apartment Communities Inc. | 800 | 94,208 | ||||||
UDR Inc. | 1,900 | 85,291 | ||||||
|
| |||||||
| 747,733 | ||||||||
|
| |||||||
Restaurants - 1.3% |
| |||||||
Chipotle Mexican Grill Inc. (a) | 160 | 117,261 | ||||||
Darden Restaurants Inc. | 886 | 107,853 | ||||||
McDonald’s Corp. | 5,467 | 1,135,277 | ||||||
Starbucks Corp. | 8,800 | 737,704 | ||||||
Yum! Brands Inc. | 2,174 | 240,596 | ||||||
|
| |||||||
| 2,338,691 | ||||||||
|
| |||||||
Retail REITs - 0.4% |
| |||||||
Federal Realty Investment Trust | 500 | 64,380 | ||||||
Kimco Realty Corp. | 3,097 | 57,232 | ||||||
Realty Income Corp. | 2,000 | 137,940 | ||||||
Regency Centers Corp. | 1,299 | 86,695 | ||||||
Simon Property Group Inc. | 2,179 | 348,117 | ||||||
The Macerich Co. | 744 | 24,917 | ||||||
|
| |||||||
| 719,281 | ||||||||
|
| |||||||
Semiconductor Equipment - 0.4% |
| |||||||
Applied Materials Inc. | 6,838 | 307,094 | ||||||
KLA-Tencor Corp. | 1,178 | 139,240 | ||||||
Lam Research Corp. | 1,131 | 212,447 | ||||||
|
| |||||||
| 658,781 | ||||||||
|
| |||||||
Semiconductors - 3.4% |
| |||||||
Advanced Micro Devices Inc. (a)(b) | 6,600 | 200,442 | ||||||
Analog Devices Inc. | 2,587 | 291,995 | ||||||
Broadcom Inc. | 2,768 | 796,796 | ||||||
Intel Corp. | 32,001 | 1,531,888 | ||||||
Maxim Integrated Products Inc. | 2,100 | 125,622 | ||||||
Microchip Technology Inc. | 1,800 | 156,060 | ||||||
Micron Technology Inc. (a) | 8,268 | 319,062 | ||||||
NVIDIA Corp. | 4,338 | 712,430 | ||||||
Qorvo Inc. (a) | 900 | 59,949 | ||||||
QUALCOMM Inc. | 8,768 | 666,982 | ||||||
Skyworks Solutions Inc. | 1,342 | 103,696 | ||||||
Texas Instruments Inc. | 6,609 | 758,449 | ||||||
Xilinx Inc. | 1,787 | 210,723 | ||||||
|
| |||||||
| 5,934,094 | ||||||||
|
| |||||||
Soft Drinks - 1.6% |
| |||||||
Monster Beverage Corp. (a) | 2,756 | 175,916 | ||||||
PepsiCo Inc. | 9,965 | 1,306,710 | ||||||
The Coca-Cola Co. | 27,370 | 1,393,680 | ||||||
|
| |||||||
| 2,876,306 | ||||||||
|
| |||||||
See Notes to Schedule of Investments and Notes to Financial Statements.
| 10 | State Street S&P 500 Index V.I.S. Fund |
Table of Contents
State Street S&P 500 Index V.I.S. Fund
Schedule of Investments, continued — June 30, 2019 (Unaudited)
| Number of Shares | Fair Value $ | |||||||
Specialized Consumer Services - 0.0%* |
| |||||||
H&R Block Inc. | 1,579 | 46,265 | ||||||
|
| |||||||
Specialized REITs - 1.3% |
| |||||||
American Tower Corp. | 3,181 | 650,355 | ||||||
Crown Castle International Corp. | 3,000 | 391,050 | ||||||
Digital Realty Trust Inc. | 1,500 | 176,685 | ||||||
Equinix Inc. | 596 | 300,557 | ||||||
Extra Space Storage Inc. | 800 | 84,880 | ||||||
Iron Mountain Inc. | 1,886 | 59,032 | ||||||
Public Storage | 1,030 | 245,315 | ||||||
SBA Communications Corp. (a) | 833 | 187,292 | ||||||
Weyerhaeuser Co. | 5,567 | 146,635 | ||||||
|
| |||||||
| 2,241,801 | ||||||||
|
| |||||||
Specialty Chemicals - 0.8% |
| |||||||
Albemarle Corp. (b) | 769 | 54,146 | ||||||
Celanese Corp. | 900 | 97,020 | ||||||
DuPont de Nemours Inc. | 5,417 | 406,654 | ||||||
Ecolab Inc. | 1,802 | 355,787 | ||||||
International Flavors & Fragrances Inc. | 647 | 93,873 | ||||||
PPG Industries Inc. | 1,659 | 193,622 | ||||||
The Sherwin-Williams Co. | 563 | 258,017 | ||||||
|
| |||||||
| 1,459,119 | ||||||||
|
| |||||||
Specialty Stores - 0.2% |
| |||||||
Tiffany & Co. | 704 | 65,922 | ||||||
Tractor Supply Co. | 837 | 91,066 | ||||||
Ulta Salon Cosmetics & Fragrance Inc. (a) | 400 | 138,756 | ||||||
|
| |||||||
| 295,744 | ||||||||
|
| |||||||
Steel - 0.1% |
| |||||||
Nucor Corp. | 2,259 | 124,471 | ||||||
|
| |||||||
Systems Software - 4.9% |
| |||||||
Fortinet Inc. (a) | 1,100 | 84,513 | ||||||
Microsoft Corp. | 54,752 | 7,334,578 | ||||||
Oracle Corp. | 17,413 | 992,018 | ||||||
Red Hat Inc. (a) | 1,300 | 244,088 | ||||||
Symantec Corp. | 4,672 | 101,663 | ||||||
|
| |||||||
| 8,756,860 | ||||||||
|
| |||||||
| Number of Shares | Fair Value $ | |||||||
Technology Hardware, Storage & Peripherals - 3.9% |
| |||||||
Apple Inc. | 31,360 | 6,206,771 | ||||||
Hewlett Packard Enterprise Co. | 9,619 | 143,804 | ||||||
HP Inc. | 11,254 | 233,971 | ||||||
NetApp Inc. | 1,870 | 115,379 | ||||||
Seagate Technology PLC | 1,732 | 81,612 | ||||||
Western Digital Corp. | 2,077 | 98,761 | ||||||
Xerox Corp. | 1,211 | 42,882 | ||||||
|
| |||||||
| 6,923,180 | ||||||||
|
| |||||||
Tobacco - 0.8% |
| |||||||
Altria Group Inc. | 13,339 | 631,602 | ||||||
Philip Morris International Inc. | 11,037 | 866,735 | ||||||
|
| |||||||
| 1,498,337 | ||||||||
|
| |||||||
Trading Companies & Distributors - 0.2% |
| |||||||
Fastenal Co. | 3,900 | 127,101 | ||||||
United Rentals Inc. (a) | 564 | 74,803 | ||||||
WW Grainger Inc. | 282 | 75,641 | ||||||
|
| |||||||
| 277,545 | ||||||||
|
| |||||||
Trucking - 0.0%* |
| |||||||
JB Hunt Transport Services Inc. | 720 | 65,815 | ||||||
|
| |||||||
Water Utilities - 0.1% |
| |||||||
American Water Works Company Inc. | 1,200 | 139,200 | ||||||
|
| |||||||
| Total Common Stock (Cost $68,089,768) |
| 174,787,931 | ||||||
|
| |||||||
| Short-Term Investments - 1.3% |
| |||||||
State Street Institutional U.S. Government Money Market Fund - Class G Shares 2.35% | 2,309,185 | 2,309,185 | ||||||
|
| |||||||
| Total Investments (Cost $70,398,953) |
| 177,097,116 | ||||||
| Other Assets and Liabilities, net - 0.0%* |
| 82,311 | ||||||
|
| |||||||
| NET ASSETS - 100.0% |
| 177,179,427 | ||||||
|
| |||||||
Other Information:
The Fund had the following long futures contracts open at June 30, 2019:
| Description | Expiration date | Number of Contracts | Notional Amount | Value | Unrealized Appreciation | |||||||||||||||
S&P 500E-mini Index Futures | September 2019 | 17 | $ | 2,462,067 | $ | 2,502,531 | $ | 40,464 | ||||||||||||
|
| |||||||||||||||||||
During the period ended June 30, 2019, average notional value related to long futures contracts was $2,583,432.
See Notes to Schedule of Investments and Notes to Financial Statements.
| State Street S&P 500 Index V.I.S. Fund | 11 |
Table of Contents
State Street S&P 500 Index V.I.S. Fund
Notes to Schedule of Investments — June 30, 2019 (Unaudited)
The views expressed in this document reflect our judgment as of the publication date and are subject to change at any time without notice. The securities cited may not be representative of the Fund’s future investments and should not be construed as a recommendation to purchase or sell a particular security. See the Fund’s summary prospectus and statutory prospectus for complete descriptions of investment objectives, policies, risks and permissible investments.
| (a) | Non-income producing security. |
| (b) | At June 30, 2019, all or a portion of this security was pledged to cover collateral requirements for futures. |
| (c) | State Street Corp. is the parent company of State Street Bank & Trust Co., the Fund’ssub-administrator, custodian and accounting agent. |
| (d) | Sponsored by SSGA Funds Management, Inc., the Fund’s investment adviser and administrator, and an affiliate of State Street Bank & Trust Co., the Fund’ssub-administrator, custodian and accounting agent. |
| (e) | Coupon amount represents effective yield. |
| † | Percentages are based on net assets as of June 30, 2019. |
| * | Less than 0.05%. |
Abbreviations:
REIT - Real Estate Investment Trust
The following table represents the Fund’s investments measured at fair value on a recurring basis at June 30, 2019.
| Investments | Level 1 | Level 2 | Level 3 | Total | ||||||||||||
Investments in Securities | ||||||||||||||||
Common Stock | $ | 174,787,931 | $ | — | $ | — | $ | 174,787,931 | ||||||||
Short-Term Investments | 2,309,185 | — | — | 2,309,185 | ||||||||||||
|
|
|
|
|
|
|
| |||||||||
Total Investments in Securities | $ | 177,097,116 | $ | — | $ | — | $ | 177,097,116 | ||||||||
|
|
|
|
|
|
|
| |||||||||
Other Financial Instruments |
| |||||||||||||||
Long Futures Contracts - Unrealized Appreciation | $ | 40,464 | $ | — | $ | — | $ | 40,464 | ||||||||
|
|
|
|
|
|
|
| |||||||||
Affiliate Table
| Number of Shares Held at 12/31/18 | Value At 12/31/18 | Cost of Purchases | Proceeds from Shares Sold | Realized Gain (Loss) | Change in Unrealized Appreciation/ Depreciation | Number of Shares Held at 6/30/19 | Value at 6/30/19 | Dividend Income | ||||||||||||||||||||||||||||
State Street Corp. | 2,911 | $ | 183,597 | $ | — | $ | 20,585 | $ | (661 | ) | $ | (15,978 | ) | 2,611 | $ | 146,373 | $ | 2,595 | ||||||||||||||||||
State Street Institutional U.S. Government Money Market Fund - Class G Shares | 1,781,046 | 1,781,046 | 11,366,801 | 10,838,662 | — | — | 2,309,185 | 2,309,185 | 25,998 | |||||||||||||||||||||||||||
|
|
|
|
|
|
|
|
|
|
|
|
|
| |||||||||||||||||||||||
TOTAL | $ | 1,964,643 | $ | 11,366,801 | $ | 10,859,247 | $ | (661 | ) | $ | (15,978 | ) | $ | 2,455,558 | $ | 28,593 | ||||||||||||||||||||
|
|
|
|
|
|
|
|
|
|
|
|
|
| |||||||||||||||||||||||
See Notes to Schedule of Investments and Notes to Financial Statements.
| 12 | State Street S&P 500 Index V.I.S. Fund |
Table of Contents
State Street S&P 500 Index V.I.S. Fund
Selected data based on a share outstanding throughout the periods indicated
| 6/30/19† | 12/31/18 | 12/31/17 | 12/31/16 | 12/31/15* | 12/31/14* | |||||||||||||||||||
| Inception date | 4/15/85 | |||||||||||||||||||||||
Net asset value, beginning of period | $ | 38.13 | $ | 44.09 | $ | 38.22 | $ | 36.16 | $ | 36.60 | $ | 32.83 | ||||||||||||
Income/(loss) from investment operations: |
| |||||||||||||||||||||||
Net investment income | 0.37 | (a) | 0.74 | (a) | 0.71 | (a) | 0.72 | 0.69 | 0.61 | |||||||||||||||
Net realized and unrealized gains/(losses) on investments | 6.62 | (2.86 | ) | 7.52 | 3.49 | (0.28 | ) | 3.76 | ||||||||||||||||
|
|
|
|
|
|
|
|
|
|
|
| |||||||||||||
Total income/(loss) from investment operations | 6.99 | (2.12 | ) | 8.23 | 4.21 | 0.41 | 4.37 | |||||||||||||||||
|
|
|
|
|
|
|
|
|
|
|
| |||||||||||||
Less distributions from: |
| |||||||||||||||||||||||
Net investment income | — | 0.80 | 0.79 | 0.73 | 0.85 | 0.60 | ||||||||||||||||||
Net realized gains | — | 3.04 | 1.57 | 1.42 | — | — | ||||||||||||||||||
|
|
|
|
|
|
|
|
|
|
|
| |||||||||||||
Total distributions | — | 3.84 | 2.36 | 2.15 | 0.85 | 0.60 | ||||||||||||||||||
|
|
|
|
|
|
|
|
|
|
|
| |||||||||||||
Net asset value, end of period | $ | 45.12 | $ | 38.13 | $ | 44.09 | $ | 38.22 | $ | 36.16 | $ | 36.60 | ||||||||||||
|
|
|
|
|
|
|
|
|
|
|
| |||||||||||||
Total Return(b) | 18.33 | % | (4.73 | )% | 21.50 | % | 11.61 | % | 1.07 | % | 13.28 | % | ||||||||||||
Ratios/Supplemental Data: |
| |||||||||||||||||||||||
Net assets, end of period (in thousands) | $ | 177,179 | $ | 160,902 | $ | 194,117 | $ | 180,761 | $ | 179,395 | $ | 203,262 | ||||||||||||
Ratios to average net assets: |
| |||||||||||||||||||||||
Net expenses | 0.34 | %** | 0.33 | % | 0.32 | % | 0.34 | %(d) | 0.37 | %(d) | 0.41 | %(c)(d) | ||||||||||||
Gross expenses | 0.34 | %** | 0.33 | % | 0.32 | % | 0.37 | % | 0.42 | % | 0.46 | % | ||||||||||||
Net investment income | 1.73 | %** | 1.62 | % | 1.69 | % | 1.86 | % | 1.72 | % | 1.65 | % | ||||||||||||
Portfolio turnover rate | 0 | %†† | 2 | % | 2 | % | 2 | % | 2 | % | 2 | % | ||||||||||||
Notes to Financial Highlights
| (a) | Per share values have been calculated using the average shares method. |
| (b) | Total returns are historical and assume changes in share price, reinvestment of dividends and capital gains distributions and do not include the effect of insurance contract charges. Past performance does not guarantee future results. |
| (c) | Includes contractual management fee waiver related to the Fund’s investments in the GE Institutional Money Market Fund (the “Money Market Fund”). The fee waiver agreement was terminated effective June 30, 2014 with the closure of the Money Market Fund. |
| (d) | Reflects a contractual arrangement with GE Asset Management Incorporated, the Fund’s investment adviser and administrator prior to July 1, 2016, to limit the advisory and administrative fee charged to the Fund to 0.30% of the average daily net assets of the Fund. |
| † | Unaudited. |
| †† | Rounds to less than 1%. |
| * | Beginning with the year ended December 31, 2016, the Fund was audited by Ernst & Young LLP. The previous years were audited by another independent registered public accounting firm. |
| ** | Annualized for periods less than one year. |
The accompanying Notes are an integral part of these financial statements.
| Financial Highlights | 13 |
Table of Contents
State Street S&P 500 Index V.I.S. Fund
Statements of Assets and Liabilities — June 30, 2019 (Unaudited)
Assets | ||||
Investments in securities, at fair value (cost $67,942,621) | $ | 174,641,558 | ||
Investments in affiliated securities, at fair value (cost $147,147) | 146,373 | |||
Short-term affiliated investments, at fair value | 2,309,185 | |||
Cash | 1,391 | |||
Cash collateral on deposit with broker for future contracts | 92,990 | |||
Income receivables | 143,737 | |||
Receivable for fund shares sold | 4,964 | |||
Income receivable from affiliated investments | 4,526 | |||
Receivable for accumulated variation margin on futures contracts | 40,503 | |||
|
| |||
Total assets | 177,385,227 | |||
|
| |||
Liabilities | ||||
Payable for investments purchased | 96,427 | |||
Payable for fund shares redeemed | 44,405 | |||
Payable to the Adviser | 35,750 | |||
Payable for custody, fund accounting andsub-administration fees | 5,512 | |||
Accrued other expenses | 23,706 | |||
|
| |||
Total liabilities | 205,800 | |||
|
| |||
Net Assets | $ | 177,179,427 | ||
|
| |||
Net Assets Consist of: | ||||
Capital paid in | $ | 66,479,507 | ||
Total distributable earnings (loss) | 110,699,920 | |||
|
| |||
Net Assets | $ | 177,179,427 | ||
|
| |||
Shares outstanding ($0.01 par value; unlimited shares authorized) | 3,926,647 | |||
Net asset value per share | $ | 45.12 | ||
The accompanying Notes are an integral part of these financial statements.
| 14 | Statements of Assets and Liabilities |
Table of Contents
State Street S&P 500 Index V.I.S. Fund
Statements of Operations — For the period ended June 30, 2019 (Unaudited)
Investment Income |
| |||
Income |
| |||
Dividend | $ | 1,758,230 | ||
Income from affiliated investments | 28,593 | |||
|
| |||
Total income | 1,786,823 | |||
|
| |||
Expenses |
| |||
Advisory and administration fees | 215,563 | |||
Directors’ fees | 11,119 | |||
Custody, fund accounting andsub-administration fees | 19,674 | |||
Professional fees | 25,316 | |||
Printing and shareholder reports | 12,676 | |||
Other expenses | 10,704 | |||
|
| |||
Total Expenses | 295,052 | |||
|
| |||
Net investment income | $ | 1,491,771 | ||
|
| |||
Net Realized and Unrealized Gain (Loss) on Investments |
| |||
Realized gain (loss) on: |
| |||
Unaffiliated investments | $ | 5,860,000 | ||
Affiliated investments | (661 | ) | ||
Futures | 269,027 | |||
Increase (decrease) in unrealized appreciation/depreciation on: |
| |||
Unaffiliated investments | 21,102,549 | |||
Affiliated investments | (15,978 | ) | ||
Futures | 130,595 | |||
|
| |||
Net realized and unrealized gain (loss) on investments | 27,345,532 | |||
|
| |||
Net Increase in Net Assets Resulting from Operations | $ | 28,837,303 | ||
|
| |||
The accompanying Notes are an integral part of these financial statements.
| Statements of Operations | 15 |
Table of Contents
State Street S&P 500 Index V.I.S. Fund
Statements of Changes in Net Assets
Six Months Ended June 30, 2019* | Year Ended December 31, | |||||||
Increase (Decrease) in Net Assets |
| |||||||
Operations: |
| |||||||
Net investment income | $ | 1,491,771 | $ | 3,026,780 | ||||
Net realized gain (loss) on investments and futures | 6,128,366 | 13,212,356 | ||||||
Net increase (decrease) in unrealized appreciation/depreciation on investments and futures | 21,217,166 | (23,393,093 | ) | |||||
|
|
|
| |||||
Net increase (decrease) from operations | 28,837,303 | (7,153,957 | ) | |||||
|
|
|
| |||||
Distributions to shareholders: |
| |||||||
Total distributions | — | (14,751,301 | ) | |||||
|
|
|
| |||||
Increase (decrease) in assets from operations and distributions | 28,837,303 | (21,905,258 | ) | |||||
|
|
|
| |||||
Share transactions: |
| |||||||
Proceeds from sale of shares | 1,418,863 | 2,837,356 | ||||||
Value of distributions reinvested | — | 14,751,301 | ||||||
Cost of shares redeemed | (13,979,010 | ) | (28,898,496 | ) | ||||
|
|
|
| |||||
Net increase (decrease) from share transactions | (12,560,147 | ) | (11,309,839 | ) | ||||
|
|
|
| |||||
Total increase (decrease) in net assets | 16,277,156 | (33,215,097 | ) | |||||
Net Assets |
| |||||||
Beginning of period | 160,902,271 | 194,117,368 | ||||||
|
|
|
| |||||
End of period | $ | 177,179,427 | $ | 160,902,271 | ||||
|
|
|
| |||||
Changes in Fund Shares |
| |||||||
Shares sold | 33,356 | 61,494 | ||||||
Issued for distributions reinvested | — | 389,731 | ||||||
Shares redeemed | (326,824 | ) | (634,062 | ) | ||||
|
|
|
| |||||
Net decrease in fund shares | (293,468 | ) | (182,837 | ) | ||||
|
|
|
| |||||
| * | Unaudited. |
The accompanying Notes are an integral part of these financial statements.
| 16 | Statements of Changes in Net Assets |
Table of Contents
State Street S&P 500 Index V.I.S. Fund
Notes to Financial Statements — June 30, 2019 (Unaudited)
| 1. | Organization of the Company |
State Street Variable Insurance Series Funds, Inc. (the “Company”) was incorporated under the laws of the Commonwealth of Virginia on May 14, 1984 and is registered under the Investment Company Act of 1940, as amended (the “1940 Act”), as anopen-end management investment company. The Company is currently composed of the following seven investment portfolios (collectively, the “Funds”): State Street U.S. Equity V.I.S. Fund, State Street S&P 500 Index V.I.S. Fund (the “Fund”), State Street Premier Growth Equity V.I.S. Fund, State StreetSmall-Cap Equity V.I.S. Fund, State Street Total Return V.I.S. Fund, State Street Income V.I.S. Fund and State Street Real Estate Securities V.I.S. Fund. Each Fund is a diversified investment company within the meaning of the 1940 Act.
Shares of the Funds of the Company are offered only to insurance company separate accounts that fund certain variable life insurance contracts and variable annuity contracts.
The Company currently offers one share class (Class 1) of the Fund as an investment option for variable life insurance and variable annuity contracts.
Under the Company’s organizational documents, its officers and directors are indemnified against certain liabilities arising out of the performance of their duties to the Company. Additionally, in the normal course of business, the Company enters into contracts with service providers that contain general indemnification clauses. The Company’s maximum exposure under these arrangements is unknown as this would involve future claims that may be made against the Company that have not yet occurred.
| 2. | Summary of Significant Accounting Policies |
The following is a summary of significant accounting policies followed by the Company in the preparation of its financial statements:
The preparation of financial statements in accordance with U.S. generally accepted accounting principles (“U.S. GAAP”) requires management to make estimates and assumptions that affect the reported amounts and disclosures in the financial statements. Actual results could differ from those estimates. The Fund is an investment company under U.S. GAAP and follows the accounting and reporting guidance applicable to investment companies.
Security Valuation The Fund’s investments are valued at fair value each day that the New York Stock Exchange (“NYSE”) is open and, for financial reporting purposes, as of the report date should the reporting period end on a day that the NYSE is not open. Fair value is generally defined as the price a fund would receive to sell an asset or pay to transfer a liability in an orderly transaction between market participants at the measurement date. By its nature, a fair value price is a good faith estimate of the valuation in a current sale and may not reflect an actual market price. The investments of the Fund are valued pursuant to the policy and procedures developed by the Oversight Committee (the “Committee”) and approved by the Company’s Board of Directors (the “Board”). The Committee provides oversight of the valuation of investments for the Fund. The Board has responsibility for overseeing the determination of the fair value of investments.
Valuation techniques used to value the Fund’s investments by major category are as follows:
| • | Equity investments traded on a recognized securities exchange for which market quotations are readily available are valued at the last sale price or official closing price, as applicable, on the primary market or exchange on which they trade. Equity investments traded on a recognized exchange for which there were no sales on that day are valued at the last published sale price or at fair value. |
| • | Investments in registered investment companies (including money market funds) or other unitized pooled investment vehicles that are not traded on an exchange are valued at that day’s published net asset value (“NAV”) per share or unit. |
| • | Exchange-traded futures contracts are valued at the closing settlement price on the primary market on which they are traded most extensively. Exchange-traded futures contracts traded on a recognized exchange for which there were no sales on that day are valued at the last reported sale price obtained from independent pricing services or brokers or at fair value. |
| Notes to Financial Statements | 17 |
Table of Contents
State Street S&P 500 Index V.I.S. Fund
Notes to Financial Statements, continued — June 30, 2019 (Unaudited)
In the event prices or quotations are not readily available or that the application of these valuation methods results in a price for an investment that is deemed to be not representative of the fair value of such investment, fair value will be determined in good faith by the Committee, in accordance with the valuation policy and procedures approved by the Board.
The Fund values its assets and liabilities at fair value using a fair value hierarchy consisting of three broad levels that prioritize the inputs to valuation techniques giving the highest priority to readily available unadjusted quoted prices in active markets for identical assets or liabilities (Level 1 measurements) and the lowest priority to unobservable inputs (Level 3 measurements) when market prices are not readily available or reliable. The categorization of a value determined for an investment within the hierarchy is based upon the pricing transparency of the investment and is not necessarily an indication of the risk associated with investing in it.
The three levels of the fair value hierarchy are as follows:
| • | Level 1 — Unadjusted quoted prices in active markets for an identical asset or liability; |
| • | Level 2 — Inputs other than quoted prices included within Level 1 that are observable for the asset or liability either directly or indirectly, including quoted prices for similar assets or liabilities in active markets, quoted prices for identical or similar assets or liabilities in markets that are not considered to be active, inputs other than quoted prices that are observable for the asset or liability (such as exchange rates, financing terms, interest rates, yield curves, volatilities, prepayment speeds, loss severities, credit risks and default rates) or other market-corroborated inputs; and |
| • | Level 3 — Unobservable inputs for the asset or liability, including the Committee’s assumptions used in determining the fair value of investments. |
The value of the Fund’s investments according to the fair value hierarchy as of June 30, 2019 is disclosed in the Fund’s Schedule of Investments.
Investment Transactions and Income Recognition Investment transactions are accounted for on trade date for financial reporting purposes. Realized gains and losses from the sale or disposition of investments and foreign exchange transactions, if any, are determined using the identified cost method.
Dividend income and capital gain distributions, if any, are recognized on theex-dividend date, net of any foreign taxes withheld at source, if any.
Interest income is recorded daily on an accrual basis. All premiums and discounts are amortized/accreted for financial reporting purposes.
Non-cash dividends received in the form of stock are recorded as dividend income at fair value.
Expenses Certain expenses, which are directly identifiable to a specific Fund, are applied to the Fund within the Company. Other expenses which cannot be attributed to a specific Fund are allocated in such a manner as deemed equitable, taking into consideration the nature and type of expense and the relative net assets of the Fund within the Company.
Distributions The Fund declares and pays any dividends from net investment income annually.
Net realized capital gains, if any, are distributed annually, unless additional distributions are required for compliance with applicable tax regulations. The amount and character of income and capital gains to be distributed are determined in accordance with applicable tax regulations which may differ from net investment income and realized gains recognized for U.S. GAAP purposes.
| 3. | Derivative Financial Instruments |
Futures Contracts The Fund may enter into futures contracts to meet the Fund’s objectives. A futures contract is a standardized, exchange-traded agreement to buy or sell a financial instrument at a set price on a future date. Upon entering into a futures contract, the Fund is required to deposit with the broker, cash or securities in an amount equal to the minimum initial margin requirements of the clearing house. Subsequent payments are made or received by the Fund equal to the daily change in the contract value and are recorded as variation margin receivable or payable with a corresponding offset to unrealized gains or losses. The Fund recognizes a realized gain or loss when the contract is closed.
| 18 | Notes to Financial Statements |
Table of Contents
State Street S&P 500 Index V.I.S. Fund
Notes to Financial Statements, continued — June 30, 2019 (Unaudited)
Losses may arise if the value of a futures contract decreases due to unfavorable changes in the market rates or values of the underlying instrument during the term of the contract or if the counterparty does not perform under the contract. The use of futures contracts also involves the risk that the movements in the price of the futures contracts do not correlate with the movement of the assets underlying such contracts.
For the period ended June 30, 2019, the Fund entered into futures contracts for cash equitization.
The following tables summarize the value of the Fund’s derivative instruments as of June 30, 2019 and the related location in the accompanying Statement of Assets and Liabilities and Statement of Operations, presented by primary underlying risk exposure:
Asset Derivatives
| Interest Rate Contracts Risk | Foreign Exchange Contracts Risk | Credit Contracts Risk | Equity Contracts Risk | Commodity Contracts Risk | Total | |||||||||||||||||||
State Street S&P 500 Index V.I.S. Fund |
| |||||||||||||||||||||||
Futures Contracts | $ | — | $ | — | $ | — | $ | 40,503 | $ | — | $ | 40,503 | ||||||||||||
Realized Gain/Loss
| Interest Rate Contracts Risk | �� | Foreign Exchange Contracts Risk | Credit Contracts Risk | Equity Contracts Risk | Commodity Contracts Risk | Total | ||||||||||||||||||
State Street S&P 500 Index V.I.S. Fund |
| |||||||||||||||||||||||
Futures Contracts | $ | — | $ | — | $ | — | $ | 269,027 | $ | — | $ | 269,027 | ||||||||||||
Net Change in Unrealized Appreciation (Depreciation)
| Interest Rate Contracts Risk | Foreign Exchange Contracts Risk | Credit Contracts Risk | Equity Contracts Risk | Commodity Contracts Risk | Total | |||||||||||||||||||
State Street S&P 500 Index V.I.S. Fund |
| |||||||||||||||||||||||
Futures Contracts | $ | — | $ | — | $ | — | $ | 130,595 | $ | — | $ | 130,595 | ||||||||||||
| 4. | Fees and Transactions with Affiliates |
Advisory Fee SSGA Funds Management, Inc. (the “Adviser” or “SSGA FM”), a registered investment adviser, was retained by the Board to act as investment adviser and administrator of the Fund. SSGA FM’s compensation for investment advisory and administrative services (“Management Fee”) is paid monthly based on the average daily net assets of the Fund at an annualized rate of 0.25%.
Custody, Fund Accounting andSub-Administration Fees State Street Bank and Trust Company (“State Street”) serves as the custodian, fund accountant andsub-administrator to the Fund. Amounts paid by the Fund to State Street for performing such services are included as custody, fund accounting andsub-administration fees in the Statement of Operations.
Other Transactions with Affiliates The Fund may invest in affiliated entities, including securities issued by State Street Corporation, affiliated funds, or entities deemed to be affiliates as a result of the Fund owning more than five percent of the entity’s voting securities or outstanding shares. Amounts relating to these transactions during the period ended June 30, 2019 are disclosed in the Schedule of Investments.
| 5. | Directors’ Fees |
The fees and expenses of the Company’s directors who are not “interested persons” of the Company, as defined in the 1940 Act (“Independent Directors”), are paid directly by the Fund. The Independent Directors are reimbursed for travel and otherout-of-pocket expenses in connection with meeting attendance and industry seminars.
| Notes to Financial Statements | 19 |
Table of Contents
State Street S&P 500 Index V.I.S. Fund
Notes to Financial Statements, continued — June 30, 2019 (Unaudited)
| 6. | Investment Transactions |
Purchases and sales of investments (excludingin-kind transactions, short term investments and derivative contracts) for the period ended June 30, 2019, were as follows:
| Non-U.S. Government Securities | ||||||||
| Purchases | Sales | |||||||
| $ | 586,570 | $ | 11,676,676 | |||||
| 7. | Income Taxes |
The Fund has qualified and intends to continue to qualify as a regulated investment company under Subchapter M of the Internal Revenue Code of 1986, as amended. The Fund will not be subject to federal income taxes to the extent it distributes its taxable income, including any net realized capital gains, for each fiscal year. Therefore, no provision for federal income tax is required.
The Fund files federal and various state and local tax returns as required. No income tax returns are currently under examination. Generally, the federal returns are subject to examination by the Internal Revenue Service for a period of three years from date of filing, while the state returns may remain open for an additional year depending upon jurisdiction. SSGA FM has analyzed the Fund’s tax positions taken on tax returns for all open years and does not believe there are any uncertain tax positions that would require recognition of a tax liability.
Under tax reform legislation commonly referred to as the Tax Cuts and Jobs Act (the “Tax Act”), a direct REIT shareholder is permitted to claim a 20% deduction for “qualified REIT dividends” (i.e., ordinary REIT dividends other than capital gain dividends and portions of REIT dividends designated as qualified dividend income). Originally, the Act did not contain a provision permitting a regulated investment company, such as the Fund, to pass through the special character of “qualified REIT dividends” to its shareholders. On January 18, 2019, the Treasury Department and IRS issued proposed regulations (the “Proposed Regulations”) that generally permit regulated investment companies, such as the Fund, to pass through “qualified REIT dividends” to its shareholders under Section 199A of the Internal Revenue Code.
Distributions to shareholders are recorded onex-dividend date. Income dividends and gain distributions are determined in accordance with income tax rules and regulations, which may differ from generally accepted accounting principles.
As of June 30, 2019, gross unrealized appreciation and gross unrealized depreciation of investments and other financial instruments based on cost for federal income tax purposes were as follows:
| Tax Cost | Gross Unrealized Appreciation | Gross Unrealized Depreciation | Net Unrealized Appreciation (Depreciation) | |||||||||||||||
| $ | 75,726,413 | $ | 110,350,582 | $ | 8,939,415 | $ | 101,411,167 | |||||||||||
| 8. | Line of Credit |
The Fund and other affiliated funds (each, a “Participant” and collectively, the “Participants”) participate in a $500 million revolving credit facility provided by a syndication of banks under which the Participants may borrow to fund shareholder redemptions. This agreement expires in October 2019 unless otherwise extended or renewed.
The Participants are charged an annual commitment fee which is calculated based on the unused portion of the shared credit line. Commitment fees are allocated among each of the Participants based on relative net assets. Commitment fees are ordinary fund operating expenses. A Participant incurs and pays the interest expense related to its borrowing. Interest is calculated at a rate per annum equal to the sum of 1% plus the greater of the New York Fed Bank Rate and1-month LIBOR rate.
The Fund had no outstanding loans as of June 30, 2019.
| 20 | Notes to Financial Statements |
Table of Contents
State Street S&P 500 Index V.I.S. Fund
Notes to Financial Statements, continued — June 30, 2019 (Unaudited)
| 9. | Risks |
Concentration Risk As a result of the Fund’s ability to invest a large percentage of its assets in obligations of issuers within the same country, state, region, currency or economic sector, an adverse economic, business or political development may affect the value of the Fund’s investments more than if the Fund were more broadly diversified.
Market and Credit Risk In the normal course of business, the Fund trades financial instruments and enters into financial transactions where risk of potential loss exists due to changes in the general economic conditions and fluctuations of the market (market risk). Additionally, the Fund may also be exposed to credit risk in the event that an issuer or guarantor fails to perform or that an institution or entity with which the Fund has unsettled or open transactions defaults.
| 10. | Subsequent Events |
Management has evaluated the impact of all subsequent events on the Fund through the date on which the financial statements were available to be issued and has determined that there were no subsequent events requiring adjustment or disclosure in the financial statements.
| Notes to Financial Statements | 21 |
Table of Contents
State Street S&P 500 Index V.I.S. Fund
Other Information — June 30, 2019 (Unaudited)
Proxy Voting Policies and Procedures and Record
The Fund has adopted the proxy voting policies of SSGA FM. A description of the policies and procedures that the Fund has adopted to determine how to vote proxies relating to portfolio securities is available (i) without charge, upon request, by calling1-800-242-0134, (ii) on the Fund’s website at http://www.ssga.com/geam, or (iii) on the SEC’s website at www.sec.gov. Information regarding how the Fund voted proxies, if any, during the most recent12-month period ended June 30 is available by August 31 of each year without charge (1) by calling1-800-242-0134 (toll free), and (2) on the website of the SEC at www.sec.gov.
Quarterly Portfolio Schedule
Following the Fund’s first and third fiscal quarter-ends, a complete schedule of investments is filed with the SEC as an exhibit to its reports onForm N-PORT, which can be found on the SEC’s website at www.sec.gov. The Fund’s schedule of investments are available upon request, without charge, by calling 1-800-242-0134 and on the Fund’s website at http://www.ssga.com/geam.
| 22 | Other Information |
Table of Contents
State Street S&P 500 Index V.I.S. Fund
Other Information — June 30, 2019 (Unaudited), continued
Director Considerations in Approving Continuation of Investment Advisory Agreement1
Overview of the Contract Review Process
Under the Investment Company Act of 1940, as amended (the “1940 Act”), an investment advisory agreement between a mutual fund and its investment adviser may continue in effect from year to year only if its continuance is approved at least annually by the fund’s board of directors or its shareholders, and by a vote of a majority of those directors who are not “interested persons” of the fund (commonly referred to as, the “Independent Directors”) cast in person at a meeting called for the purpose of considering such approval.
Consistent with these requirements, the Board of Directors (the “Board”) of the State Street Variable Insurance Series Funds, Inc. (the “Company”) met in person on April 10, 2019 and May 15, 2019, including in executive sessions attended by the Independent Directors, to consider a proposal to approve, with respect to State Street S&P 500 Index V.I.S. Fund (the “Fund”), the continuation of the investment advisory agreement (the “Advisory Agreement”) with SSGA Funds Management, Inc. (“SSGA FM” or the “Adviser”). Prior to voting on the proposal, the Independent Directors, as well as the Directors who are “interested persons” of the Adviser, reviewed information furnished by the Adviser and others reasonably necessary to permit the Board to evaluate the proposal fully. The Independent Directors were separately represented by counsel who are independent of the Adviser in connection with their consideration of approval of the Agreement. Following the April 10, 2019 meeting, the Independent Directors submitted questions and requests for additional information to management, and considered management’s responses thereto prior to and at the May 15, 2019 meeting. The Independent Directors considered, among other things, the following:
Information about Performance, Expenses and Fees
| • | A report prepared by an independent third-party provider of investment company data, which includes for the Fund: |
| ¡ | Comparisons of the Fund’s performance over the pastone-, three-, five- andten-year periods ended December 31, 2018, to the performance of an appropriate benchmark constructed by Broadridge Financial Solutions, Inc. (“Broadridge”) for the Fund (the “Lipper Index”) and a universe of other mutual funds with similar investment objectives and policies (the “Performance Group” and/or the “Performance Universe”); |
| ¡ | Comparisons of the Fund’s expense ratio (with detail of component expenses) to the expense ratios of a group of comparable mutual funds selected by the independent third-party data provider (the “Expense Group” and/or “Expense Universe”); |
| ¡ | A chart showing the Fund’s historical average net assets relative to its total expenses, management fees, andnon-management expenses over the past five calendar years; and |
| ¡ | Comparisons of the Fund’s contractual management fee to the contractual management fees of comparable mutual funds at different asset levels. |
| • | Comparative information concerning fees charged by the Adviser for managing institutional accounts using investment strategies and techniques similar to those used in managing the Fund; and |
| 1 | The Independent Directors have identified numerous relevant issues, factors and concerns (“issues, factors and concerns”) that they consider each year in connection with the proposed continuation of the advisory agreement, the administration agreement, the distribution plans, the distribution agreement and various related-party service agreements (the “annual review process”). The statement of issues, factors and concerns and the related conclusions of the Independent Directors may not change substantially from year to year. However, the information requested by, and provided to, the Independent Directors with respect to the issues, factors and concerns and on which their conclusions are based is updated annually and, in some cases, may differ substantially from the previous year. The Independent Directors schedule annually a separatein-person meeting that is dedicated to the annual review process (the “special meeting”). At the special meeting and throughout the annual review process, the Independent Directors take a fresh look at each of the issues, factors and concerns in light of the latest available information and each year present one or more sets of comments and questions to management with respect to specific issues, factors and concerns. Management responds to such comments and questions to the satisfaction of the Independent Directors before the annual review process is completed and prior to the Independent Directors voting on proposals to approve continuation of the agreements and plans. |
Other Information | 23 |
Table of Contents
State Street S&P 500 Index V.I.S. Fund
Other Information — June 30, 2019 (Unaudited), continued
| • | Profitability analyses for (a) the Adviser with respect to the Fund and (b) affiliates of SSGA FM that provide services to the Fund (“Affiliated Service Providers”). |
Information about Portfolio Management
| • | Descriptions of the investment management services provided by the Adviser, including its investment strategies and processes; |
| • | Information concerning the allocation of brokerage; and |
| • | Information regarding the procedures and processes used to value the assets of the Fund. |
Information about the Adviser
| • | Reports detailing the financial results and condition of SSGA FM and its affiliates; |
| • | Descriptions of the qualifications, education and experience of the individual investment and other professionals responsible for managing the portfolio of the Fund and for Fund operations; |
| • | Information relating to compliance with and the administration of the Code of Ethics adopted by the Adviser; |
| • | Information about the Adviser’s proxy voting policies and procedures and information regarding the Adviser’s practices for overseeing proxy vendors; |
| • | Information concerning the resources devoted by the Adviser to overseeing compliance by the Fund and its service providers, including information concerning compliance with investment policies and restrictions and other operating policies of the Fund; |
| • | A description of the adequacy and sophistication of the Adviser’s technology and systems with respect to investment and administrative matters and a description of any material improvements or changes in technology or systems in the past year; |
| • | A description of the business continuity and disaster recovery plans of the Adviser; and |
| • | Information regarding the Adviser’s risk management processes. |
Other Relevant Information
| • | Information concerning the nature, extent, quality and cost of services provided to the Fund by SSGA FM in its capacity as the Fund’s administrator (the “Administrator”); |
| • | Information concerning the nature, extent, quality and cost of variousnon-investment management services provided to the Fund by affiliates of the Adviser, including the custodian,sub-administrator and fund accountant of the Fund, and the role of the Adviser in managing the Fund’s relationship with these service providers; |
| • | Copies of the Advisory Agreement and agreements with other service providers of the Fund; |
| • | Draft responses to a letter from independent legal counsel to the Independent Directors (“Independent Counsel”), reviewed prior to such date by Independent Counsel, requesting specific information from each of: |
| ¡ | SSGA FM, in its capacity as the Fund’s Adviser and Administrator, with respect to its operations relating to the Fund and its approximate profit margins from such operations for the calendar year ended December 31, 2018; and the relevant operations of other affiliated service providers to the Fund, together with their approximate profit margins from such relevant operations for the calendar year ended December 31, 2018; |
| ¡ | State Street Bank and Trust Company (“State Street”), thesub-administrator, custodian, and fund accountant for the Fund, with respect to its operations relating to the Fund; and |
| ¡ | State Street Global Advisors Funds Distributors, LLC, the principal underwriter and distributor of the shares of the Fund (the “Distributor”), with respect to its operations relating to the Fund, together with the Fund’s related distribution plans and arrangements under Rule12b-1 of the 1940 Act; |
| • | Information from SSGA FM, State Street and the Distributor with respect to the Fund providing any material changes to the previous information supplied in response to the letter from Independent Counsel prior to the executive session of the Board on May 15, 2019; |
| 24 | Other Information |
Table of Contents
State Street S&P 500 Index V.I.S. Fund
Other Information — June 30, 2019 (Unaudited), continued
| • | Materials provided by Broadridge, circulated to the Independent Directors and to Independent Counsel; and |
| • | A summary of the foregoing materials prepared by Independent Counsel. |
In addition to the information identified above, the Board considered information provided from time to time by the Adviser, and other service providers of the Fund throughout the year at meetings of the Board and its committees. At such meetings, the Directors received, among other things, presentations by the portfolio managers and other investment professionals of the Adviser relating to the performance of the Fund and the investment strategies used in pursuing the Fund’s investment objective.
The Independent Directors were assisted throughout the contract review process by their Independent Counsel. The Independent Directors relied upon the advice of such counsel and their own business judgment in determining the material factors to be considered in evaluating the Agreement, and the weight to be given to each such factor. The conclusions reached with respect to the Agreement were based on a comprehensive evaluation of all the information provided and not any single factor. Moreover, each Director may have placed varying emphasis on particular factors in reaching conclusions with respect to the Fund.
Results of the Process
Based on a consideration of the foregoing and such other information as deemed relevant, including the factors and conclusions described below, on May 15, 2019 the Board, including a majority of the Independent Directors, voted to approve the continuation of the Agreement effective June 1, 2019, for an additional year with respect to the Fund.
Nature, Extent and Quality of Services
In considering whether to approve the Agreement, the Board evaluated the nature, extent and quality of services provided to the Fund by the Adviser.
The Board considered the Adviser’s management capabilities and investment process with respect to the types of investments held by the Fund, including the education, experience and number of investment professionals and other personnel who provide portfolio management, investment research, and similar services to the Fund. The Board evaluated the abilities and experience of such investment personnel in analyzing particular markets, industries and specific issuers of securities in these markets and industries. The Board also considered the substantial expertise of the Adviser in developing and applying proprietary quantitative models for managing the Fund. The Board considered the extensive experience and resources committed by the Adviser to risk management, including with respect to investment risk, liquidity risk, operational risk, counterparty risk and model risk. The Directors also considered the significant risks assumed by the Adviser in connection with the services provided to the Fund, including reputational and entrepreneurial risks. The Board also took into account the compensation paid to recruit and retain investment personnel, and the time and attention devoted to the Fund by senior management.
The Board had previously reviewed the compliance programs of SSGA FM and various affiliated service providers. Among other things, the Board considered compliance and reporting matters relating to personal trading by investment personnel, selective disclosure of portfolio holdings, late trading, frequent trading, portfolio valuation, business continuity, the allocation of investment opportunities and the voting of proxies.
On the basis of the foregoing and other relevant information, the Board concluded that the Adviser can be expected to continue to provide high quality investment management and related services for the Fund.
Fund Performance
The Board compared the Fund’s investment performance to the performance of an appropriate benchmark and universe of comparable mutual funds for various time periods ended December 31, 2018. For purposes of these comparisons the Independent Directors relied extensively on the Performance Group, Performance Universe and Lipper Index and the analyses of the related data provided by Broadridge. Among other information, the Board considered the following performance information in its evaluation of the Fund:
State Street S&P 500 Index V.I.S. Fund. The Board considered that the Fund’s performance was below the median of its Performance Group for the1-,3- and5-year periods and below its Lipper Index for the1-year period. The Board also considered that the Fund’s performance was equal to the median of the Performance Group for the10-year period and the median of the Performance Universe for the1-year period. The Board also considered that the Fund’s performance was above the median of the Performance Universe for the3-,5- and10-year periods and above the Lipper Index for the3-,5- and10-year periods. The Board took into account management’s discussion of the Fund’s performance.
Other Information | 25 |
Table of Contents
State Street S&P 500 Index V.I.S. Fund
Other Information — June 30, 2019 (Unaudited), continued
On the basis of the foregoing and other relevant information, the Board concluded that the performance of the Fund is satisfactory.
Management Fees and Expenses
The Board reviewed the contractual investment advisory fee rates payable by the Fund and actual fees paid by the Fund. As part of its review, the Board considered the Fund’s management fee and total expense ratio, including the portion attributable to administrative services provided by SSGA FM (both before and after giving effect to any expense caps), as compared to its Expense Group and Expense Universe, as constructed by Broadridge, and the related Broadridge analysis for the Fund. The Board also considered the comparability of the fees charged and the services provided to the Fund by the Adviser to the fees charged and services provided to other clients of the Adviser, including institutional accounts, as applicable. Among other information, the Board considered the following expense information in its evaluation of the Fund:
State Street S&P 500 Index V.I.S. Fund. The Board considered that the Fund’s actual management fee was above the medians of its Expense Group and Expense Universe. The Board also considered that the Fund’s total expenses were above the medians of its Expense Group and Expense Universe. The Board considered management’s discussion of the Fund’s expenses.
On the basis of the foregoing and other relevant information, and in light of the nature, extent and quality of the services provided by the Adviser, the Board concluded that the fees and the expense ratio of the Fund compare favorably to the fees and expenses of the Expense Group and Expense Universe and are reasonable in relation to the services provided.
Profitability
The Board reviewed the level of profits realized by the Adviser and its affiliates in providing investment advisory and other services to the Fund and to all funds within the fund complex. The Board considered other direct and indirect benefits received by SSGA FM and Affiliated Service Providers in connection with their relationships with the Fund, including soft dollar commission benefits generated through Fund portfolio transactions. The Board further considered the profitability of each of the Affiliated Service Providers with respect to their services to the Fund and/or fund complex. The Board also considered the various risks borne by SSGA FM and State Street in connection with their various roles in servicing the Fund, including reputational and entrepreneurial risks.
The Board concluded that the profitability of the Adviser with respect to the Fund, and the profitability range of each of the Affiliated Service Providers with respect to its services to the Fund, were reasonable in relation to the services provided.
Economies of Scale
In reviewing management fees and profitability, the Board also considered the extent to which the Adviser and its affiliates, on the one hand, and the Fund and the fund complex, on the other hand, can expect to realize benefits from economies of scale as the assets of the Fund and fund complex increase. The Board acknowledged the difficulty in accurately measuring the benefits resulting from the economies of scale with respect to the management of the Fund or the fund complex taken as a whole. The Board concluded that, in light of the current size of the Fund and the fund complex, the level of profitability of the Adviser and its affiliates with respect to the Fund and the fund complex over various time periods, and the comparative management fee and expense ratio of the Fund during these periods, it does not appear that the Adviser or its affiliates has realized benefits from economies of scale in managing the assets of the Fund to such an extent that previously agreed advisory fees should be reduced or that breakpoints in such fees should be implemented for the Fund at this time.
Conclusions
In reaching its decision to approve the Agreement, the Board did not identify any single factor as being controlling, but based its recommendation on each of the factors it considered. Each Director may have contributed different weight to the various factors. Based upon the materials reviewed, the representations made and the considerations described above, and as part of its deliberations, the Board, including the Independent Directors, concluded that the Adviser possesses the capability and resources to perform the duties required of it under the Agreement.
Further, based upon its review of the Agreement, the materials provided, and the considerations described above, the Board, including the Independent Directors, concluded that (1) the terms of the Advisory Agreement are reasonable, fair, and in the best interests of the Fund and its shareholders, and (2) the rates payable under the Advisory Agreement are fair and reasonable in light of the usual and customary charges made for services of the same nature and quality.
| 26 | Other Information |
Table of Contents
Directors
Michael F. Holland, Co-Chairperson
Patrick J. Riley, Co-Chairperson
John R. Costantino
Donna M. Rapaccioli
Michael A. Jessee
Richard D. Shirk
Rina K. Spence
Jeanne M. La Porta
Ellen M. Needham
Officers
Jeanne M. La Porta, President
Brian Harris, Chief Compliance Officer, Anti-Money Laundering Officer and Code of Ethics Compliance Officer
Sean O’Malley, Chief Legal Officer
Bruce S. Rosenberg, Treasurer
Ann M. Carpenter, Vice President and Deputy Treasurer
Chad C. Hallett, Deputy Treasurer
Arthur A. Jensen, Deputy Treasurer
Darlene Anderson-Vasquez, Deputy Treasurer
Sujata Upreti, Assistant Treasurer
Daniel Foley, Assistant Treasurer
Andrew DeLorme, Secretary
James Goundrey, Assistant Secretary
Kevin Morris, Assistant Secretary
David Urman, Assistant Secretary
Investment Adviser and Administrator
SSGA Funds Management, Inc.
One Iron Street
Boston, MA 02210
Custodian andSub-Administrator
State Street Bank and Trust Company
One Lincoln Street
Boston, Massachusetts 02111
Distributor
State Street Global Advisors Funds Distributors, LLC
One Iron Street
Boston, MA 02210
Independent Registered Public Accounting Firm
Ernst & Young LLP
200 Clarendon Street
Boston, Massachusetts 02116
Table of Contents
Semi-Annual Report
June 30, 2019
State StreetSmall-Cap Equity V.I.S. Fund
Beginning on January 1, 2021, as permitted by regulations adopted by the U.S. Securities and Exchange Commission, paper copies of a Fund’s annual and semi- annual shareholder reports will no longer be sent by mail, unless you specifically request paper copies of the reports. Instead, the reports will be made available on a Fund’s website (www.ssga.com/geam), and you will be notified by mail each time a report is posted, and provided with a website link to access the report. If you already elected to receive shareholder reports electronically, you will not be affected by this change and you need not take any action.
You may elect to receive all future reports in paper free of charge. To do so, contact your Insurance Provider. Your election to receive reports in paper will apply to all funds held in your account.

Table of Contents
State StreetSmall-Cap Equity V.I.S. Fund
Semi-Annual Report
June 30, 2019 (Unaudited)
| Page | ||||
| Fund Information | 1 | |||
| Understanding Your Fund’s Expenses | 2 | |||
| Schedule of Investments | 3 | |||
| Financial Statements | ||||
| 11 | ||||
| 12 | ||||
| 13 | ||||
| 14 | ||||
| Notes to Financial Statements | 15 | |||
| Other Information | 20 | |||
This report is prepared for Policyholders of certain variable contracts and may be distributed to others only if preceded or accompanied by the variable contract’s current prospectus and the current summary prospectus of the Fund available for investments thereunder.
Table of Contents
State StreetSmall-Cap Equity V.I.S. Fund
Fund Information — June 30, 2019 (Unaudited)
Total return performance shown in this report for the Fund takes into account changes in share price and assumes reinvestment of dividends and capital gains distributions, if any. Total returns shown are net of Fund fees and expenses but do not reflect fees and charges associated with the variable contracts such as administrative fees, account charges and surrender charges, which, if reflected, would reduce the Fund’s total returns for all periods shown.
The performance data quoted represents past performance; past performance does not guarantee future results. Investment return and principal value will fluctuate so your shares, when redeemed, may be worth more or less than their original cost. Current performance may be higher or lower than the performance data quoted. Periods less than one year are not annualized. Please call toll-free(800) 242-0134 or visit the Fund’s website at http://www.ssga.com/geam for the most recent month-end performance data.
An investment in the Fund is not a deposit of any bank and is not insured or guaranteed by the Federal Deposit Insurance Corporation (“FDIC”) or any other government agency. An investment in the Fund is subject to risk, including possible loss of principal invested.
Sector Allocation
Portfolio Composition as a % of Fair Value of $33,584 (in thousands) as of June 30, 2019(a)(b)
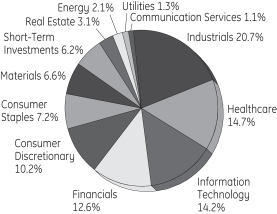
Top Ten Largest Holdings
as of June 30, 2019 (as a % of Fair Value)(a)(b)
Sensient Technologies Corp. | 1.12 | % | ||
Dycom Industries Inc. | 1.10 | % | ||
John Wiley & Sons Inc., Class A | 1.04 | % | ||
The Timken Co. | 1.03 | % | ||
Darling Ingredients Inc. | 1.03 | % | ||
Ritchie Bros Auctioneers Inc. | 1.00 | % | ||
The Brink’s Co. | 0.99 | % | ||
Blackbaud Inc. | 0.98 | % | ||
Blackline Inc. | 0.96 | % | ||
Koppers Holdings Inc. | 0.93 | % | ||
| (a) | Fair Value basis is inclusive of short-term investment in State Street Institutional U.S. Government Money Market Fund Class G Shares. |
| (b) | The securities information regarding holdings, allocations and other characteristics is presented to illustrate examples of securities that the Fund has bought and the diversity of areas in which the Fund may invest as of a particular date. It may not be representative of the Fund’s current or future investments and should not be construed as a recommendation to purchase or sell a particular security. |
State Street Global Advisors Funds Distributors, LLC, member of FINRA & SIPC is the principal underwriter and distributor of the State Street V.I.S. Funds and an indirect wholly-owned subsidiary of State Street Corporation. References to State Street may include State Street Corporation and its affiliates. The Funds pay State Street Bank and Trust Company for its services as custodian and Fund Accounting agent, and pay SSGA Funds Management, Inc. for investment advisory and administrative services.
State Street Small-Cap Equity V.I.S. Fund | 1 |
Table of Contents
State StreetSmall-Cap Equity V.I.S. Fund
Understanding Your Fund’s Expenses — June 30, 2019 (Unaudited)
As a shareholder of the Fund, you incur ongoing costs. Ongoing costs include portfolio management fees, professional fees, administrative fees and other Fund expenses. The following example is intended to help you understand your ongoing costs (in dollars) of investing in the Fund and to compare these costs with the ongoing costs of investing in other mutual funds.
To illustrate these ongoing costs, we have provided an example and calculated the expenses paid by investors in the Fund during the period. The information in the following table is based on an investment of $1,000, which is invested at the beginning of the period and held for the entiresix-month period ended June 30, 2019.
Actual Expenses
The first section of the table provides information about actual account values and actual expenses. You may use the information in this section, together with the amount you invested, to estimate the expenses that you paid over the period. To do so, simply divide your account value by $1,000 (for example, an $8,600 account value divided by $1,000 = 8.6), then multiply the result by the number given under the heading “Expenses paid during the period” to estimate the expenses you paid on your account during the period.
Hypothetical Example for Comparison Purposes
The second section of the table provides information about hypothetical account values and hypothetical expenses based on the Fund’s actual expense ratio and an assumed rate of return of 5% per year before expenses, which is not the Fund’s actual return. The hypothetical account values and expenses may not be used to estimate the actual ending account balance or expenses you paid for the period. You may use this information to compare the ongoing costs of investing in the Fund and other funds. To do so, compare this 5% hypothetical example with the 5% hypothetical examples that appear in the shareholder reports of other funds.
Please note that the expenses shown in the table are meant to highlight and help you compare ongoing costs only and do not reflect transaction costs, such as sales charges or redemption fees, if any. Therefore, the second section of the table is useful in comparing ongoing costs only, and will not help you determine the relative total costs of owning different funds. Additionally, the expenses shown do not reflect the fees or charges associated with variable contracts through which shares of the Fund are offered.
| Actual Fund Return | Hypothetical 5% Return (2.5% for the period) | |||||||
Account value at the beginning of the period January 1, 2019 | $ | 1,000.00 | $ | 1,000.00 | ||||
Account value at the end of the period June 30, 2019 | $ | 1,177.90 | $ | 1,018.55 | ||||
Expenses paid during the period* | $ | 6.80 | $ | 6.31 | ||||
| * | Expenses are equal to the Fund’s annualized expense ratio of 1.26% (for the period January 1, 2019-June 30, 2019), multiplied by the average account value over the period, multiplied by 181/365 (to reflect theone-half year period). |
| 2 | State Street Small-Cap Equity V.I.S. Fund |
Table of Contents
State Street Small-Cap Equity V.I.S. Fund
Schedule of Investments — June 30, 2019 (Unaudited)
| Number of Shares | Fair $ | |||||||
| Common Stock - 93.4%† |
| |||||||
Aerospace & Defense - 0.8% |
| |||||||
Astronics Corp. (a) | 626 | 25,178 | ||||||
Teledyne Technologies Inc. (a) | 858 | 234,980 | ||||||
|
| |||||||
| 260,158 | ||||||||
|
| |||||||
Agricultural & Farm Machinery - 0.7% |
| |||||||
AGCO Corp. | 3,038 | 235,658 | ||||||
|
| |||||||
Agricultural Products - 1.0% |
| |||||||
Darling Ingredients Inc. (a) | 17,300 | 344,097 | ||||||
|
| |||||||
Air Freight & Logistics - 0.2% |
| |||||||
Echo Global Logistics Inc. (a) | 911 | 19,013 | ||||||
Forward Air Corp. | 448 | 26,499 | ||||||
Hub Group Inc., Class A (a) | 552 | 23,173 | ||||||
|
| |||||||
| 68,685 | ||||||||
|
| |||||||
Airlines - 0.0%* |
| |||||||
Hawaiian Holdings Inc. | 404 | 11,082 | ||||||
|
| |||||||
Apparel Retail - 0.6% |
| |||||||
American Eagle Outfitters Inc. | 2,608 | 44,075 | ||||||
Burlington Stores Inc. (a) | 488 | 83,033 | ||||||
Chico’s FAS Inc. | 3,639 | 12,263 | ||||||
The Buckle Inc. | 3,786 | 65,536 | ||||||
|
| |||||||
| 204,907 | ||||||||
|
| |||||||
Apparel, Accessories & Luxury Goods - 0.3% |
| |||||||
G-III Apparel Group Ltd. (a) | 3,659 | 107,648 | ||||||
|
| |||||||
Application Software - 6.9% |
| |||||||
ACI Worldwide Inc. (a) | 6,365 | 218,574 | ||||||
Altair Engineering Inc., Class A (a) | 1,571 | 63,453 | ||||||
Blackbaud Inc. | 3,949 | 329,741 | ||||||
Blackline Inc. (a) | 6,033 | 322,826 | ||||||
Cornerstone OnDemand Inc. (a) | 2,822 | 163,478 | ||||||
Envestnet Inc. (a) | 1,950 | 133,321 | ||||||
Fair Isaac Corp. (a) | 127 | 39,881 | ||||||
LogMeIn Inc. | 1,775 | 130,782 | ||||||
New Relic Inc. (a) | 2,405 | 208,057 | ||||||
Paylocity Holding Corp. (a) | 321 | 30,116 | ||||||
Q2 Holdings Inc. (a) | 3,150 | 240,534 | ||||||
RealPage Inc. (a) | 2,209 | 130,000 | ||||||
Upland Software Inc. (a) | 543 | 24,723 | ||||||
Verint Systems Inc. (a) | 660 | 35,495 | ||||||
Yext Inc. (a) | 10,750 | 215,967 | ||||||
Zix Corp. (a) | 4,753 | 43,205 | ||||||
|
| |||||||
| 2,330,153 | ||||||||
|
| |||||||
Asset Management & Custody Banks - 0.2% |
| |||||||
BrightSphere Investment Group PLC | 1,307 | 14,913 | ||||||
| Number of Shares | Fair $ | |||||||
Cohen & Steers Inc. | 729 | 37,500 | ||||||
|
| |||||||
| 52,413 | ||||||||
|
| |||||||
Auto Parts & Equipment - 0.5% |
| |||||||
Dorman Products Inc. (a) | 207 | 18,038 | ||||||
Gentherm Inc. (a) | 194 | 8,115 | ||||||
LCI Industries | 403 | 36,270 | ||||||
Modine Manufacturing Co. (a) | 1,141 | 16,328 | ||||||
Standard Motor Products Inc. | 1,446 | 65,561 | ||||||
Tower International Inc. | 678 | 13,221 | ||||||
|
| |||||||
| 157,533 | ||||||||
|
| |||||||
Automobile Manufacturers - 0.7% |
| |||||||
Thor Industries Inc. | 3,901 | 228,014 | ||||||
Winnebago Industries Inc. | 433 | 16,735 | ||||||
|
| |||||||
| 244,749 | ||||||||
|
| |||||||
Automotive Retail - 1.4% |
| |||||||
America’sCar-Mart Inc. (a) | 432 | 37,187 | ||||||
Group 1 Automotive Inc. | 2,210 | 180,977 | ||||||
Monro Inc. | 858 | 73,187 | ||||||
Murphy USA Inc. (a) | 2,240 | 188,227 | ||||||
|
| |||||||
| 479,578 | ||||||||
|
| |||||||
Biotechnology - 0.9% |
| |||||||
Genomic Health Inc. (a) | 296 | 17,218 | ||||||
Heron Therapeutics Inc. (a) | 2,987 | 55,528 | ||||||
Repligen Corp. (a) | 2,587 | 222,353 | ||||||
|
| |||||||
| 295,099 | ||||||||
|
| |||||||
Brewers - 0.4% |
| |||||||
The Boston Beer Company Inc., Class A (a) | 325 | 122,772 | ||||||
|
| |||||||
Building Products - 0.5% |
| |||||||
American Woodmark Corp. (a) | 248 | 20,986 | ||||||
Apogee Enterprises Inc. | 508 | 22,067 | ||||||
Builders FirstSource Inc. (a) | 1,166 | 19,659 | ||||||
Continental Building Products Inc. (a) | 524 | 13,923 | ||||||
Cornerstone Building Brands Inc. (a) | 1,145 | 6,675 | ||||||
CSW Industrials Inc. | 265 | 18,060 | ||||||
Masonite International Corp. (a) | 178 | 9,377 | ||||||
Patrick Industries Inc. (a) | 359 | 17,659 | ||||||
Universal Forest Products Inc. | 1,271 | 48,374 | ||||||
|
| |||||||
| 176,780 | ||||||||
|
| |||||||
Coal & Consumable Fuels - 0.0%* |
| |||||||
CONSOL Energy Inc. (a) | 483 | 12,853 | ||||||
|
| |||||||
See Notes to Schedule of Investments and Notes to Financial Statements.
| State Street Small-Cap Equity V.I.S. Fund | 3 |
Table of Contents
State Street Small-Cap Equity V.I.S. Fund
Schedule of Investments, continued — June 30, 2019 (Unaudited)
| Number of Shares | Fair $ | |||||||
Commercial Printing - 0.0%* |
| |||||||
Deluxe Corp. | 315 | 12,808 | ||||||
|
| |||||||
Commodity Chemicals - 1.0% |
| |||||||
AdvanSix Inc. (a) | 795 | 19,422 | ||||||
Koppers Holdings Inc. (a) | 10,656 | 312,860 | ||||||
Trinseo S.A. | 485 | 20,535 | ||||||
|
| |||||||
| 352,817 | ||||||||
|
| |||||||
Communications Equipment - 0.5% |
| |||||||
ADTRAN Inc. | 654 | 9,973 | ||||||
Ciena Corp. (a) | 383 | 15,753 | ||||||
Extreme Networks Inc. (a) | 6,474 | 41,887 | ||||||
Lumentum Holdings Inc. (a) | 640 | 34,182 | ||||||
NETGEAR Inc. (a) | 693 | 17,526 | ||||||
NetScout Systems Inc. (a) | 653 | 16,580 | ||||||
Plantronics Inc. | 1,125 | 41,670 | ||||||
|
| |||||||
| 177,571 | ||||||||
|
| |||||||
Construction & Engineering - 1.8% |
| |||||||
Aegion Corp. (a) | 11,845 | 217,948 | ||||||
Dycom Industries Inc. (a) | 6,266 | 368,879 | ||||||
EMCOR Group Inc. | 270 | 23,787 | ||||||
|
| |||||||
| 610,614 | ||||||||
|
| |||||||
Construction Machinery & Heavy Trucks - 1.0% |
| |||||||
Alamo Group Inc. | 415 | 41,471 | ||||||
Astec Industries Inc. | 573 | 18,657 | ||||||
The Greenbrier Companies Inc. | 730 | 22,192 | ||||||
Trinity Industries Inc. | 10,346 | 214,679 | ||||||
Wabash National Corp. | 2,045 | 33,272 | ||||||
|
| |||||||
| 330,271 | ||||||||
|
| |||||||
Construction Materials - 0.1% |
| |||||||
Eagle Materials Inc. | 251 | 23,268 | ||||||
Summit Materials Inc., Class A (a) | 1,253 | 24,120 | ||||||
|
| |||||||
| 47,388 | ||||||||
|
| |||||||
Consumer Electronics - 0.0%* |
| |||||||
Turtle Beach Corp. (a) | 975 | 11,271 | ||||||
|
| |||||||
Consumer Finance - 0.2% |
| |||||||
Enova International Inc. (a) | 1,940 | 44,717 | ||||||
Green Dot Corp., Class A (a) | 257 | 12,567 | ||||||
|
| |||||||
| 57,284 | ||||||||
|
| |||||||
Data Processing & Outsourced Services - 1.7% |
| |||||||
Broadridge Financial Solutions Inc. | 1,459 | 186,285 | ||||||
Cass Information Systems Inc. | 150 | 7,272 | ||||||
CoreLogic Inc. (a) | 3,715 | 155,399 | ||||||
| Number of Shares | Fair $ | |||||||
CSG Systems International Inc. | 1,669 | 81,497 | ||||||
EVERTEC Inc. | 1,216 | 39,763 | ||||||
MAXIMUS Inc. | 315 | 22,850 | ||||||
NIC Inc. | 4,602 | 73,816 | ||||||
|
| |||||||
| 566,882 | ||||||||
|
| |||||||
Distillers & Vintners - 0.5% |
| |||||||
MGP Ingredients Inc. | 2,580 | 171,080 | ||||||
|
| |||||||
Distributors - 0.4% |
| |||||||
LKQ Corp. (a) | 5,371 | 142,922 | ||||||
|
| |||||||
Diversified Metals & Mining - 0.4% |
| |||||||
Compass Minerals International Inc. | 1,857 | 102,042 | ||||||
Materion Corp. | 456 | 30,922 | ||||||
|
| |||||||
| 132,964 | ||||||||
|
| |||||||
Diversified REITs - 0.2% |
| |||||||
American Assets Trust Inc. | 810 | 38,167 | ||||||
Essential Properties Realty Trust Inc. | 1,021 | 20,461 | ||||||
|
| |||||||
| 58,628 | ||||||||
|
| |||||||
Diversified Support Services - 1.5% |
| |||||||
Healthcare Services Group Inc. | 4,417 | 133,924 | ||||||
Ritchie Bros Auctioneers Inc. | 10,131 | 336,552 | ||||||
UniFirst Corp. | 220 | 41,485 | ||||||
|
| |||||||
| 511,961 | ||||||||
|
| |||||||
Education Services - 0.4% |
| |||||||
K12 Inc. (a) | 4,847 | 147,397 | ||||||
|
| |||||||
Electric Utilities - 0.9% |
| |||||||
ALLETE Inc. | 363 | 30,205 | ||||||
IDACORP Inc. | 2,719 | 273,069 | ||||||
|
| |||||||
| 303,274 | ||||||||
|
| |||||||
Electrical Components & Equipment - 0.4% |
| |||||||
Atkore International Group Inc. (a) | 735 | 19,014 | ||||||
EnerSys | 143 | 9,796 | ||||||
Generac Holdings Inc. (a) | 622 | 43,173 | ||||||
GrafTech International Ltd. | 1,321 | 15,192 | ||||||
Regal Beloit Corp. | 533 | 43,551 | ||||||
|
| |||||||
| 130,726 | ||||||||
|
| |||||||
Electronic Components - 1.2% |
| |||||||
Belden Inc. | 4,397 | 261,929 | ||||||
Littelfuse Inc. | 881 | 155,858 | ||||||
|
| |||||||
| 417,787 | ||||||||
|
| |||||||
See Notes to Schedule of Investments and Notes to Financial Statements.
| 4 | State Street Small-Cap Equity V.I.S. Fund |
Table of Contents
State Street Small-Cap Equity V.I.S. Fund
Schedule of Investments, continued — June 30, 2019 (Unaudited)
| Number of Shares | Fair $ | |||||||
Electronic Equipment & Instruments - 0.8% |
| |||||||
National Instruments Corp. | 2,460 | 103,295 | ||||||
Zebra Technologies Corp., Class A (a) | 754 | 157,956 | ||||||
|
| |||||||
| 261,251 | ||||||||
|
| |||||||
Electronic Manufacturing Services - 0.3% |
| |||||||
KEMET Corp. | 1,018 | 19,149 | ||||||
Methode Electronics Inc. | 997 | 28,484 | ||||||
Plexus Corp. (a) | 616 | 35,956 | ||||||
TTM Technologies Inc. (a) | 2,784 | 28,397 | ||||||
|
| |||||||
| 111,986 | ||||||||
|
| |||||||
Environmental & Facilities Services - 0.8% |
| |||||||
Clean Harbors Inc. (a) | 3,889 | 276,508 | ||||||
|
| |||||||
Food Distributors - 0.6% |
| |||||||
Performance Food Group Co. (a) | 4,168 | 166,845 | ||||||
SpartanNash Co. | 3,420 | 39,911 | ||||||
|
| |||||||
| 206,756 | ||||||||
|
| |||||||
Food Retail - 0.1% |
| |||||||
Casey’s General Stores Inc. | 154 | 24,022 | ||||||
Sprouts Farmers Market Inc. (a) | 1,166 | 22,026 | ||||||
|
| |||||||
| 46,048 | ||||||||
|
| |||||||
Footwear - 0.8% |
| |||||||
Deckers Outdoor Corp. (a) | 694 | 122,123 | ||||||
Wolverine World Wide Inc. | 5,400 | 148,716 | ||||||
|
| |||||||
| 270,839 | ||||||||
|
| |||||||
Forest Products - 0.1% |
| |||||||
Boise Cascade Co. | 726 | 20,408 | ||||||
|
| |||||||
Gas Utilities - 0.3% |
| |||||||
Chesapeake Utilities Corp. | 210 | 19,954 | ||||||
South Jersey Industries Inc. | 1,231 | 41,522 | ||||||
Spire Inc. | 451 | 37,848 | ||||||
|
| |||||||
| 99,324 | ||||||||
|
| |||||||
Health Care REITs - 0.2% |
| |||||||
CareTrust REIT Inc. | 1,311 | 31,176 | ||||||
Physicians Realty Trust | 1,996 | 34,810 | ||||||
|
| |||||||
| 65,986 | ||||||||
|
| |||||||
Healthcare Equipment - 5.2% |
| |||||||
Cantel Medical Corp. | 1,740 | 140,314 | ||||||
Cardiovascular Systems Inc. (a) | 4,840 | 207,781 | ||||||
CONMED Corp. | 3,240 | 277,247 | ||||||
Hill-Rom Holdings Inc. | 2,513 | 262,910 | ||||||
Insulet Corp. (a) | 1,150 | 137,287 | ||||||
Integer Holdings Corp. (a) | 242 | 20,309 | ||||||
| Number of Shares | Fair $ | |||||||
Integra LifeSciences Holdings Corp. (a) | 5,400 | 301,590 | ||||||
IntriCon Corp. (a) | 2,098 | 49,009 | ||||||
LeMaitre Vascular Inc. | 760 | 21,265 | ||||||
LivaNova PLC (a) | 266 | 19,141 | ||||||
Masimo Corp. (a) | 700 | 104,174 | ||||||
NuVasive Inc. (a) | 2,140 | 125,276 | ||||||
Orthofix Medical Inc. (a) | 406 | 21,469 | ||||||
Penumbra Inc. (a) | 425 | 68,000 | ||||||
|
| |||||||
| 1,755,772 | ||||||||
|
| |||||||
Healthcare Facilities - 0.5% |
| |||||||
Acadia Healthcare Company Inc. (a) | 3,025 | 105,724 | ||||||
Select Medical Holdings Corp. (a) | 1,423 | 22,583 | ||||||
Tenet Healthcare Corp. (a) | 432 | 8,925 | ||||||
The Ensign Group Inc. | 415 | 23,622 | ||||||
|
| |||||||
| 160,854 | ||||||||
|
| |||||||
Healthcare Services - 1.0% |
| |||||||
Amedisys Inc. (a) | 182 | 22,097 | ||||||
AMN Healthcare Services Inc. (a) | 1,124 | 60,977 | ||||||
BioTelemetry Inc. (a) | 1,976 | 95,144 | ||||||
Chemed Corp. | 85 | 30,671 | ||||||
MEDNAX Inc. (a) | 4,567 | 115,226 | ||||||
R1 RCM Inc. (a) | 1,724 | 21,688 | ||||||
|
| |||||||
| 345,803 | ||||||||
|
| |||||||
Healthcare Supplies - 1.1% |
| |||||||
Avanos Medical Inc. (a) | 5,445 | 237,456 | ||||||
Endologix Inc. (a) | 3,604 | 26,093 | ||||||
ICU Medical Inc. (a) | 106 | 26,703 | ||||||
Lantheus Holdings Inc. (a) | 1,345 | 38,064 | ||||||
Merit Medical Systems Inc. (a) | 474 | 28,231 | ||||||
Quidel Corp. (a) | 472 | 27,999 | ||||||
|
| |||||||
| 384,546 | ||||||||
|
| |||||||
Healthcare Technology - 1.9% |
| |||||||
Computer Programs & Systems Inc. | 629 | 17,480 | ||||||
HMS Holdings Corp. (a) | 6,600 | 213,774 | ||||||
Medidata Solutions Inc. (a) | 2,275 | 205,910 | ||||||
NextGen Healthcare Inc. (a) | 724 | 14,408 | ||||||
Omnicell Inc. (a) | 506 | 43,531 | ||||||
Teladoc Health Inc. (a) | 2,025 | 134,480 | ||||||
|
| |||||||
| 629,583 | ||||||||
|
| |||||||
Home Building - 0.4% |
| |||||||
Cavco Industries Inc. (a) | 75 | 11,815 | ||||||
LGI Homes Inc. (a) | 478 | 34,144 | ||||||
Skyline Champion Corp. (a) | 1,466 | 40,139 | ||||||
TopBuild Corp. (a) | 666 | 55,118 | ||||||
|
| |||||||
| 141,216 | ||||||||
|
| |||||||
See Notes to Schedule of Investments and Notes to Financial Statements.
| State Street Small-Cap Equity V.I.S. Fund | 5 |
Table of Contents
State Street Small-Cap Equity V.I.S. Fund
Schedule of Investments, continued — June 30, 2019 (Unaudited)
| Number of Shares | Fair $ | |||||||
Home Furnishing Retail - 0.8% |
| |||||||
Aaron’s Inc. | 3,741 | 229,735 | ||||||
RH (a) | 273 | 31,559 | ||||||
|
| |||||||
| 261,294 | ||||||||
|
| |||||||
Hotel & Resort REITs - 0.5% |
| |||||||
Chatham Lodging Trust | 189 | 3,567 | ||||||
Pebblebrook Hotel Trust | 1,128 | 31,787 | ||||||
RLJ Lodging Trust | 7,033 | 124,765 | ||||||
|
| |||||||
| 160,119 | ||||||||
|
| |||||||
Hotels, Resorts & Cruise Lines - 1.0% |
| |||||||
Extended Stay America Inc. | 18,109 | 305,861 | ||||||
Hilton Grand Vacations Inc. (a) | 543 | 17,278 | ||||||
|
| |||||||
| 323,139 | ||||||||
|
| |||||||
Household Appliances - 0.4% |
| |||||||
Helen of Troy Ltd. (a) | 905 | 118,184 | ||||||
|
| |||||||
Human Resource & Employment Services - 0.6% |
| |||||||
ASGN Inc. (a) | 447 | 27,088 | ||||||
Barrett Business Services Inc. | 179 | 14,785 | ||||||
Heidrick & Struggles International Inc. | 448 | 13,427 | ||||||
Insperity Inc. | 622 | 75,971 | ||||||
Kforce Inc. | 966 | 33,897 | ||||||
Korn Ferry | 493 | 19,755 | ||||||
|
| |||||||
| 184,923 | ||||||||
|
| |||||||
Hypermarkets & Super Centers - 0.1% |
| |||||||
BJ’s Wholesale Club Holdings Inc. (a) | 941 | 24,842 | ||||||
|
| |||||||
Industrial Machinery - 7.8% |
| |||||||
Actuant Corp., Class A | 10,126 | 251,226 | ||||||
Altra Industrial Motion Corp. | 5,824 | 208,965 | ||||||
Barnes Group Inc. | 5,522 | 311,109 | ||||||
Crane Co. | 2,596 | 216,610 | ||||||
Evoqua Water Technologies Corp. (a) | 2,950 | 42,008 | ||||||
Franklin Electric Company Inc. | 353 | 16,768 | ||||||
Harsco Corp. (a) | 594 | 16,299 | ||||||
Hillenbrand Inc. | 489 | 19,350 | ||||||
John Bean Technologies Corp. | 2,250 | 272,542 | ||||||
Kennametal Inc. | 513 | 18,976 | ||||||
LB Foster Co., Class A (a) | 996 | 27,231 | ||||||
Lydall Inc. (a) | 2,515 | 50,803 | ||||||
Mueller Industries Inc. | 4,503 | 131,803 | ||||||
Standex International Corp. | 1,615 | 118,121 | ||||||
The Timken Co. | 6,729 | 345,467 | ||||||
TriMas Corp. (a) | 2,400 | 74,328 | ||||||
| Number of Shares | Fair $ | |||||||
Watts Water Technologies Inc., Class A | 1,407 | 131,104 | ||||||
Welbilt Inc. (a) | 14,400 | 240,480 | ||||||
Woodward Inc. | 1,167 | 132,058 | ||||||
|
| |||||||
| 2,625,248 | ||||||||
|
| |||||||
Industrial REITs - 0.6% |
| |||||||
EastGroup Properties Inc. | 1,323 | 153,442 | ||||||
Monmouth Real Estate Investment Corp. | 2,456 | 33,279 | ||||||
Rexford Industrial Realty Inc. | 579 | 23,374 | ||||||
|
| |||||||
| 210,095 | ||||||||
|
| |||||||
Interactive Home Entertainment - 0.1% |
| |||||||
Glu Mobile Inc. (a) | 2,997 | 21,518 | ||||||
|
| |||||||
Internet & Direct Marketing Retail - 0.1% |
| |||||||
1-800-Flowers.com Inc., Class A (a) | 1,274 | 24,053 | ||||||
|
| |||||||
Internet Services & Infrastructure - 0.1% |
| |||||||
Carbonite Inc. (a) | 1,144 | 29,790 | ||||||
|
| |||||||
Investment Banking & Brokerage - 0.9% |
| |||||||
Evercore Inc., Class A | 233 | 20,637 | ||||||
Greenhill & Company Inc. | 906 | 12,313 | ||||||
Houlihan Lokey Inc. | 798 | 35,535 | ||||||
Piper Jaffray Cos. | 515 | 38,249 | ||||||
Raymond James Financial Inc. | 1,697 | 143,481 | ||||||
Stifel Financial Corp. | 624 | 36,853 | ||||||
|
| |||||||
| 287,068 | ||||||||
|
| |||||||
IT Consulting & Other Services - 0.1% |
| |||||||
Perficient Inc. (a) | 827 | 28,383 | ||||||
|
| |||||||
Leisure Products - 0.7% |
| |||||||
Malibu Boats Inc., Class A (a) | 628 | 24,398 | ||||||
MasterCraft Boat Holdings Inc. (a) | 986 | 19,315 | ||||||
Polaris Industries Inc. | 2,230 | 203,443 | ||||||
|
| |||||||
| 247,156 | ||||||||
|
| |||||||
Life & Health Insurance - 0.1% |
| |||||||
Trupanion Inc. (a) | 1,332 | 48,125 | ||||||
|
| |||||||
Life Sciences Tools & Services - 1.9% |
| |||||||
Bruker Corp. | 3,945 | 197,053 | ||||||
ICON PLC (a) | 1,308 | 201,393 | ||||||
Medpace Holdings Inc. (a) | 448 | 29,308 | ||||||
PRA Health Sciences Inc. (a) | 363 | 35,991 | ||||||
Syneos Health Inc. (a) | 3,532 | 180,450 | ||||||
|
| |||||||
| 644,195 | ||||||||
|
| |||||||
See Notes to Schedule of Investments and Notes to Financial Statements.
| 6 | State Street Small-Cap Equity V.I.S. Fund |
Table of Contents
State Street Small-Cap Equity V.I.S. Fund
Schedule of Investments, continued — June 30, 2019 (Unaudited)
| Number of Shares | Fair $ | |||||||
Managed Healthcare - 0.1% |
| |||||||
Magellan Health Inc. (a) | 269 | 19,968 | ||||||
|
| |||||||
Marine - 0.1% |
| |||||||
Matson Inc. | 625 | 24,281 | ||||||
|
| |||||||
Multi-Line Insurance - 0.4% |
| |||||||
Horace Mann Educators Corp. | 2,595 | 104,552 | ||||||
National General Holdings Corp. | 807 | 18,513 | ||||||
|
| |||||||
| 123,065 | ||||||||
|
| |||||||
Multi-Utilities - 0.2% |
| |||||||
Black Hills Corp. | 640 | 50,029 | ||||||
|
| |||||||
Office REITs - 0.8% |
| |||||||
Brandywine Realty Trust | 1,999 | 28,626 | ||||||
Corporate Office Properties Trust | 966 | 25,473 | ||||||
Cousins Properties Inc. | 5,467 | 197,741 | ||||||
Easterly Government Properties Inc. | 1,480 | 26,803 | ||||||
|
| |||||||
| 278,643 | ||||||||
|
| |||||||
Office Services & Supplies - 1.1% |
| |||||||
Herman Miller Inc. | 538 | 24,049 | ||||||
HNI Corp. | 480 | 16,982 | ||||||
Knoll Inc. | 691 | 15,879 | ||||||
MSA Safety Inc. | 2,761 | 290,982 | ||||||
Steelcase Inc., Class A | 1,701 | 29,087 | ||||||
|
| |||||||
| 376,979 | ||||||||
|
| |||||||
Oil & Gas Drilling - 0.0%* |
| |||||||
Nabors Industries Ltd. | 3,783 | 10,971 | ||||||
|
| |||||||
Oil & Gas Equipment & Services - 0.7% |
| |||||||
Keane Group Inc. (a) | 689 | 4,630 | ||||||
Natural Gas Services Group Inc. (a) | 1,010 | 16,665 | ||||||
Oil States International Inc. (a) | 7,840 | 143,472 | ||||||
ProPetro Holding Corp. (a) | 3,141 | 65,019 | ||||||
|
| |||||||
| 229,786 | ||||||||
|
| |||||||
Oil & Gas Exploration & Production - 1.3% |
| |||||||
Callon Petroleum Co. (a) | 4,780 | 31,500 | ||||||
Carrizo Oil & Gas Inc. (a) | 7,826 | 78,417 | ||||||
Encana Corp. | 30,013 | 153,967 | ||||||
Gulfport Energy Corp. (a) | 2,332 | 11,450 | ||||||
Oasis Petroleum Inc. (a) | 1,484 | 8,429 | ||||||
PDC Energy Inc. (a) | 837 | 30,182 | ||||||
Range Resources Corp. | 2,764 | 19,293 | ||||||
SM Energy Co. | 6,418 | 80,353 | ||||||
SRC Energy Inc. (a) | 3,754 | 18,620 | ||||||
|
| |||||||
| 432,211 | ||||||||
|
| |||||||
| Number of Shares | Fair $ | |||||||
Oil & Gas Refining & Marketing - 0.1% |
| |||||||
Delek US Holdings Inc. | 818 | 33,145 | ||||||
|
| |||||||
Packaged Foods & Meats - 3.8% |
| |||||||
B&G Foods Inc. | 6,575 | 136,760 | ||||||
Calavo Growers Inc. | 168 | 16,252 | ||||||
Freshpet Inc. (a) | 1,700 | 77,367 | ||||||
Hostess Brands Inc. (a) | 19,675 | 284,107 | ||||||
J&J Snack Foods Corp. | 375 | 60,356 | ||||||
John B Sanfilippo & Son Inc. | 189 | 15,062 | ||||||
Lancaster Colony Corp. | 500 | 74,300 | ||||||
Sanderson Farms Inc. | 2,085 | 284,728 | ||||||
The Simply Good Foods Co. (a) | 5,850 | 140,868 | ||||||
TreeHouse Foods Inc. (a) | 3,510 | 189,891 | ||||||
|
| |||||||
| 1,279,691 | ||||||||
|
| |||||||
Paper Products - 0.1% |
| |||||||
Neenah Inc. | 412 | 27,830 | ||||||
Verso Corp., Class A (a) | 797 | 15,183 | ||||||
|
| |||||||
| 43,013 | ||||||||
|
| |||||||
Personal Products - 0.5% |
| |||||||
elf Beauty Inc. (a) | 7,665 | 108,077 | ||||||
Medifast Inc. | 178 | 22,837 | ||||||
USANA Health Sciences Inc. (a) | 309 | 24,544 | ||||||
|
| |||||||
| 155,458 | ||||||||
|
| |||||||
Pharmaceuticals - 2.1% |
| |||||||
ANI Pharmaceuticals Inc. (a) | 404 | 33,209 | ||||||
Assertio Therapeutics Inc. (a) | 2,242 | 7,735 | ||||||
Catalent Inc. (a) | 4,262 | 231,043 | ||||||
Collegium Pharmaceutical Inc. (a) | 1,098 | 14,439 | ||||||
Endo International PLC (a) | 1,166 | 4,804 | ||||||
Horizon Therapeutics PLC (a) | 1,435 | 34,526 | ||||||
Phibro Animal Health Corp., Class A | 628 | 19,951 | ||||||
Prestige Consumer Healthcare Inc. (a) | 7,103 | 225,023 | ||||||
Supernus Pharmaceuticals Inc. (a) | 4,088 | 135,272 | ||||||
|
| |||||||
| 706,002 | ||||||||
|
| |||||||
Property & Casualty Insurance - 1.9% |
| |||||||
AMERISAFE Inc. | 1,855 | 118,293 | ||||||
Argo Group International Holdings Ltd. | 3,618 | 267,913 | ||||||
James River Group Holdings Ltd. | 2,150 | 100,835 | ||||||
RLI Corp. | 1,581 | 135,507 | ||||||
Selective Insurance Group Inc. | 139 | 10,410 | ||||||
|
| |||||||
| 632,958 | ||||||||
|
| |||||||
See Notes to Schedule of Investments and Notes to Financial Statements.
| State Street Small-Cap Equity V.I.S. Fund | 7 |
Table of Contents
State Street Small-Cap Equity V.I.S. Fund
Schedule of Investments, continued — June 30, 2019 (Unaudited)
| Number of Shares | Fair $ | |||||||
Publishing - 1.0% |
| |||||||
John Wiley & Sons Inc., Class A | 7,649 | 350,783 | ||||||
|
| |||||||
Railroads - 0.6% |
| |||||||
Genesee & Wyoming Inc., Class A (a) | 2,176 | 217,600 | ||||||
|
| |||||||
Regional Banks - 8.3% |
| |||||||
1st Source Corp. | 576 | 26,726 | ||||||
Atlantic Union Bankshares Corp. | 1,033 | 36,496 | ||||||
BankUnited Inc. | 535 | 18,051 | ||||||
Banner Corp. | 830 | 44,944 | ||||||
Bryn Mawr Bank Corp. | 2,125 | 79,305 | ||||||
Camden National Corp. | 537 | 24,632 | ||||||
Chemical Financial Corp. | 878 | 36,095 | ||||||
Columbia Banking System Inc. | 902 | 32,634 | ||||||
Community Bank System Inc. | 1,825 | 120,158 | ||||||
Cullen/Frost Bankers Inc. | 1,413 | 132,342 | ||||||
CVB Financial Corp. | 5,050 | 106,201 | ||||||
Enterprise Financial Services Corp. | 942 | 39,187 | ||||||
Equity Bancshares Inc., Class A (a) | 995 | 26,527 | ||||||
First Interstate BancSystem Inc., Class A | 937 | 37,115 | ||||||
Franklin Financial Network Inc. | 646 | 17,998 | ||||||
Fulton Financial Corp. | 7,970 | 130,469 | ||||||
German American Bancorp Inc. | 2,400 | 72,288 | ||||||
Hancock Whitney Corp. | �� | 658 | 26,359 | |||||
Home BancShares Inc. | 1,368 | 26,348 | ||||||
IBERIABANK Corp. | 2,128 | 161,409 | ||||||
Independent Bank Corp. | 2,425 | 184,664 | ||||||
Investors Bancorp Inc. | 1,638 | 18,264 | ||||||
Lakeland Financial Corp. | 387 | 18,123 | ||||||
LegacyTexas Financial Group Inc. | 458 | 18,645 | ||||||
Origin Bancorp Inc. | 650 | 21,450 | ||||||
Pinnacle Financial Partners Inc. | 687 | 39,489 | ||||||
Prosperity Bancshares Inc. | 4,175 | 275,759 | ||||||
Renasant Corp. | 5,240 | 188,326 | ||||||
Sandy Spring Bancorp Inc. | 844 | 29,439 | ||||||
Simmons First National Corp., Class A | 932 | 21,678 | ||||||
Stock Yards Bancorp Inc. | 1,990 | 71,938 | ||||||
UMB Financial Corp. | 3,420 | 225,104 | ||||||
United Community Banks Inc. | 1,277 | 36,471 | ||||||
Valley National Bancorp | 860 | 9,271 | ||||||
Washington Trust Bancorp Inc. | 1,700 | 88,706 | ||||||
Westamerica Bancorporation | 2,416 | 148,850 | ||||||
Western Alliance Bancorp (a) | 3,595 | 160,768 | ||||||
Wintrust Financial Corp. | 618 | 45,213 | ||||||
|
| |||||||
| 2,797,442 | ||||||||
|
| |||||||
| Number of Shares | Fair $ | |||||||
Research & Consulting Services - 0.3% |
| |||||||
Resources Connection Inc. | 7,229 | 115,736 | ||||||
|
| |||||||
Residential REITs - 0.1% |
| |||||||
NexPoint Residential Trust Inc. | 428 | 17,719 | ||||||
|
| |||||||
Restaurants - 0.9% |
| |||||||
BJ’s Restaurants Inc. | 553 | 24,299 | ||||||
Bloomin’ Brands Inc. | 448 | 8,472 | ||||||
Brinker International Inc. | 504 | 19,832 | ||||||
Cracker Barrel Old Country Store Inc. | 425 | 72,560 | ||||||
Dave & Buster’s Entertainment Inc. | 359 | 14,529 | ||||||
Ruth’s Hospitality Group Inc. | 1,217 | 27,638 | ||||||
Texas Roadhouse Inc. | 1,615 | 86,677 | ||||||
The Cheesecake Factory Inc. | 1,395 | 60,989 | ||||||
|
| |||||||
| 314,996 | ||||||||
|
| |||||||
Retail REITs - 0.1% |
| |||||||
Retail Opportunity Investments Corp. | 2,050 | 35,116 | ||||||
|
| |||||||
Security & Alarm Services - 1.0% |
| |||||||
The Brink’s Co. | 4,089 | 331,945 | ||||||
|
| |||||||
Semiconductor Equipment - 0.4% |
| |||||||
Advanced Energy Industries Inc. (a) | 319 | 17,950 | ||||||
Ichor Holdings Ltd. (a) | 1,474 | 34,846 | ||||||
Rudolph Technologies Inc. (a) | 2,467 | 68,163 | ||||||
|
| |||||||
| 120,959 | ||||||||
|
| |||||||
Semiconductors - 0.6% |
| |||||||
Diodes Inc. (a) | 567 | 20,622 | ||||||
Semtech Corp. (a) | 3,211 | 154,288 | ||||||
SMART Global Holdings Inc. (a) | 1,327 | 30,508 | ||||||
|
| |||||||
| 205,418 | ||||||||
|
| |||||||
Soft Drinks - 0.2% |
| |||||||
Cott Corp. | 4,974 | 66,403 | ||||||
|
| |||||||
Specialized Consumer Services - 0.0%* |
| |||||||
Weight Watchers International Inc. (a) | 357 | 6,819 | ||||||
|
| |||||||
Specialized REITs - 0.6% |
| |||||||
CoreSite Realty Corp. | 827 | 95,245 | ||||||
National Storage Affiliates Trust | 598 | 17,306 | ||||||
PotlatchDeltic Corp. | 1,213 | 47,283 | ||||||
QTS Realty Trust Inc., Class A | 390 | 18,010 | ||||||
The GEO Group Inc. | 1,176 | 24,708 | ||||||
|
| |||||||
| 202,552 | ||||||||
|
| |||||||
See Notes to Schedule of Investments and Notes to Financial Statements.
| 8 | State Street Small-Cap Equity V.I.S. Fund |
Table of Contents
State Street Small-Cap Equity V.I.S. Fund
Schedule of Investments, continued — June 30, 2019 (Unaudited)
| Number of Shares | Fair $ | |||||||
Specialty Chemicals - 4.5% |
| |||||||
Chase Corp. | 485 | 52,205 | ||||||
Ferro Corp. (a) | 1,399 | 22,104 | ||||||
HB Fuller Co. | 4,116 | 190,983 | ||||||
Ingevity Corp. (a) | 2,218 | 233,267 | ||||||
Innospec Inc. | 1,725 | 157,389 | ||||||
Minerals Technologies Inc. | 461 | 24,668 | ||||||
PolyOne Corp. | 5,023 | 157,672 | ||||||
PQ Group Holdings Inc. (a) | 161 | 2,552 | ||||||
Quaker Chemical Corp. | 632 | 128,220 | ||||||
Sensient Technologies Corp. | 5,130 | 376,953 | ||||||
Stepan Co. | 1,754 | 161,210 | ||||||
|
| |||||||
| 1,507,223 | ||||||||
|
| |||||||
Specialty Stores - 0.5% |
| |||||||
Hudson Ltd., Class A (a) | 977 | 13,473 | ||||||
MarineMax Inc. (a) | 887 | 14,582 | ||||||
Sally Beauty Holdings Inc. (a) | 10,948 | 146,046 | ||||||
|
| |||||||
| 174,101 | ||||||||
|
| |||||||
Steel - 0.3% |
| |||||||
Carpenter Technology Corp. | 679 | 32,579 | ||||||
Commercial Metals Co. | 4,571 | 81,592 | ||||||
|
| |||||||
| 114,171 | ||||||||
|
| |||||||
Systems Software - 0.6% |
| |||||||
Progress Software Corp. | 693 | 30,229 | ||||||
Qualys Inc. (a) | 1,400 | 121,912 | ||||||
Talend S.A. ADR (a)(b) | 1,500 | 57,885 | ||||||
|
| |||||||
| 210,026 | ||||||||
|
| |||||||
Technology Distributors - 0.3% |
| |||||||
Insight Enterprises Inc. (a) | 448 | 26,074 | ||||||
SYNNEX Corp. | 206 | 20,270 | ||||||
Tech Data Corp. (a) | 466 | 48,744 | ||||||
|
| |||||||
| 95,088 | ||||||||
|
| |||||||
Technology Hardware, Storage & Peripherals - 0.6% |
| |||||||
Pure Storage Inc., Class A (a) | 14,300 | 218,361 | ||||||
|
| |||||||
| Number of Shares | Fair $ | |||||||
Thrifts & Mortgage Finance - 0.7% |
| |||||||
Axos Financial Inc. (a) | 876 | 23,871 | ||||||
Essent Group Ltd. (a) | 558 | 26,220 | ||||||
HomeStreet Inc. (a) | 1,040 | 30,826 | ||||||
Kearny Financial Corp. | 646 | 8,585 | ||||||
NMI Holdings Inc., Class A (a) | 1,076 | 30,548 | ||||||
WSFS Financial Corp. | 2,787 | 115,103 | ||||||
|
| |||||||
| 235,153 | ||||||||
|
| |||||||
Tires & Rubber - 0.1% |
| |||||||
Cooper Tire & Rubber Co. | 1,311 | 41,362 | ||||||
|
| |||||||
Trading Companies & Distributors - 0.7% |
| |||||||
Applied Industrial Technologies Inc. | 3,092 | 190,251 | ||||||
BMC Stock Holdings Inc. (a) | 897 | 19,016 | ||||||
GMS Inc. (a) | 571 | 12,562 | ||||||
Herc Holdings Inc. (a) | 667 | 30,569 | ||||||
|
| |||||||
| 252,398 | ||||||||
|
| |||||||
Trucking - 0.6% |
| |||||||
ArcBest Corp. | 448 | 12,593 | ||||||
Avis Budget Group Inc. (a) | 538 | 18,916 | ||||||
Marten Transport Ltd. | 1,200 | 21,780 | ||||||
Old Dominion Freight Line Inc. | 699 | 104,333 | ||||||
Saia Inc. (a) | 440 | 28,455 | ||||||
|
| |||||||
| 186,077 | ||||||||
|
| |||||||
| Total Common Stock (Cost $24,604,800) |
| 31,516,470 | ||||||
|
| |||||||
| Short-Term Investments - 6.1% |
| |||||||
State Street Institutional U.S. Government Money Market Fund - Class G Shares 2.35% (Cost $2,067,502) (b)(c)(d) | 2,067,502 | 2,067,502 | ||||||
|
| |||||||
| Total Investments (Cost $26,672,302) |
| 33,583,972 | ||||||
| Other Assets and Liabilities, net - 0.5% |
| 163,359 | ||||||
|
| |||||||
| NET ASSETS - 100.0% |
| 33,747,331 | ||||||
|
| |||||||
Other Information:
The Fund had the following long futures contracts open at June 30, 2019:
| Description | Expiration date | Number of Contracts | Notional Amount | Value | Unrealized Appreciation | |||||||||||||||
E-mini Russell 2000 Index Futures | September 2019 | 8 | $ | 615,738 | $ | 626,840 | $ | 11,102 | ||||||||||||
|
| |||||||||||||||||||
During the period ended June 30, 2019, average notional value related to long futures contracts was $531,891.
See Notes to Schedule of Investments and Notes to Financial Statements.
| State Street Small-Cap Equity V.I.S. Fund | 9 |
Table of Contents
State Street Small-Cap Equity V.I.S. Fund
Notes to Schedule of Investments — June 30, 2019 (Unaudited)
The views expressed in this document reflect our judgment as of the publication date and are subject to change at any time without notice. The securities cited may not be representative of the Fund’s future investments and should not be construed as a recommendation to purchase or sell a particular security. See the Fund’s summary prospectus and statutory prospectus for complete descriptions of investment objectives, policies, risks and permissible investments.
| (a) | Non-income producing security. |
| (b) | At June 30, 2019, all or a portion of this security was pledged to cover collateral requirements for futures. |
| (c) | Sponsored by SSGA Funds Management, Inc., the Fund’s investment adviser and administrator, and an affiliate of State Street Bank & Trust Co., the Fund’ssub-administrator, custodian and accounting agent. |
| (d) | Coupon amount represents effective yield. |
| † | Percentages are based on net assets as of June 30, 2019. |
| * | Less than 0.05%. |
Abbreviations:
ADR - American Depositary Receipt
REIT - Real Estate Investment Trust
The following table presents the Fund’s investments measured at fair value on a recurring basis at June 30, 2019:
| Investments | Level 1 | Level 2 | Level 3 | Total | ||||||||||||
Investments in Securities | ||||||||||||||||
Common Stock | $ | 31,516,470 | $ | — | $ | — | $ | 31,516,470 | ||||||||
Short-Term Investments | 2,067,502 | — | — | 2,067,502 | ||||||||||||
|
|
|
|
|
|
|
| |||||||||
Total Investments in Securities | $ | 33,583,972 | $ | — | $ | — | $ | 33,583,972 | ||||||||
|
|
|
|
|
|
|
| |||||||||
Other Financial Instruments | ||||||||||||||||
Long Futures Contracts - Unrealized Appreciation | $ | 11,102 | $ | — | $ | — | $ | 11,102 | ||||||||
|
|
|
|
|
|
|
| |||||||||
Affiliate Table
Number Held at | Value At 12/31/18 | Cost of Purchases | Proceeds from Shares Sold | Number of Shares Held at 6/30/19 | Value at 6/30/19 | Dividend Income | ||||||||||||||||||||||
State Street Institutional U.S. Government Money Market Fund - Class G Shares | 1,256,107 | $ | 1,256,107 | $ | 5,713,583 | $ | 4,902,188 | 2,067,502 | $ | 2,067,502 | $ | 21,259 | ||||||||||||||||
See Notes to Schedule of Investments and Notes to Financial Statements.
| 10 | State Street Small-Cap Equity V.I.S. Fund |
Table of Contents
State Street Small-Cap Equity V.I.S. Fund
Financial Highlights
Selected data based on a share outstanding throughout the periods indicated
| 6/30/19† | 12/31/18 | 12/31/17 | 12/31/16 | 12/31/15* | 12/31/14* | |||||||||||||||||||
| Inception date | 4/28/00 | |||||||||||||||||||||||
Net asset value, beginning of period | $ | 11.24 | $ | 14.73 | $ | 14.40 | $ | 12.20 | $ | 14.39 | $ | 16.26 | ||||||||||||
|
| �� |
|
|
|
|
|
|
|
|
|
| ||||||||||||
Income/(loss) from investment operations: |
| |||||||||||||||||||||||
Net investment loss | (0.00 | )††(a) | (0.02 | )(a) | (0.02 | )(a) | (0.03 | ) | (0.04 | ) | (0.06 | ) | ||||||||||||
Net realized and unrealized gains/(losses) on investments | 2.00 | (1.43 | ) | 1.86 | 2.93 | (0.52 | ) | 0.67 | ||||||||||||||||
|
|
|
|
|
|
|
|
|
|
|
| |||||||||||||
Total income/(loss) from investment operations | 2.00 | (1.45 | ) | 1.84 | 2.90 | (0.56 | ) | 0.61 | ||||||||||||||||
|
|
|
|
|
|
|
|
|
|
|
| |||||||||||||
Less distributions from: | ||||||||||||||||||||||||
Net investment income | — | — | — | — | — | — | ||||||||||||||||||
Net realized gains | — | 2.04 | 1.51 | 0.70 | 1.63 | 2.48 | ||||||||||||||||||
|
|
|
|
|
|
|
|
|
|
|
| |||||||||||||
Total distributions | — | 2.04 | 1.51 | 0.70 | 1.63 | 2.48 | ||||||||||||||||||
|
|
|
|
|
|
|
|
|
|
|
| |||||||||||||
Net asset value, end of period | $ | 13.24 | $ | 11.24 | $ | 14.73 | $ | 14.40 | $ | 12.20 | $ | 14.39 | ||||||||||||
|
|
|
|
|
|
|
|
|
|
|
| |||||||||||||
Total Return(b) | 17.79 | % | (9.70 | )% | 12.71 | % | 23.77 | % | (4.12 | )% | 3.77 | % | ||||||||||||
Ratios/Supplemental Data: | ||||||||||||||||||||||||
Net assets, end of period (in thousands) | $ | 33,747 | $ | 30,781 | $ | 40,711 | $ | 42,320 | $ | 38,359 | $ | 43,460 | ||||||||||||
Ratios to average net assets: | ||||||||||||||||||||||||
Net expenses | 1.26 | %** | 1.20 | % | 1.25 | % | 1.40 | % | 1.36 | % | 1.33 | %(c) | ||||||||||||
Gross expenses | 1.26 | %** | 1.20 | % | 1.25 | % | 1.40 | % | 1.36 | % | 1.33 | % | ||||||||||||
Net investment loss | (0.05 | )%** | (0.13 | )% | (0.13 | )% | (0.22 | )% | (0.30 | )% | (0.35 | )% | ||||||||||||
Portfolio turnover rate | 12 | % | 33 | % | 32 | % | 36 | % | 42 | % | 37 | % | ||||||||||||
Notes to Financial Highlights
| (a) | Per share values have been calculated using the average shares method. |
| (b) | Total returns are historical and assume changes in share price, reinvestment of dividends and capital gains distributions and do not include the effect of insurance contract charges. Past performance does not guarantee future results. |
| (c) | Includes contractual management fee waiver related to the Fund’s investments in the GE Institutional Money Market Fund (the “Money Market Fund”). The fee waiver agreement was terminated effective June 30, 2014 with the closure of the Money Market Fund. |
| † | Unaudited. |
| †† | Rounds to less than $0.01. |
| * | Beginning with the year ended December 31, 2016, the Fund was audited by Ernst & Young LLP. The previous years were audited by another independent registered public accounting firm. |
| ** | Annualized for periods less than one year. |
The accompanying Notes are an integral part of these financial statements.
| Financial Highlights | 11 |
Table of Contents
State Street Small-Cap Equity V.I.S. Fund
Statement of Assets and Liabilities — June 30, 2019 (Unaudited)
Assets | ||||
Investments in securities, at fair value (cost $24,604,800) | $ | 31,516,470 | ||
Short-term affiliated investments, at fair value | 2,067,502 | |||
Cash | 978 | |||
Cash collateral on deposit with broker for future contracts | 48,305 | |||
Receivable for investments sold | 257,441 | |||
Income receivables | 25,477 | |||
Income receivable from affiliated investments | 4,237 | |||
Receivable for accumulated variation margin on futures contracts | 11,120 | |||
|
| |||
Total assets | 33,931,530 | |||
|
| |||
Liabilities | ||||
Payable for investments purchased | 77,694 | |||
Payable for fund shares redeemed | 52,173 | |||
Payable to the Adviser | 25,736 | |||
Payable for custody, fund accounting andsub-administration fees | 2,477 | |||
Accrued other expenses | 26,119 | |||
|
| |||
Total liabilities | 184,199 | |||
|
| |||
Net Assets | $ | 33,747,331 | ||
|
| |||
Net Assets Consist of: | ||||
Capital paid in | $ | 25,830,481 | ||
Total distributable earnings (loss) | 7,916,850 | |||
|
| |||
Net Assets | $ | 33,747,331 | ||
|
| |||
Shares outstanding ($0.01 par value; unlimited shares authorized) | 2,548,756 | |||
Net asset value per share | $ | 13.24 | ||
The accompanying Notes are an integral part of these financial statements.
| 12 | Statement of Assets and Liabilities |
Table of Contents
State Street Small-Cap Equity V.I.S. Fund
Statement of Operations — For the period ended June 30, 2019 (Unaudited)
Investment Income | ||||
Income | ||||
Dividend | $ | 181,563 | ||
Income from affiliated investments | 21,259 | |||
Less: Foreign taxes withheld | (829 | ) | ||
|
| |||
Total income | 201,993 | |||
|
| |||
Expenses | ||||
Advisory and administration fees | 158,257 | |||
Directors’ fees | 9,396 | |||
Custody, fund accounting andsub-administration fees | 15,306 | |||
Professional fees | 18,955 | |||
Other expenses | 7,941 | |||
|
| |||
Total Expenses | 209,855 | |||
|
| |||
Net investment loss | $ | (7,862 | ) | |
|
| |||
Net Realized and Unrealized Gain (Loss) on Investments | ||||
Realized gain (loss) on: | ||||
Unaffiliated investments | $ | 1,200,026 | ||
Futures | 48,803 | |||
Increase (decrease) in unrealized appreciation/depreciation on: |
| |||
Unaffiliated investments | 4,126,862 | |||
Futures | 29,284 | |||
|
| |||
Net realized and unrealized gain (loss) on investments | 5,404,975 | |||
|
| |||
Net Increase in Net Assets Resulting from Operations | $ | 5,397,113 | ||
|
| |||
The accompanying Notes are an integral part of these financial statements.
| Statement of Operations | 13 |
Table of Contents
State Street Small-Cap Equity V.I.S. Fund
Statements of Changes in Net Assets
Six Months Ended June 30, 2019• | Year Ended December 31, 2018 | |||||||
Increase (Decrease) in Net Assets | ||||||||
Operations: | ||||||||
Net investment loss | $ | (7,862 | ) | $ | (46,009 | ) | ||
Net realized gain (loss) on investments and futures | 1,248,829 | 4,440,893 | ||||||
Net increase (decrease) in unrealized appreciation/depreciation on investments and futures | 4,156,146 | (7,508,138 | ) | |||||
|
|
|
| |||||
Net increase (decrease) from operations | 5,397,113 | (3,113,254 | ) | |||||
|
|
|
| |||||
Distributions to shareholders: | ||||||||
Total distributions | — | (4,717,857 | ) | |||||
|
|
|
| |||||
Increase (decrease) in assets from operations and distributions | 5,397,113 | (7,831,111 | ) | |||||
|
|
|
| |||||
Share transactions: | ||||||||
Proceeds from sale of shares | 114,475 | 513,653 | ||||||
Value of distributions reinvested | — | 4,717,857 | ||||||
Cost of shares redeemed | (2,545,666 | ) | (7,330,360 | ) | ||||
|
|
|
| |||||
Net increase (decrease) from share transactions | (2,431,191 | ) | (2,098,850 | ) | ||||
|
|
|
| |||||
Total increase (decrease) in net assets | 2,965,922 | (9,929,961 | ) | |||||
Net Assets | ||||||||
Beginning of period | 30,781,409 | 40,711,370 | ||||||
|
|
|
| |||||
End of period | $ | 33,747,331 | $ | 30,781,409 | ||||
|
|
|
| |||||
Changes in Fund Shares | ||||||||
Shares sold | 8,998 | 34,303 | ||||||
Issued for distributions reinvested | — | 425,032 | ||||||
Shares redeemed | (199,732 | ) | (482,858 | ) | ||||
|
|
|
| |||||
Net decrease in fund shares | (190,734 | ) | (23,523 | ) | ||||
|
|
|
| |||||
| • | Unaudited. |
The accompanying Notes are an integral part of these financial statements.
| 14 | Statements of Changes in Net Assets |
Table of Contents
State Street Small-Cap Equity V.I.S. Fund
Notes to Financial Statements — June 30, 2019 (Unaudited)
| 1. | Organization of the Company |
State Street Variable Insurance Series Funds, Inc. (the “Company”) was incorporated under the laws of the Commonwealth of Virginia on May 14, 1984 and is registered under the Investment Company Act of 1940, as amended (the “1940 Act”), as anopen-end management investment company. The Company is currently composed of the following seven investment portfolios (collectively, the “Funds”): State Street U.S. Equity V.I.S. Fund, State Street S&P 500 Index V.I.S. Fund, State Street Premier Growth Equity V.I.S. Fund, State StreetSmall-Cap Equity V.I.S. Fund (the “Fund”), State Street Total Return V.I.S. Fund, State Street Income V.I.S. Fund and State Street Real Estate Securities V.I.S. Fund. Each Fund is a diversified investment company within the meaning of the 1940 Act.
Shares of the Funds of the Company are offered only to insurance company separate accounts that fund certain variable life insurance contracts and variable annuity contracts.
The Company currently offers one share class (Class 1) of the Fund as an investment option for variable life insurance and variable annuity contracts.
Under the Company’s organizational documents, its officers and directors are indemnified against certain liabilities arising out of the performance of their duties to the Company. Additionally, in the normal course of business, the Company enters into contracts with service providers that contain general indemnification clauses. The Company’s maximum exposure under these arrangements is unknown as this would involve future claims that may be made against the Company that have not yet occurred.
| 2. | Summary of Significant Accounting Policies |
The following is a summary of significant accounting policies followed by the Company in the preparation of its financial statements:
The preparation of financial statements in accordance with U.S. generally accepted accounting principles (“U.S. GAAP”) requires management to make estimates and assumptions that affect the reported amounts and disclosures in the financial statements. Actual results could differ from those estimates. The Fund is an investment company under U.S. GAAP and follows the accounting and reporting guidance applicable to investment companies.
Security Valuation The Fund’s investments are valued at fair value each day that the New York Stock Exchange (“NYSE”) is open and, for financial reporting purposes, as of the report date should the reporting period end on a day that the NYSE is not open. Fair value is generally defined as the price a fund would receive to sell an asset or pay to transfer a liability in an orderly transaction between market participants at the measurement date. By its nature, a fair value price is a good faith estimate of the valuation in a current sale and may not reflect an actual market price. The investments of the Fund are valued pursuant to the policy and procedures developed by the Oversight Committee (the “Committee”) and approved by the Company’s Board of Directors (the “Board”). The Committee provides oversight of the valuation of investments for the Fund. The Board has responsibility for overseeing the determination of the fair value of investments.
Valuation techniques used to value the Fund’s investments by major category are as follows:
| • | Equity investments traded on a recognized securities exchange for which market quotations are readily available are valued at the last sale price or official closing price, as applicable, on the primary market or exchange on which they trade. Equity investments traded on a recognized exchange for which there were no sales on that day are valued at the last published sale price or at fair value. |
| • | Investments in registered investment companies (including money market funds) or other unitized pooled investment vehicles that are not traded on an exchange are valued at that day’s published net asset value (“NAV”) per share or unit. |
| • | Exchange-traded futures contracts are valued at the closing settlement price on the primary market on which they are traded most extensively. Exchange-traded futures contracts traded on a recognized exchange for which there were no sales on that day are valued at the last reported sale price obtained from independent pricing services or brokers or at fair value. |
In the event prices or quotations are not readily available or that the application of these valuation methods results in a price for an investment that is deemed to be not representative of the fair value of such investment, fair value will be determined in good faith by the Committee, in accordance with the valuation policy and procedures approved by the Board.
| Notes to Financial Statements | 15 |
Table of Contents
State Street Small-Cap Equity V.I.S. Fund
Notes to Financial Statements, continued — June 30, 2019 (Unaudited)
The Fund values its assets and liabilities at fair value using a fair value hierarchy consisting of three broad levels that prioritize the inputs to valuation techniques giving the highest priority to readily available unadjusted quoted prices in active markets for identical assets or liabilities (Level 1 measurements) and the lowest priority to unobservable inputs (Level 3 measurements) when market prices are not readily available or reliable. The categorization of a value determined for an investment within the hierarchy is based upon the pricing transparency of the investment and is not necessarily an indication of the risk associated with investing in it.
The three levels of the fair value hierarchy are as follows:
| • | Level 1 — Unadjusted quoted prices in active markets for an identical asset or liability; |
| • | Level 2 — Inputs other than quoted prices included within Level 1 that are observable for the asset or liability either directly or indirectly, including quoted prices for similar assets or liabilities in active markets, quoted prices for identical or similar assets or liabilities in markets that are not considered to be active, inputs other than quoted prices that are observable for the asset or liability (such as exchange rates, financing terms, interest rates, yield curves, volatilities, prepayment speeds, loss severities, credit risks and default rates) or other market-corroborated inputs; and |
| • | Level 3 — Unobservable inputs for the asset or liability, including the Committee’s assumptions used in determining the fair value of investments. |
The value of the Fund’s investments according to the fair value hierarchy as of June 30, 2019 is disclosed in the Fund’s Schedule of Investments.
Investment Transactions and Income Recognition Investment transactions are accounted for on trade date for financial reporting purposes. Realized gains and losses from the sale or disposition of investments and foreign exchange transactions, if any, are determined using the identified cost method.
Dividend income and capital gain distributions, if any, are recognized on theex-dividend date, net of any foreign taxes withheld at source, if any.
Interest income is recorded daily on an accrual basis. All premiums and discounts are amortized/accreted for financial reporting purposes.
Non-cash dividends received in the form of stock are recorded as dividend income at fair value.
Expenses Certain expenses, which are directly identifiable to a specific Fund, are applied to the Fund within the Company. Other expenses which cannot be attributed to a specific Fund are allocated in such a manner as deemed equitable, taking into consideration the nature and type of expense and the relative net assets of the Fund within the Company.
Foreign Taxes The Fund may be subject to foreign taxes (a portion of which may be reclaimable) on income, stock dividends, realized and unrealized capital gains on investments or certain foreign currency transactions. Foreign taxes are recorded in accordance with SSGA Funds Management, Inc.’s (the “Adviser” or “SSGA FM”) understanding of the applicable foreign tax regulations and rates that exist in the foreign jurisdictions in which the Fund invests. These foreign taxes, if any, are paid by the Fund and are reflected in the Statement of Operations, if applicable. Foreign taxes payable or deferred as of June 30, 2019, if any, are disclosed in the Fund’s Statement of Assets and Liabilities.
Distributions The Fund declares and pays any dividends from net investment income annually.
Net realized capital gains, if any, are distributed annually, unless additional distributions are required for compliance with applicable tax regulations. The amount and character of income and capital gains to be distributed are determined in accordance with applicable tax regulations which may differ from net investment income and realized gains recognized for U.S. GAAP purposes.
| 3. | Derivative Financial Instruments |
Futures Contracts The Fund may enter into futures contracts to meet the Fund’s objectives. A futures contract is a standardized, exchange-traded agreement to buy or sell a financial instrument at a set price on a future date. Upon entering into a futures contract, the Fund is required to deposit with the broker, cash or securities in an amount equal to the minimum
| 16 | Notes to Financial Statements |
Table of Contents
State Street Small-Cap Equity V.I.S. Fund
Notes to Financial Statements, continued — June 30, 2019 (Unaudited)
initial margin requirements of the clearing house. Subsequent payments are made or received by the Fund equal to the daily change in the contract value and are recorded as variation margin receivable or payable with a corresponding offset to unrealized gains or losses. The Fund recognizes a realized gain or loss when the contract is closed.
Losses may arise if the value of a futures contract decreases due to unfavorable changes in the market rates or values of the underlying instrument during the term of the contract or if the counterparty does not perform under the contract. The use of futures contracts also involves the risk that the movements in the price of the futures contracts do not correlate with the movement of the assets underlying such contracts.
For the period ended June 30, 2019, the Fund entered into futures contracts for cash equitization.
The following tables summarize the value of the Fund’s derivative instruments as of June 30, 2019 and the related location in the accompanying Statement of Assets and Liabilities and Statement of Operations, presented by primary underlying risk exposure:
Asset Derivatives
| Interest Rate Contracts Risk | Foreign Exchange Contracts Risk | Credit Contracts Risk | Equity Contracts Risk | Commodity Contracts Risk | Total | |||||||||||||||||||
State StreetSmall-Cap Equity V.I.S. Fund |
| |||||||||||||||||||||||
Futures Contracts | $ | — | $ | — | $ | — | $ | 11,120 | $ | — | $ | 11,120 | ||||||||||||
Realized Gain/Loss
| Interest Rate Contracts Risk | Foreign Exchange Contracts Risk | Credit Contracts Risk | Equity Contracts Risk | Commodity Contracts Risk | Total | |||||||||||||||||||
State StreetSmall-Cap Equity V.I.S. Fund |
| |||||||||||||||||||||||
Futures Contracts | $ | — | $ | — | $ | — | $ | 48,803 | $ | — | $ | 48,803 | ||||||||||||
Net Change in Unrealized Appreciation (Depreciation)
| Interest Rate Contracts Risk | Foreign Exchange Contracts Risk | Credit Contracts Risk | Equity Contracts Risk | Commodity Contracts Risk | Total | |||||||||||||||||||
State StreetSmall-Cap Equity V.I.S. Fund |
| |||||||||||||||||||||||
Futures Contracts | $ | — | $ | — | $ | — | $ | 29,284 | $ | — | $ | 29,284 | ||||||||||||
| 4. | Fees and Transactions with Affiliates |
Advisory Fee SSGA FM, a registered investment adviser, was retained by the Board to act as investment adviser and administrator of the Fund. SSGA FM’s compensation for investment advisory and administrative services (“Management Fee”) is paid monthly based on the average daily net assets of the Fund at an annualized rate of 0.95%.
Custody, Fund Accounting and Sub-Administration Fees State Street Bank and Trust Company (“State Street”) serves as the custodian, fund accountant andsub-administrator to the Fund. Amounts paid by the Fund to State Street for performing such services are included as custody, fund accounting andsub-administration fees in the Statement of Operations.
Other Transactions with Affiliates The Fund may invest in affiliated entities, including securities issued by State Street Corporation, affiliated funds, or entities deemed to be affiliates as a result of the Fund owning more than five percent of the entity’s voting securities or outstanding shares. Amounts relating to these transactions during the period ended June 30, 2019 are disclosed in the Schedule of Investments.
| Notes to Financial Statements | 17 |
Table of Contents
State Street Small-Cap Equity V.I.S. Fund
Notes to Financial Statements, continued — June 30, 2019 (Unaudited)
| 5. | Sub-Advisory Fees |
Pursuant to investmentsub-advisory agreements with SSGA FM, the assets of the Fund are allocated to and managed by each of the followingsub-advisers: (i) Palisade Capital Management, L.L.C.; (ii) Champlain Investment Partners, LLC; (iii) GlobeFlex Capital, L.P.; (iv) Kennedy Capital Management, Inc.; and (v) SouthernSun Asset Management, LLC. SSGA FM is responsible for allocating the Fund’s assets among thesub-advisers in its discretion (“Allocated Assets”), and for managing the Fund’s cash position, while eachsub-adviser is responsible for theday-to-day management of their portion of the Allocated Assets, under the general supervision and oversight of SSGA FM and the Board. For their services, SSGA FM pays eachsub-adviser an investmentsub-advisory fee, which is calculated as a percentage of the average daily net assets of the respective Allocated Assets that it manages.
| 6. | Directors’ Fees |
The fees and expenses of the Company’s directors who are not “interested persons” of the Company, as defined in the 1940 Act (“Independent Directors”), are paid directly by the Fund. The Independent Directors are reimbursed for travel and otherout-of-pocket expenses in connection with meeting attendance and industry seminars.
| 7. | Investment Transactions |
Purchases and sales of investments (excludingin-kind transactions, short term investments and derivative contracts) for the period ended June 30, 2019 were as follows:
| Non-U.S. Government Securities | ||||||||
| Purchases | Sales | |||||||
| $ | 3,764,031 | $ | 7,131,619 | |||||
| 8. | Income Taxes |
The Fund has qualified and intends to continue to qualify as a regulated investment company under Subchapter M of the Internal Revenue Code of 1986, as amended. The Fund will not be subject to federal income taxes to the extent it distributes its taxable income, including any net realized capital gains, for each fiscal year. Therefore, no provision for federal income tax is required.
The Fund files federal and various state and local tax returns as required. No income tax returns are currently under examination. Generally, the federal returns are subject to examination by the Internal Revenue Service for a period of three years from date of filing, while the state returns may remain open for an additional year depending upon jurisdiction. SSGA FM has analyzed the Fund’s tax positions taken on tax returns for all open years and does not believe there are any uncertain tax positions that would require recognition of a tax liability.
Distributions to shareholders are recorded onex-dividend date. Income dividends and gain distributions are determined in accordance with income tax rules and regulations, which may differ from generally accepted accounting principles.
As of June 30, 2019, gross unrealized appreciation and gross unrealized depreciation of investments and other financial instruments based on cost for federal income tax purposes were as follows:
| Tax Cost | Gross Unrealized Appreciation | Gross Unrealized Depreciation | Net Unrealized Appreciation (Depreciation) | |||||||||||||||
| $ | 28,397,173 | $ | 8,449,939 | $ | 3,252,038 | $ | 5,197,901 | |||||||||||
| 9. | Line of Credit |
The Fund and other affiliated funds (each, a “Participant” and collectively, the “Participants”) participate in a $500 million revolving credit facility provided by a syndication of banks under which the Participants may borrow to fund shareholder redemptions. This agreement expires in October 2019 unless otherwise extended or renewed.
| 18 | Notes to Financial Statements |
Table of Contents
State Street Small-Cap Equity V.I.S. Fund
Notes to Financial Statements, continued — June 30, 2019 (Unaudited)
The Participants are charged an annual commitment fee which is calculated based on the unused portion of the shared credit line. Commitment fees are allocated among each of the Participants based on relative net assets. Commitment fees are ordinary fund operating expenses. A Participant incurs and pays the interest expense related to its borrowing. Interest is calculated at a rate per annum equal to the sum of 1% plus the greater of the New York Fed Bank Rate and1-month LIBOR rate.
The Fund had no outstanding loans as of June 30, 2019.
| 10. | Risks |
Concentration Risk As a result of the Fund’s ability to invest a large percentage of its assets in obligations of issuers within the same country, state, region, currency or economic sector, an adverse economic, business or political development may affect the value of the Fund’s investments more than if the Fund were more broadly diversified.
Market and Credit Risk In the normal course of business, the Fund trades financial instruments and enters into financial transactions where risk of potential loss exists due to changes in the general economic conditions and fluctuations of the market (market risk). Additionally, the Fund may also be exposed to credit risk in the event that an issuer or guarantor fails to perform or that an institution or entity with which the Fund has unsettled or open transactions defaults.
| 11. | Subsequent Events |
Management has evaluated the impact of all subsequent events on the Fund through the date on which the financial statements were available to be issued and has determined that there were no subsequent events requiring adjustment or disclosure in the financial statements.
| Notes to Financial Statements | 19 |
Table of Contents
State Street Small-Cap Equity V.I.S. Fund
Other Information — June 30, 2019 (Unaudited)
Proxy Voting Policies and Procedures and Record
The Fund has adopted the proxy voting policies of SSGA FM. A description of the policies and procedures that the Fund has adopted to determine how to vote proxies relating to portfolio securities is available (i) without charge, upon request, by calling1-800-242-0134, (ii) on the Fund’s website at http://www.ssga.com/geam, or (iii) on the SEC’s website at www.sec.gov. Information regarding how the Fund voted proxies, if any, during the most recent 12-month period ended June 30 is available by August 31 of each year without charge (1) by calling 1-800-242-0134 (toll free), and (2) on the website of the SEC at www.sec.gov.
Quarterly Portfolio Schedule
Following the Fund’s first and third fiscal quarter-ends, a complete schedule of investments is filed with the SEC as an exhibit to its reports on Form N-PORT, which can be found on the SEC’s website at www.sec.gov. The Fund’s schedule of investments are available upon request, without charge, by calling 1-800-242-0134 and on the Fund’s website at http://www.ssga.com/geam.
| 20 | Other Information |
Table of Contents
State StreetSmall-Cap Equity V.I.S. Fund
Other Information — June 30, 2019 (Unaudited), continued
Director Considerations in Approving Continuation of Investment Advisory andSub-Advisory Agreements1
Overview of the Contract Review Process
Under the Investment Company Act of 1940, as amended (the “1940 Act”), an investment advisory agreement between a mutual fund and its investment adviser may continue in effect from year to year only if its continuance is approved at least annually by the fund’s board of directors or its shareholders, and by a vote of a majority of those directors who are not “interested persons” of the fund (commonly referred to as, the “Independent Directors”) cast in person at a meeting called for the purpose of considering such approval.
Consistent with these requirements, the Board of Directors (the “Board”) of the State Street Variable Insurance Series Funds, Inc. (the “Company”) met in person on April 10, 2019 and May 15, 2019, including in executive sessions attended by the Independent Directors, to consider a proposal to approve, with respect to State StreetSmall-Cap Equity V.I.S. Fund (the “Fund”), the continuation of the investment advisory agreement (the “Advisory Agreement”) with SSGA Funds Management, Inc. (“SSGA FM” or the “Adviser”), and thesub-advisory agreements (each, a“Sub-Advisory Agreement” and, together with the Advisory Agreement, the “Agreements”) by and among SSGA FM, and the Company on behalf of the Fund, and each of Champlain Investment Partners, LLC, GlobeFlex Capital, L.P., Kennedy Capital Management, Inc., Palisade Capital Management, LLC and SouthernSun Asset Management, LLC (collectively, the“Sub-Advisers”). Prior to voting on the proposal, the Independent Directors, as well as the Directors who are “interested persons” of the Adviser, reviewed information furnished by the Adviser andSub-Advisers and others reasonably necessary to permit the Board to evaluate the proposal fully. The Independent Directors were separately represented by counsel who are independent of the Adviser andSub-Advisers in connection with their consideration of approval of the Agreements. Following the April 10, 2019 meeting, the Independent Directors submitted questions and requests for additional information to management, and considered management’s responses thereto prior to and at the May 15, 2019 meeting. The Independent Directors considered, among other things, the following:
Information about Performance, Expenses and Fees
| • | A report prepared by an independent third-party provider of investment company data, which includes for the Fund: |
| ¡ | Comparisons of the Fund’s performance over the pastone-, three-, five- andten-year periods ended December 31, 2018, to the performance of an appropriate benchmark constructed by Broadridge Financial Solutions, Inc. (“Broadridge”) for the Fund (the “Lipper Index”) and a universe of other mutual funds with similar investment objectives and policies (the “Performance Group” and/or the “Performance Universe”); |
| ¡ | Comparisons of the Fund’s expense ratio (with detail of component expenses) to the expense ratios of a group of comparable mutual funds selected by the independent third-party data provider (the “Expense Group” and/or “Expense Universe”); |
| ¡ | A chart showing the Fund’s historical average net assets relative to its total expenses, management fees, andnon-management expenses over the past five calendar years; and |
| 1 | The Independent Directors have identified numerous relevant issues, factors and concerns (“issues, factors and concerns”) that they consider each year in connection with the proposed continuation of the advisory andsub-advisory agreements, the administration agreement, the distribution plans, the distribution agreement and various related-party service agreements (the “annual review process”). The statement of issues, factors and concerns and the related conclusions of the Independent Directors may not change substantially from year to year. However, the information requested by, and provided to, the Independent Directors with respect to the issues, factors and concerns and on which their conclusions are based is updated annually and, in some cases, may differ substantially from the previous year. The Independent Directors schedule annually a separatein-person meeting that is dedicated to the annual review process (the “special meeting”). At the special meeting and throughout the annual review process, the Independent Directors take a fresh look at each of the issues, factors and concerns in light of the latest available information and each year present one or more sets of comments and questions to management with respect to specific issues, factors and concerns. Management responds to such comments and questions to the satisfaction of the Independent Directors before the annual review process is completed and prior to the Independent Directors voting on proposals to approve continuation of the agreements and plans. |
| Other Information | 21 |
Table of Contents
State StreetSmall-Cap Equity V.I.S. Fund
Other Information — June 30, 2019 (Unaudited), continued
| ¡ | Comparisons of the Fund’s contractual management fee to the contractual management fees of comparable mutual funds at different asset levels. |
| • | Comparative information concerning fees charged by the Adviser andSub-Advisers for managing institutional accounts using investment strategies and techniques similar to those used in managing the Fund; and |
| • | Profitability analyses for (a) the Adviser andSub-Advisers with respect to the Fund and (b) affiliates of SSGA FM that provide services to the Fund (“Affiliated Service Providers”). |
Information about Portfolio Management
| • | Descriptions of the investment management services provided by the Adviser andSub-Advisers, including their investment strategies and processes; |
| • | Information concerning the allocation of brokerage; and |
| • | Information regarding the procedures and processes used to value the assets of the Fund. |
Information about the Adviser andSub-Advisers
| • | Reports detailing the financial results and condition of SSGA FM and its affiliates, as well as of theSub-Advisers; |
| • | Descriptions of the qualifications, education and experience of the individual investment and other professionals responsible for managing the portfolio of the Fund and for Fund operations; |
| • | Information relating to compliance with and the administration of the Codes of Ethics adopted by the Adviser andSub-Advisers; |
| • | Information about the Adviser’s and eachSub-Adviser’s proxy voting policies and procedures and information regarding the Adviser’s and eachSub-Adviser’s practices for overseeing proxy vendors; |
| • | Information concerning the resources devoted by the Adviser andSub-Advisers to overseeing compliance by the Fund and its service providers, including information concerning compliance with investment policies and restrictions and other operating policies of the Fund; |
| • | A description of the adequacy and sophistication of the Adviser’s andSub-Advisers’ technology and systems with respect to investment and administrative matters and a description of any material improvements or changes in technology or systems in the past year; |
| • | A description of the business continuity and disaster recovery plans of the Adviser andSub-Advisers; and |
| • | Information regarding the Adviser’s andSub-Advisers’ risk management processes. |
Other Relevant Information
| • | Information concerning the nature, extent, quality and cost of services provided to the Fund by SSGA FM in its capacity as the Fund’s administrator (the “Administrator”); |
| • | Information concerning the nature, extent, quality and cost of variousnon-investment management services provided to the Fund by affiliates of the Adviser, including the custodian,sub-administrator and fund accountant of the Fund, and the role of the Adviser in managing the Fund’s relationship with these service providers; |
| • | Copies of the Advisory Agreement andSub-Advisory Agreements and agreements with other service providers of the Fund; |
| • | Draft responses to a letter from independent legal counsel to the Independent Directors (“Independent Counsel”), reviewed prior to such date by Independent Counsel, requesting specific information from each of: |
| ¡ | SSGA FM, in its capacity as the Fund’s Adviser and Administrator, with respect to its operations relating to the Fund and its approximate profit margins from such operations for the calendar year ended December 31, 2018; and the relevant operations of other affiliated service providers to the Fund, together with their approximate profit margins from such relevant operations for the calendar year ended December 31, 2018; |
| 22 | Other Information |
Table of Contents
State StreetSmall-Cap Equity V.I.S. Fund
Other Information — June 30, 2019 (Unaudited), continued
| ¡ | TheSub-Advisers, with respect to their operations relating to the Fund and their approximate profitability from such operations for the calendar year ended December 31, 2018; |
| ¡ | State Street Bank and Trust Company (“State Street”), thesub-administrator, custodian, and fund accountant for the Fund, with respect to its operations relating to the Fund; and |
| ¡ | State Street Global Advisors Funds Distributors, LLC, the principal underwriter and distributor of the shares of the Fund (the “Distributor”), with respect to its operations relating to the Fund, together with the Fund’s related distribution plans and arrangements under Rule12b-1 of the 1940 Act; |
| • | Information from SSGA FM, State Street, the Distributor and theSub-Advisers with respect to the Fund providing any material changes to the previous information supplied in response to the letter from Independent Counsel prior to the executive session of the Board on May 15, 2019; |
| • | Materials provided by Broadridge, circulated to the Independent Directors and to Independent Counsel; and |
| • | A summary of the foregoing materials prepared by Independent Counsel. |
In addition to the information identified above, the Board considered information provided from time to time by the Adviser andSub-Advisers, and other service providers of the Fund throughout the year at meetings of the Board and its committees. At such meetings, the Directors received, among other things, presentations by the portfolio managers and other investment professionals of the Adviser andSub-Advisers relating to the performance of the Fund and the investment strategies used in pursuing the Fund’s investment objective.
The Independent Directors were assisted throughout the contract review process by their Independent Counsel. The Independent Directors relied upon the advice of such counsel and their own business judgment in determining the material factors to be considered in evaluating the Agreements, and the weight to be given to each such factor. The conclusions reached with respect to the Agreements were based on a comprehensive evaluation of all the information provided and not any single factor. Moreover, each Director may have placed varying emphasis on particular factors in reaching conclusions with respect to the Fund.
Results of the Process
Based on a consideration of the foregoing and such other information as deemed relevant, including the factors and conclusions described below, on May 15, 2019 the Board, including a majority of the Independent Directors, voted to approve the continuation of the Agreement effective June 1, 2019, for an additional year with respect to the Fund.
Nature, Extent and Quality of Services
In considering whether to approve the Agreements, the Board evaluated the nature, extent and quality of services provided to the Fund by the Adviser andSub-Advisers.
The Board considered the Adviser’s management capabilities and investment process with respect to the types of investments held by the Fund, including the education, experience and number of investment professionals and other personnel who provide portfolio management, investment research, and similar services to the Fund. The Board evaluated the abilities and experience of such investment personnel in analyzing particular markets, industries and specific issuers of securities in these markets and industries. The Board also considered the substantial expertise of the Adviser in developing and applying proprietary quantitative models for managing the Fund. The Board considered the Adviser’s process used for overseeingsub-advisers. The Board considered the extensive experience and resources committed by the Adviser to risk management, including with respect to investment risk, liquidity risk, operational risk, counterparty risk and model risk. The Directors also considered the significant risks assumed by the Adviser in connection with the services provided to the Fund, including reputational and entrepreneurial risks. The Board also took into account the compensation paid to recruit and retain investment personnel, and the time and attention devoted to the Fund by senior management.
The Board had previously reviewed the compliance programs of SSGA FM and various affiliated service providers. Among other things, the Board considered compliance and reporting matters relating to personal trading by investment personnel, selective disclosure of portfolio holdings, late trading, frequent trading, portfolio valuation, business continuity, the allocation of investment opportunities and the voting of proxies.
| Other Information | 23 |
Table of Contents
State StreetSmall-Cap Equity V.I.S. Fund
Other Information — June 30, 2019 (Unaudited), continued
In connection with their consideration of the services provided by each of theSub-Advisers, the Board considered eachSub-Adviser’s attributes relating to its investment philosophy oriented toward long-term performance, its process for selecting investments, its experienced professionals, access to significant technological resources and a favorable history and reputation. The Board also considered the review process undertaken by SSGA FM and SSGA FM’s favorable assessment of the nature and quality of the investmentsub-advisory services provided by eachSub-Adviser to the Fund. The Board also considered the Fund’s multi-manager structure and how eachSub-Adviser’s approach tosmall-cap investing fits within the Fund’s overall strategy.
On the basis of the foregoing and other relevant information, the Board concluded that the Adviser and eachSub-Adviser can be expected to continue to provide high quality investment management and related services for the Fund.
Fund Performance
The Board compared the Fund’s investment performance to the performance of an appropriate benchmark and universe of comparable mutual funds for various time periods ended December 31, 2018. For purposes of these comparisons the Independent Directors relied extensively on the Performance Group, Performance Universe and Lipper Index and the analyses of the related data provided by Broadridge. Among other information, the Board considered the following performance information in its evaluation of the Fund:
State StreetSmall-Cap Equity V.I.S. Fund. The Board considered that the Fund’s performance was above the median of its Performance Group for the1-,3- and10-year periods and the median of the Performance Universe for the1-,3-,5- and10-year periods and above its Lipper Index for the1-,3-,5- and10-year periods. The Board also considered that the Fund’s performance was equal to the median of the Performance Group for the5-year period. The Board took into account management’s discussion of the Fund’s performance.
On the basis of the foregoing and other relevant information, the Board concluded that the performance of the Fund is satisfactory.
Management Fees and Expenses
The Board reviewed the contractual investment advisory fee rates payable by the Fund and actual fees paid by the Fund, as well as the fees paid to each of theSub-Advisers by the Adviser, which reduced the net management fees retained by the Adviser. The Board also reviewed (i) the allocation of the total advisory fees between SSGA FM and eachSub-Adviser, and (ii) the services required of SSGA FM to oversee theSub-Advisers for those services. As part of its review, the Board considered the Fund’s management fee and total expense ratio, including the portion attributable to administrative services provided by SSGA FM (both before and after giving effect to any expense caps), as compared to its Expense Group and Expense Universe, as constructed by Broadridge, and the related Broadridge analysis for the Fund. The Board also considered the comparability of the fees charged and the services provided to the Fund by the Adviser andSub-Advisers to the fees charged and services provided to other clients of the Adviser andSub-Advisers, including institutional accounts, as applicable. The Board also considered that thesub-advisory fees are paid by the Adviser out of its advisory fees it receives from the Fund and are not paid by the Fund. Among other information, the Board considered the following expense information in its evaluation of the Fund:
State StreetSmall-Cap Equity V.I.S. Fund. The Board considered that the Fund’s actual management fee was above the medians of its Expense Group and Expense Universe. The Board also considered that the Fund’s total expenses were above the medians of its Expense Group and Expense Universe. The Board considered management’s discussion of the Fund’s expenses.
On the basis of the foregoing and other relevant information, and in light of the nature, extent and quality of the services provided by the Adviser andSub-Advisers, the Board concluded that the fees and the expense ratio of the Fund compare favorably to the fees and expenses of the Expense Group and Expense Universe and are reasonable in relation to the services provided.
Profitability
The Board reviewed the level of profits realized by the Adviser and its affiliates and theSub-Advisers in providing investment advisory and other services to the Fund and to all funds within the fund complex. The Board considered other direct and indirect benefits received by SSGA FM and Affiliated Service Providers and theSub-Advisers in connection with their relationships with the Fund, including soft dollar commission benefits generated through Fund portfolio transactions. The Board further considered the profitability of each of the Affiliated Service Providers with respect to their services to the Fund and/or fund complex. The
| 24 | Other Information |
Table of Contents
State StreetSmall-Cap Equity V.I.S. Fund
Other Information — June 30, 2019 (Unaudited), continued
Board also considered the various risks borne by SSGA FM and State Street in connection with their various roles in servicing the Fund, including reputational and entrepreneurial risks.
The Board concluded that the profitability of the Adviser and theSub-Advisers with respect to the Fund, and the profitability range of each of the Affiliated Service Providers with respect to its services to the Fund, were reasonable in relation to the services provided.
Economies of Scale
In reviewing management fees and profitability, the Board also considered the extent to which the Adviser and its affiliates, on the one hand, and the Fund and the fund complex, on the other hand, can expect to realize benefits from economies of scale as the assets of the Fund and fund complex increase. The Board acknowledged the difficulty in accurately measuring the benefits resulting from the economies of scale with respect to the management of the Fund or the fund complex taken as a whole. The Board concluded that, in light of the current size of the Fund and the fund complex, the level of profitability of the Adviser and its affiliates with respect to the Fund and the fund complex over various time periods, and the comparative management fee and expense ratio of the Fund during these periods, it does not appear that the Adviser or its affiliates has realized benefits from economies of scale in managing the assets of the Fund to such an extent that previously agreed advisory fees should be reduced or that breakpoints in such fees should be implemented for the Fund at this time. The Board noted that the fees under theSub-Advisory Agreements are paid by the Adviser out of the advisory fees that the Adviser receives under the Advisory Agreements. Therefore, the Board concluded that the potential for economies of scale in theSub-Advisers’ management of the Fund is not a material factor to the approval of theSub-Advisory Agreements.
Conclusions
In reaching its decision to approve the Agreements, the Board did not identify any single factor as being controlling, but based its recommendation on each of the factors it considered. Each Director may have contributed different weight to the various factors. Based upon the materials reviewed, the representations made and the considerations described above, and as part of its deliberations, the Board, including the Independent Directors, concluded that the Adviser andSub-Advisers possess the capability and resources to perform the duties required of them under the respective Agreements.
Further, based upon its review of the Agreements, the materials provided, and the considerations described above, the Board, including the Independent Directors, concluded that (1) the terms of the Advisory Agreement andSub-Advisory Agreements are reasonable, fair, and in the best interests of the Fund and its shareholders, and (2) the rates payable under the Advisory Agreement andSub-Advisory Agreements are fair and reasonable in light of the usual and customary charges made for services of the same nature and quality.
| Other Information | 25 |
Table of Contents
Directors
Michael F. Holland, Co-Chairperson
Patrick J. Riley, Co-Chairperson
John R. Costantino
Donna M. Rapaccioli
Michael A. Jessee
Richard D. Shirk
Rina K. Spence
Jeanne M. La Porta
Ellen M. Needham
Officers
Jeanne M. La Porta, President
Brian Harris, Chief Compliance Officer, Anti-Money Laundering Officer and Code of Ethics Compliance Officer
Sean O’Malley, Chief Legal Officer
Bruce S. Rosenberg, Treasurer
Ann M. Carpenter, Vice President and Deputy Treasurer
Chad C. Hallett, Deputy Treasurer
Arthur A. Jensen, Deputy Treasurer
Darlene Anderson-Vasquez, Deputy Treasurer
Sujata Upreti, Assistant Treasurer
Daniel Foley, Assistant Treasurer
Andrew DeLorme, Secretary
James Goundrey, Assistant Secretary
Kevin Morris, Assistant Secretary
David Urman, Assistant Secretary
Investment Adviser and Administrator
SSGA Funds Management, Inc.
One Iron Street
Boston, MA 02210
Custodian and Sub-Administrator
State Street Bank and Trust Company
One Lincoln Street
Boston, Massachusetts 02111
Distributor
State Street Global Advisors Funds Distributors, LLC
One Iron Street
Boston, MA 02210
Independent Registered Public Accounting Firm
Ernst & Young LLP
200 Clarendon Street
Boston, Massachusetts 02116
Table of Contents
Semi-Annual Report
June 30, 2019
State Street U.S. Equity V.I.S. Fund
Beginning on January 1, 2021, as permitted by regulations adopted by the U.S. Securities and Exchange Commission, paper copies of a Fund’s annual and semi-annual shareholder reports will no longer be sent by mail, unless you specifically request paper copies of the reports. Instead, the reports will be made available on a Fund’s website (www.ssga.com/geam), and you will be notified by mail each time a report is posted, and provided with a website link to access the report. If you already elected to receive shareholder reports electronically, you will not be affected by this change and you need not take any action.
You may elect to receive all future reports in paper free of charge. To do so, contact your Insurance Provider. Your election to receive reports in paper will apply to all funds held in your account.

Table of Contents
State Street U.S. Equity V.I.S Fund
Semi-Annual Report
June 30, 2019 (Unaudited)
| Page | ||||
| Fund Information | 1 | |||
| Understanding Your Fund’s Expenses | 2 | |||
| Schedule of Investments | 3 | |||
| Financial Statements | ||||
| 8 | ||||
| 9 | ||||
| 10 | ||||
| 11 | ||||
| Notes to Financial Statements | 12 | |||
| Other Information | 17 | |||
This report is prepared for Policyholders of certain variable contracts and may be distributed to others only if preceded or accompanied by the variable contract’s current prospectus and the current summary prospectus of the Fund available for investments thereunder.
Table of Contents
State Street U.S. Equity V.I.S. Fund
Fund Information — June 30, 2019 (Unaudited)
Total return performance shown in this report for the Fund takes into account changes in share price and assumes reinvestment of dividends and capital gains distributions, if any. Total returns shown are net of Fund fees and expenses but do not reflect fees and charges associated with the variable contracts such as administrative fees, account charges and surrender charges, which, if reflected, would reduce the Fund’s total returns for all periods shown.
The performance data quoted represents past performance; past performance does not guarantee future results. Investment return and principal value will fluctuate so your shares, when redeemed, may be worth more or less than their original cost. Current performance may be higher or lower than the performance data quoted. Periods less than one year are not annualized. Please call toll-free (800) 242-0134 or visit the Fund’s website at http://www.ssga.com/geam for the most recentmonth-end performance data.
An investment in the Fund is not a deposit of any bank and is not insured or guaranteed by the Federal Deposit Insurance Corporation (“FDIC”) or any other government agency. An investment in the Fund is subject to risk, including possible loss of principal invested.
Sector Allocation
Portfolio Composition as a % of Fair Value of $26,129 (in thousands) as of June 30, 2019(a)(b)
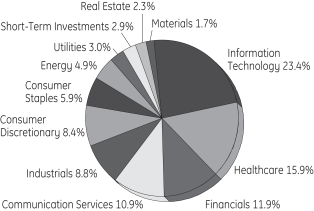
Top Ten Largest Holdings
as of June 30, 2019 (as a % of Fair Value)(a)(b)
Microsoft Corp. | 5.00 | % | ||
Amazon.com Inc. | 3.70 | % | ||
Visa Inc., Class A | 3.35 | % | ||
JPMorgan Chase & Co. | 2.92 | % | ||
Apple Inc. | 2.64 | % | ||
Alphabet Inc., Class A | 2.35 | % | ||
Merck & Company Inc. | 2.29 | % | ||
UnitedHealth Group Inc. | 2.10 | % | ||
Allergan PLC | 2.04 | % | ||
Applied Materials Inc. | 2.03 | % | ||
| (a) | Fair Value basis is inclusive of short-term investment in State Street Institutional U.S. Government Money Market Fund Class G Shares. |
| (b) | The securities information regarding holdings, allocations and other characteristics is presented to illustrate examples of securities that the Fund has bought and the diversity of areas in which the Fund may invest as of a particular date. It may not be representative of the Fund’s current or future investments and should not be construed as a recommendation to purchase or sell a particular security. |
State Street Global Advisors Funds Distributors, LLC, member of FINRA & SIPC is the principal underwriter and distributor of the State Street V.I.S. Funds and an indirect wholly-owned subsidiary of State Street Corporation. References to State Street may include State Street Corporation and its affiliates. The Funds pay State Street Bank and Trust Company for its services as custodian and Fund Accounting agent, and pay SSGA Funds Management, Inc. for investment advisory and administrative services.
| State Street U.S. Equity V.I.S. Fund | 1 |
Table of Contents
State Street U.S. Equity V.I.S. Fund
Understanding Your Fund’s Expenses — June 30, 2019 (Unaudited)
As a shareholder of the Fund, you incur ongoing costs. Ongoing costs include portfolio management fees, professional fees, administrative fees and other Fund expenses. The following example is intended to help you understand your ongoing costs (in dollars) of investing in the Fund and to compare these costs with the ongoing costs of investing in other mutual funds.
To illustrate these ongoing costs, we have provided an example and calculated the expenses paid by investors in the Fund during the period. The information in the following table is based on an investment of $1,000, which is invested at the beginning of the period and held for the entiresix-month period ended June 30, 2019.
Actual Expenses
The first section of the table provides information about actual account values and actual expenses. You may use the information in this section, together with the amount you invested, to estimate the expenses that you paid over the period. To do so, simply divide your account value by $1,000 (for example, an $8,600 account value divided by $1,000 = 8.6), then multiply the result by the number given under the heading “Expenses paid during the period” to estimate the expenses you paid on your account during the period.
Hypothetical Example for Comparison Purposes
The second section of the table provides information about hypothetical account values and hypothetical expenses based on the Fund’s actual expense ratio and an assumed rate of return of 5% per year before expenses, which is not the Fund’s actual return. The hypothetical account values and expenses may not be used to estimate the actual ending account balance or expenses you paid for the period. You may use this information to compare the ongoing costs of investing in the Fund and other funds. To do so, compare this 5% hypothetical example with the 5% hypothetical examples that appear in the shareholder reports of other funds.
Please note that the expenses shown in the table are meant to highlight and help you compare ongoing costs only and do not reflect transaction costs, such as sales charges or redemption fees, if any. Therefore, the second section of the table is useful in comparing ongoing costs only, and will not help you determine the relative total costs of owning different funds. Additionally, the expenses shown do not reflect the fees or charges associated with variable contracts through which shares of the Fund are offered.
| Actual Fund Return | Hypothetical 5% Return (2.5% for the period) | |||||||
Account value at the beginning of the period January 1, 2019 | $ | 1,000.00 | $ | 1,000.00 | ||||
Account value at the end of the period June 30, 2019 | $ | 1,195.40 | $ | 1,020.38 | ||||
Expenses paid during the period | $ | 4.84 | $ | 4.46 | ||||
| * | Expenses are equal to the Fund’s annualized expense ratio of 0.89% (for the period January 1, 2019-June 30, 2019), multiplied by the average account value over the period, multiplied by 181/365 (to reflect theone-half year period). |
| 2 | State Street U.S. Equity V.I.S. Fund |
Table of Contents
State Street U.S. Equity V.I.S. Fund
Schedule of Investments — June 30, 2019 (Unaudited)
| Number of Shares | Fair $ | |||||||
| Common Stock - 97.0%† |
| |||||||
Aerospace & Defense - 1.1% |
| |||||||
Hexcel Corp. | 984 | 79,586 | ||||||
Raytheon Co. | 687 | 119,455 | ||||||
The Boeing Co. | 268 | 97,555 | ||||||
|
| |||||||
| 296,596 | ||||||||
|
| |||||||
Air Freight & Logistics - 0.4% |
| |||||||
FedEx Corp. | 187 | 30,703 | ||||||
United Parcel Service Inc., Class B | 658 | 67,952 | ||||||
|
| |||||||
| 98,655 | ||||||||
|
| |||||||
Airlines - 0.2% |
| |||||||
Alaska Air Group Inc. | 631 | 40,327 | ||||||
JetBlue Airways Corp. (a) | 997 | 18,435 | ||||||
|
| |||||||
| 58,762 | ||||||||
|
| |||||||
Application Software - 1.7% |
| |||||||
Adobe Inc. (a) | 353 | 104,011 | ||||||
Intuit Inc. | 248 | 64,810 | ||||||
salesforce.com Inc. (a) | 1,828 | 277,362 | ||||||
Splunk Inc. (a) | 73 | 9,180 | ||||||
|
| |||||||
| 455,363 | ||||||||
|
| |||||||
Auto Parts & Equipment - 0.3% |
| |||||||
Aptiv PLC | 974 | 78,728 | ||||||
|
| |||||||
Automotive Retail - 0.5% |
| |||||||
AutoZone Inc. (a) | 116 | 127,539 | ||||||
|
| |||||||
Biotechnology - 3.4% |
| |||||||
Alexion Pharmaceuticals Inc. (a) | 1,143 | 149,710 | ||||||
BioMarin Pharmaceutical | 1,161 | 99,440 | ||||||
Gilead Sciences Inc. | 7,352 | 496,701 | ||||||
Vertex Pharmaceuticals Inc. (a) | 852 | 156,240 | ||||||
|
| |||||||
| 902,091 | ||||||||
|
| |||||||
Building Products - 0.2% |
| |||||||
Allegion PLC | 453 | 50,079 | ||||||
|
| |||||||
Cable & Satellite - 2.0% |
| |||||||
Charter Communications Inc., Class A (a) | 851 | 336,298 | ||||||
Comcast Corp., Class A | 4,491 | 189,880 | ||||||
|
| |||||||
| 526,178 | ||||||||
|
| |||||||
Commodity Chemicals - 0.2% |
| |||||||
Dow Inc. (a) | 809 | 39,892 | ||||||
|
| |||||||
Communications Equipment - 0.7% |
| |||||||
Cisco Systems Inc. | 3,384 | 185,206 | ||||||
|
| |||||||
| Number of Shares | Fair $ | |||||||
Construction Materials - 0.1% |
| |||||||
Vulcan Materials Co. | 191 | 26,226 | ||||||
|
| |||||||
Data Processing & Outsourced Services - 4.3% |
| |||||||
Mastercard Inc., Class A | 909 | 240,458 | ||||||
Visa Inc., Class A | 5,041 | 874,865 | ||||||
|
| |||||||
| 1,115,323 | ||||||||
|
| |||||||
Diversified Banks - 2.9% |
| |||||||
JPMorgan Chase & Co. | 6,827 | 763,259 | ||||||
|
| |||||||
Electric Utilities - 1.4% |
| |||||||
American Electric Power Company Inc. | 817 | 71,904 | ||||||
Duke Energy Corp. | 311 | 27,443 | ||||||
Edison International | 456 | 30,739 | ||||||
Exelon Corp. | 1,897 | 90,942 | ||||||
NextEra Energy Inc. | 748 | 153,235 | ||||||
|
| |||||||
| 374,263 | ||||||||
|
| |||||||
Electrical Components & Equipment - 0.4% |
| |||||||
Emerson Electric Co. | 1,680 | 112,090 | ||||||
|
| |||||||
Electronic Components - 2.4% |
| |||||||
Amphenol Corp., Class A | 1,971 | 189,098 | ||||||
Corning Inc. | 12,932 | 429,730 | ||||||
|
| |||||||
| 618,828 | ||||||||
|
| |||||||
Environmental & Facilities Services - 0.6% |
| |||||||
Republic Services Inc. | 577 | 49,991 | ||||||
Waste Management Inc. | 864 | 99,680 | ||||||
|
| |||||||
| 149,671 | ||||||||
|
| |||||||
Fertilizers & Agricultural Chemicals - 0.1% |
| |||||||
Corteva Inc. (a) | 857 | 25,341 | ||||||
|
| |||||||
Financial Exchanges & Data - 3.4% |
| |||||||
CME Group Inc. | 1,979 | 384,144 | ||||||
MSCI Inc. | 351 | 83,815 | ||||||
S&P Global Inc. | 1,542 | 351,252 | ||||||
Tradeweb Markets Inc., Class A | 1,825 | 79,953 | ||||||
|
| |||||||
| 899,164 | ||||||||
|
| |||||||
Footwear - 0.7% |
| |||||||
NIKE Inc., Class B | 2,050 | 172,098 | ||||||
|
| |||||||
General Merchandise Stores - 0.4% |
| |||||||
Dollar Tree Inc. (a) | 881 | 94,611 | ||||||
|
| |||||||
Gold - 0.1% |
| |||||||
Newmont Goldcorp Corp. | 836 | 32,161 | ||||||
|
| |||||||
See Notes to Schedule of Investments and Notes to Financial Statements.
| State Street U.S. Equity V.I.S. Fund | 3 |
Table of Contents
State Street U.S. Equity V.I.S. Fund
Schedule of Investments, continued — June 30, 2019 (Unaudited)
| Number of Shares | Fair $ | |||||||
Healthcare Equipment - 2.4% |
| |||||||
ABIOMED Inc. (a) | 239 | 62,257 | ||||||
Becton Dickinson and Co. | 513 | 129,281 | ||||||
Boston Scientific Corp. (a) | 7,042 | 302,665 | ||||||
Medtronic PLC | 1,417 | 138,002 | ||||||
|
| |||||||
| 632,205 | ||||||||
|
| |||||||
Healthcare Services - 1.1% |
| |||||||
Cigna Corp. (a) | 960 | 151,248 | ||||||
DaVita Inc. (a) | 1,032 | 58,060 | ||||||
Quest Diagnostics Inc. | 747 | 76,052 | ||||||
|
| |||||||
| 285,360 | ||||||||
|
| |||||||
Home Improvement Retail - 0.5% |
| |||||||
The Home Depot Inc. | 673 | 139,964 | ||||||
|
| |||||||
Hotels, Resorts & Cruise Lines - 0.3% |
| |||||||
Marriott International Inc., Class A | 547 | 76,739 | ||||||
|
| |||||||
Household Products - 1.0% |
| |||||||
The Procter & Gamble Co. | 2,331 | 255,594 | ||||||
|
| |||||||
Hypermarkets & Super Centers - 0.3% |
| |||||||
Walmart Inc. | 762 | 84,193 | ||||||
|
| |||||||
Industrial Conglomerates - 1.2% |
| |||||||
Honeywell International Inc. | 1,121 | 195,715 | ||||||
Roper Technologies Inc. | 334 | 122,331 | ||||||
|
| |||||||
| 318,046 | ||||||||
|
| |||||||
Industrial Gases - 0.6% |
| |||||||
Air Products & Chemicals Inc. | 531 | 120,203 | ||||||
Linde PLC | 189 | 37,951 | ||||||
|
| |||||||
| 158,154 | ||||||||
|
| |||||||
Industrial Machinery - 2.5% |
| |||||||
Ingersoll-Rand PLC | 2,802 | 354,929 | ||||||
Xylem Inc. | 3,435 | 287,304 | ||||||
|
| |||||||
| 642,233 | ||||||||
|
| |||||||
Insurance Brokers - 0.3% |
| |||||||
Marsh & McLennan Companies Inc. | 839 | 83,690 | ||||||
|
| |||||||
Integrated Oil & Gas - 2.3% |
| |||||||
Chevron Corp. | 3,000 | 373,320 | ||||||
Exxon Mobil Corp. | 3,028 | 232,036 | ||||||
|
| |||||||
| 605,356 | ||||||||
|
| |||||||
Integrated Telecommunication Services - 0.7% |
| |||||||
AT&T Inc. | 1,597 | 53,515 | ||||||
Verizon Communications Inc. | 2,052 | 117,231 | ||||||
|
| |||||||
| 170,746 | ||||||||
|
| |||||||
| Number of Shares | Fair $ | |||||||
Interactive Home Entertainment - 0.2% |
| |||||||
Activision Blizzard Inc. (b) | 666 | 31,435 | ||||||
Electronic Arts Inc. (a) | 337 | 34,125 | ||||||
|
| |||||||
| 65,560 | ||||||||
|
| |||||||
Interactive Media & Services - 5.4% |
| |||||||
Alphabet Inc., Class A (a) | 568 | 615,030 | ||||||
Alphabet Inc., Class C (a) | 302 | 326,435 | ||||||
Facebook Inc., Class A (a) | 2,425 | 468,025 | ||||||
|
| |||||||
| 1,409,490 | ||||||||
|
| |||||||
Internet & Direct Marketing Retail - 4.4% |
| |||||||
Amazon.com Inc. (a)(b) | 510 | 965,752 | ||||||
Booking Holdings Inc. (a) | 106 | 198,719 | ||||||
|
| |||||||
| 1,164,471 | ||||||||
|
| |||||||
Investment Banking & Brokerage - 0.8% |
| |||||||
The Charles Schwab Corp. | 5,003 | 201,071 | ||||||
|
| |||||||
IT Consulting & Other Services - 0.7% |
| |||||||
Accenture PLC, Class A | 458 | 84,624 | ||||||
International Business Machines Corp. | 652 | 89,911 | ||||||
|
| |||||||
| 174,535 | ||||||||
|
| |||||||
Life & Health Insurance - 0.3% |
| |||||||
Prudential Financial Inc. | 777 | 78,477 | ||||||
|
| |||||||
Life Sciences Tools & Services - 1.0% |
| |||||||
Illumina Inc. (a) | 418 | 153,887 | ||||||
IQVIA Holdings Inc. (a) | 408 | 65,647 | ||||||
Thermo Fisher Scientific Inc. | 119 | 34,948 | ||||||
|
| |||||||
| 254,482 | ||||||||
|
| |||||||
Managed Healthcare - 2.5% |
| |||||||
Humana Inc. | 382 | 101,345 | ||||||
UnitedHealth Group Inc. | 2,250 | 549,022 | ||||||
|
| |||||||
| 650,367 | ||||||||
|
| |||||||
Movies & Entertainment - 2.4% |
| |||||||
Netflix Inc. (a) | 406 | 149,132 | ||||||
The Walt Disney Co. | 3,387 | 472,961 | ||||||
|
| |||||||
| 622,093 | ||||||||
|
| |||||||
Multi-Line Insurance - 0.5% |
| |||||||
American International Group Inc. | 1,267 | 67,506 | ||||||
The Hartford Financial Services Group Inc. | 991 | 55,218 | ||||||
|
| |||||||
| 122,724 | ||||||||
|
| |||||||
See Notes to Schedule of Investments and Notes to Financial Statements.
| 4 | State Street U.S. Equity V.I.S. Fund |
Table of Contents
State Street U.S. Equity V.I.S. Fund
Schedule of Investments, continued — June 30, 2019 (Unaudited)
| Number of Shares | Fair $ | |||||||
Multi-Sector Holdings - 1.1% |
| |||||||
Berkshire Hathaway Inc., Class B (a) | 1,378 | 293,748 | ||||||
|
| |||||||
Multi-Utilities - 1.5% |
| |||||||
CMS Energy Corp. | 645 | 37,352 | ||||||
Dominion Energy Inc. | 644 | 49,794 | ||||||
Sempra Energy | 2,245 | 308,553 | ||||||
|
| |||||||
| 395,699 | ||||||||
|
| |||||||
Oil & Gas Equipment & Services - 1.0% |
| |||||||
Schlumberger Ltd. | 6,450 | 256,323 | ||||||
|
| |||||||
Oil & Gas Exploration & Production - 1.3% |
| |||||||
Concho Resources Inc. | 253 | 26,105 | ||||||
ConocoPhillips | 1,213 | 73,993 | ||||||
Diamondback Energy Inc. | 1,902 | 207,261 | ||||||
EOG Resources Inc. | 495 | 46,114 | ||||||
|
| |||||||
| 353,473 | ||||||||
|
| |||||||
Oil & Gas Refining & Marketing - 0.3% |
| |||||||
Marathon Petroleum Corp. | 1,327 | 74,153 | ||||||
|
| |||||||
Packaged Foods & Meats - 1.6% |
| |||||||
Mondelez International Inc., Class A | 7,585 | 408,831 | ||||||
|
| |||||||
Personal Products - 0.7% |
| |||||||
The Estee Lauder Companies Inc., Class A | 986 | 180,546 | ||||||
|
| |||||||
Pharmaceuticals - 5.5% |
| |||||||
Allergan PLC | 3,193 | 534,604 | ||||||
Bristol-Myers Squibb Co. | 2,749 | 124,667 | ||||||
Elanco Animal Health Inc. (a) | 2,418 | 81,728 | ||||||
Merck & Company Inc. | 7,132 | 598,018 | ||||||
Mylan N.V. (a) | 5,037 | 95,905 | ||||||
|
| |||||||
| 1,434,922 | ||||||||
|
| |||||||
Property & Casualty Insurance - 0.5% |
| |||||||
Chubb Ltd. | 676 | 99,568 | ||||||
The Progressive Corp. | 503 | 40,205 | ||||||
|
| |||||||
| 139,773 | ||||||||
|
| |||||||
Railroads - 0.5% |
| |||||||
Union Pacific Corp. | 787 | 133,090 | ||||||
|
| |||||||
Regional Banks - 2.0% |
| |||||||
Comerica Inc. | 817 | 59,347 | ||||||
First Republic Bank | 3,124 | 305,058 | ||||||
Regions Financial Corp. | 4,399 | 65,721 | ||||||
| Number of Shares | Fair $ | |||||||
SVB Financial Group (a) | 464 | 104,210 | ||||||
|
| |||||||
| 534,336 | ||||||||
|
| |||||||
Restaurants - 1.0% |
| |||||||
McDonald’s Corp. | 1,302 | 270,373 | ||||||
|
| |||||||
Semiconductor Equipment - 2.6% |
| |||||||
Applied Materials Inc. | 11,819 | 530,791 | ||||||
ASML Holding N.V. (b) | 776 | 161,354 | ||||||
|
| |||||||
| 692,145 | ||||||||
|
| |||||||
Semiconductors - 2.0% |
| |||||||
Broadcom Inc. | 471 | 135,582 | ||||||
Intel Corp. | 2,312 | 110,675 | ||||||
NVIDIA Corp. | 720 | 118,246 | ||||||
QUALCOMM Inc. | 890 | 67,702 | ||||||
Texas Instruments Inc. | 714 | 81,939 | ||||||
|
| |||||||
| 514,144 | ||||||||
|
| |||||||
Soft Drinks - 1.9% |
| |||||||
PepsiCo Inc. | 3,696 | 484,656 | ||||||
|
| |||||||
Specialized REITs - 2.3% |
| |||||||
American Tower Corp. | 614 | 125,532 | ||||||
Equinix Inc. | 577 | 290,976 | ||||||
Extra Space Storage Inc. | 1,659 | 176,020 | ||||||
|
| |||||||
| 592,528 | ||||||||
|
| |||||||
Specialty Chemicals - 0.6% |
| |||||||
Albemarle Corp. (b) | 386 | 27,178 | ||||||
DuPont de Nemours Inc. | 857 | 64,335 | ||||||
PPG Industries Inc. | 565 | 65,941 | ||||||
|
| |||||||
| 157,454 | ||||||||
|
| |||||||
Specialty Stores - 0.3% |
| |||||||
Ulta Salon Cosmetics & Fragrance Inc. (a) | 234 | 81,172 | ||||||
|
| |||||||
Systems Software - 6.4% |
| |||||||
Microsoft Corp. | 9,753 | 1,306,512 | ||||||
Oracle Corp. | 2,987 | 170,169 | ||||||
Proofpoint Inc. (a) | 463 | 55,676 | ||||||
Red Hat Inc. (a) | 251 | 47,128 | ||||||
ServiceNow Inc. (a) | 311 | 85,391 | ||||||
|
| |||||||
| 1,664,876 | ||||||||
|
| |||||||
Technology Hardware, Storage & Peripherals - 2.6% |
| |||||||
Apple Inc. | 3,483 | 689,355 | ||||||
|
| |||||||
Tobacco - 0.5% |
| |||||||
Philip Morris International Inc. | 1,628 | 127,847 | ||||||
|
| |||||||
See Notes to Schedule of Investments and Notes to Financial Statements.
| State Street U.S. Equity V.I.S. Fund | 5 |
Table of Contents
State Street U.S. Equity V.I.S. Fund
Schedule of Investments, continued — June 30, 2019 (Unaudited)
| Number of Shares | Fair $ | |||||||
Trading Companies & Distributors - 1.3% |
| |||||||
United Rentals Inc. (a) | 2,571 | 340,992 | ||||||
|
| |||||||
Trucking - 0.4% |
| |||||||
Lyft Inc., Class A (a) | 1,425 | 93,637 | ||||||
|
| |||||||
Wireless Telecommunication Services - 0.2% |
| |||||||
T-Mobile US Inc. (a) | 699 | 51,824 | ||||||
|
| |||||||
| Total Common Stock (Cost $19,022,190) |
| 25,363,571 | ||||||
|
| |||||||
| Number of Shares | Fair $ | |||||||
| Short-Term Investments - 2.9% |
| |||||||
State Street Institutional U.S. Government Money Market Fund - Class G Shares 2.35% | 765,584 | 765,584 | ||||||
|
| |||||||
| Total Investments (Cost $19,787,774) | 26,129,155 | |||||||
| Other Assets and Liabilities, net - 0.1% |
| 24,671 | ||||||
|
| |||||||
| NET ASSETS - 100.0% | 26,153,826 | |||||||
|
| |||||||
Other Information:
The Fund had the following long futures contracts open at June 30, 2019:
| Description | Expiration date | Number of Contracts | Notional Amount | Value | Unrealized Appreciation | |||||||||||||||
S&P 500E-mini Index Futures | September 2019 | 3 | $ | 438,569 | $ | 441,630 | $ | 3,061 | ||||||||||||
|
| |||||||||||||||||||
During the period ended June 30, 2019, average notional value related to long futures contracts was $279,504.
See Notes to Schedule of Investments and Notes to Financial Statements.
| 6 | State Street U.S. Equity V.I.S. Fund |
Table of Contents
State Street U.S. Equity V.I.S. Fund
Notes to Schedule of Investments — June 30, 2019 (Unaudited)
The views expressed in this document reflect our judgment as of the publication date and are subject to change at any time without notice. The securities cited may not be representative of the Fund’s future investments and should not be construed as a recommendation to purchase or sell a particular security. See the Fund’s summary prospectus and statutory prospectus for complete descriptions of investment objectives, policies, risks and permissible investments.
| (a) | Non-income producing security. |
| (b) | At June 30, 2019, all or a portion of this security was pledged to cover collateral requirements for futures. |
| (c) | Sponsored by SSGA Funds Management, Inc., the Fund’s investment adviser and administrator, and an affiliate of State Street Bank & Trust Co., the Fund’ssub-administrator, custodian and accounting agent. |
| (d) | Coupon amount represents effective yield. |
| † | Percentages are based on net assets as of June 30, 2019. |
Abbreviations:
REIT - Real Estate Investment Trust
The following table represents the Fund’s investments measured at fair value on a recurring basis at June 30, 2019:
| Investments | Level 1 | Level 2 | Level 3 | Total | ||||||||||||
Investments in Securities | ||||||||||||||||
Common Stock | $ | 25,363,571 | $ | — | $ | — | $ | 25,363,571 | ||||||||
Short-Term Investments | 765,584 | — | — | 765,584 | ||||||||||||
|
|
|
|
|
|
|
| |||||||||
Total Investments in Securities | $ | 26,129,155 | $ | — | $ | — | $ | 26,129,155 | ||||||||
|
|
|
|
|
|
|
| |||||||||
Other Financial Instruments | ||||||||||||||||
Long Futures Contracts - Unrealized Appreciation | $ | 3,061 | $ | — | $ | — | $ | 3,061 | ||||||||
|
|
|
|
|
|
|
| |||||||||
Affiliate Table
| Number of Shares Held at 12/31/18 | Value At 12/31/18 | Cost of Purchases | Proceeds from Shares Sold | Number Held at 6/30/19 | Value at 6/30/19 | Dividend Income | ||||||||||||||||||||||
State Street Institutional U.S. Government Money Market Fund - Class G Shares | 743,662 | $ | 743,662 | $ | 2,472,966 | $ | 2,451,044 | 765,584 | $ | 765,584 | $ | 6,607 | ||||||||||||||||
See Notes to Schedule of Investments and Notes to Financial Statements.
| State Street U.S. Equity V.I.S. Fund | 7 |
Table of Contents
State Street U.S. Equity V.I.S. Fund
Selected data based on a share outstanding throughout the periods indicated
| 6/30/19† | 12/31/18 | 12/31/17 | 12/31/16 | 12/31/15* | 12/31/14* | |||||||||||||||||||
| Inception date | 1/3/95 | |||||||||||||||||||||||
Net asset value, beginning of period | $ | 38.07 | $ | 44.20 | $ | 42.02 | $ | 42.25 | $ | 48.44 | $ | 46.63 | ||||||||||||
|
|
|
|
|
|
|
|
|
|
|
| |||||||||||||
Income/(loss) from investment operations: |
| |||||||||||||||||||||||
Net investment income | 0.16 | (a) | 0.37 | (a) | 0.35 | (a) | 0.55 | 0.53 | 0.50 | |||||||||||||||
Net realized and unrealized gains/(losses) on investments | 7.28 | (1.90 | ) | 8.03 | 3.41 | (1.56 | ) | 5.48 | ||||||||||||||||
|
|
|
|
|
|
|
|
|
|
|
| |||||||||||||
Total income/(loss) from investment operations | 7.44 | (1.53 | ) | 8.38 | 3.96 | (1.03 | ) | 5.98 | ||||||||||||||||
|
|
|
|
|
|
|
|
|
|
|
| |||||||||||||
Less distributions from: |
| |||||||||||||||||||||||
Net investment income | — | 0.41 | 0.38 | 0.54 | 0.53 | 0.46 | ||||||||||||||||||
Net realized gains | — | 4.19 | 5.82 | 3.65 | 4.63 | 3.71 | ||||||||||||||||||
|
|
|
|
|
|
|
|
|
|
|
| |||||||||||||
Total distributions | — | 4.60 | 6.20 | 4.19 | 5.16 | 4.17 | ||||||||||||||||||
|
|
|
|
|
|
|
|
|
|
|
| |||||||||||||
Net asset value, end of period | $ | 45.51 | $ | 38.07 | $ | 44.20 | $ | 42.02 | $ | 42.25 | $ | 48.44 | ||||||||||||
|
|
|
|
|
|
|
|
|
|
|
| |||||||||||||
Total Return(b) | 19.54 | % | (3.40 | )% | 19.91 | % | 9.31 | % | (2.30 | )% | 12.77 | % | ||||||||||||
Ratios/Supplemental Data: |
| |||||||||||||||||||||||
Net assets, end of period (in thousands) | $ | 26,154 | $ | 23,473 | $ | 28,308 | $ | 27,336 | $ | 31,405 | $ | 35,178 | ||||||||||||
Ratios to average net assets: |
| |||||||||||||||||||||||
Net expenses | 0.89 | %** | 0.80 | % | 0.85 | % | 0.83 | % | 0.76 | % | 0.77 | %(c) | ||||||||||||
Gross expenses | 0.89 | %** | 0.80 | % | 0.85 | % | 0.83 | % | 0.76 | % | 0.77 | % | ||||||||||||
Net investment income | 0.74 | %** | 0.81 | % | 0.75 | % | 1.16 | % | 1.04 | % | 0.99 | % | ||||||||||||
Portfolio turnover rate | 17 | % | 41 | % | 80 | % | 37 | % | 37 | % | 43 | % | ||||||||||||
Notes to Financial Highlights
| (a) | Per share values have been calculated using the average shares method. |
| (b) | Total returns are historical and assume changes in share price, reinvestment of dividends and capital gains distributions and do not include the effect of insurance contract charges. Past performance does not guarantee future results. |
| (c) | Includes contractual management fee waiver related to the Fund’s investments in the GE Institutional Money Market Fund (the “Money Market Fund”). The fee waiver agreement was terminated effective June 30, 2014 with the closure of the Money Market Fund. |
| † | Unaudited. |
| * | Beginning with the year ended December 31, 2016, the Fund was audited by Ernst & Young LLP. The previous years were audited by another independent registered public accounting firm. |
| ** | Annualized for periods less than one year. |
The accompanying Notes are an integral part of these financial statements.
| 8 | Financial Highlights |
Table of Contents
State Street U.S. Equity V.I.S. Fund
Statement of Assets and Liabilities — June 30, 2019 (Unaudited)
Assets | ||||
Investments in securities, at fair value (cost $19,022,190) | $ | 25,363,571 | ||
Short-term affiliated investments, at fair value | 765,584 | |||
Cash | 1,607 | |||
Cash collateral on deposit with broker for future contracts | 37,894 | |||
Receivable for investments sold | 55,988 | |||
Income receivables | 17,042 | |||
Income receivable from affiliated investments | 1,390 | |||
Receivable for accumulated variation margin on futures contracts | 3,068 | |||
|
| |||
Total assets | 26,246,144 | |||
|
| |||
Liabilities | ||||
Payable for investments purchased | 34,106 | |||
Payable for fund shares redeemed | 25,734 | |||
Payable to the Adviser | 11,545 | |||
Payable for custody, fund accounting andsub-administration fees | 1,482 | |||
Accrued other expenses | 19,451 | |||
|
| |||
Total liabilities | 92,318 | |||
|
| |||
Net Assets | $ | 26,153,826 | ||
|
| |||
Net Assets Consist of: | ||||
Capital paid in | $ | 18,933,157 | ||
Total distributable earnings (loss) | 7,220,669 | |||
|
| |||
Net Assets | $ | 26,153,826 | ||
|
| |||
Shares outstanding ($0.01 par value; unlimited shares authorized) | 574,710 | |||
Net asset value per share | $ | 45.51 | ||
The accompanying Notes are an integral part of these financial statements.
| Statement of Assets and Liabilities | 9 |
Table of Contents
State Street U.S. Equity V.I.S. Fund
Statement of Operations — For the period ended June 30, 2019 (Unaudited)
Investment Income | ||||
Income | ||||
Dividend | $ | 200,572 | ||
Income from affiliated investments | 6,607 | |||
Less: Foreign taxes withheld | (203 | ) | ||
|
| |||
Total income | 206,976 | |||
|
| |||
Expenses |
| |||
Advisory and administration fees | 69,574 | |||
Directors’ fees | 9,275 | |||
Custody, fund accounting andsub-administration fees | 9,988 | |||
Professional fees | 16,042 | |||
Printing and shareholder reports | 7,191 | |||
Other expenses | 936 | |||
|
| |||
Total Expenses | 113,006 | |||
|
| |||
Net investment income | $ | 93,970 | ||
|
| |||
Net Realized and Unrealized Gain (Loss) on Investments | ||||
Realized gain (loss) on: |
| |||
Unaffiliated investments | $ | 659,452 | ||
Futures | 32,169 | |||
Increase (decrease) in unrealized appreciation/depreciation on: |
| |||
Unaffiliated investments | 3,681,214 | |||
Futures | 13,081 | |||
|
| |||
Net realized and unrealized gain (loss) on investments | 4,385,916 | |||
|
| |||
Net Increase in Net Assets Resulting from Operations | $ | 4,479,886 | ||
|
| |||
The accompanying Notes are an integral part of these financial statements.
| 10 | Statement of Operations |
Table of Contents
State Street U.S. Equity V.I.S. Fund
Statements of Changes in Net Assets
Six Months Ended June 30, 2019* | Year Ended December 31, | |||||||
Increase (Decrease) in Net Assets |
| |||||||
Operations: |
| |||||||
Net investment income | $ | 93,970 | $ | 224,719 | ||||
Net realized gain (loss) on investments and futures transactions | 691,621 | 2,185,851 | ||||||
Net increase (decrease) in unrealized appreciation/depreciation on investments and futures | 3,694,295 | (3,055,035 | ) | |||||
|
|
|
| |||||
Net increase (decrease) from operations | 4,479,886 | (644,465 | ) | |||||
|
|
|
| |||||
Distributions to shareholders: | ||||||||
Total distributions | — | (2,528,893 | ) | |||||
|
|
|
| |||||
Increase (decrease) in assets from operations and distributions | 4,479,886 | (3,173,358 | ) | |||||
|
|
|
| |||||
Share transactions: | ||||||||
Proceeds from sale of shares | 323,386 | 241,533 | ||||||
Value of distributions reinvested | — | 2,528,893 | ||||||
Cost of shares redeemed | (2,122,819 | ) | (4,431,611 | ) | ||||
|
|
|
| |||||
Net increase (decrease) from share transactions | (1,799,433 | ) | (1,661,185 | ) | ||||
|
|
|
| |||||
Total increase (decrease) in net assets | 2,680,453 | (4,834,543 | ) | |||||
Net Assets | ||||||||
Beginning of period | 23,473,373 | 28,307,916 | ||||||
|
|
|
| |||||
End of period | $ | 26,153,826 | $ | 23,473,373 | ||||
|
|
|
| |||||
Changes in Fund Shares | ||||||||
Shares sold | 7,411 | 5,408 | ||||||
Issued for distributions reinvested | — | 66,920 | ||||||
Shares redeemed | (49,364 | ) | (96,095 | ) | ||||
|
|
|
| |||||
Net decrease in fund shares | (41,953 | ) | (23,767 | ) | ||||
|
|
|
| |||||
| * | Unaudited. |
The accompanying Notes are an integral part of these financial statements.
| Statements of Changes in Net Assets | 11 |
Table of Contents
State Street U.S. Equity V.I.S. Fund
Notes to Financial Statements — June 30, 2019 (Unaudited)
| 1. | Organization of the Company |
State Street Variable Insurance Series Funds, Inc. (the “Company”) was incorporated under the laws of the Commonwealth of Virginia on May 14, 1984 and is registered under the Investment Company Act of 1940, as amended (the “1940 Act”), as anopen-end management investment company. The Company is currently composed of the following seven investment portfolios (collectively, the “Funds”): State Street U.S. Equity V.I.S. Fund (the “Fund”), State Street S&P 500 Index V.I.S. Fund, State Street Premier Growth Equity V.I.S. Fund, State StreetSmall-Cap Equity V.I.S. Fund, State Street Total Return V.I.S. Fund, State Street Income V.I.S. Fund and State Street Real Estate Securities V.I.S. Fund. Each Fund is a diversified investment company within the meaning of the 1940 Act.
Shares of the Funds of the Company are offered only to insurance company separate accounts that fund certain variable life insurance contracts and variable annuity contracts.
The Company currently offers one share class (Class 1) of the Fund as an investment option for variable life insurance and variable annuity contracts.
Under the Company’s organizational documents, its officers and directors are indemnified against certain liabilities arising out of the performance of their duties to the Company. Additionally, in the normal course of business, the Company enters into contracts with service providers that contain general indemnification clauses. The Company’s maximum exposure under these arrangements is unknown as this would involve future claims that may be made against the Company that have not yet occurred.
| 2. | Summary of Significant Accounting Policies |
The following is a summary of significant accounting policies followed by the Company in the preparation of its financial statements:
The preparation of financial statements in accordance with U.S. generally accepted accounting principles (“U.S. GAAP”) requires management to make estimates and assumptions that affect the reported amounts and disclosures in the financial statements. Actual results could differ from those estimates. The Fund is an investment company under U.S. GAAP and follows the accounting and reporting guidance applicable to investment companies.
Security Valuation The Fund’s investments are valued at fair value each day that the New York Stock Exchange (“NYSE”) is open and, for financial reporting purposes, as of the report date should the reporting period end on a day that the NYSE is not open. Fair value is generally defined as the price a fund would receive to sell an asset or pay to transfer a liability in an orderly transaction between market participants at the measurement date. By its nature, a fair value price is a good faith estimate of the valuation in a current sale and may not reflect an actual market price. The investments of the Fund are valued pursuant to the policy and procedures developed by the Oversight Committee (the “Committee”) and approved by the Company’s Board of Directors (the “Board”). The Committee provides oversight of the valuation of investments for the Fund. The Board has responsibility for overseeing the determination of the fair value of investments.
Valuation techniques used to value the Fund’s investments by major category are as follows:
| • | Equity investments (including preferred stocks) traded on a recognized securities exchange for which market quotations are readily available are valued at the last sale price or official closing price, as applicable, on the primary market or exchange on which they trade. Equity investments traded on a recognized exchange for which there were no sales on that day are valued at the last published sale price or at fair value. |
| • | Exchange-traded futures contracts are valued at the closing settlement price on the primary market on which they are traded most extensively. Exchange-traded futures contracts traded on a recognized exchange for which there were no sales on that day are valued at the last reported sale price obtained from independent pricing services or brokers or at fair value. |
| • | Investments in registered investment companies (including money market funds) or other unitized pooled investment vehicles that are not traded on an exchange are valued at that day’s published net asset value (“NAV”) per share or unit. |
In the event prices or quotations are not readily available or that the application of these valuation methods results in a price for an investment that is deemed to be not representative of the fair value of such investment, fair value will be determined in good faith by the Committee, in accordance with the valuation policy and procedures approved by the Board.
| 12 | Notes to Financial Statements |
Table of Contents
State Street U.S. Equity V.I.S. Fund
Notes to Financial Statements, continued — June 30, 2019 (Unaudited)
The Fund values its assets and liabilities at fair value using a fair value hierarchy consisting of three broad levels that prioritize the inputs to valuation techniques giving the highest priority to readily available unadjusted quoted prices in active markets for identical assets or liabilities (Level 1 measurements) and the lowest priority to unobservable inputs (Level 3 measurements) when market prices are not readily available or reliable. The categorization of a value determined for an investment within the hierarchy is based upon the pricing transparency of the investment and is not necessarily an indication of the risk associated with investing in it.
The three levels of the fair value hierarchy are as follows:
| • | Level 1 — Unadjusted quoted prices in active markets for an identical asset or liability; |
| • | Level 2 — Inputs other than quoted prices included within Level 1 that are observable for the asset or liability either directly or indirectly, including quoted prices for similar assets or liabilities in active markets, quoted prices for identical or similar assets or liabilities in markets that are not considered to be active, inputs other than quoted prices that are observable for the asset or liability (such as exchange rates, financing terms, interest rates, yield curves, volatilities, prepayment speeds, loss severities, credit risks and default rates) or other market-corroborated inputs; and |
| • | Level 3 — Unobservable inputs for the asset or liability, including the Committee’s assumptions used in determining the fair value of investments. |
The value of the Fund’s investments according to the fair value hierarchy as of June 30, 2019 is disclosed in the Fund’s Schedule of Investments.
Investment Transactions and Income Recognition Investment transactions are accounted for on trade date for financial reporting purposes. Realized gains and losses from the sale or disposition of investments and foreign exchange transactions, if any, are determined using the identified cost method.
Dividend income and capital gain distributions, if any, are recognized on theex-dividend date, net of any foreign taxes withheld at source, if any.
Interest income is recorded daily on an accrual basis. All premiums and discounts are amortized/accreted for financial reporting purposes.
Non-cash dividends received in the form of stock are recorded as dividend income at fair value.
Expenses Certain expenses, which are directly identifiable to a specific Fund, are applied to the Fund within the Company. Other expenses which cannot be attributed to a specific Fund are allocated in such a manner as deemed equitable, taking into consideration the nature and type of expense and the relative net assets of the Fund within the Company.
Foreign Currency Translation The accounting records of the Fund are maintained in U.S. dollars. Foreign currencies as well as investment securities and other assets and liabilities denominated in a foreign currency are translated to U.S. dollars using exchange rates at period end. Purchases and sales of securities, income receipts and expense payments denominated in foreign currencies are translated into U.S. dollars at the prevailing exchange rate on the respective dates of the transactions.
The effects of exchange rate fluctuations on investments are included with the net realized and unrealized gain (loss) on investment securities. Other foreign currency transactions resulting in realized and unrealized gain (loss) are disclosed separately.
Foreign Taxes The Fund may be subject to foreign taxes (a portion of which may be reclaimable) on income, stock dividends, realized and unrealized capital gains on investments or certain foreign currency transactions. Foreign taxes are recorded in accordance with SSGA Funds Management, Inc.’s (the “Adviser” or “SSGA FM”) understanding of the applicable foreign tax regulations and rates that exist in the foreign jurisdictions in which the Fund invests. These foreign taxes, if any, are paid by the Fund and are reflected in the Statement of Operations, if applicable. Foreign taxes payable or deferred as of June 30, 2019, if any, are disclosed in the Fund’s Statement of Assets and Liabilities.
Distributions The Fund declares and pays any dividends from net investment income annually.
| Notes to Financial Statements | 13 |
Table of Contents
State Street U.S. Equity V.I.S. Fund
Notes to Financial Statements, continued — June 30, 2019 (Unaudited)
Net realized capital gains, if any, are distributed annually, unless additional distributions are required for compliance with applicable tax regulations. The amount and character of income and capital gains to be distributed are determined in accordance with applicable tax regulations which may differ from net investment income and realized gains recognized for U.S. GAAP purposes.
| 3. | Derivative Financial Instruments |
Futures Contracts The Fund may enter into futures contracts to meet the Fund’s objectives. A futures contract is a standardized, exchange-traded agreement to buy or sell a financial instrument at a set price on a future date. Upon entering into a futures contract, the Fund is required to deposit with the broker, cash or securities in an amount equal to the minimum initial margin requirements of the clearing house. Subsequent payments are made or received by the Fund equal to the daily change in the contract value and are recorded as variation margin receivable or payable with a corresponding offset to unrealized gains or losses. The Fund recognizes a realized gain or loss when the contract is closed.
Losses may arise if the value of a futures contract decreases due to unfavorable changes in the market rates or values of the underlying instrument during the term of the contract or if the counterparty does not perform under the contract. The use of futures contracts also involves the risk that the movements in the price of the futures contracts do not correlate with the movement of the assets underlying such contracts.
For the period ended June 30, 2019, the Fund entered into futures contracts for cash equitization.
The following tables summarize the value of the Fund’s derivative instruments as of June 30, 2019 and the related location in the accompanying Statement of Assets and Liabilities and Statement of Operations, presented by primary underlying risk exposure:
Asset Derivatives
| Interest Rate Contracts Risk | Foreign Exchange Contracts Risk | Credit Contracts Risk | Equity Contracts Risk | Commodity Contracts Risk | Total | |||||||||||||||||||
State Street U.S. Equity V.I.S. Fund | ||||||||||||||||||||||||
Futures Contracts | $ | — | $ | — | $ | — | $ | 3,068 | $ | — | $ | 3,068 | ||||||||||||
Realized Gain/Loss
| Interest Rate Contracts Risk | Foreign Exchange Contracts Risk | Credit Contracts Risk | Equity Contracts Risk | Commodity Contracts Risk | Total | |||||||||||||||||||
State Street U.S. Equity V.I.S. Fund | ||||||||||||||||||||||||
Futures Contracts | $ | — | $ | — | $ | — | $ | 32,169 | $ | — | $ | 32,169 | ||||||||||||
Net Change in Unrealized Appreciation (Depreciation)
| Interest Rate Contracts Risk | Foreign Exchange Contracts Risk | Credit Contracts Risk | Equity Contracts Risk | Commodity Contracts Risk | Total | |||||||||||||||||||
State Street U.S. Equity V.I.S. Fund | ||||||||||||||||||||||||
Futures Contracts | $ | — | $ | — | $ | — | $ | 13,081 | $ | — | $ | 13,081 | ||||||||||||
| 4. | Fees and Transactions with Affiliates |
Advisory Fee SSGA FM, a registered investment adviser, was retained by the Board to act as investment adviser and administrator of the Fund. SSGA FM’s compensation for investment advisory and administrative services (“Management Fee”) is paid monthly based on the average daily net assets of the Fund at an annualized rate of 0.55%.
| 14 | Notes to Financial Statements |
Table of Contents
State Street U.S. Equity V.I.S. Fund
Notes to Financial Statements, continued — June 30, 2019 (Unaudited)
Custody, Fund Accounting andSub-Administration Fees State Street Bank and Trust Company (“State Street”) serves as the custodian, fund accountant andsub-administrator to the Fund. Amounts paid by the Fund to State Street for performing such services are included as custody, fund accounting andsub-administration fees in the Statement of Operations.
Other Transactions with Affiliates The Fund may invest in affiliated entities, including securities issued by State Street Corporation, affiliated funds, or entities deemed to be affiliates as a result of the Fund owning more than five percent of the entity’s voting securities or outstanding shares. Amounts relating to these transactions during the period ended June 30, 2019 are disclosed in the Schedule of Investments.
| 5. | Directors’ Fees |
The fees and expenses of the Company’s directors who are not “interested persons” of the Company, as defined in the 1940 Act (“Independent Directors”), are paid directly by the Fund. The Independent Directors are reimbursed for travel and otherout-of-pocket expenses in connection with meeting attendance and industry seminars.
| 6. | Investment Transactions |
Purchases and sales of investments (excludingin-kind transactions, short term investments and derivative contracts) for the period ended June 30, 2019 were as follows:
| Non-U.S. Government Securities | ||||||||
| Purchases | Sales | |||||||
| $ | 4,099,103 | $ | 5,803,343 | |||||
| 7. | Income Taxes |
The Fund has qualified and intends to continue to qualify as a regulated investment company under Subchapter M of the Internal Revenue Code of 1986, as amended. The Fund will not be subject to federal income taxes to the extent it distributes its taxable income, including any net realized capital gains, for each fiscal year. Therefore, no provision for federal income tax is required.
The Fund files federal and various state and local tax returns as required. No income tax returns are currently under examination. Generally, the federal returns are subject to examination by the Internal Revenue Service for a period of three years from date of filing, while the state returns may remain open for an additional year depending upon jurisdiction. SSGA FM has analyzed the Fund’s tax positions taken on tax returns for all open years and does not believe there are any uncertain tax positions that would require recognition of a tax liability.
Distributions to shareholders are recorded onex-dividend date. Income dividends and gain distributions are determined in accordance with income tax rules and regulations, which may differ from generally accepted accounting principles.
As of June 30, 2019, gross unrealized appreciation and gross unrealized depreciation of investments and other financial instruments based on cost for federal income tax purposes were as follows:
| Tax Cost | Gross Unrealized Appreciation | Gross Unrealized Depreciation | Net Unrealized Appreciation (Depreciation) | |||||||||||||||
| $ | 19,924,316 | $ | 6,919,451 | $ | 711,551 | $ | 6,207,900 | |||||||||||
| 8. | Line of Credit |
The Fund and other affiliated funds (each, a “Participant” and collectively, the “Participants”) participate in a $500 million revolving credit facility provided by a syndication of banks under which the Participants may borrow to fund shareholder redemptions. This agreement expires in October 2019 unless otherwise extended or renewed.
The Participants are charged an annual commitment fee which is calculated based on the unused portion of the shared credit line. Commitment fees are allocated among each of the Participants based on relative net assets. Commitment fees are ordinary fund operating expenses. A Participant incurs and pays the interest expense related to its borrowing. Interest is calculated at a rate per annum equal to the sum of 1% plus the greater of the New York Fed Bank Rate and1-month LIBOR rate.
| Notes to Financial Statements | 15 |
Table of Contents
State Street U.S. Equity V.I.S. Fund
Notes to Financial Statements, continued — June 30, 2019 (Unaudited)
The Fund had no outstanding loans as of June 30, 2019.
| 9. | Risks |
Concentration Risk As a result of the Fund’s ability to invest a large percentage of its assets in obligations of issuers within the same country, state, region, currency or economic sector, an adverse economic, business or political development may affect the value of the Fund’s investments more than if the Fund were more broadly diversified.
Market and Credit Risk In the normal course of business, the Fund trades financial instruments and enters into financial transactions where risk of potential loss exists due to changes in the general economic conditions and fluctuations of the market (market risk). Additionally, the Fund may also be exposed to credit risk in the event that an issuer or guarantor fails to perform or that an institution or entity with which the Fund has unsettled or open transactions defaults.
| 10. | Subsequent Events |
Management has evaluated the impact of all subsequent events on the Fund through the date on which the financial statements were available to be issued and has determined that there were no subsequent events requiring adjustment or disclosure in the financial statements.
| 16 | Notes to Financial Statements |
Table of Contents
State Street U.S. Equity V.I.S. Fund
Other Information — June 30, 2019 (Unaudited)
Proxy Voting Policies and Procedures and Record
The Fund has adopted the proxy voting policies of SSGA FM. A description of the policies and procedures that the Fund has adopted to determine how to vote proxies relating to portfolio securities is available (i) without charge, upon request, by calling1-800-242-0134, (ii) on the Fund’s website at http://www.ssga.com/geam, or (iii) on the SEC’s website at www.sec.gov. Information regarding how the Fund voted proxies, if any, during the most recent 12-month period ended June 30 is available by August 31 of each year without charge (1) by calling 1-800-242-0134 (toll free), and (2) on the website of the SEC at www.sec.gov.
Quarterly Portfolio Schedule
Following the Fund’s first and third fiscal quarter-ends, a complete schedule of investments is filed with the SEC as an exhibit to its reports on Form N-PORT, which can be found on the SEC’s website at www.sec.gov. The Fund’s schedules of investments are available upon request, without charge, by calling 1-800-242-0134 and on the Fund’s website at http://www.ssga.com/geam.
| Other Information | 17 |
Table of Contents
State Street U.S. Equity V.I.S. Fund
Other Information — June 30, 2019 (Unaudited), continued
Director Considerations in Approving Continuation of Investment Advisory Agreement1
Overview of the Contract Review Process
Under the Investment Company Act of 1940, as amended (the “1940 Act”), an investment advisory agreement between a mutual fund and its investment adviser may continue in effect from year to year only if its continuance is approved at least annually by the fund’s board of directors or its shareholders, and by a vote of a majority of those directors who are not “interested persons” of the fund (commonly referred to as, the “Independent Directors”) cast in person at a meeting called for the purpose of considering such approval.
Consistent with these requirements, the Board of Directors (the “Board”) of the State Street Variable Insurance Series Funds, Inc. (the “Company”) met in person on April 10, 2019 and May 15, 2019, including in executive sessions attended by the Independent Directors, to consider a proposal to approve, with respect to State Street U.S. Equity V.I.S. Fund (the “Fund”), the continuation of the investment advisory agreement (the “Advisory Agreement”) with SSGA Funds Management, Inc. (“SSGA FM” or the “Adviser”). Prior to voting on the proposal, the Independent Directors, as well as the Directors who are “interested persons” of the Adviser, reviewed information furnished by the Adviser and others reasonably necessary to permit the Board to evaluate the proposal fully. The Independent Directors were separately represented by counsel who are independent of the Adviser in connection with their consideration of approval of the Agreement. Following the April 10, 2019 meeting, the Independent Directors submitted questions and requests for additional information to management, and considered management’s responses thereto prior to and at the May 15, 2019 meeting. The Independent Directors considered, among other things, the following:
Information about Performance, Expenses and Fees
| • | A report prepared by an independent third-party provider of investment company data, which includes for the Fund: |
| ¡ | Comparisons of the Fund’s performance over the pastone-, three-, five- andten-year periods ended December 31, 2018, to the performance of an appropriate benchmark constructed by Broadridge Financial Solutions, Inc. (“Broadridge”) for the Fund (the “Lipper Index”) and a universe of other mutual funds with similar investment objectives and policies (the “Performance Group” and/or the “Performance Universe”); |
| ¡ | Comparisons of the Fund’s expense ratio (with detail of component expenses) to the expense ratios of a group of comparable mutual funds selected by the independent third-party data provider (the “Expense Group” and/or “Expense Universe”); |
| ¡ | A chart showing the Fund’s historical average net assets relative to its total expenses, management fees, andnon-management expenses over the past five calendar years; and |
| ¡ | Comparisons of the Fund’s contractual management fee to the contractual management fees of comparable mutual funds at different asset levels. |
| • | Comparative information concerning fees charged by the Adviser for managing institutional accounts using investment strategies and techniques similar to those used in managing the Fund; and |
| 1 | The Independent Directors have identified numerous relevant issues, factors and concerns (“issues, factors and concerns”) that they consider each year in connection with the proposed continuation of the advisory agreement, the administration agreement, the distribution plans, the distribution agreement and various related-party service agreements (the “annual review process”). The statement of issues, factors and concerns and the related conclusions of the Independent Directors may not change substantially from year to year. However, the information requested by, and provided to, the Independent Directors with respect to the issues, factors and concerns and on which their conclusions are based is updated annually and, in some cases, may differ substantially from the previous year. The Independent Directors schedule annually a separatein-person meeting that is dedicated to the annual review process (the “special meeting”). At the special meeting and throughout the annual review process, the Independent Directors take a fresh look at each of the issues, factors and concerns in light of the latest available information and each year present one or more sets of comments and questions to management with respect to specific issues, factors and concerns. Management responds to such comments and questions to the satisfaction of the Independent Directors before the annual review process is completed and prior to the Independent Directors voting on proposals to approve continuation of the agreements and plans. |
| 18 | Other Information |
Table of Contents
State Street U.S. Equity V.I.S. Fund
Other Information — June 30, 2019 (Unaudited), continued
| • | Profitability analyses for (a) the Adviser with respect to the Fund and (b) affiliates of SSGA FM that provide services to the Fund (“Affiliated Service Providers”). |
Information about Portfolio Management
| • | Descriptions of the investment management services provided by the Adviser, including its investment strategies and processes; |
| • | Information concerning the allocation of brokerage; and |
| • | Information regarding the procedures and processes used to value the assets of the Fund. |
Information about the Adviser
| • | Reports detailing the financial results and condition of SSGA FM and its affiliates; |
| • | Descriptions of the qualifications, education and experience of the individual investment and other professionals responsible for managing the portfolio of the Fund and for Fund operations; |
| • | Information relating to compliance with and the administration of the Code of Ethics adopted by the Adviser; |
| • | Information about the Adviser’s proxy voting policies and procedures and information regarding the Adviser’s practices for overseeing proxy vendors; |
| • | Information concerning the resources devoted by the Adviser to overseeing compliance by the Fund and its service providers, including information concerning compliance with investment policies and restrictions and other operating policies of the Fund; |
| • | A description of the adequacy and sophistication of the Adviser’s technology and systems with respect to investment and administrative matters and a description of any material improvements or changes in technology or systems in the past year; |
| • | A description of the business continuity and disaster recovery plans of the Adviser; and |
| • | Information regarding the Adviser’s risk management processes. |
Other Relevant Information
| • | Information concerning the nature, extent, quality and cost of services provided to the Fund by SSGA FM in its capacity as the Fund’s administrator (the “Administrator”); |
| • | Information concerning the nature, extent, quality and cost of variousnon-investment management services provided to the Fund by affiliates of the Adviser, including the custodian,sub-administrator and fund accountant of the Fund, and the role of the Adviser in managing the Fund’s relationship with these service providers; |
| • | Copies of the Advisory Agreement and agreements with other service providers of the Fund; |
| • | Draft responses to a letter from independent legal counsel to the Independent Directors (“Independent Counsel”), reviewed prior to such date by Independent Counsel, requesting specific information from each of: |
| ¡ | SSGA FM, in its capacity as the Fund’s Adviser and Administrator, with respect to its operations relating to the Fund and its approximate profit margins from such operations for the calendar year ended December 31, 2018; and the relevant operations of other affiliated service providers to the Fund, together with their approximate profit margins from such relevant operations for the calendar year ended December 31, 2018; |
| ¡ | State Street Bank and Trust Company (“State Street”), thesub-administrator, custodian, and fund accountant for the Fund, with respect to its operations relating to the Fund; and |
| ¡ | State Street Global Advisors Funds Distributors, LLC, the principal underwriter and distributor of the shares of the Fund (the “Distributor”), with respect to its operations relating to the Fund, together with the Fund’s related distribution plans and arrangements under Rule12b-1 of the 1940 Act; |
| • | Information from SSGA FM, State Street and the Distributor with respect to the Fund providing any material changes to the previous information supplied in response to the letter from Independent Counsel prior to the executive session of the Board on May 15, 2019; |
| Other Information | 19 |
Table of Contents
State Street U.S. Equity V.I.S. Fund
Other Information — June 30, 2019 (Unaudited), continued
| • | Materials provided by Broadridge, circulated to the Independent Directors and to Independent Counsel; and |
| • | A summary of the foregoing materials prepared by Independent Counsel. |
In addition to the information identified above, the Board considered information provided from time to time by the Adviser, and other service providers of the Fund throughout the year at meetings of the Board and its committees. At such meetings, the Directors received, among other things, presentations by the portfolio managers and other investment professionals of the Adviser relating to the performance of the Fund and the investment strategies used in pursuing the Fund’s investment objective.
The Independent Directors were assisted throughout the contract review process by their Independent Counsel. The Independent Directors relied upon the advice of such counsel and their own business judgment in determining the material factors to be considered in evaluating the Agreement, and the weight to be given to each such factor. The conclusions reached with respect to the Agreement were based on a comprehensive evaluation of all the information provided and not any single factor. Moreover, each Director may have placed varying emphasis on particular factors in reaching conclusions with respect to the Fund.
Results of the Process
Based on a consideration of the foregoing and such other information as deemed relevant, including the factors and conclusions described below, on May 15, 2019 the Board, including a majority of the Independent Directors, voted to approve the continuation of the Agreement effective June 1, 2019, for an additional year with respect to the Fund.
Nature, Extent and Quality of Services
In considering whether to approve the Agreement, the Board evaluated the nature, extent and quality of services provided to the Fund by the Adviser.
The Board considered the Adviser’s management capabilities and investment process with respect to the types of investments held by the Fund, including the education, experience and number of investment professionals and other personnel who provide portfolio management, investment research, and similar services to the Fund. The Board evaluated the abilities and experience of such investment personnel in analyzing particular markets, industries and specific issuers of securities in these markets and industries. The Board also considered the substantial expertise of the Adviser in developing and applying proprietary quantitative models for managing the Fund The Board considered the extensive experience and resources committed by the Adviser to risk management, including with respect to investment risk, liquidity risk, operational risk, counterparty risk and model risk. The Directors also considered the significant risks assumed by the Adviser in connection with the services provided to the Fund, including reputational and entrepreneurial risks. The Board also took into account the compensation paid to recruit and retain investment personnel, and the time and attention devoted to the Fund by senior management.
The Board had previously reviewed the compliance programs of SSGA FM and various affiliated service providers. Among other things, the Board considered compliance and reporting matters relating to personal trading by investment personnel, selective disclosure of portfolio holdings, late trading, frequent trading, portfolio valuation, business continuity, the allocation of investment opportunities and the voting of proxies.
On the basis of the foregoing and other relevant information, the Board concluded that the Adviser can be expected to continue to provide high quality investment management and related services for the Fund.
Fund Performance
The Board compared the Fund’s investment performance to the performance of an appropriate benchmark and universe of comparable mutual funds for various time periods ended December 31, 2018. For purposes of these comparisons the Independent Directors relied extensively on the Performance Group, Performance Universe and Lipper Index and the analyses of the related data provided by Broadridge. Among other information, the Board considered the following performance information in its evaluation of the Fund:
State Street U.S. Equity V.I.S. Fund.The Board considered that the Fund’s performance was below the median of its Performance Group for the3-,5- and10-year periods and the median of its Performance Universe for the5- and10-year periods and below its Lipper Index for the5- and10-year periods. The Board also considered that the Fund’s performance was above the median of the Performance Group for the1-year period and the Performance Universe for the1- and3-year periods and above the Lipper Index for the1- and3-year periods. The Board took into account management’s discussion of the Fund’s performance.
| 20 | Other Information |
Table of Contents
State Street U.S. Equity V.I.S. Fund
Other Information — June 30, 2019 (Unaudited), continued
On the basis of the foregoing and other relevant information, the Board concluded that the performance of the Fund is satisfactory.
Management Fees and Expenses
The Board reviewed the contractual investment advisory fee rates payable by the Fund and actual fees paid by the Fund. As part of its review, the Board considered the Fund’s management fee and total expense ratio, including the portion attributable to administrative services provided by SSGA FM (both before and after giving effect to any expense caps), as compared to its Expense Group and Expense Universe, as constructed by Broadridge, and the related Broadridge analysis for the Fund. The Board also considered the comparability of the fees charged and the services provided to the Fund by the Adviser to the fees charged and services provided to other clients of the Adviser, including institutional accounts, as applicable. Among other information, the Board considered the following expense information in its evaluation of the Fund:
State Street U.S. Equity V.I.S. Fund.The Board considered that the Fund’s actual management fee was below the medians of its Expense Group and Expense Universe. The Board also considered that the Fund’s total expenses were below the median of its Expense Group and above the median of its Expense Universe. The Board considered management’s discussion of the Fund’s expenses.
On the basis of the foregoing and other relevant information, and in light of the nature, extent and quality of the services provided by the Adviser, the Board concluded that the fees and the expense ratio of the Fund compare favorably to the fees and expenses of the Expense Group and Expense Universe and are reasonable in relation to the services provided.
Profitability
The Board reviewed the level of profits realized by the Adviser and its affiliates in providing investment advisory and other services to the Fund and to all funds within the fund complex. The Board considered other direct and indirect benefits received by SSGA FM and Affiliated Service Providers in connection with their relationships with the Fund, including soft dollar commission benefits generated through Fund portfolio transactions. The Board further considered the profitability of each of the Affiliated Service Providers with respect to their services to the Fund and/or fund complex. The Board also considered the various risks borne by SSGA FM and State Street in connection with their various roles in servicing the Fund, including reputational and entrepreneurial risks.
The Board concluded that the profitability of the Adviser with respect to the Fund, and the profitability range of each of the Affiliated Service Providers with respect to its services to the Fund, were reasonable in relation to the services provided.
Economies of Scale
In reviewing management fees and profitability, the Board also considered the extent to which the Adviser and its affiliates, on the one hand, and the Fund and the fund complex, on the other hand, can expect to realize benefits from economies of scale as the assets of the Fund and fund complex increase. The Board acknowledged the difficulty in accurately measuring the benefits resulting from the economies of scale with respect to the management of the Fund or the fund complex taken as a whole. The Board concluded that, in light of the current size of the Fund and the fund complex, the level of profitability of the Adviser and its affiliates with respect to the Fund and the fund complex over various time periods, and the comparative management fee and expense ratio of the Fund during these periods, it does not appear that the Adviser or its affiliates has realized benefits from economies of scale in managing the assets of the Fund to such an extent that previously agreed advisory fees should be reduced or that breakpoints in such fees should be implemented for the Fund at this time.
Conclusions
In reaching its decision to approve the Agreement, the Board did not identify any single factor as being controlling, but based its recommendation on each of the factors it considered. Each Director may have contributed different weight to the various factors. Based upon the materials reviewed, the representations made and the considerations described above, and as part of its deliberations, the Board, including the Independent Directors, concluded that the Adviser possesses the capability and resources to perform the duties required of it under the Agreement.
Further, based upon its review of the Agreement, the materials provided, and the considerations described above, the Board, including the Independent Directors, concluded that (1) the terms of the Advisory Agreement are reasonable, fair, and in the best interests of the Fund and its shareholders, and (2) the rates payable under the Advisory Agreement are fair and reasonable in light of the usual and customary charges made for services of the same nature and quality.
| Other Information | 21 |
Table of Contents
Directors
Michael F. Holland, Co-Chairperson
Patrick J. Riley, Co-Chairperson
John R. Costantino
Donna M. Rapaccioli
Michael A. Jessee
Richard D. Shirk
Rina K. Spence
Jeanne M. La Porta
Ellen M. Needham
Officers
Jeanne M. La Porta, President
Brian Harris, Chief Compliance Officer, Anti-Money Laundering Officer and Code of Ethics Compliance Officer
Sean O’Malley, Chief Legal Officer
Bruce S. Rosenberg, Treasurer
Ann M. Carpenter, Vice President and Deputy Treasurer
Chad C. Hallett, Deputy Treasurer
Arthur A. Jensen, Deputy Treasurer
Darlene Anderson-Vasquez, Deputy Treasurer
Sujata Upreti, Assistant Treasurer
Daniel Foley, Assistant Treasurer
Andrew DeLorme, Secretary
James Goundrey, Assistant Secretary
Kevin Morris, Assistant Secretary
David Urman, Assistant Secretary
Investment Adviser and Administrator
SSGA Funds Management, Inc.
One Iron Street
Boston, MA 02210
Custodian and Sub-Administrator
State Street Bank and Trust Company
One Lincoln Street
Boston, Massachusetts 02111
Distributor
State Street Global Advisors Funds Distributors, LLC
One Iron Street
Boston, MA 02210
Independent Registered Public Accounting Firm
Ernst & Young LLP
200 Clarendon Street
Boston, Massachusetts 02116
Table of Contents
Semi-Annual Report
June 30, 2019
State Street Premier Growth Equity V.I.S. Fund
Beginning on January 1, 2021, as permitted by regulations adopted by the U.S. Securities and Exchange Commission, paper copies of a Fund’s annual and semi-annual shareholder reports will no longer be sent by mail, unless you specifically request paper copies of the reports. Instead, the reports will be made available on a Fund’s website (www.ssga.com/geam), and you will be notified by mail each time a report is posted, and provided with a website link to access the report. If you already elected to receive shareholder reports electronically, you will not be affected by this change and you need not take any action.
You may elect to receive all future reports in paper free of charge. To do so, contact your Insurance Provider. Your election to receive reports in paper will apply to all funds held in your account.

Table of Contents
State Street Premier Growth Equity V.I.S. Fund
Semi-Annual Report
June 30, 2019 (Unaudited)
| Page | ||||
| Fund Information | 1 | |||
| Understanding Your Fund’s Expenses | 2 | |||
| Schedule of Investments | 3 | |||
| Financial Statements | ||||
| 6 | ||||
| 7 | ||||
| 8 | ||||
| 9 | ||||
| Notes to Financial Statements | 10 | |||
| Other Information | 15 | |||
This report is prepared for Policyholders of certain variable contracts and may be distributed to others only if preceded or accompanied by the variable contract’s current prospectus and the current summary prospectus of the Fund available for investments thereunder.
Table of Contents
State Street Premier Growth Equity V.I.S. Fund
Fund Information — June 30, 2019 (Unaudited)
Total return performance shown in this report for the Fund takes into account changes in share price and assumes reinvestment of dividends and capital gains distributions, if any. Total returns shown are net of Fund fees and expenses but do not reflect fees and charges associated with the variable contracts such as administrative fees, account charges and surrender charges, which, if reflected, would reduce the Fund’s total returns for all periods shown.
The performance data quoted represents past performance; past performance does not guarantee future results. Investment return and principal value will fluctuate so your shares, when redeemed, may be worth more or less than their original cost. Current performance may be higher or lower than the performance data quoted. Periods less than one year are not annualized. Please call toll-free (800) 242-0134 or visit the Fund’s website at http://www.ssga.com/geam for the most recent month-end performance data.
An investment in the Fund is not a deposit of any bank and is not insured or guaranteed by the Federal Deposit Insurance Corporation (“FDIC”) or any other government agency. An investment in the Fund is subject to risk, including possible loss of principal invested.
Sector Allocation
Portfolio Composition as a % of Fair Value of $34,008 (in thousands) as of June 30, 2019(a)(b)
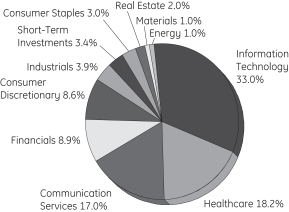
Top Ten Largest Holdings
as of June 30, 2019 (as a % of Fair Value)(a)(b)
Microsoft Corp. | 8.47 | % | ||
Apple Inc. | 5.65 | % | ||
Amazon.com Inc. | 5.10 | % | ||
Visa Inc., Class A | 4.94 | % | ||
Alphabet Inc., Class C | 4.44 | % | ||
The Walt Disney Co. | 3.51 | % | ||
salesforce.com Inc. | 3.48 | % | ||
Applied Materials Inc. | 3.43 | % | ||
Facebook Inc., Class A | 3.35 | % | ||
United Rentals Inc. | 3.24 | % | ||
| (a) | Fair Value basis is inclusive of short-term investment in State Street Institutional U.S. Government Money Market Fund Class G Shares. |
| (b) | The securities information regarding holdings, allocations and other characteristics is presented to illustrate examples of securities that the Fund has bought and the diversity of areas in which the Fund may invest as of a particular date. It may not be representative of the Fund’s current or future investments and should not be construed as a recommendation to purchase or sell a particular security. |
State Street Global Advisors Funds Distributors, LLC, member of FINRA & SIPC is the principal underwriter and distributor of the State Street V.I.S. Funds and an indirect wholly-owned subsidiary of State Street Corporation. References to State Street may include State Street Corporation and its affiliates. The Funds pay State Street Bank and Trust Company for its services as custodian and Fund Accounting agent, and pay SSGA Funds Management, Inc. for investment advisory and administrative services.
| State Street Premier Growth Equity V.I.S. Fund | 1 |
Table of Contents
State Street Premier Growth Equity V.I.S. Fund
Understanding Your Fund’s Expenses — June 30, 2019 (Unaudited)
As a shareholder of the Fund, you incur ongoing costs. Ongoing costs include portfolio management fees, professional fees, administrative fees and other Fund expenses. The following example is intended to help you understand your ongoing costs (in dollars) of investing in the Fund and to compare these costs with the ongoing costs of investing in other mutual funds.
To illustrate these ongoing costs, we have provided an example and calculated the expenses paid by investors in the Fund during the period. The information in the following table is based on an investment of $1,000, which is invested at the beginning of the period and held for the entiresix-month period ended June 30, 2019.
Actual Expenses
The first section of the table provides information about actual account values and actual expenses. You may use the information in this section, together with the amount you invested, to estimate the expenses that you paid over the period. To do so, simply divide your account value by $1,000 (for example, an $8,600 account value divided by $1,000 = 8.6), then multiply the result by the number given under the heading “Expenses paid during the period” to estimate the expenses you paid on your account during the period.
Hypothetical Example for Comparison Purposes
The second section of the table provides information about hypothetical account values and hypothetical expenses based on the Fund’s actual expense ratio and an assumed rate of return of 5% per year before expenses, which is not the Fund’s actual return. The hypothetical account values and expenses may not be used to estimate the actual ending account balance or expenses you paid for the period. You may use this information to compare the ongoing costs of investing in the Fund and other funds. To do so, compare this 5% hypothetical example with the 5% hypothetical examples that appear in the shareholder reports of other funds.
Please note that the expenses shown in the table are meant to highlight and help you compare ongoing costs only and do not reflect transaction costs, such as sales charges or redemption fees, if any. Therefore, the second section of the table is useful in comparing ongoing costs only, and will not help you determine the relative total costs of owning different funds. Additionally, the expenses shown do not reflect the fees or charges associated with variable contracts through which shares of the Fund are offered.
| Actual Fund Return | Hypothetical 5% Return (2.5% for the period) | |||||||
Actual Fund Return | ||||||||
Beginning Account Value January 1, 2019 | $ | 1,000.00 | $ | 1,000.00 | ||||
Ending Account Value June 30, 2019 | $ | 1,215.10 | $ | 1,020.23 | ||||
Expenses Paid During Period* | $ | 5.05 | $ | 4.61 | ||||
| * | Expenses are equal to the Fund’s annualized expense ratio of 0.92% (for the period January 1, 2019-June 30, 2019), multiplied by the average account value over the period, multiplied by 181/365 (to reflect theone-half year period). |
| 2 | State Street Premier Growth Equity V.I.S. Fund |
Table of Contents
State Street Premier Growth Equity V.I.S. Fund
Schedule of Investments — June 30, 2019 (Unaudited)
| Number of Shares | Fair $ | |||||||
| Common Stock - 96.6%† |
| |||||||
Application Software - 3.5% |
| |||||||
salesforce.com Inc. (a) | 7,798 | 1,183,191 | ||||||
|
| |||||||
Biotechnology - 5.3% |
| |||||||
Alexion Pharmaceuticals Inc. (a) | 7,463 | 977,504 | ||||||
Vertex Pharmaceuticals Inc. (a) | 4,479 | 821,359 | ||||||
|
| |||||||
| 1,798,863 | ||||||||
|
| |||||||
Cable & Satellite - 4.1% |
| |||||||
Charter Communications Inc., Class A (a) | 2,371 | 936,972 | ||||||
Liberty Global PLC, Class C (a) | 17,559 | 465,840 | ||||||
|
| |||||||
| 1,402,812 | ||||||||
|
| |||||||
Data Processing & Outsourced Services - 6.3% |
| |||||||
Mastercard Inc., Class A | 1,805 | 477,477 | ||||||
Visa Inc., Class A | 9,672 | 1,678,575 | ||||||
|
| |||||||
| 2,156,052 | ||||||||
|
| |||||||
Electronic Components - 2.2% |
| |||||||
Corning Inc. | 22,080 | 733,718 | ||||||
|
| |||||||
Financial Exchanges & Data - 5.2% |
| |||||||
CME Group Inc. | 4,750 | 922,022 | ||||||
S&P Global Inc. | 3,664 | 834,623 | ||||||
|
| |||||||
| 1,756,645 | ||||||||
|
| |||||||
Healthcare Equipment - 5.7% |
| |||||||
Abbott Laboratories | 4,269 | 359,023 | ||||||
Boston Scientific Corp. (a) | 22,985 | 987,895 | ||||||
Intuitive Surgical Inc. (a) | 1,130 | 592,742 | ||||||
|
| |||||||
| 1,939,660 | ||||||||
|
| |||||||
Interactive Media & Services - 9.4% |
| |||||||
Alphabet Inc., Class A (a) | 499 | 540,317 | ||||||
Alphabet Inc., Class C (a) | 1,397 | 1,510,032 | ||||||
Facebook Inc., Class A (a) | 5,900 | 1,138,700 | ||||||
|
| |||||||
| 3,189,049 | ||||||||
|
| |||||||
Internet & Direct Marketing Retail - 8.6% |
| |||||||
Alibaba Group Holding Ltd. ADR (a)(b) | 3,390 | 574,435 | ||||||
Amazon.com Inc. (a) | 916 | 1,734,566 | ||||||
Booking Holdings Inc. (a)(b) | 329 | 616,780 | ||||||
|
| |||||||
| 2,925,781 | ||||||||
|
| |||||||
Investment Banking & Brokerage - 1.9% |
| |||||||
The Charles Schwab Corp. | 16,548 | 665,064 | ||||||
|
| |||||||
Managed Healthcare - 3.0% |
| |||||||
UnitedHealth Group Inc. | 4,125 | 1,006,541 | ||||||
|
| |||||||
| Number of Shares | Fair $ | |||||||
Movies & Entertainment - 3.5% |
| |||||||
The Walt Disney Co. | 8,551 | 1,194,062 | ||||||
|
| |||||||
Oil & Gas Equipment & Services - 1.0% |
| |||||||
Schlumberger Ltd. (b) | 8,242 | 327,537 | ||||||
|
| |||||||
Pharmaceuticals - 4.3% |
| |||||||
Allergan PLC | 6,144 | 1,028,690 | ||||||
Elanco Animal Health Inc. (a) | 12,632 | 426,962 | ||||||
|
| |||||||
| 1,455,652 | ||||||||
|
| |||||||
Regional Banks - 1.8% |
| |||||||
First Republic Bank | 6,271 | 612,363 | ||||||
|
| |||||||
Semiconductor Equipment - 4.7% |
| |||||||
Applied Materials Inc. | 25,981 | 1,166,807 | ||||||
ASML Holding N.V. | 2,151 | 447,257 | ||||||
|
| |||||||
| 1,614,064 | ||||||||
|
| |||||||
Soft Drinks - 3.0% |
| |||||||
PepsiCo Inc. | 7,831 | 1,026,879 | ||||||
|
| |||||||
Specialized REITs - 2.0% |
| |||||||
American Tower Corp. | 3,272 | 668,960 | ||||||
|
| |||||||
Specialty Chemicals - 1.0% |
| |||||||
Albemarle Corp. | 4,762 | 335,292 | ||||||
|
| |||||||
Systems Software - 10.7% |
| |||||||
Microsoft Corp. | 21,513 | 2,881,881 | ||||||
ServiceNow Inc. (a) | 2,712 | 744,634 | ||||||
|
| |||||||
| 3,626,515 | ||||||||
|
| |||||||
Technology Hardware, Storage & Peripherals - 5.6% |
| |||||||
Apple Inc. | 9,706 | 1,921,012 | ||||||
|
| |||||||
Trading Companies & Distributors - 3.2% |
| |||||||
United Rentals Inc. (a) | 8,321 | 1,103,614 | ||||||
|
| |||||||
Trucking - 0.6% |
| |||||||
Lyft Inc., Class A (a) | 3,199 | 210,206 | ||||||
|
| |||||||
| Total Common Stock (Cost $20,180,406) |
| 32,853,532 | ||||||
|
| |||||||
| Short-Term Investments - 3.4% |
| |||||||
State Street Institutional U.S. Government Money Market Fund - Class G Shares 2.35% | 1,154,726 | 1,154,726 | ||||||
|
| |||||||
| Total Investments (Cost $21,335,132) |
| 34,008,258 | ||||||
| Other Assets and Liabilities, net - 0.0% |
| 3,799 | ||||||
|
| |||||||
| NET ASSETS - 100.0% |
| 34,012,057 | ||||||
|
| |||||||
See Notes to Schedule of Investments and Notes to Financial Statements.
| State Street Premier Growth Equity V.I.S. Fund | 3 |
Table of Contents
State Street Premier Growth Equity V.I.S. Fund
Schedule of Investments, continued — June 30, 2019 (Unaudited)
Other Information:
The Fund had the following long futures contracts open at June 30, 2019:
| Description | Expiration date | Number of Contracts | Notional Amount | Value | Unrealized Appreciation | |||||||||||||||
S&P 500 Emini Index Futures | September 2019 | 3 | $ | 439,319 | $ | 441,630 | $ | 2,311 | ||||||||||||
|
| |||||||||||||||||||
During the period ended June 30, 2019, average notional values related to long and short futures contracts was $262,643 and $38,164, respectively.
See Notes to Schedule of Investments and Notes to Financial Statements.
| 4 | State Street Premier Growth Equity V.I.S. Fund |
Table of Contents
State Street Premier Growth Equity V.I.S. Fund
Notes to Schedule of Investments — June 30, 2019 (Unaudited)
The views expressed in this document reflect our judgment as of the publication date and are subject to change at any time without notice. The securities cited may not be representative of the Fund’s future investments and should not be construed as a recommendation to purchase or sell a particular security. See the Fund’s summary prospectus and statutory prospectus for complete descriptions of investment objectives, policies, risks and permissible investments.
| (a) | Non-income producing security. |
| (b) | At June 30, 2019, all or a portion of this security was pledged to cover collateral requirements for futures. |
| (c) | Coupon amount represents effective yield. |
| (d) | Sponsored by SSGA Funds Management, Inc., the Fund’s investment adviser and administrator, and an affiliate of State Street Bank & Trust Co., the Funds’sub-administrator, custodian and accounting agent. |
| † | Percentages are based on net assets as of June 30, 2019. |
Abbreviations:
ADR - American Depositary Receipt
REIT - Real Estate Investment Trust
The following table represents the Fund’s investments measured at fair value on a recurring basis at June 30, 2019:
| Investments | Level 1 | Level 2 | Level 3 | Total | ||||||||||||
Investments in Securities |
| |||||||||||||||
Common Stock | $ | 32,853,532 | $ | — | $ | — | $ | 32,853,532 | ||||||||
Short-Term Investments | 1,154,726 | — | — | 1,154,726 | ||||||||||||
|
|
|
|
|
|
|
| |||||||||
Total Investments in Securities | $ | 34,008,258 | $ | — | $ | — | $ | 34,008,258 | ||||||||
|
| �� |
|
|
|
|
|
| ||||||||
Other Financial Instruments |
| |||||||||||||||
Long Futures Contracts - Unrealized Appreciation | $ | 2,311 | $ | — | $ | — | $ | 2,311 | ||||||||
|
|
|
|
|
|
|
| |||||||||
Affiliate Table
| Number of Shares Held at 12/31/18 | Value At 12/31/18 | Cost of Purchases | Proceeds from Shares Sold | Number of Shares Held at 6/30/19 | Value at 6/30/19 | Dividend Income | ||||||||||||||||||||||
State Street Institutional U.S. Government Money Market Fund - Class G Shares | 311,364 | $ | 311,364 | $ | 4,452,164 | $ | 3,608,802 | 1,154,726 | $ | 1,154,726 | $ | 8,898 | ||||||||||||||||
See Notes to Schedule of Investments and Notes to Financial Statements.
| State Street Premier Growth Equity V.I.S. Fund | 5 |
Table of Contents
State Street Premier Growth Equity V.I.S. Fund
Selected data based on a share outstanding throughout the periods indicated
| 6/30/19† | 12/31/18 | 12/31/17 | 12/31/16 | 12/31/15* | 12/31/14* | |||||||||||||||||||
| Inception date | 12/12/97 | |||||||||||||||||||||||
Net asset value, beginning of period | $ | 82.51 | $ | 99.23 | $ | 86.08 | $ | 94.07 | $ | 106.58 | $ | 107.84 | ||||||||||||
|
|
|
|
|
|
|
|
|
|
|
| |||||||||||||
Income/(loss) from investment operations: |
| |||||||||||||||||||||||
Net investment income (loss) | (0.00 | )(a)(b) | 0.12 | (a) | 0.32 | (a) | 0.50 | 0.52 | 0.63 | |||||||||||||||
Net realized and unrealized gains/(losses) on investments | 17.75 | (2.88 | ) | 24.10 | 1.90 | 3.25 | 14.71 | |||||||||||||||||
|
|
|
|
|
|
|
|
|
|
|
| |||||||||||||
Total income/(loss) from investment operations | 17.75 | (2.76 | ) | 24.42 | 2.40 | 3.77 | 15.34 | |||||||||||||||||
|
|
|
|
|
|
|
|
|
|
|
| |||||||||||||
Less distributions from: |
| |||||||||||||||||||||||
Net investment income | — | 0.15 | 0.34 | 0.48 | 0.53 | 0.58 | ||||||||||||||||||
Net realized gains | — | 13.81 | 10.93 | 9.91 | 15.75 | 16.02 | ||||||||||||||||||
|
|
|
|
|
|
|
|
|
|
|
| |||||||||||||
Total distributions | — | 13.96 | 11.27 | 10.39 | 16.28 | 16.60 | ||||||||||||||||||
|
|
|
|
|
|
|
|
|
|
|
| |||||||||||||
Net asset value, end of period | $ | 100.26 | $ | 82.51 | $ | 99.23 | $ | 86.08 | $ | 94.07 | $ | 106.58 | ||||||||||||
|
|
|
|
|
|
|
|
|
|
|
| |||||||||||||
Total Return(c) | 21.51 | % | (2.66 | )% | 28.34 | % | 2.47 | % | 3.30 | % | 14.05 | % | ||||||||||||
Ratios/Supplemental Data: |
| |||||||||||||||||||||||
Net assets, end of period (in thousands) | $ | 34,012 | $ | 30,369 | $ | 36,404 | $ | 33,219 | $ | 36,858 | $ | 39,944 | ||||||||||||
Ratios to average net assets: |
| |||||||||||||||||||||||
Net expenses | 0.92 | %** | 0.87 | % | 0.85 | % | 0.84 | % | 0.81 | % | 0.81 | %(d) | ||||||||||||
Gross expenses | 0.92 | %** | 0.87 | % | 0.85 | % | 0.84 | % | 0.81 | % | 0.81 | % | ||||||||||||
Net investment income | (0.00 | )%(e)** | 0.11 | % | 0.31 | % | 0.52 | % | 0.46 | % | 0.52 | % | ||||||||||||
Portfolio turnover rate | 12 | % | 27 | % | 21 | % | 22 | % | 19 | % | 19 | % | ||||||||||||
Notes to Financial Highlights
| (a) | Per share values have been calculated using the average shares method. |
| (b) | Rounds to less than $0.01. |
| (c) | Total returns are historical and assume changes in share price, reinvestment of dividends and capital gains distributions and do not include the effect of insurance contract charges. Past performance does not guarantee future results. |
| (d) | Includes contractual management fee waiver related to the Fund’s investments in the GE Institutional Money Market Fund (the “Money Market Fund”). The fee waiver agreement was terminated effective June 30, 2014 with the closure of the Money Market Fund. |
| (e) | Less than 0.005%. |
| † | Unaudited. |
| * | Beginning with the year ended December 31, 2016, the Fund was audited by Ernst & Young LLP. The previous years were audited by another independent registered public accounting firm. |
| ** | Annualized for periods less than one year. |
The accompanying Notes are an integral part of these financial statements.
| 6 | Financial Highlights |
Table of Contents
State Street Premier Growth Equity V.I.S. Fund
Statement of Assets and Liabilities — June 30, 2019 (Unaudited)
Assets | ||||
Investments in securities, at fair value (cost $20,180,406) | $ | 32,853,532 | ||
Short-term affiliated investments, at fair value | 1,154,726 | |||
Cash collateral on deposit with broker for future contracts | 25,592 | |||
Receivable for investments sold | 87,004 | |||
Income receivables | 9,180 | |||
Receivable for fund shares sold | 163 | |||
Income receivable from affiliated investments | 976 | |||
Receivable for accumulated variation margin on futures contracts | 2,318 | |||
|
| |||
Total assets | 34,133,491 | |||
|
| |||
Liabilities | ||||
Payable for fund shares redeemed | 82,219 | |||
Payable to the Adviser | 16,912 | |||
Payable for custody, fund accounting andsub-administration fees | 1,896 | |||
Accrued other expenses | 20,407 | |||
|
| |||
Total liabilities | 121,434 | |||
|
| |||
Net Assets | $ | 34,012,057 | ||
|
| |||
Net Assets Consist of: | ||||
Capital paid in | $ | 19,106,075 | ||
Total distributable earnings (loss) | 14,905,982 | |||
|
| |||
Net Assets | $ | 34,012,057 | ||
|
| |||
Shares outstanding ($0.01 par value; unlimited shares authorized) | 339,231 | |||
Net asset value per share | $ | 100.26 | ||
The accompanying Notes are an integral part of these financial statements.
| Statement of Assets and Liabilities | 7 |
Table of Contents
State Street Premier Growth Equity V.I.S. Fund
Statement of Operations — For the period ended June 30, 2019 (Unaudited)
Investment Income |
| |||
Income |
| |||
Dividend | $ | 143,049 | ||
Income from affiliated investments | 8,898 | |||
Less: Foreign taxes withheld | (490 | ) | ||
|
| |||
Total income | 151,457 | |||
|
| |||
Expenses |
| |||
Advisory and administration fees | 107,171 | |||
Directors’ fees | 8,829 | |||
Custody, fund accounting andsub-administration fees | 10,574 | |||
Professional fees | 16,678 | |||
Printing and shareholder reports | 6,206 | |||
Other expenses | 2,140 | |||
|
| |||
Total Expenses | 151,598 | |||
|
| |||
Net investment loss | $ | (141 | ) | |
|
| |||
Net Realized and Unrealized Gain (Loss) on Investments |
| |||
Realized gain (loss) on: |
| |||
Unaffiliated investments | $ | 2,114,923 | ||
Futures | (19,309 | ) | ||
Increase (decrease) in unrealized appreciation/depreciation on: |
| |||
Unaffiliated investments | 4,258,292 | |||
Futures | 3,161 | |||
|
| |||
Net realized and unrealized gain (loss) on investments | 6,357,067 | |||
|
| |||
Net Increase in Net Assets Resulting from Operations | $ | 6,356,926 | ||
|
| |||
The accompanying Notes are an integral part of these financial statements.
| 8 | Statement of Operations |
Table of Contents
State Street Premier Growth Equity V.I.S. Fund
Statements of Changes in Net Assets
Six Months Ended June 30, | Year Ended December 31, | |||||||
Increase (Decrease) in Net Assets |
| |||||||
Operations: |
| |||||||
Net investment income (loss) | $ | (141 | ) | $ | 40,859 | |||
Net realized gain (loss) on investments and futures | 2,095,614 | 4,399,877 | ||||||
Net increase (decrease) in unrealized appreciation/depreciation on investments and futures | 4,261,453 | (4,978,924 | ) | |||||
|
|
|
| |||||
Net increase (decrease) from operations | 6,356,926 | (538,188 | ) | |||||
|
|
|
| |||||
Distributions to shareholders: |
| |||||||
Total distributions | — | (4,400,219 | ) | |||||
|
|
|
| |||||
Increase (decrease) in assets from operations and distributions | 6,356,926 | (4,938,407 | ) | |||||
|
|
|
| |||||
Share transactions: |
| |||||||
Proceeds from sale of shares | 93,544 | 175,763 | ||||||
Value of distributions reinvested | — | 4,400,219 | ||||||
Cost of shares redeemed | (2,807,058 | ) | (5,672,877 | ) | ||||
|
|
|
| |||||
Net increase (decrease) from share transactions | (2,713,514 | ) | (1,096,895 | ) | ||||
|
|
|
| |||||
Total increase (decrease) in net assets | 3,643,412 | (6,035,302 | ) | |||||
Net Assets |
| |||||||
Beginning of period | 30,368,645 | 36,403,947 | ||||||
|
|
|
| |||||
End of period | $ | 34,012,057 | $ | 30,368,645 | ||||
|
|
|
| |||||
Changes in Fund Shares |
| |||||||
Shares sold | 996 | 1,683 | ||||||
Issued for distributions reinvested | — | 53,766 | ||||||
Shares redeemed | (29,827 | ) | (54,267 | ) | ||||
|
|
|
| |||||
Net increase (decrease) in fund shares | (28,831 | ) | 1,182 | |||||
|
|
|
| |||||
| * | Unaudited. |
The accompanying Notes are an integral part of these financial statements.
| Statements of Changes in Net Assets | 9 |
Table of Contents
State Street Premier Growth Equity V.I.S. Fund
Notes to Financial Statements — June 30, 2019 (Unaudited)
| 1. | Organization of the Company |
State Street Variable Insurance Series Funds, Inc. (the “Company”) was incorporated under the laws of the Commonwealth of Virginia on May 14, 1984 and is registered under the Investment Company Act of 1940, as amended (the “1940 Act”), as anopen-end management investment company. The Company is currently composed of the following seven investment portfolios (collectively, the “Funds”): State Street U.S. Equity V.I.S. Fund, State Street S&P 500 Index V.I.S. Fund, State Street Premier Growth Equity V.I.S. Fund (the “Fund”), State StreetSmall-Cap Equity V.I.S. Fund, State Street Total Return V.I.S. Fund, State Street Income V.I.S. Fund and State Street Real Estate Securities V.I.S. Fund. Each Fund is a diversified investment company within the meaning of the 1940 Act.
Shares of the Funds of the Company are offered only to insurance company separate accounts that fund certain variable life insurance contracts and variable annuity contracts.
The Company currently offers one share class (Class 1) of the Fund as an investment option for variable life insurance and variable annuity contracts.
Under the Company’s organizational documents, its officers and directors are indemnified against certain liabilities arising out of the performance of their duties to the Company. Additionally, in the normal course of business, the Company enters into contracts with service providers that contain general indemnification clauses. The Company’s maximum exposure under these arrangements is unknown as this would involve future claims that may be made against the Company that have not yet occurred.
| 2. | Summary of Significant Accounting Policies |
The following is a summary of significant accounting policies followed by the Company in the preparation of its financial statements:
The preparation of financial statements in accordance with U.S. generally accepted accounting principles (“U.S. GAAP”) requires management to make estimates and assumptions that affect the reported amounts and disclosures in the financial statements. Actual results could differ from those estimates. The Fund is an investment company under U.S. GAAP and follows the accounting and reporting guidance applicable to investment companies.
Security Valuation The Fund’s investments are valued at fair value each day that the New York Stock Exchange (“NYSE”) is open and, for financial reporting purposes, as of the report date should the reporting period end on a day that the NYSE is not open. Fair value is generally defined as the price a fund would receive to sell an asset or pay to transfer a liability in an orderly transaction between market participants at the measurement date. By its nature, a fair value price is a good faith estimate of the valuation in a current sale and may not reflect an actual market price. The investments of the Fund are valued pursuant to the policy and procedures developed by the Oversight Committee (the “Committee”) and approved by the Company’s Board of Directors (the “Board”). The Committee provides oversight of the valuation of investments for the Fund. The Board has responsibility for overseeing the determination of the fair value of investments.
Valuation techniques used to value the Fund’s investments by major category are as follows:
| • | Equity investments (including preferred stocks) traded on a recognized securities exchange for which market quotations are readily available are valued at the last sale price or official closing price, as applicable, on the primary market or exchange on which they trade. Equity investments traded on a recognized exchange for which there were no sales on that day are valued at the last published sale price or at fair value. |
| • | Investments in registered investment companies (including money market funds) or other unitized pooled investment vehicles that are not traded on an exchange are valued at that day’s published net asset value (“NAV”) per share or unit. |
| • | Exchange-traded futures contracts are valued at the closing settlement price on the primary market on which they are traded most extensively. Exchange-traded futures contracts traded on a recognized exchange for which there were no sales on that day are valued at the last reported sale price obtained from independent pricing services or brokers or at fair value. |
| 10 | Notes to Financial Statements |
Table of Contents
State Street Premier Growth Equity V.I.S. Fund
Notes to Financial Statements, continued — June 30, 2019 (Unaudited)
In the event prices or quotations are not readily available or that the application of these valuation methods results in a price for an investment that is deemed to be not representative of the fair value of such investment, fair value will be determined in good faith by the Committee, in accordance with the valuation policy and procedures approved by the Board.
The Fund values its assets and liabilities at fair value using a fair value hierarchy consisting of three broad levels that prioritize the inputs to valuation techniques giving the highest priority to readily available unadjusted quoted prices in active markets for identical assets or liabilities (Level 1 measurements) and the lowest priority to unobservable inputs (Level 3 measurements) when market prices are not readily available or reliable. The categorization of a value determined for an investment within the hierarchy is based upon the pricing transparency of the investment and is not necessarily an indication of the risk associated with investing in it.
The three levels of the fair value hierarchy are as follows:
| • | Level 1 — Unadjusted quoted prices in active markets for an identical asset or liability; |
| • | Level 2 — Inputs other than quoted prices included within Level 1 that are observable for the asset or liability either directly or indirectly, including quoted prices for similar assets or liabilities in active markets, quoted prices for identical or similar assets or liabilities in markets that are not considered to be active, inputs other than quoted prices that are observable for the asset or liability (such as exchange rates, financing terms, interest rates, yield curves, volatilities, prepayment speeds, loss severities, credit risks and default rates) or other market-corroborated inputs; and |
| • | Level 3 — Unobservable inputs for the asset or liability, including the Committee’s assumptions used in determining the fair value of investments. |
The value of the Fund’s investments according to the fair value hierarchy as of June 30, 2019 is disclosed in the Fund’s Schedule of Investments.
Investment Transactions and Income Recognition Investment transactions are accounted for on trade date for financial reporting purposes. Realized gains and losses from the sale or disposition of investments and foreign exchange transactions, if any, are determined using the identified cost method.
Dividend income and capital gain distributions, if any, are recognized on theex-dividend date, net of any foreign taxes withheld at source, if any.
Interest income is recorded daily on an accrual basis. All premiums and discounts are amortized/accreted for financial reporting purposes.
Non-cash dividends received in the form of stock are recorded as dividend income at fair value.
Expenses Certain expenses, which are directly identifiable to a specific Fund, are applied to the Fund within the Company. Other expenses which cannot be attributed to a specific Fund are allocated in such a manner as deemed equitable, taking into consideration the nature and type of expense and the relative net assets of the Fund within the Company.
Distributions The Fund declares and pays any dividends from net investment income annually.
Net realized capital gains, if any, are distributed annually, unless additional distributions are required for compliance with applicable tax regulations. The amount and character of income and capital gains to be distributed are determined in accordance with applicable tax regulations which may differ from net investment income and realized gains recognized for U.S. GAAP purposes.
| 3. | Derivative Financial Instruments |
Futures Contracts The Fund may enter into futures contracts to meet the Fund’s objectives. A futures contract is a standardized, exchange-traded agreement to buy or sell a financial instrument at a set price on a future date. Upon entering into a futures contract, the Fund is required to deposit with the broker, cash or securities in an amount equal to the minimum initial margin requirements of the clearing house. Subsequent payments are made or received by the Fund equal to the daily change in the contract value and are recorded as variation margin receivable or payable with a corresponding offset to unrealized gains or losses. The Fund recognizes a realized gain or loss when the contract is closed.
| Notes to Financial Statements | 11 |
Table of Contents
State Street Premier Growth Equity V.I.S. Fund
Notes to Financial Statements, continued — June 30, 2019 (Unaudited)
Losses may arise if the value of a futures contract decreases due to unfavorable changes in the market rates or values of the underlying instrument during the term of the contract or if the counterparty does not perform under the contract. The use of futures contracts also involves the risk that the movements in the price of the futures contracts do not correlate with the movement of the assets underlying such contracts.
For the period ended June 30, 2019, the Fund entered into futures contracts for cash equitization.
The following tables summarize the value of the Fund’s derivative instruments as of June 30, 2019 and the related location in the accompanying Statement of Assets and Liabilities and Statement of Operations, presented by primary underlying risk exposure:
Asset Derivatives
| Interest Rate Contracts Risk | Foreign Exchange Contracts Risk | Credit Contracts Risk | Equity Contracts Risk | Commodity Contracts Risk | Total | |||||||||||||||||||
State Street Premier Growth Equity V.I.S. Fund |
| |||||||||||||||||||||||
Futures Contracts | $ | — | $ | — | $ | — | $ | 2,318 | $ | — | $ | 2,318 | ||||||||||||
Realized Gain/Loss
| Interest Rate Contracts Risk | Foreign Exchange Contracts Risk | Credit Contracts Risk | Equity Contracts Risk | Commodity Contracts Risk | Total | |||||||||||||||||||
State Street Premier Growth Equity V.I.S. Fund |
| |||||||||||||||||||||||
Futures Contracts | $ | — | $ | — | $ | — | $ | (19,309 | ) | $ | — | $ | (19,309 | ) | ||||||||||
Net Change in Unrealized Appreciation (Depreciation)
| Interest Rate Contracts Risk | Foreign Exchange Contracts Risk | Credit Contracts Risk | Equity Contracts Risk | Commodity Contracts Risk | Total | |||||||||||||||||||
State Street Premier Growth Equity V.I.S. Fund |
| |||||||||||||||||||||||
Futures Contracts | $ | — | $ | — | $ | — | $ | 3,161 | $ | — | $ | 3,161 | ||||||||||||
| 4. | Fees and Transactions with Affiliates |
Advisory Fee SSGA Funds Management, Inc. (the “Adviser” or “SSGA FM”), a registered investment adviser, was retained by the Board to act as investment adviser and administrator of the Fund. SSGA FM’s compensation for investment advisory and administrative services (“Management Fee”) is paid monthly based on the average daily net assets of the Fund at an annualized rate of 0.65%.
Custody, Fund Accounting andSub-Administration Fees State Street Bank and Trust Company (“State Street”) serves as the custodian, fund accountant andsub-administrator to the Fund. Amounts paid by the Fund to State Street for performing such services are included as custody, fund accounting andsub-administration fees in the Statement of Operations.
Other Transactions with Affiliates The Fund may invest in affiliated entities, including securities issued by State Street Corporation, affiliated funds, or entities deemed to be affiliates as a result of the Fund owning more than five percent of the entity’s voting securities or outstanding shares. Amounts relating to these transactions during the period ended June 30, 2019 are disclosed in the Schedule of Investments.
| 5. | Directors’ Fees |
The fees and expenses of the Company’s directors who are not “interested persons” of the Company, as defined in the 1940 Act (“Independent Directors”), are paid directly by the Fund. The Independent Directors are reimbursed for travel and otherout-of-pocket expenses in connection with meeting attendance and industry seminars.
| 12 | Notes to Financial Statements |
Table of Contents
State Street Premier Growth Equity V.I.S. Fund
Notes to Financial Statements, continued — June 30, 2019 (Unaudited)
| 6. | Investment Transactions |
Purchases and sales of investments (excludingin-kind transactions, short term investments and derivative contracts) for the period ended June 30, 2019 were as follows:
| Non-U.S. Government Securities | ||||||||
| Purchases | Sales | |||||||
| $ | 3,845,648 | $ | 7,450,105 | |||||
| 7. | Income Taxes |
The Fund has qualified and intends to continue to qualify as a regulated investment company under Subchapter M of the Internal Revenue Code of 1986, as amended. The Fund will not be subject to federal income taxes to the extent it distributes its taxable income, including any net realized capital gains, for each fiscal year. Therefore, no provision for federal income tax is required.
The Fund files federal and various state and local tax returns as required. No income tax returns are currently under examination. Generally, the federal returns are subject to examination by the Internal Revenue Service for a period of three years from date of filing, while the state returns may remain open for an additional year depending upon jurisdiction. SSGA FM has analyzed the Fund’s tax positions taken on tax returns for all open years and does not believe there are any uncertain tax positions that would require recognition of a tax liability.
Distributions to shareholders are recorded onex-dividend date. Income dividends and gain distributions are determined in accordance with income tax rules and regulations, which may differ from generally accepted accounting principles.
As of June 30, 2019, gross unrealized appreciation and gross unrealized depreciation of investments and other financial instruments based on cost for federal income tax purposes were as follows:
| Tax Cost | Gross Unrealized Appreciation | Gross Unrealized Depreciation | Net Unrealized Appreciation (Depreciation) | |||||||||||||||
| $ | 21,335,132 | $ | 13,462,991 | $ | 787,554 | $ | 12,675,437 | |||||||||||
| 8. | Line of Credit |
The Fund and other affiliated funds (each, a “Participant” and collectively, the “Participants”) participate in a $500 million revolving credit facility provided by a syndication of banks under which the Participants may borrow to fund shareholder redemptions. This agreement expires in October 2019 unless otherwise extended or renewed.
The Participants are charged an annual commitment fee which is calculated based on the unused portion of the shared credit line. Commitment fees are allocated among each of the Participants based on relative net assets. Commitment fees are ordinary fund operating expenses. A Participant incurs and pays the interest expense related to its borrowing. Interest is calculated at a rate per annum equal to the sum of 1% plus the greater of the New York Fed Bank Rate and1-month LIBOR rate.
The Fund had no outstanding loans as of June 30, 2019.
| 9. | Risks |
Concentration Risk As a result of the Fund’s ability to invest a large percentage of its assets in obligations of issuers within the same country, state, region, currency or economic sector, an adverse economic, business or political development may affect the value of the Fund’s investments more than if the Fund were more broadly diversified.
Market and Credit Risk In the normal course of business, the Fund trades financial instruments and enters into financial transactions where risk of potential loss exists due to changes in the general economic conditions and fluctuations of the market (market risk). Additionally, the Fund may also be exposed to credit risk in the event that an issuer or guarantor fails to perform or that an institution or entity with which the Fund has unsettled or open transactions defaults.
| Notes to Financial Statements | 13 |
Table of Contents
State Street Premier Growth Equity V.I.S. Fund
Notes to Financial Statements, continued — June 30, 2019 (Unaudited)
| 10. | Subsequent Events |
Management has evaluated the impact of all subsequent events on the Fund through the date on which the financial statements were available to be issued and has determined that there were no subsequent events requiring adjustment or disclosure in the financial statements.
| 14 | Notes to Financial Statements |
Table of Contents
State Street Premier Growth Equity V.I.S. Fund
Other Information — June 30, 2019 (Unaudited)
Proxy Voting Policies and Procedures and Record
The Fund has adopted the proxy voting policies of SSGA FM. A description of the policies and procedures that the Fund has adopted to determine how to vote proxies relating to portfolio securities is available (i) without charge, upon request, by calling1-800-242-0134, (ii) on the Fund’s website at http://www.ssga.com/geam or (iii) on the SEC’s website at www.sec.gov. Information regarding how the Fund voted proxies, if any, during the most recent12-month period ended June 30 is available by August 31 of each year without charge (1) by calling1-800-242-0134 (toll free), and (2) on the website of the SEC at www.sec.gov.
Quarterly Portfolio Schedule
Following the Fund’s first and third fiscal quarter-ends, a complete schedule of investments is filed with the SEC as an exhibit to its reports on Form N-PORT, which can be found on the SEC’s website at www.sec.gov. The Fund’s schedule of investments are available upon request, without charge, by calling 1-800-242-0134 and on the Fund’s website at http://www.ssga.com/geam.
| Other Information | 15 |
Table of Contents
State Street Premier Growth Equity V.I.S. Fund
Other Information — June 30, 2019 (Unaudited), continued
Director Considerations in Approving Continuation of Investment Advisory Agreement1
Overview of the Contract Review Process
Under the Investment Company Act of 1940, as amended (the “1940 Act”), an investment advisory agreement between a mutual fund and its investment adviser may continue in effect from year to year only if its continuance is approved at least annually by the fund’s board of directors or its shareholders, and by a vote of a majority of those directors who are not “interested persons” of the fund (commonly referred to as, the “Independent Directors”) cast in person at a meeting called for the purpose of considering such approval.
Consistent with these requirements, the Board of Directors (the “Board”) of the State Street Variable Insurance Series Funds, Inc. (the “Company”) met in person on April 10, 2019 and May 15, 2019, including in executive sessions attended by the Independent Directors, to consider a proposal to approve, with respect to State Street Premier Growth Equity V.I.S. Fund (the “Fund”), the continuation of the investment advisory agreement (the “Advisory Agreement”) with SSGA Funds Management, Inc. (“SSGA FM” or the “Adviser”). Prior to voting on the proposal, the Independent Directors, as well as the Directors who are “interested persons” of the Adviser, reviewed information furnished by the Adviser and others reasonably necessary to permit the Board to evaluate the proposal fully. The Independent Directors were separately represented by counsel who are independent of the Adviser in connection with their consideration of approval of the Agreement. Following the April 10, 2019 meeting, the Independent Directors submitted questions and requests for additional information to management, and considered management’s responses thereto prior to and at the May 15, 2019 meeting. The Independent Directors considered, among other things, the following:
Information about Performance, Expenses and Fees
| • | A report prepared by an independent third-party provider of investment company data, which includes for the Fund: |
| ¡ | Comparisons of the Fund’s performance over the pastone-, three-, five- andten-year periods ended December 31, 2018, to the performance of an appropriate benchmark constructed by Broadridge Financial Solutions, Inc. (“Broadridge”) for the Fund (the “Lipper Index”) and a universe of other mutual funds with similar investment objectives and policies (the “Performance Group” and/or the “Performance Universe”); |
| ¡ | Comparisons of the Fund’s expense ratio (with detail of component expenses) to the expense ratios of a group of comparable mutual funds selected by the independent third-party data provider (the “Expense Group” and/or “Expense Universe”); |
| ¡ | A chart showing the Fund’s historical average net assets relative to its total expenses, management fees, andnon-management expenses over the past five calendar years; and |
| ¡ | Comparisons of the Fund’s contractual management fee to the contractual management fees of comparable mutual funds at different asset levels. |
| • | Comparative information concerning fees charged by the Adviser for managing institutional accounts using investment strategies and techniques similar to those used in managing the Fund; and |
| 16 | Other Information |
| 1 | The Independent Directors have identified numerous relevant issues, factors and concerns (“issues, factors and concerns”) that they consider each year in connection with the proposed continuation of the advisory agreement, the administration agreement, the distribution plans, the distribution agreement and various related-party service agreements (the “annual review process”). The statement of issues, factors and concerns and the related conclusions of the Independent Directors may not change substantially from year to year. However, the information requested by, and provided to, the Independent Directors with respect to the issues, factors and concerns and on which their conclusions are based is updated annually and, in some cases, may differ substantially from the previous year. The Independent Directors schedule annually a separatein-person meeting that is dedicated to the annual review process (the “special meeting”). At the special meeting and throughout the annual review process, the Independent Directors take a fresh look at each of the issues, factors and concerns in light of the latest available information and each year present one or more sets of comments and questions to management with respect to specific issues, factors and concerns. Management responds to such comments and questions to the satisfaction of the Independent Directors before the annual review process is completed and prior to the Independent Directors voting on proposals to approve continuation of the agreements and plans. |
Table of Contents
State Street Premier Growth Equity V.I.S. Fund
Other Information — June 30, 2019 (Unaudited), continued
| • | Profitability analyses for (a) the Adviser with respect to the Fund and (b) affiliates of SSGA FM that provide services to the Fund (“Affiliated Service Providers”). |
Information about Portfolio Management
| • | Descriptions of the investment management services provided by the Adviser, including its investment strategies and processes; |
| • | Information concerning the allocation of brokerage; and |
| • | Information regarding the procedures and processes used to value the assets of the Fund. |
Information about the Adviser
| • | Reports detailing the financial results and condition of SSGA FM and its affiliates; |
| • | Descriptions of the qualifications, education and experience of the individual investment and other professionals responsible for managing the portfolio of the Fund and for Fund operations; |
| • | Information relating to compliance with and the administration of the Code of Ethics adopted by the Adviser; |
| • | Information about the Adviser’s proxy voting policies and procedures and information regarding the Adviser’s practices for overseeing proxy vendors; |
| • | Information concerning the resources devoted by the Adviser to overseeing compliance by the Fund and its service providers, including information concerning compliance with investment policies and restrictions and other operating policies of the Fund; |
| • | A description of the adequacy and sophistication of the Adviser’s technology and systems with respect to investment and administrative matters and a description of any material improvements or changes in technology or systems in the past year; |
| • | A description of the business continuity and disaster recovery plans of the Adviser; and |
| • | Information regarding the Adviser’s risk management processes. |
Other Relevant Information
| • | Information concerning the nature, extent, quality and cost of services provided to the Fund by SSGA FM in its capacity as the Fund’s administrator (the “Administrator”); |
| • | Information concerning the nature, extent, quality and cost of variousnon-investment management services provided to the Fund by affiliates of the Adviser, including the custodian,sub-administrator and fund accountant of the Fund, and the role of the Adviser in managing the Fund’s relationship with these service providers; |
| • | Copies of the Advisory Agreement and agreements with other service providers of the Fund; |
| • | Draft responses to a letter from independent legal counsel to the Independent Directors (“Independent Counsel”), reviewed prior to such date by Independent Counsel, requesting specific information from each of: |
| ¡ | SSGA FM, in its capacity as the Fund’s Adviser and Administrator, with respect to its operations relating to the Fund and its approximate profit margins from such operations for the calendar year ended December 31, 2018; and the relevant operations of other affiliated service providers to the Fund, together with their approximate profit margins from such relevant operations for the calendar year ended December 31, 2018; |
| ¡ | State Street Bank and Trust Company (“State Street”), thesub-administrator, custodian, and fund accountant for the Fund, with respect to its operations relating to the Fund; and |
| ¡ | State Street Global Advisors Funds Distributors, LLC, the principal underwriter and distributor of the shares of the Fund (the “Distributor”), with respect to its operations relating to the Fund, together with the Fund’s related distribution plans and arrangements under Rule12b-1 of the 1940 Act; |
| • | Information from SSGA FM, State Street and the Distributor with respect to the Fund providing any material changes to the previous information supplied in response to the letter from Independent Counsel prior to the executive session of the Board on May 15, 2019; |
| Other Information | 17 |
Table of Contents
State Street Premier Growth Equity V.I.S. Fund
Other Information — June 30, 2019 (Unaudited), continued
| • | Materials provided by Broadridge, circulated to the Independent Directors and to Independent Counsel; and |
| • | A summary of the foregoing materials prepared by Independent Counsel. |
In addition to the information identified above, the Board considered information provided from time to time by the Adviser, and other service providers of the Fund throughout the year at meetings of the Board and its committees. At such meetings, the Directors received, among other things, presentations by the portfolio managers and other investment professionals of the Adviser relating to the performance of the Fund and the investment strategies used in pursuing the Fund’s investment objective.
The Independent Directors were assisted throughout the contract review process by their Independent Counsel. The Independent Directors relied upon the advice of such counsel and their own business judgment in determining the material factors to be considered in evaluating the Agreement, and the weight to be given to each such factor. The conclusions reached with respect to the Agreement were based on a comprehensive evaluation of all the information provided and not any single factor. Moreover, each Director may have placed varying emphasis on particular factors in reaching conclusions with respect to the Fund.
Results of the Process
Based on a consideration of the foregoing and such other information as deemed relevant, including the factors and conclusions described below, on May 15, 2019 the Board, including a majority of the Independent Directors, voted to approve the continuation of the Agreement effective June 1, 2019, for an additional year with respect to the Fund.
Nature, Extent and Quality of Services
In considering whether to approve the Agreement, the Board evaluated the nature, extent and quality of services provided to the Fund by the Adviser.
The Board considered the Adviser’s management capabilities and investment process with respect to the types of investments held by the Fund, including the education, experience and number of investment professionals and other personnel who provide portfolio management, investment research, and similar services to the Fund. The Board evaluated the abilities and experience of such investment personnel in analyzing particular markets, industries and specific issuers of securities in these markets and industries. The Board also considered the substantial expertise of the Adviser in developing and applying proprietary quantitative models for managing the Fund. The Board considered the extensive experience and resources committed by the Adviser to risk management, including with respect to investment risk, liquidity risk, operational risk, counterparty risk and model risk. The Directors also considered the significant risks assumed by the Adviser in connection with the services provided to the Fund, including reputational and entrepreneurial risks. The Board also took into account the compensation paid to recruit and retain investment personnel, and the time and attention devoted to the Fund by senior management.
The Board had previously reviewed the compliance programs of SSGA FM and various affiliated service providers. Among other things, the Board considered compliance and reporting matters relating to personal trading by investment personnel, selective disclosure of portfolio holdings, late trading, frequent trading, portfolio valuation, business continuity, the allocation of investment opportunities and the voting of proxies.
On the basis of the foregoing and other relevant information, the Board concluded that the Adviser can be expected to continue to provide high quality investment management and related services for the Fund.
Fund Performance
The Board compared the Fund’s investment performance to the performance of an appropriate benchmark and universe of comparable mutual funds for various time periods ended December 31, 2018. For purposes of these comparisons the Independent Directors relied extensively on the Performance Group, Performance Universe and Lipper Index and the analyses of the related data provided by Broadridge. Among other information, the Board considered the following performance information in its evaluation of the Fund:
State Street Premier Growth Equity V.I.S. Fund. The Board considered that the Fund’s performance was below the medians of its Performance Group and Performance Universe for the1-,3-,5- and10-year periods and below its Lipper Index for the1-,3-,5- and10-year periods. The Board took into account management’s discussion of the Fund’s performance.
| 18 | Other Information |
Table of Contents
State Street Premier Growth Equity V.I.S. Fund
Other Information — June 30, 2019 (Unaudited), continued
On the basis of the foregoing and other relevant information, the Board concluded that the performance of the Fund is satisfactory.
Management Fees and Expenses
The Board reviewed the contractual investment advisory fee rates payable by the Fund and actual fees paid by the Fund. As part of its review, the Board considered the Fund’s management fee and total expense ratio, including the portion attributable to administrative services provided by SSGA FM (both before and after giving effect to any expense caps), as compared to its Expense Group and Expense Universe, as constructed by Broadridge, and the related Broadridge analysis for the Fund. The Board also considered the comparability of the fees charged and the services provided to the Fund by the Adviser to the fees charged and services provided to other clients of the Adviser, including institutional accounts, as applicable. Among other information, the Board considered the following expense information in its evaluation of the Fund:
State Street Premier Growth Equity V.I.S. Fund. The Board considered that the Fund’s actual management fee was equal to the median of its Expense Group and below the median of its Expense Universe. The Board also considered that the Fund’s total expenses were above the medians of its Expense Group and Expense Universe. The Board considered management’s discussion of the Fund’s expenses.
On the basis of the foregoing and other relevant information, and in light of the nature, extent and quality of the services provided by the Adviser, the Board concluded that the fees and the expense ratio of the Fund compare favorably to the fees and expenses of the Expense Group and Expense Universe and are reasonable in relation to the services provided.
Profitability
The Board reviewed the level of profits realized by the Adviser and its affiliates in providing investment advisory and other services to the Fund and to all funds within the fund complex. The Board considered other direct and indirect benefits received by SSGA FM and Affiliated Service Providers in connection with their relationships with the Fund, including soft dollar commission benefits generated through Fund portfolio transactions. The Board further considered the profitability of each of the Affiliated Service Providers with respect to their services to the Fund and/or fund complex. The Board also considered the various risks borne by SSGA FM and State Street in connection with their various roles in servicing the Fund, including reputational and entrepreneurial risks.
The Board concluded that the profitability of the Adviser with respect to the Fund, and the profitability range of each of the Affiliated Service Providers with respect to its services to the Fund, were reasonable in relation to the services provided.
Economies of Scale
In reviewing management fees and profitability, the Board also considered the extent to which the Adviser and its affiliates, on the one hand, and the Fund and the fund complex, on the other hand, can expect to realize benefits from economies of scale as the assets of the Fund and fund complex increase. The Board acknowledged the difficulty in accurately measuring the benefits resulting from the economies of scale with respect to the management of the Fund or the fund complex taken as a whole. The Board concluded that, in light of the current size of the Fund and the fund complex, the level of profitability of the Adviser and its affiliates with respect to the Fund and the fund complex over various time periods, and the comparative management fee and expense ratio of the Fund during these periods, it does not appear that the Adviser or its affiliates has realized benefits from economies of scale in managing the assets of the Fund to such an extent that previously agreed advisory fees should be reduced or that breakpoints in such fees should be implemented for the Fund at this time.
Conclusions
In reaching its decision to approve the Agreement, the Board did not identify any single factor as being controlling, but based its recommendation on each of the factors it considered. Each Director may have contributed different weight to the various factors. Based upon the materials reviewed, the representations made and the considerations described above, and as part of its deliberations, the Board, including the Independent Directors, concluded that the Adviser possesses the capability and resources to perform the duties required of it under the Agreement.
Further, based upon its review of the Agreement, the materials provided, and the considerations described above, the Board, including the Independent Directors, concluded that (1) the terms of the Advisory Agreement are reasonable, fair, and in the best interests of the Fund and its shareholders, and (2) the rates payable under the Advisory Agreement are fair and reasonable in light of the usual and customary charges made for services of the same nature and quality.
| Other Information | 19 |
Table of Contents
Directors
Michael F. Holland, Co-Chairperson
Patrick J. Riley, Co-Chairperson
John R. Costantino
Donna M. Rapaccioli
Michael A. Jessee
Richard D. Shirk
Rina K. Spence
Jeanne M. La Porta
Ellen M. Needham
Officers
Jeanne M. La Porta, President
Brian Harris, Chief Compliance Officer, Anti-Money Laundering Officer and Code of Ethics Compliance Officer
Sean O’Malley, Chief Legal Officer
Bruce S. Rosenberg, Treasurer
Ann M. Carpenter, Vice President and Deputy Treasurer
Chad C. Hallett, Deputy Treasurer
Arthur A. Jensen, Deputy Treasurer
Darlene Anderson-Vasquez, Deputy Treasurer
Sujata Upreti, Assistant Treasurer
Daniel Foley, Assistant Treasurer
Andrew DeLorme, Secretary
James Goundrey, Assistant Secretary
Kevin Morris, Assistant Secretary
David Urman, Assistant Secretary
Investment Adviser and Administrator
SSGA Funds Management, Inc.
One Iron Street
Boston, MA 02210
Custodian andSub-Administrator
State Street Bank and Trust Company
One Lincoln Street
Boston, Massachusetts 02111
Distributor
State Street Global Advisors Funds Distributors, LLC
One Iron Street
Boston, MA 02210
Independent Registered Public Accounting Firm
Ernst & Young LLP
200 Clarendon Street
Boston, Massachusetts 02116
Table of Contents
Semi-Annual Report
June 30, 2019
State Street Income V.I.S. Fund
Beginning on January 1, 2021, as permitted by regulations adopted by the U.S. Securities and Exchange Commission, paper copies of a Fund’s annual and semi- annual shareholder reports will no longer be sent by mail, unless you specifically request paper copies of the reports. Instead, the reports will be made available on a Fund’s website (www.ssga.com/geam), and you will be notified by mail each time a report is posted, and provided with a website link to access the report. If you already elected to receive shareholder reports electronically, you will not be affected by this change and you need not take any action.
You may elect to receive all future reports in paper free of charge. To do so, contact your Insurance Provider. Your election to receive reports in paper will apply to all funds held in your account.

Table of Contents
State Street Income V.I.S. Fund
Semi-Annual Report
June 30, 2019 (Unaudited)
| Page | ||||
| Fund Information | 1 | |||
| Understanding Your Fund’s Expenses | 2 | |||
| Schedule of Investments | 3 | |||
| Financial Statements | ||||
| 20 | ||||
| 21 | ||||
| 22 | ||||
| 23 | ||||
| Notes to Financial Statements | 24 | |||
| Other Information | 32 | |||
This report is prepared for Policyholders of certain variable contracts and may be distributed to others only if preceded or accompanied by the variable contract’s current prospectus and the current summary prospectus of the Fund available for investments thereunder.
Table of Contents
State Street Income V.I.S. Fund
Fund Information — June 30, 2019 (Unaudited)
Total return performance shown in this report for the Fund takes into account changes in share price and assumes reinvestment of dividends and capital gains distributions, if any. Total returns shown are net of Fund fees and expenses but do not reflect fees and charges associated with the variable contracts such as administrative fees, account charges and surrender charges, which, if reflected, would reduce the Fund’s total returns for all periods shown.
The performance data quoted represents past performance; past performance does not guarantee future results. Investment return and principal value will fluctuate so your shares, when redeemed, may be worth more or less than their original cost. Current performance may be higher or lower than the performance data quoted. Periods less than one year are not annualized. Please call toll-free (800) 242-0134 or visit the Fund’s website at http://www.ssga.com/geam for the most recent month-end performance data.
An investment in the Fund is not a deposit of any bank and is not insured or guaranteed by the Federal Deposit Insurance Corporation (“FDIC”) or any other government agency. An investment in the Fund is subject to risk, including possible loss of principal invested.
Sector Allocation
Portfolio Composition as a % of Fair Value of $21,640 (in thousands) as of June 30, 2019(a)(b)
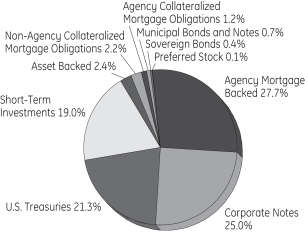
Quality Ratings
as of June 30, 2019 as a % of Fair Value(a)(b)
Moody’s / S&P /Rating* | Percentage of Fair Value | |||
Aaa / AAA | 23.49 | % | ||
Aa / AA | 51.22 | % | ||
A / A | 6.25 | % | ||
Baa / BBB | 16.56 | % | ||
Ba / BB and lower | 1.89 | % | ||
NR / Other | 0.59 | % | ||
|
| |||
| 100.00 | % | |||
|
| |||
| (a) | Fair Value basis is inclusive of short-term investment in State Street Institutional U.S. Government Money Market Fund Class G Shares. |
| (b) | The securities information regarding holdings, allocations and other characteristics is presented to illustrate examples of securities that the Fund has bought and the diversity of areas in which the Fund may invest as of a particular date. It may not be representative of the Fund’s current or future investments and should not be construed as a recommendation to purchase or sell a particular security. |
| * | Moody’s Investors Services, Inc. (“Moody’s”) and S&P Global Ratings (“S&P”) are nationally recognized statistical rating organizations. The quality ratings represent the lower of Moody’s or S&P credit ratings. When a rating from only one of the rating agencies is available, that rating is used. Securities not rated by Moody’s or S&P are categorized as not rated. Credit quality measures a bond issuer’s ability to repay interest and principal in a timely manner. Credit quality ratings assigned by a rating agency are subject to change periodically and are not absolute standards of quality. In formulating investment decisions for the Fund, SSGA Funds Management, Inc. develops its own analysis of the credit quality and risks associated with individual debt instruments, rather than relying exclusively on rating agency ratings. |
State Street Global Advisors Funds Distributors, LLC, member of FINRA & SIPC is the principal underwriter and distributor of the State Street V.I.S. Funds and an indirect wholly-owned subsidiary of State Street Corporation. References to State Street may include State Street Corporation and its affiliates. The Funds pay State Street Bank and Trust Company for its services as custodian and Fund Accounting agent, and pay SSGA Funds Management, Inc. for investment advisory and administrative services.
| State Street Income V.I.S. Fund | 1 |
Table of Contents
State Street Income V.I.S. Fund
Understanding Your Fund’s Expenses — June 30, 2019 (Unaudited)
As a shareholder of the Fund, you incur ongoing costs. Ongoing costs include portfolio management fees, professional fees, administrative fees and other Fund expenses. The following example is intended to help you understand your ongoing costs (in dollars) of investing in the Fund and to compare these costs with the ongoing costs of investing in other mutual funds.
To illustrate these ongoing costs, we have provided an example and calculated the expenses paid by investors in the Fund during the period. The information in the following table is based on an investment of $1,000, which is invested at the beginning of the period and held for the entiresix-month period ended June 30, 2019.
Actual Expenses
The first section of the table provides information about actual account values and actual expenses. You may use the information in this section, together with the amount you invested, to estimate the expenses that you paid over the period. To do so, simply divide your account value by $1,000 (for example, an $8,600 account value divided by $1,000 = 8.6), then multiply the result by the number given under the heading “Expenses paid during the period” to estimate the expenses you paid on your account during the period.
Hypothetical Example for Comparison Purposes
The second section of the table provides information about hypothetical account values and hypothetical expenses based on the Fund’s actual expense ratio and an assumed rate of return of 5% per year before expenses, which is not the Fund’s actual return. The hypothetical account values and expenses may not be used to estimate the actual ending account balance or expenses you paid for the period. You may use this information to compare the ongoing costs of investing in the Fund and other funds. To do so, compare this 5% hypothetical example with the 5% hypothetical examples that appear in the shareholder reports of other funds.
Please note that the expenses shown in the table are meant to highlight and help you compare ongoing costs only and do not reflect transaction costs, such as sales charges or redemption fees, if any. Therefore, the second section of the table is useful in comparing ongoing costs only, and will not help you determine the relative total costs of owning different funds. Additionally, the expenses shown do not reflect the fees or charges associated with variable contracts through which shares of the Fund are offered.
| Actual Fund Return | Hypothetical 5% Return (2.5% for the period) | |||||||
Account value at the | ||||||||
beginning of the period January 1, 2019 | $ | 1,000.00 | $ | 1,000.00 | ||||
Account value at the end of the period June 30, 2019 | $ | 1,063.20 | $ | 1,019.64 | ||||
Expenses paid during the period* | $ | 5.32 | $ | 5.21 | ||||
| * | Expenses are equal to the Fund’s annualized expense ratio of 1.04% (for the period January 1, 2019-June 30, 2019), multiplied by the average account value over the period, multiplied by 181/365 (to reflect theone-half year period). |
| 2 | State Street Income V.I.S. Fund |
Table of Contents
State Street Income V.I.S. Fund
Schedule of Investments — June 30, 2019 (Unaudited)
| Principal Amount ($) | Fair $ | |||||||
| Bonds and Notes - 98.2%† |
| |||||||
U.S. Treasuries - 25.9% | ||||||||
U.S. Treasury Bonds | ||||||||
2.25% 08/15/46 (a) | 135,000 | 127,533 | ||||||
3.00% 08/15/48 (a) | 739,400 | 810,914 | ||||||
U.S. Treasury Notes | ||||||||
1.38% 12/15/19 (a) | 726,400 | 724,130 | ||||||
1.50% 11/30/19 (a) | 950,700 | 948,286 | ||||||
1.63% 02/15/26 (a) | 779,500 | 768,051 | ||||||
2.25% 03/31/20 (a) | 805,000 | 806,352 | ||||||
2.50% 01/31/24 (a) | 413,200 | 426,790 | ||||||
|
| |||||||
| 4,612,056 | ||||||||
|
| |||||||
Agency Mortgage Backed - 33.7% |
| |||||||
Federal Home Loan Mortgage Corp. | ||||||||
4.05% 09/25/28 (a)(b) | 86,000 | 96,645 | ||||||
4.50% 06/01/33 - 02/01/35 (a) | 4,002 | 4,231 | ||||||
5.00% 07/01/35 (a) | 33,944 | 36,767 | ||||||
5.50% 05/01/20 - 01/01/38 (a) | 37,498 | 40,961 | ||||||
6.00% 07/01/19 - 11/01/37 (a) | 104,615 | 117,346 | ||||||
6.50% 02/01/29 (a) | 50 | 57 | ||||||
6.93% 06/01/26 (a)(c) | 60,000 | 78,641 | ||||||
7.00% 06/01/29 - 08/01/36 (a) | 23,338 | 26,710 | ||||||
7.50% 01/01/30 - 09/01/33 (a) | 4,012 | 4,411 | ||||||
8.00% 11/01/30 (a) | 4,615 | 5,230 | ||||||
8.50% 04/01/30 (a) | 4,380 | 5,587 | ||||||
Federal National Mortgage Assoc. | ||||||||
3.50% 08/01/45 - 07/01/47 (a) | 283,133 | 293,862 | ||||||
4.00% 01/01/41 - 10/01/47 (a) | 485,970 | 508,089 | ||||||
4.50% 10/01/19 - 02/01/40 (a) | 36,156 | 38,454 | ||||||
5.00% 03/01/34 - 08/01/35 (a) | 43,840 | 47,428 | ||||||
5.50% 06/01/20 - 01/01/39 (a) | 146,919 | 159,705 | ||||||
6.00% 10/01/19 - 07/01/35 (a) | 159,748 | 180,539 | ||||||
6.50% 10/01/28 - 08/01/34 (a) | 23,379 | 25,660 | ||||||
7.00% 10/01/32 - 02/01/34 (a) | 5,484 | 5,939 | ||||||
7.50% 11/01/22 - 03/01/33 (a) | 16,817 | 17,971 | ||||||
8.00% 08/01/25 - 10/01/31 (a) | 7,768 | 8,717 | ||||||
9.00% 12/01/22 (a) | 202 | 211 | ||||||
Federal National Mortgage Assoc. 1.60% + 12 month USD LIBOR | 924 | 949 | ||||||
Federal National Mortgage Assoc. TBA | ||||||||
2.50% TBA (d) | 129,000 | 129,829 | ||||||
3.00% TBA (d) | 909,232 | 919,042 | ||||||
3.50% TBA (d) | 1,004,000 | 1,026,048 | ||||||
4.00% TBA (d) | 405,000 | 418,555 | ||||||
4.50% TBA (a)(d) | 33,000 | 34,478 | ||||||
Government National Mortgage Assoc. | ||||||||
3.00% 12/20/42 | 387,840 | 399,295 | ||||||
| Principal Amount ($) | Fair $ | |||||||
4.00% 01/20/41 - 04/20/43 (a) | 127,778 | 134,777 | ||||||
4.50% 08/15/33 - 03/20/41 (a) | 93,724 | 99,674 | ||||||
6.00% 04/15/27 - 04/15/34 (a) | 82,155 | 93,489 | ||||||
6.50% 03/15/24 - 08/15/34 (a) | 34,013 | 37,832 | ||||||
7.00% 01/15/28 - 10/15/36 (a) | 25,249 | 27,801 | ||||||
7.50% 11/15/31 (a) | 171 | 171 | ||||||
9.00% 12/15/21 (a) | 95 | 99 | ||||||
Government National Mortgage Assoc. 1.50% + 1 year CMT | ||||||||
4.00% 02/20/23 - 02/20/26 (a)(b) | 1,603 | 1,620 | ||||||
4.13% 12/20/24 (a)(b) | 699 | 708 | ||||||
Government National Mortgage Assoc. TBA | ||||||||
3.50% TBA (d) | 630,000 | 650,210 | ||||||
4.00% TBA (a)(d) | 76,000 | 78,782 | ||||||
4.50% TBA (a)(d) | 233,000 | 242,863 | ||||||
|
| |||||||
| 5,999,383 | ||||||||
|
| |||||||
Agency Collateralized Mortgage Obligations - 1.4% |
| |||||||
Federal Home Loan Mortgage Corp. | ||||||||
0.08% 09/25/43 (a)(b)(e) | 416,784 | 1,127 | ||||||
3.30% 04/25/29 (a) | 47,000 | 50,101 | ||||||
3.77% 12/25/28 (a) | 40,000 | 44,107 | ||||||
3.86% 11/25/28 (a)(b) | 36,000 | 39,952 | ||||||
4.06% 10/25/28 (a)(b) | 73,000 | 82,095 | ||||||
Federal Home Loan Mortgage Corp. REMIC | ||||||||
3.50% 09/15/29 - 11/15/30 (a)(e) | 36,761 | 1,964 | ||||||
5.50% 06/15/33 (a)(e) | 18,501 | 3,165 | ||||||
7.50% 07/15/27 (a)(e) | 1,769 | 311 | ||||||
Federal Home Loan Mortgage Corp. REMIC 6.60% - 1 month USD LIBOR | 15,455 | 745 | ||||||
Federal Home Loan Mortgage Corp. STRIPS | ||||||||
1.47% 08/01/27 (a)(f)(g) | 211 | 194 | ||||||
8.00% 02/01/23 - 07/01/24 (a)(e) | 584 | 75 | ||||||
Federal National Mortgage Assoc. REMIC | ||||||||
0.51% 12/25/22 (a)(f)(g) | 3 | 3 | ||||||
1.09% 12/25/42 (a)(b)(e) | 22,345 | 719 | ||||||
5.00% 09/25/40 (a) | 16,327 | 1,614 | ||||||
7.00% 09/25/20 (a) | 28 | 28 | ||||||
Federal National Mortgage Assoc. REMIC 6.00% - 1 month USD LIBOR | 6,451 | 814 | ||||||
Federal National Mortgage Assoc. STRIPS | ||||||||
1.87% 12/25/34 (a)(f)(g) | 15,301 | 13,083 | ||||||
4.50% 08/25/35 - 01/25/36 (a)(e) | 19,317 | 3,249 | ||||||
See Notes to Schedule of Investments and Notes to Financial Statements.
| State Street Income V.I.S. Fund | 3 |
Table of Contents
State Street Income V.I.S. Fund
Schedule of Investments, continued — June 30, 2019 (Unaudited)
| Principal Amount ($) | Fair $ | |||||||
5.00% 03/25/38 - 05/25/38 (a)(e) | 10,636 | 1,990 | ||||||
5.50% 12/25/33 (a)(e) | 4,678 | 959 | ||||||
6.00% 01/25/35 (a)(e) | 7,917 | 1,802 | ||||||
7.50% 11/25/23 (a)(e) | 2,539 | 276 | ||||||
8.00% 08/25/23 - 07/25/24 (a)(e) | 1,178 | 155 | ||||||
Government National Mortgage Assoc. REMIC | ||||||||
4.50% 08/16/39 (a)(e) | 11,059 | 637 | ||||||
5.00% 09/20/38 (a)(e) | 2,782 | 50 | ||||||
Government National Mortgage Assoc. REMIC 6.80% - 1 month USD LIBOR | 21,896 | 4,350 | ||||||
|
| |||||||
| 253,565 | ||||||||
|
| |||||||
Asset Backed - 2.9% | ||||||||
American Express Credit Account Master Trust2017-6 | 124,437 | 124,311 | ||||||
American Express Credit Account Master Trust2018-8 | 104,000 | 106,535 | ||||||
BA Credit Card Trust2018-A1 | 44,000 | 44,416 | ||||||
Citibank Credit Card Issuance Trust2016-A1 | 200,000 | 199,600 | ||||||
Nissan Auto Lease Trust2019-A | 45,000 | 45,368 | ||||||
|
| |||||||
| 520,230 | ||||||||
|
| |||||||
Corporate Notes - 30.4% | ||||||||
Abbott Laboratories | ||||||||
2.90% 11/30/21 (a) | 13,000 | 13,211 | ||||||
3.75% 11/30/26 (a) | 6,000 | 6,499 | ||||||
4.90% 11/30/46 (a) | 10,000 | 12,333 | ||||||
AbbVie Inc. | ||||||||
3.20% 05/14/26 (a) | 4,000 | 4,037 | ||||||
4.45% 05/14/46 (a) | 11,000 | 10,791 | ||||||
4.88% 11/14/48 (a) | 3,000 | 3,153 | ||||||
Activision Blizzard Inc. | 14,000 | 13,976 | ||||||
Aetna Inc. | 8,000 | 8,251 | ||||||
Aflac Inc. | 3,000 | 3,133 | ||||||
Aircastle Ltd. | 10,000 | 10,125 | ||||||
Alexandria Real Estate Equities Inc. | 3,000 | 3,376 | ||||||
| Principal Amount ($) | Fair $ | |||||||
Alimentation Couche-Tard Inc. | 8,000 | 8,014 | ||||||
Allergan Finance LLC | ||||||||
3.25% 10/01/22 (a) | 6,000 | 6,096 | ||||||
4.63% 10/01/42 (a) | 2,000 | 1,986 | ||||||
Allergan Funding SCS | ||||||||
3.00% 03/12/20 (a) | 16,000 | 16,040 | ||||||
3.45% 03/15/22 (a) | 8,000 | 8,156 | ||||||
Allergan Sales LLC | 15,000 | 15,748 | ||||||
Altria Group Inc. | ||||||||
2.95% 05/02/23 (a) | 5,000 | 5,059 | ||||||
3.80% 02/14/24 (a) | 4,000 | 4,172 | ||||||
4.25% 08/09/42 (a) | 2,000 | 1,856 | ||||||
4.40% 02/14/26 (a) | 7,000 | 7,490 | ||||||
4.50% 05/02/43 (a) | 3,000 | 2,869 | ||||||
4.80% 02/14/29 (a) | 7,000 | 7,548 | ||||||
5.95% 02/14/49 (a) | 5,000 | 5,685 | ||||||
Amazon.com Inc. | ||||||||
2.80% 08/22/24 (a) | 5,000 | 5,145 | ||||||
3.15% 08/22/27 (a) | 4,000 | 4,202 | ||||||
3.88% 08/22/37 (a) | 2,000 | 2,205 | ||||||
4.05% 08/22/47 (a) | 5,000 | 5,654 | ||||||
Ameren Corp. | 5,000 | 5,161 | ||||||
American Campus Communities Operating Partnership LP | 4,000 | 4,224 | ||||||
American Express Co. | 8,000 | 8,192 | ||||||
American International Group Inc. | ||||||||
4.25% 03/15/29 (a) | 8,000 | 8,577 | ||||||
4.50% 07/16/44 (a) | 7,000 | 7,387 | ||||||
6.40% 12/15/20 (a) | 7,000 | 7,394 | ||||||
American Tower Corp. | ||||||||
3.38% 10/15/26 (a) | 5,000 | 5,087 | ||||||
3.80% 08/15/29 (a) | 10,000 | 10,359 | ||||||
4.40% 02/15/26 (a) | 7,000 | 7,542 | ||||||
American Water Capital Corp. | 9,000 | 9,023 | ||||||
Amgen Inc. | ||||||||
2.65% 05/11/22 (a) | 9,000 | 9,067 | ||||||
3.20% 11/02/27 (a) | 5,000 | 5,122 | ||||||
4.66% 06/15/51 (a) | 3,000 | 3,278 | ||||||
Anadarko Petroleum Corp. | ||||||||
4.85% 03/15/21 (a) | 3,000 | 3,105 | ||||||
6.20% 03/15/40 (a) | 5,000 | 6,009 | ||||||
Andeavor Logistics LP/Tesoro Logistics Finance Corp. | ||||||||
5.20% 12/01/47 (a) | 3,000 | 3,208 | ||||||
5.25% 01/15/25 (a) | 24,000 | 25,336 | ||||||
5.50% 10/15/19 (a) | 17,000 | 17,089 | ||||||
See Notes to Schedule of Investments and Notes to Financial Statements.
| 4 | State Street Income V.I.S. Fund |
Table of Contents
State Street Income V.I.S. Fund
Schedule of Investments, continued — June 30, 2019 (Unaudited)
| Principal Amount ($) | Fair $ | |||||||
6.25% 10/15/22 (a) | 10,000 | 10,248 | ||||||
Anheuser-Busch Companies LLC/Anheuser-Busch InBev Worldwide Inc. | ||||||||
3.65% 02/01/26 (a) | 11,000 | 11,565 | ||||||
4.70% 02/01/36 (a) | 8,000 | 8,783 | ||||||
4.90% 02/01/46 (a) | 9,000 | 10,015 | ||||||
Anheuser-Busch InBev Worldwide Inc. | ||||||||
4.00% 04/13/28 (a) | 4,000 | 4,312 | ||||||
4.38% 04/15/38 (a) | 13,000 | 13,746 | ||||||
4.75% 04/15/58 (a) | 7,000 | 7,472 | ||||||
5.55% 01/23/49 (a) | 11,000 | 13,449 | ||||||
Anthem Inc. | 6,000 | 6,175 | ||||||
Apache Corp. | ||||||||
4.38% 10/15/28 (a) | 3,000 | 3,133 | ||||||
5.10% 09/01/40 (a) | 7,000 | 7,038 | ||||||
Apple Inc. | ||||||||
2.50% 02/09/22 (a) | 7,000 | 7,080 | ||||||
2.85% 05/11/24 (a) | 7,000 | 7,206 | ||||||
3.35% 02/09/27 (a) | 7,000 | 7,360 | ||||||
3.45% 02/09/45 (a) | 10,000 | 9,997 | ||||||
4.25% 02/09/47 (a) | 7,000 | 7,852 | ||||||
Applied Materials Inc. | 6,000 | 6,694 | ||||||
Aptiv PLC | 7,000 | 6,543 | ||||||
Archer-Daniels-Midland Co. | 6,000 | 6,006 | ||||||
Ascension Health | 10,000 | 12,255 | ||||||
AstraZeneca PLC | ||||||||
2.38% 11/16/20 (a) | 6,000 | 6,005 | ||||||
3.50% 08/17/23 (a) | 6,000 | 6,249 | ||||||
4.00% 01/17/29 (a) | 3,000 | 3,280 | ||||||
4.38% 08/17/48 (a) | 2,000 | 2,241 | ||||||
AT&T Inc. | ||||||||
3.00% 06/30/22 (a) | 8,000 | 8,139 | ||||||
3.80% 03/15/22 (a) | 11,000 | 11,402 | ||||||
4.35% 03/01/29 (a) | 12,000 | 12,914 | ||||||
4.45% 04/01/24 (a) | 7,000 | 7,540 | ||||||
4.50% 05/15/35 (a) | 12,000 | 12,577 | ||||||
4.55% 03/09/49 (a) | 4,000 | 4,087 | ||||||
4.75% 05/15/46 (a) | 4,000 | 4,209 | ||||||
4.80% 06/15/44 (a) | 7,000 | 7,377 | ||||||
4.85% 03/01/39 (a) | 8,000 | 8,605 | ||||||
5.15% 11/15/46 (a) | 2,000 | 2,211 | ||||||
5.25% 03/01/37 (a) | 5,000 | 5,610 | ||||||
5.35% 12/15/43 (a) | 7,000 | 7,705 | ||||||
5.45% 03/01/47 (a) | 7,000 | 8,046 | ||||||
Athene Holding Ltd. | 4,000 | 4,032 | ||||||
| Principal Amount ($) | Fair $ | |||||||
Avangrid Inc. | 9,000 | 9,155 | ||||||
Bank of America Corp. | ||||||||
3.95% 04/21/25 (a) | 7,000 | 7,341 | ||||||
4.18% 11/25/27 (a) | 11,000 | 11,669 | ||||||
4.25% 10/22/26 (a) | 11,000 | 11,756 | ||||||
Bank of America Corp. (2.37% fixed rate until 07/21/20; 0.66% + 3 month USD LIBOR thereafter) | 10,000 | 9,990 | ||||||
Bank of America Corp. (3.12% fixed rate until 01/20/22; 1.16% + 3 month USD LIBOR thereafter) | 8,000 | 8,130 | ||||||
Bank of America Corp. (3.37% fixed rate until 01/23/25; 0.81% + 3 month USD LIBOR thereafter) | 14,000 | 14,422 | ||||||
Bank of America Corp. (3.42% fixed rate until 12/20/27; 1.04% + 3 month USD LIBOR thereafter) | 12,000 | 12,345 | ||||||
Bank of America Corp. (3.46% fixed rate until 03/15/24; 0.97% + 3 month USD LIBOR thereafter) | 12,000 | 12,452 | ||||||
Bank of America Corp. (3.95% fixed rate until 01/23/48; 1.19% + 3 month USD LIBOR thereafter) | 3,000 | 3,174 | ||||||
Bank of America Corp. (4.24% fixed rate until 04/24/37; 1.81% + 3 month USD LIBOR thereafter) | 11,000 | 11,977 | ||||||
Bank of America Corp. (4.27% fixed rate until 07/23/28; 1.31% + 3 month USD LIBOR thereafter) | 3,000 | 3,274 | ||||||
Bank of America Corp. (4.33% fixed rate until 03/15/49; 1.52% + 3 month USD LIBOR thereafter) | 5,000 | 5,570 | ||||||
See Notes to Schedule of Investments and Notes to Financial Statements.
| State Street Income V.I.S. Fund | 5 |
Table of Contents
State Street Income V.I.S. Fund
Schedule of Investments, continued — June 30, 2019 (Unaudited)
| Principal Amount ($) | Fair $ | |||||||
Bank of America Corp. (4.44% fixed rate until 01/20/47; 1.99% + 3 month USD LIBOR thereafter) | 3,000 | 3,396 | ||||||
Bank of Montreal (4.34% fixed rate until 10/05/23; 1.28% + USD 5 year Swap Rate thereafter) | 15,000 | 15,754 | ||||||
Barrick North America Finance LLC | 3,000 | 3,646 | ||||||
BAT Capital Corp. | ||||||||
2.30% 08/14/20 (a) | 12,000 | 11,974 | ||||||
2.76% 08/15/22 (a) | 7,000 | 7,012 | ||||||
3.56% 08/15/27 (a) | 5,000 | 4,978 | ||||||
4.39% 08/15/37 (a) | 3,000 | 2,850 | ||||||
4.54% 08/15/47 (a) | 4,000 | 3,719 | ||||||
Baxalta Inc. | 5,000 | 5,015 | ||||||
Becton Dickinson and Co. | ||||||||
2.89% 06/06/22 (a) | 11,000 | 11,148 | ||||||
3.70% 06/06/27 (a) | 10,000 | 10,439 | ||||||
3.73% 12/15/24 (a) | 2,000 | 2,096 | ||||||
4.67% 06/06/47 (a) | 3,000 | 3,366 | ||||||
4.69% 12/15/44 (a) | 2,000 | 2,217 | ||||||
Berkshire Hathaway Energy Co. | ||||||||
2.40% 02/01/20 (a) | 14,000 | 14,001 | ||||||
3.25% 04/15/28 (a) | 4,000 | 4,119 | ||||||
3.80% 07/15/48 (a) | 5,000 | 5,086 | ||||||
6.13% 04/01/36 (a) | 5,000 | 6,685 | ||||||
Berkshire Hathaway Finance Corp. | 6,000 | 6,746 | ||||||
Biogen Inc. | 7,000 | 7,035 | ||||||
BNP Paribas S.A. | 7,000 | 7,282 | ||||||
Boardwalk Pipelines LP | 10,000 | 10,440 | ||||||
Boston Scientific Corp. | ||||||||
4.00% 03/01/28 (a) | 5,000 | 5,383 | ||||||
4.70% 03/01/49 (a) | 4,000 | 4,566 | ||||||
BP Capital Markets America Inc. | ||||||||
3.02% 01/16/27 (a) | 18,000 | 18,402 | ||||||
3.22% 11/28/23 (a) | 14,000 | 14,456 | ||||||
Brighthouse Financial Inc. | 2,000 | 1,901 | ||||||
Bristol-Myers Squibb Co. | ||||||||
3.20% 06/15/26 (a)(h) | 12,000 | 12,470 | ||||||
3.40% 07/26/29 (a)(h) | 12,000 | 12,571 | ||||||
4.13% 06/15/39 (a)(h) | 5,000 | 5,389 | ||||||
4.25% 10/26/49 (a)(h) | 5,000 | 5,525 | ||||||
| Principal Amount ($) | Fair $ | |||||||
Broadcom Corp./Broadcom Cayman Finance Ltd. | ||||||||
2.65% 01/15/23 (a) | 3,000 | 2,960 | ||||||
3.00% 01/15/22 (a) | 6,000 | 6,018 | ||||||
3.13% 01/15/25 (a) | 3,000 | 2,930 | ||||||
3.88% 01/15/27 (a) | 2,000 | 1,959 | ||||||
Brown-Forman Corp. | 2,000 | 2,160 | ||||||
Buckeye Partners LP | 7,000 | 5,763 | ||||||
Bunge Limited Finance Corp. | 3,000 | 2,977 | ||||||
Burlington Northern Santa Fe LLC | ||||||||
4.15% 12/15/48 (a) | 8,000 | 8,986 | ||||||
4.55% 09/01/44 (a) | 11,000 | 12,746 | ||||||
Campbell Soup Co. | 11,000 | 11,139 | ||||||
Canadian Natural Resources Ltd. | ||||||||
3.85% 06/01/27 (a) | 3,000 | 3,117 | ||||||
4.95% 06/01/47 (a) | 2,000 | 2,287 | ||||||
Cantor Fitzgerald LP | 18,000 | 18,522 | ||||||
Capital One Financial Corp. | ||||||||
3.75% 07/28/26 (a) | 9,000 | 9,161 | ||||||
4.75% 07/15/21 (a) | 12,000 | 12,545 | ||||||
Cardinal Health Inc. | ||||||||
2.62% 06/15/22 (a) | 6,000 | 6,035 | ||||||
3.08% 06/15/24 (a) | 4,000 | 4,026 | ||||||
Caterpillar Financial Services Corp. | 14,000 | 14,158 | ||||||
Caterpillar Inc. | 4,000 | 4,259 | ||||||
CBS Corp. | ||||||||
2.90% 01/15/27 (a) | 5,000 | 4,865 | ||||||
3.70% 06/01/28 (a) | 4,000 | 4,074 | ||||||
Celgene Corp. | ||||||||
3.45% 11/15/27 (a) | 2,000 | 2,082 | ||||||
4.55% 02/20/48 (a) | 7,000 | 7,987 | ||||||
5.00% 08/15/45 (a) | 5,000 | 5,919 | ||||||
Cenovus Energy Inc. | ||||||||
4.25% 04/15/27 (a) | 2,000 | 2,071 | ||||||
5.25% 06/15/37 (a) | 3,000 | 3,136 | ||||||
5.40% 06/15/47 (a) | 3,000 | 3,230 | ||||||
CenterPoint Energy Inc. | ||||||||
2.50% 09/01/22 (a) | 13,000 | 13,020 | ||||||
3.60% 11/01/21 (a) | 8,000 | 8,215 | ||||||
Charter Communications Operating LLC/Charter Communications Operating Capital | ||||||||
3.58% 07/23/20 (a) | 18,000 | 18,159 | ||||||
4.46% 07/23/22 (a) | 11,000 | 11,549 | ||||||
4.91% 07/23/25 (a) | 5,000 | 5,426 | ||||||
See Notes to Schedule of Investments and Notes to Financial Statements.
| 6 | State Street Income V.I.S. Fund |
Table of Contents
State Street Income V.I.S. Fund
Schedule of Investments, continued — June 30, 2019 (Unaudited)
| Principal Amount ($) | Fair $ | |||||||
5.05% 03/30/29 (a) | 12,000 | 13,239 | ||||||
5.75% 04/01/48 (a) | 10,000 | 11,052 | ||||||
6.38% 10/23/35 (a) | 3,000 | 3,516 | ||||||
6.48% 10/23/45 (a) | 5,000 | 5,946 | ||||||
Chevron Corp. | ||||||||
2.42% 11/17/20 (a) | 7,000 | 7,032 | ||||||
3.19% 06/24/23 (a) | 4,000 | 4,152 | ||||||
Chubb INA Holdings Inc. | 8,000 | 9,318 | ||||||
Church & Dwight Company Inc. | 7,000 | 7,013 | ||||||
Cigna Corp. | ||||||||
3.20% 09/17/20 (a)(h) | 10,000 | 10,092 | ||||||
3.40% 09/17/21 (a)(h) | 7,000 | 7,136 | ||||||
3.75% 07/15/23 (a)(h) | 6,000 | 6,244 | ||||||
4.13% 11/15/25 (a)(h) | 7,000 | 7,446 | ||||||
4.38% 10/15/28 (a)(h) | 3,000 | 3,237 | ||||||
4.80% 08/15/38 (a)(h) | 3,000 | 3,230 | ||||||
4.90% 12/15/48 (a)(h) | 3,000 | 3,276 | ||||||
Cigna Holding Co. | ||||||||
3.25% 04/15/25 (a) | 7,000 | 7,117 | ||||||
3.88% 10/15/47 (a) | 6,000 | 5,590 | ||||||
Cisco Systems Inc. | 5,000 | 6,820 | ||||||
Citigroup Inc. | ||||||||
2.70% 10/27/22 (a) | 8,000 | 8,061 | ||||||
2.90% 12/08/21 (a) | 5,000 | 5,056 | ||||||
4.40% 06/10/25 (a) | 5,000 | 5,341 | ||||||
4.45% 09/29/27 (a) | 4,000 | 4,310 | ||||||
4.65% 07/23/48 (a) | 13,000 | 15,138 | ||||||
4.75% 05/18/46 (a) | 9,000 | 10,182 | ||||||
Citigroup Inc. (2.88% fixed rate until 07/24/22; 0.95% + 3 month USD LIBOR thereafter) | 7,000 | 7,085 | ||||||
Citigroup Inc. (3.88% fixed rate until 01/24/38; 1.17% + 3 month USD LIBOR thereafter) | 7,000 | 7,290 | ||||||
Citigroup Inc. (4.28% fixed rate until 04/24/47; 1.84% + 3 month USD LIBOR thereafter) | 11,000 | 12,266 | ||||||
Citigroup Inc. (5.88% fixed rate until 03/27/20; 4.06% + 3 month USD LIBOR thereafter) | 23,000 | 23,223 | ||||||
CME Group Inc. | 2,000 | 2,174 | ||||||
CMS Energy Corp. | 11,000 | 12,772 | ||||||
CNA Financial Corp. | ||||||||
3.45% 08/15/27 (a) | 5,000 | 5,072 | ||||||
3.90% 05/01/29 (a) | 10,000 | 10,493 | ||||||
| Principal Amount ($) | Fair $ | |||||||
CNH Industrial Capital LLC | ||||||||
3.38% 07/15/19 (a) | 8,000 | 8,002 | ||||||
4.38% 11/06/20 (a) | 7,000 | 7,147 | ||||||
4.88% 04/01/21 (a) | 8,000 | 8,284 | ||||||
CNH Industrial N.V. | 11,000 | 10,985 | ||||||
Columbia Pipeline Group Inc. | 7,000 | 7,047 | ||||||
Comcast Corp. | ||||||||
3.20% 07/15/36 (a) | 7,000 | 6,800 | ||||||
3.38% 08/15/25 (a) | 5,000 | 5,228 | ||||||
3.97% 11/01/47 (a) | 11,000 | 11,524 | ||||||
4.15% 10/15/28 (a) | 13,000 | 14,322 | ||||||
4.25% 10/15/30 (a) | 7,000 | 7,807 | ||||||
4.60% 08/15/45 (a) | 3,000 | 3,401 | ||||||
4.70% 10/15/48 (a) | 4,000 | 4,690 | ||||||
CommonSpirit Health | 16,000 | 16,081 | ||||||
Conagra Brands Inc. | ||||||||
3.80% 10/22/21 (a) | 11,000 | 11,305 | ||||||
5.30% 11/01/38 (a) | 3,000 | 3,251 | ||||||
5.40% 11/01/48 (a) | 4,000 | 4,390 | ||||||
Conagra Brands Inc. 0.75% + 3 month USD LIBOR | 9,000 | 9,001 | ||||||
Concho Resources Inc. | ||||||||
3.75% 10/01/27 (a) | 3,000 | 3,103 | ||||||
4.30% 08/15/28 (a) | 3,000 | 3,236 | ||||||
4.88% 10/01/47 (a) | 4,000 | 4,510 | ||||||
ConocoPhillips Co. | 8,000 | 8,961 | ||||||
Consolidated Edison Company of New York Inc. | ||||||||
2.90% 12/01/26 (a) | 12,000 | 11,996 | ||||||
3.88% 06/15/47 (a) | 4,000 | 4,141 | ||||||
Constellation Brands Inc. | ||||||||
3.70% 12/06/26 (a) | 6,000 | 6,284 | ||||||
4.50% 05/09/47 (a) | 8,000 | 8,360 | ||||||
Continental Resources Inc. | 12,000 | 12,601 | ||||||
Corning Inc. | 6,000 | 5,851 | ||||||
Corporation Andina de Fomento | ||||||||
2.20% 07/18/20 (a) | 16,000 | 15,937 | ||||||
4.38% 06/15/22 (a) | 69,000 | 72,618 | ||||||
Crown Castle International Corp. | 6,000 | 6,884 | ||||||
CSX Corp. | 14,000 | 15,570 | ||||||
CubeSmart LP | 7,000 | 7,455 | ||||||
CVS Health Corp. | ||||||||
2.25% 08/12/19 (a) | 12,000 | 11,995 | ||||||
3.13% 03/09/20 (a) | 24,000 | 24,090 | ||||||
See Notes to Schedule of Investments and Notes to Financial Statements.
| State Street Income V.I.S. Fund | 7 |
Table of Contents
State Street Income V.I.S. Fund
Schedule of Investments, continued — June 30, 2019 (Unaudited)
| Principal Amount ($) | Fair $ | |||||||
3.35% 03/09/21 (a) | 11,000 | 11,153 | ||||||
3.70% 03/09/23 (a) | 14,000 | 14,464 | ||||||
3.88% 07/20/25 (a) | 5,000 | 5,219 | ||||||
4.10% 03/25/25 (a) | 7,000 | 7,384 | ||||||
4.30% 03/25/28 (a) | 2,000 | 2,109 | ||||||
4.78% 03/25/38 (a) | 6,000 | 6,257 | ||||||
5.00% 12/01/24 (a) | 6,000 | 6,542 | ||||||
5.05% 03/25/48 (a) | 8,000 | 8,531 | ||||||
D.R. Horton Inc. | 12,000 | 11,992 | ||||||
Dell International LLC/EMC Corp. | ||||||||
4.00% 07/15/24 (a)(h) | 9,000 | 9,213 | ||||||
4.42% 06/15/21 (a)(h) | 11,000 | 11,327 | ||||||
5.30% 10/01/29 (a)(h) | 7,000 | 7,372 | ||||||
5.45% 06/15/23 (a)(h) | 5,000 | 5,389 | ||||||
6.02% 06/15/26 (a)(h) | 5,000 | 5,506 | ||||||
8.10% 07/15/36 (a)(h) | 2,000 | 2,440 | ||||||
8.35% 07/15/46 (a)(h) | 4,000 | 5,049 | ||||||
Deutsche Bank AG | 12,000 | 11,940 | ||||||
Devon Energy Corp. | ||||||||
4.00% 07/15/21 (a) | 13,000 | 13,449 | ||||||
5.00% 06/15/45 (a) | 6,000 | 6,885 | ||||||
Diageo Investment Corp. | 15,000 | 15,274 | ||||||
Diamondback Energy Inc. | 10,000 | 10,280 | ||||||
Digital Realty Trust LP | 10,000 | 10,152 | ||||||
Discovery Communications LLC | ||||||||
2.20% 09/20/19 (a) | 9,000 | 8,987 | ||||||
2.95% 03/20/23 (a) | 17,000 | 17,146 | ||||||
3.95% 03/20/28 (a) | 5,000 | 5,147 | ||||||
4.95% 05/15/42 (a) | 2,000 | 2,023 | ||||||
5.00% 09/20/37 (a) | 3,000 | 3,134 | ||||||
Dollar Tree Inc. | ||||||||
4.00% 05/15/25 (a) | 7,000 | 7,278 | ||||||
4.20% 05/15/28 (a) | 10,000 | 10,350 | ||||||
Dominion Energy Inc. | ||||||||
2.58% 07/01/20 (a) | 9,000 | 8,991 | ||||||
3.07% 08/15/24 (c) | 5,000 | 5,044 | ||||||
DPL Inc. | 10,000 | 10,144 | ||||||
DTE Energy Co. | ||||||||
2.85% 10/01/26 (a) | 8,000 | 7,911 | ||||||
3.85% 12/01/23 (a) | 7,000 | 7,336 | ||||||
Duke Energy Carolinas LLC | 5,000 | 5,309 | ||||||
Duke Energy Corp. | ||||||||
1.80% 09/01/21 (a) | 7,000 | 6,921 | ||||||
3.55% 09/15/21 (a) | 6,000 | 6,133 | ||||||
3.75% 09/01/46 (a) | 3,000 | 2,933 | ||||||
Duke Energy Progress LLC | 11,000 | 11,912 | ||||||
| Principal Amount ($) | Fair $ | |||||||
Duke Realty LP | ||||||||
3.25% 06/30/26 (a) | 4,000 | 4,068 | ||||||
3.38% 12/15/27 (a) | 3,000 | 3,063 | ||||||
DuPont de Nemours Inc. | ||||||||
3.77% 11/15/20 (a) | 11,000 | 11,209 | ||||||
5.32% 11/15/38 (a) | 3,000 | 3,525 | ||||||
5.42% 11/15/48 (a) | 3,000 | 3,649 | ||||||
Duquesne Light Holdings Inc. | 11,000 | 11,029 | ||||||
Eastman Chemical Co. | ||||||||
3.50% 12/01/21 (a) | 8,000 | 8,185 | ||||||
3.60% 08/15/22 (a) | 7,000 | 7,194 | ||||||
4.50% 01/15/21 - 12/01/28 (a) | 25,000 | 26,135 | ||||||
Eaton Corp. | 4,000 | 4,062 | ||||||
Ecolab Inc. | ||||||||
3.25% 12/01/27 (a) | 2,000 | 2,080 | ||||||
3.95% 12/01/47 (a) | 4,000 | 4,309 | ||||||
Eli Lilly & Co. | ||||||||
3.38% 03/15/29 (a) | 5,000 | 5,329 | ||||||
3.70% 03/01/45 (a) | 2,000 | 2,078 | ||||||
3.95% 03/15/49 (a) | 8,000 | 8,659 | ||||||
Emera US Finance LP | 3,000 | 3,237 | ||||||
Enbridge Energy Partners LP | 4,000 | 4,666 | ||||||
Encana Corp. | 9,000 | 9,222 | ||||||
Energy Transfer Operating LP | ||||||||
4.25% 03/15/23 (a) | 8,000 | 8,349 | ||||||
4.50% 04/15/24 (a) | 14,000 | 14,894 | ||||||
4.95% 06/15/28 (a) | 4,000 | 4,375 | ||||||
5.88% 01/15/24 (a) | 13,000 | 14,476 | ||||||
6.13% 12/15/45 (a) | 3,000 | 3,418 | ||||||
6.50% 02/01/42 (a) | 8,000 | 9,418 | ||||||
7.50% 10/15/20 (a) | 11,000 | 11,667 | ||||||
Energy Transfer Partners LP/Regency Energy Finance Corp. | 4,000 | 4,230 | ||||||
Entergy Louisiana LLC | ||||||||
3.05% 06/01/31 (a) | 10,000 | 10,053 | ||||||
4.00% 03/15/33 (a) | 3,000 | 3,304 | ||||||
Enterprise Products Operating LLC | ||||||||
4.20% 01/31/50 (d) | 10,000 | 10,317 | ||||||
4.25% 02/15/48 (a) | 7,000 | 7,232 | ||||||
Enterprise Products Operating LLC (5.25% fixed rate until 08/16/27; 3.03% + 3 month USD LIBOR thereafter) | 7,000 | 6,682 | ||||||
EOG Resources Inc. | ||||||||
4.10% 02/01/21 (a) | 12,000 | 12,349 | ||||||
5.10% 01/15/36 (a) | 4,000 | 4,706 | ||||||
See Notes to Schedule of Investments and Notes to Financial Statements.
| 8 | State Street Income V.I.S. Fund |
Table of Contents
State Street Income V.I.S. Fund
Schedule of Investments, continued — June 30, 2019 (Unaudited)
| Principal Amount ($) | Fair $ | |||||||
EPR Properties | 4,000 | 4,302 | ||||||
EQM Midstream Partners LP | ||||||||
4.75% 07/15/23 (a) | 2,000 | 2,079 | ||||||
5.50% 07/15/28 (a) | 2,000 | 2,106 | ||||||
ERP Operating LP | 9,000 | 10,198 | ||||||
Exelon Corp. | ||||||||
3.50% 06/01/22 (a) | 9,000 | 9,218 | ||||||
4.45% 04/15/46 (a) | 7,000 | 7,492 | ||||||
Express Scripts Holding Co. | 5,000 | 5,073 | ||||||
Exxon Mobil Corp. | 7,000 | 7,019 | ||||||
FedEx Corp. | 12,000 | 11,548 | ||||||
Fifth Third Bancorp | 12,000 | 12,608 | ||||||
FirstEnergy Corp. | 2,000 | 2,099 | ||||||
FirstEnergy Transmission LLC | 7,000 | 7,646 | ||||||
Fiserv Inc. | ||||||||
2.75% 07/01/24 (a) | 17,000 | 17,170 | ||||||
3.50% 07/01/29 (a) | 5,000 | 5,149 | ||||||
4.40% 07/01/49 (a) | 5,000 | 5,271 | ||||||
Florida Power & Light Co. | 13,000 | 14,376 | ||||||
Ford Motor Co. | 6,000 | 6,053 | ||||||
General Dynamics Corp. | ||||||||
2.13% 08/15/26 (a) | 9,000 | 8,791 | ||||||
3.00% 05/11/21 (a) | 14,000 | 14,224 | ||||||
3.50% 05/15/25 (a) | 6,000 | 6,386 | ||||||
General Mills Inc. | ||||||||
3.20% 04/16/21 (a) | 9,000 | 9,135 | ||||||
3.70% 10/17/23 (a) | 5,000 | 5,240 | ||||||
4.55% 04/17/38 (a) | 2,000 | 2,128 | ||||||
4.70% 04/17/48 (a) | 3,000 | 3,231 | ||||||
General Motors Co. | ||||||||
5.20% 04/01/45 (a) | 3,000 | 2,871 | ||||||
5.40% 04/01/48 (a) | 2,000 | 1,949 | ||||||
General Motors Financial Company Inc. | ||||||||
2.35% 10/04/19 (a) | 12,000 | 11,991 | ||||||
3.45% 01/14/22 - 04/10/22 (a) | 19,000 | 19,267 | ||||||
3.55% 04/09/21 (a) | 14,000 | 14,206 | ||||||
4.20% 11/06/21 (a) | 4,000 | 4,118 | ||||||
5.25% 03/01/26 (a) | 14,000 | 15,032 | ||||||
Georgia-Pacific LLC | 20,000 | 21,006 | ||||||
Gilead Sciences Inc. | ||||||||
2.55% 09/01/20 (a) | 7,000 | 7,018 | ||||||
| Principal Amount ($) | Fair $ | |||||||
2.95% 03/01/27 (a) | 3,000 | 3,051 | ||||||
3.50% 02/01/25 (a) | 4,000 | 4,192 | ||||||
3.65% 03/01/26 (a) | 2,000 | 2,114 | ||||||
4.15% 03/01/47 (a) | 9,000 | 9,448 | ||||||
GlaxoSmithKline Capital Inc. | ||||||||
3.38% 05/15/23 (a) | 7,000 | 7,283 | ||||||
3.63% 05/15/25 (a) | 6,000 | 6,382 | ||||||
GlaxoSmithKline Capital PLC | ||||||||
3.13% 05/14/21 (a) | 8,000 | 8,134 | ||||||
3.38% 06/01/29 (a) | 9,000 | 9,514 | ||||||
Glencore Finance Canada Ltd. | 7,000 | 7,350 | ||||||
Glencore Funding LLC | ||||||||
4.13% 03/12/24 (a)(h) | 12,000 | 12,429 | ||||||
4.88% 03/12/29 (a)(h) | 7,000 | 7,365 | ||||||
Halliburton Co. | ||||||||
3.80% 11/15/25 (a) | 5,000 | 5,247 | ||||||
5.00% 11/15/45 (a) | 6,000 | 6,538 | ||||||
HCA Inc. | ||||||||
4.13% 06/15/29 (a) | 5,000 | 5,150 | ||||||
5.88% 03/15/22 (a) | 11,000 | 12,050 | ||||||
Hess Corp. | ||||||||
5.60% 02/15/41 (a) | 4,000 | 4,309 | ||||||
5.80% 04/01/47 (a) | 2,000 | 2,230 | ||||||
Hewlett Packard Enterprise Co. | 5,000 | 5,536 | ||||||
Highwoods Realty LP | ||||||||
4.13% 03/15/28 (a) | 7,000 | 7,298 | ||||||
4.20% 04/15/29 (a) | 11,000 | 11,491 | ||||||
HSBC Holdings PLC (6.50% fixed rate until 03/23/28; 3.61% + USD 5 yearMid-Market Swap Rate thereafter) | 15,000 | 15,703 | ||||||
Hyundai Capital America | 7,000 | 7,045 | ||||||
Ingersoll-Rand Luxembourg Finance S.A. | ||||||||
3.50% 03/21/26 (a) | 11,000 | 11,359 | ||||||
3.55% 11/01/24 (a) | 7,000 | 7,292 | ||||||
3.80% 03/21/29 (a) | 11,000 | 11,540 | ||||||
Intel Corp. | ||||||||
2.60% 05/19/26 (a) | 8,000 | 8,053 | ||||||
2.88% 05/11/24 (a) | 3,000 | 3,089 | ||||||
International Paper Co. | 7,000 | 6,836 | ||||||
Interstate Power & Light Co. | 8,000 | 8,196 | ||||||
Jabil Inc. | 4,000 | 3,916 | ||||||
Jefferies Group LLC | ||||||||
5.13% 01/20/23 (a) | 10,000 | 10,717 | ||||||
6.50% 01/20/43 (a) | 16,000 | 17,231 | ||||||
See Notes to Schedule of Investments and Notes to Financial Statements.
| State Street Income V.I.S. Fund | 9 |
Table of Contents
State Street Income V.I.S. Fund
Schedule of Investments, continued — June 30, 2019 (Unaudited)
| Principal Amount ($) | Fair $ | |||||||
John Deere Capital Corp. | 10,000 | 10,118 | ||||||
Johnson & Johnson | 5,000 | 5,351 | ||||||
Johnson Controls International PLC | 5,000 | 5,080 | ||||||
JPMorgan Chase & Co. | ||||||||
2.30% 08/15/21 (a) | 20,000 | 19,970 | ||||||
2.55% 10/29/20 (a) | 10,000 | 10,025 | ||||||
3.30% 04/01/26 (a) | 11,000 | 11,386 | ||||||
3.63% 12/01/27 (a) | 5,000 | 5,160 | ||||||
JPMorgan Chase & Co. (3.51% fixed rate until 01/23/28; 0.95% + 3 month USD LIBOR thereafter) | 7,000 | 7,257 | ||||||
JPMorgan Chase & Co. (3.88% fixed rate until 07/24/37; 1.36% + 3 month USD LIBOR thereafter) | 7,000 | 7,327 | ||||||
JPMorgan Chase & Co. (3.90% fixed rate until 01/23/48; 1.22% + 3 month USD LIBOR thereafter) | ||||||||
3.90% 01/23/49 (a)(b) | 10,000 | 10,500 | ||||||
JPMorgan Chase & Co. (3.96% fixed rate until 01/29/26; 1.25% + 3 month USD LIBOR thereafter) | 12,000 | 12,836 | ||||||
JPMorgan Chase & Co. (4.01% fixed rate until 04/23/28; 1.12% + 3 month USD LIBOR thereafter) | 4,000 | 4,310 | ||||||
JPMorgan Chase & Co. (4.03% fixed rate until 07/24/47; 1.46% + 3 month USD LIBOR thereafter) | 7,000 | 7,474 | ||||||
JPMorgan Chase & Co. (6.10% fixed rate until 10/01/24; 3.33% + 3 month USD LIBOR thereafter) | 7,000 | 7,485 | ||||||
JPMorgan Chase & Co. 3.47% + 3 month USD LIBOR | 11,000 | 11,001 | ||||||
Keurig Dr Pepper Inc. | ||||||||
3.55% 05/25/21 (a) | 12,000 | 12,239 | ||||||
4.06% 05/25/23 (a) | 7,000 | 7,351 | ||||||
4.50% 11/15/45 (a) | 3,000 | 3,033 | ||||||
| Principal Amount ($) | Fair $ | |||||||
Kinder Morgan Energy Partners LP | ||||||||
3.50% 03/01/21 (a) | 18,000 | 18,257 | ||||||
4.70% 11/01/42 (a) | 2,000 | 2,028 | ||||||
5.30% 09/15/20 (a) | 7,000 | 7,231 | ||||||
6.38% 03/01/41 (a) | 9,000 | 10,938 | ||||||
Kinder Morgan Inc. | ||||||||
3.05% 12/01/19 (a) | 8,000 | 8,012 | ||||||
4.30% 03/01/28 (a) | 3,000 | 3,210 | ||||||
5.05% 02/15/46 (a) | 9,000 | 9,803 | ||||||
Kraft Heinz Foods Co. | ||||||||
2.80% 07/02/20 (a) | 7,000 | 7,012 | ||||||
3.50% 06/06/22 (a) | 12,000 | 12,313 | ||||||
4.38% 06/01/46 (a) | 10,000 | 9,475 | ||||||
L3 Technologies Inc. | 6,000 | 6,303 | ||||||
Lam Research Corp. | 11,000 | 11,722 | ||||||
Lear Corp. | ||||||||
4.25% 05/15/29 (a) | 10,000 | 10,088 | ||||||
5.25% 05/15/49 (a) | 5,000 | 4,941 | ||||||
Liberty Property LP | 8,000 | 8,645 | ||||||
Lincoln National Corp. | ||||||||
3.63% 12/12/26 (a) | 4,000 | 4,170 | ||||||
4.35% 03/01/48 (a) | 7,000 | 7,355 | ||||||
Lockheed Martin Corp. | 7,000 | 8,036 | ||||||
Lowe’s Companies Inc. | ||||||||
3.65% 04/05/29 (a) | 12,000 | 12,529 | ||||||
4.05% 05/03/47 (a) | 4,000 | 3,982 | ||||||
4.55% 04/05/49 (a) | 12,000 | 12,937 | ||||||
LYB International Finance BV | 5,000 | 5,324 | ||||||
Marathon Oil Corp. | ||||||||
2.70% 06/01/20 (a) | 14,000 | 14,008 | ||||||
3.85% 06/01/25 (a) | 7,000 | 7,256 | ||||||
Mars Inc. | ||||||||
2.70% 04/01/25 (a)(h) | 9,000 | 9,183 | ||||||
3.20% 04/01/30 (a)(h) | 7,000 | 7,271 | ||||||
Marsh & McLennan Companies Inc. | ||||||||
3.50% 03/10/25 (a) | 7,000 | 7,275 | ||||||
4.90% 03/15/49 (a) | 6,000 | 7,112 | ||||||
Masco Corp. | 2,000 | 1,978 | ||||||
McDonald’s Corp. | ||||||||
3.70% 01/30/26 (a) | 5,000 | 5,314 | ||||||
3.80% 04/01/28 (a) | 9,000 | 9,673 | ||||||
4.88% 12/09/45 (a) | 8,000 | 9,229 | ||||||
McKesson Corp. | 15,000 | 15,239 | ||||||
Medtronic Inc. | 2,000 | 2,418 | ||||||
See Notes to Schedule of Investments and Notes to Financial Statements.
| 10 | State Street Income V.I.S. Fund |
Table of Contents
State Street Income V.I.S. Fund
Schedule of Investments, continued — June 30, 2019 (Unaudited)
| Principal Amount ($) | Fair $ | |||||||
Memorial Sloan-Kettering Cancer Center | 17,000 | 18,933 | ||||||
Merck & Company Inc. | ||||||||
2.75% 02/10/25 (a) | 7,000 | 7,180 | ||||||
3.40% 03/07/29 (a) | 11,000 | 11,687 | ||||||
4.00% 03/07/49 (a) | 6,000 | 6,665 | ||||||
MetLife Inc. | ||||||||
4.05% 03/01/45 (a) | 3,000 | 3,217 | ||||||
4.72% 12/15/44 (a) | 10,000 | 11,664 | ||||||
Microsoft Corp. | ||||||||
2.40% 08/08/26 (a) | 6,000 | 6,032 | ||||||
3.45% 08/08/36 (a) | 5,000 | 5,284 | ||||||
3.50% 02/12/35 (a) | 3,000 | 3,198 | ||||||
3.70% 08/08/46 (a) | 11,000 | 11,896 | ||||||
3.95% 08/08/56 (a) | 5,000 | 5,566 | ||||||
4.10% 02/06/37 (a) | 4,000 | 4,565 | ||||||
4.50% 02/06/57 (a) | 3,000 | 3,663 | ||||||
Mitsubishi UFJ Financial Group Inc. | 14,000 | 14,311 | ||||||
Molson Coors Brewing Co. | ||||||||
2.10% 07/15/21 (a) | 7,000 | 6,948 | ||||||
4.20% 07/15/46 (a) | 6,000 | 5,771 | ||||||
Morgan Stanley | ||||||||
2.63% 11/17/21 (a) | 15,000 | 15,090 | ||||||
2.65% 01/27/20 (a) | 20,000 | 20,023 | ||||||
2.75% 05/19/22 (a) | 4,000 | 4,042 | ||||||
3.70% 10/23/24 (a) | 7,000 | 7,379 | ||||||
3.95% 04/23/27 (a) | 5,000 | 5,230 | ||||||
Morgan Stanley (3.97% fixed rate until 07/22/37; 1.46% + 3 month USD LIBOR thereafter) | 10,000 | 10,419 | ||||||
Morgan Stanley (4.43% fixed rate until 01/23/29; 1.63% + 3 month USD LIBOR thereafter) | 7,000 | 7,741 | ||||||
MPLX LP | ||||||||
3.38% 03/15/23 (a) | 5,000 | 5,115 | ||||||
4.50% 04/15/38 (a) | 4,000 | 4,040 | ||||||
4.70% 04/15/48 (a) | 6,000 | 6,107 | ||||||
Mylan Inc. | 5,000 | 4,617 | ||||||
Mylan N.V. | ||||||||
3.15% 06/15/21 (a) | 7,000 | 6,990 | ||||||
3.95% 06/15/26 (a) | 2,000 | 1,931 | ||||||
National Retail Properties Inc. | 6,000 | 6,343 | ||||||
New York Life Insurance Co. | 5,000 | 5,515 | ||||||
Newfield Exploration Co. | 16,000 | 17,148 | ||||||
| Principal Amount ($) | Fair $ | |||||||
Newmont Goldcorp Corp. | 7,000 | 7,825 | ||||||
Nexen Inc. | 7,000 | 9,343 | ||||||
NextEra Energy Capital Holdings Inc. | 11,000 | 11,303 | ||||||
NextEra Energy Capital Holdings Inc. (5.65% fixed rate until 05/01/29; 3.16% + 3 month USD LIBOR thereafter) | 7,000 | 7,208 | ||||||
Noble Energy Inc. | ||||||||
3.85% 01/15/28 (a) | 12,000 | 12,237 | ||||||
3.90% 11/15/24 (a) | 4,000 | 4,171 | ||||||
5.05% 11/15/44 (a) | 3,000 | 3,189 | ||||||
Nordstrom Inc. | 2,000 | 1,864 | ||||||
Norfolk Southern Corp. | 6,000 | 6,166 | ||||||
Northern States Power Co. | 23,000 | 23,006 | ||||||
Northrop Grumman Corp. | ||||||||
2.55% 10/15/22 (a) | 5,000 | 5,028 | ||||||
3.85% 04/15/45 (a) | 4,000 | 4,121 | ||||||
4.03% 10/15/47 (a) | 3,000 | 3,199 | ||||||
Novartis Capital Corp. | 3,000 | 3,099 | ||||||
Nucor Corp. | ||||||||
3.95% 05/01/28 (a) | 6,000 | 6,463 | ||||||
4.13% 09/15/22 (a) | 6,000 | 6,326 | ||||||
Nutrien Ltd. | ||||||||
4.00% 12/15/26 (a) | 3,000 | 3,136 | ||||||
4.90% 06/01/43 (a) | 6,000 | 6,545 | ||||||
Occidental Petroleum Corp. | ||||||||
4.10% 02/15/47 (a) | 6,000 | 5,945 | ||||||
4.20% 03/15/48 (a) | 3,000 | 3,029 | ||||||
Omnicom Group Inc./Omnicom Capital Inc. | 7,000 | 7,221 | ||||||
Oncor Electric Delivery Company LLC | 2,000 | 2,117 | ||||||
Oracle Corp. | ||||||||
2.40% 09/15/23 (a) | 4,000 | 4,028 | ||||||
2.65% 07/15/26 (a) | 7,000 | 7,028 | ||||||
3.80% 11/15/37 (a) | 3,000 | 3,170 | ||||||
4.00% 07/15/46 - 11/15/47 (a) | 15,000 | 16,104 | ||||||
Oshkosh Corp. | 6,000 | 6,228 | ||||||
Owens Corning | 5,000 | 4,282 | ||||||
See Notes to Schedule of Investments and Notes to Financial Statements.
| State Street Income V.I.S. Fund | 11 |
Table of Contents
State Street Income V.I.S. Fund
Schedule of Investments, continued — June 30, 2019 (Unaudited)
| Principal Amount ($) | Fair $ | |||||||
PacifiCorp | 4,000 | 5,391 | ||||||
Packaging Corporation of America | 3,000 | 3,037 | ||||||
Parker-Hannifin Corp. | ||||||||
2.70% 06/14/24 (a) | 5,000 | 5,075 | ||||||
3.25% 06/14/29 (a) | 5,000 | 5,196 | ||||||
PepsiCo Inc. | 6,000 | 6,167 | ||||||
Petroleos Mexicanos | ||||||||
5.35% 02/12/28 (a) | 10,000 | 9,087 | ||||||
5.63% 01/23/46 (a) | 10,000 | 8,055 | ||||||
6.35% 02/12/48 (a) | 10,000 | 8,575 | ||||||
6.38% 01/23/45 (a) | 12,000 | 10,263 | ||||||
6.50% 03/13/27 (a) | 15,000 | 14,791 | ||||||
Pfizer Inc. | ||||||||
3.00% 12/15/26 (a) | 5,000 | 5,157 | ||||||
3.20% 09/15/23 (a) | 6,000 | 6,236 | ||||||
3.45% 03/15/29 (a) | 9,000 | 9,521 | ||||||
3.60% 09/15/28 (a) | 7,000 | 7,560 | ||||||
3.90% 03/15/39 (a) | 5,000 | 5,384 | ||||||
4.00% 03/15/49 (a) | 8,000 | 8,705 | ||||||
4.40% 05/15/44 (a) | 4,000 | 4,570 | ||||||
Philip Morris International Inc. | ||||||||
3.38% 08/15/29 (a) | 14,000 | 14,417 | ||||||
4.13% 03/04/43 (a) | 7,000 | 7,148 | ||||||
Phillips 66 | 7,000 | 7,379 | ||||||
Phillips 66 Partners LP | ||||||||
3.75% 03/01/28 (a) | 3,000 | 3,063 | ||||||
4.68% 02/15/45 (a) | 6,000 | 6,183 | ||||||
Plains All American Pipeline LP/PAA Finance Corp. | ||||||||
3.65% 06/01/22 (a) | 11,000 | 11,261 | ||||||
4.70% 06/15/44 (a) | 6,000 | 5,774 | ||||||
5.75% 01/15/20 (a) | 8,000 | 8,135 | ||||||
PPL Capital Funding Inc. | 12,000 | 11,966 | ||||||
Precision Castparts Corp. | 10,000 | 11,359 | ||||||
Prudential Financial Inc. (5.70% fixed rate until 09/15/28; 2.67% + 3 month USD LIBOR thereafter) | 12,000 | 12,896 | ||||||
Public Service Company of Colorado | 7,000 | 7,546 | ||||||
Public Service Electric & Gas Co. | 20,000 | 20,072 | ||||||
QUALCOMM Inc. | ||||||||
2.90% 05/20/24 (a) | 2,000 | 2,030 | ||||||
3.00% 05/20/22 (a) | 5,000 | 5,093 | ||||||
| Principal Amount ($) | Fair $ | |||||||
3.25% 05/20/27 (a) | 2,000 | 2,038 | ||||||
4.30% 05/20/47 (a) | 3,000 | 3,154 | ||||||
Realty Income Corp. | 5,000 | 5,023 | ||||||
Regions Financial Corp. | 7,000 | 7,329 | ||||||
Reynolds American Inc. | 4,000 | 4,243 | ||||||
Rio Tinto Finance USA PLC | 6,000 | 6,703 | ||||||
Rockwell Automation Inc. | 6,000 | 6,776 | ||||||
Rockwell Collins Inc. | 3,000 | 3,133 | ||||||
Rogers Communications Inc. | 4,000 | 4,639 | ||||||
RPM International Inc. | 2,000 | 2,027 | ||||||
Ryder System Inc. | ||||||||
2.45% 09/03/19 (a) | 26,000 | 25,983 | ||||||
3.65% 03/18/24 (a) | 8,000 | 8,359 | ||||||
Sabine Pass Liquefaction LLC | ||||||||
4.20% 03/15/28 (a) | 4,000 | 4,200 | ||||||
5.00% 03/15/27 (a) | 2,000 | 2,194 | ||||||
Santander Holdings USA Inc. | ||||||||
2.65% 04/17/20 (a) | 19,000 | 18,996 | ||||||
3.70% 03/28/22 (a) | 12,000 | 12,276 | ||||||
4.40% 07/13/27 (a) | 4,000 | 4,178 | ||||||
Schlumberger Holdings Corp. | 11,000 | 11,440 | ||||||
Selective Insurance Group Inc. | 8,000 | 8,935 | ||||||
Sempra Energy | ||||||||
3.80% 02/01/38 (a) | 2,000 | 1,933 | ||||||
4.00% 02/01/48 (a) | 4,000 | 3,911 | ||||||
Shell International Finance BV | ||||||||
2.38% 08/21/22 (a) | 11,000 | 11,082 | ||||||
3.75% 09/12/46 (a) | 7,000 | 7,412 | ||||||
4.13% 05/11/35 (a) | 8,000 | 8,875 | ||||||
Shire Acquisitions Investments Ireland DAC | ||||||||
2.40% 09/23/21 (a) | 7,000 | 6,989 | ||||||
2.88% 09/23/23 (a) | 3,000 | 3,030 | ||||||
3.20% 09/23/26 (a) | 3,000 | 3,024 | ||||||
Simon Property Group LP | 4,000 | 4,157 | ||||||
Smithfield Foods Inc. | ||||||||
2.70% 01/31/20 (a)(h) | 8,000 | 7,976 | ||||||
Southern California Edison Co. | ||||||||
2.40% 02/01/22 (a) | 16,000 | 15,889 | ||||||
2.90% 03/01/21 (a) | 11,000 | 11,015 | ||||||
4.20% 03/01/29 (a) | 11,000 | 11,699 | ||||||
See Notes to Schedule of Investments and Notes to Financial Statements.
| 12 | State Street Income V.I.S. Fund |
Table of Contents
State Street Income V.I.S. Fund
Schedule of Investments, continued — June 30, 2019 (Unaudited)
| Principal Amount ($) | Fair $ | |||||||
Southern Company Gas Capital Corp. | 2,000 | 2,115 | ||||||
Southern Copper Corp. | 8,000 | 9,490 | ||||||
Southwestern Electric Power Co. | 7,000 | 6,873 | ||||||
Spectra Energy Partners LP | ||||||||
3.38% 10/15/26 (a) | 2,000 | 2,038 | ||||||
4.50% 03/15/45 (a) | 3,000 | 3,174 | ||||||
Spirit Realty LP | 10,000 | 10,119 | ||||||
Starbucks Corp. | 6,000 | 6,538 | ||||||
Steel Dynamics Inc. | 10,000 | 10,009 | ||||||
Sumitomo Mitsui Financial Group Inc. | 11,000 | 11,116 | ||||||
Suncor Energy Inc. | 3,000 | 3,107 | ||||||
Sunoco Logistics Partners Operations LP | 5,000 | 5,161 | ||||||
Sysco Corp. | 4,000 | 4,076 | ||||||
Tampa Electric Co. | 13,000 | 13,979 | ||||||
Target Corp. | ||||||||
2.50% 04/15/26 (a) | 5,000 | 5,038 | ||||||
3.38% 04/15/29 (a) | 12,000 | 12,734 | ||||||
Teck Resources Ltd. | 12,000 | 12,426 | ||||||
Teva Pharmaceutical Finance Netherlands III BV | ||||||||
1.70% 07/19/19 (a) | 46,000 | 45,902 | ||||||
2.20% 07/21/21 (a) | 8,000 | 7,597 | ||||||
Texas Instruments Inc. | 6,000 | 6,528 | ||||||
The Allstate Corp. | 3,000 | 3,344 | ||||||
The Allstate Corp. (5.75% fixed rate until 08/15/23; 2.94% + 3 month USD LIBOR thereafter) | 18,000 | 18,871 | ||||||
The Bank of New York Mellon Corp. (2.66% fixed rate until 05/16/22; 0.63% + 3 month USD LIBOR thereafter) | ||||||||
2.66% 05/16/23 (a)(b) | 5,000 | 5,038 | ||||||
The Bank of New York Mellon Corp. (4.63% fixed rate until 09/20/26; 3.13% + 3 month USD LIBOR thereafter) | ||||||||
4.63% 12/29/49 (a)(b) | 6,000 | 5,989 | ||||||
| Principal Amount ($) | Fair $ | |||||||
The Bank of Nova Scotia (4.65% fixed rate until 10/12/22; 2.65% + 3 month USD LIBOR thereafter) | ||||||||
4.65% 12/31/99 (a)(b) | 14,000 | 13,375 | ||||||
The Boeing Co. | ||||||||
3.25% 03/01/28 (a) | 3,000 | 3,115 | ||||||
The Cleveland Electric Illuminating Co. | ||||||||
4.55% 11/15/30 (a)(h) | 14,000 | 15,441 | ||||||
The Dow Chemical Co. | ||||||||
4.25% 10/01/34 (a) | 5,000 | 5,226 | ||||||
5.55% 11/30/48 (a)(h) | 4,000 | 4,750 | ||||||
The George Washington University | ||||||||
4.13% 09/15/48 (a) | 8,000 | 8,971 | ||||||
The Goldman Sachs Group Inc. | ||||||||
3.50% 11/16/26 (a) | 12,000 | 12,285 | ||||||
3.85% 01/26/27 (a) | 4,000 | 4,179 | ||||||
4.25% 10/21/25 (a) | 2,000 | 2,121 | ||||||
5.15% 05/22/45 (a) | 5,000 | 5,712 | ||||||
The Goldman Sachs Group Inc. (2.88% fixed rate until 10/31/21; 0.82% + 3 month USD LIBOR thereafter) | ||||||||
2.88% 10/31/22 (a)(b) | 7,000 | 7,055 | ||||||
The Goldman Sachs Group Inc. (2.91% fixed rate until 06/05/22; 1.05% + 3 month USD LIBOR thereafter) | ||||||||
2.91% 06/05/23 (a)(b) | 11,000 | 11,115 | ||||||
The Goldman Sachs Group Inc. (3.81% fixed rate until 04/23/28; 1.16% + 3 month USD LIBOR thereafter) | ||||||||
3.81% 04/23/29 (a)(b) | 4,000 | 4,159 | ||||||
The Goldman Sachs Group Inc. (4.02% fixed rate until 10/31/37; 1.37% + 3 month USD LIBOR thereafter) | ||||||||
4.02% 10/31/38 (a)(b) | 6,000 | 6,178 | ||||||
The Goldman Sachs Group Inc. (4.22% fixed rate until 05/01/28; 1.30% + 3 month USD LIBOR thereafter) | ||||||||
4.22% 05/01/29 (a)(b) | 11,000 | 11,773 | ||||||
The Hartford Financial Services Group Inc. 2.13% + 3 month USD LIBOR | ||||||||
4.64% 02/12/47 (a)(b)(h) | 10,000 | 8,460 | ||||||
The Home Depot Inc. | ||||||||
3.50% 09/15/56 (a) | 7,000 | 6,909 | ||||||
3.90% 12/06/28 (a) | 6,000 | 6,612 | ||||||
4.50% 12/06/48 (a) | 4,000 | 4,718 | ||||||
See Notes to Schedule of Investments and Notes to Financial Statements.
| State Street Income V.I.S. Fund | 13 |
Table of Contents
State Street Income V.I.S. Fund
Schedule of Investments, continued — June 30, 2019 (Unaudited)
| Principal Amount ($) | Fair $ | |||||||
The Interpublic Group of Companies Inc. | ||||||||
3.75% 10/01/21 (a) | 10,000 | 10,279 | ||||||
The Kroger Co. | ||||||||
2.95% 11/01/21 (a) | 14,000 | 14,161 | ||||||
4.65% 01/15/48 (a) | 4,000 | 4,020 | ||||||
The Mosaic Co. | ||||||||
5.63% 11/15/43 (a) | 3,000 | 3,303 | ||||||
The Sherwin-Williams Co. | ||||||||
2.25% 05/15/20 (a) | 7,000 | 6,986 | ||||||
2.75% 06/01/22 (a) | 7,000 | 7,071 | ||||||
The Southern Co. | ||||||||
4.40% 07/01/46 (a) | 4,000 | 4,223 | ||||||
The Toronto-Dominion Bank (3.63% fixed rate until 09/15/26; 2.21% + USD 5 year Swap Rate thereafter) | ||||||||
3.63% 09/15/31 (a)(b) | 10,000 | 10,166 | ||||||
The Walt Disney Co. | ||||||||
3.38% 11/15/26 (a)(h) | 5,000 | 5,251 | ||||||
4.50% 02/15/21 (a)(h) | 7,000 | 7,263 | ||||||
4.75% 11/15/46 (a)(h) | 4,000 | 4,930 | ||||||
6.65% 11/15/37 (a)(h) | 8,000 | 11,493 | ||||||
The Williams Companies Inc. | ||||||||
3.75% 06/15/27 (a) | 3,000 | 3,100 | ||||||
4.85% 03/01/48 (a) | 7,000 | 7,490 | ||||||
4.90% 01/15/45 (a) | 5,000 | 5,242 | ||||||
5.40% 03/04/44 (a) | 4,000 | 4,443 | ||||||
Time Warner Cable LLC | ||||||||
4.50% 09/15/42 (a) | 3,000 | 2,789 | ||||||
6.55% 05/01/37 (a) | 5,000 | 5,743 | ||||||
Total Capital International S.A. | ||||||||
3.46% 02/19/29 (a) | 12,000 | 12,767 | ||||||
TransCanada PipeLines Ltd. | ||||||||
4.25% 05/15/28 (a) | 12,000 | 12,972 | ||||||
4.88% 01/15/26 (a) | 3,000 | 3,341 | ||||||
Transcontinental Gas Pipe Line Company LLC | ||||||||
4.00% 03/15/28 (a) | 6,000 | 6,298 | ||||||
TWDC Enterprises 18 Corp. | ||||||||
4.13% 06/01/44 (a) | 6,000 | 6,819 | ||||||
Tyco Electronics Group S.A. | ||||||||
2.35% 08/01/19 (a) | 16,000 | 15,995 | ||||||
3.13% 08/15/27 (a) | 5,000 | 5,007 | ||||||
Tyson Foods Inc. | ||||||||
2.65% 08/15/19 (a) | 7,000 | 7,000 | ||||||
4.00% 03/01/26 (a) | 12,000 | 12,773 | ||||||
4.55% 06/02/47 (a) | 2,000 | 2,090 | ||||||
U.S. Bancorp | ||||||||
3.15% 04/27/27 (a) | 10,000 | 10,384 | ||||||
U.S. Bancorp (5.13% fixed rate until 01/15/21; 3.49% + 3 month USD LIBOR thereafter) | ||||||||
5.13% 12/29/49 (a)(b) | 36,000 | 36,721 | ||||||
| Principal Amount ($) | Fair $ | |||||||
Union Pacific Corp. | ||||||||
3.20% 06/08/21 (a) | 14,000 | 14,261 | ||||||
3.50% 06/08/23 (a) | 12,000 | 12,505 | ||||||
3.60% 09/15/37 (a) | 3,000 | 3,034 | ||||||
3.70% 03/01/29 (a) | 5,000 | 5,373 | ||||||
4.10% 09/15/67 (a) | 5,000 | 4,998 | ||||||
4.30% 03/01/49 (a) | 5,000 | 5,530 | ||||||
United Technologies Corp. | ||||||||
3.13% 05/04/27 (a) | 10,000 | 10,283 | ||||||
3.65% 08/16/23 (a) | 7,000 | 7,336 | ||||||
3.95% 08/16/25 (a) | 2,000 | 2,155 | ||||||
4.13% 11/16/28 (a) | 2,000 | 2,196 | ||||||
4.15% 05/15/45 (a) | 5,000 | 5,377 | ||||||
4.45% 11/16/38 (a) | 4,000 | 4,486 | ||||||
4.50% 06/01/42 (a) | 4,000 | 4,511 | ||||||
UnitedHealth Group Inc. | ||||||||
4.45% 12/15/48 (a) | 12,000 | 13,789 | ||||||
4.75% 07/15/45 (a) | 8,000 | 9,480 | ||||||
Vale Overseas Ltd. | ||||||||
4.38% 01/11/22 (a) | 6,000 | 6,185 | ||||||
6.25% 08/10/26 (a) | 12,000 | 13,623 | ||||||
Vale S.A. | ||||||||
5.63% 09/11/42 (a) | 5,000 | 5,365 | ||||||
Valero Energy Corp. | ||||||||
4.00% 04/01/29 (a) | 14,000 | 14,673 | ||||||
Valero Energy Partners LP | ||||||||
4.38% 12/15/26 (a) | 8,000 | 8,552 | ||||||
Ventas Realty LP | ||||||||
3.25% 10/15/26 (a) | 16,000 | 16,076 | ||||||
Verizon Communications Inc. | ||||||||
3.38% 02/15/25 (a) | 4,000 | 4,176 | ||||||
3.88% 02/08/29 (a) | 4,000 | 4,290 | ||||||
4.33% 09/21/28 (a) | 7,000 | 7,753 | ||||||
4.40% 11/01/34 (a) | 12,000 | 13,319 | ||||||
4.52% 09/15/48 (a) | 6,000 | 6,718 | ||||||
4.67% 03/15/55 (a) | 6,000 | 6,800 | ||||||
4.86% 08/21/46 (a) | 12,000 | 13,969 | ||||||
5.01% 04/15/49 (a) | 5,000 | 5,949 | ||||||
5.25% 03/16/37 (a) | 5,000 | 5,995 | ||||||
Viacom Inc. | ||||||||
3.45% 10/04/26 (a) | 7,000 | 6,996 | ||||||
4.38% 03/15/43 (a) | 5,000 | 4,892 | ||||||
4.50% 03/01/21 (a) | 30,000 | 30,920 | ||||||
5.25% 04/01/44 (a) | 3,000 | 3,275 | ||||||
Virginia Electric & Power Co. | ||||||||
4.00% 11/15/46 (a) | 7,000 | 7,390 | ||||||
Visa Inc. | ||||||||
3.15% 12/14/25 (a) | 4,000 | 4,198 | ||||||
4.30% 12/14/45 (a) | 7,000 | 8,239 | ||||||
Vistra Operations Company LLC | ||||||||
3.55% 07/15/24 (a)(h) | 17,000 | 17,141 | ||||||
Vodafone Group PLC | ||||||||
4.38% 05/30/28 (a) | 8,000 | 8,648 | ||||||
See Notes to Schedule of Investments and Notes to Financial Statements.
| 14 | State Street Income V.I.S. Fund |
Table of Contents
State Street Income V.I.S. Fund
Schedule of Investments, continued — June 30, 2019 (Unaudited)
| Principal Amount ($) | Fair $ | |||||||
5.25% 05/30/48 (a) | 4,000 | 4,406 | ||||||
Vornado Realty LP | ||||||||
3.50% 01/15/25 (a) | 4,000 | 4,099 | ||||||
Vulcan Materials Co. | 4,000 | 4,109 | ||||||
Walgreen Co. | 4,000 | 3,806 | ||||||
Walmart Inc. | ||||||||
3.63% 12/15/47 (a) | 6,000 | 6,411 | ||||||
3.70% 06/26/28 (a) | 7,000 | 7,637 | ||||||
3.95% 06/28/38 (a) | 3,000 | 3,344 | ||||||
4.05% 06/29/48 (a) | 7,000 | 8,014 | ||||||
WEC Energy Group Inc. | 10,000 | 10,501 | ||||||
Wells Fargo & Co. | ||||||||
3.90% 05/01/45 (a) | 3,000 | 3,220 | ||||||
4.15% 01/24/29 (a) | 14,000 | 15,234 | ||||||
4.75% 12/07/46 (a) | 14,000 | 15,940 | ||||||
Wells Fargo & Co. (3.20% fixed rate until 06/17/26; 1.17% + 3 month USD LIBOR thereafter) | 15,000 | 15,332 | ||||||
Wells Fargo & Co. (5.88% fixed rate until 06/15/25; 3.99% + 3 month USD LIBOR thereafter) | 15,000 | 16,262 | ||||||
Wells Fargo & Co. (5.90% fixed rate until 06/15/24; 3.11% + 3 month USD LIBOR thereafter) | 15,000 | 15,717 | ||||||
Wells Fargo & Co. 3.77% + 3 month USD LIBOR | 16,000 | 16,120 | ||||||
Western Midstream Operating LP | ||||||||
4.00% 07/01/22 (a) | 11,000 | 11,161 | ||||||
5.38% 06/01/21 (a) | 10,000 | 10,395 | ||||||
Willis North America Inc. | 6,000 | 6,188 | ||||||
WPP Finance 2010 | 10,000 | 10,341 | ||||||
WRKCo Inc. | 4,000 | 4,034 | ||||||
Xilinx Inc. | 5,000 | 5,073 | ||||||
Zoetis Inc. | ||||||||
3.00% 09/12/27 (a) | 3,000 | 3,016 | ||||||
3.90% 08/20/28 (a) | 6,000 | 6,445 | ||||||
|
| |||||||
| 5,414,558 | ||||||||
|
| |||||||
Non-Agency Collateralized Mortgage Obligations - 2.7% |
| |||||||
Banc of America Commercial Mortgage Trust 2016-UBS10 | 23,000 | 25,066 | ||||||
| Principal Amount ($) | Fair $ | |||||||
BANK 2018-BNK11 | 12,000 | 12,931 | ||||||
BANK 2019-BNK17 | 10,000 | 10,803 | ||||||
Citigroup Commercial Mortgage Trust2016-P6 | 31,273 | 33,459 | ||||||
Citigroup Commercial Mortgage Trust2018-C5 | 21,000 | 22,892 | ||||||
COMM 2014-CR14 Mortgage Trust | 25,000 | 26,854 | ||||||
GS Mortgage Securities Trust2016-GS3 | 33,000 | 33,554 | ||||||
GS Mortgage Securities Trust2017-GS8 | 63,977 | 67,429 | ||||||
GS Mortgage Securities Trust2018-GS9 | 25,000 | 27,161 | ||||||
JPMBB Commercial Mortgage Securities Trust2013-C12 | 15,000 | 15,840 | ||||||
JPMBB Commercial Mortgage Securities Trust2015-C32 | 20,000 | 21,086 | ||||||
LB-UBS Commercial Mortgage Trust2007-C6 | 148 | 148 | ||||||
6.11% 07/15/40 (a)(h) | 295 | 295 | ||||||
MASTR Alternative Loan Trust2003-5 | 741 | 13 | ||||||
Morgan Stanley Bank of America Merrill Lynch Trust2015-C21 | 377,326 | 15,127 | ||||||
Morgan Stanley Capital I Trust 2006-IQ11 | 50,000 | 50,641 | ||||||
UBS Commercial Mortgage Trust2018-C12 | 17,000 | 18,933 | ||||||
Wells Fargo Commercial Mortgage Trust2019-C50 | 15,000 | 15,841 | ||||||
WFRBS Commercial Mortgage Trust2013-C17 | 25,000 | 26,592 | ||||||
WFRBS Commercial Mortgage Trust 2014-LC14 | 58,000 | 62,271 | ||||||
|
| |||||||
| 486,936 | ||||||||
|
| |||||||
See Notes to Schedule of Investments and Notes to Financial Statements.
| State Street Income V.I.S. Fund | 15 |
Table of Contents
State Street Income V.I.S. Fund
Schedule of Investments, continued — June 30, 2019 (Unaudited)
| Principal Amount ($) | Fair $ | |||||||
Sovereign Bonds - 0.4% |
| |||||||
Government of Mexico | ||||||||
4.00% 10/02/23 (a) | 12,000 | 12,528 | ||||||
4.75% 03/08/44 (a) | 20,000 | 20,892 | ||||||
Government of Peru | 11,000 | 15,175 | ||||||
Government of Uruguay | 14,040 | 15,813 | ||||||
Panama Notas del Tesoro | 11,000 | 11,428 | ||||||
|
| |||||||
| 75,836 | ||||||||
|
| |||||||
Municipal Bonds and Notes - 0.8% |
| |||||||
American Municipal Power Inc. | 15,000 | 20,146 | ||||||
New Jersey Transportation Trust Fund Authority | 15,000 | 15,034 | ||||||
Port Authority of New York & New Jersey | 25,000 | �� | 29,915 | |||||
State of California | ||||||||
4.60% 04/01/38 (a) | 15,000 | 16,380 | ||||||
5.70% 11/01/21 (a) | 40,000 | 43,450 | ||||||
State of Illinois | 10,000 | 10,531 | ||||||
The University of Texas System | 10,000 | 10,166 | ||||||
|
| |||||||
| 145,622 | ||||||||
|
| |||||||
| Total Bonds and Notes (Cost $16,934,011) | 17,508,186 | |||||||
|
| |||||||
| Number of Shares | Fair $ | |||||||
| Domestic Equity - 0.1% | ||||||||
Preferred Stock - 0.1% | ||||||||
Wells Fargo & Co. 3.09% + 3 month USD LIBOR | 932 | 24,474 | ||||||
|
| |||||||
| Total Investments in Securities (Cost $16,949,097) |
| 17,532,660 | ||||||
|
| |||||||
| Short-Term Investments - 23.1% |
| |||||||
State Street Institutional U.S. Government Money Market Fund - Class G Shares 2.35% | 4,107,770 | 4,107,770 | ||||||
|
| |||||||
| Total Investments (Cost $21,056,867) | 21,640,430 | |||||||
| Liabilities in Excess of Other Assets, net - (21.4)% |
| (3,820,542 | ) | |||||
|
| |||||||
| NET ASSETS - 100.0% | 17,819,888 | |||||||
|
| |||||||
Other Information:
Centrally Cleared Credit Default Swaps
Reference Entity | Counterparty | Notional Amount (000s omitted) | Contract Annual Fixed Rate/ Payment Frequency | Termination Date | Market Value | Unamortized Upfront Payments Received | Unrealized Appreciation/ Depreciation | |||||||||||||||||||
Buy Protection |
| |||||||||||||||||||||||||
Markit CDX North America Investment Grade Index | Intercontinental Exchange | $ | 71 | | 1.00%/ Quarterly | 06/20/24 | $ | (1,510 | ) | $ | (1,374 | ) | $ | (136 | ) | |||||||||||
|
| |||||||||||||||||||||||||
Sell Protection |
| |||||||||||||||||||||||||
Markit CDX North America High Yield Index | Intercontinental Exchange | $ | 657 | | 5.00%/ Quarterly | 06/20/24 | $ | 49,268 | $ | 39,151 | $ | 10,117 | ||||||||||||||
|
| |||||||||||||||||||||||||
| $ | 9,981 | |||||||||||||||||||||||||
|
| |||||||||||||||||||||||||
See Notes to Schedule of Investments and Notes to Financial Statements.
| 16 | State Street Income V.I.S. Fund |
Table of Contents
State Street Income V.I.S. Fund
Schedule of Investments, continued — June 30, 2019 (Unaudited)
Centrally Cleared Interest Rate Swaps
| Counterparty | Notional Amount (000s omitted) | Fund Pays/ Receives Fixed Rate/ Payment Frequency | Floating Rate | Contract Annual Fixed Rate | Termination Date | Market Value | Unamortized Upfront Payments Received | Unrealized Depreciation | ||||||||||||||||||||||||
CME Group, Inc. | $ | 883 | | Pays/ Quarterly | | 3 Month U.S. Dollar LIBOR | | 3.05% | 11/19/21 | $ | (26,453 | ) | $ | — | $ | (26,453 | ) | |||||||||||||||
CME Group, Inc. | 884 | | Pays/ Quarterly | | 3 Month U.S. Dollar LIBOR | | 3.06% | 11/19/21 | (26,553 | ) | — | (26,553 | ) | |||||||||||||||||||
|
| |||||||||||||||||||||||||||||||
| $ | (53,006 | ) | ||||||||||||||||||||||||||||||
|
| |||||||||||||||||||||||||||||||
| $ | (43,025 | ) | ||||||||||||||||||||||||||||||
|
| |||||||||||||||||||||||||||||||
The Fund had the following long futures contracts open at June 30, 2019:
| Description | Expiration date | Number of Contracts | Notional Amount | Value | Unrealized Appreciation | |||||||||||||||
2 Yr. U.S. Treasury Notes Futures | September 2019 | 15 | $ | 3,206,776 | $ | 3,227,695 | $ | 20,919 | ||||||||||||
5 Yr. U.S. Treasury Notes Futures | September 2019 | 11 | 1,280,810 | 1,299,719 | 18,909 | |||||||||||||||
10 Yr. U.S. Treasury Notes Futures | September 2019 | 12 | 1,511,303 | 1,535,624 | 24,321 | |||||||||||||||
|
| |||||||||||||||||||
| $ | 64,149 | |||||||||||||||||||
|
| |||||||||||||||||||
The Fund had the following short futures contracts open at June 30, 2019:
| Description | Expiration date | Number of Contracts | Notional Amount | Value | Unrealized Depreciation | |||||||||||||||
U.S. Long Bond Futures | September 2019 | 2 | $ | (304,371 | ) | $ | (311,187 | ) | $ | (6,816 | ) | |||||||||
10 Yr. U.S. Treasury Ultra Futures | September 2019 | 5 | (674,834 | ) | (690,625 | ) | (15,791 | ) | ||||||||||||
|
| |||||||||||||||||||
| $ | (22,607 | ) | ||||||||||||||||||
|
| |||||||||||||||||||
| $ | 41,542 | |||||||||||||||||||
|
| |||||||||||||||||||
During the period ended June 30, 2019, average notional values related to derivative contracts were as follows:
Purchased Put Options | Purchased Call Options | Written Put Options | Written Call Options | Long Futures Contracts | Short Futures Contracts | Credit Default Swap Contracts | Interest Rate Swap Contracts | |||||||||||||||||||||||||
Average Notional Value | $ | 536 | $ | — | $ | 54 | $ | — | $ | 6,174,503 | $ | 912,913 | $ | 588,517 | $ | 1,766,945 | ||||||||||||||||
See Notes to Schedule of Investments and Notes to Financial Statements.
| State Street Income V.I.S. Fund | 17 |
Table of Contents
State Street Income V.I.S. Fund
Notes to Schedule of Investments
The views expressed in this document reflect our judgment as of the publication date and are subject to change at any time without notice. The securities cited may not be representative of the Fund’s future investments and should not be construed as a recommendation to purchase or sell a particular security. See the Fund’s summary prospectus and statutory prospectus for complete descriptions of investment objectives, policies, risks and permissible investments.
| (a) | At June 30, 2019, all or a portion of this security was pledged to cover collateral requirements for futures, options, swaps and/or TBAs. |
| (b) | Variable Rate Security - Interest rate shown is rate in effect at June 30, 2019. For securities based on a published reference rate and spread, the reference rate and spread are indicated in the description above. |
| (c) | Step coupon bond. |
| (d) | Settlement is on a delayed delivery or when-issued basis with final maturity to be announced (“TBA”) in the future. |
| (e) | Interest only security. These securities represent the right to receive the monthly interest payments on an underlying pool of mortgages. Payments of principal on the pool reduce the value of the “interest only” holding. |
| (f) | Principal only security. These securities represent the right to receive the monthly principal payments on an underlying pool of mortgages. No payments of interest on the pool are passed through to the “principal only” holder. |
| (g) | Coupon amount represents effective yield. |
| (h) | Pursuant to Rule 144A of the Securities Act of 1933, as amended, these securities may be resold in transactions exempt from registration, normally to qualified institutional buyers. At June 30, 2019, these securities amounted to $377,047 or 2.12% of the net assets of the State Street Income V.I.S. Fund. These securities have been determined to be liquid using procedures established by the State Street Variable Insurance Series Funds, Inc.’s Board of Directors. |
| (i) | Sponsored by SSGA Funds Management, Inc., the Fund’s investment adviser and administrator, and an affiliate of State Street Bank & Trust Co., the Funds’sub-administrator, custodian and accounting agent. |
| † | Percentages are based on net assets as of June 30, 2019. |
Abbreviations:
CMT - Constant Maturity Treasury
LIBOR - London Interbank Offered Rate
REIT - Real Estate Investment Trust
REMIC - Real Estate Mortgage Investment Conduit
STRIPS - Separate Trading of Registered Interest and Principal of Security
TBA - To Be Announced
The following table presents the Fund’s investments measured at fair value on a recurring basis at June 30, 2019:
| Investments | Level 1 | Level 2 | Level 3 | Total | ||||||||||||
Investments in Securities |
| |||||||||||||||
U.S. Treasuries | $ | — | $ | 4,612,056 | $ | — | $ | 4,612,056 | ||||||||
Agency Mortgage Backed | — | 5,999,383 | — | 5,999,383 | ||||||||||||
Agency Collateralized Mortgage Obligations | — | 253,565 | — | 253,565 | ||||||||||||
Asset Backed | — | 520,230 | — | 520,230 | ||||||||||||
Corporate Notes | — | 5,414,558 | — | 5,414,558 | ||||||||||||
Non-Agency Collateralized Mortgage Obligations | — | 486,936 | — | 486,936 | ||||||||||||
Sovereign Bonds | — | 75,836 | — | 75,836 | ||||||||||||
Municipal Bonds and Notes | — | 145,622 | — | 145,622 | ||||||||||||
Preferred Stock | 24,474 | — | — | 24,474 | ||||||||||||
Short-Term Investments | 4,107,770 | — | — | 4,107,770 | ||||||||||||
|
|
|
|
|
|
|
| |||||||||
Total Investments in Securities | $ | 4,132,244 | $ | 17,508,186 | $ | — | $ | 21,640,430 | ||||||||
|
|
|
|
|
|
|
| |||||||||
Other Financial Instruments |
| |||||||||||||||
Credit Default Swap Contracts - Unrealized Appreciation | $ | — | $ | 10,117 | $ | — | $ | 10,117 | ||||||||
Credit Default Swap Contracts - Unrealized Depreciation | — | (136 | ) | — | (136 | ) | ||||||||||
Interest Rate Swap Contracts - Unrealized Depreciation | — | (53,006 | ) | — | (53,006 | ) | ||||||||||
Long Futures Contracts - Unrealized Appreciation | 64,149 | — | — | 64,149 | ||||||||||||
Short Futures Contracts - Unrealized Depreciation | (22,607 | ) | — | — | (22,607 | ) | ||||||||||
|
|
|
|
|
|
|
| |||||||||
Total Other Financial Instruments | $ | 41,542 | $ | (43,025 | ) | $ | — | $ | (1,483 | ) | ||||||
|
|
|
|
|
|
|
| |||||||||
See Notes to Schedule of Investments and Notes to Financial Statements.
| 18 | State Street Income V.I.S. Fund |
Table of Contents
State Street Income V.I.S. Fund
Notes to Schedule of Investments, continued — June 30, 2019 (Unaudited)
Affiliate Table
| Number of Shares Held at 12/31/18 | Value At 12/31/18 | Cost of Purchases | Proceeds from Shares Sold | Number of Shares Held at 6/30/19 | Value at 6/30/19 | Dividend Income | ||||||||||||||||||||||
State Street Institutional U.S. Government Money Market Fund - Class G Shares | 3,131,172 | $ | 3,131,172 | $ | 6,400,499 | $ | 5,423,901 | 4,107,770 | $ | 4,107,770 | $ | 43,965 | ||||||||||||||||
See Notes to Schedule of Investments and Notes to Financial Statements.
| State Street Income V.I.S. Fund | 19 |
Table of Contents
State Street Income V.I.S. Fund
Selected data based on a share outstanding throughout the periods indicated
| 6/30/19† | 12/31/18 | 12/31/17 | 12/31/16 | 12/31/15* | 12/31/14* | |||||||||||||||||||
| Inception date | 1/3/95 | |||||||||||||||||||||||
Net asset value, beginning of period | $ | 11.07 | $ | 11.49 | $ | 11.37 | $ | 11.25 | $ | 11.56 | $ | 11.25 | ||||||||||||
|
|
|
|
|
|
|
|
|
|
|
| |||||||||||||
Income/(loss) from investment operations: |
| |||||||||||||||||||||||
Net investment income | 0.13 | (a) | 0.25 | (a) | 0.19 | (a) | 0.24 | 0.25 | 0.27 | |||||||||||||||
Net realized and unrealized gains/(losses) on investments | 0.57 | (0.41 | ) | 0.18 | 0.09 | (0.30 | ) | 0.31 | ||||||||||||||||
|
|
|
|
|
|
|
|
|
|
|
| |||||||||||||
Total income/(loss) from investment operations | 0.70 | (0.16 | ) | 0.37 | 0.33 | (0.05 | ) | 0.58 | ||||||||||||||||
|
|
|
|
|
|
|
|
|
|
|
| |||||||||||||
Less distributions from: |
| |||||||||||||||||||||||
Net investment income | — | 0.26 | 0.25 | 0.21 | 0.26 | 0.27 | ||||||||||||||||||
|
|
|
|
|
|
|
|
|
|
|
| |||||||||||||
Total distributions | — | 0.26 | 0.25 | 0.21 | 0.26 | 0.27 | ||||||||||||||||||
|
|
|
|
|
|
|
|
|
|
|
| |||||||||||||
Net asset value, end of period | $ | 11.77 | $ | 11.07 | $ | 11.49 | $ | 11.37 | $ | 11.25 | $ | 11.56 | ||||||||||||
|
|
|
|
|
|
|
|
|
|
|
| |||||||||||||
Total Return(b) | 6.32 | % | (1.42 | )% | 3.25 | % | 2.98 | % | (0.42 | )% | 5.12 | % | ||||||||||||
Ratios/Supplemental Data: |
| |||||||||||||||||||||||
Net assets, end of period (in thousands) | $ | 17,820 | $ | 18,685 | $ | 21,847 | $ | 25,582 | $ | 28,375 | $ | 32,668 | ||||||||||||
Ratios to average net assets: |
| |||||||||||||||||||||||
Net expenses | 1.04 | %** | 1.00 | % | 1.36 | % | 1.15 | % | 1.06 | %(c) | 0.91 | %(d) | ||||||||||||
Gross expenses | 1.04 | %** | 1.00 | % | 1.36 | % | 1.15 | % | 1.11 | % | 0.91 | % | ||||||||||||
Net investment income | 2.27 | %** | 2.25 | % | 1.62 | % | 1.98 | % | 2.06 | % | 2.14 | % | ||||||||||||
Portfolio turnover rate | 58 | % | 182 | % | 255 | % | 220 | % | 241 | % | 282 | % | ||||||||||||
Notes to Financial Highlights
| (a) | Per share values have been calculated using the average shares method. |
| (b) | Total returns are historical and assume changes in share price, reinvestment of dividends and capital gains distributions and do not include the effect of insurance contract charges. Past performance does not guarantee future results. |
| (c) | Reflects a voluntary reimbursement of other operating expenses by GE Asset Management, Inc., the Fund’s investment adviser and administrator prior to July 1, 2016. |
| (d) | Includes contractual management fee waiver related to the Fund’s investments in the GE Institutional Money Market Fund (the “Money Market Fund”). The fee waiver agreement was terminated effective June 30, 2014 with the closure of the Money Market Fund. |
| † | Unaudited. |
| * | Beginning with the year ended December 31, 2016, the Fund was audited by Ernst & Young LLP. The previous years were audited by another independent registered public accounting firm. |
| ** | Annualized for periods less than one year. |
The accompanying Notes are an integral part of these financial statements.
| 20 | Financial Highlights |
Table of Contents
State Street Income V.I.S. Fund
Statement of Assets and Liabilities — June 30, 2019 (Unaudited)
Assets | ||||
Investments in securities, at fair value (cost $16,949,097) | $ | 17,532,660 | ||
Short-term affiliated investments, at fair value | 4,107,770 | |||
Cash collateral on deposit with broker for swap contracts | 6,838 | |||
Receivable for investments sold | 4,302,729 | |||
Income receivables | 97,346 | |||
Receivable for fund shares sold | 514 | |||
Income receivable from affiliated investments | 7,905 | |||
Receivable for accumulated variation margin on swap contracts | 50,271 | |||
Receivable for accumulated variation margin on futures contracts | 41,594 | |||
|
| |||
Total assets | 26,147,627 | |||
|
| |||
Liabilities | ||||
Net cash collateral on futures contracts due to broker | 41,682 | |||
Payable for investments purchased | 8,187,142 | |||
Payable for fund shares redeemed | 7,709 | |||
Payable for accumulated variation margin on swap contracts | 55,355 | |||
Payable to the Adviser | 7,311 | |||
Payable for custody, fund accounting andsub-administration fees | 7,703 | |||
Accrued other expenses | 20,837 | |||
|
| |||
Total liabilities | 8,327,739 | |||
|
| |||
Net Assets | $ | 17,819,888 | ||
|
| |||
Net Assets Consist of: | ||||
Capital paid in | $ | 17,332,580 | ||
Total distributable earnings (loss) | 487,308 | |||
|
| |||
Net Assets | $ | 17,819,888 | ||
|
| |||
Shares outstanding ($0.01 par value; unlimited shares authorized) | 1,514,211 | |||
Net asset value per share | $ | 11.77 | ||
The accompanying Notes are an integral part of these financial statements.
| Statements of Assets and Liabilities | 21 |
Table of Contents
State Street Income V.I.S. Fund
Statement of Operations — For the period ended June 30, 2019 (Unaudited)
Investment Income | ||||
Income | ||||
Dividend | $ | 683 | ||
Interest | 256,606 | |||
Income from affiliated investments | 43,965 | |||
|
| |||
Total income | 301,254 | |||
|
| |||
Expenses | ||||
Advisory and administration fees | 45,476 | |||
Directors’ fees | 9,209 | |||
Custody, fund accounting andsub-administration fees | 13,234 | |||
Professional fees | 17,533 | |||
Printing and shareholder reports | 8,749 | |||
Other expenses | 778 | |||
|
| |||
Total Expenses | 94,979 | |||
|
| |||
Net investment income | $ | 206,275 | ||
|
| |||
Net Realized and Unrealized Gain (Loss) on Investments | ||||
Realized gain (loss) on: | ||||
Unaffiliated investments | $ | 209,614 | ||
Futures | 75,408 | |||
Written options | 248 | |||
Swap contracts | 6,478 | |||
Increase (decrease) in unrealized appreciation/depreciation on: | ||||
Unaffiliated investments | 657,216 | |||
Futures | (23,828 | ) | ||
Swap contracts | (12,824 | ) | ||
|
| |||
Net realized and unrealized gain (loss) on investments | 912,312 | |||
|
| |||
Net Increase in Net Assets Resulting from Operations | $ | 1,118,587 | ||
|
| |||
The accompanying Notes are an integral part of these financial statements.
| 22 | Statement of Operations |
Table of Contents
State Street Income V.I.S. Fund
Statements of Changes in Net Assets
Six Months Ended June 30, 2019* | Year Ended December 31, 2018 | |||||||
Increase (Decrease) in Net Assets | ||||||||
Operations: | ||||||||
Net investment income | $ | 206,275 | $ | 446,877 | ||||
Net realized gain (loss) on investments, futures, written options and swap contracts | 291,748 | (470,496 | ) | |||||
Net increase (decrease) in unrealized appreciation/depreciation on investments, futures and swap contracts | 620,564 | (306,952 | ) | |||||
|
|
|
| |||||
Net increase (decrease) from operations | 1,118,587 | (330,571 | ) | |||||
|
|
|
| |||||
Distributions to shareholders: | ||||||||
Total distributions | — | (420,122 | ) | |||||
|
|
|
| |||||
Increase (decrease) in assets from operations and distributions | 1,118,587 | (750,693 | ) | |||||
|
|
|
| |||||
Share transactions: | ||||||||
Proceeds from sale of shares | 97,069 | 412,104 | ||||||
Value of distributions reinvested | — | 420,122 | ||||||
Cost of shares redeemed | (2,081,247 | ) | (3,243,066 | ) | ||||
|
|
|
| |||||
Net increase (decrease) from share transactions | (1,984,178 | ) | (2,410,840 | ) | ||||
|
|
|
| |||||
Total increase (decrease) in net assets | (865,591 | ) | (3,161,533 | ) | ||||
Net Assets | ||||||||
Beginning of period | 18,685,479 | 21,847,012 | ||||||
|
|
|
| |||||
End of period | $ | 17,819,888 | $ | 18,685,479 | ||||
|
|
|
| |||||
Changes in Fund Shares | ||||||||
Shares sold | 8,547 | 36,818 | ||||||
Issued for distributions reinvested | — | 38,089 | ||||||
Shares redeemed | (182,520 | ) | (288,624 | ) | ||||
|
|
|
| |||||
Net decrease in fund shares | (173,973 | ) | (213,717 | ) | ||||
|
|
|
| |||||
| * | Unaudited. |
The accompanying Notes are an integral part of these financial statements.
| Statements of Changes in Net Assets | 23 |
Table of Contents
State Street Income V.I.S. Fund
Notes to Financial Statements — June 30, 2019 (Unaudited)
| 1. | Organization of the Company |
State Street Variable Insurance Series Funds, Inc. (the “Company”) was incorporated under the laws of the Commonwealth of Virginia on May 14, 1984 and is registered under the Investment Company Act of 1940, as amended (the “1940 Act”), as anopen-end management investment company. The Company is currently composed of the following seven investment portfolios (collectively, the “Funds”): State Street U.S. Equity V.I.S. Fund, State Street S&P 500 Index V.I.S. Fund, State Street Premier Growth Equity V.I.S. Fund, State StreetSmall-Cap Equity V.I.S. Fund, State Street Total Return V.I.S. Fund, State Street Income V.I.S. Fund (the “Fund”) and State Street Real Estate Securities V.I.S. Fund. Each Fund is a diversified investment company within the meaning of the 1940 Act.
Shares of the Funds of the Company are offered only to insurance company separate accounts that fund certain variable life insurance contracts and variable annuity contracts.
The Company currently offers one share class (Class 1) of the Fund as an investment option for variable life insurance and variable annuity contracts.
Under the Company’s organizational documents, its officers and directors are indemnified against certain liabilities arising out of the performance of their duties to the Company. Additionally, in the normal course of business, the Company enters into contracts with service providers that contain general indemnification clauses. The Company’s maximum exposure under these arrangements is unknown as this would involve future claims that may be made against the Company that have not yet occurred.
| 2. | Summary of Significant Accounting Policies |
The following is a summary of significant accounting policies followed by the Company in the preparation of its financial statements:
The preparation of financial statements in accordance with U.S. generally accepted accounting principles (“U.S. GAAP”) requires management to make estimates and assumptions that affect the reported amounts and disclosures in the financial statements. Actual results could differ from those estimates. The Fund is an investment company under U.S. GAAP and follows the accounting and reporting guidance applicable to investment companies.
Security Valuation The Fund’s investments are valued at fair value each day that the New York Stock Exchange (“NYSE”) is open and, for financial reporting purposes, as of the report date should the reporting period end on a day that the NYSE is not open. Fair value is generally defined as the price a fund would receive to sell an asset or pay to transfer a liability in an orderly transaction between market participants at the measurement date. By its nature, a fair value price is a good faith estimate of the valuation in a current sale and may not reflect an actual market price. The investments of the Fund are valued pursuant to the policy and procedures developed by the Oversight Committee (the “Committee”) and approved by the Company’s Board of Directors (the “Board”). The Committee provides oversight of the valuation of investments for the Fund. The Board has responsibility for overseeing the determination of the fair value of investments.
Valuation techniques used to value the Fund’s investments by major category are as follows:
| • | Equity investments (including preferred stocks) traded on a recognized securities exchange for which market quotations are readily available are valued at the last sale price or official closing price, as applicable, on the primary market or exchange on which they trade. Equity investments traded on a recognized exchange for which there were no sales on that day are valued at the last published sale price or at fair value. |
| • | Government and municipal fixed income securities are generally valued using quotations from independent pricing services or brokers. Certain government inflation-indexed securities may require a calculated fair valuation as the cumulative inflation is contained within the price provided by the pricing service or broker. For these securities, the inflation component of the price is “cleaned” from the pricing service or broker price utilizing the published inflation factors in order to ensure proper accrual of income. |
| • | Debt obligations (including short term investments and convertible debt securities) are valued using quotations from independent pricing services or brokers or are generally valued at the last reported evaluated prices. |
| 24 | Notes to Financial Statements |
Table of Contents
State Street Income V.I.S. Fund
Notes to Financial Statements, continued — June 30, 2019 (Unaudited)
| • | Exchange-traded futures contracts are valued at the closing settlement price on the primary market on which they are traded most extensively. Exchange-traded futures contracts traded on a recognized exchange for which there were no sales on that day are valued at the last reported sale price obtained from independent pricing services or brokers or at fair value. |
| • | Swap agreements are valued daily based upon prices supplied by Board approved pricing vendors or through brokers. Depending on the product and terms of the transaction, the value of agreements is determined using a series of techniques including valuation models that incorporate a number of market data factors, such as discounted cash flows, yields, curves, trades and values of the underlying reference instruments. In the event SSGA Funds Management, Inc. (the “Adviser” or “SSGA FM”) is unable to obtain an independent, third-party valuation the agreements will be fair valued. |
| • | Options on futures are priced at their last sale price on the principal market on which they are traded on the valuation date. If there were no sales on that day, options on futures are valued at either the last reported sale or official closing price on their primary exchange determined in accordance with the valuation policy and procedures approved by the Board. |
In the event prices or quotations are not readily available or that the application of these valuation methods results in a price for an investment that is deemed to be not representative of the fair value of such investment, fair value will be determined in good faith by the Committee, in accordance with the valuation policy and procedures approved by the Board.
The Fund values its assets and liabilities at fair value using a fair value hierarchy consisting of three broad levels that prioritize the inputs to valuation techniques giving the highest priority to readily available unadjusted quoted prices in active markets for identical assets or liabilities (Level 1 measurements) and the lowest priority to unobservable inputs (Level 3 measurements) when market prices are not readily available or reliable. The categorization of a value determined for an investment within the hierarchy is based upon the pricing transparency of the investment and is not necessarily an indication of the risk associated with investing in it.
The three levels of the fair value hierarchy are as follows:
| • | Level 1 — Unadjusted quoted prices in active markets for an identical asset or liability; |
| • | Level 2 — Inputs other than quoted prices included within Level 1 that are observable for the asset or liability either directly or indirectly, including quoted prices for similar assets or liabilities in active markets, quoted prices for identical or similar assets or liabilities in markets that are not considered to be active, inputs other than quoted prices that are observable for the asset or liability (such as exchange rates, financing terms, interest rates, yield curves, volatilities, prepayment speeds, loss severities, credit risks and default rates) or other market-corroborated inputs; and |
| • | Level 3 — Unobservable inputs for the asset or liability, including the Committee’s assumptions used in determining the fair value of investments. |
The value of the Fund’s investments according to the fair value hierarchy as of June 30, 2019 is disclosed in the Fund’s Schedule of Investments.
Investment Transactions and Income Recognition Investment transactions are accounted for on trade date for financial reporting purposes. Realized gains and losses from the sale or disposition of investments and foreign exchange transactions, if any, are determined using the identified cost method.
Dividend income and capital gain distributions, if any, are recognized on theex-dividend date, net of any foreign taxes withheld at source, if any.
Interest income is recorded daily on an accrual basis. All premiums and discounts are amortized/accreted for financial reporting purposes.
Non-cash dividends received in the form of stock are recorded as dividend income at fair value.
Expenses Certain expenses, which are directly identifiable to a specific Fund, are applied to the Fund within the Company. Other expenses which cannot be attributed to a specific Fund are allocated in such a manner as deemed equitable, taking into consideration the nature and type of expense and the relative net assets of the Fund within the Company.
Foreign Currency Translation The accounting records of the Fund are maintained in U.S. dollars. Foreign currencies as well as investment securities and other assets and liabilities denominated in a foreign currency are translated to U.S. dollars
| Notes to Financial Statements | 25 |
Table of Contents
State Street Income V.I.S. Fund
Notes to Financial Statements, continued — June 30, 2019 (Unaudited)
using exchange rates at period end. Purchases and sales of securities, income receipts and expense payments denominated in foreign currencies are translated into U.S. dollars at the prevailing exchange rate on the respective dates of the transactions.
The effects of exchange rate fluctuations on investments are included with the net realized and unrealized gain (loss) on investment securities. Other foreign currency transactions resulting in realized and unrealized gain (loss) are disclosed separately.
Foreign Taxes The Fund may be subject to foreign taxes (a portion of which may be reclaimable) on income, stock dividends, realized and unrealized capital gains on investments or certain foreign currency transactions. Foreign taxes are recorded in accordance with SSGA FM’s understanding of the applicable foreign tax regulations and rates that exist in the foreign jurisdictions in which the Fund invests. These foreign taxes, if any, are paid by the Fund and are reflected in the Statement of Operations, if applicable. Foreign taxes payable or deferred as of June 30, 2019, if any, are disclosed in the Fund’s Statement of Assets and Liabilities.
Distributions The Fund declares and pays any dividends from net investment income annually.
Net realized capital gains, if any, are distributed annually, unless additional distributions are required for compliance with applicable tax regulations. The amount and character of income and capital gains to be distributed are determined in accordance with applicable tax regulations which may differ from net investment income and realized gains recognized for U.S. GAAP purposes.
| 3. | Securities and Other Investments |
Delayed Delivery Transactions and When-Issued Securities During the period ended June 30, 2019, the Fund transacted in securities on a delayed delivery or when-issued basis. Payment and delivery may take place after the customary settlement period for that security. The price of the underlying securities and the date when the securities will be delivered and paid for are fixed at the time the transaction is negotiated. The securities purchased on a delayed delivery or when-issued basis are identified as such in the Fund’s Schedule of Investments. The Fund may receive compensation for interest forgone in the purchase of a delayed delivery or when-issued security. With respect to such purchase commitments, the Fund identifies securities as segregated in its records with a value at least equal to the amount of the commitment. Losses may arise due to changes in the value of the underlying securities or if the counterparty does not perform under the contract’s terms, or if the issuer does not issue the securities due to political, economic or other factors.
To-Be-Announced Transactions The Fund may seek to obtain exposure to U.S. agency mortgage pass-through securities through the use of“to-be-announced” or “TBA transactions.” “TBA” refers to a commonly used mechanism for the forward settlement of U.S. agency mortgage pass-through securities. In a TBA transaction, the buyer and seller decide on general trade parameters, such as agency, settlement date, coupon, and price.
The Fund may use TBA transactions to “roll over” such agreements prior to the settlement date. This type of TBA transaction is sometimes known as a “TBA roll.” In a TBA roll, the Fund generally will sell the obligation to purchase the pools stipulated in the TBA agreement prior to the settlement date and will enter into a new TBA agreement for future delivery of pools of mortgage pass-through securities. The Fund may also enter into TBA agreements and settle such transactions on the stipulated settlement date by accepting actual receipt or delivery of the pools of mortgage pass-through securities.
Default by or bankruptcy of a counterparty to a TBA transaction would expose the Fund to possible loss because of adverse market action, expenses or delays in connection with the purchase or sale of the pools of mortgage pass-through securities specified in the TBA transaction. To minimize this risk, the Fund will enter into TBA transactions only with established counterparties. The Fund’s use of “TBA rolls” may impact portfolio turnover, transaction costs and capital gain distributions to shareholders.
| 4. | Derivative Financial Instruments |
Futures Contracts The Fund may enter into futures contracts to meet the Fund’s objectives. A futures contract is a standardized, exchange-traded agreement to buy or sell a financial instrument at a set price on a future date. Upon entering into a futures contract, the Fund is required to deposit with the broker, cash or securities in an amount equal to the minimum
| 26 | Notes to Financial Statements |
Table of Contents
State Street Income V.I.S. Fund
Notes to Financial Statements, continued — June 30, 2019 (Unaudited)
initial margin requirements of the clearing house. Subsequent payments are made or received by the Fund equal to the daily change in the contract value and are recorded as variation margin receivable or payable with a corresponding offset to unrealized gains or losses. The Fund recognizes a realized gain or loss when the contract is closed.
Losses may arise if the value of a futures contract decreases due to unfavorable changes in the market rates or values of the underlying instrument during the term of the contract or if the counterparty does not perform under the contract. The use of futures contracts also involves the risk that the movements in the price of the futures contracts do not correlate with the movement of the assets underlying such contracts.
For the period ended June 30, 2019, the Fund entered into futures contracts to manage interest rate risk.
Options on Futures Contracts The Fund may purchase and write options, including options on futures contracts, subject to certain limitations. Writing puts and buying calls tend to increase the Fund’s exposure to the underlying instrument while buying puts and writing calls tend to decrease the Fund’s exposure to the underlying instrument. The Fund will not enter into a transaction involving options for speculative purposes. The Fund’s risks in using these contracts include changes in the value of the underlying instruments,non-performance of the counterparties under the contracts’ terms and changes in the liquidity of the secondary market for the contracts.
When the Fund writes an option, the amount of the premium received is recorded as a liability and is subsequently adjusted to the current fair value of the option written. Premiums received from writing options that expire unexercised are treated by the Fund on the expiration date as realized gain from investments. The difference between the premium and the amount paid on effecting a closing purchase transaction, including brokerage commissions, is also treated as a realized gain, or if the premium is less than the amount paid for the closing purchase, as a realized loss. When an option is exercised, the proceeds from the sale of the underlying instrument or the cost basis of the securities purchased is adjusted by the original premium received or paid. In return for a premium paid, call and put options on futures contracts give the holder the right, but not the obligation, to purchase or sell, respectively, a position in a particular futures contract at a specified exercise price.
For the period ended June 30, 2019, the Fund purchased and wrote options in order to manage interest rate risk.
Credit Default Swaps During the period ended June 30, 2019, the Fund engaged in credit default swaps to manage credit risk. When the Fund is the buyer in a credit default swap contract, the Fund is entitled to receive the par (or other agreed upon) value (full notional value) of a referenced debt obligation (or basket of debt obligations) from the counterparty (or central clearing party (“CCP”) in the case of a centrally cleared swap) to the contract if a credit event by a third party, such as a U.S. or foreign corporate issuer or sovereign issuer, on the debt obligation occurs. In return, the Fund pays the counterparty a periodic stream of payments over the term of the contract provided that no credit event has occurred. If no credit event occurs, the Fund loses its investment and recovers nothing. However, if a credit event occurs, the Fund receives full notional value for a referenced debt obligation that may have little or no value. When the Fund is the seller of a credit default swap, it receives a fixed rate of income throughout the term of the contract, provided there is no credit event. If a credit event occurs, the Fund is obligated to pay the notional amount of the swap and in certain instances take delivery of securities of the reference entity upon the occurrence of a credit event, as defined under the terms of that particular swap agreement. Credit events are contract specific but may include bankruptcy, failure to pay, restructuring, obligation acceleration and repudiation/moratorium. If the Fund is a seller of protection and a credit event occurs, the maximum potential amount of future payments that the Fund could be required to make would be an amount equal to the notional amount of the agreement. This potential amount would be partially offset by any recovery value of the respective referenced obligation, or net amount received from the settlement of a buy protection credit default swap agreement entered into by the Fund for the same referenced obligation.
As the seller, the Fund may create economic leverage to its portfolio because, in addition to its total net assets, the Fund is subject to investment exposure on the notional amount of the swap. The interest fee paid or received on the swap, which is based on a specified interest rate on a fixed notional amount, is accrued daily as a component of unrealized appreciation (depreciation) and is recorded as realized gain upon receipt or realized loss upon payment. The Fund also records an increase or decrease to unrealized appreciation (depreciation) in an amount equal to the daily valuation. For centrally cleared swaps, the daily change in valuation is recorded as a receivable or payable for variation margin and settled in cash with the CCP daily. All upfront payments, if any, are amortized over the life of the swap as realized gains or losses. Those upfront payments that are paid or received, typically fornon-centrally cleared swaps, are recorded as other assets or other liabilities, respectively, net of
| Notes to Financial Statements | 27 |
Table of Contents
State Street Income V.I.S. Fund
Notes to Financial Statements, continued — June 30, 2019 (Unaudited)
amortization. For financial reporting purposes, unamortized upfront payments, if any, are netted with unrealized appreciation or depreciation on swaps to determine the market value of swaps. The Fund segregates assets in the form of cash or liquid securities in an amount equal to the notional amount of the credit default swaps of which it is the seller. The Fund segregates assets in the form of cash or liquid securities in an amount equal to any unrealized depreciation of the credit default swaps of which it is the buyer, marked to market on a daily basis. Credit default swaps involve greater risks than if the Fund had invested in the referenced debt obligation directly. If the Fund is a buyer of a credit default swap and no credit event occurs, the Fund will not earn any return on its investment. If the Fund is a seller of a credit default swap, the Fund’s risk of loss may be the entire notional amount of the swap. Swaps may also subject the Fund to the risk that the counterparty to the transaction may not fulfill its obligation. In the case of centrally cleared swaps, counterparty risk is minimal due to protections provided by the CCP.
Interest Rate Swaps Interest rate swaps involve the exchange by the Fund with another party of their respective commitments to pay or receive interest, such as an exchange of fixed rate payments for floating rate payments.
During the period ended June 30, 2019, the Fund entered into interest rate swaps in order to manage interest rate risk.
The following tables summarize the value of the Fund’s derivative instruments as of June 30, 2019 and the related location in the accompanying Statement of Assets and Liabilities and Statement of Operations, presented by primary underlying risk exposure:
Asset Derivatives
| Interest Rate Contracts Risk | Foreign Exchange Contracts Risk | Credit Contracts Risk | Equity Contracts Risk | Commodity Contracts Risk | Total | |||||||||||||||||||
State Street Income V.I.S. Fund | ||||||||||||||||||||||||
Futures Contracts | $ | 41,594 | $ | — | $ | — | $ | — | $ | — | $ | 41,594 | ||||||||||||
Swap Contracts | — | — | 50,271 | — | — | 50,271 | ||||||||||||||||||
Liability Derivatives
| Interest Rate Contracts Risk | Foreign Exchange Contracts Risk | Credit Contracts Risk | Equity Contracts Risk | Commodity Contracts Risk | Total | |||||||||||||||||||
State Street Income V.I.S. Fund | ||||||||||||||||||||||||
Swap Contracts | (53,823 | ) | — | (1,532 | ) | — | — | (55,355 | ) | |||||||||||||||
Realized Gain/Loss
| Interest Rate Contracts Risk | Foreign Exchange Contracts Risk | Credit Contracts Risk | Equity Contracts Risk | Commodity Contracts Risk | Total | |||||||||||||||||||
State Street Income V.I.S. Fund | ||||||||||||||||||||||||
Futures Contracts | $ | 75,408 | $ | — | $ | — | $ | — | $ | — | $ | 75,408 | ||||||||||||
Swap Contracts | (3,703 | ) | — | 10,181 | — | — | 6,478 | |||||||||||||||||
Purchased Option Contracts(a) | (2,099 | ) | — | — | — | — | (2,099 | ) | ||||||||||||||||
Written Option Contracts | 248 | — | — | — | — | 248 | ||||||||||||||||||
| (a) | Purchased options are included in net realized gain (loss) from investments. |
| 28 | Notes to Financial Statements |
Table of Contents
State Street Income V.I.S. Fund
Notes to Financial Statements, continued — June 30, 2019 (Unaudited)
Net Change in Unrealized Appreciation (Depreciation)
| Interest Rate Contracts Risk | Foreign Exchange Contracts Risk | Credit Contracts Risk | Equity Contracts Risk | Commodity Contracts Risk | Total | |||||||||||||||||||
State Street Income V.I.S. Fund | ||||||||||||||||||||||||
Futures Contracts | $ | (23,828 | ) | $ | — | $ | — | $ | — | $ | — | $ | (23,828 | ) | ||||||||||
Swap Contracts | (30,132 | ) | — | 17,308 | — | — | (12,824 | ) | ||||||||||||||||
| 5. | Fees and Transactions with Affiliates |
Advisory Fee SSGA FM, a registered investment adviser, was retained by the Board to act as investment adviser and administrator of the Fund. SSGA FM’s compensation for investment advisory and administrative services (“Management Fee”) is paid monthly based on the average daily net assets of the Fund at an annualized rate of 0.50%.
Custody, Fund Accounting andSub-Administration Fees State Street Bank and Trust Company (“State Street”) serves as the custodian, fund accountant andsub-administrator to the Fund. Amounts paid by the Fund to State Street for performing such services are included as custody, fund accounting andsub-administration fees in the Statement of Operations.
Other Transactions with Affiliates The Fund may invest in affiliated entities, including securities issued by State Street Corporation, affiliated funds, or entities deemed to be affiliates as a result of the Fund owning more than five percent of the entity’s voting securities or outstanding shares. Amounts relating to these transactions during the period ended June 30, 2019 are disclosed in the Schedule of Investments.
| 6. | Directors’ Fees |
The fees and expenses of the Company’s directors who are not “interested persons” of the Company, as defined in the 1940 Act (“Independent Directors”), are paid directly by the Fund. The Independent Directors are reimbursed for travel and otherout-of-pocket expenses in connection with meeting attendance and industry seminars.
| 7. | Investment Transactions |
Purchases and sales of investments (excludingin-kind transactions, short term investments and derivative contracts) for the period ended June 30, 2019 were as follows:
| U.S. Government Securities | ||||||||
| Purchases | Sales | |||||||
| $ | 36,172,339 | $ | 34,988,072 | |||||
| Non-U.S. Government Securities | ||||||||
| Purchases | Sales | |||||||
| $ | 2,139,228 | $ | 4,658,554 | |||||
| 8. | Income Taxes |
The Fund has qualified and intends to continue to qualify as a regulated investment company under Subchapter M of the Internal Revenue Code of 1986, as amended. The Fund will not be subject to federal income taxes to the extent it distributes its taxable income, including any net realized capital gains, for each fiscal year. Therefore, no provision for federal income tax is required.
The Fund files federal and various state and local tax returns as required. No income tax returns are currently under examination. Generally, the federal returns are subject to examination by the Internal Revenue Service for a period of three years from date of filing, while the state returns may remain open for an additional year depending upon jurisdiction. SSGA FM has analyzed the Fund’s tax positions taken on tax returns for all open years and does not believe there are any uncertain tax positions that would require recognition of a tax liability.
| Notes to Financial Statements | 29 |
Table of Contents
State Street Income V.I.S. Fund
Notes to Financial Statements, continued — June 30, 2019 (Unaudited)
Distributions to shareholders are recorded onex-dividend date. Income dividends and gain distributions are determined in accordance with income tax rules and regulations, which may differ from generally accepted accounting principles.
As of June 30, 2019, gross unrealized appreciation and gross unrealized depreciation of investments and other financial instruments based on cost for federal income tax purposes were as follows:
| Tax Cost | Gross Unrealized Appreciation | Gross Unrealized Depreciation | Net Unrealized Appreciation (Depreciation) | |||||||||||||||
| $ | 21,128,348 | $ | 677,877 | $ | 167,278 | $ | 510,599 | |||||||||||
| 9. | Line of Credit |
The Fund and other affiliated funds (each, a “Participant” and collectively, the “Participants”) participate in a $500 million revolving credit facility provided by a syndication of banks under which the Participants may borrow to fund shareholder redemptions. This agreement expires in October 2019 unless otherwise extended or renewed.
The Participants are charged an annual commitment fee which is calculated based on the unused portion of the shared credit line. Commitment fees are allocated among each of the Participants based on relative net assets. Commitment fees are ordinary fund operating expenses. A Participant incurs and pays the interest expense related to its borrowing. Interest is calculated at a rate per annum equal to the sum of 1% plus the greater of the New York Fed Bank Rate and1-month LIBOR rate.
The Fund had no outstanding loans as of June 30, 2019.
| 10. | Risks |
Concentration Risk As a result of the Fund’s ability to invest a large percentage of its assets in obligations of issuers within the same country, state, region, currency or economic sector, an adverse economic, business or political development may affect the value of the Fund’s investments more than if the Fund was more broadly diversified.
Interest Rate Risk Is the risk that fixed income securities will decline in value because of changes in interest rates. Bond prices generally rise when interest rates decline and generally decline when interest rates rise. Changes in governmental policy, including changes in central bank monetary policy, could cause interest rates to rise rapidly, or cause investors to expect a rapid rise in interest rates. This could lead to heightened levels of interest rate, volatility and liquidity risks for the fixed income markets generally and could have a substantial and immediate effect on the values of the Fund’s investments.
Foreign and Emerging Markets Risk Investing in foreign markets involves risks and considerations not typically associated with investing in the U.S. Foreign securities may be subject to risk of loss because of government regulation, economic, political and social instability in the countries in which the Fund invests. Foreign markets may be less liquid than investments in the U.S. and may be subject to the risks of currency fluctuations. To the extent that the Fund invests in securities of issuers located in emerging markets, these risks may be even more pronounced.
Market and Credit Risk In the normal course of business, the Fund trades financial instruments and enters into financial transactions where risk of potential loss exists due to changes in the general economic conditions and fluctuations of the market (market risk). Additionally, the Fund may also be exposed to credit risk in the event that an issuer or guarantor fails to perform or that an institution or entity with which the Fund has unsettled or open transactions defaults.
| 11. | Change in Accounting Principle |
In March 2017, the Financial Accounting Standards Board issued Accounting Standards Update2017-08, Receivables – Nonrefundable Fees and Other Costs (Subtopic310-20) — Premium Amortization on Purchased Callable Debt Securities (“ASU2017-08”). For callable debt securities held at a premium that have explicit,non-contingent call features and that are callable at fixed prices on preset dates, ASU2017-08 requires the premium to be amortized to the earliest call date. The adoption resulted in a change in accounting principle, since the Fund had historically amortized such premiums to maturity for U.S. GAAP. Accordingly, the Fund has adopted ASU2017-08 to amend the premium amortization period for certain purchased callable debt securities withnon-contingent call features to the earliest call date. In accordance with the transition
| 30 | Notes to Financial Statements |
Table of Contents
State Street Income V.I.S. Fund
Notes to Financial Statements, continued — June 30, 2019 (Unaudited)
provisions of the standard, the Fund applied the amendments on a modified retrospective basis by recognizing a cumulative effect adjustment that decreased the beginning of period cost of investments and increased the unrealized appreciation on investments by $8,497.
This change in accounting policy has been made to comply with the newly issued accounting standard and had no impact on total accumulated earnings (loss) or the net asset value of the Fund. With respect to the Fund’s results of operations, amortization of premium to first call date accelerates amortization with the intent of more closely aligning the recognition of income on such bonds with the economics of the instrument.
| 12. | Subsequent Events |
Management has evaluated the impact of all subsequent events on the Fund through the date on which the financial statements were available to be issued and has determined that there were no subsequent events requiring adjustment or disclosure in the financial statements.
| Notes to Financial Statements | 31 |
Table of Contents
State Street Income V.I.S. Fund
Other Information — June 30, 2019 (Unaudited)
Proxy Voting Policies and Procedures and Record
The Fund has adopted the proxy voting policies of SSGA FM. A description of the policies and procedures that the Fund has adopted to determine how to vote proxies relating to portfolio securities is available (i) without charge, upon request, by calling1-800-242-0134, (ii) on the Fund’s website at http://www.ssga.com/geam, or (iii) on the SEC’s website at www.sec.gov. Information regarding how the Fund voted proxies, if any, during the most recent12-month period ended June 30 is available by August 31 of each year without charge (1) by calling1-800-242-0134 (toll free), and (2) on the website of the SEC at www.sec.gov.
Quarterly Portfolio Schedule
Following the Fund’s first and third fiscal quarter-ends, a complete schedule of investments is filed with the SEC as an exhibit to its reports on Form N-PORT, which can be found on the SEC’s website at www.sec.gov. The Fund’s schedule of investments are available upon request, without charge, by calling 1-800-242-0134 and on the Fund’s website at http://www.ssga.com/geam.
| 32 | Other Information |
Table of Contents
State Street Income V.I.S. Fund
Other Information — June 30, 2019 (Unaudited), continued
Director Considerations in Approving Continuation of Investment Advisory Agreement1
Overview of the Contract Review Process
Under the Investment Company Act of 1940, as amended (the “1940 Act”), an investment advisory agreement between a mutual fund and its investment adviser may continue in effect from year to year only if its continuance is approved at least annually by the fund’s board of directors or its shareholders, and by a vote of a majority of those directors who are not “interested persons” of the fund (commonly referred to as, the “Independent Directors”) cast in person at a meeting called for the purpose of considering such approval.
Consistent with these requirements, the Board of Directors (the “Board”) of the State Street Variable Insurance Series Funds, Inc. (the “Company”) met in person on April 10, 2019 and May 15, 2019, including in executive sessions attended by the Independent Directors, to consider a proposal to approve, with respect to State Street Income V.I.S. Fund (the “Fund”), the continuation of the investment advisory agreement (the “Advisory Agreement”) with SSGA Funds Management, Inc. (“SSGA FM” or the “Adviser”). Prior to voting on the proposal, the Independent Directors, as well as the Directors who are “interested persons” of the Adviser, reviewed information furnished by the Adviser and others reasonably necessary to permit the Board to evaluate the proposal fully. The Independent Directors were separately represented by counsel who are independent of the Adviser in connection with their consideration of approval of the Agreement. Following the April 10, 2019 meeting, the Independent Directors submitted questions and requests for additional information to management, and considered management’s responses thereto prior to and at the May 15, 2019 meeting. The Independent Directors considered, among other things, the following:
Information about Performance, Expenses and Fees
| • | A report prepared by an independent third-party provider of investment company data, which includes for the Fund: |
| ¡ | Comparisons of the Fund’s performance over the pastone-, three-, five- andten-year periods ended December 31, 2018, to the performance of an appropriate benchmark constructed by Broadridge Financial Solutions, Inc. (“Broadridge”) for the Fund (the “Lipper Index”) and a universe of other mutual funds with similar investment objectives and policies (the “Performance Group” and/or the “Performance Universe”); |
| ¡ | Comparisons of the Fund’s expense ratio (with detail of component expenses) to the expense ratios of a group of comparable mutual funds selected by the independent third-party data provider (the “Expense Group” and/or “Expense Universe”); |
| ¡ | A chart showing the Fund’s historical average net assets relative to its total expenses, management fees, andnon-management expenses over the past five calendar years; and |
| ¡ | Comparisons of the Fund’s contractual management fee to the contractual management fees of comparable mutual funds at different asset levels. |
| • | Comparative information concerning fees charged by the Adviser for managing institutional accounts using investment strategies and techniques similar to those used in managing the Fund; and |
| 1 | The Independent Directors have identified numerous relevant issues, factors and concerns (“issues, factors and concerns”) that they consider each year in connection with the proposed continuation of the advisory agreement, the administration agreement, the distribution plans, the distribution agreement and various related-party service agreements (the “annual review process”). The statement of issues, factors and concerns and the related conclusions of the Independent Directors may not change substantially from year to year. However, the information requested by, and provided to, the Independent Directors with respect to the issues, factors and concerns and on which their conclusions are based is updated annually and, in some cases, may differ substantially from the previous year. The Independent Directors schedule annually a separate in-person meeting that is dedicated to the annual review process (the “special meeting”). At the special meeting and throughout the annual review process, the Independent Directors take a fresh look at each of the issues, factors and concerns in light of the latest available information and each year present one or more sets of comments and questions to management with respect to specific issues, factors and concerns. Management responds to such comments and questions to the satisfaction of the Independent Directors before the annual review process is completed and prior to the Independent Directors voting on proposals to approve continuation of the agreements and plans. |
| Other Information | 33 |
Table of Contents
State Street Income V.I.S. Fund
Other Information — June 30, 2019 (Unaudited), continued
| • | Profitability analyses for (a) the Adviser with respect to the Fund and (b) affiliates of SSGA FM that provide services to the Fund (“Affiliated Service Providers”). |
Information about Portfolio Management
| • | Descriptions of the investment management services provided by the Adviser, including its investment strategies and processes; |
| • | Information concerning the allocation of brokerage; and |
| • | Information regarding the procedures and processes used to value the assets of the Fund. |
Information about the Adviser
| • | Reports detailing the financial results and condition of SSGA FM and its affiliates; |
| • | Descriptions of the qualifications, education and experience of the individual investment and other professionals responsible for managing the portfolio of the Fund and for Fund operations; |
| • | Information relating to compliance with and the administration of the Code of Ethics adopted by the Adviser; |
| • | Information about the Adviser’s proxy voting policies and procedures and information regarding the Adviser’s practices for overseeing proxy vendors; |
| • | Information concerning the resources devoted by the Adviser to overseeing compliance by the Fund and its service providers, including information concerning compliance with investment policies and restrictions and other operating policies of the Fund; |
| • | A description of the adequacy and sophistication of the Adviser’s technology and systems with respect to investment and administrative matters and a description of any material improvements or changes in technology or systems in the past year; |
| • | A description of the business continuity and disaster recovery plans of the Adviser; and |
| • | Information regarding the Adviser’s risk management processes. |
Other Relevant Information
| • | Information concerning the nature, extent, quality and cost of services provided to the Fund by SSGA FM in its capacity as the Fund’s administrator (the “Administrator”); |
| • | Information concerning the nature, extent, quality and cost of variousnon-investment management services provided to the Fund by affiliates of the Adviser, including the custodian,sub-administrator and fund accountant of the Fund, and the role of the Adviser in managing the Fund’s relationship with these service providers; |
| • | Copies of the Advisory Agreement and agreements with other service providers of the Fund; |
| • | Draft responses to a letter from independent legal counsel to the Independent Directors (“Independent Counsel”), reviewed prior to such date by Independent Counsel, requesting specific information from each of: |
| ¡ | SSGA FM, in its capacity as the Fund’s Adviser and Administrator, with respect to its operations relating to the Fund and its approximate profit margins from such operations for the calendar year ended December 31, 2018; and the relevant operations of other affiliated service providers to the Fund, together with their approximate profit margins from such relevant operations for the calendar year ended December 31, 2018; |
| ¡ | State Street Bank and Trust Company (“State Street”), thesub-administrator, custodian, and fund accountant for the Fund, with respect to its operations relating to the Fund; and |
| ¡ | State Street Global Advisors Funds Distributors, LLC, the principal underwriter and distributor of the shares of the Fund (the “Distributor”), with respect to its operations relating to the Fund, together with the Fund’s related distribution plans and arrangements under Rule12b-1 of the 1940 Act; |
| • | Information from SSGA FM, State Street and the Distributor with respect to the Fund providing any material changes to the previous information supplied in response to the letter from Independent Counsel prior to the executive session of the Board on May 15, 2019; |
| 34 | Other Information |
Table of Contents
State Street Income V.I.S. Fund
Other Information — June 30, 2019 (Unaudited), continued
| • | Materials provided by Broadridge, circulated to the Independent Directors and to Independent Counsel; and |
| • | A summary of the foregoing materials prepared by Independent Counsel. |
In addition to the information identified above, the Board considered information provided from time to time by the Adviser, and other service providers of the Fund throughout the year at meetings of the Board and its committees. At such meetings, the Directors received, among other things, presentations by the portfolio managers and other investment professionals of the Adviser relating to the performance of the Fund and the investment strategies used in pursuing the Fund’s investment objective.
The Independent Directors were assisted throughout the contract review process by their Independent Counsel. The Independent Directors relied upon the advice of such counsel and their own business judgment in determining the material factors to be considered in evaluating the Agreement, and the weight to be given to each such factor. The conclusions reached with respect to the Agreement were based on a comprehensive evaluation of all the information provided and not any single factor. Moreover, each Director may have placed varying emphasis on particular factors in reaching conclusions with respect to the Fund.
Results of the Process
Based on a consideration of the foregoing and such other information as deemed relevant, including the factors and conclusions described below, on May 15, 2019 the Board, including a majority of the Independent Directors, voted to approve the continuation of the Agreement effective June 1, 2019, for an additional year with respect to the Fund.
Nature, Extent and Quality of Services
In considering whether to approve the Agreement, the Board evaluated the nature, extent and quality of services provided to the Fund by the Adviser.
The Board considered the Adviser’s management capabilities and investment process with respect to the types of investments held by the Fund, including the education, experience and number of investment professionals and other personnel who provide portfolio management, investment research, and similar services to the Fund. The Board evaluated the abilities and experience of such investment personnel in analyzing particular markets, industries and specific issuers of securities in these markets and industries. The Board also considered the extensive experience and resources committed by the Adviser to the evaluation of a portfolio’s quality distribution and sector and interest rate exposure. The Board considered the extensive experience and resources committed by the Adviser to risk management, including with respect to investment risk, liquidity risk, operational risk, counterparty risk and model risk. The Directors also considered the significant risks assumed by the Adviser in connection with the services provided to the Fund, including reputational and entrepreneurial risks. The Board also took into account the compensation paid to recruit and retain investment personnel, and the time and attention devoted to the Fund by senior management.
The Board had previously reviewed the compliance programs of SSGA FM and various affiliated service providers. Among other things, the Board considered compliance and reporting matters relating to personal trading by investment personnel, selective disclosure of portfolio holdings, late trading, frequent trading, portfolio valuation, business continuity, the allocation of investment opportunities and the voting of proxies.
On the basis of the foregoing and other relevant information, the Board concluded that the Adviser can be expected to continue to provide high quality investment management and related services for the Fund.
Fund Performance
The Board compared the Fund’s investment performance to the performance of an appropriate benchmark and universe of comparable mutual funds for various time periods ended December 31, 2018. For purposes of these comparisons the Independent Directors relied extensively on the Performance Group, Performance Universe and Lipper Index and the analyses of the related data provided by Broadridge. Among other information, the Board considered the following performance information in its evaluation of the Fund:
State Street Income V.I.S. Fund. The Board considered that the Fund’s performance was below the medians of its Performance Group and Performance Universe for the1-,3-,5- and10-year periods and below its Lipper Index for the1-,3-,5- and10-year periods. The Board took into account management’s discussion of the Fund’s performance.
On the basis of the foregoing and other relevant information, the Board concluded that the performance of the Fund is satisfactory.
| Other Information | 35 |
Table of Contents
State Street Income V.I.S. Fund
Other Information — June 30, 2019 (Unaudited), continued
Management Fees and Expenses
The Board reviewed the contractual investment advisory fee rates payable by the Fund and actual fees paid by the Fund. As part of its review, the Board considered the Fund’s management fee and total expense ratio, including the portion attributable to administrative services provided by SSGA FM (both before and after giving effect to any expense caps), as compared to its Expense Group and Expense Universe, as constructed by Broadridge, and the related Broadridge analysis for the Fund. The Board also considered the comparability of the fees charged and the services provided to the Fund by the Adviser to the fees charged and services provided to other clients of the Adviser, including institutional accounts, as applicable. Among other information, the Board considered the following expense information in its evaluation of the Fund:
State Street Income V.I.S. Fund. The Board considered that the Fund’s actual management fee was above the medians of its Expense Group and Expense Universe. The Board also considered that the Fund’s total expenses were above the medians of its Expense Group and Expense Universe. The Board considered management’s discussion of the Fund’s expenses.
On the basis of the foregoing and other relevant information, and in light of the nature, extent and quality of the services provided by the Adviser, the Board concluded that the fees and the expense ratio of the Fund compare favorably to the fees and expenses of the Expense Group and Expense Universe and are reasonable in relation to the services provided.
Profitability
The Board reviewed the level of profits realized by the Adviser and its affiliates in providing investment advisory and other services to the Fund and to all funds within the fund complex. The Board considered other direct and indirect benefits received by SSGA FM and Affiliated Service Providers in connection with their relationships with the Fund, including soft dollar commission benefits generated through Fund portfolio transactions. The Board further considered the profitability of each of the Affiliated Service Providers with respect to their services to the Fund and/or fund complex. The Board also considered the various risks borne by SSGA FM and State Street in connection with their various roles in servicing the Fund, including reputational and entrepreneurial risks.
The Board concluded that the profitability of the Adviser with respect to the Fund, and the profitability range of each of the Affiliated Service Providers with respect to its services to the Fund, were reasonable in relation to the services provided.
Economies of Scale
In reviewing management fees and profitability, the Board also considered the extent to which the Adviser and its affiliates, on the one hand, and the Fund and the fund complex, on the other hand, can expect to realize benefits from economies of scale as the assets of the Fund and fund complex increase. The Board acknowledged the difficulty in accurately measuring the benefits resulting from the economies of scale with respect to the management of the Fund or the fund complex taken as a whole. The Board concluded that, in light of the current size of the Fund and the fund complex, the level of profitability of the Adviser and its affiliates with respect to the Fund and the fund complex over various time periods, and the comparative management fee and expense ratio of the Fund during these periods, it does not appear that the Adviser or its affiliates has realized benefits from economies of scale in managing the assets of the Fund to such an extent that previously agreed advisory fees should be reduced or that breakpoints in such fees should be implemented for the Fund at this time.
Conclusions
In reaching its decision to approve the Agreement, the Board did not identify any single factor as being controlling, but based its recommendation on each of the factors it considered. Each Director may have contributed different weight to the various factors. Based upon the materials reviewed, the representations made and the considerations described above, and as part of its deliberations, the Board, including the Independent Directors, concluded that the Adviser possesses the capability and resources to perform the duties required of it under the Agreement.
Further, based upon its review of the Agreement, the materials provided, and the considerations described above, the Board, including the Independent Directors, concluded that (1) the terms of the Advisory Agreement are reasonable, fair, and in the best interests of the Fund and its shareholders, and (2) the rates payable under the Advisory Agreement are fair and reasonable in light of the usual and customary charges made for services of the same nature and quality.
| 36 | Other Information |
Table of Contents
Directors
Michael F. Holland, Co-Chairperson
Patrick J. Riley, Co-Chairperson
John R. Costantino
Donna M. Rapaccioli
Michael A. Jessee
Richard D. Shirk
Rina K. Spence
Jeanne M. La Porta
Ellen M. Needham
Officers
Jeanne M. La Porta, President
Brian Harris, Chief Compliance Officer, Anti-Money Laundering Officer and Code of Ethics Compliance Officer
Sean O’Malley, Chief Legal Officer
Bruce S. Rosenberg, Treasurer
Ann M. Carpenter, Vice President and Deputy Treasurer
Chad C. Hallett, Deputy Treasurer
Arthur A. Jensen, Deputy Treasurer
Darlene Anderson-Vasquez, Deputy Treasurer
Sujata Upreti, Assistant Treasurer
Daniel Foley, Assistant Treasurer
Andrew DeLorme, Secretary
James Goundrey, Assistant Secretary
Kevin Morris, Assistant Secretary
David Urman, Assistant Secretary
Investment Adviser and Administrator
SSGA Funds Management, Inc.
One Iron Street
Boston, MA 02210
Custodian andSub-Administrator
State Street Bank and Trust Company
One Lincoln Street
Boston, Massachusetts 02111
Distributor
State Street Global Advisors Funds Distributors, LLC
One Iron Street
Boston, MA 02210
Independent Registered Public Accounting Firm
Ernst & Young LLP
200 Clarendon Street
Boston, Massachusetts 02116
Table of Contents
Semi-Annual Report
June 30, 2019
State Street Real Estate Securities V.I.S. Fund
Beginning on January 1, 2021, as permitted by regulations adopted by the U.S. Securities and Exchange Commission, paper copies of a Fund’s annual and semi-annual shareholder reports will no longer be sent by mail, unless you specifically request paper copies of the reports. Instead, the reports will be made available on a Fund’s website (www.ssga.com/geam), and you will be notified by mail each time a report is posted, and provided with a website link to access the report. If you already elected to receive shareholder reports electronically, you will not be affected by this change and you need not take any action.
You may elect to receive all future reports in paper free of charge. To do so, contact your Insurance Provider. Your election to receive reports in paper will apply to all funds held in your account.

Table of Contents
State Street Real Estate Securities V.I.S. Fund
Semi-Annual Report
June 30, 2019 (Unaudited)
| Page | ||||
| Fund Information | 1 | |||
| Understanding Your Fund’s Expenses | 2 | |||
| Schedule of Investments | 3 | |||
| Financial Statements | ||||
| 5 | ||||
| 6 | ||||
| 7 | ||||
| 8 | ||||
| Notes to Financial Statements | 9 | |||
| Other Information | 13 | |||
This report is prepared for Policyholders of certain variable contracts and may be distributed to others only if preceded or accompanied by the variable contract’s current prospectus and the current summary prospectus of the Fund available for investments thereunder.
Table of Contents
State Street Real Estate Securities V.I.S. Fund
Fund Information — June 30, 2019 (Unaudited)
Total return performance shown in this report for the Fund takes into account changes in share price and assumes reinvestment of dividends and capital gains distributions, if any. Total returns shown are net of Fund fees and expenses but do not reflect fees and charges associated with the variable contracts such as administrative fees, account charges and surrender charges, which, if reflected, would reduce the Fund’s total returns for all periods shown.
The performance data quoted represents past performance; past performance does not guarantee future results. Investment return and principal value will fluctuate so your shares, when redeemed, may be worth more or less than their original cost. Current performance may be higher or lower than the performance data quoted. Periods less than one year are not annualized. Please call toll-free
(800) 242-0134 or visit the Fund’s website at http://www.ssga.com/geam for the most recent month-end performance data.
An investment in the Fund is not a deposit of any bank and is not insured or guaranteed by the Federal Deposit Insurance Corporation (“FDIC”) or any other government agency. An investment in the Fund is subject to risk, including possible loss of principal invested.
Sector Allocation
Portfolio Composition as a % of Fair Value of $54,688 (in thousands) as of June 30, 2019(a)(b)
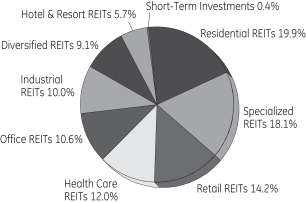
Top Ten Largest Holdings
as of June 30, 2019 (as a % of Fair Value)(a)(b)
Prologis Inc. REIT | 5.64 | % | ||
Ventas Inc. | 5.55 | % | ||
Equinix Inc. | 5.09 | % | ||
AvalonBay Communities Inc. | 4.74 | % | ||
Simon Property Group Inc. | 4.12 | % | ||
Equity Residential | 3.98 | % | ||
HCP Inc. | 3.24 | % | ||
VEREIT Inc. | 3.04 | % | ||
Sun Communities Inc. | 2.94 | % | ||
Public Storage | 2.79 | % | ||
| (a) | Fair Value basis is inclusive of short-term investment in State Street Institutional U.S. Government Money Market Fund Class G Shares. |
| (b) | The securities information regarding holdings, allocations and other characteristics is presented to illustrate examples of securities that the Fund has bought and the diversity of areas in which the Fund may invest as of a particular date. It may not be representative of the Fund’s current or future investments and should not be construed as a recommendation to purchase or sell a particular security. |
State Street Global Advisors Funds Distributors, LLC, member of FINRA & SIPC is the principal underwriter and distributor of the State Street V.I.S. Funds and an indirect wholly-owned subsidiary of State Street Corporation. References to State Street may include State Street Corporation and its affiliates. The Funds pay State Street Bank and Trust Company for its services as custodian and Fund Accounting agent, and pay SSGA Funds Management, Inc. for investment advisory and administrative services.
| State Street Real Estate Securities V.I.S. Fund | 1 |
Table of Contents
State Street Real Estate Securities V.I.S. Fund
Understanding Your Fund’s Expenses — June 30, 2019 (Unaudited)
As a shareholder of the Fund, you incur ongoing costs. Ongoing costs include portfolio management fees, professional fees, administrative fees and other Fund expenses. The following example is intended to help you understand your ongoing costs (in dollars) of investing in the Fund and to compare these costs with the ongoing costs of investing in other mutual funds.
To illustrate these ongoing costs, we have provided an example and calculated the expenses paid by investors in the Fund during the period. The information in the following table is based on an investment of $1,000, which is invested at the beginning of the period and held for the entiresix-month period ended June 30, 2019.
Actual Expenses
The first section of the table provides information about actual account values and actual expenses. You may use the information in this section, together with the amount you invested, to estimate the expenses that you paid over the period. To do so, simply divide your account value by $1,000 (for example, an $8,600 account value divided by $1,000 = 8.6), then multiply the result by the number given under the heading “Expenses paid during the period” to estimate the expenses you paid on your account during the period.
Hypothetical Example for Comparison Purposes
The second section of the table provides information about hypothetical account values and hypothetical expenses based on the Fund’s actual expense ratio and an assumed rate of return of 5% per year before expenses, which is not the Fund’s actual return. The hypothetical account values and expenses may not be used to estimate the actual ending account balance or expenses you paid for the period. You may use this information to compare the ongoing costs of investing in the Fund and other funds. To do so, compare this 5% hypothetical example with the 5% hypothetical examples that appear in the shareholder reports of other funds.
Please note that the expenses shown in the table are meant to highlight and help you compare ongoing costs only and do not reflect transaction costs, such as sales charges or redemption fees, if any. Therefore, the second section of the table is useful in comparing ongoing costs only, and will not help you determine the relative total costs of owning different funds. Additionally, the expenses shown do not reflect the fees or charges associated with variable contracts through which shares of the Fund are offered.
| Actual Fund Return | Hypothetical 5% Return (2.5% for the period) | |||||||
Account value at the beginning of the period | ||||||||
January 1, 2019 | $ | 1,000.00 | $ | 1,000.00 | ||||
Account value at the end of the period | ||||||||
June 30, 2019 | $ | 1,182.20 | $ | 1,019.54 | ||||
Expenses paid during the period * | $ | 5.74 | $ | 5.31 | ||||
| * | Expenses are equal to the Fund’s annualized expense ratio of 1.06% (for the period January 1, 2019-June 30, 2019), multiplied by the average account value over the period, multiplied by 181/365 (to reflect theone-half year period). |
| 2 | State Street Real Estate Securities V.I.S. Fund |
Table of Contents
State Street Real Estate Securities V.I.S. Fund
Schedule of Investments — June 30, 2019 (Unaudited)
| Number of Shares | Fair Value $ | |||||||
| Common Stock (REITs) - 99.2% † |
| |||||||
Alternate Housing - 6.5% | ||||||||
American Homes 4 Rent, Class A | 30,410 | 739,267 | ||||||
Invitation Homes Inc. | 46,849 | 1,252,274 | ||||||
Sun Communities Inc. | 12,526 | 1,605,708 | ||||||
|
| |||||||
| 3,597,249 | ||||||||
|
| |||||||
Diversified - 6.1% | ||||||||
JBG SMITH Properties | 12,498 | 491,671 | ||||||
VEREIT Inc. | 184,800 | 1,665,048 | ||||||
WP Carey Inc. | 14,780 | 1,199,841 | ||||||
|
| |||||||
| 3,356,560 | ||||||||
|
| |||||||
Freestanding - 3.7% | ||||||||
National Retail Properties Inc. | 6,590 | 349,336 | ||||||
Realty Income Corp. | 16,510 | 1,138,695 | ||||||
STORE Capital Corp. | 16,670 | 553,277 | ||||||
|
| |||||||
| 2,041,308 | ||||||||
|
| |||||||
Healthcare - 12.0% | ||||||||
HCP Inc. | 55,470 | 1,773,931 | ||||||
Healthcare Trust of America Inc., Class A | 30,243 | 829,565 | ||||||
Sabra Health Care REIT Inc. | 31,360 | 617,478 | ||||||
Ventas Inc. | 44,430 | 3,036,791 | ||||||
Welltower Inc. | 3,825 | 311,852 | ||||||
|
| |||||||
| 6,569,617 | ||||||||
|
| |||||||
Hotel - 5.7% | ||||||||
Chesapeake Lodging Trust | 20,058 | 570,048 | ||||||
DiamondRock Hospitality Co. | 20,368 | 210,605 | ||||||
Host Hotels & Resorts Inc. | 36,950 | 673,229 | ||||||
MGM Growth Properties LLC, Class A | 12,660 | 388,029 | ||||||
Park Hotels & Resorts Inc. | 25,310 | 697,544 | ||||||
Sunstone Hotel Investors Inc. | 41,510 | 569,102 | ||||||
|
| |||||||
| 3,108,557 | ||||||||
|
| |||||||
Industrial - 11.4% | ||||||||
Americold Realty Trust | 21,430 | 694,761 | ||||||
Duke Realty Corp. | 24,636 | 778,744 | ||||||
Industrial Logistics Properties Trust | 11,810 | 245,884 | ||||||
Liberty Property Trust | 15,460 | 773,619 | ||||||
Prologis Inc. REIT | 38,530 | 3,086,253 | ||||||
Rexford Industrial Realty Inc. | 4,230 | 170,765 | ||||||
STAG Industrial Inc. | 16,660 | 503,798 | ||||||
|
| |||||||
| 6,253,824 | ||||||||
|
| |||||||
Multifamily - 13.2% | ||||||||
AvalonBay Communities Inc. | 12,750 | 2,590,545 | ||||||
Camden Property Trust | 10,840 | 1,131,587 | ||||||
Equity Residential | 28,640 | 2,174,349 | ||||||
Essex Property Trust Inc. | 1,670 | 487,523 | ||||||
Mid-America Apartment Communities Inc. | 2,785 | 327,962 | ||||||
UDR Inc. | 12,058 | 541,284 | ||||||
|
| |||||||
| 7,253,250 | ||||||||
|
| |||||||
Office - 11.9% |
| |||||||
Alexander & Baldwin Inc. | 3,649 | 84,292 | ||||||
Alexandria Real Estate Equities Inc. | 9,043 | 1,275,877 | ||||||
Boston Properties Inc. | 7,458 | 962,082 | ||||||
Brandywine Realty Trust | 28,950 | 414,564 | ||||||
Columbia Property Trust Inc. | 30,100 | 624,274 | ||||||
Empire State Realty Trust Inc., Class A | 48,240 | 714,435 | ||||||
Highwoods Properties Inc. | 5,650 | 233,345 | ||||||
Kilroy Realty Corp. | 16,430 | 1,212,698 | ||||||
Mack-Cali Realty Corp. | 24,670 | 574,564 | ||||||
VICI Properties Inc. | 18,760 | 413,470 | ||||||
|
| |||||||
| 6,509,601 | ||||||||
|
| |||||||
| Number of Shares | Fair Value $ | |||||||||||
Regional Malls - 6.0% |
| |||||||||||
Simon Property Group Inc. | 14,090 | 2,251,018 | ||||||||||
Taubman Centers Inc. | 12,342 | 503,924 | ||||||||||
The Macerich Co. | 16,588 | 555,532 | ||||||||||
|
| |||||||||||
| 3,310,474 | ||||||||||||
|
| |||||||||||
Self Storage - 6.5% |
| |||||||||||
CubeSmart | 33,460 | 1,118,902 | ||||||||||
Extra Space Storage Inc. | 8,680 | 920,948 | ||||||||||
Public Storage | 6,410 | 1,526,670 | ||||||||||
|
| |||||||||||
| 3,566,520 | ||||||||||||
|
| |||||||||||
Shopping Centers - 5.4% |
| |||||||||||
Brixmor Property Group Inc. | 25,830 | 461,840 | ||||||||||
Federal Realty Investment Trust | 3,380 | 435,209 | ||||||||||
Kite Realty Group Trust | 6,127 | 92,702 | ||||||||||
Regency Centers Corp. | 9,250 | 617,345 | ||||||||||
Retail Opportunity Investments Corp. | 25,750 | 441,097 | ||||||||||
Retail Properties of America Inc., Class A | 61,440 | 722,534 | ||||||||||
Urban Edge Properties | 11,850 | 205,361 | ||||||||||
|
| |||||||||||
| 2,976,088 | ||||||||||||
|
| |||||||||||
Specialty - 10.8% |
| |||||||||||
CoreSite Realty Corp. | 4,186 | 482,102 | ||||||||||
CyrusOne Inc. | 22,930 | 1,323,520 | ||||||||||
Digital Realty Trust Inc. | 2,350 | 276,806 | ||||||||||
Equinix Inc. | 5,519 | 2,783,177 | ||||||||||
Iron Mountain Inc. | 34,330 | 1,074,528 | ||||||||||
| 5,940,133 | ||||||||||||
|
| |||||||||||
| Total Common Stock (REITs) (Cost $47,187,457) |
| 54,483,181 | ||||||||||
|
| |||||||||||
| Short-Term Investments - 0.4% |
| |||||||||||
State Street Institutional U.S. Government Money Market | 204,468 | 204,468 | ||||||||||
|
| |||||||||||
| Total Investments (Cost $47,391,925) |
| 54,687,649 | ||||||||||
|
| |||||||||||
| Other Assets and Liabilities, net - 0.4% |
| 225,830 | ||||||||||
|
| |||||||||||
| NET ASSETS - 100.0% |
| $ | 54,913,479 | |||||||||
|
| |||||||||||
See Notes to Schedule of Investments and Notes to Financial Statements.
| State Street Real Estate Securities V.I.S. Fund | 3 |
Table of Contents
State Street Real Estate Securities V.I.S. Fund
Notes to Schedule of Investments — June 30, 2019 (Unaudited)
The views expressed in this document reflect our judgment as of the publication date and are subject to change at any time without notice. The securities cited may not be representative of the Fund’s future investments and should not be construed as a recommendation to purchase or sell a particular security. See the Fund’s summary prospectus and statutory prospectus for complete descriptions of investment objectives, policies, risks and permissible investments.
| (a) | Coupon amount represents effective yield. |
| (b) | Sponsored by SSGA Funds Management, Inc., the Fund’s investment adviser and administrator, and an affiliate of State Street Bank & Trust Co., the Fund’s sub- administrator, custodian and accounting agent. |
| † | Percentages are based on net assets as of June 30, 2019. |
Abbreviations:
REIT - Real Estate Investment Trust
The following table presents the Fund’s investments measured at fair value on a recurring basis at June 30, 2019:
| Investments | Level 1 | Level 2 | Level 3 | Total | ||||||||||||
Investments in Securities | ||||||||||||||||
Common Stock | $ | 54,483,181 | $ | — | $ | — | $ | 54,483,181 | ||||||||
Short-Term Investments | 204,468 | — | — | 204,468 | ||||||||||||
|
|
|
|
|
|
|
| |||||||||
Total Investments in Securities | $ | 54,687,649 | $ | — | $ | — | $ | 54,687,649 | ||||||||
|
|
|
|
|
|
|
| |||||||||
Affiliate Table
| Number of Shares Held at 12/31/18 | Value At 12/31/18 | Cost of Purchases | Proceeds from Shares Sold | Number of Shares Held at 6/30/19 | Value at 6/30/19 | Dividend Income | ||||||||||||||||||||||
State Street Institutional U.S. | 66,693 | $ | 66,693 | $ | 3,821,477 | $ | 3,683,702 | 204,468 | $ | 204,468 | $ | 1,966 | ||||||||||||||||
See Notes to Schedule of Investments and Notes to Financial Statements.
| 4 | State Street Real Estate Securities V.I.S. Fund |
Table of Contents
State Street Real Estate Securities V.I.S. Fund
Selected data based on a share outstanding throughout the periods indicated
| 6/30/19† | 12/31/18 | 12/31/17 | 12/31/16 | 12/31/15* | 12/31/14* | |||||||||||||||||||
| Inception date | 5/1/95 | |||||||||||||||||||||||
Net asset value, beginning of period | $ | 11.14 | $ | 12.32 | $ | 12.37 | $ | 13.30 | $ | 14.74 | $ | 12.68 | ||||||||||||
|
|
|
|
|
|
|
|
|
|
|
| |||||||||||||
Income/(loss) from investment operations: |
| |||||||||||||||||||||||
Net investment income | 0.18 | (a) | 0.25 | (a) | 0.15 | (a) | 0.31 | 0.29 | 0.28 | |||||||||||||||
Net realized and unrealized gains/(losses) on investments | 1.85 | (0.95 | ) | 0.57 | 0.71 | 0.41 | 3.79 | |||||||||||||||||
|
|
|
|
|
|
|
|
|
|
|
| |||||||||||||
Total income/(loss) from investment operations | 2.03 | (0.70 | ) | 0.72 | 1.02 | 0.70 | 4.07 | |||||||||||||||||
|
|
|
|
|
|
|
|
|
|
|
| |||||||||||||
Less distributions from: |
| |||||||||||||||||||||||
Net investment income | — | 0.28 | 0.22 | 0.35 | 0.28 | 0.29 | ||||||||||||||||||
Net realized gains | — | 0.16 | 0.55 | 1.60 | 1.86 | 1.72 | ||||||||||||||||||
Return of capital | — | 0.04 | — | — | — | — | ||||||||||||||||||
|
|
|
|
|
|
|
|
|
|
|
| |||||||||||||
Total distributions | — | 0.48 | 0.77 | 1.95 | 2.14 | 2.01 | ||||||||||||||||||
|
|
|
|
|
|
|
|
|
|
|
| |||||||||||||
Net asset value, end of period | $ | 13.17 | $ | 11.14 | $ | 12.32 | $ | 12.37 | $ | 13.30 | $ | 14.74 | ||||||||||||
|
|
|
|
|
|
|
|
|
|
|
| |||||||||||||
Total Return(b) | 18.22 | % | (5.71 | )% | 5.84 | % | 8.00 | % | 4.56 | % | 31.90 | % | ||||||||||||
Ratios/Supplemental Data: |
| |||||||||||||||||||||||
Net assets, end of period (in thousands) | $ | 54,913 | $ | 50,360 | $ | 61,685 | $ | 72,483 | $ | 78,912 | $ | 91,007 | ||||||||||||
Ratios to average net assets: |
| |||||||||||||||||||||||
Net expenses | 1.06 | %** | 1.05 | % | 1.01 | % | 0.97 | % | 0.95 | % | 0.94 | %(c) | ||||||||||||
Gross expenses | 1.06 | %** | 1.05 | % | 1.01 | % | 0.97 | % | 0.95 | % | 0.94 | % | ||||||||||||
Net investment income | 2.79 | %** | 2.11 | % | 1.16 | % | 1.95 | % | 1.80 | % | 1.57 | % | ||||||||||||
Portfolio turnover rate | 30 | % | 59 | % | 73 | % | 67 | % | 57 | % | 53 | % | ||||||||||||
Notes to Financial Highlights
| (a) | Per share values have been calculated using the average shares method. |
| (b) | Total returns are historical and assume changes in share price, reinvestment of dividends and capital gains distributions and do not include the effect of insurance contract charges. Past performance does not guarantee future results. |
| (c) | Includes contractual management fee waiver related to the Fund’s investments in the GE Institutional Money Market Fund (the “Money Market Fund”). The fee waiver agreement was terminated effective June 30, 2014 with the closure of the Money Market Fund. |
| † | Unaudited. |
| * | Beginning with the year ended December 31, 2016, the Fund was audited by Ernst & Young LLP. The previous years were audited by another independent registered public accounting firm. |
| ** | Annualized for periods less than one year. |
The accompanying Notes are an integral part of these financial statements.
| Financial Highlights | 5 |
Table of Contents
State Street Real Estate Securities V.I.S. Fund
Statement of Assets and Liabilities — June 30, 2019 (Unaudited)
Assets | ||||
Investments in securities, at fair value (cost $47,187,457) | $ | 54,483,181 | ||
Short-term affiliated investments, at fair value | 204,468 | |||
Cash | 16,051 | |||
Receivable for investments sold | 214,158 | |||
Income receivables | 285,638 | |||
Receivable for fund shares sold | 10,864 | |||
Income receivable from affiliated investments | 289 | |||
|
| |||
Total assets | 55,214,649 | |||
|
| |||
Liabilities | ||||
Payable for investments purchased | 235,862 | |||
Payable to the Adviser | 38,847 | |||
Payable for custody, fund accounting andsub-administration fees | 2,241 | |||
Accrued other expenses | 24,220 | |||
|
| |||
Total liabilities | 301,170 | |||
|
| |||
Net Assets | $ | 54,913,479 | ||
|
| |||
Net Assets Consist of: | ||||
Capital paid in | $ | 46,459,546 | ||
Total distributable earnings (loss) | 8,453,933 | |||
|
| |||
Net Assets | $ | 54,913,479 | ||
|
| |||
Shares outstanding ($0.01 par value; unlimited shares authorized) | 4,170,497 | |||
Net asset value per share | $ | 13.17 | ||
The accompanying Notes are an integral part of these financial statements.
| 6 | Statement of Assets and Liabilities |
Table of Contents
State Street Real Estate Securities V.I.S. Fund
Statement of Operations — For the period ended June 30, 2019 (Unaudited)
Investment Income |
| |||
Income |
| |||
Dividend | $ | 1,050,372 | ||
Income from affiliated investments | 1,966 | |||
|
| |||
Total income | 1,052,338 | |||
|
| |||
Expenses |
| |||
Advisory and administration fees | 232,615 | |||
Directors’ fees | 9,630 | |||
Custody, fund accounting andsub-administration fees | 11,365 | |||
Professional fees | 18,255 | |||
Printing and shareholder reports | 16,173 | |||
Other expenses | 1,458 | |||
|
| |||
Total Expenses | 289,496 | |||
|
| |||
Net investment income | $ | 762,842 | ||
|
| |||
Net Realized and Unrealized Gain (Loss) on Investments |
| |||
Realized gain (loss) on investments | $ | 1,382,857 | ||
Increase (decrease) in unrealized appreciation/(depreciation) on investments | 6,925,883 | |||
|
| |||
Net realized and unrealized gain (loss) on investments | 8,308,740 | |||
|
| |||
Net Increase in Net Assets Resulting from Operations | $ | 9,071,582 | ||
|
| |||
The accompanying Notes are an integral part of these financial statements.
| Statements of Operations | 7 |
Table of Contents
State Street Real Estate Securities V.I.S. Fund
Statements of Changes in Net Assets
Six Months Ended June 30, 2019* | Year Ended December 31, | |||||||
Increase (Decrease) in Net Assets |
| |||||||
Operations: |
| |||||||
Net investment income | $ | 762,842 | $ | 1,195,948 | ||||
Net realized gain (loss) on investments | 1,382,857 | (571,497 | ) | |||||
Net increase (decrease) in unrealized appreciation/depreciation on investments | 6,925,883 | (3,874,624 | ) | |||||
|
|
|
| |||||
Net increase (decrease) from operations | 9,071,582 | (3,250,173 | ) | |||||
|
|
|
| |||||
Distributions to shareholders: |
| |||||||
Total distributions | — | (1,861,401 | ) | |||||
Return of capital | — | (188,993 | ) | |||||
|
|
|
| |||||
Increase (decrease) in assets from operations and distributions | 9,071,582 | (5,300,567 | ) | |||||
|
|
|
| |||||
Share transactions: |
| |||||||
Proceeds from sale of shares | 497,388 | 5,027,170 | ||||||
Value of distributions reinvested | — | 2,050,394 | ||||||
Cost of shares redeemed | (5,015,565 | ) | (13,101,821 | ) | ||||
|
|
|
| |||||
Net increase (decrease) from share transactions | (4,518,177 | ) | (6,024,257 | ) | ||||
|
|
|
| |||||
Total increase (decrease) in net assets | 4,553,405 | (11,324,824 | ) | |||||
Net Assets |
| |||||||
Beginning of period | 50,360,074 | 61,684,898 | ||||||
|
|
|
| |||||
End of period | $ | 54,913,479 | $ | 50,360,074 | ||||
|
|
|
| |||||
Changes in Fund Shares |
| |||||||
Shares sold | 42,273 | 419,885 | ||||||
Issued for distributions reinvested | — | 185,388 | ||||||
Shares redeemed | (392,970 | ) | (1,090,576 | ) | ||||
|
|
|
| |||||
Net decrease in fund shares | (350,697 | ) | (485,303 | ) | ||||
|
|
|
| |||||
| * | Unaudited. |
The accompanying Notes are an integral part of these financial statements.
| 8 | Statements of Changes in Net Assets |
Table of Contents
State Street Real Estate Securities V.I.S. Fund
Notes to Financial Statements — June 30, 2019 (Unaudited)
| 1. | Organization of the Company |
State Street Variable Insurance Series Funds, Inc. (the “Company”) was incorporated under the laws of the Commonwealth of Virginia on May 14, 1984 and is registered under the Investment Company Act of 1940, as amended (the “1940 Act”), as anopen-end management investment company. The Company is currently composed of the following seven investment portfolios (collectively, the “Funds”): State Street U.S. Equity V.I.S. Fund, State Street S&P 500 Index V.I.S. Fund, State Street Premier Growth Equity V.I.S. Fund, State StreetSmall-Cap Equity V.I.S. Fund, State Street Total Return V.I.S. Fund, State Street Income V.I.S. Fund and State Street Real Estate Securities V.I.S. Fund (the “Fund”). Each Fund is a diversified investment company within the meaning of the 1940 Act.
Shares of the Funds of the Company are offered only to insurance company separate accounts that fund certain variable life insurance contracts and variable annuity contracts.
The Company currently offers one share class (Class 1) of the Fund as an investment option for variable life insurance and variable annuity contracts.
Under the Company’s organizational documents, its officers and directors are indemnified against certain liabilities arising out of the performance of their duties to the Company. Additionally, in the normal course of business, the Company enters into contracts with service providers that contain general indemnification clauses. The Company’s maximum exposure under these arrangements is unknown as this would involve future claims that may be made against the Company that have not yet occurred.
| 2. | Summary of Significant Accounting Policies |
The following is a summary of significant accounting policies followed by the Company in the preparation of its financial statements:
The preparation of financial statements in accordance with U.S. generally accepted accounting principles (“U.S. GAAP”) requires management to make estimates and assumptions that affect the reported amounts and disclosures in the financial statements. Actual results could differ from those estimates. The Fund is an investment company under U.S. GAAP and follows the accounting and reporting guidance applicable to investment companies.
Security Valuation The Fund’s investments are valued at fair value each day that the New York Stock Exchange (“NYSE”) is open and, for financial reporting purposes, as of the report date should the reporting period end on a day that the NYSE is not open. Fair value is generally defined as the price a fund would receive to sell an asset or pay to transfer a liability in an orderly transaction between market participants at the measurement date. By its nature, a fair value price is a good faith estimate of the valuation in a current sale and may not reflect an actual market price. The investments of the Fund are valued pursuant to the policy and procedures developed by the Oversight Committee (the “Committee”) and approved by the Company’s Board of Directors (the “Board”). The Committee provides oversight of the valuation of investments for the Fund. The Board has responsibility for overseeing the determination of the fair value of investments.
Valuation techniques used to value the Fund’s investments by major category are as follows:
| • | Equity investments traded on a recognized securities exchange for which market quotations are readily available are valued at the last sale price or official closing price, as applicable, on the primary market or exchange on which they trade. Equity investments traded on a recognized exchange for which there were no sales on that day are valued at the last published sale price or at fair value. |
| • | Investments in registered investment companies (including money market funds) or other unitized pooled investment vehicles that are not traded on an exchange are valued at that day’s published net asset value (“NAV”) per share or unit. |
In the event prices or quotations are not readily available or that the application of these valuation methods results in a price for an investment that is deemed to be not representative of the fair value of such investment, fair value will be determined in good faith by the Committee, in accordance with the valuation policy and procedures approved by the Board.
The Fund values its assets and liabilities at fair value using a fair value hierarchy consisting of three broad levels that prioritize the inputs to valuation techniques giving the highest priority to readily available unadjusted quoted prices in active
| Notes to Financial Statements | 9 |
Table of Contents
State Street Real Estate Securities V.I.S. Fund
Notes to Financial Statements, continued — June 30, 2019 (Unaudited)
markets for identical assets or liabilities (Level 1 measurements) and the lowest priority to unobservable inputs (Level 3 measurements) when market prices are not readily available or reliable. The categorization of a value determined for an investment within the hierarchy is based upon the pricing transparency of the investment and is not necessarily an indication of the risk associated with investing in it.
The three levels of the fair value hierarchy are as follows:
| • | Level 1 — Unadjusted quoted prices in active markets for an identical asset or liability; |
| • | Level 2 — Inputs other than quoted prices included within Level 1 that are observable for the asset or liability either directly or indirectly, including quoted prices for similar assets or liabilities in active markets, quoted prices for identical or similar assets or liabilities in markets that are not considered to be active, inputs other than quoted prices that are observable for the asset or liability (such as exchange rates, financing terms, interest rates, yield curves, volatilities, prepayment speeds, loss severities, credit risks and default rates) or other market-corroborated inputs; and |
| • | Level 3 — Unobservable inputs for the asset or liability, including the Committee’s assumptions used in determining the fair value of investments. |
The value of the Fund’s investments according to the fair value hierarchy as of June 30, 2019 is disclosed in the Fund’s Schedule of Investments.
Investment Transactions and Income Recognition Investment transactions are accounted for on trade date for financial reporting purposes. Realized gains and losses from the sale or disposition of investments and foreign exchange transactions, if any, are determined using the identified cost method.
Dividend income and capital gain distributions, if any, are recognized on theex-dividend date, net of any foreign taxes withheld at source, if any.
Interest income is recorded daily on an accrual basis. All premiums and discounts are amortized/accreted for financial reporting purposes.
Non-cash dividends received in the form of stock are recorded as dividend income at fair value.
Expenses Certain expenses, which are directly identifiable to a specific Fund, are applied to the Fund within the Company. Other expenses which cannot be attributed to a specific Fund are allocated in such a manner as deemed equitable, taking into consideration the nature and type of expense and the relative net assets of the Fund within the Company.
Foreign Currency Translation The accounting records of the Fund are maintained in U.S. dollars. Foreign currencies as well as investment securities and other assets and liabilities denominated in a foreign currency are translated to U.S. dollars using exchange rates at period end. Purchases and sales of securities, income receipts and expense payments denominated in foreign currencies are translated into U.S. dollars at the prevailing exchange rate on the respective dates of the transactions.
The effects of exchange rate fluctuations on investments are included with the net realized and unrealized gain (loss) on investment securities. Other foreign currency transactions resulting in realized and unrealized gain (loss) are disclosed separately.
Foreign Taxes The Fund may be subject to foreign taxes (a portion of which may be reclaimable) on income, stock dividends, realized and unrealized capital gains on investments or certain foreign currency transactions. Foreign taxes are recorded in accordance with SSGA Funds Management, Inc.’s (the “Adviser” or “SSGA FM”) understanding of the applicable foreign tax regulations and rates that exist in the foreign jurisdictions in which the Fund invests. These foreign taxes, if any, are paid by the Fund and are reflected in the Statement of Operations, if applicable. Foreign taxes payable or deferred as of June 30, 2019, if any, are disclosed in the Fund’s Statement of Assets and Liabilities.
Distributions The Fund declares and pays any dividends from net investment income annually.
Net realized capital gains, if any, are distributed annually, unless additional distributions are required for compliance with applicable tax regulations. The amount and character of income and capital gains to be distributed are determined in accordance with applicable tax regulations which may differ from net investment income and realized gains recognized for U.S. GAAP purposes.
| 10 | Notes to Financial Statements |
Table of Contents
State Street Real Estate Securities V.I.S. Fund
Notes to Financial Statements, continued — June 30, 2019 (Unaudited)
| 3. | Fees and Transactions with Affiliates |
Advisory Fee SSGA FM, a registered investment adviser, was retained by the Board to act as investment adviser and administrator of the Fund. SSGA FM’s compensation for investment advisory and administrative services (“Management Fee”) is paid monthly based on the average daily net assets of the Fund. The Management Fee is stated in the following schedule:
Average Daily Net Assets of the Fund | Management Fees | |||||||||
| First $ | 100 million | 0.85 | % | |||||||
| Next $ | 100 million | 0.80 | % | |||||||
| Over $ | 200 million | 0.75 | % | |||||||
Custody, Fund Accounting andSub-Administration Fees State Street Bank and Trust Company (“State Street”) serves as the custodian, fund accountant andsub-administrator to the Fund. Amounts paid by the Fund to State Street for performing such services are included as custody, fund accounting andsub-administration fees in the Statement of Operations.
Other Transactions with Affiliates The Fund may invest in affiliated entities, including securities issued by State Street Corporation, affiliated funds, or entities deemed to be affiliates as a result of the Fund owning more than five percent of the entity’s voting securities or outstanding shares. Amounts relating to these transactions during the period ended June 30, 2019 are disclosed in the Schedule of Investments.
| 4. | Sub-Advisory Fees |
Pursuant to an investmentsub-advisory agreement with SSGA FM, CenterSquare Investment Management LLC (“CenterSquare”) is thesub-adviser to the Fund. CenterSquare is responsible for theday-to-day portfolio management of the assets of the Fund, including the responsibility for making decisions to buy, sell or hold a particular security, under the general supervision of SSGA FM and the Board. For its services, SSGA FM pays CenterSquare monthlysub-advisory fees which are calculated as a percentage of the average daily net assets of the Fund.
| 5. | Directors’ Fees |
The fees and expenses of the Company’s directors who are not “interested persons” of the Company, as defined in the 1940 Act (“Independent Directors”), are paid directly by the Fund. The Independent Directors are reimbursed for travel and otherout-of-pocket expenses in connection with meeting attendance and industry seminars.
| 6. | Investment Transactions |
Purchases and sales of investments (excludingin-kind transactions, short term investments and derivative contracts) for the period ended June 30, 2019 were as follows:
| Non-U.S. Government Securities | ||||||||||
| Purchases | Sales | |||||||||
| $16,075,810 | $ | 19,884,706 | ||||||||
| 7. | Income Taxes |
The Fund has qualified and intends to continue to qualify as a regulated investment company under Subchapter M of the Internal Revenue Code of 1986, as amended. The Fund will not be subject to federal income taxes to the extent it distributes its taxable income, including any net realized capital gains, for each fiscal year. Therefore, no provision for federal income tax is required.
The Fund files federal and various state and local tax returns as required. No income tax returns are currently under examination. Generally, the federal returns are subject to examination by the Internal Revenue Service for a period of three years from date of filing, while the state returns may remain open for an additional year depending upon jurisdiction. SSGA FM has analyzed the Fund’s tax positions taken on tax returns for all open years and does not believe there are any uncertain tax positions that would require recognition of a tax liability.
| Notes to Financial Statements | 11 |
Table of Contents
State Street Real Estate Securities V.I.S. Fund
Notes to Financial Statements, continued — June 30, 2019 (Unaudited)
Distributions to shareholders are recorded onex-dividend date. Income dividends and gain distributions are determined in accordance with income tax rules and regulations, which may differ from generally accepted accounting principles.
As of June 30, 2019, gross unrealized appreciation and gross unrealized depreciation of investments based on cost for federal income tax purposes were as follows:
| Tax Cost | Gross Unrealized Appreciation | Gross Unrealized Depreciation | Net Unrealized Appreciation (Depreciation) | |||||||||||||||
| $ | 47,842,015 | $ | 8,291,118 | $ | 1,445,484 | $ | 6,845,634 | |||||||||||
| 8. | Line of Credit |
The Fund and other affiliated funds (each, a “Participant” and collectively, the “Participants”) participate in a $500 million revolving credit facility provided by a syndication of banks under which the Participants may borrow to fund shareholder redemptions. This agreement expires in October 2019 unless otherwise extended or renewed.
The Participants are charged an annual commitment fee which is calculated based on the unused portion of the shared credit line. Commitment fees are allocated among each of the Participants based on relative net assets. Commitment fees are ordinary fund operating expenses. A Participant incurs and pays the interest expense related to its borrowing. Interest is calculated at a rate per annum equal to the sum of 1% plus the greater of the New York Fed Bank Rate and1-month LIBOR rate.
The Fund had no outstanding loans as of June 30, 2019.
| 9. | Risks |
Concentration Risk As a result of the Fund’s ability to invest a large percentage of its assets in obligations of issuers within the same country, state, region, currency or economic sector, an adverse economic, business or political development may affect the value of the Fund’s investments more than if the Fund were more broadly diversified.
Market and Credit Risk In the normal course of business, the Fund trades financial instruments and enters into financial transactions where risk of potential loss exists due to changes in the general economic conditions and fluctuations of the market (market risk). Additionally, the Fund may also be exposed to credit risk in the event that an issuer or guarantor fails to perform or that an institution or entity with which the Fund has unsettled or open transactions defaults.
| 10. | Subsequent Events |
Management has evaluated the impact of all subsequent events on the Fund through the date on which the financial statements were available to be issued and has determined that there were no subsequent events requiring adjustment or disclosure in the financial statements.
| 12 | Notes to Financial Statements |
Table of Contents
State Street Real Estate Securities V.I.S. Fund
Other Information — June 30, 2019 (Unaudited)
Proxy Voting Policies and Procedures and Record
The Fund has adopted the proxy voting policies of SSGA FM. A description of the policies and procedures that the Fund has adopted to determine how to vote proxies relating to portfolio securities is available (i) without charge, upon request, by calling1-800-242-0134, (ii) on the Fund’s website at http://www.ssga.com/geam, or (iii) on the SEC’s website at www.sec.gov. Information regarding how the Fund voted proxies, if any, during the most recent 12-month period ended June 30 is available by August 31 of each year without charge (1) by calling 1-800-242-0134 (toll free), and (2) on the website of the SEC at www.sec.gov.
Quarterly Portfolio Schedule
Following the Fund’s first and third fiscal quarter-ends, a complete schedule of investments is filed with the SEC as an exhibit to its reports on Form N-PORT, which can be found on the SEC’s website at www.sec.gov. The Fund’s schedule of investments are available upon request, without charge, by calling 1-800-242-0134 and on the Fund’s website at http://www.ssga.com/geam.
| Other Information | 13 |
Table of Contents
State Street Real Estate Securities V.I.S. Fund
Other Information — June 30, 2019 (Unaudited), continued
Director Considerations in Approving Continuation of Investment Advisory andSub-Advisory Agreements1
Overview of the Contract Review Process
Under the Investment Company Act of 1940, as amended (the “1940 Act”), an investment advisory agreement between a mutual fund and its investment adviser may continue in effect from year to year only if its continuance is approved at least annually by the fund’s board of directors or its shareholders, and by a vote of a majority of those directors who are not “interested persons” of the fund (commonly referred to as, the “Independent Directors”) cast in person at a meeting called for the purpose of considering such approval.
Consistent with these requirements, the Board of Directors (the “Board”) of the State Street Variable Insurance Series Funds, Inc. (the “Company”) met in person on April 10, 2019 and May 15, 2019, including in executive sessions attended by the Independent Directors, to consider a proposal to approve, with respect to State Street Real Estate Securities V.I.S. Fund (the “Fund”), the continuation of the investment advisory agreement (the “Advisory Agreement”) with SSGA Funds Management, Inc. (“SSGA FM” or the “Adviser”), and thesub-advisory agreement (the“Sub-Advisory Agreement” and, together with the Advisory Agreement, the “Agreements”) by and among SSGA FM, and the Company on behalf of the Fund and CenterSquare Investment Management LLC (the“Sub-Adviser”). Prior to voting on the proposal, the Independent Directors, as well as the Directors who are “interested persons” of the Adviser, reviewed information furnished by the Adviser andSub-Adviser and others reasonably necessary to permit the Board to evaluate the proposal fully. The Independent Directors were separately represented by counsel who are independent of the Adviser andSub-Adviser in connection with their consideration of approval of the Agreements. Following the April 10, 2019 meeting, the Independent Directors submitted questions and requests for additional information to management, and considered management’s responses thereto prior to and at the May 15, 2019 meeting. The Independent Directors considered, among other things, the following:
Information about Performance, Expenses and Fees
| • | A report prepared by an independent third-party provider of investment company data, which includes for the Fund: |
| ¡ | Comparisons of the Fund’s performance over the pastone-, three-, five- andten-year periods ended December 31, 2018, to the performance of an appropriate benchmark constructed by Broadridge Financial Solutions, Inc. (“Broadridge”) for the Fund (the “Lipper Index”) and a universe of other mutual funds with similar investment objectives and policies (the “Performance Group” and/or the “Performance Universe”); |
| ¡ | Comparisons of the Fund’s expense ratio (with detail of component expenses) to the expense ratios of a group of comparable mutual funds selected by the independent third-party data provider (the “Expense Group” and/or “Expense Universe”); |
| ¡ | A chart showing the Fund’s historical average net assets relative to its total expenses, management fees, andnon-management expenses over the past five calendar years; and |
| ¡ | Comparisons of the Fund’s contractual management fee to the contractual management fees of comparable mutual funds at different asset levels. |
| 1 | The Independent Directors have identified numerous relevant issues, factors and concerns (“issues, factors and concerns”) that they consider each year in connection with the proposed continuation of the advisory andsub-advisory agreements, the administration agreement, the distribution plans, the distribution agreement and various related-party service agreements (the “annual review process”). The statement of issues, factors and concerns and the related conclusions of the Independent Directors may not change substantially from year to year. However, the information requested by, and provided to, the Independent Directors with respect to the issues, factors and concerns and on which their conclusions are based is updated annually and, in some cases, may differ substantially from the previous year. The Independent Directors schedule annually a separatein-person meeting that is dedicated to the annual review process (the “special meeting”). At the special meeting and throughout the annual review process, the Independent Directors take a fresh look at each of the issues, factors and concerns in light of the latest available information and each year present one or more sets of comments and questions to management with respect to specific issues, factors and concerns. Management responds to such comments and questions to the satisfaction of the Independent Directors before the annual review process is completed and prior to the Independent Directors voting on proposals to approve continuation of the agreements and plans. |
| 14 | Other Information |
Table of Contents
State Street Real Estate Securities V.I.S. Fund
Other Information — June 30, 2019 (Unaudited), continued
| • | Comparative information concerning fees charged by the Adviser andSub-Adviser for managing institutional accounts using investment strategies and techniques similar to those used in managing the Fund; and |
| • | Profitability analyses for (a) the Adviser andSub-Adviser with respect to the Fund and (b) affiliates of SSGA FM that provide services to the Fund (“Affiliated Service Providers”). |
Information about Portfolio Management
| • | Descriptions of the investment management services provided by the Adviser andSub-Adviser, including their investment strategies and processes; |
| • | Information concerning the allocation of brokerage; and |
| • | Information regarding the procedures and processes used to value the assets of the Fund. |
Information about the Adviser andSub-Adviser
| • | Reports detailing the financial results and condition of SSGA FM and its affiliates, as well as of theSub-Adviser; |
| • | Descriptions of the qualifications, education and experience of the individual investment and other professionals responsible for managing the portfolio of the Fund and for Fund operations; |
| • | Information relating to compliance with and the administration of the Codes of Ethics adopted by the Adviser andSub-Adviser; |
| • | Information about the Adviser’s and theSub-Adviser’s proxy voting policies and procedures and information regarding the Adviser’s and theSub-Adviser’s practices for overseeing proxy vendors; |
| • | Information concerning the resources devoted by the Adviser andSub-Adviser to overseeing compliance by the Fund and its service providers, including information concerning compliance with investment policies and restrictions and other operating policies of the Fund; |
| • | A description of the adequacy and sophistication of the Adviser’s andSub-Adviser’s technology and systems with respect to investment and administrative matters and a description of any material improvements or changes in technology or systems in the past year; |
| • | A description of the business continuity and disaster recovery plans of the Adviser andSub-Adviser; and |
| • | Information regarding the Adviser’s andSub-Adviser’s risk management processes. |
Other Relevant Information
| • | Information concerning the nature, extent, quality and cost of services provided to the Fund by SSGA FM in its capacity as the Fund’s administrator (the “Administrator”); |
| • | Information concerning the nature, extent, quality and cost of variousnon-investment management services provided to the Fund by affiliates of the Adviser, including the custodian,sub-administrator and fund accountant of the Fund, and the role of the Adviser in managing the Fund’s relationship with these service providers; |
| • | Copies of the Advisory Agreement andSub-Advisory Agreement and agreements with other service providers of the Fund; |
| • | Draft responses to a letter from independent legal counsel to the Independent Directors (“Independent Counsel”), reviewed prior to such date by Independent Counsel, requesting specific information from each of: |
| ¡ | SSGA FM, in its capacity as the Fund’s Adviser and Administrator, with respect to its operations relating to the Fund and its approximate profit margins from such operations for the calendar year ended December 31, 2018; and the relevant operations of other affiliated service providers to the Fund, together with their approximate profit margins from such relevant operations for the calendar year ended December 31, 2018; |
| ¡ | TheSub-Adviser, with respect to its operations relating to the Fund and its approximate profitability from such operations for the calendar year ended December 31, 2018; |
| Other Information | 15 |
Table of Contents
State Street Real Estate Securities V.I.S. Fund
Other Information — June 30, 2019 (Unaudited), continued
| ¡ | State Street Bank and Trust Company (“State Street”), thesub-administrator, custodian, and fund accountant for the Fund, with respect to its operations relating to the Fund; and |
| ¡ | State Street Global Advisors Funds Distributors, LLC, the principal underwriter and distributor of the shares of the Fund (the “Distributor”), with respect to its operations relating to the Fund, together with the Fund’s related distribution plans and arrangements under Rule12b-1 of the 1940 Act; |
| • | Information from SSGA FM, State Street, the Distributor and theSub-Adviser with respect to the Fund providing any material changes to the previous information supplied in response to the letter from Independent Counsel prior to the executive session of the Board on May 15, 2019; |
| • | Materials provided by Broadridge, circulated to the Independent Directors and to Independent Counsel; and |
| • | A summary of the foregoing materials prepared by Independent Counsel. |
In addition to the information identified above, the Board considered information provided from time to time by the Adviser andSub-Adviser, and other service providers of the Fund throughout the year at meetings of the Board and its committees. At such meetings, the Directors received, among other things, presentations by the portfolio managers and other investment professionals of the Adviser andSub-Adviser relating to the performance of the Fund and the investment strategies used in pursuing the Fund’s investment objective.
The Independent Directors were assisted throughout the contract review process by their Independent Counsel. The Independent Directors relied upon the advice of such counsel and their own business judgment in determining the material factors to be considered in evaluating the Agreements, and the weight to be given to each such factor. The conclusions reached with respect to the Agreements were based on a comprehensive evaluation of all the information provided and not any single factor. Moreover, each Director may have placed varying emphasis on particular factors in reaching conclusions with respect to the Fund.
Results of the Process
Based on a consideration of the foregoing and such other information as deemed relevant, including the factors and conclusions described below, on May 15, 2019 the Board, including a majority of the Independent Directors, voted to approve the continuation of the Agreement effective June 1, 2019, for an additional year with respect to the Fund.
Nature, Extent and Quality of Services
In considering whether to approve the Agreements, the Board evaluated the nature, extent and quality of services provided to the Fund by the Adviser andSub-Adviser.
The Board considered the Adviser’s management capabilities and investment process with respect to the types of investments held by the Fund, including the education, experience and number of investment professionals and other personnel who provide portfolio management, investment research, and similar services to the Fund. The Board evaluated the abilities and experience of such investment personnel in analyzing particular markets, industries and specific issuers of securities in these markets and industries. The Board also considered the substantial expertise of the Adviser in developing and applying proprietary quantitative models for managing the Fund. The Board considered the Adviser’s process used for overseeingsub-advisers. The Board considered the extensive experience and resources committed by the Adviser to risk management, including with respect to investment risk, liquidity risk, operational risk, counterparty risk and model risk. The Directors also considered the significant risks assumed by the Adviser in connection with the services provided to the Fund, including reputational and entrepreneurial risks. The Board also took into account the compensation paid to recruit and retain investment personnel, and the time and attention devoted to the Fund by senior management.
The Board had previously reviewed the compliance programs of SSGA FM and various affiliated service providers. Among other things, the Board considered compliance and reporting matters relating to personal trading by investment personnel, selective disclosure of portfolio holdings, late trading, frequent trading, portfolio valuation, business continuity, the allocation of investment opportunities and the voting of proxies.
In connection with their consideration of the services provided by theSub-Adviser, the Board considered theSub-Adviser’s attributes relating to its investment philosophy oriented toward long-term performance, its process for selecting investments, its
| 16 | Other Information |
Table of Contents
State Street Real Estate Securities V.I.S. Fund
Other Information — June 30, 2019 (Unaudited), continued
experienced professionals, access to significant technological resources and a favorable history and reputation. The Board also considered the review process undertaken by SSGA FM and SSGA FM’s favorable assessment of the nature and quality of the investmentsub-advisory services provided by theSub-Adviser to the Fund.
On the basis of the foregoing and other relevant information, the Board concluded that the Adviser and theSub-Adviser can be expected to continue to provide high quality investment management and related services for the Fund.
Fund Performance
The Board compared the Fund’s investment performance to the performance of an appropriate benchmark and universe of comparable mutual funds for various time periods ended December 31, 2018. For purposes of these comparisons the Independent Directors relied extensively on the Performance Group, Performance Universe and Lipper Index and the analyses of the related data provided by Broadridge. Among other information, the Board considered the following performance information in its evaluation of the Fund:
State Street Real Estate Securities V.I.S. Fund. The Board considered that the Fund’s performance was below the median of its Performance Group for the1- and3-year periods and equal to the median of its Performance Universe for the1-year period. The Board also considered that the Fund’s performance was above the median of the Performance Group for the5- and10-year periods and the median of its Performance Universe for the3-,5- and10-year periods and above its Lipper Index for the1-,3-,5- and10-year periods. The Board took into account management’s discussion of the Fund’s performance.
On the basis of the foregoing and other relevant information, the Board concluded that the performance of the Fund is satisfactory.
Management Fees and Expenses
The Board reviewed the contractual investment advisory fee rates payable by the Fund and actual fees paid by the Fund as well as the fees paid to theSub-Adviser by the Adviser, which reduced the net management fees retained by the Adviser. The Board also reviewed (i) the allocation of the total advisory fees between SSGA FM and theSub-Adviser, and (ii) the services required of SSGA FM to oversee theSub-Adviser for those services. As part of its review, the Board considered the Fund’s management fee and total expense ratio, including the portion attributable to administrative services provided by SSGA FM (both before and after giving effect to any expense caps), as compared to its Expense Group and Expense Universe, as constructed by Broadridge, and the related Broadridge analysis for the Fund. The Board also considered the comparability of the fees charged and the services provided to the Fund by the Adviser andSub-Adviser to the fees charged and services provided to other clients of the Adviser andSub-Adviser, including institutional accounts, as applicable. The Board also considered that thesub-advisory fees are paid by the Adviser out of its advisory fees it receives from the Fund and are not paid by the Fund. Among other information, the Board considered the following expense information in its evaluation of the Fund:
State Street Real Estate Securities V.I.S. Fund. The Board considered that the Fund’s actual management fee was above the medians of its Expense Group and Expense Universe. The Board also considered that the Fund’s total expenses were above the medians of its Expense Group and Expense Universe. The Board considered management’s discussion of the Fund’s expenses.
On the basis of the foregoing and other relevant information, and in light of the nature, extent and quality of the services provided by the Adviser andSub-Adviser, the Board concluded that the fees and the expense ratio of the Fund compare favorably to the fees and expenses of the Expense Group and Expense Universe and are reasonable in relation to the services provided.
Profitability
The Board reviewed the level of profits realized by the Adviser and its affiliates and theSub-Adviser in providing investment advisory and other services to the Fund and to all funds within the fund complex. The Board considered other direct and indirect benefits received by SSGA FM and Affiliated Service Providers and theSub-Adviser in connection with their relationships with the Fund, including soft dollar commission benefits generated through Fund portfolio transactions. The Board further considered the profitability of each of the Affiliated Service Providers with respect to their services to the Fund and/or fund complex. The Board also considered the various risks borne by SSGA FM and State Street in connection with their various roles in servicing the Fund, including reputational and entrepreneurial risks.
| Other Information | 17 |
Table of Contents
State Street Real Estate Securities V.I.S. Fund
Other Information — June 30, 2019 (Unaudited), continued
The Board concluded that the profitability of the Adviser and theSub-Adviser with respect to the Fund, and the profitability range of each of the Affiliated Service Providers with respect to its services to the Fund, were reasonable in relation to the services provided.
Economies of Scale
In reviewing management fees and profitability, the Board also considered the extent to which the Adviser and its affiliates, on the one hand, and the Fund and the fund complex, on the other hand, can expect to realize benefits from economies of scale as the assets of the Fund and fund complex increase. The Board acknowledged the difficulty in accurately measuring the benefits resulting from the economies of scale with respect to the management of the Fund or the fund complex taken as a whole. The Board concluded that, in light of the current size of the Fund and the fund complex, the level of profitability of the Adviser and its affiliates with respect to the Fund and the fund complex over various time periods, and the comparative management fee and expense ratio of the Fund during these periods, it does not appear that the Adviser or its affiliates has realized benefits from economies of scale in managing the assets of the Fund to such an extent that previously agreed advisory fees should be reduced or that breakpoints in such fees should be implemented for the Fund at this time. The Board noted that the fees under theSub-Advisory Agreement are paid by the Adviser out of the advisory fees that the Adviser receives under the Advisory Agreement. Therefore, the Board concluded that the potential for economies of scale in theSub-Adviser’s management of the Fund is not a material factor to the approval of theSub-Advisory Agreement.
Conclusions
In reaching its decision to approve the Agreements, the Board did not identify any single factor as being controlling, but based its recommendation on each of the factors it considered. Each Director may have contributed different weight to the various factors. Based upon the materials reviewed, the representations made and the considerations described above, and as part of its deliberations, the Board, including the Independent Directors, concluded that the Adviser andSub-Adviser possess the capability and resources to perform the duties required of them under the respective Agreements.
Further, based upon its review of the Agreements, the materials provided, and the considerations described above, the Board, including the Independent Directors, concluded that (1) the terms of the Advisory Agreement andSub-Advisory Agreement are reasonable, fair, and in the best interests of the Fund and its shareholders, and (2) the rates payable under the Advisory Agreement andSub-Advisory Agreement are fair and reasonable in light of the usual and customary charges made for services of the same nature and quality.
| 18 | Other Information |
Table of Contents
Directors
Michael F. Holland, Co-Chairperson
Patrick J. Riley, Co-Chairperson
John R. Costantino
Donna M. Rapaccioli
Michael A. Jessee
Richard D. Shirk
Rina K. Spence
Jeanne M. La Porta
Ellen M. Needham
Officers
Jeanne M. La Porta, President
Brian Harris, Chief Compliance Officer, Anti-Money Laundering Officer and Code of Ethics Compliance Officer
Sean O’Malley, Chief Legal Officer
Bruce S. Rosenberg, Treasurer
Ann M. Carpenter, Vice President and Deputy Treasurer
Chad C. Hallett, Deputy Treasurer
Arthur A. Jensen, Deputy Treasurer
Darlene Anderson-Vasquez, Deputy Treasurer
Sujata Upreti, Assistant Treasurer
Daniel Foley, Assistant Treasurer
Andrew DeLorme, Secretary
James Goundrey, Assistant Secretary
Kevin Morris, Assistant Secretary
David Urman, Assistant Secretary
Investment Adviser and Administrator
SSGA Funds Management, Inc.
One Iron Street
Boston, MA 02210
Custodian and Sub-Administrator
State Street Bank and Trust Company
One Lincoln Street
Boston, Massachusetts 02111
Distributor
State Street Global Advisors Funds Distributors, LLC
One Iron Street
Boston, MA 02210
Independent Registered Public Accounting Firm
Ernst & Young LLP
200 Clarendon Street
Boston, Massachusetts 02116
Table of Contents
Semi-Annual Report
June 30, 2019
State Street Total Return V.I.S. Fund
Beginning on January 1, 2021, as permitted by regulations adopted by the U.S. Securities and Exchange Commission, paper copies of a Fund’s annual and semi-annual shareholder reports will no longer be sent by mail, unless you specifically request paper copies of the reports. Instead, the reports will be made available on a Fund’s website (www.ssga.com/geam), and you will be notified by mail each time a report is posted, and provided with a website link to access the report. If you already elected to receive shareholder reports electronically, you will not be affected by this change and you need not take any action.
You may elect to receive all future reports in paper free of charge. To do so, contact your Insurance Provider. Your election to receive reports in paper will apply to all funds held in your account.

Table of Contents
State Street Total Return V.I.S Fund
Semi-Annual Report
June 30, 2019 (Unaudited)
| Page | ||||
| Fund Information | 1 | |||
| Understanding Your Fund’s Expenses | 2 | |||
| Summary Schedule of Investments | 3 | |||
| Financial Statements | ||||
| 14 | ||||
| 16 | ||||
| 17 | ||||
| 18 | ||||
| Notes to Financial Statements | 19 | |||
| Other Information | 26 | |||
This report is prepared for Policyholders of certain variable contracts and may be distributed to others only if preceded or accompanied by the variable contract’s current prospectus and the current summary prospectus of the Fund available for investments thereunder.
Table of Contents
State Street Total Return V.I.S. Fund
Fund Information — June 30, 2019 (Unaudited)
Total return performance shown in this report for the Fund takes into account changes in share price and assumes reinvestment of dividends and capital gains distributions, if any. Total returns shown are net of Fund fees and expenses but do not reflect fees and charges associated with the variable contracts such as administrative fees, account charges and surrender charges, which, if reflected, would reduce the Fund’s total returns for all periods shown.
The performance data quoted represents past performance; past performance does not guarantee future results. Investment return and principal value will fluctuate so your shares, when redeemed, may be worth more or less than their original cost. Current performance may be higher or lower than the performance data quoted. Periods less than one year are not annualized. Please call toll-free (800) 242-0134 or visit the Fund’s website at http://www.ssga.com/geam for the most recent month-end performance data.
An investment in the Fund is not a deposit of any bank and is not insured or guaranteed by the Federal Deposit Insurance Corporation (“FDIC”) or any other government agency. An investment in the Fund is subject to risk, including possible loss of principal invested.
Sector Allocation
Portfolio Composition as a % of Fair Value of $1,974,753 (in thousands) as of June 30, 2019 (a)(b)
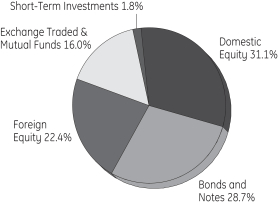
Top Ten Largest Equity Holdings
as of June 30, 2019 (as a % of Fair Value) (a)(b)
Berkshire Hathaway Inc., Class B | 1.03 | % | ||
Johnson & Johnson | 0.89 | % | ||
Cisco Systems Inc. | 0.80 | % | ||
Accenture PLC, Class A | 0.75 | % | ||
Honeywell International Inc. | 0.75 | % | ||
Danaher Corp. | 0.69 | % | ||
The TJX Companies Inc. | 0.65 | % | ||
Linde PLC | 0.65 | % | ||
Intel Corp. | 0.65 | % | ||
Costco Wholesale Corp. | 0.61 | % | ||
| (a) | Fair Value basis is inclusive of short-term investment in State Street Institutional U.S. Government Money Market Fund Class G Shares. |
| (b) | The securities information regarding holdings, allocations and other characteristics is presented to illustrate examples of securities that the Fund has bought and the diversity of areas in which the Fund may invest as of a particular date. It may not be representative of the Fund’s current or future investments and should not be construed as a recommendation to purchase or sell a particular security. |
State Street Global Advisors Funds Distributors, LLC, member of FINRA & SIPC is the principal underwriter and distributor of the State Street V.I.S. Funds and an indirect wholly-owned subsidiary of State Street Corporation. References to State Street may include State Street Corporation and its affiliates. The Funds pay State Street Bank and Trust Company for its services as custodian and Fund Accounting agent, and pay SSGA Funds Management, Inc. for investment advisory and administrative services.
| State Street Total Return V.I.S. Fund | 1 |
Table of Contents
State Street Total Return V.I.S. Fund
Understanding Your Fund’s Expenses — June 30, 2019 (Unaudited)
As a shareholder of the Fund, you incur ongoing costs. Ongoing costs include portfolio management fees, professional fees, administrative fees and other Fund expenses. The following example is intended to help you understand your ongoing costs (in dollars) of investing in the Fund and to compare these costs with the ongoing costs of investing in other mutual funds.
To illustrate these ongoing costs, we have provided an example and calculated the expenses paid by investors in the Fund during the period. The information in the following table is based on an investment of $1,000, which is invested at the beginning of the period and held for the entiresix-month period ended June 30, 2019.
Actual Expenses
The first section of the table provides information about actual account values and actual expenses. You may use the information in this section, together with the amount you invested, to estimate the expenses that you paid over the period. To do so, simply divide your account value by $1,000 (for example, an $8,600 account value divided by $1,000 = 8.6), then multiply the result by the number given under the heading “Expenses paid during the period” to estimate the expenses you paid on your account during the period.
Hypothetical Example for Comparison Purposes
The second section of the table provides information about hypothetical account values and hypothetical expenses based on the Fund’s actual expense ratio and an assumed rate of return of 5% per year before expenses, which is not the Fund’s actual return. The hypothetical account values and expenses may not be used to estimate the actual ending account balance or expenses you paid for the period. You may use this information to compare the ongoing costs of investing in the Fund and other funds. To do so, compare this 5% hypothetical example with the 5% hypothetical examples that appear in the shareholder reports of other funds.
Please note that the expenses shown in the table are meant to highlight and help you compare ongoing costs only and do not reflect transaction costs, such as sales charges or redemption fees, if any. Therefore, the second section of the table is useful in comparing ongoing costs only, and will not help you determine the relative total costs of owning different funds. Additionally, the expenses shown do not reflect the fees or charges associated with variable contracts through which shares of the Fund are offered.
Class 1 | Actual Fund Return | Hypothetical 5% Return (2.5% for the period) | ||||||
Account Value at the Beginning of the Period January 1, 2019 | $ | 1,000.00 | $ | 1,000.00 | ||||
Account Value at the End of the Period June 30, 2019 | $ | 1,109.50 | $ | 1,021.70 | ||||
Expenses Paid During the Period* | $ | 3.24 | $ | 3.11 | ||||
Class 3 | Actual Fund Return | Hypothetical 5% Return (2.5% for the period) | ||||||
Account Value at the Beginning of the Period January 1, 2019 | $ | 1,000.00 | $ | 1,000.00 | ||||
Account Value at the End of the Period June 30, 2019 | $ | 1,108.50 | $ | 1,020.48 | ||||
Expenses Paid During the Period* | $ | 4.55 | $ | 4.36 | ||||
| * | Expenses are equal to the Fund’s annualized expense ratio of 0.62% for Class 1 shares and 0.87% for Class 3 shares (for the period January 1, 2019-June 30, 2019, multiplied by the average account value over the period, multiplied by 181/365 (to reflect theone-half year period). |
| 2 | State Street Total Return V.I.S. Fund |
Table of Contents
State Street Total Return V.I.S. Fund
Summary Schedule of Investments — June 30, 2019 (Unaudited)
Principal | Fair Value $ | |||||||
| Equity Securities - 53.8%† |
| |||||||
Communication Services - 2.9% |
| |||||||
The Walt Disney Co. | 74,404 | 10,389,775 | ||||||
Other Securities | 47,688,097 | |||||||
|
| |||||||
| 58,077,872 | ||||||||
|
| |||||||
Consumer Discretionary - 6.1% |
| |||||||
Bridgestone Corp. | 64,000 | 4,870,386 | ||||||
FF Group (a)(d) | 1,860 | 1,017 | ||||||
The TJX Companies Inc. | 243,327 | 12,867,132 | ||||||
VF Corp. | 64,784 | 5,658,883 | ||||||
Wesfarmers Ltd. | 64,000 | 6,235,289 | ||||||
Other Securities | 92,113,238 | |||||||
|
| |||||||
| 121,745,945 | ||||||||
|
| |||||||
Consumer Staples - 3.8% |
| |||||||
China Huishan Dairy Holdings Company Ltd. (a)(d) | 55,000 | — | ||||||
Costco Wholesale Corp. | 45,816 | 12,107,336 | ||||||
Koninklijke Ahold Delhaize N.V. | 64,000 | 4,430,875 | ||||||
L’Oreal S.A. | 29,971 | 8,549,812 | ||||||
The Estee Lauder Companies Inc., Class A | 42,884 | 7,852,489 | ||||||
Other Securities | 41,175,873 | |||||||
|
| |||||||
| 74,116,385 | ||||||||
|
| |||||||
Energy - 2.3% |
| |||||||
Phillips 66 | 82,514 | 7,718,360 | ||||||
Total S.A. | 64,000 | 5,129,697 | ||||||
Valero Energy Corp. | 84,960 | 7,273,426 | ||||||
Other Securities | 25,846,362 | |||||||
|
| |||||||
| 45,967,845 | ||||||||
|
| |||||||
Financials - 11.6% |
| |||||||
Aflac Inc. | 149,411 | 8,189,217 | ||||||
Allianz SE | 33,727 | 8,142,564 | ||||||
Assicurazioni Generali S.p.A. | 237,279 | 4,474,734 | ||||||
Berkshire Hathaway Inc., Class B (a) | 95,725 | 20,405,698 | ||||||
China Common Rich Renewable Energy Investments Ltd. (a)(d) | 64,000 | — | ||||||
Chubb Ltd. | 62,950 | 9,271,906 | ||||||
Muenchener Rueckversicherungs-Gesellschaft AG | 29,591 | 7,437,202 | ||||||
Royal Bank of Canada | 117,552 | 9,361,880 | ||||||
The Allstate Corp. | 50,644 | 5,149,988 | ||||||
Zurich Insurance Group AG | 25,594 | 8,922,462 | ||||||
Other Securities | 147,749,615 | |||||||
|
| |||||||
| 229,105,266 | ||||||||
|
| |||||||
| Principal Amount ($) or Number of Shares | Fair Value $ | |||||||
Healthcare - 5.4% |
| |||||||
Anthem Inc. | 13,726 | 3,873,614 | ||||||
Danaher Corp. | 94,460 | 13,500,223 | ||||||
HCA Healthcare | 49,538 | 6,696,051 | ||||||
Johnson & Johnson | 126,161 | 17,571,704 | ||||||
Pfizer Inc. | 200,942 | 8,704,807 | ||||||
Roche Holding AG | 64,000 | 6,973,575 | ||||||
UnitedHealth Group Inc. | 15,955 | 3,893,179 | ||||||
Other Securities | 45,370,352 | |||||||
|
| |||||||
| 106,583,505 | ||||||||
|
| |||||||
Industrials - 6.5% |
| |||||||
Exxon Mobil Corp. | 56,702 | 4,345,074 | ||||||
Honeywell International Inc. | 84,831 | 14,810,644 | ||||||
Kone Oyj, Class B | 64,000 | 4,340,933 | ||||||
Secom Company Ltd. | 64,000 | 3,916,531 | ||||||
Other Securities | 101,476,733 | |||||||
|
| |||||||
| 128,889,915 | ||||||||
|
| |||||||
Information Technology - 7.9% |
| |||||||
Accenture PLC, Class A | 80,180 | 14,814,859 | ||||||
Apple Inc. | 44,508 | 8,809,023 | ||||||
Amazon.com Inc. (a) | 2,373 | 4,493,584 | ||||||
Cisco Systems Inc. | 289,039 | 15,819,104 | ||||||
Paychex Inc. | 64,247 | 5,286,886 | ||||||
FUJIFILM Holdings Corp. | 64,000 | 3,955,021 | ||||||
Intel Corp. | 267,048 | 12,783,588 | ||||||
Intuit Inc. | 45,796 | 11,967,869 | ||||||
Microsoft Corp. | 54,162 | 7,255,542 | ||||||
Other Securities | 69,989,839 | |||||||
|
| |||||||
| 155,175,315 | ||||||||
|
| |||||||
Materials - 2.0% |
| |||||||
Ferroglobe PLC (a)(d) | 1,316 | — | ||||||
Linde PLC | 63,734 | 12,797,787 | ||||||
Other Securities | 26,501,894 | |||||||
|
| |||||||
| 39,299,681 | ||||||||
|
| |||||||
Real Estate - 2.9% |
| |||||||
Link REIT | 64,000 | 5,336,420 | ||||||
Other Securities | 51,642,755 | |||||||
|
| |||||||
| 56,979,175 | ||||||||
|
| |||||||
Utilities - 2.2% |
| |||||||
CLP Holdings Ltd. | 64,000 | 3,926,463 | ||||||
Other Securities | 38,672,719 | |||||||
|
| |||||||
| 42,599,182 | ||||||||
|
| |||||||
| Total Equity Securities (Cost $981,160,264) |
| 1,058,540,086 | ||||||
|
| |||||||
See Notes to Summary Schedule of Investments and Notes to Financial Statements.
| State Street Total Return V.I.S. Fund | 3 |
Table of Contents
State Street Total Return V.I.S. Fund
Summary Schedule of Investments, continued — June 30, 2019 (Unaudited)
| Principal Amount ($) or Number of Shares | Fair Value $ | |||||||
| Bonds and Notes - 28.7% |
| |||||||
U.S. Treasuries - 13.9% |
| |||||||
U.S. Treasury Bonds | ||||||||
2.25% 08/15/46 | 1,000,000 | 944,688 | ||||||
2.50% 02/15/45 - 05/15/46 | 3,110,000 | 3,094,744 | ||||||
2.75% 11/15/42 - 11/15/47 | 2,150,000 | 2,246,828 | ||||||
2.88% 05/15/43 - 05/15/49 | 2,100,000 | 2,247,172 | ||||||
3.00% 05/15/42 - 02/15/49 | 7,950,000 | 8,707,936 | ||||||
3.13% 08/15/44 - 05/15/48 | 2,000,000 | 2,238,469 | ||||||
3.38% 05/15/44 - 11/15/48 | 2,600,000 | 3,039,687 | ||||||
3.63% 08/15/43 - 02/15/44 | 1,740,000 | 2,101,785 | ||||||
3.75% 11/15/43 | 1,400,000 | 1,723,531 | ||||||
4.25% 05/15/39 - 11/15/40 | 900,000 | 1,177,953 | ||||||
4.38% 02/15/38 - 05/15/40 | 2,000,000 | 2,650,172 | ||||||
4.50% 02/15/36 | 1,700,000 | 2,242,672 | ||||||
4.63% 02/15/40 | 500,000 | 686,406 | ||||||
5.25% 02/15/29 | 200,000 | 256,813 | ||||||
5.50% 08/15/28 | 200,000 | 258,719 | ||||||
6.00% 02/15/26 | 827,000 | 1,039,306 | ||||||
6.38% 08/15/27 | 200,000 | 266,594 | ||||||
7.63% 11/15/22 - 02/15/25 | 500,000 | 619,219 | ||||||
7.88% 02/15/21 | 1,000,000 | 1,095,859 | ||||||
U.S. Treasury Inflation Indexed Bonds |
| |||||||
0.63% 02/15/43 | 1,333,572 | 1,294,292 | ||||||
0.75% 02/15/42 - 02/15/45 | 3,697,119 | 3,687,735 | ||||||
0.88% 02/15/47 | 1,005,537 | 1,025,644 | ||||||
1.00% 02/15/46 - 02/15/49 | 3,882,456 | 4,084,096 | ||||||
1.38% 02/15/44 | 2,082,970 | 2,366,331 | ||||||
1.75% 01/15/28 | 975,688 | 1,094,555 | ||||||
2.00% 01/15/26 | 643,660 | 716,579 | ||||||
2.13% 02/15/40 - 02/15/41 | 1,109,933 | 1,430,419 | ||||||
2.38% 01/15/25 - 01/15/27 | 3,808,495 | 4,305,155 | ||||||
2.50% 01/15/29 | 1,547,065 | 1,861,968 | ||||||
3.38% 04/15/32 | 575,780 | 789,741 | ||||||
3.63% 04/15/28 | 600,294 | 771,104 | ||||||
3.88% 04/15/29 | 2,331,330 | 3,123,251 | ||||||
U.S. Treasury Inflation Indexed Notes |
| |||||||
0.13% 04/15/21 - 07/15/26 | 27,272,454 | 27,133,390 | ||||||
0.25% 01/15/25 | 5,285,826 | 5,294,017 | ||||||
0.38% 07/15/23 - 07/15/27 | 13,105,948 | 13,223,115 | ||||||
0.50% 04/15/24 - 01/15/28 | 4,162,095 | 4,226,048 | ||||||
0.63% 07/15/21 - 01/15/26 | 9,790,284 | 9,919,723 | ||||||
0.75% 07/15/28 | 3,852,638 | 4,015,873 | ||||||
0.88% 01/15/29 | 2,630,888 | 2,770,546 | ||||||
1.13% 01/15/21 | 3,504,000 | 3,532,051 | ||||||
1.25% 07/15/20 | 1,171,570 | 1,179,446 | ||||||
U.S. Treasury Notes | ||||||||
1.13% 06/30/21 - 09/30/21 | 3,200,000 | 3,158,669 | ||||||
1.25% 10/31/21 | 1,000,000 | 988,906 | ||||||
1.38% 08/31/20 - 05/31/21 | 4,400,000 | 4,370,946 | ||||||
1.50% 01/31/22 - 08/15/26 | 2,900,000 | 2,854,835 | ||||||
1.63% 07/31/20 - 05/15/26 | 8,540,000 | 8,475,417 | ||||||
| Principal Amount ($) or Number of Shares | Fair Value $ | |||||||
1.75% 10/31/20 - 05/15/23 | 11,600,000 | 11,598,155 | ||||||
1.75% 06/30/24 (e) | 600,000 | 599,813 | ||||||
1.88% 12/15/20 - 09/30/22 | 14,600,000 | 14,660,617 | ||||||
2.00% 07/31/20 - 11/15/26 | 12,744,000 | 12,847,877 | ||||||
2.13% 08/31/20 - 05/31/26 | 12,700,000 | 12,846,625 | ||||||
2.25% 03/31/21 - 11/15/27 | 11,890,000 | �� | 12,133,979 | |||||
2.38% 01/31/23 - 05/15/29 | 5,400,000 | 5,554,938 | ||||||
2.50% 03/31/23 - 01/31/25 | 8,000,000 | 8,250,743 | ||||||
2.63% 07/31/20 - 02/15/29 | 11,885,000 | 12,271,231 | ||||||
2.75% 09/30/20 - 02/15/28 | 14,400,000 | 14,974,742 | ||||||
2.88% 10/15/21 - 08/15/28 | 9,700,000 | 10,205,687 | ||||||
3.00% 10/31/25 | 500,000 | 534,414 | ||||||
3.13% 05/15/21 - 11/15/28 | 2,300,000 | 2,486,660 | ||||||
3.63% 02/15/21 | 700,000 | 720,098 | ||||||
|
| |||||||
| 274,017,984 | ||||||||
|
| |||||||
U.S. Government Sponsored Agency - 0.0%* |
| |||||||
Other Securities | 534,915 | |||||||
|
| |||||||
Agency Collateralized Mortgage Obligations - 0.1% |
| |||||||
Federal Home Loan Mortgage Corp. |
| |||||||
2.75% 01/25/26 (b) | 300,000 | 308,040 | ||||||
3.06% 07/25/23 (b)(f) | 600,000 | 620,959 | ||||||
3.18% 11/25/28 | 337,836 | 354,459 | ||||||
3.30% 04/25/23 (b)(f) | 100,000 | 104,260 | ||||||
3.39% 03/25/24 (b) | 200,000 | 210,447 | ||||||
3.49% 01/25/24 (b) | 300,000 | 316,435 | ||||||
3.85% 06/25/28 (b) | 250,000 | 276,436 | ||||||
3.97% 01/25/21 (b)(f) | 200,000 | 203,666 | ||||||
4.33% 10/25/20 (b)(f) | 49,957 | 50,713 | ||||||
Federal National Mortgage Assoc. |
| |||||||
2.78% 06/25/21 (b)(f) | 248,516 | 249,055 | ||||||
3.18% 06/25/27 (b)(f) | 261,000 | 271,938 | ||||||
3.78% 08/25/30 (b)(f) | 200,000 | 218,199 | ||||||
|
| |||||||
| 3,184,607 | ||||||||
|
| |||||||
Agency Mortgage Backed - 6.8% |
| |||||||
Federal Home Loan Mortgage Corp. |
| |||||||
1.13% 08/12/21 | 637,000 | 627,961 | ||||||
2.38% 01/13/22 | 1,100,000 | 1,115,785 | ||||||
2.50% 01/01/28 - 02/01/32 | 2,031,255 | 2,049,964 | ||||||
2.51% 11/25/22 (b) | 300,000 | 303,968 | ||||||
2.89% 04/16/24 | 1,000,000 | 1,002,270 | ||||||
3.00% 05/01/30 - 03/01/48 | 10,593,889 | 10,790,741 | ||||||
3.50% 03/01/26 - 04/01/48 | 9,179,427 | 9,483,491 | ||||||
4.00% 06/01/42 - 03/01/49 | 5,817,232 | 6,079,807 | ||||||
4.50% 05/01/42 - 03/01/49 | 1,786,540 | 1,871,957 | ||||||
5.00% 06/01/41 | 1,325,803 | 1,453,747 | ||||||
5.50% 01/01/38 - 04/01/39 | 315,034 | 344,888 | ||||||
6.00% 06/01/37 - 11/01/37 | 306,884 | 352,698 | ||||||
6.25% 07/15/32 | 250,000 | 358,855 | ||||||
See Notes to Summary Schedule of Investments and Notes to Financial Statements.
| 4 | State Street Total Return V.I.S. Fund |
Table of Contents
State Street Total Return V.I.S. Fund
Summary Schedule of Investments, continued — June 30, 2019 (Unaudited)
| Principal Amount ($) or Number of Shares | Fair Value $ | |||||||
Federal National Mortgage Assoc. |
| |||||||
1.50% 07/30/20 | 500,000 | 497,485 | ||||||
1.88% 09/24/26 | 1,000,000 | 990,400 | ||||||
2.13% 04/24/26 | 700,000 | 703,577 | ||||||
2.25% 04/12/22 | 425,000 | 430,295 | ||||||
2.50% 09/01/28 - 10/01/31 | 1,888,018 | 1,905,020 | ||||||
2.63% 01/11/22 | 1,500,000 | 1,530,990 | ||||||
3.00% 01/01/28 - 05/01/47 | 11,611,977 | 11,832,179 | ||||||
3.50% 01/01/27 - 09/01/48 | 16,251,989 | 16,767,702 | ||||||
4.00% 10/01/41 - 03/01/49 | 11,222,655 | 11,756,490 | ||||||
4.50% 01/01/27 - 04/01/49 | 5,438,969 | 5,785,322 | ||||||
5.00% 12/01/39 - 05/01/41 | 261,783 | 281,835 | ||||||
5.50% 12/01/35 - 04/01/38 | 1,108,220 | 1,207,052 | ||||||
6.00% 03/01/34 - 08/01/37 | 1,473,552 | 1,684,359 | ||||||
6.63% 11/15/30 | 100,000 | 142,959 | ||||||
3.50% TBA (e) | 1,800,000 | 1,841,954 | ||||||
4.00% TBA (e) | 2,100,000 | 2,170,287 | ||||||
4.50% TBA (e) | 500,000 | 522,390 | ||||||
Government National Mortgage Assoc. |
| |||||||
2.50% 05/20/45 | 234,559 | 236,350 | ||||||
3.00% 10/15/42 - 02/20/47 | 7,800,360 | 7,990,197 | ||||||
3.50% 03/20/45 - 08/20/48 | 11,603,105 | 12,024,489 | ||||||
4.00% 12/20/40 - 01/20/49 | 6,583,694 | 6,928,560 | ||||||
4.50% 05/20/40 - 12/20/48 | 2,973,007 | 3,125,352 | ||||||
5.00% 08/15/41 | 1,864,698 | 2,006,956 | ||||||
3.50% TBA (e) | 1,150,000 | 1,187,835 | ||||||
4.00% TBA (e) | 1,500,000 | 1,554,900 | ||||||
4.50% TBA (e) | 1,250,000 | 1,302,912 | ||||||
Other Securities | 1,514,322 | |||||||
|
| |||||||
| 133,758,301 | ||||||||
|
| |||||||
Asset Backed - 0.1% |
| |||||||
Other Securities | 2,069,729 | |||||||
|
| |||||||
Corporate Notes - 6.9% |
| |||||||
Aflac Inc. | ||||||||
3.63% 11/15/2024 | 150,000 | 158,682 | ||||||
Amazon.com Inc. | ||||||||
1.90% 8/21/2020 | 100,000 | 99,770 | ||||||
3.15% 8/22/2027 | 100,000 | 105,060 | ||||||
3.88% 8/22/2037 | 100,000 | 110,229 | ||||||
4.25% 8/22/2057 | 100,000 | 115,611 | ||||||
4.80% 12/5/2034 | 150,000 | 184,168 | ||||||
Anthem Inc. | ||||||||
3.30% 1/15/2023 | 100,000 | 102,910 | ||||||
3.70% 8/15/2021 | 237,000 | 242,517 | ||||||
4.38% 12/1/2047 | 65,000 | 69,060 | ||||||
Apple Inc. | ||||||||
2.00% 11/13/2020 | 50,000 | 49,976 | ||||||
2.25% 2/23/2021 | 200,000 | 200,644 | ||||||
2.40% 1/13/2023 | 50,000 | 50,471 | ||||||
2.50% 2/9/2022 | 150,000 | 151,707 | ||||||
| Principal Amount ($) or Number of Shares | Fair Value $ | |||||||
2.75% 1/13/2025 | 50,000 | 51,109 | ||||||
3.00% 11/13/2027 | 100,000 | 103,012 | ||||||
3.25% 2/23/2026 | 160,000 | 167,358 | ||||||
3.75% 11/13/2047 | 50,000 | 52,473 | ||||||
4.38% 5/13/2045 | 165,000 | 188,024 | ||||||
4.50% 2/23/2036 | 150,000 | 175,527 | ||||||
4.65% 2/23/2046 | 185,000 | 219,508 | ||||||
Berkshire Hathaway Energy Co. |
| |||||||
4.45% 1/15/2049 | 100,000 | 112,938 | ||||||
6.13% 4/01/2036 | 194,000 | 259,392 | ||||||
Berkshire Hathaway Finance Corp. |
| |||||||
3.00% 5/15/2022 | 200,000 | 205,780 | ||||||
4.2% 8/15/2048 | 100,000 | 111,665 | ||||||
4.25% 1/15/2049 | 100,000 | 112,425 | ||||||
Cisco Systems Inc. | ||||||||
2.90% 3/4/2021 | 125,000 | 126,539 | ||||||
5.90% 2/15/2039 | 200,000 | 272,818 | ||||||
Costco Wholesale Corp. | ||||||||
2.25% 2/15/2022 | 85,000 | 85,344 | ||||||
3.00% 5/18/2027 | 100,000 | 103,534 | ||||||
Exxon Mobil Corp. | ||||||||
2.71% 3/06/2025 | 150,000 | 153,552 | ||||||
3.04% 3/01/2026 | 50,000 | 51,805 | ||||||
3.18% 3/15/2024 | 150,000 | 156,598 | ||||||
Ford Motor Co. | ||||||||
4.35% 12/08/2026 | 100,000 | 100,875 | ||||||
4.75% 01/15/2043 | 150,000 | 130,376 | ||||||
HCA Inc. | ||||||||
4.50% 02/15/2027 | 30,000 | 31,985 | ||||||
4.75% 05/01/2023 | 30,000 | 32,069 | ||||||
5.00% 03/15/2024 | 50,000 | 54,464 | ||||||
5.13% 06/15/2039 | 100,000 | 104,179 | ||||||
5.25% 04/15/2025 | 35,000 | 38,752 | ||||||
5.25% 06/15/2026 | 35,000 | 38,709 | ||||||
5.50% 06/15/2047 | 35,000 | 37,521 | ||||||
5.88% 03/15/2022 | 150,000 | 164,313 | ||||||
Honeywell International Inc. |
| |||||||
3.35% 12/01/2023 | 150,000 | 157,081 | ||||||
Intel Corp. | ||||||||
2.60% 05/19/2026 | 150,000 | 150,996 | ||||||
3.73% 12/08/2047 | 100,000 | 103,842 | ||||||
4.10% 05/11/2047 | 100,000 | 109,388 | ||||||
Johnson & Johnson | ||||||||
1.95% 11/10/2020 | 15,000 | 15,000 | ||||||
2.45% 12/05/2021 | 200,000 | 202,052 | ||||||
2.45% 03/01/2026 | 75,000 | 75,274 | ||||||
2.90% 01/15/2028 | 50,000 | 51,484 | ||||||
3.40% 01/15/2038 | 25,000 | 25,976 | ||||||
3.50% 01/15/2048 | 30,000 | 31,456 | ||||||
4.38% 12/05/2033 | 150,000 | 175,903 | ||||||
Microsoft Corp. | ||||||||
1.55% 08/08/2021 | 150,000 | 148,724 | ||||||
2.40% 02/06/2022 | 100,000 | 101,067 | ||||||
See Notes to Summary Schedule of Investments and Notes to Financial Statements.
| State Street Total Return V.I.S. Fund | 5 |
Table of Contents
State Street Total Return V.I.S. Fund
Summary Schedule of Investments, continued — June 30, 2019 (Unaudited)
| Principal Amount ($) or Number of Shares | Fair Value $ | |||||||
2.88% 02/06/2024 | 150,000 | 155,373 | ||||||
3.45% 08/08/2036 | 200,000 | 211,362 | ||||||
3.50% 02/12/2035 | 65,000 | 69,284 | ||||||
3.75% 05/01/2043 | 150,000 | 163,068 | ||||||
4.10% 02/06/2037 | 100,000 | 114,137 | ||||||
4.45% 11/03/2045 | 225,000 | 270,751 | ||||||
Pfizer Inc. | ||||||||
2.80% 03/11/2022 | 100,000 | 101,974 | ||||||
3.00% 09/15/2021 | 120,000 | 122,431 | ||||||
3.20% 09/15/2023 | 125,000 | 129,920 | ||||||
3.45% 03/15/2029 | 50,000 | 52,897 | ||||||
3.60% 09/15/2028 | 50,000 | 53,997 | ||||||
3.90% 03/15/2039 | 125,000 | 134,594 | ||||||
4.00% 12/15/2036 | 100,000 | 108,883 | ||||||
4.00% 03/15/2049 | 25,000 | 27,202 | ||||||
4.30% 06/14/2043 | 100,000 | 112,427 | ||||||
Phillips 66 | ||||||||
3.90% 03/15/2028 | 50,000 | 52,705 | ||||||
4.88% 11/15/2044 | 45,000 | 50,233 | ||||||
Phillips 66 Partners LP | ||||||||
3.75% 03/01/2028 | 10,000 | 10,210 | ||||||
4.68% 02/15/2045 | 10,000 | 10,305 | ||||||
Royal Bank of Canada | ||||||||
2.15% 10/26/2020 | 125,000 | 124,951 | ||||||
2.30% 03/22/2021 | 100,000 | 150,666 | ||||||
2.75% 02/01/2022 | 50,000 | 50,789 | ||||||
2.80% 04/29/2022 | 100,000 | 101,627 | ||||||
The Allstate Corp. | ||||||||
4.20% 12/15/2046 | 100,000 | 111,476 | ||||||
The Allstate Corp. (5.75% fixed rate until 08/15/23; 2.94% + 3 month USD LIBOR thereafter) | ||||||||
5.75% 08/15/2053 (f) | 50,000 | 52,420 | ||||||
The Walt Disney Co. | ||||||||
3.38% 11/15/2026 (c) | 100,000 | 105,028 | ||||||
4.75% 11/15/2046 (c) | 100,000 | 123,262 | ||||||
6.65% 11/15/2037 (c) | 179,000 | 257,162 | ||||||
UnitedHealth Group Inc. | ||||||||
2.95% 10/15/2027 | 200,000 | 203,140 | ||||||
3.10% 03/15/2026 | 150,000 | 155,025 | ||||||
3.50% 02/15/2024 | 10,000 | 10,484 | ||||||
3.70% 12/15/2025 | 10,000 | 10,660 | ||||||
3.75% 10/15/2047 | 100,000 | 102,487 | ||||||
3.88% 12/15/2028 | 15,000 | 16,334 | ||||||
4.45% 12/15/2048 | 10,000 | 11,491 | ||||||
4.63% 07/15/2035 | 45,000 | 51,877 | ||||||
6.88% 02/15/2038 | 100,000 | 144,517 | ||||||
Valero Energy Corp. | ||||||||
6.63% 06/15/2037 | 150,000 | 189,570 | ||||||
| Principal Amount ($) or Number of Shares | Fair Value $ | |||||||
Valero Energy Partners LP | ||||||||
4.38% 12/15/2026 | 100,000 | 106,897 | ||||||
Other Securities | 125,551,703 | |||||||
|
| |||||||
| 136,015,011 | ||||||||
|
| |||||||
Non-Agency Collateralized Mortgage Obligations - 0.3% |
| |||||||
Other Securities | 5,483,118 | |||||||
|
| |||||||
Sovereign Bonds - 0.4% |
| |||||||
Other Securities | 7,734,305 | |||||||
|
| |||||||
Municipal Bonds and Notes - 0.2% |
| |||||||
Other Securities | 3,261,651 | |||||||
|
| |||||||
| Total Bonds and Notes (Cost $549,099,318) |
| 566,059,621 | ||||||
|
| |||||||
| Exchange Traded Funds - 16.0% |
| |||||||
Exchange Traded & Mutual Funds - 16.0% |
| |||||||
Invesco Optimum Yield Diversified Commodity Strategy NoK-1 ETF | 3,712,770 | 60,778,045 | ||||||
SPDR Bloomberg Barclays High Yield Bond ETF (g) | 1,454,125 | 158,412,378 | ||||||
SPDR Dow Jones REIT ETF (g) | 972,313 | 96,064,524 | ||||||
|
| |||||||
| Total Exchange Traded Funds (Cost $314,768,164) |
| 315,254,947 | ||||||
|
| |||||||
| Total Investments in Securities (Cost $1,845,027,746) |
| 1,939,854,654 | ||||||
|
| |||||||
| Short-Term Investments - 1.8% |
| |||||||
State Street Institutional U.S. Government Money Market Fund - Class G Shares 2.35% | 34,898,673 | 34,898,673 | ||||||
|
| |||||||
| Total Investments (Cost $1,879,926,419) |
| 1,974,753,327 | ||||||
| Liabilities in Excess of Other Assets, net - (0.1)% |
| (2,352,805 | ) | |||||
|
| |||||||
| NET ASSETS - 100.0% | 1,972,400,522 | |||||||
|
| |||||||
See Notes to Summary Schedule of Investments and Notes to Financial Statements.
| 6 | State Street Total Return V.I.S. Fund |
Table of Contents
State Street Total Return V.I.S. Fund
Summary Schedule of Investments, continued — June 30, 2019 (Unaudited)
Other Information:
The Fund had the following long futures contracts open at June 30, 2019:
| Description | Expiration date | Number of Contracts | Current Notional Value | Unrealized Appreciation | ||||||||||||
E-mini Russell 2000 Index Futures | September 2019 | 34 | $ | 2,664,070 | $ | 55,355 | ||||||||||
MSCI EAFE Mini Index Futures | September 2019 | 47 | 4,519,755 | 106,775 | ||||||||||||
MSCI Emerging Market Mini Futures | September 2019 | 110 | 5,793,700 | 204,403 | ||||||||||||
S&P 500E-mini Index Futures | September 2019 | 42 | 6,182,820 | 103,162 | ||||||||||||
|
| |||||||||||||||
| $ | 469,695 | |||||||||||||||
|
| |||||||||||||||
During the period ended June 30, 2019, average notional value related to futures contracts was $12,448,479 or 0.6% of net assets.
See Notes to Summary Schedule of Investments and Notes to Financial Statements.
| State Street Total Return V.I.S. Fund | 7 |
Table of Contents
State Street Total Return V.I.S. Fund
Notes to Summary Schedule of Investments — June 30, 2019 (Unaudited)
The Summary Schedule of Investments does not reflect the complete portfolio holdings. It includes the Fund’s 50 largest holdings and each investment of any issuer that exceeds 1% of the Fund’s net assets. “Other Securities” represent all issues not required to be disclosed under the rules adopted by the U.S. Securities and Exchange Commission (“SEC”). In certain instances, securities for which footnotes listed above may otherwise apply are included in the Other Securities caption. The complete schedule of portfolio holdings is available (i) without charge, upon request, by calling (800)242-0134; and ii) on the SEC’s website at http://www.sec.gov.
| (a) | Non-income producing security. |
| (b) | At June 30, 2019, all or a portion of this security was pledged to cover collateral requirements for futures and/or TBAs. |
| (c) | Pursuant to Rule 144A of the Securities Act of 1933, as amended, these securities may be resold in transactions exempt from registration, normally to qualified institutional buyers. At June 30, 2019, these securities amounted to $6,686,675 or 0.34% of the net assets of the State Street Total Return V.I.S. Fund. These securities have been determined to be liquid using procedures established by the State Street Variable Insurance Series Funds, Inc.’s Board of Directors (the “Board”). |
| (d) | Security is fair valued by the Oversight Committee, in accordance with the procedures approved by the Board. Security value is determined based on level 3 inputs. |
| (e) | Settlement is on a delayed delivery or when-issued basis with final maturity to be announced (“TBA”) in the future. |
| (f) | Variable Rate Security - Interest rate shown is rate in effect at June 30, 2019. For securities based on a published reference rate and spread, the reference rate and spread are indicated in the description above. |
| (g) | Sponsored by SSGA Funds Management, Inc., the Fund’s investment adviser and administrator, and an affiliate of State Street Bank & Trust Co., the Fund’ssub-administrator, custodian and accounting agent. |
| (h) | Coupon amount represents effective yield. |
| † | Percentages are based on net assets as of June 30, 2019. |
| * | Less than 0.05%. |
Abbreviations:
ADR - American Depositary Receipt
ISDA - International Swaps and Derivatives Association
LIBOR - London Interbank Offered Rate
NVDR -Non-Voting Depositary Receipt
REIT - Real Estate Investment Trust
SPDR - Standard and Poor’s Depositary Receipt
TBA - To Be Announced
The following table presents the Fund’s investments measured at fair value on a recurring basis at June 30, 2019:
| Investments | Level 1 | Level 2 | Level 3 | Total | ||||||||||||
Investments in Securities | ||||||||||||||||
Domestic Equity | $ | 614,964,288 | $ | 336 | $ | — | $ | 614,964,624 | ||||||||
Foreign Equity | 443,487,548 | 86,897 | 1,017 | 443,575,462 | ||||||||||||
U.S. Treasuries | — | 274,017,984 | — | 274,017,984 | ||||||||||||
Agency Mortgage Backed | — | 133,758,301 | — | 133,758,301 | ||||||||||||
Agency Collateralized Mortgage Obligations | — | 3,184,607 | — | 3,184,607 | ||||||||||||
Asset Backed | — | 2,069,729 | — | 2,069,729 | ||||||||||||
Corporate Notes | — | 136,015,011 | — | 136,015,011 | ||||||||||||
Non-Agency Collateralized Mortgage Obligations | — | 5,483,118 | — | 5,483,118 | ||||||||||||
Sovereign Bonds | — | 7,734,305 | — | 7,734,305 | ||||||||||||
Municipal Bonds and Notes | — | 3,261,651 | — | 3,261,651 | ||||||||||||
U.S. Government Sponsored Agencies | — | 534,915 | — | 534,915 | ||||||||||||
Exchange Traded & Mutual Funds | 315,254,947 | — | — | 315,254,947 | ||||||||||||
Short-Term Investments | 34,898,673 | — | — | 34,898,673 | ||||||||||||
|
|
|
|
|
|
|
| |||||||||
Total Investments in Securities | $ | 1,408,605,456 | $ | 566,146,854 | $ | 1,017 | $ | 1,974,753,327 | ||||||||
|
|
|
|
|
|
|
| |||||||||
Other Financial Instruments | ||||||||||||||||
Long Futures Contracts - Unrealized Appreciation | $ | 469,695 | $ | — | $ | — | $ | 469,695 | ||||||||
|
|
|
|
|
|
|
| |||||||||
See Notes to Summary Schedule of Investments and Notes to Financial Statements.
| 8 | State Street Total Return V.I.S. Fund |
Table of Contents
State Street Total Return V.I.S. Fund
Notes to Summary Schedule of Investments, continued — June 30, 2019 (Unaudited)
The Fund was invested in the following countries/territories at June 30, 2019 (unaudited):
| Country/Territory | Percentage (based on Fair Value) | |||
United States | 74.67% | |||
Japan | 3.26% | |||
United Kingdom | 2.98% | |||
Switzerland | 2.44% | |||
Canada | 2.20% | |||
Australia | 1.34% | |||
Germany | 1.32% | |||
France | 1.28% | |||
China | 1.10% | |||
Hong Kong | 0.98% | |||
Ireland | 0.88% | |||
Sweden | 0.58% | |||
Taiwan | 0.58% | |||
South Korea | 0.50% | |||
Netherlands | 0.46% | |||
Italy | 0.44% | |||
India | 0.40% | |||
Singapore | 0.39% | |||
Finland | 0.33% | |||
Supranational | 0.32% | |||
South Africa | 0.32% | |||
Spain | 0.31% | |||
Bermuda | 0.27% | |||
Israel | 0.26% | |||
Brazil | 0.26% | |||
Russian Federation | 0.26% | |||
Norway | 0.18% | |||
Belgium | 0.17% | |||
| Country/Territory | Percentage (based on Fair Value) | |||
Denmark | 0.17% | |||
Mexico | 0.17% | |||
New Zealand | 0.12% | |||
Malaysia | 0.12% | |||
Luxembourg | 0.12% | |||
Puerto Rico | 0.10% | |||
Poland | 0.10% | |||
Thailand | 0.09% | |||
Cayman Islands | 0.08% | |||
Philippines | 0.07% | |||
Chile | 0.06% | |||
Colombia | 0.05% | |||
Indonesia | 0.05% | |||
Turkey | 0.04% | |||
Hungary | 0.03% | |||
Iraq | 0.02% | |||
Uruguay | 0.02% | |||
Czech Republic | 0.02% | |||
Greece | 0.02% | |||
Peru | 0.02% | |||
Austria | 0.01% | |||
Czech | 0.01% | |||
Panama | 0.01% | |||
Guernsey | 0.01% | |||
Jersey | 0.01% | |||
Pakistan | 0.00% | |||
|
| |||
| 100.00% | ||||
|
| |||
The Fund’s % share of investment in the various categories, based on Fair Value, is as follows at June 30, 2019 (unaudited):
| Industry | Domestic | Foreign | Total | |||||||||
| 8.02% | 0.00% | 8.02% | ||||||||||
Exchange Traded Funds | 7.94% | 0.00% | 7.94% | |||||||||
Property & Casualty Insurance | 1.92% | 0.40% | 2.32% | |||||||||
Pharmaceuticals | 1.45% | 0.60% | 2.05% | |||||||||
Multi-Line Insurance | 0.13% | 1.40% | 1.53% | |||||||||
Diversified Banks | 0.00% | 1.40% | 1.40% | |||||||||
Multi-Sector Holdings | 1.03% | 0.27% | 1.30% | |||||||||
Application Software | 1.25% | 0.00% | 1.25% | |||||||||
Life & Health Insurance | 0.58% | 0.64% | 1.22% | |||||||||
Semiconductors | 1.06% | 0.15% | 1.21% | |||||||||
IT Consulting & Other Services | 0.24% | 0.92% | 1.16% | |||||||||
Technology Hardware, Storage & Peripherals | 0.62% | 0.52% | 1.14% | |||||||||
Oil & Gas Refining & Marketing | 0.92% | 0.17% | 1.09% | |||||||||
Healthcare Equipment | 0.99% | 0.03% | 1.02% | |||||||||
Industrial Machinery | 0.30% | 0.70% | 1.00% | |||||||||
Electric Utilities | 0.34% | 0.65% | 0.99% | |||||||||
Integrated Telecommunication Services | 0.01% | 0.96% | 0.97% | |||||||||
Apparel Retail | 0.80% | 0.15% | 0.95% | |||||||||
Industrial Conglomerates | 0.75% | 0.20% | 0.95% | |||||||||
See Notes to Summary Schedule of Investments and Notes to Financial Statements.
| State Street Total Return V.I.S. Fund | 9 |
Table of Contents
State Street Total Return V.I.S. Fund
Notes to Summary Schedule of Investments, continued — June 30, 2019 (Unaudited)
| Industry | Domestic | Foreign | Total | |||||||||
Integrated Oil & Gas | 0.22% | 0.72% | 0.94% | |||||||||
Communications Equipment | 0.93% | 0.00% | 0.93% | |||||||||
Retail REITs | 0.43% | 0.50% | 0.93% | |||||||||
Personal Products | 0.41% | 0.46% | 0.87% | |||||||||
Asset Management & Custody Banks | 0.46% | 0.35% | 0.81% | |||||||||
Food Retail | 0.25% | 0.54% | 0.79% | |||||||||
Mortgage REITs | 0.77% | 0.00% | 0.77% | |||||||||
Automobile Manufacturers | 0.39% | 0.37% | 0.76% | |||||||||
Apparel, Accessories & Luxury Goods | 0.35% | 0.40% | 0.75% | |||||||||
Trading Companies & Distributors | 0.24% | 0.50% | 0.74% | |||||||||
Movies & Entertainment | 0.69% | 0.04% | 0.73% | |||||||||
Industrial Gases | 0.00% | 0.73% | 0.73% | |||||||||
Data Processing & Outsourced Services | 0.68% | 0.04% | 0.72% | |||||||||
Hypermarkets & Super Centers | 0.61% | 0.10% | 0.71% | |||||||||
Reinsurance | 0.10% | 0.60% | 0.70% | |||||||||
Managed Healthcare | 0.67% | 0.00% | 0.67% | |||||||||
Regional Banks | 0.43% | 0.17% | 0.60% | |||||||||
Aerospace & Defense | 0.32% | 0.26% | 0.58% | |||||||||
Packaged Foods & Meats | 0.25% | 0.30% | 0.55% | |||||||||
Systems Software | 0.50% | 0.04% | 0.54% | |||||||||
Auto Parts & Equipment | 0.22% | 0.32% | 0.54% | |||||||||
Gas Utilities | 0.21% | 0.32% | 0.53% | |||||||||
Home Building | 0.05% | 0.45% | 0.50% | |||||||||
Specialty Chemicals | 0.04% | 0.45% | 0.49% | |||||||||
Healthcare Facilities | 0.39% | 0.03% | 0.42% | |||||||||
Diversified REITs | 0.14% | 0.27% | 0.41% | |||||||||
Household Products | 0.35% | 0.05% | 0.40% | |||||||||
Financial Exchanges & Data | 0.22% | 0.18% | 0.40% | |||||||||
Construction & Engineering | 0.23% | 0.14% | 0.37% | |||||||||
Internet & Direct Marketing Retail | 0.27% | 0.10% | 0.37% | |||||||||
Advertising | 0.29% | 0.05% | 0.34% | |||||||||
General Merchandise Stores | 0.00% | 0.33% | 0.33% | |||||||||
Biotechnology | 0.33% | 0.00% | 0.33% | |||||||||
Air Freight & Logistics | 0.29% | 0.03% | 0.32% | |||||||||
Tires & Rubber | 0.03% | 0.29% | 0.32% | |||||||||
Research & Consulting Services | 0.15% | 0.16% | 0.31% | |||||||||
Multi-Utilities | 0.21% | 0.09% | 0.30% | |||||||||
Technology Distributors | 0.27% | 0.03% | 0.30% | |||||||||
Healthcare Services | 0.22% | 0.08% | 0.30% | |||||||||
Healthcare Distributors | 0.15% | 0.14% | 0.29% | |||||||||
Department Stores | 0.17% | 0.11% | 0.28% | |||||||||
Environmental & Facilities Services | 0.28% | 0.00% | 0.28% | |||||||||
Airlines | 0.20% | 0.07% | 0.27% | |||||||||
Construction Machinery & Heavy Trucks | 0.19% | 0.07% | 0.26% | |||||||||
Life Sciences Tools & Services | 0.18% | 0.07% | 0.25% | |||||||||
Independent Power Producers & Energy Traders | 0.13% | 0.12% | 0.25% | |||||||||
Trucking | 0.20% | 0.04% | 0.24% | |||||||||
Human Resource & Employment Services | 0.16% | 0.06% | 0.22% | |||||||||
Interactive Media & Services | 0.12% | 0.10% | 0.22% | |||||||||
Industrial REITs | 0.01% | 0.20% | 0.21% | |||||||||
Health Care REITs | 0.21% | 0.00% | 0.21% | |||||||||
Specialty Stores | 0.20% | 0.01% | 0.21% | |||||||||
Security & Alarm Services | 0.00% | 0.21% | 0.21% | |||||||||
Real Estate Operating Companies | 0.00% | 0.20% | 0.20% | |||||||||
See Notes to Summary Schedule of Investments and Notes to Financial Statements.
| 10 | State Street Total Return V.I.S. Fund |
Table of Contents
State Street Total Return V.I.S. Fund
Notes to Summary Schedule of Investments, continued — June 30, 2019 (Unaudited)
| Industry | Domestic | Foreign | Total | |||||||||
Office REITs | 0.06% | 0.14% | 0.20% | |||||||||
Wireless Telecommunication Services | 0.03% | 0.17% | 0.20% | |||||||||
Electronic Manufacturing Services | 0.16% | 0.04% | 0.20% | |||||||||
Specialized REITs | 0.19% | 0.00% | 0.19% | |||||||||
Hotel & Resort REITs | 0.17% | 0.00% | 0.17% | |||||||||
Real Estate Development | 0.00% | 0.17% | 0.17% | |||||||||
Thrifts & Mortgage Finance | 0.16% | 0.00% | 0.16% | |||||||||
Distributors | 0.16% | 0.00% | 0.16% | |||||||||
Automotive Retail | 0.15% | 0.01% | 0.16% | |||||||||
Hotels, Resorts & Cruise Lines | 0.04% | 0.12% | 0.16% | |||||||||
Steel | 0.10% | 0.06% | 0.16% | |||||||||
Investment Banking & Brokerage | 0.16% | (0.01% | ) | 0.15% | ||||||||
Commodity Chemicals | 0.01% | 0.14% | 0.15% | |||||||||
Electronic Equipment & Instruments | 0.07% | 0.07% | 0.14% | |||||||||
Alternative Carriers | 0.11% | 0.03% | 0.14% | |||||||||
Electronic Components | 0.07% | 0.07% | 0.14% | |||||||||
Metal & Glass Containers | 0.10% | 0.04% | 0.14% | |||||||||
Diversified Support Services | 0.13% | 0.00% | 0.13% | |||||||||
Broadcasting | 0.07% | 0.06% | 0.13% | |||||||||
Tobacco | 0.01% | 0.10% | 0.11% | |||||||||
Commercial Printing | 0.01% | 0.10% | 0.11% | |||||||||
Internet Services & Infrastructure | 0.11% | 0.00% | 0.11% | |||||||||
Restaurants | 0.10% | 0.01% | 0.11% | |||||||||
Marine | 0.00% | 0.11% | 0.11% | |||||||||
Diversified Real Estate Activities | 0.00% | 0.11% | 0.11% | |||||||||
Cable & Satellite | 0.05% | 0.05% | 0.10% | |||||||||
Footwear | 0.07% | 0.03% | 0.10% | |||||||||
Distillers & Vintners | 0.02% | 0.08% | 0.10% | |||||||||
Consumer Electronics | 0.10% | 0.00% | 0.10% | |||||||||
Insurance Brokers | 0.10% | 0.00% | 0.10% | |||||||||
Electrical Components & Equipment | 0.09% | 0.00% | 0.09% | |||||||||
Construction Materials | 0.00% | 0.09% | 0.09% | |||||||||
Coal & Consumable Fuels | 0.01% | 0.08% | 0.09% | |||||||||
Airport Services | 0.03% | 0.05% | 0.08% | |||||||||
Oil & Gas Exploration & Production | 0.04% | 0.04% | 0.08% | |||||||||
Consumer Finance | 0.07% | 0.00% | 0.07% | |||||||||
Other Diversified Financial Services | 0.04% | 0.03% | 0.07% | |||||||||
Paper Packaging | 0.07% | 0.00% | 0.07% | |||||||||
Healthcare Supplies | 0.07% | 0.00% | 0.07% | |||||||||
Residential REITs | 0.06% | 0.00% | 0.06% | |||||||||
Renewable Electricity | 0.00% | 0.06% | 0.06% | |||||||||
Home Furnishing Retail | 0.06% | 0.00% | 0.06% | |||||||||
Soft Drinks | 0.05% | 0.01% | 0.06% | |||||||||
Brewers | 0.05% | 0.01% | 0.06% | |||||||||
Agricultural Products | 0.00% | 0.06% | 0.06% | |||||||||
Leisure Products | 0.04% | 0.02% | 0.06% | |||||||||
Railroads | 0.06% | 0.00% | 0.06% | |||||||||
Publishing | 0.02% | 0.03% | 0.05% | |||||||||
Oil & Gas Storage & Transportation | 0.02% | 0.03% | 0.05% | |||||||||
Agricultural & Farm Machinery | 0.05% | 0.00% | 0.05% | |||||||||
Interactive Home Entertainment | 0.05% | 0.00% | 0.05% | |||||||||
Oil & Gas Drilling | 0.05% | 0.00% | 0.05% | |||||||||
Household Appliances | 0.01% | 0.04% | 0.05% | |||||||||
See Notes to Summary Schedule of Investments and Notes to Financial Statements.
| State Street Total Return V.I.S. Fund | 11 |
Table of Contents
State Street Total Return V.I.S. Fund
Notes to Summary Schedule of Investments, continued — June 30, 2019 (Unaudited)
| Industry | Domestic | Foreign | Total | |||||||||
Diversified Metals & Mining | 0.00% | 0.05% | 0.05% | |||||||||
Paper Products | 0.04% | 0.00% | 0.04% | |||||||||
Education Services | 0.04% | 0.00% | 0.04% | |||||||||
Marine Ports & Services | 0.00% | 0.04% | 0.04% | |||||||||
Office Services & Supplies | 0.02% | 0.02% | 0.04% | |||||||||
Oil & Gas Equipment & Services | 0.04% | 0.00% | 0.04% | |||||||||
Fertilizers & Agricultural Chemicals | 0.01% | 0.03% | 0.04% | |||||||||
Home Improvement Retail | 0.00% | 0.04% | 0.04% | |||||||||
Computer & Electronics Retail | 0.00% | 0.03% | 0.03% | |||||||||
Building Products | 0.03% | 0.00% | 0.03% | |||||||||
Leisure Facilities | 0.03% | 0.00% | 0.03% | |||||||||
Water Utilities | 0.00% | 0.03% | 0.03% | |||||||||
Casinos & Gaming | 0.00% | 0.03% | 0.03% | |||||||||
Food Distributors | 0.01% | 0.02% | 0.03% | |||||||||
Diversified Chemicals | 0.00% | 0.03% | 0.03% | |||||||||
Motorcycle Manufacturers | 0.00% | 0.02% | 0.02% | |||||||||
Semiconductor Equipment | 0.01% | 0.01% | 0.02% | |||||||||
Drug Retail | 0.00% | 0.02% | 0.02% | |||||||||
Textiles | 0.00% | 0.01% | 0.01% | |||||||||
Diversified Capital Markets | 0.00% | 0.01% | 0.01% | |||||||||
Real Estate Services | 0.01% | 0.00% | 0.01% | |||||||||
Highways & Railtracks | 0.00% | 0.01% | 0.01% | |||||||||
Copper | 0.00% | 0.01% | 0.01% | |||||||||
Healthcare Technology | 0.01% | 0.00% | 0.01% | |||||||||
Aluminum | 0.00% | 0.00% | 0.00% | |||||||||
Home Furnishings | 0.00% | 0.00% | 0.00% | |||||||||
Specialized Finance | 0.00% | 0.00% | 0.00% | |||||||||
Banks | 0.00% | 0.00% | 0.00% | |||||||||
|
| |||||||||||
| 69.57% | ||||||||||||
|
| |||||||||||
| Sector | Percentage (based on Fair Value) | |||
U.S. Treasuries | 13.88% | |||
Corporate Notes | 6.89% | |||
Agency Mortgage Backed | 6.77% | |||
Sovereign Bonds | 0.39% | |||
Non-Agency Collateralized Mortgage Obligations | 0.28% | |||
Municipal Bonds and Notes | 0.16% | |||
Agency Collateralized Mortgage Obligations | 0.16% | |||
Asset Backed | 0.10% | |||
U.S. Government Sponsored Agencies | 0.03% | |||
|
| |||
| 28.66% | ||||
|
| |||
| Sector | Percentage (based on Fair Value) | |||
Short-Term Investments | ||||
Short-Term Investments | 1.77% | |||
|
| |||
| 1.77% | ||||
|
| |||
| 100.00% | ||||
|
| |||
See Notes to Summary Schedule of Investments and Notes to Financial Statements.
| 12 | State Street Total Return V.I.S. Fund |
Table of Contents
State Street Total Return V.I.S. Fund
Notes to Summary Schedule of Investments, continued — June 30, 2019 (Unaudited)
Affiliate Table
| Number of Shares Held at 12/31/18 | Value At 12/31/18 | Cost of Purchases | Proceeds from Shares Sold | Realized Gain (Loss) | Change in Unrealized Appreciation/ Depreciation | Number of Shares Held at 6/30/19 | Value at 6/30/19 | Dividend Income | ||||||||||||||||||||||||||||
SPDR Bloomberg Barclays High Yield Bond ETF | 2,846,551 | $ | 95,615,648 | $ | 81,239,660 | $ | 26,434,652 | $ | (726,720 | ) | $ | 8,718,442 | 1,454,125 | $ | 158,412,378 | $ | 2,910,395 | |||||||||||||||||||
SPDR Dow Jones REIT ETF | 410,485 | 35,301,710 | 74,819,129 | 20,888,224 | 408,828 | 6,423,081 | 972,313 | 96,064,524 | 1,173,419 | |||||||||||||||||||||||||||
State Street Institutional U.S. Government Money Market Fund -Class G Shares | 90,625,489 | 90,625,489 | 252,175,406 | 307,902,222 | — | — | 34,898,673 | 34,898,673 | 557,397 | |||||||||||||||||||||||||||
|
|
|
|
|
|
|
|
|
|
|
|
|
| |||||||||||||||||||||||
TOTAL | $ | 221,542,847 | $ | 408,234,195 | $ | 355,225,098 | $ | (317,892 | ) | $ | 15,141,523 | $ | 289,375,575 | $ | 4,641,211 | |||||||||||||||||||||
|
|
|
|
|
|
|
|
|
|
|
|
|
| |||||||||||||||||||||||
See Notes to Summary Schedule of Investments and Notes to Financial Statements.
| State Street Total Return V.I.S. Fund | 13 |
Table of Contents
State Street Total Return V.I.S. Fund
Selected data based on a share outstanding throughout the periods indicated
| Class 1 | ||||||||||||||||||||||||
| 6/30/19† | 12/31/18 | 12/31/17 | 12/31/16 | 12/31/15* | 12/31/14* | |||||||||||||||||||
| Inception date | 7/1/85 | |||||||||||||||||||||||
Net asset value, beginning of period | $ | 14.06 | $ | 19.94 | $ | 18.08 | $ | 17.66 | $ | 18.81 | $ | 18.71 | ||||||||||||
|
|
|
|
|
|
|
|
|
|
|
| |||||||||||||
Income/(loss) from investment operations: |
| |||||||||||||||||||||||
Net investment income | 0.18 | (a) | 0.40 | (a) | 0.36 | (a) | 0.35 | 0.31 | 0.35 | |||||||||||||||
Net realized and unrealized gains/(losses) on investments | 1.36 | (1.69 | ) | 2.46 | 0.77 | (0.52 | ) | 0.65 | ||||||||||||||||
|
|
|
|
|
|
|
|
|
|
|
| |||||||||||||
Total income/(loss) from investment operations | 1.54 | (1.29 | ) | 2.82 | 1.12 | (0.21 | ) | 1.00 | ||||||||||||||||
|
|
|
|
|
|
|
|
|
|
|
| |||||||||||||
Less distributions from: | ||||||||||||||||||||||||
Net investment income | — | 0.45 | 0.41 | 0.35 | 0.34 | 0.34 | ||||||||||||||||||
Net realized gains | — | 4.14 | 0.55 | 0.35 | 0.60 | 0.56 | ||||||||||||||||||
|
|
|
|
|
|
|
|
|
|
|
| |||||||||||||
Total distributions | — | 4.59 | 0.96 | 0.70 | 0.94 | 0.90 | ||||||||||||||||||
|
|
|
|
|
|
|
|
|
|
|
| |||||||||||||
Net asset value, end of period | $ | 15.60 | $ | 14.06 | $ | 19.94 | $ | 18.08 | $ | 17.66 | $ | 18.81 | ||||||||||||
|
|
|
|
|
|
|
|
|
|
|
| |||||||||||||
Total Return(b) | 10.95 | % | (6.34 | )% | 15.58 | % | 6.35 | % | (1.13 | )% | 5.32 | % | ||||||||||||
Ratios/Supplemental Data: | ||||||||||||||||||||||||
Net assets, end of period (in thousands) | $ | 768,639 | $ | 733,417 | $ | 856,665 | $ | 797,448 | $ | 807,584 | $ | 941,344 | ||||||||||||
Ratios to average net assets: | ||||||||||||||||||||||||
Net expenses | 0.62 | %** | 0.62 | % | 0.62 | % | 0.60 | % | 0.61 | % | 0.62 | %(c) | ||||||||||||
Gross expenses | 0.62 | %** | 0.62 | % | 0.62 | % | 0.60 | % | 0.61 | % | 0.62 | % | ||||||||||||
Net investment income | 2.42 | %** | 2.01 | % | 1.83 | % | 1.85 | % | 1.56 | % | 1.66 | % | ||||||||||||
Portfolio turnover rate | 45 | % | 97 | % | 15 | % | 45 | % | 70 | % | 78 | % | ||||||||||||
Notes to Financial Highlights
| (a) | Per share values have been calculated using the average shares method. |
| (b) | Total returns are historical and assume changes in share price, reinvestment of dividends and capital gains distributions and do not include the effect of insurance contract charges. Past performance does not guarantee future results. |
| (c) | Includes contractual management fee waiver related to the Fund’s investments in the GE Institutional Money Market Fund (the “Money Market Fund”). The fee waiver agreement was terminated effective June 30, 2014 with the closure of the Money Market Fund. |
| † | Unaudited. |
| * | Beginning with the year ended December 31, 2016, the Fund was audited by Ernst & Young LLP. The previous years were audited by another independent registered public accounting firm. |
| ** | Annualized for periods less than one year. |
The accompanying Notes are an integral part of these financial statements.
| 14 | Financial Highlights |
Table of Contents
State Street Total Return V.I.S. Fund
Financial Highlights
Selected data based on a share outstanding throughout the fiscal years indicated
| Class 3 | ||||||||||||||||||||||||
| 6/30/19† | 12/31/18 | 12/31/17 | 12/31/16 | 12/31/15* | 12/31/14* | |||||||||||||||||||
| Inception date | 5/1/06 | |||||||||||||||||||||||
Net asset value, beginning of period | $ | 14.01 | $ | 19.88 | $ | 18.03 | $ | 17.61 | $ | 18.75 | $ | 18.65 | ||||||||||||
|
|
|
|
|
|
|
|
|
|
|
| |||||||||||||
Income/(loss) from investment operations: |
| |||||||||||||||||||||||
Net investment income | 0.16 | (a) | 0.35 | (a) | 0.31 | (a) | 0.30 | 0.27 | 0.28 | |||||||||||||||
Net realized and unrealized gains/(losses) on investments | 1.36 | (1.69 | ) | 2.44 | 0.77 | (0.51 | ) | 0.67 | ||||||||||||||||
|
|
|
|
|
|
|
|
|
|
|
| |||||||||||||
Total income/(loss) from investment operations | 1.52 | (1.34 | ) | 2.75 | 1.07 | (0.24 | ) | 0.95 | ||||||||||||||||
|
|
|
|
|
|
|
|
|
|
|
| |||||||||||||
Less distributions from: | ||||||||||||||||||||||||
Net investment income | — | 0.39 | 0.35 | 0.30 | 0.30 | 0.29 | ||||||||||||||||||
Net realized gains | — | 4.14 | 0.55 | 0.35 | 0.60 | 0.56 | ||||||||||||||||||
|
|
|
|
|
|
|
|
|
|
|
| |||||||||||||
Total distributions | — | 4.53 | 0.90 | 0.65 | 0.90 | 0.85 | ||||||||||||||||||
|
|
|
|
|
|
|
|
|
|
|
| |||||||||||||
Net asset value, end of period | $ | 15.53 | $ | 14.01 | $ | 19.88 | $ | 18.03 | $ | 17.61 | $ | 18.75 | ||||||||||||
|
|
|
|
|
|
|
|
|
|
|
| |||||||||||||
Total Return(b) | 10.85 | % | (6.61 | )% | 15.26 | % | 6.08 | % | (1.34 | )% | 5.07 | % | ||||||||||||
Ratios/Supplemental Data: | ||||||||||||||||||||||||
Net assets, end of period (in thousands) | $ | 1,203,761 | $ | 1,165,809 | $ | 1,464,061 | $ | 1,508,428 | $ | 1,633,723 | $ | 1,842,997 | ||||||||||||
Ratios to average net assets: | ||||||||||||||||||||||||
Net Expenses | 0.87 | %** | 0.87 | % | 0.87 | % | 0.85 | % | 0.86 | % | 0.87 | %(c) | ||||||||||||
Gross Expenses | 0.87 | %** | 0.87 | % | 0.87 | % | 0.85 | % | 0.86 | % | 0.87 | % | ||||||||||||
Net investment income | 2.17 | %** | 1.76 | % | 1.59 | % | 1.60 | % | 1.31 | % | 1.40 | % | ||||||||||||
Portfolio turnover rate | 45 | % | 97 | % | 15 | % | 45 | % | 70 | % | 78 | % | ||||||||||||
Notes to Financial Highlights
| (a) | Per share values have been calculated using the average shares method. |
| (b) | Total returns are historical and assume changes in share price, reinvestment of dividends and capital gains distributions and do not include the effect of insurance contract charges. Past performance does not guarantee future results. |
| (c) | Includes contractual management fee waiver related to the Fund’s investments in the GE Institutional Money Market Fund (the “Money Market Fund”). The fee waiver agreement was terminated effective June 30, 2014 with the closure of the Money Market Fund. |
| † | Unaudited. |
| * | Beginning with the year ended December 31, 2016, the Fund was audited by Ernst & Young LLP. The previous years were audited by another independent registered public accounting firm. |
| ** | Annualized for periods less than one year. |
The accompanying Notes are an integral part of these financial statements.
| Financial Highlights | 15 |
Table of Contents
State Street Total Return V.I.S. Fund
Statement of Assets and Liabilities — June 30, 2019 (Unaudited)
Assets | ||||
Investments in securities, at fair value (cost $1,595,535,937) | $ | 1,685,377,752 | ||
Investments in affiliated securities, at fair value (cost $249,491,809) | 254,476,902 | |||
Short-term affiliated investments, at fair value | 34,898,673 | |||
Cash | 5,775 | |||
Cash collateral on deposit with broker for future contracts | 565,766 | |||
Foreign currency (cost $2,052,182) | 2,068,658 | |||
Receivable for investments sold | 374,712 | |||
Income receivables | 6,542,117 | |||
Receivable for fund shares sold | 1,780 | |||
Income receivable from affiliated investments | 61,842 | |||
Receivable for accumulated variation margin on futures contracts | 470,305 | |||
|
| |||
Total assets | 1,984,844,282 | |||
|
| |||
Liabilities | ||||
Payable for investments purchased | 9,950,305 | |||
Payable for fund shares redeemed | 452,565 | |||
Payable to the Adviser | 562,995 | |||
Payable for custody, fund accounting andsub-administration fees | 82,158 | |||
Accrued other expenses | 122,122 | |||
Distribution and service fees | 1,228,019 | |||
Accrued foreign capital gains tax | 45,596 | |||
|
| |||
Total liabilities | 12,443,760 | |||
|
| |||
Net Assets | $ | 1,972,400,522 | ||
|
| |||
Net Assets Consist of: | ||||
Capital paid in | $ | 1,884,034,560 | ||
Total distributable earnings (loss) | 88,365,962 | |||
|
| |||
Net Assets | $ | 1,972,400,522 | ||
|
| |||
Class 1 | ||||
Net Assets | $ | 768,639,365 | ||
Shares outstanding ($0.01 par value, unlimited shares authorized) | 49,282,535 | |||
Net asset value, offering and redemption price per share | $ | 15.60 | ||
Class 3 | ||||
Net Assets | $ | 1,203,761,157 | ||
Shares outstanding ($0.01 par value, unlimited shares authorized) | 77,527,598 | |||
Net asset value per share | $ | 15.53 | ||
The accompanying Notes are an integral part of these financial statements.
| 16 | Statement of Assets and Liabilities |
Table of Contents
State Street Total Return V.I.S. Fund
Statement of Operations — For the period ended June 30, 2019 (Unaudited)
Investment Income | ||||
Income | ||||
Dividend | $ | 17,792,875 | ||
Interest | 8,376,382 | |||
Income from affiliated investments | 4,641,211 | |||
Less: Foreign taxes withheld | (1,137,446 | ) | ||
|
| |||
Total income | 29,673,022 | |||
|
| |||
Expenses | ||||
Advisory and administration fees | 3,413,764 | |||
Distribution and service fees | ||||
Class 1 | 757,421 | |||
Class 3 | 2,684,928 | |||
Directors’ fees | 47,860 | |||
Custody, fund accounting andsub-administration fees | 333,028 | |||
Professional fees | 189,068 | |||
Other expenses | 117,763 | |||
|
| |||
Total expenses | 7,543,832 | |||
|
| |||
Net investment income | $ | 22,129,190 | ||
|
| |||
Net Realized and Unrealized Gain (Loss) on Investments |
| |||
Realized gain (loss) on: |
| |||
Unaffiliated investments | $ | (5,990,609 | )* | |
Affiliated investments | (317,892 | ) | ||
Futures | 1,071,571 | |||
Foreign currency transactions | (143,106 | ) | ||
Increase (decrease) in unrealized appreciation/depreciation on: |
| |||
Unaffiliated investments | 168,796,028 | ** | ||
Affiliated investments | 15,141,523 | |||
Futures | 789,263 | |||
Foreign currency translations | 30,696 | |||
|
| |||
Net realized and unrealized gain (loss) on investments | 179,377,474 | |||
|
| |||
Net Increase in Net Assets Resulting from Operations | $ | 201,506,664 | ||
|
| |||
| * | Includes $7,694 of net realized gains from foreign capital tax gain. |
| ** | Includes change in accrued foreign capital gains tax of $45,596. |
The accompanying Notes are an integral part of these financial statements.
| Statement of Operations | 17 |
Table of Contents
State Street Total Return V.I.S. Fund
Statement of Changes in Net Assets
Six Months Ended June 30, | Year Ended December 31, | |||||||
Increase (Decrease) in Net Assets | ||||||||
Operations: | ||||||||
Net investment income | $ | 22,129,190 | $ | 40,212,947 | ||||
Net realized gain (loss) on investments, futures and foreign currency related transactions | (5,380,036 | ) | 405,529,321 | |||||
Net increase (decrease) in unrealized appreciation/depreciation on investments, futures and foreign currency transactions | 184,757,510 | (578,300,573 | ) | |||||
|
|
|
| |||||
Net increase (decrease) from operations | 201,506,664 | (132,558,305 | ) | |||||
|
|
|
| |||||
Distributions to shareholders: |
| |||||||
Total distributions | ||||||||
Class 1 | — | (180,207,716 | ) | |||||
Class 3 | — | (284,866,389 | ) | |||||
|
|
|
| |||||
Total distributions | — | (465,074,105 | ) | |||||
|
|
|
| |||||
Increase (decrease) in assets from operations and distributions | 201,506,664 | (597,632,410 | ) | |||||
|
|
|
| |||||
Share transactions: |
| |||||||
Proceeds from sale of shares | ||||||||
Class 1 | 4,139,551 | 20,964,003 | ||||||
Class 3 | 7,447,161 | 30,059,171 | ||||||
Value of distributions reinvested | ||||||||
Class 1 | — | 180,207,716 | ||||||
Class 3 | — | 284,866,389 | ||||||
Cost of shares redeemed | ||||||||
Class 1 | (47,579,116 | ) | (94,290,832 | ) | ||||
Class 3 | (92,340,402 | ) | (245,672,997 | ) | ||||
|
|
|
| |||||
Net increase (decrease) from share transactions | (128,332,806 | ) | 176,133,450 | |||||
|
|
|
| |||||
Total increase (decrease) in net assets | 73,173,858 | (421,498,960 | ) | |||||
Net Assets |
| |||||||
Beginning of period | 1,899,226,664 | 2,320,725,624 | ||||||
|
|
|
| |||||
End of period | $ | 1,972,400,522 | $ | 1,899,226,664 | ||||
|
|
|
| |||||
Changes in Fund Shares |
| |||||||
Class 1 |
| |||||||
Shares sold | 276,291 | 1,059,253 | ||||||
Issued for distributions reinvested | — | 12,899,622 | ||||||
Shares redeemed | (3,164,743 | ) | (4,756,048 | ) | ||||
|
|
|
| |||||
Net increase (decrease) in fund shares | (2,888,452 | ) | 9,202,827 | |||||
|
|
|
| |||||
Class 3 |
| |||||||
Shares sold | 497,982 | 1,521,278 | ||||||
Issued for distributions reinvested | — | 20,449,848 | ||||||
Shares redeemed | (6,168,227 | ) | (12,429,805 | ) | ||||
|
|
|
| |||||
Net increase (decrease) in fund shares | (5,670,245 | ) | 9,541,321 | |||||
|
|
|
| |||||
| * | Unaudited. |
The accompanying Notes are an integral part of these financial statements.
| 18 | Statement of Changes in Net Assets |
Table of Contents
State Street Total Return V.I.S. Fund
Notes to Financial Statements — June 30, 2019 (Unaudited)
| 1. | Organization of the Company |
State Street Variable Insurance Series Funds, Inc. (the “Company”) was incorporated under the laws of the Commonwealth of Virginia on May 14, 1984 and is registered under the Investment Company Act of 1940, as amended (the “1940 Act”), as anopen-end management investment company. The Company is currently composed of the following seven investment portfolios (collectively, the “Funds”): State Street U.S. Equity V.I.S. Fund, State Street S&P 500 Index V.I.S. Fund, State Street Premier Growth Equity V.I.S. Fund, State StreetSmall-Cap Equity V.I.S. Fund, State Street Total Return V.I.S. Fund (the “Fund”), State Street Income V.I.S. Fund and State Street Real Estate Securities V.I.S. Fund. Each Fund is a diversified investment company within the meaning of the 1940 Act.
Shares of the Funds of the Company are offered only to insurance company separate accounts that fund certain variable life insurance contracts and variable annuity contracts.
The Company currently offers two share classes of the Fund as investment options for variable life insurance and variable annuity contracts — Class 1 and Class 3. Class 3 shares were first offered on May 1, 2006, and Fund shares outstanding prior to May 1, 2006 were designated as Class 1 shares. Each class of shares has different fees and expenses, and as a result, each class of shares will have different share price and performance. Not all variable contracts offer each class of the Fund’s shares.
Under the Company’s organizational documents, its officers and directors are indemnified against certain liabilities arising out of the performance of their duties to the Company. Additionally, in the normal course of business, the Company enters into contracts with service providers that contain general indemnification clauses. The Company’s maximum exposure under these arrangements is unknown as this would involve future claims that may be made against the Company that have not yet occurred.
| 2. | Summary of Significant Accounting Policies |
The following is a summary of significant accounting policies followed by the Company in the preparation of its financial statements:
The preparation of financial statements in accordance with U.S. generally accepted accounting principles (“U.S. GAAP”) requires management to make estimates and assumptions that affect the reported amounts and disclosures in the financial statements. Actual results could differ from those estimates. The Fund is an investment company under U.S. GAAP and follows the accounting and reporting guidance applicable to investment companies.
Security Valuation The Fund’s investments are valued at fair value each day that the New York Stock Exchange (“NYSE”) is open and, for financial reporting purposes, as of the report date should the reporting period end on a day that the NYSE is not open. Fair value is generally defined as the price a fund would receive to sell an asset or pay to transfer a liability in an orderly transaction between market participants at the measurement date. By its nature, a fair value price is a good faith estimate of the valuation in a current sale and may not reflect an actual market price. The investments of the Fund are valued pursuant to the policy and procedures developed by the Oversight Committee (the “Committee”) and approved by the Company’s Board of Directors (the “Board”). The Committee provides oversight of the valuation of investments for the Fund. The Board has responsibility for overseeing the determination of the fair value of investments.
Valuation techniques used to value the Fund’s investments by major category are as follows:
| • | Equity investments (including preferred stocks and registered investment companies that are exchange - traded funds) traded on a recognized securities exchange for which market quotations are readily available are valued at the last sale price or official closing price, as applicable, on the primary market or exchange on which they trade. Equity investments traded on a recognized exchange for which there were no sales on that day are valued at the last published sale price or at fair value. |
| • | Investments in registered investment companies (including money market funds) or other unitized pooled investment vehicles that are not traded on an exchange are valued at that day’s published net asset value (“NAV”) per share or unit. |
| • | Government and municipal fixed income securities are generally valued using quotations from independent pricing services or brokers. Certain government inflation-indexed securities may require a calculated fair valuation as the cumulative |
| Notes to Financial Statements | 19 |
Table of Contents
State Street Total Return V.I.S. Fund
Notes to Financial Statements, continued — June 30, 2019 (Unaudited)
| inflation is contained within the price provided by the pricing service or broker. For these securities, the inflation component of the price is “cleaned” from the pricing service or broker price utilizing the published inflation factors in order to ensure proper accrual of income. |
| • | Debt obligations (including short term investments and convertible debt securities) are valued using quotations from independent pricing services or brokers or are generally valued at the last reported evaluated prices. |
| • | Exchange-traded futures contracts are valued at the closing settlement price on the primary market on which they are traded most extensively. Exchange-traded futures contracts traded on a recognized exchange for which there were no sales on that day are valued at the last reported sale price obtained from independent pricing services or brokers or at fair value. |
In the event prices or quotations are not readily available or that the application of these valuation methods results in a price for an investment that is deemed to be not representative of the fair value of such investment, fair value will be determined in good faith by the Committee, in accordance with the valuation policy and procedures approved by the Board.
A “significant event” is an event that the Board believes, with a reasonably high degree of certainty, has caused the closing market prices of a Fund’s portfolio securities to no longer reflect their value at the time of the Fund’s NAV calculation. Fair value may be determined using an independent fair value service under valuation procedures approved by the Board. The independent fair value service takes into account multiple factors including, but not limited to, movements in the U.S. securities markets, certain depositary receipts, futures contracts and foreign currency exchange rates that have occurred subsequent to the close of foreign securities exchanges. The use of the independent fair value service or alternative fair valuation methods would result in the investments being classified within Level 2 of the fair value hierarchy.
The Fund values its assets and liabilities at fair value using a fair value hierarchy consisting of three broad levels that prioritize the inputs to valuation techniques giving the highest priority to readily available unadjusted quoted prices in active markets for identical assets or liabilities (Level 1 measurements) and the lowest priority to unobservable inputs (Level 3 measurements) when market prices are not readily available or reliable. The categorization of a value determined for an investment within the hierarchy is based upon the pricing transparency of the investment and is not necessarily an indication of the risk associated with investing in it.
The three levels of the fair value hierarchy are as follows:
| • | Level 1 — Unadjusted quoted prices in active markets for an identical asset or liability; |
| • | Level 2 — Inputs other than quoted prices included within Level 1 that are observable for the asset or liability either directly or indirectly, including quoted prices for similar assets or liabilities in active markets, quoted prices for identical or similar assets or liabilities in markets that are not considered to be active, inputs other than quoted prices that are observable for the asset or liability (such as exchange rates, financing terms, interest rates, yield curves, volatilities, prepayment speeds, loss severities, credit risks and default rates) or other market-corroborated inputs; and |
| • | Level 3 — Unobservable inputs for the asset or liability, including the Committee’s assumptions used in determining the fair value of investments. |
The value of the Fund’s investments according to the fair value hierarchy as of June 30, 2019 is disclosed in the Fund’s Summary Schedule of Investments.
Investment Transactions and Income Recognition Investment transactions are accounted for on trade date for financial reporting purposes. Realized gains and losses from the sale or disposition of investments and foreign exchange transactions, if any, are determined using the identified cost method.
Dividend income and capital gain distributions, if any, are recognized on theex-dividend date, net of any foreign taxes withheld at source, if any.
Interest income is recorded daily on an accrual basis. All premiums and discounts are amortized/accreted for financial reporting purposes.
Non-cash dividends received in the form of stock are recorded as dividend income at fair value.
| 20 | Notes to Financial Statements |
Table of Contents
State Street Total Return V.I.S. Fund
Notes to Financial Statements, continued — June 30, 2019 (Unaudited)
Expenses Certain expenses, which are directly identifiable to a specific Fund, are applied to the Fund within the Company. Other expenses which cannot be attributed to a specific Fund are allocated in such a manner as deemed equitable, taking into consideration the nature and type of expense and the relative net assets of the Fund within the Company.
Foreign Currency Translation The accounting records of the Fund are maintained in U.S. dollars. Foreign currencies as well as investment securities and other assets and liabilities denominated in a foreign currency are translated to U.S. dollars using exchange rates at period end. Purchases and sales of securities, income receipts and expense payments denominated in foreign currencies are translated into U.S. dollars at the prevailing exchange rate on the respective dates of the transactions.
The effects of exchange rate fluctuations on investments are included with the net realized and unrealized gain (loss) on investment securities. Other foreign currency transactions resulting in realized and unrealized gain (loss) are disclosed separately.
Foreign Taxes The Fund may be subject to foreign taxes (a portion of which may be reclaimable) on income, stock dividends, realized and unrealized capital gains on investments or certain foreign currency transactions. Foreign taxes are recorded in accordance with SSGA Funds Management, Inc.’s (the “Adviser” or “SSGA FM”) understanding of the applicable foreign tax regulations and rates that exist in the foreign jurisdictions in which the Fund invests. These foreign taxes, if any, are paid by the Fund and are reflected in the Statement of Operations, if applicable. Foreign taxes payable or deferred as of June 30, 2019, if any, are disclosed in the Fund’s Statement of Assets and Liabilities.
Distributions The Fund declares and pays any dividends from net investment income annually.
Net realized capital gains, if any, are distributed annually, unless additional distributions are required for compliance with applicable tax regulations. The amount and character of income and capital gains to be distributed are determined in accordance with applicable tax regulations which may differ from net investment income and realized gains recognized for U.S. GAAP purposes.
| 3. | Securities and Other Investments |
Delayed Delivery Transactions and When-Issued Securities During the period ended June 30, 2019, the Fund transacted in securities on a delayed delivery or when-issued basis. Payment and delivery may take place after the customary settlement period for that security. The price of the underlying securities and the date when the securities will be delivered and paid for are fixed at the time the transaction is negotiated. The securities purchased on a delayed delivery or when-issued basis are identified as such in the Fund’s Summary Schedule of Investments. The Fund may receive compensation for interest forgone in the purchase of a delayed delivery or when-issued security. With respect to such purchase commitments, the Fund identifies securities as segregated in its records with a value at least equal to the amount of the commitment. Losses may arise due to changes in the value of the underlying securities or if the counterparty does not perform under the contract’s terms, or if the issuer does not issue the securities due to political, economic or other factors.
To-Be-Announced Transactions The Fund may seek to obtain exposure to U.S. agency mortgage pass-through securities through the use of“to-be-announced” or “TBA transactions.” “TBA” refers to a commonly used mechanism for the forward settlement of U.S. agency mortgage pass-through securities. In a TBA transaction, the buyer and seller decide on general trade parameters, such as agency, settlement date, coupon, and price.
The Fund may use TBA transactions to “roll over” such agreements prior to the settlement date. This type of TBA transaction is sometimes known as a “TBA roll.” In a TBA roll, the Fund generally will sell the obligation to purchase the pools stipulated in the TBA agreement prior to the settlement date and will enter into a new TBA agreement for future delivery of pools of mortgage pass-through securities. The Fund may also enter into TBA agreements and settle such transactions on the stipulated settlement date by accepting actual receipt or delivery of the pools of mortgage pass-through securities.
Default by or bankruptcy of a counterparty to a TBA transaction would expose the Fund to possible loss because of adverse market action, expenses or delays in connection with the purchase or sale of the pools of mortgage pass-through securities specified in the TBA transaction. To minimize this risk, the Fund will enter into TBA transactions only with established counterparties. The Fund’s use of “TBA rolls” may impact portfolio turnover, transaction costs and capital gain distributions to shareholders.
| Notes to Financial Statements | 21 |
Table of Contents
State Street Total Return V.I.S. Fund
Notes to Financial Statements, continued — June 30, 2019 (Unaudited)
| 4. | Derivative Financial Instruments |
Futures Contracts The Fund may enter into futures contracts to meet the Fund’s objectives. A futures contract is a standardized, exchange-traded agreement to buy or sell a financial instrument at a set price on a future date. Upon entering into a futures contract, the Fund is required to deposit with the broker, cash or securities in an amount equal to the minimum initial margin requirements of the clearing house. Subsequent payments are made or received by the Fund equal to the daily change in the contract value and are recorded as variation margin receivable or payable with a corresponding offset to unrealized gains or losses. The Fund recognizes a realized gain or loss when the contract is closed.
Losses may arise if the value of a futures contract decreases due to unfavorable changes in the market rates or values of the underlying instrument during the term of the contract or if the counterparty does not perform under the contract. The use of futures contracts also involves the risk that the movements in the price of the futures contracts do not correlate with the movement of the assets underlying such contracts.
For the period ended June 30, 2019, the Fund entered into futures contracts for cash equitization.
The following tables summarize the value of the Fund’s derivative instruments as of June 30, 2019 and the related location in the accompanying Statement of Assets and Liabilities and Statement of Operations, presented by primary underlying risk exposure:
Asset Derivatives
| Interest Rate Contracts Risk | Foreign Exchange Contracts Risk | Credit Contracts Risk | Equity Contracts Risk | Commodity Contracts Risk | Total | |||||||||||||||||||
State Street Total Return V.I.S. Fund |
| |||||||||||||||||||||||
Futures Contracts | $ | — | $ | — | $ | — | $ | 470,305 | $ | — | $ | 470,305 | ||||||||||||
Realized Gain/Loss
|
| |||||||||||||||||||||||
| Interest Rate Contracts Risk | Foreign Exchange Contracts Risk | Credit Contracts Risk | Equity Contracts Risk | Commodity Contracts Risk | Total | |||||||||||||||||||
State Street Total Return V.I.S. Fund |
| |||||||||||||||||||||||
Futures Contracts | $ | — | $ | — | $ | — | $ | 1,071,571 | $ | — | $ | 1,071,571 | ||||||||||||
Net Change in Unrealized Appreciation (Depreciation)
|
| |||||||||||||||||||||||
| Interest Rate Contracts Risk | Foreign Exchange Contracts Risk | Credit Contracts Risk | Equity Contracts Risk | Commodity Contracts Risk | Total | |||||||||||||||||||
State Street Total Return V.I.S. Fund |
| |||||||||||||||||||||||
Futures Contracts | $ | — | $ | — | $ | — | $ | 789,263 | $ | — | $ | 789,263 | ||||||||||||
| 5. | Fees and Transactions with Affiliates |
Advisory Fee SSGA FM, a registered investment adviser, was retained by the Board to act as investment adviser and administrator of the Fund. SSGA FM’s compensation for investment advisory and administrative services (“Management Fee”) is paid monthly based on the average daily net assets of the Fund at an annualized rate of 0.35%.
Investor Service Plan — Class 1 and Class 3 Shares The Company adopted an Investor Service Plan (the “Service Plan”) on December 9, 2005 for Class 1 shares and on May 1, 2009 for Class 3 shares of the Fund. The Service Plan was not adopted pursuant to Rule12b-1 under the 1940 Act. Each Service Plan provides that during any fiscal year, the amount of compensation paid under the Service Plan by the Fund Class 1 or Class 3 shares may not exceed the annual rate of 0.20% of the average daily net assets of the Fund attributable to each such share class.
| 22 | Notes to Financial Statements |
Table of Contents
State Street Total Return V.I.S. Fund
Notes to Financial Statements, continued — June 30, 2019 (Unaudited)
Distribution and Shareholder Service(12b-1) Fees The Company has adopted a Distribution and Service(12b-1) Plan (the“12b-1 Plan”) pursuant to Rule12b-1 under the 1940 Act with respect to each of Class 1 and Class 3 shares of the Fund. Under the12b-1 Plan for Class 1 shares that became effective May 1, 2009, payments made under the Class 1 Investor Service Plan are covered in the event that any portion of compensation paid pursuant to the Class 1 Investor Service Plan is determined to be an indirect use of the assets attributable to the Class 1 shares to finance distribution of such shares. Under the12b-1 Plan for Class 3 shares, the Company, on behalf of the Fund, may have compensated State Street Global Advisors Funds Distributors, LLC (“SSGA FD”), the distributor of the shares of the Fund for certain sales services provided by SSGA FD or other broker dealers and investor services provided by SSGA FD or other service providers relating to the Fund’s Class 3 shares, including services to owners or prospective owners of variable contracts issued by insurance companies that offer Class 3 shares as an investment option under such variable contracts. The amount of compensation paid under the12b-1 Plan for Class 3 shares may not exceed 0.25% of the average daily net assets of the Fund attributable to such share class. The12b-1 Plan continues in effect from year to year for so long as such continuance is approved annually by the Board, including by those Directors who are not interested persons of the Company and who have no direct or indirect financial interest in the operation of the12b-1 Plan or in any agreement related to it. In addition, the Class 312b-1 Plan covers payments made under the Class 3 Investor Service Plan in the event that any portion of compensation paid pursuant to the Class 3 Investor Service Plan is determined to be an indirect use of the assets attributable to the Class 3 shares to finance distribution of such shares.
Custody, Fund Accounting andSub-Administration Fees State Street Bank and Trust Company (“State Street”) serves as the custodian, fund accountant andsub-administrator to the Fund. Amounts paid by the Fund to State Street for performing such services are included as custody, fund accounting andsub-administration fees in the Statement of Operations.
Other Transactions with Affiliates The Fund may invest in affiliated entities, including securities issued by State Street Corporation, affiliated funds, or entities deemed to be affiliates as a result of the Fund owning more than five percent of the entity’s voting securities or outstanding shares. Amounts relating to these transactions during the period ended June 30, 2019 are disclosed in the Summary Schedule of Investments.
| 6. | Directors’ Fees |
The fees and expenses of the Company’s directors who are not “interested persons” of the Company, as defined in the 1940 Act (“Independent Directors”), are paid directly by the Fund. The Independent Directors are reimbursed for travel and otherout-of-pocket expenses in connection with meeting attendance and industry seminars.
| 7. | Investment Transactions |
Purchases and sales of investments (excludingin-kind transactions, short term investments and derivative contracts) for the period ended June 30, 2019 were as follows:
| U.S. Government Securities | ||||||||
| Purchases | Sales | |||||||
| $ | 126,937,469 | $ | 180,976,834 | |||||
| Non-U.S. Government Securities | ||||||||
| Purchases | Sales | |||||||
| $ | 792,515,740 | $ | 790,207,363 | |||||
| 8. | Income Taxes |
The Fund has qualified and intends to continue to qualify as a regulated investment company under Subchapter M of the Internal Revenue Code of 1986, as amended. The Fund will not be subject to federal income taxes to the extent it distributes its taxable income, including any net realized capital gains, for each fiscal year. Therefore, no provision for federal income tax is required.
The Fund files federal and various state and local tax returns as required. No income tax returns are currently under examination. Generally, the federal returns are subject to examination by the Internal Revenue Service for a period of three
| Notes to Financial Statements | 23 |
Table of Contents
State Street Total Return V.I.S. Fund
Notes to Financial Statements, continued — June 30, 2019 (Unaudited)
years from date of filing, while the state returns may remain open for an additional year depending upon jurisdiction. SSGA FM has analyzed the Fund’s tax positions taken on tax returns for all open years and does not believe there are any uncertain tax positions that would require recognition of a tax liability.
Distributions to shareholders are recorded onex-dividend date. Income dividends and gain distributions are determined in accordance with income tax rules and regulations, which may differ from generally accepted accounting principles.
As of June 30, 2019, gross unrealized appreciation and gross unrealized depreciation of investments and other financial instruments based on cost for federal income tax purposes were as follows:
| Tax Cost | Gross Unrealized Appreciation | Gross Unrealized Depreciation | Net Unrealized Appreciation (Depreciation) | |||||||||||||||
| $ | 1,881,675,169 | $ | 138,005,079 | $ | 44,457,226 | $ | 93,547,853 | |||||||||||
| 9. | Line of Credit |
The Fund and other affiliated funds (each, a “Participant” and collectively, the “Participants”) participate in a $500 million revolving credit facility provided by a syndication of banks under which the Participants may borrow to fund shareholder redemptions. This agreement expires in October 2019 unless otherwise extended or renewed.
The Participants are charged an annual commitment fee which is calculated based on the unused portion of the shared credit line. Commitment fees are allocated among each of the Participants based on relative net assets. Commitment fees are ordinary fund operating expenses. A Participant incurs and pays the interest expense related to its borrowing. Interest is calculated at a rate per annum equal to the sum of 1% plus the greater of the New York Fed Bank Rate and1-month LIBOR rate.
The Fund had no outstanding loans as of June 30, 2019.
| 10. | Risks |
Concentration Risk As a result of the Fund’s ability to invest a large percentage of its assets in obligations of issuers within the same country, state, region, currency or economic sector, an adverse economic, business or political development may affect the value of the Fund’s investments more than if the Fund was more broadly diversified.
Interest Rate Risk Is the risk that fixed income securities will decline in value because of changes in interest rates. Bond prices generally rise when interest rates decline and generally decline when interest rates rise. Changes in governmental policy, including changes in central bank monetary policy, could cause interest rates to rise rapidly, or cause investors to expect a rapid rise in interest rates. This could lead to heightened levels of interest rate, volatility and liquidity risks for the fixed income markets generally and could have a substantial and immediate effect on the values of the Fund’s investments.
Foreign and Emerging Markets Risk Investing in foreign markets involves risks and considerations not typically associated with investing in the U.S. Foreign securities may be subject to risk of loss because of government regulation, economic, political and social instability in the countries in which the Fund invests. Foreign markets may be less liquid than investments in the U.S. and may be subject to the risks of currency fluctuations. To the extent that the Fund invests in securities of issuers located in emerging markets, these risks may be even more pronounced.
Market and Credit Risk In the normal course of business, the Fund trades financial instruments and enters into financial transactions where risk of potential loss exists due to changes in the general economic conditions and fluctuations of the market (market risk). Additionally, the Fund may also be exposed to credit risk in the event that an issuer or guarantor fails to perform or that an institution or entity with which the Fund has unsettled or open transactions defaults.
| 11. | Change in Accounting Principle |
In March 2017, the Financial Accounting Standards Board issued Accounting Standards Update2017-08, Receivables – Nonrefundable Fees and Other Costs (Subtopic310-20) – Premium Amortization on Purchased Callable Debt Securities (“ASU2017-08”). For callable debt securities held at a premium that have explicit,non-contingent call features and that are callable at fixed prices on preset dates, ASU2017-08 requires the premium to be amortized to the earliest call date. The adoption
| 24 | Notes to Financial Statements |
Table of Contents
State Street Total Return V.I.S. Fund
Notes to Financial Statements, continued — June 30, 2019 (Unaudited)
resulted in a change in accounting principle, since the Fund had historically amortized such premiums to maturity for U.S. GAAP. Accordingly, the Fund has adopted ASU2017-08 to amend the premium amortization period for certain purchased callable debt securities withnon-contingent call features to the earliest call date. In accordance with the transition provisions of the standard, the Fund applied the amendments on a modified retrospective basis by recognizing a cumulative effect adjustment that decreased the beginning of period cost of investments and increased the unrealized appreciation on investments by $9,979.
This change in accounting policy has been made to comply with the newly issued accounting standard and had no impact on total accumulated earnings (loss) or the net asset value of the Fund. With respect to the Fund’s results of operations, amortization of premium to first call date accelerates amortization with the intent of more closely aligning the recognition of income on such bonds with the economics of the instrument.
| 12. | Subsequent Events |
Management has evaluated the impact of all subsequent events on the Fund through the date on which the financial statements were available to be issued and has determined that there were no subsequent events requiring adjustment or disclosure in the financial statements.
| Notes to Financial Statements | 25 |
Table of Contents
State Street Total Return V.I.S. Fund
Other Information — June 30, 2019 (Unaudited)
Proxy Voting Policies and Procedures and Record
The Fund has adopted the proxy voting policies of SSGA FM. A description of the policies and procedures that the Fund has adopted to determine how to vote proxies relating to portfolio securities is available (i) without charge, upon request, by calling1-800-242-0134, (ii) on the Fund’s website at http://www.ssga.com/geam, or (iii) on the SEC’s website at www.sec.gov. Information regarding how the Fund voted proxies, if any, during the most recent12-month period ended June 30 is available by August 31 of each year without charge (1) by calling1-800-242-0134 (toll free), and (2) on the website of the SEC at www.sec.gov.
Quarterly Portfolio Schedule
Following the Fund’s first and third fiscal quarter-ends, a complete schedule of investments is filed with the SEC as an exhibit to its reports on Form N-PORT, which can be found on the SEC’s website at www.sec.gov. The Fund’s schedules of investments are available upon request, without charge, by calling 1-800-242-0134 and on the Fund’s website at http://www.ssga.com/geam.
| 26 | Other Information |
Table of Contents
State Street Total Return V.I.S. Fund
Other Information — June 30, 2019 (Unaudited), continued
Director Considerations in Approving Continuation of Investment Advisory Agreement1
Overview of the Contract Review Process
Under the Investment Company Act of 1940, as amended (the “1940 Act”), an investment advisory agreement between a mutual fund and its investment adviser may continue in effect from year to year only if its continuance is approved at least annually by the fund’s board of directors or its shareholders, and by a vote of a majority of those directors who are not “interested persons” of the fund (commonly referred to as, the “Independent Directors”) cast in person at a meeting called for the purpose of considering such approval.
Consistent with these requirements, the Board of Directors (the “Board”) of the State Street Variable Insurance Series Funds, Inc. (the “Company”) met in person on April 10, 2019 and May 15, 2019, including in executive sessions attended by the Independent Directors, to consider a proposal to approve, with respect to State Street Total Return V.I.S. Fund (the “Fund”), the continuation of the investment advisory agreement (the “Advisory Agreement”) with SSGA Funds Management, Inc. (“SSGA FM” or the “Adviser”). Prior to voting on the proposal, the Independent Directors, as well as the Directors who are “interested persons” of the Adviser, reviewed information furnished by the Adviser and others reasonably necessary to permit the Board to evaluate the proposal fully. The Independent Directors were separately represented by counsel who are independent of the Adviser in connection with their consideration of approval of the Agreement. Following the April 10, 2019 meeting, the Independent Directors submitted questions and requests for additional information to management, and considered management’s responses thereto prior to and at the May 15, 2019 meeting. The Independent Directors considered, among other things, the following:
Information about Performance, Expenses and Fees
| • | A report prepared by an independent third-party provider of investment company data, which includes for the Fund: |
| ¡ | Comparisons of the Fund’s performance over the pastone-, three-, five- andten-year periods ended December 31, 2018, to the performance of an appropriate benchmark constructed by Broadridge Financial Solutions, Inc. (“Broadridge”) for the Fund (the “Lipper Index”) and a universe of other mutual funds with similar investment objectives and policies (the “Performance Group” and/or the “Performance Universe”); |
| ¡ | Comparisons of the Fund’s expense ratio (with detail of component expenses) to the expense ratios of a group of comparable mutual funds selected by the independent third-party data provider (the “Expense Group” and/or “Expense Universe”); |
| ¡ | A chart showing the Fund’s historical average net assets relative to its total expenses, management fees, andnon-management expenses over the past five calendar years; and |
| ¡ | Comparisons of the Fund’s contractual management fee to the contractual management fees of comparable mutual funds at different asset levels. |
| • | Comparative information concerning fees charged by the Adviser for managing institutional accounts using investment strategies and techniques similar to those used in managing the Fund; and |
| 1 | The Independent Directors have identified numerous relevant issues, factors and concerns (“issues, factors and concerns”) that they consider each year in connection with the proposed continuation of the advisory agreement, the administration agreement, the distribution plans, the distribution agreement and various related-party service agreements (the “annual review process”). The statement of issues, factors and concerns and the related conclusions of the Independent Directors may not change substantially from year to year. However, the information requested by, and provided to, the Independent Directors with respect to the issues, factors and concerns and on which their conclusions are based is updated annually and, in some cases, may differ substantially from the previous year. The Independent Directors schedule annually a separatein-person meeting that is dedicated to the annual review process (the “special meeting”). At the special meeting and throughout the annual review process, the Independent Directors take a fresh look at each of the issues, factors and concerns in light of the latest available information and each year present one or more sets of comments and questions to management with respect to specific issues, factors and concerns. Management responds to such comments and questions to the satisfaction of the Independent Directors before the annual review process is completed and prior to the Independent Directors voting on proposals to approve continuation of the agreements and plans. |
| Other Information | 27 |
Table of Contents
State Street Total Return V.I.S. Fund
Other Information — June 30, 2019 (Unaudited), continued
| • | Profitability analyses for (a) the Adviser with respect to the Fund and (b) affiliates of SSGA FM that provide services to the Fund (“Affiliated Service Providers”). |
Information about Portfolio Management
| • | Descriptions of the investment management services provided by the Adviser, including its investment strategies and processes; |
| • | Information concerning the allocation of brokerage; and |
| • | Information regarding the procedures and processes used to value the assets of the Fund. |
Information about the Adviser
| • | Reports detailing the financial results and condition of SSGA FM and its affiliates; |
| • | Descriptions of the qualifications, education and experience of the individual investment and other professionals responsible for managing the portfolio of the Fund and for Fund operations; |
| • | Information relating to compliance with and the administration of the Code of Ethics adopted by the Adviser; |
| • | Information about the Adviser’s proxy voting policies and procedures and information regarding the Adviser’s practices for overseeing proxy vendors; |
| • | Information concerning the resources devoted by the Adviser to overseeing compliance by the Fund and its service providers, including information concerning compliance with investment policies and restrictions and other operating policies of the Fund; |
| • | A description of the adequacy and sophistication of the Adviser’s technology and systems with respect to investment and administrative matters and a description of any material improvements or changes in technology or systems in the past year; |
| • | A description of the business continuity and disaster recovery plans of the Adviser; and |
| • | Information regarding the Adviser’s risk management processes. |
Other Relevant Information
| • | Information concerning the nature, extent, quality and cost of services provided to the Fund by SSGA FM in its capacity as the Fund’s administrator (the “Administrator”); |
| • | Information concerning the nature, extent, quality and cost of variousnon-investment management services provided to the Fund by affiliates of the Adviser, including the custodian,sub-administrator and fund accountant of the Fund, and the role of the Adviser in managing the Fund’s relationship with these service providers; |
| • | Copies of the Advisory Agreement and agreements with other service providers of the Fund; |
| • | Draft responses to a letter from independent legal counsel to the Independent Directors (“Independent Counsel”), reviewed prior to such date by Independent Counsel, requesting specific information from each of: |
| ¡ | SSGA FM, in its capacity as the Fund’s Adviser and Administrator, with respect to its operations relating to the Fund and its approximate profit margins from such operations for the calendar year ended December 31, 2018; and the relevant operations of other affiliated service providers to the Fund, together with their approximate profit margins from such relevant operations for the calendar year ended December 31, 2018; |
| ¡ | State Street Bank and Trust Company (“State Street”), thesub-administrator, custodian, and fund accountant for the Fund, with respect to its operations relating to the Fund; and |
| ¡ | State Street Global Advisors Funds Distributors, LLC, the principal underwriter and distributor of the shares of the Fund (the “Distributor”), with respect to its operations relating to the Fund, together with the Fund’s related distribution plans and arrangements under Rule12b-1 of the 1940 Act; |
| • | Information from SSGA FM, State Street and the Distributor with respect to the Fund providing any material changes to the previous information supplied in response to the letter from Independent Counsel prior to the executive session of the Board on May 15, 2019; |
| 28 | Other Information |
Table of Contents
State Street Total Return V.I.S. Fund
Other Information — June 30, 2019 (Unaudited), continued
| • | Materials provided by Broadridge, circulated to the Independent Directors and to Independent Counsel; and |
| • | A summary of the foregoing materials prepared by Independent Counsel. |
In addition to the information identified above, the Board considered information provided from time to time by the Adviser, and other service providers of the Fund throughout the year at meetings of the Board and its committees. At such meetings, the Directors received, among other things, presentations by the portfolio managers and other investment professionals of the Adviser relating to the performance of the Fund and the investment strategies used in pursuing the Fund’s investment objective.
The Independent Directors were assisted throughout the contract review process by their Independent Counsel. The Independent Directors relied upon the advice of such counsel and their own business judgment in determining the material factors to be considered in evaluating the Agreement, and the weight to be given to each such factor. The conclusions reached with respect to the Agreement were based on a comprehensive evaluation of all the information provided and not any single factor. Moreover, each Director may have placed varying emphasis on particular factors in reaching conclusions with respect to the Fund.
Results of the Process
Based on a consideration of the foregoing and such other information as deemed relevant, including the factors and conclusions described below, on May 15, 2019 the Board, including a majority of the Independent Directors, voted to approve the continuation of the Agreement effective June 1, 2019, for an additional year with respect to the Fund.
Nature, Extent and Quality of Services
In considering whether to approve the Agreement, the Board evaluated the nature, extent and quality of services provided to the Fund by the Adviser.
The Board considered the Adviser’s management capabilities and investment process with respect to the types of investments held by the Fund, including the education, experience and number of investment professionals and other personnel who provide portfolio management, investment research, and similar services to the Fund. The Board evaluated the abilities and experience of such investment personnel in analyzing particular markets, industries and specific issuers of securities in these markets and industries. The Board also considered the substantial expertise of the Adviser in developing and applying proprietary quantitative models for managing the Fund. The Board considered the extensive experience and resources committed by the Adviser to the evaluation of a portfolio’s quality distribution and sector and interest rate exposure. The Board considered the extensive experience and resources committed by the Adviser to risk management, including with respect to investment risk, liquidity risk, operational risk, counterparty risk and model risk. The Directors also considered the significant risks assumed by the Adviser in connection with the services provided to the Fund, including reputational and entrepreneurial risks. The Board also took into account the compensation paid to recruit and retain investment personnel, and the time and attention devoted to the Fund by senior management.
The Board had previously reviewed the compliance programs of SSGA FM and various affiliated service providers. Among other things, the Board considered compliance and reporting matters relating to personal trading by investment personnel, selective disclosure of portfolio holdings, late trading, frequent trading, portfolio valuation, business continuity, the allocation of investment opportunities and the voting of proxies.
On the basis of the foregoing and other relevant information, the Board concluded that the Adviser can be expected to continue to provide high quality investment management and related services for the Fund.
Fund Performance
The Board compared the Fund’s investment performance to the performance of an appropriate benchmark and universe of comparable mutual funds for various time periods ended December 31, 2018. For purposes of these comparisons the Independent Directors relied extensively on the Performance Group, Performance Universe and Lipper Index and the analyses of the related data provided by Broadridge. Among other information, the Board considered the following performance information in its evaluation of the Fund:
State Street Total Return V.I.S. Fund.The Board considered that the Fund’s performance was below the median of its Performance Group for the10-year period and the median of its Performance Universe for the1-year period and below its Lipper Index for the1- and10-year periods. The Board also considered that the Fund’s performance was above the median of the Performance Group for
| Other Information | 29 |
Table of Contents
State Street Total Return V.I.S. Fund
Other Information — June 30, 2019 (Unaudited), continued
the1-,3- and5-year periods and the Performance Universe for the3-,5- and10-year periods and above the Lipper Index for the3- and5-year periods. The Board took into account management’s discussion of the Fund’s performance.
On the basis of the foregoing and other relevant information, the Board concluded that the performance of the Fund is satisfactory.
Management Fees and Expenses
The Board reviewed the contractual investment advisory fee rates payable by the Fund and actual fees paid by the Fund. As part of its review, the Board considered the Fund’s management fee and total expense ratio, including the portion attributable to administrative services provided by SSGA FM (both before and after giving effect to any expense caps), as compared to its Expense Group and Expense Universe, as constructed by Broadridge, and the related Broadridge analysis for the Fund. The Board also considered the comparability of the fees charged and the services provided to the Fund by the Adviser to the fees charged and services provided to other clients of the Adviser, including institutional accounts, as applicable. Among other information, the Board considered the following expense information in its evaluation of the Fund:
State Street Total Return V.I.S. Fund.The Board considered that the Fund’s actual management fee was below the medians of its Expense Group and Expense Universe. The Board also considered that the Fund’s total expenses were below the medians of its Expense Group and Expense Universe.
On the basis of the foregoing and other relevant information, and in light of the nature, extent and quality of the services provided by the Adviser, the Board concluded that the fees and the expense ratio of the Fund compare favorably to the fees and expenses of the Expense Group and Expense Universe and are reasonable in relation to the services provided.
Profitability
The Board reviewed the level of profits realized by the Adviser and its affiliates in providing investment advisory and other services to the Fund and to all funds within the fund complex. The Board considered other direct and indirect benefits received by SSGA FM and Affiliated Service Providers in connection with their relationships with the Fund, including soft dollar commission benefits generated through Fund portfolio transactions. The Board further considered the profitability of each of the Affiliated Service Providers with respect to their services to the Fund and/or fund complex. The Board also considered the various risks borne by SSGA FM and State Street in connection with their various roles in servicing the Fund, including reputational and entrepreneurial risks.
The Board concluded that the profitability of the Adviser with respect to the Fund, and the profitability range of each of the Affiliated Service Providers with respect to its services to the Fund, were reasonable in relation to the services provided.
Economies of Scale
In reviewing management fees and profitability, the Board also considered the extent to which the Adviser and its affiliates, on the one hand, and the Fund and the fund complex, on the other hand, can expect to realize benefits from economies of scale as the assets of the Fund and fund complex increase. The Board acknowledged the difficulty in accurately measuring the benefits resulting from the economies of scale with respect to the management of the Fund or the fund complex taken as a whole. The Board concluded that, in light of the current size of the Fund and the fund complex, the level of profitability of the Adviser and its affiliates with respect to the Fund and the fund complex over various time periods, and the comparative management fee and expense ratio of the Fund during these periods, it does not appear that the Adviser or its affiliates has realized benefits from economies of scale in managing the assets of the Fund to such an extent that previously agreed advisory fees should be reduced or that breakpoints in such fees should be implemented for the Fund at this time.
Conclusions
In reaching its decision to approve the Agreement, the Board did not identify any single factor as being controlling, but based its recommendation on each of the factors it considered. Each Director may have contributed different weight to the various factors. Based upon the materials reviewed, the representations made and the considerations described above, and as part of its deliberations, the Board, including the Independent Directors, concluded that the Adviser possesses the capability and resources to perform the duties required of it under the Agreement.
Further, based upon its review of the Agreement, the materials provided, and the considerations described above, the Board, including the Independent Directors, concluded that (1) the terms of the Advisory Agreement are reasonable, fair, and in the best interests of the Fund and its shareholders, and (2) the rates payable under the Advisory Agreement are fair and reasonable in light of the usual and customary charges made for services of the same nature and quality.
| 30 | Other Information |
Table of Contents
Directors
Michael F. Holland, Co-Chairperson
Patrick J. Riley, Co-Chairperson
John R. Costantino
Donna M. Rapaccioli
Michael A. Jessee
Richard D. Shirk
Rina K. Spence
Jeanne M. La Porta
Ellen M. Needham
Officers
Jeanne M. La Porta, President
Brian Harris, Chief Compliance Officer, Anti-Money Laundering Officer and Code of Ethics Compliance Officer
Sean O’Malley, Chief Legal Officer
Bruce S. Rosenberg, Treasurer
Ann M. Carpenter, Vice President and Deputy Treasurer
Chad C. Hallett, Deputy Treasurer
Arthur A. Jensen, Deputy Treasurer
Darlene Anderson-Vasquez, Deputy Treasurer
Sujata Upreti, Assistant Treasurer
Daniel Foley, Assistant Treasurer
Andrew DeLorme, Secretary
James Goundrey, Assistant Secretary
Kevin Morris, Assistant Secretary
David Urman, Assistant Secretary
Investment Adviser and Administrator
SSGA Funds Management, Inc.
One Iron Street
Boston, MA 02210
Custodian andSub-Administrator
State Street Bank and Trust Company
One Lincoln Street
Boston, Massachusetts 02111
Distributor
State Street Global Advisors Funds Distributors, LLC
One Iron Street
Boston, MA 02210
Independent Registered Public Accounting Firm
Ernst & Young LLP
200 Clarendon Street
Boston, Massachusetts 02116
Table of Contents
| Item 2. | Code of Ethics. |
Not applicable to this filing.
| Item 3. | Audit Committee Financial Expert. |
Not applicable to this filing.
| Item 4. | Principal Accountant Fees and Services. |
Not applicable to this filing.
| Item 5. | Audit Committee of Listed Registrants. |
Not applicable to the Registrant.
| Item 6. | Investments. |
| (a) | The Schedule of Investments for the State Street Total Return V.I.S. Fund is listed below. The Schedules of Investments for the State Street U.S. Equity V.I.S. Fund, State Street S&P 500 Index V.I.S. Fund, State Street Premier Growth V.I.S. Fund, State StreetSmall-Cap Equity V.I.S. Fund, State Street Income V.I.S. Fund and State Street Real Estate Securities V.I.S. Fund and a Summary Schedule of Investments for the State Street Total Return V.I.S. Fund are included as part of the report to shareholders filed under Item 1 of this FormN-CSR. |
Table of Contents
| State Street Total Return V.I.S. Fund | ||
| Schedule of Investments | June 30, 2019 (Unaudited) |
| State Street Total Return V.I.S. Fund | ||||||||||||
Number of Shares | Fair Value | |||||||||||
Domestic Equity – 31.2% † |
| |||||||||||
Common Stock – 31.2% |
| |||||||||||
Advertising – 0.3% |
| |||||||||||
Boston Omaha Corp., Class A | 2,289 | $ | 52,990 | (a | ) | |||||||
National CineMedia Inc. | 37,600 | 246,656 | ||||||||||
Omnicom Group Inc. | 44,586 | 3,653,823 | ||||||||||
TechTarget Inc. | 1,723 | 36,614 | (a | ) | ||||||||
The Interpublic Group of Companies Inc. | 76,865 | 1,736,380 | ||||||||||
| 5,726,463 | ||||||||||||
Aerospace & Defense – 0.3% |
| |||||||||||
Aerovironment Inc. | 6,400 | 363,328 | (a | ) | ||||||||
HEICO Corp. | 7,758 | 1,038,098 | ||||||||||
HEICO Corp., Class A | 15,146 | 1,565,642 | ||||||||||
Hexcel Corp. | 7,857 | 635,474 | ||||||||||
Maxar Technologies Inc. | 25,700 | 200,974 | (a | ) | ||||||||
National Presto Industries Inc. | 2,396 | 223,523 | ||||||||||
Teledyne Technologies Inc. | 7,021 | 1,922,841 | (a | ) | ||||||||
TransDigm Group Inc. | 947 | 458,159 | (a | ) | ||||||||
| 6,408,039 | ||||||||||||
Agricultural & Farm Machinery – 0.1% |
| |||||||||||
AGCO Corp. | 12,964 | 1,005,617 | ||||||||||
Air Freight & Logistics – 0.3% |
| |||||||||||
Atlas Air Worldwide Holdings Inc. | 2,200 | 98,208 | (a | ) | ||||||||
CH Robinson Worldwide Inc. | 27,357 | 2,307,563 | ||||||||||
Expeditors International of Washington Inc. | 34,467 | 2,614,667 | ||||||||||
Hub Group Inc., Class A | 8,672 | 364,050 | (a | ) | ||||||||
Radiant Logistics Inc. | 18,200 | 111,748 | (a | ) | ||||||||
| 5,496,236 | ||||||||||||
Airlines – 0.2% |
| |||||||||||
Alaska Air Group Inc. | 8,804 | 562,663 | ||||||||||
Mesa Air Group Inc. | 5,400 | 49,356 | (a | ) | ||||||||
United Continental Holdings Inc. | 37,865 | 3,315,081 | (a | ) | ||||||||
| 3,927,100 | ||||||||||||
Airport Services – 0.0%* |
| |||||||||||
Macquarie Infrastructure Corp. | 15,903 | 644,708 | ||||||||||
Alternative Carriers – 0.1% |
| |||||||||||
CenturyLink Inc. | 191,552 | 2,252,651 | ||||||||||
Apparel Retail – 0.8% |
| |||||||||||
Abercrombie & Fitch Co., Class A | 5,647 | 90,578 | ||||||||||
Ascena Retail Group Inc. | 81,970 | 50,001 | (a | ) | ||||||||
Designer Brands Inc., Class A | 33,111 | 634,738 | ||||||||||
Foot Locker Inc. | 22,435 | 940,475 | ||||||||||
Guess? Inc. | 12,159 | 196,368 | ||||||||||
Shoe Carnival Inc. | 4,713 | 130,079 | ||||||||||
The Buckle Inc. | 14,109 | 244,227 | ||||||||||
The Cato Corp., Class A | 10,437 | 128,584 | ||||||||||
The TJX Companies Inc. | 243,327 | 12,867,132 | ||||||||||
Tilly’s Inc., Class A | 9,606 | 73,294 | ||||||||||
Urban Outfitters Inc. | 14,180 | 322,595 | (a | ) | ||||||||
Zumiez Inc. | 9,172 | 239,389 | (a | ) | ||||||||
| 15,917,460 | ||||||||||||
Apparel, Accessories & Luxury Goods – 0.4% |
| |||||||||||
Columbia Sportswear Co. | 6,058 | 606,769 | ||||||||||
Fossil Group Inc. | 22,280 | 256,220 | (a | ) | ||||||||
Kontoor Brands Inc. | 9,396 | 263,276 | (a | ) | ||||||||
Movado Group Inc. | 5,426 | 146,502 | ||||||||||
VF Corp. | 64,784 | 5,658,883 | ||||||||||
| 6,931,650 | ||||||||||||
Application Software – 1.3% |
| |||||||||||
Alteryx Inc., Class A | 2,100 | 229,152 | (a | ) | ||||||||
American Software Inc., Class A | 14,028 | 184,468 | ||||||||||
ANSYS Inc. | 16,722 | 3,425,000 | (a | ) | ||||||||
Aspen Technology Inc. | 13,915 | 1,729,356 | (a | ) | ||||||||
Number of Shares | Fair Value | |||||||||||
Cadence Design Systems Inc. | 39,474 | $ | 2,795,154 | (a | ) | |||||||
Cision Ltd. | 32,579 | 382,152 | (a | ) | ||||||||
Fair Isaac Corp. | 5,774 | 1,813,152 | (a | ) | ||||||||
Intuit Inc. | 45,796 | 11,967,869 | ||||||||||
Manhattan Associates Inc. | 12,880 | 892,970 | (a | ) | ||||||||
ShotSpotter Inc. | 3,725 | 164,645 | (a | ) | ||||||||
SPS Commerce Inc. | 3,300 | 337,293 | (a | ) | ||||||||
The Trade Desk Inc., Class A | 2,700 | 615,006 | (a | ) | ||||||||
Zix Corp. | 25,500 | 231,795 | (a | ) | ||||||||
| 24,768,012 | ||||||||||||
Asset Management & Custody Banks – 0.5% |
| |||||||||||
Cohen & Steers Inc. | 10,805 | 555,809 | ||||||||||
Diamond Hill Investment Group Inc. | 1,681 | 238,231 | ||||||||||
Franklin Resources Inc. | 60,205 | 2,095,134 | ||||||||||
Legg Mason Inc. | 16,944 | 648,616 | ||||||||||
Silvercrest Asset Management Group Inc., Class A | 3,814 | 53,511 | ||||||||||
T Rowe Price Group Inc. | 46,462 | 5,097,346 | ||||||||||
Waddell & Reed Financial Inc., Class A | 15,394 | 256,618 | ||||||||||
Westwood Holdings Group Inc. | 3,800 | 133,760 | ||||||||||
| 9,079,025 | ||||||||||||
Auto Parts & Equipment – 0.2% |
| |||||||||||
American Axle & Manufacturing Holdings Inc. | 30,000 | 382,800 | (a | ) | ||||||||
Dorman Products Inc. | 8,700 | 758,118 | (a | ) | ||||||||
Fox Factory Holding Corp. | 700 | 57,757 | (a | ) | ||||||||
Gentex Corp. | 52,593 | 1,294,314 | ||||||||||
Lear Corp. | 12,495 | 1,740,178 | ||||||||||
Superior Industries International Inc. | 9,500 | 32,870 | ||||||||||
| 4,266,037 | ||||||||||||
Automobile Manufacturers – 0.4% |
| |||||||||||
Ford Motor Co. | 415,086 | 4,246,330 | ||||||||||
General Motors Co. | 86,332 | 3,326,372 | ||||||||||
| 7,572,702 | ||||||||||||
Automotive Retail – 0.2% |
| |||||||||||
Advance Auto Parts Inc. | 10,318 | 1,590,416 | ||||||||||
America’sCar-Mart Inc. | 1,000 | 86,080 | (a | ) | ||||||||
AutoNation Inc. | 10,981 | 460,543 | (a | ) | ||||||||
AutoZone Inc. | 291 | 319,946 | (a | ) | ||||||||
Penske Automotive Group Inc. | 6,797 | 321,498 | ||||||||||
Sonic Automotive Inc., Class A | 11,822 | 276,044 | ||||||||||
| 3,054,527 | ||||||||||||
Biotechnology – 0.3% |
| |||||||||||
Adverum Biotechnologies Inc. | 16,840 | 200,228 | (a | ) | ||||||||
Aeglea BioTherapeutics Inc. | 6,225 | 42,641 | (a | ) | ||||||||
Anika Therapeutics Inc. | 4,736 | 192,376 | (a | ) | ||||||||
Arcus Biosciences Inc. | 14,640 | 116,388 | (a | ) | ||||||||
ArQule Inc. | 25,800 | 284,058 | (a | ) | ||||||||
Arrowhead Pharmaceuticals Inc. | 36,860 | 976,790 | (a | ) | ||||||||
Avid Bioservices Inc. | 23,700 | 132,720 | (a | ) | ||||||||
BioSpecifics Technologies Corp. | 2,800 | 167,188 | (a | ) | ||||||||
BioTime Inc. | 36,700 | 40,370 | (a | ) | ||||||||
CareDx Inc. | 6,200 | 223,138 | (a | ) | ||||||||
Celcuity Inc. | 2,589 | 64,725 | (a | ) | ||||||||
Cue Biopharma Inc. | 8,523 | 76,622 | (a | ) | ||||||||
Denali Therapeutics Inc. | 18,373 | 381,423 | (a | ) | ||||||||
Emergent BioSolutions Inc. | 3,173 | 153,288 | (a | ) | ||||||||
Enanta Pharmaceuticals Inc. | 2,700 | 227,826 | (a | ) | ||||||||
Evelo Biosciences Inc. | 6,411 | 57,571 | (a | ) | ||||||||
Fate Therapeutics Inc. | 21,310 | 432,593 | (a | ) | ||||||||
G1 Therapeutics Inc. | 5,367 | 164,552 | (a | ) | ||||||||
Genomic Health Inc. | 10,280 | 597,988 | (a | ) | ||||||||
Homology Medicines Inc. | 2,814 | 55,070 | (a | ) | ||||||||
PDL BioPharma Inc. | 69,967 | 219,696 | (a | ) | ||||||||
Ra Pharmaceuticals Inc. | 1,900 | 57,133 | (a | ) | ||||||||
Repligen Corp. | 6,500 | 558,675 | (a | ) | ||||||||
Synlogic Inc. | 6,100 | 55,510 | (a | ) | ||||||||
United Therapeutics Corp. | 8,610 | 672,097 | (a | ) | ||||||||
UNITY Biotechnology Inc. | 11,602 | 110,219 | (a | ) | ||||||||
Veracyte Inc. | 4,800 | 136,848 | (a | ) | ||||||||
See Notes to Schedule of Investments and Notes to Financial Statements.
Table of Contents
| State Street Total Return V.I.S. Fund | ||
| Schedule of Investments | June 30, 2019 (Unaudited) |
Number of Shares | Fair Value | |||||||||||
Verastem Inc. | 15,500 | $ | 23,405 | (a | ) | |||||||
Viking Therapeutics Inc. | 13,200 | 109,560 | (a | ) | ||||||||
| 6,530,698 | ||||||||||||
Brewers – 0.0%* | ||||||||||||
The Boston Beer Company Inc., Class A | 2,430 | 917,957 | (a | ) | ||||||||
Broadcasting – 0.1% | ||||||||||||
AMC Networks Inc., Class A | 8,804 | 479,730 | (a | ) | ||||||||
Discovery Inc., Class A | 30,770 | 944,639 | (a | ) | ||||||||
Media General Inc. | 2,076 | 208 | (b,c | ) | ||||||||
| 1,424,577 | ||||||||||||
Building Products – 0.0%* |
| |||||||||||
AAON Inc. | 1,600 | 80,288 | ||||||||||
Resideo Technologies Inc. | 24,636 | 540,021 | (a | ) | ||||||||
| 620,309 | ||||||||||||
Cable & Satellite – 0.1% | ||||||||||||
Cable One Inc. | 854 | 1,000,025 | ||||||||||
Casinos & Gaming – 0.0%* |
| |||||||||||
Century Casinos Inc. | 8,000 | 77,600 | (a | ) | ||||||||
Coal & Consumable Fuels – 0.0%* |
| |||||||||||
Energy Fuels Inc. | 39,800 | 124,574 | (a | ) | ||||||||
NACCO Industries Inc., Class A | 1,500 | 77,910 | ||||||||||
| 202,484 | ||||||||||||
Commercial Printing – 0.0%* |
| |||||||||||
Ennis Inc. | 12,500 | 256,500 | ||||||||||
RR Donnelley & Sons Co. | 17,700 | 34,869 | ||||||||||
| 291,369 | ||||||||||||
Commodity Chemicals – 0.0%* |
| |||||||||||
Hawkins Inc. | 3,500 | 151,935 | ||||||||||
Communications Equipment – 0.9% |
| |||||||||||
Cisco Systems Inc. | 289,039 | 15,819,104 | ||||||||||
Digi International Inc. | 13,500 | 171,180 | (a | ) | ||||||||
F5 Networks Inc. | 11,927 | 1,736,929 | (a | ) | ||||||||
NETGEAR Inc. | 9,399 | 237,701 | (a | ) | ||||||||
Ubiquiti Networks Inc. | 3,029 | 398,314 | ||||||||||
| 18,363,228 | ||||||||||||
Computer & Electronics Retail – 0.0%* |
| |||||||||||
GameStop Corp., Class A | 12,200 | 66,734 | ||||||||||
Construction & Engineering – 0.2% |
| |||||||||||
Arcosa Inc. | 9,399 | 353,684 | ||||||||||
Argan Inc. | 7,100 | 287,976 | ||||||||||
IES Holdings Inc. | 2,800 | 52,780 | (a | ) | ||||||||
Jacobs Engineering Group Inc. | 25,085 | 2,116,923 | ||||||||||
MYR Group Inc. | 5,405 | 201,877 | (a | ) | ||||||||
NV5 Global Inc. | 4,700 | 382,580 | (a | ) | ||||||||
Quanta Services Inc. | 29,156 | 1,113,468 | ||||||||||
Tutor Perini Corp. | 2,600 | 36,062 | (a | ) | ||||||||
WillScot Corp. | 4,033 | 60,656 | (a | ) | ||||||||
| 4,606,006 | ||||||||||||
Construction Machinery & Heavy Trucks – 0.2% |
| |||||||||||
Allison Transmission Holdings Inc. | 22,908 | 1,061,786 | ||||||||||
Cummins Inc. | 12,022 | 2,059,849 | ||||||||||
Miller Industries Inc. | 5,386 | 165,619 | ||||||||||
The Greenbrier Companies Inc. | 3,500 | 106,400 | ||||||||||
Trinity Industries Inc. | 14,769 | 306,457 | ||||||||||
| 3,700,111 | ||||||||||||
Construction Materials – 0.0%* |
| |||||||||||
United States Lime & Minerals Inc. | 957 | 76,560 | ||||||||||
Consumer Electronics – 0.1% |
| |||||||||||
Garmin Ltd. | 22,814 | 1,820,557 | ||||||||||
Roku Inc. | 1,181 | 106,975 | (a | ) | ||||||||
| 1,927,532 | ||||||||||||
Consumer Finance – 0.1% |
| |||||||||||
Credit Acceptance Corp. | 1,136 | 549,631 | (a | ) | ||||||||
Curo Group Holdings Corp. | 5,405 | 59,725 | (a | ) | ||||||||
Number of Shares | Fair Value | |||||||||||
Santander Consumer USA Holdings Inc. | 23,098 | $ | 553,428 | |||||||||
World Acceptance Corp. | 1,700 | 278,987 | (a | ) | ||||||||
| 1,441,771 | ||||||||||||
Data Processing & Outsourced Services – 0.7% |
| |||||||||||
Broadridge Financial Solutions Inc. | 23,187 | 2,960,516 | ||||||||||
Euronet Worldwide Inc. | 9,845 | 1,656,323 | (a | ) | ||||||||
Genpact Ltd. | 7,960 | 303,196 | ||||||||||
Jack Henry & Associates Inc. | 15,450 | 2,069,064 | ||||||||||
NIC Inc. | 31,119 | 499,149 | ||||||||||
Paychex Inc. | 64,247 | 5,286,886 | ||||||||||
Sykes Enterprises Inc. | 19,200 | 527,232 | (a | ) | ||||||||
| 13,302,366 | ||||||||||||
Department Stores – 0.2% | ||||||||||||
Dillard’s Inc., Class A | 5,270 | 328,216 | ||||||||||
Kohl’s Corp. | 32,880 | 1,563,444 | ||||||||||
Macy’s Inc. | 61,259 | 1,314,618 | ||||||||||
| 3,206,278 | ||||||||||||
Distillers & Vintners – 0.0%* |
| |||||||||||
Brown-Forman Corp., Class A | 5,606 | 308,330 | ||||||||||
Distributors – 0.2% | ||||||||||||
Funko Inc., Class A | 5,190 | 125,702 | (a | ) | ||||||||
Genuine Parts Co. | 28,596 | 2,961,973 | ||||||||||
Weyco Group Inc. | 2,959 | 79,035 | ||||||||||
| 3,166,710 | ||||||||||||
Diversified Metals & Mining – 0.0%* |
| |||||||||||
Materion Corp. | 1,058 | 71,743 | ||||||||||
Diversified REITs – 0.2% | ||||||||||||
Armada Hoffler Properties Inc. | 23,980 | 396,869 | ||||||||||
One Liberty Properties Inc. | 7,298 | 211,350 | ||||||||||
PS Business Parks Inc. | 6,300 | 1,061,739 | ||||||||||
STORE Capital Corp. | 38,338 | 1,272,438 | ||||||||||
| 2,942,396 | ||||||||||||
Diversified Support Services – 0.1% |
| |||||||||||
McGrath RentCorp. | 11,758 | 730,760 | ||||||||||
UniFirst Corp. | 7,329 | 1,382,029 | ||||||||||
Viad Corp. | 8,269 | 547,739 | ||||||||||
| 2,660,528 | ||||||||||||
Education Services – 0.0%* | ||||||||||||
American Public Education Inc. | 7,731 | 228,683 | (a | ) | ||||||||
Graham Holdings Co., Class B | 852 | 587,905 | ||||||||||
| 816,588 | ||||||||||||
Electric Utilities – 0.3% | ||||||||||||
Avangrid Inc. | 8,141 | 411,120 | ||||||||||
Eversource Energy | 19,500 | 1,477,320 | ||||||||||
Hawaiian Electric Industries Inc. | 21,725 | 946,124 | ||||||||||
OGE Energy Corp. | 39,947 | 1,700,144 | ||||||||||
Pinnacle West Capital Corp. | 22,340 | 2,101,971 | ||||||||||
| 6,636,679 | ||||||||||||
Electrical Components & Equipment – 0.1% |
| |||||||||||
Encore Wire Corp. | 7,978 | 467,351 | ||||||||||
EnerSys | 2,400 | 164,400 | ||||||||||
Powell Industries Inc. | 4,300 | 163,400 | ||||||||||
Preformed Line Products Co. | 1,505 | 83,558 | ||||||||||
Regal Beloit Corp. | 8,614 | 703,850 | ||||||||||
Vicor Corp. | 8,500 | 263,925 | (a | ) | ||||||||
| 1,846,484 | ||||||||||||
Electronic Components – 0.1% |
| |||||||||||
AVX Corp. | 22,625 | 375,575 | ||||||||||
Dolby Laboratories Inc., Class A | 12,444 | 803,882 | ||||||||||
Vishay Intertechnology Inc. | 13,800 | 227,976 | ||||||||||
| 1,407,433 | ||||||||||||
Electronic Equipment & Instruments – 0.1% |
| |||||||||||
Arlo Technologies Inc. | 14,652 | 58,755 | (a | ) | ||||||||
Badger Meter Inc. | 13,913 | 830,467 | ||||||||||
Napco Security Technologies Inc. | 5,600 | 166,208 | (a | ) | ||||||||
nLight Inc. | 4,000 | 76,800 | (a | ) | ||||||||
See Notes to Schedule of Investments and Notes to Financial Statements.
Table of Contents
| State Street Total Return V.I.S. Fund | ||
| Schedule of Investments | June 30, 2019 (Unaudited) |
Number of Shares | Fair Value | |||||||||||
PAR Technology Corp. | 5,500 | $ | 155,100 | (a | ) | |||||||
Vishay Precision Group Inc. | 5,037 | 204,653 | (a | ) | ||||||||
| 1,491,983 | ||||||||||||
Electronic Manufacturing Services – 0.2% |
| |||||||||||
Benchmark Electronics Inc. | 21,197 | 532,469 | ||||||||||
Jabil Inc. | 30,318 | 958,049 | ||||||||||
Kimball Electronics Inc. | 12,100 | 196,504 | (a | ) | ||||||||
Park Electrochemical Corp. | 8,994 | 150,110 | ||||||||||
Plexus Corp. | 14,815 | 864,751 | (a | ) | ||||||||
Sanmina Corp. | 11,700 | 354,276 | (a | ) | ||||||||
| 3,056,159 | ||||||||||||
Environmental & Facilities Services – 0.3% |
| |||||||||||
ABM Industries Inc. | 15,600 | 624,000 | ||||||||||
PICO Holdings Inc. | 9,100 | 105,742 | (a | ) | ||||||||
Republic Services Inc. | 43,606 | 3,778,024 | ||||||||||
Rollins Inc. | 29,002 | 1,040,302 | ||||||||||
| 5,548,068 | ||||||||||||
Fertilizers & Agricultural Chemicals – 0.0%* |
| |||||||||||
The Mosaic Co. | 10,670 | 267,070 | ||||||||||
Financial Exchanges & Data – 0.2% |
| |||||||||||
CME Group Inc. | 18,736 | 3,636,845 | ||||||||||
Donnelley Financial Solutions Inc. | 16,400 | 218,776 | (a | ) | ||||||||
Morningstar Inc. | 3,645 | 527,213 | ||||||||||
| 4,382,834 | ||||||||||||
Food Distributors – 0.0%* |
| |||||||||||
SpartanNash Co. | 3,000 | 35,010 | ||||||||||
United Natural Foods Inc. | 25,000 | 224,250 | (a | ) | ||||||||
| 259,260 | ||||||||||||
Food Retail – 0.3% |
| |||||||||||
Casey’s General Stores Inc. | 7,289 | 1,137,011 | ||||||||||
Natural Grocers by Vitamin Cottage Inc. | 4,228 | 42,492 | (a | ) | ||||||||
The Kroger Co. | 158,937 | 3,450,522 | ||||||||||
Village Super Market Inc., Class A | 3,847 | 101,984 | ||||||||||
Weis Markets Inc. | 4,703 | 171,236 | ||||||||||
| 4,903,245 | ||||||||||||
Footwear – 0.1% |
| |||||||||||
Rocky Brands Inc. | 3,145 | 85,796 | ||||||||||
Steven Madden Ltd. | 42,110 | 1,429,634 | ||||||||||
| 1,515,430 | ||||||||||||
Gas Utilities – 0.2% |
| |||||||||||
Atmos Energy Corp. | 22,908 | 2,418,169 | ||||||||||
UGI Corp. | 34,552 | 1,845,422 | ||||||||||
| 4,263,591 | ||||||||||||
Health Care REITs – 0.2% |
| |||||||||||
Community Healthcare Trust Inc. | 8,627 | 339,990 | ||||||||||
LTC Properties Inc. | 14,000 | 639,240 | ||||||||||
Medical Properties Trust Inc. | 73,836 | 1,287,700 | ||||||||||
Omega Healthcare Investors Inc. | 39,663 | 1,457,615 | ||||||||||
Senior Housing Properties Trust | 45,351 | 375,053 | ||||||||||
| 4,099,598 | ||||||||||||
Healthcare Distributors – 0.1% |
| |||||||||||
Henry Schein Inc. | 30,386 | 2,123,982 | (a | ) | ||||||||
Patterson Companies Inc. | 23,500 | 538,150 | ||||||||||
PetIQ Inc. | 7,620 | 251,155 | (a | ) | ||||||||
| 2,913,287 | ||||||||||||
Healthcare Equipment – 1.0% |
| |||||||||||
ABIOMED Inc. | 1,261 | 328,478 | (a | ) | ||||||||
Danaher Corp. | 94,460 | 13,500,223 | ||||||||||
FONAR Corp. | 3,000 | 64,530 | (a | ) | ||||||||
Globus Medical Inc., Class A | 1,941 | 82,104 | (a | ) | ||||||||
IntriCon Corp. | 3,600 | 84,096 | (a | ) | ||||||||
Masimo Corp. | 9,182 | 1,366,465 | (a | ) | ||||||||
SeaSpine Holdings Corp. | 6,900 | 91,425 | (a | ) | ||||||||
Steris PLC | 16,755 | 2,494,484 | (a | ) | ||||||||
Surmodics Inc. | 1,932 | 83,405 | (a | ) | ||||||||
Tandem Diabetes Care Inc. | 17,230 | 1,111,680 | (a | ) | ||||||||
Number of Shares | Fair Value | |||||||||||
TransEnterix Inc. | 77,300 | $ | 105,128 | (a | ) | |||||||
Varian Medical Systems Inc. | 2,479 | 337,466 | (a | ) | ||||||||
| 19,649,484 | ||||||||||||
Healthcare Facilities – 0.4% |
| |||||||||||
Community Health Systems Inc. | 40,100 | 107,067 | (a | ) | ||||||||
HCA Healthcare Inc. | 49,538 | 6,696,051 | ||||||||||
National HealthCare Corp. | 5,892 | 478,136 | ||||||||||
Tenet Healthcare Corp. | 2,101 | 43,407 | (a | ) | ||||||||
US Physical Therapy Inc. | 3,700 | 453,509 | ||||||||||
| 7,778,170 | ||||||||||||
Healthcare Services – 0.2% |
| |||||||||||
Addus HomeCare Corp. | 4,800 | 359,760 | (a | ) | ||||||||
Amedisys Inc. | 2,400 | 291,384 | (a | ) | ||||||||
BioTelemetry Inc. | 3,500 | 168,525 | (a | ) | ||||||||
Cigna Corp. | 17,492 | 2,755,865 | (a | ) | ||||||||
CorVel Corp. | 4,413 | 383,975 | (a | ) | ||||||||
Premier Inc., Class A | 10,413 | 407,252 | (a | ) | ||||||||
| 4,366,761 | ||||||||||||
Healthcare Supplies – 0.1% |
| |||||||||||
Atrion Corp. | 600 | 511,644 | ||||||||||
ICU Medical Inc. | 1,126 | 283,651 | (a | ) | ||||||||
Meridian Bioscience Inc. | 20,263 | 240,724 | ||||||||||
OrthoPediatrics Corp. | 3,178 | 123,942 | (a | ) | ||||||||
Utah Medical Products Inc. | 1,605 | 153,599 | ||||||||||
| 1,313,560 | ||||||||||||
Healthcare Technology – 0.0%* |
| |||||||||||
Simulations Plus Inc. | 5,672 | 161,992 | ||||||||||
Home Building – 0.1% |
| |||||||||||
MDC Holdings Inc. | 23,700 | 776,886 | ||||||||||
Meritage Homes Corp. | 5,100 | 261,834 | (a | ) | ||||||||
| 1,038,720 | ||||||||||||
Home Furnishing Retail – 0.1% |
| |||||||||||
Bed Bath & Beyond Inc. | 14,900 | 173,138 | ||||||||||
Williams-Sonoma Inc. | 16,066 | 1,044,290 | ||||||||||
| 1,217,428 | ||||||||||||
Home Furnishings – 0.0%* |
| |||||||||||
Ethan Allen Interiors Inc. | 3,300 | 69,498 | ||||||||||
Hotel & Resort REITs – 0.2% |
| |||||||||||
Apple Hospitality REIT Inc. | 43,355 | 687,610 | ||||||||||
Chesapeake Lodging Trust | 28,723 | 816,308 | ||||||||||
Hospitality Properties Trust | 32,567 | 814,175 | ||||||||||
Park Hotels & Resorts Inc. | 40,231 | 1,108,766 | ||||||||||
| 3,426,859 | ||||||||||||
Hotels, Resorts & Cruise Lines – 0.0%* |
| |||||||||||
Wyndham Destinations Inc. | 19,121 | 839,412 | ||||||||||
Household Appliances – 0.0%* |
| |||||||||||
Hamilton Beach Brands Holding Co., Class A | 3,017 | 57,474 | ||||||||||
iRobot Corp. | 3,100 | 284,084 | (a | ) | ||||||||
| 341,558 | ||||||||||||
Household Products – 0.4% |
| |||||||||||
Church & Dwight Company Inc. | 48,940 | 3,575,556 | ||||||||||
The Procter & Gamble Co. | 31,049 | 3,404,523 | ||||||||||
| 6,980,079 | ||||||||||||
Human Resource & Employment Services – 0.2% |
| |||||||||||
BG Staffing Inc. | 4,000 | 75,520 | ||||||||||
GP Strategies Corp. | 5,800 | 87,464 | (a | ) | ||||||||
Kelly Services Inc., Class A | 15,209 | 398,324 | ||||||||||
Kforce Inc. | 7,283 | 255,560 | ||||||||||
ManpowerGroup Inc. | 12,306 | 1,188,760 | ||||||||||
Robert Half International Inc. | 23,687 | 1,350,396 | ||||||||||
| 3,356,024 | ||||||||||||
Hypermarkets & Super Centers – 0.6% |
| |||||||||||
Costco Wholesale Corp. | 45,816 | 12,107,336 | ||||||||||
Independent Power Producers & Energy Traders – 0.1% |
| |||||||||||
AES Corp. | 77,244 | 1,294,609 | ||||||||||
Vistra Energy Corp. | 54,326 | 1,229,941 | ||||||||||
| 2,524,550 | ||||||||||||
See Notes to Schedule of Investments and Notes to Financial Statements.
Table of Contents
| State Street Total Return V.I.S. Fund | ||
| Schedule of Investments | June 30, 2019 (Unaudited) |
Number of Shares | Fair Value | |||||||||||
Industrial Conglomerates – 0.8% |
| |||||||||||
Honeywell International Inc. | 84,831 | $ | 14,810,644 | |||||||||
Industrial Machinery – 0.3% |
| |||||||||||
Donaldson Company Inc. | 25,653 | 1,304,712 | ||||||||||
Gencor Industries Inc. | 4,000 | 52,000 | (a | ) | ||||||||
Hurco Companies Inc. | 3,033 | 107,853 | ||||||||||
Hyster-Yale Materials Handling Inc. | 3,800 | 209,988 | ||||||||||
ITT Inc. | 17,512 | 1,146,686 | ||||||||||
Mueller Industries Inc. | 18,500 | 541,495 | ||||||||||
Snap-on Inc. | 11,075 | 1,834,463 | ||||||||||
The Eastern Co. | 2,534 | 71,003 | ||||||||||
The Gorman-Rupp Co. | 8,575 | 281,517 | ||||||||||
The Timken Co. | 6,310 | 323,955 | ||||||||||
| 5,873,672 | ||||||||||||
Industrial REITs – 0.0%* |
| |||||||||||
Innovative Industrial Properties Inc. | 2,269 | 280,358 | ||||||||||
Insurance Brokers – 0.1% |
| |||||||||||
Brown & Brown Inc. | 46,442 | 1,555,807 | ||||||||||
Goosehead Insurance Inc., Class A | 4,803 | 229,583 | ||||||||||
Health Insurance Innovations Inc., Class A | 4,500 | 116,640 | (a | ) | ||||||||
| 1,902,030 | ||||||||||||
Integrated Oil & Gas – 0.2% |
| |||||||||||
Exxon Mobil Corp. | 56,702 | 4,345,074 | ||||||||||
Integrated Telecommunication Services – 0.0%* |
| |||||||||||
ATN International Inc. | 4,900 | 282,877 | ||||||||||
Frontier Communications Corp. | 30,500 | 53,375 | (a | ) | ||||||||
| 336,252 | ||||||||||||
Interactive Home Entertainment – 0.0%* |
| |||||||||||
Zynga Inc., Class A | 153,254 | 939,447 | (a | ) | ||||||||
Interactive Media & Services – 0.1% |
| |||||||||||
Alphabet Inc., Class C | 325 | 351,296 | (a | ) | ||||||||
Liberty TripAdvisor Holdings Inc., Class A | 12,100 | 150,040 | (a | ) | ||||||||
Match Group Inc. | 10,507 | 706,806 | ||||||||||
The Meet Group Inc. | 8,900 | 30,972 | (a | ) | ||||||||
TripAdvisor Inc. | 20,826 | 964,035 | (a | ) | ||||||||
| 2,203,149 | ||||||||||||
Internet & Direct Marketing Retail – 0.3% |
| |||||||||||
1-800-Flowers.com Inc., Class A | 12,960 | 244,685 | (a | ) | ||||||||
Amazon.com Inc. | 2,373 | 4,493,584 | (a | ) | ||||||||
Duluth Holdings Inc., Class B | 3,800 | 51,642 | (a | ) | ||||||||
Qurate Retail Inc. | 30,481 | 377,659 | (a | ) | ||||||||
Stamps.com Inc. | 4,200 | 190,134 | (a | ) | ||||||||
| 5,357,704 | ||||||||||||
Internet Services & Infrastructure – 0.1% |
| |||||||||||
Okta Inc. | 17,388 | 2,147,592 | (a | ) | ||||||||
Investment Banking & Brokerage – 0.1% |
| |||||||||||
Cowen Inc., Class A | 13,500 | 232,065 | (a | ) | ||||||||
Evercore Inc., Class A | 8,046 | 712,634 | ||||||||||
Greenhill & Company Inc. | 8,300 | 112,797 | ||||||||||
Houlihan Lokey Inc. | 16,305 | 726,062 | ||||||||||
INTL. FCStone Inc. | 7,550 | 298,905 | (a | ) | ||||||||
Moelis & Co., Class A | 21,559 | 753,487 | ||||||||||
Oppenheimer Holdings Inc., Class A | 2,487 | 67,696 | ||||||||||
| 2,903,646 | ||||||||||||
IT Consulting & Other Services – 0.2% |
| |||||||||||
Amdocs Ltd. | 27,665 | 1,717,720 | ||||||||||
Booz Allen Hamilton Holding Corp. | 27,357 | 1,811,307 | ||||||||||
ManTech International Corp., Class A | 12,769 | 840,839 | ||||||||||
Perficient Inc. | 4,160 | 142,771 | (a | ) | ||||||||
Unisys Corp. | 24,600 | 239,112 | (a | ) | ||||||||
| 4,751,749 | ||||||||||||
Leisure Facilities – 0.0%* |
| |||||||||||
International Speedway Corp., Class A | 11,370 | 510,399 | ||||||||||
Speedway Motorsports Inc. | 5,327 | 98,816 | ||||||||||
| 609,215 | ||||||||||||
Number of Shares | Fair Value | |||||||||||
Leisure Products – 0.0%* |
| |||||||||||
Escalade Inc. | 4,200 | $ | 48,174 | |||||||||
Johnson Outdoors Inc., Class A | 2,304 | 171,809 | ||||||||||
MasterCraft Boat Holdings Inc. | 8,948 | 175,292 | (a | ) | ||||||||
Sturm Ruger & Company Inc. | 7,800 | 424,944 | ||||||||||
| 820,219 | ||||||||||||
Life & Health Insurance – 0.6% |
| |||||||||||
Aflac Inc. | 149,411 | 8,189,217 | ||||||||||
Athene Holding Ltd., Class A | 10,602 | 456,522 | (a | ) | ||||||||
Brighthouse Financial Inc. | 24,087 | 883,752 | (a | ) | ||||||||
FBL Financial Group Inc., Class A | 2,263 | 144,379 | ||||||||||
Genworth Financial Inc., Class A | 500 | 1,855 | (a | ) | ||||||||
Independence Holding Co. | 1,669 | 64,624 | ||||||||||
National Western Life Group Inc., Class A | 1,055 | 271,135 | ||||||||||
Torchmark Corp. | 20,731 | 1,854,595 | ||||||||||
| 11,866,079 | ||||||||||||
Life Sciences Tools & Services – 0.2% |
| |||||||||||
Bio-Techne Corp. | 7,405 | 1,543,868 | ||||||||||
Bruker Corp. | 6,990 | 349,151 | ||||||||||
Charles River Laboratories International Inc. | 4,165 | 591,013 | (a | ) | ||||||||
Luminex Corp. | 20,065 | 414,142 | ||||||||||
Medpace Holdings Inc. | 10,500 | 686,910 | (a | ) | ||||||||
Quanterix Corp. | 2,265 | 76,534 | (a | ) | ||||||||
| 3,661,618 | ||||||||||||
Managed Healthcare – 0.7% |
| |||||||||||
Anthem Inc. | 13,726 | 3,873,614 | ||||||||||
Centene Corp. | 17,356 | 910,149 | (a | ) | ||||||||
Molina Healthcare Inc. | 12,454 | 1,782,666 | (a | ) | ||||||||
UnitedHealth Group Inc. | 15,955 | 3,893,179 | ||||||||||
WellCare Health Plans Inc. | 9,561 | 2,725,554 | (a | ) | ||||||||
| 13,185,162 | ||||||||||||
Metal & Glass Containers – 0.1% |
| |||||||||||
AptarGroup Inc. | 12,424 | 1,544,800 | ||||||||||
Greif Inc., Class B | 2,200 | 96,030 | ||||||||||
Silgan Holdings Inc. | 15,472 | 473,443 | ||||||||||
| 2,114,273 | ||||||||||||
Mortgage REITs – 0.8% |
| |||||||||||
AG Mortgage Investment Trust Inc. | 14,014 | 222,823 | ||||||||||
AGNC Investment Corp. | 107,202 | 1,803,138 | ||||||||||
Annaly Capital Management Inc. | 276,981 | 2,528,837 | ||||||||||
Anworth Mortgage Asset Corp. | 47,600 | 180,404 | ||||||||||
Apollo Commercial Real Estate Finance Inc. | 59,575 | 1,095,584 | ||||||||||
Arbor Realty Trust Inc. | 35,470 | 429,896 | ||||||||||
Ares Commercial Real Estate Corp. | 13,107 | 194,770 | ||||||||||
Arlington Asset Investment Corp., Class A | 13,922 | 95,783 | ||||||||||
ARMOUR Residential REIT Inc. | 24,800 | 462,272 | ||||||||||
Blackstone Mortgage Trust Inc., Class A | 55,175 | 1,963,126 | ||||||||||
Capstead Mortgage Corp. | 41,253 | 344,463 | ||||||||||
Cherry Hill Mortgage Investment Corp. | 7,684 | 122,944 | ||||||||||
Chimera Investment Corp. | 37,268 | 703,247 | ||||||||||
Dynex Capital Inc. | 11,158 | 186,902 | ||||||||||
MFA Financial Inc. | 89,476 | 642,438 | ||||||||||
New Residential Investment Corp. | 80,557 | 1,239,772 | ||||||||||
PennyMac Mortgage Investment Trust | 29,100 | 635,253 | ||||||||||
Ready Capital Corp. | 8,300 | 123,670 | ||||||||||
Starwood Property Trust Inc. | 53,735 | 1,220,859 | ||||||||||
TPG RE Finance Trust Inc. | 15,047 | 290,257 | ||||||||||
Two Harbors Investment Corp. | 49,130 | 622,477 | ||||||||||
| 15,108,915 | ||||||||||||
Movies & Entertainment – 0.7% |
| |||||||||||
AMC Entertainment Holdings Inc., Class A | 12,200 | 113,826 | ||||||||||
Cinemark Holdings Inc. | 21,406 | 772,757 | ||||||||||
See Notes to Schedule of Investments and Notes to Financial Statements.
Table of Contents
| State Street Total Return V.I.S. Fund | ||
| Schedule of Investments | June 30, 2019 (Unaudited) |
Number of Shares | Fair Value | |||||||||||
The Walt Disney Co. | 74,404 | $ | 10,389,775 | |||||||||
Viacom Inc., Class B | 70,712 | 2,112,167 | ||||||||||
| 13,388,525 | ||||||||||||
Multi-Line Insurance – 0.1% |
| |||||||||||
American Financial Group Inc. | 14,351 | 1,470,547 | ||||||||||
Assurant Inc. | 10,413 | 1,107,735 | ||||||||||
| 2,578,282 | ||||||||||||
Multi-Sector Holdings – 1.0% |
| |||||||||||
Berkshire Hathaway Inc., Class B | 95,725 | 20,405,698 | (a | ) | ||||||||
Multi-Utilities – 0.2% |
| |||||||||||
Ameren Corp. | 48,656 | 3,654,552 | ||||||||||
Unitil Corp. | 5,900 | 353,351 | ||||||||||
| 4,007,903 | ||||||||||||
Office REITs – 0.1% |
| |||||||||||
Columbia Property Trust Inc. | 23,665 | 490,812 | ||||||||||
Equity Commonwealth | 23,476 | 763,440 | ||||||||||
| 1,254,252 | ||||||||||||
Office Services & Supplies – 0.0%* |
| |||||||||||
Steelcase Inc., Class A | 21,181 | 362,195 | ||||||||||
Oil & Gas Drilling – 0.0%* |
| |||||||||||
Diamond Offshore Drilling Inc. | 4,600 | 40,802 | (a | ) | ||||||||
Noble Corporation PLC | 120,216 | 224,804 | (a | ) | ||||||||
Pioneer Energy Services Corp. | 24,000 | 6,070 | (a | ) | ||||||||
Transocean Ltd. | 103,218 | 661,627 | (a | ) | ||||||||
| 933,303 | ||||||||||||
Oil & Gas Equipment & Services – 0.0%* |
| |||||||||||
Era Group Inc. | 9,400 | 78,396 | (a | ) | ||||||||
Frank’s International N.V. | 35,700 | 194,922 | (a | ) | ||||||||
Liberty Oilfield Services Inc., Class A | 3,332 | 53,912 | ||||||||||
Mammoth Energy Services Inc. | 5,798 | 39,890 | ||||||||||
Matrix Service Co. | 12,968 | 262,731 | (a | ) | ||||||||
Smart Sand Inc. | 10,400 | 25,376 | (a | ) | ||||||||
Solaris Oilfield Infrastructure Inc., Class A | 7,114 | 106,568 | ||||||||||
| 761,795 | ||||||||||||
Oil & Gas Exploration & Production – 0.1% |
| |||||||||||
California Resources Corp. | 2,700 | 53,136 | (a | ) | ||||||||
Denbury Resources Inc. | 41,800 | 51,832 | (a | ) | ||||||||
Evolution Petroleum Corp. | 11,902 | 85,099 | ||||||||||
Gulfport Energy Corp. | 43,800 | 215,058 | (a | ) | ||||||||
Penn Virginia Corp. | 400 | 12,272 | (a | ) | ||||||||
SM Energy Co. | 22,813 | 285,619 | ||||||||||
W&T Offshore Inc. | 18,900 | 93,744 | (a | ) | ||||||||
Whiting Petroleum Corp. | 18,373 | 343,208 | (a | ) | ||||||||
| 1,139,968 | ||||||||||||
Oil & Gas Refining & Marketing – 0.9% |
| |||||||||||
CVR Energy Inc. | 8,836 | 441,712 | ||||||||||
HollyFrontier Corp. | 31,843 | 1,473,694 | ||||||||||
PBF Energy Inc., Class A | 23,840 | 746,192 | ||||||||||
Phillips 66 | 82,514 | 7,718,359 | ||||||||||
Renewable Energy Group Inc. | 18,000 | 285,480 | (a | ) | ||||||||
Valero Energy Corp. | 84,960 | 7,273,426 | ||||||||||
World Fuel Services Corp. | 13,500 | 485,460 | ||||||||||
| 18,424,323 | ||||||||||||
Oil & Gas Storage & Transportation – 0.0%* |
| |||||||||||
DHT Holdings Inc. | 44,800 | 264,768 | ||||||||||
Nordic American Tankers Ltd. | 65,700 | 153,738 | ||||||||||
| 418,506 | ||||||||||||
Other Diversified Financial Services – 0.0%* |
| |||||||||||
AXA Equitable Holdings Inc. | 39,596 | 827,556 | ||||||||||
Packaged Foods & Meats – 0.2% |
| |||||||||||
Hormel Foods Corp. | 54,431 | 2,206,633 | ||||||||||
J&J Snack Foods Corp. | 4,981 | 801,692 | ||||||||||
JBS S.A. | 38,092 | 210,902 | ||||||||||
Lancaster Colony Corp. | 9,172 | 1,362,959 | ||||||||||
Tootsie Roll Industries Inc. | 8,211 | 303,232 | ||||||||||
| 4,885,418 | ||||||||||||
Number of Shares | Fair Value | |||||||||||
Paper Packaging – 0.1% |
| |||||||||||
Sonoco Products Co. | 19,690 | $ | 1,286,545 | |||||||||
UFP Technologies Inc. | 3,071 | 127,784 | (a | ) | ||||||||
| 1,414,329 | ||||||||||||
Paper Products – 0.0%* |
| |||||||||||
Domtar Corp. | 12,495 | 556,402 | ||||||||||
Verso Corp., Class A | 16,753 | 319,145 | (a | ) | ||||||||
| 875,547 | ||||||||||||
Personal Products – 0.4% |
| |||||||||||
Medifast Inc. | 1,865 | 239,280 | ||||||||||
The Estee Lauder Companies Inc., Class A | 42,884 | 7,852,489 | ||||||||||
USANA Health Sciences Inc. | 1,026 | 81,495 | (a | ) | ||||||||
| 8,173,264 | ||||||||||||
Pharmaceuticals – 1.5% |
| |||||||||||
Amneal Pharmaceuticals Inc. | 4,108 | 29,454 | (a | ) | ||||||||
Eli Lilly & Co. | 20,731 | 2,296,788 | ||||||||||
Endo International PLC | 12,700 | 52,324 | (a | ) | ||||||||
Evolus Inc. | 4,370 | 63,889 | (a | ) | ||||||||
Johnson & Johnson | 126,161 | 17,571,704 | ||||||||||
Mallinckrodt PLC | 7,900 | 72,522 | (a | ) | ||||||||
Pfizer Inc. | 200,942 | 8,704,808 | ||||||||||
| 28,791,489 | ||||||||||||
Property & Casualty Insurance – 1.9% |
| |||||||||||
AMERISAFE Inc. | 9,264 | 590,765 | ||||||||||
Arch Capital Group Ltd. | 77,528 | 2,874,738 | (a | ) | ||||||||
Assured Guaranty Ltd. | 20,760 | 873,581 | ||||||||||
Axis Capital Holdings Ltd. | 16,471 | 982,495 | ||||||||||
Chubb Ltd. | 62,950 | 9,271,906 | ||||||||||
Cincinnati Financial Corp. | 30,765 | 3,189,408 | ||||||||||
Donegal Group Inc., Class A | 4,372 | 66,761 | ||||||||||
Employers Holdings Inc. | 8,700 | 367,749 | ||||||||||
Erie Indemnity Co., Class A | 4,929 | 1,253,346 | ||||||||||
Fidelity National Financial Inc. | 52,916 | 2,132,515 | ||||||||||
First American Financial Corp. | 21,678 | 1,164,109 | ||||||||||
James River Group Holdings Ltd. | 1,500 | 70,350 | ||||||||||
Kinsale Capital Group Inc. | 9,509 | 869,883 | ||||||||||
Loews Corp. | 55,720 | 3,046,212 | ||||||||||
Mercury General Corp. | 5,263 | 328,938 | ||||||||||
Old Republic International Corp. | 56,703 | 1,269,013 | ||||||||||
Protective Insurance Corp., Class B | 4,514 | 78,408 | ||||||||||
Safety Insurance Group Inc. | 7,093 | 674,757 | ||||||||||
The Allstate Corp. | 50,644 | 5,149,988 | ||||||||||
The Hanover Insurance Group Inc. | 8,520 | 1,093,116 | ||||||||||
United Fire Group Inc. | 6,500 | 314,990 | ||||||||||
White Mountains Insurance Group Ltd. | 568 | 580,189 | ||||||||||
WR Berkley Corp. | 28,473 | 1,877,225 | ||||||||||
| 38,120,442 | ||||||||||||
Publishing – 0.0%* |
| |||||||||||
John Wiley & Sons Inc., Class A | 8,593 | 394,075 | ||||||||||
Scholastic Corp. | 1,500 | 49,860 | ||||||||||
| 443,935 | ||||||||||||
Railroads – 0.1% |
| |||||||||||
Genesee & Wyoming Inc., Class A | 11,549 | 1,154,900 | (a | ) | ||||||||
Real Estate Services – 0.0%* |
| |||||||||||
Marcus & Millichap Inc. | 2,500 | 77,125 | (a | ) | ||||||||
Realogy Holdings Corp. | 24,172 | 175,005 | ||||||||||
| 252,130 | ||||||||||||
Regional Banks – 0.5% |
| |||||||||||
1st Constitution Bancorp | 3,476 | 64,202 | ||||||||||
ACNB Corp. | 3,167 | 125,318 | ||||||||||
American National Bankshares Inc. | 1,488 | 57,660 | ||||||||||
Ames National Corp. | 3,713 | 100,622 | ||||||||||
Arrow Financial Corp. | 6,030 | 209,422 | ||||||||||
Auburn National Bancorporation Inc. | 1,184 | 39,664 | ||||||||||
Bank of Hawaii Corp. | 8,236 | 682,847 | ||||||||||
Bank of Marin Bancorp | 3,200 | 131,264 | ||||||||||
Baycom Corp. | 4,757 | 104,178 | (a | ) | ||||||||
Cambridge Bancorp | 1,684 | 137,246 | ||||||||||
CB Financial Services Inc. | 2,210 | 52,487 | ||||||||||
See Notes to Schedule of Investments and Notes to Financial Statements.
Table of Contents
| State Street Total Return V.I.S. Fund | ||
| Schedule of Investments | June 30, 2019 (Unaudited) |
Number of Shares | Fair Value | |||||||||||
CenterState Bank Corp. | 3,592 | $ | 82,724 | |||||||||
Chemung Financial Corp. | 1,535 | 74,202 | ||||||||||
Citizens & Northern Corp. | 4,741 | 124,831 | ||||||||||
City Holding Co. | 4,886 | 372,606 | ||||||||||
Commerce Bancshares Inc. | 19,974 | 1,191,649 | ||||||||||
Community Trust Bancorp Inc. | 6,149 | 260,041 | ||||||||||
Evans Bancorp Inc. | 1,187 | 44,786 | ||||||||||
Fidelity D&D Bancorp Inc. | 1,358 | 91,258 | ||||||||||
Fidelity Southern Corp. | 900 | 27,873 | ||||||||||
Financial Institutions Inc. | 4,000 | 116,600 | ||||||||||
First Choice Bancorp | 410 | 9,323 | ||||||||||
First Community Bancshares Inc. | 7,000 | 236,320 | ||||||||||
First Community Corp. | 3,345 | 61,916 | ||||||||||
First Financial Corp. | 5,855 | 235,137 | ||||||||||
First Financial Northwest Inc. | 3,803 | 53,812 | ||||||||||
First Hawaiian Inc. | 26,411 | 683,253 | ||||||||||
First Mid Bancshares Inc. | 5,632 | 196,669 | ||||||||||
First Savings Financial Group Inc. | 852 | 51,120 | ||||||||||
First United Corp. | 2,990 | 58,933 | ||||||||||
FNB Corp. | 49,792 | 586,052 | ||||||||||
Independent Bank Corp. | 79 | 6,016 | ||||||||||
Investar Holding Corp. | 2,700 | 64,395 | ||||||||||
LCNB Corp. | 4,198 | 79,762 | ||||||||||
Level One Bancorp Inc. | 2,039 | 50,955 | ||||||||||
Metropolitan Bank Holding Corp. | 2,799 | 123,156 | (a | ) | ||||||||
Mid Penn Bancorp Inc. | 490 | 12,225 | ||||||||||
Middlefield Banc Corp. | 1,480 | 60,680 | ||||||||||
MutualFirst Financial Inc. | 2,502 | 85,168 | ||||||||||
National Bankshares Inc. | 3,186 | 124,031 | ||||||||||
Northrim BanCorp Inc. | 3,126 | 111,473 | ||||||||||
Norwood Financial Corp. | 2,672 | 93,012 | ||||||||||
Oak Valley Bancorp | 3,274 | 64,007 | ||||||||||
Ohio Valley Banc Corp. | 1,971 | 76,021 | ||||||||||
Orrstown Financial Services Inc. | 2,744 | 60,341 | ||||||||||
Park National Corp. | 4,955 | 492,477 | ||||||||||
Parke Bancorp Inc. | 2,300 | 55,085 | ||||||||||
PCB Bancorp | 2,800 | 47,712 | ||||||||||
Penns Woods Bancorp Inc. | 1,479 | 66,925 | ||||||||||
People’s United Financial Inc. | 34,173 | 573,423 | ||||||||||
Peoples Bancorp of North Carolina Inc. | 1,900 | 57,095 | ||||||||||
Premier Financial Bancorp Inc. | 5,592 | 83,880 | ||||||||||
Prosperity Bancshares Inc. | 13,374 | 883,353 | ||||||||||
Republic Bancorp Inc., Class A | 2,000 | 99,500 | ||||||||||
Select Bancorp Inc. | 2,769 | 31,677 | (a | ) | ||||||||
Shore Bancshares Inc. | 5,893 | 96,292 | ||||||||||
Spirit of Texas Bancshares Inc. | 4,738 | 106,605 | (a | ) | ||||||||
| 9,869,281 | ||||||||||||
Reinsurance – 0.1% |
| |||||||||||
Reinsurance Group of America Inc. | 12,529 | 1,954,900 | ||||||||||
Research & Consulting Services – 0.2% |
| |||||||||||
CBIZ Inc. | 24,983 | 489,417 | (a | ) | ||||||||
CRA International Inc. | 3,635 | 139,330 | ||||||||||
Exponent Inc. | 24,934 | 1,459,636 | ||||||||||
Forrester Research Inc. | 5,032 | 236,655 | ||||||||||
ICF International Inc. | 4,005 | 291,564 | ||||||||||
Navigant Consulting Inc. | 20,500 | 475,395 | ||||||||||
Resources Connection Inc. | 14,614 | 233,970 | ||||||||||
| 3,325,967 | ||||||||||||
Residential REITs – 0.1% |
| |||||||||||
American Campus Communities Inc. | 25,937 | 1,197,252 | ||||||||||
BRT Apartments Corp. | 4,577 | 64,673 | ||||||||||
| 1,261,925 | ||||||||||||
Restaurants – 0.1% |
| |||||||||||
BJ’s Restaurants Inc. | 3,300 | 145,002 | ||||||||||
Brinker International Inc. | 18,246 | 717,980 | ||||||||||
El Pollo Loco Holdings Inc. | 3,700 | 39,442 | (a | ) | ||||||||
J. Alexander’s Holdings Inc. | 5,935 | 66,650 | (a | ) | ||||||||
Nathan’s Famous Inc. | 700 | 54,684 | ||||||||||
The Cheesecake Factory Inc. | 20,490 | 895,823 | ||||||||||
Wingstop Inc. | 1,000 | 94,750 | ||||||||||
| 2,014,331 | ||||||||||||
Number of Shares | Fair Value | |||||||||||
Retail REITs – 0.4% |
| |||||||||||
Brixmor Property Group Inc. | 60,394 | $ | 1,079,845 | |||||||||
Getty Realty Corp. | 15,945 | 490,468 | ||||||||||
Kimco Realty Corp. | 81,409 | 1,504,438 | ||||||||||
National Retail Properties Inc. | 31,712 | 1,681,053 | ||||||||||
Realty Income Corp. | 15,714 | 1,083,795 | ||||||||||
Retail Properties of America Inc., Class A | 43,067 | 506,468 | ||||||||||
RPT Realty | 8,300 | 100,513 | ||||||||||
SITE Centers Corp. | 30,576 | 404,826 | ||||||||||
Spirit Realty Capital Inc. | 17,134 | 730,937 | ||||||||||
Weingarten Realty Investors | 23,855 | 654,104 | ||||||||||
Whitestone REIT | 18,500 | 234,765 | ||||||||||
| 8,471,212 | ||||||||||||
Semiconductor Equipment – 0.0%* |
| |||||||||||
AXT Inc. | 11,000 | 43,560 | (a | ) | ||||||||
Photronics Inc. | 31,591 | 259,046 | (a | ) | ||||||||
| 302,606 | ||||||||||||
Semiconductors – 1.1% |
| |||||||||||
Cirrus Logic Inc. | 5,900 | 257,830 | (a | ) | ||||||||
Diodes Inc. | 19,500 | 709,215 | (a | ) | ||||||||
Intel Corp. | 267,048 | 12,783,588 | ||||||||||
Monolithic Power Systems Inc. | 7,289 | 989,700 | ||||||||||
NVE Corp. | 2,266 | 157,782 | ||||||||||
Xilinx Inc. | 51,023 | 6,016,632 | ||||||||||
| 20,914,747 | ||||||||||||
Soft Drinks – 0.1% |
| |||||||||||
Keurig Dr Pepper Inc. | 36,344 | 1,050,342 | ||||||||||
Specialized Finance – 0.0%* |
| |||||||||||
NewStar Financial Inc. | 492 | 128 | (b,c | ) | ||||||||
Specialized REITs – 0.2% |
| |||||||||||
EPR Properties | 14,767 | 1,101,471 | ||||||||||
Jernigan Capital Inc. | 9,291 | 190,466 | ||||||||||
Lamar Advertising Co., Class A | 16,850 | 1,359,963 | ||||||||||
Life Storage Inc. | 9,188 | 873,595 | ||||||||||
Uniti Group Inc. | 28,541 | 271,139 | ||||||||||
| 3,796,634 | ||||||||||||
Specialty Chemicals – 0.0%* |
| |||||||||||
FutureFuel Corp. | 12,100 | 141,449 | ||||||||||
NewMarket Corp. | 1,515 | 607,424 | ||||||||||
| 748,873 | ||||||||||||
Specialty Stores – 0.2% |
| |||||||||||
Barnes & Noble Inc. | 26,400 | 176,616 | ||||||||||
Dick’s Sporting Goods Inc. | 14,300 | 495,209 | ||||||||||
Hibbett Sports Inc. | 8,905 | 162,071 | (a | ) | ||||||||
MarineMax Inc. | 10,831 | 178,062 | (a | ) | ||||||||
Sally Beauty Holdings Inc. | 7,900 | 105,386 | (a | ) | ||||||||
Signet Jewelers Ltd. | 1,900 | 33,972 | ||||||||||
Sportsman’s Warehouse Holdings Inc. | 13,200 | 49,896 | (a | ) | ||||||||
Tractor Supply Co. | 24,423 | 2,657,222 | ||||||||||
| 3,858,434 | ||||||||||||
Steel – 0.1% |
| |||||||||||
Reliance Steel & Aluminum Co. | 13,671 | 1,293,550 | ||||||||||
Warrior Met Coal Inc. | 20,901 | 545,934 | ||||||||||
| 1,839,484 | ||||||||||||
Systems Software – 0.5% |
| |||||||||||
Fortinet Inc. | 3,497 | 268,674 | (a | ) | ||||||||
Microsoft Corp. | 54,162 | 7,255,542 | ||||||||||
SecureWorks Corp., Class A | 4,060 | 53,957 | (a | ) | ||||||||
VMware Inc., Class A | 14,389 | 2,405,985 | ||||||||||
| 9,984,158 | ||||||||||||
Technology Distributors – 0.3% |
| |||||||||||
Arrow Electronics Inc. | 16,891 | 1,203,822 | (a | ) | ||||||||
Avnet Inc. | 21,560 | 976,021 | ||||||||||
Insight Enterprises Inc. | 16,987 | 988,643 | (a | ) | ||||||||
PC Connection Inc. | 5,505 | 192,565 | ||||||||||
ScanSource Inc. | 12,088 | 393,585 | (a | ) | ||||||||
Tech Data Corp. | 15,300 | 1,600,380 | (a | ) | ||||||||
| 5,355,016 | ||||||||||||
See Notes to Schedule of Investments and Notes to Financial Statements.
Table of Contents
| State Street Total Return V.I.S. Fund | ||
| Schedule of Investments | June 30, 2019 (Unaudited) |
Number of Shares | Fair Value | |||||||||||
Technology Hardware, Storage & Peripherals – 0.6% |
| |||||||||||
Apple Inc. | 44,508 | $ | 8,809,023 | |||||||||
Dell Technologies, Class C | 2,276 | 115,621 | (a | ) | ||||||||
HP Inc. | 89,957 | 1,870,206 | ||||||||||
Xerox Corp. | 40,231 | 1,424,580 | ||||||||||
| 12,219,430 | ||||||||||||
Thrifts & Mortgage Finance – 0.2% |
| |||||||||||
Capitol Federal Financial Inc. | 63,700 | 877,149 | ||||||||||
Entegra Financial Corp. | 3,164 | 95,300 | (a | ) | ||||||||
ESSA Bancorp Inc. | 3,100 | 47,275 | ||||||||||
FS Bancorp Inc. | 1,739 | 90,202 | ||||||||||
Luther Burbank Corp. | 7,970 | 86,793 | ||||||||||
Northwest Bancshares Inc. | 46,290 | 815,167 | ||||||||||
OP Bancorp | 5,921 | 64,184 | ||||||||||
Oritani Financial Corp. | 18,662 | 331,064 | ||||||||||
Territorial Bancorp Inc. | 3,616 | 111,734 | ||||||||||
Timberland Bancorp Inc. | 2,247 | 67,140 | ||||||||||
TrustCo Bank Corp. | 45,556 | 360,804 | ||||||||||
Waterstone Financial Inc. | 12,100 | 206,426 | ||||||||||
Western New England Bancorp Inc. | 4,900 | 45,766 | ||||||||||
| 3,199,004 | ||||||||||||
Tires & Rubber – 0.0%* |
| |||||||||||
Cooper Tire & Rubber Co. | 16,100 | 507,955 | ||||||||||
Tobacco – 0.0%* |
| |||||||||||
Turning Point Brands Inc. | 3,919 | 191,953 | ||||||||||
Trading Companies & Distributors – 0.3% |
| |||||||||||
Aircastle Ltd. | 10,900 | 231,734 | ||||||||||
BlueLinx Holdings Inc. | 4,130 | 81,815 | (a | ) | ||||||||
CAI International Inc. | 8,400 | 208,488 | (a | ) | ||||||||
Foundation Building Materials Inc. | 5,653 | 100,510 | (a | ) | ||||||||
Kaman Corp. | 13,340 | 849,625 | ||||||||||
MSC Industrial Direct Company Inc., Class A | 8,841 | 656,533 | ||||||||||
NOW Inc. | 25,000 | 369,000 | (a | ) | ||||||||
Rush Enterprises Inc., Class A | 1,600 | 58,432 | ||||||||||
Rush Enterprises Inc., Class B | 2,089 | 77,105 | ||||||||||
WESCO International Inc. | 9,372 | 474,692 | (a | ) | ||||||||
Willis Lease Finance Corp. | 1,474 | 85,964 | (a | ) | ||||||||
WW Grainger Inc. | 7,119 | 1,909,529 | ||||||||||
| 5,103,427 | ||||||||||||
Trucking – 0.2% |
| |||||||||||
AMERCO | 1,420 | 537,541 | ||||||||||
ArcBest Corp. | 11,428 | 321,241 | ||||||||||
Heartland Express Inc. | 22,700 | 410,189 | ||||||||||
Landstar System Inc. | 8,012 | 865,216 | ||||||||||
Marten Transport Ltd. | 19,001 | 344,868 | ||||||||||
PAM Transportation Services Inc. | 507 | 31,434 | (a | ) | ||||||||
Ryder System Inc. | 10,413 | 607,078 | ||||||||||
US Xpress Enterprises Inc., Class A | 10,600 | 54,484 | (a | ) | ||||||||
Werner Enterprises Inc. | 22,674 | 704,708 | ||||||||||
| 3,876,759 | ||||||||||||
Wireless Telecommunication Services – 0.0%* |
| |||||||||||
Telephone & Data Systems Inc. | 19,766 | 600,886 | ||||||||||
Total Domestic Equity |
| 614,964,624 | ||||||||||
Foreign Equity – 22.4% |
| |||||||||||
Common Stock – 22.2% |
| |||||||||||
Advertising – 0.1% |
| |||||||||||
Cheil Worldwide Inc. | 1,816 | 46,240 | ||||||||||
Hakuhodo DY Holdings Inc. | 50,548 | 851,068 | ||||||||||
| 897,308 | ||||||||||||
Aerospace & Defense – 0.3% |
| |||||||||||
Meggitt PLC | 168,353 | 1,122,738 | ||||||||||
Singapore Technologies Engineering Ltd. | 338,100 | 1,034,579 | ||||||||||
Thales S.A. | 22,782 | 2,818,832 | ||||||||||
| 4,976,149 | ||||||||||||
Number of Shares | Fair Value | |||||||||||
Agricultural Products – 0.1% |
| |||||||||||
China Agri-Industries Holdings Ltd. | 120,000 | $ | 38,554 | |||||||||
Wilmar International Ltd. | 416,298 | 1,138,477 | ||||||||||
| 1,177,031 | ||||||||||||
Air Freight & Logistics – 0.0%* |
| |||||||||||
SG Holdings Company Ltd. | 31,200 | 884,685 | ||||||||||
Airlines – 0.1% |
| |||||||||||
Japan Airlines Company Ltd. | 24,940 | 796,997 | ||||||||||
Korean Air Lines Company Ltd. | 2,577 | 64,612 | ||||||||||
Singapore Airlines Ltd. | 75,908 | 520,098 | ||||||||||
| 1,381,707 | ||||||||||||
Airport Services – 0.1% |
| |||||||||||
Grupo Aeroportuario del Sureste SAB de C.V., Class B | 19,082 | 308,991 | ||||||||||
SATS Ltd. | 146,063 | 563,545 | ||||||||||
TAV Havalimanlari Holding A/S | 26,101 | 121,841 | ||||||||||
| 994,377 | ||||||||||||
Alternative Carriers – 0.0%* |
| |||||||||||
Intelsat S.A. | 27,010 | 525,344 | (a | ) | ||||||||
Aluminum – 0.0%* |
| |||||||||||
China Zhongwang Holdings Ltd. | 147,200 | 74,236 | ||||||||||
Apparel Retail – 0.2% |
| |||||||||||
ABC-Mart Inc. | 7,142 | 465,350 | ||||||||||
Hennes & Mauritz AB, Class B | 85,242 | 1,519,219 | ||||||||||
Mr Price Group Ltd. | 16,066 | 226,169 | ||||||||||
Shimamura Company Ltd. | 4,800 | 358,641 | ||||||||||
Truworths International Ltd. | 63,599 | 315,712 | ||||||||||
| 2,885,091 | ||||||||||||
Apparel, Accessories & Luxury Goods – 0.4% |
| |||||||||||
Burberry Group PLC | 89,151 | 2,112,672 | ||||||||||
FF Group | 1,860 | 1,017 | (a,d | ) | ||||||||
HUGO BOSS AG | 13,731 | 914,757 | ||||||||||
Lululemon Athletica Inc. | 19,122 | 3,445,975 | (a | ) | ||||||||
Shenzhou International Group Holdings Ltd. | 47,600 | 654,367 | ||||||||||
The Swatch Group AG | 12,098 | 655,773 | ||||||||||
| 7,784,561 | ||||||||||||
Asset Management & Custody Banks – 0.4% |
| |||||||||||
3i Group PLC | 210,857 | 2,988,163 | ||||||||||
CI Financial Corp. | 50,270 | 820,939 | ||||||||||
Hargreaves Lansdown PLC | 61,634 | 1,505,294 | ||||||||||
IGM Financial Inc. | 18,266 | 522,645 | ||||||||||
Schroders PLC | 26,922 | 1,045,041 | ||||||||||
| 6,882,082 | ||||||||||||
Auto Parts & Equipment – 0.3% |
| |||||||||||
Fuyao Glass Industry Group Company Ltd., Class H | 72,800 | �� | 225,971 | (c | ) | |||||||
Garrett Motion Inc. | 15,365 | 235,853 | (a | ) | ||||||||
Magna International Inc. | 68,753 | 3,428,311 | ||||||||||
Sumitomo Electric Industries Ltd. | 163,500 | 2,146,564 | ||||||||||
Toyoda Gosei Company Ltd. | 13,565 | 264,526 | ||||||||||
| 6,301,225 | ||||||||||||
Automobile Manufacturers – 0.3% |
| |||||||||||
Astra International Tbk PT | 301,136 | 158,801 | ||||||||||
Dongfeng Motor Group Company Ltd., Class H | 390,000 | 319,488 | ||||||||||
Ford Otomotiv Sanayi A/S | 10,085 | 108,975 | ||||||||||
Isuzu Motors Ltd. | 119,508 | 1,361,020 | ||||||||||
Kia Motors Corp. | 31,805 | 1,211,986 | ||||||||||
Mazda Motor Corp. | 123,200 | 1,285,859 | ||||||||||
Nissan Motor Company Ltd. | 42,900 | 307,236 | ||||||||||
Peugeot S.A. | 58,816 | 1,451,450 | ||||||||||
| 6,204,815 | ||||||||||||
Automotive Retail – 0.0%* |
| |||||||||||
Petrobras Distribuidora S.A. | 16,096 | 104,993 | ||||||||||
Banks – 0.0%* |
| |||||||||||
China Common Rich Renewable Energy Investments Ltd. | 64,000 | — | (a,d | ) | ||||||||
See Notes to Schedule of Investments and Notes to Financial Statements.
Table of Contents
| State Street Total Return V.I.S. Fund | ||
| Schedule of Investments | June 30, 2019 (Unaudited) |
Number of Shares | Fair Value | |||||||||||
Brewers – 0.0%* |
| |||||||||||
Cia Cervecerias Unidas S.A. | 19,668 | $ | 276,644 | |||||||||
Broadcasting – 0.1% |
| |||||||||||
ITV PLC | 785,137 | 1,079,184 | ||||||||||
Surya Citra Media Tbk PT | 801,400 | 91,329 | ||||||||||
| 1,170,513 | ||||||||||||
Cable & Satellite – 0.1% |
| |||||||||||
Cyfrowy Polsat S.A. | 17,563 | 140,157 | ||||||||||
Eutelsat Communications S.A. | 37,834 | 708,324 | ||||||||||
Megacable Holdings SAB de C.V. | 43,028 | 182,624 | ||||||||||
| 1,031,105 | ||||||||||||
Casinos & Gaming – 0.0%* |
| |||||||||||
Kangwon Land Inc. | 16,908 | 442,963 | ||||||||||
Coal & Consumable Fuels – 0.1% |
| |||||||||||
Bukit Asam Tbk PT | 413,900 | 86,721 | ||||||||||
China Shenhua Energy Company Ltd., Class H | 486,000 | 1,017,723 | ||||||||||
Washington H Soul Pattinson & Company Ltd. | 25,923 | 400,030 | ||||||||||
| 1,504,474 | ||||||||||||
Commercial Printing – 0.1% |
| |||||||||||
Dai Nippon Printing Company Ltd. | 52,700 | 1,123,067 | ||||||||||
Toppan Printing Company Ltd. | 53,100 | 805,815 | ||||||||||
| 1,928,882 | ||||||||||||
Commodity Chemicals – 0.1% |
| |||||||||||
Kaneka Corp. | 10,652 | 400,414 | ||||||||||
Kumho Petrochemical Company Ltd. | 1,095 | 92,368 | ||||||||||
Mexichem SAB de C.V. | 18,244 | 38,261 | ||||||||||
Petronas Chemicals Group Bhd | 344,900 | 701,067 | ||||||||||
Sinopec Shanghai Petrochemical Company Ltd., Class H | 217,000 | 86,105 | ||||||||||
Tosoh Corp. | 56,300 | 791,670 | ||||||||||
| 2,109,885 | ||||||||||||
Computer & Electronics Retail – 0.0%* |
| |||||||||||
Yamada Denki Company Ltd. | 136,000 | 602,116 | ||||||||||
Construction & Engineering – 0.1% |
| |||||||||||
China Communications Services Corporation Ltd., Class H | 344,000 | 266,834 | ||||||||||
China Railway Construction Corporation Ltd., Class H | 283,500 | 347,639 | ||||||||||
China Railway Group Ltd., Class H | 544,461 | 413,965 | ||||||||||
Hyundai Engineering & Construction Company Ltd. | 3,094 | 143,626 | ||||||||||
Metallurgical Corporation of China Ltd., Class H | 413,000 | 110,486 | ||||||||||
Sinopec Engineering Group Company Ltd., Class H | 189,000 | 160,151 | ||||||||||
Skanska AB, Class B | 73,715 | 1,332,371 | ||||||||||
| 2,775,072 | ||||||||||||
Construction Machinery & Heavy Trucks – 0.1% |
| |||||||||||
Hino Motors Ltd. | 62,200 | 523,625 | ||||||||||
Sinotruk Hong Kong Ltd. | 99,000 | 171,326 | ||||||||||
Weichai Power Company Ltd., Class H | 129,000 | 217,958 | ||||||||||
Yangzijiang Shipbuilding Holdings Ltd. | 516,400 | 583,977 | ||||||||||
| 1,496,886 | ||||||||||||
Construction Materials – 0.1% |
| |||||||||||
Anhui Conch Cement Company Ltd., Class H | 30,836 | 193,206 | ||||||||||
Asia Cement Corp. | 78,030 | 119,459 | ||||||||||
China Resources Cement Holdings Ltd. | 353,161 | 342,199 | ||||||||||
POSCO Chemical Company Ltd. | 3,395 | 157,599 | ||||||||||
The Siam Cement PCL | 5,646 | 86,897 | (b | ) | ||||||||
The Siam Cement PCL NVDR | 49,600 | 763,388 | ||||||||||
| 1,662,748 | ||||||||||||
Copper – 0.0%* |
| |||||||||||
Jiangxi Copper Company Ltd., Class H | 180,000 | 239,616 | ||||||||||
Data Processing & Outsourced Services – 0.1% |
| |||||||||||
EVERTEC Inc. | 29,440 | 962,688 | ||||||||||
Number of Shares | Fair Value | |||||||||||
Department Stores – 0.1% |
| |||||||||||
El Puerto de Liverpool SAB de C.V. | 26,969 | $ | 150,023 | |||||||||
Hyundai Department Store Company Ltd. | 2,018 | 144,536 | ||||||||||
Next PLC | 29,796 | 2,095,535 | ||||||||||
| 2,390,094 | ||||||||||||
Distillers & Vintners – 0.1% |
| |||||||||||
Diageo PLC | 38,896 | 1,675,180 | ||||||||||
Diversified Banks – 1.3% |
| |||||||||||
Absa Group Ltd. | 26,720 | 333,497 | ||||||||||
Agricultural Bank of China Ltd., Class H | 3,097,578 | 1,296,522 | ||||||||||
Alliance Bank Malaysia Bhd | 31,600 | 28,752 | ||||||||||
Banco de Chile | 1,874,012 | 275,740 | ||||||||||
Banco de Credito e Inversiones S.A. | 2,784 | 191,696 | ||||||||||
Banco Santander Brasil S.A. | 43,756 | 519,001 | ||||||||||
Banco Santander Mexico S.A. Institucion de Banca Multiple Grupo Financiero Santand | 124,777 | 190,754 | ||||||||||
Bancolombia S.A. | 9,769 | 117,703 | ||||||||||
Bangkok Bank PCL | 12,200 | 79,165 | ||||||||||
Bangkok Bank PCL NVDR | 23,400 | 150,316 | (b | ) | ||||||||
Bank Hapoalim BM | 231,229 | 1,715,473 | ||||||||||
Bank LeumiLe-Israel BM | 248,989 | 1,798,364 | ||||||||||
Bank of China Ltd., Class H | 205,499 | 86,803 | ||||||||||
Bank of Communications Company Ltd., Class H | 1,258,000 | 954,872 | ||||||||||
Bank Polska Kasa Opieki S.A. | 24,515 | 734,950 | ||||||||||
China CITIC Bank Corporation Ltd., Class H | 1,283,000 | 730,797 | ||||||||||
China Everbright Bank Company Ltd., Class H | 364,000 | 166,799 | ||||||||||
First Financial Holding Company Ltd. | 269,381 | 197,746 | ||||||||||
Hong Leong Financial Group Bhd | 33,000 | 148,051 | ||||||||||
Industrial & Commercial Bank of China Ltd., Class H | 946,178 | 690,332 | ||||||||||
Industrial Bank of Korea | 36,210 | 440,610 | ||||||||||
Israel Discount Bank Ltd. Class A | 126,884 | 518,344 | ||||||||||
Komercni banka A/S | 9,900 | 394,798 | ||||||||||
Krung Thai Bank PCL NVDR | 502,100 | 319,261 | (b | ) | ||||||||
MCB Bank Ltd. | 25,041 | 27,345 | ||||||||||
Mega Financial Holding Company Ltd. | 622,238 | 619,043 | ||||||||||
Mizrahi Tefahot Bank Ltd. | 30,341 | 699,879 | ||||||||||
Moneta Money Bank A/S | 69,758 | 239,158 | (c | ) | ||||||||
Nedbank Group Ltd. | 57,507 | 1,032,587 | ||||||||||
Postal Savings Bank of China Company Ltd., Class H | 411,000 | 244,101 | (c | ) | ||||||||
RHB Bank Bhd | 103,822 | 140,439 | ||||||||||
Royal Bank of Canada | 117,552 | 9,361,880 | ||||||||||
SinoPac Financial Holdings Company Ltd. | 918,106 | 385,753 | ||||||||||
Swedbank AB, Class A | 42,574 | 639,881 | ||||||||||
Taiwan Business Bank | 551,514 | 242,379 | ||||||||||
Taiwan Cooperative Financial Holding Company Ltd. | 531,739 | 356,096 | ||||||||||
The Shanghai Commercial & Savings Bank Ltd. | 44,000 | 79,615 | ||||||||||
Turkiye Halk Bankasi A/S | 81,467 | 80,847 | ||||||||||
| 26,229,349 | ||||||||||||
Diversified Capital Markets – 0.0%* |
| |||||||||||
Investec Ltd. | 41,244 | 268,676 | ||||||||||
Diversified Chemicals – 0.0%* |
| |||||||||||
Daicel Corp. | 56,900 | 505,942 | ||||||||||
Diversified Metals & Mining – 0.0%* |
| |||||||||||
Ferroglobe PLC | 1,316 | — | (a,d | ) | ||||||||
Korea Zinc Company Ltd. | 418 | 172,319 | ||||||||||
Mitsubishi Materials Corp. | 22,800 | 648,617 | ||||||||||
| 820,936 | ||||||||||||
Diversified Real Estate Activities – 0.1% |
| |||||||||||
Robinsons Land Corp. | 141,400 | 72,722 | ||||||||||
See Notes to Schedule of Investments and Notes to Financial Statements.
Table of Contents
| State Street Total Return V.I.S. Fund | ||
| Schedule of Investments | June 30, 2019 (Unaudited) |
Number of Shares | Fair Value | |||||||||||
Swire Pacific Ltd., Class A | 107,929 | $ | 1,326,231 | |||||||||
The Wharf Holdings Ltd. | 264,187 | 699,990 | ||||||||||
| 2,098,943 | ||||||||||||
Diversified REITs – 0.3% |
| |||||||||||
Fibra Uno Administracion S.A. de C.V. | 67,470 | 89,273 | ||||||||||
Growthpoint Properties Ltd. | 426,923 | 735,090 | ||||||||||
H&R Real Estate Investment Trust | 30,412 | 531,556 | ||||||||||
Mirvac Group | 793,665 | 1,743,267 | ||||||||||
Redefine Properties Ltd. | 617,203 | 395,675 | ||||||||||
The GPT Group | 391,150 | 1,688,111 | ||||||||||
| 5,182,972 | ||||||||||||
Drug Retail – 0.0%* |
| |||||||||||
Clicks Group Ltd. | 23,728 | 345,439 | ||||||||||
Electric Utilities – 0.7% |
| |||||||||||
CEZ A/S | 1,542 | 37,268 | ||||||||||
CLP Holdings Ltd. | 355,864 | 3,926,462 | ||||||||||
Emera Inc. | 12,610 | 516,366 | ||||||||||
Endesa S.A. | 68,835 | 1,772,383 | ||||||||||
HK Electric Investments & HK Electric Investments Ltd. | 574,000 | 587,776 | ||||||||||
Hydro One Ltd. | 71,013 | 1,241,199 | (c | ) | ||||||||
Inter Rao UES PJSC | 3,349,581 | 240,245 | (a | ) | ||||||||
Manila Electric Co. | 32,390 | 244,656 | ||||||||||
PGE Polska Grupa Energetyczna S.A. | 72,115 | 185,489 | (a | ) | ||||||||
Red Electrica Corporacion S.A. | 93,809 | 1,956,587 | ||||||||||
Terna Rete Elettrica Nazionale S.p.A. | 84,129 | 536,514 | ||||||||||
Tokyo Electric Power Company Holdings Inc. | 330,633 | 1,724,668 | (a | ) | ||||||||
| 12,969,613 | ||||||||||||
Electronic Components – 0.1% |
| |||||||||||
Delta Electronics Inc. | 38,865 | 197,081 | ||||||||||
Hirose Electric Company Ltd. | 6,700 | 747,485 | ||||||||||
Samsung Electro-Mechanics Company Ltd. | 2,150 | 182,107 | ||||||||||
Walsin Technology Corp. | 7,000 | 36,961 | ||||||||||
Zhen Ding Technology Holding Ltd. | 63,481 | 203,159 | ||||||||||
| 1,366,793 | ||||||||||||
Electronic Equipment & Instruments – 0.1% |
| |||||||||||
China Railway Signal & Communication Corporation Ltd. Class H | 212,000 | 154,133 | (c | ) | ||||||||
Halma PLC | 31,595 | 812,261 | ||||||||||
Hitachi High-Technologies Corp. | 6,900 | 354,799 | ||||||||||
| 1,321,193 | ||||||||||||
Electronic Manufacturing Services – 0.0%* |
| |||||||||||
Fabrinet | 17,300 | 859,291 | (a | ) | ||||||||
Fertilizers & Agricultural Chemicals – 0.0%* |
| |||||||||||
Israel Chemicals Ltd. | 91,773 | 480,923 | ||||||||||
Financial Exchanges & Data – 0.2% |
| |||||||||||
ASX Ltd. | 41,955 | 2,425,131 | ||||||||||
Singapore Exchange Ltd. | 174,149 | 1,019,446 | ||||||||||
| 3,444,577 | ||||||||||||
Food Distributors – 0.0%* |
| |||||||||||
The SPAR Group Ltd. | 19,508 | 258,465 | ||||||||||
Food Retail – 0.5% |
| |||||||||||
BIM Birlesik Magazalar A/S | 9,825 | 135,298 | ||||||||||
Casino Guichard Perrachon S.A. | 11,890 | 406,210 | ||||||||||
Colruyt S.A. | 12,436 | 722,268 | ||||||||||
ICA Gruppen AB | 19,603 | 843,431 | ||||||||||
J Sainsbury PLC | 381,716 | 951,945 | ||||||||||
Koninklijke Ahold Delhaize N.V. | 196,725 | 4,430,875 | ||||||||||
Lawson Inc. | 10,900 | 523,046 | ||||||||||
Loblaw Companies Ltd. | 25,221 | 1,294,102 | ||||||||||
Metro Inc. | 21,415 | 805,306 | ||||||||||
Pick n Pay Stores Ltd. | 8,479 | 41,489 | ||||||||||
WM Morrison Supermarkets PLC | 206,793 | 530,056 | ||||||||||
| 10,684,026 | ||||||||||||
Number of Shares | Fair Value | |||||||||||
Footwear – 0.0%* |
| |||||||||||
Pou Chen Corp. | 43,000 | $ | 53,301 | |||||||||
Yue Yuen Industrial Holdings Ltd. | 157,500 | 431,424 | ||||||||||
| 484,725 | ||||||||||||
Gas Utilities – 0.3% |
| |||||||||||
Enagas S.A. | 49,151 | 1,313,691 | ||||||||||
Osaka Gas Company Ltd. | 81,309 | 1,416,530 | ||||||||||
Petronas Gas Bhd | 59,500 | 249,950 | ||||||||||
Snam S.p.A. | 450,777 | 2,243,831 | ||||||||||
Toho Gas Company Ltd. | 16,100 | 592,505 | ||||||||||
Tokyo Gas Company Ltd. | 12,800 | 301,467 | ||||||||||
| 6,117,974 | ||||||||||||
General Merchandise Stores – 0.3% |
| |||||||||||
Harvey Norman Holdings Ltd. | 114,974 | 328,380 | ||||||||||
Wesfarmers Ltd. | 245,723 | 6,235,289 | ||||||||||
| 6,563,669 | ||||||||||||
Healthcare Distributors – 0.1% |
| |||||||||||
Alfresa Holdings Corp. | 40,781 | 1,006,088 | ||||||||||
Medipal Holdings Corp. | 39,677 | 876,105 | ||||||||||
Suzuken Company Ltd. | 15,656 | 918,377 | ||||||||||
| 2,800,570 | ||||||||||||
Healthcare Equipment – 0.0%* |
| |||||||||||
Smith & Nephew PLC | 23,891 | 518,424 | ||||||||||
Healthcare Facilities – 0.0%* |
| |||||||||||
Ryman Healthcare Ltd. | 58,190 | 459,229 | ||||||||||
Healthcare Services – 0.1% |
| |||||||||||
Sonic Healthcare Ltd. | 76,787 | 1,460,291 | ||||||||||
Highways & Railtracks – 0.0%* |
| |||||||||||
Jiangsu Expressway Company Ltd., Class H | 176,000 | 250,511 | ||||||||||
Home Building – 0.4% |
| |||||||||||
Barratt Developments PLC | 219,798 | 1,601,774 | ||||||||||
Berkeley Group Holdings PLC | 26,595 | 1,262,849 | ||||||||||
Iida Group Holdings Company Ltd. | 31,900 | 515,185 | ||||||||||
Persimmon PLC | 68,476 | 1,740,374 | ||||||||||
Sekisui House Ltd. | 134,700 | 2,219,787 | ||||||||||
Taylor Wimpey PLC | 710,045 | 1,425,546 | ||||||||||
| 8,765,515 | ||||||||||||
Home Improvement Retail – 0.0%* |
| |||||||||||
Kingfisher PLC | 253,822 | 694,211 | ||||||||||
Hotels, Resorts & Cruise Lines – 0.1% |
| |||||||||||
Whitbread PLC | 39,087 | 2,302,744 | ||||||||||
Household Appliances – 0.0%* |
| |||||||||||
Arcelik A/S | 29,130 | 97,956 | (a | ) | ||||||||
Rinnai Corp. | 7,300 | 464,127 | ||||||||||
| 562,083 | ||||||||||||
Household Products – 0.1% |
| |||||||||||
Hindustan Unilever Ltd. | 32,611 | 844,525 | ||||||||||
Unilever Indonesia Tbk PT | 47,200 | 150,345 | ||||||||||
| 994,870 | ||||||||||||
Human Resource & Employment Services – 0.1% |
| |||||||||||
Randstad N.V. | 19,707 | 1,083,965 | ||||||||||
Hypermarkets & Super Centers – 0.1% |
| |||||||||||
Atacadao S.A. | 56,998 | 327,177 | ||||||||||
Carrefour S.A. | 24,845 | 480,424 | ||||||||||
METRO AG | 39,022 | 714,345 | ||||||||||
Sun Art Retail Group Ltd. | 136,151 | 128,962 | ||||||||||
Wal-Mart de Mexico SAB de C.V. | 67,024 | 182,809 | ||||||||||
| 1,833,717 | ||||||||||||
Independent Power Producers & Energy Traders – 0.1% |
| |||||||||||
Aboitiz Power Corp. | 211,500 | 143,656 | ||||||||||
China Power International Development Ltd. | 634,000 | 155,000 | ||||||||||
China Resources Power Holdings Company Ltd. | 200,000 | 291,840 | ||||||||||
Colbun S.A. | 591,605 | 121,989 | ||||||||||
Electricity Generating PCL NVDR | 18,900 | 200,294 | (b | ) | ||||||||
See Notes to Schedule of Investments and Notes to Financial Statements.
Table of Contents
| State Street Total Return V.I.S. Fund | ||
| Schedule of Investments | June 30, 2019 (Unaudited) |
Number of Shares | Fair Value | |||||||||||
Huadian Power International Corporation Ltd., Class H | 234,000 | $ | 92,552 | |||||||||
Uniper SE | 43,620 | 1,322,831 | ||||||||||
| 2,328,162 | ||||||||||||
Industrial Conglomerates – 0.2% |
| |||||||||||
DMCI Holdings Inc. | 488,200 | 98,145 | ||||||||||
Far Eastern New Century Corp. | 461,982 | 498,282 | ||||||||||
Grupo Carso SAB de C.V., Class A1 | 38,528 | 143,510 | ||||||||||
Jardine Matheson Holdings Ltd. | 21,693 | 1,367,093 | ||||||||||
Keihan Holdings Company Ltd. | 16,500 | 719,023 | ||||||||||
NWS Holdings Ltd. | 338,071 | 694,966 | ||||||||||
Shanghai Industrial Holdings Ltd. | 70,000 | 151,782 | ||||||||||
Sime Darby Bhd | 342,062 | 187,068 | ||||||||||
Turkiye Sise ve Cam Fabrikalari A/S | 96,996 | 87,035 | ||||||||||
| 3,946,904 | ||||||||||||
Industrial Gases – 0.7% |
| |||||||||||
Air Liquide S.A. | 6,902 | 967,173 | ||||||||||
Air Water Inc. | 32,300 | 552,824 | ||||||||||
Linde PLC | 63,734 | 12,797,787 | ||||||||||
| 14,317,784 | ||||||||||||
Industrial Machinery – 0.7% |
| |||||||||||
Amada Holdings Company Ltd. | 73,700 | 829,758 | ||||||||||
Atlas Copco AB, Class B | 84,568 | 2,428,156 | ||||||||||
JTEKT Corp. | 44,600 | 540,631 | ||||||||||
Kone Oyj, Class B | 73,446 | 4,340,933 | ||||||||||
Kurita Water Industries Ltd. | 21,400 | 531,326 | ||||||||||
Mitsubishi Heavy Industries Ltd. | 33,400 | 1,454,236 | ||||||||||
Schindler Holding AG | 8,824 | 1,966,621 | ||||||||||
Schindler Holding AG | 4,361 | 953,605 | ||||||||||
Sumitomo Heavy Industries Ltd. | 23,900 | 821,881 | ||||||||||
| 13,867,147 | ||||||||||||
Industrial REITs – 0.2% |
| |||||||||||
Goodman Group | 168,103 | 1,773,033 | ||||||||||
Segro PLC | 234,872 | 2,182,726 | ||||||||||
| 3,955,759 | ||||||||||||
Integrated Oil & Gas – 0.7% |
| |||||||||||
China Petroleum & Chemical Corp., Class H | 1,714,125 | 1,165,056 | ||||||||||
Gazprom PJSC ADR | 394,543 | 2,890,422 | (b | ) | ||||||||
Imperial Oil Ltd. | 8,597 | 238,552 | ||||||||||
LUKOIL PJSC ADR | 13,994 | 1,175,776 | (b | ) | ||||||||
LUKOIL PJSC ADR | 3,661 | 309,062 | ||||||||||
MOL Hungarian Oil & Gas PLC | 37,008 | 411,556 | ||||||||||
Oil & Natural Gas Corporation Ltd. | 130,018 | 315,969 | ||||||||||
PetroChina Company Ltd., Class H | 260,768 | 143,860 | ||||||||||
Polskie Gornictwo Naftowe i Gazownictwo S.A. | 249,099 | 354,692 | ||||||||||
Royal Dutch Shell PLC, Class B | 63,074 | 2,071,879 | ||||||||||
Total S.A. | 91,415 | 5,129,697 | ||||||||||
| 14,206,521 | ||||||||||||
Integrated Telecommunication Services – 1.0% |
| |||||||||||
BCE Inc. | 33,070 | 1,507,795 | ||||||||||
China Telecom Corporation Ltd., Class H | 1,995,047 | 1,003,588 | ||||||||||
Chunghwa Telecom Company Ltd. | 470,000 | 1,709,944 | ||||||||||
Elisa Oyj | 3,494 | 170,738 | ||||||||||
HKT Trust & HKT Ltd. | 819,527 | 1,300,753 | ||||||||||
LG Uplus Corp. | 15,685 | 196,971 | ||||||||||
PCCW Ltd. | 920,527 | 531,402 | ||||||||||
Proximus SADP | 32,965 | 973,051 | ||||||||||
Spark New Zealand Ltd. | 397,934 | 1,069,089 | ||||||||||
Swisscom AG | 5,613 | 2,821,468 | ||||||||||
Telenor ASA | 82,087 | 1,743,592 | ||||||||||
Telia Company AB | 334,246 | 1,485,666 | ||||||||||
Telkom S.A. SOC Ltd. | 40,397 | 264,104 | ||||||||||
Telstra Corporation Ltd. | 902,118 | 2,437,286 | ||||||||||
TELUS Corp. | 42,788 | 1,585,129 | ||||||||||
| 18,800,576 | ||||||||||||
Interactive Home Entertainment – 0.0%* |
| |||||||||||
CD Projekt S.A. | 1,064 | 61,428 | ||||||||||
Number of Shares | Fair Value | |||||||||||
Interactive Media & Services – 0.1% |
| |||||||||||
Tencent Holdings Ltd. | 48,963 | $ | 2,209,837 | |||||||||
Internet & Direct Marketing Retail – 0.1% |
| |||||||||||
Alibaba Group Holding Ltd. ADR | 9,694 | 1,642,648 | (a,b | ) | ||||||||
CJ ENM Company Ltd. | 187 | 28,666 | ||||||||||
Naspers Ltd., Class N | 1,448 | 351,137 | ||||||||||
| 2,022,451 | ||||||||||||
Investment Banking & Brokerage – 0.0%* |
| |||||||||||
Guotai Junan Securities Company Ltd., Class H | 51,600 | 91,939 | (c | ) | ||||||||
IT Consulting & Other Services – 0.9% |
| |||||||||||
Accenture PLC, Class A | 80,180 | 14,814,859 | ||||||||||
HCL Technologies Ltd. | 14,134 | 217,997 | ||||||||||
Infosys Ltd. | 90,265 | 957,212 | ||||||||||
Itochu Techno-Solutions Corp. | 20,800 | 533,224 | ||||||||||
Tata Consultancy Services Ltd. | 18,374 | 592,844 | ||||||||||
Tech Mahindra Ltd. | 34,091 | 348,973 | ||||||||||
Wipro Ltd. | 185,346 | 753,172 | ||||||||||
| 18,218,281 | ||||||||||||
Leisure Products – 0.0%* |
| |||||||||||
Sankyo Company Ltd. | 9,700 | 351,123 | ||||||||||
Life & Health Insurance – 0.6% |
| |||||||||||
CNP Assurances | 37,200 | 845,573 | ||||||||||
Great-West Lifeco Inc. | 60,320 | 1,391,734 | ||||||||||
Hanwha Life Insurance Company Ltd. | 9,567 | 27,135 | ||||||||||
Liberty Holdings Ltd. | 18,507 | 138,672 | ||||||||||
MMI Holdings Ltd. | 129,110 | 173,688 | ||||||||||
Poste Italiane S.p.A. | 113,223 | 1,193,970 | (c | ) | ||||||||
Power Corporation of Canada | 65,219 | 1,407,942 | ||||||||||
Power Financial Corp. | 57,485 | 1,325,003 | ||||||||||
Sony Financial Holdings Inc. | 33,000 | 792,686 | ||||||||||
Sun Life Financial Inc. | 28,885 | 1,198,725 | ||||||||||
Swiss Life Holding AG | 7,417 | 3,680,353 | ||||||||||
| 12,175,481 | ||||||||||||
Life Sciences Tools & Services – 0.1% |
| |||||||||||
Divi’s Laboratories Ltd. | 11,444 | 264,757 | ||||||||||
Sartorius Stedim Biotech | 5,994 | 946,762 | ||||||||||
| 1,211,519 | ||||||||||||
Marine – 0.1% |
| |||||||||||
COSCO SHIPPING Energy Transportation Company Ltd., Class H | 176,000 | 104,080 | ||||||||||
Costamare Inc. | 23,487 | 120,488 | ||||||||||
Kuehne + Nagel International AG | 11,703 | 1,739,246 | ||||||||||
MISC Bhd | 97,000 | 167,828 | ||||||||||
| 2,131,642 | ||||||||||||
Marine Ports & Services – 0.0%* |
| |||||||||||
COSCO SHIPPING Ports Ltd. | 244,746 | 241,535 | ||||||||||
Kamigumi Company Ltd. | 23,301 | 551,490 | ||||||||||
| 793,025 | ||||||||||||
Metal & Glass Containers – 0.0%* |
| |||||||||||
Toyo Seikan Group Holdings Ltd. | 30,100 | 597,306 | ||||||||||
Motorcycle Manufacturers – 0.0%* |
| |||||||||||
Bajaj Auto Ltd. | 7,547 | 309,090 | ||||||||||
Hero MotoCorp Ltd. | 3,531 | 132,053 | ||||||||||
| 441,143 | ||||||||||||
Movies & Entertainment – 0.1% |
| |||||||||||
Toho Company Ltd. | 24,600 | 1,045,740 | ||||||||||
Multi-Line Insurance – 1.4% |
| |||||||||||
Allianz SE | 33,727 | 8,142,564 | ||||||||||
Assicurazioni Generali S.p.A. | 237,279 | 4,474,734 | ||||||||||
Baloise Holding AG | 10,576 | 1,874,393 | ||||||||||
BB Seguridade Participacoes S.A. | 100,592 | 849,848 | ||||||||||
Gjensidige Forsikring ASA | 43,344 | 873,382 | ||||||||||
Mapfre S.A. | 233,587 | 683,909 | ||||||||||
Porto Seguro S.A. | 13,919 | 187,686 | ||||||||||
Sampo Oyj, Class A | 27,369 | 1,293,465 | ||||||||||
See Notes to Schedule of Investments and Notes to Financial Statements.
Table of Contents
| State Street Total Return V.I.S. Fund | ||
| Schedule of Investments | June 30, 2019 (Unaudited) |
Number of Shares | Fair Value | |||||||||||
Sul America S.A. | 29,441 | $ | 288,215 | |||||||||
Zurich Insurance Group AG | 25,594 | 8,922,462 | ||||||||||
| 27,590,658 | ||||||||||||
Multi-Sector Holdings – 0.3% |
| |||||||||||
EXOR N.V. | 23,503 | 1,648,738 | ||||||||||
Groupe Bruxelles Lambert S.A. | 17,484 | 1,717,903 | ||||||||||
Industrivarden AB, Class C | 36,197 | 802,886 | ||||||||||
L E Lundbergforetagen AB, Class B | 11,859 | 444,287 | ||||||||||
Pargesa Holding S.A. | 8,367 | 645,761 | ||||||||||
| 5,259,575 | ||||||||||||
Multi-Utilities – 0.1% |
| |||||||||||
AGL Energy Ltd. | 142,033 | 1,994,430 | ||||||||||
Office REITs – 0.1% |
| |||||||||||
Dexus | 220,444 | 2,007,961 | ||||||||||
Japan Prime Realty Investment Corp. | 170 | 736,867 | ||||||||||
| 2,744,828 | ||||||||||||
Office Services & Supplies – 0.0%* |
| |||||||||||
Societe BIC S.A. | 5,556 | 424,237 | ||||||||||
Oil & Gas Exploration & Production – 0.0%* |
| |||||||||||
Oil & Gas Development Company Ltd. | 66,680 | 54,884 | ||||||||||
Tatneft PJSC ADR | 3,865 | 285,237 | (b | ) | ||||||||
| 340,121 | ||||||||||||
Oil & Gas Refining & Marketing – 0.2% |
| |||||||||||
Caltex Australia Ltd. | 54,079 | 939,261 | ||||||||||
Cosan S.A. | 23,473 | 282,645 | ||||||||||
Grupa Lotos S.A. | 5,125 | 116,402 | ||||||||||
Idemitsu Kosan Company Ltd. | 12,600 | 378,912 | ||||||||||
JXTG Holdings Inc. | 249,509 | 1,237,587 | ||||||||||
Tupras Turkiye Petrol Rafinerileri A/S | 6,467 | 128,580 | ||||||||||
| 3,083,387 | ||||||||||||
Oil & Gas Storage & Transportation – 0.0%* |
| |||||||||||
Ship Finance International Ltd. | 39,445 | 493,457 | ||||||||||
Teekay Tankers Ltd., Class A | 89,400 | 114,432 | (a | ) | ||||||||
| 607,889 | ||||||||||||
Other Diversified Financial Services – 0.0%* |
| |||||||||||
RMB Holdings Ltd. | 101,429 | 607,081 | ||||||||||
Packaged Foods & Meats – 0.3% |
| |||||||||||
China Huishan Dairy Holdings Company Ltd. | 55,000 | — | (a,d | ) | ||||||||
Chocoladefabriken Lindt & Spruengli AG | 233 | 1,697,913 | ||||||||||
Mowi ASA | 32,695 | 764,834 | (a | ) | ||||||||
Nestle Malaysia Bhd | 3,600 | 129,887 | ||||||||||
NH Foods Ltd. | 18,600 | 796,724 | ||||||||||
Nisshin Seifun Group Inc. | 42,899 | 979,104 | ||||||||||
PPB Group Bhd | 54,260 | 245,532 | ||||||||||
QL Resources Bhd | 93,300 | 154,428 | ||||||||||
Toyo Suisan Kaisha Ltd. | 19,200 | 791,238 | ||||||||||
Uni-President China Holdings Ltd. | 79,000 | 87,974 | ||||||||||
Yihai International Holding Ltd. | 60,649 | 314,793 | (a | ) | ||||||||
| 5,962,427 | ||||||||||||
Personal Products – 0.5% |
| |||||||||||
Dabur India Ltd. | 13,072 | 75,844 | ||||||||||
L’Oreal S.A. | 29,971 | 8,549,812 | ||||||||||
Marico Ltd. | 59,369 | 318,702 | ||||||||||
| 8,944,358 | ||||||||||||
Pharmaceuticals – 0.6% |
| |||||||||||
Astellas Pharma Inc. | 81,199 | 1,156,863 | ||||||||||
China Traditional Chinese Medicine Holdings Company Ltd. | 164,000 | 79,770 | ||||||||||
Kalbe Farma Tbk PT | 2,065,100 | 213,417 | ||||||||||
Novo Nordisk A/S, Class B | 47,563 | 2,427,498 | ||||||||||
Orion Oyj, Class B | 19,260 | 706,910 | ||||||||||
Roche Holding AG | 24,756 | 6,973,575 | ||||||||||
SSY Group Ltd. | 218,000 | 197,002 | ||||||||||
Tong Ren Tang Technologies Company Ltd., Class H | 22,000 | 26,217 | ||||||||||
| 11,781,252 | ||||||||||||
Number of Shares | Fair Value | |||||||||||
Property & Casualty Insurance – 0.4% |
| |||||||||||
Admiral Group PLC | 40,894 | $ | 1,149,171 | |||||||||
DB Insurance Company Ltd. | 6,116 | 314,103 | ||||||||||
Direct Line Insurance Group PLC | 297,985 | 1,258,337 | ||||||||||
Hyundai Marine & Fire Insurance Company Ltd. | 8,992 | 221,558 | ||||||||||
Intact Financial Corp. | 30,226 | 2,799,273 | ||||||||||
Samsung Fire & Marine Insurance Company Ltd. | 4,425 | 1,027,065 | ||||||||||
Tryg A/S | 26,193 | 852,851 | ||||||||||
| 7,622,358 | ||||||||||||
Publishing – 0.0%* |
| |||||||||||
Singapore Press Holdings Ltd. | 346,942 | 625,698 | ||||||||||
Real Estate Development – 0.2% |
| |||||||||||
China Overseas Land & Investment Ltd. | 72,000 | 265,421 | ||||||||||
China Resources Land Ltd. | 100,077 | 440,659 | ||||||||||
China Vanke Company Ltd., Class H | 10,145 | 38,048 | ||||||||||
Land & Houses PCL NVDR | 429,300 | 155,383 | (b | ) | ||||||||
Longfor Group Holdings Ltd. | 213,000 | 802,925 | ||||||||||
Shimao Property Holdings Ltd. | 166,000 | 505,702 | ||||||||||
Sino Land Company Ltd. | 569,190 | 954,418 | ||||||||||
Yuexiu Property Company Ltd. | 164,000 | 37,156 | ||||||||||
Yuzhou Properties Company Ltd. | 234,000 | 109,924 | ||||||||||
| 3,309,636 | ||||||||||||
Real Estate Operating Companies – 0.2% |
| |||||||||||
Aroundtown S.A. | 169,947 | 1,402,360 | ||||||||||
First Capital Realty Inc. | 37,904 | 634,078 | ||||||||||
Hysan Development Company Ltd. | 136,436 | 704,665 | ||||||||||
Multiplan Empreendimentos Imobiliarios S.A. | 10,783 | 78,101 | ||||||||||
Swire Properties Ltd. | 253,627 | 1,024,247 | ||||||||||
Swiss Prime Site AG | 2,200 | 192,359 | (a | ) | ||||||||
| 4,035,810 | ||||||||||||
Regional Banks – 0.1% |
| |||||||||||
Bendigo & Adelaide Bank Ltd. | 105,970 | 861,140 | ||||||||||
DGB Financial Group Inc. | 17,446 | 123,141 | ||||||||||
Popular Inc. | 19,791 | 1,073,464 | ||||||||||
| 2,057,745 | ||||||||||||
Reinsurance – 0.6% |
| |||||||||||
China Reinsurance Group Corp., Class H | 816,000 | 145,183 | ||||||||||
Hannover Rueck SE | 13,068 | 2,116,198 | ||||||||||
IRB Brasil Resseguros S.A. | 20,191 | 518,913 | ||||||||||
Muenchener Rueckversicherungs-Gesellschaft AG | 29,591 | 7,437,202 | ||||||||||
SCOR SE | 35,333 | 1,551,548 | ||||||||||
| 11,769,044 | ||||||||||||
Renewable Electricity – 0.1% |
| |||||||||||
Engie Brasil Energia S.A. | 29,294 | 332,253 | ||||||||||
Meridian Energy Ltd. | 277,722 | 886,027 | ||||||||||
| 1,218,280 | ||||||||||||
Research & Consulting Services – 0.1% |
| |||||||||||
Thomson Reuters Corp. | 43,427 | 2,807,509 | ||||||||||
Restaurants – 0.0%* |
| |||||||||||
Jollibee Foods Corp. | 23,530 | 129,418 | ||||||||||
Retail REITs – 0.5% |
| |||||||||||
CapitaLand Mall Trust | 559,353 | 1,087,327 | ||||||||||
Hyprop Investments Ltd. | 13,164 | 65,226 | ||||||||||
Japan Retail Fund Investment Corp. | 567 | 1,147,262 | ||||||||||
Link REIT | 434,279 | 5,336,420 | ||||||||||
RioCan Real Estate Investment Trust | 32,540 | 647,189 | ||||||||||
SmartCentres Real Estate Investment Trust | 14,460 | 367,489 | ||||||||||
Vicinity Centres | 706,659 | 1,214,950 | ||||||||||
| 9,865,863 | ||||||||||||
See Notes to Schedule of Investments and Notes to Financial Statements.
Table of Contents
| State Street Total Return V.I.S. Fund | ||
| Schedule of Investments | June 30, 2019 (Unaudited) |
Number of Shares | Fair Value | |||||||||||||
Security & Alarm Services – 0.2% |
| |||||||||||||
Secom Company Ltd. | 45,500 | $ | 3,916,531 | |||||||||||
Securitas AB, Class B | 9,520 | 167,145 | ||||||||||||
| 4,083,676 | ||||||||||||||
Semiconductor Equipment – 0.0%* |
| |||||||||||||
Xinyi Solar Holdings Ltd. | 196,000 | 96,589 | ||||||||||||
Semiconductors – 0.2% |
| |||||||||||||
Hua Hong Semiconductor Ltd. | 64,000 | 123,863 | (c | ) | ||||||||||
Novatek Microelectronics Corp. | 83,000 | 462,306 | ||||||||||||
Realtek Semiconductor Corp. | 65,770 | 483,860 | ||||||||||||
SK Hynix Inc. | 5,357 | 322,445 | ||||||||||||
Taiwan Semiconductor Manufacturing Company Ltd. | 157,811 | 1,214,341 | ||||||||||||
Vanguard International Semiconductor Corp. | 129,000 | 270,797 | ||||||||||||
| 2,877,612 | ||||||||||||||
Soft Drinks – 0.0%* |
| |||||||||||||
Fraser & Neave Holdings Bhd | 18,400 | 153,879 | ||||||||||||
Specialty Chemicals – 0.5% |
| |||||||||||||
Croda International PLC | 27,849 | 1,814,704 | ||||||||||||
Evonik Industries AG | 35,346 | 1,030,855 | ||||||||||||
Givaudan S.A. | 1,317 | 3,722,720 | ||||||||||||
Hitachi Chemical Company Ltd. | 21,600 | 586,612 | ||||||||||||
Johnson Matthey PLC | 41,941 | 1,776,964 | ||||||||||||
| 8,931,855 | ||||||||||||||
Specialty Stores – 0.0%* |
| |||||||||||||
JUMBO S.A. | 11,908 | 230,534 | ||||||||||||
Steel – 0.1% |
| |||||||||||||
Angang Steel Company Ltd., Class H | 154,800 | 70,539 | ||||||||||||
China Oriental Group Company Ltd. | 160,000 | 93,594 | ||||||||||||
Hitachi Metals Ltd. | 46,500 | 525,251 | ||||||||||||
Maanshan Iron & Steel Company Ltd., Class H | 250,000 | 99,200 | ||||||||||||
Maruichi Steel Tube Ltd. | 12,242 | 340,081 | ||||||||||||
Severstal PJSC GDR | 9,891 | 166,663 | ||||||||||||
| 1,295,328 | ||||||||||||||
Systems Software – 0.0%* |
| |||||||||||||
Oracle Corporation Japan | 8,300 | 606,284 | ||||||||||||
Technology Distributors – 0.0%* |
| |||||||||||||
Synnex Technology International Corp. | 203,400 | 255,400 | ||||||||||||
WPG Holdings Ltd. | 216,920 | 281,805 | ||||||||||||
| 537,205 | ||||||||||||||
Technology Hardware, Storage & Peripherals – 0.4% |
| |||||||||||||
Asustek Computer Inc. | 94,105 | 675,652 | ||||||||||||
Canon Inc. | 28,200 | 823,438 | ||||||||||||
Chicony Electronics Company Ltd. | 84,647 | 208,214 | ||||||||||||
FUJIFILM Holdings Corp. | 78,000 | 3,955,021 | ||||||||||||
Inventec Corp. | 361,000 | 287,085 | ||||||||||||
Konica Minolta Inc. | 20,800 | 202,517 | ||||||||||||
Lite-On Technology Corp. | 239,669 | 351,099 | ||||||||||||
Quanta Computer Inc. | 379,000 | 737,024 | ||||||||||||
Samsung Electronics Company Ltd. | 29,144 | 1,186,306 | ||||||||||||
Wistron Corp. | 384,939 | 299,925 | ||||||||||||
| 8,726,281 | ||||||||||||||
Textiles – 0.0%* |
| |||||||||||||
Formosa Taffeta Company Ltd. | 121,000 | 152,324 | ||||||||||||
Ruentex Industries Ltd. | 51,187 | 124,426 | ||||||||||||
| 276,750 | ||||||||||||||
Tires & Rubber – 0.3% |
| |||||||||||||
Bridgestone Corp. | 123,700 | 4,870,386 | ||||||||||||
Hankook Tire & Technology Company Ltd. | 1,193 | 36,266 | ||||||||||||
Sumitomo Rubber Industries Ltd. | 37,000 | 427,900 | ||||||||||||
The Yokohama Rubber Company Ltd. | 25,700 | 472,304 | ||||||||||||
| 5,806,856 | ||||||||||||||
Tobacco – 0.1% |
| |||||||||||||
British American Tobacco Malaysia Bhd | 7,600 | 52,966 | ||||||||||||
Gudang Garam Tbk PT | 5,554 | 30,222 | ||||||||||||
Number of Shares | Fair Value | |||||||||||||
Hanjaya Mandala Sampoerna Tbk PT | 422,228 | $ | 93,845 | |||||||||||
ITC Ltd. | 61,774 | 245,073 | ||||||||||||
Swedish Match AB | 38,132 | 1,611,061 | ||||||||||||
| 2,033,167 | ||||||||||||||
Trading Companies & Distributors – 0.5% |
| |||||||||||||
AerCap Holdings N.V. | 27,070 | 1,407,911 | (a | ) | ||||||||||
BOC Aviation Ltd. | 29,900 | 251,064 | (c | ) | ||||||||||
Bunzl PLC | 72,906 | 1,927,196 | ||||||||||||
Ferguson PLC | 50,246 | 3,581,093 | (a | ) | ||||||||||
Marubeni Corp. | 338,907 | 2,242,813 | ||||||||||||
Posco International Corp. | 7,091 | 112,692 | ||||||||||||
| 9,522,769 | ||||||||||||||
Trucking – 0.1% |
| |||||||||||||
ComfortDelGro Corporation Ltd. | 469,264 | 922,608 | ||||||||||||
Water Utilities – 0.0%* |
| |||||||||||||
Aguas Andinas S.A., Class A | 375,764 | 221,379 | ||||||||||||
Guangdong Investment Ltd. | 160,000 | 316,621 | ||||||||||||
| 538,000 | ||||||||||||||
Wireless Telecommunication Services – 0.2% |
| |||||||||||||
China Mobile Ltd. | 132,062 | 1,202,715 | ||||||||||||
KDDI Corp. | 11,100 | 282,651 | ||||||||||||
SK Telecom Company Ltd. | 1,034 | 231,937 | ||||||||||||
Taiwan Mobile Company Ltd. | 222,762 | 878,583 | ||||||||||||
Vodacom Group Ltd. | 89,191 | 756,918 | ||||||||||||
| 3,352,804 | ||||||||||||||
Total Common Stock |
| 438,619,675 | ||||||||||||
Preferred Stock – 0.2% |
| |||||||||||||
Automobile Manufacturers – 0.0%* |
| |||||||||||||
Bayerische Motoren Werke AG | 12,050 | 749,251 | ||||||||||||
Hyundai Motor Co. | 3,052 | 228,110 | (b | ) | ||||||||||
Hyundai Motor Co. | 3,325 | 227,781 | (b | ) | ||||||||||
| 1,205,142 | ||||||||||||||
Commodity Chemicals – 0.0%* |
| |||||||||||||
FUCHS PETROLUB SE | 15,052 | 592,744 | (b | ) | ||||||||||
LG Chem Ltd. | 653 | 110,563 | (b | ) | ||||||||||
| 703,307 | ||||||||||||||
Diversified Banks – 0.1% |
| |||||||||||||
Grupo Aval Acciones y Valores S.A. | 562,021 | 225,194 | (b | ) | ||||||||||
Itausa - Investimentos Itau S.A. | 369,265 | 1,241,915 | (b | ) | ||||||||||
| 1,467,109 | ||||||||||||||
Integrated Telecommunication Services – 0.0%* |
| |||||||||||||
Telefonica Brasil S.A. | 3,211 | 41,815 | (b | ) | ||||||||||
Technology Hardware, Storage & Peripherals – 0.1% |
| |||||||||||||
Samsung Electronics Company Ltd. | 46,440 | 1,538,414 | (b | ) | ||||||||||
Total Preferred Stock |
| 4,955,787 | ||||||||||||
Total Foreign Equity |
| 443,575,462 | ||||||||||||
Principal Amount | Fair Value | |||||||||||||
Bonds and Notes – 28.7% |
| |||||||||||||
U.S. Treasuries – 13.9% |
| |||||||||||||
U.S. Treasury Bonds |
| |||||||||||||
2.25% | 08/15/46 | $ | 1,000,000 | 944,688 | ||||||||||
2.50% | 02/15/45 - 05/15/46 | 3,110,000 | 3,094,744 | |||||||||||
2.75% | 11/15/42 - 11/15/47 | 2,150,000 | 2,246,828 | |||||||||||
2.88% | 05/15/43 - 05/15/49 | 2,100,000 | 2,247,172 | |||||||||||
3.00% | 05/15/42 - 02/15/49 | 7,950,000 | 8,707,936 | |||||||||||
3.13% | 08/15/44 - 05/15/48 | 2,000,000 | 2,238,469 | |||||||||||
3.38% | 05/15/44 - 11/15/48 | 2,600,000 | 3,039,687 | |||||||||||
3.63% | 08/15/43 - 02/15/44 | 1,740,000 | 2,101,785 | |||||||||||
3.75% | 11/15/43 | 1,400,000 | 1,723,531 | |||||||||||
4.25% | 05/15/39 - 11/15/40 | 900,000 | 1,177,953 | |||||||||||
See Notes to Schedule of Investments and Notes to Financial Statements.
Table of Contents
| State Street Total Return V.I.S. Fund | ||
| Schedule of Investments | June 30, 2019 (Unaudited) |
Principal Amount | Fair Value | |||||||||||||
4.38% | 02/15/38 - 05/15/40 | $ | 2,000,000 | $ | 2,650,172 | |||||||||
4.50% | 02/15/36 | 1,700,000 | 2,242,672 | |||||||||||
4.63% | 02/15/40 | 500,000 | 686,406 | |||||||||||
5.25% | 02/15/29 | 200,000 | 256,813 | |||||||||||
5.50% | 08/15/28 | 200,000 | 258,719 | |||||||||||
6.00% | 02/15/26 | 827,000 | 1,039,306 | |||||||||||
6.38% | 08/15/27 | 200,000 | 266,594 | |||||||||||
7.63% | 11/15/22 - 02/15/25 | 500,000 | 619,219 | |||||||||||
7.88% | 02/15/21 | 1,000,000 | 1,095,859 | |||||||||||
U.S. Treasury Inflation Indexed Bonds |
| |||||||||||||
0.63% | 02/15/43 | 1,333,572 | 1,294,292 | |||||||||||
0.75% | 02/15/42 - 02/15/45 | 3,697,119 | 3,687,735 | |||||||||||
0.88% | 02/15/47 | 1,005,537 | 1,025,644 | |||||||||||
1.00% | 02/15/46 - 02/15/49 | 3,882,456 | 4,084,096 | |||||||||||
1.38% | 02/15/44 | 2,082,970 | 2,366,331 | |||||||||||
1.75% | 01/15/28 | 975,688 | 1,094,555 | |||||||||||
2.00% | 01/15/26 | 643,660 | 716,579 | |||||||||||
2.13% | 02/15/40 - 02/15/41 | 1,109,933 | 1,430,419 | |||||||||||
2.38% | 01/15/25 - 01/15/27 | 3,808,495 | 4,305,155 | |||||||||||
2.50% | 01/15/29 | 1,547,065 | 1,861,968 | |||||||||||
3.38% | 04/15/32 | 575,780 | 789,741 | |||||||||||
3.63% | 04/15/28 | 600,294 | 771,104 | |||||||||||
3.88% | 04/15/29 | 2,331,330 | 3,123,251 | |||||||||||
U.S. Treasury Inflation Indexed Notes |
| |||||||||||||
0.13% | 04/15/21 - 07/15/26 | 27,272,454 | 27,133,390 | |||||||||||
0.25% | 01/15/25 | 5,285,826 | 5,294,017 | |||||||||||
0.38% | 07/15/23 - 07/15/27 | 13,105,948 | 13,223,115 | |||||||||||
0.50% | 04/15/24 - 01/15/28 | 4,162,095 | 4,226,048 | |||||||||||
0.63% | 07/15/21 - 01/15/26 | 9,790,284 | 9,919,723 | |||||||||||
0.75% | 07/15/28 | 3,852,638 | 4,015,873 | |||||||||||
0.88% | 01/15/29 | 2,630,888 | 2,770,546 | |||||||||||
1.13% | 01/15/21 | 3,504,000 | 3,532,051 | |||||||||||
1.25% | 07/15/20 | 1,171,570 | 1,179,446 | |||||||||||
U.S. Treasury Notes |
| |||||||||||||
1.13% | 06/30/21 - 09/30/21 | 3,200,000 | 3,158,669 | |||||||||||
1.25% | 10/31/21 | 1,000,000 | 988,906 | |||||||||||
1.38% | 08/31/20 - 05/31/21 | 4,400,000 | 4,370,946 | |||||||||||
1.50% | 01/31/22 - 08/15/26 | 2,900,000 | 2,854,835 | |||||||||||
1.63% | 07/31/20 - 05/15/26 | 8,540,000 | 8,475,417 | |||||||||||
1.75% | 10/31/20 - 05/15/23 | 11,600,000 | 11,598,155 | |||||||||||
1.75% | 06/30/24 | 600,000 | 599,813 | (e | ) | |||||||||
1.88% | 12/15/20 - 09/30/22 | 14,600,000 | 14,660,617 | |||||||||||
2.00% | 07/31/20 - 11/15/26 | 12,744,000 | 12,847,877 | |||||||||||
2.13% | 08/31/20 - 05/31/26 | 12,700,000 | 12,846,625 | |||||||||||
2.25% | 03/31/21 - 11/15/27 | 11,890,000 | 12,133,979 | |||||||||||
2.38% | 01/31/23 - 05/15/29 | 5,400,000 | 5,554,938 | |||||||||||
2.50% | 03/31/23 - 01/31/25 | 8,000,000 | 8,250,743 | |||||||||||
2.63% | 07/31/20 - 02/15/29 | 11,885,000 | 12,271,231 | |||||||||||
2.75% | 09/30/20 - 02/15/28 | 14,400,000 | 14,974,742 | |||||||||||
2.88% | 10/15/21 - 08/15/28 | 9,700,000 | 10,205,687 | |||||||||||
3.00% | 10/31/25 | 500,000 | 534,414 | |||||||||||
3.13% | 05/15/21 - 11/15/28 | 2,300,000 | 2,486,660 | |||||||||||
3.63% | 02/15/21 | 700,000 | 720,098 | |||||||||||
| 274,017,984 | ||||||||||||||
Agency Mortgage Backed – 6.8% |
| |||||||||||||
Federal Home Loan Banks |
| |||||||||||||
1.88% | 07/07/21 | 925,000 | 925,610 | |||||||||||
2.50% | 02/13/24 | 440,000 | 452,857 | |||||||||||
3.25% | 11/16/28 | 125,000 | 135,855 | |||||||||||
Federal Home Loan Mortgage Corp. |
| |||||||||||||
1.13% | 08/12/21 | 637,000 | 627,961 | |||||||||||
2.38% | 01/13/22 | 1,100,000 | 1,115,785 | |||||||||||
2.50% | 01/01/28 - 02/01/32 | 2,031,255 | 2,049,964 | |||||||||||
2.51% | 11/25/22 | 300,000 | 303,968 | (b | ) | |||||||||
2.89% | 04/16/24 | 1,000,000 | 1,002,270 | |||||||||||
3.00% | 05/01/30 - 03/01/48 | 10,593,889 | 10,790,741 | |||||||||||
3.50% | 03/01/26 - 04/01/48 | 9,179,427 | 9,483,491 | |||||||||||
4.00% | 06/01/42 - 03/01/49 | 5,817,232 | 6,079,807 | |||||||||||
4.50% | 05/01/42 - 03/01/49 | 1,786,540 | 1,871,957 | |||||||||||
5.00% | 06/01/41 | 1,325,803 | 1,453,747 | |||||||||||
5.50% | 01/01/38 - 04/01/39 | 315,034 | 344,888 | |||||||||||
6.00% | 06/01/37 - 11/01/37 | 306,884 | 352,698 | |||||||||||
6.25% | 07/15/32 | 250,000 | 358,855 | |||||||||||
Principal Amount | Fair Value | |||||||||||||
Federal National Mortgage Assoc. |
| |||||||||||||
1.50% | 07/30/20 | $ | 500,000 | $ | 497,485 | |||||||||
1.88% | 09/24/26 | 1,000,000 | 990,400 | |||||||||||
2.13% | 04/24/26 | 700,000 | 703,577 | |||||||||||
2.25% | 04/12/22 | 425,000 | 430,295 | |||||||||||
2.50% | 09/01/28 - 10/01/31 | 1,888,018 | 1,905,020 | |||||||||||
2.63% | 01/11/22 | 1,500,000 | 1,530,990 | |||||||||||
3.00% | 01/01/28 - 05/01/47 | 11,611,977 | 11,832,179 | |||||||||||
3.50% | 01/01/27 - 09/01/48 | 16,251,989 | 16,767,702 | |||||||||||
4.00% | 10/01/41 - 03/01/49 | 11,222,655 | 11,756,490 | |||||||||||
4.50% | 01/01/27 - 04/01/49 | 5,438,969 | 5,785,322 | |||||||||||
5.00% | 12/01/39 - 05/01/41 | 261,783 | 281,835 | |||||||||||
5.50% | 12/01/35 - 04/01/38 | 1,108,220 | 1,207,052 | |||||||||||
6.00% | 03/01/34 - 08/01/37 | 1,473,552 | 1,684,359 | |||||||||||
6.63% | 11/15/30 | 100,000 | 142,959 | |||||||||||
3.50% | TBA | 1,800,000 | 1,841,954 | (e | ) | |||||||||
4.00% | TBA | 2,100,000 | 2,170,287 | (e | ) | |||||||||
4.50% | TBA | 500,000 | 522,390 | (e | ) | |||||||||
Government National Mortgage Assoc. |
| |||||||||||||
2.50% | 05/20/45 | 234,559 | 236,350 | |||||||||||
3.00% | 10/15/42 - 02/20/47 | 7,800,360 | 7,990,197 | |||||||||||
3.50% | 03/20/45 - 08/20/48 | 11,603,105 | 12,024,489 | |||||||||||
4.00% | 12/20/40 - 01/20/49 | 6,583,694 | 6,928,560 | |||||||||||
4.50% | 05/20/40 - 12/20/48 | 2,973,007 | 3,125,352 | |||||||||||
5.00% | 08/15/41 | 1,864,698 | 2,006,956 | |||||||||||
3.50% | TBA | 1,150,000 | 1,187,835 | (e | ) | |||||||||
4.00% | TBA | 1,500,000 | 1,554,900 | (e | ) | |||||||||
4.50% | TBA | 1,250,000 | 1,302,912 | (e | ) | |||||||||
| 133,758,301 | ||||||||||||||
Agency Collateralized Mortgage Obligations – 0.1% |
| |||||||||||||
Federal Home Loan Mortgage Corp. |
| |||||||||||||
2.75% | 01/25/26 | 300,000 | 308,040 | (b | ) | |||||||||
3.06% | 07/25/23 | 600,000 | 620,959 | (b,f | ) | |||||||||
3.18% | 11/25/28 | 337,836 | 354,459 | |||||||||||
3.30% | 04/25/23 | 100,000 | 104,260 | (b,f | ) | |||||||||
3.39% | 03/25/24 | 200,000 | 210,447 | (b | ) | |||||||||
3.49% | 01/25/24 | 300,000 | 316,435 | (b | ) | |||||||||
3.85% | 06/25/28 | 250,000 | 276,436 | (b | ) | |||||||||
3.97% | 01/25/21 | 200,000 | 203,666 | (b,f | ) | |||||||||
4.33% | 10/25/20 | 49,957 | 50,713 | (b,f | ) | |||||||||
Federal National Mortgage Assoc. |
| |||||||||||||
2.78% | 06/25/21 | 248,516 | 249,055 | (b,f | ) | |||||||||
3.18% | 06/25/27 | 261,000 | 271,938 | (b,f | ) | |||||||||
3.78% | 08/25/30 | 200,000 | 218,199 | (b,f | ) | |||||||||
| 3,184,607 | ||||||||||||||
Asset Backed – 0.1% |
| |||||||||||||
American Express Credit Account Master Trust2018-8 |
| |||||||||||||
3.18% | 04/15/24 | 171,000 | 175,168 | (b | ) | |||||||||
Americredit Automobile Receivables Trust2018-1 |
| |||||||||||||
3.50% | 01/18/24 | 75,000 | 76,987 | (b | ) | |||||||||
BA Credit Card Trust |
| |||||||||||||
3.10% | 12/15/23 | 200,000 | 204,292 | (b | ) | |||||||||
Capital One Multi-Asset Execution Trust |
| |||||||||||||
1.66% | 06/17/24 | 30,000 | 29,754 | |||||||||||
Carmax Auto Owner Trust2018-4 |
| |||||||||||||
3.48% | 02/15/24 | 150,000 | 155,993 | |||||||||||
Chase Issuance Trust |
| |||||||||||||
1.49% | 07/15/22 | 100,000 | 99,350 | |||||||||||
Citibank Credit Card Issuance Trust |
| |||||||||||||
3.21% | 12/07/24 | 300,000 | 310,783 | (b | ) | |||||||||
Discover Card Execution Note Trust |
| |||||||||||||
3.32% | 03/15/24 | 65,000 | 66,747 | (b | ) | |||||||||
3.04% | 07/15/24 | 60,000 | 61,448 | |||||||||||
Drive Auto Receivables Trust2018-2 |
| |||||||||||||
4.14% | 08/15/24 | 150,000 | 153,674 | (b | ) | |||||||||
Ford Credit Auto Lease Trust |
| |||||||||||||
3.19% | 12/15/21 | 40,000 | 40,414 | (b | ) | |||||||||
Ford Credit Floorplan Master Owner Trust A |
| |||||||||||||
2.16% | 09/15/22 | 250,000 | 249,634 | (b | ) | |||||||||
See Notes to Schedule of Investments and Notes to Financial Statements.
Table of Contents
| State Street Total Return V.I.S. Fund | ||
| Schedule of Investments | June 30, 2019 (Unaudited) |
Principal Amount | Fair Value | |||||||||||||
GM Financial Automobile Leasing Trust2019-2 | ||||||||||||||
| 2.67% | 03/21/22 | $ | 25,000 | $ | 25,196 | |||||||||
Nissan Auto Receivables2018-B Owner Trust | ||||||||||||||
| 3.06% | 03/15/23 | 115,000 | 116,900 | (b | ) | |||||||||
Synchrony Credit Card Master Note Trust2016-2 | ||||||||||||||
| 2.21% | 05/15/24 | 100,000 | 100,152 | (b | ) | |||||||||
Toyota Auto Receivables2018-B Owner Trust | ||||||||||||||
| 2.96% | 09/15/22 | 100,000 | 101,158 | (b | ) | |||||||||
World Omni Auto Receivables Trust2018-D | ||||||||||||||
| 3.33% | 04/15/24 | 50,000 | 51,279 | (b | ) | |||||||||
World Omni Automobile Lease Securitization Trust2018-B | ||||||||||||||
| 3.19% | 12/15/21 | 50,000 | 50,800 | (b | ) | |||||||||
| 2,069,729 | ||||||||||||||
Corporate Notes – 6.9% | ||||||||||||||
3M Co. | ||||||||||||||
| 3.00% | 09/14/21 - 08/07/25 | 50,000 | 51,364 | |||||||||||
| 3.25% | 02/14/24 | 75,000 | 78,293 | |||||||||||
| 3.38% | 03/01/29 | 50,000 | 52,795 | |||||||||||
| 3.63% | 09/14/28 | 25,000 | 26,849 | |||||||||||
| 4.00% | 09/14/48 | 55,000 | 59,497 | |||||||||||
Abbott Laboratories | ||||||||||||||
| 2.55% | 03/15/22 | 130,000 | 131,390 | |||||||||||
| 3.75% | 11/30/26 | 57,000 | 61,744 | |||||||||||
| 4.75% | 11/30/36 | 100,000 | 118,315 | |||||||||||
| 4.90% | 11/30/46 | 100,000 | 123,335 | |||||||||||
AbbVie Inc. | ||||||||||||||
| 2.30% | 05/14/21 | 100,000 | 99,725 | |||||||||||
| 3.38% | 11/14/21 | 100,000 | 102,017 | |||||||||||
| 3.75% | 11/14/23 | 35,000 | 36,521 | |||||||||||
| 4.25% | 11/14/28 | 15,000 | 16,025 | |||||||||||
| 4.30% | 05/14/36 | 100,000 | 100,350 | |||||||||||
| 4.40% | 11/06/42 | 150,000 | 147,783 | |||||||||||
| 4.50% | 05/14/35 | 70,000 | 71,867 | |||||||||||
| 4.70% | 05/14/45 | 150,000 | 152,875 | |||||||||||
| 4.88% | 11/14/48 | 25,000 | 26,276 | |||||||||||
Adobe Inc. | ||||||||||||||
| 3.25% | 02/01/25 | 70,000 | 73,032 | |||||||||||
AerCap Ireland Capital DAC/AerCap Global Aviation Trust | ||||||||||||||
| 4.45% | 10/01/25 | 100,000 | 105,074 | |||||||||||
AerCap Ireland Capital DAC/AerCap Global Aviation Trust | ||||||||||||||
| 3.95% | 02/01/22 | 100,000 | 102,823 | |||||||||||
| 4.45% | 04/03/26 | 150,000 | 157,882 | |||||||||||
Aetna Inc. | ||||||||||||||
| 2.75% | 11/15/22 | 50,000 | 50,287 | |||||||||||
Aflac Inc. | ||||||||||||||
| 3.63% | 11/15/24 | 150,000 | 158,682 | |||||||||||
African Development Bank | ||||||||||||||
| 2.13% | 11/16/22 | 100,000 | 100,966 | |||||||||||
| 3.00% | 09/20/23 | 150,000 | 156,882 | |||||||||||
Air Lease Corp. | ||||||||||||||
| 3.88% | 04/01/21 - 07/03/23 | 150,000 | 154,170 | |||||||||||
| 4.25% | 02/01/24 | 100,000 | 105,444 | |||||||||||
Aircastle Ltd. | ||||||||||||||
| 4.13% | 05/01/24 | 20,000 | 20,481 | |||||||||||
| 5.00% | 04/01/23 | 20,000 | 21,157 | |||||||||||
| 5.13% | 03/15/21 | 20,000 | 20,720 | |||||||||||
| 5.50% | 02/15/22 | 20,000 | 21,204 | |||||||||||
Alexandria Real Estate Equities Inc. | ||||||||||||||
| 3.45% | 04/30/25 | 100,000 | 102,909 | |||||||||||
| 4.70% | 07/01/30 | 15,000 | 16,879 | |||||||||||
Alibaba Group Holding Ltd. | ||||||||||||||
| 3.13% | 11/28/21 | 200,000 | 202,970 | |||||||||||
| 4.20% | 12/06/47 | 60,000 | 62,861 | |||||||||||
Allergan Finance LLC | ||||||||||||||
| 3.25% | 10/01/22 | 150,000 | 152,401 | |||||||||||
Allergan Funding SCS | ||||||||||||||
| 4.75% | 03/15/45 | 100,000 | 102,902 | |||||||||||
Alphabet Inc. | ||||||||||||||
| 3.38% | 02/25/24 | 125,000 | 132,058 | |||||||||||
Altria Group Inc. | ||||||||||||||
| 2.63% | 09/16/26 | 100,000 | 96,243 | |||||||||||
| 3.80% | 02/14/24 | 20,000 | 20,862 | |||||||||||
Principal Amount | Fair Value | |||||||||||||
| 4.25% | 08/09/42 | $ | 213,000 | $ | 197,630 | |||||||||
| 4.80% | 02/14/29 | 40,000 | 43,132 | |||||||||||
| 5.38% | 01/31/44 | 70,000 | 75,096 | |||||||||||
| 5.80% | 02/14/39 | 15,000 | 16,813 | |||||||||||
| 5.95% | 02/14/49 | 40,000 | 45,482 | |||||||||||
| 6.20% | 02/14/59 | 15,000 | 17,192 | |||||||||||
Amazon.com Inc. | ||||||||||||||
| 1.90% | 08/21/20 | 100,000 | 99,770 | |||||||||||
| 3.15% | 08/22/27 | 100,000 | 105,060 | |||||||||||
| 3.88% | 08/22/37 | 100,000 | 110,229 | |||||||||||
| 4.25% | 08/22/57 | 100,000 | 115,611 | |||||||||||
| 4.80% | 12/05/34 | 150,000 | 184,168 | |||||||||||
America Movil SAB de C.V. | ||||||||||||||
| 3.13% | 07/16/22 | 150,000 | 152,926 | |||||||||||
American Campus Communities Operating Partnership LP | ||||||||||||||
| 3.63% | 11/15/27 | 30,000 | 30,580 | |||||||||||
American Electric Power Company Inc. | ||||||||||||||
| 3.20% | 11/13/27 | 100,000 | 101,658 | |||||||||||
American Express Co. | ||||||||||||||
| 2.20% | 10/30/20 | 120,000 | 119,711 | |||||||||||
| 3.00% | 02/22/21 - 10/30/24 | 165,000 | 168,100 | |||||||||||
| 3.38% | 05/17/21 | 50,000 | 50,936 | |||||||||||
| 3.40% | 02/27/23 | 100,000 | 103,557 | |||||||||||
| 3.63% | 12/05/24 | 150,000 | 157,416 | |||||||||||
| 3.70% | 11/05/21 | 25,000 | 25,746 | |||||||||||
American Financial Group Inc. | ||||||||||||||
| 3.50% | 08/15/26 | 65,000 | 65,514 | |||||||||||
American Homes 4 Rent LP | ||||||||||||||
| 4.90% | 02/15/29 | 100,000 | 108,812 | |||||||||||
American Honda Finance Corp. | ||||||||||||||
| 2.40% | 06/27/24 | 25,000 | 24,988 | |||||||||||
| 2.60% | 11/16/22 | 100,000 | 101,046 | |||||||||||
| 3.38% | 12/10/21 | 100,000 | 102,591 | |||||||||||
American International Group Inc. | ||||||||||||||
| 4.25% | 03/15/29 | 100,000 | 107,216 | |||||||||||
| 4.50% | 07/16/44 | 150,000 | 158,287 | |||||||||||
| 4.88% | 06/01/22 | 200,000 | 214,202 | |||||||||||
American Tower Corp. | ||||||||||||||
| 3.38% | 05/15/24 | 100,000 | 102,908 | |||||||||||
| 3.50% | 01/31/23 | 150,000 | 154,696 | |||||||||||
| 3.95% | 03/15/29 | 100,000 | 104,497 | |||||||||||
Ameriprise Financial Inc. | ||||||||||||||
| 3.00% | 03/22/22 | 15,000 | 15,286 | |||||||||||
AmerisourceBergen Corp. | ||||||||||||||
| 3.45% | 12/15/27 | 100,000 | 101,987 | |||||||||||
Amgen Inc. | ||||||||||||||
| 3.20% | 11/02/27 | 100,000 | 102,443 | |||||||||||
| 4.56% | 06/15/48 | 150,000 | 162,621 | |||||||||||
| 4.66% | 06/15/51 | 105,000 | 114,724 | |||||||||||
Amphenol Corp. | ||||||||||||||
| 4.35% | 06/01/29 | 25,000 | 27,068 | |||||||||||
Anadarko Petroleum Corp. | ||||||||||||||
| 6.20% | 03/15/40 | 142,000 | 170,643 | |||||||||||
Analog Devices Inc. | ||||||||||||||
| 2.50% | 12/05/21 | 200,000 | 200,828 | |||||||||||
Andeavor Logistics LP/Tesoro Logistics Finance Corp. | ||||||||||||||
| 4.25% | 12/01/27 | 35,000 | 36,972 | |||||||||||
Anheuser-Busch Companies LLC/Anheuser-Busch InBev Worldwide Inc. | ||||||||||||||
| 4.70% | 02/01/36 | 150,000 | 164,674 | |||||||||||
| 4.90% | 02/01/46 | 220,000 | 244,809 | |||||||||||
Anheuser-Busch InBev Worldwide Inc. | ||||||||||||||
| 4.00% | 04/13/28 | 155,000 | 167,095 | |||||||||||
| 4.15% | 01/23/25 | 100,000 | 108,362 | |||||||||||
| 4.38% | 04/15/38 | 215,000 | 227,332 | |||||||||||
| 4.60% | 04/15/48 | 135,000 | 144,612 | |||||||||||
| 4.75% | 01/23/29 - 04/15/58 | 105,000 | 115,734 | |||||||||||
| 5.45% | 01/23/39 | 35,000 | 41,575 | |||||||||||
| 5.55% | 01/23/49 | 165,000 | 201,741 | |||||||||||
| 5.80% | 01/23/59 | 25,000 | 31,332 | |||||||||||
Anthem Inc. | ||||||||||||||
| 3.30% | 01/15/23 | 100,000 | 102,910 | |||||||||||
| 3.70% | 08/15/21 | 237,000 | 242,517 | |||||||||||
| 4.38% | 12/01/47 | 65,000 | 69,060 | |||||||||||
See Notes to Schedule of Investments and Notes to Financial Statements.
Table of Contents
| State Street Total Return V.I.S. Fund | ||
| Schedule of Investments | June 30, 2019 (Unaudited) |
Principal Amount | Fair Value | |||||||||||||
Aon Corp. | ||||||||||||||
| 3.75% | 05/02/29 | $ | 25,000 | $ | 26,060 | |||||||||
| 4.50% | 12/15/28 | 100,000 | 110,009 | |||||||||||
Apache Corp. | ||||||||||||||
| 4.38% | 10/15/28 | 25,000 | 26,112 | |||||||||||
| 5.10% | 09/01/40 | 150,000 | 150,817 | |||||||||||
| 5.35% | 07/01/49 | 50,000 | 53,195 | |||||||||||
Apple Inc. | ||||||||||||||
| 2.00% | 11/13/20 | 50,000 | 49,976 | |||||||||||
| 2.25% | 02/23/21 | 200,000 | 200,644 | |||||||||||
| 2.40% | 01/13/23 | 50,000 | 50,471 | |||||||||||
| 2.50% | 02/09/22 | 150,000 | 151,707 | |||||||||||
| 2.75% | 01/13/25 | 50,000 | 51,109 | |||||||||||
| 3.00% | 11/13/27 | 100,000 | 103,012 | |||||||||||
| 3.25% | 02/23/26 | 160,000 | 167,358 | |||||||||||
| 3.75% | 11/13/47 | 50,000 | 52,473 | |||||||||||
| 4.38% | 05/13/45 | 165,000 | 188,024 | |||||||||||
| 4.50% | 02/23/36 | 150,000 | 175,527 | |||||||||||
| 4.65% | 02/23/46 | 185,000 | 219,508 | |||||||||||
Applied Materials Inc. | ||||||||||||||
| 3.90% | 10/01/25 | 160,000 | 171,518 | |||||||||||
Aptiv Corp. | ||||||||||||||
| 4.15% | 03/15/24 | 150,000 | 158,091 | |||||||||||
Aptiv PLC | ||||||||||||||
| 5.40% | 03/15/49 | 100,000 | 105,369 | |||||||||||
ArcelorMittal | ||||||||||||||
| 4.55% | 03/11/26 | 100,000 | 105,523 | |||||||||||
| 5.25% | 08/05/20 | 30,000 | 30,731 | |||||||||||
| 5.50% | 03/01/21 | 25,000 | 26,033 | |||||||||||
| 6.13% | 06/01/25 | 20,000 | 22,686 | |||||||||||
| 6.25% | 02/25/22 | 25,000 | 27,077 | |||||||||||
| 7.00% | 10/15/39 | 28,000 | 33,217 | |||||||||||
Arch Capital Finance LLC | ||||||||||||||
| 4.01% | 12/15/26 | 100,000 | 107,449 | |||||||||||
| 5.03% | 12/15/46 | 100,000 | 118,374 | |||||||||||
Archer-Daniels-Midland Co. | ||||||||||||||
| 4.02% | 04/16/43 | 120,000 | 128,141 | |||||||||||
Ares Capital Corp. | ||||||||||||||
| 4.20% | 06/10/24 | 65,000 | 65,827 | |||||||||||
Arizona Public Service Co. | ||||||||||||||
| 4.25% | 03/01/49 | 25,000 | 27,195 | |||||||||||
Arrow Electronics Inc. | ||||||||||||||
| 4.00% | 04/01/25 | 40,000 | 41,064 | |||||||||||
Ascension Health | ||||||||||||||
| 3.95% | 11/15/46 | 25,000 | 27,006 | |||||||||||
Asian Development Bank | ||||||||||||||
| 2.13% | 03/19/25 | 200,000 | 202,376 | |||||||||||
| 2.25% | 01/20/21 | 200,000 | 201,076 | |||||||||||
| 2.63% | 01/30/24 | 200,000 | 206,716 | |||||||||||
| 2.75% | 03/17/23 | 295,000 | 304,924 | |||||||||||
| 3.13% | 09/26/28 | 25,000 | 27,138 | |||||||||||
Assurant Inc. | ||||||||||||||
| 4.90% | 03/27/28 | 50,000 | 54,069 | |||||||||||
AstraZeneca PLC | ||||||||||||||
| 3.50% | 08/17/23 | 25,000 | 26,038 | |||||||||||
| 4.00% | 01/17/29 | 20,000 | 21,868 | |||||||||||
| 4.38% | 08/17/48 | 20,000 | 22,413 | |||||||||||
| 6.45% | 09/15/37 | 150,000 | 202,873 | |||||||||||
AT&T Inc. | ||||||||||||||
| 2.80% | 02/17/21 | 300,000 | 301,878 | |||||||||||
| 3.60% | 07/15/25 | 100,000 | 103,866 | |||||||||||
| 4.10% | 02/15/28 | 206,000 | 218,076 | |||||||||||
| 4.30% | 02/15/30 | 120,000 | 128,224 | |||||||||||
| 4.35% | 06/15/45 | 150,000 | 149,894 | |||||||||||
| 4.50% | 05/15/35 - 03/09/48 | 145,000 | 150,609 | |||||||||||
| 4.75% | 05/15/46 | 150,000 | 157,830 | |||||||||||
| 4.85% | 03/01/39 | 150,000 | 161,352 | |||||||||||
| 5.15% | 03/15/42 - 02/15/50 | 250,000 | 275,437 | |||||||||||
| 5.55% | 08/15/41 | 154,000 | 178,170 | |||||||||||
| 6.10% | 07/15/40 | 150,000 | 179,541 | |||||||||||
| 6.25% | 03/29/41 | 100,000 | 122,436 | |||||||||||
Principal Amount | Fair Value | |||||||||||||
Atmos Energy Corp. |
| |||||||||||||
4.30% | 10/01/48 | $ | 100,000 | $ | 112,953 | |||||||||
Australia & New Zealand Banking Group Ltd. |
| |||||||||||||
3.70% | 11/16/25 | 150,000 | 159,891 | |||||||||||
AutoNation Inc. |
| |||||||||||||
3.80% | 11/15/27 | 50,000 | 49,087 | |||||||||||
AutoZone Inc. |
| |||||||||||||
3.75% | 04/18/29 | 100,000 | 104,043 | |||||||||||
AvalonBay Communities Inc. |
| |||||||||||||
3.20% | 01/15/28 | 40,000 | 41,328 | |||||||||||
3.45% | 06/01/25 | 115,000 | 120,569 | |||||||||||
Avangrid Inc. |
| |||||||||||||
3.80% | 06/01/29 | 50,000 | 52,320 | |||||||||||
AXA S.A. |
| |||||||||||||
8.60% | 12/15/30 | 100,000 | 142,593 | |||||||||||
Baidu Inc. |
| |||||||||||||
3.88% | 09/29/23 | 100,000 | 103,847 | |||||||||||
4.38% | 03/29/28 | 100,000 | 105,652 | |||||||||||
Baker Hughes a GE Company LLC/Baker HughesCo-Obligor Inc. |
| |||||||||||||
2.77% | 12/15/22 | 50,000 | 50,531 | |||||||||||
3.34% | 12/15/27 | 50,000 | 50,357 | |||||||||||
4.08% | 12/15/47 | 50,000 | 48,281 | |||||||||||
Banco Santander S.A. |
| |||||||||||||
3.13% | 02/23/23 | 100,000 | 101,484 | |||||||||||
3.80% | 02/23/28 | 100,000 | 102,017 | |||||||||||
4.25% | 04/11/27 | 100,000 | 105,042 | |||||||||||
Bank of America Corp. |
| |||||||||||||
2.15% | 11/09/20 | 200,000 | 199,480 | |||||||||||
3.50% | 04/19/26 | 145,000 | 151,513 | |||||||||||
3.88% | 08/01/25 | 150,000 | 160,447 | |||||||||||
3.95% | 04/21/25 | 155,000 | 162,558 | |||||||||||
4.00% | 04/01/24 | 150,000 | 160,029 | |||||||||||
4.18% | 11/25/27 | 100,000 | 106,084 | |||||||||||
6.11% | 01/29/37 | 100,000 | 127,440 | |||||||||||
Bank of America Corp. (2.37% fixed rate until 07/21/20; 0.66% + 3 month USD LIBOR thereafter) |
| |||||||||||||
2.37% | 07/21/21 | 200,000 | 199,796 | (f | ) | |||||||||
Bank of America Corp. (3.00% fixed rate until 12/20/22; 0.79% + 3 month USD LIBOR thereafter) |
| |||||||||||||
3.00% | 12/20/23 | 200,000 | 203,486 | (f | ) | |||||||||
Bank of America Corp. (3.42% fixed rate until 12/20/27; 1.04% + 3 month USD LIBOR thereafter) |
| |||||||||||||
3.42% | 12/20/28 | 107,000 | 110,075 | (f | ) | |||||||||
Bank of America Corp. (3.46% fixed rate until 03/15/24; 0.97% + 3 month USD LIBOR thereafter) |
| |||||||||||||
3.46% | 03/15/25 | 100,000 | 103,770 | (f | ) | |||||||||
Bank of America Corp. (3.50% fixed rate until 05/17/21; 0.63% + 3 month USD LIBOR thereafter) |
| |||||||||||||
3.50% | 05/17/22 | 100,000 | 101,945 | (f | ) | |||||||||
Bank of America Corp. (3.55% fixed rate until 03/05/23; 0.78% + 3 month USD LIBOR thereafter) |
| |||||||||||||
3.55% | 03/05/24 | 100,000 | 103,633 | (f | ) | |||||||||
Bank of America Corp. (3.56% fixed rate until 04/23/26; 1.06% + 3 month USD LIBOR thereafter) |
| |||||||||||||
3.56% | 04/23/27 | 200,000 | 208,464 | (f | ) | |||||||||
Bank of America Corp. (3.95% fixed rate until 01/23/48; 1.19% + 3 month USD LIBOR thereafter) |
| |||||||||||||
3.95% | 01/23/49 | 200,000 | 211,610 | (f | ) | |||||||||
Bank of America Corp. (3.97% fixed rate until 03/05/28; 1.07% + 3 month USD LIBOR thereafter) |
| |||||||||||||
3.97% | 03/05/29 | 100,000 | 106,726 | (f | ) | |||||||||
Bank of America Corp. (4.08% fixed rate until 04/23/39; 1.32% + 3 month USD LIBOR thereafter) |
| |||||||||||||
4.08% | 04/23/40 | 150,000 | 159,750 | (f | ) | |||||||||
Bank of America Corp. (4.24% fixed rate until 04/24/37; 1.81% + 3 month USD LIBOR thereafter) |
| |||||||||||||
4.24% | 04/24/38 | 150,000 | 163,323 | (f | ) | |||||||||
Bank of America Corp. (4.33% fixed rate until 03/15/49; 1.52% + 3 month USD LIBOR thereafter) |
| |||||||||||||
4.33% | 03/15/50 | 100,000 | 111,399 | (f | ) | |||||||||
Bank of Montreal |
| |||||||||||||
2.90% | 03/26/22 | 50,000 | 50,772 | |||||||||||
See Notes to Schedule of Investments and Notes to Financial Statements.
Table of Contents
| State Street Total Return V.I.S. Fund | ||
| Schedule of Investments | June 30, 2019 (Unaudited) |
Principal Amount | Fair Value | |||||||||||||
| 3.10% | 07/13/20 - 04/13/21 | $ | 140,000 | $ | 141,817 | |||||||||
| 3.30% | 02/05/24 | 100,000 | 103,535 | |||||||||||
Barclays Bank PLC | ||||||||||||||
| 2.65% | 01/11/21 | 200,000 | 200,346 | |||||||||||
Barclays PLC | ||||||||||||||
| 3.65% | 03/16/25 | 150,000 | 150,750 | |||||||||||
Barclays PLC (4.97% fixed rate until 05/16/28; 1.90% + 3 month USD LIBOR thereafter) | ||||||||||||||
| 4.97% | 05/16/29 | 100,000 | 106,513 | (f | ) | |||||||||
BAT Capital Corp. | ||||||||||||||
| 2.30% | 08/14/20 | 100,000 | 99,784 | |||||||||||
| 2.76% | 08/15/22 | 100,000 | 100,172 | |||||||||||
| 3.22% | 08/15/24 | 100,000 | 100,779 | |||||||||||
| 3.56% | 08/15/27 | 100,000 | 99,556 | |||||||||||
| 4.39% | 08/15/37 | 100,000 | 95,015 | |||||||||||
Baxalta Inc. | ||||||||||||||
| 4.00% | 06/23/25 | 30,000 | 31,935 | |||||||||||
Baxter International Inc. | ||||||||||||||
| 2.60% | 08/15/26 | 130,000 | 129,396 | |||||||||||
BB&T Corp. | ||||||||||||||
| 2.15% | 02/01/21 | 100,000 | 99,822 | |||||||||||
| 2.85% | 10/26/24 | 50,000 | 51,224 | |||||||||||
| 3.75% | 12/06/23 | 200,000 | 211,716 | |||||||||||
Becton Dickinson and Co. | ||||||||||||||
| 3.70% | 06/06/27 | 66,000 | 68,897 | |||||||||||
| 3.73% | 12/15/24 | 50,000 | 52,396 | |||||||||||
Bell Canada Inc. | ||||||||||||||
| 4.30% | 07/29/49 | 30,000 | 32,369 | |||||||||||
Berkshire Hathaway Energy Co. | ||||||||||||||
| 4.45% | 01/15/49 | 100,000 | 112,938 | |||||||||||
| 6.13% | 04/01/36 | 194,000 | 259,392 | |||||||||||
Berkshire Hathaway Finance Corp. | ||||||||||||||
| 3.00% | 05/15/22 | 200,000 | 205,780 | |||||||||||
| 4.20% | 08/15/48 | 100,000 | 111,665 | |||||||||||
| 4.25% | 01/15/49 | 100,000 | 112,425 | |||||||||||
Best Buy Company Inc. | ||||||||||||||
| 4.45% | 10/01/28 | 25,000 | 26,396 | |||||||||||
Biogen Inc. | ||||||||||||||
| 4.05% | 09/15/25 | 80,000 | 85,790 | |||||||||||
| 5.20% | 09/15/45 | 150,000 | 168,051 | |||||||||||
Black Hills Corp. | ||||||||||||||
| 4.35% | 05/01/33 | 30,000 | 33,172 | |||||||||||
BlackRock Inc. | ||||||||||||||
| 3.25% | 04/30/29 | 60,000 | 62,845 | |||||||||||
Boardwalk Pipelines LP | ||||||||||||||
| 4.80% | 05/03/29 | 20,000 | 20,880 | |||||||||||
Boeing Co. | ||||||||||||||
| 3.10% | 05/01/26 | 100,000 | 103,073 | |||||||||||
Booking Holdings Inc. | ||||||||||||||
| 2.75% | 03/15/23 | 100,000 | 101,316 | |||||||||||
| 3.55% | 03/15/28 | 100,000 | 104,700 | |||||||||||
Boston Properties LP | ||||||||||||||
| 3.40% | 06/21/29 | 50,000 | 51,355 | |||||||||||
| 3.85% | 02/01/23 | 150,000 | 156,486 | |||||||||||
Boston Scientific Corp. | ||||||||||||||
| 4.00% | 03/01/28 | 100,000 | 107,655 | |||||||||||
| 4.13% | 10/01/23 | 100,000 | 105,950 | |||||||||||
| 4.55% | 03/01/39 | 50,000 | 55,561 | |||||||||||
BP Capital Markets America Inc. | ||||||||||||||
| 3.22% | 11/28/23 | 100,000 | 103,257 | |||||||||||
| 3.41% | 02/11/26 | 50,000 | 52,489 | |||||||||||
| 3.94% | 09/21/28 | 100,000 | 108,562 | |||||||||||
| 4.23% | 11/06/28 | 50,000 | 55,528 | |||||||||||
BP Capital Markets PLC | ||||||||||||||
| 2.50% | 11/06/22 | 100,000 | 100,967 | |||||||||||
| 3.06% | 03/17/22 | 210,000 | 214,903 | |||||||||||
BPCE S.A. | ||||||||||||||
| 4.00% | 04/15/24 | 150,000 | 159,666 | |||||||||||
Branch Banking & Trust Co. | ||||||||||||||
| 2.63% | 01/15/22 | 100,000 | 100,901 | |||||||||||
Bristol-Myers Squibb Co. | ||||||||||||||
| 2.00% | 08/01/22 | 50,000 | 49,699 | |||||||||||
Principal Amount | Fair Value | |||||||||||||
| 2.60% | 05/16/22 | $ | 50,000 | $ | 50,607 | (c | ) | |||||||
| 2.90% | 07/26/24 | 55,000 | 56,269 | (c | ) | |||||||||
| 3.40% | 07/26/29 | 55,000 | 57,616 | (c | ) | |||||||||
| 4.13% | 06/15/39 | 15,000 | 16,167 | (c | ) | |||||||||
| 4.25% | 10/26/49 | 40,000 | 44,202 | (c | ) | |||||||||
British Telecommunications PLC | ||||||||||||||
| 9.63% | 12/15/30 | 150,000 | 226,117 | |||||||||||
Brixmor Operating Partnership LP | ||||||||||||||
| 4.13% | 05/15/29 | 50,000 | 52,281 | |||||||||||
Broadcom Corp./Broadcom Cayman Finance Ltd. | ||||||||||||||
| 2.65% | 01/15/23 | 100,000 | 98,653 | |||||||||||
| 3.00% | 01/15/22 | 100,000 | 100,296 | |||||||||||
| 3.13% | 01/15/25 | 100,000 | 97,658 | |||||||||||
| 3.63% | 01/15/24 | 100,000 | 100,899 | |||||||||||
Broadcom Inc. | ||||||||||||||
| 3.13% | 10/15/22 | 15,000 | 15,084 | (c | ) | |||||||||
| 3.63% | 10/15/24 | 100,000 | 100,522 | (c | ) | |||||||||
| 4.75% | 04/15/29 | 100,000 | 102,570 | (c | ) | |||||||||
Broadridge Financial Solutions Inc. | ||||||||||||||
| 3.40% | 06/27/26 | 80,000 | 81,335 | |||||||||||
Brookfield Finance Inc. | ||||||||||||||
| 3.90% | 01/25/28 | 100,000 | 101,770 | |||||||||||
Brown & Brown Inc. | ||||||||||||||
| 4.50% | 03/15/29 | 100,000 | 105,522 | |||||||||||
Brown-Forman Corp. | ||||||||||||||
| 4.00% | 04/15/38 | 30,000 | 32,404 | |||||||||||
Buckeye Partners LP | ||||||||||||||
| 4.15% | 07/01/23 | 150,000 | 145,313 | |||||||||||
Bunge Limited Finance Corp. | ||||||||||||||
| 4.35% | 03/15/24 | 50,000 | 52,342 | |||||||||||
Burlington Northern Santa Fe LLC | ||||||||||||||
| 5.75% | 05/01/40 | 200,000 | 261,846 | |||||||||||
Camden Property Trust | ||||||||||||||
| 4.10% | 10/15/28 | 10,000 | 10,904 | |||||||||||
Campbell Soup Co. | ||||||||||||||
| 3.65% | 03/15/23 | 50,000 | 51,501 | |||||||||||
| 4.15% | 03/15/28 | 50,000 | 52,349 | |||||||||||
| 4.80% | 03/15/48 | 20,000 | 20,298 | |||||||||||
Canadian Imperial Bank of Commerce | ||||||||||||||
| 2.10% | 10/05/20 | 100,000 | 99,886 | |||||||||||
| 2.70% | 02/02/21 | 40,000 | 40,289 | |||||||||||
Canadian National Railway Co. | ||||||||||||||
| 2.95% | 11/21/24 | 155,000 | 159,214 | |||||||||||
Canadian Natural Resources Ltd. | ||||||||||||||
| 3.80% | 04/15/24 | 150,000 | 157,270 | |||||||||||
| 3.85% | 06/01/27 | 100,000 | 103,898 | |||||||||||
| 3.90% | 02/01/25 | 50,000 | 52,269 | |||||||||||
Canadian Pacific Railway Co. | ||||||||||||||
| 2.90% | 02/01/25 | 150,000 | 153,964 | |||||||||||
Capital One Financial Corp. | ||||||||||||||
| 3.75% | 07/28/26 - 03/09/27 | 230,000 | 235,520 | |||||||||||
| 3.90% | 01/29/24 | 125,000 | 131,413 | |||||||||||
| 4.20% | 10/29/25 | 90,000 | 94,715 | |||||||||||
Cardinal Health Inc. | ||||||||||||||
| 3.20% | 03/15/23 | 150,000 | 152,098 | |||||||||||
Caterpillar Financial Services Corp. | ||||||||||||||
| 2.55% | 11/29/22 | 50,000 | 50,564 | |||||||||||
| 2.90% | 03/15/21 | 100,000 | 101,141 | |||||||||||
| 3.15% | 09/07/21 | 15,000 | 15,296 | |||||||||||
| 3.25% | 12/01/24 | 100,000 | 104,096 | |||||||||||
| 3.35% | 12/07/20 | 200,000 | 203,010 | |||||||||||
CBS Corp. | ||||||||||||||
| 3.38% | 03/01/22 | 150,000 | 153,444 | |||||||||||
| 4.00% | 01/15/26 | 150,000 | 157,173 | |||||||||||
Celgene Corp. | ||||||||||||||
| 2.75% | 02/15/23 | 50,000 | 50,526 | |||||||||||
| 3.45% | 11/15/27 | 50,000 | 52,057 | |||||||||||
| 4.35% | 11/15/47 | 50,000 | 55,194 | |||||||||||
| 5.00% | 08/15/45 | 150,000 | 177,567 | |||||||||||
| 5.25% | 08/15/43 | 220,000 | 258,599 | |||||||||||
Celulosa Arauco y Constitucion S.A. | ||||||||||||||
| 3.88% | 11/02/27 | 100,000 | 101,885 | |||||||||||
See Notes to Schedule of Investments and Notes to Financial Statements.
Table of Contents
| State Street Total Return V.I.S. Fund | ||
| Schedule of Investments | June 30, 2019 (Unaudited) |
Principal Amount | Fair Value | |||||||||||||
Cenovus Energy Inc. | ||||||||||||||
| 3.00% | 08/15/22 | $ | 35,000 | $ | 35,133 | |||||||||
| 4.25% | 04/15/27 | 100,000 | 103,545 | |||||||||||
CenterPoint Energy Houston Electric LLC | ||||||||||||||
| 4.25% | 02/01/49 | 110,000 | 124,994 | |||||||||||
| 4.50% | 04/01/44 | 150,000 | 172,390 | |||||||||||
Charter Communications Operating LLC/Charter Communications Operating Capital | ||||||||||||||
| 4.46% | 07/23/22 | 300,000 | 314,985 | |||||||||||
| 4.91% | 07/23/25 | 135,000 | 146,499 | |||||||||||
| 6.48% | 10/23/45 | 150,000 | 178,375 | |||||||||||
Chevron Corp. | ||||||||||||||
| 2.41% | 03/03/22 | 45,000 | 45,461 | |||||||||||
| 2.90% | 03/03/24 | 150,000 | 155,071 | |||||||||||
| 2.95% | 05/16/26 | 100,000 | 103,219 | |||||||||||
Chubb INA Holdings Inc. | ||||||||||||||
| 2.70% | 03/13/23 | 150,000 | 152,289 | |||||||||||
| 4.35% | 11/03/45 | 100,000 | 116,471 | |||||||||||
Cigna Corp. | ||||||||||||||
| 3.40% | 09/17/21 | 140,000 | 142,712 | (c | ) | |||||||||
| 3.75% | 07/15/23 | 55,000 | 57,237 | (c | ) | |||||||||
| 4.38% | 10/15/28 | 40,000 | 43,164 | (c | ) | |||||||||
| 4.80% | 08/15/38 | 30,000 | 32,303 | (c | ) | |||||||||
| 4.90% | 12/15/48 | 230,000 | 251,174 | (c | ) | |||||||||
Cimarex Energy Co. | ||||||||||||||
| 4.38% | 03/15/29 | 150,000 | 159,018 | |||||||||||
Cintas Corporation No. 2 | ||||||||||||||
| 3.70% | 04/01/27 | 100,000 | 106,533 | |||||||||||
Cisco Systems Inc. | ||||||||||||||
| 2.90% | 03/04/21 | 125,000 | 126,539 | |||||||||||
| 5.90% | 02/15/39 | 200,000 | 272,818 | |||||||||||
Citibank NA | ||||||||||||||
| 2.13% | 10/20/20 | 200,000 | 199,582 | |||||||||||
| 2.85% | 02/12/21 | 150,000 | 151,192 | |||||||||||
| 3.40% | 07/23/21 | 200,000 | 204,212 | |||||||||||
| 3.65% | 01/23/24 | 100,000 | 105,197 | |||||||||||
Citigroup Inc. | ||||||||||||||
| 2.70% | 10/27/22 | 100,000 | 100,760 | |||||||||||
| 2.90% | 12/08/21 | 100,000 | 101,127 | |||||||||||
| 3.88% | 03/26/25 | 150,000 | 156,426 | |||||||||||
| 4.30% | 11/20/26 | 200,000 | 211,254 | |||||||||||
| 4.45% | 09/29/27 | 150,000 | 161,617 | |||||||||||
| 4.75% | 05/18/46 | 50,000 | 56,565 | |||||||||||
| 5.88% | 01/30/42 | 172,000 | 226,319 | |||||||||||
| 6.13% | 08/25/36 | 155,000 | 192,051 | |||||||||||
Citigroup Inc. (3.35% fixed rate until 04/24/24; 0.90% + 3 month USD LIBOR thereafter) | ||||||||||||||
| 3.35% | 04/24/25 | 100,000 | 103,250 | (f | ) | |||||||||
Citigroup Inc. (3.52% fixed rate until 10/27/27; 1.15% + 3 month USD LIBOR thereafter) | ||||||||||||||
| 3.52% | 10/27/28 | 100,000 | 103,200 | (f | ) | |||||||||
Citigroup Inc. (3.98% fixed rate until 03/20/29; 1.34% + 3 month USD LIBOR thereafter) | ||||||||||||||
| 3.98% | 03/20/30 | 100,000 | 106,873 | (f | ) | |||||||||
Citizens Bank NA | ||||||||||||||
| 2.25% | 10/30/20 | 150,000 | 149,690 | |||||||||||
CME Group Inc. | ||||||||||||||
| 3.00% | 03/15/25 | 150,000 | 155,709 | |||||||||||
CNH Industrial Capital LLC | ||||||||||||||
| 3.88% | 10/15/21 | 15,000 | 15,350 | |||||||||||
| 4.38% | 11/06/20 - 04/05/22 | 35,000 | 35,955 | |||||||||||
| 4.88% | 04/01/21 | 15,000 | 15,533 | |||||||||||
CNH Industrial N.V. | ||||||||||||||
| 3.85% | 11/15/27 | 15,000 | 14,980 | |||||||||||
Colgate-Palmolive Co. | ||||||||||||||
| 3.25% | 03/15/24 | 150,000 | 157,621 | |||||||||||
Comcast Corp. | ||||||||||||||
| 3.15% | 02/15/28 | 100,000 | 102,549 | |||||||||||
| 3.30% | 10/01/20 | 200,000 | 202,740 | |||||||||||
| 3.45% | 10/01/21 | 40,000 | 41,157 | |||||||||||
| 3.55% | 05/01/28 | 100,000 | 105,492 | |||||||||||
| 3.70% | 04/15/24 | 55,000 | 58,369 | |||||||||||
| 3.90% | 03/01/38 | 200,000 | 210,614 | |||||||||||
Principal Amount | Fair Value | |||||||||||||
| 3.95% | 10/15/25 | $ | 200,000 | $ | 215,982 | |||||||||
| 3.97% | 11/01/47 | 100,000 | 104,760 | |||||||||||
| 4.00% | 08/15/47 - 11/01/49 | 250,000 | 263,105 | |||||||||||
| 4.05% | 11/01/52 | 100,000 | 105,899 | |||||||||||
| 4.15% | 10/15/28 | 45,000 | 49,578 | |||||||||||
| 4.25% | 01/15/33 | 100,000 | 111,799 | |||||||||||
| 4.60% | 10/15/38 | 230,000 | 263,295 | |||||||||||
| 4.70% | 10/15/48 | 40,000 | 46,897 | |||||||||||
Comerica Inc. | ||||||||||||||
| 3.70% | 07/31/23 | 25,000 | 26,163 | |||||||||||
| 4.00% | 02/01/29 | 50,000 | 53,719 | |||||||||||
Commonwealth Edison Co. | ||||||||||||||
| 4.00% | 03/01/49 | 100,000 | 107,936 | |||||||||||
| 4.60% | 08/15/43 | 150,000 | 172,621 | |||||||||||
| 4.70% | 01/15/44 | 175,000 | 205,394 | |||||||||||
Compass Bank | ||||||||||||||
| 3.88% | 04/10/25 | 150,000 | 154,891 | |||||||||||
Conagra Brands Inc. | ||||||||||||||
| 3.80% | 10/22/21 | 10,000 | 10,277 | |||||||||||
| 4.30% | 05/01/24 | 5,000 | 5,310 | |||||||||||
| 4.85% | 11/01/28 | 25,000 | 27,698 | |||||||||||
| 5.30% | 11/01/38 | 110,000 | 119,208 | |||||||||||
| 5.40% | 11/01/48 | 20,000 | 21,949 | |||||||||||
Concho Resources Inc. | ||||||||||||||
| 4.30% | 08/15/28 | 25,000 | 26,963 | |||||||||||
| 4.85% | 08/15/48 | 25,000 | 28,126 | |||||||||||
ConocoPhillips | ||||||||||||||
| 6.50% | 02/01/39 | 200,000 | 280,520 | |||||||||||
Consolidated Edison Company of New York Inc. | ||||||||||||||
| 3.88% | 06/15/47 | 100,000 | 103,519 | |||||||||||
| 3.95% | 03/01/43 | 150,000 | 155,755 | |||||||||||
| 4.00% | 12/01/28 | 25,000 | 27,487 | |||||||||||
| 4.13% | 05/15/49 | 50,000 | 53,908 | |||||||||||
Constellation Brands Inc. | ||||||||||||||
| 3.50% | 05/09/27 | 100,000 | 102,916 | |||||||||||
| 4.75% | 11/15/24 | 100,000 | 110,001 | |||||||||||
| 5.25% | 11/15/48 | 15,000 | 17,432 | |||||||||||
Consumers Energy Co. | ||||||||||||||
| 3.75% | 02/15/50 | 100,000 | 105,392 | |||||||||||
| 4.05% | 05/15/48 | 50,000 | 55,638 | |||||||||||
Continental Resources Inc. | ||||||||||||||
| 3.80% | 06/01/24 | 35,000 | 36,010 | |||||||||||
| 4.38% | 01/15/28 | 35,000 | 36,782 | |||||||||||
| 4.50% | 04/15/23 | 50,000 | 52,506 | |||||||||||
| 4.90% | 06/01/44 | 25,000 | 26,397 | |||||||||||
| 5.00% | 09/15/22 | 56,000 | 56,492 | |||||||||||
Cooperatieve Rabobank UA | ||||||||||||||
| 2.50% | 01/19/21 | 150,000 | 150,520 | |||||||||||
| 2.75% | 01/10/22 | 100,000 | 101,076 | |||||||||||
| 3.95% | 11/09/22 | 100,000 | 103,781 | |||||||||||
| 4.63% | 12/01/23 | 150,000 | 160,578 | |||||||||||
Corning Inc. | ||||||||||||||
| 2.90% | 05/15/22 | 155,000 | 157,401 | |||||||||||
Corporation Andina de Fomento | ||||||||||||||
| 2.13% | 09/27/21 | 150,000 | 148,922 | |||||||||||
Costco Wholesale Corp. | ||||||||||||||
| 2.25% | 02/15/22 | 85,000 | 85,344 | |||||||||||
| 3.00% | 05/18/27 | 100,000 | 103,534 | |||||||||||
Council Of Europe Development Bank | ||||||||||||||
| 2.63% | 02/13/23 | 120,000 | 123,341 | |||||||||||
Credit Suisse AG | ||||||||||||||
| 3.63% | 09/09/24 | 150,000 | 157,972 | |||||||||||
Credit Suisse Group Funding Guernsey Ltd. | ||||||||||||||
| 4.88% | 05/15/45 | 150,000 | 175,398 | |||||||||||
Crown Castle International Corp. | ||||||||||||||
| 3.15% | 07/15/23 | 155,000 | 157,951 | |||||||||||
| 3.80% | 02/15/28 | 100,000 | 103,819 | |||||||||||
| 5.20% | 02/15/49 | 50,000 | 57,364 | |||||||||||
CSX Corp. | ||||||||||||||
| 2.60% | 11/01/26 | 100,000 | 98,988 | |||||||||||
| 4.10% | 03/15/44 | 68,000 | 71,354 | |||||||||||
| 4.50% | 03/15/49 | 95,000 | 106,568 | |||||||||||
| 4.75% | 11/15/48 | 65,000 | 75,541 | |||||||||||
See Notes to Schedule of Investments and Notes to Financial Statements.
Table of Contents
| State Street Total Return V.I.S. Fund | ||
| Schedule of Investments | June 30, 2019 (Unaudited) |
Principal Amount | Fair Value | |||||||||||||
CubeSmart LP | ||||||||||||||
| 4.38% | 02/15/29 | $ | 15,000 | $ | 15,974 | |||||||||
CVS Health Corp. | ||||||||||||||
| 2.75% | 12/01/22 | 150,000 | 150,640 | |||||||||||
| 3.35% | 03/09/21 | 195,000 | 197,720 | |||||||||||
| 3.38% | 08/12/24 | 150,000 | 153,484 | |||||||||||
| 3.70% | 03/09/23 | 115,000 | 118,811 | |||||||||||
| 4.10% | 03/25/25 | 150,000 | 158,232 | |||||||||||
| 4.30% | 03/25/28 | 110,000 | 116,021 | |||||||||||
| 4.78% | 03/25/38 | 145,000 | 151,218 | |||||||||||
| 5.05% | 03/25/48 | 215,000 | 229,270 | |||||||||||
Darden Restaurants Inc. | ||||||||||||||
| 4.55% | 02/15/48 | 15,000 | 15,041 | |||||||||||
Deere & Co. | ||||||||||||||
| 3.90% | 06/09/42 | 71,000 | 78,070 | |||||||||||
Dell International LLC/EMC Corp. | ||||||||||||||
| 5.30% | 10/01/29 | 100,000 | 105,314 | (c | ) | |||||||||
| 6.02% | 06/15/26 | 190,000 | 209,228 | (c | ) | |||||||||
| 8.10% | 07/15/36 | 100,000 | 121,989 | (c | ) | |||||||||
Delmarva Power & Light Co. | ||||||||||||||
| 4.15% | 05/15/45 | 100,000 | 107,180 | |||||||||||
Delta Air Lines Inc. | ||||||||||||||
| 2.60% | 12/04/20 | 45,000 | 44,938 | |||||||||||
| 3.40% | 04/19/21 | 100,000 | 101,359 | |||||||||||
| 3.80% | 04/19/23 | 30,000 | 30,799 | |||||||||||
| 4.38% | 04/19/28 | 50,000 | 50,997 | |||||||||||
Deutsche Bank AG | ||||||||||||||
| 2.95% | 08/20/20 | 150,000 | 149,087 | |||||||||||
| 3.30% | 11/16/22 | 100,000 | 98,550 | |||||||||||
| 3.38% | 05/12/21 | 150,000 | 149,162 | |||||||||||
Deutsche Telekom International Finance BV | ||||||||||||||
| 8.75% | 06/15/30 | 150,000 | 215,383 | |||||||||||
Devon Energy Corp. | ||||||||||||||
| 3.25% | 05/15/22 | 150,000 | 154,686 | |||||||||||
| 5.00% | 06/15/45 | 100,000 | 114,750 | |||||||||||
Diageo Investment Corp. | ||||||||||||||
| 2.88% | 05/11/22 | 150,000 | 152,742 | |||||||||||
Digital Realty Trust LP | ||||||||||||||
| 4.45% | 07/15/28 | 150,000 | 162,628 | |||||||||||
Discover Bank | ||||||||||||||
| 4.20% | 08/08/23 | 150,000 | 159,181 | |||||||||||
Discover Financial Services | ||||||||||||||
| 4.50% | 01/30/26 | 100,000 | 107,125 | |||||||||||
Discovery Communications LLC | ||||||||||||||
| 3.25% | 04/01/23 | 175,000 | 178,167 | |||||||||||
| 3.45% | 03/15/25 | 135,000 | 136,804 | |||||||||||
| 3.90% | 11/15/24 | 150,000 | 156,522 | |||||||||||
Dollar General Corp. | ||||||||||||||
| 4.13% | 05/01/28 | 70,000 | 74,463 | |||||||||||
Dollar Tree Inc. | ||||||||||||||
| 3.70% | 05/15/23 | 20,000 | 20,715 | |||||||||||
| 4.00% | 05/15/25 | 50,000 | 51,987 | |||||||||||
| 4.20% | 05/15/28 | 25,000 | 25,874 | |||||||||||
Dominion Energy Inc. | ||||||||||||||
| 2.58% | 07/01/20 | 100,000 | 99,897 | |||||||||||
| 4.25% | 06/01/28 | 150,000 | 162,862 | |||||||||||
Dominion Energy South Carolina Inc. | ||||||||||||||
| 5.10% | 06/01/65 | 50,000 | 62,647 | |||||||||||
DPL Inc. | ||||||||||||||
| 4.35% | 04/15/29 | 25,000 | 25,360 | (c | ) | |||||||||
DTE Electric Co. | ||||||||||||||
| 3.70% | 03/15/45 | 45,000 | 46,665 | |||||||||||
DTE Energy Co. | ||||||||||||||
| 3.85% | 12/01/23 | 150,000 | 157,195 | |||||||||||
Duke Energy Carolinas LLC | ||||||||||||||
| 3.05% | 03/15/23 | 150,000 | 154,425 | |||||||||||
| 3.70% | 12/01/47 | 50,000 | 51,004 | |||||||||||
| 3.95% | 03/15/48 | 50,000 | 53,094 | |||||||||||
Duke Energy Corp. | ||||||||||||||
| 3.05% | 08/15/22 | 139,000 | 141,656 | |||||||||||
Principal Amount | Fair Value | |||||||||||||
Duke Energy Florida LLC | ||||||||||||||
| 2.10% | 12/15/19 | $ | 5,000 | $ | 4,993 | |||||||||
| 3.20% | 01/15/27 | 100,000 | 103,369 | |||||||||||
| 3.40% | 10/01/46 | 100,000 | 97,128 | |||||||||||
| 3.80% | 07/15/28 | 50,000 | 53,871 | |||||||||||
Duke Energy Ohio Inc. | ||||||||||||||
| 3.65% | 02/01/29 | 100,000 | 107,381 | |||||||||||
| 4.30% | 02/01/49 | 100,000 | 111,864 | |||||||||||
Duke Energy Progress LLC | ||||||||||||||
| 3.70% | 09/01/28 | 100,000 | 107,092 | |||||||||||
Duke Realty LP | ||||||||||||||
| 3.38% | 12/15/27 | 50,000 | 51,051 | |||||||||||
DuPont de Nemours Inc. | ||||||||||||||
| 3.77% | 11/15/20 | 100,000 | 101,901 | |||||||||||
| 4.21% | 11/15/23 | 50,000 | 53,541 | |||||||||||
| 4.73% | 11/15/28 | 50,000 | 56,466 | |||||||||||
| 5.32% | 11/15/38 | 15,000 | 17,624 | |||||||||||
| 5.42% | 11/15/48 | 40,000 | 48,653 | |||||||||||
Eaton Vance Corp. | ||||||||||||||
| 3.50% | 04/06/27 | 100,000 | 103,513 | |||||||||||
eBay Inc. | ||||||||||||||
| 3.80% | 03/09/22 | 145,000 | 149,846 | |||||||||||
Ecolab Inc. | ||||||||||||||
| 2.38% | 08/10/22 | 100,000 | 100,310 | |||||||||||
| 3.25% | 12/01/27 | 70,000 | 72,813 | |||||||||||
Ecopetrol S.A. | ||||||||||||||
| 4.13% | 01/16/25 | 250,000 | 258,765 | |||||||||||
Edison International | ||||||||||||||
| 4.13% | 03/15/28 | 50,000 | 48,634 | |||||||||||
Eli Lilly & Co. | ||||||||||||||
| 2.75% | 06/01/25 | 45,000 | 45,916 | |||||||||||
| 3.38% | 03/15/29 | 30,000 | 31,973 | |||||||||||
| 3.88% | 03/15/39 | 50,000 | 54,269 | |||||||||||
| 3.95% | 03/15/49 | 50,000 | 54,120 | |||||||||||
| 4.15% | 03/15/59 | 50,000 | 54,818 | |||||||||||
Emera US Finance LP | ||||||||||||||
| 3.55% | 06/15/26 | 60,000 | 61,226 | |||||||||||
Emerson Electric Co. | ||||||||||||||
| 2.63% | 02/15/23 | 100,000 | 102,211 | |||||||||||
Enable Midstream Partners LP | ||||||||||||||
| 4.95% | 05/15/28 | 60,000 | 62,826 | |||||||||||
Enbridge Energy Partners LP | ||||||||||||||
| 5.88% | 10/15/25 | 125,000 | 144,923 | |||||||||||
Enbridge Inc. | ||||||||||||||
| 3.50% | 06/10/24 | 65,000 | 67,139 | |||||||||||
Enel Chile S.A. | ||||||||||||||
| 4.88% | 06/12/28 | 50,000 | 54,586 | |||||||||||
Energy Transfer Operating LP | ||||||||||||||
| 4.20% | 09/15/23 | 25,000 | 26,207 | |||||||||||
| 4.50% | 04/15/24 | 135,000 | 143,622 | |||||||||||
| 4.95% | 06/15/28 | 75,000 | 82,031 | |||||||||||
| 5.25% | 04/15/29 | 25,000 | 27,928 | |||||||||||
| 6.00% | 06/15/48 | 50,000 | 57,136 | |||||||||||
| 6.25% | 04/15/49 | 125,000 | 147,985 | |||||||||||
| 6.50% | 02/01/42 | 150,000 | 176,592 | |||||||||||
Entergy Louisiana LLC | ||||||||||||||
| 4.05% | 09/01/23 | 150,000 | 159,463 | |||||||||||
Entergy Texas Inc. | ||||||||||||||
| 4.00% | 03/30/29 | 100,000 | 107,620 | |||||||||||
| 4.50% | 03/30/39 | 100,000 | 111,011 | |||||||||||
Enterprise Products Operating LLC | ||||||||||||||
| 2.80% | 02/15/21 | 50,000 | 50,291 | |||||||||||
| 3.50% | 02/01/22 | 25,000 | 25,673 | |||||||||||
| 3.70% | 02/15/26 | 35,000 | 37,000 | |||||||||||
| 3.90% | 02/15/24 | 175,000 | 185,481 | |||||||||||
| 4.15% | 10/16/28 | 25,000 | 27,188 | |||||||||||
| 4.20% | 01/31/50 | 35,000 | 36,110 | (e | ) | |||||||||
| 4.25% | 02/15/48 | 25,000 | 25,829 | |||||||||||
| 4.45% | 02/15/43 | 142,000 | 148,969 | |||||||||||
| 4.80% | 02/01/49 | 25,000 | 27,861 | |||||||||||
Enterprise Products Operating LLC (5.38% fixed rate until 02/15/28; 2.57% + 3 month USD LIBOR thereafter) | ||||||||||||||
| 5.38% | 02/15/78 | 50,000 | 46,444 | (f | ) | |||||||||
See Notes to Schedule of Investments and Notes to Financial Statements.
Table of Contents
| State Street Total Return V.I.S. Fund | ||
| Schedule of Investments | June 30, 2019 (Unaudited) |
Principal Amount | Fair Value | |||||||||||||
EOG Resources Inc. | ||||||||||||||
| 3.15% | 04/01/25 | $ | 80,000 | $ | 82,199 | |||||||||
EPR Properties | ||||||||||||||
| 4.95% | 04/15/28 | 100,000 | 107,549 | |||||||||||
EQT Corp. | ||||||||||||||
| 3.90% | 10/01/27 | 150,000 | 142,263 | |||||||||||
Equinor ASA | ||||||||||||||
| 2.45% | 01/17/23 | 250,000 | 252,477 | |||||||||||
ERP Operating LP | ||||||||||||||
| 3.00% | 04/15/23 | 150,000 | 153,621 | |||||||||||
Essex Portfolio LP | ||||||||||||||
| 3.63% | 05/01/27 | 100,000 | 103,832 | |||||||||||
European Bank for Reconstruction & Development | ||||||||||||||
| 1.13% | 08/24/20 | 200,000 | 198,068 | |||||||||||
European Investment Bank | ||||||||||||||
| 1.63% | 12/15/20 | 500,000 | 497,985 | |||||||||||
| 2.00% | 12/15/22 | 200,000 | 201,408 | |||||||||||
| 2.25% | 06/24/24 | 250,000 | 254,877 | |||||||||||
| 2.38% | 05/13/21 | 250,000 | 252,415 | |||||||||||
| 2.63% | 03/15/24 | 285,000 | 295,083 | |||||||||||
| 2.88% | 12/15/21 | 115,000 | 117,969 | |||||||||||
| 3.13% | 12/14/23 | 200,000 | 211,016 | |||||||||||
Evergy Inc. | ||||||||||||||
| 4.85% | 06/01/21 | 104,000 | 107,670 | |||||||||||
Eversource Energy | ||||||||||||||
| 2.90% | 10/01/24 | 100,000 | 101,476 | |||||||||||
| 3.15% | 01/15/25 | 125,000 | 128,106 | |||||||||||
Express Scripts Holding Co. | ||||||||||||||
| 4.75% | 11/15/21 | 174,000 | 182,792 | |||||||||||
Exxon Mobil Corp. | ||||||||||||||
| 2.71% | 03/06/25 | 150,000 | 153,552 | |||||||||||
| 3.04% | 03/01/26 | 50,000 | 51,805 | |||||||||||
| 3.18% | 03/15/24 | 150,000 | 156,598 | |||||||||||
Federal Realty Investment Trust | ||||||||||||||
| 3.20% | 06/15/29 | 50,000 | 50,737 | |||||||||||
FedEx Corp. | ||||||||||||||
| 3.40% | 02/15/28 | 100,000 | 103,083 | |||||||||||
| 4.05% | 02/15/48 | 100,000 | 96,505 | |||||||||||
| 4.75% | 11/15/45 | 195,000 | 205,300 | |||||||||||
Fibria Overseas Finance Ltd. | ||||||||||||||
| 4.00% | 01/14/25 | 50,000 | 50,351 | |||||||||||
Fidelity National Financial Inc. | ||||||||||||||
| 4.50% | 08/15/28 | 25,000 | 26,109 | |||||||||||
Fidelity National Information Services Inc. | ||||||||||||||
| 4.25% | 05/15/28 | 80,000 | 87,548 | |||||||||||
| 4.75% | 05/15/48 | 100,000 | 111,647 | |||||||||||
Fifth Third Bancorp | ||||||||||||||
| 3.65% | 01/25/24 | 100,000 | 105,063 | |||||||||||
Fifth Third Bank | ||||||||||||||
| 2.20% | 10/30/20 | 100,000 | 99,880 | |||||||||||
| 2.88% | 10/01/21 | 80,000 | 80,951 | |||||||||||
FirstEnergy Corp. | ||||||||||||||
| 4.25% | 03/15/23 | 30,000 | 31,688 | |||||||||||
| 7.38% | 11/15/31 | 55,000 | 75,292 | |||||||||||
Fiserv Inc. | ||||||||||||||
| 2.75% | 07/01/24 | 100,000 | 100,999 | |||||||||||
| 3.50% | 07/01/29 | 45,000 | 46,341 | |||||||||||
| 3.80% | 10/01/23 | 25,000 | 26,300 | |||||||||||
| 4.20% | 10/01/28 | 30,000 | 32,444 | |||||||||||
| 4.40% | 07/01/49 | 40,000 | 42,169 | |||||||||||
Flex Ltd. | ||||||||||||||
| 4.88% | 06/15/29 | 25,000 | 25,438 | |||||||||||
Florida Power & Light Co. | ||||||||||||||
| 4.13% | 02/01/42 | 100,000 | 110,581 | |||||||||||
Fluor Corp. | ||||||||||||||
| 4.25% | 09/15/28 | 50,000 | 51,603 | |||||||||||
FMS Wertmanagement | ||||||||||||||
| 2.00% | 08/01/22 | 200,000 | 201,086 | |||||||||||
| 2.75% | 01/30/24 | 100,000 | 103,939 | |||||||||||
Ford Motor Co. | ||||||||||||||
| 4.35% | 12/08/26 | 100,000 | 100,875 | |||||||||||
| 4.75% | 01/15/43 | 150,000 | 130,376 | |||||||||||
Principal Amount | Fair Value | |||||||||||||
Ford Motor Credit Company LLC | ||||||||||||||
| 3.81% | 10/12/21 | $ | 200,000 | $ | 202,842 | |||||||||
| 5.11% | 05/03/29 | 100,000 | 102,175 | |||||||||||
| 5.60% | 01/07/22 | 200,000 | 211,686 | |||||||||||
Fox Corp. | ||||||||||||||
| 4.03% | 01/25/24 | 125,000 | 132,851 | (c | ) | |||||||||
GATX Corp. | ||||||||||||||
| 3.50% | 03/15/28 | 100,000 | 100,412 | |||||||||||
GE Capital International Funding Company Unlimited Co. | ||||||||||||||
| 2.34% | 11/15/20 | 200,000 | 199,038 | |||||||||||
| 4.42% | 11/15/35 | 300,000 | 296,925 | |||||||||||
General Dynamics Corp. | ||||||||||||||
| 3.00% | 05/11/21 | 50,000 | 50,799 | |||||||||||
| 3.38% | 05/15/23 | 50,000 | 52,215 | |||||||||||
| 3.75% | 05/15/28 | 55,000 | 60,020 | |||||||||||
General Electric Co. | ||||||||||||||
| 2.70% | 10/09/22 | 100,000 | 99,857 | |||||||||||
| 6.75% | 03/15/32 | 100,000 | 123,203 | |||||||||||
General Mills Inc. | ||||||||||||||
| 3.20% | 04/16/21 | 100,000 | 101,498 | |||||||||||
| 3.65% | 02/15/24 | 150,000 | 156,796 | |||||||||||
| 4.55% | 04/17/38 | 100,000 | 106,381 | |||||||||||
General Motors Financial Company Inc. | ||||||||||||||
| 2.45% | 11/06/20 | 100,000 | 99,642 | |||||||||||
| 3.25% | 01/05/23 | 50,000 | 50,174 | |||||||||||
| 3.45% | 01/14/22 | 100,000 | 101,463 | |||||||||||
| 3.50% | 11/07/24 | 100,000 | 99,871 | |||||||||||
| 3.55% | 04/09/21 | 100,000 | 101,472 | |||||||||||
| 3.70% | 05/09/23 | 100,000 | 101,504 | |||||||||||
| 4.35% | 01/17/27 | 100,000 | 101,935 | |||||||||||
| 4.38% | 09/25/21 | 100,000 | 103,232 | |||||||||||
| 5.10% | 01/17/24 | 100,000 | 106,923 | |||||||||||
| 5.25% | 03/01/26 | 155,000 | 166,425 | |||||||||||
Georgia Power Co. | ||||||||||||||
| 4.30% | 03/15/42 | 172,000 | 182,000 | |||||||||||
Georgia-Pacific LLC | ||||||||||||||
| 8.88% | 05/15/31 | 150,000 | 232,720 | |||||||||||
Gilead Sciences Inc. | ||||||||||||||
| 2.55% | 09/01/20 | 200,000 | 200,522 | |||||||||||
| 3.70% | 04/01/24 | 150,000 | 158,571 | |||||||||||
| 4.80% | 04/01/44 | 150,000 | 170,256 | |||||||||||
GlaxoSmithKline Capital Inc. | ||||||||||||||
| 3.38% | 05/15/23 | 100,000 | 104,039 | |||||||||||
| 3.63% | 05/15/25 | 55,000 | 58,499 | |||||||||||
| 3.88% | 05/15/28 | 100,000 | 109,260 | |||||||||||
GlaxoSmithKline Capital PLC | ||||||||||||||
| 3.13% | 05/14/21 | 70,000 | 71,175 | |||||||||||
GLP Capital LP/GLP Financing II Inc. | ||||||||||||||
| 4.88% | 11/01/20 | 30,000 | 30,584 | |||||||||||
| 5.25% | 06/01/25 | 10,000 | 10,710 | |||||||||||
| 5.38% | 11/01/23 - 04/15/26 | 30,000 | 32,393 | |||||||||||
| 5.75% | 06/01/28 | 10,000 | 11,024 | |||||||||||
Halliburton Co. | ||||||||||||||
| 3.50% | 08/01/23 | 100,000 | 103,381 | |||||||||||
| 5.00% | 11/15/45 | 150,000 | 163,440 | |||||||||||
Harris Corp. | ||||||||||||||
| 3.83% | 04/27/25 | 150,000 | 157,908 | |||||||||||
| 4.85% | 04/27/35 | 40,000 | 44,698 | |||||||||||
HCA Inc. | ||||||||||||||
| 4.50% | 02/15/27 | 30,000 | 31,985 | |||||||||||
| 4.75% | 05/01/23 | 30,000 | 32,069 | |||||||||||
| 5.00% | 03/15/24 | 50,000 | 54,464 | |||||||||||
| 5.13% | 06/15/39 | 100,000 | 104,179 | |||||||||||
| 5.25% | 04/15/25 - 06/15/26 | 70,000 | 77,461 | |||||||||||
| 5.50% | 06/15/47 | 35,000 | 37,521 | |||||||||||
| 5.88% | 03/15/22 | 150,000 | 164,313 | |||||||||||
HCP Inc. | ||||||||||||||
| 3.25% | 07/15/26 | 100,000 | 100,929 | (e | ) | |||||||||
Helmerich & Payne Inc. | ||||||||||||||
| 4.65% | 03/15/25 | 100,000 | 106,224 | |||||||||||
Hewlett Packard Enterprise Co. | ||||||||||||||
| 3.50% | 10/05/21 | 50,000 | 51,025 | |||||||||||
| 6.35% | 10/15/45 | 150,000 | 166,089 | |||||||||||
See Notes to Schedule of Investments and Notes to Financial Statements.
Table of Contents
| State Street Total Return V.I.S. Fund | ||
| Schedule of Investments | June 30, 2019 (Unaudited) |
Principal Amount | Fair Value | |||||||||||||
Highwoods Realty LP | ||||||||||||||
| 4.20% | 04/15/29 | $ | 25,000 | $ | 26,117 | |||||||||
Honeywell International Inc. | ||||||||||||||
| 3.35% | 12/01/23 | 150,000 | 157,081 | |||||||||||
Hospitality Properties Trust | ||||||||||||||
| 4.65% | 03/15/24 | 150,000 | 154,366 | |||||||||||
HP Inc. | ||||||||||||||
| 6.00% | 09/15/41 | 162,000 | 178,542 | |||||||||||
HSBC Bank USA NA | ||||||||||||||
| 5.88% | 11/01/34 | 150,000 | 188,619 | |||||||||||
HSBC Holdings PLC | ||||||||||||||
| 2.65% | 01/05/22 | 200,000 | 200,892 | |||||||||||
| 3.40% | 03/08/21 | 200,000 | 203,144 | |||||||||||
| 3.90% | 05/25/26 | 150,000 | 156,873 | |||||||||||
| 5.10% | 04/05/21 | 100,000 | 104,479 | |||||||||||
HSBC Holdings PLC (3.80% fixed rate until 03/11/24; 1.21% + 3 month USD LIBOR thereafter) | ||||||||||||||
| 3.80% | 03/11/25 | 100,000 | 104,103 | (f | ) | |||||||||
HSBC Holdings PLC (3.95% fixed rate until 05/18/23; 0.99% + 3 month USD LIBOR thereafter) | ||||||||||||||
| 3.95% | 05/18/24 | 100,000 | 104,479 | (f | ) | |||||||||
HSBC Holdings PLC (4.29% fixed rate until 09/12/25; 1.35% + 3 month USD LIBOR thereafter) | ||||||||||||||
| 4.29% | 09/12/26 | 200,000 | 212,866 | (f | ) | |||||||||
HSBC USA Inc. | ||||||||||||||
| 2.75% | 08/07/20 | 150,000 | 150,739 | |||||||||||
Hubbell Inc. | ||||||||||||||
| 3.50% | 02/15/28 | 50,000 | 50,545 | |||||||||||
Hudson Pacific Properties LP | ||||||||||||||
| 4.65% | 04/01/29 | 25,000 | 26,815 | |||||||||||
Humana Inc. | ||||||||||||||
| 2.50% | 12/15/20 | 50,000 | 49,999 | |||||||||||
| 2.90% | 12/15/22 | 100,000 | 101,369 | |||||||||||
Huntington Bancshares Inc. | ||||||||||||||
| 3.15% | 03/14/21 | 150,000 | 151,875 | |||||||||||
Huntsman International LLC | ||||||||||||||
| 4.50% | 05/01/29 | 20,000 | 20,604 | |||||||||||
Husky Energy Inc. | ||||||||||||||
| 4.00% | 04/15/24 | 100,000 | 104,858 | |||||||||||
IBM Credit LLC | ||||||||||||||
| 2.65% | 02/05/21 | 100,000 | 100,586 | |||||||||||
| 3.60% | 11/30/21 | 100,000 | 103,143 | |||||||||||
Illinois Tool Works Inc. | ||||||||||||||
| 2.65% | 11/15/26 | 100,000 | 100,983 | |||||||||||
| 3.50% | 03/01/24 | 50,000 | 52,677 | |||||||||||
Indiana Michigan Power Co. | ||||||||||||||
| 3.85% | 05/15/28 | 25,000 | 26,944 | |||||||||||
ING Groep N.V. | ||||||||||||||
| 3.95% | 03/29/27 | 100,000 | 105,137 | |||||||||||
Ingersoll-Rand Global Holding Company Ltd. | ||||||||||||||
| 4.25% | 06/15/23 | 100,000 | 106,376 | |||||||||||
Intel Corp. | ||||||||||||||
| 2.60% | 05/19/26 | 150,000 | 150,996 | |||||||||||
| 3.73% | 12/08/47 | 100,000 | 103,842 | |||||||||||
| 4.10% | 05/11/47 | 100,000 | 109,388 | |||||||||||
Inter-American Development Bank | ||||||||||||||
| 1.25% | 09/14/21 | 400,000 | 395,264 | |||||||||||
| 2.13% | 01/15/25 | 200,000 | 202,378 | |||||||||||
| 2.38% | 07/07/27 | 200,000 | 204,732 | |||||||||||
| 2.63% | 04/19/21 - 01/16/24 | 300,000 | 308,072 | |||||||||||
| 3.00% | 09/26/22 | 50,000 | 51,866 | |||||||||||
Intercontinental Exchange Inc. | ||||||||||||||
| 3.45% | 09/21/23 | 90,000 | 93,783 | |||||||||||
International Bank for Reconstruction & Development | ||||||||||||||
| 1.63% | 09/04/20 | 200,000 | 199,234 | |||||||||||
| 2.13% | 11/01/20 | 300,000 | 300,816 | |||||||||||
| 2.50% | 03/19/24 - 07/29/25 | 300,000 | 309,526 | |||||||||||
| 2.75% | 07/23/21 | 200,000 | 203,794 | |||||||||||
| 3.00% | 09/27/23 | 150,000 | 157,189 | |||||||||||
International Business Machines Corp. | ||||||||||||||
| 2.50% | 01/27/22 | 150,000 | 151,020 | |||||||||||
Principal Amount | Fair Value | |||||||||||||
| 2.85% | 05/13/22 | $ | 100,000 | $ | 101,724 | |||||||||
| 3.00% | 05/15/24 | 100,000 | 102,669 | |||||||||||
| 3.50% | 05/15/29 | 130,000 | 135,968 | |||||||||||
| 4.00% | 06/20/42 | 150,000 | 154,915 | |||||||||||
| 4.25% | 05/15/49 | 100,000 | 107,385 | |||||||||||
International Finance Corp. | ||||||||||||||
| 2.00% | 10/24/22 | 100,000 | 100,723 | |||||||||||
| 2.13% | 04/07/26 | 150,000 | 151,594 | |||||||||||
| 2.25% | 01/25/21 | 100,000 | 100,556 | |||||||||||
International Flavors & Fragrances Inc. | ||||||||||||||
| 5.00% | 09/26/48 | 15,000 | 16,645 | |||||||||||
International Paper Co. | ||||||||||||||
| 3.65% | 06/15/24 | 150,000 | 156,865 | |||||||||||
Invesco Finance PLC | ||||||||||||||
| 3.13% | 11/30/22 | 200,000 | 204,204 | |||||||||||
Jabil Inc. | ||||||||||||||
| 3.95% | 01/12/28 | 100,000 | 97,910 | |||||||||||
| 4.70% | 09/15/22 | 23,000 | 23,998 | |||||||||||
Jefferies Group LLC | ||||||||||||||
| 5.13% | 01/20/23 | 150,000 | 160,762 | |||||||||||
John Deere Capital Corp. | ||||||||||||||
| 2.30% | 06/07/21 | 100,000 | 100,274 | |||||||||||
| 2.35% | 01/08/21 | 100,000 | 100,278 | |||||||||||
| 2.70% | 01/06/23 | 100,000 | 101,535 | |||||||||||
| 2.88% | 03/12/21 | 50,000 | 50,573 | |||||||||||
| 2.95% | 04/01/22 | 100,000 | 102,017 | |||||||||||
| 3.45% | 06/07/23 - 03/13/25 | 175,000 | 183,421 | |||||||||||
Johnson & Johnson | ||||||||||||||
| 1.95% | 11/10/20 | 15,000 | 15,000 | |||||||||||
| 2.45% | 12/05/21 - 03/01/26 | 275,000 | 277,326 | |||||||||||
| 2.90% | 01/15/28 | 50,000 | 51,484 | |||||||||||
| 3.40% | 01/15/38 | 25,000 | 25,976 | |||||||||||
| 3.50% | 01/15/48 | 30,000 | 31,456 | |||||||||||
| 4.38% | 12/05/33 | 150,000 | 175,903 | |||||||||||
Johnson Controls International PLC | ||||||||||||||
| 3.63% | 07/02/24 | 75,000 | 77,864 | (g | ) | |||||||||
JPMorgan Chase & Co. | ||||||||||||||
| 3.13% | 01/23/25 | 150,000 | 154,192 | |||||||||||
| 3.25% | 09/23/22 | 236,000 | 242,471 | |||||||||||
| 3.38% | 05/01/23 | 150,000 | 154,185 | |||||||||||
| 4.50% | 01/24/22 | 203,000 | 213,970 | |||||||||||
| 4.63% | 05/10/21 | 200,000 | 208,180 | |||||||||||
| 6.40% | 05/15/38 | 100,000 | 137,782 | |||||||||||
JPMorgan Chase & Co. (3.21% fixed rate until 04/01/22; 0.70% + 3 month USD LIBOR thereafter) | ||||||||||||||
| 3.21% | 04/01/23 | 80,000 | 81,604 | (f | ) | |||||||||
JPMorgan Chase & Co. (3.51% fixed rate until 06/18/21; 0.61% + 3 month USD LIBOR thereafter) | ||||||||||||||
| 3.51% | 06/18/22 | 100,000 | 102,175 | (f | ) | |||||||||
JPMorgan Chase & Co. (3.54% fixed rate until 05/01/27; 1.38% + 3 month USD LIBOR thereafter) | ||||||||||||||
| 3.54% | 05/01/28 | 150,000 | 156,103 | (f | ) | |||||||||
JPMorgan Chase & Co. (3.80% fixed rate until 07/23/23; 0.89% + 3 month USD LIBOR thereafter) | ||||||||||||||
| 3.80% | 07/23/24 | 200,000 | 209,486 | (f | ) | |||||||||
JPMorgan Chase & Co. (3.88% fixed rate until 07/24/37; 1.36% + 3 month USD LIBOR thereafter) | ||||||||||||||
| 3.88% | 07/24/38 | 250,000 | 261,675 | (f | ) | |||||||||
JPMorgan Chase & Co. (3.90% fixed rate until 01/23/48; 1.22% + 3 month USD LIBOR thereafter) | ||||||||||||||
| 3.90% | 01/23/49 | 100,000 | 105,001 | (f | ) | |||||||||
JPMorgan Chase & Co. (3.96% fixed rate until 01/29/26; 1.25% + 3 month USD LIBOR thereafter) | ||||||||||||||
| 3.96% | 01/29/27 | 100,000 | 106,968 | (f | ) | |||||||||
JPMorgan Chase & Co. (4.02% fixed rate until 12/05/23; 1.00% + 3 month USD LIBOR thereafter) | ||||||||||||||
| 4.02% | 12/05/24 | 150,000 | 159,298 | (f | ) | |||||||||
JPMorgan Chase & Co. (4.45% fixed rate until 12/05/28; 1.33% + 3 month USD LIBOR thereafter) | ||||||||||||||
| 4.45% | 12/05/29 | 150,000 | 166,777 | (f | ) | |||||||||
See Notes to Schedule of Investments and Notes to Financial Statements.
Table of Contents
| State Street Total Return V.I.S. Fund | ||
| Schedule of Investments | June 30, 2019 (Unaudited) |
Principal Amount | Fair Value | |||||||||||||
JPMorgon Chase & Co. (3.70% fixed rate until 05/06/29; 1.16% + 3 month USD LIBOR thereafter) | ||||||||||||||
| 3.70% | 05/06/30 | $ | 175,000 | $ | 184,532 | (f | ) | |||||||
Kaiser Foundation Hospitals | ||||||||||||||
| 4.15% | 05/01/47 | 100,000 | 111,438 | |||||||||||
Kansas City Power & Light Co. | ||||||||||||||
| 4.20% | 06/15/47 | 100,000 | 110,119 | |||||||||||
Kansas City Southern | ||||||||||||||
| 4.70% | 05/01/48 | 50,000 | 55,951 | |||||||||||
Kellogg Co. | ||||||||||||||
| 2.65% | 12/01/23 | 100,000 | 101,162 | |||||||||||
Kennametal Inc. | ||||||||||||||
| 4.63% | 06/15/28 | 25,000 | 26,031 | |||||||||||
Kentucky Utilities Co. | ||||||||||||||
| 4.38% | 10/01/45 | 40,000 | 45,074 | |||||||||||
Keurig Dr Pepper Inc. | ||||||||||||||
| 3.13% | 12/15/23 | 100,000 | 101,396 | |||||||||||
Keurig Dr Pepper Inc. | ||||||||||||||
| 3.55% | 05/25/21 | 100,000 | 101,993 | |||||||||||
| 4.60% | 05/25/28 | 50,000 | 54,778 | |||||||||||
| 4.99% | 05/25/38 | 125,000 | 137,669 | |||||||||||
KeyBank NA | ||||||||||||||
| 3.38% | 03/07/23 | 150,000 | 155,388 | |||||||||||
| 3.90% | 04/13/29 | 100,000 | 106,312 | |||||||||||
KeyCorp | ||||||||||||||
| 2.90% | 09/15/20 | 125,000 | 125,745 | |||||||||||
Kilroy Realty LP | ||||||||||||||
| 3.45% | 12/15/24 | 50,000 | 51,378 | |||||||||||
Kimberly-Clark Corp. | ||||||||||||||
| 3.20% | 07/30/46 | 125,000 | 120,208 | |||||||||||
Kinder Morgan Energy Partners LP | ||||||||||||||
| 5.00% | 08/15/42 | 242,000 | 256,830 | |||||||||||
Kinder Morgan Inc. | ||||||||||||||
| 4.30% | 06/01/25 | 115,000 | 122,804 | |||||||||||
| 5.05% | 02/15/46 | 150,000 | 163,386 | |||||||||||
| 5.30% | 12/01/34 | 100,000 | 113,080 | |||||||||||
KLA-Tencor Corp. | ||||||||||||||
| 4.65% | 11/01/24 | 115,000 | 125,919 | |||||||||||
Kraft Heinz Foods Co. | ||||||||||||||
| 3.38% | 06/15/21 | 15,000 | 15,244 | |||||||||||
| 4.00% | 06/15/23 | 100,000 | 104,583 | |||||||||||
| 4.63% | 01/30/29 | 50,000 | 53,863 | |||||||||||
| 5.00% | 06/04/42 | 150,000 | 154,390 | |||||||||||
| 5.20% | 07/15/45 | 150,000 | 156,993 | |||||||||||
Kreditanstalt fuer Wiederaufbau | ||||||||||||||
| 1.75% | 09/15/21 | 300,000 | 299,655 | |||||||||||
| 1.88% | 12/15/20 | 150,000 | 149,901 | |||||||||||
| 2.00% | 09/29/22 - 05/02/25 | 350,000 | 352,276 | |||||||||||
| 2.13% | 03/07/22 | 400,000 | 403,516 | |||||||||||
| 2.50% | 02/15/22 | 200,000 | 203,606 | |||||||||||
| 2.63% | 04/12/21 - 02/28/24 | 375,000 | 384,790 | |||||||||||
| 2.88% | 04/03/28 | 175,000 | 186,168 | |||||||||||
L3 Technologies Inc. | ||||||||||||||
| 3.85% | 12/15/26 | 100,000 | 105,047 | |||||||||||
Laboratory Corporation of America Holdings | ||||||||||||||
| 4.00% | 11/01/23 | 100,000 | 104,801 | |||||||||||
Lam Research Corp. | ||||||||||||||
| 3.80% | 03/15/25 | 115,000 | 121,542 | |||||||||||
Landwirtschaftliche Rentenbank | ||||||||||||||
| 2.50% | 11/15/27 | 200,000 | 206,550 | |||||||||||
Lazard Group LLC | ||||||||||||||
| 4.38% | 03/11/29 | 150,000 | 158,242 | |||||||||||
Lear Corp. | ||||||||||||||
| 4.25% | 05/15/29 | 25,000 | 25,220 | |||||||||||
Leggett & Platt Inc. | ||||||||||||||
| 3.50% | 11/15/27 | 50,000 | 49,651 | |||||||||||
| 4.40% | 03/15/29 | 100,000 | 104,674 | |||||||||||
Liberty Property LP | ||||||||||||||
| 4.38% | 02/01/29 | 65,000 | 70,240 | |||||||||||
Life Storage LP | ||||||||||||||
| 4.00% | 06/15/29 | 50,000 | 51,283 | |||||||||||
Principal Amount | Fair Value | |||||||||||||
Lincoln National Corp. | ||||||||||||||
| 3.63% | 12/12/26 | $ | 50,000 | $ | 52,126 | |||||||||
| 4.20% | 03/15/22 | 117,000 | 122,370 | |||||||||||
Lloyds Bank PLC | ||||||||||||||
| 2.70% | 08/17/20 | 150,000 | 150,546 | |||||||||||
Lloyds Banking Group PLC | ||||||||||||||
| 3.00% | 01/11/22 | 100,000 | 100,951 | |||||||||||
| 3.90% | 03/12/24 | 100,000 | 104,120 | |||||||||||
| 4.45% | 05/08/25 | 100,000 | 106,364 | |||||||||||
| 4.65% | 03/24/26 | 150,000 | 156,438 | |||||||||||
Lockheed Martin Corp. | ||||||||||||||
| 3.60% | 03/01/35 | 55,000 | 57,016 | |||||||||||
| 4.70% | 05/15/46 | 150,000 | 181,891 | |||||||||||
Loews Corp. | ||||||||||||||
| 2.63% | 05/15/23 | 100,000 | 100,833 | |||||||||||
Lowe’s Companies Inc. | ||||||||||||||
| 2.50% | 04/15/26 | 130,000 | 127,599 | |||||||||||
| 3.38% | 09/15/25 | 30,000 | 31,190 | |||||||||||
| 4.05% | 05/03/47 | 100,000 | 99,542 | |||||||||||
LYB International Finance II BV | ||||||||||||||
| 3.50% | 03/02/27 | 100,000 | 101,755 | |||||||||||
LyondellBasell Industries N.V. | ||||||||||||||
| 6.00% | 11/15/21 | 100,000 | 107,230 | |||||||||||
M&T Bank Corp. | ||||||||||||||
| 3.55% | 07/26/23 | 150,000 | 156,832 | |||||||||||
Macy’s Retail Holdings Inc. | ||||||||||||||
| 3.88% | 01/15/22 | 150,000 | 152,346 | |||||||||||
Magellan Midstream Partners LP | ||||||||||||||
| 4.85% | 02/01/49 | 100,000 | 113,545 | |||||||||||
Marathon Petroleum Corp. | ||||||||||||||
| 3.80% | 04/01/28 | 30,000 | 30,522 | |||||||||||
| 4.50% | 04/01/48 | 25,000 | 25,091 | |||||||||||
| 4.75% | 12/15/23 | 50,000 | 53,913 | |||||||||||
| 5.13% | 12/15/26 | 50,000 | 54,855 | |||||||||||
Markel Corp. | ||||||||||||||
| 3.50% | 11/01/27 | 50,000 | 49,955 | |||||||||||
Marriott International Inc. | ||||||||||||||
| 3.60% | 04/15/24 | 100,000 | 104,182 | |||||||||||
| 4.00% | 04/15/28 | 150,000 | 157,974 | |||||||||||
Marsh & McLennan Companies Inc. | ||||||||||||||
| 3.88% | 03/15/24 | 100,000 | 106,083 | |||||||||||
| 4.38% | 03/15/29 | 25,000 | 27,591 | |||||||||||
| 4.75% | 03/15/39 | 100,000 | 114,516 | |||||||||||
| 4.90% | 03/15/49 | 15,000 | 17,780 | |||||||||||
Martin Marietta Materials Inc. | ||||||||||||||
| 3.50% | 12/15/27 | 50,000 | 49,943 | |||||||||||
Masco Corp. | ||||||||||||||
| 3.50% | 04/01/21 | 60,000 | 60,920 | |||||||||||
| 4.38% | 04/01/26 | 40,000 | 42,055 | |||||||||||
Massachusetts Institute of Technology | ||||||||||||||
| 3.89% | 07/01/16 | 126,000 | 133,546 | |||||||||||
Mastercard Inc. | ||||||||||||||
| 2.95% | 11/21/26 | 100,000 | 103,173 | |||||||||||
McDonald’s Corp. | ||||||||||||||
| 2.75% | 12/09/20 | 200,000 | 201,222 | |||||||||||
| 3.70% | 02/15/42 | 150,000 | 146,651 | |||||||||||
| 3.80% | 04/01/28 | 50,000 | 53,737 | |||||||||||
McKesson Corp. | ||||||||||||||
| 3.80% | 03/15/24 | 150,000 | 157,429 | |||||||||||
Mead Johnson Nutrition Co. | ||||||||||||||
| 4.13% | 11/15/25 | 110,000 | 119,019 | |||||||||||
Medtronic Inc. | ||||||||||||||
| 3.63% | 03/15/24 | 100,000 | 105,743 | |||||||||||
| 4.63% | 03/15/45 | 100,000 | 120,915 | |||||||||||
Memorial Sloan-Kettering Cancer Center | ||||||||||||||
| 4.13% | 07/01/52 | 195,000 | 217,171 | |||||||||||
Merck & Company Inc. | ||||||||||||||
| 2.40% | 09/15/22 | 128,000 | 129,324 | |||||||||||
| 2.75% | 02/10/25 | 70,000 | 71,797 | |||||||||||
| 2.90% | 03/07/24 | 100,000 | 103,357 | |||||||||||
| 3.40% | 03/07/29 | 25,000 | 26,561 | |||||||||||
| 3.90% | 03/07/39 | 25,000 | 27,291 | |||||||||||
| 4.00% | 03/07/49 | 115,000 | 127,743 | |||||||||||
See Notes to Schedule of Investments and Notes to Financial Statements.
Table of Contents
| State Street Total Return V.I.S. Fund | ||
| Schedule of Investments | June 30, 2019 (Unaudited) |
Principal Amount | Fair Value | |||||||||||||
Mercy Health | ||||||||||||||
| 4.30% | 07/01/28 | $ | 100,000 | $ | 110,310 | |||||||||
MetLife Inc. | ||||||||||||||
| 4.13% | 08/13/42 | 150,000 | 161,709 | |||||||||||
| 6.50% | 12/15/32 | 150,000 | 204,154 | |||||||||||
Microchip Technology Inc. | ||||||||||||||
| 3.92% | 06/01/21 | 100,000 | 101,849 | |||||||||||
Micron Technology Inc. | ||||||||||||||
| 4.64% | 02/06/24 | 15,000 | 15,644 | |||||||||||
Microsoft Corp. | ||||||||||||||
| 1.55% | 08/08/21 | 150,000 | 148,724 | |||||||||||
| 2.40% | 02/06/22 | 100,000 | 101,067 | |||||||||||
| 2.88% | 02/06/24 | 150,000 | 155,373 | |||||||||||
| 3.45% | 08/08/36 | 200,000 | 211,362 | |||||||||||
| 3.50% | 02/12/35 | 65,000 | 69,284 | |||||||||||
| 3.75% | 05/01/43 | 150,000 | 163,068 | |||||||||||
| 4.10% | 02/06/37 | 100,000 | 114,137 | |||||||||||
| 4.45% | 11/03/45 | 225,000 | 270,751 | |||||||||||
Mid-America Apartments LP | ||||||||||||||
| 4.20% | 06/15/28 | 100,000 | 107,467 | |||||||||||
MidAmerican Energy Co. | ||||||||||||||
| 3.65% | 04/15/29 | 100,000 | 107,908 | |||||||||||
Mitsubishi UFJ Financial Group Inc. | ||||||||||||||
| 2.76% | 09/13/26 | 150,000 | 149,654 | |||||||||||
| 3.22% | 03/07/22 | 100,000 | 102,106 | |||||||||||
| 3.46% | 03/02/23 | 100,000 | 103,209 | |||||||||||
| 3.78% | 03/02/25 | 100,000 | 105,739 | |||||||||||
| 3.96% | 03/02/28 | 100,000 | 108,509 | |||||||||||
| 4.05% | 09/11/28 | 100,000 | 109,726 | |||||||||||
| 4.15% | 03/07/39 | 70,000 | 76,651 | |||||||||||
Mizuho Financial Group Inc. | ||||||||||||||
| 3.55% | 03/05/23 | 100,000 | 103,448 | |||||||||||
| 4.02% | 03/05/28 | 100,000 | 109,019 | |||||||||||
Molson Coors Brewing Co. | ||||||||||||||
| 3.00% | 07/15/26 | 95,000 | 93,840 | |||||||||||
Mondelez International Inc. | ||||||||||||||
| 4.13% | 05/07/28 | 100,000 | 108,120 | |||||||||||
Moody’s Corp. | ||||||||||||||
| 4.88% | 02/15/24 - 12/17/48 | 250,000 | 280,948 | |||||||||||
Morgan Stanley | ||||||||||||||
| 2.63% | 11/17/21 | 200,000 | 201,200 | |||||||||||
| 2.75% | 05/19/22 | 200,000 | 202,088 | |||||||||||
| 3.13% | 01/23/23 | 200,000 | 204,504 | |||||||||||
| 3.95% | 04/23/27 | 150,000 | 156,897 | |||||||||||
| 4.00% | 07/23/25 | 95,000 | 101,823 | |||||||||||
| 4.10% | 05/22/23 | 150,000 | 157,789 | |||||||||||
| 4.35% | 09/08/26 | 150,000 | 160,821 | |||||||||||
| 4.88% | 11/01/22 | 150,000 | 160,452 | |||||||||||
| 5.50% | 07/28/21 | 98,000 | 104,054 | |||||||||||
Morgan Stanley (3.74% fixed rate until 04/24/23; 0.85% + 3 month USD LIBOR thereafter) | ||||||||||||||
| 3.74% | 04/24/24 | 110,000 | 114,693 | (f | ) | |||||||||
Morgan Stanley (3.77% fixed rate until 01/24/28; 1.14% + 3 month USD LIBOR thereafter) | ||||||||||||||
| 3.77% | 01/24/29 | 100,000 | 105,365 | (f | ) | |||||||||
Morgan Stanley (4.46% fixed rate until 04/22/38; 1.43% + 3 month USD LIBOR thereafter) | ||||||||||||||
| 4.46% | 04/22/39 | 100,000 | 110,742 | (f | ) | |||||||||
Motorola Solutions Inc. | ||||||||||||||
| 4.60% | 02/23/28 | 100,000 | 104,854 | |||||||||||
MPLX LP | ||||||||||||||
| 4.00% | 03/15/28 | 35,000 | 36,289 | |||||||||||
| 4.50% | 04/15/38 | 30,000 | 30,302 | |||||||||||
| 4.70% | 04/15/48 | 25,000 | 25,446 | |||||||||||
| 4.80% | 02/15/29 | 70,000 | 77,026 | |||||||||||
| 4.90% | 04/15/58 | 25,000 | 25,285 | |||||||||||
| 5.50% | 02/15/49 | 70,000 | 79,277 | |||||||||||
MUFG Americas Holdings Corp. | ||||||||||||||
| 3.00% | 02/10/25 | 120,000 | 121,261 | |||||||||||
MUFG Union Bank NA | ||||||||||||||
| 3.15% | 04/01/22 | 100,000 | 102,210 | |||||||||||
Principal Amount | Fair Value | |||||||||||||
Mylan Inc. | ||||||||||||||
| 4.55% | 04/15/28 | $ | 100,000 | $ | 98,176 | |||||||||
Mylan N.V. | ||||||||||||||
| 3.15% | 06/15/21 | 200,000 | 199,710 | |||||||||||
National Australia Bank Ltd. | ||||||||||||||
| 2.80% | 01/10/22 | 100,000 | 101,248 | |||||||||||
National Fuel Gas Co. | ||||||||||||||
| 4.75% | 09/01/28 | 50,000 | 52,472 | |||||||||||
National Retail Properties Inc. | ||||||||||||||
| 3.60% | 12/15/26 | 100,000 | 102,673 | |||||||||||
National Rural Utilities Cooperative Finance Corp. | ||||||||||||||
| 2.90% | 03/15/21 | 70,000 | 70,887 | |||||||||||
| 3.40% | 02/07/28 | 100,000 | 104,857 | |||||||||||
| 3.70% | 03/15/29 | 50,000 | 53,832 | |||||||||||
| 4.40% | 11/01/48 | 10,000 | 11,411 | |||||||||||
NetApp Inc. | ||||||||||||||
| 3.38% | 06/15/21 | 110,000 | 111,337 | |||||||||||
Newmont Goldcorp Corp. | ||||||||||||||
| 3.50% | 03/15/22 | 150,000 | 153,439 | |||||||||||
Nexen Inc. | ||||||||||||||
| 6.40% | 05/15/37 | 200,000 | 266,944 | |||||||||||
NextEra Energy Capital Holdings Inc. | ||||||||||||||
| 3.15% | 04/01/24 | 100,000 | 102,876 | |||||||||||
| 3.34% | 09/01/20 | 100,000 | 101,143 | |||||||||||
| 3.50% | 04/01/29 | 100,000 | 103,976 | |||||||||||
NIKE Inc. | ||||||||||||||
| 2.38% | 11/01/26 | 150,000 | 150,239 | |||||||||||
NiSource Inc. | ||||||||||||||
| 2.65% | 11/17/22 | 40,000 | 40,265 | |||||||||||
| 3.65% | 06/15/23 | 100,000 | 103,528 | |||||||||||
| 4.38% | 05/15/47 | 100,000 | 107,086 | |||||||||||
Nordic Investment Bank | ||||||||||||||
| 2.25% | 02/01/21 | 200,000 | 201,044 | |||||||||||
Norfolk Southern Corp. | ||||||||||||||
| 3.80% | 08/01/28 | 30,000 | 32,344 | |||||||||||
| 3.94% | 11/01/47 | 160,000 | 166,339 | |||||||||||
| 4.15% | 02/28/48 | 100,000 | 107,381 | |||||||||||
Northern Trust Corp. | ||||||||||||||
| 3.65% | 08/03/28 | 100,000 | 107,864 | |||||||||||
Northrop Grumman Corp. | ||||||||||||||
| 2.08% | 10/15/20 | 60,000 | 59,906 | |||||||||||
| 2.55% | 10/15/22 | 100,000 | 100,569 | |||||||||||
| 2.93% | 01/15/25 | 50,000 | 50,907 | |||||||||||
| 3.25% | 01/15/28 | 65,000 | 66,748 | |||||||||||
| 4.03% | 10/15/47 | 75,000 | 79,982 | |||||||||||
Northwestern University | ||||||||||||||
| 3.66% | 12/01/57 | 10,000 | 10,731 | |||||||||||
Novartis Capital Corp. | ||||||||||||||
| 2.40% | 09/21/22 | 202,000 | 203,875 | |||||||||||
| 3.00% | 11/20/25 | 150,000 | 154,942 | |||||||||||
NSTAR Electric Co. | ||||||||||||||
| 3.20% | 05/15/27 | 100,000 | 103,097 | |||||||||||
Nutrien Ltd. | ||||||||||||||
| 3.63% | 03/15/24 | 150,000 | 155,520 | |||||||||||
| 4.00% | 12/15/26 | 100,000 | 104,526 | |||||||||||
| 5.00% | 04/01/49 | 50,000 | 56,622 | |||||||||||
NXP BV/NXP Funding LLC | ||||||||||||||
| 5.55% | 12/01/28 | 200,000 | 225,102 | (c | ) | |||||||||
O’Reilly Automotive Inc. | ||||||||||||||
| 4.35% | 06/01/28 | 100,000 | 108,334 | |||||||||||
Occidental Petroleum Corp. | ||||||||||||||
| 3.40% | 04/15/26 | 140,000 | 142,892 | |||||||||||
| 4.10% | 02/15/47 | 100,000 | 99,090 | |||||||||||
Oesterreichische Kontrollbank AG | ||||||||||||||
| 2.63% | 01/31/22 | 150,000 | 152,991 | |||||||||||
| 2.88% | 09/07/21 | 100,000 | 102,183 | |||||||||||
Ohio Power Co. | ||||||||||||||
| 4.15% | 04/01/48 | 100,000 | 108,802 | |||||||||||
Oklahoma Gas & Electric Co. | ||||||||||||||
| 3.30% | 03/15/30 | 50,000 | 50,831 | |||||||||||
Omega Healthcare Investors Inc. | ||||||||||||||
| 4.50% | 04/01/27 | 100,000 | 104,479 | |||||||||||
See Notes to Schedule of Investments and Notes to Financial Statements.
Table of Contents
| State Street Total Return V.I.S. Fund | ||
| Schedule of Investments | June 30, 2019 (Unaudited) |
Principal Amount | Fair Value | |||||||||||||
Omnicom Group Inc./Omnicom Capital Inc. | ||||||||||||||
| 3.63% | 05/01/22 | $ | 100,000 | $ | 103,158 | |||||||||
Oncor Electric Delivery Company LLC | ||||||||||||||
| 2.75% | 06/01/24 | 100,000 | 101,940 | (c | ) | |||||||||
| 3.70% | 11/15/28 | 100,000 | 107,581 | (c | ) | |||||||||
| 3.80% | 06/01/49 | 100,000 | 105,639 | (c | ) | |||||||||
ONE Gas Inc. | ||||||||||||||
| 4.50% | 11/01/48 | 20,000 | 22,867 | |||||||||||
ONEOK Inc. | ||||||||||||||
| 4.35% | 03/15/29 | 50,000 | 53,443 | |||||||||||
ONEOK Partners LP | ||||||||||||||
| 6.13% | 02/01/41 | 162,000 | 189,428 | |||||||||||
Oracle Corp. | ||||||||||||||
| 2.65% | 07/15/26 | 200,000 | 200,788 | |||||||||||
| 2.95% | 11/15/24 | 200,000 | 206,028 | |||||||||||
| 3.25% | 05/15/30 | 150,000 | 157,446 | |||||||||||
| 3.63% | 07/15/23 | 125,000 | 131,831 | |||||||||||
| 4.00% | 07/15/46 - 11/15/47 | 200,000 | 214,776 | |||||||||||
| 4.30% | 07/08/34 | 100,000 | 113,723 | |||||||||||
Orange S.A. | ||||||||||||||
| 9.00% | 03/01/31 | 150,000 | 228,217 | |||||||||||
ORIX Corp. | ||||||||||||||
| 4.05% | 01/16/24 | 100,000 | 106,035 | |||||||||||
Owens Corning | ||||||||||||||
| 4.20% | 12/15/22 | 150,000 | 156,546 | |||||||||||
PACCAR Financial Corp. | ||||||||||||||
| 2.05% | 11/13/20 | 50,000 | 49,931 | |||||||||||
| 3.10% | 05/10/21 | 20,000 | 20,317 | |||||||||||
PacifiCorp | ||||||||||||||
| 4.15% | 02/15/50 | 50,000 | 55,314 | |||||||||||
| 6.25% | 10/15/37 | 153,000 | 206,200 | |||||||||||
Packaging Corporation of America | ||||||||||||||
| 2.45% | 12/15/20 | 70,000 | 69,946 | |||||||||||
| 3.40% | 12/15/27 | 35,000 | 35,437 | |||||||||||
Parker-Hannifin Corp. | ||||||||||||||
| 4.00% | 06/14/49 | 20,000 | 21,228 | |||||||||||
| 4.20% | 11/21/34 | 100,000 | 110,057 | |||||||||||
Patterson-UTI Energy Inc. | ||||||||||||||
| 3.95% | 02/01/28 | 100,000 | 98,662 | |||||||||||
PepsiCo Inc. | ||||||||||||||
| 2.00% | 04/15/21 | 200,000 | 199,710 | |||||||||||
| 2.75% | 03/01/23 | 150,000 | 153,330 | |||||||||||
| 3.00% | 10/15/27 | 100,000 | 103,949 | |||||||||||
| 3.45% | 10/06/46 | 50,000 | 51,393 | |||||||||||
Petroleos Mexicanos | ||||||||||||||
| 4.50% | 01/23/26 | 100,000 | 91,709 | |||||||||||
| 5.50% | 01/21/21 - 06/27/44 | 258,000 | 249,145 | |||||||||||
| 6.38% | 01/23/45 | 250,000 | 213,802 | |||||||||||
| 6.50% | 01/23/29 - 06/02/41 | 242,000 | 220,509 | |||||||||||
| 6.75% | 09/21/47 | 113,000 | 100,048 | |||||||||||
Pfizer Inc. | ||||||||||||||
| 2.80% | 03/11/22 | 100,000 | 101,974 | |||||||||||
| 3.00% | 09/15/21 | 120,000 | 122,431 | |||||||||||
| 3.20% | 09/15/23 | 125,000 | 129,920 | |||||||||||
| 3.45% | 03/15/29 | 50,000 | 52,897 | |||||||||||
| 3.60% | 09/15/28 | 50,000 | 53,997 | |||||||||||
| 3.90% | 03/15/39 | 125,000 | 134,594 | |||||||||||
| 4.00% | 12/15/36 - 03/15/49 | 125,000 | 136,085 | |||||||||||
| 4.30% | 06/15/43 | 100,000 | 112,427 | |||||||||||
Philip Morris International Inc. | ||||||||||||||
| 2.88% | 05/01/24 | 150,000 | 152,302 | |||||||||||
| 3.13% | 03/02/28 | 50,000 | 50,800 | |||||||||||
| 3.38% | 08/15/29 | 150,000 | 154,465 | |||||||||||
| 3.88% | 08/21/42 | 92,000 | 91,059 | |||||||||||
Phillips 66 | ||||||||||||||
| 3.90% | 03/15/28 | 50,000 | 52,705 | |||||||||||
| 4.88% | 11/15/44 | 45,000 | 50,233 | |||||||||||
Phillips 66 Partners LP | ||||||||||||||
| 3.75% | 03/01/28 | 10,000 | 10,210 | |||||||||||
| 4.68% | 02/15/45 | 10,000 | 10,305 | |||||||||||
Pinnacle West Capital Corp. | ||||||||||||||
| 2.25% | 11/30/20 | 45,000 | 44,838 | |||||||||||
Principal Amount | Fair Value | |||||||||||||
Plains All American Pipeline LP/PAA Finance Corp. | ||||||||||||||
| 3.85% | 10/15/23 | $ | 100,000 | $ | 103,226 | |||||||||
| 4.50% | 12/15/26 | 100,000 | 106,248 | |||||||||||
PNC Bank NA | ||||||||||||||
| 2.55% | 12/09/21 | 150,000 | 151,056 | |||||||||||
| 2.95% | 02/23/25 | 100,000 | 102,312 | |||||||||||
| 3.10% | 10/25/27 | 100,000 | 102,836 | |||||||||||
PPG Industries Inc. | ||||||||||||||
| 3.75% | 03/15/28 | 50,000 | 53,373 | |||||||||||
PPL Electric Utilities Corp. | ||||||||||||||
| 4.15% | 06/15/48 | 100,000 | 110,631 | |||||||||||
President & Fellows of Harvard College | ||||||||||||||
| 3.15% | 07/15/46 | 50,000 | 49,678 | |||||||||||
Principal Financial Group Inc. | ||||||||||||||
| 3.40% | 05/15/25 | 150,000 | 156,394 | |||||||||||
Prologis LP | ||||||||||||||
| 4.25% | 08/15/23 | 150,000 | 160,524 | |||||||||||
Providence Saint Joseph Health Obligated Group | ||||||||||||||
| 3.93% | 10/01/48 | 20,000 | 20,739 | |||||||||||
Prudential Financial Inc. | ||||||||||||||
| 3.94% | 12/07/49 | 190,000 | 199,141 | |||||||||||
| 4.35% | 02/25/50 | 100,000 | 111,798 | |||||||||||
Prudential Financial Inc. (5.70% fixed rate until 09/15/28; 2.67% + 3 month USD LIBOR thereafter) | ||||||||||||||
| 5.70% | 09/15/48 | 100,000 | 107,470 | (f | ) | |||||||||
Public Service Company of Colorado | ||||||||||||||
| 3.70% | 06/15/28 | 50,000 | 53,904 | |||||||||||
| 4.10% | 06/15/48 | 30,000 | 33,099 | |||||||||||
Public Service Electric & Gas Co. | ||||||||||||||
| 2.38% | 05/15/23 | 100,000 | 100,362 | |||||||||||
| 3.65% | 09/01/28 | 25,000 | 26,828 | |||||||||||
Public Service Enterprise Group Inc. | ||||||||||||||
| 2.88% | 06/15/24 | 15,000 | 15,201 | |||||||||||
Public Storage | ||||||||||||||
| 3.39% | 05/01/29 | 30,000 | 31,327 | |||||||||||
Puget Energy Inc. | ||||||||||||||
| 3.65% | 05/15/25 | 150,000 | 153,220 | |||||||||||
QUALCOMM Inc. | ||||||||||||||
| 4.30% | 05/20/47 | 100,000 | 105,120 | |||||||||||
| 4.65% | 05/20/35 | 150,000 | 166,800 | |||||||||||
Quest Diagnostics Inc. | ||||||||||||||
| 4.25% | 04/01/24 | 150,000 | 158,860 | |||||||||||
Raytheon Co. | ||||||||||||||
| 3.15% | 12/15/24 | 90,000 | 93,653 | |||||||||||
Realty Income Corp. | ||||||||||||||
| 4.65% | 08/01/23 | 100,000 | 108,101 | |||||||||||
Regency Centers LP | ||||||||||||||
| 4.13% | 03/15/28 | 50,000 | 53,332 | |||||||||||
Regions Bank (3.37% fixed rate until 08/13/20; 0.50% + 3 month USD LIBOR thereafter) | ||||||||||||||
| 3.37% | 08/13/21 | 50,000 | 50,427 | (f | ) | |||||||||
Regions Financial Corp. | ||||||||||||||
| 3.80% | 08/14/23 | 100,000 | 104,702 | |||||||||||
Reinsurance Group of America Inc. | ||||||||||||||
| 3.90% | 05/15/29 | 50,000 | 51,862 | |||||||||||
RELX Capital Inc. | ||||||||||||||
| 3.50% | 03/16/23 | 30,000 | 30,977 | |||||||||||
| 4.00% | 03/18/29 | 25,000 | 26,491 | |||||||||||
RenaissanceRe Holdings Ltd. | ||||||||||||||
| 3.60% | 04/15/29 | 25,000 | 25,613 | |||||||||||
Reynolds American Inc. | ||||||||||||||
| 4.45% | 06/12/25 | 100,000 | 106,073 | |||||||||||
Rio Tinto Finance USA Ltd. | ||||||||||||||
| 5.20% | 11/02/40 | 150,000 | 187,164 | |||||||||||
Rockwell Automation Inc. | ||||||||||||||
| 3.50% | 03/01/29 | 45,000 | 47,930 | |||||||||||
Rogers Communications Inc. | ||||||||||||||
| 2.90% | 11/15/26 | 100,000 | 100,361 | |||||||||||
| 3.00% | 03/15/23 | 50,000 | 50,965 | |||||||||||
| 3.63% | 12/15/25 | 60,000 | 63,314 | |||||||||||
Roper Technologies Inc. | ||||||||||||||
| 3.80% | 12/15/26 | 100,000 | 104,216 | |||||||||||
See Notes to Schedule of Investments and Notes to Financial Statements.
Table of Contents
| State Street Total Return V.I.S. Fund | ||
| Schedule of Investments | June 30, 2019 (Unaudited) |
Principal Amount | Fair Value | |||||||||||||
Royal Bank of Canada | ||||||||||||||
| 2.15% | 10/26/20 | $ | 125,000 | $ | 124,951 | |||||||||
| 2.30% | 03/22/21 | 150,000 | 150,666 | |||||||||||
| 2.75% | 02/01/22 | 50,000 | 50,789 | |||||||||||
| 2.80% | 04/29/22 | 100,000 | 101,627 | |||||||||||
Royal Bank of Scotland Group PLC | ||||||||||||||
| 3.88% | 09/12/23 | 100,000 | 102,659 | |||||||||||
| 5.13% | 05/28/24 | 80,000 | 84,403 | |||||||||||
| 6.00% | 12/19/23 | 75,000 | 81,728 | |||||||||||
| 6.10% | 06/10/23 | 35,000 | 37,992 | |||||||||||
| 6.13% | 12/15/22 | 85,000 | 91,656 | |||||||||||
Royal Bank of Scotland Group PLC (4.89% fixed rate until 05/18/28; 1.75% + 3 month USD LIBOR thereafter) | ||||||||||||||
| 4.89% | 05/18/29 | 100,000 | 106,672 | (f | ) | |||||||||
RPM International Inc. | ||||||||||||||
| 4.25% | 01/15/48 | 50,000 | 45,974 | |||||||||||
Ryder System Inc. | ||||||||||||||
| 3.40% | 03/01/23 | 150,000 | 154,048 | |||||||||||
S&P Global Inc. | ||||||||||||||
| 4.40% | 02/15/26 | 100,000 | 110,386 | |||||||||||
Sabine Pass Liquefaction LLC | ||||||||||||||
| 5.63% | 02/01/21 - 03/01/25 | 310,000 | 332,876 | |||||||||||
| 5.75% | 05/15/24 | 35,000 | 38,926 | |||||||||||
San Diego Gas & Electric Co. | ||||||||||||||
| 3.60% | 09/01/23 | 100,000 | 103,695 | |||||||||||
Sanofi | ||||||||||||||
| 3.63% | 06/19/28 | 100,000 | 107,620 | |||||||||||
Santander Holdings USA Inc. | ||||||||||||||
| 3.40% | 01/18/23 | 50,000 | 50,768 | |||||||||||
| 4.40% | 07/13/27 | 50,000 | 52,224 | |||||||||||
| 4.45% | 12/03/21 | 200,000 | 207,772 | |||||||||||
Santander UK Group Holdings PLC (3.37% fixed rate until 01/05/23; 1.08% + 3 month USD LIBOR thereafter) | ||||||||||||||
| 3.37% | 01/05/24 | 100,000 | 100,854 | (f | ) | |||||||||
Santander UK PLC | ||||||||||||||
| 2.88% | 06/18/24 | 200,000 | 201,298 | |||||||||||
Seagate HDD Cayman | ||||||||||||||
| 4.75% | 06/01/23 | 150,000 | 154,503 | |||||||||||
Sempra Energy | ||||||||||||||
| 3.80% | 02/01/38 | 100,000 | 96,634 | |||||||||||
| 4.05% | 12/01/23 | 150,000 | 157,980 | |||||||||||
Shell International Finance BV | ||||||||||||||
| 3.50% | 11/13/23 | 140,000 | 147,136 | (b | ) | |||||||||
| 4.00% | 05/10/46 | 150,000 | 164,692 | |||||||||||
| 4.13% | 05/11/35 | 150,000 | 166,405 | |||||||||||
| 4.38% | 05/11/45 | 100,000 | 114,968 | |||||||||||
Shire Acquisitions Investments Ireland DAC | ||||||||||||||
| 3.20% | 09/23/26 | 150,000 | 151,222 | |||||||||||
Simon Property Group LP | ||||||||||||||
| 2.75% | 02/01/23 | 121,000 | 122,482 | |||||||||||
SL Green Operating Partnership LP | ||||||||||||||
| 3.25% | 10/15/22 | 30,000 | 30,401 | |||||||||||
Southern California Edison Co. | ||||||||||||||
| 3.40% | 06/01/23 | 100,000 | 101,735 | |||||||||||
| 3.60% | 02/01/45 | 125,000 | 116,223 | |||||||||||
| 4.20% | 03/01/29 | 100,000 | 106,355 | |||||||||||
Southern Copper Corp. | ||||||||||||||
| 5.88% | 04/23/45 | 155,000 | 183,859 | |||||||||||
Southwest Airlines Co. | ||||||||||||||
| 3.00% | 11/15/26 | 100,000 | 100,225 | |||||||||||
Southwestern Electric Power Co. | ||||||||||||||
| 3.85% | 02/01/48 | 100,000 | 98,651 | |||||||||||
Spectra Energy Partners LP | ||||||||||||||
| 3.50% | 03/15/25 | 150,000 | 154,311 | |||||||||||
SSM Health Care Corp. | ||||||||||||||
| 3.69% | 06/01/23 | 10,000 | 10,452 | |||||||||||
Stanley Black & Decker Inc. | ||||||||||||||
| 2.90% | 11/01/22 | 150,000 | 152,571 | |||||||||||
Starbucks Corp. | ||||||||||||||
| 2.20% | 11/22/20 | 20,000 | 19,972 | |||||||||||
| 3.10% | 03/01/23 | 50,000 | 51,313 | |||||||||||
| 3.50% | 03/01/28 | 50,000 | 52,457 | |||||||||||
Principal Amount | Fair Value | |||||||||||||
| 3.75% | 12/01/47 | $ | 35,000 | $ | 34,371 | |||||||||
| 4.45% | 08/15/49 | 100,000 | 109,510 | |||||||||||
Stryker Corp. | ||||||||||||||
| 3.65% | 03/07/28 | 150,000 | 159,285 | |||||||||||
Sumitomo Mitsui Financial Group Inc. | ||||||||||||||
| 2.78% | 10/18/22 | 200,000 | 201,884 | |||||||||||
| 3.01% | 10/19/26 | 100,000 | 101,381 | |||||||||||
| 3.35% | 10/18/27 | 50,000 | 51,879 | |||||||||||
| 3.94% | 10/16/23 | 100,000 | 105,875 | |||||||||||
| 4.31% | 10/16/28 | 100,000 | 111,767 | |||||||||||
Suncor Energy Inc. | ||||||||||||||
| 6.85% | 06/01/39 | 150,000 | 208,191 | |||||||||||
Sunoco Logistics Partners Operations LP | ||||||||||||||
| 5.95% | 12/01/25 | 150,000 | 170,797 | |||||||||||
SunTrust Bank | ||||||||||||||
| 2.80% | 05/17/22 | 50,000 | 50,632 | |||||||||||
| 3.00% | 02/02/23 | 100,000 | 101,934 | |||||||||||
| 3.20% | 04/01/24 | 50,000 | 51,551 | |||||||||||
SunTrust Banks Inc. | ||||||||||||||
| 4.00% | 05/01/25 | 50,000 | 53,549 | |||||||||||
Svenska Handelsbanken AB | ||||||||||||||
| 3.35% | 05/24/21 | 150,000 | 152,853 | |||||||||||
Synchrony Financial | ||||||||||||||
| 3.95% | 12/01/27 | 100,000 | 99,828 | |||||||||||
| 4.38% | 03/19/24 | 35,000 | 36,746 | |||||||||||
Sysco Corp. | ||||||||||||||
| 3.55% | 03/15/25 | 100,000 | 104,724 | |||||||||||
| 4.45% | 03/15/48 | 100,000 | 109,236 | |||||||||||
Takeda Pharmaceutical Company Ltd. | ||||||||||||||
| 3.80% | 11/26/20 | 100,000 | 101,856 | (c | ) | |||||||||
| 4.00% | 11/26/21 | 100,000 | 103,320 | (c | ) | |||||||||
| 4.40% | 11/26/23 | 50,000 | 53,460 | (c | ) | |||||||||
| 5.00% | 11/26/28 | 50,000 | 56,714 | (c | ) | |||||||||
Tampa Electric Co. | ||||||||||||||
| 4.30% | 06/15/48 | 50,000 | 54,448 | |||||||||||
Target Corp. | ||||||||||||||
| 3.38% | 04/15/29 | 50,000 | 53,057 | |||||||||||
| 3.90% | 11/15/47 | 50,000 | 53,803 | |||||||||||
| 4.00% | 07/01/42 | 150,000 | 162,972 | |||||||||||
TC PipeLines LP | ||||||||||||||
| 3.90% | 05/25/27 | 100,000 | 101,980 | |||||||||||
TD Ameritrade Holding Corp. | ||||||||||||||
| 2.95% | 04/01/22 | 150,000 | 152,566 | |||||||||||
Telefonica Emisiones S.A. | ||||||||||||||
| 4.90% | 03/06/48 | 150,000 | 158,520 | |||||||||||
TELUS Corp. | ||||||||||||||
| 4.60% | 11/16/48 | 50,000 | 55,476 | |||||||||||
Texas Instruments Inc. | ||||||||||||||
| 3.88% | 03/15/39 | 100,000 | 108,801 | |||||||||||
Textron Inc. | ||||||||||||||
| 3.90% | 09/17/29 | 50,000 | 52,237 | |||||||||||
The Allstate Corp. | ||||||||||||||
| 4.20% | 12/15/46 | 100,000 | 111,476 | |||||||||||
The Allstate Corp. (5.75% fixed rate until 08/15/23; 2.94% + 3 month USD LIBOR thereafter) | ||||||||||||||
| 5.75% | 08/15/53 | 50,000 | 52,420 | (f | ) | |||||||||
The Bank of New York Mellon Corp. | ||||||||||||||
| 2.80% | 05/04/26 | 30,000 | 30,296 | |||||||||||
| 3.00% | 02/24/25 | 105,000 | 107,920 | |||||||||||
| 3.45% | 08/11/23 | 200,000 | 208,534 | |||||||||||
| 3.50% | 04/28/23 | 100,000 | 104,246 | |||||||||||
| 3.85% | 04/28/28 | 100,000 | 109,291 | |||||||||||
The Bank of Nova Scotia | ||||||||||||||
| 2.50% | 01/08/21 | 200,000 | 200,852 | |||||||||||
| 3.13% | 04/20/21 | 100,000 | 101,645 | |||||||||||
The Boeing Co. | ||||||||||||||
| 3.20% | 03/01/29 | 50,000 | 51,771 | |||||||||||
| 3.38% | 06/15/46 | 150,000 | 143,505 | |||||||||||
The Charles Schwab Corp. | ||||||||||||||
| 3.85% | 05/21/25 | 150,000 | 160,398 | |||||||||||
The Clorox Co. | ||||||||||||||
| 3.50% | 12/15/24 | 150,000 | 157,966 | |||||||||||
See Notes to Schedule of Investments and Notes to Financial Statements.
Table of Contents
| State Street Total Return V.I.S. Fund | ||
| Schedule of Investments | June 30, 2019 (Unaudited) |
Principal Amount | Fair Value | |||||||||||||
The Coca-Cola Co. | ||||||||||||||
| 2.45% | 11/01/20 | $ | 150,000 | $ | 150,616 | |||||||||
The Dayton Power & Light Co. | ||||||||||||||
| 3.95% | 06/15/49 | 15,000 | 15,509 | (c | ) | |||||||||
The Dow Chemical Co. | ||||||||||||||
| 3.00% | 11/15/22 | 137,000 | 138,987 | |||||||||||
| 4.38% | 11/15/42 | 237,000 | 240,775 | |||||||||||
The George Washington University | ||||||||||||||
| 4.13% | 09/15/48 | 50,000 | 56,071 | (b | ) | |||||||||
The Goldman Sachs Group Inc. | ||||||||||||||
| 2.60% | 12/27/20 | 100,000 | 100,095 | |||||||||||
| 2.75% | 09/15/20 | 150,000 | 150,618 | |||||||||||
| 3.00% | 04/26/22 | 100,000 | 100,905 | |||||||||||
| 3.50% | 11/16/26 | 150,000 | 153,556 | |||||||||||
| 3.63% | 02/20/24 | 180,000 | 187,742 | |||||||||||
| 3.85% | 07/08/24 | 150,000 | 157,437 | |||||||||||
| 4.80% | 07/08/44 | 100,000 | 115,016 | |||||||||||
| 5.75% | 01/24/22 | 100,000 | 108,094 | |||||||||||
| 6.25% | 02/01/41 | 150,000 | 200,521 | |||||||||||
| 6.75% | 10/01/37 | 200,000 | 261,738 | |||||||||||
The Goldman Sachs Group Inc. (2.88% fixed rate until 10/31/21; 0.82% + 3 month USD LIBOR thereafter) | ||||||||||||||
| 2.88% | 10/31/22 | 200,000 | 201,562 | (f | ) | |||||||||
The Goldman Sachs Group Inc. (4.02% fixed rate until 10/31/37; 1.37% + 3 month USD LIBOR thereafter) | ||||||||||||||
| 4.02% | 10/31/38 | 100,000 | 102,959 | (f | ) | |||||||||
The Hartford Financial Services Group Inc. | ||||||||||||||
| 4.40% | 03/15/48 | 100,000 | 108,960 | |||||||||||
The Hershey Co. | ||||||||||||||
| 3.38% | 05/15/23 | 50,000 | 52,296 | |||||||||||
The Home Depot Inc. | ||||||||||||||
| 2.13% | 09/15/26 | 45,000 | 44,050 | |||||||||||
| 2.63% | 06/01/22 | 190,000 | 193,239 | |||||||||||
| 3.90% | 12/06/28 | 100,000 | 110,196 | |||||||||||
| 4.20% | 04/01/43 | 150,000 | 166,818 | |||||||||||
| 4.40% | 04/01/21 | 150,000 | 155,137 | |||||||||||
| 4.50% | 12/06/48 | 100,000 | 117,948 | |||||||||||
The Interpublic Group of Companies Inc. | ||||||||||||||
| 4.65% | 10/01/28 | 10,000 | 10,886 | |||||||||||
The JM Smucker Co. | ||||||||||||||
| 3.38% | 12/15/27 | 100,000 | 102,058 | |||||||||||
The Kroger Co. | ||||||||||||||
| 3.85% | 08/01/23 | 150,000 | 156,736 | |||||||||||
| 4.50% | 01/15/29 | 100,000 | 108,883 | |||||||||||
| 5.40% | 01/15/49 | 100,000 | 111,104 | |||||||||||
The Mosaic Co. | ||||||||||||||
| 3.25% | 11/15/22 | 50,000 | 51,002 | |||||||||||
| 4.05% | 11/15/27 | 50,000 | 51,514 | |||||||||||
The PNC Financial Services Group Inc. | ||||||||||||||
| 3.50% | 01/23/24 | 110,000 | 115,775 | |||||||||||
The Procter & Gamble Co. | ||||||||||||||
| 1.70% | 11/03/21 | 200,000 | 198,520 | |||||||||||
| 2.45% | 11/03/26 | 100,000 | 100,402 | |||||||||||
The Progressive Corp. | ||||||||||||||
| 4.35% | 04/25/44 | 100,000 | 113,515 | |||||||||||
The Sherwin-Williams Co. | ||||||||||||||
| 3.95% | 01/15/26 | 100,000 | 104,655 | |||||||||||
| 4.20% | 01/15/22 | 100,000 | 103,876 | |||||||||||
| 4.50% | 06/01/47 | 100,000 | 106,651 | |||||||||||
The Southern Co. (5.50% fixed rate until 03/15/22; 3.63% + 3 month USD LIBOR thereafter) | ||||||||||||||
| 5.50% | 03/15/57 | 100,000 | 102,325 | (f | ) | |||||||||
The Timken Co. | ||||||||||||||
| 4.50% | 12/15/28 | 20,000 | 21,054 | |||||||||||
The Toronto-Dominion Bank | ||||||||||||||
| 2.65% | 06/12/24 | 100,000 | 100,991 | |||||||||||
| 3.15% | 09/17/20 | 100,000 | 101,170 | |||||||||||
| 3.25% | 06/11/21 - 03/11/24 | 200,000 | 205,551 | |||||||||||
The Travelers Companies Inc. | ||||||||||||||
| 4.00% | 05/30/47 | 100,000 | 108,751 | |||||||||||
| 5.35% | 11/01/40 | 100,000 | 127,627 | |||||||||||
Principal Amount | Fair Value | |||||||||||||
The Walt Disney Co. | ||||||||||||||
| 3.38% | 11/15/26 | $ | 100,000 | $ | 105,028 | (c | ) | |||||||
| 4.75% | 11/15/46 | 100,000 | 123,262 | (c | ) | |||||||||
| 6.65% | 11/15/37 | 179,000 | 257,162 | (c | ) | |||||||||
The Western Union Co. | ||||||||||||||
| 3.60% | 03/15/22 | 150,000 | 153,579 | |||||||||||
The Williams Companies Inc. | ||||||||||||||
| 3.70% | 01/15/23 | 10,000 | 10,326 | |||||||||||
| 4.55% | 06/24/24 | 40,000 | 43,067 | |||||||||||
| 4.85% | 03/01/48 | 70,000 | 74,899 | |||||||||||
| 5.10% | 09/15/45 | 150,000 | 162,613 | |||||||||||
| 5.75% | 06/24/44 | 15,000 | 17,496 | |||||||||||
| 5.80% | 11/15/43 | 150,000 | 174,321 | |||||||||||
Thermo Fisher Scientific Inc. | ||||||||||||||
| 3.30% | 02/15/22 | 80,000 | 82,037 | |||||||||||
| 4.15% | 02/01/24 | 25,000 | 26,780 | |||||||||||
Time Warner Cable LLC | ||||||||||||||
| 4.50% | 09/15/42 | 150,000 | 139,425 | |||||||||||
Torchmark Corp. | ||||||||||||||
| 4.55% | 09/15/28 | 25,000 | 27,310 | |||||||||||
Total Capital International S.A. | ||||||||||||||
| 2.75% | 06/19/21 | 150,000 | 151,773 | |||||||||||
| 3.46% | 02/19/29 | 100,000 | 106,392 | |||||||||||
Total Capital S.A. | ||||||||||||||
| 3.88% | 10/11/28 | 25,000 | 27,451 | |||||||||||
Total System Services Inc. | ||||||||||||||
| 4.45% | 06/01/28 | 100,000 | 107,182 | |||||||||||
Toyota Motor Credit Corp. | ||||||||||||||
| 2.60% | 01/11/22 | 100,000 | 101,039 | |||||||||||
| 2.70% | 01/11/23 | 100,000 | 101,623 | |||||||||||
| 2.95% | 04/13/21 | 100,000 | 101,349 | |||||||||||
| 3.05% | 01/08/21 | 25,000 | 25,342 | |||||||||||
| 3.35% | 01/08/24 | 100,000 | 104,495 | |||||||||||
| 3.45% | 09/20/23 | 50,000 | 52,341 | |||||||||||
| 3.65% | 01/08/29 | 100,000 | 108,443 | |||||||||||
TransCanada PipeLines Ltd. | ||||||||||||||
| 4.25% | 05/15/28 | 50,000 | 54,049 | |||||||||||
| 5.10% | 03/15/49 | 50,000 | 57,850 | |||||||||||
| 7.63% | 01/15/39 | 100,000 | 143,193 | |||||||||||
Transcontinental Gas Pipe Line Company LLC | ||||||||||||||
| 4.00% | 03/15/28 | 100,000 | 104,974 | |||||||||||
Tucson Electric Power Co. | ||||||||||||||
| 4.85% | 12/01/48 | 50,000 | 58,425 | |||||||||||
TWDC Enterprises 18 Corp. | ||||||||||||||
| 2.30% | 02/12/21 | 130,000 | 130,445 | |||||||||||
| 3.00% | 07/30/46 | 60,000 | 56,429 | |||||||||||
| 3.15% | 09/17/25 | 165,000 | 173,410 | |||||||||||
Tyson Foods Inc. | ||||||||||||||
| 4.00% | 03/01/26 | 15,000 | 15,967 | |||||||||||
| 4.88% | 08/15/34 | 70,000 | 79,789 | |||||||||||
| 5.10% | 09/28/48 | 35,000 | 39,514 | |||||||||||
U.S. Bancorp | ||||||||||||||
| 2.63% | 01/24/22 | 100,000 | 101,072 | |||||||||||
UDR Inc. | ||||||||||||||
| 4.40% | 01/26/29 | 50,000 | 54,525 | |||||||||||
Unilever Capital Corp. | ||||||||||||||
| 2.00% | 07/28/26 | 150,000 | 144,591 | |||||||||||
| 2.75% | 03/22/21 | 100,000 | 101,057 | |||||||||||
| 2.90% | 05/05/27 | 100,000 | 102,147 | |||||||||||
Union Electric Co. | ||||||||||||||
| 2.95% | 06/15/27 | 100,000 | 101,598 | |||||||||||
| 3.50% | 03/15/29 | 25,000 | 26,460 | |||||||||||
| 3.65% | 04/15/45 | 35,000 | 35,775 | |||||||||||
Union Pacific Corp. | ||||||||||||||
| 3.00% | 04/15/27 | 100,000 | 102,128 | |||||||||||
| 3.20% | 06/08/21 | 100,000 | 101,861 | |||||||||||
| 3.50% | 06/08/23 | 50,000 | 52,104 | |||||||||||
| 3.70% | 03/01/29 | 65,000 | 69,848 | |||||||||||
| 3.95% | 09/10/28 | 30,000 | 32,797 | |||||||||||
| 4.38% | 09/10/38 | 15,000 | 16,496 | |||||||||||
| 4.50% | 09/10/48 | 30,000 | 34,050 | |||||||||||
| 4.80% | 09/10/58 | 75,000 | 87,143 | |||||||||||
See Notes to Schedule of Investments and Notes to Financial Statements.
Table of Contents
| State Street Total Return V.I.S. Fund | ||
| Schedule of Investments | June 30, 2019 (Unaudited) |
Principal Amount | Fair Value | |||||||||||||
United Airlines2013-1 Class A Pass Through Trust | ||||||||||||||
| 4.30% | 08/15/25 | $ | 194,392 | $ | 206,413 | |||||||||
United Parcel Service Inc. | ||||||||||||||
| 2.05% | 04/01/21 | 100,000 | 99,814 | |||||||||||
| 2.45% | 10/01/22 | 175,000 | 176,885 | |||||||||||
| 3.05% | 11/15/27 | 50,000 | 51,662 | |||||||||||
| 3.75% | 11/15/47 | 50,000 | 50,474 | |||||||||||
United Technologies Corp. | ||||||||||||||
| 3.35% | 08/16/21 | 110,000 | 112,435 | |||||||||||
| 3.65% | 08/16/23 | 20,000 | 20,961 | |||||||||||
| 3.95% | 08/16/25 | 15,000 | 16,160 | |||||||||||
| 4.13% | 11/16/28 | 30,000 | 32,941 | |||||||||||
| 4.45% | 11/16/38 | 160,000 | 179,427 | |||||||||||
| 4.50% | 06/01/42 | 158,000 | 178,167 | |||||||||||
| 4.63% | 11/16/48 | 15,000 | 17,472 | |||||||||||
UnitedHealth Group Inc. | ||||||||||||||
| 2.95% | 10/15/27 | 200,000 | 203,140 | |||||||||||
| 3.10% | 03/15/26 | 150,000 | 155,025 | |||||||||||
| 3.50% | 02/15/24 | 10,000 | 10,484 | |||||||||||
| 3.70% | 12/15/25 | 10,000 | 10,660 | |||||||||||
| 3.75% | 10/15/47 | 100,000 | 102,487 | |||||||||||
| 3.88% | 12/15/28 | 15,000 | 16,334 | |||||||||||
| 4.45% | 12/15/48 | 10,000 | 11,491 | |||||||||||
| 4.63% | 07/15/35 | 45,000 | 51,877 | |||||||||||
| 6.88% | 02/15/38 | 100,000 | 144,517 | |||||||||||
University of Notre Dame du Lac | ||||||||||||||
| 3.39% | 02/15/48 | 25,000 | 25,359 | |||||||||||
US Bancorp | ||||||||||||||
| 3.95% | 11/17/25 | 100,000 | 108,632 | |||||||||||
US Bank NA | ||||||||||||||
| 2.05% | 10/23/20 | 150,000 | 149,735 | |||||||||||
| 2.80% | 01/27/25 | 150,000 | 153,217 | |||||||||||
Vale Overseas Ltd. | ||||||||||||||
| 6.88% | 11/10/39 | 100,000 | 120,497 | |||||||||||
Valero Energy Corp. | ||||||||||||||
| 6.63% | 06/15/37 | 150,000 | 189,570 | |||||||||||
Valero Energy Partners LP | ||||||||||||||
| 4.38% | 12/15/26 | 100,000 | 106,897 | |||||||||||
Ventas Realty LP | ||||||||||||||
| 4.00% | 03/01/28 | 150,000 | 157,449 | |||||||||||
| 4.40% | 01/15/29 | 100,000 | 108,493 | |||||||||||
VEREIT Operating Partnership LP | ||||||||||||||
| 4.13% | 06/01/21 | 15,000 | 15,397 | |||||||||||
| 4.60% | 02/06/24 | 20,000 | 21,216 | |||||||||||
| 4.88% | 06/01/26 | 25,000 | 27,209 | |||||||||||
Verisk Analytics Inc. | ||||||||||||||
| 4.13% | 03/15/29 | 25,000 | 26,833 | |||||||||||
Verizon Communications Inc. | ||||||||||||||
| 3.85% | 11/01/42 | 236,000 | 240,340 | |||||||||||
| 3.88% | 02/08/29 | 5,000 | 5,362 | |||||||||||
| 4.33% | 09/21/28 | 209,000 | 231,478 | |||||||||||
| 4.40% | 11/01/34 | 150,000 | 166,492 | |||||||||||
| 4.52% | 09/15/48 | 150,000 | 167,956 | |||||||||||
| 4.81% | 03/15/39 | 189,000 | 217,140 | |||||||||||
| 5.15% | 09/15/23 | 200,000 | 223,518 | |||||||||||
| 5.25% | 03/16/37 | 200,000 | 239,780 | |||||||||||
Viacom Inc. | ||||||||||||||
| 5.85% | 09/01/43 | 100,000 | 117,742 | |||||||||||
Virginia Electric & Power Co. | ||||||||||||||
| 3.80% | 04/01/28 | 100,000 | 107,321 | |||||||||||
| 4.60% | 12/01/48 | 60,000 | 69,704 | |||||||||||
| 4.65% | 08/15/43 | 100,000 | 114,720 | |||||||||||
Visa Inc. | ||||||||||||||
| 2.15% | 09/15/22 | 200,000 | 200,778 | |||||||||||
| 4.30% | 12/14/45 | 100,000 | 117,705 | |||||||||||
Vodafone Group PLC | ||||||||||||||
| 4.38% | 05/30/28 - 02/19/43 | 205,000 | 208,441 | |||||||||||
| 5.00% | 05/30/38 | 100,000 | 108,489 | |||||||||||
| 5.25% | 05/30/48 | 50,000 | 55,081 | |||||||||||
Vornado Realty LP | ||||||||||||||
| 3.50% | 01/15/25 | 50,000 | 51,234 | |||||||||||
Principal Amount | Fair Value | |||||||||||||
Vulcan Materials Co. | ||||||||||||||
| 4.70% | 03/01/48 | $ | 50,000 | $ | 49,745 | |||||||||
Wabtec Corp. | ||||||||||||||
| 3.45% | 11/15/26 | 100,000 | 98,075 | |||||||||||
Walgreens Boots Alliance Inc. | ||||||||||||||
| 3.45% | 06/01/26 | 55,000 | 55,592 | |||||||||||
| 4.50% | 11/18/34 | 155,000 | 159,238 | |||||||||||
Walmart Inc. | ||||||||||||||
| 1.90% | 12/15/20 | 100,000 | 99,821 | |||||||||||
| 2.35% | 12/15/22 | 100,000 | 100,967 | |||||||||||
| 2.65% | 12/15/24 | 100,000 | 102,248 | |||||||||||
| 3.13% | 06/23/21 | 50,000 | 51,086 | |||||||||||
| 3.25% | 07/08/29 | 40,000 | 42,212 | |||||||||||
| 3.40% | 06/26/23 | 50,000 | 52,507 | |||||||||||
| 3.63% | 12/15/47 | 125,000 | 133,571 | |||||||||||
| 3.70% | 06/26/28 | 100,000 | 109,098 | |||||||||||
| 3.95% | 06/28/38 | 40,000 | 44,587 | |||||||||||
| 4.05% | 06/29/48 | 185,000 | 211,806 | |||||||||||
Waste Connections Inc. | ||||||||||||||
| 3.50% | 05/01/29 | 50,000 | 52,011 | |||||||||||
Waste Management Inc. | ||||||||||||||
| 2.90% | 09/15/22 | 150,000 | 152,902 | |||||||||||
| 4.15% | 07/15/49 | 65,000 | 71,092 | |||||||||||
WEC Energy Group Inc. | ||||||||||||||
| 3.38% | 06/15/21 | 65,000 | 66,249 | |||||||||||
Wells Fargo & Co. | ||||||||||||||
| 2.50% | 03/04/21 | 240,000 | 240,494 | |||||||||||
| 2.63% | 07/22/22 | 200,000 | 201,454 | |||||||||||
| 3.75% | 01/24/24 | 300,000 | 315,393 | |||||||||||
| 4.13% | 08/15/23 | 150,000 | 158,205 | |||||||||||
| 4.15% | 01/24/29 | 100,000 | 108,814 | |||||||||||
| 4.40% | 06/14/46 | 150,000 | 161,436 | |||||||||||
| 4.65% | 11/04/44 | 150,000 | 166,882 | |||||||||||
| 4.75% | 12/07/46 | 100,000 | 113,854 | |||||||||||
| 5.61% | 01/15/44 | 169,000 | 210,853 | |||||||||||
Wells Fargo Bank NA | ||||||||||||||
| 3.55% | 08/14/23 | 150,000 | 156,525 | |||||||||||
| 3.63% | 10/22/21 | 200,000 | 205,612 | |||||||||||
Wells Fargo Bank NA (3.33% fixed rate until 07/23/20; 0.49% + 3 month USD LIBOR thereafter) | ||||||||||||||
| 3.33% | 07/23/21 | 150,000 | 151,410 | (f | ) | |||||||||
Welltower Inc. | ||||||||||||||
| 3.63% | 03/15/24 | 25,000 | 26,012 | |||||||||||
| 4.25% | 04/15/28 | 115,000 | 122,984 | �� | ||||||||||
Western Midstream Operating LP | ||||||||||||||
| 5.45% | 04/01/44 | 150,000 | 141,110 | |||||||||||
Westlake Chemical Corp. | ||||||||||||||
| 4.38% | 11/15/47 | 50,000 | 47,226 | |||||||||||
Westpac Banking Corp. | ||||||||||||||
| 2.00% | 08/19/21 | 100,000 | 99,439 | |||||||||||
| 2.80% | 01/11/22 | 100,000 | 101,245 | |||||||||||
| 3.30% | 02/26/24 | 100,000 | 103,802 | |||||||||||
| 3.35% | 03/08/27 | 100,000 | 104,178 | |||||||||||
Westpac Banking Corp. (2.24% fixed rate until 11/23/26; 2.24% + 5 Year US ISDA thereafter) | ||||||||||||||
| 4.32% | 11/23/31 | 100,000 | 103,359 | (f | ) | |||||||||
Weyerhaeuser Co. (REIT) | ||||||||||||||
| 7.38% | 03/15/32 | 100,000 | 139,750 | |||||||||||
Whirlpool Corp. | ||||||||||||||
| 3.70% | 05/01/25 | 150,000 | 155,796 | |||||||||||
Willis North America Inc. | ||||||||||||||
| 4.50% | 09/15/28 | 50,000 | 53,862 | |||||||||||
Wisconsin Electric Power Co. | ||||||||||||||
| 4.30% | 10/15/48 | 10,000 | 11,159 | |||||||||||
Wisconsin Power & Light Co. | ||||||||||||||
| 3.05% | 10/15/27 | 100,000 | 101,673 | |||||||||||
WP Carey Inc. | ||||||||||||||
| 3.85% | 07/15/29 | 50,000 | 50,690 | |||||||||||
WRKCo Inc. | ||||||||||||||
| 4.20% | 06/01/32 | 50,000 | 51,575 | |||||||||||
| 4.65% | 03/15/26 | 100,000 | 108,483 | |||||||||||
See Notes to Schedule of Investments and Notes to Financial Statements.
Table of Contents
| State Street Total Return V.I.S. Fund | ||
| Schedule of Investments | June 30, 2019 (Unaudited) |
Principal Amount | Fair Value | |||||||||||||
Xcel Energy Inc. | ||||||||||||||
| 3.30% | 06/01/25 | $ | 150,000 | $ | 154,699 | |||||||||
| 4.00% | 06/15/28 | 100,000 | 107,623 | |||||||||||
Zimmer Biomet Holdings Inc. | ||||||||||||||
| 3.70% | 03/19/23 | 75,000 | 77,406 | |||||||||||
Zoetis Inc. | ||||||||||||||
| 4.70% | 02/01/43 | 150,000 | 169,014 | |||||||||||
| 136,015,011 | ||||||||||||||
Non-Agency Collateralized Mortgage Obligations – 0.3% | ||||||||||||||
BANK 2018-BNK14 | ||||||||||||||
| 4.23% | 09/15/60 | 191,106 | 213,563 | (b | ) | |||||||||
BBCMS Mortgage Trust2018-C2 | ||||||||||||||
| 4.31% | 12/15/51 | 50,000 | 56,039 | (b | ) | |||||||||
Benchmark2018-B5 Mortgage Trust | ||||||||||||||
| 4.21% | 07/15/51 | 100,000 | 111,781 | (b | ) | |||||||||
Benchmark Mortgage Trust | ||||||||||||||
| 4.12% | 07/15/51 | 100,000 | 110,936 | (b,f | ) | |||||||||
CD2017-CD6 Mortgage Trust | ||||||||||||||
| 3.46% | 11/13/50 | 150,000 | 158,656 | (b | ) | |||||||||
Citigroup Commercial Mortgage Trust 2014-GC21 | ||||||||||||||
| 4.03% | 05/10/47 | 100,000 | 105,858 | (b | ) | |||||||||
Citigroup Commercial Mortgage Trust 2014-GC25 | ||||||||||||||
| 4.02% | 10/10/47 | 300,000 | 317,797 | (b | ) | |||||||||
Citigroup Commercial Mortgage Trust 2015-GC31 | ||||||||||||||
| 3.76% | 06/10/48 | 250,000 | 266,784 | |||||||||||
COMM 2012-CCRE 1 Mortgage Trust | ||||||||||||||
| 3.39% | 05/15/45 | 468,712 | 480,228 | (b | ) | |||||||||
COMM 2013-CCRE12 Mortgage Trust | ||||||||||||||
| 4.05% | 10/10/46 | 200,000 | 212,895 | (b | ) | |||||||||
COMM 2015-LC19 Mortgage Trust | ||||||||||||||
| 3.18% | 02/10/48 | 150,000 | 155,261 | |||||||||||
CSAIL 2018-CX12 Commercial Mortgage Trust | ||||||||||||||
| 4.22% | 08/15/51 | 300,000 | 333,879 | (b,f | ) | |||||||||
GS Mortgage Securities Trust 2015-GC28 | ||||||||||||||
| 3.98% | 02/10/48 | 150,000 | 156,683 | (b | ) | |||||||||
GS Mortgage Securities Trust2016-GS3 | ||||||||||||||
| 2.78% | 10/10/49 | 80,000 | 81,326 | (b | ) | |||||||||
GS Mortgage Securities Trust2017-GS5 | ||||||||||||||
| 3.67% | 03/10/50 | 204,729 | 218,933 | (b | ) | |||||||||
GS Mortgage Securities Trust 2019-GC38 | ||||||||||||||
| 3.97% | 02/10/52 | 50,000 | 54,883 | |||||||||||
JP Morgan Chase Commercial Mortgage Securities Trust2014-C20 | ||||||||||||||
| 3.80% | 07/15/47 | 250,000 | 265,030 | (b | ) | |||||||||
JPMBB Commercial Mortgage Securities Trust2013-C14 | ||||||||||||||
| 3.76% | 08/15/46 | 202,844 | 209,205 | (b,f | ) | |||||||||
JPMBB Commercial Mortgage Securities Trust2014-C22 | ||||||||||||||
| 3.80% | 09/15/47 | 75,000 | 79,582 | (b | ) | |||||||||
Morgan Stanley Bank of America Merrill Lynch Trust2016-C29 | ||||||||||||||
| 3.14% | 05/15/49 | 500,000 | 514,861 | (b | ) | |||||||||
Morgan Stanley Capital I Trust 2016-UBS12 | ||||||||||||||
| 3.60% | 12/15/49 | 150,000 | 158,905 | (b | ) | |||||||||
UBS Commercial Mortgage Trust2017-C4 | ||||||||||||||
| 3.56% | 10/15/50 | 185,000 | 195,879 | (b | ) | |||||||||
Wells Fargo Commercial Mortgage Trust2012-LC5 | ||||||||||||||
| 2.92% | 10/15/45 | 158,129 | 161,415 | (b | ) | |||||||||
| 4.69% | 10/15/45 | 220,000 | 231,348 | (b,f | ) | |||||||||
Wells Fargo Commercial Mortgage Trust2017-C41 | ||||||||||||||
| 3.47% | 11/15/50 | 300,000 | 315,965 | (b | ) | |||||||||
WFRBS Commercial Mortgage Trust2012-C7 | ||||||||||||||
| 3.43% | 06/15/45 | 200,000 | 205,951 | (b | ) | |||||||||
WFRBS Commercial Mortgage Trust2013-C17 | ||||||||||||||
| 4.02% | 12/15/46 | 35,000 | 37,245 | |||||||||||
WFRBS Commercial Mortgage Trust2014-C23 | ||||||||||||||
| 3.65% | 10/15/57 | 68,545 | 72,230 | (b | ) | |||||||||
| 5,483,118 | ||||||||||||||
Sovereign Bonds – 0.4% | ||||||||||||||
Export Development Canada | ||||||||||||||
| 2.50% | 01/24/23 | 200,000 | 204,696 | |||||||||||
Export-Import Bank of Korea | ||||||||||||||
| 3.00% | 11/01/22 | 200,000 | 204,210 | |||||||||||
| 3.63% | 11/27/23 | 200,000 | 210,452 | |||||||||||
Principal Amount | Fair Value | |||||||||||||
Government of Canada | ||||||||||||||
| 2.63% | 01/25/22 | $ | 200,000 | $ | 204,346 | |||||||||
Government of Colombia | ||||||||||||||
| 5.00% | 06/15/45 | 150,000 | 165,822 | |||||||||||
| 6.13% | 01/18/41 | 250,000 | 310,415 | |||||||||||
Government of Hungary | ||||||||||||||
| 5.38% | 03/25/24 | 100,000 | 112,800 | |||||||||||
Government of Indonesia | ||||||||||||||
| 4.75% | 02/11/29 | 100,000 | 111,074 | |||||||||||
Government of Italy | ||||||||||||||
| 5.38% | 06/15/33 | 150,000 | 166,609 | |||||||||||
Government of Mexico | ||||||||||||||
| 3.50% | 01/21/21 | 100,000 | 101,555 | |||||||||||
| 4.00% | 10/02/23 | 200,000 | 208,808 | |||||||||||
| 4.35% | 01/15/47 | 200,000 | 198,498 | |||||||||||
| 4.75% | 03/08/44 | 102,000 | 106,549 | |||||||||||
| 5.75% | 10/12/10 | 172,000 | 188,101 | |||||||||||
| 6.05% | 01/11/40 | 130,000 | 155,176 | |||||||||||
Government of Panama | ||||||||||||||
| 6.70% | 01/26/36 | 150,000 | 204,514 | |||||||||||
Government of Peru | ||||||||||||||
| 6.55% | 03/14/37 | 147,000 | 207,701 | |||||||||||
| 7.35% | 07/21/25 | 100,000 | 127,599 | |||||||||||
Government of Philippines | ||||||||||||||
| 3.70% | 03/01/41 | 200,000 | 217,230 | |||||||||||
| 3.75% | 01/14/29 | 200,000 | 218,650 | |||||||||||
| 4.00% | 01/15/21 | 100,000 | 102,631 | |||||||||||
| 4.20% | 01/21/24 | 200,000 | 215,548 | |||||||||||
Government of Poland | ||||||||||||||
| 3.00% | 03/17/23 | 147,000 | 151,088 | |||||||||||
| 3.25% | 04/06/26 | 100,000 | 105,784 | |||||||||||
| 5.00% | 03/23/22 | 100,000 | 107,476 | |||||||||||
Government of Uruguay | ||||||||||||||
| 4.50% | 08/14/24 | 200,000 | 213,588 | |||||||||||
| 4.98% | 04/20/55 | 200,000 | 221,106 | |||||||||||
Iraq Government AID Bond | ||||||||||||||
| 2.15% | 01/18/22 | 480,000 | 483,077 | |||||||||||
Japan Bank for International Cooperation | ||||||||||||||
| 2.13% | 07/21/20 | 400,000 | 400,120 | |||||||||||
| 2.88% | 07/21/27 | 200,000 | 207,566 | |||||||||||
| 3.38% | 10/31/23 | 200,000 | 210,538 | |||||||||||
Korea International Bond | ||||||||||||||
| 2.50% | 06/19/29 | 200,000 | 199,804 | |||||||||||
Province of Alberta Canada | ||||||||||||||
| 2.95% | 01/23/24 | 50,000 | 52,018 | |||||||||||
| 3.35% | 11/01/23 | 150,000 | 158,238 | |||||||||||
Province of Manitoba Canada | ||||||||||||||
| 2.60% | 04/16/24 | 100,000 | 102,635 | |||||||||||
Province of Ontario Canada | ||||||||||||||
| 2.55% | 02/12/21 | 150,000 | 151,347 | |||||||||||
| 3.05% | 01/29/24 | 250,000 | 261,205 | |||||||||||
| 3.40% | 10/17/23 | 150,000 | 158,509 | |||||||||||
Province of Quebec Canada | ||||||||||||||
| 2.38% | 01/31/22 | 200,000 | 202,484 | |||||||||||
| 3.50% | 07/29/20 | 200,000 | 203,090 | |||||||||||
The Korea Development Bank | ||||||||||||||
| 2.63% | 02/27/22 | 200,000 | 201,648 | |||||||||||
| 7,734,305 | ||||||||||||||
Municipal Bonds and Notes – 0.2% | ||||||||||||||
American Municipal Power Inc. | ||||||||||||||
| 6.27% | 02/15/50 | 100,000 | 134,309 | (b | ) | |||||||||
Bay Area Toll Authority | ||||||||||||||
| 6.26% | 04/01/49 | 100,000 | 149,936 | (b | ) | |||||||||
Chicago O’Hare International Airport | ||||||||||||||
| 4.47% | 01/01/49 | 100,000 | 117,359 | (b | ) | |||||||||
Chicago Transit Authority | ||||||||||||||
| 6.90% | 12/01/40 | 75,000 | 101,612 | (b | ) | |||||||||
Commonwealth of Massachusetts | ||||||||||||||
| 4.50% | 08/01/31 | 100,000 | 115,877 | (b | ) | |||||||||
Dallas Area Rapid Transit | ||||||||||||||
| 5.02% | 12/01/48 | 75,000 | 96,322 | (b | ) | |||||||||
| 6.00% | 12/01/44 | 100,000 | 141,078 | (b | ) | |||||||||
See Notes to Schedule of Investments and Notes to Financial Statements.
Table of Contents
| State Street Total Return V.I.S. Fund | ||
| Schedule of Investments | June 30, 2019 (Unaudited) |
Principal Amount | Fair Value | |||||||||||||
East Bay Municipal Utility District | ||||||||||||||
| 5.87% | 06/01/40 | $ | 100,000 | $ | 136,182 | (b | ) | |||||||
Florida Hurricane Catastrophe Fund Finance Corp. | ||||||||||||||
| 3.00% | 07/01/20 | 100,000 | 100,650 | (b | ) | |||||||||
Los Angeles Department of Water & Power | ||||||||||||||
| 6.57% | 07/01/45 | 100,000 | 151,976 | (b | ) | |||||||||
| 6.60% | 07/01/50 | 90,000 | 141,719 | (b | ) | |||||||||
Los Angeles Unified School District | ||||||||||||||
| 5.76% | 07/01/29 | 110,000 | 134,082 | (b | ) | |||||||||
Metropolitan Transportation Authority | ||||||||||||||
| 6.81% | 11/15/40 | 150,000 | 211,184 | (b | ) | |||||||||
Municipal Electric Authority of Georgia | ||||||||||||||
| 6.64% | 04/01/57 | 124,000 | 148,977 | (b | ) | |||||||||
New York City Water & Sewer System | ||||||||||||||
| 6.01% | 06/15/42 | 50,000 | 70,986 | (b | ) | |||||||||
New York State Urban Development Corp. | ||||||||||||||
| 3.90% | 03/15/33 | 25,000 | 26,837 | |||||||||||
North Texas Tollway Authority | ||||||||||||||
| 6.72% | 01/01/49 | 100,000 | 155,121 | (b | ) | |||||||||
Port Authority of New York & New Jersey | ||||||||||||||
| 4.46% | 10/01/62 | 100,000 | 119,659 | (b | ) | |||||||||
| 5.31% | 08/01/46 | 200,000 | 221,516 | (b | ) | |||||||||
Sales Tax Securitization Corp. | ||||||||||||||
| 4.64% | 01/01/40 | 25,000 | 27,568 | |||||||||||
San Diego County Water Authority | ||||||||||||||
| 6.14% | 05/01/49 | 100,000 | 141,961 | (b | ) | |||||||||
South Carolina State Public Service Authority | ||||||||||||||
| 6.45% | 01/01/50 | 50,000 | 74,531 | (b | ) | |||||||||
State of California | ||||||||||||||
| 7.60% | 11/01/40 | 100,000 | 162,268 | (b | ) | |||||||||
University of California | ||||||||||||||
| 4.60% | 05/15/31 | 100,000 | 114,144 | (b | ) | |||||||||
| 6.58% | 05/15/49 | 100,000 | 143,355 | (b | ) | |||||||||
University of Texas System | ||||||||||||||
| 4.79% | 08/15/46 | 100,000 | 122,442 | (b | ) | |||||||||
| 3,261,651 | ||||||||||||||
Other Information:
During the period ended June 30, 2019, average notional value related to futures contracts was $12,448,479 or 0.6% of net assets
The Fund had the following long futures contracts open at June 30, 2019:
Principal Amount | Fair Value | |||||||||||||
U.S. Government Sponsored Agency – 0.0%* | ||||||||||||||
Tennessee Valley Authority | ||||||||||||||
| 3.50% | 12/15/42 | $ | 500,000 | $ | 534,915 | |||||||||
Total Bonds and Notes | 566,059,621 | |||||||||||||
Number of Shares | Fair Value | |||||||||||||
Exchange Traded & Mutual Funds – 16.0% | ||||||||||||||
Invesco Optimum Yield Diversified Commodity Strategy NoK-1 ETF | 3,712,770 | 60,778,045 | ||||||||||||
SPDR Bloomberg Barclays High Yield Bond ETF | 1,454,125 | 158,412,378 | (h | ) | ||||||||||
SPDR Dow Jones REIT ETF | 972,313 | 96,064,524 | (h | ) | ||||||||||
| 315,254,947 | ||||||||||||||
Total Exchange Traded & Mutual Funds | 315,254,947 | |||||||||||||
Total Investments in Securities | 1,939,854,654 | |||||||||||||
Short-Term Investments – 1.8% | ||||||||||||||
State Street Institutional U.S. Government Money Market Fund - Class G Shares 2.35% | 34,898,673 | 34,898,673 | (h,i | ) | ||||||||||
Total Investments | 1,974,753,327 | |||||||||||||
Liabilities in Excess of Other Assets, net – (0.1)% | (2,352,805 | ) | ||||||||||||
|
| |||||||||||||
NET ASSETS – 100.0% | $ | 1,972,400,522 | ||||||||||||
|
| |||||||||||||
Description | Expiration date | Number of Contracts | Notional Amount | Value | Unrealized Appreciation | |||||||||||||
E-mini Russell 2000 Index Futures | September 2019 | 34 | $ | 2,608,715 | $ | 2,664,070 | $ | 55,355 | ||||||||||
MSCI EAFE Mini Index Futures | September 2019 | 47 | 4,412,980 | 4,519,755 | 106,775 | |||||||||||||
MSCI Emerging Market Mini Futures | September 2019 | 110 | 5,589,297 | 5,793,700 | 204,403 | |||||||||||||
S&P 500E-mini Index Futures | September 2019 | 42 | 6,079,658 | 6,182,820 | 103,162 | |||||||||||||
|
| |||||||||||||||||
| $469,695 | ||||||||||||||||||
|
| |||||||||||||||||
The securities information regarding holdings, allocations and other characteristics are presented to illustrate examples of securities that the Fund has bought and the diversity of areas in which the Fund may invest as of a particular date. It may not be representative of the Fund’s current or future investments and should not be construed as a recommendation to purchase or sell a particular security. See the Fund’s summary prospectus and statutory prospectus for complete descriptions of investment objectives, policies, risks and permissible investments.
| (a) | Non-income producing security. |
| (b) | At June 30, 2019, all or a portion of this security was pledged to cover collateral requirements for futures and/or TBAs. |
| (c) | Pursuant to Rule 144A of the Securities Act of 1933, as amended, these securities may be resold in transactions exempt from registration, normally to qualified institutional buyers. At June 30, 2019, these securities amounted to $6,686,676 or 0.34% of the net assets of the State Street Total Return V.I.S. Fund. These securities have been determined to be liquid using procedures established by the State Street Variable Insurance Series Funds, Inc.’s Board of Directors (the “Board”). |
See Notes to Schedule of Investments and Notes to Financial Statements.
Table of Contents
| State Street Total Return V.I.S. Fund | ||
| Schedule of Investments | June 30, 2019 (Unaudited) |
| (d) | Security is fair valued by the Oversight Committee, in accordance with the procedures approved by the Board. Security value is determined based on level 3 inputs. |
| (e) | Settlement is on a delayed delivery or when-issued basis with final maturity to be announced (“TBA”) in the future. |
| (f) | Variable Rate Security - Interest rate shown is rate in effect at June 30, 2019. For securities based on a published reference rate and spread, the reference rate and spread are indicated in the description above. |
| (g) | Step coupon bond. |
| (h) | Sponsored by SSGA Funds Management, Inc., the Fund’s investment adviser and administrator, and an affiliate of State Street Bank & Trust Co., the Fund’ssub-administrator, custodian and accounting agent. |
| (i) | Coupon amount represents effective yield. |
| † | Percentages are based on net assets as of June 30, 2019. |
| * | Less than 0.05%. |
| Abbreviations: | ||
| ADR | American Depositary Receipt | |
| GDR | Global Depositary Receipt | |
| ISDA | International Swaps and Derivatives Association | |
| LIBOR | London Interbank Offered Rate | |
| NVDR | Non-Voting Depositary Receipt | |
| REIT | Real Estate Investment Trust | |
| SPDR | Standard and Poor’s Depositary Receipt | |
| TBA | To Be Announced | |
Investments | Level 1 | Level 2 | Level 3 | Total | ||||||||||||
Investments in Securities |
| |||||||||||||||
Domestic Equity | $ | 614,964,288 | $ | 336 | $ | — | $ | 614,964,624 | ||||||||
Foreign Equity | 443,487,548 | 86,897 | 1,017 | 443,575,462 | ||||||||||||
U.S. Treasuries | — | 274,017,984 | — | 274,017,984 | ||||||||||||
Agency Mortgage Backed | — | 133,758,301 | — | 133,758,301 | ||||||||||||
Agency Collateralized Mortgage Obligations | — | 3,184,607 | — | 3,184,607 | ||||||||||||
Asset Backed | — | 2,069,729 | — | 2,069,729 | ||||||||||||
Corporate Notes | — | 136,015,011 | — | 136,015,011 | ||||||||||||
Non-Agency Collateralized Mortgage Obligations | — | 5,483,118 | — | 5,483,118 | ||||||||||||
Sovereign Bonds | — | 7,734,305 | — | 7,734,305 | ||||||||||||
Municipal Bonds and Notes | — | 3,261,651 | — | 3,261,651 | ||||||||||||
U.S. Government Sponsored Agencies | — | 534,915 | — | 534,915 | ||||||||||||
Exchange Traded & Mutual Funds | 315,254,947 | — | — | 315,254,947 | ||||||||||||
Short-Term Investments | 34,898,673 | — | — | 34,898,673 | ||||||||||||
|
|
|
|
|
|
|
| |||||||||
Total Investments in Securities | $ | 1,408,605,456 | $ | 566,146,854 | $ | 1,017 | $ | 1,974,753,327 | ||||||||
|
|
|
|
|
|
|
| |||||||||
Other Financial Instruments |
| |||||||||||||||
Long Futures Contracts - Unrealized Appreciation | $ | 469,695 | $ | — | $ | — | $ | 469,695 | ||||||||
|
|
|
|
|
|
|
| |||||||||
The Fund was invested in the following countries/territories at June 30, 2019 (unaudited):
Country/Territory | Percentage (based on Fair Value) | |||
United States | 74.67 | % | ||
Japan | 3.26 | % | ||
United Kingdom | 2.98 | % | ||
Switzerland | 2.44 | % | ||
Canada | 2.20 | % | ||
Australia | 1.34 | % | ||
Germany | 1.32 | % | ||
France | 1.28 | % | ||
China | 1.10 | % | ||
Hong Kong | 0.98 | % | ||
Ireland | 0.88 | % | ||
Sweden | 0.58 | % | ||
Taiwan | 0.58 | % | ||
South Korea | 0.50 | % | ||
Netherlands | 0.46 | % | ||
Italy | 0.44 | % | ||
See Notes to Schedule of Investments and Notes to Financial Statements.
Table of Contents
| State Street Total Return V.I.S. Fund | ||
| Schedule of Investments | June 30, 2019 (Unaudited) |
Country/Territory | Percentage (based on Fair Value) | |||
India | 0.40 | % | ||
Singapore | 0.39 | % | ||
Finland | 0.33 | % | ||
Supranational | 0.32 | % | ||
South Africa | 0.32 | % | ||
Spain | 0.31 | % | ||
Bermuda | 0.27 | % | ||
Israel | 0.26 | % | ||
Brazil | 0.26 | % | ||
Russian Federation | 0.26 | % | ||
Norway | 0.18 | % | ||
Belgium | 0.17 | % | ||
Denmark | 0.17 | % | ||
Mexico | 0.17 | % | ||
New Zealand | 0.12 | % | ||
Malaysia | 0.12 | % | ||
Luxembourg | 0.12 | % | ||
Puerto Rico | 0.10 | % | ||
Poland | 0.10 | % | ||
Thailand | 0.09 | % | ||
Cayman Islands | 0.08 | % | ||
Philippines | 0.07 | % | ||
Chile | 0.06 | % | ||
Colombia | 0.05 | % | ||
Indonesia | 0.05 | % | ||
Turkey | 0.04 | % | ||
Hungary | 0.03 | % | ||
Iraq | 0.02 | % | ||
Uruguay | 0.02 | % | ||
Czech Republic | 0.02 | % | ||
Greece | 0.02 | % | ||
Peru | 0.02 | % | ||
Austria | 0.01 | % | ||
Czech | 0.01 | % | ||
Panama | 0.01 | % | ||
Guernsey | 0.01 | % | ||
Jersey | 0.01 | % | ||
Pakistan | 0.00 | % | ||
|
| |||
| 100.00 | % | |||
|
| |||
The Fund’s % share of investment in the various categories, based on Fair Value, is as follows at June 30, 2019 (unaudited):
Industry | Domestic | Foreign | Total | |||||||||
| 8.02 | % | 0.00 | % | 8.02 | % | |||||||
Exchange Traded Funds | 7.94 | % | 0.00 | % | 7.94 | % | ||||||
Property & Casualty Insurance | 1.92 | % | 0.40 | % | 2.32 | % | ||||||
Pharmaceuticals | 1.45 | % | 0.60 | % | 2.05 | % | ||||||
Multi-Line Insurance | 0.13 | % | 1.40 | % | 1.53 | % | ||||||
Diversified Banks | 0.00 | % | 1.40 | % | 1.40 | % | ||||||
Multi-Sector Holdings | 1.03 | % | 0.27 | % | 1.30 | % | ||||||
Application Software | 1.25 | % | 0.00 | % | 1.25 | % | ||||||
Life & Health Insurance | 0.58 | % | 0.64 | % | 1.22 | % | ||||||
Semiconductors | 1.06 | % | 0.15 | % | 1.21 | % | ||||||
IT Consulting & Other Services | 0.24 | % | 0.92 | % | 1.16 | % | ||||||
Technology Hardware, Storage & Peripherals | 0.62 | % | 0.52 | % | 1.14 | % | ||||||
Oil & Gas Refining & Marketing | 0.92 | % | 0.17 | % | 1.09 | % | ||||||
Healthcare Equipment | 0.99 | % | 0.03 | % | 1.02 | % | ||||||
Industrial Machinery | 0.30 | % | 0.70 | % | 1.00 | % | ||||||
Electric Utilities | 0.34 | % | 0.65 | % | 0.99 | % | ||||||
Integrated Telecommunication Services | 0.01 | % | 0.96 | % | 0.97 | % | ||||||
Apparel Retail | 0.80 | % | 0.15 | % | 0.95 | % | ||||||
Industrial Conglomerates | 0.75 | % | 0.20 | % | 0.95 | % | ||||||
Integrated Oil & Gas | 0.22 | % | 0.72 | % | 0.94 | % | ||||||
Communications Equipment | 0.93 | % | 0.00 | % | 0.93 | % | ||||||
Retail REITs | 0.43 | % | 0.50 | % | 0.93 | % | ||||||
Personal Products | 0.41 | % | 0.46 | % | 0.87 | % | ||||||
Asset Management & Custody Banks | 0.46 | % | 0.35 | % | 0.81 | % | ||||||
Food Retail | 0.25 | % | 0.54 | % | 0.79 | % | ||||||
Mortgage REITs | 0.77 | % | 0.00 | % | 0.77 | % | ||||||
See Notes to Schedule of Investments and Notes to Financial Statements.
Table of Contents
| State Street Total Return V.I.S. Fund | ||
| Schedule of Investments | June 30, 2019 (Unaudited) |
Industry | Domestic | Foreign | Total | |||||||||
Automobile Manufacturers | 0.39 | % | 0.37 | % | 0.76 | % | ||||||
Apparel, Accessories & Luxury Goods | 0.35 | % | 0.40 | % | 0.75 | % | ||||||
Trading Companies & Distributors | 0.24 | % | 0.50 | % | 0.74 | % | ||||||
Movies & Entertainment | 0.69 | % | 0.04 | % | 0.73 | % | ||||||
Industrial Gases | 0.00 | % | 0.73 | % | 0.73 | % | ||||||
Data Processing & Outsourced Services | 0.68 | % | 0.04 | % | 0.72 | % | ||||||
Hypermarkets & Super Centers | 0.61 | % | 0.10 | % | 0.71 | % | ||||||
Reinsurance | 0.10 | % | 0.60 | % | 0.70 | % | ||||||
Managed Healthcare | 0.67 | % | 0.00 | % | 0.67 | % | ||||||
Regional Banks | 0.43 | % | 0.17 | % | 0.60 | % | ||||||
Aerospace & Defense | 0.32 | % | 0.26 | % | 0.58 | % | ||||||
Packaged Foods & Meats | 0.25 | % | 0.30 | % | 0.55 | % | ||||||
Systems Software | 0.50 | % | 0.04 | % | 0.54 | % | ||||||
Auto Parts & Equipment | 0.22 | % | 0.32 | % | 0.54 | % | ||||||
Gas Utilities | 0.21 | % | 0.32 | % | 0.53 | % | ||||||
Home Building | 0.05 | % | 0.45 | % | 0.50 | % | ||||||
Specialty Chemicals | 0.04 | % | 0.45 | % | 0.49 | % | ||||||
Healthcare Facilities | 0.39 | % | 0.03 | % | 0.42 | % | ||||||
Diversified REITs | 0.14 | % | 0.27 | % | 0.41 | % | ||||||
Household Products | 0.35 | % | 0.05 | % | 0.40 | % | ||||||
Financial Exchanges & Data | 0.22 | % | 0.18 | % | 0.40 | % | ||||||
Construction & Engineering | 0.23 | % | 0.14 | % | 0.37 | % | ||||||
Internet & Direct Marketing Retail | 0.27 | % | 0.10 | % | 0.37 | % | ||||||
Advertising | 0.29 | % | 0.05 | % | 0.34 | % | ||||||
General Merchandise Stores | 0.00 | % | 0.33 | % | 0.33 | % | ||||||
Biotechnology | 0.33 | % | 0.00 | % | 0.33 | % | ||||||
Air Freight & Logistics | 0.29 | % | 0.03 | % | 0.32 | % | ||||||
Tires & Rubber | 0.03 | % | 0.29 | % | 0.32 | % | ||||||
Research & Consulting Services | 0.15 | % | 0.16 | % | 0.31 | % | ||||||
Multi-Utilities | 0.21 | % | 0.09 | % | 0.30 | % | ||||||
Technology Distributors | 0.27 | % | 0.03 | % | 0.30 | % | ||||||
Healthcare Services | 0.22 | % | 0.08 | % | 0.30 | % | ||||||
Healthcare Distributors | 0.15 | % | 0.14 | % | 0.29 | % | ||||||
Department Stores | 0.17 | % | 0.11 | % | 0.28 | % | ||||||
Environmental & Facilities Services | 0.28 | % | 0.00 | % | 0.28 | % | ||||||
Airlines | 0.20 | % | 0.07 | % | 0.27 | % | ||||||
Construction Machinery & Heavy Trucks | 0.19 | % | 0.07 | % | 0.26 | % | ||||||
Life Sciences Tools & Services | 0.18 | % | 0.07 | % | 0.25 | % | ||||||
Independent Power Producers & Energy Traders | 0.13 | % | 0.12 | % | 0.25 | % | ||||||
Trucking | 0.20 | % | 0.04 | % | 0.24 | % | ||||||
Human Resource & Employment Services | 0.16 | % | 0.06 | % | 0.22 | % | ||||||
Interactive Media & Services | 0.12 | % | 0.10 | % | 0.22 | % | ||||||
Industrial REITs | 0.01 | % | 0.20 | % | 0.21 | % | ||||||
Health Care REITs | 0.21 | % | 0.00 | % | 0.21 | % | ||||||
Specialty Stores | 0.20 | % | 0.01 | % | 0.21 | % | ||||||
Security & Alarm Services | 0.00 | % | 0.21 | % | 0.21 | % | ||||||
Real Estate Operating Companies | 0.00 | % | 0.20 | % | 0.20 | % | ||||||
Office REITs | 0.06 | % | 0.14 | % | 0.20 | % | ||||||
Wireless Telecommunication Services | 0.03 | % | 0.17 | % | 0.20 | % | ||||||
Electronic Manufacturing Services | 0.16 | % | 0.04 | % | 0.20 | % | ||||||
Specialized REITs | 0.19 | % | 0.00 | % | 0.19 | % | ||||||
Hotel & Resort REITs | 0.17 | % | 0.00 | % | 0.17 | % | ||||||
Real Estate Development | 0.00 | % | 0.17 | % | 0.17 | % | ||||||
Thrifts & Mortgage Finance | 0.16 | % | 0.00 | % | 0.16 | % | ||||||
Distributors | 0.16 | % | 0.00 | % | 0.16 | % | ||||||
Automotive Retail | 0.15 | % | 0.01 | % | 0.16 | % | ||||||
Hotels, Resorts & Cruise Lines | 0.04 | % | 0.12 | % | 0.16 | % | ||||||
Steel | 0.10 | % | 0.06 | % | 0.16 | % | ||||||
Investment Banking & Brokerage | 0.16 | % | (0.01 | %) | 0.15 | % | ||||||
Commodity Chemicals | 0.01 | % | 0.14 | % | 0.15 | % | ||||||
Electronic Equipment & Instruments | 0.07 | % | 0.07 | % | 0.14 | % | ||||||
Alternative Carriers | 0.11 | % | 0.03 | % | 0.14 | % | ||||||
Electronic Components | 0.07 | % | 0.07 | % | 0.14 | % | ||||||
Metal & Glass Containers | 0.10 | % | 0.04 | % | 0.14 | % | ||||||
Diversified Support Services | 0.13 | % | 0.00 | % | 0.13 | % | ||||||
Broadcasting | 0.07 | % | 0.06 | % | 0.13 | % | ||||||
Tobacco | 0.01 | % | 0.10 | % | 0.11 | % | ||||||
Commercial Printing | 0.01 | % | 0.10 | % | 0.11 | % | ||||||
Internet Services & Infrastructure | 0.11 | % | 0.00 | % | 0.11 | % | ||||||
Restaurants | 0.10 | % | 0.01 | % | 0.11 | % | ||||||
Marine | 0.00 | % | 0.11 | % | 0.11 | % | ||||||
Diversified Real Estate Activities | 0.00 | % | 0.11 | % | 0.11 | % | ||||||
See Notes to Schedule of Investments and Notes to Financial Statements.
Table of Contents
| State Street Total Return V.I.S. Fund | ||
| Schedule of Investments | June 30, 2019 (Unaudited) |
Industry | Domestic | Foreign | Total | |||||||||
Cable & Satellite | 0.05 | % | 0.05 | % | 0.10 | % | ||||||
Footwear | 0.07 | % | 0.03 | % | 0.10 | % | ||||||
Distillers & Vintners | 0.02 | % | 0.08 | % | 0.10 | % | ||||||
Consumer Electronics | 0.10 | % | 0.00 | % | 0.10 | % | ||||||
Insurance Brokers | 0.10 | % | 0.00 | % | 0.10 | % | ||||||
Electrical Components & Equipment | 0.09 | % | 0.00 | % | 0.09 | % | ||||||
Construction Materials | 0.00 | % | 0.09 | % | 0.09 | % | ||||||
Coal & Consumable Fuels | 0.01 | % | 0.08 | % | 0.09 | % | ||||||
Airport Services | 0.03 | % | 0.05 | % | 0.08 | % | ||||||
Oil & Gas Exploration & Production | 0.04 | % | 0.04 | % | 0.08 | % | ||||||
Consumer Finance | 0.07 | % | 0.00 | % | 0.07 | % | ||||||
Other Diversified Financial Services | 0.04 | % | 0.03 | % | 0.07 | % | ||||||
Paper Packaging | 0.07 | % | 0.00 | % | 0.07 | % | ||||||
Healthcare Supplies | 0.07 | % | 0.00 | % | 0.07 | % | ||||||
Residential REITs | 0.06 | % | 0.00 | % | 0.06 | % | ||||||
Renewable Electricity | 0.00 | % | 0.06 | % | 0.06 | % | ||||||
Home Furnishing Retail | 0.06 | % | 0.00 | % | 0.06 | % | ||||||
Soft Drinks | 0.05 | % | 0.01 | % | 0.06 | % | ||||||
Brewers | 0.05 | % | 0.01 | % | 0.06 | % | ||||||
Agricultural Products | 0.00 | % | 0.06 | % | 0.06 | % | ||||||
Leisure Products | 0.04 | % | 0.02 | % | 0.06 | % | ||||||
Railroads | 0.06 | % | 0.00 | % | 0.06 | % | ||||||
Publishing | 0.02 | % | 0.03 | % | 0.05 | % | ||||||
Oil & Gas Storage & Transportation | 0.02 | % | 0.03 | % | 0.05 | % | ||||||
Agricultural & Farm Machinery | 0.05 | % | 0.00 | % | 0.05 | % | ||||||
Interactive Home Entertainment | 0.05 | % | 0.00 | % | 0.05 | % | ||||||
Oil & Gas Drilling | 0.05 | % | 0.00 | % | 0.05 | % | ||||||
Household Appliances | 0.01 | % | 0.04 | % | 0.05 | % | ||||||
Diversified Metals & Mining | 0.00 | % | 0.05 | % | 0.05 | % | ||||||
Paper Products | 0.04 | % | 0.00 | % | 0.04 | % | ||||||
Education Services | 0.04 | % | 0.00 | % | 0.04 | % | ||||||
Marine Ports & Services | 0.00 | % | 0.04 | % | 0.04 | % | ||||||
Office Services & Supplies | 0.02 | % | 0.02 | % | 0.04 | % | ||||||
Oil & Gas Equipment & Services | 0.04 | % | 0.00 | % | 0.04 | % | ||||||
Fertilizers & Agricultural Chemicals | 0.01 | % | 0.03 | % | 0.04 | % | ||||||
Home Improvement Retail | 0.00 | % | 0.04 | % | 0.04 | % | ||||||
Computer & Electronics Retail | 0.00 | % | 0.03 | % | 0.03 | % | ||||||
Building Products | 0.03 | % | 0.00 | % | 0.03 | % | ||||||
Leisure Facilities | 0.03 | % | 0.00 | % | 0.03 | % | ||||||
Water Utilities | 0.00 | % | 0.03 | % | 0.03 | % | ||||||
Casinos & Gaming | 0.00 | % | 0.03 | % | 0.03 | % | ||||||
Food Distributors | 0.01 | % | 0.02 | % | 0.03 | % | ||||||
Diversified Chemicals | 0.00 | % | 0.03 | % | 0.03 | % | ||||||
Motorcycle Manufacturers | 0.00 | % | 0.02 | % | 0.02 | % | ||||||
Semiconductor Equipment | 0.01 | % | 0.01 | % | 0.02 | % | ||||||
Drug Retail | 0.00 | % | 0.02 | % | 0.02 | % | ||||||
Textiles | 0.00 | % | 0.01 | % | 0.01 | % | ||||||
Diversified Capital Markets | 0.00 | % | 0.01 | % | 0.01 | % | ||||||
Real Estate Services | 0.01 | % | 0.00 | % | 0.01 | % | ||||||
Highways & Railtracks | 0.00 | % | 0.01 | % | 0.01 | % | ||||||
Copper | 0.00 | % | 0.01 | % | 0.01 | % | ||||||
Healthcare Technology | 0.01 | % | 0.00 | % | 0.01 | % | ||||||
Aluminum | 0.00 | % | 0.00 | % | 0.00 | % | ||||||
Home Furnishings | 0.00 | % | 0.00 | % | 0.00 | % | ||||||
Specialized Finance | 0.00 | % | 0.00 | % | 0.00 | % | ||||||
Banks | 0.00 | % | 0.00 | % | 0.00 | % | ||||||
|
| |||||||||||
| 69.57 | % | |||||||||||
|
| |||||||||||
Sector | Percentage (based on Fair Value) | |||||||||
U.S. Treasuries | 13.88 | % | ||||||||
Corporate Notes | 6.89 | % | ||||||||
Agency Mortgage Backed | 6.77 | % | ||||||||
Sovereign Bonds | 0.39 | % | ||||||||
Non-Agency Collateralized Mortgage Obligations | 0.28 | % | ||||||||
Municipal Bonds and Notes | 0.16 | % | ||||||||
Agency Collateralized Mortgage Obligations | 0.16 | % | ||||||||
Asset Backed | 0.10 | % | ||||||||
U.S. Government Sponsored Agencies | 0.03 | % | ||||||||
|
| |||||||||
| 28.66 | % | |||||||||
|
| |||||||||
Short-Term Investments | ||||||||||
Short-Term Investments | 1.77 | % | ||||||||
|
| |||||||||
| 1.77 | % | |||||||||
|
| |||||||||
| 100.00 | % | |||||||||
|
| |||||||||
See Notes to Schedule of Investments and Notes to Financial Statements.
Table of Contents
| State Street Total Return V.I.S. Fund | ||
| Schedule of Investments | June 30, 2019 (Unaudited) |
Affiliate Table
| Number of Shares Held at 12/31/18 | Value At 12/31/18 | Cost of Purchases | Proceeds from Shares Sold | Realized Gain (Loss) | Change in Unrealized Appreciation/Dep reciation | Number of Shares Held at 6/30/19 | Value at 6/30/19 | Dividend Income | ||||||||||||||||||||||||||||
SPDR Bloomberg Barclays High Yield Bond ETF | 2,846,551 | 95,615,648 | 81,239,660 | 26,434,652 | (726,720 | ) | 8,718,442 | 1,454,125 | $ | 158,412,378 | 2,910,395 | |||||||||||||||||||||||||
SPDR Dow Jones REIT ETF | 410,485 | 35,301,710 | 74,819,129 | 20,888,224 | 408,828 | 6,423,081 | 972,313 | 96,064,524 | 1,173,419 | |||||||||||||||||||||||||||
State Street Institutional U.S. Government Money Market Fund - Class G Shares | 90,625,489 | 90,625,489 | 252,175,406 | 307,902,222 | — | — | 34,898,673 | 34,898,673 | 557,397 | |||||||||||||||||||||||||||
|
|
|
|
|
|
|
|
|
|
|
|
|
|
|
|
|
| |||||||||||||||||||
TOTAL | $ | 221,542,847 | $ | 408,234,195 | $ | 355,225,098 | $ | (317,892 | ) | $ | 15,141,523 | $ | 289,375,575 | $ | 4,641,211 | |||||||||||||||||||||
|
|
|
|
|
|
|
|
|
|
|
|
|
| |||||||||||||||||||||||
See Notes to Schedule of Investments and Notes to Financial Statements.
Table of Contents
| (b) | Not applicable to the Registrant. |
| Item 7. | Disclosure of Proxy Voting Policies and Procedures forClosed-End Management Investment Companies. |
Not applicable to the Registrant.
| Item 8. | Portfolio Managers ofClosed-End Management Investment Companies. |
Not applicable to the Registrant.
| Item 9. | Purchases of Equity Securities byClosed-End Management Investment Company and Affiliated Purchasers. |
Not applicable to the Registrant.
Table of Contents
| Item 10. | Submission of Matters to a Vote of Security Holders. |
The Registrant’s Board of Directors (the “Board”) approved an Amended and Restated Nominating Committee Charter (the “Charter”) by unanimous written consent. The Charter contains procedures related to how shareholders are to submit recommendations for Director candidates to the Registrant. Those procedures are as follows:
Procedures for Shareholders to Submit Nominee Candidates
(As of January 10, 20191)
A shareholder of the Fund Entity, or of any series thereof, if applicable, must follow the following procedures in order to submit properly a nominee recommendation for the Nominating Committee’s consideration.
| 1. | The shareholder must submit any such recommendation (a “Shareholder Recommendation”) in writing to the Fund Entity, to the attention of the Fund Entity’s Secretary, at the address of the principal executive offices of the Fund Entity. |
| 2. | The Shareholder Recommendation must be delivered to, or mailed and received at, the principal executive offices of the Fund Entity not less than sixty (60) calendar days nor more than ninety (90) calendar days prior to the date of the Board or shareholder meeting at which the nominee candidate would be considered for election. Shareholder Recommendations will be kept on file for two years after receipt of the Shareholder Recommendation. A Shareholder Recommendation considered by the Nominating Committee in connection with the Nominating Committee’s nomination of any candidate(s) for appointment or election as an independent Trustee/Directors need not be considered again by the Nominating Committee in connection with any subsequent nomination(s). |
| 3. | The Shareholder Recommendation must include: (i) a statement in writing setting forth (A) the name, age, date of birth, business address, residence address and nationality of the person recommended by the shareholder (the “candidate”), and the names and addresses of at least three professional references; (B) the number of all shares of the Fund Entity (including the series and class, if applicable) owned of record or beneficially by the candidate, the date such shares were acquired and the investment intent of such acquisition(s), as reported to such shareholder by the candidate; (C) any other information regarding the candidate called for with respect to director nominees by paragraphs (a), (d), (e) and (f) of Item 401 of RegulationS-K or paragraph (b) of Item 22 of Rule14a-101 (Schedule 14A) under the Securities Exchange Act of 1934, as amended (the “Exchange Act”), adopted by the Securities and Exchange Commission (or the corresponding provisions of any applicable regulation or rule subsequently adopted by the Securities and Exchange Commission or any successor agency with jurisdiction related to the Fund Entity); (D) any other information regarding the candidate that would be required to be disclosed if the candidate were a nominee in a proxy statement or other filing required to be made in connection with solicitation of proxies for election of directors pursuant to Section 14 of the Exchange Act and the rules and regulations promulgated thereunder or any other applicable law or regulation; and (E) whether the recommending shareholder believes that the candidate is or will be an “interested person” of the Fund Entity (as defined in the Investment Company Act of 1940, as amended) and, if not an “interested person,” information regarding the candidate that will be sufficient, in the discretion of the Board or the Nominating Committee, for the Fund Entity to make such determination; (ii) the written and signed consent of the candidate to be named as a nominee and to serve as a Trustee/Director if elected; (iii) the recommending |
| 1 | Amended solely with respect to the adoption of this charter by State Street Institutional Funds and State Street Variable Insurance Series Funds, Inc. |
Table of Contents
| shareholder’s name as it appears on the Fund Entity’s books; (iv) the number of all shares of the Fund Entity (including the series and class, if applicable) owned beneficially and of record by the recommending shareholder; (v) a complete description of all arrangements or understandings between the recommending shareholder and the candidate and any other person or persons (including their names) pursuant to which the recommendation is being made by the recommending shareholder including, without limitation, all direct and indirect compensation and other material monetary agreements, arrangements and understandings between the candidate and recommending shareholder during the past three years, and (vi) a brief description of the candidate’s relevant background and experience for membership on the Board, such as qualification as an audit committee financial expert. |
| 4. | The Nominating Committee may require the recommending shareholder to furnish such other information as it may reasonably require or deem necessary to verify any information furnished pursuant to paragraph 3 above or to determine the eligibility of the candidate to serve as a Trustee/Director of the Fund Entity or to satisfy applicable law. If the recommending shareholder fails to provide such other information in writing within seven days of receipt of a written request from the Nominating Committee, the recommendation of such candidate as a nominee will be deemed not properly submitted for consideration, and the Nominating Committee will not be required to consider such candidate. |
| Item 11. | Controls and Procedures. |
| (a) | The Registrant’s principal executive officer and principal financial officer have concluded that the Registrant’s disclosure controls and procedures (as defined in Rule30a-3(c) under the Investment Company Act of 1940, as amended (the “1940 Act”)) are effective to provide reasonable assurance that information required to be disclosed by the Registrant on FormN-CSR is recorded, processed, summarized and reported as of a date within 90 days of the filing date of this report, based on their evaluation of these controls and procedures required by Rule30a-3(b) under the 1940 Act and Rules13a-15(b) or15d-15(b) under the Securities Exchange Act of 1934, as amended. |
| (b) | There were no changes in the Registrant’s internal control over financial reporting (as defined in Rule30a-3(d) under the 1940 Act) that occurred during the Registrant’s most recent fiscal half-year that have materially affected, or are reasonably likely to materially affect, the Registrant’s internal control over financial reporting. |
| Item 12. | Disclosure of Securities Lending Activities forClosed-End Management Investment Companies. |
| (a) | Not applicable to the Registrant. |
| (b) | Not applicable to the Registrant. |
Table of Contents
| Item 13. | Exhibits. |
| (a)(1) | Not applicable; this FormN-CSR is a Semi-Annual Report. | |
| (a)(2) | Certifications of principal executive officer and principal financial and accounting officer of the Registrant as required by Rule30a-2(a) under the 1940 Act are attached hereto. | |
(a)(3) | Not applicable to the Registrant. | |
| (a)(4) | Not applicable. | |
| (b) | Certifications of principal executive officer and principal financial and accounting officer of the Registrant as required by Rule30a-2(b) under the 1940 Act and Section 906 of the Sarbanes-Oxley Act of 2002 are attached hereto. | |
Table of Contents
SIGNATURES
Pursuant to the requirements of the Securities Exchange Act of 1934 and the Investment Company Act of 1940, the Registrant has duly caused this report to be signed on its behalf by the undersigned, thereunto duly authorized.
Registrant: STATE STREET VARIABLE INSURANCE SERIES FUNDS, INC.
| By: | /s/ Jeanne M. La Porta | |
| Jeanne M. La Porta | ||
| President | ||
| Date: | August 26, 2019 | |
Pursuant to the requirements of the Securities Exchange Act of 1934 and the Investment Company Act of 1940, this report has been signed below by the following persons on behalf of the Registrant and in the capacities and on the dates indicated.
| By: | /s/ Jeanne M. La Porta | |
| Jeanne M. La Porta | ||
| President (Principal Executive Officer) | ||
| Date: | August 26, 2019 | |
| By: | /s/ Bruce S. Rosenberg | |
| Bruce S. Rosenberg | ||
| Treasurer (Principal Financial Officer) | ||
| Date: | August 26, 2019 | |