UNITED STATES
SECURITIES AND EXCHANGE COMMISSION
Washington, D.C. 20549
FORM N-CSR
CERTIFIED SHAREHOLDER REPORT OF REGISTERED
MANAGEMENT INVESTMENT COMPANIES
Investment Company Act file number 811-04087
Manning & Napier Fund, Inc.
(Exact name of registrant as specified in charter)
| | |
| 290 Woodcliff Drive, Fairport, NY | | 14450 |
| (Address of principal executive offices) | | (Zip Code) |
B. Reuben Auspitz 290 Woodcliff Drive, Fairport, NY 14450
(Name and address of agent for service)
Registrant’s telephone number, including area code: 585-325-6880
Date of fiscal year end: December 31, 2007
Date of reporting period: January 1, 2007 through December 31, 2007
Form N-CSR is to be used by management investment companies to file reports with the Commission not later than 10 days after the transmission to stockholders of any report that is required to be transmitted to stockholders under Rule 30e-1 under the Investment Company Act of 1940 (17 CFR 270.30e-1). The Commission may use the information provided on Form N-CSR in its regulatory, disclosure review, inspection, and policymaking roles.
A registrant is required to disclose the information specified by Form N-CSR, and the Commission will make this information public. A registrant is not required to respond to the collection of information contained in Form N-CSR unless the Form displays a currently valid Office of Management and Budget (“OMB”) control number. Please direct comments concerning the accuracy of the information collection burden estimate and any suggestions for reducing the burden to Secretary, Securities and Exchange Commission, 450 Fifth Street, NW, Washington, DC 20549-0609. The OMB has reviewed this collection of information under the clearance requirements of 44 U.S.C. Section 3507.
| ITEM 1: | REPORTS TO STOCKHOLDERS |
Manning & Napier Fund, Inc.
| | | | |
| CORE BOND SERIES | | | | | Annual Report - December 31, 2007 |

Management Discussion and Analysis (unaudited)
Dear Shareholders:
It would be a bit of an understatement to describe 2007 as an “eventful” year; it was a wild ride during which fixed income investors were buffeted by a number of factors. “Subprime”, a relatively obscure term, entered the everyday vernacular. Securities that were thought to be rated “AAA” turned out not to be. There were high profile disasters as well as conservative success stories. And, as always seems to be the case, the Federal Reserve (the “Fed”) once again played a prominent role.
Given the added risk associated with corporate bonds and mortgage-backed bonds, they traditionally carry higher yields when compared to similar maturity U.S. Treasury securities. That difference is called the “credit spread” when referring to corporate bonds, and the “pre-payment spread” when referring to pass-through securities such as mortgage-backed bonds. Over the long-term, those spreads have allowed corporate bonds and mortgage-backed bonds to generate higher total returns than U.S. Treasuries. That tendency led to the activation of the Core Bond Series back in April of 2005.
Unfortunately in 2007, the credit/pre-payment spreads associated with those securities widened; U.S. Treasury yields moved sharply lower last year while yields in the mortgage-backed sector were only slightly lower and corporate yields were slightly higher. As a result mortgage-backed and corporate bond investors did earn their coupons, plus in many instances a modest capital gain, but those returns failed to keep up with the returns of the U.S. Treasury market. The fact that the Core Bond Series concentrates its investments in spread investments worked against the Series last year, so it underperformed relative to its benchmark, which includes a significant U.S. Treasury and Agency component.
As for specifics, the yield on the market-weighted U.S. Treasury index dropped from 4.87% to 3.66%. The biggest declines were on the short-end of the yield curve where yields on bonds with 2-year maturities fell 176 basis points (1.76%), starting the year at 4.81% and finishing it at 3.05%; long-term U.S. Treasury rates dropped from 4.81% to 4.45%, a 36 basis point (0.36%) decline. As for the mortgage-backed market, the yield on that index fell 34 basis points (0.34%), from 5.66% to 5.32%; the yield on the corporate index moved higher, rising from 5.70% to 5.81%.
The first quarter of the year was relatively quiet since the economic releases were relatively mixed. On the good side, unemployment was down to 4.4% in March, payroll growth was still relatively robust, and the 4-week average of initial claims for unemployment insurance was drifting lower. Unfortunately, the good news in the labor markets was offset by the bad news in the housing sector; it remained under duress, and it started to become apparent that the hoped for bottom of the housing market was still quite a ways off.
During the second quarter of the year, rates on short- and long-term bonds began to move in opposite directions, reflecting two distinct factors. On the short-end of the yield curve, a significant change in the market’s supply/demand dynamics pushed rates lower. A shrinking Federal deficit mitigates the Treasury’s borrowing needs, which in turn shrinks the supply of U.S. Treasury Bills, while foreign central banks began paring back their longer-term U.S. Treasury purchases, focusing instead on U.S. Treasury Bills. The combination of a shrinking supply and increased demand pushed short-term U.S. Treasury rates lower. On the intermediate-to-long end of the yield curve, rates rose due to a marked change in the market’s expectations about monetary policy and the rate of economic growth. As we moved into the summer, a number of the economic releases suggested that the rate of economic growth was picking back up. At the same time, the Fed started to hedge when it came to defining what it considered to be an acceptable rate of inflation. The markets responded by re-adjusting intermediate-to-longer term interest rates higher.
Market psychology definitely changed during the third quarter of the year and the precipitous drop in interest rates began, triggered by a flight to quality and a reassessment of the trajectory of Fed policy. While the problems in the market for subprime mortgage loans were well known prior to the third quarter, the collapse of two high profile hedge funds at Bear Stearns along with a couple of European bank announcements revealed the first set of identifiable
Management Discussion and Analysis (unaudited)
victims. That caused investors to exit and/or avoid anything remotely tied to the subprime sector. The proceeds were parked in the perceived safest, most liquid alternative, specifically short-term U.S. Treasury instruments.
Given the financial dislocations caused by this flight to quality, both the Fed and European central banks responded by injecting liquidity into the financial system. The Fed began by cutting the discount rate (the rate charged to banks to borrow reserves directly from the Fed), and followed that initial move with a cut in the Fed Funds target (the rate charged by banks to borrow reserves from each other). Cutting the targeted Fed Funds rate was not only a response to the liquidity concerns associated with a flight to quality, but also a response to a weakening labor market.
During the fourth quarter there were two additional policy moves enacted by the Fed. It followed up its 50 basis point cut in September with 25 basis point cuts in October and December. The Fed and the markets were both responding to the headwinds that continued to buffet the U.S. economy. The housing sector continued to sink with new home sales dropping 50% from their highs, existing home sales down one-third, and home prices posting year-over-year declines, a decidedly rare occurrence. What was more troubling was the fact that the problems in the housing sector appeared to have spilled over into other sectors of the economy. Job growth had slowed and the unemployment rate had risen to 5.0%, a level not seen since the end of 2005. At some point that should affect income growth, which had been remarkably robust. It was not just the consumer sector that troubled the market; the manufacturing sector appeared to be weakening as well.
Given the economic headwinds, credit concerns rose. In addition, the corporate bond market is dominated by financial issuers, one of the sectors most impacted by the subprime mess. As was mentioned, credit spreads widened quite dramatically. As for the mortgage-backed sector, its spreads typically widen when interest rate volatility picks up; that was definitely the case in 2007, and pre-payment spreads widened.
As for the performance of the Core Bond Series in 2007, its total return was 5.58%. That lagged the Merrill Lynch U.S. Corporate, Government & Mortgage Index (which includes all U.S. Treasury, U.S. Agency, investment-grade corporate bonds, and plain vanilla mortgage-backed securities with maturities of more than one year), which returned 7.17% in 2007. The underperformance can be traced primarily to the strong performance of U.S. Treasury market, which we believe to be a short-term phenomenon.
We appreciate your business and wish you all the very best in the coming year.
Sincerely,
Manning & Napier Advisors, Inc.
Performance Update as of December 31, 2007 (unaudited)
| | | | | | |
| | | Average Annual Total Returns
As of December 31, 2007 | | |
| | | One
Year | | Since
Inception1 | | |
Manning & Napier Fund, Inc. - Core Bond Series2 | | 5.58% | | 4.09% | | |
Merrill Lynch U.S. Corporate, Government & Mortgage Index3 | | 7.17% | | 4.99% | | |
The following graph compares the value of a $10,000 investment in the Manning & Napier Fund, Inc. - Core Bond Series from its inception1 (4/21/05) to present (12/31/07) to the Merrill Lynch U.S. Corporate, Government & Mortgage Index.
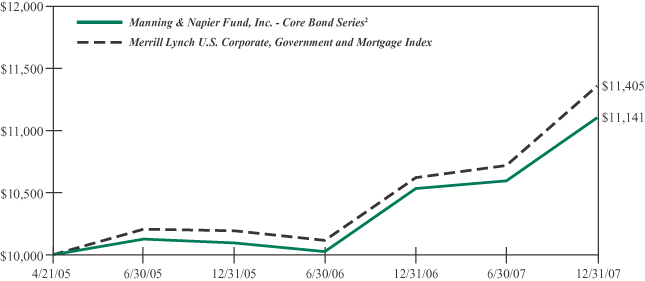
1Performance numbers for the Series and Index are calculated from April 21, 2005, the Series’ inception date.
2The Series’ performance does not reflect the deduction of taxes that a shareholder would pay on fund distributions or the redemption of shares. The Series’ performance is historical and may not be indicative of future results. The performance returns shown are inclusive of the net expense ratio of the Series. For the year ended December 31, 2007, this net expense ratio was 0.80%. The gross expense ratio, which does not account for any voluntary or contractual waivers currently in effect, was 0.84% for the year ended December 31, 2007.
3The unmanaged Merrill Lynch U.S. Corporate, Government & Mortgage Index (formerly Merrill Lynch U.S. Domestic Master Index) is a market value weighted measure that represents U.S. government, corporate, and pass-through securities issued by entities within the United States, by supranational entities, or by entities headquartered outside of the United States but who have issued dollar-denominated securities within the United States. The Index only includes investment-grade securities with maturities of greater than one year. The Index returns assume reinvestment of coupons and, unlike Series returns, do not reflect any fees or expenses.
Shareholder Expense Example (unaudited)
As a shareholder of the Series, you may incur two types of costs: (1) transaction costs, including potential wire charges on redemptions and (2) ongoing costs, including management fees and other Series expenses. This example is intended to help you understand your ongoing costs (in dollars) of investing in the Series and to compare these costs with the ongoing costs of investing in other mutual funds.
The example is based on an investment of $1,000 invested at the beginning of the period and held for the entire period (July 1, 2007 to December 31, 2007).
Actual Expenses
The first line of the table below provides information about actual account values and actual expenses. You may use the information in this line, together with the amount you invested, to estimate the expenses that you paid over the period. Simply divide your account value by $1,000 (for example, an $8,600 account value divided by $1,000 = 8.6), then multiply the result by the number in the first line under the heading entitled “Expenses Paid During Period” to estimate the expenses you paid on your account during this period.
Hypothetical Example for Comparison Purposes
The second line of the table below provides information about hypothetical account values and hypothetical expenses based on the Series’ actual expense ratio and an assumed rate of return of 5% per year before expenses, which is not the Series’ actual return. The hypothetical account values and expenses may not be used to estimate the actual ending account balance or expenses you paid during the period. You may use this information to compare the ongoing costs of investing in the Series and other funds. To do so, compare this 5% hypothetical example with the 5% hypothetical examples that appear in the shareholder reports of the other funds.
Please note that the expenses shown in the table are meant to highlight your ongoing costs only and do not reflect any transaction costs, such as potential wire charges on redemptions. Therefore, the second line of the table is useful in comparing ongoing costs only, and will not help you determine the relative total costs of owning different funds. In addition, if these transaction costs were included, your costs would have been higher.
| | | | | | | | | |
| | | Beginning
Account Value
7/1/07 | | Ending
Account Value
12/31/07 | | Expenses Paid
During Period*
7/1/07-12/31/07 |
Actual | | $ | 1,000.00 | | $ | 1,049.40 | | $ | 4.13 |
Hypothetical
(5% return before expenses) | | $ | 1,000.00 | | $ | 1,021.17 | | $ | 4.08 |
*Expenses are equal to the Series’ annualized expense ratio (for the six-month period) of 0.80%, multiplied by the average account value over the period, multiplied by 184/365 (to reflect the one-half year period). Expenses are based on the most recent fiscal half year; therefore, the expense ratio stated above may differ from the expense ratio stated in the financial highlights, which is based on one-year data. The Series’ total return would have been lower had certain expenses not been waived during the period.
Portfolio Composition as of December 31, 2007 (unaudited)
Sector Allocation1
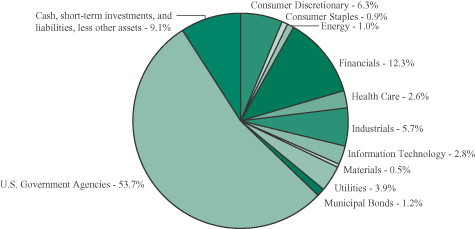
1As a percentage of net assets.
Credit Quality Ratings2,3
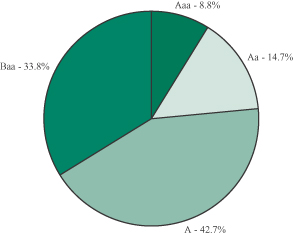
2As a percentage of total corporate bonds and municipal bonds.
3Based on ratings from Moody’s, or the S&P equivalent. The Series may use different ratings provided by other rating agencies for purposes of determining compliance with the Series’ investment policies.
Investment Portfolio - December 31, 2007
| | | | | | | | |
| | | Credit
Rating1
(unaudited) | | Principal
Amount | | Value
(Note 2) |
| | | | | | | | |
| | | |
CORPORATE BONDS - 36.0% | | | | | | | | |
| | | |
Convertible Corporate Bonds - 2.8% | | | | | | | | |
Consumer Discretionary - 0.7% | | | | | | | | |
Hotels, Restaurants & Leisure - 0.7% | | | | | | | | |
Carnival Corp., 2.00%, 4/15/2021 | | A3 | | $ | 305,000 | | $ | 356,469 |
| | | | | | | | |
Health Care - 1.2% | | | | | | | | |
Biotechnology - 0.9% | | | | | | | | |
Amgen, Inc., 0.375%, 2/1/2013 | | A2 | | | 515,000 | | | 452,556 |
| | | | | | | | |
Health Care Equipment & Supplies - 0.3% | | | | | | | | |
Medtronic, Inc., 1.625%, 4/15/2013 | | A1 | | | 120,000 | | | 128,100 |
| | | | | | | | |
Total Health Care | | | | | | | | 580,656 |
| | | | | | | | |
Information Technology - 0.9% | | | | | | | | |
Software - 0.9% | | | | | | | | |
Amdocs Ltd., 0.50%, 3/15/2024 (Guernsey) (Note 7) | | Baa3 | | | 465,000 | | | 472,556 |
| | | | | | | | |
Total Convertible Corporate Bonds
(Identified Cost $1,455,261) | | | | | | | | 1,409,681 |
| | | | | | | | |
Non-Convertible Corporate Bonds - 33.2% | | | | | | | | |
Consumer Discretionary - 5.6% | | | | | | | | |
Hotels, Restaurants & Leisure - 1.0% | | | | | | | | |
McDonald’s Corp., 5.80%, 10/15/2017 | | A3 | | | 480,000 | | | 496,981 |
| | | | | | | | |
Media - 2.9% | | | | | | | | |
AOL Time Warner (now known as Time Warner, Inc.), 7.625%, 4/15/2031 | | Baa2 | | | 510,000 | | | 564,376 |
Comcast Corp., 6.50%, 11/15/2035 | | Baa2 | | | 570,000 | | | 581,650 |
The Walt Disney Co., 7.00%, 3/1/2032 | | A2 | | | 280,000 | | | 321,742 |
| | | | | | | | |
| | | | | | | | 1,467,768 |
| | | | | | | | |
Multiline Retail - 1.0% | | | | | | | | |
Target Corp., 5.875%, 3/1/2012 | | A2 | | | 485,000 | | | 502,097 |
| | | | | | | | |
Specialty Retail - 0.7% | | | | | | | | |
Lowe’s Companies, Inc., 8.25%, 6/1/2010 | | A1 | | | 300,000 | | | 327,765 |
| | | | | | | | |
Total Consumer Discretionary | | | | | | | | 2,794,611 |
| | | | | | | | |
Consumer Staples - 0.9% | | | | | | | | |
Food & Staples Retailing - 0.9% | | | | | | | | |
The Kroger Co., 7.25%, 6/1/2009 | | Baa2 | | | 215,000 | | | 221,167 |
The Kroger Co., 5.50%, 2/1/2013 | | Baa2 | | | 230,000 | | | 230,604 |
| | | | | | | | |
Total Consumer Staples | | | | | | | | 451,771 |
| | | | | | | | |
Energy - 1.0% | | | | | | | | |
Oil, Gas & Consumable Fuels - 1.0% | | | | | | | | |
Anadarko Petroleum Corp., 5.95%, 9/15/2016 | | Baa3 | | | 455,000 | | | 463,295 |
| | | | | | | | |
| | |
| 6 | | The accompanying notes are an integral part of the financial statements. |
Investment Portfolio - December 31, 2007
| | | | | | | | |
| | | Credit
Rating1
(unaudited) | | Principal
Amount | | Value
(Note 2) |
| | | | | | | | |
| | | |
CORPORATE BONDS (continued) | | | | | | | | |
| | | |
Non-Convertible Corporate Bonds (continued) | | | | | | | | |
Financials - 12.3% | | | | | | | | |
Capital Markets - 3.0% | | | | | | | | |
The Goldman Sachs Group, Inc., 6.345%, 2/15/2034 | | A1 | | $ | 640,000 | | $ | 577,997 |
Lehman Brothers Holdings, Inc., 4.9775%,11/16/20095 | | A1 | | | 240,000 | | | 233,804 |
Lehman Brothers Holdings, Inc., 6.50%, 7/19/2017 | | A2 | | | 235,000 | | | 237,786 |
Merrill Lynch & Co., Inc., 6.00%, 2/15/2017 | | A1 | | | 235,000 | | | 229,872 |
Merrill Lynch & Co., Inc., 6.11%, 1/29/2037 | | A2 | | | 230,000 | | | 203,134 |
| | | | | | | | |
| | | | | | | | 1,482,593 |
| | | | | | | | |
Commercial Banks - 5.2% | | | | | | | | |
Commonwealth Bank of Australia3, 4/30/2010 (Australia) (Note 7) | | Aa1 | | | 400,000 | | | 415,520 |
Manufacturers & Traders Trust Co., 6.625%, 12/4/2017 | | A2 | | | 495,000 | | | 494,862 |
PNC Bank National Association, 5.25%, 1/15/2017 | | A1 | | | 510,000 | | | 484,284 |
U.S. Bank National Association, 6.375%, 8/1/2011 | | Aa2 | | | 625,000 | | | 655,491 |
Wachovia Corp., 5.25%, 8/1/2014 | | A1 | | | 590,000 | | | 576,864 |
| | | | | | | | |
| | | | | | | | 2,627,021 |
| | | | | | | | |
Consumer Finance - 0.8% | | | | | | | | |
Toyota Motor Credit Corp., 10.00%, 5/4/2022 | | Aaa | | | 400,000 | | | 384,000 |
| | | | | | | | |
Diversified Financial Services - 0.8% | | | | | | | | |
Bank of America Corp. Capital Trust VI, 5.625%, 3/8/2035 | | Aa2 | | | 455,000 | | | 388,605 |
| | | | | | | | |
Insurance - 2.5% | | | | | | | | |
Ambac Financial Group, Inc., 5.95%, 12/5/2035 | | Aa2 | | | 820,000 | | | 640,046 |
American International Group, Inc., 4.25%, 5/15/2013 | | Aa2 | | | 660,000 | | | 627,838 |
| | | | | | | | |
| | | | | | | | 1,267,884 |
| | | | | | | | |
Total Financials | | | | | | | | 6,150,103 |
| | | | | | | | |
Health Care - 1.4% | | | | | | | | |
Pharmaceuticals - 1.4% | | | | | | | | |
Abbott Laboratories, 3.50%, 2/17/2009 | | A1 | | | 265,000 | | | 261,525 |
Wyeth, 6.50%, 2/1/2034 | | A3 | | | 420,000 | | | 445,756 |
| | | | | | | | |
Total Health Care | | | | | | | | 707,281 |
| | | | | | | | |
Industrials - 5.7% | | | | | | | | |
Aerospace & Defense - 0.7% | | | | | | | | |
Boeing Capital Corp., 6.50%, 2/15/2012 | | A2 | | | 310,000 | | | 332,803 |
| | | | | | | | |
Air Freight & Logistics - 0.4% | | | | | | | | |
FedEx Corp., 3.50%, 4/1/2009 | | Baa2 | | | 210,000 | | | 206,607 |
| | | | | | | | |
| | |
| The accompanying notes are an integral part of the financial statements. | | 7 |
Investment Portfolio - December 31, 2007
| | | | | | | | |
| | | Credit
Rating1
(unaudited) | | Principal
Amount | | Value
(Note 2) |
| | | | | | | | |
| | | |
CORPORATE BONDS (continued) | | | | | | | | |
| | | |
Non-Convertible Corporate Bonds (continued) | | | | | | | | |
Industrials (continued) | | | | | | | | |
Airlines - 0.9% | | | | | | | | |
Southwest Airlines Co., 5.25%, 10/1/2014 | | Baa1 | | $ | 475,000 | | $ | 462,924 |
| | | | | | | | |
Industrial Conglomerates - 1.3% | | | | | | | | |
General Electric Capital Corp., 6.75%, 3/15/2032 | | Aaa | | | 570,000 | | | 647,168 |
| | | | | | | | |
Machinery - 0.4% | | | | | | | | |
John Deere Capital Corp., 5.50%, 4/13/2017 | | A2 | | | 225,000 | | | 226,770 |
| | | | | | | | |
Road & Rail - 2.0% | | | | | | | | |
CSX Corp., 6.00%, 10/1/2036 | | Baa3 | | | 705,000 | | | 639,851 |
Union Pacific Corp., 5.65%, 5/1/2017 | | Baa2 | | | 340,000 | | | 335,614 |
| | | | | | | | |
| | | | | | | | 975,465 |
| | | | | | | | |
Total Industrials | | | | | | | | 2,851,737 |
| | | | | | | | |
Information Technology - 1.9% | | | | | | | | |
Communications Equipment - 1.9% | | | | | | | | |
Cisco Systems, Inc., 5.25%, 2/22/2011 | | A1 | | | 205,000 | | | 210,178 |
Cisco Systems, Inc., 5.50%, 2/22/2016 | | A1 | | | 250,000 | | | 254,242 |
Corning, Inc., 6.20%, 3/15/2016 | | Baa1 | | | 475,000 | | | 489,392 |
| | | | | | | | |
Total Information Technology | | | | | | | | 953,812 |
| | | | | | | | |
Materials - 0.5% | | | | | | | | |
Metals & Mining - 0.5% | | | | | | | | |
Alcoa, Inc., 5.87%, 2/23/2022 | | Baa1 | | | 250,000 | | | 241,600 |
| | | | | | | | |
Utilities - 3.9% | | | | | | | | |
Electric Utilities - 2.1% | | | | | | | | |
American Electric Power Co., Inc., 5.375%, 3/15/2010 | | Baa2 | | | 465,000 | | | 471,659 |
Exelon Generation Co. LLC, 5.35%, 1/15/2014 | | A3 | | | 580,000 | | | 564,453 |
| | | | | | | | |
| | | | | | | | 1,036,112 |
| | | | | | | | |
Multi-Utilities - 1.8% | | | | | | | | |
CenterPoint Energy Resources Corp., 7.875%, 4/1/2013 | | Baa3 | | | 335,000 | | | 367,826 |
Duke Energy Field Services LLC (now known as DCP Midstream LLC), 7.875%, 8/16/2010 | | Baa2 | | | 280,000 | | | 300,359 |
Sempra Energy, 7.95%, 3/1/2010 | | Baa1 | | | 210,000 | | | 224,376 |
| | | | | | | | |
| | | | | | | | 892,561 |
| | | | | | | | |
Total Utilities | | | | | | | | 1,928,673 |
| | | | | | | | |
Total Non-Convertible Corporate Bonds
(Identified Cost $16,752,969) | | | | | | | | 16,542,883 |
| | | | | | | | |
TOTAL CORPORATE BONDS
(Identified Cost $18,208,230) | | | | | | | | 17,952,564 |
| | | | | | | | |
| | |
| 8 | | The accompanying notes are an integral part of the financial statements. |
Investment Portfolio - December 31, 2007
| | | | | | | | | |
| | | Credit
Rating1
(unaudited) | | | Principal
Amount | | Value
(Note 2) |
| | | | | | | | | |
| | | |
MUNICIPAL BONDS - 1.2% | | | | | | | | | |
Canyon Independent School District, G.O. Bond, 4.50%, 2/15/2030 | | AAA | 2 | | $ | 100,000 | | $ | 98,072 |
Chapel Hill Independent School District, School Building, G.O. Bond, 4.50%, 8/15/2032 | | Aaa | | | | 100,000 | | | 97,666 |
Commerce Independent School District, School Building, G.O. Bond, 4.50%, 8/15/2037 | | Aaa | | | | 100,000 | | | 96,504 |
Harlandale Independent School District, School Building, G.O. Bond, 4.75%, 8/15/2036 | | Aaa | | | | 100,000 | | | 100,065 |
Katy Texas Independent School District, School Building, G.O. Bond, 4.50%, 2/15/2031 | | Aaa | | | | 100,000 | | | 97,773 |
Keller Independent School District, School Building, G.O. Bond, 4.75%, 8/15/2032 | | Aaa | | | | 100,000 | | | 100,532 |
| | | | | | | | | |
TOTAL MUNICIPAL BONDS
(Identified Cost $576,813) | | | | | | | | | 590,612 |
| | | | | | | | | |
| | | |
U.S. GOVERNMENT AGENCIES - 53.7% | | | | | | | | | |
Mortgage-Backed Securities - 50.6% | | | | | | | | | |
Fannie Mae, Pool #762352, 5.00%, 4/1/2019 | | | | | | 16,255 | | | 16,284 |
Fannie Mae, Pool #255274, 5.00%, 6/1/2019 | | | | | | 16,666 | | | 16,697 |
Fannie Mae, Pool #795855, 5.50%, 9/1/2019 | | | | | | 283,352 | | | 287,319 |
Fannie Mae, Pool #840165, 4.50%, 11/1/2020 | | | | | | 153,025 | | | 150,464 |
Fannie Mae, Pool #813938, 4.50%, 12/1/2020 | | | | | | 189,609 | | | 186,435 |
Fannie Mae, Pool #256114, 4.50%, 1/1/2021 | | | | | | 391,745 | | | 385,189 |
Fannie Mae, Pool #881624, 4.50%, 1/1/2021 | | | | | | 390,255 | | | 383,724 |
Fannie Mae, Pool #902047, 5.00%, 11/1/2021 | | | | | | 922,364 | | | 923,357 |
Fannie Mae, Pool #912409, 5.00%, 2/1/2022 | | | | | | 173,342 | | | 173,529 |
Fannie Mae, Pool #254375, 6.50%, 7/1/2022 | | | | | | 4,026 | | | 4,165 |
Fannie Mae, Pool #786281, 6.50%, 7/1/2034 | | | | | | 287,231 | | | 296,046 |
Fannie Mae, Pool #815409, 4.50%, 2/1/2035 | | | | | | 227,332 | | | 215,276 |
Fannie Mae, Pool #745147, 4.50%, 12/1/2035 | | | | | | 3,493,014 | | | 3,307,774 |
Fannie Mae, Pool #872535, 6.50%, 6/1/2036 | | | | | | 727,172 | | | 747,564 |
Fannie Mae, Pool #898299, 6.50%, 10/1/2036 | | | | | | 844,886 | | | 868,579 |
Fannie Mae, TBA4, 4.50%, 1/15/2038 | | | | | | 1,688,000 | | | 1,597,270 |
Fannie Mae, TBA4, 6.00%, 1/15/2038 | | | | | | 2,190,000 | | | 2,223,533 |
Federal Home Loan Mortgage Corp., Pool #M90974, 4.50%, 3/1/2010 | | | | | | 69,196 | | | 68,900 |
Federal Home Loan Mortgage Corp., Pool #B16835, 5.50%, 10/1/2019 | | | | | | 257,001 | | | 260,349 |
Federal Home Loan Mortgage Corp., Pool #G11896, 4.50%, 1/1/2021 | | | | | | 1,090,910 | | | 1,072,033 |
Federal Home Loan Mortgage Corp., Pool #G12419, 5.00%, 10/1/2021 | | | | | | 194,387 | | | 194,597 |
Federal Home Loan Mortgage Corp., Pool #G18168, 5.00%, 2/1/2022 | | | | | | 898,174 | | | 899,160 |
| | |
| The accompanying notes are an integral part of the financial statements. | | 9 |
Investment Portfolio - December 31, 2007
| | | | | | | | | |
| | | | | Principal
Amount/
Shares | | Value
(Note 2) | |
| | | | | | | | | |
| | | |
U.S. GOVERNMENT AGENCIES (continued) | | | | | | | | | |
Mortgage-Backed Securities (continued) | | | | | | | | | |
Federal Home Loan Mortgage Corp., Pool #G18182, 5.50%, 5/1/2022 | | | | $ | 749,868 | | $ | 758,894 | |
Federal Home Loan Mortgage Corp., Pool #A27705, 6.50%, 10/1/2034 | | | | | 96,982 | | | 99,955 | |
Federal Home Loan Mortgage Corp., Pool #G01782, 6.50%, 2/1/2035 | | | | | 69,422 | | | 71,681 | |
Federal Home Loan Mortgage Corp., Pool #A52716, 6.50%, 10/1/2036 | | | | | 1,604,118 | | | 1,649,224 | |
Federal Home Loan Mortgage Corp., TBA4, 4.50%, 1/15/2023 | | | | | 1,527,000 | | | 1,501,710 | |
Federal Home Loan Mortgage Corp., TBA4, 5.00%, 1/15/2023 | | | | | 1,749,000 | | | 1,750,640 | |
Federal Home Loan Mortgage Corp., TBA4, 5.50%, 1/15/2023 | | | | | 985,000 | | | 996,697 | |
Federal Home Loan Mortgage Corp., TBA4, 5.00%, 1/15/2038 | | | | | 3,025,000 | | | 2,951,266 | |
Federal Home Loan Mortgage Corp., TBA4, 5.50%, 1/15/2038 | | | | | 989,000 | | | 986,836 | |
GNMA, Pool #487193, 5.00%, 4/15/2020 | | | | | 86,450 | | | 86,671 | |
GNMA, Pool #563559, 6.50%, 4/15/2032 | | | | | 51,202 | | | 53,085 | |
GNMA, Pool #631703, 6.50%, 9/15/2034 | | | | | 76,424 | | | 79,117 | |
| | | | | | | | | |
Total Mortgage-Backed Securities
(Identified Cost $25,072,693) | | | | | | | | 25,264,020 | |
| | | | | | | | | |
| | | |
Other Agencies - 3.1% | | | | | | | | | |
Federal Home Loan Mortgage Corp., 6.25%, 7/15/2032
(Identified Cost $1,405,919) | | | | | 1,275,000 | | | 1,519,140 | |
| | | | | | | | | |
TOTAL U.S. GOVERNMENT AGENCIES
(Identified Cost $26,478,612) | | | | | | | | 26,783,160 | |
| | | | | | | | | |
| | | |
SHORT-TERM INVESTMENTS - 32.4% | | | | | | | | | |
Dreyfus Treasury Cash Management - Institutional Shares | | | | | 1,224,474 | | | 1,224,474 | |
Fannie Mae Discount Note, 1/14/2008 | | | | $ | 8,500,000 | | | 8,486,050 | |
Fannie Mae Discount Note, 1/31/2008 | | | | | 4,500,000 | | | 4,483,376 | |
Federal Home Loan Bank Discount Note, 1/18/2008 | | | | | 2,000,000 | | | 1,995,680 | |
| | | | | | | | | |
TOTAL SHORT-TERM INVESTMENTS
(Identified Cost $16,191,353) | | | | | | | | 16,189,580 | |
| | | | | | | | | |
TOTAL INVESTMENTS - 123.3%
(Identified Cost $61,455,008) | | | | | | | | 61,515,916 | |
| | | |
LIABILITIES, LESS OTHER ASSETS - (23.3%) | | | | | | | | (11,607,165 | ) |
| | | | | | | | | |
NET ASSETS - 100% | | | | | | | $ | 49,908,751 | |
| | | | | | | | | |
| | |
| 10 | | The accompanying notes are an integral part of the financial statements. |
Investment Portfolio - December 31, 2007
Key:
G.O. Bond - General Obligation Bond
TBA - to be announced
1Credit ratings from Moody’s (unaudited).
2Credit ratings from S&P (unaudited).
3Restricted securities - Investment in securities that are restricted as to public resale under the Securities Act of 1933, as amended. This security was aquired on April 13, 2007 at a cost of $400,000 ($100.00 per share) and has been determined to be illiquid under guidelines established by the Board of Directors. This security amounts to $415,520, or 0.8%, of the Series’ net assets as of December 31, 2007 (see Note 2 to the financial statements).
4Securities purchased on a forward commitment or when-issued basis (see Note 2 to the financial statements).
5The coupon rate is a floating rate and is subject to change quarterly. The coupon rate stated is the rate as of December 31, 2007.
| | |
| The accompanying notes are an integral part of the financial statements. | | 11 |
Statement of Assets and Liabilities
December 31, 2007
| | | |
ASSETS: | | | |
| | | |
| |
Investments, at value (identified cost, $61,455,008) (Note 2) | | $ | 61,515,916 |
Interest receivable | | | 407,714 |
Dividends receivable | | | 3,183 |
| | | |
TOTAL ASSETS | | | 61,926,813 |
| | | |
| LIABILITIES: | | | |
| |
Accrued management fees (Note 3) | | | 19,895 |
Accrued fund accounting and transfer agent fees (Note 3) | | | 3,016 |
Accrued Chief Compliance Officer service fees (Note 3) | | | 721 |
Payable for purchases of delayed delivery securities (Note 2) | | | 11,953,282 |
Audit fees payable | | | 29,477 |
Payable for fund shares repurchased | | | 6,773 |
Other payables and accrued expenses | | | 4,898 |
| | | |
TOTAL LIABILITIES | | | 12,018,062 |
| | | |
TOTAL NET ASSETS | | $ | 49,908,751 |
| | | |
NET ASSETS CONSIST OF: | | | |
| |
Capital stock | | $ | 49,659 |
Additional paid-in-capital | | | 49,487,703 |
Undistributed net investment income | | | 4,622 |
Accumulated net realized gain on investments | | | 305,859 |
Net unrealized appreciation on investments | | | 60,908 |
| | | |
TOTAL NET ASSETS | | $ | 49,908,751 |
| | | |
NET ASSET VALUE, OFFERING PRICE AND REDEMPTION PRICE PER SHARE ($49,908,751/4,965,938 shares) | | $ | 10.05 |
| | | |
| | |
| 12 | | The accompanying notes are an integral part of the financial statements. |
Statement of Operations
For the Year Ended December 31, 2007
| | | | |
INVESTMENT INCOME: | | | | |
| | | | |
| | | | |
| |
Interest | | $ | 2,282,645 | |
Dividends | | | 67,912 | |
| | | | |
Total Investment Income | | | 2,350,557 | |
| | | | |
| EXPENSES: | | | | |
| |
Management fees (Note 3) | | | 281,238 | |
Fund accounting and transfer agent fees (Note 3) | | | 34,595 | |
Directors’ fees (Note 3) | | | 7,844 | |
Chief Compliance Officer service fees (Note 3) | | | 6,100 | |
Audit fees | | | 29,499 | |
Custodian fees | | | 6,299 | |
Miscellaneous | | | 28,289 | |
| | | | |
Total Expenses | | | 393,864 | |
Less reduction of expenses (Note 3) | | | (18,694 | ) |
| | | | |
Net Expenses | | | 375,170 | |
| | | | |
NET INVESTMENT INCOME | | | 1,975,387 | |
| | | | |
| REALIZED AND UNREALIZED GAIN ON INVESTMENTS: | | | | |
| |
Net realized gain on investments | | | 580,680 | |
Net change in unrealized appreciation (depreciation) on investments | | | 87,790 | |
| | | | |
| |
NET REALIZED AND UNREALIZED GAIN ON
INVESTMENTS | | | 668,470 | |
| | | | |
NET INCREASE IN NET ASSETS RESULTING FROM OPERATIONS | | $ | 2,643,857 | |
| | | | |
| | |
| The accompanying notes are an integral part of the financial statements. | | 13 |
Statements of Changes in Net Assets
| | | | | | | | |
| | | For the
Year Ended
12/31/07 | | | For the
Year Ended
12/31/06 | |
| | | | | | | | |
| INCREASE (DECREASE) IN NET ASSETS: | | | | | | | | |
| | |
| OPERATIONS: | | | | | | | | |
| | |
Net investment income | | $ | 1,975,387 | | | $ | 1,329,985 | |
Net realized gain on investments | | | 580,680 | | | | 225,664 | |
Net change in unrealized appreciation (depreciation) on investments | | | 87,790 | | | | 123,352 | |
| | | | | | | | |
Net increase from operations | | | 2,643,857 | | | | 1,679,001 | |
| | | | | | | | |
DISTRIBUTIONS TO SHAREHOLDERS (Note 8): | | | | | | | | |
| | |
From net investment income | | | (1,978,671 | ) | | | (1,327,178 | ) |
From net realized gain on investments | | | (300,431 | ) | | | — | |
| | | | | | | | |
Total distributions to shareholders | | | (2,279,102 | ) | | | (1,327,178 | ) |
| | | | | | | | |
CAPITAL STOCK ISSUED AND REPURCHASED: | | | | | | | | |
| | |
Net increase from capital share transactions
(Note 5) | | | 3,847,920 | | | | 16,766,575 | |
| | | | | | | | |
Net increase in net assets | | | 4,212,675 | | | | 17,118,398 | |
| | |
| NET ASSETS: | | | | | | | | |
| | |
Beginning of year | | | 45,696,076 | | | | 28,577,678 | |
| | | | | | | | |
End of year (including undistributed net investment income of $4,622 and $7,906, respectively) | | $ | 49,908,751 | | | $ | 45,696,076 | |
| | | | | | | | |
| | |
| 14 | | The accompanying notes are an integral part of the financial statements. |
Financial Highlights
| | | | | | |
| | | For the
Year Ended
12/31/07 | | For the
Year Ended
12/31/06 | | For the
Period 4/21/051
to 12/31/05 |
| | | | | | |
| | | | | | |
| Per share data (for a share outstanding throughout each period): | | | | | | |
Net asset value - Beginning of period | | $9.98 | | $9.89 | | $10.00 |
| | | | | | |
Income (loss) from investment operations: | | | | | | |
Net investment income | | 0.42 | | 0.36 | | 0.21 |
Net realized and unrealized gain (loss) on investments | | 0.13 | | 0.09 | | (0.11) |
| | | | | | |
Total from investment operations | | 0.55 | | 0.45 | | 0.10 |
| | | | | | |
Less distributions to shareholders: | | | | | | |
From net investment income | | (0.42) | | (0.36) | | (0.21) |
From net realized gain on investments | | (0.06) | | — | | — |
| | | | | | |
Total distributions to shareholders | | (0.48) | | (0.36) | | (0.21) |
| | | | | | |
Net asset value - End of period | | $10.05 | | $9.98 | | $9.89 |
| | | | | | |
Total return2 | | 5.58% | | 4.51% | | 0.98% |
| Ratios (to average net assets)/Supplemental Data: | | | | | | |
Expenses* | | 0.80% | | 0.80% | | 0.80%3 |
Net investment income | | 4.21% | | 3.87% | | 3.08%3 |
Portfolio turnover | | 346% | | 313% | | 293% |
Net assets - End of period (000’s omitted) | | $49,909 | | $45,696 | | $28,578 |
| | | | | | |
|
*The investment advisor did not impose all of its management fee. If these expenses had been incurred by the Series, the expense ratio (to average net assets) would have been increased as follows: |
| | 0.04% | | 0.08% | | 0.20%3 |
1Commencement of operations.
2Represents aggregate total return for the period indicated, and assumes reinvestment of all distributions. Total return would have been lower had certain expenses not been waived during the period. Periods less than one year are not annualized.
3Annualized.
| | |
| The accompanying notes are an integral part of the financial statements. | | 15 |
Notes to Financial Statements
Core Bond Series (the “Series”) is a no-load non-diversified series of Manning & Napier Fund, Inc. (the “Fund”). The Fund is organized in Maryland and is registered under the Investment Company Act of 1940, as amended, as an open-end management investment company.
The Series’ investment objective is to provide long-term total return by investing primarily in investment grade bonds and other financial instruments, including derivatives, with economic characteristics similar to bonds.
The Fund’s Advisor is Manning & Napier Advisors, Inc. (the “Advisor”). Shares of the Series are offered to investors, clients and employees of the Advisor and its affiliates. The total authorized capital stock of the Fund consists of 5.0 billion shares of common stock each having a par value of $0.01. As of December 31, 2007, 3.33 billion shares have been designated in total among 27 series, of which 125 million have been designated as Core Bond Series Class A common stock.
| 2. | SIGNIFICANT ACCOUNTING POLICIES |
Security Valuation
Debt securities, including government bonds, sovereign bonds, corporate bonds and mortgage-backed securities, will normally be valued on the basis of evaluated bid prices provided by an independent pricing service. Certain investments in securities held by the Series were valued on a basis of a price provided by a principal market maker. These prices may differ from the value that would have been used had a broader market for securities existed.
Municipal securities will normally be valued on the basis of market valuations provided by an independent pricing service that utilizes the latest price quotations and a matrix system (which considers such factors as security prices of similar securities, yields, maturities and ratings).
Securities for which representative valuations or prices are not available from the Fund’s pricing service may be valued at fair value. Due to the inherent uncertainty of valuations of such securities, the fair value may differ significantly from the values that would have been used had a ready market for such securities existed. If trading or events occurring after the close of the principal market in which securities are traded are expected to materially affect the value of those securities, then they may be valued at their fair value, taking this trading or these events into account. Fair value is determined in good faith by the Advisor under procedures approved by and under the general supervision and responsibility of the Fund’s Board of Directors (the “Board”).
Short-term investments that mature in sixty days or less are valued at amortized cost, which approximates market value. Investments in open-end investment companies are valued at their net asset value per share on valuation date.
Security Transactions, Investment Income and Expenses
Security transactions are accounted for on trade date. Interest income, including amortization of premium and accretion of discounts using the effective interest method, is earned from settlement date and accrued daily. Dividend income is recorded on an accrual basis on ex-dividend date.
Expenses are recorded on an accrual basis. Most expenses of the Fund can be attributed to a specific series. Expenses which cannot be directly attributed are apportioned among the series in the Fund in such a manner as deemed equitable by the Fund’s Board, taking into consideration, among other things, the nature and type of expense.
Notes to Financial Statements
| 2. | SIGNIFICANT ACCOUNTING POLICIES (continued) |
Security Transactions, Investment Income and Expenses (continued)
The Series uses the identified cost method for determining realized gain or loss on investments for both financial statement and federal income tax reporting purposes.
Securities Purchased on a When-Issued Basis or Forward Commitment
The Series may purchase securities on a when-issued basis or forward commitment. These transactions involve a commitment by the Series to purchase securities for a predetermined price with payment and delivery taking place beyond the customary settlement period. When such purchases are outstanding, the Series will designate liquid assets in an amount sufficient to meet the purchase price. When purchasing a security on a delayed delivery basis, the Series assumes the rights and risks of ownership of the security, including the risk of price and yield fluctuations, and takes such fluctuations into account when determining its net asset value. The Series may sell the when-issued securities before they are delivered, which may result in a capital gain or loss.
In connection with its ability to purchase or sell securities on a forward commitment basis, the Series may enter into forward roll transactions principally using To Be Announced (TBA) securities. Forward roll transactions require the sale of securities for delivery in the current month, and a simultaneous agreement to repurchase substantially similar (same type, coupon and maturity) securities on a specified future date. Risks of entering into forward roll transactions include the potential inability of the counterparty to meet the terms of the agreement; the potential of the Series to receive inferior securities at redelivery as compared to the securities sold to the counterparty; counterparty credit risk; and the potential pay down speed variance between the mortgage-backed pools. During the roll period, the Series forgoes principal and interest paid on the securities. The Series accounts for such dollar rolls as purchases and sales. The Series had TBA dollar rolls outstanding as of December 31, 2007, which are included in Payable for Purchases of Delayed Delivery Securities on the Statement of Assets and Liabilities.
Restricted Securities
Restricted securities are purchased in private placement transactions, are not registered under the Securities Act of 1933, as amended, and may have contractual restrictions on resale. Information regarding restricted securities is included at the end of the Series’ Investment Portfolio.
Illiquid Securities
A security may be considered illiquid if so deemed in good faith by the Advisor under procedures approved by and under the general supervision and responsibility of the Fund’s Board. Securities that are illiquid are marked with the applicable footnote on the Investment Portfolio.
Federal Taxes
The Series’ policy is to comply with the provisions of the Internal Revenue Code applicable to regulated investment companies. The Series is not subject to federal income tax or excise tax to the extent that the Series distributes to shareholders each year its taxable income, including any net realized gains on investments, in accordance with requirements of the Internal Revenue Code. Accordingly, no provision for federal income tax or excise tax has been made in the financial statements.
On June 29, 2007, the Series adopted Financial Accounting Standards Board Interpretation No. 48 - Accounting for Uncertainty in Income Taxes (“FIN 48”). FIN 48 prescribes the minimum recognition threshold a tax position must meet in connection with accounting for
Notes to Financial Statements
| 2. | SIGNIFICANT ACCOUNTING POLICIES (continued) |
Federal Taxes (continued)
uncertainties in income tax positions taken or expected to be taken by an entity before being measured and recognized in the financial statements. Management has determined that FIN 48 did not have a material impact on the Series’ financial statements. The Series files income tax returns in the U.S. federal jurisdiction, various states and foreign jurisdictions, as required. No income tax returns are currently under investigation. The statute of limitations on the Series’ tax returns remains open for the years ended December 31, 2005 through December 31, 2007.
Additionally, based on the Fund’s understanding of the tax rules and rates related to income, gains and transactions for foreign jurisdictions in which it invests, the Series will provide for foreign taxes, and where appropriate, deferred foreign tax.
Distributions of Income and Gains
Distributions to shareholders of net investment income and net realized gains are made annually. An additional distribution may be necessary to avoid taxation of the Series. Distributions are recorded on the ex-dividend date.
Indemnifications
The Fund’s organizational documents provide former and current directors and officers with a limited indemnification against liabilities arising in connection with the performance of their duties to the Fund. In the normal course of business, the Fund may also enter into contracts that provide general indemnifications. The Fund’s maximum exposure under these arrangements is unknown as this would be dependent on future claims that may be made against the Fund. The risk of material loss from such claims is considered remote.
Other
The preparation of financial statements in conformity with accounting principles generally accepted in the United States of America requires management to make estimates and assumptions that affect the reported amounts of assets and liabilities and the disclosure of contingent assets and liabilities at the date of the financial statements and the reported amounts of income and expenses during the reporting period. Actual results could differ from those estimates.
| 3. | TRANSACTIONS WITH AFFILIATES |
The Fund has an Investment Advisory Agreement (the “Agreement”) with the Advisor, for which the Series pays a fee, computed daily and payable monthly, at an annual rate of 0.60% of the Series’ average daily net assets.
Under the Agreement, personnel of the Advisor provide the Series with advice and assistance in the choice of investments and the execution of securities transactions, and otherwise maintain the Series’ organization. The Advisor also provides the Fund with necessary office space and fund administration and support services. The salaries of all officers of the Fund (except a percentage of the Fund’s Chief Compliance Officer’s salary, which is paid by the Fund), and of all Directors who are “affiliated persons” of the Fund, or of the Advisor, and all personnel of the Fund, or of the Advisor, performing services relating to research, statistical and investment activities, are paid by the Advisor. Each “non-affiliated” Director receives an annual stipend, which is allocated among all the active series of the Fund. In addition, these Directors also receive a fee per Board meeting attended for each active series of the Fund plus a fee for each committee meeting attended.
Notes to Financial Statements
| 3. | TRANSACTIONS WITH AFFILIATES (continued) |
The Advisor has contractually agreed, until at least April 30, 2009, to waive its fee and, if necessary, pay other operating expenses of the Series in order to maintain total direct annual fund operating expenses for the Series at no more than 0.80% of average daily net assets each year. Accordingly, the Advisor waived fees of $18,694 for the year ended December 31, 2007, which is reflected as a reduction of expenses on the Statement of Operations. The Advisor is not eligible to recoup any expenses that have been waived or reimbursed in prior years.
Manning & Napier Investor Services, Inc., a registered broker-dealer affiliate of the Advisor, acts as distributor for the Fund’s shares. The services of Manning & Napier Investor Services, Inc. are provided at no additional cost to the Series.
For fund accounting and transfer agent services, the Fund pays the Advisor an annual fee of 0.11% of the Fund’s average daily net assets up to $900 million, 0.07% of the Fund’s average daily net assets between $900 million and $1.5 billion, and 0.04% of the Fund’s average daily net assets over $1.5 billion. Additionally, certain transaction and account-based fees and out-of-pocket expenses, including charges for reporting relating to the Fund’s compliance program, are charged. Expenses not directly attributable to a series are allocated based on each series’ relative net assets or number of accounts, depending on the expense. The Advisor has an agreement with Citi Fund Services Ohio, Inc. (“Citi”) (formerly BISYS Fund Services Ohio, Inc.) under which Citi serves as sub-accountant and sub-transfer agent.
| 4. | PURCHASES AND SALES OF SECURITIES |
For the year ended December 31, 2007, purchases and sales of securities, other than United States Government securities and short-term securities, were $9,674,855 and $4,872,989, respectively. Purchases and sales of United States Government securities, other than short-term securities, were $146,888,741 and $141,153,698, respectively.
| 5. | CAPITAL STOCK TRANSACTIONS |
Transactions in shares of Core Bond Series were:
| | | | | | | | | | | | | |
| | | For the Year
Ended 12/31/07 | | | For the Year
Ended 12/31/06 | |
| | | Shares | | | Amount | | | Shares | | | Amount | |
Sold | | 587,661 | | | $ 5,932,540 | | | 1,637,576 | | | $ | 16,250,398 | |
Reinvested | | 225,784 | | | 2,243,435 | | | 130,284 | | | | 1,304,357 | |
Repurchased | | (426,400 | ) | | (4,328,055 | ) | | (79,452 | ) | | | (788,180 | ) |
| | | | | | | | | | | | | |
Total | | 387,045 | | | $ 3,847,920 | | | 1,688,408 | | | $ | 16,766,575 | |
| | | | | | | | | | | | | |
Substantially all of the Series’ shares represent investments by fiduciary accounts over which the Advisor has sole investment discretion.
The Series may trade in financial instruments with off-balance sheet risk in the normal course of its investing activities to assist in managing exposure to various market risks. These financial instruments include written options, forward foreign currency exchange contracts and futures contracts and may involve, to a varying degree, elements of risk in excess of the amounts recognized for financial statement purposes. No such investments were held by the Series on December 31, 2007.
Notes to Financial Statements
Investing in securities of foreign companies and foreign governments involves special risks and considerations not typically associated with investing in securities of domestic companies and the United States Government. These risks include revaluation of currencies and future adverse political and economic developments. Moreover, securities of foreign companies and foreign governments and their markets may be less liquid and their prices more volatile than those of comparable domestic companies and the United States Government.
| 8. | FEDERAL INCOME TAX INFORMATION |
The amount and characterization of certain income and capital gains to be distributed are determined in accordance with federal income tax regulations, which may differ from accounting principles generally accepted in the United States of America. These differences are primarily due to differing book and tax treatments in the timing of the recognition of net investment income or gains and losses, including Post-October losses. The Series may periodically make reclassifications among its capital accounts to reflect income and gains available for distribution (or available capital loss carryovers) under income tax regulations, without impacting the Series’ net asset value. Any such reclassifications are not reflected in the financial highlights.
The tax character of distributions paid were as follows:
| | | | | | |
| | | For the Year
Ended 12/31/07 | | For the Year
Ended 12/31/06 |
Ordinary income | | $ | 2,029,563 | | $ | 1,327,178 |
Long-term capital gains | | | 249,539 | | | — |
At December 31, 2007, the tax basis components of distributable earnings and the net unrealized appreciation based on identified cost for federal income tax purposes were as follows:
| | | | |
Cost for federal income tax purposes | | $ | 61,455,008 | |
| |
Unrealized appreciation | | $ | 476,360 | |
Unrealized depreciation | | | (415,452 | ) |
| | | | |
Net unrealized appreciation | | $ | 60,908 | |
Undistributed ordinary income | | | 161,029 | |
Undistributed long-term capital gains | | | 149,452 | |
| 9. | RECENT ACCOUNTING PRONOUNCEMENTS |
In September 2006, FASB Statement of Financial Accounting Standards No. 157, Fair Value Measurements (“FAS 157”) was issued, and is effective for fiscal years beginning after November 15, 2007. FAS 157 defines fair value, establishes a framework for measuring fair value, and expands disclosure about fair value measurements. The standard does not expand the use of fair value in any new circumstances, but provides clarification on acceptable fair value methods and applications. At this time, management is evaluating the implications of FAS 157, but it is not expected to materially impact the Series’ financial statements.
Report of Independent Registered Public Accounting Firm
To the Board of Directors of Manning & Napier Fund, Inc. and Shareholders of Core Bond Series:
In our opinion, the accompanying statement of assets and liabilities, including the investment portfolio, and the related statements of operations and of changes in net assets and the financial highlights present fairly, in all material respects, the financial position of the Core Bond Series (a series of Manning & Napier Fund, Inc., hereafter referred to as the “Series”) at December 31, 2007, and the results of its operations for the year then ended, the changes in its net assets for each of the two years in the period then ended and the financial highlights for each of the periods indicated, in conformity with accounting principles generally accepted in the United States of America. These financial statements and financial highlights (hereafter referred to as “financial statements”) are the responsibility of the Series’ management; our responsibility is to express an opinion on these financial statements based on our audits. We conducted our audits of these financial statements in accordance with the standards of the Public Company Accounting Oversight Board (United States). Those standards require that we plan and perform the audit to obtain reasonable assurance about whether the financial statements are free of material misstatement. An audit includes examining, on a test basis, evidence supporting the amounts and disclosures in the financial statements, assessing the accounting principles used and significant estimates made by management, and evaluating the overall financial statement presentation. We believe that our audits, which included confirmation of securities at December 31, 2007 by correspondence with the custodian and brokers, provide a reasonable basis for our opinion.

Columbus, Ohio
February 20, 2008
Supplemental Tax Information (unaudited)
Pursuant to Section 852 of the Internal Revenue Code, as amended, the Series hereby designates $249,539 as capital gains for its taxable year ended December 31, 2007.
Renewal of Investment Advisory Agreements (unaudited)
During the period covered by this shareholder report, the Board of Directors (the “Board”) of Manning & Napier Fund, Inc. (the “Fund”) considered approval of two separate investment advisory agreements with Manning & Napier Advisors, Inc. (the “Advisor”):
| | • | | At a meeting held on August 30, 2007, the Board approved a new investment advisory agreement between the Fund and the Advisor (the “New Investment Advisory Agreement”) and recommended that the New Investment Advisory Agreement be submitted to shareholders for approval. Shareholders approved the New Investment Advisory Agreement at a meeting held on December 17, 2007. |
| | • | | At a meeting held on November 12, 2007, the Board approved the continuation of the then-current investment advisory agreement between the Fund and the Advisor (the “Current Investment Advisory Agreement”), which was to be superseded by the New Investment Advisory Agreement upon its approval by the Fund’s shareholders. The continuation of the Current Investment Advisory Agreement was necessary as a result of the delay in obtaining the number of votes necessary to convene the shareholder meeting and approve the New Investment Advisory Agreement with respect to all investment portfolios of the Fund (the “Series”). |
Consideration of New Investment Advisory Agreement:
In response to recent regulatory and compliance initiatives promulgated by the SEC over the past year, the Fund engaged in a comprehensive review of all material aspects of the Fund’s operations, including the Fund’s Current Investment Advisory Agreement. As a result of its review, the Board determined that the Current Investment Advisory Agreement should be amended for the purpose of modernizing the form of the agreement and to include additional provisions in the agreement that are customarily included in investment advisory agreements between registered investment companies and their investment advisors, but which are not included in the Current Investment Advisory Agreement. Accordingly, at the Board meeting on November 16, 2006, representatives of the Advisor presented to the Board proposed changes to the Current Investment Advisory Agreement in order to address the Board’s request to update and modernize the Current Investment Advisory Agreement. As a result of the discussions between the Board and representatives of the Advisor at the November 2006 Board meeting, the Board determined to formally consider the approval of a new investment advisory agreement between the Fund and the Advisor, which would incorporate the changes proposed at the November 2006 Board meeting, at its in-person Board meeting in August 2007.
At an in-person meeting held on August 30, 2007, the Board considered the approval of the New Investment Advisory Agreement between the Fund and the Advisor. Based on the information it received at the meeting and the November 16, 2006 Board meeting, the Board approved the New Investment Advisory Agreement subject to its further approval by the Fund’s shareholders. Representatives of the Advisor attended the meeting and presented additional oral and written information to the Board to assist the Board in its considerations. At the meeting, the Board concluded it was reasonable to take into account the conclusions the Board made when considering and evaluating the renewal of the Current Investment Advisory Agreement (the “2006 Annual Review”), which occurred at the November 16, 2006 in-person Board meeting, as part of its considerations to approve the New Investment Advisory Agreement. The discussion immediately below outlines the materials and information presented to the Board in connection with the Board’s 2006 Annual Review of the Current Investment Advisory Agreement and the conclusions made by the Directors when determining to continue the Current Investment Advisory Agreement for an additional one-year period.
Renewal of Investment Advisory Agreements (unaudited)
In connection with its review and deliberations, the Board considered the following factors and reached a conclusion with respect to such factors.
| | • | | The Board considered the services provided by the Advisor under the Current Investment Advisory Agreement including, among others: deciding what securities to purchase and sell for each Series; arranging for the purchase and sale of such securities by placing orders with broker-dealers; administering the affairs of the Fund (including the books and records of the Fund not maintained by third party service providers such as the custodian or sub-transfer agent); arranging for the insurance coverage for the Fund; and supervising the preparation of tax returns, SEC filings (including registration statements) and reports to shareholders for the Fund. The Board also considered the nature and quality of such services provided under the Current Investment Advisory Agreement in light of the Advisor’s services provided to the Fund for 21 years. The Board discussed the quality of these services with representatives from the Advisor and concluded that the Advisor was performing its services to the Fund required under the Current Investment Advisory Agreement in a reasonable manner. |
| | • | | The Board considered the investment performance of the various Series of the Fund. The investment performance for each Series was reviewed on a cumulative basis since inception and on a one year basis. In addition, annualized performance for the following time periods was considered: inception, three year, five year, ten year, and current market cycle. A market cycle includes periods of both rising and falling markets. Returns for established benchmark indices for each Series were provided for each time period. The Board noted that all the Series were competitive against their respective benchmark indices over all time periods noted above through September 30, 2006. In addition, the Board considered at the meeting (and considers on a quarterly basis) a peer group performance analysis consisting of Morningstar universes of mutual funds with similar investment objectives. The Board discussed the performance with representatives from the Advisor and concluded that the investment performance of each of the Fund’s Series was reasonable based on the Fund’s actual performance and comparative performance, especially performance over the current market cycle. |
| | • | | The Board considered the costs of the Advisor’s services and the profits of the Advisor as they relate to the Advisor’s services to the Fund under the Current Investment Advisory Agreement. In reviewing the Advisor’s costs and profits, the Board discussed the Advisor’s revenues generated from the Fund (on both an actual and adjusted basis) and its expenses associated with providing the services under the Current Investment Advisory Agreement. In addition, the Board reviewed the Advisor’s expenses associated with Fund activities outside of the Current Investment Advisory Agreement (such as expense reimbursements pursuant to expense caps and payments made by the Advisor to third party platforms on which shares of the Fund are available for purchase). It was noted by representatives of the Advisor that 6 of the 18 active Series of the Fund are currently experiencing expenses above the capped expense ratios. After discussing the above costs and profits, the Board concluded that the Advisor’s profitability relating to its services provided under the Current Investment Advisory Agreement was reasonable. |
| | • | | The Board considered the fees and expenses of the various Series of the Fund. The Advisor presented the advisory fees and total expenses for each Series, including the |
Renewal of Investment Advisory Agreements (unaudited)
| | advisory fee adjusted for any expense waivers or reimbursements (either contractual or voluntary) paid by the Advisor. The advisory fees and expense ratios of each Series were compared to an average (on both a mean and median basis) of similar funds as disclosed on the Morningstar database. Representatives of the Advisor discussed with the Board the levels of its advisory fee for each Series of the Fund and as compared to the median and mean advisory fees for similar funds as listed on Morningstar. Expense ratios for every Series, except the High Yield Bond Series, are currently below the median and mean for similar funds as listed on Morningstar. Based on their review of the information provided, the Board concluded that the fees and expenses of each Series of the Fund were reasonable on a comparative basis. |
| | • | | The Board also considered the other benefits the Advisor derives from its relationship with the Fund. Such other benefits include certain research products provided by soft dollars. Given the level of soft dollar transactions involving the Fund, the Board concluded that these additional benefits to the Advisor were reasonable. |
| | • | | In addition to the factors described above, the Board considered the Advisor’s personnel, investment strategies, policies and procedures relating to compliance with personal securities transactions, and reputation, expertise and resources in domestic and foreign financial markets. The Board concluded that these factors support the conclusion that the Advisor performs its services in a reasonable manner. |
| | • | | The Board did not consider economies of scale at this time because of the multiple uses of the Fund (for the Advisor’s discretionary investment account clients in addition to direct investors), the current profitability of the Advisor’s services to the Fund under the Current Investment Advisory Agreement, and the overall size of the Fund complex. |
Based on the Board’s deliberations and their evaluation of the information described above, the Board, including a majority of Directors that are “not interested” as defined in the Investment Company Act of 1940 (the “1940 Act”), concluded that the compensation under the Current Investment Advisory Agreement was fair and reasonable in light of the services and expenses and such other matters as the Directors considered to be relevant in the exercise of their reasonable judgment. Accordingly, the Board approved the renewal of the Current Investment Advisory Agreement for another year. In the course of their deliberations, the Directors did not identify any particular information that was all important or controlling.
As stated above, at the August 30, 2007 Board meeting, the Board concluded it was reasonable to take into account the conclusions set forth above when determining whether to approve the New Investment Advisory Agreement. The Board’s conclusion in this regard was based on the fact that the New Investment Advisory Agreement is identical to the Current Investment Advisory Agreement except for certain provisions of the Agreement which have been updated and modernized in response to the Board’s specific request. Further, the Board’s conclusion in this regard was based on the fact that the New Investment Advisory Agreement does not change either the investment advisory fees payable by the Fund to the Advisor or the day-to-day investment management services the Advisor provides to the Fund.
In addition to the conclusions formed with respect to the 2006 Annual Review, the Directors considered specific information at the August 30, 2007 Board meeting concerning the additional provisions included in the New Investment Advisory Agreement. The Directors considered the fact that these additional provisions are designed to (i) address and memorialize certain standard practices and regulatory requirements of mutual funds and their investment advisors; (ii) further
Renewal of Investment Advisory Agreements (unaudited)
delineate the duties and obligations of the Fund and the Advisor; (iii) modernize the agreement to reflect current industry practice and applicable law; and (iv) generally improve the overall quality of the agreement. The Board further considered the fact that the New Investment Advisory Agreement does not alter the actual day-to-day investment management services provided by the Advisor to each Series of the Fund, and the investment advisory fee rate paid to the Advisor under the New Investment Advisory Agreement for a Series is the same as the fee rate paid by the Series under the Current Investment Advisory Agreement.
Based on its evaluation of the information and the conclusions with respect thereto at its meetings on November 16, 2006 and August 30, 2007, the Board unanimously concluded that: (a) the terms of the New Investment Advisory Agreement were fair and reasonable; (b) the approval of the New Investment Advisory Agreement would be in the best interests of the shareholders and the Fund; and (c) it would recommend the approval of the New Investment Advisory Agreement to shareholders. In the course of their deliberations, the Board did not identify any particular information or factor that was all-important or controlling.
Consideration of Current Investment Advisory Agreement
At a meeting held on November 12, 2007, the Board considered the continuation of the Current Investment Advisory Agreement and simultaneously conducted its annual review of the services provided to the Fund by the Adviser (the “2007 Annual Review”). Representatives of the Advisor attended the meeting and presented additional oral and written information to the Board to assist the Board in its considerations. The discussion immediately below outlines the materials and information presented to the Board in connection with the Board’s 2007 Annual Review of the Current Investment Advisory Agreement and the conclusions made by the Directors when determining to continue the Current Investment Advisory Agreement.
In connection with its review and deliberations, the Board considered the following factors and reached a conclusion with respect to such factors.
| | • | | The Board considered the services provided by the Advisor under the Current Investment Advisory Agreement including, among others: deciding what securities to purchase and sell for each Series; arranging for the purchase and sale of such securities by placing orders with broker-dealers; administering the affairs of the Fund (including the books and records of the Fund not maintained by third party service providers such as the custodian or sub-transfer agent); arranging for the insurance coverage for the Fund; and supervising the preparation of tax returns, SEC filings (including registration statements) and reports to shareholders for the Fund. The Board also considered the nature and quality of such services provided under the Current Investment Advisory Agreement in light of the Advisor’s services provided to the Fund for 21 years. The Board discussed the quality of these services with representatives from the Advisor and concluded that the Advisor was performing its services to the Fund required under the Current Investment Advisory Agreement in a reasonable manner. |
| | • | | The Board considered the investment performance of the various Series of the Fund. The investment performance for each Series was reviewed on a cumulative basis since inception and on a one year basis. In addition, annualized performance for the following time periods was considered: inception, three year, five year, ten year, and current market cycle. A market cycle includes periods of both rising and falling markets. Returns for established benchmark indices for each Series were provided for |
Renewal of Investment Advisory Agreements (unaudited)
| | each time period. The Board noted that all the Series were competitive against their respective benchmark indices over all time periods noted above through September 30, 2007. In addition, the Board considered at the meeting (and considers on a quarterly basis) a peer group performance analysis consisting of Morningstar universes of mutual funds with similar investment objectives. The Board discussed the performance with representatives from the Advisor and concluded that the investment performance of each of the Fund’s Series was reasonable based on the Fund’s actual performance and comparative performance, especially performance over the current market cycle. |
| | • | | The Board considered the costs of the Advisor’s services and the profits of the Advisor as they relate to the Advisor’s services to the Fund under the Current Investment Advisory Agreement. In reviewing the Advisor’s costs and profits, the Board discussed the Advisor’s revenues generated from the Fund (on both an actual and adjusted basis) and its expenses associated with providing the services under the Current Investment Advisory Agreement. In addition, the Board reviewed the Advisor’s expenses associated with Fund activities outside of the Current Investment Advisory Agreement (such as expense reimbursements pursuant to expense caps and payments made by the Advisor to third party platforms on which shares of the Fund are available for purchase). It was noted by representatives of the Advisor that 4 of the 18 active Series of the Fund are currently experiencing expenses above the capped expense ratios. After discussing the above costs and profits, the Board concluded that the Advisor’s profitability relating to its services provided under the Current Investment Advisory Agreement was reasonable. |
| | • | | The Board considered the fees and expenses of the various Series of the Fund. The Advisor presented the advisory fees and total expenses for each Series, including the advisory fee adjusted for any expense waivers or reimbursements (either contractual or voluntary) paid by the Advisor. The advisory fees and expense ratios of each Series were compared to an average (on both a mean and median basis) of similar funds as disclosed on the Morningstar database. Representatives of the Advisor discussed with the Board the levels of its advisory fee for each Series of the Fund and as compared to the median and mean advisory fees for similar funds as listed on Morningstar. Expense ratios for every Series, except the High Yield Bond Series and Global Fixed Income Series, are currently below the median and mean for similar funds as listed on Morningstar. Based on their review of the information provided, the Board concluded that the fees and expenses of each Series of the Fund were reasonable on a comparative basis. |
| | • | | The Board also considered the other benefits the Advisor derives from its relationship with the Fund. Such other benefits include certain research products provided by soft dollars. Given the level of soft dollar transactions involving the Fund, the Board concluded that these additional benefits to the Advisor were reasonable. |
| | • | | In addition to the factors described above, the Board considered the Advisor’s personnel, investment strategies, policies and procedures relating to compliance with personal securities transactions, and reputation, expertise and resources in domestic and foreign financial markets. The Board concluded that these factors support the conclusion that the Advisor performs its services in a reasonable manner. |
Renewal of Investment Advisory Agreements (unaudited)
| | • | | The Board did not consider economies of scale at this time because of the multiple uses of the Fund (for the Advisor’s discretionary investment account clients in addition to direct investors), the current profitability of the Advisor’s services to the Fund under the Current Investment Advisory Agreement, and the overall size of the Fund complex. |
Based on the Board’s deliberations and their evaluation of the information described above, the Board, including a majority of Directors that are not “interested persons” as defined in the 1940 Act, concluded that the compensation under the Current Investment Advisory Agreement was fair and reasonable in light of the services and expenses and such other matters as the Directors considered to be relevant in the exercise of their reasonable judgment. Accordingly, the Board approved the renewal of the Current Investment Advisory Agreement. In the course of their deliberations, the Directors did not identify any particular information that was all important or controlling.
Proxy Voting Results (unaudited)
A special meeting of the shareholders of Manning & Napier Fund, Inc. was held on November 12, 2007. The number of votes necessary to conduct the meeting and approve each proposal was obtained, and the results of the votes of shareholders on proposals before them are listed below:
Election of Directors.
| | | | |
| | | Number of Shares
voted for | | Number of Shares
withheld |
B. Reuben Auspitz | | 215,932,354.541 | | 15,898,685.154 |
Stephen B. Ashley | | 215,960,751.214 | | 15,870,288.481 |
Peter L. Faber | | 217,504,725.208 | | 14,326,314.487 |
Harris H. Rusitzky | | 215,924,013.609 | | 15,907,026.086 |
To approve the investment advisory agreement between Manning & Napier Advisors, Inc. and Manning & Napier Fund, Inc.
| | |
| | | Number of shares voted |
For | | 3,191,080.260 |
Against | | 0 |
Abstain (includes broker non-votes) | | 0 |
Eliminating, amending, or reclassifying certain fundamental investment policies or restrictions.
Proposal 3.A.i. To approve changes to the fundamental policy regarding borrowing money.
| | |
| | | Number of shares voted |
For | | 3,191,080.260 |
Against | | 0 |
Abstain (includes broker non-votes) | | 0 |
Proposal 3.A.v. To approve changes to the fundamental policy regarding buying or selling of commodities or commodity contracts.
| | |
| | | Number of shares voted |
For | | 3,191,080.260 |
Against | | 0 |
Abstain (includes broker non-votes) | | 0 |
Directors’ and Officers’ Information (unaudited)
The Statement of Additional Information provides additional information about the Fund’s directors and officers and can be obtained without charge by calling 1-800-466-3863, at www.manningnapieradvisors.com, or on the EDGAR Database on the SEC Internet web site (http://www.sec.gov). The following chart shows certain information about the Fund’s officers and directors, including their principal occupations during the last five years. Unless specific dates are provided, the individuals have held the listed positions for longer than five years.
INTERESTED DIRECTOR/OFFICER
| | |
| |
| Name: | | B. Reuben Auspitz* |
| Address: | | 290 Woodcliff Drive
Fairport, NY 14450 |
| Age: | | 60 |
| Current Position(s) Held with Fund: | | Principal Executive Officer, President, Chairman & Director |
| Term of Office1 & Length of Time Served: | | Indefinite - Director since 1984; Vice President 1984 - 2003;
President since 2004; Principal Executive Officer since 2002 |
| Principal Occupation(s) During Past 5 Years: | | Executive Vice President; Co-Executive Director; Executive Group Member**; Chief Compliance Officer since 2004 - Manning & Napier Advisors, Inc. President; Director - Manning & Napier Investor Services, Inc. Holds or has held one or more of the following titles for various subsidiaries and affiliates: President, Vice President, Director, Chairman, Treasurer, Chief Compliance Officer or Member. |
| Number of Portfolios Overseen within Fund Complex: | | 27 |
| Other Directorships Held Outside Fund Complex: | | N/A |
| |
| INDEPENDENT DIRECTORS | | |
| |
| Name: | | Stephen B. Ashley |
| Address: | | 290 Woodcliff Drive
Fairport, NY 14450 |
| Age: | | 67 |
| Current Position(s) Held with Fund: | | Director, Audit Committee Member, Governance & Nominating
Committee Member |
| Term of Office & Length of Time Served: | | Indefinite - Since 1996 |
| Principal Occupation(s) During Past 5 Years: | | Chairman, Director, President & Chief Executive Officer, The Ashley Group (property management and investment) |
| Number of Portfolios Overseen within Fund Complex: | | 27 |
| Other Directorships Held Outside Fund Complex: | | The Ashley Group |
| | | Fannie Mae |
| Name: | | Peter L. Faber |
| Address: | | 290 Woodcliff Drive
Fairport, NY 14450 |
| Age: | | 68 |
| Current Position(s) Held with Fund: | | Director, Governance & Nominating Committee Member |
| Term of Office & Length of Time Served: | | Indefinite - Since 1987 |
| Principal Occupation(s) During Past 5 Years: | | Senior Counsel, McDermott, Will & Emery LLP (law firm) |
| Number of Portfolios Overseen within Fund Complex: | | 27 |
| Other Directorships Held Outside Fund Complex: | | Partnership for New York City, Inc. |
| | New York Collegium |
| | | Boston Early Music Festival |
| Name: | | Harris H. Rusitzky |
| Address: | | 290 Woodcliff Drive
Fairport, NY 14450 |
| Age: | | 72 |
| Current Position(s) Held with Fund: | | Director, Audit Committee Member, Governance & Nominating
Committee Member |
| Term of Office & Length of Time Served: | | Indefinite - Since 1985 |
| Principal Occupation(s) During Past 5 Years: | | President, The Greening Group (business consultants); Partner, The Restaurant Group (restaurants) |
| Number of Portfolios Overseen within Fund Complex: | | 27 |
| Other Directorships Held Outside Fund Complex: | | N/A |
Directors’ and Officers’ Information (unaudited)
| | |
| Name: | | Paul A. Brooke |
| Address: | | 290 Woodcliff Drive
Fairport, NY 14450 |
| Age: | | 62 |
| Current Position(s) Held with Fund: | | Director, Audit Committee Member, Governance & Nominating Committee Member |
| Term of Office & Length of Time Served: | | Indefinite - Since 2007 |
| Principal Occupation(s) During Past 5 Years: | | Chairman & CEO, Alsius Corp. (investments); Managing Member, PMSV Holdings LLC (investments) |
| Number of Portfolios Overseen within Fund Complex: | | 27 |
| Other Directorships Held Outside Fund Complex: | | Incyte Corp. |
| | ViroPharma, Inc. |
| | HLTH Corp. |
| | Cheyne Capital International |
| | MPM Bio-equities |
| | GMP Companies |
| | | HoustonPharma |
OFFICERS
| | |
| |
| Name: | | Jeffrey S. Coons, Ph.D., CFA |
| Address: | | 290 Woodcliff Drive
Fairport, NY 14450 |
| Age: | | 44 |
| Current Position(s) Held with Fund: | | Vice President |
| Term of Office1 & Length of Time Served: | | Since 2004 |
| Principal Occupation(s) During Past 5 Years: | | Co-Director of Research since 2002 & Executive Group Member**, Manning & Napier Advisors, Inc. Holds one or more of the following titles for various subsidiaries and affiliates: President, Director, Treasurer or Senior Trust Officer. |
| Number of Portfolios Overseen within Fund Complex: | | 27 |
| Other Directorships Held Outside Fund Complex: | | N/A |
| Name: | | Christine Glavin |
| Address: | | 290 Woodcliff Drive |
| | Fairport, NY 14450 |
| Age: | | 41 |
| Current Position(s) Held with Fund: | | Principal Financial Officer, Chief Financial Officer |
| Term of Office1 & Length of Time Served: | | Principal Financial Officer since 2002; Chief Financial Officer since 2001 |
| Principal Occupation(s) During Past 5 Years: | | Fund Reporting Manager, Manning & Napier Advisors, Inc. |
| Number of Portfolios Overseen within Fund Complex: | | 27 |
| Other Directorships Held Outside Fund Complex: | | N/A |
| Name: | | Jodi L. Hedberg |
| Address: | | 290 Woodcliff Drive |
| | Fairport, NY 14450 |
| Age: | | 40 |
| Current Position(s) Held with Fund: | | Corporate Secretary, Chief Compliance Officer, Anti-Money Laundering Compliance Officer |
| Term of Office1 & Length of Time Served: | | Corporate Secretary since 1997; Chief Compliance Officer since 2004 |
| Principal Occupation(s) During Past 5 Years: | | Director of Compliance, Manning & Napier Advisors, Inc. and affiliates; Corporate Secretary, Manning & Napier Investor Services, Inc. since 2006 |
| Number of Portfolios Overseen within Fund Complex: | | 27 |
| Other Directorships Held Outside Fund Complex: | | N/A |
*Interested Director, within the meaning of the Investment Company Act of 1940 by reason of his position with the Fund’s investment advisor and distributor. Mr. Auspitz serves as the Executive Vice President and Director, Manning & Napier Advisors, Inc. and President and Director, Manning & Napier Investor Services, Inc., the Fund’s distributor.
**The Executive Group performs the duties of the Office of the Chief Executive of Manning & Napier Advisors, Inc.
1The term of office for President, Vice President, Chief Financial Officer, and Corporate Secretary is one year and until their respective successors are chosen and qualified. All other officers’ terms are indefinite.
(THISPAGEINTENTIONALLYLEFTBLANK)
(THISPAGEINTENTIONALLYLEFTBLANK)
Literature Requests (unaudited)
Proxy Voting Policies and Procedures
A description of the policies and procedures that the Fund uses to determine how to vote proxies relating to portfolio securities is available, without charge, upon request:
| | |
By phone | | 1-800-466-3863 |
On the Securities and Exchange Commission’s (SEC) web site | | http://www.sec.gov |
Proxy Voting Record
Information regarding how the Fund voted proxies relating to portfolio securities during the most recent 12-month period ended June 30th is available, without charge, upon request:
| | |
By phone | | 1-800-466-3863 |
On the SEC’s web site | | http://www.sec.gov |
Quarterly Portfolio Holdings
The Series’ complete schedule of portfolio holdings for the 1st and 3rd quarters of each fiscal year are provided on Form N-Q, and are available, without charge, upon request:
| | |
By phone | | 1-800-466-3863 |
On the SEC’s web site | | http://www.sec.gov |
The Series’ Form N-Q may be reviewed and copied at the SEC’s Public Reference Room in Washington, D.C. Information on the operation of the Public Reference Room may be obtained by calling 1-800-SEC-0330.
Prospectus and Statement of Additional Information (SAI)
The prospectus and SAI provide additional information about each Series, including charges, expenses and risks. These documents are available, without charge, upon request:
| | |
By phone | | 1-800-466-3863 |
On the SEC’s web site | | http://www.sec.gov |
On the Advisor’s web site | | http://www.manningnapieradvisors.com |
Additional information available at www.manningnapieradvisors.com
1. Fund Holdings - Month-End
2. Fund Holdings - Quarter-End
3. Shareholder Report - Annual
4. Shareholder Report - Semi-Annual
Manning & Napier Fund, Inc.
| | | | |
| CORE PLUS BOND SERIES | | | | | Annual Report - December 31, 2007 |

Management Discussion and Analysis (unaudited)
Dear Shareholders:
It would be a bit of an understatement to describe 2007 as an “eventful” year; it was a wild ride during which fixed income investors were buffeted by a number of factors. “Subprime”, a relatively obscure term, entered the everyday vernacular. Securities that were thought to be rated “AAA” turned out not to be. There were high profile disasters as well as conservative success stories. And, as always seems to be the case, the Federal Reserve (the “Fed”) once again played a prominent role.
Given the added risk associated with corporate bonds and mortgage-backed bonds, they traditionally carry higher yields when compared to similar maturity U.S. Treasury securities. That difference is called the “credit spread” when referring to corporate bonds, and the “pre-payment spread” when referring to pass-through securities such as mortgage-backed bonds. Over the long-term, those spreads have allowed corporate bonds and mortgage-backed bonds to generate higher total returns than U.S. Treasuries. That tendency led to the activation of the Core Plus Bond Series back in April of 2005.
Unfortunately in 2007, the credit/pre-payment spreads associated with those securities widened; U.S. Treasury yields moved sharply lower last year while yields in the mortgage-backed sector were only slightly lower and corporate yields were slightly higher. As a result mortgage-backed and corporate bond investors did earn their coupons, plus in many instances a modest capital gain, but those returns failed to keep up with the returns of the U.S. Treasury market. The fact that the Core Plus Bond Series concentrates its investments in spread investments worked against the Series last year, so it underperformed relative to its benchmark, which includes a significant U.S. Treasury and Agency component.
As for specifics, the yield on the market-weighted U.S. Treasury index dropped from 4.87% to 3.66%. The biggest declines were on the short-end of the yield curve where yields on bonds with 2-year maturities fell 176 basis points (1.76%), starting the year at 4.81% and finishing it at 3.05%; long-term U.S. Treasury rates dropped from 4.81% to 4.45%, a 36 basis point (0.36%) decline. As for the mortgage-backed market, the yield on that index fell 34 basis points (0.34%), from 5.66% to 5.32%; the yield on the corporate index moved higher, rising from 5.70% to 5.81%.
The first quarter of the year was relatively quiet since the economic releases were relatively mixed. On the good side, unemployment was down to 4.4% in March, payroll growth was still relatively robust, and the 4-week average of initial claims for unemployment insurance was drifting lower. Unfortunately, the good news in the labor markets was offset by the bad news in the housing sector; it remained under duress, and it started to become apparent that the hoped for bottom of the housing market was still quite a ways off.
During the second quarter of the year, rates on short- and long-term bonds began to move in opposite directions, reflecting two distinct factors. On the short-end of the yield curve, a significant change in the market’s supply/demand dynamics pushed rates lower. A shrinking Federal deficit mitigates the Treasury’s borrowing needs, which in turn shrinks the supply of U.S. Treasury Bills, while foreign central banks began paring back their longer-term U.S. Treasury purchases, focusing instead on U.S. Treasury Bills. The combination of a shrinking supply and increased demand pushed short-term U.S. Treasury rates lower. On the intermediate-to-long end of the yield curve, rates rose due to a marked change in the market’s expectations about monetary policy and the rate of economic growth. As we moved into the summer, a number of the economic releases suggested that the rate of economic growth was picking back up. At the same time, the Fed started to hedge when it came to defining what it considered to be an acceptable rate of inflation. The markets responded by re-adjusting intermediate-to-longer term interest rates higher.
Market psychology definitely changed during the third quarter of the year and the precipitous drop in interest rates began, triggered by a flight to quality and a reassessment of the trajectory of Fed policy. While the problems in the market for subprime mortgage loans were well known prior to the third quarter, the collapse of two high profile hedge funds at Bear Stearns along with a couple of European bank announcements revealed the first set of identifiable victims. That caused investors to exit and/or avoid anything remotely tied to the subprime sector. The proceeds were parked in the perceived safest, most liquid alternative, specifically short-term U.S. Treasury instruments.
Management Discussion and Analysis (unaudited)
Given the financial dislocations caused by this flight to quality, both the Fed and European central banks responded by injecting liquidity into the financial system. The Fed began by cutting the discount rate (the rate charged to banks to borrow reserves directly from the Fed), and followed that initial move with a cut in the Fed Funds target (the rate charged by banks to borrow reserves from each other). Cutting the targeted Fed Funds rate was not only a response to the liquidity concerns associated with a flight to quality, but also a response to a weakening labor market.
During the fourth quarter there were two additional policy moves enacted by the Fed. It followed up its 50 basis point cut in September with 25 basis point cuts in October and December. The Fed and the markets were both responding to the headwinds that continued to buffet the U.S. economy. The housing sector continued to sink with new home sales dropping 50% from their highs, existing home sales down one-third, and home prices posting year-over-year declines, a decidedly rare occurrence. What was more troubling was the fact that the problems in the housing sector appeared to have spilled over into other sectors of the economy. Job growth had slowed and the unemployment rate had risen to 5.0%, a level not seen since the end of 2005. At some point that should affect income growth, which had been remarkably robust. It was not just the consumer sector that troubled the market; the manufacturing sector appeared to be weakening as well.
Given the economic headwinds, credit concerns rose. In addition, the corporate bond market is dominated by financial issuers, one of the sectors most impacted by the subprime mess. As was mentioned, credit spreads widened quite dramatically. As for the mortgage-backed sector, its spreads typically widen when interest rate volatility picks up; that was definitely the case in 2007, and pre-payment spreads widened.
As for the performance of the Core Plus Bond Series in 2007, its total return was 4.34%. That lagged the Merrill Lynch U.S. Corporate, Government & Mortgage Index (which includes all U.S. Treasury, U.S. Agency, investment-grade corporate bonds, and plain vanilla mortgage-backed securities with maturities of more than one year), which returned 7.17% in 2007. The underperformance can be traced primarily to the strong performance of U.S. Treasury market, which we believe to be a short-term phenomenon.
We appreciate your business and wish you all the very best in the coming year.
Sincerely,
Manning & Napier Advisors, Inc.
Performance Update as of December 31, 2007 (unaudited)
| | | | | | |
| | | Average Annual Total Returns
As of December 31, 2007 | | |
| | | One
Year | | Since
Inception1 | | |
Manning & Napier Fund, Inc. - Core Plus Bond Series2 | | 4.34% | | 3.69% | | |
Merrill Lynch U.S. Corporate, Government & Mortgage Index3 | | 7.17% | | 4.99% | | |
The following graph compares the value of a $10,000 investment in the Manning & Napier Fund, Inc. - Core Plus Bond Series from its inception1 (4/21/05) to present (12/31/07) to the Merrill Lynch U.S. Corporate, Government & Mortgage Index.
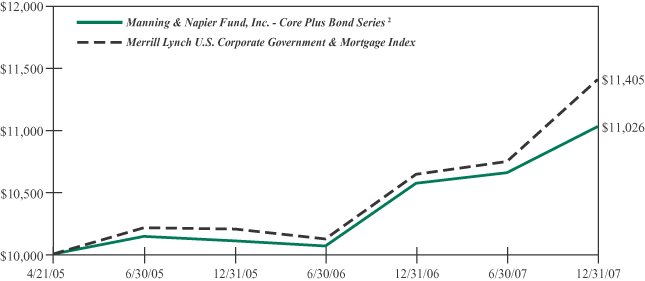
1Performance numbers for the Series and Index are calculated from April 21, 2005, the Series' inception date.
2The Series' performance does not reflect the deduction of taxes that a shareholder would pay on fund distributions or the redemption of shares. The Series' performance is historical and may not be indicative of future results. The performance returns shown are inclusive of the net expense ratio of the Series. For the year ended December 31, 2007, this net expense ratio was 0.81%. The gross expense ratio, which does not account for any voluntary or contractual waivers currently in effect, was 0.81% for the year ended December 31, 2007.
3The unmanaged Merrill Lynch U.S. Corporate, Government & Mortgage Index (formerly Merrill Lynch U.S. Domestic Master Index) is a market value weighted measure that represents U.S. government, corporate, and pass-through securities issued by entities within the United States, by supranational entities, or by entities headquartered outside of the United States but who have issued dollar-denominated securities within the United States. The Index only includes investment-grade securities with maturities of greater than one year. The Index returns assume reinvestment of coupons and, unlike Series returns, do not reflect any fees or expenses.
Shareholder Expense Example (unaudited)
As a shareholder of the Series, you may incur two types of costs: (1) transaction costs, including potential wire charges on redemptions and (2) ongoing costs, including management fees and other Series expenses. This example is intended to help you understand your ongoing costs (in dollars) of investing in the Series and to compare these costs with the ongoing costs of investing in other mutual funds.
The example is based on an investment of $1,000 invested at the beginning of the period and held for the entire period (July 1, 2007 to December 31, 2007).
Actual Expenses
The first line of the table below provides information about actual account values and actual expenses. You may use the information in this line, together with the amount you invested, to estimate the expenses that you paid over the period. Simply divide your account value by $1,000 (for example, an $8,600 account value divided by $1,000 = 8.6), then multiply the result by the number in the first line under the heading entitled “Expenses Paid During Period” to estimate the expenses you paid on your account during this period.
Hypothetical Example for Comparison Purposes
The second line of the table below provides information about hypothetical account values and hypothetical expenses based on the Series’ actual expense ratio and an assumed rate of return of 5% per year before expenses, which is not the Series’ actual return. The hypothetical account values and expenses may not be used to estimate the actual ending account balance or expenses you paid during the period. You may use this information to compare the ongoing costs of investing in the Series and other funds. To do so, compare this 5% hypothetical example with the 5% hypothetical examples that appear in the shareholder reports of the other funds.
Please note that the expenses shown in the table are meant to highlight your ongoing costs only and do not reflect any transaction costs, such as potential wire charges on redemptions. Therefore, the second line of the table is useful in comparing ongoing costs only, and will not help you determine the relative total costs of owning different funds. In addition, if these transaction costs were included, your costs would have been higher.
| | | | | | | | | |
| | | Beginning
Account Value
7/1/07 | | Ending
Account Value
12/31/07 | | Expenses Paid
During Period*
7/1/07-12/31/07 |
Actual | | $ | 1,000.00 | | $ | 1,035.10 | | $ | 4.21 |
Hypothetical
(5% return before expenses) | | $ | 1,000.00 | | $ | 1,021.07 | | $ | 4.18 |
*Expenses are equal to the Series’ annualized expense ratio (for the six-month period) of 0.82%, multiplied by the average account value over the period, multiplied by 184/365 (to reflect the one-half year period). Expenses are based on the most recent fiscal half year; therefore, the expense ratio stated above may differ from the expense ratio stated in the financial highlights, which is based on one-year data.
Portfolio Composition as of December 31, 2007 (unaudited)
Sector Allocation1
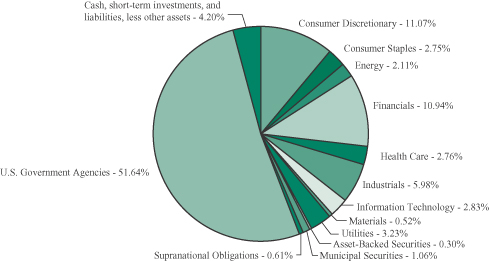
1As a percentage of net assets.
Credit Quality Ratings2,3
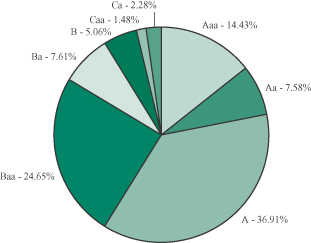
2As a percentage of total corporate bonds, foreign bonds, asset-backed securities, municipal bonds and supranational obligations.
3Based on ratings from Moody's, or the S&P equivalent. The Series may use different ratings provided by other rating agencies for purposes of determining compliance with the Series' investment policies.
Investment Portfolio - December 31, 2007
| | | | | | | | | |
| | | Credit
Rating1
(unaudited) | | | Principal
Amount | | Value
(Note 2) |
| | | | | | | | | |
| | | | | | | | | |
| | | |
CORPORATE BONDS - 36.72% | | | | | | | | | |
| | | |
Convertible Corporate Bonds - 4.04% | | | | | | | | | |
Consumer Discretionary - 1.44% | | | | | | | | | |
Hotels, Restaurants & Leisure - 0.53% | | | | | | | | | |
Carnival Corp., 2.00%, 4/15/2021 | | A3 | | | $ | 1,250,000 | | $ | 1,460,937 |
| | | | | | | | | |
Media - 0.91% | | | | | | | | | |
Charter Communications, Inc., 6.50%, 10/1/2027 | | Ca | | | | 4,272,000 | | | 2,541,840 |
| | | | | | | | | |
Total Consumer Discretionary | | | | | | | | | 4,002,777 |
| | | | | | | | | |
Health Care - 1.31% | | | | | | | | | |
Biotechnology - 0.89% | | | | | | | | | |
Amgen, Inc., 0.375%, 2/1/2013 | | A2 | | | | 2,830,000 | | | 2,486,862 |
| | | | | | | | | |
Health Care Equipment & Supplies - 0.26% | | | | | | | | | |
Medtronic, Inc., 1.625%, 4/15/2013 | | A1 | | | | 665,000 | | | 709,888 |
| | | | | | | | | |
Pharmaceuticals - 0.16% | | | | | | | | | |
Valeant Pharmaceuticals International, 4.00%, 11/15/2013 | | B | 2 | | | 540,000 | | | 453,600 |
| | | | | | | | | |
Total Health Care | | | | | | | | | 3,650,350 |
| | | | | | | | | |
Industrials - 0.59% | | | | | | | | | |
Airlines - 0.59% | | | | | | | | | |
JetBlue Airways Corp., 3.75%, 3/15/2035 | | Caa2 | | | | 1,900,000 | | | 1,648,250 |
| | | | | | | | | |
Information Technology - 0.70% | | | | | | | | | |
Software - 0.70% | | | | | | | | | |
Amdocs Ltd., 0.50%, 3/15/2024 (Guernsey) (Note 7) | | Baa3 | | | | 1,930,000 | | | 1,961,363 |
| | | | | | | | | |
Total Convertible Corporate Bonds
(Identified Cost $12,814,686) | | | | | | | | | 11,262,740 |
| | | | | | | | | |
Non-Convertible Corporate Bonds - 32.68% | | | | | | | | | |
Consumer Discretionary - 8.74% | | | | | | | | | |
Automobiles - 3.49% | | | | | | | | | |
Ford Motor Credit Co. LLC, 5.625%, 10/1/2008 | | B1 | | | | 2,590,000 | | | 2,514,618 |
General Motors Acceptance Corp. LLC, 6.125%, 1/22/2008 | | Ba3 | | | | 7,240,000 | | | 7,209,669 |
| | | | | | | | | |
| | | | | | | | | 9,724,287 |
| | | | | | | | | |
Hotels, Restaurants & Leisure - 0.99% | | | | | | | | | |
McDonald’s Corp., 5.80%, 10/15/2017 | | A3 | | | | 2,655,000 | | | 2,748,929 |
| | | | | | | | | |
Media - 2.93% | | | | | | | | | |
AOL Time Warner (now known as Time Warner, Inc.), 7.625%, 4/15/2031 | | Baa2 | | | | 2,725,000 | | | 3,015,540 |
Comcast Corp., 6.50%, 11/15/2035 | | Baa2 | | | | 3,105,000 | | | 3,168,463 |
The Walt Disney Co., 7.00%, 3/1/2032 | | A2 | | | | 1,720,000 | | | 1,976,416 |
| | | | | | | | | |
| | | | | | | | | 8,160,419 |
| | | | | | | | | |
| | |
| 6 | | The accompanying notes are an integral part of the financial statements. |
Investment Portfolio - December 31, 2007
| | | | | | | | |
| | | Credit
Rating1
(unaudited) | | Principal
Amount | | Value
(Note 2) |
| | | | | | | | |
| | | |
CORPORATE BONDS (continued) | | | | | | | | |
| | | |
Non-Convertible Corporate Bonds (continued) | | | | | | | | |
Consumer Discretionary (continued) | | | | | | | | |
Multiline Retail - 0.75% | | | | | | | | |
Target Corp., 5.875%, 3/1/2012 | | A2 | | $ | 2,020,000 | | $ | 2,091,207 |
| | | | | | | | |
Specialty Retail - 0.58% | | | | | | | | |
Lowe's Companies, Inc., 8.25%, 6/1/2010 | | A1 | | | 1,470,000 | | | 1,606,047 |
| | | | | | | | |
Total Consumer Discretionary | | | | | | | | 24,330,889 |
| | | | | | | | |
Consumer Staples - 1.32% | | | | | | | | |
Beverages - 0.73% | | | | | | | | |
The Coca-Cola Co., 5.35%, 11/15/2017 | | Aa3 | | | 2,000,000 | | | 2,049,084 |
| | | | | | | | |
Food & Staples Retailing - 0.58% | | | | | | | | |
The Kroger Co., 7.25%, 6/1/2009 | | Baa2 | | | 775,000 | | | 797,230 |
The Kroger Co., 6.80%, 4/1/2011 | | Baa2 | | | 775,000 | | | 815,602 |
| | | | | | | | |
| | | | | | | | 1,612,832 |
| | | | | | | | |
Household Products - 0.01% | | | | | | | | |
The Procter & Gamble Co., 4.85%, 12/15/2015 | | Aa3 | | | 25,000 | | | 25,280 |
| | | | | | | | |
Total Consumer Staples | | | | | | | | 3,687,196 |
| | | | | | | | |
Energy - 1.33% | | | | | | | | |
Oil, Gas & Consumable Fuels - 1.33% | | | | | | | | |
Anadarko Petroleum Corp., 5.95%, 9/15/2016 | | Baa3 | | | 1,015,000 | | | 1,033,503 |
Arch Western Finance LLC, 6.75%, 7/1/2013 | | B1 | | | 2,745,000 | | | 2,662,650 |
| | | | | | | | |
Total Energy | | | | | | | | 3,696,153 |
| | | | | | | | |
Financials - 9.65% | | | | | | | | |
Capital Markets - 2.75% | | | | | | | | |
The Goldman Sachs Group, Inc., 6.345%, 2/15/2034 | | A1 | | | 3,450,000 | | | 3,115,764 |
Lehman Brothers Holdings, Inc., 4.9775%, 11/16/20098 | | A1 | | | 1,155,000 | | | 1,125,184 |
Lehman Brothers Holdings, Inc., 6.50%, 7/19/2017 | | A2 | | | 1,260,000 | | | 1,274,940 |
Merrill Lynch & Co., Inc., 6.00%, 2/15/2017 | | A1 | | | 1,165,000 | | | 1,139,577 |
Merrill Lynch & Co., Inc., 6.11%, 1/29/2037 | | A2 | | | 1,145,000 | | | 1,011,253 |
| | | | | | | | |
| | | | | | | | 7,666,718 |
| | | | | | | | |
Commercial Banks - 3.44% | | | | | | | | |
Commonwealth Bank of Australia3,4, 4/30/2010 (Australia) (Note 7) | | Aa1 | | | 1,000,000 | | | 1,038,800 |
Manufacturers & Traders Trust Co., 6.625%, 12/4/2017 | | A2 | | | 2,505,000 | | | 2,504,304 |
PNC Bank National Association, 5.25%, 1/15/2017 | | A1 | | | 2,810,000 | | | 2,668,311 |
U.S. Bank National Association, 6.375%, 8/1/2011 | | Aa2 | | | 85,000 | | | 89,147 |
Wachovia Corp., 5.25%, 8/1/2014 | | A1 | | | 3,340,000 | | | 3,265,638 |
| | | | | | | | |
| | | | | | | | 9,566,200 |
| | | | | | | | |
| | |
| The accompanying notes are an integral part of the financial statements. | | 7 |
Investment Portfolio - December 31, 2007
| | | | | | | | |
| | | Credit
Rating1
(unaudited) | | Principal
Amount | | Value
(Note 2) |
| | | | | | | | |
| | | |
CORPORATE BONDS (continued) | | | | | | | | |
| | | |
Non-Convertible Corporate Bonds (continued) | | | | | | | | |
Financials (continued) | | | | | | | | |
Consumer Finance - 1.58% | | | | | | | | |
Toyota Motor Credit Corp., 0.75%, 6/9/2008 (JPY) (Note 7) | | Aaa | | | 235,000,000 | | $ | 2,101,914 |
Toyota Motor Credit Corp., 10.00%, 5/4/2022 | | Aaa | | $ | 2,400,000 | | | 2,304,000 |
| | | | | | | | |
| | | | | | | | 4,405,914 |
| | | | | | | | |
Insurance - 1.88% | | | | | | | | |
Ambac Financial Group, Inc., 5.95%, 12/5/2035 | | Aa2 | | | 4,465,000 | | | 3,485,129 |
American International Group, Inc., 4.25%, 5/15/2013 | | Aa2 | | | 1,840,000 | | | 1,750,335 |
| | | | | | | | |
| | | | | | | | 5,235,464 |
| | | | | | | | |
Total Financials | | | | | | | | 26,874,296 |
| | | | | | | | |
Health Care - 1.45% | | | | | | | | |
Pharmaceuticals - 1.45% | | | | | | | | |
Abbott Laboratories, 3.50%, 2/17/2009 | | A1 | | | 1,305,000 | | | 1,287,885 |
Abbott Laboratories, 5.875%, 5/15/2016 | | A1 | | | 500,000 | | | 522,274 |
Wyeth, 6.50%, 2/1/2034 | | A3 | | | 2,100,000 | | | 2,228,778 |
| | | | | | | | |
Total Health Care | | | | | | | | 4,038,937 |
| | | | | | | | |
Industrials - 5.39% | | | | | | | | |
Aerospace & Defense - 0.45% | | | | | | | | |
Boeing Capital Corp., 6.50%, 2/15/2012 | | A2 | | | 1,175,000 | | | 1,261,431 |
| | | | | | | | |
Air Freight & Logistics - 0.46% | | | | | | | | |
FedEx Corp., 3.50%, 4/1/2009 | | Baa2 | | | 1,310,000 | | | 1,288,833 |
| | | | | | | | |
Airlines - 0.92% | | | | | | | | |
Southwest Airlines Co., 5.25%, 10/1/2014 | | Baa1 | | | 2,630,000 | | | 2,563,135 |
| | | | | | | | |
Industrial Conglomerates - 1.23% | | | | | | | | |
General Electric Capital Corp., 3.75%, 4/9/2008 (EUR) (Note 7) | | Aaa | | | 1,215,000 | | | 1,770,858 |
General Electric Capital Corp., 6.75%, 3/15/2032 | | Aaa | | $ | 1,460,000 | | | 1,657,659 |
| | | | | | | | |
| | | | | | | | 3,428,517 |
| | | | | | | | |
Machinery - 0.45% | | | | | | | | |
John Deere Capital Corp., 5.50%, 4/13/2017 | | A2 | | | 1,240,000 | | | 1,249,753 |
| | | | | | | | |
Road & Rail - 1.88% | | | | | | | | |
CSX Corp., 6.00%, 10/1/2036 | | Baa3 | | | 3,725,000 | | | 3,380,773 |
Union Pacific Corp., 5.65%, 5/1/2017 | | Baa2 | | | 1,870,000 | | | 1,845,877 |
| | | | | | | | |
| | | | | | | | 5,226,650 |
| | | | | | | | |
Total Industrials | | | | | | | | 15,018,319 |
| | | | | | | | |
| | |
| 8 | | The accompanying notes are an integral part of the financial statements. |
Investment Portfolio - December 31, 2007
| | | | | | | | |
| | | Credit
Rating1
(unaudited) | | Principal
Amount | | Value
(Note 2) |
| | | | | | | | |
| | | |
CORPORATE BONDS (continued) | | | | | | | | |
| | | |
Non-Convertible Corporate Bonds (continued) | | | | | | | | |
Information Technology - 1.41% | | | | | | | | |
Communications Equipment - 1.41% | | | | | | | | |
Cisco Systems, Inc., 5.50%, 2/22/2016 | | A1 | | $ | 1,240,000 | | $ | 1,261,043 |
Corning, Inc., 6.20%, 3/15/2016 | | Baa1 | | | 2,590,000 | | | 2,668,474 |
| | | | | | | | |
Total Information Technology | | | | | | | | 3,929,517 |
| | | | | | | | |
Materials - 0.52% | | | | | | | | |
Metals & Mining - 0.52% | | | | | | | | |
Alcoa, Inc., 5.87%, 2/23/2022 | | Baa1 | | | 1,505,000 | | | 1,454,435 |
| | | | | | | | |
Utilities - 2.87% | | | | | | | | |
Electric Utilities - 2.54% | | | | | | | | |
Allegheny Energy Supply Co. LLC3,5, 8.25%, 4/15/2012 | | Ba1 | | | 1,180,000 | | | 1,259,650 |
American Electric Power Co., Inc., 5.375%, 3/15/2010 | | Baa2 | | | 2,510,000 | | | 2,545,943 |
Exelon Generation Co. LLC, 5.35%, 1/15/2014 | | A3 | | | 3,355,000 | | | 3,265,069 |
| | | | | | | | |
| | | | | | | | 7,070,662 |
| | | | | | | | |
Multi-Utilities - 0.33% | | | | | | | | |
CenterPoint Energy Resources Corp., 7.875%, 4/1/2013 | | Baa3 | | | 770,000 | | | 845,450 |
Duke Energy Field Services LLC (now known as DCP Midstream LLC), 7.875%, 8/16/2010 | | Baa2 | | | 30,000 | | | 32,181 |
Sempra Energy, 7.95%, 3/1/2010 | | Baa1 | | | 30,000 | | | 32,054 |
| | | | | | | | |
| | | | | | | | 909,685 |
| | | | | | | | |
Total Utilities | | | | | | | | 7,980,347 |
| | | | | | | | |
Total Non-Convertible Corporate Bonds
(Identified Cost $91,598,631) | | | | | | | | 91,010,089 |
| | | | | | | | |
TOTAL CORPORATE BONDS
(Identified Cost $104,413,317) | | | | | | | | 102,272,829 |
| | | | | | | | |
| | | |
COMMERCIAL PAPER - 3.76% | | | | | | | | |
Consumer Discretionary - 0.89% | | | | | | | | |
Automobiles - 0.35% | | | | | | | | |
FCAR Owner Trust II, 1/30/2008 | | | | | 1,000,000 | | | 994,884 |
| | | | | | | | |
Media - 0.36% | | | | | | | | |
Time Warner Cable, Inc., 1/15/2008 | | | | | 1,000,000 | | | 997,729 |
| | | | | | | | |
Specialty Retail - 0.18% | | | | | | | | |
Home Depot, Inc.3,5, 1/30/2008 | | | | | 500,000 | | | 497,784 |
| | | | | | | | |
Total Consumer Discretionary | | | | | | | | 2,490,397 |
| | | | | | | | |
| | |
| The accompanying notes are an integral part of the financial statements. | | 9 |
Investment Portfolio - December 31, 2007
| | | | | | | | |
| | | Credit
Rating1
(unaudited) | | Principal
Amount/
Shares | | Value
(Note 2) |
| | | | | | | | |
| | | |
COMMERCIAL PAPER (continued) | | | | | | | | |
Consumer Staples - 1.43% | | | | | | | | |
Food Products - 1.07% | | | | | | | | |
General Mills, Inc.3,5, 1/24/2008 | | | | $ | 1,000,000 | | $ | 996,514 |
Heinz (HJ) Finance Co.3,5, 1/25/2008 | | | | | 1,000,000 | | | 996,289 |
Kellogg Co.3,5, 1/30/2008 | | | | | 1,000,000 | | | 995,569 |
| | | | | | | | |
| | | | | | | | 2,988,372 |
| | | | | | | | |
Household Products - 0.36% | | | | | | | | |
Clorox Co.3,5, 1/7/2008 | | | | | 1,000,000 | | | 998,977 |
| | | | | | | | |
Total Consumer Staples | | | | | | | | 3,987,349 |
| | | | | | | | |
Energy - 0.36% | | | | | | | | |
Energy Equipment & Services - 0.36% | | | | | | | | |
Weatherford International Ltd., 1/28/2008 | | | | | 1,000,000 | | | 995,297 |
| | | | | | | | |
Information Technology - 0.72% | | | | | | | | |
IT Services - 0.72% | | | | | | | | |
Computer Sciences Corp.3,5, 1/15/2008 | | | | | 1,000,000 | | | 997,708 |
Western Union Co.3,5, 1/22/2008 | | | | | 1,000,000 | | | 996,763 |
| | | | | | | | |
Total Information Technology | | | | | | | | 1,994,471 |
| | | | | | | | |
| | | |
Utilities - 0.36% | | | | | | | | |
Electric Utilities - 0.36% | | | | | | | | |
American Electric Power Co., Inc.3,5, 1/15/2008 | | | | | 1,000,000 | | | 997,893 |
| | | | | | | | |
TOTAL COMMERCIAL PAPER
(Identified Cost $10,467,984) | | | | | | | | 10,465,407 |
| | | | | | | | |
| | | |
FOREIGN BONDS - 1.29% | | | | | | | | |
Financials - 1.29% | | | | | | | | |
Commercial Banks - 1.29% | | | | | | | | |
Depfa ACS Bank, 0.75%, 9/22/2008 (Ireland) (JPY) (Note 7) | | Aaa | | | 180,000,000 | | | 1,610,090 |
MBNA Europe Funding plc, 3.00%, 2/7/2008 (United Kingdom) (EUR) (Note 7) | | Aaa | | | 1,350,000 | | | 1,969,719 |
| | | | | | | | |
TOTAL FOREIGN BONDS
(Identified Cost $3,267,031) | | | | | | | | 3,579,809 |
| | | | | | | | |
| | | |
PREFERRED STOCKS - 0.42% | | | | | | | | |
Energy - 0.42% | | | | | | | | |
Oil, Gas & Consumable Fuels - 0.42% | | | | | | | | |
Edge Petroleum Corp. - Series A
(Identified Cost $1,341,937) | | | | | 35,050 | | | 1,182,937 |
| | | | | | | | |
| | |
| 10 | | The accompanying notes are an integral part of the financial statements. |
Investment Portfolio - December 31, 2007
| | | | | | | | | |
| | | Credit
Rating1
(unaudited) | | | Principal
Amount | | Value
(Note 2) |
| | | | | | | | | |
| | | |
ASSET-BACKED SECURITIES - 0.30% | | | | | | | | | |
Terra 2007-1A B1 Static Synthetic CDO3,6,8, 5.92625%, 3/20/2015 | | | | | | | | | |
(Identified Cost $1,000,000) | | A | 2 | | $ | 1,000,000 | | $ | 843,100 |
| | | | | | | | | |
| | | |
MUNICIPAL SECURITIES - 1.06% | | | | | | | | | |
Canyon Independent School District, G.O. Bond, 4.50%, 2/15/2030 | | AAA | 2 | | | 500,000 | | | 490,360 |
Chapel Hill Independent School District, School Building, G.O. Bond, 4.50%, 8/15/2032 | | Aaa | | | | 500,000 | | | 488,330 |
Commerce Independent School District, School Building, G.O. Bond, 4.50%, 8/15/2037 | | Aaa | | | | 500,000 | | | 482,520 |
Harlandale Independent School District, School Building, G.O. Bond, 4.75%, 8/15/2036 | | Aaa | | | | 500,000 | | | 500,325 |
Katy Independent School District, School Building, G.O. Bond, 4.50%, 2/15/2031 | | Aaa | | | | 500,000 | | | 488,865 |
Keller Independent School District, School Building, G.O. Bond, 4.75%, 8/15/2032 | | Aaa | | | | 500,000 | | | 502,660 |
| | | | | | | | | |
TOTAL MUNICIPAL SECURITIES
(Identified Cost $2,884,066) | | | | | | | | | 2,953,060 |
| | | | | | | | | |
| | |
SUPRANATIONAL OBLIGATIONS - 0.61% | | | | | | | |
International Bank for Reconstruction and Development, 2.00%, 2/18/2008 (JPY) (Note 7) | | | | | | | | | |
(Identified Cost $1,700,243) | | Aaa | | | | 190,000,000 | | | 1,702,696 |
| | | | | | | | | |
| | | |
U.S. GOVERNMENT AGENCIES - 51.64% | | | | | | | | | |
Mortgage-Backed Securities - 48.42% | | | | | | | | | |
Fannie Mae, Pool #244510, 5.50%, 12/1/2008 | | | | | $ | 2,474 | | | 2,475 |
Fannie Mae, Pool #050972, 5.50%, 1/1/2009 | | | | | | 3,486 | | | 3,488 |
Fannie Mae, Pool #190549, 5.50%, 1/1/2009 | | | | | | 3,283 | | | 3,288 |
Fannie Mae, Pool #663794, 5.50%, 9/1/2017 | | | | | | 103,234 | | | 104,795 |
Fannie Mae, Pool #555389, 5.50%, 4/1/2018 | | | | | | 459,661 | | | 466,611 |
Fannie Mae, Pool #697020, 5.50%, 5/1/2018 | | | | | | 37,796 | | | 38,357 |
Fannie Mae, Pool #741610, 5.50%, 9/1/2018 | | | | | | 335,113 | | | 340,094 |
Fannie Mae, Pool #761280, 5.50%, 2/1/2019 | | | | | | 108,895 | | | 110,420 |
Fannie Mae, Pool #725793, 5.50%, 9/1/2019 | | | | | | 523,047 | | | 530,821 |
Fannie Mae, Pool #815122, 5.50%, 4/1/2020 | | | | | | 101,911 | | | 103,271 |
Fannie Mae, Pool #829068, 4.50%, 8/1/2020 | | | | | | 88,266 | | | 86,789 |
Fannie Mae, Pool #825922, 4.50%, 9/1/2020 | | | | | | 713,774 | | | 701,829 |
Fannie Mae, Pool #829070, 4.50%, 9/1/2020 | | | | | | 82,978 | | | 81,589 |
Fannie Mae, Pool #829702, 4.50%, 10/1/2020 | | | | | | 95,621 | | | 94,020 |
Fannie Mae, Pool #844909, 4.50%, 10/1/2020 | | | | | | 91,007 | | | 89,484 |
Fannie Mae, Pool #813954, 4.50%, 12/1/2020 | | | | | | 803,765 | | | 790,314 |
Fannie Mae, Pool #837186, 4.50%, 12/1/2020 | | | | | | 287,828 | | | 283,011 |
| | |
| The accompanying notes are an integral part of the financial statements. | | 11 |
Investment Portfolio - December 31, 2007
| | | | | | | | |
| | | | | Principal Amount | | Value
(Note 2) |
| | | | | | | | |
| | | |
U.S. GOVERNMENT AGENCIES (continued) | | | | | | | | |
Mortgage-Backed Securities (continued) | | | | | | | | |
Fannie Mae, Pool #256114, 4.50%, 1/1/2021 | | | | $ | 196,554 | | $ | 193,265 |
Fannie Mae, Pool #852931, 4.50%, 4/1/2021 | | | | | 412,240 | | | 405,563 |
Fannie Mae, Pool #869204, 4.50%, 5/1/2021 | | | | | 406,516 | | | 399,932 |
Fannie Mae, Pool #256543, 5.00%, 11/1/2021 | | | | | 714,879 | | | 715,649 |
Fannie Mae, Pool #900880, 5.00%, 12/1/2021 | | | | | 761,155 | | | 761,974 |
Fannie Mae, Pool #904409, 5.00%, 12/1/2021 | | | | | 659,816 | | | 660,527 |
Fannie Mae, Pool #905666, 5.00%, 12/1/2021 | | | | | 297,203 | | | 297,523 |
Fannie Mae, Pool #906708, 5.00%, 12/1/2021 | | | | | 741,204 | | | 742,003 |
Fannie Mae, Pool #907113, 5.00%, 12/1/2021 | | | | | 755,007 | | | 755,820 |
Fannie Mae, Pool #899017, 5.00%, 1/1/2022 | | | | | 677,165 | | | 677,894 |
Fannie Mae, Pool #818020, 4.50%, 2/1/2022 | | | | | 1,104,130 | | | 1,086,711 |
Fannie Mae, Pool #912557, 4.50%, 2/1/2022 | | | | | 1,157,177 | | | 1,138,921 |
Fannie Mae, Pool #909352, 5.00%, 2/1/2022 | | | | | 25,296 | | | 25,324 |
Fannie Mae, Pool #912415, 5.00%, 2/1/2022 | | | | | 745,614 | | | 746,417 |
Fannie Mae, Pool #741552, 6.50%, 9/1/2033 | | | | | 417,536 | | | 431,140 |
Fannie Mae, Pool #747607, 6.50%, 11/1/2033 | | | | | 81,260 | | | 83,907 |
Fannie Mae, Pool #776452, 6.50%, 1/1/2034 | | | | | 43,121 | | | 44,526 |
Fannie Mae, Pool #765848, 6.50%, 2/1/2034 | | | | | 49,158 | | | 50,667 |
Fannie Mae, Pool #766304, 6.50%, 3/1/2034 | | | | | 68,901 | | | 71,015 |
Fannie Mae, Pool #725686, 6.50%, 7/1/2034 | | | | | 131,122 | | | 135,555 |
Fannie Mae, Pool #782769, 6.50%, 7/1/2034 | | | | | 575,648 | | | 593,314 |
Fannie Mae, Pool #786281, 6.50%, 7/1/2034 | | | | | 48,682 | | | 50,176 |
Fannie Mae, Pool #786692, 6.50%, 8/1/2034 | | | | | 52,786 | | | 54,406 |
Fannie Mae, Pool #799657, 6.50%, 11/1/2034 | | | | | 337,277 | | | 347,628 |
Fannie Mae, Pool #812185, 4.50%, 2/1/2035 | | | | | 398,344 | | | 377,220 |
Fannie Mae, Pool #815409, 4.50%, 2/1/2035 | | | | | 208,898 | | | 197,820 |
Fannie Mae, Pool #815926, 4.50%, 4/1/2035 | | | | | 956,075 | | | 905,372 |
Fannie Mae, Pool #745147, 4.50%, 12/1/2035 | | | | | 17,062,213 | | | 16,157,377 |
Fannie Mae, Pool #745876, 6.50%, 9/1/2036 | | | | | 163,643 | | | 168,231 |
Fannie Mae, Pool #900357, 6.50%, 9/1/2036 | | | | | 811,695 | | | 834,457 |
Fannie Mae, Pool #902295, 6.50%, 11/1/2036 | | | | | 1,677,734 | | | 1,724,782 |
Fannie Mae, Pool #905210, 6.50%, 11/1/2036 | | | | | 1,622,603 | | | 1,668,105 |
Fannie Mae, Pool #920084, 6.50%, 11/1/2036 | | | | | 892,004 | | | 917,018 |
Fannie Mae, Pool #894774, 6.50%, 12/1/2036 | | | | | 855,605 | | | 879,598 |
Fannie Mae, Pool #902858, 6.50%, 12/1/2036 | | | | | 1,863,421 | | | 1,915,676 |
Fannie Mae, TBA7, 4.50%, 1/15/2038 | | | | | 9,342,000 | | | 8,839,867 |
Fannie Mae, TBA7, 6.00%, 1/15/2038 | | | | | 12,121,000 | | | 12,306,597 |
Federal Home Loan Mortgage Corp., Pool #M90974,
4.50%, 3/1/2010 | | | | | 459,207 | | | 457,244 |
Federal Home Loan Mortgage Corp., Pool #E00593,
5.50%, 11/1/2013 | | | | | 13,500 | | | 13,673 |
| | |
| 12 | | The accompanying notes are an integral part of the financial statements. |
Investment Portfolio - December 31, 2007
| | | | | | | | |
| | | | | Principal Amount | | Value
(Note 2) |
| | | | | | | | |
| | | |
U.S. GOVERNMENT AGENCIES (continued) | | | | | | | | |
Mortgage-Backed Securities (continued) | | | | | | | | |
Federal Home Loan Mortgage Corp., Pool #E91213,
5.50%, 9/1/2017 | | | | $ | 73,923 | | $ | 74,965 |
Federal Home Loan Mortgage Corp., Pool #E01488,
5.00%, 10/1/2018 | | | | | 13,286 | | | 13,318 |
Federal Home Loan Mortgage Corp., Pool #B11112,
5.50%, 11/1/2018 | | | | | 402,403 | | | 407,963 |
Federal Home Loan Mortgage Corp., Pool #B11862,
5.50%, 1/1/2019 | | | | | 198,552 | | | 201,295 |
Federal Home Loan Mortgage Corp., Pool #B16144,
5.50%, 8/1/2019 | | | | | 149,187 | | | 151,131 |
Federal Home Loan Mortgage Corp., Pool #B16835,
5.50%, 10/1/2019 | | | | | 901,223 | | | 912,963 |
Federal Home Loan Mortgage Corp., Pool #J02511,
5.00%, 9/1/2020 | | | | | 181,403 | | | 181,581 |
Federal Home Loan Mortgage Corp., Pool #J00774,
5.00%, 12/1/2020 | | | | | 69,121 | | | 69,188 |
Federal Home Loan Mortgage Corp., Pool #G11896,
4.50%, 1/1/2021 | | | | | 5,353,908 | | | 5,261,263 |
Federal Home Loan Mortgage Corp., Pool #G11981,
5.00%, 4/1/2021 | | | | | 70,490 | | | 70,566 |
Federal Home Loan Mortgage Corp., Pool #G18160,
5.00%, 11/1/2021 | | | | | 82,864 | | | 82,954 |
Federal Home Loan Mortgage Corp., Pool #G18156,
5.00%, 12/1/2021 | | | | | 3,354,440 | | | 3,358,075 |
Federal Home Loan Mortgage Corp., Pool #G12491,
5.00%, 1/1/2022 | | | | | 72,046 | | | 72,124 |
Federal Home Loan Mortgage Corp., Pool #J04222,
5.00%, 1/1/2022 | | | | | 875,861 | | | 876,824 |
Federal Home Loan Mortgage Corp., Pool #G18168,
5.00%, 2/1/2022 | | | | | 642,727 | | | 643,433 |
Federal Home Loan Mortgage Corp., Pool #G18182,
5.50%, 5/1/2022 | | | | | 3,959,680 | | | 4,007,340 |
Federal Home Loan Mortgage Corp., Pool #A22067,
6.50%, 5/1/2034 | | | | | 829,250 | | | 854,668 |
Federal Home Loan Mortgage Corp., Pool #A25775,
6.50%, 8/1/2034 | | | | | 610,018 | | | 628,717 |
Federal Home Loan Mortgage Corp., Pool #G01741,
6.50%, 10/1/2034 | | | | | 481,741 | | | 498,038 |
Federal Home Loan Mortgage Corp., Pool #G01782,
6.50%, 2/1/2035 | | | | | 393,393 | | | 406,193 |
Federal Home Loan Mortgage Corp., Pool #G08141,
6.50%, 7/1/2036 | | | | | 26,600 | | | 27,348 |
| | |
| The accompanying notes are an integral part of the financial statements. | | 13 |
Investment Portfolio - December 31, 2007
| | | | | | | | |
| | | | | Principal Amount | | Value
(Note 2) |
| | | | | | | | |
| | | |
U.S. GOVERNMENT AGENCIES (continued) | | | | | | | | |
Mortgage-Backed Securities (continued) | | | | | | | | |
Federal Home Loan Mortgage Corp., Pool #G02327, 6.50%, 8/1/2036 | | | | $ | 34,492 | | $ | 35,462 |
Federal Home Loan Mortgage Corp., Pool #A52364, 6.50%, 9/1/2036 | | | | | 11,377 | | | 11,696 |
Federal Home Loan Mortgage Corp., Pool #A52428, 6.50%, 9/1/2036 | | | | | 779,622 | | | 801,545 |
Federal Home Loan Mortgage Corp., Pool #A54391, 6.50%, 9/1/2036 | | | | | 15,261 | | | 15,690 |
Federal Home Loan Mortgage Corp., Pool #A61160, 6.50%, 9/1/2036 | | | | | 27,709 | | | 28,488 |
Federal Home Loan Mortgage Corp., Pool #A52716, 6.50%, 10/1/2036 | | | | | 5,131,414 | | | 5,275,705 |
Federal Home Loan Mortgage Corp., Pool #A52888, 6.50%, 10/1/2036 | | | | | 206,097 | | | 211,893 |
Federal Home Loan Mortgage Corp., Pool #G02433, 6.50%, 11/1/2036 | | | | | 817,042 | | | 840,016 |
Federal Home Loan Mortgage Corp., Pool #A55847, 6.50%, 12/1/2036 | | | | | 21,875 | | | 22,490 |
Federal Home Loan Mortgage Corp., TBA7,
4.50%, 1/15/2023 | | | | | 8,462,000 | | | 8,321,852 |
Federal Home Loan Mortgage Corp., TBA7,
5.00%, 1/15/2023 | | | | | 9,694,000 | | | 9,703,093 |
Federal Home Loan Mortgage Corp., TBA7,
5.50%, 1/15/2023 | | | | | 5,457,000 | | | 5,521,802 |
Federal Home Loan Mortgage Corp., TBA7,
5.00%, 1/15/2038 | | | | | 16,742,000 | | | 16,333,914 |
Federal Home Loan Mortgage Corp., TBA7,
5.50%, 1/15/2038 | | | | | 5,476,000 | | | 5,464,018 |
GNMA, Pool #487193, 5.00%, 4/15/2020 | | | | | 563,548 | | | 564,984 |
GNMA, Pool #563559, 6.50%, 4/15/2032 | | | | | 530,779 | | | 550,296 |
GNMA, Pool #552765, 6.50%, 9/15/2032 | | | | | 655,829 | | | 679,944 |
| | | | | | | | |
Total Mortgage-Backed Securities
(Identified Cost $133,877,841) | | | | | | | | 134,846,385 |
| | | | | | | | |
| | | |
Other Agencies - 3.22% | | | | | | | | |
Federal Home Loan Mortgage Corp., 6.25%, 7/15/2032
(Identified Cost $8,282,029) | | | | | 7,525,000 | | | 8,965,902 |
| | | | | | | | |
TOTAL U.S. GOVERNMENT AGENCIES
(Identified Cost $142,159,870) | | | | | | | | 143,812,287 |
| | | | | | | | |
| | |
| 14 | | The accompanying notes are an integral part of the financial statements. |
Investment Portfolio - December 31, 2007
| | | | | | | | | |
| | | | | Shares/
Principal
Amount | | Value
(Note 2) | |
| | | | | | | | | |
| | | |
SHORT-TERM INVESTMENTS - 27.09% | | | | | | | | | |
Dreyfus Treasury Cash Management - Institutional Shares | | | | | 4,612,395 | | $ | 4,612,395 | |
Fannie Mae Discount Note, 1/14/2008 | | | | $ | 39,000,000 | | | 38,935,995 | |
Fannie Mae Discount Note, 1/31/2008 | | | | | 15,000,000 | | | 14,944,588 | |
Fannie Mae Discount Note, 2/1/2008 | | | | | 17,000,000 | | | 16,936,684 | |
| | | | | | | | | |
TOTAL SHORT-TERM INVESTMENTS
(Identified Cost $75,438,001) | | | | | | | | 75,429,662 | |
| | | | | | | | | |
TOTAL INVESTMENTS - 122.89%
(Identified Cost $342,672,449) | | | | | | | | 342,241,787 | |
| | | |
LIABILITIES, LESS OTHER ASSETS - (22.89%) | | | | | | | | (63,747,451 | ) |
| | | | | | | | | |
NET ASSETS - 100% | | | | | | | $ | 278,494,336 | |
| | | | | | | | | |
Key:
G.O. Bond - General Obligation Bond
TBA - to be announced
1Credit ratings from Moody's (unaudited).
2Credit ratings from S&P (unaudited).
3Restricted securities - Investment in securities that are restricted as to public resale under the Securities Act of 1933, as amended. These securities amount to $10,619,047, or 3.8%, of the Series' net assets as of December 31, 2007 (see Note 2 to the financial statements).
4This security was acquired on April 13, 2007 at a cost of $1,000,000 ($100.00 per share) and has been determined to be illiquid under guidelines established by the Board of Directors (see Note 2 to the financial statements).
5These securities have been sold under rule 144A and have been determined to be liquid under guidelines established by the Board of Directors (see Note 2 to the financial statements).
6This security was acquired on February 28, 2007 at a cost of $1,000,000 ($100.00 per share) and has been determined to be illiquid under guidelines established by the Board of Directors (see Note 2 to the financial statements).
7Securities purchased on a forward commitment or when-issued basis (see Note 2 to the financial statements).
8The coupon rate is a floating rate and is subject to change quarterly. The coupon rate stated is the rate as of December 31, 2007.
| | |
| The accompanying notes are an integral part of the financial statements. | | 15 |
Statement of Assets and Liabilities
December 31, 2007
| | | | |
ASSETS: | | | | |
| | | | |
| |
Investments, at value (identified cost, $342,672,449) (Note 2) | | $ | 342,241,787 | |
Interest receivable | | | 2,439,652 | |
Receivable for fund shares sold | | | 226,169 | |
Dividends receivable | | | 35,057 | |
| | | | |
TOTAL ASSETS | | | 344,942,665 | |
| | | | |
| LIABILITIES: | | | | |
| |
Accrued management fees (Note 3) | | | 163,646 | |
Accrued fund accounting and transfer agent fees (Note 3) | | | 14,918 | |
Accrued Chief Compliance Officer service fees (Note 3) | | | 721 | |
Payable for purchases of delayed delivery securities (Note 2) | | | 66,188,374 | |
Payable for fund shares repurchased | | | 32,041 | |
Audit fees payable | | | 30,962 | |
Other payables and accrued expenses | | | 17,667 | |
| | | | |
TOTAL LIABILITIES | | | 66,448,329 | |
| | | | |
TOTAL NET ASSETS | | $ | 278,494,336 | |
| | | | |
NET ASSETS CONSIST OF: | | | | |
| |
Capital stock | | $ | 277,846 | |
Additional paid-in-capital | | | 277,905,853 | |
Undistributed net investment income | | | 160,737 | |
Accumulated net realized gain on investments, foreign currency and
other assets and liabilities | | | 574,940 | |
Net unrealized depreciation on investments and other assets and liabilities | | | (425,040 | ) |
| | | | |
TOTAL NET ASSETS | | $ | 278,494,336 | |
| | | | |
NET ASSET VALUE, OFFERING PRICE AND REDEMPTION PRICE PER SHARE ($278,494,336/27,784,633 shares) | | $ | 10.02 | |
| | | | |
| | |
| 16 | | The accompanying notes are an integral part of the financial statements. |
Statement of Operations
For the Year Ended December 31, 2007
| | | | |
INVESTMENT INCOME: | | | | |
| | | | |
| |
Interest | | $ | 12,325,792 | |
Dividends | | | 267,922 | |
| | | | |
Total Investment Income | | | 12,593,714 | |
| | | | |
| EXPENSES: | | | | |
| |
Management fees (Note 3) | | | 1,756,440 | |
Fund accounting and transfer agent fees (Note 3) | | | 165,447 | |
Directors' fees (Note 3) | | | 7,794 | |
Chief Compliance Officer service fees (Note 3) | | | 6,100 | |
Custodian fees | | | 24,151 | |
Miscellaneous | | | 84,777 | |
| | | | |
Total Expenses | | | 2,044,709 | |
| | | | |
NET INVESTMENT INCOME | | | 10,549,005 | |
| | | | |
| REALIZED AND UNREALIZED GAIN (LOSS) ON INVESTMENTS: | | | | |
| |
Net realized gain (loss) on - | | | | |
Investments | | | 757,704 | |
Foreign currency and other assets and liabilities | | | (38,836 | ) |
| | | | |
| | | 718,868 | |
| | | | |
| |
Net change in unrealized depreciation on - | | | | |
Investments | | | (71,768 | ) |
Foreign currency and other assets and liabilities | | | 4,355 | |
| | | | |
| | | (67,413 | ) |
| | | | |
| |
NET REALIZED AND UNREALIZED GAIN (LOSS) ON INVESTMENTS | | | 651,455 | |
| | | | |
NET INCREASE IN NET ASSETS RESULTING FROM OPERATIONS | | $ | 11,200,460 | |
| | | | |
| | |
| The accompanying notes are an integral part of the financial statements. | | 17 |
Statements of Changes in Net Assets
| | | | | | | | |
| | | For the
Year Ended
12/31/07 | | | For the
Year Ended
12/31/06 | |
| | | | | | | | |
| INCREASE (DECREASE) IN NET ASSETS: | | | | | | | | |
| | |
| OPERATIONS: | | | | | | | | |
| | |
Net investment income | | $ | 10,549,005 | | | $ | 7,885,174 | |
Net realized gain on investments and foreign currency | | | 718,868 | | | | 1,021,783 | |
Net change in unrealized depreciation on investments and foreign currency | | | (67,413 | ) | | | 296,345 | |
| | | | | | | | |
Net increase from operations | | | 11,200,460 | | | | 9,203,302 | |
| | | | | | | | |
| DISTRIBUTIONS TO SHAREHOLDERS (Note 8): | | | | | | | | |
| | |
From net investment income | | | (10,349,432 | ) | | | (7,841,271 | ) |
| | | | | | | | |
| CAPITAL STOCK ISSUED AND REPURCHASED: | | | | | | | | |
| | |
Net increase from capital share transactions (Note 5) | | | 53,498,514 | | | | 47,188,672 | |
| | | | | | | | |
Net increase in net assets | | | 54,349,542 | | | | 48,550,703 | |
| | |
| NET ASSETS: | | | | | | | | |
| | |
Beginning of year | | | 224,144,794 | | | | 175,594,091 | |
| | | | | | | | |
End of year (including undistributed net
investment income of $160,737 and $0, respectively) | | $ | 278,494,336 | | | $ | 224,144,794 | |
| | | | | | | | |
| | |
| 18 | | The accompanying notes are an integral part of the financial statements. |
Financial Highlights
| | | | | | |
| | | For the
Year Ended 12/31/07 | | For the
Year Ended 12/31/06 | | For the Period
4/21/051 to
12/31/05 |
| | | | |
| | | | | | |
| | | | | | |
| Per share data (for a share outstanding throughout each period): | | | | | | |
Net asset value - Beginning of period | | $9.98 | | $9.89 | | $10.00 |
| | | | | | |
Income (loss) from investment operations: | | | | | | |
Net investment income | | 0.40 | | 0.37 | | 0.22 |
Net realized and unrealized gain (loss) on investments | | 0.03 | | 0.08 | | (0.12) |
| | | | | | |
Total from investment operations | | 0.43 | | 0.45 | | 0.10 |
| | | | | | |
Less distributions to shareholders: | | | | | | |
From net investment income | | (0.39) | | (0.36) | | (0.21) |
| | | | | | |
Net asset value - End of period | | $10.02 | | $9.98 | | $9.89 |
| | | | | | |
Total return2 | | 4.34% | | 4.59% | | 1.04% |
| Ratios (to average net assets)/Supplemental Data: | | | | | | |
Expenses | | 0.81% | | 0.83% | | 0.88%3 |
Net investment income | | 4.20% | | 3.95% | | 3.12%3 |
Portfolio turnover | | 341% | | 315% | | 290% |
Net assets - End of period (000's omitted) | | $278,494 | | $224,145 | | $175,594 |
| | | | | | |
1Commencement of operations.
2Represents aggregate total return for the period indicated, and assumes reinvestment of all distributions. Periods less than one year are not annualized.
3Annualized.
| | |
| The accompanying notes are an integral part of the financial statements. | | 19 |
Notes to Financial Statements
Core Plus Bond Series (the “Series”) is a no-load non-diversified series of Manning & Napier Fund, Inc. (the “Fund”). The Fund is organized in Maryland and is registered under the Investment Company Act of 1940, as amended, as an open-end management investment company.
The Series’ investment objective is to provide long-term total return by investing primarily in bonds and other financial instruments, including derivatives, with economic characteristics similar to bonds.
The Fund’s Advisor is Manning & Napier Advisors, Inc. (the “Advisor”). Shares of the Series are offered to investors, clients and employees of the Advisor and its affiliates. The total authorized capital stock of the Fund consists of 5.0 billion shares of common stock each having a par value of $0.01. As of December 31, 2007, 3.33 billion shares have been designated in total among 27 series, of which 125 million have been designated as Core Plus Bond Series Class A common stock.
| 2. | SIGNIFICANT ACCOUNTING POLICIES |
Security Valuation
Debt securities, including government bonds, foreign bonds, asset-backed securities, structured notes, supranational obligations, sovereign bonds, corporate bonds and mortgage-backed securities will normally be valued on the basis of evaluated bid prices provided by an independent pricing service. Certain investments in securities held by the Series were valued on a basis of a price provided by a principal market maker. These prices may differ from the value that would have been used had a broader market for securities existed.
Municipal securities will normally be valued on the basis of market valuations provided by an independent pricing service that utilizes the latest price quotations and a matrix system (which considers such factors as security prices of similar securities, yields, maturities and ratings).
Securities for which representative valuations or prices are not available from the Fund’s pricing service may be valued at fair value. Due to the inherent uncertainty of valuations of such securities, the fair value may differ significantly from the values that would have been used had a ready market for such securities existed. If trading or events occurring after the close of the principal market in which securities are traded are expected to materially affect the value of those securities, then they may be valued at their fair value, taking this trading or these events into account. Fair value is determined in good faith by the Advisor under procedures approved by and under the general supervision and responsibility of the Fund’s Board of Directors (the “Board”).
Short-term investments that mature in sixty days or less are valued at amortized cost, which approximates market value. Investments in open-end investment companies are valued at their net asset value per share on valuation date.
Security Transactions, Investment Income and Expenses
Security transactions are accounted for on trade date. Interest income, including amortization of premium and accretion of discounts using the effective interest method, is earned from settlement date and accrued daily. Dividend income is recorded on the ex-dividend date. Non-cash dividends, if any, are recorded at the fair market value of the securities received.
Notes to Financial Statements
| 2. | SIGNIFICANT ACCOUNTING POLICIES (continued) |
Security Transactions, Investment Income and Expenses (continued)
Expenses are recorded on an accrual basis. Most expenses of the Fund can be attributed to a specific series. Expenses which cannot be directly attributed are apportioned among the series in the Fund in such a manner as deemed equitable by the Fund’s Board, taking into consideration, among other things, the nature and type of expense.
The Series uses the identified cost method for determining realized gain or loss on investments for both financial statement and federal income tax reporting purposes.
Foreign Currency Translation
The books and records of the Series are maintained in U.S. dollars. Foreign currencies, investments and other assets and liabilities are translated into U.S. dollars at the current exchange rates. Purchases and sales of investment securities and income and expenses are translated on the respective dates of such transactions. The Series does not isolate realized and unrealized gains and losses attributable to changes in the exchange rates from gains and losses that arise from changes in the market value of investments. Such fluctuations are included with net realized and unrealized gain or loss on investments. Net realized foreign currency gains and losses represent foreign currency gains and losses between trade date and settlement date on securities transactions, gains and losses on disposition of foreign currencies and the difference between the amount of income and foreign withholding taxes recorded on the books of the Series and the amounts actually received or paid.
Securities Purchased on a When-Issued Basis or Forward Commitment
The Series may purchase securities on a when-issued basis or forward commitment. These transactions involve a commitment by the Series to purchase securities for a predetermined price with payment and delivery taking place beyond the customary settlement period. When such purchases are outstanding, the Series will designate liquid assets in an amount sufficient to meet the purchase price. When purchasing a security on a delayed delivery basis, the Series assumes the rights and risks of ownership of the security, including the risk of price and yield fluctuations, and takes such fluctuations into account when determining its net asset value. The Series may sell the when-issued securities before they are delivered, which may result in a capital gain or loss.
In connection with its ability to purchase or sell securities on a forward commitment basis, the Series may enter into forward roll transactions principally using To Be Announced (TBA) securities. Forward roll transactions require the sale of securities for delivery in the current month, and a simultaneous agreement to repurchase substantially similar (same type, coupon and maturity) securities on a specified future date. Risks of entering into forward roll transactions include the potential inability of the counterparty to meet the terms of the agreement; the potential of the Series to receive inferior securities at redelivery as compared to the securities sold to the counterparty; counterparty credit risk; and the potential pay down speed variance between the mortgage-backed pools. During the roll period, the Series forgoes principal and interest paid on the securities. The Series accounts for such dollar rolls as purchases and sales. The Series had TBA dollar rolls outstanding as of December 31, 2007, which are included in Payable for Purchases of Delayed Delivery Securities on the Statement of Assets and Liabilities.
Restricted Securities
Restricted securities are purchased in private placement transactions, are not registered under the Securities Act of 1933, as amended, and may have contractual restrictions on resale. Information regarding restricted securities is included at the end of the Series’ Investment Portfolio.
Notes to Financial Statements
| 2. | SIGNIFICANT ACCOUNTING POLICIES (continued) |
Illiquid Securities
A security may be considered illiquid if so deemed in good faith by the Advisor under procedures approved by and under the general supervision and responsibility of the Fund’s Board. Securities that are illiquid are marked with the applicable footnote on the Investment Portfolio. As of December 31, 2007, the aggregate value of securities deemed illiquid was $1,881,900, representing 0.7% of the Series’ net assets.
Federal Taxes
The Series’ policy is to comply with the provisions of the Internal Revenue Code applicable to regulated investment companies. The Series is not subject to federal income tax or excise tax to the extent that the Series distributes to shareholders each year its taxable income, including any net realized gains on investments, in accordance with requirements of the Internal Revenue Code. Accordingly, no provision for federal income tax or excise tax has been made in the financial statements.
On June 29, 2007, the Series adopted Financial Accounting Standards Board Interpretation No. 48 - Accounting for Uncertainty in Income Taxes (“FIN 48”). FIN 48 prescribes the minimum recognition threshold a tax position must meet in connection with accounting for uncertainties in income tax positions taken or expected to be taken by an entity before being measured and recognized in the financial statements. Management has determined that FIN 48 did not have a material impact on the Series’ financial statements. The Series files income tax returns in the U.S. federal jurisdiction, various states and foreign jurisdictions, as required. No income tax returns are currently under investigation. The statute of limitations on the Series’ tax returns remains open for the years ended December 31, 2005 through December 31, 2007.
Additionally, based on the Fund’s understanding of the tax rules and rates related to income, gains and transactions for foreign jurisdictions in which it invests, the Series will provide for foreign taxes, and where appropriate, deferred foreign tax.
Distributions of Income and Gains
Distributions to shareholders of net investment income and net realized gains are made annually. An additional distribution may be necessary to avoid taxation of the Series. Distributions are recorded on the ex-dividend date.
Indemnifications
The Fund’s organizational documents provide former and current directors and officers with a limited indemnification against liabilities arising in connection with the performance of their duties to the Fund. In the normal course of business, the Fund may also enter into contracts that provide general indemnifications. The Fund’s maximum exposure under these arrangements is unknown as this would be dependent on future claims that may be made against the Fund. The risk of material loss from such claims is considered remote.
Other
The preparation of financial statements in conformity with accounting principles generally accepted in the United States of America requires management to make estimates and assumptions that affect the reported amounts of assets and liabilities and the disclosure of contingent assets and liabilities at the date of the financial statements and the reported amounts of income and expenses during the reporting period. Actual results could differ from those estimates.
Notes to Financial Statements
| 3. | TRANSACTIONS WITH AFFILIATES |
The Fund has an Investment Advisory Agreement (the “Agreement”) with the Advisor, for which the Series pays a fee, computed daily and payable monthly, at an annual rate of 0.70% of the Series’ average daily net assets.
Under the Agreement, personnel of the Advisor provide the Series with advice and assistance in the choice of investments and the execution of securities transactions, and otherwise maintain the Series’ organization. The Advisor also provides the Fund with necessary office space and fund administration and support services. The salaries of all officers of the Fund (except a percentage of the Fund’s Chief Compliance Officer’s salary, which is paid by the Fund), and of all Directors who are “affiliated persons” of the Fund, or of the Advisor, and all personnel of the Fund, or of the Advisor, performing services relating to research, statistical and investment activities, are paid by the Advisor. Each “non-affiliated” Director receives an annual stipend, which is allocated among all the active series of the Fund. In addition, these Directors also receive a fee per Board meeting attended for each active series of the Fund plus a fee for each committee meeting attended.
The Advisor has contractually agreed, until at least April 30, 2009, to waive its fee and, if necessary, pay other operating expenses of the Series in order to maintain total direct annual fund operating expenses for the Series at no more than 0.90% of average daily net assets each year. For the year ended December 31, 2007, the Advisor did not waive its management fee or reimburse any expenses of the Series. The Advisor is not eligible to recoup any expenses that have been waived or reimbursed in prior years.
Manning & Napier Investor Services, Inc., a registered broker-dealer affiliate of the Advisor, acts as distributor for the Fund’s shares. The services of Manning & Napier Investor Services, Inc. are provided at no additional cost to the Series.
For fund accounting and transfer agent services, the Fund pays the Advisor an annual fee of 0.11% of the Fund’s average daily net assets up to $900 million, 0.07% of the Fund’s average daily net assets between $900 million and $1.5 billion, and 0.04% of the Fund’s average daily net assets over $1.5 billion. Additionally, certain transaction and account-based fees and out-of-pocket expenses, including charges for reporting relating to the Fund’s compliance program, are charged. Expenses not directly attributable to a series are allocated based on each series’ relative net assets or number of accounts, depending on the expense. The Advisor has an agreement with Citi Fund Services Ohio, Inc. (“Citi”) (formerly BISYS Fund Services Ohio, Inc.) under which Citi serves as sub-accountant and sub-transfer agent.
| 4. | PURCHASES AND SALES OF SECURITIES |
For the year ended December 31, 2007, purchases and sales of securities, other than United States Government securities and short-term securities, were $94,344,656 and $51,976,893, respectively. Purchases and sales of United States Government securities, other than short-term securities, were $777,864,357 and $756,239,463, respectively.
Notes to Financial Statements
| 5. | CAPITAL STOCK TRANSACTIONS |
Transactions in shares of Core Plus Bond Series were:
| | | | | | | | | | | | | | |
| | | For the Year
Ended 12/31/07 | | | For the Year
Ended 12/31/06 | |
| | | Shares | | | Amount | | | Shares | | | Amount | |
| | | | | | | | | | | | | | |
Sold | | 4,853,349 | | | $ | 49,066,123 | | | 4,918,606 | | | $ | 49,160,159 | |
Reinvested | | 1,024,246 | | | | 10,150,276 | | | 767,956 | | | | 7,681,140 | |
Repurchased | | (563,255 | ) | | | (5,717,885 | ) | | (968,235 | ) | | | (9,652,627 | ) |
| | | | | | | | | | | | | | |
Total | | 5,314,340 | | | $ | 53,498,514 | | | 4,718,327 | | | $ | 47,188,672 | |
| | | | | | | | | | | | | | |
Substantially all of the Series’ shares represent investments by fiduciary accounts over which the Advisor has sole investment discretion.
The Series may trade in financial instruments with off-balance sheet risk in the normal course of its investing activities to assist in managing exposure to various market risks. These financial instruments include written options, forward foreign currency exchange contracts and futures contracts and may involve, to a varying degree, elements of risk in excess of the amounts recognized for financial statement purposes. No such investments were held by the Series on December 31, 2007.
Investing in securities of foreign companies and foreign governments involves special risks and considerations not typically associated with investing in securities of domestic companies and the United States Government. These risks include revaluation of currencies and future adverse political and economic developments. Moreover, securities of foreign companies and foreign governments and their markets may be less liquid and their prices more volatile than those of comparable domestic companies and the United States Government.
| 8. | FEDERAL INCOME TAX INFORMATION |
The amount and characterization of certain income and capital gains to be distributed are determined in accordance with federal income tax regulations, which may differ from accounting principles generally accepted in the United States of America. These differences are primarily due to differing book and tax treatments in the timing of the recognition of net investment income or gains and losses, including foreign currency gains and losses and Post-October losses. The Series may periodically make reclassifications among its capital accounts to reflect income and gains available for distribution (or available capital loss carryovers) under income tax regulations, without impacting the Series’ net asset value. Any such reclassifications are not reflected in the financial highlights.
The tax character of distributions paid were as follows:
| | | | | | |
| | | For the Year
Ended 12/31/07 | | For the Year
Ended 12/31/06 |
Ordinary income | | $ | 10,349,432 | | $ | 7,841,271 |
Notes to Financial Statements
| 8. | FEDERAL INCOME TAX INFORMATION (continued) |
At December 31, 2007, the tax basis components of distributable earnings and the net unrealized depreciation based on identified cost for federal income tax purposes were as follows:
| | | | |
Cost for federal income tax purposes | | $ | 342,672,449 | |
| |
Unrealized appreciation | | $ | 3,287,366 | |
Unrealized depreciation | | | (3,718,028 | ) |
| | | | |
Net unrealized depreciation | | $ | (430,662 | ) |
Undistributed ordinary income | | | 160,737 | |
Undistributed long-term capital gains | | | 574,940 | |
| 9. | RECENT ACCOUNTING PRONOUNCEMENTS |
In September 2006, FASB Statement of Financial Accounting Standards No. 157, Fair Value Measurements (“FAS 157”) was issued, and is effective for fiscal years beginning after November 15, 2007. FAS 157 defines fair value, establishes a framework for measuring fair value, and expands disclosure about fair value measurements. The standard does not expand the use of fair value in any new circumstances, but provides clarification on acceptable fair value methods and applications. At this time, management is evaluating the implications of FAS 157, but it is not expected to materially impact the Series’ financial statements.
Report of Independent Registered Public Accounting Firm
To the Board of Directors of Manning & Napier Fund, Inc. and Shareholders of Core Plus Bond Series:
In our opinion, the accompanying statement of assets and liabilities, including the investment portfolio, and the related statements of operations and of changes in net assets and the financial highlights present fairly, in all material respects, the financial position of the Core Plus Bond Series (a series of Manning & Napier Fund, Inc., hereafter referred to as the "Series") at December 31, 2007, and the results of its operations for the year then ended, the changes in its net assets for each of the two years in the period then ended and the financial highlights for each of the periods indicated, in conformity with accounting principles generally accepted in the United States of America. These financial statements and financial highlights (hereafter referred to as "financial statements") are the responsibility of the Series’ management; our responsibility is to express an opinion on these financial statements based on our audits. We conducted our audits of these financial statements in accordance with the standards of the Public Company Accounting Oversight Board (United States). Those standards require that we plan and perform the audit to obtain reasonable assurance about whether the financial statements are free of material misstatement. An audit includes examining, on a test basis, evidence supporting the amounts and disclosures in the financial statements, assessing the accounting principles used and significant estimates made by management, and evaluating the overall financial statement presentation. We believe that our audits, which included confirmation of securities at December 31, 2007 by correspondence with the custodian and brokers, provide a reasonable basis for our opinion.

Columbus, Ohio
February 20, 2008
Renewal of Investment Advisory Agreements (unaudited)
During the period covered by this shareholder report, the Board of Directors (the “Board”) of Manning & Napier Fund, Inc. (the “Fund”) considered approval of two separate investment advisory agreements with Manning & Napier Advisors, Inc. (the “Advisor”):
| | • | | At a meeting held on August 30, 2007, the Board approved a new investment advisory agreement between the Fund and the Advisor (the “New Investment Advisory Agreement”) and recommended that the New Investment Advisory Agreement be submitted to shareholders for approval. Shareholders approved the New Investment Advisory Agreement at a meeting held on December 17, 2007. |
| | • | | At a meeting held on November 12, 2007, the Board approved the continuation of the then-current investment advisory agreement between the Fund and the Advisor (the “Current Investment Advisory Agreement”), which was to be superseded by the New Investment Advisory Agreement upon its approval by the Fund’s shareholders. The continuation of the Current Investment Advisory Agreement was necessary as a result of the delay in obtaining the number of votes necessary to convene the shareholder meeting and approve the New Investment Advisory Agreement with respect to all investment portfolios of the Fund (the “Series”). |
Consideration of New Investment Advisory Agreement:
In response to recent regulatory and compliance initiatives promulgated by the SEC over the past year, the Fund engaged in a comprehensive review of all material aspects of the Fund’s operations, including the Fund’s Current Investment Advisory Agreement. As a result of its review, the Board determined that the Current Investment Advisory Agreement should be amended for the purpose of modernizing the form of the agreement and to include additional provisions in the agreement that are customarily included in investment advisory agreements between registered investment companies and their investment advisors, but which are not included in the Current Investment Advisory Agreement. Accordingly, at the Board meeting on November 16, 2006, representatives of the Advisor presented to the Board proposed changes to the Current Investment Advisory Agreement in order to address the Board’s request to update and modernize the Current Investment Advisory Agreement. As a result of the discussions between the Board and representatives of the Advisor at the November 2006 Board meeting, the Board determined to formally consider the approval of a new investment advisory agreement between the Fund and the Advisor, which would incorporate the changes proposed at the November 2006 Board meeting, at its in-person Board meeting in August 2007.
At an in-person meeting held on August 30, 2007, the Board considered the approval of the New Investment Advisory Agreement between the Fund and the Advisor. Based on the information it received at the meeting and the November 16, 2006 Board meeting, the Board approved the New Investment Advisory Agreement subject to its further approval by the Fund’s shareholders. Representatives of the Advisor attended the meeting and presented additional oral and written information to the Board to assist the Board in its considerations. At the meeting, the Board concluded it was reasonable to take into account the conclusions the Board made when considering and evaluating the renewal of the Current Investment Advisory Agreement (the “2006 Annual Review”), which occurred at the November 16, 2006 in-person Board meeting, as part of its considerations to approve the New Investment Advisory Agreement. The discussion immediately below outlines the materials and information presented to the Board in connection with the Board’s 2006 Annual Review of the Current Investment Advisory Agreement and the conclusions made by the Directors when determining to continue the Current Investment Advisory Agreement for an additional one-year period.
Renewal of Investment Advisory Agreements (unaudited)
In connection with its review and deliberations, the Board considered the following factors and reached a conclusion with respect to such factors.
| | • | | The Board considered the services provided by the Advisor under the Current Investment Advisory Agreement including, among others: deciding what securities to purchase and sell for each Series; arranging for the purchase and sale of such securities by placing orders with broker-dealers; administering the affairs of the Fund (including the books and records of the Fund not maintained by third party service providers such as the custodian or sub-transfer agent); arranging for the insurance coverage for the Fund; and supervising the preparation of tax returns, SEC filings (including registration statements) and reports to shareholders for the Fund. The Board also considered the nature and quality of such services provided under the Current Investment Advisory Agreement in light of the Advisor’s services provided to the Fund for 21 years. The Board discussed the quality of these services with representatives from the Advisor and concluded that the Advisor was performing its services to the Fund required under the Current Investment Advisory Agreement in a reasonable manner. |
| | • | | The Board considered the investment performance of the various Series of the Fund. The investment performance for each Series was reviewed on a cumulative basis since inception and on a one year basis. In addition, annualized performance for the following time periods was considered: inception, three year, five year, ten year, and current market cycle. A market cycle includes periods of both rising and falling markets. Returns for established benchmark indices for each Series were provided for each time period. The Board noted that all the Series were competitive against their respective benchmark indices over all time periods noted above through September 30, 2006. In addition, the Board considered at the meeting (and considers on a quarterly basis) a peer group performance analysis consisting of Morningstar universes of mutual funds with similar investment objectives. The Board discussed the performance with representatives from the Advisor and concluded that the investment performance of each of the Fund’s Series was reasonable based on the Fund’s actual performance and comparative performance, especially performance over the current market cycle. |
| | • | | The Board considered the costs of the Advisor’s services and the profits of the Advisor as they relate to the Advisor’s services to the Fund under the Current Investment Advisory Agreement. In reviewing the Advisor’s costs and profits, the Board discussed the Advisor’s revenues generated from the Fund (on both an actual and adjusted basis) and its expenses associated with providing the services under the Current Investment Advisory Agreement. In addition, the Board reviewed the Advisor’s expenses associated with Fund activities outside of the Current Investment Advisory Agreement (such as expense reimbursements pursuant to expense caps and payments made by the Advisor to third party platforms on which shares of the Fund are available for purchase). It was noted by representatives of the Advisor that 6 of the 18 active Series of the Fund are currently experiencing expenses above the capped expense ratios. After discussing the above costs and profits, the Board concluded that the Advisor’s profitability relating to its services provided under the Current Investment Advisory Agreement was reasonable. |
| | • | | The Board considered the fees and expenses of the various Series of the Fund. The Advisor presented the advisory fees and total expenses for each Series, including the |
Renewal of Investment Advisory Agreements (unaudited)
| | advisory fee adjusted for any expense waivers or reimbursements (either contractual or voluntary) paid by the Advisor. The advisory fees and expense ratios of each Series were compared to an average (on both a mean and median basis) of similar funds as disclosed on the Morningstar database. Representatives of the Advisor discussed with the Board the levels of its advisory fee for each Series of the Fund and as compared to the median and mean advisory fees for similar funds as listed on Morningstar. Expense ratios for every Series, except the High Yield Bond Series, are currently below the median and mean for similar funds as listed on Morningstar. Based on their review of the information provided, the Board concluded that the fees and expenses of each Series of the Fund were reasonable on a comparative basis. |
| | • | | The Board also considered the other benefits the Advisor derives from its relationship with the Fund. Such other benefits include certain research products provided by soft dollars. Given the level of soft dollar transactions involving the Fund, the Board concluded that these additional benefits to the Advisor were reasonable. |
| | • | | In addition to the factors described above, the Board considered the Advisor’s personnel, investment strategies, policies and procedures relating to compliance with personal securities transactions, and reputation, expertise and resources in domestic and foreign financial markets. The Board concluded that these factors support the conclusion that the Advisor performs its services in a reasonable manner. |
| | • | | The Board did not consider economies of scale at this time because of the multiple uses of the Fund (for the Advisor’s discretionary investment account clients in addition to direct investors), the current profitability of the Advisor’s services to the Fund under the Current Investment Advisory Agreement, and the overall size of the Fund complex. |
Based on the Board’s deliberations and their evaluation of the information described above, the Board, including a majority of Directors that are “not interested” as defined in the Investment Company Act of 1940 (the “1940 Act”), concluded that the compensation under the Current Investment Advisory Agreement was fair and reasonable in light of the services and expenses and such other matters as the Directors considered to be relevant in the exercise of their reasonable judgment. Accordingly, the Board approved the renewal of the Current Investment Advisory Agreement for another year. In the course of their deliberations, the Directors did not identify any particular information that was all important or controlling.
As stated above, at the August 30, 2007 Board meeting, the Board concluded it was reasonable to take into account the conclusions set forth above when determining whether to approve the New Investment Advisory Agreement. The Board’s conclusion in this regard was based on the fact that the New Investment Advisory Agreement is identical to the Current Investment Advisory Agreement except for certain provisions of the Agreement which have been updated and modernized in response to the Board’s specific request. Further, the Board’s conclusion in this regard was based on the fact that the New Investment Advisory Agreement does not change either the investment advisory fees payable by the Fund to the Advisor or the day-to-day investment management services the Advisor provides to the Fund.
In addition to the conclusions formed with respect to the 2006 Annual Review, the Directors considered specific information at the August 30, 2007 Board meeting concerning the additional provisions included in the New Investment Advisory Agreement. The Directors considered the fact that these additional provisions are designed to (i) address and memorialize certain standard practices and regulatory requirements of mutual funds and their investment advisors; (ii) further
Renewal of Investment Advisory Agreements (unaudited)
delineate the duties and obligations of the Fund and the Advisor; (iii) modernize the agreement to reflect current industry practice and applicable law; and (iv) generally improve the overall quality of the agreement. The Board further considered the fact that the New Investment Advisory Agreement does not alter the actual day-to-day investment management services provided by the Advisor to each Series of the Fund, and the investment advisory fee rate paid to the Advisor under the New Investment Advisory Agreement for a Series is the same as the fee rate paid by the Series under the Current Investment Advisory Agreement.
Based on its evaluation of the information and the conclusions with respect thereto at its meetings on November 16, 2006 and August 30, 2007, the Board unanimously concluded that: (a) the terms of the New Investment Advisory Agreement were fair and reasonable; (b) the approval of the New Investment Advisory Agreement would be in the best interests of the shareholders and the Fund; and (c) it would recommend the approval of the New Investment Advisory Agreement to shareholders. In the course of their deliberations, the Board did not identify any particular information or factor that was all-important or controlling.
Consideration of Current Investment Advisory Agreement
At a meeting held on November 12, 2007, the Board considered the continuation of the Current Investment Advisory Agreement and simultaneously conducted its annual review of the services provided to the Fund by the Adviser (the “2007 Annual Review”). Representatives of the Advisor attended the meeting and presented additional oral and written information to the Board to assist the Board in its considerations. The discussion immediately below outlines the materials and information presented to the Board in connection with the Board’s 2007 Annual Review of the Current Investment Advisory Agreement and the conclusions made by the Directors when determining to continue the Current Investment Advisory Agreement.
In connection with its review and deliberations, the Board considered the following factors and reached a conclusion with respect to such factors.
| | • | | The Board considered the services provided by the Advisor under the Current Investment Advisory Agreement including, among others: deciding what securities to purchase and sell for each Series; arranging for the purchase and sale of such securities by placing orders with broker-dealers; administering the affairs of the Fund (including the books and records of the Fund not maintained by third party service providers such as the custodian or sub-transfer agent); arranging for the insurance coverage for the Fund; and supervising the preparation of tax returns, SEC filings (including registration statements) and reports to shareholders for the Fund. The Board also considered the nature and quality of such services provided under the Current Investment Advisory Agreement in light of the Advisor’s services provided to the Fund for 21 years. The Board discussed the quality of these services with representatives from the Advisor and concluded that the Advisor was performing its services to the Fund required under the Current Investment Advisory Agreement in a reasonable manner. |
| | • | | The Board considered the investment performance of the various Series of the Fund. The investment performance for each Series was reviewed on a cumulative basis since inception and on a one year basis. In addition, annualized performance for the following time periods was considered: inception, three year, five year, ten year, and current market cycle. A market cycle includes periods of both rising and falling markets. Returns for established benchmark indices for each Series were provided for |
Renewal of Investment Advisory Agreements (unaudited)
| | each time period. The Board noted that all the Series were competitive against their respective benchmark indices over all time periods noted above through September 30, 2007. In addition, the Board considered at the meeting (and considers on a quarterly basis) a peer group performance analysis consisting of Morningstar universes of mutual funds with similar investment objectives. The Board discussed the performance with representatives from the Advisor and concluded that the investment performance of each of the Fund’s Series was reasonable based on the Fund’s actual performance and comparative performance, especially performance over the current market cycle. |
| | • | | The Board considered the costs of the Advisor’s services and the profits of the Advisor as they relate to the Advisor’s services to the Fund under the Current Investment Advisory Agreement. In reviewing the Advisor’s costs and profits, the Board discussed the Advisor’s revenues generated from the Fund (on both an actual and adjusted basis) and its expenses associated with providing the services under the Current Investment Advisory Agreement. In addition, the Board reviewed the Advisor’s expenses associated with Fund activities outside of the Current Investment Advisory Agreement (such as expense reimbursements pursuant to expense caps and payments made by the Advisor to third party platforms on which shares of the Fund are available for purchase). It was noted by representatives of the Advisor that 4 of the 18 active Series of the Fund are currently experiencing expenses above the capped expense ratios. After discussing the above costs and profits, the Board concluded that the Advisor’s profitability relating to its services provided under the Current Investment Advisory Agreement was reasonable. |
| | • | | The Board considered the fees and expenses of the various Series of the Fund. The Advisor presented the advisory fees and total expenses for each Series, including the advisory fee adjusted for any expense waivers or reimbursements (either contractual or voluntary) paid by the Advisor. The advisory fees and expense ratios of each Series were compared to an average (on both a mean and median basis) of similar funds as disclosed on the Morningstar database. Representatives of the Advisor discussed with the Board the levels of its advisory fee for each Series of the Fund and as compared to the median and mean advisory fees for similar funds as listed on Morningstar. Expense ratios for every Series, except the High Yield Bond Series and Global Fixed Income Series, are currently below the median and mean for similar funds as listed on Morningstar. Based on their review of the information provided, the Board concluded that the fees and expenses of each Series of the Fund were reasonable on a comparative basis. |
| | • | | The Board also considered the other benefits the Advisor derives from its relationship with the Fund. Such other benefits include certain research products provided by soft dollars. Given the level of soft dollar transactions involving the Fund, the Board concluded that these additional benefits to the Advisor were reasonable. |
| | • | | In addition to the factors described above, the Board considered the Advisor’s personnel, investment strategies, policies and procedures relating to compliance with personal securities transactions, and reputation, expertise and resources in domestic and foreign financial markets. The Board concluded that these factors support the conclusion that the Advisor performs its services in a reasonable manner. |
Renewal of Investment Advisory Agreements (unaudited)
| | • | | The Board did not consider economies of scale at this time because of the multiple uses of the Fund (for the Advisor’s discretionary investment account clients in addition to direct investors), the current profitability of the Advisor’s services to the Fund under the Current Investment Advisory Agreement, and the overall size of the Fund complex. |
Based on the Board’s deliberations and their evaluation of the information described above, the Board, including a majority of Directors that are not “interested persons” as defined in the 1940 Act, concluded that the compensation under the Current Investment Advisory Agreement was fair and reasonable in light of the services and expenses and such other matters as the Directors considered to be relevant in the exercise of their reasonable judgment. Accordingly, the Board approved the renewal of the Current Investment Advisory Agreement. In the course of their deliberations, the Directors did not identify any particular information that was all important or controlling.
Proxy Voting Results (unaudited)
A special meeting of the shareholders of Manning & Napier Fund, Inc. was held on November 12, 2007. The number of votes necessary to conduct the meeting and approve each proposal was obtained, and the results of the votes of shareholders on proposals before them are listed below:
PROPOSAL 1:
Election of Directors.
| | | | |
| | | Number of Shares
voted for | | Number of Shares
withheld |
B. Reuben Auspitz | | 215,932,354.541 | | 15,898,685.154 |
Stephen B. Ashley | | 215,960,751.214 | | 15,870,288.481 |
Peter L. Faber | | 217,504,725.208 | | 14,326,314.487 |
Harris H. Rusitzky | | 215,924,013.609 | | 15,907,026.086 |
PROPOSAL 2:
To approve the investment advisory agreement between Manning & Napier Advisors, Inc. and Manning & Napier Fund, Inc.
| | |
| | | Number of
shares voted |
For | | 21,452,752.490 |
Against | | 0 |
Abstain (includes broker non-votes) | | 0 |
PROPOSAL 3:
Eliminating, amending, or reclassifying certain fundamental investment policies or restrictions.
Proposal 3.A.i. To approve changes to the fundamental policy regarding borrowing money.
| | |
| | | Number of
shares voted |
For | | 21,452,752.490 |
Against | | 0 |
Abstain (includes broker non-votes) | | 0 |
Proposal 3.A.v. To approve changes to the fundamental policy regarding buying or selling of commodities or commodity contracts.
| | |
| | | Number of
shares voted |
For | | 21,452,752.490 |
Against | | 0 |
Abstain (includes broker non-votes) | | 0 |
Directors’ and Officers’ Information (unaudited)
The Statement of Additional Information provides additional information about the Fund's directors and officers and can be obtained without charge by calling 1-800-466-3863, at www.manningnapieradvisors.com, or on the EDGAR Database on the SEC Internet web site (http://www.sec.gov). The following chart shows certain information about the Fund's officers and directors, including their principal occupations during the last five years. Unless specific dates are provided, the individuals have held the listed positions for longer than five years.
| | |
| INTERESTED DIRECTOR/OFFICER | | |
| |
| Name: | | B. Reuben Auspitz* |
| Address: | | 290 Woodcliff Drive |
| | Fairport, NY 14450 |
| Age: | | 60 |
| Current Position(s) Held with Fund: | | Principal Executive Officer, President, Chairman & Director |
| Term of Office1 & Length of Time Served: | | Indefinite - Director since 1984; Vice President 1984 - 2003; President since 2004; Principal Executive Officer since 2002 |
| Principal Occupation(s) During Past 5 Years: | | Executive Vice President; Co-Executive Director; Executive Group Member**; Chief Compliance Officer since 2004 - Manning & Napier Advisors, Inc. President; Director - Manning & Napier Investor Services, Inc. Holds or has held one or more of the following titles for various subsidiaries and affiliates: President, Vice President, Director, Chairman, Treasurer, Chief Compliance Officer or Member. |
| Number of Portfolios Overseen within Fund Complex: | | 27 |
| Other Directorships Held Outside Fund Complex: | | N/A |
| |
| INDEPENDENT DIRECTORS | | |
| |
| Name: | | Stephen B. Ashley |
| Address: | | 290 Woodcliff Drive |
| | Fairport, NY 14450 |
| Age: | | 67 |
| Current Position(s) Held with Fund: | | Director, Audit Committee Member, Governance & Nominating Committee Member |
| Term of Office & Length of Time Served: | | Indefinite - Since 1996 |
| Principal Occupation(s) During Past 5 Years: | | Chairman, Director, President & Chief Executive Officer, The Ashley Group (property management and investment) |
| Number of Portfolios Overseen within Fund Complex: | | 27 |
| Other Directorships Held Outside Fund Complex: | | The Ashley Group |
| | | Fannie Mae |
| Name: | | Peter L. Faber |
| Address: | | 290 Woodcliff Drive |
| | Fairport, NY 14450 |
| Age: | | 68 |
| Current Position(s) Held with Fund: | | Director, Governance & Nominating Committee Member |
| Term of Office & Length of Time Served: | | Indefinite - Since 1987 |
| Principal Occupation(s) During Past 5 Years: | | Senior Counsel, McDermott, Will & Emery LLP (law firm) |
| Number of Portfolios Overseen within Fund Complex: | | 27 |
| Other Directorships Held Outside Fund Complex: | | Partnership for New York City, Inc. |
| | New York Collegium |
| | | Boston Early Music Festival |
| Name: | | Harris H. Rusitzky |
| Address: | | 290 Woodcliff Drive |
| | Fairport, NY 14450 |
| Age: | | 72 |
| Current Position(s) Held with Fund: | | Director, Audit Committee Member, Governance & Nominating Committee Member |
| Term of Office & Length of Time Served: | | Indefinite - Since 1985 |
| Principal Occupation(s) During Past 5 Years: | | President, The Greening Group (business consultants); Partner, The Restaurant Group (restaurants) |
| Number of Portfolios Overseen within Fund Complex: | | 27 |
| Other Directorships Held Outside Fund Complex: | | N/A |
Directors’ and Officers’ Information (unaudited)
| | |
| Name: | | Paul A. Brooke |
| Address: | | 290 Woodcliff Drive |
| | Fairport, NY 14450 |
| Age: | | 62 |
| Current Position(s) Held with Fund: | | Director, Audit Committee Member, Governance & Nominating Committee Member |
| Term of Office & Length of Time Served: | | Indefinite - Since 2007 |
| Principal Occupation(s) During Past 5 Years: | | Chairman & CEO, Alsius Corp. (investments); Managing Member, PMSV Holdings LLC (investments) |
| Number of Portfolios Overseen within Fund Complex: | | 27 |
| Other Directorships Held Outside Fund Complex: | | Incyte Corp.
ViroPharma, Inc.
HLTH Corp.
Cheyne Capital International
MPM Bio-equities
GMP Companies
HoustonPharma |
| OFFICERS | | |
| |
| Name: | | Jeffrey S. Coons, Ph.D., CFA |
| Address: | | 290 Woodcliff Drive |
| | Fairport, NY 14450 |
| Age: | | 44 |
| Current Position(s) Held with Fund: | | Vice President |
| Term of Office1 & Length of Time Served: | | Since 2004 |
| Principal Occupation(s) During Past 5 Years: | | Co-Director of Research since 2002 & Executive Group Member**, Manning & Napier Advisors, Inc. Holds one or more of the following titles for various subsidiaries and affiliates: President, Director, Treasurer or Senior Trust Officer. |
| Number of Portfolios Overseen within Fund Complex: | | 27 |
| Other Directorships Held Outside Fund Complex: | | N/A |
| Name: | | Christine Glavin |
| Address: | | 290 Woodcliff Drive |
| | Fairport, NY 14450 |
| Age: | | 41 |
| Current Position(s) Held with Fund: | | Principal Financial Officer, Chief Financial Officer |
| Term of Office1 & Length of Time Served: | | Principal Financial Officer since 2002; Chief Financial Officer since 2001 |
| Principal Occupation(s) During Past 5 Years: | | Fund Reporting Manager, Manning & Napier Advisors, Inc. |
| Number of Portfolios Overseen within Fund Complex: | | 27 |
| Other Directorships Held Outside Fund Complex: | | N/A |
| Name: | | Jodi L. Hedberg |
| Address: | | 290 Woodcliff Drive |
| | Fairport, NY 14450 |
| Age: | | 40 |
| Current Position(s) Held with Fund: | | Corporate Secretary, Chief Compliance Officer, Anti-Money Laundering Compliance Officer |
| Term of Office1 & Length of Time Served: | | Corporate Secretary since 1997; Chief Compliance Officer since 2004 |
| Principal Occupation(s) During Past 5 Years: | | Director of Compliance, Manning & Napier Advisors, Inc. and affiliates; Corporate Secretary, Manning & Napier Investor Services, Inc. since 2006 |
| Number of Portfolios Overseen within Fund Complex: | | 27 |
| Other Directorships Held Outside Fund Complex: | | N/A |
*Interested Director, within the meaning of the Investment Company Act of 1940 by reason of his position with the Fund's investment advisor and distributor. Mr. Auspitz serves as the Executive Vice President and Director, Manning & Napier Advisors, Inc. and President and Director, Manning & Napier Investor Services, Inc., the Fund's distributor.
**The Executive Group performs the duties of the Office of the Chief Executive of Manning & Napier Advisors, Inc.
1The term of office for President, Vice President, Chief Financial Officer, and Corporate Secretary is one year and until their respective successors are chosen and qualified. All other officers' terms are indefinite.
(THISPAGEINTENTIONALLYLEFTBLANK)
(THISPAGEINTENTIONALLYLEFTBLANK)
Literature Requests (unaudited)
Proxy Voting Policies and Procedures
A description of the policies and procedures that the Fund uses to determine how to vote proxies relating to portfolio securities is available, without charge, upon request:
| | |
By phone | | 1-800-466-3863 |
On the Securities and Exchange Commission’s (SEC) web site | | http://www.sec.gov |
Proxy Voting Record
Information regarding how the Fund voted proxies relating to portfolio securities during the most recent 12-month period ended June 30th is available, without charge, upon request:
| | |
By phone | | 1-800-466-3863 |
On the SEC’s web site | | http://www.sec.gov |
Quarterly Portfolio Holdings
The Series’ complete schedule of portfolio holdings for the 1st and 3rd quarters of each fiscal year are provided on Form N-Q, and are available, without charge, upon request:
| | |
By phone | | 1-800-466-3863 |
On the SEC’s web site | | http://www.sec.gov |
The Series’ Form N-Q may be reviewed and copied at the SEC’s Public Reference Room in Washington, D.C. Information on the operation of the Public Reference Room may be obtained by calling 1-800-SEC-0330.
Prospectus and Statement of Additional Information (SAI)
The prospectus and SAI provide additional information about each Series, including charges, expenses and risks. These documents are available, without charge, upon request:
| | |
By phone | | 1-800-466-3863 |
On the SEC’s web site | | http://www.sec.gov |
On the Advisor’s web site | | http://www.manningnapieradvisors.com |
Additional information available at www.manningnapieradvisors.com
1. Fund Holdings - Month-End
2. Fund Holdings - Quarter-End
3. Shareholder Report - Annual
4. Shareholder Report - Semi-Annual
Manning & Napier Fund, Inc.
| | | | |
| DIVERSIFIED TAX EXEMPT SERIES | | | | | Annual Report - December 31, 2007 |

Management Discussion and Analysis (unaudited)
Dear Shareholders:
It would be a bit of an understatement to describe 2007 as an “eventful” year; it was a wild ride during which fixed income investors, including municipal bond investors, were buffeted by a number of factors, some totally new, others quite familiar. “Subprime”, a relatively obscure term, entered the everyday vernacular. Some of these securities that were thought to be “AAA” turned out not to be. There were high profile disasters, as well as conservative investments that turned out to be stellar investments. And, as always seems to be the case, the Federal Reserve (the “Fed”) once again played a prominent role.
In the end, interest rates generally fell across the board. However, in some instances, yields actually finished the year at levels higher than where they started. Unfortunately, this was the case for longer-term municipal bonds. For instance, the market weighted yield for the Merrill Lynch Broad Market 12-22 Year Index increased 12 basis points (0.12%) in 2007 from 4.64% to 4.76%. Yields on longer-term issues increased even more; the Merrill Lynch Broad Market 22+ Year Index started the year yielding 4.81% and finished the year 26 basis points (0.26%) higher at 5.07%. Short-term municipal bond yields on the other hand moved materially lower; the yield on the Merrill Lynch Broad Market 1-3 Year Index dropped 46 basis points (0.46%) from 3.66% to 3.20%.
While not explicitly tied to the U.S. Treasury markets, municipal bonds generally take their cue from what happens there. In 2007, short-term U.S. Treasury interest rates moved sharply lower; longer-term rates also moved lower but to a lesser degree. Those moves reflected the changing state of the economic environment.
The first quarter of the year was relatively quiet since the economic releases were relatively mixed. On the good side, unemployment was down to 4.4% in March, payroll growth was still relatively robust, and the 4-week average of initial claims for unemployment insurance was drifting lower. Unfortunately, the good news in the labor markets was offset by the bad news in the housing sector; it remained under duress, and it started to become apparent that the hoped for bottom of the housing market was still quite a ways off.
During the second quarter of the year, rates on short- and long-term bonds moved in opposite directions, reflecting two distinct factors. For shorter-term bonds, a significant change in the market’s supply/demand dynamics pushed interest rates lower. A shrinking Federal deficit mitigates the Treasury’s borrowing needs, which in turn shrinks the supply of U.S. Treasury Bills, while foreign central banks began paring back their longer-term U.S. Treasury purchases, focusing instead on U.S. Treasury Bills. The combination of a shrinking supply and increased demand pushed short-term U.S. Treasury rates lower. For intermediate-to-longer-term bonds, rates rose due to a marked change in the market’s expectations about monetary policy and the rate of economic growth. As we moved into the summer, a number of the economic releases suggested that the rate of economic growth was picking back up. At the same time, the Fed started to hedge when it came to defining what it considered to be an acceptable rate of inflation. The markets responded by re-adjusting intermediate-to-longer term interest rates higher.
Market psychology definitely changed during the third quarter of the year and a precipitous drop in interest rates began, triggered by a flight to quality and a reassessment of the trajectory of Fed policy. While the problems in the market for subprime mortgage loans were well known prior to the third quarter, the collapse of two high profile hedge funds at Bear Stearns along with a couple of European bank announcements revealed the first set of identifiable victims. That caused investors to exit and/or avoid anything remotely tied to the subprime sector. The proceeds were parked in the perceived safest, most liquid alternative, specifically short-term U.S. Treasury instruments. Given the financial dislocations caused by this flight to quality, both the Fed and European central banks responded by injecting liquidity into the financial system. The Fed began by cutting the discount rate (the rate charged to banks to borrow reserves directly from the Fed), and followed that initial move with its first cut in the Fed Funds target (the rate charged by banks to borrow reserves from each other). Cutting the targeted Fed Funds rate was not only a response to the liquidity concerns associated with a flight to quality, but also a response to a weakening labor market, with the average gains down more than one-third from the gains reported over the prior 12 to 18 months.
Management Discussion and Analysis (unaudited)
During the fourth quarter there were two additional policy moves enacted by the Fed. It followed up its 50 basis point (0.50%) cut in September with 25 basis point (0.25%) cuts in October and again in December. The Fed and the markets were both responding to the headwinds that continued to buffet the U.S. economy. The housing sector continued to sink, with new home sales dropping 50% from their highs, existing home sales down one-third, and home prices posting year-over-year declines, a decidedly rare occurrence. What was more troubling was the fact that the problems in the housing sector appeared to have spilled over into other sectors of the economy. Job growth had slowed and the unemployment rate had risen to 5.0%, a level not seen since the end of 2005. At some point that should affect personal income growth, which had been remarkably robust.
While municipal bonds may take their cue from the U.S. Treasury markets, their movements also depend on factors specific to the municipal market. In 2007, short-term municipal yields moved lower along with U.S. Treasuries, but the magnitude of the move was not as great. Longer-term municipal yields ignored the U.S. Treasury market and those yields actually moved higher. The deviations can be traced to two factors: deteriorating credit quality within the municipal market and the subprime/collateralized debt obligation (CDO) issues that arose in the monoline insurer industry. In terms of credit quality, the debacle in the housing market (affecting property tax revenues), the smallest rise in retail sales since 2002 (affecting sales tax revenues), and modest increases in the equity markets (affecting capital gains tax revenues) put pressure on tax receipts. At the same time, worries about the economy suggest that spending on social services is likely to increase. As for the monoline insurers, their forays into the CDO marketplace caused the ratings agencies to re-examine their AAA credit ratings, which in turn caused municipal investors to look through the insurance overlays to the underlying credit rating of the issuer.
As for the performance of the Diversified Tax Exempt Series in 2007, its total return was 3.20%. That lagged the total return of the Merrill Lynch 1-12 Year Municipal Bond Index which was 4.98%, but it compares favorably with the Lipper average which was 3.04% in 2007. The Series holds a number of longer-term bonds, which the Index does not. Those longer-term holdings did not perform well in 2007, which explains the underperformance versus the Index. However, those longer-term holdings generated attractive coupons in 2007, and we continue to view them as attractive investments.
We appreciate your business and wish you all the very best in the coming year.
Sincerely,
Manning & Napier Advisors, Inc.
Performance Update as of December 31, 2007 (unaudited)
| | | | | | | | | | |
| | | Average Annual Total Returns
As of December 31, 2007 | | |
| | | One
Year | | Five
Year | | Ten
Year | | Since
Inception1 | | |
Manning & Napier Fund, Inc. - Diversified Tax Exempt Series2 | | 3.20% | | 3.64% | | 4.40% | | 4.68% | | |
Merrill Lynch 1-12 Year Municipal Bond Index3 | | 4.98% | | 3.77% | | 5.00% | | 5.20% | | |
The following graph compares the value of a $10,000 investment in the Manning & Napier Fund, Inc. - Diversified Tax Exempt Series for the ten years ended December 31, 2007 to the Merrill Lynch 1-12 Year Municipal Bond Index.
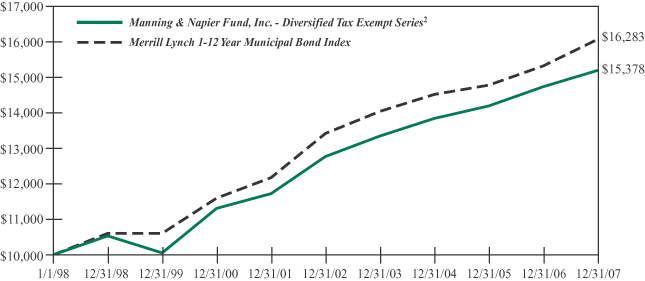
1Performance numbers for the Series and Index are calculated from February 14, 1994, the Series’ inception date.
2The Series’ performance does not reflect the deduction of taxes that a shareholder would pay on fund distributions or the redemption of shares. The Series’ performance is historical and may not be indicative of future results. The performance returns shown are inclusive of the net expense ratio of the Series. For the year ended December 31, 2007, this net expense ratio was 0.62%. The gross expense ratio, which does not account for any voluntary or contractual waivers currently in effect, was 0.62% for the year ended December 31, 2007.
3The Merrill Lynch 1-12 Year Municipal Bond Index is an unmanaged, market weighted index comprised of investment-grade, fixed rate, coupon bearing municipal bonds with maturities greater than one year but less than twelve years. The Index returns assume reinvestment of coupons and, unlike Series returns, do not reflect any fees or expenses.
Shareholder Expense Example (unaudited)
As a shareholder of the Series, you may incur two types of costs: (1) transaction costs, including potential wire charges on redemptions and (2) ongoing costs, including management fees and other Series expenses. This example is intended to help you understand your ongoing costs (in dollars) of investing in the Series and to compare these costs with the ongoing costs of investing in other mutual funds.
The example is based on an investment of $1,000 invested at the beginning of the period and held for the entire period (July 1, 2007 to December 31, 2007).
Actual Expenses
The first line of the table below provides information about actual account values and actual expenses. You may use the information in this line, together with the amount you invested, to estimate the expenses that you paid over the period. Simply divide your account value by $1,000 (for example, an $8,600 account value divided by $1,000 = 8.6), then multiply the result by the number in the first line under the heading entitled “Expenses Paid During Period” to estimate the expenses you paid on your account during this period.
Hypothetical Example for Comparison Purposes
The second line of the table below provides information about hypothetical account values and hypothetical expenses based on the Series’ actual expense ratio and an assumed rate of return of 5% per year before expenses, which is not the Series’ actual return. The hypothetical account values and expenses may not be used to estimate the actual ending account balance or expenses you paid during the period. You may use this information to compare the ongoing costs of investing in the Series and other funds. To do so, compare this 5% hypothetical example with the 5% hypothetical examples that appear in the shareholder reports of the other funds.
Please note that the expenses shown in the table are meant to highlight your ongoing costs only and do not reflect any transaction costs, such as potential wire charges on redemptions. Therefore, the second line of the table is useful in comparing ongoing costs only, and will not help you determine the relative total costs of owning different funds. In addition, if these transaction costs were included, your costs would have been higher.
| | | | | | | | | |
| | | Beginning
Account Value
7/1/07 | | Ending
Account Value
12/31/07 | | Expenses Paid
During Period*
7/1/07-12/31/07 |
Actual | | $ | 1,000.00 | | $ | 1,038.80 | | $ | 3.24 |
Hypothetical
(5% return before expenses) | | $ | 1,000.00 | | $ | 1,022.03 | | $ | 3.21 |
*Expenses are equal to the Series’ annualized expense ratio (for the six-month period) of 0.63%, multiplied by the average account value over the period, multiplied by 184/365 (to reflect the one-half year period). Expenses are based on the most recent fiscal half year; therefore, the expense ratio stated above may differ from the expense ratio stated in the financial highlights, which is based on one-year data.
Portfolio Composition as of December 31, 2007 (unaudited)
Bond Types1
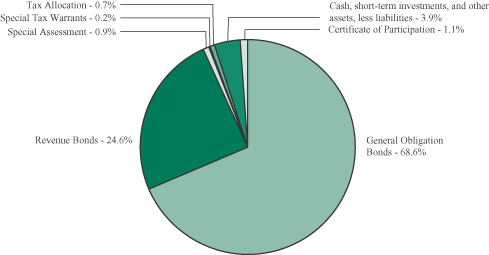
1As a percentage of net assets.
Credit Quality Ratings2,3
| | |
Aaa | | 85.5% |
Aa | | 9.2% |
A | | 1.4% |
Unrated investments, such as cash, short-term investments, and other assets, less liabilities | | 3.9% |
2As a percentage of net assets.
3Based on ratings from Moody’s, or the S&P equivalent. The Series may use different ratings provided by other rating agencies for purposes of determining compliance with the Series’ investment policies.
Top Ten States4
| | |
Texas | | 5.8% |
Michigan | | 5.3% |
California | | 5.3% |
Washington | | 4.3% |
Ohio | | 4.2% |
New Jersey | | 4.1% |
Illinois | | 3.8% |
Nevada | | 3.7% |
New York | | 3.5% |
Florida | | 3.5% |
4 As a percentage of total investments.
Investment Portfolio - December 31, 2007
| | | | | | | | | | | | | |
| | | Coupon
Rate | | | Maturity
Date | | Credit
Rating1
(unaudited) | | Principal
Amount | | Value
(Note 2) |
| | | | | | | | | | | | | |
| | | |
MUNICIPAL SECURITIES - 96.1% | | | | | | | | |
| | | |
Alabama - 1.6% | | | | | | | | |
Bessemer Governmental Utility Services Corp., Water Supply, Revenue Bond, MBIA | | 5.200 | % | | 6/1/2024 | | Aaa | | $ | 500,000 | | $ | 512,940 |
Birmingham, Capital Impt., Prerefunded Balance, Series B, G.O. Bond, AMBAC | | 5.000 | % | | 12/1/2032 | | Aaa | | | 1,005,000 | | | 1,084,294 |
Fort Payne Waterworks Board, Revenue Bond, AMBAC | | 3.500 | % | | 7/1/2015 | | Aaa | | | 665,000 | | | 657,519 |
Hoover Board of Education, Capital Outlay Warrants, Special Tax Warrants, MBIA | | 5.250 | % | | 2/15/2017 | | Aaa | | | 500,000 | | | 528,075 |
Mobile County Board of School Commissioners, Capital Outlay Warrants, Prerefunded Balance, Series B, G.O. Bond, AMBAC | | 5.000 | % | | 3/1/2018 | | Aaa | | | 500,000 | | | 527,650 |
Odenville Utilities Board Water, Revenue Bond, MBIA | | 4.300 | % | | 8/1/2028 | | Aaa | | | 500,000 | | | 492,595 |
| | | | | | | | | | | | | |
| | | | | | | | | | | | | 3,803,073 |
| | | | | | | | | | | | | |
Alaska - 0.2% | | | | | | | | | | | | | |
Alaska Municipal Banking Authority, Revenue Bond, MBIA | | 4.100 | % | | 6/1/2017 | | Aaa | | | 455,000 | | | 465,451 |
| | | | | | | | | | | | | |
Arizona - 3.0% | | | | | | | | | | | | | |
Goodyear, G.O. Bond, MBIA | | 4.375 | % | | 7/1/2020 | | Aaa | | | 680,000 | | | 697,823 |
Mesa, G.O. Bond, FGIC | | 4.125 | % | | 7/1/2027 | | Aaa | | | 2,215,000 | | | 2,094,703 |
Phoenix, Series B, G.O. Bond | | 4.200 | % | | 7/1/2021 | | Aa1 | | | 1,500,000 | | | 1,508,445 |
Salt River Project, Agricultural Impt. & Power District, Certificate of Participation, MBIA | | 5.000 | % | | 12/1/2011 | | Aaa | | | 1,500,000 | | | 1,591,800 |
Yuma County Library District, Series A, G.O. Bond, AMBAC | | 4.500 | % | | 7/1/2035 | | Aaa | | | 1,200,000 | | | 1,186,920 |
| | | | | | | | | | | | | |
| | | | | | | | | | | | | 7,079,691 |
| | | | | | | | | | | | | |
California - 5.2% | | | | | | | | | | | | | |
California State, G.O. Bond | | 4.750 | % | | 12/1/2028 | | A1 | | | 795,000 | | | 783,568 |
California State, G.O. Bond | | 5.250 | % | | 2/1/2023 | | A1 | | | 500,000 | | | 552,300 |
California State, Unrefunded Balance, G.O. Bond, MBIA | | 5.000 | % | | 6/1/2012 | | Aaa | | | 1,300,000 | | | 1,368,328 |
California State, Various Purposes, G.O. Bond, AMBAC | | 4.250 | % | | 12/1/2035 | | Aaa | | | 1,140,000 | | | 1,045,391 |
California State, G.O. Bond | | 4.250 | % | | 11/1/2014 | | A1 | | | 1,975,000 | | | 2,050,860 |
Campbell Union School District, G.O. Bond, FSA | | 4.375 | % | | 8/1/2027 | | Aaa | | | 1,810,000 | | | 1,779,067 |
Chula Vista Elementary School District, Series F, G.O. Bond, MBIA | | 4.800 | % | | 8/1/2024 | | Aaa | | | 435,000 | | | 447,541 |
Chula Vista Elementary School District, Series F, G.O. Bond, MBIA | | 4.875 | % | | 8/1/2025 | | Aaa | | | 425,000 | | | 438,128 |
| | |
| 6 | | The accompanying notes are an integral part of the financial statements. |
Investment Portfolio - December 31, 2007
| | | | | | | | | | | | | | |
| | | Coupon
Rate | | | Maturity
Date | | Credit
Rating1
(unaudited) | | | Principal
Amount | | Value
(Note 2) |
| | | | | | | | | | | | | | |
| | | |
MUNICIPAL SECURITIES (continued) | | | | | | | | | |
| | | | | |
California (continued) | | | | | | | | | | | | | | |
Los Angeles Unified School District, Series B, G.O. Bond, AMBAC | | 4.500 | % | | 7/1/2027 | | Aaa | | | $ | 840,000 | | $ | 826,073 |
Oak Valley Hospital District, G.O. Bond, FGIC | | 4.500 | % | | 7/1/2025 | | Aaa | | | | 1,395,000 | | | 1,383,324 |
Richmond Joint Powers Financing Authority, Series A, Tax Allocation, MBIA | | 5.250 | % | | 9/1/2025 | | Aaa | | | | 1,570,000 | | | 1,630,602 |
| | | | | | | | | | | | | | |
| | | | | | | | | | | | | | 12,305,182 |
| | | | | | | | | | | | | | |
Colorado - 1.8% | | | | | | | | | | | | | | |
Broomfield Water Activity, Enterprise Water, Revenue Bond, MBIA | | 5.000 | % | | 12/1/2015 | | Aaa | | | | 700,000 | | | 747,684 |
Colorado Water Resources & Power Development Authority, Water Resource, Series D, Revenue Bond, FSA | | 4.375 | % | | 8/1/2035 | | Aaa | | | | 1,420,000 | | | 1,362,163 |
Commerce City, Certificate of Participation, AMBAC | | 4.750 | % | | 12/15/2032 | | AAA | 2 | | | 1,000,000 | | | 999,980 |
Denver City & County School District No. 1, Prerefunded Balance, G.O. Bond, FGIC | | 5.000 | % | | 12/1/2023 | | Aaa | | | | 895,000 | | | 936,358 |
Denver City & County School District No. 1, Unrefunded Balance, G.O. Bond, FGIC | | 5.000 | % | | 12/1/2023 | | Aaa | | | | 105,000 | | | 108,341 |
| | | | | | | | | | | | | | |
| | | | | | | | | | | | | | 4,154,526 |
| | | | | | | | | | | | | | |
Connecticut - 0.7% | | | | | | | | | | | | | | |
Stamford, G.O. Bond | | 4.400 | % | | 2/15/2026 | | Aaa | | | | 1,545,000 | | | 1,548,940 |
| | | | | | | | | | | | | | |
Delaware - 1.6% | | | | | | | | | | | | | | |
Delaware Transportation Authority, Revenue Bond, MBIA | | 5.000 | % | | 7/1/2011 | | Aaa | | | | 1,000,000 | | | 1,061,880 |
New Castle County, Series A, G.O. Bond | | 4.250 | % | | 7/15/2025 | | Aaa | | | | 1,500,000 | | | 1,483,515 |
New Castle County, Series A, G.O. Bond | | 4.250 | % | | 7/15/2026 | | Aaa | | | | 1,265,000 | | | 1,240,940 |
| | | | | | | | | | | | | | |
| | | | | | | | | | | | | | 3,786,335 |
| | | | | | | | | | | | | | |
Florida - 3.4% | | | | | | | | | | | | | | |
Cape Coral Utility Impt. Assessment, Special Assessment, MBIA | | 4.500 | % | | 7/1/2021 | | Aaa | | | | 2,000,000 | | | 2,021,580 |
Florida State Department of Transportation, G.O. Bond | | 5.000 | % | | 7/1/2027 | | Aa1 | | | | 1,000,000 | | | 1,031,560 |
Florida State Board of Education, Capital Outlay, Public Education, Series A, G.O. Bond, FSA | | 4.500 | % | | 6/1/2025 | | Aaa | | | | 1,280,000 | | | 1,278,426 |
Florida State Board of Education, Capital Outlay, Public Education, Series C, G.O. Bond, AMBAC | | 5.000 | % | | 6/1/2011 | | Aaa | | | | 425,000 | | | 449,025 |
Florida Sate Board of Education, Capital Outlay, Public Education, Series D, G.O. Bond | | 5.000 | % | | 6/1/2016 | | Aa1 | | | | 2,000,000 | | | 2,188,200 |
| | |
| The accompanying notes are an integral part of the financial statements. | | 7 |
Investment Portfolio - December 31, 2007
| | | | | | | | | | | | | |
| | | Coupon
Rate | | | Maturity
Date | | Credit
Rating1
(unaudited) | | Principal
Amount | | Value
(Note 2) |
| | | | | | | | | | | | | |
| | | |
MUNICIPAL SECURITIES (continued) | | | | | | | | |
| | | | | |
Florida (continued) | | | | | | | | | | | | | |
Miami-Dade County, Educational Facilities Authority, Prerefunded Balance, Series A, Revenue Bond, AMBAC | | 5.000 | % | | 4/1/2015 | | Aaa | | $ | 510,000 | | $ | 553,182 |
Tohopekaliga Water Authority, Utility System, Series A, Revenue Bond, FSA | | 5.000 | % | | 10/1/2028 | | Aaa | | | 510,000 | | | 525,305 |
| | | | | | | | | | | | | |
| | | | | | | | | | | | | 8,047,278 |
| | | | | | | | | | | | | |
Georgia - 2.0% | | | | | | | | | | | | | |
Atlanta, Prerefunded Balance, G.O. Bond | | 5.600 | % | | 12/1/2018 | | Aa3 | | | 350,000 | | | 354,175 |
Atlanta, Water & Wastewater, Series A,
Revenue Bond, MBIA | | 5.000 | % | | 11/1/2033 | | Aaa | | | 310,000 | | | 316,144 |
Atlanta, Water & Wastewater, Revenue Bond, FSA | | 5.000 | % | | 11/1/2043 | | Aaa | | | 1,500,000 | | | 1,536,510 |
Georgia State, Series B, G.O. Bond | | 4.000 | % | | 3/1/2022 | | Aaa | | | 1,270,000 | | | 1,252,372 |
Georgia State, Series B, G.O. Bond | | 5.650 | % | | 3/1/2012 | | Aaa | | | 5,000 | | | 5,468 |
Georgia State, Unrefunded Balance, Series B, G.O. Bond | | 5.650 | % | | 3/1/2012 | | Aaa | | | 195,000 | | | 213,591 |
Madison Water & Sewer, Revenue Bond, AMBAC | | 4.625 | % | | 7/1/2030 | | Aaa | | | 1,000,000 | | | 1,000,990 |
| | | | | | | | | | | | | |
| | | | | | | | | | | | | 4,679,250 |
| | | | | | | | | | | | | |
Illinois - 3.7% | | | | | | | | | | | | | |
Chicago Neighborhoods Alive 21 Program, Prerefunded Balance, G.O. Bond, FGIC | | 5.375 | % | | 1/1/2026 | | Aaa | | | 500,000 | | | 531,905 |
Chicago, Prerefunded Balance, G.O. Bond, FGIC | | 5.250 | % | | 1/1/2027 | | Aaa | | | 250,000 | | | 255,000 |
Chicago, Series A, G.O. Bond, MBIA | | 5.000 | % | | 1/1/2034 | | Aaa | | | 830,000 | | | 851,007 |
Chicago, Series A, G.O. Bond, AMBAC | | 5.000 | % | | 1/1/2018 | | Aaa | | | 2,255,000 | | | 2,445,322 |
Chicago, Series A, G.O. Bond, FSA | | 4.750 | % | | 1/1/2038 | | Aaa | | | 1,500,000 | | | 1,509,930 |
Cook County, Series A, G.O. Bond, FGIC | | 5.000 | % | | 11/15/2022 | | Aaa | | | 750,000 | | | 765,067 |
Illinois State, G.O. Bond | | 5.000 | % | | 12/1/2027 | | Aa3 | | | 600,000 | | | 616,008 |
Illinois State, Series 1995 A, Certificate of Participation, MBIA | | 5.600 | % | | 7/1/2010 | | Aaa | | | 100,000 | | | 101,197 |
Madison & St. Clair Counties School District No. 010 Collinsville, School Building, Prerefunded Balance, G.O. Bond, FGIC | | 5.125 | % | | 2/1/2019 | | Aaa | | | 500,000 | | | 528,785 |
Rock Island County School District No. 041 Rock Island, G.O. Bond, FSA | | 5.125 | % | | 12/1/2015 | | Aaa | | | 200,000 | | | 203,572 |
Springfield Electric, Revenue Bond, MBIA | | 5.000 | % | | 3/1/2035 | | Aaa | | | 1,000,000 | | | 1,037,950 |
| | | | | | | | | | | | | |
| | | | | | | | | | | | | 8,845,743 |
| | | | | | | | | | | | | |
| | |
| 8 | | The accompanying notes are an integral part of the financial statements. |
Investment Portfolio - December 31, 2007
| | | | | | | | | | | | | |
| | | Coupon
Rate | | | Maturity
Date | | Credit
Rating1
(unaudited) | | Principal
Amount | | Value
(Note 2) |
| | | | | | | | | | | | | |
| | | |
MUNICIPAL SECURITIES (continued) | | | | | | | | |
| | | | | |
Indiana - 2.3% | | | | | | | | | | | | | |
Avon Community School Building Corp., Revenue Bond, AMBAC | | 4.250 | % | | 7/15/2018 | | Aaa | | $ | 1,450,000 | | $ | 1,488,338 |
Avon Community School Building Corp., Revenue Bond, AMBAC | | 4.750 | % | | 1/15/2032 | | Aaa | | | 1,015,000 | | | 1,023,506 |
Frankfort High School Elementary School Building Corp., Revenue Bond, FSA | | 4.750 | % | | 7/15/2025 | | Aaa | | | 1,500,000 | | | 1,532,715 |
La Porte County, G.O. Bond, FGIC | | 5.200 | % | | 1/15/2018 | | Aaa | | | 300,000 | | | 318,651 |
Noblesville Sewage Works, Revenue Bond, AMBAC | | 5.000 | % | | 1/1/2024 | | Aaa | | | 550,000 | | | 570,927 |
North Lawrence Indiana Community Schools Building Corp., Revenue Bond, FSA | | 5.000 | % | | 7/15/2020 | | Aaa | | | 450,000 | | | 474,417 |
| | | | | | | | | | | | | |
| | | | | | | | | | | | | 5,408,554 |
| | | | | | | | | | | | | |
Iowa - 1.8% | | | | | | | | | | | | | |
Indianola Community School District, G.O. Bond, FGIC | | 5.200 | % | | 6/1/2021 | | Aaa | | | 425,000 | | | 455,069 |
Iowa City Community School District, G.O. Bond, FSA | | 4.000 | % | | 6/1/2018 | | Aaa | | | 425,000 | | | 427,788 |
Iowa City, Sewer, Revenue Bond, MBIA | | 5.750 | % | | 7/1/2021 | | Aaa | | | 250,000 | | | 250,482 |
Polk County, Series C, G.O. Bond | | 4.000 | % | | 6/1/2017 | | Aa1 | | | 995,000 | | | 1,013,706 |
Polk County, Series C, G.O. Bond | | 4.125 | % | | 6/1/2025 | | Aa1 | | | 2,075,000 | | | 2,022,046 |
| | | | | | | | | | | | | |
| | | | | | | | | | | | | 4,169,091 |
| | | | | | | | | | | | | |
Kansas - 2.8% | | | | | | | | | | | | | |
Johnson & Miami Counties Unified School District No. 230, G.O. Bond, FGIC | | 4.000 | % | | 9/1/2022 | | Aaa | | | 1,000,000 | | | 981,760 |
Johnson County Unified School District No. 231, Prerefunded Balance, Series A, G.O. Bond, FGIC | | 5.750 | % | | 10/1/2016 | | Aaa | | | 500,000 | | | 523,160 |
Miami County Unified School District No. 416 Louisburg, G.O. Bond, MBIA | | 5.000 | % | | 9/1/2018 | | Aaa | | | 2,000,000 | | | 2,170,020 |
Sedgwick County Unified School District No. 265, G.O. Bond, FSA | | 5.000 | % | | 10/1/2025 | | Aaa | | | 1,090,000 | | | 1,145,634 |
Shawnee County Unified School District No.
450, Shawnee Heights, G.O. Bond, FSA | | 4.200 | % | | 9/1/2020 | | Aaa | | | 700,000 | | | 704,627 |
Shawnee County Unified School District No.
450, Shawnee Heights, G.O. Bond, FSA | | 4.250 | % | | 9/1/2021 | | Aaa | | | 580,000 | | | 582,610 |
Wyandotte County School District No. 204 Bonner Springs, Prerefunded Balance, Series
A, G.O. Bond, FSA | | 5.375 | % | | 9/1/2015 | | Aaa | | | 290,000 | | | 306,597 |
Wyandotte County School District No. 204 Bonner Springs, Unrefunded Balance, Series
A, G.O. Bond, FSA | | 5.375 | % | | 9/1/2015 | | Aaa | | | 110,000 | | | 115,890 |
| | | | | | | | | | | | | |
| | | | | | | | | | | | | 6,530,298 |
| | | | | | | | | | | | | |
| | |
| The accompanying notes are an integral part of the financial statements. | | 9 |
Investment Portfolio - December 31, 2007
| | | | | | | | | | | | | |
| | | Coupon
Rate | | | Maturity
Date | | Credit
Rating1
(unaudited) | | Principal
Amount | | Value
(Note 2) |
| | | | | | | | | | | | | |
| | | |
MUNICIPAL SECURITIES (continued) | | | | | | | | |
| | | | | |
Kentucky - 0.8% | | | | | | | | | | | | | |
Kentucky State Turnpike Authority, Economic Development, Revenue Bond, AMBAC | | 6.500 | % | | 7/1/2008 | | Aaa | | $ | 250,000 | | $ | 254,298 |
Lexington-Fayette Urban County Government, Public Facilities Corp., Revenue Bond, MBIA | | 4.000 | % | | 10/1/2018 | | Aaa | | | 1,655,000 | | | 1,668,687 |
| | | | | | | | | | | | | |
| | | | | | | | | | | | | 1,922,985 |
| | | | | | | | | | | | | |
Louisiana - 1.3% | | | | | | | | | | | | | |
Caddo Parish Parishwide School District, G.O. Bond, MBIA | | 4.350 | % | | 3/1/2026 | | Aaa | | | 660,000 | | | 643,526 |
Caddo Parish Parishwide School District, G.O. Bond, MBIA | | 4.375 | % | | 3/1/2027 | | Aaa | | | 1,090,000 | | | 1,066,674 |
Lafayette Public Power Authority, Series A, Revenue Bond, AMBAC | | 5.000 | % | | 11/1/2012 | | Aaa | | | 730,000 | | | 775,829 |
New Orleans Sewage Service, Revenue Bond, FGIC | | 5.250 | % | | 6/1/2012 | | Aaa | | | 300,000 | | | 303,321 |
Orleans Parish Parishwide School District, Series A, G.O. Bond, FGIC | | 5.125 | % | | 9/1/2016 | | Aaa | | | 400,000 | | | 400,576 |
| | | | | | | | | | | | | |
| | | | | | | | | | | | | 3,189,926 |
| | | | | | | | | | | | | |
Maine - 0.3% | | | | | | | | | | | | | |
Kennebec Water District, Revenue Bond, FSA | | 5.125 | % | | 12/1/2021 | | Aaa | | | 750,000 | | | 761,423 |
| | | | | | | | | | | | | |
Maryland - 1.7% | | | | | | | | | | | | | |
Anne Arundel County, Water & Sewer, G.O. Bond | | 4.200 | % | | 3/1/2025 | | Aa1 | | | 1,770,000 | | | 1,739,291 |
Anne Arundel County, Water & Sewer, G.O. Bond | | 4.125 | % | | 3/1/2024 | | Aa1 | | | 345,000 | | | 339,183 |
Baltimore County, Metropolitan District, G.O. Bond | | 4.250 | % | | 9/1/2029 | | Aaa | | | 1,000,000 | | | 968,400 |
Baltimore, Water Project, Series A, Revenue Bond, FGIC | | 5.550 | % | | 7/1/2009 | | Aaa | | | 260,000 | | | 269,693 |
Maryland State, State & Local Facilities, G.O. Bond | | 4.250 | % | | 8/1/2021 | | Aaa | | | 750,000 | | | 759,675 |
| | | | | | | | | | | | | |
| | | | | | | | | | | | | 4,076,242 |
| | | | | | | | | | | | | |
Massachusetts - 2.4% | | | | | | | | | | | | | |
Boston, Series A, G.O. Bond, MBIA | | 4.125 | % | | 1/1/2021 | | Aaa | | | 1,000,000 | | | 999,500 |
Boston, Series A, G.O. Bond, MBIA | | 4.125 | % | | 1/1/2022 | | Aaa | | | 410,000 | | | 406,343 |
Cambridge, Series A, G.O. Bond | | 4.000 | % | | 2/1/2026 | | Aaa | | | 850,000 | | | 810,942 |
Cambridge, Series A, G.O. Bond | | 4.000 | % | | 2/1/2027 | | Aaa | | | 850,000 | | | 805,010 |
Lowell, State Qualified, G.O. Bond, AMBAC | | 5.000 | % | | 2/1/2020 | | Aaa | | | 500,000 | | | 527,955 |
Massachusetts State, Series C, G.O. Bond, AMBAC | | 5.750 | % | | 8/1/2010 | | Aaa | | | 400,000 | | | 426,316 |
Massachusetts State, Series D, G.O. Bond | | 5.250 | % | | 10/1/2014 | | Aa2 | | | 1,000,000 | | | 1,104,030 |
| | |
| 10 | | The accompanying notes are an integral part of the financial statements. |
Investment Portfolio - December 31, 2007
| | | | | | | | | | | | | |
| | | Coupon
Rate | | | Maturity
Date | | Credit
Rating1
(unaudited) | | Principal
Amount | | Value
(Note 2) |
| | | | | | | | | | | | | |
| | | |
MUNICIPAL SECURITIES (continued) | | | | | | | | |
| | | | | |
Massachusetts (continued) | | | | | | | | | | | | | |
Plymouth, G.O. Bond, MBIA | | 5.250 | % | | 10/15/2020 | | Aaa | | $ | 100,000 | | $ | 105,514 |
Richmond, G.O. Bond, MBIA | | 5.000 | % | | 4/15/2021 | | Aaa | | | 400,000 | | | 421,780 |
| | | | | | | | | | | | | |
| | | | | | | | | | | | | 5,607,390 |
| | | | | | | | | | | | | |
Michigan - 5.2% | | | | | | | | | | | | | |
Bendle Public School District, School Building & Site, G.O. Bond, FGIC | | 4.500 | % | | 5/1/2028 | | Aaa | | | 640,000 | | | 629,907 |
Detroit City School District, School Building & Site Impt., Series B, G.O. Bond, FGIC | | 5.000 | % | | 5/1/2033 | | Aaa | | | 750,000 | | | 767,917 |
Detroit Sewer Disposal System, Series B, Revenue Bond, FGIC | | 4.625 | % | | 7/1/2034 | | Aaa | | | 1,500,000 | | | 1,465,275 |
Detroit Water Supply System, Revenue Bond, MBIA | | 5.250 | % | | 7/1/2023 | | Aaa | | | 2,000,000 | | | 2,137,020 |
Grand Rapids Public Schools, G.O. Bond, MBIA | | 4.125 | % | | 5/1/2023 | | Aaa | | | 1,200,000 | | | 1,166,292 |
Holly Area School District, G.O. Bond, FGIC | | 5.000 | % | | 5/1/2022 | | Aaa | | | 500,000 | | | 507,900 |
Hudsonville Public Schools, Prerefunded Balance, G.O. Bond, FGIC | | 5.150 | % | | 5/1/2027 | | Aaa | | | 185,000 | | | 186,321 |
Hudsonville Public Schools, Unrefunded Balance, G.O. Bond, FGIC | | 5.150 | % | | 5/1/2027 | | Aaa | | | 40,000 | | | 40,180 |
Lincoln Park School District, Prerefunded Balance, G.O. Bond, FGIC | | 5.000 | % | | 5/1/2026 | | Aaa | | | 125,000 | | | 125,831 |
Lincoln Park School District, Prerefunded Balance, G.O. Bond, FGIC | | 5.000 | % | | 5/1/2026 | | Aaa | | | 355,000 | | | 356,306 |
Muskegon Public Schools, G.O. Bond, FSA | | 5.000 | % | | 5/1/2020 | | Aaa | | | 1,000,000 | | | 1,064,430 |
Muskegon Water, Revenue Bond, FSA | | 4.750 | % | | 5/1/2019 | | Aaa | | | 565,000 | | | 573,876 |
Oakland County, George W. Kuhn Drain District, Prerefunded Balance, Series B, G.O. Bond | | 5.375 | % | | 4/1/2021 | | Aaa | | | 475,000 | | | 488,656 |
Saginaw City School District, School Building
& Site, G.O. Bond, FSA | | 4.500 | % | | 5/1/2031 | | Aaa | | | 1,695,000 | | | 1,682,796 |
St. Joseph County, Sewer Disposal Systems - Constantine, G.O. Bond, FSA | | 5.000 | % | | 4/1/2012 | | Aaa | | | 100,000 | | | 100,454 |
Warren Woods Public Schools, School Building & Site, G.O. Bond, FSA | | 4.500 | % | | 5/1/2026 | | Aaa | | | 1,015,000 | | | 1,016,340 |
| | | | | | | | | | | | | |
| | | | | | | | | | | | | 12,309,501 |
| | | | | | | | | | | | | |
Minnesota - 2.3% | | | | | | | | | | | | | |
Brooklyn Center Independent School District No. 286, School Building, Series A, G.O. Bond, MBIA | | 4.375 | % | | 2/1/2026 | | Aaa | | | 1,105,000 | | | 1,086,657 |
Hennepin County, Series A, G.O. Bond | | 4.500 | % | | 12/1/2025 | | Aaa | | | 1,500,000 | | | 1,514,160 |
Minnesota State, G.O. Bond | | 5.000 | % | | 8/1/2013 | | Aa1 | | | 2,000,000 | | | 2,172,880 |
| | |
| The accompanying notes are an integral part of the financial statements. | | 11 |
Investment Portfolio - December 31, 2007
| | | | | | | | | | | | | |
| | | Coupon
Rate | | | Maturity
Date | | Credit
Rating1
(unaudited) | | Principal
Amount | | Value
(Note 2) |
| | | | | | | | | | | | | |
| | | |
MUNICIPAL SECURITIES (continued) | | | | | | | | |
| | | | | |
Minnesota (continued) | | | | | | | | | | | | | |
Pine County, Series A, G.O. Bond, FGIC | | 4.400 | % | | 2/1/2028 | | Aaa | | $ | 555,000 | | $ | 540,531 |
Western Minnesota Municipal Power Agency, Revenue Bond | | 6.625 | % | | 1/1/2016 | | Aaa | | | 175,000 | | | 202,501 |
| | | | | | | | | | | | | |
| | | | | | | | | | | | | 5,516,729 |
| | | | | | | | | | | | | |
Mississippi - 0.7% | | | | | | | | | | | | | |
Biloxi Public School District, Revenue Bond, MBIA | | 5.000 | % | | 4/1/2017 | | Aaa | | | 500,000 | | | 516,840 |
De Soto County School District, G.O. Bond, FSA | | 5.000 | % | | 2/1/2013 | | Aaa | | | 1,000,000 | | | 1,063,160 |
| | | | | | | | | | | | | |
| | | | | | | | | | | | | 1,580,000 |
| | | | | | | | | | | | | |
Missouri - 1.3% | | | | | | | | | | | | | |
Metropolitan St. Louis Sewer District Wastewater System, Series A, Revenue Bond, MBIA | | 3.600 | % | | 5/1/2013 | | Aaa | | | 600,000 | | | 606,168 |
Missouri State Water Pollution Control, Series A, G.O. Bond | | 4.500 | % | | 12/1/2030 | | Aaa | | | 2,375,000 | | | 2,368,184 |
| | | | | | | | | | | | | |
| | | | | | | | | | | | | 2,974,352 |
| | | | | | | | | | | | | |
Nebraska - 1.1% | | | | | | | | | | | | | |
Omaha Metropolitan Utilities District Water, Series A, Revenue Bond, FSA | | 4.375 | % | | 12/1/2031 | | Aaa | | | 2,640,000 | | | 2,524,025 |
| | | | | | | | | | | | | |
Nevada - 3.7% | | | | | | | | | | | | | |
Clark County Public Facilities, Prerefunded Balance, Series C, G.O. Bond, FGIC | | 5.000 | % | | 6/1/2024 | | Aaa | | | 315,000 | | | 323,622 |
Clark County Public Facilities, Unrefunded Balance, Series C, G.O. Bond, FGIC | | 5.000 | % | | 6/1/2024 | | Aaa | | | 110,000 | | | 111,846 |
Clark County Transportation, Series A, G.O. Bond, FGIC | | 4.500 | % | | 12/1/2019 | | Aaa | | | 500,000 | | | 503,910 |
Clark County, G.O. Bond, FSA | | 4.750 | % | | 6/1/2027 | | Aaa | | | 3,000,000 | | | 3,051,960 |
Las Vegas Valley Water District, Water Impt., Series A, G.O. Bond, FSA | | 4.750 | % | | 6/1/2033 | | Aaa | | | 1,500,000 | | | 1,515,495 |
Nevada State, Project Nos. 66 & 67, Prerefunded Balance, Series A, G.O. Bond, FGIC | | 5.000 | % | | 5/15/2028 | | Aaa | | | 625,000 | | | 629,650 |
Nevada State, Project Nos. 66 & 67, Unrefunded Balance, Series A, G.O. Bond, FGIC | | 5.000 | % | | 5/15/2028 | | Aaa | | | 125,000 | | | 125,516 |
North Las Vegas, G.O. Bond, MBIA | | 5.000 | % | | 5/1/2024 | | Aaa | | | 1,500,000 | | | 1,578,165 |
Truckee Meadows, Water Authority, Prerefunded Balance, Series A, Revenue Bond, FSA | | 5.000 | % | | 7/1/2025 | | Aaa | | | 750,000 | | | 795,645 |
| | | | | | | | | | | | | |
| | | | | | | | | | | | | 8,635,809 |
| | | | | | | | | | | | | |
| | |
| 12 | | The accompanying notes are an integral part of the financial statements. |
Investment Portfolio - December 31, 2007
| | | | | | | | | | | | | | |
| | | Coupon
Rate | | | Maturity
Date | | Credit
Rating1
(unaudited) | | | Principal
Amount | | Value
(Note 2) |
| | | | | | | | | | | | | | |
| | | |
MUNICIPAL SECURITIES (continued) | | | | | | | | | |
| | | | | |
New Jersey - 4.1% | | | | | | | | | | | | | | |
East Brunswick Township Board of Education, G.O. Bond, FSA | | 4.500 | % | | 11/1/2028 | | Aaa | | | $ | 835,000 | | $ | 831,602 |
East Brunswick Township Board of Education, G.O. Bond, FSA | | 4.500 | % | | 11/1/2029 | | Aaa | | | | 1,000,000 | | | 995,810 |
Essex County, Prerefunded Balance, Series A, G.O. Bond, MBIA | | 4.500 | % | | 5/1/2031 | | Aaa | | | | 500,000 | | | 533,070 |
Hudson County, G.O. Bond, CIFG | | 4.250 | % | | 9/1/2021 | | Aaa | | | | 930,000 | | | 928,047 |
Morris County Impt. Authority, School District, Morris Hills Regional District, Revenue Bond | | 3.700 | % | | 10/1/2018 | | Aaa | | | | 540,000 | | | 532,337 |
New Jersey Transportation Trust Fund Authority, Transportation System, Unrefunded Balance Series C, Revenue Bond, FSA | | 5.500 | % | | 12/15/2013 | | Aaa | | | | 1,400,000 | | | 1,558,956 |
New Jersey Transportation Trust Fund Authority, Transportation System, Series A, Revenue Bond, FSA | | 4.250 | % | | 12/15/2022 | | Aaa | | | | 2,000,000 | | | 1,986,840 |
South Brunswick Township Board of Education, G.O. Bond, MBIA | | 4.125 | % | | 8/1/2012 | | Aaa | | | | 1,200,000 | | | 1,246,428 |
Sparta Township School District, G.O. Bond, FSA | | 4.300 | % | | 2/15/2030 | | Aaa | | | | 1,000,000 | | | 968,030 |
| | | | | | | | | | | | | | |
| | | | | | | | | | | | | | 9,581,120 |
| | | | | | | | | | | | | | |
New Mexico - 0.3% | | | | | | | | | | | | | | |
New Mexico Finance Authority, Public Project Revolving Fund, Series A, Revenue Bond, MBIA | | 3.250 | % | | 6/1/2013 | | Aaa | | | | 795,000 | | | 782,789 |
| | | | | | | | | | | | | | |
New York - 3.5% | | | | | | | | | | | | | | |
Erie County, Public Impt., Series A, G.O. Bond, FGIC | | 5.000 | % | | 9/1/2014 | | Aaa | | | | 380,000 | | | 405,338 |
Hampton Bays Union Free School District, G.O. Bond, FSA | | 4.375 | % | | 9/15/2029 | | Aaa | | | | 2,225,000 | | | 2,204,864 |
Mount Morris Central School District, G.O. Bond, FGIC | | 4.125 | % | | 6/15/2014 | | Aaa | | | | 1,290,000 | | | 1,352,320 |
New York City Municipal Water Finance Authority, Series E, Revenue Bond, FGIC | | 5.000 | % | | 6/15/2026 | | Aaa | | | | 750,000 | | | 775,680 |
New York State Urban Development Corp., Series B, Revenue Bond, MBIA | | 5.000 | % | | 1/1/2019 | | AAA | 2 | | | 1,000,000 | | | 1,075,690 |
Sachem Central School District of Holbrook, G.O. Bond, FGIC | | 4.375 | % | | 10/15/2030 | | Aaa | | | | 2,000,000 | | | 1,964,480 |
Spencerport Central School District, G.O. Bond, FSA | | 5.000 | % | | 11/15/2012 | | Aaa | | | | 350,000 | | | 356,394 |
| | |
| The accompanying notes are an integral part of the financial statements. | | 13 |
Investment Portfolio - December 31, 2007
| | | | | | | | | | | | | |
| | | Coupon
Rate | | | Maturity
Date | | Credit
Rating1
(unaudited) | | Principal
Amount | | Value
(Note 2) |
| | | | | | | | | | | | | |
| | | |
MUNICIPAL SECURITIES (continued) | | | | | | | | |
| | | | | |
New York (continued) | | | | | | | | | | | | | |
Westchester County, Unrefunded Balance, G.O. Bond | | 4.750 | % | | 11/15/2016 | | Aaa | | $ | 120,000 | | $ | 120,719 |
| | | | | | | | | | | | | |
| | | | | | | | | | | | | 8,255,485 |
| | | | | | | | | | | | | |
North Carolina - 1.9% | | | | | | | | | | | | | |
Cary, G.O. Bond | | 5.000 | % | | 3/1/2018 | | Aaa | | | 700,000 | | | 742,637 |
Mecklenburg County, Public Impt., Series A, G.O. Bond | | 4.125 | % | | 2/1/2022 | | Aaa | | | 1,455,000 | | | 1,446,503 |
North Carolina State, Grant Anticipation, Revenue Bond, MBIA | | 4.000 | % | | 3/1/2018 | | Aaa | | | 1,355,000 | | | 1,372,398 |
Raleigh, G.O. Bond | | 4.400 | % | | 6/1/2017 | | Aaa | | | 250,000 | | | 255,725 |
Union County, Prerefunded Balance, Series B, G.O. Bond, FGIC | | 5.300 | % | | 3/1/2013 | | Aaa | | | 250,000 | | | 261,392 |
Wilson, G.O. Bond, AMBAC | | 5.100 | % | | 6/1/2019 | | Aaa | | | 400,000 | | | 421,956 |
| | | | | | | | | | | | | |
| | | | | | | | | | | | | 4,500,611 |
| | | | | | | | | | | | | |
North Dakota - 0.8% | | | | | | | | | | | | | |
Fargo, Series A, G.O. Bond, MBIA | | 4.700 | % | | 5/1/2030 | | Aaa | | | 1,840,000 | | | 1,847,599 |
| | | | | | | | | | | | | |
Ohio - 4.1% | | | | | | | | | | | | | |
Brookville Local School District, School Impt., G.O. Bond, FSA | | 4.125 | % | | 12/1/2026 | | Aaa | | | 660,000 | | | 624,730 |
Cleveland, Various Purposes, G.O. Bond, MBIA | | 5.000 | % | | 12/1/2012 | | Aaa | | | 1,140,000 | | | 1,227,905 |
Columbus, Limited Tax, Series 2, G.O. Bond | | 5.000 | % | | 7/1/2017 | | Aaa | | | 1,000,000 | | | 1,085,620 |
Columbus City School District, Facilities Construction & Impt., G.O. Bond, FSA | | 4.375 | % | | 12/1/2032 | | Aaa | | | 1,000,000 | | | 966,800 |
Licking Heights Local School District, School Facilities Construction & Impt., Series A, G.O. Bond, MBIA | | 5.000 | % | | 12/1/2022 | | Aaa | | | 1,450,000 | | | 1,534,579 |
Newark City School District, School Impt., G.O. Bond, FGIC | | 4.250 | % | | 12/1/2027 | | Aaa | | | 500,000 | | | 479,585 |
Ohio State Conservation Project, Series A, G.O. Bond | | 5.000 | % | | 3/1/2015 | | Aa1 | | | 1,000,000 | | | 1,083,260 |
Pickerington Local School District, School Facilities Construction & Impt., G.O. Bond, MBIA | | 4.250 | % | | 12/1/2034 | | Aaa | | | 2,500,000 | | | 2,373,025 |
Springfield City School District, Prerefunded Balance, G.O. Bond, FGIC | | 5.200 | % | | 12/1/2023 | | Aaa | | | 325,000 | | | 355,111 |
| | | | | | | | | | | | | |
| | | | | | | | | | | | | 9,730,615 |
| | | | | | | | | | | | | |
| | |
| 14 | | The accompanying notes are an integral part of the financial statements. |
Investment Portfolio - December 31, 2007
| | | | | | | | | | | | | | |
| | | Coupon
Rate | | | Maturity
Date | | Credit
Rating1
(unaudited) | | | Principal
Amount | | Value
(Note 2) |
| | | | | | | | | | | | | | |
| | | |
MUNICIPAL SECURITIES (continued) | | | | | | | | | |
| | | | | |
Oklahoma - 1.2% | | | | | | | | | | | | | | |
Oklahoma City, G.O. Bond, MBIA | | 4.250 | % | | 3/1/2023 | | Aaa | | | $ | 2,000,000 | | $ | 1,988,840 |
Oklahoma State Turnpike Authority, Prerefunded Balance, Series A, Revenue Bond, FGIC | | 5.000 | % | | 1/1/2023 | | Aaa | | | | 750,000 | | | 764,595 |
| | | | | | | | | | | | | | |
| | | | | | | | | | | | | | 2,753,435 |
| | | | | | | | | | | | | | |
Oregon - 3.1% | | | | | | | | | | | | | | |
Josephine County Unit School District Three Rivers, Prerefunded Balance, G.O. Bond, FSA | | 5.250 | % | | 6/15/2017 | | Aaa | | | | 825,000 | | | 881,851 |
Metro, G.O. Bond | | 5.000 | % | | 6/1/2022 | | Aaa | | | | 3,000,000 | | | 3,238,260 |
Oregon State Board of Higher Education, Prerefunded Balance, Series B, G.O. Bond | | 5.000 | % | | 8/1/2033 | | Aa2 | | | | 1,500,000 | | | 1,546,245 |
Salem Water & Sewer , Revenue Bond, FSA | | 5.000 | % | | 5/1/2014 | | Aaa | | | | 1,120,000 | | | 1,221,752 |
Washington County School District No. 015 Forest Grove, Prerefunded Balance, G.O.
Bond, FSA | | 5.500 | % | | 6/15/2017 | | Aaa | | | | 500,000 | | | 538,520 |
| | | | | | | | | | | | | | |
| | | | | | | | | | | | | | 7,426,628 |
| | | | | | | | | | | | | | |
Pennsylvania - 2.9% | | | | | | | | | | | | | | |
Jenkintown School District, Series A, G.O. Bond, FGIC | | 4.500 | % | | 5/15/2032 | | Aaa | | | | 1,000,000 | | | 976,650 |
Lancaster School District, G.O. Bond, FSA | | 5.000 | % | | 6/1/2019 | | Aaa | | | | 1,200,000 | | | 1,305,132 |
Pennsylvania State, G.O. Bond, MBIA | | 5.000 | % | | 1/1/2011 | | Aaa | | | | 1,500,000 | | | 1,578,405 |
Pennsylvania State Turnpike Commission, Prerefunded Balance, Revenue Bond, AMBAC | | 5.375 | % | | 7/15/2019 | | Aaa | | | | 530,000 | | | 573,937 |
Philadelphia, Water & Wastewater, Revenue Bond, MBIA | | 5.600 | % | | 8/1/2018 | | Aaa | | | | 20,000 | | | 21,995 |
Plum Boro School District, Series A, G.O. Bond, FGIC | | 4.500 | % | | 9/15/2030 | | AAA | 2 | | | 855,000 | | | 838,251 |
Uniontown Area School District, G.O. Bond, FSA | | 4.350 | % | | 10/1/2034 | | Aaa | | | | 1,500,000 | | | 1,435,860 |
| | | | | | | | | | | | | | |
| | | | | | | | | | | | | | 6,730,230 |
| | | | | | | | | | | | | | |
Rhode Island - 0.4% | | | | | | | | | | | | | | |
Rhode Island Clean Water Finance Agency,
Series A, Revenue Bond, MBIA | | 5.000 | % | | 10/1/2035 | | Aaa | | | | 1,000,000 | | | 1,020,950 |
| | | | | | | | | | | | | | |
South Carolina - 3.4% | | | | | | | | | | | | | | |
Beaufort County School District, Prerefunded Balance, Series A, G.O. Bond | | 5.000 | % | | 3/1/2020 | | Aa1 | | | | 500,000 | | | 527,650 |
Beaufort County, G.O. Bond, MBIA | | 4.250 | % | | 3/1/2024 | | Aaa | | | | 790,000 | | | 780,860 |
Charleston County, Transportation Sales Tax, G.O. Bond | | 5.000 | % | | 11/1/2017 | | Aa1 | | | | 1,000,000 | | | 1,093,490 |
| | |
| The accompanying notes are an integral part of the financial statements. | | 15 |
Investment Portfolio - December 31, 2007
| | | | | | | | | | | | | | |
| | | Coupon
Rate | | | Maturity
Date | | Credit
Rating1
(unaudited) | | | Principal
Amount | | Value
(Note 2) |
| | | | | | | | | | | | | | |
| | | |
MUNICIPAL SECURITIES (continued) | | | | | | | | | |
| | | | | |
South Carolina (continued) | | | | | | | | | | | | | | |
Orangeburg County Consolidated School District 5, Prerefunded Balance, G.O. Bond | | 5.625 | % | | 3/1/2019 | | Aa1 | | | $ | 800,000 | | $ | 841,632 |
South Carolina, State Institutional - South Carolina State University, Series D, G.O. Bond | | 4.250 | % | | 10/1/2026 | | Aaa | | | | 1,250,000 | | | 1,225,838 |
South Carolina, Transportation Infrastructure Bank, Prerefunded Balance, Series A, Revenue Bond, AMBAC | | 5.250 | % | | 10/1/2021 | | Aaa | | | | 1,500,000 | | | 1,571,025 |
South Carolina, Transportation Infrastructure Bank, Series B, Revenue Bond, AMBAC | | 4.250 | % | | 10/1/2027 | | Aaa | | | | 2,000,000 | | | 1,901,200 |
| | | | | | | | | | | | | | |
| | | | | | | | | | | | | | 7,941,695 |
| | | | | | | | | | | | | | |
South Dakota - 0.3% | | | | | | | | | | | | | | |
Rapid City Area School District No. 51-4, Capital Outlay Certificates, G.O. Bond, FSA | | 4.750 | % | | 1/1/2018 | | Aaa | | | | 650,000 | | | 650,000 |
| | | | | | | | | | | | | | |
Tennessee - 1.3% | | | | | | | | | | | | | | |
Rhea County, Prerefunded Balance, G.O. Bond, MBIA | | 5.000 | % | | 4/1/2018 | | Aaa | | | | 950,000 | | | 1,003,846 |
Shelby County, Series A, G.O. Bond | | 5.500 | % | | 3/1/2010 | | Aa2 | | | | 2,000,000 | | | 2,102,020 |
| | | | | | | | | | | | | | |
| | | | | | | | | | | | | | 3,105,866 |
| | | | | | | | | | | | | | |
Texas - 5.7% | | | | | | | | | | | | | | |
Alamo Community College District, Series A, G.O. Bond, MBIA | | 5.000 | % | | 8/15/2024 | | Aaa | | | | 1,020,000 | | | 1,072,438 |
Alvin Independent School District, G.O. Bond | | 4.375 | % | | 2/15/2024 | | Aaa | | | | 750,000 | | | 744,053 |
Brazoria County, G.O. Bond, FGIC | | 4.750 | % | | 9/1/2011 | | Aaa | | | | 445,000 | | | 449,357 |
Brazos River Authority, Series B, Revenue Bond, FGIC | | 4.250 | % | | 12/1/2017 | | Aaa | | | | 1,125,000 | | | 1,146,623 |
Canyon Independent School District, School Building, G.O. Bond | | 4.700 | % | | 2/15/2025 | | AAA | 2 | | | 1,440,000 | | | 1,469,275 |
Del Valle Independent School District, School Building, G.O. Bond | | 5.000 | % | | 6/15/2019 | | AAA | 2 | | | 1,845,000 | | | 1,984,445 |
Fort Bend County, G.O. Bond, MBIA | | 4.750 | % | | 3/1/2031 | | Aaa | | | | 1,000,000 | | | 1,007,330 |
Huntsville Independent School District, G.O. Bond | | 4.500 | % | | 2/15/2029 | | Aaa | | | | 1,220,000 | | | 1,205,189 |
McKinney Waterworks & Sewer, Revenue Bond, FGIC | | 4.750 | % | | 3/15/2024 | | Aaa | | | | 1,000,000 | | | 1,013,400 |
San Antonio Water, Revenue Bond, FGIC | | 4.375 | % | | 5/15/2029 | | Aaa | | | | 1,400,000 | | | 1,331,736 |
San Patricio Municipal Water District, Prerefunded Balance, Revenue Bond, FSA | | 5.200 | % | | 7/10/2028 | | Aaa | | | | 490,000 | | | 505,798 |
University of Texas, Financing System, Series F, Revenue Bond | | 4.750 | % | | 8/15/2028 | | Aaa | | | | 1,000,000 | | | 1,019,240 |
| | |
| 16 | | The accompanying notes are an integral part of the financial statements. |
Investment Portfolio - December 31, 2007
| | | | | | | | | | | | | |
| | | Coupon
Rate | | | Maturity
Date | | Credit
Rating1
(unaudited) | | Principal
Amount | | Value
(Note 2) |
| | | | | | | | | | | | | |
| | | |
MUNICIPAL SECURITIES (continued) | | | | | | | | |
| | | | | |
Texas (continued) | | | | | | | | | | | | | |
Waller Consolidated Independent School District, G.O. Bond | | 4.750 | % | | 2/15/2023 | | Aaa | | $ | 500,000 | | $ | 506,925 |
| | | | | | | | | | | | | |
| | | | | | | | | | | | | 13,455,809 |
| | | | | | | | | | | | | |
Utah - 1.5% | | | | | | | | | | | | | |
Mountain Regional Water Special Service District, Revenue Bond, MBIA | | 5.000 | % | | 12/15/2030 | | Aaa | | | 1,240,000 | | | 1,270,095 |
Provo City School District, Series B, G.O. Bond | | 4.000 | % | | 6/15/2014 | | Aaa | | | 1,100,000 | | | 1,139,369 |
St. George, Parks and Recreation, G.O. Bond, AMBAC | | 4.000 | % | | 8/1/2019 | | Aaa | | | 795,000 | | | 791,335 |
Utah State Building Ownership Authority,
Series C, Revenue Bond, FSA | | 5.500 | % | | 5/15/2011 | | Aaa | | | 300,000 | | | 321,384 |
| | | | | | | | | | | | | |
| | | | | | | | | | | | | 3,522,183 |
| | | | | | | | | | | | | |
Vermont - 0.4% | | | | | | | | | | | | | |
Vermont State, Series D, G.O. Bond | | 4.500 | % | | 7/15/2025 | | Aaa | | | 1,000,000 | | | 1,012,370 |
| | | | | | | | | | | | | |
Virginia - 3.0% | | | | | | | | | | | | | |
Fairfax County, Public Impt., Series A, G.O. Bond | | 4.000 | % | | 4/1/2017 | | Aaa | | | 2,000,000 | | | 2,046,060 |
Fairfax County, Public Impt., Series A, G.O. Bond | | 4.250 | % | | 4/1/2027 | | Aaa | | | 1,500,000 | | | 1,462,335 |
Norfolk, Capital Impt., G.O. Bond, MBIA | | 4.375 | % | | 3/1/2024 | | Aaa | | | 685,000 | | | 685,171 |
Norfolk, Capital Impt., G.O. Bond, FGIC | | 4.250 | % | | 10/1/2024 | | Aaa | | | 2,500,000 | | | 2,469,175 |
Richmond, Series B, G.O. Bond, FSA | | 4.750 | % | | 7/15/2023 | | Aaa | | | 400,000 | | | 411,560 |
| | | | | | | | | | | | | |
| | | | | | | | | | | | | 7,074,301 |
| | | | | | | | | | | | | |
Washington - 4.3% | | | | | | | | | | | | | |
Franklin County, G.O. Bond, FGIC | | 5.125 | % | | 12/1/2022 | | Aaa | | | 1,000,000 | | | 1,053,840 |
King County, Series B, G.O. Bond, MBIA | | 5.000 | % | | 1/1/2030 | | Aaa | | | 400,000 | | | 404,344 |
King County School District No. 411 Issaquah, Series A, G.O. Bond, FSA | | 5.250 | % | | 12/1/2018 | | Aaa | | | 2,420,000 | | | 2,630,056 |
King County, Sewer, Series A, Revenue Bond, MBIA | | 4.500 | % | | 1/1/2032 | | Aaa | | | 1,070,000 | | | 1,053,019 |
King County Sewer, Revenue Bond, FSA | | 5.000 | % | | 1/1/2024 | | Aaa | | | 1,460,000 | | | 1,544,855 |
Seattle, Drain & Wastewater, Revenue Bond, MBIA | | 4.375 | % | | 2/1/2026 | | Aaa | | | 2,000,000 | | | 1,971,660 |
Washington State, Prerefunded Balance, Series A, G.O. Bond | | 5.000 | % | | 1/1/2023 | | Aa1 | | | 410,000 | | | 410,000 |
Washington State, Motor Vehicle Fuel Tax,
G.O. Bond, AMBAC | | 5.000 | % | | 1/1/2025 | | Aaa | | | 1,000,000 | | | 1,050,260 |
| | | | | | | | | | | | | |
| | | | | | | | | | | | | 10,118,034 |
| | | | | | | | | | | | | |
| | |
| The accompanying notes are an integral part of the financial statements. | | 17 |
Investment Portfolio - December 31, 2007
| | | | | | | | | | | | | |
| | | Coupon
Rate | | | Maturity
Date | | Credit
Rating1
(unaudited) | | Principal
Amount/
Shares | | Value
(Note 2) |
| | | | | | | | | | | | | |
| | | |
MUNICIPAL SECURITIES (continued) | | | | | | | | |
| | | | | |
West Virginia - 0.3% | | | | | | | | | | | | | |
West Virginia State Water Development Authority, Series A, Revenue Bond, FGIC | | 4.250 | % | | 11/1/2026 | | Aaa | | $ | 820,000 | | $ | 774,761 |
| | | | | | | | | | | | | |
Wisconsin - 2.7% | | | | | | | | | | | | | |
Central Brown County Water Authority, Water Systems, Revenue Bond, AMBAC | | 5.000 | % | | 12/1/2035 | | Aaa | | | 1,500,000 | | | 1,544,400 |
Eau Claire, Series B, G.O. Bond, MBIA | | 4.000 | % | | 4/1/2015 | | Aaa | | | 1,195,000 | | | 1,229,822 |
Kenosha, Series B, G.O. Bond, FSA | | 5.000 | % | | 9/1/2011 | | Aaa | | | 765,000 | | | 812,881 |
Oshkosh, Corporate Purposes, Series A, G.O. Bond, FGIC | | 5.050 | % | | 12/1/2021 | | Aaa | | | 450,000 | | | 473,459 |
Stoughton Area School District, G.O. Bond, FGIC | | 4.875 | % | | 4/1/2016 | | Aaa | | | 500,000 | | | 522,800 |
Two Rivers Public School District, Prerefunded Balance, G.O. Bond, FSA | | 5.625 | % | | 3/1/2019 | | Aaa | | | 415,000 | | | 436,597 |
West De Pere School District, Prerefunded Balance, Series A, G.O. Bond, FSA | | 5.250 | % | | 10/1/2017 | | Aaa | | | 500,000 | | | 527,835 |
Wisconsin State Transportation, Series A, Revenue Bond, FSA | | 5.000 | % | | 7/1/2025 | | Aaa | | | 700,000 | | | 732,046 |
| | | | | | | | | | | | | |
| | | | | | | | | | | | | 6,279,840 |
| | | | | | | | | | | | | |
TOTAL MUNICIPAL SECURITIES
(Identified Cost $224,247,070) | | | | | | | | | | | | | 226,486,115 |
| | | | | | | | | | | | | |
| | | | | |
SHORT-TERM INVESTMENTS - 2.7% | | | | | | | | | | | | | |
Dreyfus Municipal Reserves - Class R
(Identified Cost $6,450,133) | | | | | | | | | | 6,450,133 | | | 6,450,133 |
| | | | | | | | | | | | | |
TOTAL INVESTMENTS - 98.8%
(Identified Cost $230,697,203) | | | | | | | | | | | | | 232,936,248 |
| | | | | |
OTHER ASSETS, LESS LIABILITIES - 1.2% | | | | | | | | | | | | | 2,772,303 |
| | | | | | | | | | | | | |
NET ASSETS - 100% | | | | | | | | | | | | $ | 235,708,551 |
| | | | | | | | | | | | | |
Key:
G.O. Bond - General Obligation Bond
Impt. - Improvement
No. - Number
Scheduled principal and interest payments are guaranteed by:
AMBAC (AMBAC Assurance Corp.)
CIFG (CIFG North America, Inc.)
FGIC (Financial Guaranty Insurance Co.)
FSA (Financial Security Assurance)
MBIA (MBIA, Inc.)
The insurance does not guarantee the market value of the municipal bonds.
1Credit ratings from Moody’s (unaudited).
2Credit ratings from S&P (unaudited).
The Series’ portfolio holds, as a percentage of net assets, greater than 10% in bonds insured by the following companies: MBIA - 23.9%; FSA - 22.1%; FGIC - 14.2%; AMBAC - 10.1%.
| | |
| 18 | | The accompanying notes are an integral part of the financial statements. |
Statement of Assets and Liabilities
December 31, 2007
| | | |
| | | |
ASSETS: | | | |
| |
Investments, at value (identified cost $230,697,203) (Note 2) | | $ | 232,936,248 |
Interest receivable | | | 2,889,287 |
Receivable for fund shares sold | | | 498,733 |
Dividends receivable | | | 23,004 |
| | | |
TOTAL ASSETS | | | 236,347,272 |
| | | |
| LIABILITIES: | | | |
| |
Accrued management fees (Note 3) | | | 99,060 |
Accrued fund accounting and transfer agent fees (Note 3) | | | 14,567 |
Accrued Chief Compliance Officer service fees (Note 3) | | | 714 |
Payable for fund shares repurchased | | | 481,118 |
Audit fees payable | | | 28,964 |
Other payables and accrued expenses | | | 14,298 |
| | | |
TOTAL LIABILITIES | | | 638,721 |
| | | |
TOTAL NET ASSETS | | $ | 235,708,551 |
| | | |
NET ASSETS CONSIST OF: | | | |
| |
Capital stock | | $ | 215,819 |
Additional paid-in-capital | | | 231,862,186 |
Undistributed net investment income | | | 1,366,837 |
Accumulated net realized gain on investments | | | 24,664 |
Net unrealized appreciation on investments | | | 2,239,045 |
| | | |
TOTAL NET ASSETS | | $ | 235,708,551 |
| | | |
NET ASSET VALUE, OFFERING PRICE AND REDEMPTION PRICE PER SHARE ($235,708,551/21,581,894 shares) | | $ | 10.92 |
| | | |
| | |
| The accompanying notes are an integral part of the financial statements. | | 19 |
Statement of Operations
For the Year Ended December 31, 2007
| | | | |
| | | | |
INVESTMENT INCOME: | | | | |
| |
Interest | | $ | 8,532,500 | |
Dividends | | | 283,350 | |
| | | | |
Total Investment Income | | | 8,815,850 | |
| | | | |
| EXPENSES: | | | | |
| |
Management fees (Note 3) | | | 1,031,152 | |
Fund accounting and transfer agent fees (Note 3) | | | 159,743 | |
Directors’ fees (Note 3) | | | 7,809 | |
Chief Compliance Officer service fees (Note 3) | | | 6,100 | |
Custodian fees | | | 11,924 | |
Miscellaneous | | | 72,103 | |
| | | | |
Total Expenses | | | 1,288,831 | |
| | | | |
NET INVESTMENT INCOME | | | 7,527,019 | |
| | | | |
REALIZED AND UNREALIZED GAIN (LOSS) ON
INVESTMENTS: | | | | |
| |
Net realized gain on investments | | | 90,824 | |
Net change in unrealized appreciation on investments | | | (603,383 | ) |
| | | | |
| |
NET REALIZED AND UNREALIZED GAIN (LOSS) ON
INVESTMENTS | | | (512,559 | ) |
| | | | |
NET INCREASE IN NET ASSETS RESULTING FROM
OPERATIONS | | $ | 7,014,460 | |
| | | | |
| | |
| 20 | | The accompanying notes are an integral part of the financial statements. |
Statements of Changes in Net Assets
| | | | | | | | |
| | | For the
Year Ended
12/31/07 | | | For the
Year Ended
12/31/06 | |
| | | | | | | | |
| INCREASE (DECREASE) IN NET ASSETS: | | | | | | | | |
| | |
| OPERATIONS: | | | | | | | | |
| | |
Net investment income | | $ | 7,527,019 | | | $ | 5,054,876 | |
Net realized gain on investments | | | 90,824 | | | | 162,857 | |
Net change in unrealized appreciation on investments | | | (603,383 | ) | | | 319,437 | |
| | | | | | | | |
Net increase from operations | | | 7,014,460 | | | | 5,537,170 | |
| | | | | | | | |
| DISTRIBUTIONS TO SHAREHOLDERS (Note 7): | | | | | | | | |
| | |
From net investment income | | | (7,219,804 | ) | | | (4,612,559 | ) |
From net realized gain on investments | | | (66,160 | ) | | | (134,415 | ) |
| | | | | | | | |
Total distributions to shareholders | | | (7,285,964 | ) | | | (4,746,974 | ) |
| | | | | | | | |
| CAPITAL STOCK ISSUED AND REPURCHASED: | | | | | | | | |
| | |
Net increase from capital share transactions (Note 5) | | | 68,291,443 | | | | 53,933,864 | |
| | | | | | | | |
Net increase in net assets | | | 68,019,939 | | | | 54,724,060 | |
| | |
| NET ASSETS: | | | | | | | | |
| | |
Beginning of year | | | 167,688,612 | | | | 112,964,552 | |
| | | | | | | | |
End of year (including undistributed net investment income of $1,366,837 and $1,059,622, respectively) | | $ | 235,708,551 | | | $ | 167,688,612 | |
| | | | | | | | |
| | |
| The accompanying notes are an integral part of the financial statements. | | 21 |
Financial Highlights
| | | | | | | | | | |
| | |
For the Years Ended |
| | | 12/31/07 | | 12/31/06 | | 12/31/05 | | 12/31/04 | | 12/31/03 |
| | | | | | | | | | |
| | | | | | | | | | |
| Per share data (for a share outstanding throughout each year): | | | | | | | | | | |
Net asset value - Beginning of year | | $10.95 | | $10.90 | | $10.99 | | $11.04 | | $11.00 |
| | | | | | | | | | |
Income (loss) from investment operations: | | | | | | | | | | |
Net investment income | | 0.36 | | 0.37 | | 0.37 | | 0.37 | | 0.41 |
Net realized and unrealized gain (loss) on investments | | (0.02) | | 0.05 | | (0.09) | | 0.04 | | 0.10 |
| | | | | | | | | | |
Total from investment operations | | 0.34 | | 0.42 | | 0.28 | | 0.41 | | 0.51 |
| | | | | | | | | | |
Less distributions to shareholders: | | | | | | | | | | |
From net investment income | | (0.37) | | (0.36) | | (0.36) | | (0.45) | | (0.41) |
From net realized gain on investments | | —2 | | (0.01) | | (0.01) | | (0.01) | | (0.06) |
| | | | | | | | | | |
Total distributions to shareholders | | (0.37) | | (0.37) | | (0.37) | | (0.46) | | (0.47) |
| | | | | | | | | | |
Net asset value - End of year | | $10.92 | | $10.95 | | $10.90 | | $10.99 | | $11.04 |
| | | | | | | | | | |
Total return1 | | 3.20% | | 3.94% | | 2.60% | | 3.80% | | 4.65% |
| Ratios (to average net assets)/Supplemental Data: | | | | | | | | | | |
Expenses | | 0.62% | | 0.66% | | 0.71% | | 0.77% | | 0.78% |
Net investment income | | 3.65% | | 3.71% | | 3.58% | | 3.63% | | 3.83% |
Portfolio turnover | | 3% | | 5% | | 2% | | 5% | | 7% |
Net assets - End of year (000’s omitted) | | $235,709 | | $167,689 | | $112,965 | | $86,441 | | $63,754 |
| | | | | | | | | | |
1Represents aggregate total return for the year indicated, and assumes reinvestment of all distributions.
2Less than $0.01 per share.
| | |
| 22 | | The accompanying notes are an integral part of the financial statements. |
Notes to Financial Statements
Diversified Tax Exempt Series (the “Series”) is a no-load diversified series of Manning & Napier Fund, Inc. (the “Fund”). The Fund is organized in Maryland and is registered under the Investment Company Act of 1940, as amended, as an open-end management investment company.
The Series’ investment objective is to provide as high a level of current income exempt from federal income tax as the Advisor believes is consistent with the preservation of capital.
The Fund’s Advisor is Manning & Napier Advisors, Inc. (the “Advisor”). Shares of the Series are offered to investors, clients and employees of the Advisor and its affiliates. The total authorized capital stock of the Fund consists of 5.0 billion shares of common stock each having a par value of $0.01. As of December 31, 2007, 3.33 billion shares have been designated in total among 27 series, of which 100 million have been designated as Diversified Tax Exempt Series Class A common stock.
| 2. | SIGNIFICANT ACCOUNTING POLICIES |
Security Valuation
Municipal securities will normally be valued on the basis of market valuations provided by an independent pricing service (the “Service”). The Service utilizes the latest price quotations and a matrix system (which considers such factors as security prices of similar securities, yields, maturities and ratings). The Service has been approved by the Fund’s Board of Directors (the “Board”).
Securities for which representative valuations or prices are not available from the Fund’s pricing service may be valued at fair value. Due to the inherent uncertainty of valuations of such securities, the fair value may differ significantly from the values that would have been used had a ready market for such securities existed. Fair value is determined in good faith by the Advisor under procedures approved by and under the general supervision and responsibility of the Fund’s Board.
Short-term investments that mature in sixty days or less are valued at amortized cost, which approximates market value. Investments in open-end investment companies are valued at their net asset value per share on valuation date.
Security Transactions, Investment Income and Expenses
Security transactions are accounted for on trade date. Interest income, including amortization of premium and accretion of discounts using the effective interest method, is earned from settlement date and accrued daily. Dividend income is recorded on an accrual basis on ex-dividend date.
Expenses are recorded on an accrual basis. Most expenses of the Fund can be attributed to a specific series. Expenses which cannot be directly attributed are apportioned among the series in the Fund in such a manner as deemed equitable by the Fund’s Board, taking into consideration, among other things, the nature and type of expense.
The Series uses the identified cost method for determining realized gain or loss on investments for both financial statement and federal income tax reporting purposes.
Notes to Financial Statements
| 2. | SIGNIFICANT ACCOUNTING POLICIES (continued) |
Federal Taxes
The Series’ policy is to comply with the provisions of the Internal Revenue Code applicable to regulated investment companies. The Series is not subject to federal income tax or excise tax to the extent that the Series distributes to shareholders each year its taxable income, including any net realized gains on investments, in accordance with requirements of the Internal Revenue Code. Accordingly, no provision for federal income tax or excise tax has been made in the financial statements.
On June 29, 2007, the Series adopted Financial Accounting Standards Board Interpretation No. 48 - Accounting for Uncertainty in Income Taxes (“FIN 48”). FIN 48 prescribes the minimum recognition threshold a tax position must meet in connection with accounting for uncertainties in income tax positions taken or expected to be taken by an entity before being measured and recognized in the financial statements. Management has determined that FIN 48 did not have a material impact on the Series’ financial statements. The Series files income tax returns in the U.S. federal jurisdiction and various states, as required. No income tax returns are currently under investigation. The statute of limitations on the Series’ tax returns remains open for the years ended December 31, 2004 through December 31, 2007.
Distributions of Income and Gains
Distributions to shareholders of net investment income are made quarterly. Distributions of net realized gains are made annually. An additional distribution may be necessary to avoid taxation of the Series. Distributions are recorded on the ex-dividend date.
Indemnifications
The Fund’s organizational documents provide former and current directors and officers with a limited indemnification against liabilities arising in connection with the performance of their duties to the Fund. In the normal course of business, the Fund may also enter into contracts that provide general indemnifications. The Fund’s maximum exposure under these arrangements is unknown as this would be dependent on future claims that may be made against the Fund. The risk of material loss from such claims is considered remote.
Other
The preparation of financial statements in conformity with accounting principles generally accepted in the United States of America requires management to make estimates and assumptions that affect the reported amounts of assets and liabilities and the disclosure of contingent assets and liabilities at the date of the financial statements and the reported amounts of income and expenses during the reporting period. Actual results could differ from those estimates.
| 3. | TRANSACTIONS WITH AFFILIATES |
The Fund has an Investment Advisory Agreement (the “Agreement”) with the Advisor, for which the Series pays a fee, computed daily and payable monthly, at an annual rate of 0.50% of the Series’ average daily net assets.
Under the Agreement, personnel of the Advisor provide the Series with advice and assistance in the choice of investments and the execution of securities transactions, and otherwise maintain the Series’ organization. The Advisor also provides the Fund with necessary office space and fund administration and support services. The salaries of all officers of the Fund (except a percentage of the Fund’s Chief Compliance Officer’s salary, which is paid by the Fund), and of
Notes to Financial Statements
| 3. | TRANSACTIONS WITH AFFILIATES (continued) |
all Directors who are “affiliated persons” of the Fund, or of the Advisor, and all personnel of the Fund, or of the Advisor, performing services relating to research, statistical and investment activities, are paid by the Advisor. Each “non-affiliated” Director receives an annual stipend, which is allocated among all the active series of the Fund. In addition, these Directors also receive a fee per Board meeting attended for each active series of the Fund plus a fee for each committee meeting attended.
The Advisor has contractually agreed, until at least April 30, 2009, to waive its fee and, if necessary, pay other operating expenses of the Series in order to maintain total direct annual fund operating expenses for the Series at no more than 0.85% of average daily net assets each year. For the year ended December 31, 2007, the Advisor did not waive its management fee or reimburse any expenses of the Series. The Advisor is not eligible to recoup any expenses that have been waived or reimbursed in prior years.
Manning & Napier Investor Services, Inc., a registered broker-dealer affiliate of the Advisor, acts as distributor for the Fund’s shares. The services of Manning & Napier Investor Services, Inc. are provided at no additional cost to the Series.
For fund accounting and transfer agent services, the Fund pays the Advisor an annual fee of 0.11% of the Fund’s average daily net assets up to $900 million, 0.07% of the Fund’s average daily net assets between $900 million and $1.5 billion, and 0.04% of the Fund’s average daily net assets over $1.5 billion. Additionally, certain transaction and account-based fees and out-of-pocket expenses, including charges for reporting relating to the Fund’s compliance program, are charged. Expenses not directly attributable to a series are allocated based on each series’ relative net assets or number of accounts, depending on the expense. The Advisor has an agreement with Citi Fund Services Ohio, Inc. (“Citi”) (formerly BISYS Fund Services Ohio, Inc.) under which Citi serves as sub-accountant services and sub-transfer agent.
| 4. | PURCHASES AND SALES OF SECURITIES |
For the year ended December 31, 2007, purchases and sales of securities, other than United States Government securities and short-term securities, were $72,976,121 and $6,329,700, respectively. There were no purchases or sales of United States Government securities.
| 5. | CAPITAL STOCK TRANSACTIONS |
Transactions in shares of Diversified Tax Exempt Series were:
| | | | | | | | | | | | | | |
| | | For the Year
Ended 12/31/07 | | | For the Year
Ended 12/31/06 | |
| | | | | | |
| | | Shares | | | Amount | | | Shares | | | Amount | |
| | | | | | | | | | | | | | |
| | | | | | | | | | | | | | |
Sold | | 8,230,257 | | | $ | 89,579,593 | | | 5,535,132 | | | $ | 60,276,533 | |
Reinvested | | 626,954 | | | | 6,788,154 | | | 414,795 | | | | 4,509,605 | |
Repurchased | | (2,593,583 | ) | | | (28,076,304 | ) | | (1,000,001 | ) | | | (10,852,274 | ) |
| | | | | | | | | | | | | | |
Total | | 6,263,628 | | | $ | 68,291,443 | | | 4,949,926 | | | $ | 53,933,864 | |
| | | | | | | | | | | | | | |
Substantially all of the Series’ shares represent investments by fiduciary accounts over which the Advisor has sole investment discretion.
Notes to Financial Statements
The Series may trade in financial instruments with off-balance sheet risk in the normal course of its investing activities to assist in managing exposure to various market risks. These financial instruments include written options and futures contracts and may involve, to a varying degree, elements of risk in excess of the amounts recognized for financial statement purposes. No such investments were held by the Series on December 31, 2007.
| 7. | FEDERAL INCOME TAX INFORMATION |
The amount and characterization of certain income and capital gains to be distributed are determined in accordance with federal income tax regulations, which may differ from accounting principles generally accepted in the United States of America. These differences are primarily due to differing book and tax treatments in the timing of the recognition of net investment income or gains and losses, including market discount. The Series may periodically make reclassifications among its capital accounts to reflect income and gains available for distribution (or available capital loss carryovers) under income tax regulations, without impacting the Series’ net asset value. Any such reclassifications are not reflected in the financial highlights.
The tax character of distributions paid were as follows:
| | | | | | |
| | | For the Year
Ended 12/31/07 | | For the Year
Ended 12/31/06 |
Ordinary income | | $ | 103,002 | | $ | 32,274 |
Tax exempt income | | | 7,116,802 | | | 4,580,724 |
Long-term capital gains | | | 66,160 | | | 133,976 |
At December 31, 2007, the tax basis components of distributable earnings and the net unrealized appreciation based on identified cost for federal income tax purposes were as follows:
| | | | |
Cost for federal income tax purposes | | $ | 230,655,667 | |
| |
Unrealized appreciation | | $ | 3,312,978 | |
Unrealized depreciation | | | (1,032,397 | ) |
| | | | |
Net unrealized appreciation | | $ | 2,280,581 | |
Undistributed ordinary income | | | 241 | |
Undistributed tax exempt income | | | 1,325,060 | |
Undistributed long-term capital gains | | | 24,664 | |
| 8. | RECENT ACCOUNTING PRONOUNCEMENTS |
In September 2006, FASB Statement of Financial Accounting Standards No. 157, Fair Value Measurements (“FAS 157”) was issued, and is effective for fiscal years beginning after November 15, 2007. FAS 157 defines fair value, establishes a framework for measuring fair value, and expands disclosure about fair value measurements. The standard does not expand the use of fair value in any new circumstances, but provides clarification on acceptable fair value methods and applications. At this time, management is evaluating the implications of FAS 157, but it is not expected to materially impact the Series’ financial statements.
Report of Independent Registered Public Accounting Firm
To the Board of Directors of Manning & Napier Fund, Inc. and Shareholders of Diversified Tax Exempt Series:
In our opinion, the accompanying statement of assets and liabilities, including the investment portfolio, and the related statements of operations and of changes in net assets and the financial highlights present fairly, in all material respects, the financial position of the Diversified Tax Exempt Series (a series of Manning & Napier Fund, Inc., hereafter referred to as the “Series”) at December 31, 2007, and the results of its operations for the year then ended, the changes in its net assets for each of the two years in the period then ended and the financial highlights for each of the five years in the period then ended, in conformity with accounting principles generally accepted in the United States of America. These financial statements and financial highlights (hereafter referred to as “financial statements”) are the responsibility of the Series’ management; our responsibility is to express an opinion on these financial statements based on our audits. We conducted our audits of these financial statements in accordance with the standards of the Public Company Accounting Oversight Board (United States). Those standards require that we plan and perform the audit to obtain reasonable assurance about whether the financial statements are free of material misstatement. An audit includes examining, on a test basis, evidence supporting the amounts and disclosures in the financial statements, assessing the accounting principles used and significant estimates made by management, and evaluating the overall financial statement presentation. We believe that our audits, which included confirmation of securities at December 31, 2007 by correspondence with the custodian, provide a reasonable basis for our opinion.

Columbus, Ohio
February 20, 2008
Supplemental Tax Information (unaudited)
Pursuant to Section 852 of the Internal Revenue Code, as amended, the Series hereby designates $66,160 as capital gains for its taxable year ended December 31, 2007. In addition, the Series hereby designates $7,116,802 as tax exempt dividends for the year ended December 31, 2007.
Renewal of Investment Advisory Agreements (unaudited)
During the period covered by this shareholder report, the Board of Directors (the “Board”) of Manning & Napier Fund, Inc. (the “Fund”) considered approval of two separate investment advisory agreements with Manning & Napier Advisors, Inc. (the “Advisor”):
| | • | | At a meeting held on August 30, 2007, the Board approved a new investment advisory agreement between the Fund and the Advisor (the “New Investment Advisory Agreement”) and recommended that the New Investment Advisory Agreement be submitted to shareholders for approval. Shareholders approved the New Investment Advisory Agreement at a meeting held on December 17, 2007. |
| | • | | At a meeting held on November 12, 2007, the Board approved the continuation of the then-current investment advisory agreement between the Fund and the Advisor (the “Current Investment Advisory Agreement”), which was to be superseded by the New Investment Advisory Agreement upon its approval by the Fund’s shareholders. The continuation of the Current Investment Advisory Agreement was necessary as a result of the delay in obtaining the number of votes necessary to convene the shareholder meeting and approve the New Investment Advisory Agreement with respect to all investment portfolios of the Fund (the “Series”). |
Consideration of New Investment Advisory Agreement:
In response to recent regulatory and compliance initiatives promulgated by the SEC over the past year, the Fund engaged in a comprehensive review of all material aspects of the Fund’s operations, including the Fund’s Current Investment Advisory Agreement. As a result of its review, the Board determined that the Current Investment Advisory Agreement should be amended for the purpose of modernizing the form of the agreement and to include additional provisions in the agreement that are customarily included in investment advisory agreements between registered investment companies and their investment advisors, but which are not included in the Current Investment Advisory Agreement. Accordingly, at the Board meeting on November 16, 2006, representatives of the Advisor presented to the Board proposed changes to the Current Investment Advisory Agreement in order to address the Board’s request to update and modernize the Current Investment Advisory Agreement. As a result of the discussions between the Board and representatives of the Advisor at the November 2006 Board meeting, the Board determined to formally consider the approval of a new investment advisory agreement between the Fund and the Advisor, which would incorporate the changes proposed at the November 2006 Board meeting, at its in-person Board meeting in August 2007.
At an in-person meeting held on August 30, 2007, the Board considered the approval of the New Investment Advisory Agreement between the Fund and the Advisor. Based on the information it received at the meeting and the November 16, 2006 Board meeting, the Board approved the New Investment Advisory Agreement subject to its further approval by the Fund’s shareholders. Representatives of the Advisor attended the meeting and presented additional oral and written information to the Board to assist the Board in its considerations. At the meeting, the Board concluded it was reasonable to take into account the conclusions the Board made when considering and evaluating the renewal of the Current Investment Advisory Agreement (the “2006 Annual Review”), which occurred at the November 16, 2006 in-person Board meeting, as part of its considerations to approve the New Investment Advisory Agreement. The discussion immediately below outlines the materials and information presented to the Board in connection with the Board’s 2006 Annual Review of the Current Investment Advisory Agreement and the conclusions made by the Directors when determining to continue the Current Investment Advisory Agreement for an additional one-year period.
Renewal of Investment Advisory Agreements (unaudited)
In connection with its review and deliberations, the Board considered the following factors and reached a conclusion with respect to such factors.
| | • | | The Board considered the services provided by the Advisor under the Current Investment Advisory Agreement including, among others: deciding what securities to purchase and sell for each Series; arranging for the purchase and sale of such securities by placing orders with broker-dealers; administering the affairs of the Fund (including the books and records of the Fund not maintained by third party service providers such as the custodian or sub-transfer agent); arranging for the insurance coverage for the Fund; and supervising the preparation of tax returns, SEC filings (including registration statements) and reports to shareholders for the Fund. The Board also considered the nature and quality of such services provided under the Current Investment Advisory Agreement in light of the Advisor’s services provided to the Fund for 21 years. The Board discussed the quality of these services with representatives from the Advisor and concluded that the Advisor was performing its services to the Fund required under the Current Investment Advisory Agreement in a reasonable manner. |
| | • | | The Board considered the investment performance of the various Series of the Fund. The investment performance for each Series was reviewed on a cumulative basis since inception and on a one year basis. In addition, annualized performance for the following time periods was considered: inception, three year, five year, ten year, and current market cycle. A market cycle includes periods of both rising and falling markets. Returns for established benchmark indices for each Series were provided for each time period. The Board noted that all the Series were competitive against their respective benchmark indices over all time periods noted above through September 30, 2006. In addition, the Board considered at the meeting (and considers on a quarterly basis) a peer group performance analysis consisting of Morningstar universes of mutual funds with similar investment objectives. The Board discussed the performance with representatives from the Advisor and concluded that the investment performance of each of the Fund’s Series was reasonable based on the Fund’s actual performance and comparative performance, especially performance over the current market cycle. |
| | • | | The Board considered the costs of the Advisor’s services and the profits of the Advisor as they relate to the Advisor’s services to the Fund under the Current Investment Advisory Agreement. In reviewing the Advisor’s costs and profits, the Board discussed the Advisor’s revenues generated from the Fund (on both an actual and adjusted basis) and its expenses associated with providing the services under the Current Investment Advisory Agreement. In addition, the Board reviewed the Advisor’s expenses associated with Fund activities outside of the Current Investment Advisory Agreement (such as expense reimbursements pursuant to expense caps and payments made by the Advisor to third party platforms on which shares of the Fund are available for purchase). It was noted by representatives of the Advisor that 6 of the 18 active Series of the Fund are currently experiencing expenses above the capped expense ratios. After discussing the above costs and profits, the Board concluded that the Advisor’s profitability relating to its services provided under the Current Investment Advisory Agreement was reasonable. |
| | • | | The Board considered the fees and expenses of the various Series of the Fund. The Advisor presented the advisory fees and total expenses for each Series, including the |
Renewal of Investment Advisory Agreements (unaudited)
| | advisory fee adjusted for any expense waivers or reimbursements (either contractual or voluntary) paid by the Advisor. The advisory fees and expense ratios of each Series were compared to an average (on both a mean and median basis) of similar funds as disclosed on the Morningstar database. Representatives of the Advisor discussed with the Board the levels of its advisory fee for each Series of the Fund and as compared to the median and mean advisory fees for similar funds as listed on Morningstar. Expense ratios for every Series, except the High Yield Bond Series, are currently below the median and mean for similar funds as listed on Morningstar. Based on their review of the information provided, the Board concluded that the fees and expenses of each Series of the Fund were reasonable on a comparative basis. |
| | • | | The Board also considered the other benefits the Advisor derives from its relationship with the Fund. Such other benefits include certain research products provided by soft dollars. Given the level of soft dollar transactions involving the Fund, the Board concluded that these additional benefits to the Advisor were reasonable. |
| | • | | In addition to the factors described above, the Board considered the Advisor’s personnel, investment strategies, policies and procedures relating to compliance with personal securities transactions, and reputation, expertise and resources in domestic and foreign financial markets. The Board concluded that these factors support the conclusion that the Advisor performs its services in a reasonable manner. |
| | • | | The Board did not consider economies of scale at this time because of the multiple uses of the Fund (for the Advisor’s discretionary investment account clients in addition to direct investors), the current profitability of the Advisor’s services to the Fund under the Current Investment Advisory Agreement, and the overall size of the Fund complex. |
Based on the Board’s deliberations and their evaluation of the information described above, the Board, including a majority of Directors that are “not interested” as defined in the Investment Company Act of 1940 (the “1940 Act”), concluded that the compensation under the Current Investment Advisory Agreement was fair and reasonable in light of the services and expenses and such other matters as the Directors considered to be relevant in the exercise of their reasonable judgment. Accordingly, the Board approved the renewal of the Current Investment Advisory Agreement for another year. In the course of their deliberations, the Directors did not identify any particular information that was all important or controlling.
As stated above, at the August 30, 2007 Board meeting, the Board concluded it was reasonable to take into account the conclusions set forth above when determining whether to approve the New Investment Advisory Agreement. The Board’s conclusion in this regard was based on the fact that the New Investment Advisory Agreement is identical to the Current Investment Advisory Agreement except for certain provisions of the Agreement which have been updated and modernized in response to the Board’s specific request. Further, the Board’s conclusion in this regard was based on the fact that the New Investment Advisory Agreement does not change either the investment advisory fees payable by the Fund to the Advisor or the day-to-day investment management services the Advisor provides to the Fund.
In addition to the conclusions formed with respect to the 2006 Annual Review, the Directors considered specific information at the August 30, 2007 Board meeting concerning the additional provisions included in the New Investment Advisory Agreement. The Directors considered the fact that these additional provisions are designed to (i) address and memorialize certain standard practices and regulatory requirements of mutual funds and their investment advisors; (ii) further
Renewal of Investment Advisory Agreements (unaudited)
delineate the duties and obligations of the Fund and the Advisor; (iii) modernize the agreement to reflect current industry practice and applicable law; and (iv) generally improve the overall quality of the agreement. The Board further considered the fact that the New Investment Advisory Agreement does not alter the actual day-to-day investment management services provided by the Advisor to each Series of the Fund, and the investment advisory fee rate paid to the Advisor under the New Investment Advisory Agreement for a Series is the same as the fee rate paid by the Series under the Current Investment Advisory Agreement.
Based on its evaluation of the information and the conclusions with respect thereto at its meetings on November 16, 2006 and August 30, 2007, the Board unanimously concluded that: (a) the terms of the New Investment Advisory Agreement were fair and reasonable; (b) the approval of the New Investment Advisory Agreement would be in the best interests of the shareholders and the Fund; and (c) it would recommend the approval of the New Investment Advisory Agreement to shareholders. In the course of their deliberations, the Board did not identify any particular information or factor that was all-important or controlling.
Consideration of Current Investment Advisory Agreement
At a meeting held on November 12, 2007, the Board considered the continuation of the Current Investment Advisory Agreement and simultaneously conducted its annual review of the services provided to the Fund by the Adviser (the “2007 Annual Review”). Representatives of the Advisor attended the meeting and presented additional oral and written information to the Board to assist the Board in its considerations. The discussion immediately below outlines the materials and information presented to the Board in connection with the Board’s 2007 Annual Review of the Current Investment Advisory Agreement and the conclusions made by the Directors when determining to continue the Current Investment Advisory Agreement.
In connection with its review and deliberations, the Board considered the following factors and reached a conclusion with respect to such factors.
| | • | | The Board considered the services provided by the Advisor under the Current Investment Advisory Agreement including, among others: deciding what securities to purchase and sell for each Series; arranging for the purchase and sale of such securities by placing orders with broker-dealers; administering the affairs of the Fund (including the books and records of the Fund not maintained by third party service providers such as the custodian or sub-transfer agent); arranging for the insurance coverage for the Fund; and supervising the preparation of tax returns, SEC filings (including registration statements) and reports to shareholders for the Fund. The Board also considered the nature and quality of such services provided under the Current Investment Advisory Agreement in light of the Advisor’s services provided to the Fund for 21 years. The Board discussed the quality of these services with representatives from the Advisor and concluded that the Advisor was performing its services to the Fund required under the Current Investment Advisory Agreement in a reasonable manner. |
| | • | | The Board considered the investment performance of the various Series of the Fund. The investment performance for each Series was reviewed on a cumulative basis since inception and on a one year basis. In addition, annualized performance for the following time periods was considered: inception, three year, five year, ten year, and current market cycle. A market cycle includes periods of both rising and falling markets. Returns for established benchmark indices for each Series were provided for |
Renewal of Investment Advisory Agreements (unaudited)
| | each time period. The Board noted that all the Series were competitive against their respective benchmark indices over all time periods noted above through September 30, 2007. In addition, the Board considered at the meeting (and considers on a quarterly basis) a peer group performance analysis consisting of Morningstar universes of mutual funds with similar investment objectives. The Board discussed the performance with representatives from the Advisor and concluded that the investment performance of each of the Fund’s Series was reasonable based on the Fund’s actual performance and comparative performance, especially performance over the current market cycle. |
| | • | | The Board considered the costs of the Advisor’s services and the profits of the Advisor as they relate to the Advisor’s services to the Fund under the Current Investment Advisory Agreement. In reviewing the Advisor’s costs and profits, the Board discussed the Advisor’s revenues generated from the Fund (on both an actual and adjusted basis) and its expenses associated with providing the services under the Current Investment Advisory Agreement. In addition, the Board reviewed the Advisor’s expenses associated with Fund activities outside of the Current Investment Advisory Agreement (such as expense reimbursements pursuant to expense caps and payments made by the Advisor to third party platforms on which shares of the Fund are available for purchase). It was noted by representatives of the Advisor that 4 of the 18 active Series of the Fund are currently experiencing expenses above the capped expense ratios. After discussing the above costs and profits, the Board concluded that the Advisor’s profitability relating to its services provided under the Current Investment Advisory Agreement was reasonable. |
| | • | | The Board considered the fees and expenses of the various Series of the Fund. The Advisor presented the advisory fees and total expenses for each Series, including the advisory fee adjusted for any expense waivers or reimbursements (either contractual or voluntary) paid by the Advisor. The advisory fees and expense ratios of each Series were compared to an average (on both a mean and median basis) of similar funds as disclosed on the Morningstar database. Representatives of the Advisor discussed with the Board the levels of its advisory fee for each Series of the Fund and as compared to the median and mean advisory fees for similar funds as listed on Morningstar. Expense ratios for every Series, except the High Yield Bond Series and Global Fixed Income Series, are currently below the median and mean for similar funds as listed on Morningstar. Based on their review of the information provided, the Board concluded that the fees and expenses of each Series of the Fund were reasonable on a comparative basis. |
| | • | | The Board also considered the other benefits the Advisor derives from its relationship with the Fund. Such other benefits include certain research products provided by soft dollars. Given the level of soft dollar transactions involving the Fund, the Board concluded that these additional benefits to the Advisor were reasonable. |
| | • | | In addition to the factors described above, the Board considered the Advisor’s personnel, investment strategies, policies and procedures relating to compliance with personal securities transactions, and reputation, expertise and resources in domestic and foreign financial markets. The Board concluded that these factors support the conclusion that the Advisor performs its services in a reasonable manner. |
Renewal of Investment Advisory Agreements (unaudited)
| | • | | The Board did not consider economies of scale at this time because of the multiple uses of the Fund (for the Advisor’s discretionary investment account clients in addition to direct investors), the current profitability of the Advisor’s services to the Fund under the Current Investment Advisory Agreement, and the overall size of the Fund complex. |
Based on the Board’s deliberations and their evaluation of the information described above, the Board, including a majority of Directors that are not “interested persons” as defined in the 1940 Act, concluded that the compensation under the Current Investment Advisory Agreement was fair and reasonable in light of the services and expenses and such other matters as the Directors considered to be relevant in the exercise of their reasonable judgment. Accordingly, the Board approved the renewal of the Current Investment Advisory Agreement. In the course of their deliberations, the Directors did not identify any particular information that was all important or controlling.
Proxy Voting Results (unaudited)
A special meeting of the shareholders of Manning & Napier Fund, Inc. was held on November 12, 2007. The number of votes necessary to conduct the meeting and approve each proposal was obtained, and the results of the votes of shareholders on proposals before them are listed below:
PROPOSAL 1:
Election of Directors.
| | | | |
| | | Number of Shares
voted for | | Number of Shares
withheld |
B. Reuben Auspitz | | 215,932,354.541 | | 15,898,685.154 |
Stephen B. Ashley | | 215,960,751.214 | | 15,870,288.481 |
Peter L. Faber | | 217,504,725.208 | | 14,326,314.487 |
Harris H. Rusitzky | | 215,924,013.609 | | 15,907,026.086 |
PROPOSAL 2:
To approve the investment advisory agreement between Manning & Napier Advisors, Inc. and Manning & Napier Fund, Inc.
| | |
| | | Number of
shares voted |
For | | 17,150,451.809 |
Against | | 0 |
Abstain (includes broker non-votes) | | 15,449.000 |
PROPOSAL 3:
Eliminating, amending, or reclassifying certain fundamental investment policies or restrictions.
Proposal 3.A.i. To approve changes to the fundamental policy regarding borrowing money.
| | |
| | | Number of
shares voted |
For | | 17,150,451.809 |
Against | | 0 |
Abstain (includes broker non-votes) | | 15,449.000 |
Proposal 3.A.ii. To approve changes to the fundamental policy regarding percentage of assets invested in any one industry.
| | |
| | | Number of
shares voted |
For | | 17,150,451.809 |
Against | | 0 |
Abstain (includes broker non-votes) | | 15,449.000 |
Proposal 3.A.iii. To approve changes to the fundamental policy regarding loans.
| | |
| | | Number of
shares voted |
For | | 17,150,451.809 |
Against | | 0 |
Abstain (includes broker non-votes) | | 15,449.000 |
Proxy Voting Results (unaudited)
Proposal 3.A.iv. To approve changes to the fundamental policy regarding issuance of senior securities or pledging its assets.
| | |
| | | Number of
shares voted |
For | | 17,150,451.809 |
Against | | 0 |
Abstain (includes broker non-votes) | | 15,449.000 |
Proposal 3.A.v. To approve changes to the fundamental policy regarding buying or selling of commodities or commodity contracts.
| | |
| | | Number of
shares voted |
For | | 17,150,451.809 |
Against | | 0 |
Abstain (includes broker non-votes) | | 15,449.000 |
Proposal 3.A.vi. To approve changes to the fundamental policy regarding underwriting of securities.
| | |
| | | Number of
shares voted |
For | | 17,150,451.809 |
Against | | 0 |
Abstain (includes broker non-votes) | | 15,449.000 |
Proposal 3.A.vii. To approve changes to the fundamental policy regarding diversification.
| | |
| | | Number of
shares voted |
For | | 17,150,451.809 |
Against | | 0 |
Abstain (includes broker non-votes) | | 15,449.000 |
Proposal 3.B.i. To approve changes to the policy/restriction regarding investment of its total net assets in securities of issuers that are restricted from being sold to the public without registration.
| | |
| | | Number of
shares voted |
For | | 17,150,451.809 |
Against | | 0 |
Abstain (includes broker non-votes) | | 15,449.000 |
Proposal 3.B.ii. To approve changes to the policy/restriction regarding the purchase of securities on margin.
| | |
| | | Number of
shares voted |
For | | 17,150,451.809 |
Against | | 0 |
Abstain (includes broker non-votes) | | 15,449.000 |
Proxy Voting Results (unaudited)
Proposal 3.B.iii. To approve changes to the policy/restriction regarding acquiring securities of other investment companies.
| | |
| | | Number of
shares voted |
For | | 17,150,451.809 |
Against | | 0 |
Abstain (includes broker non-votes) | | 15,449.000 |
Proposal 3.B.v. To approve changes to the policy/restriction regarding options on securities and with respect to stock index and currency futures and related options.
| | |
| | | Number of
shares voted |
For | | 17,150,451.809 |
Against | | 0 |
Abstain (includes broker non-votes) | | 15,449.000 |
Proposal 3.B.vi. To approve changes to the policy/restriction regarding hedging and derivative transactions.
| | |
| | | Number of
shares voted |
For | | 17,150,451.809 |
Against | | 0 |
Abstain (includes broker non-votes) | | 15,449.000 |
Proposal 3.B.vii. To approve changes to the policy/restriction regarding the purchase of foreign securities.
| | |
| | | Number of
shares voted |
For | | 17,150,451.809 |
Against | | 0 |
Abstain (includes broker non-votes) | | 15,449.000 |
Proposal 3.C.i. To approve changes to the policy/restriction regarding investment for the purpose of exercising control over management.
| | |
| | | Number of
shares voted |
For | | 17,150,451.809 |
Against | | 0 |
Abstain (includes broker non-votes) | | 15,449.000 |
Proposal 3.C.iii. To approve changes to the policy/restriction regarding short sales or short positions.
| | |
| | | Number of
shares voted |
For | | 17,150,451.809 |
Against | | 0 |
Abstain (includes broker non-votes) | | 15,449.000 |
Proxy Voting Results (unaudited)
Proposal 3.C.iv. To approve changes to the policy/restriction regarding participation in a joint or joint and several basis in trading account in securities.
| | |
| | | Number of
shares voted |
For | | 17,150,451.809 |
Against | | 0 |
Abstain (includes broker non-votes) | | 15,449.000 |
Proposal 3.C.v. To approve changes to the policy/restriction regarding investment in oil, gas or other mineral exploration or development programs.
| | |
| | | Number of
shares voted |
For | | 17,150,451.809 |
Against | | 0 |
Abstain (includes broker non-votes) | | 15,449.000 |
Proposal 3.C.vi. To approve changes to the policy/restriction regarding officers and directors of the Fund.
| | |
| | | Number of
shares voted |
For | | 17,150,451.809 |
Against | | 0 |
Abstain (includes broker non-votes) | | 15,449.000 |
Proposal 3.C.vii. To approve changes to the policy/restriction regarding investing in any company with less than three years continuous operation.
| | |
| | | Number of
shares voted |
For | | 17,150,451.809 |
Against | | 0 |
Abstain (includes broker non-votes) | | 15,449.000 |
Directors’ and Officers’ Information (unaudited)
The Statement of Additional Information provides additional information about the Fund’s directors and officers and can be obtained without charge by calling 1-800-466-3863, at www.manningnapieradvisors.com, or on the EDGAR Database on the SEC Internet web site (http://www.sec.gov). The following chart shows certain information about the Fund’s officers and directors, including their principal occupations during the last five years. Unless specific dates are provided, the individuals have held the listed positions for longer than five years.
INTERESTED DIRECTOR/OFFICER
| | |
| Name: | | B. Reuben Auspitz* |
| Address: | | 290 Woodcliff Drive
Fairport, NY 14450 |
| Age: | | 60 |
| Current Position(s) Held with Fund: | | Principal Executive Officer, President, Chairman & Director |
| Term of Office1 & Length of Time Served: | | Indefinite - Director since 1984; Vice President 1984 - 2003; President since 2004; Principal Executive Officer since 2002 |
| Principal Occupation(s) During Past 5 Years: | | Executive Vice President; Co-Executive Director; Executive Group Member**; Chief Compliance Officer since 2004 - Manning & Napier Advisors, Inc. President; Director - Manning & Napier Investor Services, Inc. Holds or has held one or more of the following titles for various subsidiaries and affiliates: President, Vice President, Director, Chairman, Treasurer, Chief Compliance Officer or Member. |
| Number of Portfolios Overseen within Fund Complex: | | 27 |
| Other Directorships Held Outside Fund Complex: | | N/A |
| |
| INDEPENDENT DIRECTORS | | |
| |
| Name: | | Stephen B. Ashley |
| Address: | | 290 Woodcliff Drive
Fairport, NY 14450 |
| Age: | | 67 |
| Current Position(s) Held with Fund: | | Director, Audit Committee Member, Governance & Nominating Committee Member |
| Term of Office & Length of Time Served: | | Indefinite - Since 1996 |
| Principal Occupation(s) During Past 5 Years: | | Chairman, Director, President & Chief Executive Officer, The Ashley Group (property management and investment) |
| Number of Portfolios Overseen within Fund Complex: | | 27 |
| Other Directorships Held Outside Fund Complex: | | The Ashley Group Fannie Mae |
| Name: | | Peter L. Faber |
| Address: | | 290 Woodcliff Drive
Fairport, NY 14450 |
| Age: | | 68 |
| Current Position(s) Held with Fund: | | Director, Governance & Nominating Committee Member |
| Term of Office & Length of Time Served: | | Indefinite - Since 1987 |
| Principal Occupation(s) During Past 5 Years: | | Senior Counsel, McDermott, Will & Emery LLP (law firm) |
| Number of Portfolios Overseen within Fund Complex: | | 27 |
| Other Directorships Held Outside Fund Complex: | | Partnership for New York City, Inc. New York Collegium Boston Early Music Festival |
| Name: | | Harris H. Rusitzky |
| Address: | | 290 Woodcliff Drive
Fairport, NY 14450 |
| Age: | | 72 |
| Current Position(s) Held with Fund: | | Director, Audit Committee Member, Governance & Nominating Committee Member |
| Term of Office & Length of Time Served: | | Indefinite - Since 1985 |
| Principal Occupation(s) During Past 5 Years: | | President, The Greening Group (business consultants); Partner, The Restaurant Group (restaurants) |
| Number of Portfolios Overseen within Fund Complex: | | 27 |
| Other Directorships Held Outside Fund Complex: | | N/A |
Directors’ and Officers’ Information (unaudited)
| | |
| Name: | | Paul A. Brooke |
| Address: | | 290 Woodcliff Drive
Fairport, NY 14450 |
| Age: | | 62 |
| Current Position(s) Held with Fund: | | Director, Audit Committee Member, Governance & Nominating Committee Member |
| Term of Office & Length of Time Served: | | Indefinite - Since 2007 |
| Principal Occupation(s) During Past 5 Years: | | Chairman & CEO, Alsius Corp. (investments); Managing Member, PMSV Holdings LLC (investments) |
| Number of Portfolios Overseen within Fund Complex: | | 27 |
| Other Directorships Held Outside Fund Complex: | | Incyte Corp. ViroPharma, Inc. HLTH Corp. Cheyne Capital International MPM Bio-equities GMP Companies HoustonPharma |
| |
| OFFICERS | | |
| |
| Name: | | Jeffrey S. Coons, Ph.D., CFA |
| Address: | | 290 Woodcliff Drive
Fairport, NY 14450 |
| Age: | | 44 |
| Current Position(s) Held with Fund: | | Vice President |
| Term of Office1 & Length of Time Served: | | Since 2004 |
| Principal Occupation(s) During Past 5 Years: | | Co-Director of Research since 2002 & Executive Group Member**, Manning & Napier Advisors, Inc. Holds one or more of the following titles for various subsidiaries and affiliates: President, Director, Treasurer or Senior Trust Officer. |
| Number of Portfolios Overseen within Fund Complex: | | 27 |
| Other Directorships Held Outside Fund Complex: | | N/A |
| Name: | | Christine Glavin |
| Address: | | 290 Woodcliff Drive
Fairport, NY 14450 |
| Age: | | 41 |
| Current Position(s) Held with Fund: | | Principal Financial Officer, Chief Financial Officer |
| Term of Office1 & Length of Time Served: | | Principal Financial Officer since 2002; Chief Financial Officer since 2001 |
| Principal Occupation(s) During Past 5 Years: | | Fund Reporting Manager, Manning & Napier Advisors, Inc. |
| Number of Portfolios Overseen within Fund Complex: | | 27 |
| Other Directorships Held Outside Fund Complex: | | N/A |
| Name: | | Jodi L. Hedberg |
| Address: | | 290 Woodcliff Drive
Fairport, NY 14450 |
| Age: | | 40 |
| Current Position(s) Held with Fund: | | Corporate Secretary, Chief Compliance Officer, Anti-Money Laundering Compliance Officer |
| Term of Office1 & Length of Time Served: | | Corporate Secretary since 1997; Chief Compliance Officer since 2004 |
| Principal Occupation(s) During Past 5 Years: | | Director of Compliance, Manning & Napier Advisors, Inc. and affiliates; Corporate Secretary, Manning & Napier Investor Services, Inc. since 2006 |
| Number of Portfolios Overseen within Fund Complex: | | 27 |
| Other Directorships Held Outside Fund Complex: | | N/A |
*Interested Director, within the meaning of the Investment Company Act of 1940 by reason of his position with the Fund’s investment advisor and distributor. Mr. Auspitz serves as the Executive Vice President and Director, Manning & Napier Advisors, Inc. and President and Director, Manning & Napier Investor Services, Inc., the Fund’s distributor.
**The Executive Group performs the duties of the Office of the Chief Executive of Manning & Napier Advisors, Inc.
1The term of office for President, Vice President, Chief Financial Officer, and Corporate Secretary is one year and until their respective successors are chosen and qualified. All other officers’ terms are indefinite.
(THISPAGEINTENTIONALLYLEFTBLANK)
Literature Requests (unaudited)
Proxy Voting Policies and Procedures
A description of the policies and procedures that the Fund uses to determine how to vote proxies relating to portfolio securities is available, without charge, upon request:
| | |
By phone | | 1-800-466-3863 |
On the Securities and Exchange Commission’s (SEC) web site | | http://www.sec.gov |
Proxy Voting Record
Information regarding how the Fund voted proxies relating to portfolio securities during the most recent 12-month period ended June 30th is available, without charge, upon request:
| | |
By phone | | 1-800-466-3863 |
On the SEC’s web site | | http://www.sec.gov |
Quarterly Portfolio Holdings
The Series’ complete schedule of portfolio holdings for the 1st and 3rd quarters of each fiscal year are provided on Form N-Q, and are available, without charge, upon request:
| | |
By phone | | 1-800-466-3863 |
On the SEC’s web site | | http://www.sec.gov |
The Series’ Form N-Q may be reviewed and copied at the SEC’s Public Reference Room in Washington, D.C. Information on the operation of the Public Reference Room may be obtained by calling 1-800-SEC-0330.
Prospectus and Statement of Additional Information (SAI)
The prospectus and SAI provide additional information about each Series, including charges, expenses and risks. These documents are available, without charge, upon request:
| | |
By phone | | 1-800-466-3863 |
On the SEC’s web site | | http://www.sec.gov |
On the Advisor’s web site | | http://www.manningnapieradvisors.com |
Additional information available at www.manningnapieradvisors.com
1. Fund Holdings - Month-End
2. Fund Holdings - Quarter-End
3. Shareholder Report - Annual
4. Shareholder Report - Semi-Annual
Manning & Napier Fund, Inc.
| | | | |
| NEW YORK TAX EXEMPT SERIES | | | | | Annual Report - December 31, 2007 |

Management Discussion and Analysis (unaudited)
Dear Shareholders:
It would be a bit of an understatement to describe 2007 as an “eventful” year; it was a wild ride during which fixed income investors, including municipal bond investors, were buffeted by a number of factors, some totally new, others quite familiar. “Subprime”, a relatively obscure term, entered the everyday vernacular. Some of these securities that were thought to be “AAA” turned out not to be. There were high profile disasters, as well as conservative investments that turned out to be stellar investments. And, as always seems to be the case, the Federal Reserve (the “Fed”) once again played a prominent role.
In the end, interest rates generally fell across the board. However, in some instances, yields actually finished the year at levels higher than where they started. Unfortunately, this was the case for longer-term municipal bonds. For instance, the market weighted yield for the Merrill Lynch Broad Market 12-22 Year Index increased 12 basis points (0.12%) in 2007 from 4.64% to 4.76%. Yields on longer-term issues increased even more; the Merrill Lynch Broad Market 22+ Year Index started the year yielding 4.81% and finished the year 26 basis points (0.26%) higher at 5.07%. Short-term municipal bond yields on the other hand moved materially lower; the yield on the Merrill Lynch Broad Market 1-3 Year Index dropped 46 basis points (0.46%) from 3.66% to 3.20%.
While not explicitly tied to the U.S. Treasury markets, municipal bonds generally take their cue from what happens there. In 2007, short-term U.S. Treasury interest rates moved sharply lower; longer-term rates also moved lower but to a lesser degree. Those moves reflected the changing state of the economic environment.
The first quarter of the year was relatively quiet since the economic releases were relatively mixed. On the good side, unemployment was down to 4.4% in March, payroll growth was still relatively robust, and the 4-week average of initial claims for unemployment insurance was drifting lower. Unfortunately, the good news in the labor markets was offset by the bad news in the housing sector; it remained under duress, and it started to become apparent that the hoped for bottom of the housing market was still quite a ways off.
During the second quarter of the year, rates on short- and long-term bonds moved in opposite directions, reflecting two distinct factors. For shorter-term bonds, a significant change in the market’s supply/demand dynamics pushed interest rates lower. A shrinking Federal deficit mitigates the Treasury’s borrowing needs, which in turn shrinks the supply of U.S. Treasury Bills, while foreign central banks began paring back their longer-term U.S. Treasury purchases, focusing instead on U.S. Treasury Bills. The combination of a shrinking supply and increased demand pushed short-term U.S. Treasury rates lower. For intermediate-to-longer-term bonds, rates rose due to a marked change in the market’s expectations about monetary policy and the rate of economic growth. As we moved into the summer, a number of the economic releases suggested that the rate of economic growth was picking back up. At the same time, the Fed started to hedge when it came to defining what it considered to be an acceptable rate of inflation. The markets responded by re-adjusting intermediate-to-longer term interest rates higher.
Market psychology definitely changed during the third quarter of the year and a precipitous drop in interest rates began, triggered by a flight to quality and a reassessment of the trajectory of Fed policy. While the problems in the market for subprime mortgage loans were well known prior to the third quarter, the collapse of two high profile hedge funds at Bear Stearns along with a couple of European bank announcements revealed the first set of identifiable victims. That caused investors to exit and/or avoid anything remotely tied to the subprime sector. The proceeds were parked in the perceived safest, most liquid alternative, specifically short-term U.S. Treasury instruments. Given the financial dislocations caused by this flight to quality, both the Fed and European central banks responded by injecting liquidity into the financial system. The Fed began by cutting the discount rate (the rate charged to banks to borrow reserves directly from the Fed), and followed that initial move with its first cut in the Fed Funds target (the rate charged by banks to borrow reserves from each other). Cutting the targeted Fed Funds rate was not only a response to the liquidity concerns associated with a flight to quality, but also a response to a weakening labor market, with the average gains down more than one-third from the gains reported over the prior 12 to 18 months.
Management Discussion and Analysis (unaudited)
During the fourth quarter there were two additional policy moves enacted by the Fed. It followed up its 50 basis point (0.50%) cut in September with 25 basis point (0.25%) cuts in October and again in December. The Fed and the markets were both responding to the headwinds that continued to buffet the U.S. economy. The housing sector continued to sink, with new home sales dropping 50% from their highs, existing home sales down one-third, and home prices posting year-over-year declines, a decidedly rare occurrence. What was more troubling was the fact that the problems in the housing sector appeared to have spilled over into other sectors of the economy. Job growth had slowed and the unemployment rate had risen to 5.0%, a level not seen since the end of 2005. At some point that should affect personal income growth, which had been remarkably robust.
While municipal bonds may take their cue from the U.S. Treasury markets, their movements also depend on factors specific to the municipal market. In 2007, short-term municipal yields moved lower along with U.S. Treasuries, but the magnitude of the move was not as great. Longer-term municipal yields ignored the U.S. Treasury market and those yields actually moved higher. The deviations can be traced to two factors: deteriorating credit quality within the municipal market and the subprime/collateralized debt obligation (CDO) issues that arose in the monoline insurer industry. In terms of credit quality, the debacle in the housing market (affecting property tax revenues), the smallest rise in retail sales since 2002 (affecting sales tax revenues), and modest increases in the equity markets (affecting capital gains tax revenues) put pressure on tax receipts. At the same time, worries about the economy suggest that spending on social services is likely to increase. As for the monoline insurers, their forays into the CDO marketplace caused the ratings agencies to re-examine their AAA credit ratings, which in turn caused municipal investors to look through the insurance overlays to the underlying credit rating of the issuer.
As for the performance of the New York Tax Exempt Series in 2007, its total return was 3.44%. That lagged the total return of the Merrill Lynch 1-12 Year Municipal Bond Index which was 4.98%, but it compares quite favorably with the Lipper average, which was 1.49% in 2007. The Series holds a number of longer-term bonds, which the Index does not. Those longer-term holdings did not perform well in 2007, which explains the underperformance versus the Index. However, those longer-term holdings generated attractive coupons in 2007, and we continue to view them as attractive investments.
We appreciate your business and wish you all the very best in the coming year.
Sincerely,
Manning & Napier Advisors, Inc.
Performance Update as of December 31, 2007 (unaudited)
| | | | | | | | | | |
| | | Average Annual Total Returns
As of December 31, 2007 | | |
| | | One
Year | | Five
Year | | Ten
Year | | Since
Inception1 | | |
Manning & Napier Fund, Inc. - New York Tax Exempt Series2 | | 3.44% | | 3.20% | | 4.28% | | 4.51% | | |
Merrill Lynch 1-12 Year Municipal Bond Index3 | | 4.98% | | 3.77% | | 5.00% | | 5.17% | | |
The following graph compares the value of a $10,000 investment in the Manning & Napier Fund, Inc. - New York Tax Exempt Series for the ten years ended December 31, 2007 to the Merrill Lynch 1-12 Year Municipal Bond Index.
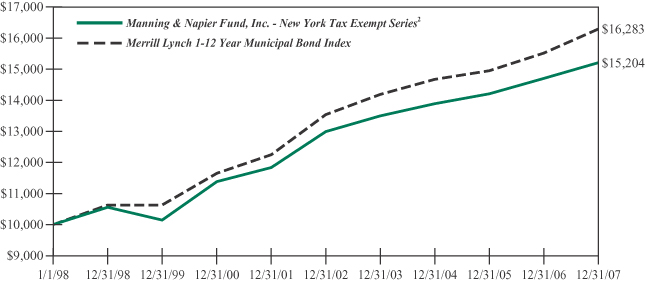
1Performance numbers for the Series and Index are calculated from January 17, 1994, the Series’ inception date.
2The Series’ performance does not reflect the deduction of taxes that a shareholder would pay on fund distributions or the redemption of shares. The Series’ performance is historical and may not be indicative of future results. The performance returns shown are inclusive of the net expense ratio of the Series. For the year ended December 31, 2007, this net expense ratio was 0.65%. The gross expense ratio, which does not account for any voluntary or contractual waivers currently in effect, was 0.65% for the year ended December 31, 2007.
3The Merrill Lynch 1-12 Year Municipal Bond Index is an unmanaged, market weighted index comprised of investment-grade, fixed rate, coupon bearing municipal bonds with maturities greater than one year but less than twelve years. The Index returns assume reinvestment of coupons and, unlike Series returns, do not reflect any fees or expenses.
Shareholder Expense Example (unaudited)
As a shareholder of the Series, you may incur two types of costs: (1) transaction costs, including potential wire charges on redemptions and (2) ongoing costs, including management fees and other Series expenses. This example is intended to help you understand your ongoing costs (in dollars) of investing in the Series and to compare these costs with the ongoing costs of investing in other mutual funds.
The example is based on an investment of $1,000 invested at the beginning of the period and held for the entire period (July 1, 2007 to December 31, 2007).
Actual Expenses
The first line of the table below provides information about actual account values and actual expenses. You may use the information in this line, together with the amount you invested, to estimate the expenses that you paid over the period. Simply divide your account value by $1,000 (for example, an $8,600 account value divided by $1,000 = 8.6), then multiply the result by the number in the first line under the heading entitled “Expenses Paid During Period” to estimate the expenses you paid on your account during this period.
Hypothetical Example for Comparison Purposes
The second line of the table below provides information about hypothetical account values and hypothetical expenses based on the Series’ actual expense ratio and an assumed rate of return of 5% per year before expenses, which is not the Series’ actual return. The hypothetical account values and expenses may not be used to estimate the actual ending account balance or expenses you paid during the period. You may use this information to compare the ongoing costs of investing in the Series and other funds. To do so, compare this 5% hypothetical example with the 5% hypothetical examples that appear in the shareholder reports of the other funds.
Please note that the expenses shown in the table are meant to highlight your ongoing costs only and do not reflect any transaction costs, such as potential wire charges on redemptions. Therefore, the second line of the table is useful in comparing ongoing costs only, and will not help you determine the relative total costs of owning different funds. In addition, if these transaction costs were included, your costs would have been higher.
| | | | | | | | | |
| | | Beginning
Account Value
7/1/07 | | Ending
Account Value
12/31/07 | | Expenses Paid
During Period*
7/1/07-12/31/07 |
Actual | | $ | 1,000.00 | | $ | 1,035.40 | | $ | 3.39 |
Hypothetical
(5% return before expenses) | | $ | 1,000.00 | | $ | 1,021.88 | | $ | 3.36 |
*Expenses are equal to the Series’ annualized expense ratio (for the six-month period) of 0.66%, multiplied by the average account value over the period, multiplied by 184/365 (to reflect the one-half year period). Expenses are based on the most recent fiscal half year; therefore, the expense ratio stated above may differ from the expense ratio stated in the financial highlights, which is based on one-year data.
Portfolio Composition as of December 31, 2007 (unaudited)
Bond Types1
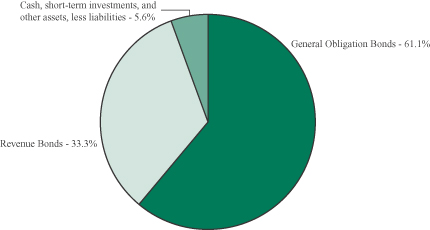
1As a percentage of net assets.
Credit Quality Ratings2,3
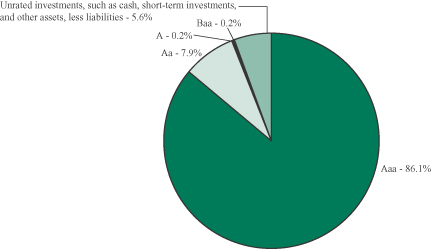
2As a percentage of net assets.
3Based on ratings from Moody’s, or the S&P equivalent. The Series may use different ratings provided by other rating agencies for purposes of determining compliance with the Series’ investment policies.
Investment Portfolio - December 31, 2007
| | | | | | | | | | | | | |
| | | Coupon
Rate | | | Maturity
Date | | Credit
Rating1
(unaudited) | | Principal
Amount | | Value
(Note 2) |
| | | | | | | | | | | | | |
| | |
NEW YORK MUNICIPAL SECURITIES - 94.4% | | | | | | |
Arlington Central School District, G.O. Bond,
MBIA | | 4.625 | % | | 12/15/2024 | | Aaa | | $ | 845,000 | | $ | 861,951 |
Arlington Central School District, G.O. Bond,
MBIA | | 4.625 | % | | 12/15/2025 | | Aaa | | | 365,000 | | | 371,552 |
Beacon City School District, G.O. Bond, MBIA | | 5.600 | % | | 7/15/2019 | | Aaa | | | 500,000 | | | 524,875 |
Brookhaven, Public Impt., G.O. Bond, FGIC | | 4.000 | % | | 5/1/2023 | | Aaa | | | 900,000 | | | 881,757 |
Brookhaven, Public Impt., G.O. Bond, FGIC | | 4.000 | % | | 5/1/2024 | | Aaa | | | 815,000 | | | 790,020 |
Buffalo Fiscal Stability Authority, Sales Tax & State Aid, Series B, Revenue Bond, MBIA | | 5.000 | % | | 9/1/2016 | | Aaa | | | 525,000 | | | 573,358 |
Buffalo Municipal Water Finance Authority, Water Systems, Prerefunded Balance, Series A, Revenue Bond, FGIC | | 5.000 | % | | 7/1/2028 | | Aaa | | | 750,000 | | | 765,307 |
Chautauqua County, Public Impt., Series B, G.O.
Bond, MBIA | | 4.500 | % | | 12/15/2018 | | Aaa | | | 485,000 | | | 510,521 |
Clyde-Savannah Central School District, G.O. Bond, FGIC | | 5.000 | % | | 6/1/2013 | | Aaa | | | 500,000 | | | 540,855 |
Colonie, G.O. Bond, MBIA | | 5.200 | % | | 8/15/2008 | | Aaa | | | 40,000 | | | 40,101 |
Dryden Central School District, G.O. Bond, FSA | | 5.500 | % | | 6/15/2011 | | Aaa | | | 200,000 | | | 202,022 |
Dutchess County, Public Impt., Prerefunded Balance, G.O. Bond, MBIA | | 4.000 | % | | 12/15/2016 | | Aaa | | | 315,000 | | | 327,011 |
Dutchess County, Public Impt., Unrefunded Balance, G.O. Bond, MBIA | | 4.000 | % | | 12/15/2016 | | Aaa | | | 360,000 | | | 371,495 |
Eastchester, Public Impt., Series B, G.O. Bond,
FSA | | 4.900 | % | | 10/15/2011 | | Aaa | | | 385,000 | | | 386,906 |
Ellenville Central School District, G.O. Bond, FSA | | 5.375 | % | | 5/1/2009 | | Aaa | | | 210,000 | | | 211,556 |
Ellenville Central School District, G.O. Bond, AMBAC | | 5.700 | % | | 5/1/2011 | | Aaa | | | 700,000 | | | 712,852 |
Erie County, Public Impt., Series A, G.O. Bond, FGIC | | 4.750 | % | | 10/1/2016 | | Aaa | | | 550,000 | | | 571,681 |
Erie County, Public Impt., Series A, G.O. Bond, FGIC | | 5.000 | % | | 9/1/2014 | | Aaa | | | 500,000 | | | 533,340 |
Fairport Central School District, G.O. Bond, FSA | | 5.000 | % | | 6/1/2019 | | Aaa | | | 500,000 | | | 526,775 |
Franklin Square Union Free School District, G.O. Bond, FGIC | | 5.000 | % | | 1/15/2021 | | Aaa | | | 520,000 | | | 539,859 |
Freeport, Series A, G.O. Bond, FGIC | | 4.000 | % | | 1/15/2014 | | Aaa | | | 540,000 | | | 554,326 |
Greece Central School District, G.O. Bond, FSA | | 4.600 | % | | 6/15/2018 | | Aaa | | | 180,000 | | | 188,177 |
Greece Central School District, G.O. Bond, FSA | | 4.000 | % | | 6/15/2019 | | Aaa | | | 2,675,000 | | | 2,701,215 |
Hampton Bays Union Free School District, G.O. Bond, FSA | | 4.250 | % | | 9/15/2026 | | Aaa | | | 1,140,000 | | | 1,128,326 |
Haverstraw-Stony Point Central School District, G.O. Bond, FSA | | 4.500 | % | | 10/15/2032 | | Aaa | | | 2,000,000 | | | 1,999,880 |
Hempstead Town, Unrefunded Balance, Series B, G.O. Bond, FGIC | | 5.625 | % | | 2/1/2010 | | Aaa | | | 165,000 | | | 165,337 |
Huntington, G.O. Bond, MBIA | | 5.875 | % | | 9/1/2009 | | Aaa | | | 45,000 | | | 45,202 |
| | |
| 6 | | The accompanying notes are an integral part of the financial statements. |
Investment Portfolio - December 31, 2007
| | | | | | | | | | | | | |
| | | Coupon
Rate | | | Maturity
Date | | Credit
Rating1
(unaudited) | | Principal
Amount | | Value
(Note 2) |
| | | | | | | | | | | | | |
| | |
NEW YORK MUNICIPAL SECURITIES (continued) | | | | | | |
Islip, Public Impt., G.O. Bond, FGIC | | 5.375 | % | | 6/15/2015 | | Aaa | | $ | 1,555,000 | | $ | 1,647,476 |
Jamesville-Dewitt Central School District, G.O. Bond, AMBAC | | 5.750 | % | | 6/15/2009 | | Aaa | | | 420,000 | | | 436,871 |
Johnson City Central School District, G.O. Bond, FGIC | | 4.250 | % | | 6/15/2024 | | Aaa | | | 500,000 | | | 493,465 |
Johnson City Central School District, G.O. Bond, FGIC | | 4.375 | % | | 6/15/2028 | | Aaa | | | 1,000,000 | | | 976,060 |
Johnson City Central School District, G.O. Bond, FGIC | | 4.375 | % | | 6/15/2030 | | Aaa | | | 985,000 | | | 954,150 |
Le Roy Central School District, G.O. Bond, FGIC | | 0.100 | % | | 6/15/2008 | | Aaa | | | 350,000 | | | 345,159 |
Long Island Power Authority, Electric Systems, Series F, Revenue Bond, MBIA | | 4.500 | % | | 5/1/2028 | | Aaa | | | 1,880,000 | | | 1,855,240 |
Long Island Power Authority, Electric Systems, Series A, Revenue Bond, FGIC | | 5.000 | % | | 12/1/2019 | | Aaa | | | 1,000,000 | | | 1,076,830 |
Long Island Power Authority, Electric Systems, Series A, Revenue Bond, FGIC | | 5.000 | % | | 12/1/2025 | | Aaa | | | 1,690,000 | | | 1,776,393 |
Longwood Central School District at Middle Island, G.O. Bond, FSA | | 5.000 | % | | 6/15/2017 | | Aaa | | | 250,000 | | | 257,335 |
Longwood Central School District at Middle Island, G.O. Bond, FSA | | 5.000 | % | | 6/15/2018 | | Aaa | | | 250,000 | | | 257,335 |
Metropolitan Transportation Authority, Transportation Facilities, Prerefunded Balance, Series B, Revenue Bond, AMBAC | | 5.000 | % | | 7/1/2018 | | Aaa | | | 1,500,000 | | | 1,600,620 |
Metropolitan Transportation Authority, Dedicated Tax Fund, Series A, Revenue Bond, MBIA | | 5.000 | % | | 11/15/2030 | | Aaa | | | 750,000 | | | 771,157 |
Metropolitan Transportation Authority, Series A, Revenue Bond, FGIC | | 5.000 | % | | 11/15/2025 | | Aaa | | | 1,500,000 | | | 1,555,770 |
Metropolitan Transportation Authority, Series A, Revenue Bond, FSA | | 5.000 | % | | 11/15/2030 | | Aaa | | | 500,000 | | | 514,105 |
Metropolitan Transportation Authority, Series B, Revenue Bond, FSA | | 4.500 | % | | 11/15/2032 | | Aaa | | | 500,000 | | | 493,345 |
Monroe County, Water Impt., G.O. Bond | | 5.250 | % | | 2/1/2017 | | Baa2 | | | 240,000 | | | 242,618 |
Monroe County, Public Impt., G.O. Bond, AMBAC | | 4.125 | % | | 6/1/2020 | | Aaa | | | 1,000,000 | | | 1,008,890 |
Monroe County Water Authority, Revenue Bond | | 5.000 | % | | 8/1/2019 | | Aa3 | | | 1,700,000 | | | 1,732,402 |
Mount Morris Central School District, G.O. Bond, FGIC | | 4.125 | % | | 6/15/2013 | | Aaa | | | 790,000 | | | 824,333 |
Nassau County, Combined Sewer Districts, Series F, G.O. Bond, MBIA | | 5.350 | % | | 7/1/2008 | | Aaa | | | 1,500,000 | | | 1,517,445 |
Nassau County, General Impt., Series C, G.O. Bond, FSA | | 5.125 | % | | 1/1/2014 | | Aaa | | | 500,000 | | | 527,490 |
Nassau County Interim Finance Authority, Sales Tax Secured, Series A, Revenue Bond, AMBAC | | 4.750 | % | | 11/15/2023 | | Aaa | | | 1,000,000 | | | 1,025,170 |
New Hyde Park Garden City Park, Union Free School District, G.O. Bond, FSA | | 4.125 | % | | 6/15/2023 | | Aaa | | | 200,000 | | | 198,034 |
| | |
| The accompanying notes are an integral part of the financial statements. | | 7 |
Investment Portfolio - December 31, 2007
| | | | | | | | | | | | | | |
| | | Coupon
Rate | | | Maturity
Date | | Credit
Rating1
(unaudited) | | | Principal
Amount | | Value
(Note 2) |
| | | | | | | | | | | | | | |
| | |
NEW YORK MUNICIPAL SECURITIES (continued) | | | | | | | |
New Hyde Park Garden City Park, Union Free School District, G.O. Bond, FSA | | 4.125 | % | | 6/15/2024 | | Aaa | | | $ | 250,000 | | $ | 245,480 |
New York City, Series K, G.O. Bond, FSA | | 5.375 | % | | 8/1/2020 | | Aaa | | | | 1,000,000 | | | 1,040,590 |
New York City, Series A, G.O. Bond, CIFG | | 5.000 | % | | 8/1/2024 | | Aaa | | | | 1,000,000 | | | 1,040,910 |
New York City, G.O. Bond, XLCA | | 5.000 | % | | 9/1/2019 | | Aaa | | | | 500,000 | | | 533,150 |
New York City, Prerefunded Balance, Series I, G.O. Bond, MBIA | | 5.000 | % | | 5/15/2028 | | AAA | 2 | | | 175,000 | | | 178,099 |
New York City, Unrefunded Balance, Series I, G.O. Bond, MBIA | | 5.000 | % | | 5/15/2028 | | AAA | 2 | | | 1,725,000 | | | 1,749,650 |
New York City Municipal Water Finance Authority, Water & Sewer Systems, Series A, Revenue Bond, AMBAC | | 5.000 | % | | 6/15/2035 | | Aaa | | | | 750,000 | | | 769,260 |
New York City Transitional Finance Authority, Future Tax Secured, Prerefunded Balance, Series A, Revenue Bond | | 5.500 | % | | 2/15/2011 | | Aa1 | | | | 1,000,000 | | | 1,059,320 |
New York City Municipal Water Finance Authority, Series E, Revenue Bond, FGIC | | 5.000 | % | | 6/15/2026 | | Aaa | | | | 750,000 | | | 775,680 |
New York City Municipal Water Finance Authority, Water & Sewer Systems, Series D, Revenue Bond, AMBAC | | 4.500 | % | | 6/15/2036 | | Aaa | | | | 500,000 | | | 486,680 |
New York City Municipal Water Finance Authority, Water & Sewer Systems, Series A, Revenue Bond | | 4.500 | % | | 6/15/2037 | | Aa2 | | | | 1,000,000 | | | 969,810 |
New York State, Series C, G.O. Bond, FSA | | 5.000 | % | | 4/15/2012 | | Aa3 | | | | 700,000 | | | 750,904 |
New York State, Prerefunded Balance, Series B, G.O. Bond | | 5.125 | % | | 3/1/2018 | | Aa3 | | | | 1,000,000 | | | 1,013,630 |
New York State, Series A, G.O. Bond | | 4.500 | % | | 3/15/2019 | | Aa3 | | | | 500,000 | | | 517,010 |
New York State, Prerefunded Balance, Series D, G.O. Bond, AMBAC | | 5.000 | % | | 7/15/2015 | | Aaa | | | | 500,000 | | | 510,600 |
New York State, Series A, G.O. Bond | | 4.600 | % | | 3/15/2013 | | Aa3 | | | | 475,000 | | | 497,391 |
New York State Dormitory Authority, Columbia University, Series A, Revenue Bond | | 5.000 | % | | 7/1/2025 | | Aaa | | | | 500,000 | | | 519,580 |
New York State Environmental Facilities Corp., Pollution Control, Unrefunded Balance, Series B, Revenue Bond | | 5.200 | % | | 5/15/2014 | | Aaa | | | | 440,000 | | | 470,338 |
New York State Environmental Facilities Corp., Pollution Control, Series A, Revenue Bond | | 5.200 | % | | 6/15/2015 | | Aaa | | | | 25,000 | | | 25,235 |
New York State Environmental Facilities Corp., Clean Water & Drinking, Series B, Revenue Bond | | 5.000 | % | | 6/15/2027 | | Aaa | | | | 1,000,000 | | | 1,028,500 |
New York State Environmental Facilities Corp., Clean Water & Drinking, Revenue Bond | | 4.500 | % | | 6/15/2022 | | Aaa | | | | 300,000 | | | 304,488 |
New York State Environmental Facilities Corp., Clean Water & Drinking, Revenue Bond, MBIA | | 5.000 | % | | 6/15/2021 | | Aaa | | | | 600,000 | | | 633,018 |
| | |
| 8 | | The accompanying notes are an integral part of the financial statements. |
Investment Portfolio - December 31, 2007
| | | | | | | | | | | | | | |
| | | Coupon
Rate | | | Maturity
Date | | Credit
Rating1
(unaudited) | | | Principal
Amount | | Value
(Note 2) |
| | | | | | | | | | | | | | |
| | |
NEW YORK MUNICIPAL SECURITIES (continued) | | | | | | | |
New York State Environmental Facilities Corp., Personal Income Tax, Series A, Revenue Bond | | 5.000 | % | | 12/15/2019 | | AAA | 2 | | $ | 750,000 | | $ | 805,927 |
New York State Housing Finance Agency, State University Construction, Series A, Revenue Bond | | 8.000 | % | | 5/1/2011 | | A1 | | | | 200,000 | | | 216,992 |
New York State Environmental Facilities Corp., Clean Water & Drinking, Series A, Revenue Bond | | 4.500 | % | | 6/15/2036 | | Aaa | | | | 1,000,000 | | | 976,440 |
New York State Environmental Facilities Corp., Clean Water & Drinking, Series B, Revenue
Bond | | 4.500 | % | | 6/15/2036 | | Aa1 | | | | 1,500,000 | | | 1,457,745 |
New York State Thruway Authority, Series F, Revenue Bond, AMBAC | | 5.000 | % | | 1/1/2026 | | Aaa | | | | 340,000 | | | 354,256 |
New York State Thruway Authority, Highway & Bridge, Series C, Revenue Bond, MBIA | | 5.250 | % | | 4/1/2011 | | Aaa | | | | 1,000,000 | | | 1,063,860 |
New York State Thruway Authority, Highway & Bridge, Series C, Revenue Bond, AMBAC | | 5.000 | % | | 4/1/2020 | | Aaa | | | | 750,000 | | | 788,880 |
New York State Thruway Authority, Highway & Bridge, Series B, Revenue Bond, AMBAC | | 5.000 | % | | 4/1/2021 | | Aaa | | | | 1,500,000 | | | 1,594,200 |
New York State Thruway Authority, Highway & Bridge, Prerefunded Balance, Series A, Revenue Bond, FGIC | | 5.500 | % | | 4/1/2015 | | Aaa | | | | 320,000 | | | 346,554 |
New York State Thruway Authority, Highway & Bridge, Prerefunded Balance, Series B, Revenue Bond, MBIA | | 5.250 | % | | 4/1/2016 | | Aaa | | | | 300,000 | | | 322,764 |
New York State Thruway Authority, Personal Income Tax, Prerefunded Balance, Series A, Revenue Bond, FSA | | 5.000 | % | | 3/15/2014 | | Aaa | | | | 500,000 | | | 541,470 |
New York State Thruway Authority, Personal Income Tax, Prerefunded Balance, Series A, Revenue Bond, MBIA | | 5.000 | % | | 3/15/2016 | | Aaa | | | | 300,000 | | | 324,882 |
New York State Urban Development Corp., Prerefunded Balance, Revenue Bond | | 5.375 | % | | 7/1/2022 | | Aaa | | | | 195,000 | | | 197,418 |
New York State Urban Development Corp., Prerefunded Balance, Revenue Bond | | 5.375 | % | | 7/1/2022 | | Aaa | | | | 180,000 | | | 182,232 |
New York State Urban Development Corp., Unrefunded Balance, Revenue Bond | | 5.375 | % | | 7/1/2022 | | Aaa | | | | 25,000 | | | 25,251 |
New York State Urban Development Corp., Correctional Capital Facilities, Series A, Revenue Bond, FSA | | 5.250 | % | | 1/1/2014 | | Aaa | | | | 500,000 | | | 537,190 |
New York State Urban Development Corp., Personal Income Tax, Series C, Revenue Bond, MBIA | | 4.250 | % | | 3/15/2024 | | Aaa | | | | 1,000,000 | | | 988,400 |
Niagara County, Series B, G.O. Bond, MBIA | | 5.200 | % | | 1/15/2011 | | Aaa | | | | 400,000 | | | 404,448 |
Niagara Falls City School District, G.O. Bond, FSA | | 4.375 | % | | 9/15/2029 | | AAA | 2 | | | 885,000 | | | 869,725 |
| | |
| The accompanying notes are an integral part of the financial statements. | | 9 |
Investment Portfolio - December 31, 2007
| | | | | | | | | | | | | |
| | | Coupon
Rate | | | Maturity
Date | | Credit
Rating1
(unaudited) | | Principal
Amount | | Value
(Note 2) |
| | | | | | | | | | | | | |
| | |
NEW YORK MUNICIPAL SECURITIES (continued) | | | | | | |
Niagara-Wheatfield Central School District, G.O. Bond, FGIC | | 4.125 | % | | 2/15/2019 | | Aaa | | $ | 610,000 | | $ | 621,322 |
Niagara-Wheatfield Central School District, G.O. Bond, FGIC | | 4.125 | % | | 2/15/2020 | | Aaa | | | 850,000 | | | 858,993 |
North Hempstead, Series A, G.O. Bond, FGIC | | 4.750 | % | | 1/15/2023 | | Aaa | | | 1,000,000 | | | 1,010,700 |
Norwich City School District, G.O. Bond, FSA | | 5.000 | % | | 6/15/2010 | | Aaa | | | 250,000 | | | 261,270 |
Panama Central School District, G.O. Bond, FGIC | | 5.000 | % | | 6/15/2019 | | Aaa | | | 595,000 | | | 627,743 |
Patchogue-Medford Union Free School District, Series A, G.O. Bond, FGIC | | 3.500 | % | | 7/1/2012 | | Aaa | | | 805,000 | | | 816,737 |
Pavilion Central School District, G.O. Bond, FSA | | 5.625 | % | | 6/15/2018 | | Aaa | | | 880,000 | | | 916,837 |
Phelps-Clifton Springs Central School District, Series B, G.O. Bond, MBIA | | 5.000 | % | | 6/15/2021 | | Aaa | | | 850,000 | | | 905,182 |
Phelps-Clifton Springs Central School District, Series B, G.O. Bond, MBIA | | 5.000 | % | | 6/15/2022 | | Aaa | | | 450,000 | | | 477,801 |
Pulaski Central School District, Series A, G.O. Bond, FGIC | | 4.500 | % | | 6/15/2026 | | Aaa | | | 425,000 | | | 430,963 |
Ramapo, Public Impt., Series B, G.O. Bond, MBIA | | 4.375 | % | | 5/1/2031 | | Aaa | | | 435,000 | | | 428,901 |
Ramapo, Public Impt., Series B, G.O. Bond, MBIA | | 4.375 | % | | 5/1/2032 | | Aaa | | | 510,000 | | | 502,161 |
Ramapo, Public Impt., Series B, G.O. Bond, MBIA | | 4.500 | % | | 5/1/2033 | | Aaa | | | 410,000 | | | 411,390 |
Ravena Coeymans Selkirk Central School District, G.O. Bond, FSA | | 4.250 | % | | 6/15/2014 | | Aaa | | | 1,180,000 | | | 1,237,124 |
Rochester, Series A, G.O. Bond, AMBAC | | 5.000 | % | | 8/15/2020 | | Aaa | | | 250,000 | | | 275,360 |
Rochester, Series A, G.O. Bond, AMBAC | | 5.000 | % | | 8/15/2022 | | Aaa | | | 95,000 | | | 104,439 |
Rondout Valley Central School District, G.O. Bond, FSA | | 5.375 | % | | 3/1/2020 | | Aaa | | | 500,000 | | | 528,745 |
Sachem Central School District of Holbrook, G.O. Bond, FGIC | | 4.250 | % | | 10/15/2028 | | Aaa | | | 330,000 | | | 321,747 |
Sachem Central School District of Holbrook, G.O. Bond, FGIC | | 4.375 | % | | 10/15/2030 | | Aaa | | | 1,000,000 | | | 982,240 |
Sachem Central School District of Holbrook, Series B, G.O. Bond, FGIC | | 4.250 | % | | 10/15/2026 | | Aaa | | | 1,200,000 | | | 1,172,580 |
St. Lawrence County, Public Impt., G.O. Bond,
FGIC | | 4.500 | % | | 5/15/2031 | | Aaa | | | 1,185,000 | | | 1,185,758 |
St. Lawrence County, Public Impt., G.O. Bond,
FGIC | | 4.500 | % | | 5/15/2032 | | Aaa | | | 1,000,000 | | | 999,950 |
Schenectady, G.O. Bond, MBIA | | 5.300 | % | | 2/1/2011 | | Aaa | | | 250,000 | | | 252,937 |
Scotia Glenville Central School District, G.O. Bond, FGIC | | 5.500 | % | | 6/15/2020 | | Aaa | | | 1,025,000 | | | 1,072,376 |
South Glens Falls Central School District, G.O. Bond, FGIC | | 5.375 | % | | 6/15/2018 | | Aaa | | | 605,000 | | | 631,892 |
South Glens Falls Central School District, Unrefunded Balance, G.O. Bond, FGIC | | 5.375 | % | | 6/15/2018 | | Aaa | | | 95,000 | | | 98,656 |
South Huntington Union Free School District, G.O. Bond, FGIC | | 5.000 | % | | 9/15/2016 | | Aaa | | | 325,000 | | | 335,621 |
| | |
| 10 | | The accompanying notes are an integral part of the financial statements. |
Investment Portfolio - December 31, 2007
| | | | | | | | | | | | | |
| | | Coupon
Rate | | | Maturity
Date | | Credit
Rating1
(unaudited) | | Principal
Amount | | Value
(Note 2) |
| | | | | | | | | | | | | |
| | |
NEW YORK MUNICIPAL SECURITIES (continued) | | | | | | |
South Huntington Union Free School District, G.O. Bond, FGIC | | 5.100 | % | | 9/15/2017 | | Aaa | | $ | 100,000 | | $ | 103,338 |
Suffolk County, Series A, G.O. Bond, FGIC | | 4.750 | % | | 8/1/2019 | | Aaa | | | 895,000 | | | 913,500 |
Suffolk County, Public Impt., Series A, G.O. Bond, MBIA | | 4.250 | % | | 5/1/2024 | | Aaa | | | 1,000,000 | | | 999,480 |
Suffolk County Water Authority, Revenue Bond, MBIA | | 4.500 | % | | 6/1/2027 | | Aaa | | | 1,160,000 | | | 1,158,469 |
Suffolk County Water Authority, Revenue Bond, MBIA | | 5.100 | % | | 6/1/2009 | | Aaa | | | 55,000 | | | 56,658 |
Suffolk County Water Authority, Unrefunded Balance, Revenue Bond, MBIA | | 5.100 | % | | 6/1/2009 | | Aaa | | | 195,000 | | | 200,552 |
Syracuse, Public Impt., Series C, G.O. Bond, AMBAC | | 5.400 | % | | 8/1/2017 | | Aaa | | | 700,000 | | | 746,844 |
Syracuse, Public Impt., Series C, G.O. Bond, AMBAC | | 5.500 | % | | 8/1/2018 | | Aaa | | | 850,000 | | | 908,973 |
Syracuse, Public Impt., Series A, G.O. Bond, MBIA | | 4.250 | % | | 6/15/2023 | | Aaa | | | 690,000 | | | 691,449 |
Syracuse, Public Impt., Series A, G.O. Bond, MBIA | | 4.375 | % | | 6/15/2025 | | Aaa | | | 990,000 | | | 993,109 |
Syracuse, Public Impt., Series A, G.O. Bond, FGIC | | 4.250 | % | | 12/1/2028 | | Aaa | | | 600,000 | | | 579,000 |
Syracuse, Public Impt., Series A, G.O. Bond, FGIC | | 4.250 | % | | 12/1/2029 | | Aaa | | | 600,000 | | | 575,178 |
Tarrytown Union Free School District, G.O. Bond, AMBAC | | 4.375 | % | | 1/15/2032 | | Aaa | | | 1,090,000 | | | 1,062,270 |
Triborough Bridge & Tunnel Authority, General Purposes, Series B, Revenue Bond | | 5.000 | % | | 11/15/2020 | | Aa2 | | | 750,000 | | | 793,418 |
Triborough Bridge & Tunnel Authority, General Purposes, Prerefunded Balance, Series A, Revenue Bond, MBIA | | 4.750 | % | | 1/1/2019 | | Aaa | | | 300,000 | | | 323,955 |
Triborough Bridge & Tunnel Authority, Subordinate Bonds, Revenue Bond, FGIC | | 5.000 | % | | 11/15/2032 | | Aaa | | | 1,000,000 | | | 1,024,400 |
Triborough Bridge & Tunnel Authority, General Purposes, Prerefunded Balance, Series A, Revenue Bond, MBIA | | 5.000 | % | | 1/1/2032 | | Aaa | | | 1,695,000 | | | 1,808,701 |
Triborough Bridge & Tunnel Authority, General Purposes, Unrefunded Balance, Series A, Revenue Bond, MBIA | | 5.000 | % | | 1/1/2032 | | Aaa | | | 305,000 | | | 313,198 |
Ulster County, Public Impt., G.O. Bond, XLCA | | 4.500 | % | | 11/15/2026 | | Aaa | | | 560,000 | | | 561,288 |
Union Endicott Central School District, G.O. Bond, FGIC | | 4.125 | % | | 6/15/2014 | | Aaa | | | 605,000 | | | 634,228 |
Union Endicott Central School District, G.O. Bond, FGIC | | 4.125 | % | | 6/15/2015 | | Aaa | | | 865,000 | | | 907,843 |
Warwick Valley Central School District, G.O. Bond, FSA | | 5.600 | % | | 1/15/2018 | | Aaa | | | 575,000 | | | 609,052 |
Warwick Valley Central School District, G.O. Bond, FSA | | 5.625 | % | | 1/15/2022 | | Aaa | | | 380,000 | | | 402,690 |
Wayne County, Public Impt., G.O. Bond, MBIA | | 4.125 | % | | 6/1/2024 | | Aaa | | | 500,000 | | | 493,640 |
| | |
| The accompanying notes are an integral part of the financial statements. | | 11 |
Investment Portfolio - December 31, 2007
| | | | | | | | | | | | | |
| | | Coupon
Rate | | | Maturity
Date | | Credit
Rating1
(unaudited) | | Principal
Amount/
Shares | | Value
(Note 2) |
| | | | | | | | | | | | | |
| | |
NEW YORK MUNICIPAL SECURITIES (continued) | | | | | | |
West Seneca Central School District, G.O. Bond, FSA | | 5.000 | % | | 5/1/2011 | | Aaa | | $ | 300,000 | | $ | 317,547 |
Westchester County, Series B, G.O. Bond | | 4.300 | % | | 12/15/2011 | | Aaa | | | 15,000 | | | 15,682 |
Westchester County, Series B, G.O. Bond | | 3.700 | % | | 12/15/2015 | | Aaa | | | 1,000,000 | | | 1,014,850 |
Westchester County, Unrefunded Balance, Series A, G.O. Bond | | 4.750 | % | | 12/15/2008 | | Aaa | | | 5,000 | | | 5,038 |
Westchester County, Unrefunded Balance, Series A, G.O. Bond | | 4.750 | % | | 12/15/2009 | | Aaa | | | 5,000 | | | 5,037 |
Westhampton Beach Union Free School District, G.O. Bond, MBIA | | 4.000 | % | | 7/15/2018 | | Aaa | | | 726,000 | | | 737,101 |
Williamsville Central School District, G.O. Bond, MBIA | | 5.000 | % | | 6/15/2012 | | Aaa | | | 490,000 | | | 524,917 |
Yonkers, Series B, G.O. Bond, MBIA | | 5.000 | % | | 8/1/2023 | | Aaa | | | 1,125,000 | | | 1,182,150 |
Yonkers, Series B, G.O. Bond, MBIA | | 5.000 | % | | 8/1/2030 | | Aaa | | | 1,095,000 | | | 1,134,081 |
| | | | | | | | | | | | | |
TOTAL NEW YORK MUNICIPAL SECURITIES
(Identified Cost $103,712,483) | | | | | | | | | | | | | 105,498,968 |
| | | | | | | | | | | | | |
SHORT-TERM INVESTMENTS - 4.7% | | | | | | | | | | | | | |
Dreyfus BASIC New York Municipal Money Market
Fund (Identified Cost $5,219,107) | | | | | | | | | | 5,219,107 | | | 5,219,107 |
| | | | | | | | | | | | | |
TOTAL INVESTMENTS - 99.1%
(Identified Cost $108,931,590) | | | | | | | | | | | | | 110,718,075 |
| | | | | |
OTHER ASSETS, LESS LIABILITIES - 0.9% | | | | | | | | | | | | | 985,763 |
| | | | | | | | | | | | | |
NET ASSETS - 100% | | | | | | | | | | | | $ | 111,703,838 |
| | | | | | | | | | | | | |
Key:
G.O. Bond - General Obligation Bond
Impt. - Improvement
Scheduled principal and interest payments are guaranteed by:
AMBAC (AMBAC Assurance Corp.)
CIFG (CIFG North America, Inc.)
FGIC (Financial Guaranty Insurance Co.)
FSA (Financial Security Assurance)
MBIA (MBIA, Inc.)
XLCA (XL Capital Assurance)
The insurance does not guarantee the market value of the municipal bonds.
1Credit ratings from Moody’s (unaudited).
2Credit ratings from S&P (unaudited).
The Series’ portfolio holds, as a percentage of net assets, greater than 10% in bonds insured by the following companies: FGIC - 28.7%; MBIA - 24.2%; FSA - 16.0%; AMBAC - 11.1%.
| | |
| 12 | | The accompanying notes are an integral part of the financial statements. |
Statement of Assets and Liabilities
December 31, 2007
| | | |
ASSETS: | | | |
| | | |
| |
Investments, at value (identified cost $108,931,590) (Note 2) | | $ | 110,718,075 |
Interest receivable | | | 1,130,618 |
Receivable for fund shares sold | | | 173,658 |
Dividends receivable | | | 11,921 |
| | | |
TOTAL ASSETS | | | 112,034,272 |
| | | |
| LIABILITIES: | | | |
| |
Accrued management fees (Note 3) | | | 47,304 |
Accrued fund accounting and transfer agent fees (Note 3) | | | 7,723 |
Accrued Chief Compliance Officer service fees (Note 3) | | | 714 |
Payable for fund shares repurchased | | | 238,424 |
Audit fees payable | | | 28,417 |
Other payables and accrued expenses | | | 7,852 |
| | | |
TOTAL LIABILITIES | | | 330,434 |
| | | |
TOTAL NET ASSETS | | $ | 111,703,838 |
| | | |
NET ASSETS CONSIST OF: | | | |
| |
Capital stock | | $ | 107,333 |
Additional paid-in-capital | | | 109,114,341 |
Undistributed net investment income | | | 695,679 |
Net unrealized appreciation on investments | | | 1,786,485 |
| | | |
TOTAL NET ASSETS | | $ | 111,703,838 |
| | | |
NET ASSET VALUE, OFFERING PRICE AND REDEMPTION PRICE PER SHARE ($111,703,838/10,733,322 shares) | | $ | 10.41 |
| | | |
| | |
| The accompanying notes are an integral part of the financial statements. | | 13 |
Statement of Operations
For the Year Ended December 31, 2007
| | | | |
INVESTMENT INCOME: | | | | |
| | | | |
| |
Interest | | $ | 4,334,012 | |
Dividends | | | 120,180 | |
| | | | |
Total Investment Income | | | 4,454,192 | |
| | | | |
| EXPENSES: | | | | |
| |
Management fees (Note 3) | | | 516,566 | |
Fund accounting and transfer agent fees (Note 3) | | | 86,703 | |
Directors’ fees (Note 3) | | | 7,809 | |
Chief Compliance Officer service fees (Note 3) | | | 6,100 | |
Custodian fees | | | 5,801 | |
Miscellaneous | | | 52,024 | |
| | | | |
Total Expenses | | | 675,003 | |
| | | | |
NET INVESTMENT INCOME | | | 3,779,189 | |
| | | | |
| REALIZED AND UNREALIZED GAIN (LOSS) ON INVESTMENTS: | | | | |
| |
Net realized gain on investments | | | 146,043 | |
Net change in unrealized appreciation on investments | | | (353,504 | ) |
| | | | |
| |
NET REALIZED AND UNREALIZED GAIN (LOSS) ON INVESTMENTS | | | (207,461 | ) |
| | | | |
NET INCREASE IN NET ASSETS RESULTING FROM OPERATIONS | | $ | 3,571,728 | |
| | | | |
| | |
| 14 | | The accompanying notes are an integral part of the financial statements. |
Statements of Changes in Net Assets
| | | | | | | | |
| | | For the
Year Ended
12/31/07 | | | For the
Year Ended
12/31/06 | |
| | | | | | | | |
| INCREASE (DECREASE) IN NET ASSETS: | | | | | | | | |
| | |
| OPERATIONS: | | | | | | | | |
| | |
Net investment income | | $ | 3,779,189 | | | $ | 3,249,762 | |
Net realized gain on investments | | | 146,043 | | | | 47,602 | |
Net change in unrealized appreciation on investments | | | (353,504 | ) | | | (158,257 | ) |
| | | | | | | | |
Net increase from operations | | | 3,571,728 | | | | 3,139,107 | |
| | | | | | | | |
| DISTRIBUTIONS TO SHAREHOLDERS (Note 8): | | | | | | | | |
| | |
From net investment income | | | (3,663,096 | ) | | | (3,059,006 | ) |
From net realized gain on investments | | | (170,028 | ) | | | (48,419 | ) |
| | | | | | | | |
Total distributions to shareholders | | | (3,833,124 | ) | | | (3,107,425 | ) |
| | | | | | | | |
| CAPITAL STOCK ISSUED AND REPURCHASED: | | | | | | | | |
| | |
Net increase from capital share transactions (Note 5) | | | 19,054,978 | | | | 10,473,150 | |
| | | | | | | | |
Net increase in net assets | | | 18,793,582 | | | | 10,504,832 | |
| | |
| NET ASSETS: | | | | | | | | |
| | |
Beginning of year | | | 92,910,256 | | | | 82,405,424 | |
| | | | | | | | |
End of year (including undistributed net investment income of $695,679 and $579,880, respectively) | | $ | 111,703,838 | | | $ | 92,910,256 | |
| | | | | | | | |
| | |
| The accompanying notes are an integral part of the financial statements. | | 15 |
Financial Highlights
| | | | | | | | | | |
| | |
For the Years Ended |
| | | 12/31/07 | | 12/31/06 | | 12/31/05 | | 12/31/04 | | 12/31/03 |
| | | | | | | | | | |
| | | | | | | | | | |
Per share data (for a share outstanding throughout each year): | | | | | | | | | | |
Net asset value - Beginning of year | | $10.44 | | $10.45 | | $10.58 | | $10.77 | | $10.89 |
| | | | | | | | | | |
Income (loss) from investment operations: | | | | | | | | | | |
Net investment income | | 0.37 | | 0.38 | | 0.37 | | 0.36 | | 0.42 |
Net realized and unrealized gain (loss) on
investments | | (0.01) | | (0.02) | | (0.13) | | (0.07) | | —2 |
| | | | | | | | | | |
Total from investment operations | | 0.36 | | 0.36 | | 0.24 | | 0.29 | | 0.42 |
| | | | | | | | | | |
Less distributions to shareholders: | | | | | | | | | | |
From net investment income | | (0.37) | | (0.36) | | (0.36) | | (0.45) | | (0.41) |
From net realized gain on investments | | (0.02) | | (0.01) | | (0.01) | | (0.03) | | (0.13) |
| | | | | | | | | | |
Total distributions to shareholders | | (0.39) | | (0.37) | | (0.37) | | (0.48) | | (0.54) |
| | | | | | | | | | |
Net asset value - End of year | | $10.41 | | $10.44 | | $10.45 | | $10.58 | | $10.77 |
| | | | | | | | | | |
Total return1 | | 3.44% | | 3.48% | | 2.33% | | 2.83% | | 3.90% |
Ratios (to average net assets)/Supplemental Data: | | | | | | | | | | |
Expenses | | 0.65% | | 0.68% | | 0.72% | | 0.75% | | 0.75%* |
Net investment income | | 3.66% | | 3.68% | | 3.55% | | 3.57% | | 3.80% |
Portfolio turnover | | 7% | | 8% | | 6% | | 7% | | 17% |
Net assets - End of year (000’s omitted) | | $111,704 | | $92,910 | | $82,405 | | $75,820 | | $64,193 |
| | | | | | | | | | |
|
*The investment advisor did not impose all of its management fee. If these expenses had been incurred by the Series, the expense ratio (to average net assets) for the year ended 12/31/03 would have been increased by 0.00%3. |
1Represents aggregate total return for the year indicated, and assumes reinvestment of all distributions. Total return would have been lower had certain expenses not been waived during the year ended 12/31/03.
2Less than $0.01 per share.
3Less than 0.01%.
| | |
| 16 | | The accompanying notes are an integral part of the financial statements. |
Notes to Financial Statements
New York Tax Exempt Series (the “Series”) is a no-load diversified series of Manning & Napier Fund, Inc. (the “Fund”). The Fund is organized in Maryland and is registered under the Investment Company Act of 1940, as amended, as an open-end management investment company.
The Series’ investment objective is to provide as high a level of current income exempt from federal income tax and New York State personal income tax as the Advisor believes is consistent with the preservation of capital.
The Fund’s Advisor is Manning & Napier Advisors, Inc. (the “Advisor”). Shares of the Series are offered to investors, clients and employees of the Advisor and its affiliates. The total authorized capital stock of the Fund consists of 5.0 billion shares of common stock each having a par value of $0.01. As of December 31, 2007, 3.33 billion shares have been designated in total among 27 series, of which 100 million have been designated as New York Tax Exempt Series Class A common stock.
| 2. | SIGNIFICANT ACCOUNTING POLICIES |
Security Valuation
Municipal securities will normally be valued on the basis of market valuations provided by an independent pricing service (the “Service”). The Service utilizes the latest price quotations and a matrix system (which considers such factors as security prices of similar securities, yields, maturities and ratings). The Service has been approved by the Fund’s Board of Directors (the “Board”).
Securities for which representative valuations or prices are not available from the Fund’s pricing service may be valued at fair value. Due to the inherent uncertainty of valuations of such securities, the fair value may differ significantly from the values that would have been used had a ready market for such securities existed. Fair value is determined in good faith by the Advisor under procedures approved by and under the general supervision and responsibility of the Fund’s Board.
Short-term investments that mature in sixty days or less are valued at amortized cost, which approximates market value. Investments in open-end investment companies are valued at their net asset value per share on valuation date.
Security Transactions, Investment Income and Expenses
Security transactions are accounted for on trade date. Interest income, including amortization of premium and accretion of discounts using the effective interest method, is earned from settlement date and accrued daily. Dividend income is recorded on an accrual basis on ex-dividend date.
Expenses are recorded on an accrual basis. Most expenses of the Fund can be attributed to a specific series. Expenses which cannot be directly attributed are apportioned among the series in the Fund in such a manner as deemed equitable by the Fund’s Board, taking into consideration, among other things, the nature and type of expense.
The Series uses the identified cost method for determining realized gain or loss on investments for both financial statement and federal income tax reporting purposes.
Notes to Financial Statements
| 2. | SIGNIFICANT ACCOUNTING POLICIES (continued) |
Federal Taxes
The Series’ policy is to comply with the provisions of the Internal Revenue Code applicable to regulated investment companies. The Series is not subject to federal income tax or excise tax to the extent that the Series distributes to shareholders each year its taxable income, including any net realized gains on investments, in accordance with requirements of the Internal Revenue Code. Accordingly, no provision for federal income tax or excise tax has been made in the financial statements.
On June 29, 2007, the Series adopted Financial Accounting Standards Board Interpretation No. 48 - Accounting for Uncertainty in Income Taxes (“FIN 48”). FIN 48 prescribes the minimum recognition threshold a tax position must meet in connection with accounting for uncertainties in income tax positions taken or expected to be taken by an entity before being measured and recognized in the financial statements. Management has determined that FIN 48 did not have a material impact on the Series’ financial statements. The Series files income tax returns in the U.S. federal jurisdiction and various states, as required. No income tax returns are currently under investigation. The statute of limitations on the Series’ tax returns remains open for the years ended December 31, 2004 through December 31, 2007.
Distributions of Income and Gains
Distributions to shareholders of net investment income are made quarterly. Distributions of net realized gains are made annually. An additional distribution may be necessary to avoid taxation of the Series. Distributions are recorded on the ex-dividend date.
Indemnifications
The Fund’s organizational documents provide former and current directors and officers with a limited indemnification against liabilities arising in connection with the performance of their duties to the Fund. In the normal course of business, the Fund may also enter into contracts that provide general indemnifications. The Fund’s maximum exposure under these arrangements is unknown as this would be dependent on future claims that may be made against the Fund. The risk of material loss from such claims is considered remote.
Other
The preparation of financial statements in conformity with accounting principles generally accepted in the United States of America requires management to make estimates and assumptions that affect the reported amounts of assets and liabilities and the disclosure of contingent assets and liabilities at the date of the financial statements and the reported amounts of income and expenses during the reporting period. Actual results could differ from those estimates.
| 3. | TRANSACTIONS WITH AFFILIATES |
The Fund has an Investment Advisory Agreement (the “Agreement”) with the Advisor, for which the Series pays a fee, computed daily and payable monthly, at an annual rate of 0.50% of the Series’ average daily net assets.
Under the Agreement, personnel of the Advisor provide the Series with advice and assistance in the choice of investments and the execution of securities transactions, and otherwise maintain the Series’ organization. The Advisor also provides the Fund with necessary office space and fund administration and support services. The salaries of all officers of the Fund (except a percentage of the Fund’s Chief Compliance Officer’s salary, which is paid by the Fund), and of
Notes to Financial Statements
| 3. | TRANSACTIONS WITH AFFILIATES (continued) |
all Directors who are “affiliated persons” of the Fund, or of the Advisor, and all personnel of the Fund, or of the Advisor, performing services relating to research, statistical and investment activities, are paid by the Advisor. Each “non-affiliated” Director receives an annual stipend, which is allocated among all the active series of the Fund. In addition, these Directors also receive a fee per Board meeting attended for each active series of the Fund plus a fee for each committee meeting attended.
The Advisor has contractually agreed, until at least April 30, 2009, to waive its fee and, if necessary, pay other operating expenses of the Series in order to maintain total direct annual fund operating expenses for the Series at no more than 0.85% of average daily net assets each year. For the year ended December 31, 2007, the Advisor did not waive its management fee or reimburse any expenses of the Series. The Advisor is not eligible to recoup any expenses that have been waived or reimbursed in prior years.
Manning & Napier Investor Services, Inc., a registered broker-dealer affiliate of the Advisor, acts as distributor for the Fund’s shares. The services of Manning & Napier Investor Services, Inc. are provided at no additional cost to the Series.
For fund accounting and transfer agent services, the Fund pays the Advisor an annual fee of 0.11% of the Fund’s average daily net assets up to $900 million, 0.07% of the Fund’s average daily net assets between $900 million and $1.5 billion, and 0.04% of the Fund’s average daily net assets over $1.5 billion. Additionally, certain transaction and account-based fees and out-of-pocket expenses, including charges for reporting relating to the Fund’s compliance program, are charged. Expenses not directly attributable to a series are allocated based on each series’ relative net assets or number of accounts, depending on the expense. The Advisor has an agreement with Citi Fund Services Ohio, Inc. (“Citi”) (formerly BISYS Fund Services Ohio, Inc.) under which Citi serves as sub-accountant and sub-transfer agent.
| 4. | PURCHASES AND SALES OF SECURITIES |
For the year ended December 31, 2007, purchases and sales of securities, other than United States Government securities and short-term securities, were $23,261,509 and $7,012,762, respectively. There were no purchases or sales of United States Government securities.
| 5. | CAPITAL STOCK TRANSACTIONS |
Transactions in shares of New York Tax Exempt Series were:
| | | | | | | | | | | | | | |
| | | For the Year
Ended 12/31/07 | | | For the Year
Ended 12/31/06 | |
| | | Shares | | | Amount | | | Shares | | | Amount | |
Sold | | 2,874,855 | | | $ | 29,845,326 | | | 1,332,286 | | | $ | 13,874,257 | |
Reinvested | | 358,700 | | | | 3,706,760 | | | 283,436 | | | | 2,944,568 | |
Repurchased | | (1,397,205 | ) | | | (14,497,108 | ) | | (608,138 | ) | | | (6,345,675 | ) |
| | | | | | | | | | | | | | |
Total | | 1,836,350 | | | $ | 19,054,978 | | | 1,007,584 | | | $ | 10,473,150 | |
| | | | | | | | | | | | | | |
Substantially all of the Series’ shares represent investments by fiduciary accounts over which the Advisor has sole investment discretion.
Notes to Financial Statements
The Series may trade in financial instruments with off-balance sheet risk in the normal course of its investing activities to assist in managing exposure to various market risks. These financial instruments include written options and futures contracts and may involve, to a varying degree, elements of risk in excess of the amounts recognized for financial statement purposes. No such investments were held by the Series on December 31, 2007.
| 7. | CONCENTRATION OF CREDIT |
The Series primarily invests in debt obligations issued by the State of New York and its political subdivisions, agencies and public authorities to obtain funds for various public purposes. The Series is more susceptible to factors adversely affecting issues of New York municipal securities than is a municipal bond fund that is not concentrated in these issues to the same extent.
| 8. | FEDERAL INCOME TAX INFORMATION |
The amount and characterization of certain income and capital gains to be distributed are determined in accordance with federal income tax regulations, which may differ from accounting principles generally accepted in the United States of America. These differences are primarily due to differing book and tax treatments in the timing of the recognition of net investment income or gains and losses, including market discount. The Series may periodically make reclassifications among its capital accounts to reflect income and gains available for distribution (or available capital loss carryovers) under income tax regulations, without impacting the Series’ net asset value. Any such reclassifications are not reflected in the financial highlights.
The tax character of distributions paid were as follows:
| | | | | | |
| | | For the Year
Ended 12/31/07 | | For the Year
Ended 12/31/06 |
Ordinary income | | $ | — | | $ | 10,775 |
Tax exempt income | | | 3,663,391 | | | 3,048,231 |
Long-term capital gains | | | 169,733 | | | 48,419 |
At December 31, 2007, the tax basis components of distributable earnings and the net unrealized appreciation based on identified cost for federal income tax purposes were as follows:
| | | | |
Cost for federal income tax purposes | | $ | 108,892,895 | |
| | | | |
Unrealized appreciation | | $ | 2,112,020 | |
Unrealized depreciation | | | (286,840 | ) |
| | | | |
Net unrealized appreciation | | $ | 1,825,180 | |
Undistributed tax exempt income | | | 656,984 | |
Notes to Financial Statements
| 9. | RECENT ACCOUNTING PRONOUNCEMENTS |
In September 2006, FASB Statement of Financial Accounting Standards No. 157, Fair Value Measurements (“FAS 157”) was issued, and is effective for fiscal years beginning after November 15, 2007. FAS 157 defines fair value, establishes a framework for measuring fair value, and expands disclosure about fair value measurements. The standard does not expand the use of fair value in any new circumstances, but provides clarification on acceptable fair value methods and applications. At this time, management is evaluating the implications of FAS 157, but it is not expected to materially impact the Series’ financial statements.
Report of Independent Registered Public Accounting Firm
To the Board of Directors of Manning & Napier Fund, Inc. and Shareholders of New York Tax Exempt Series:
In our opinion, the accompanying statement of assets and liabilities, including the investment portfolio, and the related statements of operations and of changes in net assets and the financial highlights present fairly, in all material respects, the financial position of the New York Tax Exempt Series (a series of Manning & Napier Fund, Inc., hereafter referred to as the “Series”) at December 31, 2007, and the results of its operations for the year then ended, the changes in its net assets for each of the two years in the period then ended and the financial highlights for each of the five years in the period then ended, in conformity with accounting principles generally accepted in the United States of America. These financial statements and financial highlights (hereafter referred to as “financial statements”) are the responsibility of the Series’ management; our responsibility is to express an opinion on these financial statements based on our audits. We conducted our audits of these financial statements in accordance with the standards of the Public Company Accounting Oversight Board (United States). Those standards require that we plan and perform the audit to obtain reasonable assurance about whether the financial statements are free of material misstatement. An audit includes examining, on a test basis, evidence supporting the amounts and disclosures in the financial statements, assessing the accounting principles used and significant estimates made by management, and evaluating the overall financial statement presentation. We believe that our audits, which included confirmation of securities at December 31, 2007 by correspondence with the custodian, provide a reasonable basis for our opinion.

Columbus, Ohio
February 20, 2008
Supplemental Tax Information (unaudited)
Pursuant to Section 852 of the Internal Revenue Code, as amended, the Series hereby designates $169,733 as capital gains for its taxable year ended December 31, 2007. In addition, the Series hereby designates $3,663,391 as tax exempt dividends for the year ended December 31, 2007.
Renewal of Investment Advisory Agreements (unaudited)
During the period covered by this shareholder report, the Board of Directors (the “Board”) of Manning & Napier Fund, Inc. (the “Fund”) considered approval of two separate investment advisory agreements with Manning & Napier Advisors, Inc. (the “Advisor”):
| | • | | At a meeting held on August 30, 2007, the Board approved a new investment advisory agreement between the Fund and the Advisor (the “New Investment Advisory Agreement”) and recommended that the New Investment Advisory Agreement be submitted to shareholders for approval. Shareholders approved the New Investment Advisory Agreement at a meeting held on December 17, 2007. |
| | • | | At a meeting held on November 12, 2007, the Board approved the continuation of the then-current investment advisory agreement between the Fund and the Advisor (the “Current Investment Advisory Agreement”), which was to be superseded by the New Investment Advisory Agreement upon its approval by the Fund’s shareholders. The continuation of the Current Investment Advisory Agreement was necessary as a result of the delay in obtaining the number of votes necessary to convene the shareholder meeting and approve the New Investment Advisory Agreement with respect to all investment portfolios of the Fund (the “Series”). |
Consideration of New Investment Advisory Agreement:
In response to recent regulatory and compliance initiatives promulgated by the SEC over the past year, the Fund engaged in a comprehensive review of all material aspects of the Fund’s operations, including the Fund’s Current Investment Advisory Agreement. As a result of its review, the Board determined that the Current Investment Advisory Agreement should be amended for the purpose of modernizing the form of the agreement and to include additional provisions in the agreement that are customarily included in investment advisory agreements between registered investment companies and their investment advisors, but which are not included in the Current Investment Advisory Agreement. Accordingly, at the Board meeting on November 16, 2006, representatives of the Advisor presented to the Board proposed changes to the Current Investment Advisory Agreement in order to address the Board’s request to update and modernize the Current Investment Advisory Agreement. As a result of the discussions between the Board and representatives of the Advisor at the November 2006 Board meeting, the Board determined to formally consider the approval of a new investment advisory agreement between the Fund and the Advisor, which would incorporate the changes proposed at the November 2006 Board meeting, at its in-person Board meeting in August 2007.
At an in-person meeting held on August 30, 2007, the Board considered the approval of the New Investment Advisory Agreement between the Fund and the Advisor. Based on the information it received at the meeting and the November 16, 2006 Board meeting, the Board approved the New Investment Advisory Agreement subject to its further approval by the Fund’s shareholders. Representatives of the Advisor attended the meeting and presented additional oral and written information to the Board to assist the Board in its considerations. At the meeting, the Board concluded it was reasonable to take into account the conclusions the Board made when considering and evaluating the renewal of the Current Investment Advisory Agreement (the “2006 Annual Review”), which occurred at the November 16, 2006 in-person Board meeting, as part of its considerations to approve the New Investment Advisory Agreement. The discussion immediately below outlines the materials and information presented to the Board in connection with the Board’s 2006 Annual Review of the Current Investment Advisory Agreement and the conclusions made by the Directors when determining to continue the Current Investment Advisory Agreement for an additional one-year period.
Renewal of Investment Advisory Agreements (unaudited)
In connection with its review and deliberations, the Board considered the following factors and reached a conclusion with respect to such factors.
| | • | | The Board considered the services provided by the Advisor under the Current Investment Advisory Agreement including, among others: deciding what securities to purchase and sell for each Series; arranging for the purchase and sale of such securities by placing orders with broker-dealers; administering the affairs of the Fund (including the books and records of the Fund not maintained by third party service providers such as the custodian or sub-transfer agent); arranging for the insurance coverage for the Fund; and supervising the preparation of tax returns, SEC filings (including registration statements) and reports to shareholders for the Fund. The Board also considered the nature and quality of such services provided under the Current Investment Advisory Agreement in light of the Advisor’s services provided to the Fund for 21 years. The Board discussed the quality of these services with representatives from the Advisor and concluded that the Advisor was performing its services to the Fund required under the Current Investment Advisory Agreement in a reasonable manner. |
| | • | | The Board considered the investment performance of the various Series of the Fund. The investment performance for each Series was reviewed on a cumulative basis since inception and on a one year basis. In addition, annualized performance for the following time periods was considered: inception, three year, five year, ten year, and current market cycle. A market cycle includes periods of both rising and falling markets. Returns for established benchmark indices for each Series were provided for each time period. The Board noted that all the Series were competitive against their respective benchmark indices over all time periods noted above through September 30, 2006. In addition, the Board considered at the meeting (and considers on a quarterly basis) a peer group performance analysis consisting of Morningstar universes of mutual funds with similar investment objectives. The Board discussed the performance with representatives from the Advisor and concluded that the investment performance of each of the Fund’s Series was reasonable based on the Fund’s actual performance and comparative performance, especially performance over the current market cycle. |
| | • | | The Board considered the costs of the Advisor’s services and the profits of the Advisor as they relate to the Advisor’s services to the Fund under the Current Investment Advisory Agreement. In reviewing the Advisor’s costs and profits, the Board discussed the Advisor’s revenues generated from the Fund (on both an actual and adjusted basis) and its expenses associated with providing the services under the Current Investment Advisory Agreement. In addition, the Board reviewed the Advisor’s expenses associated with Fund activities outside of the Current Investment Advisory Agreement (such as expense reimbursements pursuant to expense caps and payments made by the Advisor to third party platforms on which shares of the Fund are available for purchase). It was noted by representatives of the Advisor that 6 of the 18 active Series of the Fund are currently experiencing expenses above the capped expense ratios. After discussing the above costs and profits, the Board concluded that the Advisor’s profitability relating to its services provided under the Current Investment Advisory Agreement was reasonable. |
| | • | | The Board considered the fees and expenses of the various Series of the Fund. The Advisor presented the advisory fees and total expenses for each Series, including the |
Renewal of Investment Advisory Agreements (unaudited)
| | advisory fee adjusted for any expense waivers or reimbursements (either contractual or voluntary) paid by the Advisor. The advisory fees and expense ratios of each Series were compared to an average (on both a mean and median basis) of similar funds as disclosed on the Morningstar database. Representatives of the Advisor discussed with the Board the levels of its advisory fee for each Series of the Fund and as compared to the median and mean advisory fees for similar funds as listed on Morningstar. Expense ratios for every Series, except the High Yield Bond Series, are currently below the median and mean for similar funds as listed on Morningstar. Based on their review of the information provided, the Board concluded that the fees and expenses of each Series of the Fund were reasonable on a comparative basis. |
| | • | | The Board also considered the other benefits the Advisor derives from its relationship with the Fund. Such other benefits include certain research products provided by soft dollars. Given the level of soft dollar transactions involving the Fund, the Board concluded that these additional benefits to the Advisor were reasonable. |
| | • | | In addition to the factors described above, the Board considered the Advisor’s personnel, investment strategies, policies and procedures relating to compliance with personal securities transactions, and reputation, expertise and resources in domestic and foreign financial markets. The Board concluded that these factors support the conclusion that the Advisor performs its services in a reasonable manner. |
| | • | | The Board did not consider economies of scale at this time because of the multiple uses of the Fund (for the Advisor’s discretionary investment account clients in addition to direct investors), the current profitability of the Advisor’s services to the Fund under the Current Investment Advisory Agreement, and the overall size of the Fund complex. |
Based on the Board’s deliberations and their evaluation of the information described above, the Board, including a majority of Directors that are “not interested” as defined in the Investment Company Act of 1940 (the “1940 Act”), concluded that the compensation under the Current Investment Advisory Agreement was fair and reasonable in light of the services and expenses and such other matters as the Directors considered to be relevant in the exercise of their reasonable judgment. Accordingly, the Board approved the renewal of the Current Investment Advisory Agreement for another year. In the course of their deliberations, the Directors did not identify any particular information that was all important or controlling.
As stated above, at the August 30, 2007 Board meeting, the Board concluded it was reasonable to take into account the conclusions set forth above when determining whether to approve the New Investment Advisory Agreement. The Board’s conclusion in this regard was based on the fact that the New Investment Advisory Agreement is identical to the Current Investment Advisory Agreement except for certain provisions of the Agreement which have been updated and modernized in response to the Board’s specific request. Further, the Board’s conclusion in this regard was based on the fact that the New Investment Advisory Agreement does not change either the investment advisory fees payable by the Fund to the Advisor or the day-to-day investment management services the Advisor provides to the Fund.
In addition to the conclusions formed with respect to the 2006 Annual Review, the Directors considered specific information at the August 30, 2007 Board meeting concerning the additional provisions included in the New Investment Advisory Agreement. The Directors considered the fact that these additional provisions are designed to (i) address and memorialize certain standard practices and regulatory requirements of mutual funds and their investment advisors; (ii) further
Renewal of Investment Advisory Agreements (unaudited)
delineate the duties and obligations of the Fund and the Advisor; (iii) modernize the agreement to reflect current industry practice and applicable law; and (iv) generally improve the overall quality of the agreement. The Board further considered the fact that the New Investment Advisory Agreement does not alter the actual day-to-day investment management services provided by the Advisor to each Series of the Fund, and the investment advisory fee rate paid to the Advisor under the New Investment Advisory Agreement for a Series is the same as the fee rate paid by the Series under the Current Investment Advisory Agreement.
Based on its evaluation of the information and the conclusions with respect thereto at its meetings on November 16, 2006 and August 30, 2007, the Board unanimously concluded that: (a) the terms of the New Investment Advisory Agreement were fair and reasonable; (b) the approval of the New Investment Advisory Agreement would be in the best interests of the shareholders and the Fund; and (c) it would recommend the approval of the New Investment Advisory Agreement to shareholders. In the course of their deliberations, the Board did not identify any particular information or factor that was all-important or controlling.
Consideration of Current Investment Advisory Agreement
At a meeting held on November 12, 2007, the Board considered the continuation of the Current Investment Advisory Agreement and simultaneously conducted its annual review of the services provided to the Fund by the Adviser (the “2007 Annual Review”). Representatives of the Advisor attended the meeting and presented additional oral and written information to the Board to assist the Board in its considerations. The discussion immediately below outlines the materials and information presented to the Board in connection with the Board’s 2007 Annual Review of the Current Investment Advisory Agreement and the conclusions made by the Directors when determining to continue the Current Investment Advisory Agreement.
In connection with its review and deliberations, the Board considered the following factors and reached a conclusion with respect to such factors.
| | • | | The Board considered the services provided by the Advisor under the Current Investment Advisory Agreement including, among others: deciding what securities to purchase and sell for each Series; arranging for the purchase and sale of such securities by placing orders with broker-dealers; administering the affairs of the Fund (including the books and records of the Fund not maintained by third party service providers such as the custodian or sub-transfer agent); arranging for the insurance coverage for the Fund; and supervising the preparation of tax returns, SEC filings (including registration statements) and reports to shareholders for the Fund. The Board also considered the nature and quality of such services provided under the Current Investment Advisory Agreement in light of the Advisor’s services provided to the Fund for 21 years. The Board discussed the quality of these services with representatives from the Advisor and concluded that the Advisor was performing its services to the Fund required under the Current Investment Advisory Agreement in a reasonable manner. |
| | • | | The Board considered the investment performance of the various Series of the Fund. The investment performance for each Series was reviewed on a cumulative basis since inception and on a one year basis. In addition, annualized performance for the following time periods was considered: inception, three year, five year, ten year, and current market cycle. A market cycle includes periods of both rising and falling markets. Returns for established benchmark indices for each Series were provided for |
Renewal of Investment Advisory Agreements (unaudited)
| | each time period. The Board noted that all the Series were competitive against their respective benchmark indices over all time periods noted above through September 30, 2007. In addition, the Board considered at the meeting (and considers on a quarterly basis) a peer group performance analysis consisting of Morningstar universes of mutual funds with similar investment objectives. The Board discussed the performance with representatives from the Advisor and concluded that the investment performance of each of the Fund’s Series was reasonable based on the Fund’s actual performance and comparative performance, especially performance over the current market cycle. |
| | • | | The Board considered the costs of the Advisor’s services and the profits of the Advisor as they relate to the Advisor’s services to the Fund under the Current Investment Advisory Agreement. In reviewing the Advisor’s costs and profits, the Board discussed the Advisor’s revenues generated from the Fund (on both an actual and adjusted basis) and its expenses associated with providing the services under the Current Investment Advisory Agreement. In addition, the Board reviewed the Advisor’s expenses associated with Fund activities outside of the Current Investment Advisory Agreement (such as expense reimbursements pursuant to expense caps and payments made by the Advisor to third party platforms on which shares of the Fund are available for purchase). It was noted by representatives of the Advisor that 4 of the 18 active Series of the Fund are currently experiencing expenses above the capped expense ratios. After discussing the above costs and profits, the Board concluded that the Advisor’s profitability relating to its services provided under the Current Investment Advisory Agreement was reasonable. |
| | • | | The Board considered the fees and expenses of the various Series of the Fund. The Advisor presented the advisory fees and total expenses for each Series, including the advisory fee adjusted for any expense waivers or reimbursements (either contractual or voluntary) paid by the Advisor. The advisory fees and expense ratios of each Series were compared to an average (on both a mean and median basis) of similar funds as disclosed on the Morningstar database. Representatives of the Advisor discussed with the Board the levels of its advisory fee for each Series of the Fund and as compared to the median and mean advisory fees for similar funds as listed on Morningstar. Expense ratios for every Series, except the High Yield Bond Series and Global Fixed Income Series, are currently below the median and mean for similar funds as listed on Morningstar. Based on their review of the information provided, the Board concluded that the fees and expenses of each Series of the Fund were reasonable on a comparative basis. |
| | • | | The Board also considered the other benefits the Advisor derives from its relationship with the Fund. Such other benefits include certain research products provided by soft dollars. Given the level of soft dollar transactions involving the Fund, the Board concluded that these additional benefits to the Advisor were reasonable. |
| | • | | In addition to the factors described above, the Board considered the Advisor’s personnel, investment strategies, policies and procedures relating to compliance with personal securities transactions, and reputation, expertise and resources in domestic and foreign financial markets. The Board concluded that these factors support the conclusion that the Advisor performs its services in a reasonable manner. |
Renewal of Investment Advisory Agreements (unaudited)
| | • | | The Board did not consider economies of scale at this time because of the multiple uses of the Fund (for the Advisor’s discretionary investment account clients in addition to direct investors), the current profitability of the Advisor’s services to the Fund under the Current Investment Advisory Agreement, and the overall size of the Fund complex. |
Based on the Board’s deliberations and their evaluation of the information described above, the Board, including a majority of Directors that are not “interested persons” as defined in the 1940 Act, concluded that the compensation under the Current Investment Advisory Agreement was fair and reasonable in light of the services and expenses and such other matters as the Directors considered to be relevant in the exercise of their reasonable judgment. Accordingly, the Board approved the renewal of the Current Investment Advisory Agreement. In the course of their deliberations, the Directors did not identify any particular information that was all important or controlling.
Proxy Voting Results (unaudited)
A special meeting of the shareholders of Manning & Napier Fund, Inc. was held on November 12, 2007. The number of votes necessary to conduct the meeting and approve each proposal was obtained, and the results of the votes of shareholders on proposals before them are listed below:
PROPOSAL 1:
Election of Directors.
| | | | |
| | | Number of Shares
voted for | | Number of Shares
withheld |
B. Reuben Auspitz | | 215,932,354.541 | | 15,898,685.154 |
Stephen B. Ashley | | 215,960,751.214 | | 15,870,288.481 |
Peter L. Faber | | 217,504,725.208 | | 14,326,314.487 |
Harris H. Rusitzky | | 215,924,013.609 | | 15,907,026.086 |
PROPOSAL 2:
To approve the investment advisory agreement between Manning & Napier Advisors, Inc. and Manning & Napier Fund, Inc.
| | |
| | | Number of
shares voted |
For | | 7,358,042.565 |
Against | | 0 |
Abstain (includes broker non-votes) | | 1,920.000 |
PROPOSAL 3:
Eliminating, amending, or reclassifying certain fundamental investment policies or restrictions.
Proposal 3.A.i. To approve changes to the fundamental policy regarding borrowing money.
| | |
| | | Number of
shares voted |
For | | 7,354,320.991 |
Against | | 688.971 |
Abstain (includes broker non-votes) | | 4,952.603 |
Proposal 3.A.ii. To approve changes to the fundamental policy regarding percentage of assets invested in any one industry.
| | |
| | | Number of
shares voted |
For | | 7,354,320.991 |
Against | | 688.971 |
Abstain (includes broker non-votes) | | 4,952.603 |
Proxy Voting Results (unaudited)
Proposal 3.A.iii. To approve changes to the fundamental policy regarding loans.
| | |
| | | Number of
shares voted |
For | | 7,354,320.991 |
Against | | 688.971 |
Abstain (includes broker non-votes) | | 4,952.603 |
Proposal 3.A.iv. To approve changes to the fundamental policy regarding issuance of senior securities or pledging its assets.
| | |
| | | Number of
shares voted |
For | | 7,354,320.991 |
Against | | 688.971 |
Abstain (includes broker non-votes) | | 4,952.603 |
Proposal 3.A.v. To approve changes to the fundamental policy regarding buying or selling of commodities or commodity contracts.
| | |
| | | Number of
shares voted |
For | | 7,355,009.962 |
Against | | 0 |
Abstain (includes broker non-votes) | | 4,952.603 |
Proposal 3.A.vi. To approve changes to the fundamental policy regarding underwriting of securities.
| | |
| | | Number of
shares voted |
For | | 7,354,320.991 |
Against | | 688.971 |
Abstain (includes broker non-votes) | | 4,952.603 |
Proposal 3.A.vii. To approve changes to the fundamental policy regarding diversification.
| | |
| | | Number of
shares voted |
For | | 7,354,320.991 |
Against | | 688.971 |
Abstain (includes broker non-votes) | | 4,952.603 |
Proposal 3.B.i. To approve changes to the policy/restriction regarding investment of its total net assets in securities of issuers that are restricted from being sold to the public without registration.
| | |
| | | Number of
shares voted |
For | | 7,354,320.991 |
Against | | 688.971 |
Abstain (includes broker non-votes) | | 4,952.603 |
Proxy Voting Results (unaudited)
Proposal 3.B.ii. To approve changes to the policy/restriction regarding the purchase of securities on margin.
| | |
| | | Number of
shares voted |
For | | 7,354,320.991 |
Against | | 688.971 |
Abstain (includes broker non-votes) | | 4,952.603 |
Proposal 3.B.iii. To approve changes to the policy/restriction regarding acquiring securities of other investment companies.
| | |
| | | Number of
shares voted |
For | | 7,355,009.962 |
Against | | 0 |
Abstain (includes broker non-votes) | | 4,952.603 |
Proposal 3.B.v. To approve changes to the policy/restriction regarding options on securities and with respect to stock index and currency futures and related options.
| | |
| | | Number of
shares voted |
For | | 7,354,320.991 |
Against | | 688.971 |
Abstain (includes broker non-votes) | | 4,952.603 |
Proposal 3.B.vi. To approve changes to the policy/restriction regarding hedging and derivative transactions.
| | |
| | | Number of
shares voted |
For | | 7,355,009.962 |
Against | | 0 |
Abstain (includes broker non-votes) | | 4,952.603 |
Proposal 3.B.vii. To approve changes to the policy/restriction regarding the purchase of foreign securities.
| | |
| | | Number of
shares voted |
For | | 7,355,009.962 |
Against | | 0 |
Abstain (includes broker non-votes) | | 4,952.603 |
Proposal 3.C.i. To approve changes to the policy/restriction regarding investment for the purpose of exercising control over management.
| | |
| | | Number of
shares voted |
For | | 7,354,320.991 |
Against | | 688.971 |
Abstain (includes broker non-votes) | | 4,952.603 |
Proxy Voting Results (unaudited)
Proposal 3.C.iii. To approve changes to the policy/restriction regarding short sales or short positions.
| | |
| | | Number of
shares voted |
For | | 7,355,009.962 |
Against | | 0 |
Abstain (includes broker non-votes) | | 4,952.603 |
Proposal 3.C.iv. To approve changes to the policy/restriction regarding participation in a joint or joint and several basis in trading account in securities.
| | |
| | | Number of
shares voted |
For | | 7,355,009.962 |
Against | | 0 |
Abstain (includes broker non-votes) | | 4,952.603 |
Proposal 3.C.v. To approve changes to the policy/restriction regarding investment in oil, gas or other mineral exploration or development programs.
| | |
| | | Number of
shares voted |
For | | 7,354,320.991 |
Against | | 688.971 |
Abstain (includes broker non-votes) | | 4,952.603 |
Proposal 3.C.vi. To approve changes to the policy/restriction regarding officers and directors of the Fund.
| | |
| | | Number of
shares voted |
For | | 7,354,320.991 |
Against | | 688.971 |
Abstain (includes broker non-votes) | | 4,952.603 |
Proposal 3.C.vii. To approve changes to the policy/restriction regarding investing in any company with less than three years continuous operation.
| | |
| | | Number of
shares voted |
For | | 7,354,320.991 |
Against | | 688.971 |
Abstain (includes broker non-votes) | | 4,952.603 |
Directors’ and Officers’ Information (unaudited)
The Statement of Additional Information provides additional information about the Fund’s directors and officers and can be obtained without charge by calling 1-800-466-3863, at www.manningnapieradvisors.com, or on the EDGAR Database on the SEC Internet web site (http://www.sec.gov). The following chart shows certain information about the Fund’s officers and directors, including their principal occupations during the last five years. Unless specific dates are provided, the individuals have held the listed positions for longer than five years.
INTERESTED DIRECTOR/OFFICER
| | |
| Name: | | B. Reuben Auspitz* |
| Address: | | 290 Woodcliff Drive
Fairport, NY 14450 |
| Age: | | 60 |
| Current Position(s) Held with Fund: | | Principal Executive Officer, President, Chairman & Director |
| Term of Office1 & Length of Time Served: | | Indefinite - Director since 1984; Vice President 1984 - 2003; President since 2004; Principal Executive Officer since 2002 |
| Principal Occupation(s) During Past 5 Years: | | Executive Vice President; Co-Executive Director; Executive Group Member**; Chief Compliance Officer since 2004 - Manning & Napier Advisors, Inc. President; Director - Manning & Napier Investor Services, Inc. Holds or has held one or more of the following titles for various subsidiaries and affiliates: President, Vice President, Director, Chairman, Treasurer, Chief Compliance Officer or Member. |
| Number of Portfolios Overseen within Fund Complex: | | 27 |
| Other Directorships Held Outside Fund Complex: | | N/A |
| |
| INDEPENDENT DIRECTORS | | |
| |
| Name: | | Stephen B. Ashley |
| Address: | | 290 Woodcliff Drive
Fairport, NY 14450 |
| Age: | | 67 |
| Current Position(s) Held with Fund: | | Director, Audit Committee Member, Governance & Nominating Committee Member |
| Term of Office & Length of Time Served: | | Indefinite - Since 1996 |
| Principal Occupation(s) During Past 5 Years: | | Chairman, Director, President & Chief Executive Officer, The Ashley Group (property management and investment) |
| Number of Portfolios Overseen within Fund Complex: | | 27 |
| Other Directorships Held Outside Fund Complex: | | The Ashley Group
Fannie Mae |
| Name: | | Peter L. Faber |
| Address: | | 290 Woodcliff Drive
Fairport, NY 14450 |
| Age: | | 68 |
| Current Position(s) Held with Fund: | | Director, Governance & Nominating Committee Member |
| Term of Office & Length of Time Served: | | Indefinite - Since 1987 |
| Principal Occupation(s) During Past 5 Years: | | Senior Counsel, McDermott, Will & Emery LLP (law firm) |
| Number of Portfolios Overseen within Fund Complex: | | 27 |
| Other Directorships Held Outside Fund Complex: | | Partnership for New York City, Inc.
New York Collegium
Boston Early Music Festival |
| Name: | | Harris H. Rusitzky |
| Address: | | 290 Woodcliff Drive
Fairport, NY 14450 |
| Age: | | 72 |
| Current Position(s) Held with Fund: | | Director, Audit Committee Member, Governance & Nominating Committee Member |
| Term of Office & Length of Time Served: | | Indefinite - Since 1985 |
| Principal Occupation(s) During Past 5 Years: | | President, The Greening Group (business consultants); Partner, The Restaurant Group (restaurants) |
| Number of Portfolios Overseen within Fund Complex: | | 27 |
| Other Directorships Held Outside Fund Complex: | | N/A |
Directors’ and Officers’ Information (unaudited)
| | |
| Name: | | Paul A. Brooke |
| Address: | | 290 Woodcliff Drive
Fairport, NY 14450 |
| Age: | | 62 |
| Current Position(s) Held with Fund: | | Director, Audit Committee Member, Governance & Nominating Committee Member |
| Term of Office & Length of Time Served: | | Indefinite - Since 2007 |
| Principal Occupation(s) During Past 5 Years: | | Chairman & CEO, Alsius Corp. (investments); Managing Member, PMSV Holdings LLC (investments) |
| Number of Portfolios Overseen within Fund Complex: | | 27 |
| Other Directorships Held Outside Fund Complex: | | Incyte Corp. ViroPharma, Inc. HLTH Corp. Cheyne Capital International MPM Bio-equities GMP Companies HoustonPharma |
| |
| OFFICERS | | |
| |
| Name: | | Jeffrey S. Coons, Ph.D., CFA |
| Address: | | 290 Woodcliff Drive
Fairport, NY 14450 |
| Age: | | 44 |
| Current Position(s) Held with Fund: | | Vice President |
| Term of Office1 & Length of Time Served: | | Since 2004 |
| Principal Occupation(s) During Past 5 Years: | | Co-Director of Research since 2002 & Executive Group Member**, Manning & Napier Advisors, Inc. Holds one or more of the following titles for various subsidiaries and affiliates: President, Director, Treasurer or Senior Trust Officer. |
| Number of Portfolios Overseen within Fund Complex: | | 27 |
| Other Directorships Held Outside Fund Complex: | | N/A |
| Name: | | Christine Glavin |
| Address: | | 290 Woodcliff Drive
Fairport, NY 14450 |
| Age: | | 41 |
| Current Position(s) Held with Fund: | | Principal Financial Officer, Chief Financial Officer |
| Term of Office1 & Length of Time Served: | | Principal Financial Officer since 2002; Chief Financial Officer since 2001 |
| Principal Occupation(s) During Past 5 Years: | | Fund Reporting Manager, Manning & Napier Advisors, Inc. |
| Number of Portfolios Overseen within Fund Complex: | | 27 |
| Other Directorships Held Outside Fund Complex: | | N/A |
| Name: | | Jodi L. Hedberg |
| Address: | | 290 Woodcliff Drive
Fairport, NY 14450 |
| Age: | | 40 |
| Current Position(s) Held with Fund: | | Corporate Secretary, Chief Compliance Officer, Anti-Money Laundering Compliance Officer |
| Term of Office1 & Length of Time Served: | | Corporate Secretary since 1997; Chief Compliance Officer since 2004 |
| Principal Occupation(s) During Past 5 Years: | | Director of Compliance, Manning & Napier Advisors, Inc. and affiliates; Corporate Secretary, Manning & Napier Investor Services, Inc. since 2006 |
| Number of Portfolios Overseen within Fund Complex: | | 27 |
| Other Directorships Held Outside Fund Complex: | | N/A |
*Interested Director, within the meaning of the Investment Company Act of 1940 by reason of his position with the Fund’s investment advisor and distributor. Mr. Auspitz serves as the Executive Vice President and Director, Manning & Napier Advisors, Inc. and President and Director, Manning & Napier Investor Services, Inc., the Fund’s distributor.
**The Executive Group performs the duties of the Office of the Chief Executive of Manning & Napier Advisors, Inc.
1The term of office for President, Vice President, Chief Financial Officer, and Corporate Secretary is one year and until their respective successors are chosen and qualified. All other officers’ terms are indefinite.
(THISPAGEINTENTIONALLYLEFTBLANK)
(THISPAGEINTENTIONALLYLEFTBLANK)
Literature Requests (unaudited)
Proxy Voting Policies and Procedures
A description of the policies and procedures that the Fund uses to determine how to vote proxies relating to portfolio securities is available, without charge, upon request:
| | |
By phone | | 1-800-466-3863 |
On the Securities and Exchange Commission’s (SEC) web site | | http://www.sec.gov |
Proxy Voting Record
Information regarding how the Fund voted proxies relating to portfolio securities during the most recent 12-month period ended June 30th is available, without charge, upon request:
| | |
By phone | | 1-800-466-3863 |
On the SEC’s web site | | http://www.sec.gov |
Quarterly Portfolio Holdings
The Series’ complete schedule of portfolio holdings for the 1st and 3rd quarters of each fiscal year are provided on Form N-Q, and are available, without charge, upon request:
| | |
By phone | | 1-800-466-3863 |
On the SEC’s web site | | http://www.sec.gov |
The Series’ Form N-Q may be reviewed and copied at the SEC’s Public Reference Room in Washington, D.C. Information on the operation of the Public Reference Room may be obtained by calling 1-800-SEC-0330.
Prospectus and Statement of Additional Information (SAI)
The prospectus and SAI provide additional information about each Series, including charges, expenses and risks. These documents are available, without charge, upon request:
| | |
By phone | | 1-800-466-3863 |
On the SEC’s web site | | http://www.sec.gov |
On the Advisor’s web site | | http://www.manningnapieradvisors.com |
Additional information available at www.manningnapieradvisors.com
1. Fund Holdings - Month-End
2. Fund Holdings - Quarter-End
3. Shareholder Report - Annual
4. Shareholder Report - Semi-Annual
Manning & Napier Fund, Inc.
| | | | |
| OHIO TAX EXEMPT SERIES | | | | | Annual Report - December 31, 2007 |

Management Discussion and Analysis (unaudited)
Dear Shareholders:
It would be a bit of an understatement to describe 2007 as an “eventful” year; it was a wild ride during which fixed income investors, including municipal bond investors, were buffeted by a number of factors, some totally new, others quite familiar. “Subprime”, a relatively obscure term, entered the everyday vernacular. Some of these securities that were thought to be “AAA” turned out not to be. There were high profile disasters, as well as conservative investments that turned out to be stellar investments. And, as always seems to be the case, the Federal Reserve (the “Fed”) once again played a prominent role.
In the end, interest rates generally fell across the board. However, in some instances, yields actually finished the year at levels higher than where they started. Unfortunately, this was the case for longer-term municipal bonds. For instance, the market weighted yield for the Merrill Lynch Broad Market 12-22 Year Index increased 12 basis points (0.12%) in 2007 from 4.64% to 4.76%. Yields on longer-term issues increased even more; the Merrill Lynch Broad Market 22+ Year Index started the year yielding 4.81% and finished the year 26 basis points (0.26%) higher at 5.07%. Short-term municipal bond yields on the other hand moved materially lower; the yield on the Merrill Lynch Broad Market 1-3 Year Index dropped 46 basis points (0.46%) from 3.66% to 3.20%.
While not explicitly tied to the U.S. Treasury markets, municipal bonds generally take their cue from what happens there. In 2007, short-term U.S. Treasury interest rates moved sharply lower; longer-term rates also moved lower but to a lesser degree. Those moves reflected the changing state of the economic environment.
The first quarter of the year was relatively quiet since the economic releases were relatively mixed. On the good side, unemployment was down to 4.4% in March, payroll growth was still relatively robust, and the 4-week average of initial claims for unemployment insurance was drifting lower. Unfortunately, the good news in the labor markets was offset by the bad news in the housing sector; it remained under duress, and it started to become apparent that the hoped for bottom of the housing market was still quite a ways off.
During the second quarter of the year, rates on short- and long-term bonds moved in opposite directions, reflecting two distinct factors. For shorter-term bonds, a significant change in the market’s supply/demand dynamics pushed interest rates lower. A shrinking Federal deficit mitigates the Treasury’s borrowing needs, which in turn shrinks the supply of U.S. Treasury Bills, while foreign central banks began paring back their longer-term U.S. Treasury purchases, focusing instead on U.S. Treasury Bills. The combination of a shrinking supply and increased demand pushed short-term U.S. Treasury rates lower. For intermediate-to-longer-term bonds, rates rose due to a marked change in the market’s expectations about monetary policy and the rate of economic growth. As we moved into the summer, a number of the economic releases suggested that the rate of economic growth was picking back up. At the same time, the Fed started to hedge when it came to defining what it considered to be an acceptable rate of inflation. The markets responded by re-adjusting intermediate-to-longer term interest rates higher.
Market psychology definitely changed during the third quarter of the year and a precipitous drop in interest rates began, triggered by a flight to quality and a reassessment of the trajectory of Fed policy. While the problems in the market for subprime mortgage loans were well known prior to the third quarter, the collapse of two high profile hedge funds at Bear Stearns along with a couple of European bank announcements revealed the first set of identifiable victims. That caused investors to exit and/or avoid anything remotely tied to the subprime sector. The proceeds were parked in the perceived safest, most liquid alternative, specifically short-term U.S. Treasury instruments. Given the financial dislocations caused by this flight to quality, both the Fed and European central banks responded by injecting liquidity into the financial system. The Fed began by cutting the discount rate (the rate charged to banks to borrow reserves directly from the Fed), and followed that initial move with its first cut in the Fed Funds target (the rate charged by banks to borrow reserves from each other). Cutting the targeted Fed Funds rate was not only a response to the liquidity concerns associated with a flight to quality, but also a response to a weakening labor market, with the average gains down more than one-third from the gains reported over the prior 12 to 18 months.
Management Discussion and Analysis (unaudited)
During the fourth quarter there were two additional policy moves enacted by the Fed. It followed up its 50 basis point (0.50%) cut in September with 25 basis point (0.25%) cuts in October and again in December. The Fed and the markets were both responding to the headwinds that continued to buffet the U.S. economy. The housing sector continued to sink, with new home sales dropping 50% from their highs, existing home sales down one-third, and home prices posting year-over-year declines, a decidedly rare occurrence. What was more troubling was the fact that the problems in the housing sector appeared to have spilled over into other sectors of the economy. Job growth had slowed and the unemployment rate had risen to 5.0%, a level not seen since the end of 2005. At some point that should affect personal income growth, which had been remarkably robust.
While municipal bonds may take their cue from the U.S. Treasury markets, their movements also depend on factors specific to the municipal market. In 2007, short-term municipal yields moved lower along with U.S. Treasuries, but the magnitude of the move was not as great. Longer-term municipal yields ignored the U.S. Treasury market and those yields actually moved higher. The deviations can be traced to two factors: deteriorating credit quality within the municipal market and the subprime/collateralized debt obligation (CDO) issues that arose in the monoline insurer industry. In terms of credit quality, the debacle in the housing market (affecting property tax revenues), the smallest rise in retail sales since 2002 (affecting sales tax revenues), and modest increases in the equity markets (affecting capital gains tax revenues) put pressure on tax receipts. At the same time, worries about the economy suggest that spending on social services is likely to increase. As for the monoline insurers, their forays into the CDO marketplace caused the ratings agencies to re-examine their AAA credit ratings, which in turn caused municipal investors to look through the insurance overlays to the underlying credit rating of the issuer.
As for the performance of the Ohio Tax Exempt Series in 2007, its total return was 3.28%. That lagged the total return of the Merrill Lynch 1-12 Year Municipal Bond Index which was 4.98%, but it compares quite favorably with the Lipper average, which was 1.90% in 2007. The Series holds a number of longer-term bonds, which the Index does not. Those longer-term holdings did not perform well in 2007, which explains the underperformance versus the Index. However, those longer-term holdings generated attractive coupons in 2007, and we continue to view them as attractive investments.
We appreciate your business and wish you all the very best in the coming year.
Sincerely,
Manning & Napier Advisors, Inc.
Performance Update as of December 31, 2007 (unaudited)
| | | | | | | | | | |
| | | Average Annual Total Returns
As of December 31, 2007 | | |
| | | One
Year | | Five
Year | | Ten
Year | | Since
Inception1 | | |
Manning & Napier Fund, Inc. - Ohio Tax Exempt Series2 | | 3.28% | | 3.36% | | 4.09% | | 4.43% | | |
Merrill Lynch 1-12 Year Municipal Bond Index3 | | 4.98% | | 3.77% | | 5.00% | | 5.20% | | |
The following graph compares the value of a $10,000 investment in the Manning & Napier Fund, Inc. - Ohio Tax Exempt Series for the ten years ended December 31, 2007 to the Merrill Lynch 1-12 Year Municipal Bond Index.

1Performance numbers for the Series and Index are calculated from February 14, 1994, the Series’ inception date.
2The Series’ performance does not reflect the deduction of taxes that a shareholder would pay on fund distributions or the redemption of shares. The Series’ performance is historical and may not be indicative of future results. The performance returns shown are inclusive of the net expense ratio of the Series. For the year ended December 31, 2007, this net expense ratio was 0.85%. The gross expense ratio, which does not account for any voluntary or contractual waivers currently in effect, was 0.85% for the year ended December 31, 2007.
3The Merrill Lynch 1-12 Year Municipal Bond Index is an unmanaged, market weighted index comprised of investment-grade, fixed rate, coupon bearing municipal bonds with maturities greater than one year but less than twelve years. The Index returns assume reinvestment of coupons and, unlike Series returns, do not reflect any fees or expenses.
Shareholder Expense Example (unaudited)
As a shareholder of the Series, you may incur two types of costs: (1) transaction costs, including potential wire charges on redemptions and (2) ongoing costs, including management fees and other Series expenses. This example is intended to help you understand your ongoing costs (in dollars) of investing in the Series and to compare these costs with the ongoing costs of investing in other mutual funds.
The example is based on an investment of $1,000 invested at the beginning of the period and held for the entire period (July 1, 2007 to December 31, 2007).
Actual Expenses
The first line of the table below provides information about actual account values and actual expenses. You may use the information in this line, together with the amount you invested, to estimate the expenses that you paid over the period. Simply divide your account value by $1,000 (for example, an $8,600 account value divided by $1,000 = 8.6), then multiply the result by the number in the first line under the heading entitled “Expenses Paid During Period” to estimate the expenses you paid on your account during this period.
Hypothetical Example for Comparison Purposes
The second line of the table below provides information about hypothetical account values and hypothetical expenses based on the Series’ actual expense ratio and an assumed rate of return of 5% per year before expenses, which is not the Series’ actual return. The hypothetical account values and expenses may not be used to estimate the actual ending account balance or expenses you paid during the period. You may use this information to compare the ongoing costs of investing in the Series and other funds. To do so, compare this 5% hypothetical example with the 5% hypothetical examples that appear in the shareholder reports of the other funds.
Please note that the expenses shown in the table are meant to highlight your ongoing costs only and do not reflect any transaction costs, such as potential wire charges on redemptions. Therefore, the second line of the table is useful in comparing ongoing costs only, and will not help you determine the relative total costs of owning different funds. In addition, if these transaction costs were included, your costs would have been higher.
| | | | | | | | | |
| | | Beginning
Account Value
7/1/07 | | Ending
Account Value
12/31/07 | | Expenses Paid
During Period*
7/1/07-12/31/07 |
Actual | | $ | 1,000.00 | | $ | 1,035.80 | | $ | 4.36 |
Hypothetical
(5% return before expenses) | | $ | 1,000.00 | | $ | 1,020.92 | | $ | 4.33 |
*Expenses are equal to the Series’ annualized expense ratio (for the six-month period) of 0.85%, multiplied by the average account value over the period, multiplied by 184/365 (to reflect the one-half year period). Expenses are based on the most recent fiscal half year; therefore, the expense ratio stated above may differ from the expense ratio stated in the financial highlights, which is based on one-year data. The Series’ total return would have been lower had certain expenses not been waived during the period.
Portfolio Composition as of December 31, 2007 (unaudited)
Bond Types1
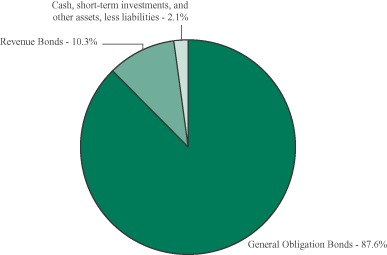
1As a percentage of net assets.
Credit Quality Ratings2,3
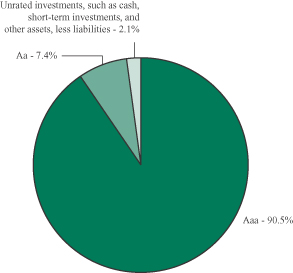
2As a percentage of net assets.
3Based on ratings from Moody’s, or the S&P equivalent. The Series may use different ratings provided by other rating agencies for purposes of determining compliance with the Series’ investment policies.
Investment Portfolio - December 31, 2007
| | | | | | | | | | | | | |
| | | Coupon
Rate | | | Maturity
Date | | Credit
Rating1
(unaudited) | | Principal
Amount | | Value
(Note 2) |
| | | | | | | | | | | | | |
| | | |
OHIO MUNICIPAL SECURITIES - 97.9% | | | | | | | | |
Amherst Exempt Village School District, G.O. Bond, FGIC | | 4.750 | % | | 12/1/2010 | | Aaa | | $ | 200,000 | | $ | 209,148 |
Avon Lake City School District, Prerefunded Balance, G.O. Bond, FGIC | | 5.750 | % | | 12/1/2014 | | Aaa | | | 500,000 | | | 534,760 |
Bedford Heights, Series A, G.O. Bond, AMBAC | | 5.650 | % | | 12/1/2014 | | Aaa | | | 40,000 | | | 42,658 |
Big Walnut Local School District, Delaware County, School Facilities Construction & Impt., G.O. Bond, FSA | | 4.500 | % | | 12/1/2029 | | Aaa | | | 200,000 | | | 199,440 |
Canal Winchester Local School District, Prerefunded Balance, G.O. Bond, MBIA | | 5.000 | % | | 12/1/2025 | | Aaa | | | 355,000 | | | 389,510 |
Canal Winchester Local School District, G.O. Bond, FSA | | 4.250 | % | | 12/1/2027 | | Aaa | | | 500,000 | | | 481,235 |
Chillicothe Water System, Revenue Bond, MBIA | | 4.000 | % | | 12/1/2009 | | Aaa | | | 125,000 | | | 127,262 |
Cincinnati, Prerefunded Balance, G.O. Bond | | 5.000 | % | | 12/1/2015 | | Aa1 | | | 300,000 | | | 320,292 |
Cincinnati, Various Purposes, Series A, G.O. Bond | | 5.000 | % | | 12/1/2011 | | Aa1 | | | 200,000 | | | 213,604 |
Cincinnati, Water Systems, Series B, Revenue Bond, MBIA | | 5.000 | % | | 12/1/2023 | | Aaa | | | 600,000 | | | 637,956 |
Cleveland Heights & University Heights County School District, Library Impt., G.O. Bond | | 5.125 | % | | 12/1/2026 | | Aa3 | | | 200,000 | | | 208,404 |
Cleveland Waterworks, Prerefunded Balance, Series I, Revenue Bond, FSA | | 5.000 | % | | 1/1/2028 | | Aaa | | | 110,000 | | | 111,100 |
Cleveland Waterworks, Unrefunded Balance, Series I, Revenue Bond, FSA | | 5.000 | % | | 1/1/2028 | | Aaa | | | 155,000 | | | 156,550 |
Columbus, Limited Tax, Series 2, G.O. Bond | | 5.000 | % | | 7/1/2017 | | Aaa | | | 250,000 | | | 271,405 |
Columbus City School District, School Facilities Construction & Impt., G.O. Bond, FSA | | 4.250 | % | | 12/1/2032 | | Aaa | | | 500,000 | | | 476,330 |
Cuyahoga Falls, G.O. Bond, MBIA | | 5.000 | % | | 12/1/2021 | | Aaa | | | 750,000 | | | 797,242 |
Delaware City School District, Prerefunded Balance, G.O. Bond, FSA | | 5.000 | % | | 12/1/2025 | | Aaa | | | 200,000 | | | 205,604 |
Delaware City School District, Prerefunded Balance, G.O. Bond, FSA | | 5.000 | % | | 12/1/2025 | | Aaa | | | 100,000 | | | 102,802 |
Dublin City School District, School Facilities Construction & Impt., Prerefunded Balance, G.O. Bond | | 5.375 | % | | 12/1/2017 | | Aa1 | | | 350,000 | | | 383,533 |
Eaton City School District, Prerefunded Balance, G.O. Bond, FGIC | | 5.000 | % | | 12/1/2029 | | Aaa | | | 200,000 | | | 217,488 |
Eaton Community City Schools, School Impt., G.O. Bond, FGIC | | 4.125 | % | | 12/1/2026 | | Aaa | | | 500,000 | | | 468,390 |
Erie County, G.O. Bond, FGIC | | 4.750 | % | | 10/1/2019 | | Aaa | | | 175,000 | | | 176,505 |
Euclid, G.O. Bond, MBIA | | 4.250 | % | | 12/1/2023 | | Aaa | | | 465,000 | | | 463,386 |
| | |
| 6 | | The accompanying notes are an integral part of the financial statements. |
Investment Portfolio - December 31, 2007
| | | | | | | | | | | | | |
| | | Coupon
Rate | | | Maturity
Date | | Credit
Rating1
(unaudited) | | Principal
Amount | | Value
(Note 2) |
| | | | | | | | | | | | | |
| | |
OHIO MUNICIPAL SECURITIES (continued) | | | | | | |
Fairbanks Local School District, School Facilities Construction & Impt., G.O. Bond, FSA | | 4.500 | % | | 12/1/2028 | | Aaa | | $ | 400,000 | | $ | 398,912 |
Fairfield County, Building Impt., G.O. Bond | | 5.000 | % | | 12/1/2018 | | Aa3 | | | 250,000 | | | 262,580 |
Fairview Park City School District, School Impt., G.O. Bond, MBIA | | 5.000 | % | | 12/1/2029 | | Aaa | | | 315,000 | | | 327,849 |
Field Local School District, School Facilities Construction & Impt., G.O. Bond, AMBAC | | 5.000 | % | | 12/1/2026 | | Aaa | | | 200,000 | | | 208,158 |
Garfield Heights City School District, School Impt., Prerefunded Balance, G.O. Bond, MBIA | | 5.000 | % | | 12/15/2026 | | Aaa | | | 250,000 | | | 267,070 |
Genoa Area Local School District, Prerefunded Balance, G.O. Bond, FGIC | | 5.400 | % | | 12/1/2027 | | Aaa | | | 150,000 | | | 161,004 |
Granville Exempt Village School District, G.O. Bond, FSA | | 4.375 | % | | 12/1/2031 | | Aaa | | | 500,000 | | | 484,475 |
Greater Cleveland Regional Transit Authority, Capital Impts., G.O. Bond, FGIC | | 4.125 | % | | 12/1/2023 | | Aaa | | | 450,000 | | | 435,330 |
Greene County Sewer System, Governmental Enterprise, Prerefunded Balance, Revenue Bond, AMBAC | | 5.625 | % | | 12/1/2025 | | Aaa | | | 235,000 | | | 253,431 |
Hamilton City School District, School Impt., G.O. Bond, FSA | | 4.250 | % | | 12/1/2030 | | Aaa | | | 500,000 | | | 474,675 |
Hancock County, Various Purposes, G.O. Bond, MBIA | | 4.000 | % | | 12/1/2016 | | Aaa | | | 200,000 | | | 205,492 |
Highland Local School District, School Impt., G.O. Bond, FSA | | 5.000 | % | | 12/1/2009 | | Aaa | | | 190,000 | | | 196,914 |
Indian Hill Exempt Village School District, Hamilton County, School Impt., G.O. Bond | | 4.375 | % | | 12/1/2022 | | Aaa | | | 250,000 | | | 253,033 |
Ironton City School District, G.O. Bond, MBIA | | 4.250 | % | | 12/1/2028 | | Aaa | | | 500,000 | | | 483,815 |
Jackson Local School District, Stark & Summit Counties, Construction & Impt., Prerefunded Balance, G.O. Bond, FGIC | | 5.000 | % | | 12/1/2030 | | Aaa | | | 200,000 | | | 218,062 |
Jackson Local School District, Stark & Summit Counties, G.O. Bond, FGIC | | 3.500 | % | | 12/1/2011 | | Aaa | | | 210,000 | | | 212,453 |
Kettering City School District, School Impt., G.O. Bond, FSA | | 4.250 | % | | 12/1/2025 | | Aaa | | | 750,000 | | | 727,890 |
Lakewood, Water System, Revenue Bond, AMBAC | | 4.500 | % | | 7/1/2028 | | Aaa | | | 500,000 | | | 494,065 |
Licking Heights Local School District, School Facilities Construction & Impt., Series A, G.O. Bond, MBIA | | 5.000 | % | | 12/1/2022 | | Aaa | | | 250,000 | | | 264,582 |
| | |
| The accompanying notes are an integral part of the financial statements. | | 7 |
Investment Portfolio - December 31, 2007
| | | | | | | | | | | | | | |
| | | Coupon
Rate | | | Maturity
Date | | Credit
Rating1
(unaudited) | | | Principal
Amount | | Value
(Note 2) |
| | | | | | | | | | | | | | |
| | |
OHIO MUNICIPAL SECURITIES (continued) | | | | | | | |
Lorain City School District, Classroom Facilities Impt., Prerefunded Balance, G.O. Bond, MBIA | | 4.750 | % | | 12/1/2025 | | Aaa | | | $ | 65,000 | | $ | 69,950 |
Lorain City School District, Classroom Facilities Impt., Unrefunded Balance, G.O. Bond, MBIA | | 4.750 | % | | 12/1/2025 | | Aaa | | | | 335,000 | | | 343,120 |
Loveland City School District, Prerefunded Balance, Series A, G.O. Bond, MBIA | | 5.000 | % | | 12/1/2024 | | Aaa | | | | 200,000 | | | 209,242 |
Mansfield City School District, Various Purposes, Prerefunded Balance, G.O. Bond, MBIA | | 5.750 | % | | 12/1/2022 | | Aaa | | | | 250,000 | | | 265,185 |
Marysville Exempt Village School District, G.O. Bond, FSA | | 5.000 | % | | 12/1/2023 | | Aaa | | | | 500,000 | | | 529,105 |
Maumee, G.O. Bond, MBIA | | 4.125 | % | | 12/1/2018 | | Aaa | | | | 375,000 | | | 382,507 |
Maumee City School District, School Facilities Construction & Impt., G.O. Bond, FSA | | 4.600 | % | | 12/1/2031 | | Aaa | | | | 260,000 | | | 260,445 |
Medina City School District, G.O. Bond, FGIC | | 5.000 | % | | 12/1/2018 | | Aaa | | | | 150,000 | | | 152,117 |
Minster Local School District, G.O. Bond, FSA | | 4.250 | % | | 12/1/2018 | | AAA | 2 | | | 250,000 | | | 256,245 |
Mississinawa Valley Local School District, Classroom Facilities, Prerefunded Balance, G.O. Bond, FSA | | 5.750 | % | | 12/1/2022 | | Aaa | | | | 205,000 | | | 221,203 |
New Albany Plain Local School District, Prerefunded Balance, G.O. Bond, FGIC | | 5.000 | % | | 12/1/2025 | | Aaa | | | | 45,000 | | | 48,214 |
New Albany Plain Local School District, Prerefunded Balance, G.O. Bond, FGIC | | 5.000 | % | | 12/1/2029 | | Aaa | | | | 95,000 | | | 101,786 |
New Albany Plain Local School District, Unrefunded Balance, G.O. Bond, FGIC | | 5.000 | % | | 12/1/2029 | | Aaa | | | | 130,000 | | | 133,496 |
New Albany Plain Local School District, Prerefunded Balance, G.O. Bond, FGIC | | 5.000 | % | | 12/1/2025 | | Aaa | | | | 85,000 | | | 91,072 |
New Albany Plain Local School District, Unrefunded Balance, G.O. Bond, FGIC | | 5.000 | % | | 12/1/2025 | | Aaa | | | | 185,000 | | | 191,891 |
Ohio State, Common Schools Capital Facilities, Prerefunded Balance, Series A, G.O. Bond | | 4.750 | % | | 6/15/2020 | | Aa1 | | | | 250,000 | | | 259,557 |
Ohio State, Infrastructure Impt., Series A, G.O. Bond | | 5.000 | % | | 3/1/2017 | | Aa1 | | | | 250,000 | | | 273,397 |
Ohio State Water Development Authority, Pure Water, Series I, Revenue Bond, AMBAC | | 6.000 | % | | 12/1/2016 | | Aaa | | | | 40,000 | | | 44,643 |
Ohio State Water Development Authority, Fresh Water, Prerefunded Balance, Revenue Bond, FSA | | 5.125 | % | | 12/1/2023 | | Aaa | | | | 300,000 | | | 305,622 |
Ohio State Water Development Authority, Pollution Control, Revenue Bond | | 5.250 | % | | 12/1/2015 | | Aaa | | | | 200,000 | | | 224,454 |
Ohio State Water Development Authority, Water Quality, Revenue Bond | | 5.000 | % | | 12/1/2012 | | Aaa | | | | 350,000 | | | 377,650 |
| | |
| 8 | | The accompanying notes are an integral part of the financial statements. |
Investment Portfolio - December 31, 2007
| | | | | | | | | | | | | | |
| | | Coupon
Rate | | | Maturity
Date | | Credit
Rating1
(unaudited) | | | Principal
Amount | | Value
(Note 2) |
| | | | | | | | | | | | | | |
| | |
OHIO MUNICIPAL SECURITIES (continued) | | | | | | | |
Olentangy Local School District, Series A, G.O. Bond, FSA | | 4.500 | % | | 12/1/2032 | | Aaa | | | $ | 800,000 | | $ | 793,576 |
Ontario Local School District, Prerefunded Balance, G.O. Bond, FSA | | 5.000 | % | | 12/1/2023 | | Aaa | | | | 350,000 | | | 359,807 |
Orange City School District, Prerefunded Balance, G.O. Bond | | 5.000 | % | | 12/1/2023 | | Aaa | | | | 305,000 | | | 316,273 |
Orange City School District, G.O. Bond | | 4.500 | % | | 12/1/2023 | | Aaa | | | | 500,000 | | | 505,340 |
Painesville City School District, School Impt., G.O. Bond, FGIC | | 4.500 | % | | 12/1/2025 | | Aaa | | | | 170,000 | | | 171,100 |
Pickerington Local School District, G.O. Bond, MBIA | | 4.300 | % | | 12/1/2024 | | Aaa | | | | 300,000 | | | 296,613 |
Plain Local School District, G.O. Bond, FGIC | | 5.000 | % | | 12/1/2030 | | Aaa | | | | 140,000 | | | 143,664 |
Sidney City School District, School Impt., Prerefunded Balance, Series B, G.O. Bond, FGIC | | 5.100 | % | | 12/1/2019 | | Aaa | | | | 150,000 | | | 162,310 |
South-Western City School District, Franklin & Pickway County, Prerefunded Balance, G.O. Bond, AMBAC | | 4.750 | % | | 12/1/2026 | | Aaa | | | | 175,000 | | | 180,526 |
South-Western City School District, Franklin & Pickway County, G.O. Bond, FSA | | 4.250 | % | | 12/1/2026 | | Aaa | | | | 600,000 | | | 578,712 |
Springboro Community City School District, School Impt., Prerefunded Balance, G.O. Bond, MBIA | | 5.000 | % | | 12/1/2025 | | Aaa | | | | 280,000 | | | 305,287 |
Sugarcreek Local School District, School Impt., G.O. Bond, FSA | | 4.250 | % | | 12/1/2031 | | Aaa | | | | 750,000 | | | 706,740 |
Tallmadge City School District, School Facilities, G.O. Bond, FSA | | 5.000 | % | | 12/1/2031 | | AAA | 2 | | | 200,000 | | | 208,030 |
Tecumseh Local School District, School Impt., G.O. Bond, FGIC | | 4.750 | % | | 12/1/2027 | | Aaa | | | | 195,000 | | | 198,676 |
Trotwood-Madison City School District, School Impt., G.O. Bond, FSA | | 4.250 | % | | 12/1/2022 | | Aaa | | | | 250,000 | | | 250,178 |
Troy City School District, School Impt., G.O. Bond, FSA | | 4.000 | % | | 12/1/2014 | | Aaa | | | | 250,000 | | | 258,733 |
Van Buren Local School District, School Facilities Construction & Impt., G.O. Bond, FSA | | 5.250 | % | | 12/1/2016 | | Aaa | | | | 300,000 | | | 320,979 |
Van Wert City School District, School Impt., Prerefunded Balance, G.O. Bond, FGIC | | 5.000 | % | | 12/1/2020 | | Aaa | | | | 500,000 | | | 539,450 |
Vandalia, G.O. Bond, AMBAC | | 5.000 | % | | 12/1/2015 | | Aaa | | | | 235,000 | | | 256,362 |
Washington Court House City School District, School Impt., G.O. Bond, FGIC | | 5.000 | % | | 12/1/2029 | | Aaa | | | | 500,000 | | | 521,550 |
Westerville City School District, Prerefunded Balance, G.O. Bond, MBIA | | 5.000 | % | | 12/1/2027 | | Aaa | | | | 200,000 | | | 211,892 |
Wood County, G.O. Bond | | 5.400 | % | | 12/1/2013 | | Aa3 | | | | 30,000 | | | 30,044 |
| | |
| The accompanying notes are an integral part of the financial statements. | | 9 |
Investment Portfolio - December 31, 2007
| | | | | | | | | | | | | |
| | | Coupon
Rate | | | Maturity
Date | | Credit
Rating1
(unaudited) | | Principal
Amount/
Shares | | Value
(Note 2) |
| | | | | | | | | | | | | |
| | |
OHIO MUNICIPAL SECURITIES (continued) | | | | | | |
Wyoming City School District, Prerefunded Balance, Series B, G.O. Bond, FGIC | | 5.150 | % | | 12/1/2027 | | Aaa | | $ | 300,000 | | $ | 308,811 |
| | | | | | | | | | | | | |
TOTAL OHIO MUNICIPAL SECURITIES (Identified Cost $25,525,735) | | | | | | | | | | | | | 25,889,948 |
| | | | | | | | | | | | | |
| | | |
SHORT-TERM INVESTMENTS - 1.8% | | | | | | | | |
Dreyfus Municipal Reserves - Class R
(Identified Cost $463,507) | | | | | | | | | | 463,507 | | | 463,507 |
| | | | | | | | | | | | | |
TOTAL INVESTMENTS - 99.7%
(Identified Cost $25,989,242) | | | | | | | | | | | | | 26,353,455 |
OTHER ASSETS, LESS LIABILITIES - 0.3% | | | | | | | | | | | | | 79,038 |
| | | | | | | | | | | | | |
NET ASSETS - 100% | | | | | | | | | | | | $ | 26,432,493 |
| | | | | | | | | | | | | |
Key:
G.O. Bond - General Obligation Bond
Impt. - Improvement
Scheduled principal and interest payments are guaranteed by:
AMBAC (AMBAC Assurance Corp.)
FGIC (Financial Guaranty Insurance Co.)
FSA (Financial Security Assurance)
MBIA (MBIA, Inc.)
The insurance does not guarantee the market value of the municipal bonds.
1Credit ratings from Moody’s (unaudited).
2Credit ratings from S&P (unaudited).
The Series’ portfolio holds, as a percentage of net assets, greater than 10% in bonds insured by the following companies: FSA - 34.3%; MBIA - 22.9%; FGIC - 20.4%.
| | |
| 10 | | The accompanying notes are an integral part of the financial statements. |
Statement of Assets and Liabilities
December 31, 2007
| | | | |
ASSETS: | | | | |
| | | | |
| |
Investments, at value (identified cost $25,989,242) (Note 2) | | $ | 26,353,455 | |
Interest receivable | | | 123,242 | |
Receivable for fund shares sold | | | 39,202 | |
Dividends receivable | | | 2,656 | |
| | | | |
TOTAL ASSETS | | | 26,518,555 | |
| | | | |
| LIABILITIES: | | | | |
| |
Accrued management fees (Note 3) | | | 11,816 | |
Accrued fund accounting and transfer agent fees (Note 3) | | | 2,645 | |
Accrued Chief Compliance Officer service fees (Note 3) | | | 714 | |
Payable for fund shares repurchased | | | 39,201 | |
Audit fees payable | | | 27,861 | |
Other payables and accrued expenses | | | 3,825 | |
| | | | |
TOTAL LIABILITIES | | | 86,062 | |
| | | | |
TOTAL NET ASSETS | | $ | 26,432,493 | |
| | | | |
NET ASSETS CONSIST OF: | | | | |
| |
Capital stock | | $ | 25,335 | |
Additional paid-in-capital | | | 25,949,436 | |
Undistributed net investment income | | | 93,573 | |
Accumulated net realized loss on investments | | | (64 | ) |
Net unrealized appreciation on investments | | | 364,213 | |
| | | | |
TOTAL NET ASSETS | | $ | 26,432,493 | |
| | | | |
NET ASSET VALUE, OFFERING PRICE AND REDEMPTION
PRICE PER SHARE ($26,432,493/2,533,541 shares) | | $ | 10.43 | |
| | | | |
| | |
| The accompanying notes are an integral part of the financial statements. | | 11 |
Statement of Operations
For the Year Ended December 31, 2007
| | | | |
INVESTMENT INCOME: | | | | |
| | | | |
| |
Interest | | $ | 978,830 | |
Dividends | | | 28,663 | |
| | | | |
Total Investment Income | | | 1,007,493 | |
| | | | |
| EXPENSES: | | | | |
| |
Management fees (Note 3) | | | 116,405 | |
Fund accounting and transfer agent fees (Note 3) | | | 28,026 | |
Directors’ fees (Note 3) | | | 7,809 | |
Chief Compliance Officer service fees (Note 3) | | | 6,100 | |
Audit fees | | | 27,901 | |
Custodian fees | | | 1,426 | |
Miscellaneous | | | 11,145 | |
| | | | |
Total Expenses | | | 198,812 | |
Less reduction of expenses (Note 3) | | | (788 | ) |
| | | | |
Net Expenses | | | 198,024 | |
| | | | |
NET INVESTMENT INCOME | | | 809,469 | |
| | | | |
REALIZED AND UNREALIZED GAIN (LOSS) ON
INVESTMENTS: | | | | |
| |
Net realized gain on investments | | | 978 | |
Net change in unrealized appreciation on investments | | | (1,877 | ) |
| | | | |
| |
NET REALIZED AND UNREALIZED GAIN (LOSS) ON
INVESTMENTS | | | (899 | ) |
| | | | |
NET INCREASE IN NET ASSETS RESULTING FROM
OPERATIONS | | $ | 808,570 | |
| | | | |
| | |
| 12 | | The accompanying notes are an integral part of the financial statements. |
Statements of Changes in Net Assets
| | | | | | | | |
| | | For the
Year Ended
12/31/07
| | | For the
Year Ended
12/31/06 | |
| | | | | | | | |
| INCREASE (DECREASE) IN NET ASSETS: | | | | | | | | |
| | |
| OPERATIONS: | | | | | | | | |
| | |
Net investment income | | $ | 809,469 | | | $ | 683,416 | |
Net realized gain (loss) on investments | | | 978 | | | | (1,042 | ) |
Net change in unrealized appreciation on investments | | | (1,877 | ) | | | (117,339 | ) |
| | | | | | | | |
Net increase from operations | | | 808,570 | | | | 565,035 | |
| | | | | | | | |
DISTRIBUTIONS TO SHAREHOLDERS
(Note 8): | | | | | | | | |
| | |
From net investment income | | | (832,869 | ) | | | (666,971 | ) |
From net realized gain on investments | | | — | | | | (10,640 | ) |
| | | | | | | | |
Total distributions to shareholders | | | (832,869 | ) | | | (677,611 | ) |
| | | | | | | | |
| CAPITAL STOCK ISSUED AND REPURCHASED: | | | | | | | | |
| | |
Net increase from capital share transactions
(Note 5) | | | 5,845,120 | | | | 4,735,810 | |
| | | | | | | | |
Net increase in net assets | | | 5,820,821 | | | | 4,623,234 | |
| | |
| NET ASSETS: | | | | | | | | |
| | |
Beginning of year | | | 20,611,672 | | | | 15,988,438 | |
| | | | | | | | |
End of year (including undistributed net investment income of $93,573 and $116,973, respectively) | | $ | 26,432,493 | | | $ | 20,611,672 | |
| | | | | | | | |
| | |
| The accompanying notes are an integral part of the financial statements. | | 13 |
Financial Highlights
| | | | | | | | | | |
| | | For the Years Ended |
| | | 12/31/07 | | 12/31/06 | | 12/31/05 | | 12/31/04 | | 12/31/03 |
| | | | | | | | | | |
| | | | | | | | | | |
| Per share data (for a share outstanding throughout each year): | | | | | | | | | | |
Net asset value - Beginning of year | | $10.46 | | $10.52 | | $10.59 | | $10.75 | | $10.74 |
| | | | | | | | | | |
Income (loss) from investment operations: | | | | | | | | | | |
Net investment income | | 0.34 | | 0.38 | | 0.38 | | 0.38 | | 0.42 |
Net realized and unrealized gain (loss) on investments | | —2 | | (0.05) | | (0.08) | | (0.04) | | 0.03 |
| | | | | | | | | | |
Total from investment operations | | 0.34 | | 0.33 | | 0.30 | | 0.34 | | 0.45 |
| | | | | | | | | | |
Less distributions to shareholders: | | | | | | | | | | |
From net investment income | | (0.37) | | (0.38) | | (0.36) | | (0.49) | | (0.39) |
From net realized gain on investments | | — | | (0.01) | | (0.01) | | (0.01) | | (0.05) |
| | | | | | | | | | |
Total distributions to shareholders | | (0.37) | | (0.39) | | (0.37) | | (0.50) | | (0.44) |
| | | | | | | | | | |
Net asset value - End of year | | $10.43 | | $10.46 | | $10.52 | | $10.59 | | $10.75 |
| | | | | | | | | | |
Total return1 | | 3.28% | | 3.19% | | 2.85% | | 3.28% | | 4.23% |
Ratios (to average net assets)/Supplemental Data: | | | | | | | | | | |
Expenses* | | 0.85% | | 0.85% | | 0.85% | | 0.85% | | 0.85% |
Net investment income | | 3.47% | | 3.81% | | 3.65% | | 3.64% | | 3.91% |
Portfolio turnover | | 3% | | 9% | | 9% | | 7% | | 14% |
Net assets - End of year (000’s omitted) | | $26,432 | | $20,612 | | $15,988 | | $14,120 | | $12,092 |
| | | | | | | | | | |
|
*The investment advisor did not impose all or a portion of its management fee and in some years paid a portion of the Series’ expenses. If these expenses had been incurred by the Series, the expense ratio (to average net assets) would |
have been increased as follows: | | 0.00%3 | | 0.07% | | 0.15% | | 0.20% | | 0.59% |
1Represents aggregate total return for the year indicated, and assumes reinvestment of all distributions. Total return would have been lower had certain expenses not been waived or reimbursed during the year.
2Less than $0.01 per share.
3Less than 0.01%.
| | |
| 14 | | The accompanying notes are an integral part of the financial statements. |
Notes to Financial Statements
Ohio Tax Exempt Series (the “Series”) is a no-load diversified series of Manning & Napier Fund, Inc. (the “Fund”). The Fund is organized in Maryland and is registered under the Investment Company Act of 1940, as amended, as an open-end management investment company.
The Series’ investment objective is to provide as high a level of current income exempt from federal income tax and Ohio State personal income tax as the Advisor believes is consistent with the preservation of capital.
The Fund’s Advisor is Manning & Napier Advisors, Inc. (the “Advisor”). Shares of the Series are offered to investors, clients and employees of the Advisor and its affiliates. The total authorized capital stock of the Fund consists of 5.0 billion shares of common stock each having a par value of $0.01. As of December 31, 2007, 3.33 billion shares have been designated in total among 27 series, of which 100 million have been designated as Ohio Tax Exempt Series Class A common stock.
| 2. | SIGNIFICANT ACCOUNTING POLICIES |
Security Valuation
Municipal securities will normally be valued on the basis of market valuations provided by an independent pricing service (the “Service”). The Service utilizes the latest price quotations and a matrix system (which considers such factors as security prices of similar securities, yields, maturities and ratings). The Service has been approved by the Fund’s Board of Directors (the “Board”).
Securities for which representative valuations or prices are not available from the Fund’s pricing service may be valued at fair value. Due to the inherent uncertainty of valuations of such securities, the fair value may differ significantly from the values that would have been used had a ready market for such securities existed. Fair value is determined in good faith by the Advisor under procedures approved by and under the general supervision and responsibility of the Fund’s Board.
Short-term investments that mature in sixty days or less are valued at amortized cost, which approximates market value. Investments in open-end investment companies are valued at their net asset value per share on valuation date.
Security Transactions, Investment Income and Expenses
Security transactions are accounted for on trade date. Interest income, including amortization of premium and accretion of discounts using the effective interest method, is earned from settlement date and accrued daily. Dividend income is recorded on an accrual basis on ex-dividend date.
Expenses are recorded on an accrual basis. Most expenses of the Fund can be attributed to a specific series. Expenses which cannot be directly attributed are apportioned among the series in the Fund in such a manner as deemed equitable by the Fund’s Board, taking into consideration, among other things, the nature and type of expense.
The Series uses the identified cost method for determining realized gain or loss on investments for both financial statement and federal income tax reporting purposes.
Notes to Financial Statements
| 2. | SIGNIFICANT ACCOUNTING POLICIES (continued) |
Federal Taxes
The Series’ policy is to comply with the provisions of the Internal Revenue Code applicable to regulated investment companies. The Series is not subject to federal income tax or excise tax to the extent that the Series distributes to shareholders each year its taxable income, including any net realized gains on investments, in accordance with requirements of the Internal Revenue Code. Accordingly, no provision for federal income tax or excise tax has been made in the financial statements.
On June 29, 2007, the Series adopted Financial Accounting Standards Board Interpretation No. 48 - Accounting for Uncertainty in Income Taxes (“FIN 48”). FIN 48 prescribes the minimum recognition threshold a tax position must meet in connection with accounting for uncertainties in income tax positions taken or expected to be taken by an entity before being measured and recognized in the financial statements. Management has determined that FIN 48 did not have a material impact on the Series’ financial statements. The Series files income tax returns in the U.S. federal jurisdiction and various states, as required. No income tax returns are currently under investigation. The statute of limitations on the Series’ tax returns remains open for the years ended December 31, 2004 through December 31, 2007.
Distributions of Income and Gains
Distributions to shareholders of net investment income are made quarterly. Distributions of net realized gains are made annually. An additional distribution may be necessary to avoid taxation of the Series. Distributions are recorded on the ex-dividend date.
Indemnifications
The Fund’s organizational documents provide former and current directors and officers with a limited indemnification against liabilities arising in connection with the performance of their duties to the Fund. In the normal course of business, the Fund may also enter into contracts that provide general indemnifications. The Fund’s maximum exposure under these arrangements is unknown as this would be dependent on future claims that may be made against the Fund. The risk of material loss from such claims is considered remote.
Other
The preparation of financial statements in conformity with accounting principles generally accepted in the United States of America requires management to make estimates and assumptions that affect the reported amounts of assets and liabilities and the disclosure of contingent assets and liabilities at the date of the financial statements and the reported amounts of income and expenses during the reporting period. Actual results could differ from those estimates.
| 3. | TRANSACTIONS WITH AFFILIATES |
The Fund has an Investment Advisory Agreement (the “Agreement”) with the Advisor, for which the Series pays a fee, computed daily and payable monthly, at an annual rate of 0.50% of the Series’ average daily net assets.
Under the Agreement, personnel of the Advisor provide the Series with advice and assistance in the choice of investments and the execution of securities transactions, and otherwise maintain the Series’ organization. The Advisor also provides the Fund with necessary office space and fund administration and support services. The salaries of all officers of the Fund (except a percentage of the Fund’s Chief Compliance Officer’s salary, which is paid by the Fund), and of
Notes to Financial Statements
| 3. | TRANSACTIONS WITH AFFILIATES (continued) |
all Directors who are “affiliated persons” of the Fund, or of the Advisor, and all personnel of the Fund, or of the Advisor, performing services relating to research, statistical and investment activities, are paid by the Advisor. Each “non-affiliated” Director receives an annual stipend, which is allocated among all the active series of the Fund. In addition, these Directors also receive a fee per Board meeting attended for each active series of the Fund plus a fee for each committee meeting attended.
The Advisor has contractually agreed, until at least April 30, 2009, to waive its fee and, if necessary, pay other operating expenses of the Series in order to maintain total direct annual fund operating expenses for the Series at no more than 0.85% of average daily net assets each year. Accordingly, the Advisor waived fees of $788 for the year ended December 31, 2007, which is reflected as a reduction of expenses on the Statement of Operations. The Advisor is not eligible to recoup any expenses that have been waived or reimbursed in prior years.
Manning & Napier Investor Services, Inc., a registered broker-dealer affiliate of the Advisor, acts as distributor for the Fund’s shares. The services of Manning & Napier Investor Services, Inc. are provided at no additional cost to the Series.
For fund accounting and transfer agent services, the Fund pays the Advisor an annual fee of 0.11% of the Fund’s average daily net assets up to $900 million, 0.07% of the Fund’s average daily net assets between $900 million and $1.5 billion, and 0.04% of the Fund’s average daily net assets over $1.5 billion. Additionally, certain transaction and account-based fees and out-of-pocket expenses, including charges for reporting relating to the Fund’s compliance program, are charged. Expenses not directly attributable to a series are allocated based on each series’ relative net assets or number of accounts, depending on the expense. The Advisor has an agreement with Citi Fund Services Ohio, Inc. (“Citi”) (formerly BISYS Fund Services Ohio, Inc.) under which Citi serves as sub-accountant services and sub-transfer agent.
| 4. | PURCHASES AND SALES OF SECURITIES |
For the year ended December 31, 2007, purchases and sales of securities, other than United States Government securities and short-term securities, were $6,573,996 and $587,750, respectively. There were no purchases or sales of United States Government securities.
| 5. | CAPITAL STOCK TRANSACTIONS |
Transactions in shares of Ohio Tax Exempt Series were:
| | | | | | | | | | | | | | |
| | | For the Year
Ended 12/31/07 | | | For the Year
Ended 12/31/06 | |
| | | Shares | | | Amount | | | Shares | | | Amount | |
| | | | | | | | | | | | | | |
Sold | | 696,089 | | | $ | 7,222,235 | | | 537,520 | | | $ | 5,640,792 | |
Reinvested | | 79,805 | | | | 825,938 | | | 64,255 | | | | 671,426 | |
Repurchased | | (212,265 | ) | | | (2,203,053 | ) | | (151,462 | ) | | | (1,576,408 | ) |
| | | | | | | | | | | | | | |
Total | | 563,629 | | | $ | 5,845,120 | | | 450,313 | | | $ | 4,735,810 | |
| | | | | | | | | | | | | | |
Substantially all of the Series’ shares represent investments by fiduciary accounts over which the Advisor has sole investment discretion.
Notes to Financial Statements
The Series may trade in financial instruments with off-balance sheet risk in the normal course of its investing activities to assist in managing exposure to various market risks. These financial instruments include written options and futures contracts and may involve, to a varying degree, elements of risk in excess of the amounts recognized for financial statement purposes. No such investments were held by the Series on December 31 2007.
| 7. | CONCENTRATION OF CREDIT |
The Series primarily invests in debt obligations issued by the State of Ohio and its political subdivisions, agencies and public authorities to obtain funds for various public purposes. The Series is more susceptible to factors adversely affecting issues of Ohio municipal securities than is a municipal bond fund that is not concentrated in these issues to the same extent.
| 8. | FEDERAL INCOME TAX INFORMATION |
The amount and characterization of certain income and capital gains to be distributed are determined in accordance with federal income tax regulations, which may differ from accounting principles generally accepted in the United States of America. These differences are primarily due to differing book and tax treatments in the timing of the recognition of net investment income or gains and losses, including market discount. The Series may periodically make reclassifications among its capital accounts to reflect income and gains available for distribution (or available capital loss carryovers) under income tax regulations, without impacting the Series’ net asset value. Any such reclassifications are not reflected in the financial highlights.
The tax character of distributions paid were as follows:
| | | | | | |
| | | For the Year
Ended 12/31/07 | | For the Year
Ended 12/31/06 |
Ordinary income | | $ | 83 | | $ | 43,306 |
Tax exempt income | | | 832,786 | | | 623,690 |
Long-term capital gains | | | — | | | 10,615 |
At December 31, 2007, the tax basis components of distributable earnings and the net unrealized appreciation based on identified cost for federal income tax purposes were as follows:
| | | | |
Cost for federal income tax purposes | | $ | 25,957,571 | |
| | | | |
Unrealized appreciation | | $ | 568,835 | |
Unrealized depreciation | | | (172,951 | ) |
| | | | |
Net unrealized appreciation | | $ | 395,884 | |
Undistributed tax exempt income | | | 61,902 | |
Capital loss carryover | | | 64 | |
The capital loss carryover, disclosed above, available to the extent allowed by tax law to offset future net capital gain, if any, will expire on December 31, 2014.
Notes to Financial Statements
| 9. | RECENT ACCOUNTING PRONOUNCEMENTS |
In September 2006, FASB Statement of Financial Accounting Standards No. 157, Fair Value Measurements (“FAS 157”) was issued, and is effective for fiscal years beginning after November 15, 2007. FAS 157 defines fair value, establishes a framework for measuring fair value, and expands disclosure about fair value measurements. The standard does not expand the use of fair value in any new circumstances, but provides clarification on acceptable fair value methods and applications. At this time, management is evaluating the implications of FAS 157, but it is not expected to materially impact the Series’ financial statements.
Report of Independent Registered Public Accounting Firm
To the Board of Directors of Manning & Napier Fund, Inc. and Shareholders of Ohio Tax Exempt Series:
In our opinion, the accompanying statement of assets and liabilities, including the investment portfolio, and the related statements of operations and of changes in net assets and the financial highlights present fairly, in all material respects, the financial position of the Ohio Tax Exempt Series (a series of Manning & Napier Fund, Inc., hereafter referred to as the “Series”) at December 31, 2007, and the results of its operations for the year then ended, the changes in its net assets for each of the two years in the period then ended and the financial highlights for each of the five years in the period then ended, in conformity with accounting principles generally accepted in the United States of America. These financial statements and financial highlights (hereafter referred to as “financial statements”) are the responsibility of the Series’ management; our responsibility is to express an opinion on these financial statements based on our audits. We conducted our audits of these financial statements in accordance with the standards of the Public Company Accounting Oversight Board (United States). Those standards require that we plan and perform the audit to obtain reasonable assurance about whether the financial statements are free of material misstatement. An audit includes examining, on a test basis, evidence supporting the amounts and disclosures in the financial statements, assessing the accounting principles used and significant estimates made by management, and evaluating the overall financial statement presentation. We believe that our audits, which included confirmation of securities at December 31, 2007 by correspondence with the custodian, provide a reasonable basis for our opinion.

Columbus, Ohio
February 20, 2008
Supplemental Tax Information (unaudited)
Pursuant to Section 852 of the Internal Revenue Code, as amended, the Series hereby designates $832,786 as tax exempt dividends for the year ended December 31, 2007.
Renewal of Investment Advisory Agreements (unaudited)
During the period covered by this shareholder report, the Board of Directors (the “Board”) of Manning & Napier Fund, Inc. (the “Fund”) considered approval of two separate investment advisory agreements with Manning & Napier Advisors, Inc. (the “Advisor”):
| | • | | At a meeting held on August 30, 2007, the Board approved a new investment advisory agreement between the Fund and the Advisor (the “New Investment Advisory Agreement”) and recommended that the New Investment Advisory Agreement be submitted to shareholders for approval. Shareholders approved the New Investment Advisory Agreement at a meeting held on December 17, 2007. |
| | • | | At a meeting held on November 12, 2007, the Board approved the continuation of the then-current investment advisory agreement between the Fund and the Advisor (the “Current Investment Advisory Agreement”), which was to be superseded by the New Investment Advisory Agreement upon its approval by the Fund’s shareholders. The continuation of the Current Investment Advisory Agreement was necessary as a result of the delay in obtaining the number of votes necessary to convene the shareholder meeting and approve the New Investment Advisory Agreement with respect to all investment portfolios of the Fund (the “Series”). |
Consideration of New Investment Advisory Agreement:
In response to recent regulatory and compliance initiatives promulgated by the SEC over the past year, the Fund engaged in a comprehensive review of all material aspects of the Fund’s operations, including the Fund’s Current Investment Advisory Agreement. As a result of its review, the Board determined that the Current Investment Advisory Agreement should be amended for the purpose of modernizing the form of the agreement and to include additional provisions in the agreement that are customarily included in investment advisory agreements between registered investment companies and their investment advisors, but which are not included in the Current Investment Advisory Agreement. Accordingly, at the Board meeting on November 16, 2006, representatives of the Advisor presented to the Board proposed changes to the Current Investment Advisory Agreement in order to address the Board’s request to update and modernize the Current Investment Advisory Agreement. As a result of the discussions between the Board and representatives of the Advisor at the November 2006 Board meeting, the Board determined to formally consider the approval of a new investment advisory agreement between the Fund and the Advisor, which would incorporate the changes proposed at the November 2006 Board meeting, at its in-person Board meeting in August 2007.
At an in-person meeting held on August 30, 2007, the Board considered the approval of the New Investment Advisory Agreement between the Fund and the Advisor. Based on the information it received at the meeting and the November 16, 2006 Board meeting, the Board approved the New Investment Advisory Agreement subject to its further approval by the Fund’s shareholders. Representatives of the Advisor attended the meeting and presented additional oral and written information to the Board to assist the Board in its considerations. At the meeting, the Board concluded it was reasonable to take into account the conclusions the Board made when considering and evaluating the renewal of the Current Investment Advisory Agreement (the “2006 Annual Review”), which occurred at the November 16, 2006 in-person Board meeting, as part of its considerations to approve the New Investment Advisory Agreement. The discussion immediately below outlines the materials and information presented to the Board in connection with the Board’s 2006 Annual Review of the Current Investment Advisory Agreement and the conclusions made by the Directors when determining to continue the Current Investment Advisory Agreement for an additional one-year period.
Renewal of Investment Advisory Agreements (unaudited)
In connection with its review and deliberations, the Board considered the following factors and reached a conclusion with respect to such factors.
| | • | | The Board considered the services provided by the Advisor under the Current Investment Advisory Agreement including, among others: deciding what securities to purchase and sell for each Series; arranging for the purchase and sale of such securities by placing orders with broker-dealers; administering the affairs of the Fund (including the books and records of the Fund not maintained by third party service providers such as the custodian or sub-transfer agent); arranging for the insurance coverage for the Fund; and supervising the preparation of tax returns, SEC filings (including registration statements) and reports to shareholders for the Fund. The Board also considered the nature and quality of such services provided under the Current Investment Advisory Agreement in light of the Advisor’s services provided to the Fund for 21 years. The Board discussed the quality of these services with representatives from the Advisor and concluded that the Advisor was performing its services to the Fund required under the Current Investment Advisory Agreement in a reasonable manner. |
| | • | | The Board considered the investment performance of the various Series of the Fund. The investment performance for each Series was reviewed on a cumulative basis since inception and on a one year basis. In addition, annualized performance for the following time periods was considered: inception, three year, five year, ten year, and current market cycle. A market cycle includes periods of both rising and falling markets. Returns for established benchmark indices for each Series were provided for each time period. The Board noted that all the Series were competitive against their respective benchmark indices over all time periods noted above through September 30, 2006. In addition, the Board considered at the meeting (and considers on a quarterly basis) a peer group performance analysis consisting of Morningstar universes of mutual funds with similar investment objectives. The Board discussed the performance with representatives from the Advisor and concluded that the investment performance of each of the Fund’s Series was reasonable based on the Fund’s actual performance and comparative performance, especially performance over the current market cycle. |
| | • | | The Board considered the costs of the Advisor’s services and the profits of the Advisor as they relate to the Advisor’s services to the Fund under the Current Investment Advisory Agreement. In reviewing the Advisor’s costs and profits, the Board discussed the Advisor’s revenues generated from the Fund (on both an actual and adjusted basis) and its expenses associated with providing the services under the Current Investment Advisory Agreement. In addition, the Board reviewed the Advisor’s expenses associated with Fund activities outside of the Current Investment Advisory Agreement (such as expense reimbursements pursuant to expense caps and payments made by the Advisor to third party platforms on which shares of the Fund are available for purchase). It was noted by representatives of the Advisor that 6 of the 18 active Series of the Fund are currently experiencing expenses above the capped expense ratios. After discussing the above costs and profits, the Board concluded that the Advisor’s profitability relating to its services provided under the Current Investment Advisory Agreement was reasonable. |
| | • | | The Board considered the fees and expenses of the various Series of the Fund. The Advisor presented the advisory fees and total expenses for each Series, including the |
Renewal of Investment Advisory Agreements (unaudited)
| | advisory fee adjusted for any expense waivers or reimbursements (either contractual or voluntary) paid by the Advisor. The advisory fees and expense ratios of each Series were compared to an average (on both a mean and median basis) of similar funds as disclosed on the Morningstar database. Representatives of the Advisor discussed with the Board the levels of its advisory fee for each Series of the Fund and as compared to the median and mean advisory fees for similar funds as listed on Morningstar. Expense ratios for every Series, except the High Yield Bond Series, are currently below the median and mean for similar funds as listed on Morningstar. Based on their review of the information provided, the Board concluded that the fees and expenses of each Series of the Fund were reasonable on a comparative basis. |
| | • | | The Board also considered the other benefits the Advisor derives from its relationship with the Fund. Such other benefits include certain research products provided by soft dollars. Given the level of soft dollar transactions involving the Fund, the Board concluded that these additional benefits to the Advisor were reasonable. |
| | • | | In addition to the factors described above, the Board considered the Advisor’s personnel, investment strategies, policies and procedures relating to compliance with personal securities transactions, and reputation, expertise and resources in domestic and foreign financial markets. The Board concluded that these factors support the conclusion that the Advisor performs its services in a reasonable manner. |
| | • | | The Board did not consider economies of scale at this time because of the multiple uses of the Fund (for the Advisor’s discretionary investment account clients in addition to direct investors), the current profitability of the Advisor’s services to the Fund under the Current Investment Advisory Agreement, and the overall size of the Fund complex. |
Based on the Board’s deliberations and their evaluation of the information described above, the Board, including a majority of Directors that are “not interested” as defined in the Investment Company Act of 1940 (the “1940 Act”), concluded that the compensation under the Current Investment Advisory Agreement was fair and reasonable in light of the services and expenses and such other matters as the Directors considered to be relevant in the exercise of their reasonable judgment. Accordingly, the Board approved the renewal of the Current Investment Advisory Agreement for another year. In the course of their deliberations, the Directors did not identify any particular information that was all important or controlling.
As stated above, at the August 30, 2007 Board meeting, the Board concluded it was reasonable to take into account the conclusions set forth above when determining whether to approve the New Investment Advisory Agreement. The Board’s conclusion in this regard was based on the fact that the New Investment Advisory Agreement is identical to the Current Investment Advisory Agreement except for certain provisions of the Agreement which have been updated and modernized in response to the Board’s specific request. Further, the Board’s conclusion in this regard was based on the fact that the New Investment Advisory Agreement does not change either the investment advisory fees payable by the Fund to the Advisor or the day-to-day investment management services the Advisor provides to the Fund.
In addition to the conclusions formed with respect to the 2006 Annual Review, the Directors considered specific information at the August 30, 2007 Board meeting concerning the additional provisions included in the New Investment Advisory Agreement. The Directors considered the fact that these additional provisions are designed to (i) address and memorialize certain standard practices and regulatory requirements of mutual funds and their investment advisors; (ii) further
Renewal of Investment Advisory Agreements (unaudited)
delineate the duties and obligations of the Fund and the Advisor; (iii) modernize the agreement to reflect current industry practice and applicable law; and (iv) generally improve the overall quality of the agreement. The Board further considered the fact that the New Investment Advisory Agreement does not alter the actual day-to-day investment management services provided by the Advisor to each Series of the Fund, and the investment advisory fee rate paid to the Advisor under the New Investment Advisory Agreement for a Series is the same as the fee rate paid by the Series under the Current Investment Advisory Agreement.
Based on its evaluation of the information and the conclusions with respect thereto at its meetings on November 16, 2006 and August 30, 2007, the Board unanimously concluded that: (a) the terms of the New Investment Advisory Agreement were fair and reasonable; (b) the approval of the New Investment Advisory Agreement would be in the best interests of the shareholders and the Fund; and (c) it would recommend the approval of the New Investment Advisory Agreement to shareholders. In the course of their deliberations, the Board did not identify any particular information or factor that was all-important or controlling.
Consideration of Current Investment Advisory Agreement
At a meeting held on November 12, 2007, the Board considered the continuation of the Current Investment Advisory Agreement and simultaneously conducted its annual review of the services provided to the Fund by the Adviser (the “2007 Annual Review”). Representatives of the Advisor attended the meeting and presented additional oral and written information to the Board to assist the Board in its considerations. The discussion immediately below outlines the materials and information presented to the Board in connection with the Board’s 2007 Annual Review of the Current Investment Advisory Agreement and the conclusions made by the Directors when determining to continue the Current Investment Advisory Agreement.
In connection with its review and deliberations, the Board considered the following factors and reached a conclusion with respect to such factors.
| | • | | The Board considered the services provided by the Advisor under the Current Investment Advisory Agreement including, among others: deciding what securities to purchase and sell for each Series; arranging for the purchase and sale of such securities by placing orders with broker-dealers; administering the affairs of the Fund (including the books and records of the Fund not maintained by third party service providers such as the custodian or sub-transfer agent); arranging for the insurance coverage for the Fund; and supervising the preparation of tax returns, SEC filings (including registration statements) and reports to shareholders for the Fund. The Board also considered the nature and quality of such services provided under the Current Investment Advisory Agreement in light of the Advisor’s services provided to the Fund for 21 years. The Board discussed the quality of these services with representatives from the Advisor and concluded that the Advisor was performing its services to the Fund required under the Current Investment Advisory Agreement in a reasonable manner. |
| | • | | The Board considered the investment performance of the various Series of the Fund. The investment performance for each Series was reviewed on a cumulative basis since inception and on a one year basis. In addition, annualized performance for the following time periods was considered: inception, three year, five year, ten year, and current market cycle. A market cycle includes periods of both rising and falling markets. Returns for established benchmark indices for each Series were provided for |
Renewal of Investment Advisory Agreements (unaudited)
| | each time period. The Board noted that all the Series were competitive against their respective benchmark indices over all time periods noted above through September 30, 2007. In addition, the Board considered at the meeting (and considers on a quarterly basis) a peer group performance analysis consisting of Morningstar universes of mutual funds with similar investment objectives. The Board discussed the performance with representatives from the Advisor and concluded that the investment performance of each of the Fund’s Series was reasonable based on the Fund’s actual performance and comparative performance, especially performance over the current market cycle. |
| | • | | The Board considered the costs of the Advisor’s services and the profits of the Advisor as they relate to the Advisor’s services to the Fund under the Current Investment Advisory Agreement. In reviewing the Advisor’s costs and profits, the Board discussed the Advisor’s revenues generated from the Fund (on both an actual and adjusted basis) and its expenses associated with providing the services under the Current Investment Advisory Agreement. In addition, the Board reviewed the Advisor’s expenses associated with Fund activities outside of the Current Investment Advisory Agreement (such as expense reimbursements pursuant to expense caps and payments made by the Advisor to third party platforms on which shares of the Fund are available for purchase). It was noted by representatives of the Advisor that 4 of the 18 active Series of the Fund are currently experiencing expenses above the capped expense ratios. After discussing the above costs and profits, the Board concluded that the Advisor’s profitability relating to its services provided under the Current Investment Advisory Agreement was reasonable. |
| | • | | The Board considered the fees and expenses of the various Series of the Fund. The Advisor presented the advisory fees and total expenses for each Series, including the advisory fee adjusted for any expense waivers or reimbursements (either contractual or voluntary) paid by the Advisor. The advisory fees and expense ratios of each Series were compared to an average (on both a mean and median basis) of similar funds as disclosed on the Morningstar database. Representatives of the Advisor discussed with the Board the levels of its advisory fee for each Series of the Fund and as compared to the median and mean advisory fees for similar funds as listed on Morningstar. Expense ratios for every Series, except the High Yield Bond Series and Global Fixed Income Series, are currently below the median and mean for similar funds as listed on Morningstar. Based on their review of the information provided, the Board concluded that the fees and expenses of each Series of the Fund were reasonable on a comparative basis. |
| | • | | The Board also considered the other benefits the Advisor derives from its relationship with the Fund. Such other benefits include certain research products provided by soft dollars. Given the level of soft dollar transactions involving the Fund, the Board concluded that these additional benefits to the Advisor were reasonable. |
| | • | | In addition to the factors described above, the Board considered the Advisor’s personnel, investment strategies, policies and procedures relating to compliance with personal securities transactions, and reputation, expertise and resources in domestic and foreign financial markets. The Board concluded that these factors support the conclusion that the Advisor performs its services in a reasonable manner. |
Renewal of Investment Advisory Agreements (unaudited)
| | • | | The Board did not consider economies of scale at this time because of the multiple uses of the Fund (for the Advisor’s discretionary investment account clients in addition to direct investors), the current profitability of the Advisor’s services to the Fund under the Current Investment Advisory Agreement, and the overall size of the Fund complex. |
Based on the Board’s deliberations and their evaluation of the information described above, the Board, including a majority of Directors that are not “interested persons” as defined in the 1940 Act, concluded that the compensation under the Current Investment Advisory Agreement was fair and reasonable in light of the services and expenses and such other matters as the Directors considered to be relevant in the exercise of their reasonable judgment. Accordingly, the Board approved the renewal of the Current Investment Advisory Agreement. In the course of their deliberations, the Directors did not identify any particular information that was all important or controlling.
Proxy Voting Results (unaudited)
A special meeting of the shareholders of Manning & Napier Fund, Inc. was held on November 12, 2007. The number of votes necessary to conduct the meeting and approve each proposal was obtained, and the results of the votes of shareholders on proposals before them are listed below:
PROPOSAL 1:
Election of Directors.
| | | | |
| | | Number of Shares
voted for | | Number of Shares
withheld |
B. Reuben Auspitz | | 215,932,354.541 | | 15,898,685.154 |
Stephen B. Ashley | | 215,960,751.214 | | 15,870,288.481 |
Peter L. Faber | | 217,504,725.208 | | 14,326,314.487 |
Harris H. Rusitzky | | 215,924,013.609 | | 15,907,026.086 |
PROPOSAL 2:
To approve the investment advisory agreement between Manning & Napier Advisors, Inc. and Manning & Napier Fund, Inc.
| | |
| | | Number of shares voted |
For | | 1,907,262.000 |
Against | | 0 |
Abstain (includes broker non-votes) | | 0 |
PROPOSAL 3:
Eliminating, amending, or reclassifying certain fundamental investment policies or restrictions.
Proposal 3.A.i. To approve changes to the fundamental policy regarding borrowing money.
| | |
| | | Number of shares voted |
For | | 1,907,262.000 |
Against | | 0 |
Abstain (includes broker non-votes) | | 0 |
Proposal 3.A.ii. To approve changes to the fundamental policy regarding percentage of assets invested in any one industry.
| | |
| | | Number of shares voted |
For | | 1,907,262.000 |
Against | | 0 |
Abstain (includes broker non-votes) | | 0 |
Proposal 3.A.iii. To approve changes to the fundamental policy regarding loans.
| | |
| | | Number of shares voted |
For | | 1,907,262.000 |
Against | | 0 |
Abstain (includes broker non-votes) | | 0 |
Proxy Voting Results (unaudited)
Proposal 3.A.iv. To approve changes to the fundamental policy regarding issuance of senior securities or pledging its assets.
| | |
| | | Number of shares voted |
For | | 1,907,262.000 |
Against | | 0 |
Abstain (includes broker non-votes) | | 0 |
Proposal 3.A.v. To approve changes to the fundamental policy regarding buying or selling of commodities or commodity contracts.
| | |
| | | Number of shares voted |
For | | 1,907,262.000 |
Against | | 0 |
Abstain (includes broker non-votes) | | 0 |
Proposal 3.A.vi. To approve changes to the fundamental policy regarding underwriting of securities.
| | |
| | | Number of shares voted |
For | | 1,907,262.000 |
Against | | 0 |
Abstain (includes broker non-votes) | | 0 |
Proposal 3.A.vii. To approve changes to the fundamental policy regarding diversification.
| | |
| | | Number of shares voted |
For | | 1,907,262.000 |
Against | | 0 |
Abstain (includes broker non-votes) | | 0 |
Proposal 3.B.i. To approve changes to the policy/restriction regarding investment of its total net assets in securities of issuers that are restricted from being sold to the public without registration.
| | |
| | | Number of shares voted |
For | | 1,907,262.000 |
Against | | 0 |
Abstain (includes broker non-votes) | | 0 |
Proposal 3.B.ii. To approve changes to the policy/restriction regarding the purchase of securities on margin.
| | |
| | | Number of shares voted |
For | | 1,907,262.000 |
Against | | 0 |
Abstain (includes broker non-votes) | | 0 |
Proposal 3.B.iii. To approve changes to the policy/restriction regarding acquiring securities of other investment companies.
| | |
| | | Number of shares voted |
For | | 1,907,262.000 |
Against | | 0 |
Abstain (includes broker non-votes) | | 0 |
Proxy Voting Results (unaudited)
Proposal 3.B.v. To approve changes to the policy/restriction regarding options on securities and with respect to stock index and currency futures and related options.
| | |
| | | Number of shares voted |
For | | 1,907,262.000 |
Against | | 0 |
Abstain (includes broker non-votes) | | 0 |
Proposal 3.B.vi. To approve changes to the policy/restriction regarding hedging and derivative transactions.
| | |
| | | Number of shares voted |
For | | 1,907,262.000 |
Against | | 0 |
Abstain (includes broker non-votes) | | 0 |
Proposal 3.B.vii. To approve changes to the policy/restriction regarding the purchase of foreign securities.
| | |
| | | Number of shares voted |
For | | 1,907,262.000 |
Against | | 0 |
Abstain (includes broker non-votes) | | 0 |
Proposal 3.C.i. To approve changes to the policy/restriction regarding investment for the purpose of exercising control over management.
| | |
| | | Number of shares voted |
For | | 1,907,262.000 |
Against | | 0 |
Abstain (includes broker non-votes) | | 0 |
Proposal 3.C.iii. To approve changes to the policy/restriction regarding short sales or short positions.
| | |
| | | Number of shares voted |
For | | 1,907,262.000 |
Against | | 0 |
Abstain (includes broker non-votes) | | 0 |
Proposal 3.C.iv. To approve changes to the policy/restriction regarding participation in a joint or joint and several basis in trading account in securities.
| | |
| | | Number of shares voted |
For | | 1,907,262.000 |
Against | | 0 |
Abstain (includes broker non-votes) | | 0 |
Proxy Voting Results (unaudited)
Proposal 3.C.v. To approve changes to the policy/restriction regarding investment in oil, gas or other mineral exploration or development programs.
| | |
| | | Number of shares voted |
For | | 1,907,262.000 |
Against | | 0 |
Abstain (includes broker non-votes) | | 0 |
Proposal 3.C.vi. To approve changes to the policy/restriction regarding officers and directors of the Fund.
| | |
| | | Number of shares voted |
For | | 1,907,262.000 |
Against | | 0 |
Abstain (includes broker non-votes) | | 0 |
Proposal 3.C.vii. To approve changes to the policy/restriction regarding investing in any company with less than three years continuous operation.
| | |
| | | Number of shares voted |
For | | 1,907,262.000 |
Against | | 0 |
Abstain (includes broker non-votes) | | 0 |
Directors’ and Officers’ Information (unaudited)
The Statement of Additional Information provides additional information about the Fund’s directors and officers and can be obtained without charge by calling 1-800-466-3863, at www.manningnapieradvisors.com, or on the EDGAR Database on the SEC Internet web site (http://www.sec.gov). The following chart shows certain information about the Fund’s officers and directors, including their principal occupations during the last five years. Unless specific dates are provided, the individuals have held the listed positions for longer than five years.
INTERESTED DIRECTOR/OFFICER
| | |
| Name: | | B. Reuben Auspitz* |
| Address: | | 290 Woodcliff Drive
Fairport, NY 14450 |
| Age: | | 60 |
Current Position(s) Held with Fund:
| | Principal Executive Officer, President, Chairman & Director |
| Term of Office1 & Length of Time Served: | | Indefinite -Director since 1984; Vice President 1984 - 2003; President since 2004; Principal Executive Officer since 2002 |
| Principal Occupation(s) During Past 5 Years: | | Executive Vice President; Co-Executive Director; Executive Group Member**; Chief Compliance Officer since 2004 - Manning & Napier Advisors, Inc. President; Director - Manning & Napier Investor Services, Inc. Holds or has held one or more of the following titles for various subsidiaries and affiliates: President, Vice President, Director, Chairman, Treasurer, Chief Compliance Officer or Member. |
| Number of Portfolios Overseen within Fund Complex: | | 27 |
| Other Directorships Held Outside Fund Complex: | | N/A |
| |
| INDEPENDENT DIRECTORS | | |
| |
| Name: | | Stephen B. Ashley |
| Address: | | 290 Woodcliff Drive
Fairport, NY 14450 |
| Age: | | 67 |
| Current Position(s) Held with Fund: | | Director, Audit Committee Member, Governance & Nominating
Committee Member |
| Term of Office & Length of Time Served: | | Indefinite - Since 1996 |
| Principal Occupation(s) During Past 5 Years: | | Chairman, Director, President & Chief Executive Officer, The Ashley
Group (property management and investment) |
| Number of Portfolios Overseen within Fund Complex: | | 27 |
| Other Directorships Held Outside Fund Complex: | | The Ashley Group
Fannie Mae |
| Name: | | Peter L. Faber |
| Address: | | 290 Woodcliff Drive
Fairport, NY 14450 |
| Age: | | 68 |
| Current Position(s) Held with Fund: | | Director, Governance & Nominating Committee Member |
| Term of Office & Length of Time Served: | | Indefinite - Since 1987 |
| Principal Occupation(s) During Past 5 Years: | | Senior Counsel, McDermott, Will & Emery LLP (law firm) |
| Number of Portfolios Overseen within Fund Complex: | | 27 |
| Other Directorships Held Outside Fund Complex: | | Partnership for New York City, Inc.
New York Collegium
Boston Early Music Festival |
| Name: | | Harris H. Rusitzky |
| Address: | | 290 Woodcliff Drive
Fairport, NY 14450 |
| Age: | | 72 |
| Current Position(s) Held with Fund: | | Director, Audit Committee Member, Governance & Nominating
Committee Member |
| Term of Office & Length of Time Served: | | Indefinite - Since 1985 |
| Principal Occupation(s) During Past 5 Years: | | President, The Greening Group (business consultants); Partner, The Restaurant Group (restaurants) |
| Number of Portfolios Overseen within Fund Complex: | | 27 |
| Other Directorships Held Outside Fund Complex: | | N/A |
Directors’ and Officers’ Information (unaudited)
| | |
| Name: | | Paul A. Brooke |
| Address: | | 290 Woodcliff Drive
Fairport, NY 14450 |
| Age: | | 62 |
| Current Position(s) Held with Fund: | | Director, Audit Committee Member, Governance & Nominating
Committee Member |
| Term of Office & Length of Time Served: | | Indefinite - Since 2007 |
| Principal Occupation(s) During Past 5 Years: | | Chairman & CEO, Alsius Corp. (investments); Managing Member, PMSV Holdings LLC (investments) |
| Number of Portfolios Overseen within Fund Complex: | | 27 |
| Other Directorships Held Outside Fund Complex: | | Incyte Corp. ViroPharma, Inc. HLTH Corp. Cheyne Capital International MPM Bio-equities GMP Companies HoustonPharma |
OFFICERS
| | |
| Name: | | Jeffrey S. Coons, Ph.D., CFA |
| Address: | | 290 Woodcliff Drive
Fairport, NY 14450 |
| Age: | | 44 |
| Current Position(s) Held with Fund: | | Vice President |
| Term of Office1 & Length of Time Served: | | Since 2004 |
| Principal Occupation(s) During Past 5 Years: | | Co-Director of Research since 2002 & Executive Group Member**, Manning & Napier Advisors, Inc. Holds one or more of the following titles for various subsidiaries and affiliates: President, Director, Treasurer or Senior Trust Officer. |
| Number of Portfolios Overseen within Fund Complex: | | 27 |
| Other Directorships Held Outside Fund Complex: | | N/A |
| Name: | | Christine Glavin |
| Address: | | 290 Woodcliff Drive
Fairport, NY 14450 |
| Age: | | 41 |
| Current Position(s) Held with Fund: | | Principal Financial Officer, Chief Financial Officer |
| Term of Office1 & Length of Time Served: | | Principal Financial Officer since 2002; Chief Financial Officer since 2001 |
| Principal Occupation(s) During Past 5 Years: | | Fund Reporting Manager, Manning & Napier Advisors, Inc. |
| Number of Portfolios Overseen within Fund Complex: | | 27 |
| Other Directorships Held Outside Fund Complex: | | N/A |
| Name: | | Jodi L. Hedberg |
| Address: | | 290 Woodcliff Drive
Fairport, NY 14450 |
| Age: | | 40 |
| Current Position(s) Held with Fund: | | Corporate Secretary, Chief Compliance Officer, Anti-Money
Laundering Compliance Officer |
| Term of Office1 & Length of Time Served: | | Corporate Secretary since 1997; Chief Compliance Officer since 2004 |
| Principal Occupation(s) During Past 5 Years: | | Director of Compliance, Manning & Napier Advisors, Inc. and affiliates; Corporate Secretary, Manning & Napier Investor Services, Inc. since 2006 |
| Number of Portfolios Overseen within Fund Complex: | | 27 |
| Other Directorships Held Outside Fund Complex: | | N/A |
*Interested Director, within the meaning of the Investment Company Act of 1940 by reason of his position with the Fund’s investment advisor and distributor. Mr. Auspitz serves as the Executive Vice President and Director, Manning & Napier Advisors, Inc. and President and Director, Manning & Napier Investor Services, Inc., the Fund’s distributor.
**The Executive Group performs the duties of the Office of the Chief Executive of Manning & Napier Advisors, Inc.
1The term of office for President, Vice President, Chief Financial Officer, and Corporate Secretary is one year and until their respective successors are chosen and qualified. All other officers’ terms are indefinite.
Literature Requests (unaudited)
Proxy Voting Policies and Procedures
A description of the policies and procedures that the Fund uses to determine how to vote proxies relating to portfolio securities is available, without charge, upon request:
| | |
By phone | | 1-800-466-3863 |
On the Securities and Exchange Commission’s (SEC) web site | | http://www.sec.gov |
Proxy Voting Record
Information regarding how the Fund voted proxies relating to portfolio securities during the most recent 12-month period ended June 30th is available, without charge, upon request:
| | |
By phone | | 1-800-466-3863 |
On the SEC’s web site | | http://www.sec.gov |
Quarterly Portfolio Holdings
The Series’ complete schedule of portfolio holdings for the 1st and 3rd quarters of each fiscal year are provided on Form N-Q, and are available, without charge, upon request:
| | |
By phone | | 1-800-466-3863 |
On the SEC’s web site | | http://www.sec.gov |
The Series’ Form N-Q may be reviewed and copied at the SEC’s Public Reference Room in Washington, D.C. Information on the operation of the Public Reference Room may be obtained by calling 1-800-SEC-0330.
Prospectus and Statement of Additional Information (SAI)
The prospectus and SAI provide additional information about each Series, including charges, expenses and risks. These documents are available, without charge, upon request:
| | |
By phone | | 1-800-466-3863 |
On the SEC’s web site | | http://www.sec.gov |
On the Advisor’s web site | | http://www.manningnapieradvisors.com |
Additional information available at www.manningnapieradvisors.com
1. Fund Holdings - Month-End
2. Fund Holdings - Quarter-End
3. Shareholder Report - Annual
4. Shareholder Report - Semi-Annual
Manning & Napier Fund, Inc.
| | | | |
| LIFE SCIENCES SERIES | | | | | Annual Report - December 31, 2007 |

Management Discussion and Analysis (unaudited)
Dear Shareholders:
Market conditions in 2007 were challenging; however, the Life Sciences Series achieved a return that exceeded the return of the Standard & Poor’s (“S&P”) 500 Health Care Index for the eighth year in a row. The Series also outperformed the S&P 500 Total Return Index for the sixth time in the last eight years. Over the calendar year 2007, the Life Sciences Series generated a total return of 10.62%, versus the 7.33% return of the S&P 500 Health Care Index and the 5.51% return of the S&P 500 Total Return Index. Performance over the full market cycle (since 4/1/00) is even stronger, both on an absolute basis and as compared to the benchmarks.
The relative performance versus the S&P 500 Health Care Index in 2007 was due in large part to the Series’ sector weightings. The Series benefited from its investments in diagnostic, vascular and orthopedic device companies. Through our investments in these companies, which we believe have lower than average risk of government intervention, the Series was able outperform the broader Health Care sector.
The main sector that drove the Series’ outperformance relative to the benchmarks was health care diagnostics. Diagnostics improve health care efficiency by quickly and accurately diagnosing medical conditions. Rapid diagnosis of a medical condition is important to allow treatment before a patient’s health deteriorates and additional spending is required. As a continuation of our 2006 theme, we further increased the Series’ position in diagnostics over the course of the year. Also, the Series benefited from our veterinary diagnostic holdings. Two attractive features of this industry are its cash-pay nature and lack of material government oversight.
The Series also benefited from several acquisitions, which were generally part of our broader health care themes. More specifically, one acquired holding was a sleep equipment manufacturer and part of our sleep industry theme. There are roughly 40 million Americans that suffer from snoring and sleep apnea related problems, with sleep assisting devices having a low market penetration. The other holding was part of our minimally invasive surgery (“MIS”) theme in orthopedics. We believe MIS is a high-value proposition for patients and physicians as well as payers. Yet another acquired holding was in our investment basket of peripheral artery disease (“PAD”) holdings. We believe there are large and unmet medical needs in PAD that are being addressed by emerging companies with novel and disruptive technologies. Finally, an eye surgery equipment manufacturer in our ophthalmology basket holdings was also acquired.
We reduced the Series’ weighting in the health care providers & services industry on the heels of strong returns in prior years. We believe that providers & services, on average, are more cyclical in nature than other health care industries. Therefore, it is critical to be cognizant of the pivotal turns in the industry’s cycle. However, we started increasing our investments in health care information technology (“HCIT”) towards the end of the year. Our long-term thesis remains intact, as significant investments are being made to improve the efficiency and effectiveness of the health care system through information technology.
Lastly, we moderately increased the Series’ weighting in the biotechnology industry when valuations became attractive. The biotechnology industry performed poorly in 2007 due to pipeline failures and valuation concerns. Also, in order to fill out gaps in their product portfolio and counter patent expiration problems, large pharmaceutical companies have become interested in developing biologics. This trend is supported by several acquisitions in the area in 2006 and 2007. There are very few acquisition candidates left, making our holdings highly desirable assets.
We appreciate your business and wish you all the very best in the coming year.
Sincerely,
Manning & Napier Advisors, Inc.
Performance Update as of December 31, 2007 (unaudited)
| | | | | | | | |
| | | Average Annual Total Returns
As of December 31, 2007 | | |
| | | One
Year | | Five
Year | | Since
Inception1 | | |
Manning & Napier Fund, Inc. - Life Sciences Series2 | | 10.62% | | 13.63% | | 16.66% | | |
Standard & Poor’s (S&P) 500 Total Return Index3 | | 5.51% | | 12.84% | | 2.52% | | |
Standard & Poor’s (S&P) 500 Health Care Index3 | | 7.33% | | 7.52% | | 2.92% | | |
The following graph compares the value of a $10,000 investment in the Manning & Napier Fund, Inc. - Life Sciences Series from its current activation1 (11/5/99) to present (12/31/07) to the S&P 500 Total Return Index and the S&P 500 Health Care Index.
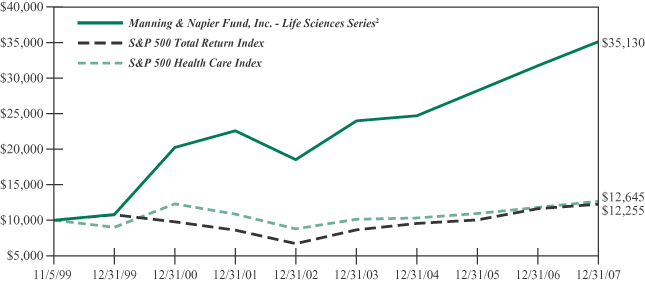
1Performance numbers for the Series and Indices are calculated from November 5, 1999, the Series’ current activation date.
2The Series’ performance does not reflect the deduction of taxes that a shareholder would pay on fund distributions or the redemption of shares. The Series’ performance is historical and may not be indicative of future results. The performance returns shown are inclusive of the net expense ratio of the Series. For the year ended December 31, 2007, this net expense ratio was 1.12%. The gross expense ratio, which does not account for any voluntary or contractual waivers currently in effect, was 1.12% for the year ended December 31, 2007.
3The S&P 500 Total Return Index is an unmanaged capitalization-weighted measure of 500 widely held common stocks listed on the New York Stock Exchange, American Stock Exchange and the Over-the-Counter market. The S&P 500 Health Care Index, a sub-index of the S&P 500 Total Return Index, includes the stocks of companies involved in the business of health care related products and services. Both Indices’ returns assume daily reinvestment of dividends and, unlike Series returns, do not reflect any fees or expenses.
Shareholder Expense Example (unaudited)
As a shareholder of the Series, you may incur two types of costs: (1) transaction costs, including potential wire charges on redemptions and (2) ongoing costs, including management fees and other Series expenses. This example is intended to help you understand your ongoing costs (in dollars) of investing in the Series and to compare these costs with the ongoing costs of investing in other mutual funds.
The example is based on an investment of $1,000 invested at the beginning of the period and held for the entire period (July 1, 2007 to December 31, 2007).
Actual Expenses
The first line of the table below provides information about actual account values and actual expenses. You may use the information in this line, together with the amount you invested, to estimate the expenses that you paid over the period. Simply divide your account value by $1,000 (for example, an $8,600 account value divided by $1,000 = 8.6), then multiply the result by the number in the first line under the heading entitled “Expenses Paid During Period” to estimate the expenses you paid on your account during this period.
Hypothetical Example for Comparison Purposes
The second line of the table below provides information about hypothetical account values and hypothetical expenses based on the Series’ actual expense ratio and an assumed rate of return of 5% per year before expenses, which is not the Series’ actual return. The hypothetical account values and expenses may not be used to estimate the actual ending account balance or expenses you paid during the period. You may use this information to compare the ongoing costs of investing in the Series and other funds. To do so, compare this 5% hypothetical example with the 5% hypothetical examples that appear in the shareholder reports of the other funds.
Please note that the expenses shown in the table are meant to highlight your ongoing costs only and do not reflect any transaction costs, such as potential wire charges on redemptions. Therefore, the second line of the table is useful in comparing ongoing costs only, and will not help you determine the relative total costs of owning different funds. In addition, if these transaction costs were included, your costs would have been higher.
| | | | | | | | | |
| | | Beginning
Account Value
7/1/07 | | Ending
Account Value
12/31/07 | | Expenses Paid
During Period*
7/1/07-12/31/07 |
Actual | | $ | 1,000.00 | | $ | 1,070.60 | | $ | 5.85 |
Hypothetical
(5% return before expenses) | | $ | 1,000.00 | | $ | 1,019.56 | | $ | 5.70 |
*Expenses are equal to the Series’ annualized expense ratio (for the six-month period) of 1.12%, multiplied by the average account value over the period, multiplied by 184/365 (to reflect the one-half year period). Expenses are based on the most recent fiscal half year; therefore, the expense ratio stated above may differ from the expense ratio stated in the financial highlights, which is based on one-year data.
Portfolio Composition as of December 31, 2007 (unaudited)
Sector Allocation1
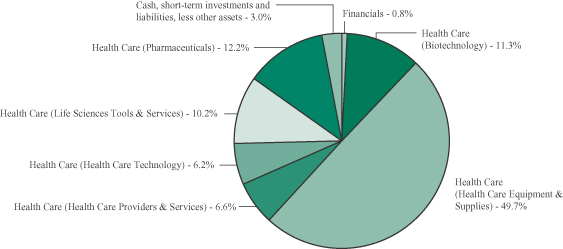
1As a percentage of net assets.
Top Ten Stock Holdings2
| | | | | | |
ev3, Inc. | | 7.9% | | Luminex Corp. | | 3.2% |
Caliper Life Sciences, Inc. | | 3.9% | | Covidien Ltd. (Bermuda) | | 3.2% |
Barr Pharmaceuticals, Inc. | | 3.6% | | OraSure Technologies, Inc. | | 3.2% |
Applera Corp. - Celera Group | | 3.4% | | Synthes, Inc. (Switzerland) | | 3.1% |
Valeant Pharmaceuticals International | | 3.3% | | Tenet Healthcare Corp. | | 2.9% |
2As a percentage of total investments.
Investment Portfolio - December 31, 2007
| | | | | |
| | | Shares | | Value
(Note 2) |
| | | | | |
| | |
COMMON STOCKS - 95.6% | | | | | |
| | |
Health Care - 95.6% | | | | | |
Biotechnology - 11.3% | | | | | |
Amgen, Inc.* | | 102,000 | | $ | 4,736,880 |
Applera Corp. - Celera Group* | | 645,000 | | | 10,236,150 |
Crucell NV - ADR* (Netherlands) (Note 7) | | 253,000 | | | 4,184,620 |
Medarex, Inc.* | | 517,000 | | | 5,387,140 |
Monogram Biosciences, Inc.* | | 3,353,000 | | | 4,861,850 |
Theratechnologies, Inc.* (Canada) (Note 7) | | 408,000 | | | 4,498,875 |
| | | | | |
| | | | | 33,905,515 |
| | | | | |
Health Care Equipment & Supplies - 49.3% | | | | | |
Abaxis, Inc.* | | 180,000 | | | 6,454,800 |
Alsius Corp.*7 | | 490,000 | | | 1,813,000 |
AtriCure, Inc.* | | 197,340 | | | 2,587,127 |
Beckman Coulter, Inc. | | 121,000 | | | 8,808,800 |
Boston Scientific Corp.* | | 631,000 | | | 7,338,530 |
Carl Zeiss Meditec AG (Germany) (Note 7) | | 419,743 | | | 7,314,392 |
The Cooper Companies, Inc. | | 149,830 | | | 5,693,540 |
Covidien Ltd. (Bermuda) (Note 7) | | 220,000 | | | 9,743,800 |
C.R. Bard, Inc. | | 55,000 | | | 5,214,000 |
Dexcom, Inc.* | | 678,242 | | | 5,988,877 |
Edwards Lifesciences Corp.* | | 72,000 | | | 3,311,280 |
ev3, Inc.* | | 1,897,000 | | | 24,110,870 |
Gen-Probe, Inc.* | | 77,000 | | | 4,845,610 |
Hansen Medical, Inc.* | | 90,678 | | | 2,714,899 |
IDEXX Laboratories, Inc.* | | 50,000 | | | 2,931,500 |
Inverness Medical Innovations, Inc.* 1,2 | | 122,000 | | | 6,853,960 |
Micrus Endovascular Corp.* | | 324,723 | | | 6,390,549 |
Nobel Biocare Holding AG (Switzerland) (Note 7) | | 9,800 | | | 2,623,377 |
OraSure Technologies, Inc.* | | 1,088,100 | | | 9,673,209 |
ResMed, Inc.* | | 62,000 | | | 3,256,860 |
SonoSite, Inc.* | | 151,000 | | | 5,084,170 |
STAAR Surgical Co.* | | 1,116,000 | | | 2,946,240 |
Straumann Holding AG (Switzerland) (Note 7) | | 10,000 | | | 2,758,636 |
Synthes, Inc. (Switzerland) (Note 7) | | 75,000 | | | 9,316,194 |
| | | | | |
| | | | | 147,774,220 |
| | | | | |
Health Care Providers & Services - 6.6% | | | | | |
Patterson Companies, Inc.* | | 97,330 | | | 3,304,353 |
Quest Diagnostics, Inc. | | 53,000 | | | 2,803,700 |
Sonic Healthcare Ltd. (Australia) (Note 7) | | 321,000 | | | 4,711,265 |
Tenet Healthcare Corp.* | | 1,750,000 | | | 8,890,000 |
| | | | | |
| | | | | 19,709,318 |
| | | | | |
| | |
| The accompanying notes are an integral part of the financial statements. | | 5 |
Investment Portfolio - December 31, 2007
| | | | | |
| | | Shares | | Value
(Note 2) |
| | | | | |
| | |
COMMON STOCKS (continued) | | | | | |
| | |
Health Care (continued) | | | | | |
Health Care Technology - 6.2% | | | | | |
Allscripts Healthcare Solutions, Inc* | | 313,000 | | $ | 6,078,460 |
AMICAS, Inc.* | | 522,862 | | | 1,390,813 |
Cerner Corp.* | | 62,500 | | | 3,525,000 |
Eclipsys Corp.* | | 302,000 | | | 7,643,620 |
| | | | | |
| | | | | 18,637,893 |
| | | | | |
Life Sciences Tools & Services - 10.0% | | | | | |
Caliper Life Sciences, Inc.* | | 2,159,153 | | | 11,940,116 |
Exelixis, Inc.* | | 647,000 | | | 5,583,610 |
Luminex Corp.* | | 600,350 | | | 9,749,684 |
PerkinElmer, Inc. | | 102,000 | | | 2,654,040 |
| | | | | |
| | | | | 29,927,450 |
| | | | | |
Pharmaceuticals - 12.2% | | | | | |
Barr Pharmaceuticals, Inc.* | | 208,000 | | | 11,044,800 |
Par Pharmaceutical Companies, Inc.* | | 327,000 | | | 7,848,000 |
Roche Holding AG (Switzerland) (Note 7) | | 46,000 | | | 7,949,112 |
Valeant Pharmaceuticals International* | | 825,000 | | | 9,875,250 |
| | | | | |
| | | | | 36,717,162 |
| | | | | |
TOTAL COMMON STOCKS
(Identified Cost $273,639,558) | | | | | 286,671,558 |
| | | | | |
| | |
PREFERRED STOCKS - 0.8% | | | | | |
Financials - 0.8% | | | | | |
Insurance - 0.8% | | | | | |
Avalon HealthCare Holdings, Inc. - Series D*1,3,4,5
(Identified Cost $2,312,500) | | 925,000 | | | 2,312,500 |
| | | | | |
| | |
WARRANTS - 0.6% | | | | | |
Health Care - 0.6% | | | | | |
Health Care Equipment & Supplies - 0.4% | | | | | |
Alsius Corp., 8/3/20097 | | 1,770,000 | | | 1,062,000 |
| | | | | |
Life Sciences Tools & Services - 0.2% | | | | | |
Caliper Life Sciences, Inc., 8/15/20101,3,6 | | 285,000 | | | 244,522 |
Caliper Life Sciences, Inc., 8/10/2011 | | 401,109 | | | 461,275 |
| | | | | |
| | | | | 705,797 |
| | | | | |
TOTAL WARRANTS
(Identified Cost $1,476,157) | | | | | 1,767,797 |
| | | | | |
| | |
| 6 | | The accompanying notes are an integral part of the financial statements. |
Investment Portfolio - December 31, 2007
| | | | | | | |
| | | Shares/
Principal Amount | | Value
(Note 2) | |
| | | | | | | |
| | |
SHORT-TERM INVESTMENTS - 4.2% | | | | | | | |
Dreyfus Treasury Cash Management - Institutional Shares | | | 7,551,072 | | $ | 7,551,072 | |
Fannie Mae Discount Note, 1/7/2008 | | $ | 5,000,000 | | | 4,995,868 | |
| | | | | | | |
TOTAL SHORT-TERM INVESTMENTS
(Identified Cost $12,547,530) | | | | | | 12,546,940 | |
| | | | | | | |
TOTAL INVESTMENTS - 101.2%
(Identified Cost $289,975,745) | | | | | | 303,298,795 | |
| | |
LIABILITIES, LESS OTHER ASSETS - (1.2%) | | | | | | (3,629,660 | ) |
| | | | | | | |
NET ASSETS - 100% | | | | | $ | 299,669,135 | |
| | | | | | | |
*Non-income producing security
ADR - American Depository Receipt
1Restricted securities - Investment in securities that are restricted as to public resale under the Securities Act of 1933, as amended. These securities amount to $9,410,982, or 3.1%, of the Series’ net assets as of December 31, 2007 (see Note 2 to the financial statements).
2This security was acquired on February 3, 2006 at a cost of $2,978,020 ($24.41 per share) and has been determined to be liquid under guidelines established by the Board of Directors (see Note 2 to the financial statements).
3Security has been valued at fair value (see Note 2 to the financial statements).
4This security was acquired June 22, 2007 at a cost of $2,312,500 ($2.50 per share) and has been determined to be illiquid under guidelines established by the Board of Directors (see Note 2 to the financial statements).
5See Note 2 to the financial statements regarding affiliated companies.
6This security was acquired on August 11, 2005 at a cost of $365,484 ($1.28 per warrant) and has been determined to be illiquid under guidelines established by the Board of Directors (see Note 2 to the financial statements).
7The Chairman and CEO of the company serves as a director of the Fund (see Note 2 to the financial statements).
| | |
| The accompanying notes are an integral part of the financial statements. | | 7 |
Statement of Assets and Liabilities
December 31, 2007
| | | |
ASSETS: | | | |
| | | |
| |
Investments, at value (identified cost $289,975,745) (Note 2) | | $ | 303,298,795 |
Foreign currency, at value (cost $1) | | | 1 |
Receivable for fund shares sold | | | 760,798 |
Dividends receivable | | | 45,112 |
| | | |
TOTAL ASSETS | | | 304,104,706 |
| | | |
| LIABILITIES: | | | |
| |
Accrued management fees (Note 3) | | | 252,800 |
Accrued fund accounting and transfer agent fees (Note 3) | | | 16,577 |
Accrued Chief Compliance Officer service fees (Note 3) | | | 714 |
Payable for securities purchased | | | 3,770,022 |
Payable for fund shares repurchased | | | 342,124 |
Audit fees payable | | | 30,962 |
Other payables and accrued expenses | | | 22,372 |
| | | |
TOTAL LIABILITIES | | | 4,435,571 |
| | | |
TOTAL NET ASSETS | | $ | 299,669,135 |
| | | |
NET ASSETS CONSIST OF: | | | |
| |
Capital stock | | $ | 259,622 |
Additional paid-in-capital | | | 284,116,661 |
Accumulated net realized gain on investments, foreign currency and
other assets and liabilities | | | 1,969,802 |
Net unrealized appreciation on investments and foreign currency | | | 13,323,050 |
| | | |
TOTAL NET ASSETS | | $ | 299,669,135 |
| | | |
NET ASSET VALUE, OFFERING PRICE AND REDEMPTION
PRICE PER SHARE ($299,669,135/25,962,237 shares) | | $ | 11.54 |
| | | |
| | |
| 8 | | The accompanying notes are an integral part of the financial statements. |
Statement of Operations
For the Year Ended December 31, 2007
| | | | |
INVESTMENT INCOME: | | | | |
| | | | |
| |
Dividends (net of foreign tax withheld, $6,876) | | $ | 767,105 | |
Interest | | | 212,376 | |
| | | | |
Total Investment Income | | | 979,481 | |
| | | | |
| EXPENSES: | | | | |
| |
Management fees (Note 3) | | | 2,681,525 | |
Fund accounting and transfer agent fees (Note 3) | | | 174,379 | |
Directors’ fees (Note 3) | | | 7,809 | |
Chief Compliance Officer service fees (Note 3) | | | 6,100 | |
Custodian fees | | | 21,901 | |
Miscellaneous | | | 101,863 | |
| | | | |
Total Expenses | | | 2,993,577 | |
| | | | |
NET INVESTMENT LOSS | | | (2,014,096 | ) |
| | | | |
| REALIZED AND UNREALIZED GAIN (LOSS) ON INVESTMENTS: | | | | |
| |
Net realized gain on - | | | | |
Investments | | | 26,451,415 | |
Foreign currency and other assets and liabilities | | | 13,859 | |
| | | | |
| | | 26,465,274 | |
| | | | |
| |
Net change in unrealized appreciation on - | | | | |
Investments | | | 2,630,145 | |
Foreign currency and other assets and liabilities | | | (3,835 | ) |
| | | | |
| | | 2,626,310 | |
| | | | |
| |
NET REALIZED AND UNREALIZED GAIN (LOSS) ON
INVESTMENTS | | | 29,091,584 | |
| | | | |
NET INCREASE IN NET ASSETS RESULTING FROM
OPERATIONS | | $ | 27,077,488 | |
| | | | |
| | |
| The accompanying notes are an integral part of the financial statements. | | 9 |
Statements of Changes in Net Assets
| | | | | | | | |
| | | For the
Year Ended
12/31/07 | | | For the
Year Ended
12/31/06 | |
| | | | | | | | |
| INCREASE (DECREASE) IN NET ASSETS: | | | | | | | | |
| | |
| OPERATIONS: | | | | | | | | |
| | |
Net investment loss | | $ | (2,014,096 | ) | | $ | (1,103,063 | ) |
Net realized gain on investments and foreign currency | | | 26,465,274 | | | | 34,026,075 | |
Net change in unrealized appreciation on investments and foreign currency | | | 2,626,310 | | | | (6,084,837 | ) |
| | | | | | | | |
Net increase from operations | | | 27,077,488 | | | | 26,838,175 | |
| | | | | | | | |
| DISTRIBUTIONS TO SHAREHOLDERS (Note 9): | | | | | | | | |
| | |
From net realized gain on investments | | | (24,823,184 | ) | | | (37,835,088 | ) |
| | | | | | | | |
| CAPITAL STOCK ISSUED AND REPURCHASED: | | | | | | | | |
| | |
Net increase from capital share transactions
(Note 5) | | | 64,342,733 | | | | 22,766,996 | |
| | | | | | | | |
Net increase in net assets | | | 66,597,037 | | | | 11,770,083 | |
| | |
| NET ASSETS: | | | | | | | | |
| | |
Beginning of year | | | 233,072,098 | | | | 221,302,015 | |
| | | | | | | | |
End of year (including undistributed net
investment loss of $0 and $0, respectively) | | $ | 299,669,135 | | | $ | 233,072,098 | |
| | | | | | | | |
| | |
| 10 | | The accompanying notes are an integral part of the financial statements. |
Financial Highlights
| | | | | | | | | | |
| | | For the Years Ended |
| | | 12/31/07 | | 12/31/06 | | 12/31/05 | | 12/31/04 | | 12/31/03 |
| | | | | | | | | | |
| | | | | | | | | | |
| Per share data (for a share outstanding throughout each year): | | | | | | | | | | |
Net asset value - Beginning of year | | $11.41 | | $12.10 | | $11.89 | | $11.96 | | $9.35 |
| | | | | | | | | | |
Income (loss) from investment operations: | | | | | | | | | | |
Net investment loss | | (0.08) | | (0.05) | | (0.04) | | (0.07) | | (0.02) |
Net realized and unrealized gain on investments | | 1.25 | | 1.56 | | 1.71 | | 0.43 | | 2.76 |
| | | | | | | | | | |
Total from investment operations | | 1.17 | | 1.51 | | 1.67 | | 0.36 | | 2.74 |
| | | | | | | | | | |
Less distributions to shareholders: | | | | | | | | | | |
From net realized gain on investments | | (1.04) | | (2.20) | | (1.46) | | (0.43) | | (0.13) |
| | | | | | | | | | |
Net asset value - End of year | | $11.54 | | $11.41 | | $12.10 | | $11.89 | | $11.96 |
| | | | | | | | | | |
Total return1 | | 10.62% | | 12.52% | | 14.16% | | 3.03% | | 29.39% |
| Ratios (to average net assets)/Supplemental Data: | | | | | | | | | | |
Expenses* | | 1.12% | | 1.14% | | 1.17% | | 1.18% | | 1.18% |
Net investment loss | | (0.75%) | | (0.51%) | | (0.32%) | | (0.62%) | | (0.19%) |
Portfolio turnover | | 95% | | 93% | | 110% | | 109% | | 86% |
Net assets - End of year (000’s omitted) | | $299,669 | | $233,072 | | $221,302 | | $185,487 | | $164,990 |
| | | | | | | | | | |
|
*The investment advisor did not impose all of its management fee in some years and is not eligible to recoup any expenses that have been waived or reimbursed in prior years. If these expenses had been incurred by the Series, the expense ratio (to average net assets) would have been increased as follows: |
| | N/A | | N/A | | N/A | | 0.04% | | 0.01% |
1Represents aggregate total return for the year indicated, and assumes reinvestment of all distributions. Total return would have been lower had certain expenses not been waived during certain years.
| | |
| The accompanying notes are an integral part of the financial statements. | | 11 |
Notes to Financial Statements
Life Sciences Series (the “Series”) is a no-load non-diversified series of Manning & Napier Fund, Inc. (the “Fund”). The Fund is organized in Maryland and is registered under the Investment Company Act of 1940 (the “1940 Act”), as amended, as an open-end management investment company.
The Series’ investment objective is to provide long-term growth by investing principally in the common stocks of companies in the life sciences industry.
The Fund’s Advisor is Manning & Napier Advisors, Inc. (the “Advisor”). On November 5, 1999, the Series resumed sales of shares to advisory clients and employees of the Advisor and its affiliates. On May 1, 2001, the Series began offering shares directly to investors. Previously, the Series was available from time to time to advisory clients and employees of the Advisor.
The total authorized capital stock of the Fund consists of 5.0 billion shares of common stock each having a par value of $0.01. As of December 31, 2007, 3.33 billion shares have been designated in total among 27 series, of which 100 million have been designated as Life Sciences Series Class A common stock.
| 2. | SIGNIFICANT ACCOUNTING POLICIES |
Security Valuation
Portfolio securities, including domestic equities, foreign equities, exchange-traded funds, warrants and options, listed on an exchange other than the NASDAQ National Market System are valued at the latest quoted sales price of the exchange on which the security is primarily traded. Securities not traded on valuation date or securities not listed on an exchange are valued at the latest quoted bid price provided by the Fund’s pricing service. Securities listed on the NASDAQ National Market System are valued in accordance with the NASDAQ Official Closing Price.
Securities for which representative valuations or prices are not available from the Fund’s pricing service may be valued at fair value. Due to the inherent uncertainty of valuations of such securities, the fair value may differ significantly from the values that would have been used had a ready market for such securities existed. If trading or events occurring after the close of the principal market in which securities are traded are expected to materially affect the value of those securities, then they may be valued at their fair value, taking this trading or these events into account. Fair value is determined in good faith by the Advisor under procedures approved by and under the general supervision and responsibility of the Fund’s Board of Directors (the “Board”).
Short-term investments that mature in sixty days or less are valued at amortized cost, which approximates market value. Investments in open-end investment companies are valued at their net asset value per share on valuation date, with the exception of exchange-traded funds, which are valued at the closing price on the exchange.
Security Transactions, Investment Income and Expenses
Security transactions are accounted for on trade date. Dividend income is recorded on the ex-dividend date, except that if the ex-dividend date has passed, certain dividends from foreign securities are recorded as soon as the Fund is informed of the ex-dividend date. Non-cash dividends, if any, are recorded at the fair market value of the securities received. Interest income, including amortization of premium and accretion of discounts using the effective interest method, is earned from settlement date and accrued daily.
Notes to Financial Statements
| 2. | SIGNIFICANT ACCOUNTING POLICIES (continued) |
Security Transactions, Investment Income and Expenses (continued)
Expenses are recorded on an accrual basis. Most expenses of the Fund can be attributed to a specific series. Expenses which cannot be directly attributed are apportioned among the series in the Fund in such a manner as deemed equitable by the Fund’s Board, taking into consideration, among other things, the nature and type of expense.
The Series uses the identified cost method for determining realized gain or loss on investments for both financial statement and federal income tax reporting purposes.
Foreign Currency Translation
The books and records of the Series are maintained in U.S. dollars. Foreign currencies, investments and other assets and liabilities are translated into U.S. dollars at the current exchange rates. Purchases and sales of investment securities and income and expenses are translated on the respective dates of such transactions. The Series does not isolate realized and unrealized gains and losses attributable to changes in the exchange rates from gains and losses that arise from changes in the market value of investments. Such fluctuations are included with net realized and unrealized gain or loss on investments. Net realized foreign currency gains and losses represent foreign currency gains and losses between trade date and settlement date on securities transactions, gains and losses on disposition of foreign currencies and the difference between the amount of income and foreign withholding taxes recorded on the books of the Series and the amounts actually received or paid.
Restricted Securities
Restricted securities are purchased in private placement transactions, are not registered under the Securities Act of 1933, as amended, and may have contractual restrictions on resale. Information regarding restricted securities is included at the end of the Series’ Investment Portfolio.
Illiquid Securities
A security may be considered illiquid if so deemed in good faith by the Advisor under procedures approved by and under the general supervision and responsibility of the Fund’s Board. Securities that are illiquid are marked with the applicable footnote on the Investment Portfolio. As of December 31, 2007, the aggregate value of securities deemed illiquid was $2,557,022, representing 0.9% of the Series’ net assets.
Affiliated Companies
The 1940 Act defines “affiliated companies” to include securities in which a series owns 5% or more of the outstanding voting securities of the issuer. The following transactions were effected in shares of Avalon Healthcare Holdings, Inc. for the year ended December 31, 2007:
| | | | | | | | | | | | | | | | | |
Name of Issuer | | Number of
Shares
Held as of
12/31/06 | | Gross
Additions | | Gross
Reductions | | Number of
Shares
Held as of
12/31/07 | | Value
as of
12/31/07 | | Investment
Income | | Realized
Gain |
Avalon Healthcare Holdings, Inc. | | — | | 925,000 | | — | | 925,000 | | $ | 2,312,500 | | $ | — | | $ | — |
Notes to Financial Statements
| 2. | SIGNIFICANT ACCOUNTING POLICIES (continued) |
Affiliated Companies (continued)
The Chairman and CEO of Alsius Corp. serves as a director of the Fund. Therefore, Alsius Corp. (formerly Ithaka Acquisition Corp.) is considered an “affiliated company” as defined in the 1940 Act. The following transactions were effected in shares of Alsius Corp. for the year ended December 31, 2007:
| | | | | | | | | | | | | | | | | |
Name of Issuer | | Number of
Shares
Held as of
12/31/06 | | Gross
Additions | | Gross
Reductions | | Number of
Shares
Held as of
12/31/07 | | Value
as of
12/31/07 | | Investment
Income | | Realized
Gain |
Alsius Corp. | | — | | 490,000 | | — | | 490,000 | | $ | 1,813,000 | | $ | — | | $ | — |
Alsius Corp., 8/3/2009 Warrants | | — | | 1,770,000 | | — | | 1,770,000 | | | 1,062,000 | | | — | | | — |
Federal Taxes
The Series’ policy is to comply with the provisions of the Internal Revenue Code applicable to regulated investment companies. The Series is not subject to federal income tax or excise tax to the extent that the Series distributes to shareholders each year its taxable income, including any net realized gains on investments, in accordance with requirements of the Internal Revenue Code. Accordingly, no provision for federal income tax or excise tax has been made in the financial statements.
On June 29, 2007, the Series adopted Financial Accounting Standards Board Interpretation No. 48 - Accounting for Uncertainty in Income Taxes (“FIN 48”). FIN 48 prescribes the minimum recognition threshold a tax position must meet in connection with accounting for uncertainties in income tax positions taken or expected to be taken by an entity before being measured and recognized in the financial statements. Management has determined that FIN 48 did not have a material impact on the Series’ financial statements. The Series files income tax returns in the U.S. federal jurisdiction, various states and foreign jurisdictions, as required. No income tax returns are currently under investigation. The statute of limitations on the Series’ tax returns remains open for the years ended December 31, 2004 through December 31, 2007.
Additionally, based on the Fund’s understanding of the tax rules and rates related to income, gains and transactions for foreign jurisdictions in which it invests, the Series will provide for foreign taxes, and where appropriate, deferred foreign tax.
Distributions of Income and Gains
Distributions to shareholders of net investment income and net realized gains are made annually. An additional distribution may be necessary to avoid taxation of the Series. Distributions are recorded on the ex-dividend date.
Indemnifications
The Fund’s organizational documents provide former and current directors and officers with a limited indemnification against liabilities arising in connection with the performance of their duties to the Fund. In the normal course of business, the Fund may also enter into contracts that provide general indemnifications. The Fund’s maximum exposure under these arrangements is unknown as this would be dependent on future claims that may be made against the Fund. The risk of material loss from such claims is considered remote.
Notes to Financial Statements
| 2. | SIGNIFICANT ACCOUNTING POLICIES (continued) |
Other
The preparation of financial statements in conformity with accounting principles generally accepted in the United States of America requires management to make estimates and assumptions that affect the reported amounts of assets and liabilities and the disclosure of contingent assets and liabilities at the date of the financial statements and the reported amounts of income and expenses during the reporting period. Actual results could differ from those estimates.
| 3. | TRANSACTIONS WITH AFFILIATES |
The Fund has an Investment Advisory Agreement (the “Agreement”) with the Advisor, for which the Series pays a fee, computed daily and payable monthly, at an annual rate of 1.00% of the Series’ average daily net assets.
Under the Agreement, personnel of the Advisor provide the Series with advice and assistance in the choice of investments and the execution of securities transactions, and otherwise maintain the Series’ organization. The Advisor also provides the Fund with necessary office space and fund administration and support services. The salaries of all officers of the Fund (except a percentage of the Fund’s Chief Compliance Officer’s salary, which is paid by the Fund), and of all Directors who are “affiliated persons” of the Fund, or of the Advisor, and all personnel of the Fund, or of the Advisor, performing services relating to research, statistical and investment activities, are paid by the Advisor. Each “non-affiliated” Director receives an annual stipend, which is allocated among all the active series of the Fund. In addition, these Directors also receive a fee per Board meeting attended for each active series of the Fund plus a fee for each committee meeting attended.
Manning & Napier Investor Services, Inc., a registered broker-dealer affiliate of the Advisor, acts as distributor for the Fund’s shares. The services of Manning & Napier Investor Services, Inc. are provided at no additional cost to the Series.
For fund accounting and transfer agent services, the Fund pays the Advisor an annual fee of 0.11% of the Fund’s average daily net assets up to $900 million, 0.07% of the Fund’s average daily net assets between $900 million and $1.5 billion, and 0.04% of the Fund’s average daily net assets over $1.5 billion. Additionally, certain transaction and account-based fees and out-of-pocket expenses, including charges for reporting relating to the Fund’s compliance program, are charged. Expenses not directly attributable to a series are allocated based on each series’ relative net assets or number of accounts, depending on the expense. The Advisor has an agreement with Citi Fund Services Ohio, Inc. (“Citi”) (formerly BISYS Fund Services Ohio, Inc.) under which Citi serves as sub-accountant and sub-transfer agent.
| 4. | PURCHASES AND SALES OF SECURITIES |
For the year ended December 31, 2007, purchases and sales of securities, other than United States Government securities and short-term securities, were $279,947,660 and $244,635,098, respectively. There were no purchases or sales of United States Government securities.
Notes to Financial Statements
| 5. | CAPITAL STOCK TRANSACTIONS |
Transactions in shares of Life Sciences Series were:
| | | | | | | | | | | | | | |
| | | For the Year
Ended 12/31/07 | | | For the Year
Ended 12/31/06 | |
| | | Shares | | | Amount | | | Shares | | | Amount | |
| | | | | | | | | | | | | | |
Sold | | 4,659,826 | | | $ | 55,397,353 | | | 2,965,428 | | | $ | 36,398,370 | |
Reinvested | | 2,186,128 | | | | 24,561,918 | | | 3,177,635 | | | | 37,129,391 | |
Repurchased | | (1,306,611 | ) | | | (15,616,538 | ) | | (4,007,781 | ) | | | (50,760,765 | ) |
| | | | | | | | | | | | | | |
Total | | 5,539,343 | | | $ | 64,342,733 | | | 2,135,282 | | | $ | 22,766,996 | |
| | | | | | | | | | | | | | |
Substantially all of the Series’ shares represent investments by fiduciary accounts over which the Advisor has sole investment discretion.
The Series may trade in financial instruments with off-balance sheet risk in the normal course of its investing activities to assist in managing exposure to various market risks. These financial instruments include written options, forward foreign currency exchange contracts and futures contracts and may involve, to a varying degree, elements of risk in excess of the amounts recognized for financial statement purposes. No such investments were held by the Series on December 31, 2007.
Investing in securities of foreign companies and foreign governments involves special risks and considerations not typically associated with investing in securities of domestic companies and the United States Government. These risks include revaluation of currencies and future adverse political and economic developments. Moreover, securities of foreign companies and foreign governments and their markets may be less liquid and their prices more volatile than those of comparable domestic companies and the United States Government.
| 8. | LIFE SCIENCES SECURITIES |
The Series may focus its investments in certain related life sciences industries; hence, the Series may subject itself to a greater degree of risk than a series that is more diversified.
| 9. | FEDERAL INCOME TAX INFORMATION |
The amount and characterization of certain income and capital gains to be distributed are determined in accordance with federal income tax regulations, which may differ from accounting principles generally accepted in the United States of America. These differences are primarily due to differing book and tax treatments in the timing of the recognition of net investment income or gains and losses, including net operating losses, foreign currency gains and losses and losses deferred due to wash sales. The Series may periodically make reclassifications among its capital accounts to reflect income and gains available for distribution (or available capital loss carryovers) under income tax regulations, without impacting the Series’ net asset value. Any such reclassifications are not reflected in the financial highlights.
Notes to Financial Statements
| 9. | FEDERAL INCOME TAX INFORMATION (continued) |
The tax character of distributions paid were as follows:
| | | | | | |
| | | For the Year
Ended 12/31/07 | | For the Year
Ended 12/31/06 |
Ordinary income | | $ | 10,394,257 | | $ | 12,093,520 |
Long-term capital gains | | | 14,428,927 | | | 25,741,568 |
At December 31, 2007, the tax basis components of distributable earnings and the net unrealized appreciation based on identified cost for federal income tax purposes were as follows:
| | | | |
Cost for federal income tax purposes | | $ | 290,897,584 | |
| |
Unrealized appreciation | | $ | 29,765,044 | |
Unrealized depreciation | | | (17,363,833 | ) |
| | | | |
Net unrealized appreciation | | $ | 12,401,211 | |
Undistributed ordinary income | | | 1,967,145 | |
Undistributed long-term capital gains | | | 924,496 | |
| 10. | RECENT ACCOUNTING PRONOUNCEMENTS |
In September 2006, FASB Statement of Financial Accounting Standards No. 157, Fair Value Measurements (“FAS 157”) was issued, and is effective for fiscal years beginning after November 15, 2007. FAS 157 defines fair value, establishes a framework for measuring fair value, and expands disclosure about fair value measurements. The standard does not expand the use of fair value in any new circumstances, but provides clarification on acceptable fair value methods and applications. At this time, management is evaluating the implications of FAS 157, but it is not expected to materially impact the Series’ financial statements.
Report of Independent Registered Public Accounting Firm
To the Board of Directors of Manning & Napier Fund, Inc. and Shareholders of Life Sciences Series:
In our opinion, the accompanying statement of assets and liabilities, including the investment portfolio, and the related statements of operations and of changes in net assets and the financial highlights present fairly, in all material respects, the financial position of the Life Sciences Series (a series of Manning & Napier Fund, Inc., hereafter referred to as the “Series”) at December 31, 2007, and the results of its operations for the year then ended, the changes in its net assets for each of the two years in the period then ended and the financial highlights for each of the five years in the period then ended, in conformity with accounting principles generally accepted in the United States of America. These financial statements and financial highlights (hereafter referred to as “financial statements”) are the responsibility of the Series’ management; our responsibility is to express an opinion on these financial statements based on our audits. We conducted our audits of these financial statements in accordance with the standards of the Public Company Accounting Oversight Board (United States). Those standards require that we plan and perform the audit to obtain reasonable assurance about whether the financial statements are free of material misstatement. An audit includes examining, on a test basis, evidence supporting the amounts and disclosures in the financial statements, assessing the accounting principles used and significant estimates made by management, and evaluating the overall financial statement presentation. We believe that our audits, which included confirmation of securities at December 31, 2007 by correspondence with the custodian and brokers, provide a reasonable basis for our opinion.

Columbus, Ohio
February 20, 2008
Supplemental Tax Information (unaudited)
For federal income tax purposes, the Series designates for the current fiscal year $418,241 or, if different, the maximum amount allowable under the tax law as qualified dividend income.
Pursuant to Section 852 of the Internal Revenue Code, as amended, the Series hereby designates $14,428,927 as capital gains for its taxable year ended December 31, 2007.
Renewal of Investment Advisory Agreements (unaudited)
During the period covered by this shareholder report, the Board of Directors (the “Board”) of Manning & Napier Fund, Inc. (the “Fund”) considered approval of two separate investment advisory agreements with Manning & Napier Advisors, Inc. (the “Advisor”):
| | • | | At a meeting held on August 30, 2007, the Board approved a new investment advisory agreement between the Fund and the Advisor (the “New Investment Advisory Agreement”) and recommended that the New Investment Advisory Agreement be submitted to shareholders for approval. Shareholders approved the New Investment Advisory Agreement at a meeting held on December 17, 2007. |
| | • | | At a meeting held on November 12, 2007, the Board approved the continuation of the then-current investment advisory agreement between the Fund and the Advisor (the “Current Investment Advisory Agreement”), which was to be superseded by the New Investment Advisory Agreement upon its approval by the Fund’s shareholders. The continuation of the Current Investment Advisory Agreement was necessary as a result of the delay in obtaining the number of votes necessary to convene the shareholder meeting and approve the New Investment Advisory Agreement with respect to all investment portfolios of the Fund (the “Series”). |
Consideration of New Investment Advisory Agreement:
In response to recent regulatory and compliance initiatives promulgated by the SEC over the past year, the Fund engaged in a comprehensive review of all material aspects of the Fund’s operations, including the Fund’s Current Investment Advisory Agreement. As a result of its review, the Board determined that the Current Investment Advisory Agreement should be amended for the purpose of modernizing the form of the agreement and to include additional provisions in the agreement that are customarily included in investment advisory agreements between registered investment companies and their investment advisors, but which are not included in the Current Investment Advisory Agreement. Accordingly, at the Board meeting on November 16, 2006, representatives of the Advisor presented to the Board proposed changes to the Current Investment Advisory Agreement in order to address the Board’s request to update and modernize the Current Investment Advisory Agreement. As a result of the discussions between the Board and representatives of the Advisor at the November 2006 Board meeting, the Board determined to formally consider the approval of a new investment advisory agreement between the Fund and the Advisor, which would incorporate the changes proposed at the November 2006 Board meeting, at its in-person Board meeting in August 2007.
At an in-person meeting held on August 30, 2007, the Board considered the approval of the New Investment Advisory Agreement between the Fund and the Advisor. Based on the information it received at the meeting and the November 16, 2006 Board meeting, the Board approved the New Investment Advisory Agreement subject to its further approval by the Fund’s shareholders. Representatives of the Advisor attended the meeting and presented additional oral and written information to the Board to assist the Board in its considerations. At the meeting, the Board concluded it was reasonable to take into account the conclusions the Board made when considering and evaluating the renewal of the Current Investment Advisory Agreement (the “2006 Annual Review”), which occurred at the November 16, 2006 in-person Board meeting, as part of its considerations to approve the New Investment Advisory Agreement. The discussion immediately below outlines the materials and information presented to the Board in connection with the Board’s 2006 Annual Review of the Current Investment Advisory Agreement and the conclusions made by the Directors when determining to continue the Current Investment Advisory Agreement for an additional one-year period.
Renewal of Investment Advisory Agreements (unaudited)
In connection with its review and deliberations, the Board considered the following factors and reached a conclusion with respect to such factors.
| | • | | The Board considered the services provided by the Advisor under the Current Investment Advisory Agreement including, among others: deciding what securities to purchase and sell for each Series; arranging for the purchase and sale of such securities by placing orders with broker-dealers; administering the affairs of the Fund (including the books and records of the Fund not maintained by third party service providers such as the custodian or sub-transfer agent); arranging for the insurance coverage for the Fund; and supervising the preparation of tax returns, SEC filings (including registration statements) and reports to shareholders for the Fund. The Board also considered the nature and quality of such services provided under the Current Investment Advisory Agreement in light of the Advisor’s services provided to the Fund for 21 years. The Board discussed the quality of these services with representatives from the Advisor and concluded that the Advisor was performing its services to the Fund required under the Current Investment Advisory Agreement in a reasonable manner. |
| | • | | The Board considered the investment performance of the various Series of the Fund. The investment performance for each Series was reviewed on a cumulative basis since inception and on a one year basis. In addition, annualized performance for the following time periods was considered: inception, three year, five year, ten year, and current market cycle. A market cycle includes periods of both rising and falling markets. Returns for established benchmark indices for each Series were provided for each time period. The Board noted that all the Series were competitive against their respective benchmark indices over all time periods noted above through September 30, 2006. In addition, the Board considered at the meeting (and considers on a quarterly basis) a peer group performance analysis consisting of Morningstar universes of mutual funds with similar investment objectives. The Board discussed the performance with representatives from the Advisor and concluded that the investment performance of each of the Fund’s Series was reasonable based on the Fund’s actual performance and comparative performance, especially performance over the current market cycle. |
| | • | | The Board considered the costs of the Advisor’s services and the profits of the Advisor as they relate to the Advisor’s services to the Fund under the Current Investment Advisory Agreement. In reviewing the Advisor’s costs and profits, the Board discussed the Advisor’s revenues generated from the Fund (on both an actual and adjusted basis) and its expenses associated with providing the services under the Current Investment Advisory Agreement. In addition, the Board reviewed the Advisor’s expenses associated with Fund activities outside of the Current Investment Advisory Agreement (such as expense reimbursements pursuant to expense caps and payments made by the Advisor to third party platforms on which shares of the Fund are available for purchase). It was noted by representatives of the Advisor that 6 of the 18 active Series of the Fund are currently experiencing expenses above the capped expense ratios. After discussing the above costs and profits, the Board concluded that the Advisor’s profitability relating to its services provided under the Current Investment Advisory Agreement was reasonable. |
| | • | | The Board considered the fees and expenses of the various Series of the Fund. The Advisor presented the advisory fees and total expenses for each Series, including the |
Renewal of Investment Advisory Agreements (unaudited)
| | advisory fee adjusted for any expense waivers or reimbursements (either contractual or voluntary) paid by the Advisor. The advisory fees and expense ratios of each Series were compared to an average (on both a mean and median basis) of similar funds as disclosed on the Morningstar database. Representatives of the Advisor discussed with the Board the levels of its advisory fee for each Series of the Fund and as compared to the median and mean advisory fees for similar funds as listed on Morningstar. Expense ratios for every Series, except the High Yield Bond Series, are currently below the median and mean for similar funds as listed on Morningstar. Based on their review of the information provided, the Board concluded that the fees and expenses of each Series of the Fund were reasonable on a comparative basis. |
| | • | | The Board also considered the other benefits the Advisor derives from its relationship with the Fund. Such other benefits include certain research products provided by soft dollars. Given the level of soft dollar transactions involving the Fund, the Board concluded that these additional benefits to the Advisor were reasonable. |
| | • | | In addition to the factors described above, the Board considered the Advisor’s personnel, investment strategies, policies and procedures relating to compliance with personal securities transactions, and reputation, expertise and resources in domestic and foreign financial markets. The Board concluded that these factors support the conclusion that the Advisor performs its services in a reasonable manner. |
| | • | | The Board did not consider economies of scale at this time because of the multiple uses of the Fund (for the Advisor’s discretionary investment account clients in addition to direct investors), the current profitability of the Advisor’s services to the Fund under the Current Investment Advisory Agreement, and the overall size of the Fund complex. |
Based on the Board’s deliberations and their evaluation of the information described above, the Board, including a majority of Directors that are “not interested” as defined in the Investment Company Act of 1940 (the “1940 Act”), concluded that the compensation under the Current Investment Advisory Agreement was fair and reasonable in light of the services and expenses and such other matters as the Directors considered to be relevant in the exercise of their reasonable judgment. Accordingly, the Board approved the renewal of the Current Investment Advisory Agreement for another year. In the course of their deliberations, the Directors did not identify any particular information that was all important or controlling.
As stated above, at the August 30, 2007 Board meeting, the Board concluded it was reasonable to take into account the conclusions set forth above when determining whether to approve the New Investment Advisory Agreement. The Board’s conclusion in this regard was based on the fact that the New Investment Advisory Agreement is identical to the Current Investment Advisory Agreement except for certain provisions of the Agreement which have been updated and modernized in response to the Board’s specific request. Further, the Board’s conclusion in this regard was based on the fact that the New Investment Advisory Agreement does not change either the investment advisory fees payable by the Fund to the Advisor or the day-to-day investment management services the Advisor provides to the Fund.
In addition to the conclusions formed with respect to the 2006 Annual Review, the Directors considered specific information at the August 30, 2007 Board meeting concerning the additional provisions included in the New Investment Advisory Agreement. The Directors considered the fact that these additional provisions are designed to (i) address and memorialize certain standard practices and regulatory requirements of mutual funds and their investment advisors; (ii) further
Renewal of Investment Advisory Agreements (unaudited)
delineate the duties and obligations of the Fund and the Advisor; (iii) modernize the agreement to reflect current industry practice and applicable law; and (iv) generally improve the overall quality of the agreement. The Board further considered the fact that the New Investment Advisory Agreement does not alter the actual day-to-day investment management services provided by the Advisor to each Series of the Fund, and the investment advisory fee rate paid to the Advisor under the New Investment Advisory Agreement for a Series is the same as the fee rate paid by the Series under the Current Investment Advisory Agreement.
Based on its evaluation of the information and the conclusions with respect thereto at its meetings on November 16, 2006 and August 30, 2007, the Board unanimously concluded that: (a) the terms of the New Investment Advisory Agreement were fair and reasonable; (b) the approval of the New Investment Advisory Agreement would be in the best interests of the shareholders and the Fund; and (c) it would recommend the approval of the New Investment Advisory Agreement to shareholders. In the course of their deliberations, the Board did not identify any particular information or factor that was all-important or controlling.
Consideration of Current Investment Advisory Agreement
At a meeting held on November 12, 2007, the Board considered the continuation of the Current Investment Advisory Agreement and simultaneously conducted its annual review of the services provided to the Fund by the Adviser (the “2007 Annual Review”). Representatives of the Advisor attended the meeting and presented additional oral and written information to the Board to assist the Board in its considerations. The discussion immediately below outlines the materials and information presented to the Board in connection with the Board’s 2007 Annual Review of the Current Investment Advisory Agreement and the conclusions made by the Directors when determining to continue the Current Investment Advisory Agreement.
In connection with its review and deliberations, the Board considered the following factors and reached a conclusion with respect to such factors.
| | • | | The Board considered the services provided by the Advisor under the Current Investment Advisory Agreement including, among others: deciding what securities to purchase and sell for each Series; arranging for the purchase and sale of such securities by placing orders with broker-dealers; administering the affairs of the Fund (including the books and records of the Fund not maintained by third party service providers such as the custodian or sub-transfer agent); arranging for the insurance coverage for the Fund; and supervising the preparation of tax returns, SEC filings (including registration statements) and reports to shareholders for the Fund. The Board also considered the nature and quality of such services provided under the Current Investment Advisory Agreement in light of the Advisor’s services provided to the Fund for 21 years. The Board discussed the quality of these services with representatives from the Advisor and concluded that the Advisor was performing its services to the Fund required under the Current Investment Advisory Agreement in a reasonable manner. |
| | • | | The Board considered the investment performance of the various Series of the Fund. The investment performance for each Series was reviewed on a cumulative basis since inception and on a one year basis. In addition, annualized performance for the following time periods was considered: inception, three year, five year, ten year, and current market cycle. A market cycle includes periods of both rising and falling markets. Returns for established benchmark indices for each Series were provided for |
Renewal of Investment Advisory Agreements (unaudited)
| | each time period. The Board noted that all the Series were competitive against their respective benchmark indices over all time periods noted above through September 30, 2007. In addition, the Board considered at the meeting (and considers on a quarterly basis) a peer group performance analysis consisting of Morningstar universes of mutual funds with similar investment objectives. The Board discussed the performance with representatives from the Advisor and concluded that the investment performance of each of the Fund’s Series was reasonable based on the Fund’s actual performance and comparative performance, especially performance over the current market cycle. |
| | • | | The Board considered the costs of the Advisor’s services and the profits of the Advisor as they relate to the Advisor’s services to the Fund under the Current Investment Advisory Agreement. In reviewing the Advisor’s costs and profits, the Board discussed the Advisor’s revenues generated from the Fund (on both an actual and adjusted basis) and its expenses associated with providing the services under the Current Investment Advisory Agreement. In addition, the Board reviewed the Advisor’s expenses associated with Fund activities outside of the Current Investment Advisory Agreement (such as expense reimbursements pursuant to expense caps and payments made by the Advisor to third party platforms on which shares of the Fund are available for purchase). It was noted by representatives of the Advisor that 4 of the 18 active Series of the Fund are currently experiencing expenses above the capped expense ratios. After discussing the above costs and profits, the Board concluded that the Advisor’s profitability relating to its services provided under the Current Investment Advisory Agreement was reasonable. |
| | • | | The Board considered the fees and expenses of the various Series of the Fund. The Advisor presented the advisory fees and total expenses for each Series, including the advisory fee adjusted for any expense waivers or reimbursements (either contractual or voluntary) paid by the Advisor. The advisory fees and expense ratios of each Series were compared to an average (on both a mean and median basis) of similar funds as disclosed on the Morningstar database. Representatives of the Advisor discussed with the Board the levels of its advisory fee for each Series of the Fund and as compared to the median and mean advisory fees for similar funds as listed on Morningstar. Expense ratios for every Series, except the High Yield Bond Series and Global Fixed Income Series, are currently below the median and mean for similar funds as listed on Morningstar. Based on their review of the information provided, the Board concluded that the fees and expenses of each Series of the Fund were reasonable on a comparative basis. |
| | • | | The Board also considered the other benefits the Advisor derives from its relationship with the Fund. Such other benefits include certain research products provided by soft dollars. Given the level of soft dollar transactions involving the Fund, the Board concluded that these additional benefits to the Advisor were reasonable. |
| | • | | In addition to the factors described above, the Board considered the Advisor’s personnel, investment strategies, policies and procedures relating to compliance with personal securities transactions, and reputation, expertise and resources in domestic and foreign financial markets. The Board concluded that these factors support the conclusion that the Advisor performs its services in a reasonable manner. |
Renewal of Investment Advisory Agreements (unaudited)
| | • | | The Board did not consider economies of scale at this time because of the multiple uses of the Fund (for the Advisor’s discretionary investment account clients in addition to direct investors), the current profitability of the Advisor’s services to the Fund under the Current Investment Advisory Agreement, and the overall size of the Fund complex. |
Based on the Board’s deliberations and their evaluation of the information described above, the Board, including a majority of Directors that are not “interested persons” as defined in the 1940 Act, concluded that the compensation under the Current Investment Advisory Agreement was fair and reasonable in light of the services and expenses and such other matters as the Directors considered to be relevant in the exercise of their reasonable judgment. Accordingly, the Board approved the renewal of the Current Investment Advisory Agreement. In the course of their deliberations, the Directors did not identify any particular information that was all important or controlling.
Proxy Voting Results (unaudited)
A special meeting of the shareholders of Manning & Napier Fund, Inc. was held on November 12, 2007. The number of votes necessary to conduct the meeting and approve each proposal was obtained, and the results of the votes of shareholders on proposals before them are listed below:
PROPOSAL 1:
Election of Directors.
| | | | |
| | | Number of Shares
voted for | | Number of Shares
withheld |
B. Reuben Auspitz | | 215,932,354.541 | | 15,898,685.154 |
Stephen B. Ashley | | 215,960,751.214 | | 15,870,288.481 |
Peter L. Faber | | 217,504,725.208 | | 14,326,314.487 |
Harris H. Rusitzky | | 215,924,013.609 | | 15,907,026.086 |
PROPOSAL 2:
To approve the investment advisory agreement between Manning & Napier Advisors, Inc. and Manning & Napier Fund, Inc.
| | |
| | | Number of
shares voted |
For | | 17,352,339.461 |
Against | | 256.876 |
Abstain (includes broker non-votes) | | 125,087.000 |
PROPOSAL 3:
Eliminating, amending, or reclassifying certain fundamental investment policies or restrictions.
Proposal 3.A.i. To approve changes to the fundamental policy regarding borrowing money.
| | |
| | | Number of
shares voted |
For | | 17,350,997.724 |
Against | | 1,598.613 |
Abstain (includes broker non-votes) | | 125,087.000 |
Proposal 3.A.ii. To approve changes to the fundamental policy regarding percentage of assets invested in any one industry.
| | |
| | | Number of
shares voted |
For | | 17,351,829.495 |
Against | | 766.842 |
Abstain (includes broker non-votes) | | 125,087.000 |
Proxy Voting Results (unaudited)
Proposal 3.A.iii. To approve changes to the fundamental policy regarding loans.
| | |
| | | Number of
shares voted |
For | | 17,351,829.495 |
Against | | 766.842 |
Abstain (includes broker non-votes) | | 125,087.000 |
Proposal 3.A.iv. To approve changes to the fundamental policy regarding issuance of senior securities or pledging its assets.
| | |
| | | Number of
shares voted |
For | | 17,350,997.724 |
Against | | 1,598.613 |
Abstain (includes broker non-votes) | | 125,087.000 |
Proposal 3.A.v. To approve changes to the fundamental policy regarding buying or selling of commodities or commodity contracts.
| | |
| | | Number of
shares voted |
For | | 17,351,829.495 |
Against | | 766.842 |
Abstain (includes broker non-votes) | | 125,087.000 |
Proposal 3.A.vi. To approve changes to the fundamental policy regarding underwriting of securities.
| | |
| | | Number of
shares voted |
For | | 17,351,829.495 |
Against | | 766.842 |
Abstain (includes broker non-votes) | | 125,087.000 |
Proposal 3.B.i. To approve changes to the policy/restriction regarding investment of its total net assets in securities of issuers that are restricted from being sold to the public without registration.
| | |
| | | Number of
shares voted |
For | | 16,135,647.268 |
Against | | 1,216,949.069 |
Abstain (includes broker non-votes) | | 125,087.000 |
Proposal 3.B.ii. To approve changes to the policy/restriction regarding the purchase of securities on margin.
| | |
| | | Number of
shares voted |
For | | 16,135,647.268 |
Against | | 1,216,949.069 |
Abstain (includes broker non-votes) | | 125,087.000 |
Proxy Voting Results (unaudited)
Proposal 3.B.iii. To approve changes to the policy/restriction regarding acquiring securities of other investment companies.
| | |
| | | Number of
shares voted |
For | | 16,135,487.517 |
Against | | 1,217,108.820 |
Abstain (includes broker non-votes) | | 125,087.000 |
Proposal 3.B.iv. To approve changes to the policy/restriction regarding warrants.
| | |
| | | Number of
shares voted |
For | | 16,134,975.248 |
Against | | 1,217,621.089 |
Abstain (includes broker non-votes) | | 125,087.000 |
Proposal 3.B.v. To approve changes to the policy/restriction regarding options on securities and with respect to stock index and currency futures and related options.
| | |
| | | Number of
shares voted |
For | | 16,135,487.517 |
Against | | 1,217,108.820 |
Abstain (includes broker non-votes) | | 125,087.000 |
Proposal 3.B.vi. To approve changes to the policy/restriction regarding hedging and derivative transactions.
| | |
| | | Number of
shares voted |
For | | 16,134,975.248 |
Against | | 1,217,621.089 |
Abstain (includes broker non-votes) | | 125,087.000 |
Proposal 3.B.vii. To approve changes to the policy/restriction regarding the purchase of foreign securities.
| | |
| | | Number of
shares voted |
For | | 16,135,647.268 |
Against | | 1,216,949.069 |
Abstain (includes broker non-votes) | | 125,087.000 |
Proposal 3.C.i. To approve changes to the policy/restriction regarding investment for the purpose of exercising control over management.
| | |
| | | Number of
shares voted |
For | | 17,350,997.724 |
Against | | 1,598.613 |
Abstain (includes broker non-votes) | | 125,087.000 |
Proxy Voting Results (unaudited)
Proposal 3.C.ii. To approve changes to the policy/restriction regarding the maximum percentage of securities the Series may purchase of any one issuer.
| | |
| | | Number of
shares voted |
For | | 17,350,997.724 |
Against | | 1,598.613 |
Abstain (includes broker non-votes) | | 125,087.000 |
Proposal 3.C.iii. To approve changes to the policy/restriction regarding short sales or short positions.
| | |
| | | Number of
shares voted |
For | | 17,350,997.724 |
Against | | 1,598.613 |
Abstain (includes broker non-votes) | | 125,087.000 |
Proposal 3.C.iv. To approve changes to the policy/restriction regarding participation in a joint or joint and several basis in trading account in securities.
| | |
| | | Number of
shares voted |
For | | 17,351,157.475 |
Against | | 1,438.862 |
Abstain (includes broker non-votes) | | 125,087.000 |
Proposal 3.C.v. To approve changes to the policy/restriction regarding investment in oil, gas or other mineral exploration or development programs.
| | |
| | | Number of
shares voted |
For | | 17,351,669.744 |
Against | | 926.593 |
Abstain (includes broker non-votes) | | 125,087.000 |
Proposal 3.C.vi. To approve changes to the policy/restriction regarding officers and directors of the Fund.
| | |
| | | Number of
shares voted |
For | | 17,350,997.724 |
Against | | 1,598.613 |
Abstain (includes broker non-votes) | | 125,087.000 |
Proposal 3.C.vii. To approve changes to the policy/restriction regarding investing in any company with less than three years continuous operation.
| | |
| | | Number of
shares voted |
For | | 17,351,157.475 |
Against | | 1,438.862 |
Abstain (includes broker non-votes) | | 125,087.000 |
Directors’ and Officers’ Information (unaudited)
The Statement of Additional Information provides additional information about the Fund’s directors and officers and can be obtained without charge by calling 1-800-466-3863, at www.manningnapieradvisors.com, or on the EDGAR Database on the SEC Internet web site (http://www.sec.gov). The following chart shows certain information about the Fund’s officers and directors, including their principal occupations during the last five years. Unless specific dates are provided, the individuals have held the listed positions for longer than five years.
INTERESTED DIRECTOR/OFFICER
| | |
| Name: | | B. Reuben Auspitz* |
| Address: | | 290 Woodcliff Drive Fairport, NY 14450 |
| Age: | | 60 |
| Current Position(s) Held with Fund: | | Principal Executive Officer, President, Chairman & Director |
| Term of Office1 & Length of Time Served: | | Indefinite - Director since 1984; Vice President 1984 - 2003; President since 2004; Principal Executive Officer since 2002 |
| Principal Occupation(s) During Past 5 Years: | | Executive Vice President; Co-Executive Director; Executive Group Member**; Chief Compliance Officer since 2004 - Manning & Napier Advisors, Inc. President; Director - Manning & Napier Investor Services, Inc. Holds or has held one or more of the following titles for various subsidiaries and affiliates: President, Vice President, Director, Chairman, Treasurer, Chief Compliance Officer or Member. |
| Number of Portfolios Overseen within Fund Complex: | | 27 |
| Other Directorships Held Outside Fund Complex: | | N/A |
| |
| INDEPENDENT DIRECTORS | | |
| |
| Name: | | Stephen B. Ashley |
| Address: | | 290 Woodcliff Drive
Fairport, NY 14450 |
| Age: | | 67 |
| Current Position(s) Held with Fund: | | Director, Audit Committee Member, Governance & Nominating Committee Member |
| Term of Office & Length of Time Served: | | Indefinite - Since 1996 |
| Principal Occupation(s) During Past 5 Years: | | Chairman, Director, President & Chief Executive Officer, The Ashley Group (property management and investment) |
| Number of Portfolios Overseen within Fund Complex: | | 27 |
| Other Directorships Held Outside Fund Complex: | | The Ashley Group Fannie Mae |
| Name: | | Peter L. Faber |
| Address: | | 290 Woodcliff Drive Fairport, NY 14450 |
| Age: | | 68 |
| Current Position(s) Held with Fund: | | Director, Governance & Nominating Committee Member |
| Term of Office & Length of Time Served: | | Indefinite - Since 1987 |
| Principal Occupation(s) During Past 5 Years: | | Senior Counsel, McDermott, Will & Emery LLP (law firm) |
| Number of Portfolios Overseen within Fund Complex: | | 27 |
| Other Directorships Held Outside Fund Complex: | | Partnership for New York City, Inc. New York Collegium Boston Early Music Festival |
| Name: | | Harris H. Rusitzky |
| Address: | | 290 Woodcliff Drive |
| | Fairport, NY 14450 |
| Age: | | 72 |
| Current Position(s) Held with Fund: | | Director, Audit Committee Member, Governance & Nominating Committee Member |
| Term of Office & Length of Time Served: | | Indefinite - Since 1985 |
| Principal Occupation(s) During Past 5 Years: | | President, The Greening Group (business consultants); Partner, The Restaurant Group (restaurants) |
| Number of Portfolios Overseen within Fund Complex: | | 27 |
| Other Directorships Held Outside Fund Complex: | | N/A |
Directors’ and Officers’ Information (unaudited)
| | |
| Name: | | Paul A. Brooke |
| Address: | | 290 Woodcliff Drive Fairport, NY 14450 |
| Age: | | 62 |
| Current Position(s) Held with Fund: | | Director, Audit Committee Member, Governance & Nominating Committee Member |
| Term of Office & Length of Time Served: | | Indefinite - Since 2007 |
| Principal Occupation(s) During Past 5 Years: | | Chairman & CEO, Alsius Corp. (investments); Managing Member, PMSV Holdings LLC (investments) |
| Number of Portfolios Overseen within Fund Complex: | | 27 |
| Other Directorships Held Outside Fund Complex: | | Incyte Corp. ViroPharma, Inc. HLTH Corp. Cheyne Capital International MPM Bio-equities GMP Companies HoustonPharma |
| |
| OFFICERS | | |
| |
| Name: | | Jeffrey S. Coons, Ph.D., CFA |
| Address: | | 290 Woodcliff Drive Fairport, NY 14450 |
| Age: | | 44 |
| Current Position(s) Held with Fund: | | Vice President |
| Term of Office1 & Length of Time Served: | | Since 2004 |
| Principal Occupation(s) During Past 5 Years: | | Co-Director of Research since 2002 & Executive Group Member**, Manning & Napier Advisors, Inc. Holds one or more of the following titles for various subsidiaries and affiliates: President, Director, Treasurer or Senior Trust Officer. |
| Number of Portfolios Overseen within Fund Complex: | | 27 |
| Other Directorships Held Outside Fund Complex: | | N/A |
| Name: | | Christine Glavin |
| Address: | | 290 Woodcliff Drive Fairport, NY 14450 |
| Age: | | 41 |
| Current Position(s) Held with Fund: | | Principal Financial Officer, Chief Financial Officer |
| Term of Office1 & Length of Time Served: | | Principal Financial Officer since 2002; Chief Financial Officer since 2001 |
| Principal Occupation(s) During Past 5 Years: | | Fund Reporting Manager, Manning & Napier Advisors, Inc. |
| Number of Portfolios Overseen within Fund Complex: | | 27 |
| Other Directorships Held Outside Fund Complex: | | N/A |
| Name: | | Jodi L. Hedberg |
| Address: | | 290 Woodcliff Drive Fairport, NY 14450 |
| Age: | | 40 |
| Current Position(s) Held with Fund: | | Corporate Secretary, Chief Compliance Officer, Anti-Money Laundering Compliance Officer |
| Term of Office1 & Length of Time Served: | | Corporate Secretary since 1997; Chief Compliance Officer since 2004 |
| Principal Occupation(s) During Past 5 Years: | | Director of Compliance, Manning & Napier Advisors, Inc. and affiliates; Corporate Secretary, Manning & Napier Investor Services, Inc. since 2006 |
| Number of Portfolios Overseen within Fund Complex: | | 27 |
| Other Directorships Held Outside Fund Complex: | | N/A |
*Interested Director, within the meaning of the Investment Company Act of 1940 by reason of his position with the Fund’s investment advisor and distributor. Mr. Auspitz serves as the Executive Vice President and Director, Manning & Napier Advisors, Inc. and President and Director, Manning & Napier Investor Services, Inc., the Fund’s distributor.
**The Executive Group performs the duties of the Office of the Chief Executive of Manning & Napier Advisors, Inc.
1The term of office for President, Vice President, Chief Financial Officer, and Corporate Secretary is one year and until their respective successors are chosen and qualified. All other officers’ terms are indefinite.
(THISPAGEINTENTIONALLYLEFTBLANK)
(THISPAGEINTENTIONALLYLEFTBLANK)
Literature Requests (unaudited)
Proxy Voting Policies and Procedures
A description of the policies and procedures that the Fund uses to determine how to vote proxies relating to portfolio securities is available, without charge, upon request:
| | |
By phone | | 1-800-466-3863 |
On the Securities and Exchange Commission’s (SEC) web site | | http://www.sec.gov |
Proxy Voting Record
Information regarding how the Fund voted proxies relating to portfolio securities during the most recent 12-month period ended June 30th is available, without charge, upon request:
| | |
By phone | | 1-800-466-3863 |
On the SEC’s web site | | http://www.sec.gov |
Quarterly Portfolio Holdings
The Series’ complete schedule of portfolio holdings for the 1st and 3rd quarters of each fiscal year are provided on Form N-Q, and are available, without charge, upon request:
| | |
By phone | | 1-800-466-3863 |
On the SEC’s web site | | http://www.sec.gov |
The Series’ Form N-Q may be reviewed and copied at the SEC’s Public Reference Room in Washington, D.C. Information on the operation of the Public Reference Room may be obtained by calling 1-800-SEC-0330.
Prospectus and Statement of Additional Information (SAI)
The prospectus and SAI provide additional information about each Series, including charges, expenses and risks. These documents are available, without charge, upon request:
| | |
By phone | | 1-800-466-3863 |
On the SEC’s web site | | http://www.sec.gov |
On the Advisor’s web site | | http://www.manningnapieradvisors.com |
Additional information available at www.manningnapieradvisors.com
1. Fund Holdings - Month-End
2. Fund Holdings - Quarter-End
3. Shareholder Report - Annual
4. Shareholder Report - Semi-Annual
Manning & Napier Fund, Inc.
| | | | |
| WORLD OPPORTUNITIES SERIES | | | | | Annual Report - December 31, 2007 |

Management Discussion and Analysis (unaudited)
Dear Shareholders:
The World Opportunities Series produced strong absolute returns during 2007, beating the return of the Morgan Stanley Capital International (MSCI) World Index while slightly trailing the return of the MSCI All Country World Index ex U.S. The Series invests entirely in stocks of companies outside the U.S., in contrast to the MSCI World Index, which includes U.S. stocks. The MSCI All Country World Index ex U.S. measures performance of non-U.S. stocks in both developed and emerging markets.
Another year of a weakening U.S. Dollar versus the Euro and British Pound helped international stock markets achieve positive gains. Over the current market cycle for international stocks (since January 1, 2000), the World Opportunities Series has substantially outperformed both benchmarks.
Our team of analysts uses time-tested strategies to choose stocks for the portfolio. These strategies include the Profile Strategy, the Hurdle Rate Strategy, and the Bankable Deal Strategy. Our investment process also follows strict pricing disciplines in order to avoid buying stocks that are not attractively valued.
The Series currently has an overweight position relative to both benchmarks in the Health Care sector. A majority of the stocks in this sector were bought under our Profile Strategy. In this strategy our analysts seek to identify companies that we believe can grow their earnings faster than global economic growth, but also have some sustainable competitive advantage that keeps competitors from entering their markets. We become interested in Profile stocks when we feel market valuations do not adequately reflect the growth prospects for a particular company. Our exposure to the Health Care sector is spread among large pharmaceutical companies, specialty health care companies, diagnostic companies, and firms that supply products to the drug discovery market. The global Health Care sector as a whole had a poor year compared to the benchmarks, but our large position in the sector contributed to relative performance due to successful stock selection.
The Series has also maintained a larger position than the benchmarks in the Information Technology sector. Interestingly, we purchased many of these companies under the Hurdle Rate Strategy. In this strategy we seek to identify industries in a downturn where profits are temporarily depressed and future expectations are low. We want to own companies that are in the strongest position as capacity is being taken out of the industry and the supply/demand situation is coming into balance, as these companies will be in the best position to increase profits and market share as the industry recovers. Under this strategy, we currently own manufacturers of flat panel displays, which were positive contributors to performance.
The Series is currently underweight in the Financials sector. We have largely shied away from companies with direct exposure to the subprime mortgage market and positioned the portfolio in companies that earn most of their revenues from fee-based business. These include many large diversified banks in developed European countries.
The Series continues to be relatively underweight in Japanese stocks; this benefited performance on an absolute and relative basis versus the benchmark as the Japanese market was weak throughout the year. The emerging markets region was the best-performing region over the year and the Series was underweight, which impacted returns compared to the benchmark. Currently, the Series is maintaining a large allocation to developed European countries as valuations in certain emerging markets look stretched.
As always, we adhere to our stock selection strategies, a unique investment process, and our strict pricing disciplines in positioning the portfolio.
We appreciate your business and wish you all the very best in the coming year.
Sincerely,
Manning & Napier Advisors, Inc.
Performance Update as of December 31, 2007 (unaudited)
| | | | | | | | | | |
| | | Average Annual Total Returns
As of December 31, 2007 | | |
| | | One
Year | | Five
Year | | Ten
Year | | Since
Inception1 | | |
Manning & Napier Fund, Inc. - World Opportunities Series2 | | 15.13% | | 23.00% | | 13.92% | | 13.42% | | |
Morgan Stanley Capital International (MSCI) World Index3 | | 9.04% | | 16.96% | | 7.00% | | 8.02% | | |
Morgan Stanley Capital International (MSCI) All Country World Index ex U.S.3 | | 16.65% | | 24.02% | | 9.75% | | 8.97% | | |
The following graph compares the value of a $10,000 investment in the Manning & Napier Fund, Inc. - World Opportunities Series for the ten years ended December 31, 2007 to the MSCI World Index and the MSCI All Country World Index ex U.S.
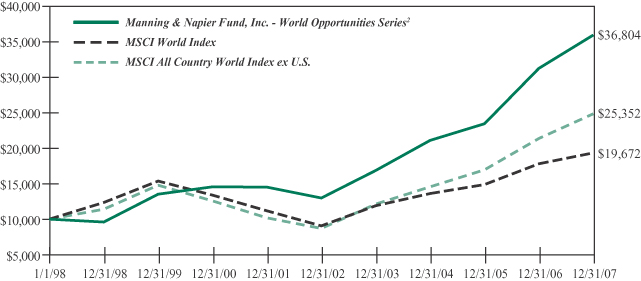
1Performance numbers for the Series are calculated from September 6, 1996, the Series’ inception date. Prior to 2001, the MSCI World Index and the MSCI All Country World Index ex U.S. only published month-end numbers; therefore, performance numbers for the Indices are calculated from September 30, 1996.
2The Series’ performance does not reflect the deduction of taxes that a shareholder would pay on fund distributions or the redemption of shares. The Series’ performance is historical and may not be indicative of future results. The performance returns shown are inclusive of the net expense ratio of the Series. For the year ended December 31, 2007, this net expense ratio was 1.14%. The gross expense ratio, which does not account for any voluntary or contractual waivers currently in effect, was 1.14% for the year ended December 31, 2007.
3The MSCI World Index is a free float-adjusted market capitalization index that is designed to measure global developed market equity performance and consists of 23 developed market country indices. The Index returns assume daily reinvestment of net dividends (which do account for foreign dividend taxation). The MSCI All Country World Index ex U.S. is a free float-adjusted market capitalization weighted index that is designed to measure equity market performance in the global developed and emerging markets and consists of 47 developed and emerging market country indices outside the United States. The Index returns assume daily reinvestment of gross dividends (which do not account for foreign dividend taxation) from the inception of the Series (see Note 1 above) through December 31, 1998, as net returns were not available. Subsequent to December 31, 1998, the Index returns assume daily reinvestment of net dividends (thus accounting for foreign dividend taxation). Both Indices are denominated in U.S. Dollars and, unlike Series returns, do not reflect any fees or expenses.
Shareholder Expense Example (unaudited)
As a shareholder of the Series, you may incur two types of costs: (1) transaction costs, including potential wire charges on redemptions and (2) ongoing costs, including management fees and other Series expenses. This example is intended to help you understand your ongoing costs (in dollars) of investing in the Series and to compare these costs with the ongoing costs of investing in other mutual funds.
The example is based on an investment of $1,000 invested at the beginning of the period and held for the entire period (July 1, 2007 to December 31, 2007).
Actual Expenses
The first line of the table below provides information about actual account values and actual expenses. You may use the information in this line, together with the amount you invested, to estimate the expenses that you paid over the period. Simply divide your account value by $1,000 (for example, an $8,600 account value divided by $1,000 = 8.6), then multiply the result by the number in the first line under the heading entitled “Expenses Paid During Period” to estimate the expenses you paid on your account during this period.
Hypothetical Example for Comparison Purposes
The second line of the table below provides information about hypothetical account values and hypothetical expenses based on the Series’ actual expense ratio and an assumed rate of return of 5% per year before expenses, which is not the Series’ actual return. The hypothetical account values and expenses may not be used to estimate the actual ending account balance or expenses you paid during the period. You may use this information to compare the ongoing costs of investing in the Series and other funds. To do so, compare this 5% hypothetical example with the 5% hypothetical examples that appear in the shareholder reports of the other funds.
Please note that the expenses shown in the table are meant to highlight your ongoing costs only and do not reflect any transaction costs, such as potential wire charges on redemptions. Therefore, the second line of the table is useful in comparing ongoing costs only, and will not help you determine the relative total costs of owning different funds. In addition, if these transaction costs were included, your costs would have been higher.
| | | | | | | | | |
| | | Beginning
Account Value
7/1/07 | | Ending
Account Value
12/31/07 | | Expenses Paid
During Period*
7/1/07-12/31/07 |
Actual | | $ | 1,000.00 | | $ | 1,027.00 | | $ | 5.93 |
Hypothetical
(5% return before expenses) | | $ | 1,000.00 | | $ | 1,019.36 | | $ | 5.90 |
*Expenses are equal to the Series’ annualized expense ratio (for the six-month period) of 1.16%, multiplied by the average account value over the period, multiplied by 184/365 (to reflect the one-half year period). Expenses are based on the most recent fiscal half year; therefore, the expense ratio stated above may differ from the expense ratio stated in the financial highlights, which is based on one-year data.
Portfolio Composition as of December 31, 2007 (unaudited)
Country Allocation1
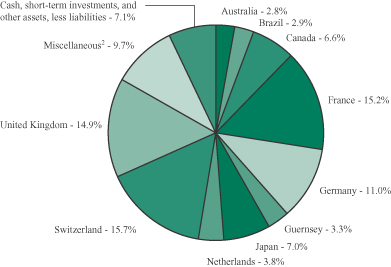
1As a percentage of net assets.
2Miscellaneous
Bermuda 2.2%
Hong Kong 1.0%
Israel 0.5%
Mexico 2.1%
South Korea 2.5%
Taiwan 1.4%
Sector Allocation3
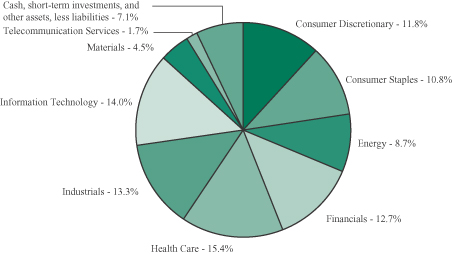
3As a percentage of net assets.
Investment Portfolio - December 31, 2007
| | | | | |
| | | Shares | | Value
(Note 2) |
| | | | | |
| | |
COMMON STOCKS - 92.9% | | | | | |
| | |
Consumer Discretionary - 11.8% | | | | | |
Hotels, Restaurants & Leisure - 2.0% | | | | | |
Club Mediterranee S.A.* (France) | | 263,000 | | $ | 16,621,090 |
| | | | | |
Leisure Equipment & Products - 2.1% | | | | | |
Sankyo Co. Ltd. (Japan) | | 212,000 | | | 9,850,313 |
Sega Sammy Holdings, Inc. (Japan) | | 592,000 | | | 7,382,775 |
| | | | | |
| | | | | 17,233,088 |
| | | | | |
Media - 4.0% | | | | | |
Grupo Televisa S.A. - ADR (Mexico) | | 737,670 | | | 17,534,416 |
Societe Television Francaise 1 (France) | | 605,430 | | | 16,196,961 |
| | | | | |
| | | | | 33,731,377 |
| | | | | |
Specialty Retail - 2.5% | | | | | |
Kingfisher plc (United Kingdom) | | 3,852,880 | | | 11,165,768 |
Valora Holding AG (Switzerland) | | 42,000 | | | 10,194,805 |
| | | | | |
| | | | | 21,360,573 |
| | | | | |
Textiles, Apparel & Luxury Goods - 1.2% | | | | | |
Adidas AG (Germany) | | 135,000 | | | 10,051,386 |
| | | | | |
Total Consumer Discretionary | | | | | 98,997,514 |
| | | | | |
Consumer Staples - 10.8% | | | | | |
Beverages - 0.5% | | | | | |
Scottish & Newcastle plc (United Kingdom) | | 290,530 | | | 4,287,892 |
| | | | | |
Food & Staples Retailing - 1.6% | | | | | |
Carrefour S.A. (France) | | 174,000 | | | 13,555,435 |
| | | | | |
Food Products - 5.3% | | | | | |
Cadbury Schweppes plc (United Kingdom) | | 780,000 | | | 9,641,130 |
Nestle S.A. (Switzerland) | | 37,190 | | | 17,085,255 |
Unilever plc - ADR (United Kingdom) | | 479,930 | | | 17,958,981 |
| | | | | |
| | | | | 44,685,366 |
| | | | | |
Personal Products - 3.4% | | | | | |
Clarins S.A. (France) | | 207,901 | | | 17,339,267 |
L’Oreal S.A. (France) | | 51,490 | | | 7,375,285 |
Natura Cosmeticos S.A. (Brazil) | | 398,800 | | | 3,810,905 |
| | | | | |
| | | | | 28,525,457 |
| | | | | |
Total Consumer Staples | | | | | 91,054,150 |
| | | | | |
Energy - 8.7% | | | | | |
Energy Equipment & Services - 8.7% | | | | | |
Abbot Group plc (United Kingdom) | | 4,057,570 | | | 30,830,942 |
Calfrac Well Services Ltd. (Canada) | | 1,183,280 | | | 21,130,428 |
| | |
| The accompanying notes are an integral part of the financial statements. | | 5 |
Investment Portfolio - December 31, 2007
| | | | | |
| | | Shares | | Value
(Note 2) |
| | | | | |
| | |
COMMON STOCKS (continued) | | | | | |
| | |
Energy (continued) | | | | | |
Energy Equipment & Services (continued) | | | | | |
Compagnie Generale de Geophysique - Veritas (CGG - Veritas)* (France) | | 20,720 | | $ | 5,906,672 |
Trican Well Service Ltd. (Canada) | | 778,160 | | | 15,165,721 |
| | | | | |
Total Energy | | | | | 73,033,763 |
| | | | | |
Financials - 12.7% | | | | | |
Capital Markets - 1.3% | | | | | |
Macquarie Group Ltd. (Australia) | | 167,330 | | | 11,192,446 |
| | | | | |
Commercial Banks - 6.2% | | | | | |
Aareal Bank AG (Germany) | | 164,880 | | | 7,404,704 |
HSBC Holdings plc (United Kingdom) | | 1,038,370 | | | 17,402,272 |
Royal Bank of Scotland Group plc (United Kingdom) | | 2,299,250 | | | 20,319,401 |
Societe Generale (France) | | 47,000 | | | 6,797,424 |
| | | | | |
| | | | | 51,923,801 |
| | | | | |
Diversified Financial Services - 2.1% | | | | | |
Financiere Marc de Lacharriere S.A. (Fimalac) (France) | | 252,670 | | | 17,360,812 |
| | | | | |
Insurance - 3.1% | | | | | |
Allianz SE (Germany) | | 86,830 | | | 18,796,834 |
Willis Group Holdings Ltd. (United Kingdom) | | 200,000 | | | 7,594,000 |
| | | | | |
| | | | | 26,390,834 |
| | | | | |
Total Financials | | | | | 106,867,893 |
| | | | | |
Health Care - 15.4% | | | | | |
Health Care Equipment & Supplies - 4.3% | | | | | |
Covidien Ltd. (Bermuda) | | 220,010 | | | 9,744,243 |
Nobel Biocare Holding AG (Switzerland) | | 29,040 | | | 7,773,761 |
Straumann Holding AG (Switzerland) | | 31,390 | | | 8,659,358 |
Synthes, Inc. (Switzerland) | | 84,260 | | | 10,466,434 |
| | | | | |
| | | | | 36,643,796 |
| | | | | |
Health Care Providers & Services - 2.1% | | | | | |
BML, Inc. (Japan) | | 322,000 | | | 5,157,189 |
Sonic Healthcare Ltd. (Australia) | | 874,342 | | | 12,832,576 |
| | | | | |
| | | | | 17,989,765 |
| | | | | |
Life Sciences Tools & Services - 3.5% | | | | | |
Lonza Group AG (Switzerland) | | 195,612 | | | 23,745,109 |
QIAGEN N.V.* (Netherlands) | | 262,366 | | | 5,522,804 |
| | | | | |
| | | | | 29,267,913 |
| | | | | |
| | |
| 6 | | The accompanying notes are an integral part of the financial statements. |
Investment Portfolio - December 31, 2007
| | | | | |
| | | Shares | | Value
(Note 2) |
| | | | | |
| | |
COMMON STOCKS (continued) | | | | | |
| | |
Health Care (continued) | | | | | |
Pharmaceuticals - 5.5% | | | | | |
Novartis AG - ADR (Switzerland) | | 460,670 | | $ | 25,018,988 |
Roche Holding AG (Switzerland) | | 66,560 | | | 11,502,020 |
Santen Pharmaceutical Co. Ltd. (Japan) | | 388,500 | | | 9,616,853 |
| | | | | |
| | | | | 46,137,861 |
| | | | | |
Total Health Care | | | | | 130,039,335 |
| | | | | |
Industrials - 13.3% | | | | | |
Aerospace & Defense - 2.4% | | | | | |
Empresa Brasileira de Aeronautica S.A. (Embraer) - ADR (Brazil) | | 450,500 | | | 20,538,295 |
| | | | | |
Air Freight & Logistics - 5.4% | | | | | |
Deutsche Post AG (Germany) | | 560,000 | | | 19,083,095 |
TNT N.V. (Netherlands) | | 638,840 | | | 26,383,296 |
| | | | | |
| | | | | 45,466,391 |
| | | | | |
Electrical Equipment - 1.1% | | | | | |
ABB Ltd. (Asea Brown Boveri) - ADR (Switzerland) | | 319,375 | | | 9,198,000 |
| | | | | |
Industrial Conglomerates - 2.3% | | | | | |
Siemens AG (Germany) | | 65,540 | | | 10,388,057 |
Tyco International Ltd. (Bermuda) | | 221,280 | | | 8,773,752 |
| | | | | |
| | | | | 19,161,809 |
| | | | | |
Machinery - 2.1% | | | | | |
Heidelberger Druckmaschinen AG (Germany) | | 275,940 | | | 9,302,345 |
Schindler Holding AG (Switzerland) | | 129,000 | | | 8,319,640 |
| | | | | |
| | | | | 17,621,985 |
| | | | | |
Total Industrials | | | | | 111,986,480 |
| | | | | |
Information Technology - 14.0% | | | | | |
Communications Equipment - 2.0% | | | | | |
Alcatel-Lucent - ADR (France) | | 2,325,420 | | | 17,022,074 |
| | | | | |
Electronic Equipment & Instruments - 3.2% | | | | | |
AU Optronics Corp. - ADR (Taiwan) | | 613,600 | | | 11,781,120 |
LG. Philips LCD Co. Ltd. - ADR* (South Korea) | | 571,500 | | | 14,847,570 |
| | | | | |
| | | | | 26,628,690 |
| | | | | |
Software - 8.8% | | | | | |
Aladdin Knowledge Systems Ltd.* (Israel) | | 172,210 | | | 4,499,847 |
Amdocs Ltd.* (Guernsey) | | 813,620 | | | 28,045,481 |
Misys plc (United Kingdom) | | 1,800,000 | | | 6,619,096 |
| | |
| The accompanying notes are an integral part of the financial statements. | | 7 |
Investment Portfolio - December 31, 2007
| | | | | | |
| | | Shares/ Principal Amount | | Value
(Note 2) |
| | | | | | |
| | |
COMMON STOCKS (continued) | | | | | | |
| | |
Information Technology (continued) | | | | | | |
Software (continued) | | | | | | |
SAP AG - ADR (Germany) | | | 340,080 | | $ | 17,361,084 |
Square Enix Co. Ltd. (Japan) | | | 251,000 | | | 7,685,049 |
UbiSoft Entertainment S.A.* (France) | | | 95,470 | | | 9,695,779 |
| | | | | | |
| | | | | | 73,906,336 |
| | | | | | |
Total Information Technology | | | | | | 117,557,100 |
| | | | | | |
Materials - 4.5% | | | | | | |
Chemicals - 2.2% | | | | | | |
NITTO DENKO Corp. (Japan) | | | 357,000 | | | 18,920,680 |
| | | | | | |
Paper & Forest Products - 2.3% | | | | | | |
Norbord, Inc. (Canada) | | | 2,347,620 | | | 18,938,943 |
| | | | | | |
Total Materials | | | | | | 37,859,623 |
| | | | | | |
Telecommunication Services - 1.7% | | | | | | |
Wireless Telecommunication Services - 1.7% | | | | | | |
Hutchison Telecommunications International Ltd. (Hong Kong) | | | 5,653,000 | | | 8,497,372 |
SK Telecom Co. Ltd. - ADR (South Korea) | | | 199,830 | | | 5,962,927 |
| | | | | | |
Total Telecommunication Services | | | | | | 14,460,299 |
| | | | | | |
TOTAL COMMON STOCKS
(Identified Cost $739,540,140) | | | | | | 781,856,157 |
| | | | | | |
| | |
SHORT-TERM INVESTMENTS - 5.5% | | | | | | |
Dreyfus Treasury Cash Management - Institutional Shares | | | 16,495,177 | | | 16,495,177 |
Fannie Mae Discount Note, 1/7/2008 | | $ | 30,000,000 | | | 29,975,176 |
| | | | | | |
TOTAL SHORT-TERM INVESTMENTS
(Identified Cost $46,473,885) | | | | | | 46,470,353 |
| | | | | | |
TOTAL INVESTMENTS - 98.4%
(Identified Cost $786,014,025) | | | | | | 828,326,510 |
| | |
OTHER ASSETS, LESS LIABILITIES - 1.6% | | | | | | 13,537,112 |
| | | | | | |
NET ASSETS - 100% | | | | | $ | 841,863,622 |
| | | | | | |
*Non-income producing security
ADR - American Depository Receipt
The Series’ portfolio holds, as a percentage of net assets, greater than 10% in the following countries: Switzerland - 15.7%; France - 15.2%; United Kingdom - 14.9%; Germany - 11.0%.
| | |
| 8 | | The accompanying notes are an integral part of the financial statements. |
Statement of Assets and Liabilities
December 31, 2007
| | | |
ASSETS: | | | |
| | | |
| |
Investments, at value (identified cost $786,014,025) (Note 2) | | $ | 828,326,510 |
Foreign currency, at value (cost $3) | | | 3 |
Receivable for securities sold | | | 10,912,830 |
Receivable for fund shares sold | | | 4,087,162 |
Dividends receivable | | | 544,286 |
Foreign tax reclaims receivable | | | 184,293 |
| | | |
TOTAL ASSETS | | | 844,055,084 |
| | | |
| LIABILITIES: | | | |
| |
Accrued management fees (Note 3) | | | 710,505 |
Accrued fund accounting and transfer agent fees (Note 3) | | | 58,479 |
Accrued Chief Compliance Officer service fees (Note 3) | | | 714 |
Payable for fund shares repurchased | | | 1,274,062 |
Accrued proxy fees | | | 48,883 |
Other payables and accrued expenses | | | 98,819 |
| | | |
TOTAL LIABILITIES | | | 2,191,462 |
| | | |
TOTAL NET ASSETS | | $ | 841,863,622 |
| | | |
NET ASSETS CONSIST OF: | | | |
| |
Capital stock | | $ | 836,317 |
Additional paid-in-capital | | | 773,094,259 |
Undistributed net investment income | | | 277,607 |
Accumulated net realized gain on investments, foreign currency and other assets and liabilities | | | 25,335,074 |
Net unrealized appreciation on investments, foreign currency and other assets and liabilities | | | 42,320,365 |
| | | |
TOTAL NET ASSETS | | $ | 841,863,622 |
| | | |
NET ASSET VALUE, OFFERING PRICE AND REDEMPTION
PRICE PER SHARE - CLASS A ($841,863,622/83,631,657 shares) | | $ | 10.07 |
| | | |
| | |
| The accompanying notes are an integral part of the financial statements. | | 9 |
Statement of Operations
For the Year Ended December 31, 2007
| | | | |
INVESTMENT INCOME: | | | | |
| | | | |
| |
Dividends (net of foreign tax withheld, $588,888) | | $ | 8,998,461 | |
Interest | | | 1,631,019 | |
| | | | |
Total Investment Income | | | 10,629,480 | |
| | | | |
| EXPENSES: | | | | |
| |
Management fees (Note 3) | | | 5,612,192 | |
Fund accounting and transfer agent fees (Note 3) | | | 416,554 | |
Directors’ fees (Note 3) | | | 7,809 | |
Chief Compliance Officer service fees (Note 3) | | | 6,100 | |
Custodian fees | | | 102,701 | |
Miscellaneous | | | 266,205 | |
| | | | |
Total Expenses | | | 6,411,561 | |
| | | | |
NET INVESTMENT INCOME | | | 4,217,919 | |
| | | | |
| REALIZED AND UNREALIZED GAIN (LOSS) ON INVESTMENTS: | | | | |
| |
Net realized gain on - | | | | |
Investments | | | 86,446,243 | |
Foreign currency and other assets and liabilities | | | 60,509 | |
| | | | |
| | | 86,506,752 | |
| | | | |
| |
Net change in unrealized appreciation on - | | | | |
Investments | | | (19,115,135 | ) |
Foreign currency and other assets and liabilities | | | (274 | ) |
| | | | |
| | | (19,115,409 | ) |
| | | | |
| |
NET REALIZED AND UNREALIZED GAIN (LOSS) ON
INVESTMENTS | | | 67,391,343 | |
| | | | |
NET INCREASE IN NET ASSETS RESULTING FROM
OPERATIONS | | $ | 71,609,262 | |
| | | | |
| | |
| 10 | | The accompanying notes are an integral part of the financial statements. |
Statements of Changes in Net Assets
| | | | | | | | |
| | | For the
Year Ended
12/31/07 | | | For the
Year Ended
12/31/06 | |
| | | | | | | | |
| | | | | | | | |
| INCREASE (DECREASE) IN NET ASSETS: | | | | | | | | |
| | |
| OPERATIONS: | | | | | | | | |
| | |
Net investment income | | $ | 4,217,919 | | | $ | 3,357,023 | |
Net realized gain on investments and foreign currency | | | 86,506,752 | | | | 41,288,613 | |
Net change in unrealized appreciation on investments and foreign currency | | | (19,115,409 | ) | | | 29,930,018 | |
| | | | | | | | |
Net increase from operations | | | 71,609,262 | | | | 74,575,654 | |
| | | | | | | | |
| DISTRIBUTIONS TO SHAREHOLDERS (Note 8): | | | | | | | | |
| | |
From net investment income | | | (4,199,452 | ) | | | (3,785,787 | ) |
From net realized gain on investments | | | (65,915,500 | ) | | | (43,381,288 | ) |
| | | | | | | | |
Total distributions to shareholders | | | (70,114,952 | ) | | | (47,167,075 | ) |
| | | | | | | | |
| CAPITAL STOCK ISSUED AND REPURCHASED: | | | | | | | | |
| | |
Net increase from capital share transactions (Note 5) | | | 523,247,936 | | | | 83,077,241 | |
| | | | | | | | |
Net increase in net assets | | | 524,742,246 | | | | 110,485,820 | |
| | |
| NET ASSETS: | | | | | | | | |
| | |
Beginning of year | | | 317,121,376 | | | | 206,635,556 | |
| | | | | | | | |
End of year (including undistributed net investment income of $277,607 and $198,631, respectively) | | $ | 841,863,622 | | | $ | 317,121,376 | |
| | | | | | | | |
| | |
| The accompanying notes are an integral part of the financial statements. | | 11 |
Financial Highlights
| | | | | | | | | | |
| | | For the Years Ended |
| | | 12/31/07 | | 12/31/06 | | 12/31/05 | | 12/31/04 | | 12/31/03 |
| | | | | | | | | | |
| | | | | | | | | | |
| Per share data (for a share outstanding throughout each year): | | | | | | | | | | |
Net asset value - Beginning of year | | $9.58 | | $8.46 | | $8.33 | | $6.84 | | $5.28 |
| | | | | | | | | | |
Income from investment operations: | | | | | | | | | | |
Net investment income | | 0.05 | | 0.12 | | 0.07 | | 0.05 | | 0.06 |
Net realized and unrealized gain on investments | | 1.36 | | 2.71 | | 0.87 | | 1.68 | | 1.56 |
| | | | | | | | | | |
Total from investment operations | | 1.41 | | 2.83 | | 0.94 | | 1.73 | | 1.62 |
| | | | | | | | | | |
Less distributions to shareholders: | | | | | | | | | | |
From net investment income | | (0.05) | | (0.14) | | (0.07) | | (0.06) | | (0.06) |
From net realized gain on investments | | (0.87) | | (1.57) | | (0.74) | | (0.18) | | —2 |
| | | | | | | | | | |
Total distributions to shareholders | | (0.92) | | (1.71) | | (0.81) | | (0.24) | | (0.06) |
| | | | | | | | | | |
Net asset value - End of year | | $10.07 | | $9.58 | | $8.46 | | $8.33 | | $6.84 |
| | | | | | | | | | |
Total return1 | | 15.13% | | 33.88% | | 11.33% | | 25.42% | | 30.80% |
Ratios (to average net assets)/Supplemental
Data: | | | | | | | | | | |
Expenses | | 1.14% | | 1.16% | | 1.21% | | 1.26% | | 1.27%* |
Net investment income | | 0.75% | | 1.35% | | 0.95% | | 0.75% | | 1.25% |
Portfolio turnover | | 49% | | 64% | | 46% | | 42% | | 31% |
Net assets - End of year (000’s omitted) | | $841,864 | | $317,121 | | $206,636 | | $160,895 | | $119,845 |
| | | | | | | | | | |
|
*The investment advisor did not impose all of its management fee and is not eligible to recoup any expenses that have been waived or reimbursed in prior years. If these expenses had been incurred by the Series, the expense ratio (to average net assets) for the year ended 12/31/03 would have been increased by 0.01%. |
1Represents aggregate total return for the year indicated, and assumes reinvestment of all distributions. Total return would have been lower had certain expenses not been waived during the year ended 12/31/03.
2Less than $0.01 per share.
| | |
| 12 | | The accompanying notes are an integral part of the financial statements. |
Notes to Financial Statements
World Opportunities Series (the “Series”) is a no-load diversified series of Manning & Napier Fund, Inc. (the “Fund”). The Fund is organized in Maryland and is registered under the Investment Company Act of 1940, as amended, as an open-end management investment company.
The Series’ investment objective is to provide long-term growth by investing principally in the common stocks of companies located around the world.
The Series is authorized to issue five classes of shares (Class A, B, Z, D and E). Currently, only Class A shares have been issued. Each class of shares is substantially the same, except that class-specific distribution and shareholder servicing expenses are borne by the specific class of shares to which they relate.
The Fund’s Advisor is Manning & Napier Advisors, Inc. (the “Advisor”). Shares of the Series are offered to investors, clients and employees of the Advisor and its affiliates. The total authorized capital stock of the Fund consists of 5.0 billion shares of common stock each having a par value of $0.01. As of December 31, 2007, 3.33 billion shares have been designated in total among 27 series, of which 150 million have been designated as World Opportunities Series Class A common stock.
| 2. | SIGNIFICANT ACCOUNTING POLICIES |
Security Valuation
Portfolio securities, including domestic equities, foreign equities, exchange-traded funds and options, listed on an exchange other than the NASDAQ National Market System are valued at the latest quoted sales price of the exchange on which the security is primarily traded. Securities not traded on valuation date or securities not listed on an exchange are valued at the latest quoted bid price provided by the Fund’s pricing service. Securities listed on the NASDAQ National Market System are valued in accordance with the NASDAQ Official Closing Price.
Securities for which representative valuations or prices are not available from the Fund’s pricing service may be valued at fair value. Due to the inherent uncertainty of valuations of such securities, the fair value may differ significantly from the values that would have been used had a ready market for such securities existed. If trading or events occurring after the close of the principal market in which securities are traded are expected to materially affect the value of those securities, then they may be valued at their fair value, taking this trading or these events into account. Fair value is determined in good faith by the Advisor under procedures approved by and under the general supervision and responsibility of the Fund’s Board of Directors (the “Board”).
Short-term investments that mature in sixty days or less are valued at amortized cost, which approximates market value. Investments in open-end investment companies are valued at their net asset value per share on valuation date, with the exception of exchange-traded funds, which are valued at the closing price on the exchange.
Security Transactions, Investment Income and Expenses
Security transactions are accounted for on trade date. Dividend income is recorded on the ex-dividend date, except that if the ex-dividend date has passed, certain dividends from foreign securities are recorded as soon as the Fund is informed of the ex-dividend date. Non-cash dividends, if any, are recorded at the fair market value of the securities received. Interest income, including amortization of premium and accretion of discounts using the effective interest method, is earned from settlement date and accrued daily.
Notes to Financial Statements
| 2. | SIGNIFICANT ACCOUNTING POLICIES (continued) |
Security Transactions, Investment Income and Expenses (continued)
Expenses are recorded on an accrual basis. Most expenses of the Fund can be attributed to a specific series. Expenses which cannot be directly attributed are apportioned among the series in the Fund in such a manner as deemed equitable by the Fund’s Board, taking into consideration, among other things, the nature and type of expense.
The Series uses the identified cost method for determining realized gain or loss on investments for both financial statement and federal income tax reporting purposes.
Foreign Currency Translation
The books and records of the Series are maintained in U.S. dollars. Foreign currencies, investments and other assets and liabilities are translated into U.S. dollars at the current exchange rates. Purchases and sales of investment securities and income and expenses are translated on the respective dates of such transactions. The Series does not isolate realized and unrealized gains and losses attributable to changes in the exchange rates from gains and losses that arise from changes in the market value of investments. Such fluctuations are included with net realized and unrealized gain or loss on investments. Net realized foreign currency gains and losses represent foreign currency gains and losses between trade date and settlement date on securities transactions, gains and losses on disposition of foreign currencies and the difference between the amount of income and foreign withholding taxes recorded on the books of the Series and the amounts actually received or paid.
Federal Taxes
The Series’ policy is to comply with the provisions of the Internal Revenue Code applicable to regulated investment companies. The Series is not subject to federal income tax or excise tax to the extent that the Series distributes to shareholders each year its taxable income, including any net realized gains on investments, in accordance with requirements of the Internal Revenue Code. Accordingly, no provision for federal income tax or excise tax has been made in the financial statements.
On June 29, 2007, the Series adopted Financial Accounting Standards Board Interpretation No. 48 - Accounting for Uncertainty in Income Taxes (“FIN 48”). FIN 48 prescribes the minimum recognition threshold a tax position must meet in connection with accounting for uncertainties in income tax positions taken or expected to be taken by an entity before being measured and recognized in the financial statements. Management has determined that FIN 48 did not have a material impact on the Series’ financial statements. The Series files income tax returns in the U.S. federal jurisdiction, various states and foreign jurisdictions, as required. No income tax returns are currently under investigation. The statute of limitations on the Series’ tax returns remains open for the years ended December 31, 2004 through December 31, 2007.
Additionally, based on the Fund’s understanding of the tax rules and rates related to income, gains and transactions for foreign jurisdictions in which it invests, the Series will provide for foreign taxes, and where appropriate, deferred foreign tax.
Distributions of Income and Gains
Distributions to shareholders of net investment income and net realized gains are made annually. An additional distribution may be necessary to avoid taxation of the Series. Distributions are recorded on the ex-dividend date.
Notes to Financial Statements
| 2. | SIGNIFICANT ACCOUNTING POLICIES (continued) |
Indemnifications
The Fund’s organizational documents provide former and current directors and officers with a limited indemnification against liabilities arising in connection with the performance of their duties to the Fund. In the normal course of business, the Fund may also enter into contracts that provide general indemnifications. The Fund’s maximum exposure under these arrangements is unknown as this would be dependent on future claims that may be made against the Fund. The risk of material loss from such claims is considered remote.
Other
The preparation of financial statements in conformity with accounting principles generally accepted in the United States of America requires management to make estimates and assumptions that affect the reported amounts of assets and liabilities and the disclosure of contingent assets and liabilities at the date of the financial statements and the reported amounts of income and expenses during the reporting period. Actual results could differ from those estimates.
| 3. | TRANSACTIONS WITH AFFILIATES |
The Fund has an Investment Advisory Agreement (the “Agreement”) with the Advisor, for which the Series pays a fee, computed daily and payable monthly, at an annual rate of 1.00% of the Series’ average daily net assets.
Under the Agreement, personnel of the Advisor provide the Series with advice and assistance in the choice of investments and the execution of securities transactions, and otherwise maintain the Series’ organization. The Advisor also provides the Fund with necessary office space and fund administration and support services. The salaries of all officers of the Fund (except a percentage of the Fund’s Chief Compliance Officer’s salary, which is paid by the Fund), and of all Directors who are “affiliated persons” of the Fund, or of the Advisor, and all personnel of the Fund, or of the Advisor, performing services relating to research, statistical and investment activities, are paid by the Advisor. Each “non-affiliated” Director receives an annual stipend, which is allocated among all the active series of the Fund. In addition, these Directors also receive a fee per Board meeting attended for each active series of the Fund plus a fee for each committee meeting attended.
Manning & Napier Investor Services, Inc., a registered broker-dealer affiliate of the Advisor, acts as distributor for the Fund’s shares. The services of Manning & Napier Investor Services, Inc. are provided at no additional cost to the Series.
For fund accounting and transfer agent services, the Fund pays the Advisor an annual fee of 0.11% of the Fund’s average daily net assets up to $900 million, 0.07% of the Fund’s average daily net assets between $900 million and $1.5 billion, and 0.04% of the Fund’s average daily net assets over $1.5 billion. Additionally, certain transaction and account-based fees and out-of-pocket expenses, including charges for reporting relating to the Fund’s compliance program, are charged. Expenses not directly attributable to a series are allocated based on each series’ relative net assets or number of accounts, depending on the expense. The Advisor has an agreement with Citi Fund Services Ohio, Inc. (“Citi”) (formerly BISYS Fund Services Ohio, Inc.) under which Citi serves as sub-accountant and sub-transfer agent.
Notes to Financial Statements
| 4. | PURCHASES AND SALES OF SECURITIES |
For the year ended December 31, 2007, purchases and sales of securities, other than United States Government securities and short-term securities, were $684,947,157 and $253,765,020, respectively. There were no purchases or sales of United States Government securities.
| 5. | CAPITAL STOCK TRANSACTIONS |
Transactions in Class A shares of World Opportunities Series were:
| | | | | | | | | | | | | | |
| | | For the Year
Ended 12/31/07 | | | For the Year
Ended 12/31/06 | |
| | | Shares | | | Amount | | | Shares | | | Amount | |
| | | | | | | | | | | | | | |
Sold | | 55,314,981 | | | $ | 576,440,251 | | | 11,822,192 | | | $ | 114,767,511 | |
Reinvested | | 6,492,581 | | | | 63,491,004 | | | 4,599,718 | | | | 44,020,070 | |
Repurchased | | (11,273,014 | ) | | | (116,683,319 | ) | | (7,744,452 | ) | | | (75,710,340 | ) |
| | | | | | | | | | | | | | |
Total | | 50,534,548 | | | $ | 523,247,936 | | | 8,677,458 | | | $ | 83,077,241 | |
| | | | | | | | | | | | | | |
Approximately 26% of the Series’ shares represent investments by fiduciary accounts over which the Advisor has sole investment discretion.
The Series may trade in financial instruments with off-balance sheet risk in the normal course of its investing activities to assist in managing exposure to various market risks. These financial instruments include written options, forward foreign currency exchange contracts and futures contracts and may involve, to a varying degree, elements of risk in excess of the amounts recognized for financial statement purposes. No such investments were held by the Series on December 31, 2007.
Investing in securities of foreign companies and foreign governments involves special risks and considerations not typically associated with investing in securities of domestic companies and the United States Government. These risks include revaluation of currencies and future adverse political and economic developments. Moreover, securities of foreign companies and foreign governments and their markets may be less liquid and their prices more volatile than those of comparable domestic companies and the United States Government.
| 8. | FEDERAL INCOME TAX INFORMATION |
The amount and characterization of certain income and capital gains to be distributed are determined in accordance with federal income tax regulations, which may differ from accounting principles generally accepted in the United States of America. These differences are primarily due to differing book and tax treatments in the timing of the recognition of net investment income or gains and losses, including foreign currency gains and losses and losses deferred due to wash sales. The Series may periodically make reclassifications among its capital accounts to reflect income and gains available for distribution (or available capital loss carryovers) under income tax regulations, without impacting the Series’ net asset value. Any such reclassifications are not reflected in the financial highlights.
Notes to Financial Statements
| 8. | FEDERAL INCOME TAX INFORMATION (continued) |
The tax character of distributions paid were as follows:
| | | | | | |
| | | For the Year
Ended 12/31/07 | | For the Year
Ended 12/31/06 |
Ordinary income | | $ | 30,433,799 | | $ | 11,373,017 |
Long-term capital gains | | | 39,681,153 | | | 35,794,058 |
At December 31, 2007, the tax basis components of distributable earnings and the net unrealized appreciation based on identified cost for federal income tax purposes were as follows,
| | | | |
Cost for federal income tax purposes | | $ | 786,040,921 | |
| |
Unrealized appreciation | | $ | 80,222,390 | |
Unrealized depreciation | | | (37,936,801 | ) |
| | | | |
Net unrealized appreciation | | $ | 42,285,589 | |
Undistributed ordinary income | | | 4,901,100 | |
Undistributed long-term capital gains | | | 20,738,477 | |
| 9. | RECENT ACCOUNTING PRONOUNCEMENTS |
In September 2006, FASB Statement of Financial Accounting Standards No. 157, Fair Value Measurements (“FAS 157”) was issued, and is effective for fiscal years beginning after November 15, 2007. FAS 157 defines fair value, establishes a framework for measuring fair value, and expands disclosure about fair value measurements. The standard does not expand the use of fair value in any new circumstances, but provides clarification on acceptable fair value methods and applications. At this time, management is evaluating the implications of FAS 157, but it is not expected to materially impact the Series’ financial statements.
Report of Independent Registered Public Accounting Firm
To the Board of Directors of Manning & Napier Fund, Inc. and Shareholders of World Opportunities Series:
In our opinion, the accompanying statement of assets and liabilities, including the investment portfolio, and the related statements of operations and of changes in net assets and the financial highlights present fairly, in all material respects, the financial position of the World Opportunities Series (a series of Manning & Napier Fund, Inc., hereafter referred to as the “Series”) at December 31, 2007, and the results of its operations for the year then ended, the changes in its net assets for each of the two years in the period then ended and the financial highlights for each of the five years in the period then ended, in conformity with accounting principles generally accepted in the United States of America. These financial statements and financial highlights (hereafter referred to as “financial statements”) are the responsibility of the Series’ management; our responsibility is to express an opinion on these financial statements based on our audits. We conducted our audits of these financial statements in accordance with the standards of the Public Company Accounting Oversight Board (United States). Those standards require that we plan and perform the audit to obtain reasonable assurance about whether the financial statements are free of material misstatement. An audit includes examining, on a test basis, evidence supporting the amounts and disclosures in the financial statements, assessing the accounting principles used and significant estimates made by management, and evaluating the overall financial statement presentation. We believe that our audits, which included confirmation of securities at December 31, 2007 by correspondence with the custodian, provide a reasonable basis for our opinion.

Columbus, Ohio
February 20, 2008
Supplemental Tax Information (unaudited)
For federal income tax purposes, the Series designates for the current fiscal year $6,568,987 or, if different, the maximum amount allowable under the tax law as qualified dividend income.
Pursuant to Section 852 of the Internal Revenue Code, as amended, the Series hereby designates $39,681,153 as capital gains for its taxable year ended December 31, 2007.
Renewal of Investment Advisory Agreements (unaudited)
During the period covered by this shareholder report, the Board of Directors (the “Board”) of Manning & Napier Fund, Inc. (the “Fund”) considered approval of two separate investment advisory agreements with Manning & Napier Advisors, Inc. (the “Advisor”):
| | • | | At a meeting held on August 30, 2007, the Board approved a new investment advisory agreement between the Fund and the Advisor (the “New Investment Advisory Agreement”) and recommended that the New Investment Advisory Agreement be submitted to shareholders for approval. Shareholders approved the New Investment Advisory Agreement at a meeting held on December 17, 2007. |
| | • | | At a meeting held on November 12, 2007, the Board approved the continuation of the then-current investment advisory agreement between the Fund and the Advisor (the “Current Investment Advisory Agreement”), which was to be superseded by the New Investment Advisory Agreement upon its approval by the Fund’s shareholders. The continuation of the Current Investment Advisory Agreement was necessary as a result of the delay in obtaining the number of votes necessary to convene the shareholder meeting and approve the New Investment Advisory Agreement with respect to all investment portfolios of the Fund (the “Series”). |
Consideration of New Investment Advisory Agreement:
In response to recent regulatory and compliance initiatives promulgated by the SEC over the past year, the Fund engaged in a comprehensive review of all material aspects of the Fund’s operations, including the Fund’s Current Investment Advisory Agreement. As a result of its review, the Board determined that the Current Investment Advisory Agreement should be amended for the purpose of modernizing the form of the agreement and to include additional provisions in the agreement that are customarily included in investment advisory agreements between registered investment companies and their investment advisors, but which are not included in the Current Investment Advisory Agreement. Accordingly, at the Board meeting on November 16, 2006, representatives of the Advisor presented to the Board proposed changes to the Current Investment Advisory Agreement in order to address the Board’s request to update and modernize the Current Investment Advisory Agreement. As a result of the discussions between the Board and representatives of the Advisor at the November 2006 Board meeting, the Board determined to formally consider the approval of a new investment advisory agreement between the Fund and the Advisor, which would incorporate the changes proposed at the November 2006 Board meeting, at its in-person Board meeting in August 2007.
At an in-person meeting held on August 30, 2007, the Board considered the approval of the New Investment Advisory Agreement between the Fund and the Advisor. Based on the information it received at the meeting and the November 16, 2006 Board meeting, the Board approved the New Investment Advisory Agreement subject to its further approval by the Fund’s shareholders. Representatives of the Advisor attended the meeting and presented additional oral and written information to the Board to assist the Board in its considerations. At the meeting, the Board concluded it was reasonable to take into account the conclusions the Board made when considering and evaluating the renewal of the Current Investment Advisory Agreement (the “2006 Annual Review”), which occurred at the November 16, 2006 in-person Board meeting, as part of its considerations to approve the New Investment Advisory Agreement. The discussion immediately below outlines the materials and information presented to the Board in connection with the Board’s 2006 Annual Review of the Current Investment Advisory Agreement and the conclusions made by the Directors when determining to continue the Current Investment Advisory Agreement for an additional one-year period.
Renewal of Investment Advisory Agreements (unaudited)
In connection with its review and deliberations, the Board considered the following factors and reached a conclusion with respect to such factors.
| | • | | The Board considered the services provided by the Advisor under the Current Investment Advisory Agreement including, among others: deciding what securities to purchase and sell for each Series; arranging for the purchase and sale of such securities by placing orders with broker-dealers; administering the affairs of the Fund (including the books and records of the Fund not maintained by third party service providers such as the custodian or sub-transfer agent); arranging for the insurance coverage for the Fund; and supervising the preparation of tax returns, SEC filings (including registration statements) and reports to shareholders for the Fund. The Board also considered the nature and quality of such services provided under the Current Investment Advisory Agreement in light of the Advisor’s services provided to the Fund for 21 years. The Board discussed the quality of these services with representatives from the Advisor and concluded that the Advisor was performing its services to the Fund required under the Current Investment Advisory Agreement in a reasonable manner. |
| | • | | The Board considered the investment performance of the various Series of the Fund. The investment performance for each Series was reviewed on a cumulative basis since inception and on a one year basis. In addition, annualized performance for the following time periods was considered: inception, three year, five year, ten year, and current market cycle. A market cycle includes periods of both rising and falling markets. Returns for established benchmark indices for each Series were provided for each time period. The Board noted that all the Series were competitive against their respective benchmark indices over all time periods noted above through September 30, 2006. In addition, the Board considered at the meeting (and considers on a quarterly basis) a peer group performance analysis consisting of Morningstar universes of mutual funds with similar investment objectives. The Board discussed the performance with representatives from the Advisor and concluded that the investment performance of each of the Fund’s Series was reasonable based on the Fund’s actual performance and comparative performance, especially performance over the current market cycle. |
| | • | | The Board considered the costs of the Advisor’s services and the profits of the Advisor as they relate to the Advisor’s services to the Fund under the Current Investment Advisory Agreement. In reviewing the Advisor’s costs and profits, the Board discussed the Advisor’s revenues generated from the Fund (on both an actual and adjusted basis) and its expenses associated with providing the services under the Current Investment Advisory Agreement. In addition, the Board reviewed the Advisor’s expenses associated with Fund activities outside of the Current Investment Advisory Agreement (such as expense reimbursements pursuant to expense caps and payments made by the Advisor to third party platforms on which shares of the Fund are available for purchase). It was noted by representatives of the Advisor that 6 of the 18 active Series of the Fund are currently experiencing expenses above the capped expense ratios. After discussing the above costs and profits, the Board concluded that the Advisor’s profitability relating to its services provided under the Current Investment Advisory Agreement was reasonable. |
| | • | | The Board considered the fees and expenses of the various Series of the Fund. The Advisor presented the advisory fees and total expenses for each Series, including the |
Renewal of Investment Advisory Agreements (unaudited)
| | advisory fee adjusted for any expense waivers or reimbursements (either contractual or voluntary) paid by the Advisor. The advisory fees and expense ratios of each Series were compared to an average (on both a mean and median basis) of similar funds as disclosed on the Morningstar database. Representatives of the Advisor discussed with the Board the levels of its advisory fee for each Series of the Fund and as compared to the median and mean advisory fees for similar funds as listed on Morningstar. Expense ratios for every Series, except the High Yield Bond Series, are currently below the median and mean for similar funds as listed on Morningstar. Based on their review of the information provided, the Board concluded that the fees and expenses of each Series of the Fund were reasonable on a comparative basis. |
| | • | | The Board also considered the other benefits the Advisor derives from its relationship with the Fund. Such other benefits include certain research products provided by soft dollars. Given the level of soft dollar transactions involving the Fund, the Board concluded that these additional benefits to the Advisor were reasonable. |
| | • | | In addition to the factors described above, the Board considered the Advisor’s personnel, investment strategies, policies and procedures relating to compliance with personal securities transactions, and reputation, expertise and resources in domestic and foreign financial markets. The Board concluded that these factors support the conclusion that the Advisor performs its services in a reasonable manner. |
| | • | | The Board did not consider economies of scale at this time because of the multiple uses of the Fund (for the Advisor’s discretionary investment account clients in addition to direct investors), the current profitability of the Advisor’s services to the Fund under the Current Investment Advisory Agreement, and the overall size of the Fund complex. |
Based on the Board’s deliberations and their evaluation of the information described above, the Board, including a majority of Directors that are “not interested” as defined in the Investment Company Act of 1940 (the “1940 Act”), concluded that the compensation under the Current Investment Advisory Agreement was fair and reasonable in light of the services and expenses and such other matters as the Directors considered to be relevant in the exercise of their reasonable judgment. Accordingly, the Board approved the renewal of the Current Investment Advisory Agreement for another year. In the course of their deliberations, the Directors did not identify any particular information that was all important or controlling.
As stated above, at the August 30, 2007 Board meeting, the Board concluded it was reasonable to take into account the conclusions set forth above when determining whether to approve the New Investment Advisory Agreement. The Board’s conclusion in this regard was based on the fact that the New Investment Advisory Agreement is identical to the Current Investment Advisory Agreement except for certain provisions of the Agreement which have been updated and modernized in response to the Board’s specific request. Further, the Board’s conclusion in this regard was based on the fact that the New Investment Advisory Agreement does not change either the investment advisory fees payable by the Fund to the Advisor or the day-to-day investment management services the Advisor provides to the Fund.
In addition to the conclusions formed with respect to the 2006 Annual Review, the Directors considered specific information at the August 30, 2007 Board meeting concerning the additional provisions included in the New Investment Advisory Agreement. The Directors considered the fact that these additional provisions are designed to (i) address and memorialize certain standard practices and regulatory requirements of mutual funds and their investment advisors; (ii) further
Renewal of Investment Advisory Agreements (unaudited)
delineate the duties and obligations of the Fund and the Advisor; (iii) modernize the agreement to reflect current industry practice and applicable law; and (iv) generally improve the overall quality of the agreement. The Board further considered the fact that the New Investment Advisory Agreement does not alter the actual day-to-day investment management services provided by the Advisor to each Series of the Fund, and the investment advisory fee rate paid to the Advisor under the New Investment Advisory Agreement for a Series is the same as the fee rate paid by the Series under the Current Investment Advisory Agreement.
Based on its evaluation of the information and the conclusions with respect thereto at its meetings on November 16, 2006 and August 30, 2007, the Board unanimously concluded that: (a) the terms of the New Investment Advisory Agreement were fair and reasonable; (b) the approval of the New Investment Advisory Agreement would be in the best interests of the shareholders and the Fund; and (c) it would recommend the approval of the New Investment Advisory Agreement to shareholders. In the course of their deliberations, the Board did not identify any particular information or factor that was all-important or controlling.
Consideration of Current Investment Advisory Agreement
At a meeting held on November 12, 2007, the Board considered the continuation of the Current Investment Advisory Agreement and simultaneously conducted its annual review of the services provided to the Fund by the Adviser (the “2007 Annual Review”). Representatives of the Advisor attended the meeting and presented additional oral and written information to the Board to assist the Board in its considerations. The discussion immediately below outlines the materials and information presented to the Board in connection with the Board’s 2007 Annual Review of the Current Investment Advisory Agreement and the conclusions made by the Directors when determining to continue the Current Investment Advisory Agreement.
In connection with its review and deliberations, the Board considered the following factors and reached a conclusion with respect to such factors.
| | • | | The Board considered the services provided by the Advisor under the Current Investment Advisory Agreement including, among others: deciding what securities to purchase and sell for each Series; arranging for the purchase and sale of such securities by placing orders with broker-dealers; administering the affairs of the Fund (including the books and records of the Fund not maintained by third party service providers such as the custodian or sub-transfer agent); arranging for the insurance coverage for the Fund; and supervising the preparation of tax returns, SEC filings (including registration statements) and reports to shareholders for the Fund. The Board also considered the nature and quality of such services provided under the Current Investment Advisory Agreement in light of the Advisor’s services provided to the Fund for 21 years. The Board discussed the quality of these services with representatives from the Advisor and concluded that the Advisor was performing its services to the Fund required under the Current Investment Advisory Agreement in a reasonable manner. |
| | • | | The Board considered the investment performance of the various Series of the Fund. The investment performance for each Series was reviewed on a cumulative basis since inception and on a one year basis. In addition, annualized performance for the following time periods was considered: inception, three year, five year, ten year, and current market cycle. A market cycle includes periods of both rising and falling markets. Returns for established benchmark indices for each Series were provided for |
Renewal of Investment Advisory Agreements (unaudited)
| | each time period. The Board noted that all the Series were competitive against their respective benchmark indices over all time periods noted above through September 30, 2007. In addition, the Board considered at the meeting (and considers on a quarterly basis) a peer group performance analysis consisting of Morningstar universes of mutual funds with similar investment objectives. The Board discussed the performance with representatives from the Advisor and concluded that the investment performance of each of the Fund’s Series was reasonable based on the Fund’s actual performance and comparative performance, especially performance over the current market cycle. |
| | • | | The Board considered the costs of the Advisor’s services and the profits of the Advisor as they relate to the Advisor’s services to the Fund under the Current Investment Advisory Agreement. In reviewing the Advisor’s costs and profits, the Board discussed the Advisor’s revenues generated from the Fund (on both an actual and adjusted basis) and its expenses associated with providing the services under the Current Investment Advisory Agreement. In addition, the Board reviewed the Advisor’s expenses associated with Fund activities outside of the Current Investment Advisory Agreement (such as expense reimbursements pursuant to expense caps and payments made by the Advisor to third party platforms on which shares of the Fund are available for purchase). It was noted by representatives of the Advisor that 4 of the 18 active Series of the Fund are currently experiencing expenses above the capped expense ratios. After discussing the above costs and profits, the Board concluded that the Advisor’s profitability relating to its services provided under the Current Investment Advisory Agreement was reasonable. |
| | • | | The Board considered the fees and expenses of the various Series of the Fund. The Advisor presented the advisory fees and total expenses for each Series, including the advisory fee adjusted for any expense waivers or reimbursements (either contractual or voluntary) paid by the Advisor. The advisory fees and expense ratios of each Series were compared to an average (on both a mean and median basis) of similar funds as disclosed on the Morningstar database. Representatives of the Advisor discussed with the Board the levels of its advisory fee for each Series of the Fund and as compared to the median and mean advisory fees for similar funds as listed on Morningstar. Expense ratios for every Series, except the High Yield Bond Series and Global Fixed Income Series, are currently below the median and mean for similar funds as listed on Morningstar. Based on their review of the information provided, the Board concluded that the fees and expenses of each Series of the Fund were reasonable on a comparative basis. |
| | • | | The Board also considered the other benefits the Advisor derives from its relationship with the Fund. Such other benefits include certain research products provided by soft dollars. Given the level of soft dollar transactions involving the Fund, the Board concluded that these additional benefits to the Advisor were reasonable. |
| | • | | In addition to the factors described above, the Board considered the Advisor’s personnel, investment strategies, policies and procedures relating to compliance with personal securities transactions, and reputation, expertise and resources in domestic and foreign financial markets. The Board concluded that these factors support the conclusion that the Advisor performs its services in a reasonable manner. |
Renewal of Investment Advisory Agreements (unaudited)
| | • | | The Board did not consider economies of scale at this time because of the multiple uses of the Fund (for the Advisor’s discretionary investment account clients in addition to direct investors), the current profitability of the Advisor’s services to the Fund under the Current Investment Advisory Agreement, and the overall size of the Fund complex. |
Based on the Board’s deliberations and their evaluation of the information described above, the Board, including a majority of Directors that are not “interested persons” as defined in the 1940 Act, concluded that the compensation under the Current Investment Advisory Agreement was fair and reasonable in light of the services and expenses and such other matters as the Directors considered to be relevant in the exercise of their reasonable judgment. Accordingly, the Board approved the renewal of the Current Investment Advisory Agreement. In the course of their deliberations, the Directors did not identify any particular information that was all important or controlling.
Proxy Voting Results (unaudited)
A special meeting of the shareholders of Manning & Napier Fund, Inc. was held on November 12, 2007. The number of votes necessary to conduct the meeting and approve each proposal was obtained, and the results of the votes of shareholders on proposals before them are listed below:
PROPOSAL 1:
Election of Directors.
| | | | |
| | | Number of Shares
voted for | | Number of Shares
withheld |
B. Reuben Auspitz | | 215,932,354.541 | | 15,898,685.154 |
Stephen B. Ashley | | 215,960,751.214 | | 15,870,288.481 |
Peter L. Faber | | 217,504,725.208 | | 14,326,314.487 |
Harris H. Rusitzky | | 215,924,013.609 | | 15,907,026.086 |
An adjourned special meeting of the shareholders of Manning & Napier Fund, Inc. was held on December 17, 2007. The number of votes necessary to conduct the meeting and approve each proposal was obtained, and the results of the votes of shareholders on proposals before them are listed below:
PROPOSAL 2:
To approve the investment advisory agreement between Manning & Napier Advisors, Inc. and Manning & Napier Fund, Inc.
| | |
| | | Number of
shares voted |
For | | 29,282,594.725 |
Against | | 166,457.000 |
Abstain (includes broker non-votes) | | 12,341,388.457 |
PROPOSAL 3:
Eliminating, amending, or reclassifying certain fundamental investment policies or restrictions.
Proposal 3.A.i. To approve changes to the fundamental policy regarding borrowing money.
| | |
| | | Number of
shares voted |
For | | 28,984,790.005 |
Against | | 388,650.720 |
Abstain (includes broker non-votes) | | 12,416,999.457 |
Proposal 3.A.ii. To approve changes to the fundamental policy regarding percentage of assets invested in any one industry.
| | |
| | | Number of
shares voted |
For | | 29,023,283.315 |
Against | | 349,793.410 |
Abstain (includes broker non-votes) | | 12,417,363.457 |
Proxy Voting Results (unaudited)
Proposal 3.A.iii. To approve changes to the fundamental policy regarding loans.
| | |
| | | Number of
shares voted |
For | | 29,029,398.315 |
Against | | 348,222.410 |
Abstain (includes broker non-votes) | | 12,412,819.457 |
Proposal 3.A.iv. To approve changes to the fundamental policy regarding issuance of senior securities or pledging its assets.
| | |
| | | Number of
shares voted |
For | | 28,599,898.901 |
Against | | 772,819.824 |
Abstain (includes broker non-votes) | | 12,417,721.457 |
Proposal 3.A.v. To approve changes to the fundamental policy regarding buying or selling of commodities or commodity contracts.
| | |
| | | Number of
shares voted |
For | | 28,620,150.211 |
Against | | 749,179.514 |
Abstain (includes broker non-votes) | | 12,421,110.457 |
Proposal 3.A.vi. To approve changes to the fundamental policy regarding underwriting of securities.
| | |
| | | Number of
shares voted |
For | | 29,042,879.315 |
Against | | 327,730.410 |
Abstain (includes broker non-votes) | | 12,419,830.457 |
Proposal 3.A.vii. To approve changes to the fundamental policy regarding diversification.
| | |
| | | Number of
shares voted |
For | | 29,022,348.315 |
Against | | 352,486.410 |
Abstain (includes broker non-votes) | | 12,415,605.457 |
Proposal 3.B.i. To approve changes to the policy/restriction regarding investment of its total net assets in securities of issuers that are restricted from being sold to the public without registration.
| | |
| | | Number of
shares voted |
For | | 28,626,334.371 |
Against | | 727,391.832 |
Abstain (includes broker non-votes) | | 12,436,713.979 |
Proxy Voting Results (unaudited)
Proposal 3.B.ii. To approve changes to the policy/restriction regarding the purchase of securities on margin.
| | |
| | | Number of
shares voted |
For | | 28,184,732.001 |
Against | | 1,152,822.724 |
Abstain (includes broker non-votes) | | 12,452,885.457 |
Proposal 3.B.iii. To approve changes to the policy/restriction regarding acquiring securities of other investment companies.
| | |
| | | Number of
shares voted |
For | | 28,607,592.371 |
Against | | 768,422.354 |
Abstain (includes broker non-votes) | | 12,414,425.457 |
Proposal 3.B.iv. To approve changes to the policy/restriction regarding warrants.
| | |
| | | Number of
shares voted |
For | | 28,191,811.479 |
Against | | 1,166,952.246 |
Abstain (includes broker non-votes) | | 12,431,676.457 |
Proposal 3.B.v. To approve changes to the policy/restriction regarding options on securities and with respect to stock index and currency futures and related options.
| | |
| | | Number of
shares voted |
For | | 28,188,359.789 |
Against | | 1,176,870.936 |
Abstain (includes broker non-votes) | | 12,425,209.457 |
Proposal 3.B.vi. To approve changes to the policy/restriction regarding hedging and derivative transactions.
| | |
| | | Number of
shares voted |
For | | 28,229,203.479 |
Against | | 1,176,515.246 |
Abstain (includes broker non-votes) | | 12,384,721.457 |
Proposal 3.B.vii. To approve changes to the policy/restriction regarding the purchase of foreign securities.
| | |
| | | Number of
shares voted |
For | | 28,271,797.789 |
Against | | 1,082,031.414 |
Abstain (includes broker non-votes) | | 12,436,610.979 |
Proxy Voting Results (unaudited)
Proposal 3.C.i. To approve changes to the policy/restriction regarding investment for the purpose of exercising control over management.
| | |
| | | Number of
shares voted |
For | | 28,599,128.423 |
Against | | 769,177.302 |
Abstain (includes broker non-votes) | | 12,422,134.457 |
Proposal 3.C.iii. To approve changes to the policy/restriction regarding short sales or short positions.
| | |
| | | Number of
shares voted |
For | | 28,596,621.423 |
Against | | 767,995.302 |
Abstain (includes broker non-votes) | | 12,425,823.457 |
Proposal 3.C.iv. To approve changes to the policy/restriction regarding participation in a joint or joint and several basis in trading account in securities.
| | |
| | | Number of
shares voted |
For | | 28,988,188.844 |
Against | | 380,275.881 |
Abstain (includes broker non-votes) | | 12,421,975.457 |
Proposal 3.C.v. To approve changes to the policy/restriction regarding investment in oil, gas or other mineral exploration or development programs.
| | |
| | | Number of
shares voted |
For | | 28,614,191.894 |
Against | | 754,705.831 |
Abstain (includes broker non-votes) | | 12,421,542.457 |
Proposal 3.C.vi. To approve changes to the policy/restriction regarding officers and directors of the Fund.
| | |
| | | Number of
shares voted |
For | | 28,551,277.901 |
Against | | 817,504.824 |
Abstain (includes broker non-votes) | | 12,421,657.457 |
Proposal 3.C.vii. To approve changes to the policy/restriction regarding investing in any company with less than three years continuous operation.
| | |
| | | Number of
shares voted |
For | | 28,969,517.322 |
Against | | 441,622.403 |
Abstain (includes broker non-votes) | | 12,379,300.457 |
Directors’ and Officers’ Information (unaudited)
The Statement of Additional Information provides additional information about the Fund’s directors and officers and can be obtained without charge by calling 1-800-466-3863, at www.manningnapieradvisors.com, or on the EDGAR Database on the SEC Internet web site (http://www.sec.gov). The following chart shows certain information about the Fund’s officers and directors, including their principal occupations during the last five years. Unless specific dates are provided, the individuals have held the listed positions for longer than five years.
INTERESTED DIRECTOR/OFFICER
| | |
| Name: | | B. Reuben Auspitz* |
| Address: | | 290 Woodcliff Drive |
| | Fairport, NY 14450 |
| Age: | | 60 |
| Current Position(s) Held with Fund: | | Principal Executive Officer, President, Chairman & Director |
| Term of Office1 & Length of Time Served: | | Indefinite - Director since 1984; Vice President 1984 - 2003; President since 2004; Principal Executive Officer since 2002 |
| Principal Occupation(s) During Past 5 Years: | | Executive Vice President; Co-Executive Director; Executive Group Member**; Chief Compliance Officer since 2004 - Manning & Napier Advisors, Inc. President; Director - Manning & Napier Investor Services, Inc. Holds or has held one or more of the following titles for various subsidiaries and affiliates: President, Vice President, Director, Chairman, Treasurer, Chief Compliance Officer or Member. |
| Number of Portfolios Overseen within Fund Complex: | | 27 |
| Other Directorships Held Outside Fund Complex: | | N/A |
| |
| INDEPENDENT DIRECTORS | | |
| |
| Name: | | Stephen B. Ashley |
| Address: | | 290 Woodcliff Drive Fairport, NY 14450 |
| Age: | | 67 |
| Current Position(s) Held with Fund: | | Director, Audit Committee Member, Governance & Nominating Committee Member |
| Term of Office & Length of Time Served: | | Indefinite - Since 1996 |
| Principal Occupation(s) During Past 5 Years: | | Chairman, Director, President & Chief Executive Officer, The Ashley Group (property management and investment) |
| Number of Portfolios Overseen within Fund Complex: | | 27 |
| Other Directorships Held Outside Fund Complex: | | The Ashley Group |
| | | Fannie Mae |
| Name: | | Peter L. Faber |
| Address: | | 290 Woodcliff Drive Fairport, NY 14450 |
| Age: | | 68 |
| Current Position(s) Held with Fund: | | Director, Governance & Nominating Committee Member |
| Term of Office & Length of Time Served: | | Indefinite - Since 1987 |
| Principal Occupation(s) During Past 5 Years: | | Senior Counsel, McDermott, Will & Emery LLP (law firm) |
| Number of Portfolios Overseen within Fund Complex: | | 27 |
| Other Directorships Held Outside Fund Complex: | | Partnership for New York City, Inc. New York Collegium Boston Early Music Festival |
| Name: | | Harris H. Rusitzky |
| Address: | | 290 Woodcliff Drive Fairport, NY 14450 |
| Age: | | 72 |
| Current Position(s) Held with Fund: | | Director, Audit Committee Member, Governance & Nominating Committee Member |
| Term of Office & Length of Time Served: | | Indefinite - Since 1985 |
| Principal Occupation(s) During Past 5 Years: | | President, The Greening Group (business consultants); Partner, The Restaurant Group (restaurants) |
| Number of Portfolios Overseen within Fund Complex: | | 27 |
| Other Directorships Held Outside Fund Complex: | | N/A |
Directors’ and Officers’ Information (unaudited)
| | |
| Name: | | Paul A. Brooke |
| Address: | | 290 Woodcliff Drive |
| | Fairport, NY 14450 |
| Age: | | 62 |
| Current Position(s) Held with Fund: | | Director, Audit Committee Member, Governance & Nominating Committee Member |
| Term of Office & Length of Time Served: | | Indefinite - Since 2007 |
| Principal Occupation(s) During Past 5 Years: | | Chairman & CEO, Alsius Corp. (investments); Managing Member, PMSV Holdings LLC (investments) |
| Number of Portfolios Overseen within Fund Complex: | | 27 |
| Other Directorships Held Outside Fund Complex: | | Incyte Corp. ViroPharma, Inc. HLTH Corp. Cheyne Capital International MPM Bio-equities GMP Companies HoustonPharma |
| |
| OFFICERS | | |
| |
| Name: | | Jeffrey S. Coons, Ph.D., CFA |
| Address: | | 290 Woodcliff Drive Fairport, NY 14450 |
| Age: | | 44 |
| Current Position(s) Held with Fund: | | Vice President |
| Term of Office1 & Length of Time Served: | | Since 2004 |
| Principal Occupation(s) During Past 5 Years: | | Co-Director of Research since 2002 & Executive Group Member**, Manning & Napier Advisors, Inc. Holds one or more of the following titles for various subsidiaries and affiliates: President, Director, Treasurer or Senior Trust Officer. |
| Number of Portfolios Overseen within Fund Complex: | | 27 |
| Other Directorships Held Outside Fund Complex: | | N/A |
| Name: | | Christine Glavin |
| Address: | | 290 Woodcliff Drive Fairport, NY 14450 |
| Age: | | 41 |
| Current Position(s) Held with Fund: | | Principal Financial Officer, Chief Financial Officer |
| Term of Office1 & Length of Time Served: | | Principal Financial Officer since 2002; Chief Financial Officer since 2001 |
| Principal Occupation(s) During Past 5 Years: | | Fund Reporting Manager, Manning & Napier Advisors, Inc. |
| Number of Portfolios Overseen within Fund Complex: | | 27 |
| Other Directorships Held Outside Fund Complex: | | N/A |
| Name: | | Jodi L. Hedberg |
| Address: | | 290 Woodcliff Drive Fairport, NY 14450 |
| Age: | | 40 |
| Current Position(s) Held with Fund: | | Corporate Secretary, Chief Compliance Officer, Anti-Money Laundering Compliance Officer |
| Term of Office1 & Length of Time Served: | | Corporate Secretary since 1997; Chief Compliance Officer since 2004 |
| Principal Occupation(s) During Past 5 Years: | | Director of Compliance, Manning & Napier Advisors, Inc. and affiliates; Corporate Secretary, Manning & Napier Investor Services, Inc. since 2006 |
| Number of Portfolios Overseen within Fund Complex: | | 27 |
| Other Directorships Held Outside Fund Complex: | | N/A |
*Interested Director, within the meaning of the Investment Company Act of 1940 by reason of his position with the Fund’s investment advisor and distributor. Mr. Auspitz serves as the Executive Vice President and Director, Manning & Napier Advisors, Inc. and President and Director, Manning & Napier Investor Services, Inc., the Fund’s distributor.
**The Executive Group performs the duties of the Office of the Chief Executive of Manning & Napier Advisors, Inc.
1The term of office for President, Vice President, Chief Financial Officer, and Corporate Secretary is one year and until their respective successors are chosen and qualified. All other officers’ terms are indefinite.
(THISPAGEINTENTIONALLYLEFTBLANK)
(THISPAGEINTENTIONALLYLEFTBLANK)
Literature Requests (unaudited)
Proxy Voting Policies and Procedures
A description of the policies and procedures that the Fund uses to determine how to vote proxies relating to portfolio securities is available, without charge, upon request:
| | |
By phone | | 1-800-466-3863 |
On the Securities and Exchange Commission’s (SEC) web site | | http://www.sec.gov |
Proxy Voting Record
Information regarding how the Fund voted proxies relating to portfolio securities during the most recent 12-month period ended June 30th is available, without charge, upon request:
| | |
By phone | | 1-800-466-3863 |
On the SEC’s web site | | http://www.sec.gov |
Quarterly Portfolio Holdings
The Series’ complete schedule of portfolio holdings for the 1st and 3rd quarters of each fiscal year are provided on Form N-Q, and are available, without charge, upon request:
| | |
By phone | | 1-800-466-3863 |
On the SEC’s web site | | http://www.sec.gov |
The Series’ Form N-Q may be reviewed and copied at the SEC’s Public Reference Room in Washington, D.C. Information on the operation of the Public Reference Room may be obtained by calling 1-800-SEC-0330.
Prospectus and Statement of Additional Information (SAI)
The prospectus and SAI provide additional information about each Series, including charges, expenses and risks. These documents are available, without charge, upon request:
| | |
By phone | | 1-800-466-3863 |
On the SEC’s web site | | http://www.sec.gov |
On the Advisor’s web site | | http://www.manningnapieradvisors.com |
Additional information available at www.manningnapieradvisors.com
1. Fund Holdings - Month-End
2. Fund Holdings - Quarter-End
3. Shareholder Report - Annual
4. Shareholder Report - Semi-Annual
Manning & Napier Fund, Inc.
| | | | |
| TECHNOLOGY SERIES | | | | | Annual Report - December 31, 2007 |

Management Discussion and Analysis (unaudited)
Dear Shareholders:
The Technology Series once again outperformed its primary benchmark, the Standard & Poor’s (“S&P”) 500 Information Technology Index, in 2007. For the year, the Series posted a return of 22.55% as compared to the 16.31% return experienced by the S&P 500 Information Technology Index. The result marked the seventh consecutive year that the Technology Series has outperformed its benchmark.
For most of 2007, the Information Technology (“IT”) sector appeared to be viewed by the investment community as being insulated from the broader economic concerns related to housing and the credit markets. In addition, we generally witnessed solid technology demand trends supported by healthy corporate balance sheets, favorable international economic conditions, a weak U.S. dollar, and several industry-specific product cycles/secular trends. Towards the end of the year, we sold or trimmed some of the Series’ holdings in response to technology valuations becoming extended in many instances. As 2007 drew to a close, however, volatility increased as investors questioned technology’s safe-haven status. More specifically, investors began to question the resiliency of corporate IT budgets, particularly within the Financial Services sector, given the depths of the housing crisis and the continued logjam in the credit markets.
We believe that 2007 favored bottom-up stock picking, with valuations and conditions offering us the opportunity to profit from our long-term views on several important themes in the technology industry such as increasing demand for storage and security solutions, communications convergence, and the proliferation of web-based and componentized software.
Within the Information Technology sector, we primarily concentrate on 1) industries enjoying secular (that is, non-cyclical) tailwinds and 2) high quality companies that fit our investment strategies, operate with sound business models, and are building sustainable competitive advantages. During the year, the Series had relatively large positions in the software and communications equipment sectors while it had limited exposure to the semiconductor/semiconductor capital equipment, telecommunications service, and electronic equipment sectors.
The software industry was the largest weighting during the year for the Series, despite the pare-down of some investments as they appreciated. We believe the industry is experiencing a wave of disruptive innovation that is yielding unique investment opportunities. Specifically, the software business is moving away from a one-size-fits-all rigid product approach to one that offers more flexible computing either through incremental product components or by accessing entire software applications over the Internet. In addition, software innovation is leading to enhanced productivity and intelligence within the enterprise, new applications and capabilities, and lower costs and greater efficiency. Within software, our investments focused on a variety of areas, including on-demand, enterprise applications, telecom billing, infrastructure software, speech recognition, security, and digital media software.
Communications equipment was the second-largest industry sector in the Series for 2007; our weighting was reduced slightly over the course of the year on account of the sale of investments that had appreciated. However, we believe we are at the early stages of a secular migration from networks based on legacy protocols to networks based on internet protocol, or IP. Richer forms of content soaking up bandwidth, combined with compelling new technologies like voice and video over IP, wireless local area networks, mobile computing/data access, wireless email, and intelligent switches, are serving as catalysts to spend for both carriers and enterprises.
The performance of the Series was also aided by selective exposure to the enterprise hardware, internet software, and electronic equipment sectors where our differing perspectives with respect to the growth of storage, online advertising, global positioning systems (GPS), and liquid crystal display (LCD) panels, respectively, helped the Series realize strong appreciation. Our investments in these areas were in proven market leaders who are demonstrably taking share and strengthening their competitive positioning.
Management Discussion and Analysis (unaudited)
The Series had a relatively small position in the Telecommunication Services segment on account of our assessment of unfavorable industry conditions such as technology substitution, increased competition, and high levels of market penetration in the developed markets, along with historically high valuations in emerging markets despite lower subscriber penetration levels. Despite these factors, the industry registered strong performance for 2007, as investors focused on the relatively high cash yields offered by many of the developed market stocks in this industry compared to other potential investment opportunities. In addition, this sector was also aided by strong emerging market performance overall as valuations rose in these regions. A lack of exposure to this segment hurt the performance of the Series on a relative basis - however, the Series benefited when this industry’s performance deteriorated towards the end of the year.
The Series also had limited exposure to the semiconductor and semiconductor capital equipment segments. Despite healthy demand conditions and generally favorable inventory levels in the broader technology industry, the semiconductor sector underperformed the broader IT benchmark given over-capacity in the key memory segments of the industry as well as difficult pricing dynamics in several other sub-segments. Furthermore, performance in the semiconductor capital equipment sector also remained subdued given investors recognition of the pending capital expenditure cutbacks at memory semiconductor manufacturers and some foundries. Given the underperformance of these industries, performance was helped by the decision to underweight these sectors.
Finally, we continued to complement our investments in the areas mentioned above with select investments in other traditional technology-based industries, as well as with companies operating in non-traditional technology sectors that are beneficiaries of technology innovation and are using it to further enhance their competitive positions in their respective industries. For example, investments that met our investment criteria in 2007 included companies that operated in industries such as leisure, industrials, chemicals, and commercial services.
We appreciate your business and wish you all the very best in the coming year.
Sincerely,
Manning & Napier Advisors, Inc.
Performance Update as of December 31, 2007 (unaudited)
| | | | | | | | |
| | | Average Annual Total Returns
As of December 31, 2007 | | |
| | | One
Year | | Five
Year | | Since
Inception1 | | |
Manning & Napier Fund, Inc. - Technology Series2 | | 22.55% | | 27.88% | | 3.35% | | |
Standard & Poor’s (S&P) 500 Total Return Index3 | | 5.51% | | 12.84% | | 1.57% | | |
Standard & Poor’s (S&P) 500 Information Technology Index3 | | 16.31% | | 13.97% | | -8.35% | | |
The following graph compares the value of a $10,000 investment in the Manning & Napier Fund, Inc. - Technology Series from its current activation1 (8/8/00) to present (12/31/07) to the S&P 500 Total Return Index and the S&P 500 Information Technology Index.
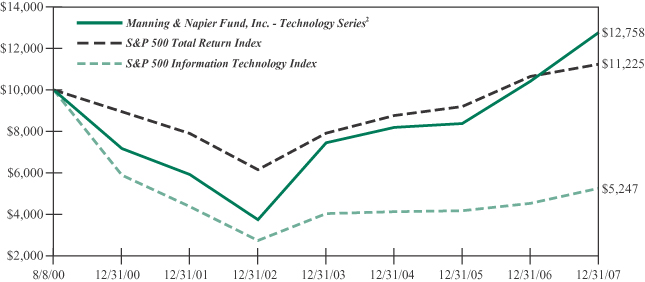
1Performance numbers for the Series and Indices are calculated from August 8, 2000, the Series’ current activation date.
2The Series’ performance does not reflect the deduction of taxes that a shareholder would pay on fund distributions or the redemption of shares. The Series’ performance is historical and may not be indicative of future results. The performance returns shown are inclusive of the net expense ratio of the Series. For the year ended December 31, 2007, this net expense ratio was 1.13%. The gross expense ratio, which does not account for any voluntary or contractual waivers currently in effect, was 1.13% for the year ended December 31, 2007.
3The S&P 500 Total Return Index is an unmanaged capitalization-weighted measure of 500 widely held common stocks listed on the New York Stock Exchange, American Stock Exchange and the Over-the-Counter market. The S&P 500 Information Technology Index, a sub-index of the S&P 500 Total Return Index, includes the stocks of companies involved in the business of technology related products and services. Both Indices’ returns assume daily reinvestment of dividends and, unlike Series returns, do not reflect any fees or expenses.
Shareholder Expense Example (unaudited)
As a shareholder of the Series, you may incur two types of costs: (1) transaction costs, including potential wire charges on redemptions and (2) ongoing costs, including management fees and other Series expenses. This example is intended to help you understand your ongoing costs (in dollars) of investing in the Series and to compare these costs with the ongoing costs of investing in other mutual funds.
The example is based on an investment of $1,000 invested at the beginning of the period and held for the entire period (July 1, 2007 to December 31, 2007).
Actual Expenses
The first line of the table below provides information about actual account values and actual expenses. You may use the information in this line, together with the amount you invested, to estimate the expenses that you paid over the period. Simply divide your account value by $1,000 (for example, an $8,600 account value divided by $1,000 = 8.6), then multiply the result by the number in the first line under the heading entitled “Expenses Paid During Period” to estimate the expenses you paid on your account during this period.
Hypothetical Example for Comparison Purposes
The second line of the table below provides information about hypothetical account values and hypothetical expenses based on the Series’ actual expense ratio and an assumed rate of return of 5% per year before expenses, which is not the Series’ actual return. The hypothetical account values and expenses may not be used to estimate the actual ending account balance or expenses you paid during the period. You may use this information to compare the ongoing costs of investing in the Series and other funds. To do so, compare this 5% hypothetical example with the 5% hypothetical examples that appear in the shareholder reports of the other funds.
Please note that the expenses shown in the table are meant to highlight your ongoing costs only and do not reflect any transaction costs, such as potential wire charges on redemptions. Therefore, the second line of the table is useful in comparing ongoing costs only, and will not help you determine the relative total costs of owning different funds. In addition, if these transaction costs were included, your costs would have been higher.
| | | | | | | | | |
| | | Beginning
Account Value
7/1/07 | | Ending
Account Value
12/31/07 | | Expenses Paid
During Period*
7/1/07-12/31/07 |
Actual | | $ | 1,000.00 | | $ | 1,064.90 | | $ | 5.88 |
Hypothetical
(5% return before expenses) | | $ | 1,000.00 | | $ | 1,019.51 | | $ | 5.75 |
*Expenses are equal to the Series’ annualized expense ratio (for the six-month period) of 1.13%, multiplied by the average account value over the period, multiplied by 184/365 (to reflect the one-half year period). Expenses are based on the most recent fiscal half year; therefore, the expense ratio stated above may differ from the expense ratio stated in the financial highlights, which is based on one year data.
Portfolio Composition as of December 31, 2007 (unaudited)
Sector Allocation1
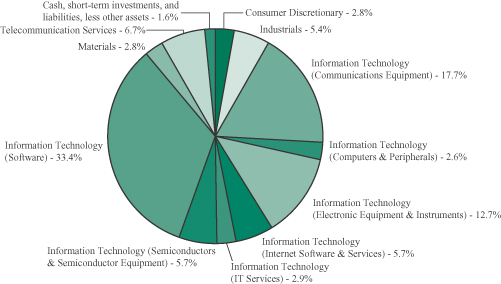
1As a percentage of net assets.
Top Ten Stock Holdings2
| | |
Salesforce.com, Inc. | | 4.8% |
Aladdin Knowledge Systems Ltd. (Israel) | | 4.8% |
Hutchison Telecommunications International Ltd. - ADR (Hong Kong) | | 4.1% |
LG. Philips LCD Co. Ltd. - ADR (South Korea) | | 3.8% |
TIBCO Software, Inc. | | 3.8% |
| | |
Alcatel-Lucent - ADR (France) | | 3.6% |
Utimaco Safeware AG (Germany) | | 3.6% |
SAP AG - ADR (Germany) | | 3.6% |
Cisco Systems, Inc. | | 3.5% |
LoJack Corp. | | 3.2% |
2As a percentage of total investments.
Investment Portfolio - December 31, 2007
| | | | | |
| | | Shares | | Value
(Note 2) |
| | | | | |
| | |
COMMON STOCKS - 98.4% | | | | | |
| | |
Consumer Discretionary - 2.8% | | | | | |
Hotels, Restaurants & Leisure - 2.8% | | | | | |
International Game Technology | | 147,000 | | $ | 6,457,710 |
| | | | | |
| | |
Industrials - 5.4% | | | | | |
Commercial Services & Supplies - 2.9% | | | | | |
Pitney Bowes, Inc. | | 176,000 | | | 6,695,040 |
| | | | | |
Industrial Conglomerates - 2.5% | | | | | |
3M Co. | | 67,500 | | | 5,691,600 |
| | | | | |
Total Industrials | | | | | 12,386,640 |
| | | | | |
| | |
Information Technology - 80.7% | | | | | |
Communications Equipment - 17.7% | | | | | |
Alcatel-Lucent - ADR (France) (Note 7) | | 1,143,000 | | | 8,366,760 |
BigBand Networks, Inc.* | | 1,180,000 | | | 6,065,200 |
Blue Coat Systems, Inc.* | | 154,000 | | | 5,061,980 |
Cisco Systems, Inc.* | | 300,000 | | | 8,121,000 |
Harris Stratex Networks, Inc. - Class A* | | 388,000 | | | 6,479,600 |
Juniper Networks, Inc.* | | 188,000 | | | 6,241,600 |
| | | | | |
| | | | | 40,336,140 |
| | | | | |
Computers & Peripherals - 2.6% | | | | | |
Rackable Systems, Inc.* | | 597,000 | | | 5,970,000 |
| | | | | |
Electronic Equipment & Instruments - 12.7% | | | | | |
AU Optronics Corp. - ADR (Taiwan) (Note 7) | | 349,000 | | | 6,700,800 |
LG. Philips LCD Co. Ltd. - ADR* (South
Korea) (Note 7) | | 340,000 | | | 8,833,200 |
LoJack Corp.* | | 432,000 | | | 7,261,920 |
Planar Systems, Inc.* | | 962,000 | | | 6,156,800 |
| | | | | |
| | | | | 28,952,720 |
| | | | | |
Internet Software & Services - 5.7% | | | | | |
Google, Inc. - Class A* | | 10,200 | | | 7,053,096 |
iPass, Inc.* | | 1,476,000 | | | 5,992,560 |
| | | | | |
| | | | | 13,045,656 |
| | | | | |
IT Services - 2.9% | | | | | |
RightNow Technologies, Inc.* | | 411,000 | | | 6,514,350 |
| | | | | |
Semiconductors & Semiconductor Equipment - 5.7% | | | |
Netlogic Microsystems, Inc.* | | 207,000 | | | 6,665,400 |
Trident Microsystems, Inc.* | | 947,000 | | | 6,212,320 |
| | | | | |
| | | | | 12,877,720 |
| | | | | |
| | |
| The accompanying notes are an integral part of the financial statements. | | 6 |
Investment Portfolio - December 31, 2007
| | | | | | | |
| | | Shares/
Principal Amount | | Value
(Note 2) | |
| | | | | | | |
| | |
COMMON STOCKS (continued) | | | | | | | |
| | |
Information Technology (continued) | | | | | | | |
Software - 33.4% | | | | | | | |
Aladdin Knowledge Systems Ltd.* (Israel)
(Note 7) | | | 420,000 | | $ | 10,974,600 | |
Amdocs Ltd.* (Guernsey) (Note 7) | | | 208,000 | | | 7,169,760 | |
Borland Software Corp.* | | | 2,360,000 | | | 7,103,600 | |
Microsoft Corp. | | | 201,000 | | | 7,155,600 | |
Salesforce.com, Inc.* | | | 177,000 | | | 11,096,130 | |
SAP AG - ADR (Germany) (Note 7) | | | 162,000 | | | 8,270,100 | |
Sonic Solutions* | | | 692,000 | | | 7,189,880 | |
TIBCO Software, Inc.* | | | 1,087,000 | | | 8,772,090 | |
Utimaco Safeware AG (Germany) (Note 7) | | | 589,000 | | | 8,309,236 | |
| | | | | | | |
| | | | | | 76,040,996 | |
| | | | | | | |
Total Information Technology | | | | | | 183,737,582 | |
| | | | | | | |
Materials - 2.8% | | | | | | | |
Chemicals - 2.8% | | | | | | | |
NITTO DENKO Corp. (Japan) (Note 7) | | | 120,000 | | | 6,359,893 | |
| | | | | | | |
Telecommunication Services - 6.7% | | | | | | | |
Diversified Telecommunication Services - 2.6% | | | | | | | |
Telus Corp. (Canada) (Note 7) | | | 122,000 | | | 5,887,720 | |
| | | | | | | |
Wireless Telecommunication Services - 4.1% | | | | | | | |
Hutchison Telecommunications International Ltd. - ADR (Hong Kong) (Note 7) | | | 411,000 | | | 9,309,150 | |
| | | | | | | |
Total Telecommunication Services | | | | | | 15,196,870 | |
| | | | | | | |
TOTAL COMMON STOCKS
(Identified Cost $207,050,596) | | | | | | 224,138,695 | |
| | | | | | | |
| | |
SHORT-TERM INVESTMENTS - 2.5% | | | | | | | |
Dreyfus Treasury Cash Management - Institutional Shares | | | 2,682,490 | | | 2,682,490 | |
Federal Home Loan Bank Discount Note, 1/7/2008 | | $ | 3,000,000 | | | 2,997,544 | |
| | | | | | | |
TOTAL SHORT-TERM INVESTMENTS
(Identified Cost $5,680,365) | | | | | | 5,680,034 | |
| | | | | | | |
TOTAL INVESTMENTS - 100.9%
(Identified Cost $212,730,961) | | | | | | 229,818,729 | |
| | |
LIABILITIES, LESS OTHER ASSETS - (0.9%) | | | | | | (2,140,083 | ) |
| | | | | | | |
NET ASSETS - 100% | | | | | $ | 227,678,646 | |
| | | | | | | |
*Non-income producing security
ADR - American Depository Receipt
| | |
| 7 | | The accompanying notes are an integral part of the financial statements. |
Statement of Assets and Liabilities
December 31, 2007
| | | | |
ASSETS: | | | | |
| | | | |
| |
Investments, at value (identified cost $212,730,961) (Note 2) | | $ | 229,818,729 | |
Receivable for fund shares sold | | | 619,128 | |
Dividends receivable | | | 88,262 | |
Foreign tax reclaims receivable | | | 8,832 | |
| | | | |
TOTAL ASSETS | | | 230,534,951 | |
| | | | |
| LIABILITIES: | | | | |
| |
Accrued management fees (Note 3) | | | 190,618 | |
Accrued fund accounting and transfer agent fees (Note 3) | | | 12,818 | |
Accrued Chief Compliance Officer service fees (Note 3) | | | 714 | |
Payable for securities purchased | | | 2,478,100 | |
Payable for fund shares repurchased | | | 124,429 | |
Audit fees payable | | | 30,453 | |
Other payables and accrued expenses | | | 19,173 | |
| | | | |
TOTAL LIABILITIES | | | 2,856,305 | |
| | | | |
TOTAL NET ASSETS | | $ | 227,678,646 | |
| | | | |
NET ASSETS CONSIST OF: | | | | |
| |
Capital stock | | $ | 201,711 | |
Additional paid-in-capital | | | 207,554,633 | |
Accumulated net investment loss | | | (708 | ) |
Accumulated net realized gain on investments, foreign currency and other assets and liabilities | | | 2,835,353 | |
Net unrealized appreciation on investments and other assets and liabilities | | | 17,087,657 | |
| | | | |
TOTAL NET ASSETS | | $ | 227,678,646 | |
| | | | |
NET ASSET VALUE, OFFERING PRICE AND REDEMPTION PRICE PER SHARE ($227,678,646/20,171,078 shares) | | $ | 11.29 | |
| | | | |
| | |
| The accompanying notes are an integral part of the financial statements. | | 8 |
Statement of Operations
For the Year Ended December 31, 2007
| | | | |
INVESTMENT INCOME: | | | | |
| | | | |
| |
Dividends (net of foreign tax withheld, $34,400) | | $ | 719,461 | |
Interest | | | 482,680 | |
| | | | |
Total Investment Income | | | 1,202,141 | |
| | | | |
| EXPENSES: | | | | |
| |
Management fees (Note 3) | | | 2,010,127 | |
Fund accounting and transfer agent fees (Note 3) | | | 131,858 | |
Directors’ fees (Note 3) | | | 7,789 | |
Chief Compliance Officer service fees (Note 3) | | | 6,100 | |
Custodian fees | | | 19,300 | |
Miscellaneous | | | 92,637 | |
| | | | |
Total Expenses | | | 2,267,811 | |
| | | | |
NET INVESTMENT LOSS | | | (1,065,670 | ) |
| | | | |
| REALIZED AND UNREALIZED GAIN (LOSS) ON INVESTMENTS: | | | | |
| |
Net realized gain (loss) on - | | | | |
Investments | | | 39,492,167 | |
Foreign currency and other assets and liabilities | | | (15,446 | ) |
| | | | |
| | | 39,476,721 | |
| | | | |
| |
Net change in unrealized appreciation on - | | | | |
Investments | | | 1,288,986 | |
Foreign currency and other assets and liabilities | | | (111 | ) |
| | | | |
| | | 1,288,875 | |
| | | | |
| |
NET REALIZED AND UNREALIZED GAIN (LOSS) ON
INVESTMENTS | | | 40,765,596 | |
| | | | |
NET INCREASE IN NET ASSETS RESULTING FROM
OPERATIONS | | $ | 39,699,926 | |
| | | | |
| | |
| 9 | | The accompanying notes are an integral part of the financial statements. |
Statements of Changes in Net Assets
| | | | | | | | |
| | | For the
Year Ended
12/31/07 | | | For the
Year Ended
12/31/06 | |
| | | | | | | | |
| INCREASE (DECREASE) IN NET ASSETS: | | | | | | | | |
| | |
| OPERATIONS: | | | | | | | | |
| | |
Net investment loss | | $ | (1,065,670 | ) | | $ | (197,990 | ) |
Net realized gain on investments and foreign currency | | | 39,476,721 | | | | 16,097,774 | |
Net change in unrealized appreciation on investments | | | 1,288,875 | | | | 14,064,805 | |
| | | | | | | | |
Net increase from operations | | | 39,699,926 | | | | 29,964,589 | |
| | | | | | | | |
| DISTRIBUTIONS TO SHAREHOLDERS (Note 9): | | | | | | | | |
| | |
From net realized gain on investments | | | (24,934,190 | ) | | | — | |
| | | | | | | | |
| CAPITAL STOCK ISSUED AND REPURCHASED: | | | | | | | | |
| | |
Net increase from capital share transactions (Note 5) | | | 45,660,620 | | | | 26,632,096 | |
| | | | | | | | |
Net increase in net assets | | | 60,426,356 | | | | 56,596,685 | |
| | |
| NET ASSETS: | | | | | | | | |
| | |
Beginning of year | | | 167,252,290 | | | | 110,655,605 | |
| | | | | | | | |
End of year (including undistributed net investment loss of $708 and $0, respectively) | | $ | 227,678,646 | | | $ | 167,252,290 | |
| | | | | | | | |
| | |
| The accompanying notes are an integral part of the financial statements. | | 10 |
Financial Highlights
| | | | | | | | | | |
| | | For the Years Ended |
| | | 12/31/07 | | 12/31/06 | | 12/31/05 | | 12/31/04 | | 12/31/03 |
| | | | | | | | | | |
| | | | | | | | | | |
| Per share data (for a share outstanding throughout each year): | | | | | | | | | | |
Net asset value - Beginning of year | | $10.41 | | $8.37 | | $8.19 | | $7.44 | | $3.73 |
| | | | | | | | | | |
Income (loss) from investment operations: | | | | | | | | | | |
Net investment loss | | (0.05) | | (0.01) | | (0.03) | | (0.04)1 | | (0.03) |
Net realized and unrealized gain on investments | | 2.34 | | 2.05 | | 0.21 | | 0.79 | | 3.74 |
| | | | | | | | | | |
Total from investment operations | | 2.29 | | 2.04 | | 0.18 | | 0.75 | | 3.71 |
| | | | | | | | | | |
Less distributions to shareholders: | | | | | | | | | | |
From net realized gain on investments | | (1.41) | | — | | — | | — | | — |
| | | | | | | | | | |
Net asset value - End of year | | $11.29 | | $10.41 | | $8.37 | | $8.19 | | $7.44 |
| | | | | | | | | | |
Total return2 | | 22.55% | | 24.37% | | 2.20% | | 10.08% | | 99.46% |
Ratios (to average net assets)/Supplemental Data: | | | | | | | | | | |
Expenses* | | 1.13% | | 1.16% | | 1.20% | | 1.20% | | 1.20% |
Net investment loss | | (0.53%) | | (0.14%) | | (0.48%) | | (0.52%) | | (0.58%) |
Portfolio turnover | | 79% | | 83% | | 116% | | 50% | | 83% |
Net assets - End of year (000’s omitted) | | $227,679 | | $167,252 | | $110,656 | | $63,321 | | $20,032 |
| | | | | | | | | | |
|
*The investment advisor did not impose all of its management fee in some years. If these expenses had been incurred by the Series, the expense ratio (to average net assets) would have been increased as follows: |
| | N/A | | N/A | | 0.03% | | 0.16% | | 0.81% |
1Calculated based on average shares outstanding during the year.
2Represents aggregate total return for the year indicated, and assumes reinvestment of all distributions. Total return would have been lower had certain expenses not been waived during certain years.
| | |
| 11 | | The accompanying notes are an integral part of the financial statements. |
Notes to Financial Statements
Technology Series (the “Series”) is a no-load non-diversified series of Manning & Napier Fund, Inc. (the “Fund”). The Fund is organized in Maryland and is registered under the Investment Company Act of 1940, as amended, as an open-end management investment company.
The Series’ investment objective is to provide long-term growth by investing principally in the common stocks of companies in technology-based industries.
The Fund’s Advisor is Manning & Napier Advisors, Inc. (the “Advisor”). On August 8, 2000, the Series resumed sales of shares to advisory clients and employees of the Advisor and its affiliates. The Series resumed offering shares directly to investors on May 18, 2004, as it had done previously from time to time.
The total authorized capital stock of the Fund consists of 5.0 billion shares of common stock each having a par value of $0.01. As of December 31, 2007, 3.33 billion shares have been designated in total among 27 series, of which 100 million have been designated as Technology Series Class A common stock.
| 2. | SIGNIFICANT ACCOUNTING POLICIES |
Security Valuation
Portfolio securities, including domestic equities, foreign equities, exchange-traded funds and options, listed on an exchange other than the NASDAQ National Market System are valued at the latest quoted sales price of the exchange on which the security is primarily traded. Securities not traded on valuation date or securities not listed on an exchange are valued at the latest quoted bid price provided by the Fund’s pricing service. Securities listed on the NASDAQ National Market System are valued in accordance with the NASDAQ Official Closing Price.
Securities for which representative valuations or prices are not available from the Fund’s pricing service may be valued at fair value. Due to the inherent uncertainty of valuations of such securities, the fair value may differ significantly from the values that would have been used had a ready market for such securities existed. If trading or events occurring after the close of the principal market in which securities are traded are expected to materially affect the value of those securities, then they may be valued at their fair value, taking this trading or these events into account. Fair value is determined in good faith by the Advisor under procedures approved by and under the general supervision and responsibility of the Fund’s Board of Directors (the “Board”).
Short-term investments that mature in sixty days or less are valued at amortized cost, which approximates market value. Investments in open-end investment companies are valued at their net asset value per share on valuation date, with the exception of exchange-traded funds, which are valued at the closing price on the exchange.
Security Transactions, Investment Income and Expenses
Security transactions are accounted for on trade date. Dividend income is recorded on the ex-dividend date, except that if the ex-dividend date has passed, certain dividends from foreign securities are recorded as soon as the Fund is informed of the ex-dividend date. Non-cash dividends, if any, are recorded at the fair market value of the securities received. Interest income, including amortization of premium and accretion of discounts using the effective interest method, is earned from settlement date and accrued daily.
Notes to Financial Statements
| 2. | SIGNIFICANT ACCOUNTING POLICIES (continued) |
Security Transactions, Investment Income and Expenses (continued)
Expenses are recorded on an accrual basis. Most expenses of the Fund can be attributed to a specific series. Expenses which cannot be directly attributed are apportioned among the series in the Fund in such a manner as deemed equitable by the Fund’s Board, taking into consideration, among other things, the nature and type of expense.
The Series uses the identified cost method for determining realized gain or loss on investments for both financial statement and federal income tax reporting purposes.
Foreign Currency Translation
The books and records of the Series are maintained in U.S. dollars. Foreign currencies, investments and other assets and liabilities are translated into U.S. dollars at the current exchange rates. Purchases and sales of investment securities and income and expenses are translated on the respective dates of such transactions. The Series does not isolate realized and unrealized gains and losses attributable to changes in the exchange rates from gains and losses that arise from changes in the market value of investments. Such fluctuations are included with net realized and unrealized gain or loss on investments. Net realized foreign currency gains and losses represent foreign currency gains and losses between trade date and settlement date on securities transactions, gains and losses on disposition of foreign currencies and the difference between the amount of income and foreign withholding taxes recorded on the books of the Series and the amounts actually received or paid.
Federal Taxes
The Series’ policy is to comply with the provisions of the Internal Revenue Code applicable to regulated investment companies. The Series is not subject to federal income tax or excise tax to the extent that the Series distributes to shareholders each year its taxable income, including any net realized gains on investments, in accordance with requirements of the Internal Revenue Code. Accordingly, no provision for federal income tax or excise tax has been made in the financial statements.
On June 29, 2007, the Series adopted Financial Accounting Standards Board Interpretation No. 48 - Accounting for Uncertainty in Income Taxes (“FIN 48”). FIN 48 prescribes the minimum recognition threshold a tax position must meet in connection with accounting for uncertainties in income tax positions taken or expected to be taken by an entity before being measured and recognized in the financial statements. Management has determined that FIN 48 did not have a material impact on the Series’ financial statements. The Series files income tax returns in the U.S. federal jurisdiction, various states and foreign jurisdictions, as required. No income tax returns are currently under investigation. The statute of limitations on the Series’ tax returns remains open for the years ended December 31, 2004 through December 31, 2007.
Additionally, based on the Fund’s understanding of the tax rules and rates related to income, gains and transactions for foreign jurisdictions in which it invests, the Series will provide for foreign taxes, and where appropriate, deferred foreign tax.
Distributions of Income and Gains
Distributions to shareholders of net investment income and net realized gains are made annually. An additional distribution may be necessary to avoid taxation of the Series. Distributions are recorded on the ex-dividend date.
Notes to Financial Statements
| 2. | SIGNIFICANT ACCOUNTING POLICIES (continued) |
Indemnifications
The Fund’s organizational documents provide former and current directors and officers with a limited indemnification against liabilities arising in connection with the performance of their duties to the Fund. In the normal course of business, the Fund may also enter into contracts that provide general indemnifications. The Fund’s maximum exposure under these arrangements is unknown as this would be dependent on future claims that may be made against the Fund. The risk of material loss from such claims is considered remote.
Other
The preparation of financial statements in conformity with accounting principles generally accepted in the United States of America requires management to make estimates and assumptions that affect the reported amounts of assets and liabilities and the disclosure of contingent assets and liabilities at the date of the financial statements and the reported amounts of income and expenses during the reporting period. Actual results could differ from those estimates.
| 3. | TRANSACTIONS WITH AFFILIATES |
The Fund has an Investment Advisory Agreement (the “Agreement”) with the Advisor, for which the Series pays a fee, computed daily and payable monthly, at an annual rate of 1.00% of the Series’ average daily net assets.
Under the Agreement, personnel of the Advisor provide the Series with advice and assistance in the choice of investments and the execution of securities transactions, and otherwise maintain the Series’ organization. The Advisor also provides the Fund with necessary office space and fund administration and support services. The salaries of all officers of the Fund (except a percentage of the Fund’s Chief Compliance Officer’s salary, which is paid by the Fund), and of all Directors who are “affiliated persons” of the Fund, or of the Advisor, and all personnel of the Fund, or of the Advisor, performing services relating to research, statistical and investment activities, are paid by the Advisor. Each “non-affiliated” Director receives an annual stipend, which is allocated among all the active series of the Fund. In addition, these Directors also receive a fee per Board meeting attended for each active series of the Fund plus a fee for each committee meeting attended.
The Advisor has contractually agreed, until at least April 30, 2009, to waive its fee and, if necessary, pay other operating expenses of the Series in order to maintain total direct annual fund operating expenses for the Series at no more than 1.20% of average daily net assets each year. For the year ended December 31, 2007, the Advisor did not waive its management fee or reimburse any expenses of the Series. The Advisor is not eligible to recoup any expenses that have been waived or reimbursed in prior years.
Manning & Napier Investor Services, Inc., a registered broker-dealer affiliate of the Advisor, acts as distributor for the Fund’s shares. The services of Manning & Napier Investor Services, Inc. are provided at no additional cost to the Series.
For fund accounting and transfer agent services, the Fund pays the Advisor an annual fee of 0.11% of the Fund’s average daily net assets up to $900 million, 0.07% of the Fund’s average daily net assets between $900 million and $1.5 billion, and 0.04% of the Fund’s average daily net assets over $1.5 billion. Additionally, certain transaction and account-based fees and out-of-pocket expenses, including charges for reporting relating to the Fund’s compliance program, are charged. Expenses not directly attributable to a series are allocated based on each
Notes to Financial Statements
| 3. | TRANSACTIONS WITH AFFILIATES (continued) |
series’ relative net assets or number of accounts, depending on the expense. The Advisor has an agreement with Citi Fund Services Ohio, Inc. (“Citi”) (formerly BISYS Fund Services Ohio, Inc.) under which Citi serves as sub-accountant and sub-transfer agent.
| 4. | PURCHASES AND SALES OF SECURITIES |
For the year ended December 31, 2007, purchases and sales of securities, other than United States Government securities and short-term securities, were $182,942,454 and $147,978,272, respectively. There were no purchases or sales of United States Government securities.
| 5. | CAPITAL STOCK TRANSACTIONS |
Transactions in shares of Technology Series were:
| | | | | | | | | | | | | | |
| | | For the Year
Ended 12/31/07 | | | For the Year
Ended 12/31/06 | |
| | | Shares | | | Amount | | | Shares | | | Amount | |
| | | | | | | | | | | | | | |
Sold | | 2,875,916 | | | $ | 33,396,379 | | | 3,714,032 | | | $ | 34,727,879 | |
Reinvested | | 2,279,674 | | | | 24,643,270 | | | — | | | | — | |
Repurchased | | (1,048,508 | ) | | | (12,379,029 | ) | | (863,035 | ) | | | (8,095,783 | ) |
| | | | | | | | | | | | | | |
Total | | 4,107,082 | | | $ | 45,660,620 | | | 2,850,997 | | | $ | 26,632,096 | |
| | | | | | | | | | | | | | |
Substantially all of the Series’ shares represent investments by fiduciary accounts over which the Advisor has sole investment discretion.
The Series may trade in financial instruments with off-balance sheet risk in the normal course of its investing activities to assist in managing exposure to various market risks. These financial instruments include written options, forward foreign currency exchange contracts and futures contracts and may involve, to a varying degree, elements of risk in excess of the amounts recognized for financial statement purposes. No such investments were held by the Series on December 31, 2007.
Investing in securities of foreign companies and foreign governments involves special risks and considerations not typically associated with investing in securities of domestic companies and the United States Government. These risks include revaluation of currencies and future adverse political and economic developments. Moreover, securities of foreign companies and foreign governments and their markets may be less liquid and their prices more volatile than those of comparable domestic companies and the United States Government.
The Series may focus its investments in certain related technology industries; hence, the Series may subject itself to a greater degree of risk than a series that is more diversified.
| 9. | FEDERAL INCOME TAX INFORMATION |
The amount and characterization of certain income and capital gains to be distributed are determined in accordance with federal income tax regulations, which may differ from accounting principles generally accepted in the United States of America. These differences are
Notes to Financial Statements
| 9. | FEDERAL INCOME TAX INFORMATION (continued) |
primarily due to differing book and tax treatments in the timing of the recognition of net investment income or gains and losses, including net operating losses, foreign currency gains and losses, Post-October losses and losses deferred due to wash sales. The Series may periodically make reclassifications among its capital accounts to reflect income and gains available for distribution (or available capital loss carryovers) under income tax regulations, without impacting the Series’ net asset value. Any such reclassifications are not reflected in the financial highlights.
The tax character of distributions paid for the year ended December 31, 2007 were as follows:
| | | |
Ordinary income | | $ | 6,784,096 |
Long-term capital gains | | | 18,150,094 |
For the year ended December 31, 2007, the Series elected to defer $708 of capital losses attributable to Post-October losses.
At December 31, 2007, the tax basis components of distributable earnings and the net unrealized appreciation based on identified cost for federal income tax purposes were as follows:
| | | | |
Cost for federal income tax purposes | | $ | 212,730,961 | |
| |
Unrealized appreciation | | $ | 30,174,020 | |
Unrealized depreciation | | | (13,086,252 | ) |
| | | | |
Net unrealized appreciation | | $ | 17,087,768 | |
Undistributed ordinary income | | | 2,835,353 | |
| 10. | RECENT ACCOUNTING PRONOUNCEMENTS |
In September 2006, FASB Statement of Financial Accounting Standards No. 157, Fair Value Measurements (“FAS 157”) was issued, and is effective for fiscal years beginning after November 15, 2007. FAS 157 defines fair value, establishes a framework for measuring fair value, and expands disclosure about fair value measurements. The standard does not expand the use of fair value in any new circumstances, but provides clarification on acceptable fair value methods and applications. At this time, management is evaluating the implications of FAS 157, but it is not expected to materially impact the Series’ financial statements.
Report of Independent Registered Public Accounting Firm
To the Board of Directors of Manning & Napier Fund, Inc. and Shareholders of Technology Series:
In our opinion, the accompanying statement of assets and liabilities, including the investment portfolio, and the related statements of operations and of changes in net assets and the financial highlights present fairly, in all material respects, the financial position of the Technology Series (a series of Manning & Napier Fund, Inc., hereafter referred to as the “Series”) at December 31, 2007, and the results of its operations for the year then ended, the changes in its net assets for each of the two years in the period then ended and the financial highlights for each of the five years in the period then ended, in conformity with accounting principles generally accepted in the United States of America. These financial statements and financial highlights (hereafter referred to as “financial statements”) are the responsibility of the Series’ management; our responsibility is to express an opinion on these financial statements based on our audits. We conducted our audits of these financial statements in accordance with the standards of the Public Company Accounting Oversight Board (United States). Those standards require that we plan and perform the audit to obtain reasonable assurance about whether the financial statements are free of material misstatement. An audit includes examining, on a test basis, evidence supporting the amounts and disclosures in the financial statements, assessing the accounting principles used and significant estimates made by management, and evaluating the overall financial statement presentation. We believe that our audits, which included confirmation of securities at December 31, 2007 by correspondence with the custodian and brokers, provide a reasonable basis for our opinion.

Columbus, Ohio
February 20, 2008
Supplemental Tax Information (unaudited)
For federal income tax purposes, the Series designates for the current fiscal year $285,621 or, if different, the maximum amount allowable under the tax law as qualified dividend income.
Pursuant to Section 852 of the Internal Revenue Code, as amended, the Series hereby designates $18,150,094 as capital gains for its taxable year ended December 31, 2007.
Renewal of Investment Advisory Agreements (unaudited)
During the period covered by this shareholder report, the Board of Directors (the “Board”) of Manning & Napier Fund, Inc. (the “Fund”) considered approval of two separate investment advisory agreements with Manning & Napier Advisors, Inc. (the “Advisor”):
| | • | | At a meeting held on August 30, 2007, the Board approved a new investment advisory agreement between the Fund and the Advisor (the “New Investment Advisory Agreement”) and recommended that the New Investment Advisory Agreement be submitted to shareholders for approval. Shareholders approved the New Investment Advisory Agreement at a meeting held on December 17, 2007. |
| | • | | At a meeting held on November 12, 2007, the Board approved the continuation of the then-current investment advisory agreement between the Fund and the Advisor (the “Current Investment Advisory Agreement”), which was to be superseded by the New Investment Advisory Agreement upon its approval by the Fund’s shareholders. The continuation of the Current Investment Advisory Agreement was necessary as a result of the delay in obtaining the number of votes necessary to convene the shareholder meeting and approve the New Investment Advisory Agreement with respect to all investment portfolios of the Fund (the “Series”). |
Consideration of New Investment Advisory Agreement:
In response to recent regulatory and compliance initiatives promulgated by the SEC over the past year, the Fund engaged in a comprehensive review of all material aspects of the Fund’s operations, including the Fund’s Current Investment Advisory Agreement. As a result of its review, the Board determined that the Current Investment Advisory Agreement should be amended for the purpose of modernizing the form of the agreement and to include additional provisions in the agreement that are customarily included in investment advisory agreements between registered investment companies and their investment advisors, but which are not included in the Current Investment Advisory Agreement. Accordingly, at the Board meeting on November 16, 2006, representatives of the Advisor presented to the Board proposed changes to the Current Investment Advisory Agreement in order to address the Board’s request to update and modernize the Current Investment Advisory Agreement. As a result of the discussions between the Board and representatives of the Advisor at the November 2006 Board meeting, the Board determined to formally consider the approval of a new investment advisory agreement between the Fund and the Advisor, which would incorporate the changes proposed at the November 2006 Board meeting, at its in-person Board meeting in August 2007.
At an in-person meeting held on August 30, 2007, the Board considered the approval of the New Investment Advisory Agreement between the Fund and the Advisor. Based on the information it received at the meeting and the November 16, 2006 Board meeting, the Board approved the New Investment Advisory Agreement subject to its further approval by the Fund’s shareholders. Representatives of the Advisor attended the meeting and presented additional oral and written information to the Board to assist the Board in its considerations. At the meeting, the Board concluded it was reasonable to take into account the conclusions the Board made when considering and evaluating the renewal of the Current Investment Advisory Agreement (the “2006 Annual Review”), which occurred at the November 16, 2006 in-person Board meeting, as part of its considerations to approve the New Investment Advisory Agreement. The discussion immediately below outlines the materials and information presented to the Board in connection with the Board’s 2006 Annual Review of the Current Investment Advisory Agreement and the conclusions made by the Directors when determining to continue the Current Investment Advisory Agreement for an additional one-year period.
Renewal of Investment Advisory Agreements (unaudited)
In connection with its review and deliberations, the Board considered the following factors and reached a conclusion with respect to such factors.
| | • | | The Board considered the services provided by the Advisor under the Current Investment Advisory Agreement including, among others: deciding what securities to purchase and sell for each Series; arranging for the purchase and sale of such securities by placing orders with broker-dealers; administering the affairs of the Fund (including the books and records of the Fund not maintained by third party service providers such as the custodian or sub-transfer agent); arranging for the insurance coverage for the Fund; and supervising the preparation of tax returns, SEC filings (including registration statements) and reports to shareholders for the Fund. The Board also considered the nature and quality of such services provided under the Current Investment Advisory Agreement in light of the Advisor’s services provided to the Fund for 21 years. The Board discussed the quality of these services with representatives from the Advisor and concluded that the Advisor was performing its services to the Fund required under the Current Investment Advisory Agreement in a reasonable manner. |
| | • | | The Board considered the investment performance of the various Series of the Fund. The investment performance for each Series was reviewed on a cumulative basis since inception and on a one year basis. In addition, annualized performance for the following time periods was considered: inception, three year, five year, ten year, and current market cycle. A market cycle includes periods of both rising and falling markets. Returns for established benchmark indices for each Series were provided for each time period. The Board noted that all the Series were competitive against their respective benchmark indices over all time periods noted above through September 30, 2006. In addition, the Board considered at the meeting (and considers on a quarterly basis) a peer group performance analysis consisting of Morningstar universes of mutual funds with similar investment objectives. The Board discussed the performance with representatives from the Advisor and concluded that the investment performance of each of the Fund’s Series was reasonable based on the Fund’s actual performance and comparative performance, especially performance over the current market cycle. |
| | • | | The Board considered the costs of the Advisor’s services and the profits of the Advisor as they relate to the Advisor’s services to the Fund under the Current Investment Advisory Agreement. In reviewing the Advisor’s costs and profits, the Board discussed the Advisor’s revenues generated from the Fund (on both an actual and adjusted basis) and its expenses associated with providing the services under the Current Investment Advisory Agreement. In addition, the Board reviewed the Advisor’s expenses associated with Fund activities outside of the Current Investment Advisory Agreement (such as expense reimbursements pursuant to expense caps and payments made by the Advisor to third party platforms on which shares of the Fund are available for purchase). It was noted by representatives of the Advisor that 6 of the 18 active Series of the Fund are currently experiencing expenses above the capped expense ratios. After discussing the above costs and profits, the Board concluded that the Advisor’s profitability relating to its services provided under the Current Investment Advisory Agreement was reasonable. |
| | • | | The Board considered the fees and expenses of the various Series of the Fund. The Advisor presented the advisory fees and total expenses for each Series, including the |
Renewal of Investment Advisory Agreements (unaudited)
| | advisory fee adjusted for any expense waivers or reimbursements (either contractual or voluntary) paid by the Advisor. The advisory fees and expense ratios of each Series were compared to an average (on both a mean and median basis) of similar funds as disclosed on the Morningstar database. Representatives of the Advisor discussed with the Board the levels of its advisory fee for each Series of the Fund and as compared to the median and mean advisory fees for similar funds as listed on Morningstar. Expense ratios for every Series, except the High Yield Bond Series, are currently below the median and mean for similar funds as listed on Morningstar. Based on their review of the information provided, the Board concluded that the fees and expenses of each Series of the Fund were reasonable on a comparative basis. |
| | • | | The Board also considered the other benefits the Advisor derives from its relationship with the Fund. Such other benefits include certain research products provided by soft dollars. Given the level of soft dollar transactions involving the Fund, the Board concluded that these additional benefits to the Advisor were reasonable. |
| | • | | In addition to the factors described above, the Board considered the Advisor’s personnel, investment strategies, policies and procedures relating to compliance with personal securities transactions, and reputation, expertise and resources in domestic and foreign financial markets. The Board concluded that these factors support the conclusion that the Advisor performs its services in a reasonable manner. |
| | • | | The Board did not consider economies of scale at this time because of the multiple uses of the Fund (for the Advisor’s discretionary investment account clients in addition to direct investors), the current profitability of the Advisor’s services to the Fund under the Current Investment Advisory Agreement, and the overall size of the Fund complex. |
Based on the Board’s deliberations and their evaluation of the information described above, the Board, including a majority of Directors that are “not interested” as defined in the Investment Company Act of 1940 (the “1940 Act”), concluded that the compensation under the Current Investment Advisory Agreement was fair and reasonable in light of the services and expenses and such other matters as the Directors considered to be relevant in the exercise of their reasonable judgment. Accordingly, the Board approved the renewal of the Current Investment Advisory Agreement for another year. In the course of their deliberations, the Directors did not identify any particular information that was all important or controlling.
As stated above, at the August 30, 2007 Board meeting, the Board concluded it was reasonable to take into account the conclusions set forth above when determining whether to approve the New Investment Advisory Agreement. The Board’s conclusion in this regard was based on the fact that the New Investment Advisory Agreement is identical to the Current Investment Advisory Agreement except for certain provisions of the Agreement which have been updated and modernized in response to the Board’s specific request. Further, the Board’s conclusion in this regard was based on the fact that the New Investment Advisory Agreement does not change either the investment advisory fees payable by the Fund to the Advisor or the day-to-day investment management services the Advisor provides to the Fund.
In addition to the conclusions formed with respect to the 2006 Annual Review, the Directors considered specific information at the August 30, 2007 Board meeting concerning the additional provisions included in the New Investment Advisory Agreement. The Directors considered the fact that these additional provisions are designed to (i) address and memorialize certain standard practices and regulatory requirements of mutual funds and their investment advisors; (ii) further
Renewal of Investment Advisory Agreements (unaudited)
delineate the duties and obligations of the Fund and the Advisor; (iii) modernize the agreement to reflect current industry practice and applicable law; and (iv) generally improve the overall quality of the agreement. The Board further considered the fact that the New Investment Advisory Agreement does not alter the actual day-to-day investment management services provided by the Advisor to each Series of the Fund, and the investment advisory fee rate paid to the Advisor under the New Investment Advisory Agreement for a Series is the same as the fee rate paid by the Series under the Current Investment Advisory Agreement.
Based on its evaluation of the information and the conclusions with respect thereto at its meetings on November 16, 2006 and August 30, 2007, the Board unanimously concluded that: (a) the terms of the New Investment Advisory Agreement were fair and reasonable; (b) the approval of the New Investment Advisory Agreement would be in the best interests of the shareholders and the Fund; and (c) it would recommend the approval of the New Investment Advisory Agreement to shareholders. In the course of their deliberations, the Board did not identify any particular information or factor that was all-important or controlling.
Consideration of Current Investment Advisory Agreement
At a meeting held on November 12, 2007, the Board considered the continuation of the Current Investment Advisory Agreement and simultaneously conducted its annual review of the services provided to the Fund by the Adviser (the “2007 Annual Review”). Representatives of the Advisor attended the meeting and presented additional oral and written information to the Board to assist the Board in its considerations. The discussion immediately below outlines the materials and information presented to the Board in connection with the Board’s 2007 Annual Review of the Current Investment Advisory Agreement and the conclusions made by the Directors when determining to continue the Current Investment Advisory Agreement.
In connection with its review and deliberations, the Board considered the following factors and reached a conclusion with respect to such factors.
| | • | | The Board considered the services provided by the Advisor under the Current Investment Advisory Agreement including, among others: deciding what securities to purchase and sell for each Series; arranging for the purchase and sale of such securities by placing orders with broker-dealers; administering the affairs of the Fund (including the books and records of the Fund not maintained by third party service providers such as the custodian or sub-transfer agent); arranging for the insurance coverage for the Fund; and supervising the preparation of tax returns, SEC filings (including registration statements) and reports to shareholders for the Fund. The Board also considered the nature and quality of such services provided under the Current Investment Advisory Agreement in light of the Advisor’s services provided to the Fund for 21 years. The Board discussed the quality of these services with representatives from the Advisor and concluded that the Advisor was performing its services to the Fund required under the Current Investment Advisory Agreement in a reasonable manner. |
| | • | | The Board considered the investment performance of the various Series of the Fund. The investment performance for each Series was reviewed on a cumulative basis since inception and on a one year basis. In addition, annualized performance for the following time periods was considered: inception, three year, five year, ten year, and current market cycle. A market cycle includes periods of both rising and falling markets. Returns for established benchmark indices for each Series were provided for |
Renewal of Investment Advisory Agreements (unaudited)
| | each time period. The Board noted that all the Series were competitive against their respective benchmark indices over all time periods noted above through September 30, 2007. In addition, the Board considered at the meeting (and considers on a quarterly basis) a peer group performance analysis consisting of Morningstar universes of mutual funds with similar investment objectives. The Board discussed the performance with representatives from the Advisor and concluded that the investment performance of each of the Fund’s Series was reasonable based on the Fund’s actual performance and comparative performance, especially performance over the current market cycle. |
| | • | | The Board considered the costs of the Advisor’s services and the profits of the Advisor as they relate to the Advisor’s services to the Fund under the Current Investment Advisory Agreement. In reviewing the Advisor’s costs and profits, the Board discussed the Advisor’s revenues generated from the Fund (on both an actual and adjusted basis) and its expenses associated with providing the services under the Current Investment Advisory Agreement. In addition, the Board reviewed the Advisor’s expenses associated with Fund activities outside of the Current Investment Advisory Agreement (such as expense reimbursements pursuant to expense caps and payments made by the Advisor to third party platforms on which shares of the Fund are available for purchase). It was noted by representatives of the Advisor that 4 of the 18 active Series of the Fund are currently experiencing expenses above the capped expense ratios. After discussing the above costs and profits, the Board concluded that the Advisor’s profitability relating to its services provided under the Current Investment Advisory Agreement was reasonable. |
| | • | | The Board considered the fees and expenses of the various Series of the Fund. The Advisor presented the advisory fees and total expenses for each Series, including the advisory fee adjusted for any expense waivers or reimbursements (either contractual or voluntary) paid by the Advisor. The advisory fees and expense ratios of each Series were compared to an average (on both a mean and median basis) of similar funds as disclosed on the Morningstar database. Representatives of the Advisor discussed with the Board the levels of its advisory fee for each Series of the Fund and as compared to the median and mean advisory fees for similar funds as listed on Morningstar. Expense ratios for every Series, except the High Yield Bond Series and Global Fixed Income Series, are currently below the median and mean for similar funds as listed on Morningstar. Based on their review of the information provided, the Board concluded that the fees and expenses of each Series of the Fund were reasonable on a comparative basis. |
| | • | | The Board also considered the other benefits the Advisor derives from its relationship with the Fund. Such other benefits include certain research products provided by soft dollars. Given the level of soft dollar transactions involving the Fund, the Board concluded that these additional benefits to the Advisor were reasonable. |
| | • | | In addition to the factors described above, the Board considered the Advisor’s personnel, investment strategies, policies and procedures relating to compliance with personal securities transactions, and reputation, expertise and resources in domestic and foreign financial markets. The Board concluded that these factors support the conclusion that the Advisor performs its services in a reasonable manner. |
Renewal of Investment Advisory Agreements (unaudited)
| | • | | The Board did not consider economies of scale at this time because of the multiple uses of the Fund (for the Advisor’s discretionary investment account clients in addition to direct investors), the current profitability of the Advisor’s services to the Fund under the Current Investment Advisory Agreement, and the overall size of the Fund complex. |
Based on the Board’s deliberations and their evaluation of the information described above, the Board, including a majority of Directors that are not “interested persons” as defined in the 1940 Act, concluded that the compensation under the Current Investment Advisory Agreement was fair and reasonable in light of the services and expenses and such other matters as the Directors considered to be relevant in the exercise of their reasonable judgment. Accordingly, the Board approved the renewal of the Current Investment Advisory Agreement. In the course of their deliberations, the Directors did not identify any particular information that was all important or controlling.
Proxy Voting Results (unaudited)
A special meeting of the shareholders of Manning & Napier Fund, Inc. was held on November 12, 2007. The number of votes necessary to conduct the meeting and approve each proposal was obtained, and the results of the votes of shareholders on proposals before them are listed below:
PROPOSAL 1:
Election of Directors.
| | | | |
| | | Number of Shares
voted for | | Number of Shares
withheld |
B. Reuben Auspitz | | 215,932,354.541 | | 15,898,685.154 |
Stephen B. Ashley | | 215,960,751.214 | | 15,870,288.481 |
Peter L. Faber | | 217,504,725.208 | | 14,326,314.487 |
Harris H. Rusitzky | | 215,924,013.609 | | 15,907,026.086 |
PROPOSAL 2:
To approve the investment advisory agreement between Manning & Napier Advisors, Inc. and Manning & Napier Fund, Inc.
| | |
| | | Number of
shares voted |
For | | 12,897,232.730 |
Against | | 0 |
Abstain (includes broker non-votes) | | 42,468.305 |
PROPOSAL 3:
Eliminating, amending, or reclassifying certain fundamental investment policies or restrictions.
Proposal 3.A.i. To approve changes to the fundamental policy regarding borrowing money.
| | |
| | | Number of
shares voted |
For | | 12,897,232.730 |
Against | | 0 |
Abstain (includes broker non-votes) | | 42,468.305 |
Proposal 3.A.ii. To approve changes to the fundamental policy regarding percentage of assets invested in any one industry.
| | |
| | | Number of
shares voted |
For | | 12,897,232.730 |
Against | | 0 |
Abstain (includes broker non-votes) | | 42,468.305 |
Proxy Voting Results (unaudited)
Proposal 3.A.iii. To approve changes to the fundamental policy regarding loans.
| | |
| | | Number of
shares voted |
For | | 12,897,232.730 |
Against | | 0 |
Abstain (includes broker non-votes) | | 42,468.305 |
Proposal 3.A.iv. To approve changes to the fundamental policy regarding issuance of senior securities or pledging its assets.
| | |
| | | Number of
shares voted |
For | | 12,897,232.730 |
Against | | 0 |
Abstain (includes broker non-votes) | | 42,468.305 |
Proposal 3.A.v. To approve changes to the fundamental policy regarding buying or selling of commodities or commodity contracts.
| | |
| | | Number of
shares voted |
For | | 12,897,232.730 |
Against | | 0 |
Abstain (includes broker non-votes) | | 42,468.305 |
Proposal 3.A.vi. To approve changes to the fundamental policy regarding underwriting of securities.
| | |
| | | Number of
shares voted |
For | | 12,897,232.730 |
Against | | 0 |
Abstain (includes broker non-votes) | | 42,468.305 |
Proposal 3.B.i. To approve changes to the policy/restriction regarding investment of its total net assets in securities of issuers that are restricted from being sold to the public without registration.
| | |
| | | Number of
shares voted |
For | | 12,430,342.730 |
Against | | 466,890.000 |
Abstain (includes broker non-votes) | | 42,468.305 |
Proposal 3.B.ii. To approve changes to the policy/restriction regarding the purchase of securities on margin.
| | |
| | | Number of
shares voted |
For | | 12,399,926.730 |
Against | | 497,306.000 |
Abstain (includes broker non-votes) | | 42,468.305 |
Proxy Voting Results (unaudited)
Proposal 3.B.iii. To approve changes to the policy/restriction regarding acquiring securities of other investment companies.
| | |
| | �� | Number of
shares voted |
For | | 12,399,926.730 |
Against | | 497,306.000 |
Abstain (includes broker non-votes) | | 42,468.305 |
Proposal 3.B.iv. To approve changes to the policy/restriction regarding warrants.
| | |
| | | Number of
shares voted |
For | | 12,399,926.730 |
Against | | 497,306.000 |
Abstain (includes broker non-votes) | | 42,468.305 |
Proposal 3.B.v. To approve changes to the policy/restriction regarding options on securities and with respect to stock index and currency futures and related options.
| | |
| | | Number of
shares voted |
For | | 12,399,926.730 |
Against | | 497,306.000 |
Abstain (includes broker non-votes) | | 42,468.305 |
Proposal 3.B.vi. To approve changes to the policy/restriction regarding hedging and derivative transactions.
| | |
| | | Number of
shares voted |
For | | 12,399,926.730 |
Against | | 497,306.000 |
Abstain (includes broker non-votes) | | 42,468.305 |
Proposal 3.B.vii. To approve changes to the policy/restriction regarding the purchase of foreign securities.
| | |
| | | Number of
shares voted |
For | | 12,399,926.730 |
Against | | 497,306.000 |
Abstain (includes broker non-votes) | | 42,468.305 |
Proposal 3.C.i. To approve changes to the policy/restriction regarding investment for the purpose of exercising control over management.
| | |
| | | Number of
shares voted |
For | | 12,866,816.730 |
Against | | 30,416.000 |
Abstain (includes broker non-votes) | | 42,468.305 |
Proxy Voting Results (unaudited)
Proposal 3.C.ii. To approve changes to the policy/restriction regarding the maximum percentage of securities the Series may purchase of any one issuer.
| | |
| | | Number of
shares voted |
For | | 12,897,232.730 |
Against | | 0 |
Abstain (includes broker non-votes) | | 42,468.305 |
Proposal 3.C.iii. To approve changes to the policy/restriction regarding short sales or short positions.
| | |
| | | Number of
shares voted |
For | | 12,897,232.730 |
Against | | 0 |
Abstain (includes broker non-votes) | | 42,468.305 |
Proposal 3.C.iv. To approve changes to the policy/restriction regarding participation in a joint or joint and several basis in trading account in securities.
| | |
| | | Number of
shares voted |
For | | 12,897,232.730 |
Against | | 0 |
Abstain (includes broker non-votes) | | 42,468.305 |
Proposal 3.C.v. To approve changes to the policy/restriction regarding investment in oil, gas or other mineral exploration or development programs.
| | |
| | | Number of
shares voted |
For | | 12,897,232.730 |
Against | | 0 |
Abstain (includes broker non-votes) | | 42,468.305 |
Proposal 3.C.vi. To approve changes to the policy/restriction regarding officers and directors of the Fund.
| | |
| | | Number of
shares voted |
For | | 12,897,232.730 |
Against | | 0 |
Abstain (includes broker non-votes) | | 42,468.305 |
Proposal 3.C.vii. To approve changes to the policy/restriction regarding investing in any company with less than three years continuous operation.
| | |
| | | Number of
shares voted |
For | | 12,897,232.730 |
Against | | 0 |
Abstain (includes broker non-votes) | | 42,468.305 |
Directors’ and Officers’ Information (unaudited)
The Statement of Additional Information provides additional information about the Fund’s directors and officers and can be obtained without charge by calling 1-800-466-3863, at www.manningnapieradvisors.com, or on the EDGAR Database on the SEC Internet web site (http://www.sec.gov). The following chart shows certain information about the Fund’s officers and directors, including their principal occupations during the last five years. Unless specific dates are provided, the individuals have held the listed positions for longer than five years.
INTERESTED DIRECTOR/OFFICER
| | |
| Name: | | B. Reuben Auspitz* |
| Address: | | 290 Woodcliff Drive |
| | Fairport, NY 14450 |
| Age: | | 60 |
| Current Position(s) Held with Fund: | | Principal Executive Officer, President, Chairman & Director |
| Term of Office1 & Length of Time Served: | | Indefinite - Director since 1984; Vice President 1984 - 2003; President since 2004; Principal Executive Officer since 2002 |
| Principal Occupation(s) During Past 5 Years: | | Executive Vice President; Co-Executive Director; Executive Group Member**; Chief Compliance Officer since 2004 - Manning & Napier Advisors, Inc. President; Director - Manning & Napier Investor Services, Inc. Holds or has held one or more of the following titles for various subsidiaries and affiliates: President, Vice President, Director, Chairman, Treasurer, Chief Compliance Officer or Member. |
| Number of Portfolios Overseen within Fund Complex: | | 27 |
| Other Directorships Held Outside Fund Complex: | | N/A |
INDEPENDENT DIRECTORS
| | |
| |
| Name: | | Stephen B. Ashley |
| Address: | | 290 Woodcliff Drive |
| | Fairport, NY 14450 |
| Age: | | 67 |
| Current Position(s) Held with Fund: | | Director, Audit Committee Member, Governance & Nominating Committee Member |
| Term of Office & Length of Time Served: | | Indefinite - Since 1996 |
| Principal Occupation(s) During Past 5 Years: | | Chairman, Director, President & Chief Executive Officer, The Ashley Group (property management and investment) |
| Number of Portfolios Overseen within Fund Complex: | | 27 |
| Other Directorships Held Outside Fund Complex: | | The Ashley Group |
| | | Fannie Mae |
| Name: | | Peter L. Faber |
| Address: | �� | 290 Woodcliff Drive |
| | Fairport, NY 14450 |
| Age: | | 68 |
| Current Position(s) Held with Fund: | | Director, Governance & Nominating Committee Member |
| Term of Office & Length of Time Served: | | Indefinite - Since 1987 |
| Principal Occupation(s) During Past 5 Years: | | Senior Counsel, McDermott, Will & Emery LLP (law firm) |
| Number of Portfolios Overseen within Fund Complex: | | 27 |
| Other Directorships Held Outside Fund Complex: | | Partnership for New York City, Inc. |
| | New York Collegium |
| | | Boston Early Music Festival |
| Name: | | Harris H. Rusitzky |
| Address: | | 290 Woodcliff Drive |
| | Fairport, NY 14450 |
| Age: | | 72 |
| Current Position(s) Held with Fund: | | Director, Audit Committee Member, Governance & Nominating Committee Member |
| Term of Office & Length of Time Served: | | Indefinite - Since 1985 |
| Principal Occupation(s) During Past 5 Years: | | President, The Greening Group (business consultants); Partner, The Restaurant Group (restaurants) |
| Number of Portfolios Overseen within Fund Complex: | | 27 |
| Other Directorships Held Outside Fund Complex: | | N/A |
Directors’ and Officers’ Information (unaudited)
| | |
| Name: | | Paul A. Brooke |
| Address: | | 290 Woodcliff Drive |
| | Fairport, NY 14450 |
| Age: | | 62 |
| Current Position(s) Held with Fund: | | Director, Audit Committee Member, Governance & Nominating Committee Member |
| Term of Office & Length of Time Served: | | Indefinite - Since 2007 |
| Principal Occupation(s) During Past 5 Years: | | Chairman & CEO, Alsius Corp. (investments); Managing Member, PMSV Holdings LLC (investments) |
| Number of Portfolios Overseen within Fund Complex: | | 27 |
| Other Directorships Held Outside Fund Complex: | | Incyte Corp. ViroPharma, Inc. HLTH Corp. Cheyne Capital International MPM Bio-equities GMP Companies HoustonPharma |
OFFICERS
| | |
| |
| Name: | | Jeffrey S. Coons, Ph.D., CFA |
| Address: | | 290 Woodcliff Drive |
| | Fairport, NY 14450 |
| Age: | | 44 |
| Current Position(s) Held with Fund: | | Vice President |
| Term of Office1 & Length of Time Served: | | Since 2004 |
| Principal Occupation(s) During Past 5 Years: | | Co-Director of Research since 2002 & Executive Group Member**, Manning & Napier Advisors, Inc. Holds one or more of the following titles for various subsidiaries and affiliates: President, Director, Treasurer or Senior Trust Officer. |
| Number of Portfolios Overseen within Fund Complex: | | 27 |
| Other Directorships Held Outside Fund Complex: | | N/A |
| Name: | | Christine Glavin |
| Address: | | 290 Woodcliff Drive |
| | Fairport, NY 14450 |
| Age: | | 41 |
| Current Position(s) Held with Fund: | | Principal Financial Officer, Chief Financial Officer |
| Term of Office1 & Length of Time Served: | | Principal Financial Officer since 2002; Chief Financial Officer since 2001 |
| Principal Occupation(s) During Past 5 Years: | | Fund Reporting Manager, Manning & Napier Advisors, Inc. |
| Number of Portfolios Overseen within Fund Complex: | | 27 |
| Other Directorships Held Outside Fund Complex: | | N/A |
| Name: | | Jodi L. Hedberg |
| Address: | | 290 Woodcliff Drive |
| | Fairport, NY 14450 |
| Age: | | 40 |
| Current Position(s) Held with Fund: | | Corporate Secretary, Chief Compliance Officer, Anti-Money Laundering Compliance Officer |
| Term of Office1 & Length of Time Served: | | Corporate Secretary since 1997; Chief Compliance Officer since 2004 |
| Principal Occupation(s) During Past 5 Years: | | Director of Compliance, Manning & Napier Advisors, Inc. and affiliates; Corporate Secretary, Manning & Napier Investor Services, Inc. since 2006 |
| Number of Portfolios Overseen within Fund Complex: | | 27 |
| Other Directorships Held Outside Fund Complex: | | N/A |
*Interested Director, within the meaning of the Investment Company Act of 1940 by reason of his position with the Fund’s investment advisor and distributor. Mr. Auspitz serves as the Executive Vice President and Director, Manning & Napier Advisors, Inc. and President and Director, Manning & Napier Investor Services, Inc., the Fund’s distributor.
**The Executive Group performs the duties of the Office of the Chief Executive of Manning & Napier Advisors, Inc.
1The term of office for President, Vice President, Chief Financial Officer, and Corporate Secretary is one year and until their respective successors are chosen and qualified. All other officers’ terms are indefinite.
Literature Requests (unaudited)
Proxy Voting Policies and Procedures
A description of the policies and procedures that the Fund uses to determine how to vote proxies relating to portfolio securities is available, without charge, upon request:
| | |
By phone | | 1-800-466-3863 |
On the Securities and Exchange Commission’s (SEC) web site | | http://www.sec.gov |
Proxy Voting Record
Information regarding how the Fund voted proxies relating to portfolio securities during the most recent 12-month period ended June 30th is available, without charge, upon request:
| | |
By phone | | 1-800-466-3863 |
On the SEC’s web site | | http://www.sec.gov |
Quarterly Portfolio Holdings
The Series’ complete schedule of portfolio holdings for the 1st and 3rd quarters of each fiscal year are provided on Form N-Q, and are available, without charge, upon request:
| | |
By phone | | 1-800-466-3863 |
On the SEC’s web site | | http://www.sec.gov |
The Series’ Form N-Q may be reviewed and copied at the SEC’s Public Reference Room in Washington, D.C. Information on the operation of the Public Reference Room may be obtained by calling 1-800-SEC-0330.
Prospectus and Statement of Additional Information (SAI)
The prospectus and SAI provide additional information about each Series, including charges, expenses and risks. These documents are available, without charge, upon request:
| | |
By phone | | 1-800-466-3863 |
On the SEC’s web site | | http://www.sec.gov |
On the Advisor’s web site | | http://www.manningnapieradvisors.com |
Additional information available at www.manningnapieradvisors.com
1. Fund Holdings - Month-End
2. Fund Holdings - Quarter-End
3. Shareholder Report - Annual
4. Shareholder Report - Semi-Annual
Manning & Napier Fund, Inc.
| | | | |
SMALL CAP SERIES | | | | | Annual Report - December 31, 2007 |

Management Discussion and Analysis (unaudited)
Dear Shareholders:
The Small Cap Series had a difficult year in 2007, underperforming the Standard & Poor’s (S&P) 500 Total Return Index as well as the Russell 2000® Index, which is the key benchmark measuring the performance of small company stocks. After generating positive returns and leading the Russell 2000® Index through the first three quarters of the year, the Small Cap Series substantially lagged the Index in the fourth quarter and ended the year down 9.32%. The Russell 2000® Index finished 2007 down 1.57% for the year. However, the Series continues to outperform both indices over the current market cycle, which began on April 1, 2000. The Series’ annualized return over the market cycle is 10.02%, compared to 1.43% for the S&P 500 Total Return Index and 5.96% for the Russell 2000® Index. Because a market cycle includes periods of both rising and falling markets, measuring performance over a full cycle provides more perspective than measurements over other time periods.
The Small Cap Series selects stocks for inclusion in the Series through company-by-company analysis. All stocks recommended must adhere to one of three core stock selection strategies and our pricing disciplines, and all recommendations are subject to a peer review by a team of senior analysts. One of these strategies - the Hurdle Rate Strategy - attempts to use industry cycles to buy strong survivors in industries that are experiencing a shakeout. This strategy focuses on industries experiencing periods of weakening demand and low returns with the understanding that these conditions will lead to supply curtailments which will serve to tighten capacity and lead to improved returns when demand recovers. It is not uncommon for this strategy to result in periods of underperformance as the Series begins to invest in these troubled industries before the industries hit bottom.
We began building positions in the airline industry using this strategy in 2004, and our investment proved successful in 2005 and again in 2006. In 2007, airline passenger demand remained strong and capacity utilization was at all time highs, providing the airlines with pricing power for the first time in many years. These conditions prompted us to continue to hold a fairly sizeable basket of airline stocks throughout 2007. Unfortunately, fuel prices increased dramatically during the year, limiting the airlines’ ability to realize the significant economic benefits we expected to arise from the environment of strong demand and tight capacity.
More recently, the Series has been utilizing the Hurdle Rate Strategy to establish and increase positions in areas of weakness such as housing, building materials and natural gas. These decisions hurt performance in the fourth quarter of 2007, though we maintain our positive view of these holdings. The Series also avoided exposure to momentum driven areas such as base metals & mining, which also detracted from performance.
Another area that adversely impacted performance in 2007 was our investment in two cable companies - Charter Communications, Inc. (“Charter”) and Mediacom Communications Corp. Both stocks have been weak amid concern about increasing competition, and Charter has been hit particularly hard given its high debt load. We believe the market is overestimating the potential negative effects from increased competition and underestimating the cable companies’ growth potential, particularly with regard to adoption of the triple-play bundle of voice, video, and internet services. In short, we think the problems that these cable companies began to experience in the second half of 2007 are more a result of cyclical influences rather than competitive pressures and we believe the valuations are particularly compelling at this time.
Management Discussion and Analysis (unaudited)
Many themes that added to outperformance throughout the first three quarters of 2007 remain in place, and we continue to have confidence in them. These include technology themes related to the network infrastructure build-out, the convergence of voice, video and data, and the integration of data storage and security. Other themes include the secular shift towards wellness and prevention and increased adoption of Information Technology in the Health Care area. We continue to have a relatively small position in Financials, and we feel comfortable going into 2008 with an opportunity to add selectively to this area as we find opportunities.
We appreciate your business and wish you all the very best in the coming year.
Sincerely,
Manning & Napier Advisors, Inc.
Performance Update as of December 31, 2007 (unaudited)
| | | | | | | | | | |
| | | Average Annual Total Returns
As of December 31, 2007 | | |
| | | One
Year | | Five
Year | | Ten
Year | | Since
Inception1 | | |
Manning & Napier Fund, Inc. - Small Cap Series2 | | -9.32% | | 15.07% | | 7.80% | | 9.78% | | |
Standard & Poor’s (S&P) 500 Total Return Index3 | | 5.51% | | 12.84% | | 5.91% | | 10.52% | | |
Russell 2000® Index3 | | -1.57% | | 16.25% | | 7.08% | | 10.58% | | |
The following graph compares the value of a $10,000 investment in the Manning & Napier Fund, Inc. - Small Cap Series for the ten years ended December 31, 2007 to the S&P 500 Total Return Index and the Russell 2000® Index.
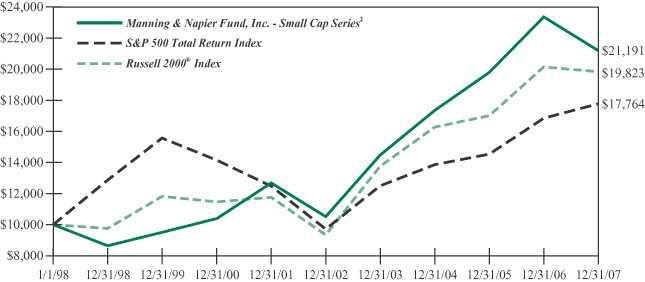
1Performance numbers for the Series and Indices are calculated from April 30, 1992, the Series’ current activation date.
2The Series’ performance does not reflect the deduction of taxes that a shareholder would pay on fund distributions or the redemption of shares. The Series’ performance is historical and may not be indicative of future results. The performance returns shown are inclusive of the net expense ratio of the Series. For the year ended December 31, 2007, this net expense ratio was 1.14%. The gross expense ratio, which does not account for any voluntary or contractual waivers currently in effect, was 1.14% for the year ended December 31, 2007.
3The S&P 500 Total Return Index is an unmanaged capitalization-weighted measure of 500 widely held common stocks listed on the New York Stock Exchange, American Stock Exchange and the Over-the-Counter market. The Index returns assume daily reinvestment of dividends. The Russell 2000® Index is an unmanaged index that consists of 2,000 U.S. small-capitalization stocks. The Index returns are based on a market capitalization-weighted average of relative price changes of the component stocks plus dividends whose reinvestments are compounded daily. Both Indices’ returns, unlike Series returns, do not reflect any fees or expenses.
Shareholder Expense Example (unaudited)
As a shareholder of the Series, you may incur two types of costs: (1) transaction costs, including potential wire charges on redemptions and (2) ongoing costs, including management fees and other Series expenses. This example is intended to help you understand your ongoing costs (in dollars) of investing in the Series and to compare these costs with the ongoing costs of investing in other mutual funds.
The example is based on an investment of $1,000 invested at the beginning of the period and held for the entire period (July 1, 2007 to December 31, 2007).
Actual Expenses
The first line of the table below provides information about actual account values and actual expenses. You may use the information in this line, together with the amount you invested, to estimate the expenses that you paid over the period. Simply divide your account value by $1,000 (for example, an $8,600 account value divided by $1,000 = 8.6), then multiply the result by the number in the first line under the heading entitled “Expenses Paid During Period” to estimate the expenses you paid on your account during this period.
Hypothetical Example for Comparison Purposes
The second line of the table below provides information about hypothetical account values and hypothetical expenses based on the Series’ actual expense ratio and an assumed rate of return of 5% per year before expenses, which is not the Series’ actual return. The hypothetical account values and expenses may not be used to estimate the actual ending account balance or expenses you paid during the period. You may use this information to compare the ongoing costs of investing in the Series and other funds. To do so, compare this 5% hypothetical example with the 5% hypothetical examples that appear in the shareholder reports of the other funds.
Please note that the expenses shown in the table are meant to highlight your ongoing costs only and do not reflect any transaction costs, such as potential wire charges on redemptions. Therefore, the second line of the table is useful in comparing ongoing costs only, and will not help you determine the relative total costs of owning different funds. In addition, if these transaction costs were included, your costs would have been higher.
| | | | | | | | | |
| | | Beginning
Account Value
7/1/07 | | Ending
Account Value
12/31/07 | | Expenses Paid
During Period*
7/1/07-12/31/07 |
Actual | | $ | 1,000.00 | | $ | 838.30 | | $ | 5.33 |
Hypothetical
(5% return before expenses) | | $ | 1,000.00 | | $ | 1,019.41 | | $ | 5.85 |
*Expenses are equal to the Series’ annualized expense ratio (for the six-month period) of 1.15%, multiplied by the average account value over the period, multiplied by 184/365 (to reflect the one-half year period). Expenses are based on the most recent fiscal half year; therefore, the expense ratio stated above may differ from the expense ratio stated in the financial highlights, which is based on one-year data.
Portfolio Composition as of December 31, 2007 (unaudited)
Sector Allocation1
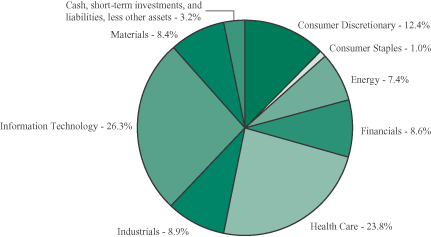
1As a percentage of net assets.
Market Capitalization
| | |
Average | | $983 |
Median | | 610 |
Weighted Average | | 931 |
Top Ten Stock Holdings2
| | |
ev3, Inc. | | 3.1% |
Online Resources Corp. | | 2.9% |
Charter Communications, Inc. - Class A | | 2.8% |
Mediacom Communications Corp. - Class A | | 2.7% |
Calgon Carbon Corp. | | 2.5% |
Tronox, Inc. - Class A | | 2.3% |
Par Pharmaceutical Companies, Inc. | | 2.2% |
LoJack Corp. | | 2.2% |
UbiSoft Entertainment S.A. (France) | | 2.1% |
Borland Software Corp. | | 2.0% |
2As a percentage of total investments.
Investment Portfolio - December 31, 2007
| | | | | |
| | | Shares | | Value
(Note 2) |
| | | | | |
| | |
COMMON STOCKS - 96.8% | | | | | |
| | |
Consumer Discretionary - 12.4% | | | | | |
Auto Components - 1.9% | | | | | |
Hankook Tire Co. Ltd. (South Korea) (Note 8) | | 99,000 | | $ | 1,893,876 |
Tenneco, Inc.* | | 62,970 | | | 1,641,628 |
| | | | | |
| | | | | 3,535,504 |
| | | | | |
Distributors - 0.6% | | | | | |
Building Materials Holding Corp. | | 210,720 | | | 1,165,282 |
| | | | | |
Household Durables - 0.9% | | | | | |
KB Home | | 75,450 | | | 1,629,720 |
| | | | | |
Leisure Equipment & Products - 0.6% | | | | | |
Sturm, Ruger & Co., Inc.* | | 127,210 | | | 1,053,299 |
| | | | | |
Media - 6.2% | | | | | |
Acme Communications, Inc. | | 396,000 | | | 1,081,080 |
Charter Communications, Inc. - Class A* | | 4,523,830 | | | 5,292,881 |
Mediacom Communications Corp. - Class A* | | 1,115,190 | | | 5,118,722 |
| | | | | |
| | | | | 11,492,683 |
| | | | | |
Specialty Retail - 2.2% | | | | | |
Build-A-Bear Workshop, Inc.* | | 147,000 | | | 2,050,650 |
Tractor Supply Co.* | | 56,690 | | | 2,037,439 |
| | | | | |
| | | | | 4,088,089 |
| | | | | |
Total Consumer Discretionary | | | | | 22,964,577 |
| | | | | |
Consumer Staples - 1.0% | | | | | |
Beverages - 0.3% | | | | | |
National Beverage Corp. | | 74,400 | | | 598,176 |
| | | | | |
Food Products - 0.7% | | | | | |
Lancaster Colony Corp. | | 12,200 | | | 484,340 |
Tootsie Roll Industries, Inc. | | 30,553 | | | 837,763 |
| | | | | |
| | | | | 1,322,103 |
| | | | | |
Total Consumer Staples | | | | | 1,920,279 |
| | | | | |
Energy - 7.4% | | | | | |
Energy Equipment & Services - 2.9% | | | | | |
Calfrac Well Services Ltd. (Canada) (Note 8) | | 141,250 | | | 2,522,373 |
Trican Well Service Ltd. (Canada) (Note 8) | | 147,940 | | | 2,883,233 |
| | | | | |
| | | | | 5,405,606 |
| | | | | |
Oil, Gas & Consumable Fuels - 4.5% | | | | | |
Edge Petroleum Corp.* | | 601,190 | | | 3,565,057 |
Evergreen Energy, Inc.* | | 390,120 | | | 869,968 |
| | |
| The accompanying notes are an integral part of the financial statements. | | 6 |
Investment Portfolio - December 31, 2007
| | | | | |
| | | Shares | | Value
(Note 2) |
| | | | | |
| | |
COMMON STOCKS (continued) | | | | | |
| | |
Energy (continued) | | | | | |
Oil, Gas & Consumable Fuels (continued) | | | | | |
Forest Oil Corp.* | | 55,000 | | $ | 2,796,200 |
Mariner Energy, Inc.* | | 44,511 | | | 1,018,412 |
| | | | | |
| | | | | 8,249,637 |
| | | | | |
Total Energy | | | | | 13,655,243 |
| | | | | |
Financials - 8.6% | | | | | |
Commercial Banks - 5.0% | | | | | |
The Bancorp, Inc.* | | 111,570 | | | 1,501,732 |
Boston Private Financial Holdings, Inc. | | 92,830 | | | 2,513,836 |
Citizens & Northern Corp. | | 24,661 | | | 431,571 |
National Bankshares, Inc. | | 26,000 | | | 444,600 |
Potomac Bancshares, Inc. | | 28,592 | | | 348,822 |
TCF Financial Corp. | | 96,280 | | | 1,726,300 |
Tower Bancorp, Inc. | | 8,825 | | | 362,708 |
Wilmington Trust Corp. | | 56,940 | | | 2,004,288 |
| | | | | |
| | | | | 9,333,857 |
| | | | | |
Consumer Finance - 1.6% | | | | | |
Nelnet, Inc. - Class A | | 225,940 | | | 2,871,697 |
| | | | | |
Insurance - 1.4% | | | | | |
LandAmerica Financial Group, Inc. | | 77,910 | | | 2,606,090 |
| | | | | |
Real Estate Management & Development - 0.6% | | | | | |
Rodobens Negocios Imobiliarios S.A. (Brazil) (Note 8) | | 85,100 | | | 1,011,729 |
| | | | | |
Total Financials | | | | | 15,823,373 |
| | | | | |
Health Care - 23.8% | | | | | |
Biotechnology - 1.8% | | | | | |
Medarex, Inc.* | | 77,550 | | | 808,071 |
Senomyx, Inc.* | | 327,405 | | | 2,452,263 |
| | | | | |
| | | | | 3,260,334 |
| | | | | |
Health Care Equipment & Supplies - 9.8% | | | | | |
The Cooper Companies, Inc. | | 92,460 | | | 3,513,480 |
ev3, Inc.* | | 454,188 | | | 5,772,729 |
Inverness Medical Innovations, Inc.* | | 26,830 | | | 1,507,309 |
OraSure Technologies, Inc.* | | 418,430 | | | 3,719,843 |
SonoSite, Inc.* | | 66,280 | | | 2,231,648 |
Wright Medical Group, Inc.* | | 45,510 | | | 1,327,527 |
| | | | | |
| | | | | 18,072,536 |
| | | | | |
Health Care Providers & Services - 2.1% | | | | | |
AMN Healthcare Services, Inc.* | | 100,000 | | | 1,717,000 |
| | |
| 7 | | The accompanying notes are an integral part of the financial statements. |
Investment Portfolio - December 31, 2007
| | | | | |
| | | Shares | | Value
(Note 2) |
| | | | | |
| | |
COMMON STOCKS (continued) | | | | | |
| | |
Health Care (continued) | | | | | |
Health Care Providers & Services (continued) | | | | | |
Cross Country Healthcare, Inc.* | | 152,000 | | $ | 2,164,480 |
| | | | | |
| | | | | 3,881,480 |
| | | | | |
Health Care Technology - 3.4% | | | | | |
Allscripts Healthcare Solutions, Inc* | | 108,710 | | | 2,111,148 |
AMICAS, Inc.* | | 628,000 | | | 1,670,480 |
Eclipsys Corp.* | | 101,380 | | | 2,565,928 |
| | | | | |
| | | | | 6,347,556 |
| | | | | |
Life Sciences Tools & Services - 3.4% | | | | | |
Affymetrix, Inc.* | | 87,480 | | | 2,024,287 |
Caliper Life Sciences, Inc.* | | 596,880 | | | 3,300,746 |
Exelixis, Inc.* | | 112,980 | | | 975,017 |
| | | | | |
| | | | | 6,300,050 |
| | | | | |
Pharmaceuticals - 3.3% | | | | | |
Par Pharmaceutical Companies, Inc.* | | 172,840 | | | 4,148,160 |
Valeant Pharmaceuticals International* | | 169,890 | | | 2,033,583 |
| | | | | |
| | | | | 6,181,743 |
| | | | | |
Total Health Care | | | | | 44,043,699 |
| | | | | |
Industrials - 8.9% | | | | | |
Airlines - 4.1% | | | | | |
AirTran Holdings, Inc.* | | 359,890 | | | 2,576,812 |
AMR Corp.* | | 31,000 | | | 434,930 |
Continental Airlines, Inc. - Class B* | | 75,960 | | | 1,690,110 |
JetBlue Airways Corp.* | | 475,490 | | | 2,805,391 |
| | | | | |
| | | | | 7,507,243 |
| | | | | |
Commercial Services & Supplies - 1.1% | | | | | |
Covanta Holding Corp.* | | 71,200 | | | 1,969,392 |
| | | | | |
Electrical Equipment - 0.7% | | | | | |
Hubbell, Inc. - Class B | | 25,870 | | | 1,334,892 |
| | | | | |
Machinery - 3.0% | | | | | |
FreightCar America, Inc. | | 79,420 | | | 2,779,700 |
Mueller Water Products, Inc. - Class B | | 283,240 | | | 2,823,903 |
| | | | | |
| | | | | 5,603,603 |
| | | | | |
Total Industrials | | | | | 16,415,130 |
| | | | | |
Information Technology - 26.3% | | | | | |
Communications Equipment - 2.3% | | | | | |
BigBand Networks, Inc.* | | 349,960 | | | 1,798,794 |
| | |
| The accompanying notes are an integral part of the financial statements. | | 8 |
Investment Portfolio - December 31, 2007
| | | | | |
| | | Shares | | Value
(Note 2) |
| | | | | |
| | |
COMMON STOCKS (continued) | | | | | |
| | |
Information Technology (continued) | | | | | |
Communications Equipment (continued) | | | | | |
Blue Coat Systems, Inc.* | | 71,820 | | $ | 2,360,723 |
| | | | | |
| | | | | 4,159,517 |
| | | | | |
Computers & Peripherals - 0.9% | | | | | |
Rackable Systems, Inc.* | | 170,120 | | | 1,701,200 |
| | | | | |
Electronic Equipment & Instruments - 4.1% | | | | | |
LoJack Corp.* | | 242,620 | | | 4,078,442 |
Mechanical Technology, Inc.* | | 519,740 | | | 389,805 |
Planar Systems, Inc.* | | 500,020 | | | 3,200,128 |
| | | | | |
| | | | | 7,668,375 |
| | | | | |
Internet Software & Services - 4.4% | | | | | |
iPass, Inc.* | | 365,950 | | | 1,485,757 |
Online Resources Corp.* | | 452,440 | | | 5,393,085 |
WebMD Health Corp. - Class A* | | 30,520 | | | 1,253,456 |
| | | | | |
| | | | | 8,132,298 |
| | | | | |
IT Services - 1.6% | | | | | |
Gevity HR, Inc. | | 154,740 | | | 1,189,951 |
RightNow Technologies, Inc.* | | 113,880 | | | 1,804,998 |
| | | | | |
| | | | | 2,994,949 |
| | | | | |
Office Electronics - 0.7% | | | | | |
Boewe Systec AG (Germany) (Note 8) | | 31,570 | | | 1,280,264 |
| | | | | |
Semiconductors & Semiconductor Equipment - 2.3% |
Netlogic Microsystems, Inc.* | | 71,390 | | | 2,298,758 |
Trident Microsystems, Inc.* | | 301,670 | | | 1,978,955 |
| | | | | |
| | | | | 4,277,713 |
| | | | | |
Software - 10.0% | | | | | |
Borland Software Corp.* | | 1,255,780 | | | 3,779,898 |
Sonic Solutions* | | 341,600 | | | 3,549,224 |
Take-Two Interactive Software, Inc.* | | 192,370 | | | 3,549,227 |
UbiSoft Entertainment S.A.* (France) (Note 8) | | 38,400 | | | 3,899,842 |
Utimaco Safeware AG (Germany) (Note 8) | | 261,920 | | | 3,695,000 |
| | | | | |
| | | | | 18,473,191 |
| | | | | |
Total Information Technology | | | | | 48,687,507 |
| | | | | |
Materials - 8.4% | | | | | |
Chemicals - 5.9% | | | | | |
Calgon Carbon Corp.* | | 298,120 | | | 4,737,127 |
The Scotts Miracle-Gro Co. - Class A | | 50,120 | | | 1,875,490 |
Tronox, Inc. - Class A | | 485,390 | | | 4,319,971 |
| | | | | |
| | | | | 10,932,588 |
| | | | | |
| | |
| 9 | | The accompanying notes are an integral part of the financial statements. |
Investment Portfolio - December 31, 2007
| | | | | | | |
| | | Shares/
Principal Amount | | Value
(Note 2) | |
| | | | | | | |
| | |
COMMON STOCKS (continued) | | | | | | | |
| | |
Materials (continued) | | | | | | | |
Paper & Forest Products - 2.5% | | | | | | | |
Louisiana-Pacific Corp. | | | 187,840 | | $ | 2,569,651 | |
Norbord, Inc. (Canada) (Note 8) | | | 261,960 | | | 2,113,309 | |
| | | | | | | |
| | | | | | 4,682,960 | |
| | | | | | | |
Total Materials | | | | | | 15,615,548 | |
| | | | | | | |
TOTAL COMMON STOCKS
(Identified Cost $203,641,927) | | | | | | 179,125,356 | |
| | | | | | | |
| | |
SHORT-TERM INVESTMENTS - 4.5% | | | | | | | |
Dreyfus Treasury Cash Management - Institutional Shares | | | 4,245,146 | | | 4,245,146 | |
Fannie Mae Discount Note, 1/7/2008 | | $ | 4,000,000 | | | 3,996,726 | |
| | | | | | | |
TOTAL SHORT-TERM INVESTMENTS
(Identified Cost $8,242,293) | | | | | | 8,241,872 | |
| | | | | | | |
TOTAL INVESTMENTS - 101.3%
(Identified Cost $211,884,220) | | | | | | 187,367,228 | |
| | |
LIABILITIES, LESS OTHER ASSETS - (1.3%) | | | | | | (2,368,729 | ) |
| | | | | | | |
NET ASSETS - 100% | | | | | $ | 184,998,499 | |
| | | | | | | |
*Non-income producing security
| | |
| The accompanying notes are an integral part of the financial statements. | | 10 |
Statement of Assets and Liabilities
December 31, 2007
| | | | |
ASSETS: | | | | |
| | | | |
| |
Investments, at value (identified cost $211,884,220) (Note 2) | | $ | 187,367,228 | |
Foreign currency, at value (cost $2) | | | 2 | |
Receivable for securities sold | | | 1,027,246 | |
Receivable for fund shares sold | | | 585,146 | |
Dividends receivable | | | 96,279 | |
Foreign tax reclaims receivable | | | 7,304 | |
| | | | |
TOTAL ASSETS | | | 189,083,205 | |
| | | | |
| LIABILITIES: | | | | |
| |
Accrued management fees (Note 3) | | | 155,985 | |
Accrued fund accounting and transfer agent fees (Note 3) | | | 10,931 | |
Accrued Chief Compliance Officer service fees (Note 3) | | | 714 | |
Payable for securities purchased | | | 2,667,434 | |
Due to custodian | | | 1,027,246 | |
Payable for fund shares repurchased | | | 171,904 | |
Audit fees payable | | | 30,590 | |
Other payables and accrued expenses | | | 19,902 | |
| | | | |
TOTAL LIABILITIES | | | 4,084,706 | |
| | | | |
TOTAL NET ASSETS | | $ | 184,998,499 | |
| | | | |
NET ASSETS CONSIST OF: | | | | |
| |
Capital stock | | $ | 181,111 | |
Additional paid-in-capital | | | 207,639,636 | |
Accumulated net investment loss | | | (499 | ) |
Accumulated net realized gain on investments, foreign currency and
other assets and liabilities | | | 1,694,815 | |
Net unrealized depreciation on investments, foreign currency and other assets and liabilities | | | (24,516,564 | ) |
| | | | |
TOTAL NET ASSETS | | $ | 184,998,499 | |
| | | | |
NET ASSET VALUE, OFFERING PRICE AND REDEMPTION
PRICE PER SHARE - CLASS A ($184,998,499/18,111,144 shares) | | $ | 10.21 | |
| | | | |
| | |
| 11 | | The accompanying notes are an integral part of the financial statements. |
Statement of Operations
For the Year Ended December 31, 2007
| | | | |
INVESTMENT INCOME: | | | | |
| | | | |
| |
Dividends (net of foreign tax withheld, $33,104) | | $ | 1,700,021 | |
Interest | | | 348,947 | |
| | | | |
Total Investment Income | | | 2,048,968 | |
| | | | |
| EXPENSES: | | | | |
| |
Management fees (Note 3) | | | 1,939,439 | |
Fund accounting and transfer agent fees (Note 3) | | | 129,568 | |
Directors’ fees (Note 3) | | | 7,774 | |
Chief Compliance Officer service fees (Note 3) | | | 6,100 | |
Custodian fees | | | 18,199 | |
Miscellaneous | | | 101,049 | |
| | | | |
Total Expenses | | | 2,202,129 | |
| | | | |
NET INVESTMENT LOSS | | | (153,161 | ) |
| | | | |
REALIZED AND UNREALIZED GAIN (LOSS) ON
INVESTMENTS: | | | | |
| |
Net realized gain on - | | | | |
Investments | | | 25,823,104 | |
Foreign currency and other assets and liabilities | | | 7,386 | |
| | | | |
| | | 25,830,490 | |
| | | | |
| |
Net change in unrealized appreciation (depreciation) on - | | | | |
Investments | | | (45,251,238 | ) |
Written options | | | 11,524 | |
Foreign currency and other assets and liabilities | | | 403 | |
| | | | |
| | | (45,239,311 | ) |
| | | | |
| |
NET REALIZED AND UNREALIZED GAIN (LOSS) ON INVESTMENTS | | | (19,408,821 | ) |
| | | | |
NET DECREASE IN NET ASSETS RESULTING FROM OPERATIONS | | $ | (19,561,982 | ) |
| | | | |
| | |
| The accompanying notes are an integral part of the financial statements. | | 12 |
Statement of Changes in Net Assets
| | | | | | | | |
| | | For the
Year Ended
12/31/07 | | | For the
Year Ended
12/31/06 | |
| | | | | | | | |
| INCREASE (DECREASE) IN NET ASSETS: | | | | | | | | |
| | |
| OPERATIONS: | | | | | | | | |
| | |
Net investment loss | | $ | (153,161 | ) | | $ | (641,385 | ) |
Net realized gain on investments and foreign currency | | | 25,830,490 | | | | 35,004,998 | |
Net change in unrealized appreciation (depreciation) on investments, written options and foreign currency | | | (45,239,311 | ) | | | (5,662,651 | ) |
| | | | | | | | |
Net increase (decrease) from operations | | | (19,561,982 | ) | | | 28,700,962 | |
| | | | | | | | |
DISTRIBUTIONS TO SHAREHOLDERS
(Note 9): | | | | | | | | |
| | |
From net realized gain on investments | | | (24,981,501 | ) | | | (33,448,452 | ) |
| | | | | | | | |
| CAPITAL STOCK ISSUED AND REPURCHASED: | | | | | | | | |
| | |
Net increase from capital share transactions (Note 5) | | | 54,050,690 | | | | 25,822,755 | |
| | | | | | | | |
Net increase in net assets | | | 9,507,207 | | | | 21,075,265 | |
| | |
| NET ASSETS: | | | | | | | | |
| | |
Beginning of year | | | 175,491,292 | | | | 154,416,027 | |
| | | | | | | | |
End of year (including undistributed net investment loss of $499 and $0, respectively) | | $ | 184,998,499 | | | $ | 175,491,292 | |
| | | | | | | | |
| | |
| 13 | | The accompanying notes are an integral part of the financial statements. |
Financial Highlights
| | | | | | | | | | |
| | | For the Years Ended |
| | | 12/31/07 | | 12/31/06 | | 12/31/05 | | 12/31/04 | | 12/31/03 |
| | | | | | | | | | |
| Per share data (for a share outstanding throughout each year): | | | | | | | | | | |
Net asset value - Beginning of year | | $13.08 | | $13.66 | | $15.01 | | $13.12 | | $9.52 |
| | | | | | | | | | |
Income (loss) from investment operations: | | | | | | | | | | |
Net investment loss | | (0.01) | | (0.05) | | (0.07) | | (0.07) | | (0.04) |
Net realized and unrealized gain (loss) on investments | | (1.25) | | 2.55 | | 2.20 | | 2.66 | | 3.64 |
| | | | | | | | | | |
Total from investment operations | | (1.26) | | 2.50 | | 2.13 | | 2.59 | | 3.60 |
| | | | | | | | | | |
Less distributions to shareholders: | | | | | | | | | | |
From net realized gain on investments | | (1.61) | | (3.08) | | (3.48) | | (0.70) | | — |
| | | | | | | | | | |
Net asset value - End of year | | $10.21 | | $13.08 | | $13.66 | | $15.01 | | $13.12 |
| | | | | | | | | | |
Total return1 | | (9.32%) | | 18.06% | | 14.11% | | 19.81% | | 37.82% |
| Ratios (to average net assets)/Supplemental Data: | | | | | | | | | | |
Expenses* | | 1.14% | | 1.16% | | 1.19% | | 1.22% | | 1.22% |
Net investment loss | | (0.08%) | | (0.40%) | | (0.51%) | | (0.54%) | | (0.39%) |
Portfolio turnover | | 64% | | 85% | | 55% | | 61% | | 42% |
Net assets - End of year (000’s omitted) | | $184,998 | | $175,491 | | $154,416 | | $169,438 | | $139,909 |
| | | | | | | | | | |
|
*The investment advisor did not impose all of its management fee in some years and is not eligible to recoup any expenses that have been waived or reimbursed in prior years. If these expenses had been incurred by the Series, the expense ratio (to average net assets) would have been increased as follows: |
| | N/A | | N/A | | N/A | | 0.01% | | 0.01% |
1Represents aggregate total return for the year indicated, and assumes reinvestment of all distributions. Total return would have been lower had certain expenses not been waived during certain years.
| | |
| The accompanying notes are an integral part of the financial statements. | | 14 |
Notes to Financial Statements
Small Cap Series (the “Series”) is a no-load diversified series of Manning & Napier Fund, Inc. (the “Fund”). The Fund is organized in Maryland and is registered under the Investment Company Act of 1940, as amended, as an open-end management investment company.
The Series’ investment objective is to provide long-term growth by investing principally in the common stocks of companies with small market capitalizations.
The Series is authorized to issue five classes of shares (Class A, B, Z, D and E). Currently, only Class A shares have been issued. Each class of shares is substantially the same, except that class-specific distribution and shareholder servicing expenses are borne by the specific class of shares to which they relate.
The Fund’s Advisor is Manning & Napier Advisors, Inc. (the “Advisor”). Shares of the Series are offered to investors, clients and employees of the Advisor and its affiliates. The total authorized capital stock of the Fund consists of 5.0 billion shares of common stock each having a par value of $0.01. As of December 31, 2007, 3.33 billion shares have been designated in total among 27 series, of which 87.5 million have been designated as Small Cap Series Class A common stock.
| 2. | SIGNIFICANT ACCOUNTING POLICIES |
Security Valuation
Portfolio securities, including domestic equities, foreign equities, exchange-traded funds and options, listed on an exchange other than the NASDAQ National Market System are valued at the latest quoted sales price of the exchange on which the security is primarily traded. Securities not traded on valuation date or securities not listed on an exchange are valued at the latest quoted bid price provided by the Fund’s pricing service. Securities listed on the NASDAQ National Market System are valued in accordance with the NASDAQ Official Closing Price.
Securities for which representative valuations or prices are not available from the Fund’s pricing service may be valued at fair value. Due to the inherent uncertainty of valuations of such securities, the fair value may differ significantly from the values that would have been used had a ready market for such securities existed. If trading or events occurring after the close of the principal market in which securities are traded are expected to materially affect the value of those securities, then they may be valued at their fair value, taking this trading or these events into account. Fair value is determined in good faith by the Advisor under procedures approved by and under the general supervision and responsibility of the Fund’s Board of Directors (the “Board”).
Short-term investments that mature in sixty days or less are valued at amortized cost, which approximates market value. Investments in open-end investment companies are valued at their net asset value per share on valuation date, with the exception of exchange-traded funds, which are valued at the closing price on the exchange.
Security Transactions, Investment Income and Expenses
Security transactions are accounted for on trade date. Dividend income is recorded on the ex-dividend date, except that if the ex-dividend date has passed, certain dividends from foreign securities are recorded as soon as the Fund is informed of the ex-dividend date. Non-cash dividends, if any, are recorded at the fair market value of the securities received. Interest income, including amortization of premium and accretion of discounts using the effective interest method, is earned from settlement date and accrued daily.
Notes to Financial Statements
| 2. | SIGNIFICANT ACCOUNTING POLICIES (continued) |
Security Transactions, Investment Income and Expenses (continued)
Expenses are recorded on an accrual basis. Most expenses of the Fund can be attributed to a specific series. Expenses which cannot be directly attributed are apportioned among the series in the Fund in such a manner as deemed equitable by the Fund’s Board, taking into consideration, among other things, the nature and type of expense.
The Series uses the identified cost method for determining realized gain or loss on investments for both financial statement and federal income tax reporting purposes.
Foreign Currency Translation
The books and records of the Series are maintained in U.S. dollars. Foreign currencies, investments and other assets and liabilities are translated into U.S. dollars at the current exchange rates. Purchases and sales of investment securities and income and expenses are translated on the respective dates of such transactions. The Series does not isolate realized and unrealized gains and losses attributable to changes in the exchange rates from gains and losses that arise from changes in the market value of investments. Such fluctuations are included with net realized and unrealized gain or loss on investments. Net realized foreign currency gains and losses represent foreign currency gains and losses between trade date and settlement date on securities transactions, gains and losses on disposition of foreign currencies and the difference between the amount of income and foreign withholding taxes recorded on the books of the Series and the amounts actually received or paid.
Option Contracts
The Series may write (sell) or buy call or put options on securities and other financial instruments. When the Series writes a call, the Series gives the purchaser the right to buy the underlying security from the Series at the price specified in the option contract (the “exercise price”) at any time during the option period. When the Series writes a put option, the Series gives the purchaser the right to sell to the Series the underlying security at the exercise price at any time during the option period. The Series will only write options on a “covered basis.” This means that the Series will own the underlying security when the Series writes a call or the Series will put aside cash, U.S. Government securities, or other liquid assets in an amount not less than the exercise price at all times the put option is outstanding.
When the Series writes an option, an amount equal to the premium received is reflected as a liability and is subsequently marked-to-market to reflect the current market value of the option. The Series, as a writer of an option, has no control over whether the underlying security or financial instrument may be sold (call) or purchased (put) and, as a result, bears the market risk of an unfavorable change in the price of the security or financial instrument underlying the written option. There is a risk that the Series may not be able to enter into a closing transaction because of an illiquid market.
The Series may also purchase options in an attempt to hedge against fluctuations in the value of its portfolio and to protect against declines in the value of the securities. The premium paid by the Series for the purchase of an option is reflected as an investment and subsequently marked-to-market to reflect the current market value of the option. The risk associated with purchasing options is limited to the premium paid.
When a security is purchased or sold through an exercise of an option, the related premium paid (or received) is added to (or deducted from) the basis of the security acquired or deducted from
Notes to Financial Statements
| 2. | SIGNIFICANT ACCOUNTING POLICIES (continued) |
Option Contracts (continued)
(or added to) the proceeds of the security sold. When an option expires (or the Series enters into a closing transaction), the Series realizes a gain or loss on the option to the extent of the premium received or paid (or gain or loss to the extent the cost of the closing transaction exceeds the premium paid or received).
The measurement of the risks associated with option contracts is meaningful only when all related and offsetting transactions are considered.
Federal Taxes
The Series’ policy is to comply with the provisions of the Internal Revenue Code applicable to regulated investment companies. The Series is not subject to federal income tax or excise tax to the extent that the Series distributes to shareholders each year its taxable income, including any net realized gains on investments, in accordance with requirements of the Internal Revenue Code. Accordingly, no provision for federal income tax or excise tax has been made in the financial statements.
On June 29, 2007, the Series adopted Financial Accounting Standards Board Interpretation No. 48 - Accounting for Uncertainty in Income Taxes (“FIN 48”). FIN 48 prescribes the minimum recognition threshold a tax position must meet in connection with accounting for uncertainties in income tax positions taken or expected to be taken by an entity before being measured and recognized in the financial statements. Management has determined that FIN 48 did not have a material impact on the Series’ financial statements. The Series files income tax returns in the U.S. federal jurisdiction, various states and foreign jurisdictions, as required. No income tax returns are currently under investigation. The statute of limitations on the Series’ tax returns remains open for the years ended December 31, 2004 through December 31, 2007.
Additionally, based on the Fund’s understanding of the tax rules and rates related to income, gains and transactions for foreign jurisdictions in which it invests, the Series will provide for foreign taxes, and where appropriate, deferred foreign tax.
Distributions of Income and Gains
Distributions to shareholders of net investment income and net realized gains are made annually. An additional distribution may be necessary to avoid taxation of the Series. Distributions are recorded on the ex-dividend date.
Indemnifications
The Fund’s organizational documents provide former and current directors and officers with a limited indemnification against liabilities arising in connection with the performance of their duties to the Fund. In the normal course of business, the Fund may also enter into contracts that provide general indemnifications. The Fund’s maximum exposure under these arrangements is unknown as this would be dependent on future claims that may be made against the Fund. The risk of material loss from such claims is considered remote.
Other
The preparation of financial statements in conformity with accounting principles generally accepted in the United States of America requires management to make estimates and assumptions that affect the reported amounts of assets and liabilities and the disclosure of contingent assets and liabilities at the date of the financial statements and the reported amounts of income and expenses during the reporting period. Actual results could differ from those estimates.
Notes to Financial Statements
| 3. | TRANSACTIONS WITH AFFILIATES |
The Fund has an Investment Advisory Agreement (the “Agreement”) with the Advisor, for which the Series pays a fee, computed daily and payable monthly, at an annual rate of 1.00% of the Series’ average daily net assets.
Under the Agreement, personnel of the Advisor provide the Series with advice and assistance in the choice of investments and the execution of securities transactions, and otherwise maintain the Series’ organization. The Advisor also provides the Fund with necessary office space and fund administration and support services. The salaries of all officers of the Fund (except a percentage of the Fund’s Chief Compliance Officer’s salary, which is paid by the Fund), and of all Directors who are “affiliated persons” of the Fund, or of the Advisor, and all personnel of the Fund, or of the Advisor, performing services relating to research, statistical and investment activities, are paid by the Advisor. Each “non-affiliated” Director receives an annual stipend, which is allocated among all the active series of the Fund. In addition, these Directors also receive a fee per Board meeting attended for each active series of the Fund plus a fee for each committee meeting attended.
Manning & Napier Investor Services, Inc., a registered broker-dealer affiliate of the Advisor, acts as distributor for the Fund’s shares. The services of Manning & Napier Investor Services, Inc. are provided at no additional cost to the Series.
For fund accounting and transfer agent services, the Fund pays the Advisor an annual fee of 0.11% of the Fund’s average daily net assets up to $900 million, 0.07% of the Fund’s average daily net assets between $900 million and $1.5 billion, and 0.04% of the Fund’s average daily net assets over $1.5 billion. Additionally, certain transaction and account-based fees and out-of-pocket expenses, including charges for reporting relating to the Fund’s compliance program, are charged. Expenses not directly attributable to a series are allocated based on each series’ relative net assets or number of accounts, depending on the expense. The Advisor has an agreement with Citi Fund Services Ohio, Inc. (“Citi”) (formerly BISYS Fund Services Ohio, Inc.) under which Citi serves as sub-accountant and sub-transfer agent.
| 4. | PURCHASES AND SALES OF SECURITIES |
For the year ended December 31, 2007, purchases and sales of securities, other than United States Government securities and short-term securities, were $145,007,825 and $115,774,779, respectively. There were no purchases or sales of United States Government securities.
| 5. | CAPITAL STOCK TRANSACTIONS |
Transactions in Class A shares of Small Cap Series were:
| | | | | | | | | | | | | | |
| | | For the Year
Ended 12/31/07 | | | For the Year
Ended 12/31/06 | |
| | | Shares | | | Amount | | | Shares | | | Amount | |
| | | | | | | | | | | | | | |
Sold | | 2,951,632 | | | $ | 38,717,750 | | | 2,333,662 | | | $ | 34,715,820 | |
Reinvested | | 2,455,169 | | | | 24,508,650 | | | 2,454,854 | | | | 32,569,872 | |
Repurchased | | (712,445 | ) | | | (9,175,710 | ) | | (2,677,271 | ) | | | (41,462,937 | ) |
| | | | | | | | | | | | | | |
Total | | 4,694,356 | | | $ | 54,050,690 | | | 2,111,245 | | | $ | 25,822,755 | |
| | | | | | | | | | | | | | |
Notes to Financial Statements
| 5. | CAPITAL STOCK TRANSACTIONS (continued) |
Approximately 78% of the Series’ shares represent investments by fiduciary accounts over which the Advisor has sole investment discretion.
A summary of obligations for written option contracts for the year ended December 31, 2007 is as follows:
| | | | | | | | | | | | |
| | | Put Options | | Call Options | |
| | | Number of
Contracts | | Premiums
Received | | Number of
Contracts | | | Premiums
Received | |
Balance at December 31, 2006 | | — | | $ | — | | 640 | | | $ | 116,476 | |
Options exercised during 2007 | | — | | | — | | (640 | ) | | | (116,476 | ) |
| | | | | | | | | | | | |
Balance at December 31, 2007 | | — | | $ | — | | — | | | $ | — | |
| | | | | | | | | | | | |
The Series may trade in financial instruments with off-balance sheet risk in the normal course of its investing activities to assist in managing exposure to various market risks. These financial instruments include written options, forward foreign currency exchange contracts and futures contracts and may involve, to a varying degree, elements of risk in excess of the amounts recognized for financial statement purposes. No such investments were held by the Series on December 31, 2007.
Investing in securities of foreign companies and foreign governments involves special risks and considerations not typically associated with investing in securities of domestic companies and the United States Government. These risks include revaluation of currencies and future adverse political and economic developments. Moreover, securities of foreign companies and foreign governments and their markets may be less liquid and their prices more volatile than those of comparable domestic companies and the United States Government.
| 9. | FEDERAL INCOME TAX INFORMATION |
The amount and characterization of certain income and capital gains to be distributed are determined in accordance with federal income tax regulations, which may differ from accounting principles generally accepted in the United States of America. These differences are primarily due to differing book and tax treatments in the timing of the recognition of net investment income or gains and losses, including net operating losses, the tax practice known as equalization, foreign currency gains and losses and Post-October losses. The Series may periodically make reclassifications among its capital accounts to reflect income and gains available for distribution (or available capital loss carryovers) under income tax regulations, without impacting the Series’ net asset value. Any such reclassifications are not reflected in the financial highlights.
Notes to Financial Statements
| 9. | FEDERAL INCOME TAX INFORMATION (continued) |
The tax character of distributions paid were as follows:
| | | | | | |
| | | For the Year
Ended 12/31/07 | | For the Year
Ended 12/31/06 |
Ordinary income | | $ | 11,710,286 | | $ | 5,103,422 |
Long-term capital gains | | | 13,271,215 | | | 28,345,030 |
For the year ended December 31, 2007, the Series elected to defer $499 of capital losses attributable to Post-October losses.
At December 31, 2007, the tax basis components of distributable earnings and the net unrealized depreciation based on identified cost for federal income tax purposes were as follows:
| | | | |
Cost for federal income tax purposes | | $ | 211,884,220 | |
| |
Unrealized appreciation | | $ | 18,802,180 | |
Unrealized depreciation | | | (43,319,172 | ) |
| | | | |
Net unrealized depreciation | | $ | (24,516,992 | ) |
Undistributed ordinary income | | | 241,860 | |
Undistributed long-term capital gains | | | 1,452,955 | |
| 10. | RECENT ACCOUNTING PRONOUNCEMENTS |
In September 2006, FASB Statement of Financial Accounting Standards No. 157, Fair Value Measurements (“FAS 157”) was issued, and is effective for fiscal years beginning after November 15, 2007. FAS 157 defines fair value, establishes a framework for measuring fair value, and expands disclosure about fair value measurements. The standard does not expand the use of fair value in any new circumstances, but provides clarification on acceptable fair value methods and applications. At this time, management is evaluating the implications of FAS 157, but it is not expected to materially impact the Series’ financial statements.
Report of Independent Registered Public Accounting Firm
To the Board of Directors of Manning & Napier Fund, Inc. and Shareholders of Small Cap Series:
In our opinion, the accompanying statement of assets and liabilities, including the investment portfolio, and the related statements of operations and of changes in net assets and the financial highlights present fairly, in all material respects, the financial position of the Small Cap Series (a series of Manning & Napier Fund, Inc., hereafter referred to as the “Series”) at December 31, 2007, and the results of its operations for the year then ended, the changes in its net assets for each of the two years in the period then ended and the financial highlights for each of the five years in the period then ended, in conformity with accounting principles generally accepted in the United States of America. These financial statements and financial highlights (hereafter referred to as “financial statements”) are the responsibility of the Series’ management; our responsibility is to express an opinion on these financial statements based on our audits. We conducted our audits of these financial statements in accordance with the standards of the Public Company Accounting Oversight Board (United States). Those standards require that we plan and perform the audit to obtain reasonable assurance about whether the financial statements are free of material misstatement. An audit includes examining, on a test basis, evidence supporting the amounts and disclosures in the financial statements, assessing the accounting principles used and significant estimates made by management, and evaluating the overall financial statement presentation. We believe that our audits, which included confirmation of securities at December 31, 2007 by correspondence with the custodian and brokers, provide a reasonable basis for our opinion.

Columbus, Ohio
February 20, 2008
Supplemental Tax Information (unaudited)
For federal income tax purposes, the Series designates for the current fiscal year $1,241,248 or, if different, the maximum amount allowable under the tax law as qualified dividend income.
Pursuant to Section 852 of the Internal Revenue Code, as amended, the Series hereby designates $13,521,215 as capital gains for its taxable year ended December 31, 2007.
Renewal of Investment Advisory Agreements (unaudited)
During the period covered by this shareholder report, the Board of Directors (the “Board”) of Manning & Napier Fund, Inc. (the “Fund”) considered approval of two separate investment advisory agreements with Manning & Napier Advisors, Inc. (the “Advisor”):
| | • | | At a meeting held on August 30, 2007, the Board approved a new investment advisory agreement between the Fund and the Advisor (the “New Investment Advisory Agreement”) and recommended that the New Investment Advisory Agreement be submitted to shareholders for approval. Shareholders approved the New Investment Advisory Agreement at a meeting held on December 17, 2007. |
| | • | | At a meeting held on November 12, 2007, the Board approved the continuation of the then-current investment advisory agreement between the Fund and the Advisor (the “Current Investment Advisory Agreement”), which was to be superseded by the New Investment Advisory Agreement upon its approval by the Fund’s shareholders. The continuation of the Current Investment Advisory Agreement was necessary as a result of the delay in obtaining the number of votes necessary to convene the shareholder meeting and approve the New Investment Advisory Agreement with respect to all investment portfolios of the Fund (the “Series”). |
Consideration of New Investment Advisory Agreement:
In response to recent regulatory and compliance initiatives promulgated by the SEC over the past year, the Fund engaged in a comprehensive review of all material aspects of the Fund’s operations, including the Fund’s Current Investment Advisory Agreement. As a result of its review, the Board determined that the Current Investment Advisory Agreement should be amended for the purpose of modernizing the form of the agreement and to include additional provisions in the agreement that are customarily included in investment advisory agreements between registered investment companies and their investment advisors, but which are not included in the Current Investment Advisory Agreement. Accordingly, at the Board meeting on November 16, 2006, representatives of the Advisor presented to the Board proposed changes to the Current Investment Advisory Agreement in order to address the Board’s request to update and modernize the Current Investment Advisory Agreement. As a result of the discussions between the Board and representatives of the Advisor at the November 2006 Board meeting, the Board determined to formally consider the approval of a new investment advisory agreement between the Fund and the Advisor, which would incorporate the changes proposed at the November 2006 Board meeting, at its in-person Board meeting in August 2007.
At an in-person meeting held on August 30, 2007, the Board considered the approval of the New Investment Advisory Agreement between the Fund and the Advisor. Based on the information it received at the meeting and the November 16, 2006 Board meeting, the Board approved the New Investment Advisory Agreement subject to its further approval by the Fund’s shareholders. Representatives of the Advisor attended the meeting and presented additional oral and written information to the Board to assist the Board in its considerations. At the meeting, the Board concluded it was reasonable to take into account the conclusions the Board made when considering and evaluating the renewal of the Current Investment Advisory Agreement (the “2006 Annual Review”), which occurred at the November 16, 2006 in-person Board meeting, as part of its considerations to approve the New Investment Advisory Agreement. The discussion immediately below outlines the materials and information presented to the Board in connection with the Board’s 2006 Annual Review of the Current Investment Advisory Agreement and the conclusions made by the Directors when determining to continue the Current Investment Advisory Agreement for an additional one-year period.
Renewal of Investment Advisory Agreements (unaudited)
In connection with its review and deliberations, the Board considered the following factors and reached a conclusion with respect to such factors.
| | • | | The Board considered the services provided by the Advisor under the Current Investment Advisory Agreement including, among others: deciding what securities to purchase and sell for each Series; arranging for the purchase and sale of such securities by placing orders with broker-dealers; administering the affairs of the Fund (including the books and records of the Fund not maintained by third party service providers such as the custodian or sub-transfer agent); arranging for the insurance coverage for the Fund; and supervising the preparation of tax returns, SEC filings (including registration statements) and reports to shareholders for the Fund. The Board also considered the nature and quality of such services provided under the Current Investment Advisory Agreement in light of the Advisor’s services provided to the Fund for 21 years. The Board discussed the quality of these services with representatives from the Advisor and concluded that the Advisor was performing its services to the Fund required under the Current Investment Advisory Agreement in a reasonable manner. |
| | • | | The Board considered the investment performance of the various Series of the Fund. The investment performance for each Series was reviewed on a cumulative basis since inception and on a one year basis. In addition, annualized performance for the following time periods was considered: inception, three year, five year, ten year, and current market cycle. A market cycle includes periods of both rising and falling markets. Returns for established benchmark indices for each Series were provided for each time period. The Board noted that all the Series were competitive against their respective benchmark indices over all time periods noted above through September 30, 2006. In addition, the Board considered at the meeting (and considers on a quarterly basis) a peer group performance analysis consisting of Morningstar universes of mutual funds with similar investment objectives. The Board discussed the performance with representatives from the Advisor and concluded that the investment performance of each of the Fund’s Series was reasonable based on the Fund’s actual performance and comparative performance, especially performance over the current market cycle. |
| | • | | The Board considered the costs of the Advisor’s services and the profits of the Advisor as they relate to the Advisor’s services to the Fund under the Current Investment Advisory Agreement. In reviewing the Advisor’s costs and profits, the Board discussed the Advisor’s revenues generated from the Fund (on both an actual and adjusted basis) and its expenses associated with providing the services under the Current Investment Advisory Agreement. In addition, the Board reviewed the Advisor’s expenses associated with Fund activities outside of the Current Investment Advisory Agreement (such as expense reimbursements pursuant to expense caps and payments made by the Advisor to third party platforms on which shares of the Fund are available for purchase). It was noted by representatives of the Advisor that 6 of the 18 active Series of the Fund are currently experiencing expenses above the capped expense ratios. After discussing the above costs and profits, the Board concluded that the Advisor’s profitability relating to its services provided under the Current Investment Advisory Agreement was reasonable. |
| | • | | The Board considered the fees and expenses of the various Series of the Fund. The Advisor presented the advisory fees and total expenses for each Series, including the |
Renewal of Investment Advisory Agreements (unaudited)
| | advisory fee adjusted for any expense waivers or reimbursements (either contractual or voluntary) paid by the Advisor. The advisory fees and expense ratios of each Series were compared to an average (on both a mean and median basis) of similar funds as disclosed on the Morningstar database. Representatives of the Advisor discussed with the Board the levels of its advisory fee for each Series of the Fund and as compared to the median and mean advisory fees for similar funds as listed on Morningstar. Expense ratios for every Series, except the High Yield Bond Series, are currently below the median and mean for similar funds as listed on Morningstar. Based on their review of the information provided, the Board concluded that the fees and expenses of each Series of the Fund were reasonable on a comparative basis. |
| | • | | The Board also considered the other benefits the Advisor derives from its relationship with the Fund. Such other benefits include certain research products provided by soft dollars. Given the level of soft dollar transactions involving the Fund, the Board concluded that these additional benefits to the Advisor were reasonable. |
| | • | | In addition to the factors described above, the Board considered the Advisor’s personnel, investment strategies, policies and procedures relating to compliance with personal securities transactions, and reputation, expertise and resources in domestic and foreign financial markets. The Board concluded that these factors support the conclusion that the Advisor performs its services in a reasonable manner. |
| | • | | The Board did not consider economies of scale at this time because of the multiple uses of the Fund (for the Advisor’s discretionary investment account clients in addition to direct investors), the current profitability of the Advisor’s services to the Fund under the Current Investment Advisory Agreement, and the overall size of the Fund complex. |
Based on the Board’s deliberations and their evaluation of the information described above, the Board, including a majority of Directors that are “not interested” as defined in the Investment Company Act of 1940 (the “1940 Act”), concluded that the compensation under the Current Investment Advisory Agreement was fair and reasonable in light of the services and expenses and such other matters as the Directors considered to be relevant in the exercise of their reasonable judgment. Accordingly, the Board approved the renewal of the Current Investment Advisory Agreement for another year. In the course of their deliberations, the Directors did not identify any particular information that was all important or controlling.
As stated above, at the August 30, 2007 Board meeting, the Board concluded it was reasonable to take into account the conclusions set forth above when determining whether to approve the New Investment Advisory Agreement. The Board’s conclusion in this regard was based on the fact that the New Investment Advisory Agreement is identical to the Current Investment Advisory Agreement except for certain provisions of the Agreement which have been updated and modernized in response to the Board’s specific request. Further, the Board’s conclusion in this regard was based on the fact that the New Investment Advisory Agreement does not change either the investment advisory fees payable by the Fund to the Advisor or the day-to-day investment management services the Advisor provides to the Fund.
In addition to the conclusions formed with respect to the 2006 Annual Review, the Directors considered specific information at the August 30, 2007 Board meeting concerning the additional provisions included in the New Investment Advisory Agreement. The Directors considered the fact that these additional provisions are designed to (i) address and memorialize certain standard practices and regulatory requirements of mutual funds and their investment advisors; (ii) further
Renewal of Investment Advisory Agreements (unaudited)
delineate the duties and obligations of the Fund and the Advisor; (iii) modernize the agreement to reflect current industry practice and applicable law; and (iv) generally improve the overall quality of the agreement. The Board further considered the fact that the New Investment Advisory Agreement does not alter the actual day-to-day investment management services provided by the Advisor to each Series of the Fund, and the investment advisory fee rate paid to the Advisor under the New Investment Advisory Agreement for a Series is the same as the fee rate paid by the Series under the Current Investment Advisory Agreement.
Based on its evaluation of the information and the conclusions with respect thereto at its meetings on November 16, 2006 and August 30, 2007, the Board unanimously concluded that: (a) the terms of the New Investment Advisory Agreement were fair and reasonable; (b) the approval of the New Investment Advisory Agreement would be in the best interests of the shareholders and the Fund; and (c) it would recommend the approval of the New Investment Advisory Agreement to shareholders. In the course of their deliberations, the Board did not identify any particular information or factor that was all-important or controlling.
Consideration of Current Investment Advisory Agreement
At a meeting held on November 12, 2007, the Board considered the continuation of the Current Investment Advisory Agreement and simultaneously conducted its annual review of the services provided to the Fund by the Adviser (the “2007 Annual Review”). Representatives of the Advisor attended the meeting and presented additional oral and written information to the Board to assist the Board in its considerations. The discussion immediately below outlines the materials and information presented to the Board in connection with the Board’s 2007 Annual Review of the Current Investment Advisory Agreement and the conclusions made by the Directors when determining to continue the Current Investment Advisory Agreement.
In connection with its review and deliberations, the Board considered the following factors and reached a conclusion with respect to such factors.
| | • | | The Board considered the services provided by the Advisor under the Current Investment Advisory Agreement including, among others: deciding what securities to purchase and sell for each Series; arranging for the purchase and sale of such securities by placing orders with broker-dealers; administering the affairs of the Fund (including the books and records of the Fund not maintained by third party service providers such as the custodian or sub-transfer agent); arranging for the insurance coverage for the Fund; and supervising the preparation of tax returns, SEC filings (including registration statements) and reports to shareholders for the Fund. The Board also considered the nature and quality of such services provided under the Current Investment Advisory Agreement in light of the Advisor’s services provided to the Fund for 21 years. The Board discussed the quality of these services with representatives from the Advisor and concluded that the Advisor was performing its services to the Fund required under the Current Investment Advisory Agreement in a reasonable manner. |
| | • | | The Board considered the investment performance of the various Series of the Fund. The investment performance for each Series was reviewed on a cumulative basis since inception and on a one year basis. In addition, annualized performance for the following time periods was considered: inception, three year, five year, ten year, and current market cycle. A market cycle includes periods of both rising and falling markets. Returns for established benchmark indices for each Series were provided for |
Renewal of Investment Advisory Agreements (unaudited)
| | each time period. The Board noted that all the Series were competitive against their respective benchmark indices over all time periods noted above through September 30, 2007. In addition, the Board considered at the meeting (and considers on a quarterly basis) a peer group performance analysis consisting of Morningstar universes of mutual funds with similar investment objectives. The Board discussed the performance with representatives from the Advisor and concluded that the investment performance of each of the Fund’s Series was reasonable based on the Fund’s actual performance and comparative performance, especially performance over the current market cycle. |
| | • | | The Board considered the costs of the Advisor’s services and the profits of the Advisor as they relate to the Advisor’s services to the Fund under the Current Investment Advisory Agreement. In reviewing the Advisor’s costs and profits, the Board discussed the Advisor’s revenues generated from the Fund (on both an actual and adjusted basis) and its expenses associated with providing the services under the Current Investment Advisory Agreement. In addition, the Board reviewed the Advisor’s expenses associated with Fund activities outside of the Current Investment Advisory Agreement (such as expense reimbursements pursuant to expense caps and payments made by the Advisor to third party platforms on which shares of the Fund are available for purchase). It was noted by representatives of the Advisor that 4 of the 18 active Series of the Fund are currently experiencing expenses above the capped expense ratios. After discussing the above costs and profits, the Board concluded that the Advisor’s profitability relating to its services provided under the Current Investment Advisory Agreement was reasonable. |
| | • | | The Board considered the fees and expenses of the various Series of the Fund. The Advisor presented the advisory fees and total expenses for each Series, including the advisory fee adjusted for any expense waivers or reimbursements (either contractual or voluntary) paid by the Advisor. The advisory fees and expense ratios of each Series were compared to an average (on both a mean and median basis) of similar funds as disclosed on the Morningstar database. Representatives of the Advisor discussed with the Board the levels of its advisory fee for each Series of the Fund and as compared to the median and mean advisory fees for similar funds as listed on Morningstar. Expense ratios for every Series, except the High Yield Bond Series and Global Fixed Income Series, are currently below the median and mean for similar funds as listed on Morningstar. Based on their review of the information provided, the Board concluded that the fees and expenses of each Series of the Fund were reasonable on a comparative basis. |
| | • | | The Board also considered the other benefits the Advisor derives from its relationship with the Fund. Such other benefits include certain research products provided by soft dollars. Given the level of soft dollar transactions involving the Fund, the Board concluded that these additional benefits to the Advisor were reasonable. |
| | • | | In addition to the factors described above, the Board considered the Advisor’s personnel, investment strategies, policies and procedures relating to compliance with personal securities transactions, and reputation, expertise and resources in domestic and foreign financial markets. The Board concluded that these factors support the conclusion that the Advisor performs its services in a reasonable manner. |
Renewal of Investment Advisory Agreements (unaudited)
| | • | | The Board did not consider economies of scale at this time because of the multiple uses of the Fund (for the Advisor’s discretionary investment account clients in addition to direct investors), the current profitability of the Advisor’s services to the Fund under the Current Investment Advisory Agreement, and the overall size of the Fund complex. |
Based on the Board’s deliberations and their evaluation of the information described above, the Board, including a majority of Directors that are not “interested persons” as defined in the 1940 Act, concluded that the compensation under the Current Investment Advisory Agreement was fair and reasonable in light of the services and expenses and such other matters as the Directors considered to be relevant in the exercise of their reasonable judgment. Accordingly, the Board approved the renewal of the Current Investment Advisory Agreement. In the course of their deliberations, the Directors did not identify any particular information that was all important or controlling.
Proxy Voting Results (unaudited)
A special meeting of the shareholders of Manning & Napier Fund, Inc. was held on November 12, 2007. The number of votes necessary to conduct the meeting and approve each proposal was obtained, and the results of the votes of shareholders on proposals before them are listed below:
PROPOSAL 1:
Election of Directors.
| | | | |
| | | Number of Shares
voted for | | Number of Shares
withheld |
B. Reuben Auspitz | | 215,932,354.541 | | 15,898,685.154 |
Stephen B. Ashley | | 215,960,751.214 | | 15,870,288.481 |
Peter L. Faber | | 217,504,725.208 | | 14,326,314.487 |
Harris H. Rusitzky | | 215,924,013.609 | | 15,907,026.086 |
PROPOSAL 2:
To approve the investment advisory agreement between Manning & Napier Advisors, Inc. and Manning & Napier Fund, Inc.
| | |
| | | Number of
shares voted |
For | | 8,771,142.362 |
Against | | 751.559 |
Abstain (includes broker non-votes) | | 1,441,319.539 |
PROPOSAL 3:
Eliminating, amending, or reclassifying certain fundamental investment policies or restrictions.
Proposal 3.A.i. To approve changes to the fundamental policy regarding borrowing money.
| | |
| | | Number of
shares voted |
For | | 8,771,877.185 |
Against | | 401.736 |
Abstain (includes broker non-votes) | | 1,440,934.539 |
Proposal 3.A.ii. To approve changes to the fundamental policy regarding percentage of assets invested in any one industry.
| | |
| | | Number of
shares voted |
For | | 8,772,023.362 |
Against | | 255.559 |
Abstain (includes broker non-votes) | | 1,440,934.539 |
Proxy Voting Results (unaudited)
Proposal 3.A.iii. To approve changes to the fundamental policy regarding loans.
| | |
| | | Number of
shares voted |
For | | 8,772,023.362 |
Against | | 255.559 |
Abstain (includes broker non-votes) | | 1,440,934.539 |
Proposal 3.A.iv. To approve changes to the fundamental policy regarding issuance of senior securities or pledging its assets.
| | |
| | | Number of
shares voted |
For | | 8,771,492.185 |
Against | | 401.736 |
Abstain (includes broker non-votes) | | 1,441,319.539 |
Proposal 3.A.v. To approve changes to the fundamental policy regarding buying or selling of commodities or commodity contracts.
| | |
| | | Number of
shares voted |
For | | 8,771,893.921 |
Against | | 0 |
Abstain (includes broker non-votes) | | 1,441,319.539 |
Proposal 3.A.vi. To approve changes to the fundamental policy regarding underwriting of securities.
| | |
| | | Number of
shares voted |
For | | 8,771,893.921 |
Against | | 0 |
Abstain (includes broker non-votes) | | 1,441,319.539 |
Proposal 3.A.vii. To approve changes to the fundamental policy regarding diversification.
| | |
| | | Number of
shares voted |
For | | 8,772,278.921 |
Against | | 0 |
Abstain (includes broker non-votes) | | 1,440,934.539 |
Proposal 3.B.i. To approve changes to the policy/restriction regarding investment of its total net assets in securities of issuers that are restricted from being sold to the public without registration.
| | |
| | | Number of
shares voted |
For | | 8,377,605.321 |
Against | | 394,673.600 |
Abstain (includes broker non-votes) | | 1,440,934.539 |
Proxy Voting Results (unaudited)
Proposal 3.B.ii. To approve changes to the policy/restriction regarding the purchase of securities on margin.
| | |
| | | Number of
shares voted |
For | | 8,377,459.144 |
Against | | 394,819.777 |
Abstain (includes broker non-votes) | | 1,440,934.539 |
Proposal 3.B.iii. To approve changes to the policy/restriction regarding acquiring securities of other investment companies.
| | |
| | | Number of
shares voted |
For | | 8,377,605.321 |
Against | | 394,673.600 |
Abstain (includes broker non-votes) | | 1,440,934.539 |
Proposal 3.B.iv. To approve changes to the policy/restriction regarding warrants.
| | |
| | | Number of
shares voted |
For | | 8,377,074.144 |
Against | | 394,819.777 |
Abstain (includes broker non-votes) | | 1,441,319.539 |
Proposal 3.B.v. To approve changes to the policy/restriction regarding options on securities and with respect to stock index and currency futures and related options.
| | |
| | | Number of
shares voted |
For | | 8,377,220.321 |
Against | | 394,673.600 |
Abstain (includes broker non-votes) | | 1,441,319.539 |
Proposal 3.B.vi. To approve changes to the policy/restriction regarding hedging and derivative transactions.
| | |
| | | Number of
shares voted |
For | | 8,377,074.144 |
Against | | 394,819.777 |
Abstain (includes broker non-votes) | | 1,441,319.539 |
Proposal 3.B.vii. To approve changes to the policy/restriction regarding the purchase of foreign securities.
| | |
| | | Number of
shares voted |
For | | 8,377,860.880 |
Against | | 394,418.041 |
Abstain (includes broker non-votes) | | 1,440,934.539 |
Proxy Voting Results (unaudited)
Proposal 3.C.i. To approve changes to the policy/restriction regarding investment for the purpose of exercising control over management.
| | |
| | | Number of
shares voted |
For | | 8,771,492.185 |
Against | | 401.736 |
Abstain (includes broker non-votes) | | 1,441,319.539 |
Proposal 3.C.iii. To approve changes to the policy/restriction regarding short sales or short positions.
| | |
| | | Number of
shares voted |
For | | 8,771,492.185 |
Against | | 401.736 |
Abstain (includes broker non-votes) | | 1,441,319.539 |
Proposal 3.C.iv. To approve changes to the policy/restriction regarding participation in a joint or joint and several basis in trading account in securities.
| | |
| | | Number of
shares voted |
For | | 8,771,893.921 |
Against | | 0 |
Abstain (includes broker non-votes) | | 1,441,319.539 |
Proposal 3.C.v. To approve changes to the policy/restriction regarding investment in oil, gas or other mineral exploration or development programs.
| | |
| | | Number of
shares voted |
For | | 8,772,132.744 |
Against | | 146.177 |
Abstain (includes broker non-votes) | | 1,440,934.539 |
Proposal 3.C.vi. To approve changes to the policy/restriction regarding officers and directors of the Fund.
| | |
| | | Number of
shares voted |
For | | 8,771,877.185 |
Against | | 401.736 |
Abstain (includes broker non-votes) | | 1,440,934.539 |
Proposal 3.C.vii. To approve changes to the policy/restriction regarding investing in any company with less than three years continuous operation.
| | |
| | | Number of
shares voted |
For | | 8,771,893.921 |
Against | | 0 |
Abstain (includes broker non-votes) | | 1,441,319.539 |
Directors’ and Officers’ Information (unaudited)
The Statement of Additional Information provides additional information about the Fund’s directors and officers and can be obtained without charge by calling 1-800-466-3863, at www.manningnapieradvisors.com, or on the EDGAR Database on the SEC Internet web site (http://www.sec.gov). The following chart shows certain information about the Fund’s officers and directors, including their principal occupations during the last five years. Unless specific dates are provided, the individuals have held the listed positions for longer than five years.
INTERESTED DIRECTOR/OFFICER
| | |
| Name: | | B. Reuben Auspitz* |
| Address: | | 290 Woodcliff Drive
Fairport, NY 14450 |
| Age: | | 60 |
| Current Position(s) Held with Fund: | | Principal Executive Officer, President, Chairman & Director |
| Term of Office1 & Length of Time Served: | | Indefinite - Director since 1984; Vice President 1984 - 2003; President since 2004; Principal Executive Officer since 2002 |
| Principal Occupation(s) During Past 5 Years: | | Executive Vice President; Co-Executive Director; Executive Group Member**; Chief Compliance Officer since 2004 - Manning & Napier Advisors, Inc. President; Director - Manning & Napier Investor Services, Inc. Holds or has held one or more of the following titles for various subsidiaries and affiliates: President, Vice President, Director, Chairman, Treasurer, Chief Compliance Officer or Member. |
| Number of Portfolios Overseen within Fund Complex: | | 27 |
| Other Directorships Held Outside Fund Complex: | | N/A |
| |
| INDEPENDENT DIRECTORS | | |
| Name: | | Stephen B. Ashley |
| Address: | | 290 Woodcliff Drive
Fairport, NY 14450 |
| Age: | | 67 |
| Current Position(s) Held with Fund: | | Director, Audit Committee Member, Governance & Nominating Committee Member |
| Term of Office & Length of Time Served: | | Indefinite - Since 1996 |
| Principal Occupation(s) During Past 5 Years: | | Chairman, Director, President & Chief Executive Officer, The Ashley Group (property management and investment) |
| Number of Portfolios Overseen within Fund Complex: | | 27 |
| Other Directorships Held Outside Fund Complex: | | The Ashley Group |
| | | Fannie Mae |
| Name: | | Peter L. Faber |
| Address: | | 290 Woodcliff Drive
Fairport, NY 14450 |
| Age: | | 68 |
| Current Position(s) Held with Fund: | | Director, Governance & Nominating Committee Member |
| Term of Office & Length of Time Served: | | Indefinite - Since 1987 |
| Principal Occupation(s) During Past 5 Years: | | Senior Counsel, McDermott, Will & Emery LLP (law firm) |
| Number of Portfolios Overseen within Fund Complex: | | 27 |
| Other Directorships Held Outside Fund Complex: | | Partnership for New York City, Inc.
New York Collegium
Boston Early Music Festival |
| Name: | | Harris H. Rusitzky |
| Address: | | 290 Woodcliff Drive
Fairport, NY 14450 |
| Age: | | 72 |
| Current Position(s) Held with Fund: | | Director, Audit Committee Member, Governance & Nominating Committee Member |
| Term of Office & Length of Time Served: | | Indefinite - Since 1985 |
| Principal Occupation(s) During Past 5 Years: | | President, The Greening Group (business consultants); Partner, The Restaurant Group (restaurants) |
| Number of Portfolios Overseen within Fund Complex: | | 27 |
| Other Directorships Held Outside Fund Complex: | | N/A |
Directors’ and Officers’ Information (unaudited)
| | |
| Name: | | Paul A. Brooke |
| Address: | | 290 Woodcliff Drive
Fairport, NY 14450 |
| Age: | | 62 |
| Current Position(s) Held with Fund: | | Director, Audit Committee Member, Governance & Nominating Committee Member |
| Term of Office & Length of Time Served: | | Indefinite - Since 2007 |
| Principal Occupation(s) During Past 5 Years: | | Chairman & CEO, Alsius Corp. (investments); Managing Member, PMSV Holdings LLC (investments) |
| Number of Portfolios Overseen within Fund Complex: | | 27 |
| Other Directorships Held Outside Fund Complex: | | Incyte Corp.
ViroPharma, Inc.
HLTH Corp.
Cheyne Capital International
MPM Bio-equities
GMP Companies
HoustonPharma |
| OFFICERS | | |
| |
| Name: | | Jeffrey S. Coons, Ph.D., CFA |
| Address: | | 290 Woodcliff Drive
Fairport, NY 14450 |
| Age: | | 44 |
| Current Position(s) Held with Fund: | | Vice President |
| Term of Office1 & Length of Time Served: | | Since 2004 |
| Principal Occupation(s) During Past 5 Years: | | Co-Director of Research since 2002 & Executive Group Member**, Manning & Napier Advisors, Inc. Holds one or more of the following titles for various subsidiaries and affiliates: President, Director, Treasurer or Senior Trust Officer. |
| Number of Portfolios Overseen within Fund Complex: | | 27 |
| Other Directorships Held Outside Fund Complex: | | N/A |
| Name: | | Christine Glavin |
| Address: | | 290 Woodcliff Drive
Fairport, NY 14450 |
| Age: | | 41 |
| Current Position(s) Held with Fund: | | Principal Financial Officer, Chief Financial Officer |
| Term of Office1 & Length of Time Served: | | Principal Financial Officer since 2002; Chief Financial Officer since 2001 |
| Principal Occupation(s) During Past 5 Years: | | Fund Reporting Manager, Manning & Napier Advisors, Inc. |
| Number of Portfolios Overseen within Fund Complex: | | 27 |
| Other Directorships Held Outside Fund Complex: | | N/A |
| Name: | | Jodi L. Hedberg |
| Address: | | 290 Woodcliff Drive
Fairport, NY 14450 |
| Age: | | 40 |
| Current Position(s) Held with Fund: | | Corporate Secretary, Chief Compliance Officer, Anti-Money Laundering Compliance Officer |
| Term of Office1 & Length of Time Served: | | Corporate Secretary since 1997; Chief Compliance Officer since 2004 |
| Principal Occupation(s) During Past 5 Years: | | Director of Compliance, Manning & Napier Advisors, Inc. and affiliates; Corporate Secretary, Manning & Napier Investor Services, Inc. since 2006 |
| Number of Portfolios Overseen within Fund Complex: | | 27 |
| Other Directorships Held Outside Fund Complex: | | N/A |
*Interested Director, within the meaning of the Investment Company Act of 1940 by reason of his position with the Fund’s investment advisor and distributor. Mr. Auspitz serves as the Executive Vice President and Director, Manning & Napier Advisors, Inc. and President and Director, Manning & Napier Investor Services, Inc., the Fund’s distributor.
**The Executive Group performs the duties of the Office of the Chief Executive of Manning & Napier Advisors, Inc.
1The term of office for President, Vice President, Chief Financial Officer, and Corporate Secretary is one year and until their respective successors are chosen and qualified. All other officers’ terms are indefinite.
Literature Requests (unaudited)
Proxy Voting Policies and Procedures
A description of the policies and procedures that the Fund uses to determine how to vote proxies relating to portfolio securities is available, without charge, upon request:
| | |
By phone | | 1-800-466-3863 |
On the Securities and Exchange Commission’s (SEC) web site | | http://www.sec.gov |
Proxy Voting Record
Information regarding how the Fund voted proxies relating to portfolio securities during the most recent 12-month period ended June 30th is available, without charge, upon request:
| | |
By phone | | 1-800-466-3863 |
On the SEC’s web site | | http://www.sec.gov |
Quarterly Portfolio Holdings
The Series’ complete schedule of portfolio holdings for the 1st and 3rd quarters of each fiscal year are provided on Form N-Q, and are available, without charge, upon request:
| | |
By phone | | 1-800-466-3863 |
On the SEC’s web site | | http://www.sec.gov |
The Series’ Form N-Q may be reviewed and copied at the SEC’s Public Reference Room in Washington, D.C. Information on the operation of the Public Reference Room may be obtained by calling 1-800-SEC-0330.
Prospectus and Statement of Additional Information (SAI)
The prospectus and SAI provide additional information about each Series, including charges, expenses and risks. These documents are available, without charge, upon request:
| | |
By phone | | 1-800-466-3863 |
On the SEC’s web site | | http://www.sec.gov |
On the Advisor’s web site | | http://www.manningnapieradvisors.com |
Additional information available at www.manningnapieradvisors.com
1. Fund Holdings - Month-End
2. Fund Holdings - Quarter-End
3. Shareholder Report - Annual
4. Shareholder Report - Semi-Annual
Manning & Napier Fund, Inc.
| | | | |
| INTERNATIONAL SERIES | | | | | Annual Report - December 31, 2007 |

Management Discussion and Analysis (unaudited)
Dear Shareholders:
The International Series returned 13.01% for the 2007 calendar year. The Series outperformed the Standard & Poor’s (S&P) 500 Total Return Index, a measure of the performance of U.S. stocks, but its performance was below that of the Morgan Stanley Capital International (MSCI) All Country World Index ex U.S., which had a strong year, appreciating 16.65%. In general, foreign stock markets had a negative fourth quarter due to the effects of the U.S.-led credit crunch and the subprime mortgage fallout.
The Series’ underperformance for the full year relative to the international benchmark can be attributed to a number of factors, including strong performance from emerging market countries in Asia and Latin America, an area where the Series was underweight relative to the benchmark. Stocks tied to energy and commodities were also strong performers, and the Series had a lower weighting in these than the benchmark. Stock selection within countries became more important for the Series as stocks leveraged to global growth were the most significant drivers of the markets’ appreciation. The Series held some stocks in emerging markets, but kept fairly defensive holdings in developed markets, because the global growth story looked “long in the tooth”. Because economic growth remained strong, the Series did not benefit from this positioning until the 4th quarter of 2007, in which it made up ground on the benchmark.
The International Series remains predominantly invested in Western Europe, based on our view that Western European countries are removing burdens on their corporate sectors, such as strict labor laws and high taxes, to regain competitiveness lost to regions with lower labor costs, such as Eastern Europe and Asia. Western Europe, and Germany in particular, has initiated a fair amount of reform over the last few years. However, reform has been more difficult in 2007 as stronger growth and corporate profits have made controversial reform less urgent.
Germany’s stock market had a very strong year in 2007, as did our holdings in Germany. However the German market did better than our holdings because we had less exposure to more cyclical stocks, which were the stronger performers. Going into the year there were concerns that a value added tax (VAT) increase from 16% to 19% would hurt the German consumer. While it had some effect, Germany’s economy kept roaring, especially from its industrial and basic materials exporting sectors. German companies also benefited from past reforms that allowed the country to restructure and become more competitive in the global economy.
On the other hand, France was much more proactive on the reform front in 2007. The election victory of Nicolas Sarkozy propelled France in a new direction. Upon taking office he immediately cut taxes on overtime pay in an effort to encourage increased working hours and to give employees more discretionary income. He is also working towards eliminating discrepancies between private and public sector benefits to decrease the burden on the state and to increase labor flexibility. Thus far, more has been expected of him than actually delivered, but despite these shortcomings, his short time in office has been the most ambitious of any French administration in over a generation. We increased the Series’ position in French companies that would benefit from the improving French labor market and a stronger domestic consumer.
We decreased the Series’ position in Japan in the second quarter. Japan was one of the weakest performers of the global markets; therefore our underweight relative to the benchmark helped performance. Over the last few years Japan has made giant reform steps such as postal privatization, cleaning up the banking sector, and loosening labor restrictions. Corporations, encouraged by the government reforms, have restructured, improving their balance sheets, and profitability. Japanese companies were also bailed out by a strong global economy that fueled demand for Japanese goods from China. However, since much of the restructuring has led to more temporary jobs and falling wages, the domestic economy has never fully participated in the growth. Economic growth is now faltering as global growth decelerates. This is already being felt in the corporate sector with sharp deceleration in corporate investment and industrial production.
Management Discussion and Analysis (unaudited)
In the early part of the year the Series bought positions in Malaysia and South Korea. Although both countries are emerging markets, there were country-specific reasons for taking positions in each. In Malaysia, the government took steps to improve the profitability at government-linked companies, enacted reforms to attract foreign investment, and addressed structural issues through budget expenditures. Malaysia has been resistant to foreign investment since the Asian financial crisis in the late 1990s. However, Malaysia has begun to realize that to attract capital, businesses needed to be restructured with a focus on profits. The Series’ purchases in South Korea were exporting companies. The South Korean Won had been strong due to the government’s monetary tightening. However the reasons for the tightening — rising inflation, credit growth, and rapid housing price appreciation — were all weakening. Depreciation in the currency relative to its Asian competitors would benefit Korean exporters in what was still a strong global environment at the time. The Malaysian and South Korean stocks purchased provided strong performance for the Series.
The Series added positions in Brazil in the second quarter in light of a number of positive developments for Brazil’s economy. President Lula continues to steer the economy in the right direction, by improving Brazil’s fiscal position, keeping inflation at bay, and stimulating growth. We focused on two specific industries for the Series: water utilities and home builders. Water utilities in Brazil are experiencing a number of tailwinds. Firstly, the market is not fully penetrated. As incomes grow, more people are demanding, and able to afford, water and sewage services. The government is also developing a regulatory body that will help improve oversight and transparency, as well as protect assets and improve the concession agreements with municipalities and the states. For the homebuilders, there is pent up demand for housing, rising incomes are bringing more families into the demand pool, and most importantly new financing vehicles are making home purchases possible for the middle and lower middle class through Brazil’s state-backed mortgage financing arm.
Midway through the year we sold out of the Series’ remaining holdings in Poland. Poland became increasingly concerning on a number of fronts. Inflation was rising sharply, wages were spiraling out of control from a lack of skilled labor, political uncertainty loomed as the ruling coalition dissolved, and valuations were expensive. The Series locked in strong gains from the sold positions.
We appreciate your business and wish you all the very best in the coming year.
Sincerely,
Manning & Napier Advisors, Inc.
Performance Update as of December 31, 2007 (unaudited)
| | | | | | | | | | |
| | | Average Annual Total Returns
As of December 31, 2007 | | |
| | | One
Year | | Five
Year | | Ten
Year | | Since
Inception1 | | |
Manning & Napier Fund, Inc. - International Series2 | | 13.01% | | 21.31% | | 10.59% | | 11.18% | | |
Standard & Poor’s (S&P) 500 Total Return Index3 | | 5.51% | | 12.84% | | 5.91% | | 10.68% | | |
Morgan Stanley Capital International (MSCI) All Country World Index ex U.S.3 | | 16.65% | | 24.02% | | 9.75% | | 9.72% | | |
The following graph compares the value of a $10,000 investment in the Manning & Napier Fund, Inc. - International Series for the ten years ended December 31, 2007 to the S&P 500 Total Return Index and the MSCI All Country World Index ex U.S.
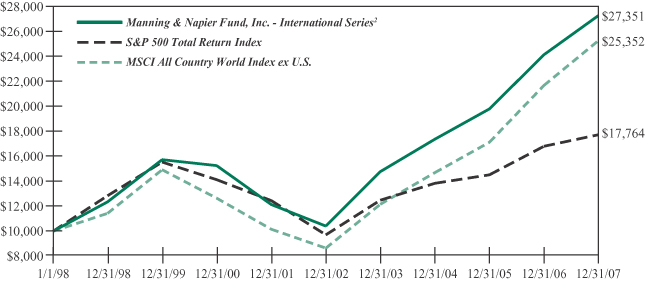
1Performance numbers for the Series and the S&P 500 Total Return Index are calculated from August 27, 1992, the Series’ inception date. Prior to 2001, the MSCI All Country World Index ex U.S. only published month-end numbers; therefore, performance numbers for the Index are calculated from August 31, 1992.
2The Series’ performance does not reflect the deduction of taxes that a shareholder would pay on fund distributions or the redemption of shares. The Series’ performance is historical and may not be indicative of future results. The performance returns shown are inclusive of the net expense ratio of the Series. For the year ended December 31, 2007, this net expense ratio was 1.16%. The gross expense ratio, which does not account for any voluntary or contractual waivers currently in effect, was 1.16% for the year ended December 31, 2007.
3The S&P 500 Total Return Index is an unmanaged capitalization-weighted measure of 500 widely held common stocks listed on the New York Stock Exchange, American Stock Exchange and the Over-the-Counter market. The Index returns assume daily reinvestment of dividends. The MSCI All Country World Index ex U.S. is a free float-adjusted market capitalization weighted index that is designed to measure equity market performance in the global developed and emerging markets and consists of 47 developed and emerging market country indices outside the United States. The Index is denominated in U.S Dollars. The Index returns assume daily reinvestment of gross dividends (which do not account for foreign dividend taxation) from the inception of the Series (see Note 1 above) through December 31, 1998, as net returns were not available. Subsequent to December 31, 1998, the Index returns assume daily reinvestment of net dividends (thus accounting for foreign dividend taxation). Both Indices’ returns, unlike Series returns, do not reflect any fees or expenses.
Shareholder Expense Example (unaudited)
As a shareholder of the Series, you may incur two types of costs: (1) transaction costs, including potential wire charges on redemptions and (2) ongoing costs, including management fees and other Series expenses. This example is intended to help you understand your ongoing costs (in dollars) of investing in the Series and to compare these costs with the ongoing costs of investing in other mutual funds.
The example is based on an investment of $1,000 invested at the beginning of the period and held for the entire period (July 1, 2007 to December 31, 2007).
Actual Expenses
The first line of the table below provides information about actual account values and actual expenses. You may use the information in this line, together with the amount you invested, to estimate the expenses that you paid over the period. Simply divide your account value by $1,000 (for example, an $8,600 account value divided by $1,000 = 8.6), then multiply the result by the number in the first line under the heading entitled “Expenses Paid During Period” to estimate the expenses you paid on your account during this period.
Hypothetical Example for Comparison Purposes
The second line of the table below provides information about hypothetical account values and hypothetical expenses based on the Series’ actual expense ratio and an assumed rate of return of 5% per year before expenses, which is not the Series’ actual return. The hypothetical account values and expenses may not be used to estimate the actual ending account balance or expenses you paid during the period. You may use this information to compare the ongoing costs of investing in the Series and other funds. To do so, compare this 5% hypothetical example with the 5% hypothetical examples that appear in the shareholder reports of the other funds.
Please note that the expenses shown in the table are meant to highlight your ongoing costs only and do not reflect any transaction costs, such as potential wire charges on redemptions. Therefore, the second line of the table is useful in comparing ongoing costs only, and will not help you determine the relative total costs of owning different funds. In addition, if these transaction costs were included, your costs would have been higher.
| | | | | | | | | |
| | | Beginning
Account Value
7/1/07 | | Ending
Account Value
12/31/07 | | Expenses Paid
During Period*
7/1/07-12/31/07 |
Actual | | $ | 1,000.00 | | $ | 1,012.70 | | $ | 5.94 |
Hypothetical
(5% return before expenses) | | $ | 1,000.00 | | $ | 1,019.31 | | $ | 5.96 |
*Expenses are equal to the Series’ annualized expense ratio (for the six-month period) of 1.17%, multiplied by the average account value over the period, multiplied by 184/365 (to reflect the one-half year period). Expenses are based on the most recent fiscal half year; therefore, the expense ratio stated above may differ from the expense ratio stated in the financial highlights, which is based on one-year data.
Portfolio Composition as of December 31, 2007 (unaudited)
Country Allocation1
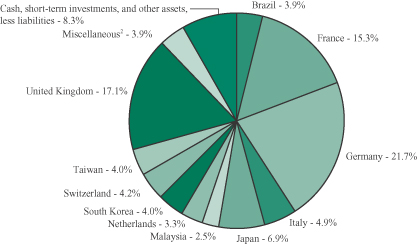
1As a percentage of net assets.
2Miscellaneous
Mexico 0.7%
Norway 0.9%
Portugal 1.6%
Spain 0.7%
Sector Allocation3
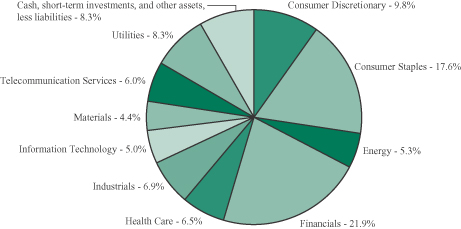
3As a percentage of net assets.
Investment Portfolio - December 31, 2007
| | | | | |
| | | Shares | | Value
(Note 2) |
| | | | | |
| | |
COMMON STOCKS - 91.7% | | | | | |
| | |
Consumer Discretionary - 9.8% | | | | | |
Auto Components - 1.0% | | | | | |
Hankook Tire Co. Ltd. (South Korea) | | 143,000 | | $ | 2,735,599 |
| | | | | |
Household Durables - 2.0% | | | | | |
Corporacion Geo S.A. de C.V. - Class B* (Mexico) | | 627,000 | | | 1,804,234 |
LG Electronics, Inc. (South Korea) | | 35,000 | | | 3,740,515 |
| | | | | |
| | | | | 5,544,749 |
| | | | | |
Media - 4.3% | | | | | |
Impresa S.A. (SGPS)* (Portugal) | | 338,000 | | | 1,017,894 |
Mediaset S.p.A. (Italy) | | 175,000 | | | 1,766,527 |
PT Multimedia-Servicos de Telecomunicacoes e Multimedia S.A. - ADR (SGPS) (Portugal) | | 13,275 | | | 185,354 |
Reed Elsevier plc - ADR (United Kingdom) | | 55,600 | | | 2,996,840 |
Societe Television Francaise 1 (France) | | 86,800 | | | 2,322,145 |
Wolters Kluwer N.V. (Netherlands) | | 105,037 | | | 3,451,891 |
| | | | | |
| | | | | 11,740,651 |
| | | | | |
Multiline Retail - 1.1% | | | | | |
PPR (France) | | 18,300 | | | 2,942,810 |
| | | | | |
Specialty Retail - 0.7% | | | | | |
KOMERI Co. Ltd. (Japan) | | 67,000 | | | 1,799,463 |
| | | | | |
Textiles, Apparel & Luxury Goods - 0.7% | | | | | |
LVMH S.A. (Louis Vuitton Moet Hennessy) (France) | | 14,920 | | | 1,803,382 |
| | | | | |
Total Consumer Discretionary | | | | | 26,566,654 |
| | | | | |
Consumer Staples - 17.6% | | | | | |
Beverages - 3.2% | | | | | |
Diageo plc (United Kingdom) | | 130,000 | | | 2,794,530 |
Kirin Holdings Co. Ltd. (Japan) | | 173,000 | | | 2,541,567 |
Scottish & Newcastle plc (United Kingdom) | | 229,000 | | | 3,379,779 |
| | | | | |
| | | | | 8,715,876 |
| | | | | |
Food & Staples Retailing - 4.6% | | | | | |
Carrefour S.A. (France) | | 38,832 | | | 3,025,199 |
Casino Guichard-Perrachon S.A. (France) | | 27,300 | | | 2,968,901 |
President Chain Store Corp. (Taiwan) | | 495,000 | | | 1,300,623 |
Tesco plc (United Kingdom) | | 533,000 | | | 5,063,081 |
| | | | | |
| | | | | 12,357,804 |
| | | | | |
Food Products - 6.8% | | | | | |
Cadbury Schweppes plc (United Kingdom) | | 358,000 | | | 4,425,031 |
Groupe Danone (France) | | 31,952 | | | 2,868,038 |
| | |
| 6 | | The accompanying notes are an integral part of the financial statements. |
Investment Portfolio - December 31, 2007
| | | | | |
| | | Shares | | Value
(Note 2) |
| | | | | |
| | |
COMMON STOCKS (continued) | | | | | |
| | |
Consumer Staples (continued) | | | | | |
Food Products (continued) | | | | | |
Nestle S.A. (Switzerland) | | 8,400 | | $ | 3,858,998 |
Suedzucker AG (Germany) | | 72,400 | | | 1,711,461 |
Unilever plc - ADR (United Kingdom) | | 148,000 | | | 5,538,160 |
| | | | | |
| | | | | 18,401,688 |
| | | | | |
Household Products - 1.9% | | | | | |
Kao Corp. (Japan) | | 47,000 | | | 1,413,787 |
Reckitt Benckiser Group plc (United Kingdom) | | 62,500 | | | 3,625,027 |
| | | | | |
| | | | | 5,038,814 |
| | | | | |
Personal Products - 1.1% | | | | | |
Clarins S.A. (France) | | 35,777 | | | 2,983,857 |
| | | | | |
Total Consumer Staples | | | | | 47,498,039 |
| | | | | |
Energy - 5.3% | | | | | |
Oil, Gas & Consumable Fuels - 5.3% | | | | | |
BP plc (United Kingdom) | | 205,000 | | | 2,509,405 |
Eni S.p.A. (Italy) | | 143,154 | | | 5,242,395 |
Royal Dutch Shell plc - Class B (Netherlands) | | 70,500 | | | 2,932,764 |
Total S.A. (France) | | 45,160 | | | 3,751,890 |
| | | | | |
Total Energy | | | | | 14,436,454 |
| | | | | |
Financials - 21.9% | | | | | |
Capital Markets - 1.0% | | | | | |
Daiwa Securities Group, Inc. (Japan) | | 79,000 | | | 718,568 |
Nomura Holdings, Inc. (Japan) | | 63,000 | | | 1,068,800 |
OSK Holdings Berhad (Malaysia) | | 1,337,000 | | | 938,529 |
| | | | | |
| | | | | 2,725,897 |
| | | | | |
Commercial Banks - 10.9% | | | | | |
Aareal Bank AG (Germany) | | 92,000 | | | 4,131,688 |
Banca Monte dei Paschi di Siena S.p.A. (Italy) | | 181,000 | | | 974,406 |
BNP Paribas (France) | | 26,000 | | | 2,821,063 |
The Chugoku Bank Ltd. (Japan) | | 137,000 | | | 1,914,566 |
Commerzbank AG (Germany) | | 62,500 | | | 2,402,089 |
Credit Agricole S.A. (France) | | 57,900 | | | 1,952,741 |
The Hachijuni Bank Ltd. (Japan) | | 244,000 | | | 1,647,055 |
Hong Leong Financial Group Berhad (Malaysia) | | 653,000 | | | 1,185,477 |
Intesa Sanpaolo (Italy) | | 159,799 | | | 1,263,833 |
Mitsubishi UFJ Financial Group, Inc. (Japan) | | 170,000 | | | 1,593,465 |
Royal Bank of Scotland Group plc (United Kingdom) | | 248,100 | | | 2,192,560 |
Societe Generale (France) | | 11,312 | | | 1,636,010 |
| | |
| The accompanying notes are an integral part of the financial statements. | | 7 |
Investment Portfolio - December 31, 2007
| | | | | |
| | | Shares | | Value
(Note 2) |
| | | | | |
| | |
COMMON STOCKS (continued) | | | | | |
| | |
Financials (continued) | | | | | |
Commercial Banks (continued) | | | | | |
The Sumitomo Trust & Banking Co. Ltd. (Japan) | | 247,000 | | $ | 1,654,038 |
UniCredito Italiano S.p.A. (Italy) | | 489,000 | | | 4,060,464 |
| | | | | |
| | | | | 29,429,455 |
| | | | | |
Diversified Financial Services - 0.9% | | | | | |
ING Groep N.V. (Netherlands) | | 65,395 | | | 2,557,330 |
| | | | | |
Insurance - 5.6% | | | | | |
Allianz SE (Germany) | | 32,620 | | | 7,061,531 |
Axa (France) | | 44,892 | | | 1,797,544 |
Muenchener Rueckver AG (Germany) | | 32,400 | | | 6,292,527 |
| | | | | |
| | | | | 15,151,602 |
| | | | | |
Real Estate Investment Trusts (REITS) - 1.4% | | | | | |
Alstria Office REIT AG* (Germany) | | 250,000 | | | 3,727,852 |
| | | | | |
Real Estate Management & Development - 2.1% | | | | | |
IOI Properties Berhad (Malaysia) | | 372,000 | | | 1,474,493 |
Klabin Segall S.A. (Brazil) | | 140,000 | | | 1,057,673 |
Rodobens Negocios Imobiliarios S.A. (Brazil) | | 259,000 | | | 3,079,174 |
| | | | | |
| | | | | 5,611,340 |
| | | | | |
Total Financials | | | | | 59,203,476 |
| | | | | |
| | |
Health Care - 6.5% | | | | | |
Health Care Equipment & Supplies - 0.5% | | | | | |
Straumann Holding AG (Switzerland) | | 5,189 | | | 1,431,456 |
| | | | | |
Pharmaceuticals - 6.0% | | | | | |
AstraZeneca plc (United Kingdom) | | 22,300 | | | 960,514 |
AstraZeneca plc - ADR (United Kingdom) | | 37,000 | | | 1,584,340 |
GlaxoSmithKline plc (United Kingdom) | | 138,000 | | | 3,513,107 |
Novartis AG - ADR (Switzerland) | | 49,000 | | | 2,661,190 |
Sanofi-Aventis (France) | | 21,083 | | | 1,941,125 |
Shire plc (United Kingdom) | | 170,000 | | | 3,887,861 |
Takeda Pharmaceutical Co. Ltd. (Japan) | | 28,000 | | | 1,646,911 |
| | | | | |
| | | | | 16,195,048 |
| | | | | |
Total Health Care | | | | | 17,626,504 |
| | | | | |
Industrials - 6.9% | | | | | |
Airlines - 1.6% | | | | | |
Deutsche Lufthansa AG (Germany) | | 164,800 | | | 4,382,364 |
| | | | | |
Commercial Services & Supplies - 0.4% | | | | | |
Taiwan Secom Co. Ltd. (Taiwan) | | 627,210 | | | 974,878 |
| | | | | |
| | |
| 8 | | The accompanying notes are an integral part of the financial statements. |
Investment Portfolio - December 31, 2007
| | | | | |
| | | Shares | | Value
(Note 2) |
| | | | | |
| | |
COMMON STOCKS (continued) | | | | | |
| | |
Industrials (continued) | | | | | |
Electrical Equipment - 0.6% | | | | | |
Teco Electric & Machinery Co. Ltd. (Taiwan) | | 3,280,000 | | $ | 1,638,685 |
| | | | | |
Industrial Conglomerates - 3.1% | | | | | |
Siemens AG (Germany) | | 41,000 | | | 6,498,480 |
Sonae S.A. (SGPS) (Portugal) | | 669,100 | | | 1,936,755 |
| | | | | |
| | | | | 8,435,235 |
| | | | | |
Machinery - 0.6% | | | | | |
FANUC Ltd. (Japan) | | 15,500 | | | 1,509,758 |
| | | | | |
Transportation Infrastructure - 0.6% | | | | | |
Malaysia Airports Holdings Berhad (Malaysia) | | 1,716,000 | | | 1,568,024 |
| | | | | |
Total Industrials | | | | | 18,508,944 |
| | | | | |
Information Technology - 5.0% | | | | | |
Communications Equipment - 0.6% | | | | | |
D-Link Corp. (Taiwan) | | 964,920 | | | 1,705,111 |
| | | | | |
Electronic Equipment & Instruments - 1.7% | | | | | |
KEYENCE Corp. (Japan) | | 4,950 | | | 1,221,768 |
Samsung SDI Co. Ltd. (South Korea) | | 34,200 | | | 2,430,587 |
Yageo Corp. (Taiwan) | | 2,690,000 | | | 945,723 |
| | | | | |
| | | | | 4,598,078 |
| | | | | |
Semiconductors & Semiconductor Equipment - 1.5% | | | |
Hynix Semiconductor, Inc.* (South Korea) | | 66,000 | | | 1,830,394 |
Taiwan Semiconductor Manufacturing Co. Ltd. - ADR (Taiwan) | | 217,378 | | | 2,165,085 |
| | | | | |
| | | | | 3,995,479 |
| | | | | |
Software - 1.2% | | | | | |
SAP AG (Germany) | | 61,400 | | | 3,197,281 |
| | | | | |
Total Information Technology | | | | | 13,495,949 |
| | | | | |
Materials - 4.4% | | | | | |
Chemicals - 3.6% | | | | | |
Arkema* (France) | | 1,129 | | | 74,173 |
Bayer AG (Germany) | | 107,350 | | | 9,788,053 |
| | | | | |
| | | | | 9,862,226 |
| | | | | |
Construction Materials - 0.8% | | | | | |
Taiwan Cement Corp. (Taiwan) | | 1,503,790 | | | 2,086,923 |
| | | | | |
Total Materials | | | | | 11,949,149 |
| | | | | |
| | |
| The accompanying notes are an integral part of the financial statements. | | 9 |
Investment Portfolio - December 31, 2007
| | | | | | |
| | | Shares/ Principal Amount | | Value
(Note 2) |
| | | | | | |
| | |
COMMON STOCKS (continued) | | | | | | |
| | |
Telecommunication Services - 6.0% | | | | | | |
Diversified Telecommunication Services - 5.4% | | | | | | |
France Telecom S.A. (France) | | | 124,500 | | $ | 4,481,010 |
France Telecom S.A. - ADR (France) | | | 31,000 | | | 1,104,530 |
Portugal Telecom S.A. (SGPS) - ADR (Portugal) | | | 94,250 | | | 1,227,135 |
Swisscom AG - ADR (Switzerland) | | | 85,000 | | | 3,285,250 |
Telefonica S.A. - ADR (Spain) | | | 18,250 | | | 1,781,017 |
Telenor ASA - ADR (Norway) | | | 36,250 | | | 2,584,625 |
| | | | | | |
| | | | | | 14,463,567 |
| | | | | | |
Wireless Telecommunication Services - 0.6% | | | | | | |
Digi.com Berhad (Malaysia) | | | 227,000 | | | 1,703,359 |
| | | | | | |
Total Telecommunication Services | | | | | | 16,166,926 |
| | | | | | |
Utilities - 8.3% | | | | | | |
Electric Utilities - 3.5% | | | | | | |
E.ON AG (Germany) | | | 43,737 | | | 9,310,193 |
| | | | | | |
Multi-Utilities - 2.5% | | | | | | |
National Grid plc (United Kingdom) | | | 229,000 | | | 3,801,397 |
Suez S.A. (France) | | | 43,340 | | | 2,950,622 |
| | | | | | |
| | | | | | 6,752,019 |
| | | | | | |
Water Utilities - 2.3% | | | | | | |
Companhia de Saneamento Basico do Estado de Sao Paulo (SABESP) (Brazil) | | | 135,040 | | | 3,122,088 |
Companhia de Saneamento de Minas Gerais - Copasa MG (Brazil) | | | 182,000 | | | 3,171,445 |
| | | | | | |
| | | | | | 6,293,533 |
| | | | | | |
Total Utilities | | | | | | 22,355,745 |
| | | | | | |
TOTAL COMMON STOCKS
(Identified Cost $163,810,583) | | | | | | 247,807,840 |
| | | | | | |
| | |
SHORT-TERM INVESTMENTS - 8.1% | | | | | | |
Dreyfus Treasury Cash Management - Institutional Shares | | | 7,767,470 | | | 7,767,470 |
Fannie Mae Discount Note, 1/7/2008 | | $ | 14,000,000 | | | 13,988,493 |
| | | | | | |
TOTAL SHORT-TERM INVESTMENTS
(Identified Cost $21,757,513) | | | | | | 21,755,963 |
| | | | | | |
TOTAL INVESTMENTS - 99.8%
(Identified Cost $185,568,096) | | | | | | 269,563,803 |
| | |
OTHER ASSETS, LESS LIABILITIES - 0.2% | | | | | | 515,743 |
| | | | | | |
NET ASSETS - 100% | | | | | $ | 270,079,546 |
| | | | | | |
*Non-income producing security
ADR - American Depository Receipt
The Series’ portfolio holds, as a percentage of net assets, greater than 10% in the following countries: Germany - 21.7%; United Kingdom - 17.1%; France - 15.3%.
| | |
| 10 | | The accompanying notes are an integral part of the financial statements. |
Statement of Assets and Liabilities
December 31, 2007
| | | |
ASSETS: | | | |
| | | |
| | | |
| |
Investments, at value (identified cost $185,568,096) (Note 2) | | $ | 269,563,803 |
Foreign currency, at value (cost $64,832) | | | 65,327 |
Receivable for fund shares sold | | | 520,140 |
Dividends receivable | | | 268,293 |
Foreign tax reclaims receivable | | | 137,515 |
| | | |
TOTAL ASSETS | | | 270,555,078 |
| | | |
| LIABILITIES: | | | |
| |
Accrued management fees (Note 3) | | | 228,763 |
Accrued fund accounting and transfer agent fees (Note 3) | | | 15,081 |
Accrued Chief Compliance Officer service fees (Note 3) | | | 714 |
Payable for fund shares repurchased | | | 160,267 |
Audit fees payable | | | 35,850 |
Accrued custodian fees | | | 18,630 |
Other payables and accrued expenses | | | 16,227 |
| | | |
TOTAL LIABILITIES | | | 475,532 |
| | | |
TOTAL NET ASSETS | | $ | 270,079,546 |
| | | |
NET ASSETS CONSIST OF: | | | |
| |
Capital stock | | $ | 248,465 |
Additional paid-in-capital | | | 181,187,803 |
Undistributed net investment income | | | 36,293 |
Accumulated net realized gain on investments, foreign currency and
other assets and liabilities | | | 4,600,418 |
Net unrealized appreciation on investments, foreign currency and other assets and liabilities | | | 84,006,567 |
| | | |
TOTAL NET ASSETS | | $ | 270,079,546 |
| | | |
NET ASSET VALUE, OFFERING PRICE AND REDEMPTION PRICE PER SHARE ($270,079,546/24,846,522 shares) | | $ | 10.87 |
| | | |
| | |
| The accompanying notes are an integral part of the financial statements. | | 11 |
Statement of Operations
For the Year Ended December 31, 2007
| | | | |
INVESTMENT INCOME: | | | | |
| | | | |
| |
Dividends (net of foreign tax withheld, $776,838) | | $ | 6,083,848 | |
Interest | | | 451,758 | |
| | | | |
Total Investment Income | | | 6,535,606 | |
| | | | |
| EXPENSES: | | | | |
| |
Management fees (Note 3) | | | 2,484,560 | |
Fund accounting and transfer agent fees (Note 3) | | | 162,135 | |
Directors’ fees (Note 3) | | | 7,774 | |
Chief Compliance Officer service fees (Note 3) | | | 6,100 | |
Custodian fees | | | 104,700 | |
Miscellaneous | | | 118,127 | |
| | | | |
Total Expenses | | | 2,883,396 | |
| | | | |
NET INVESTMENT INCOME | | | 3,652,210 | |
| | | | |
| REALIZED AND UNREALIZED GAIN (LOSS) ON INVESTMENTS: | | | | |
| |
Net realized gain (loss) on - | | | | |
Investments | | | 7,032,673 | |
Foreign currency and other assets and liabilities | | | (227,262 | ) |
| | | | |
| | | 6,805,411 | |
| | | | |
| |
Net change in unrealized appreciation on - | | | | |
Investments | | | 19,020,934 | |
Foreign currency and other assets and liabilities | | | 1,603 | |
| | | | |
| | | 19,022,537 | |
| | | | |
| |
NET REALIZED AND UNREALIZED GAIN (LOSS) ON INVESTMENTS | | | 25,827,948 | |
| | | | |
NET INCREASE IN NET ASSETS RESULTING FROM
OPERATIONS | | $ | 29,480,158 | |
| | | | |
| | |
| 12 | | The accompanying notes are an integral part of the financial statements. |
Statements of Changes in Net Assets
| | | | | | | | |
| | | For the
Year Ended
12/31/07 | | | For the
Year Ended
12/31/06 | |
| | | | | | | | |
| INCREASE (DECREASE) IN NET ASSETS: | | | | | | | | |
| | |
| OPERATIONS: | | | | | | | | |
| | |
Net investment income | | $ | 3,652,210 | | | $ | 2,730,077 | |
Net realized gain on investments and foreign currency | | | 6,805,411 | | | | 35,089,156 | |
Net change in unrealized appreciation on investments and foreign currency | | | 19,022,537 | | | | 3,929,198 | |
| | | | | | | | |
Net increase from operations | | | 29,480,158 | | | | 41,748,431 | |
| | | | | | | | |
| DISTRIBUTIONS TO SHAREHOLDERS (Note 8): | | | | | | | | |
| | |
From net investment income | | | (3,469,574 | ) | | | (2,592,847 | ) |
From net realized gain on investments | | | (2,432,255 | ) | | | (36,732,750 | ) |
| | | | | | | | |
Total distributions to shareholders | | | (5,901,829 | ) | | | (39,325,597 | ) |
| | | | | | | | |
| CAPITAL STOCK ISSUED AND REPURCHASED: | | | | | | | | |
| | |
Net increase from capital share transactions
(Note 5) | | | 30,520,529 | | | | 20,390,350 | |
| | | | | | | | |
Net increase in net assets | | | 54,098,858 | | | | 22,813,184 | |
| | |
| NET ASSETS: | | | | | | | | |
| | |
Beginning of year | | | 215,980,688 | | | | 193,167,504 | |
| | | | | | | | |
End of year (including undistributed net investment income of $36,293 and $80,919, respectively) | | $ | 270,079,546 | | | $ | 215,980,688 | |
| | | | | | | | |
| | |
| The accompanying notes are an integral part of the financial statements. | | 13 |
Financial Highlights
| | | | | | | | | | |
| | | For the Years Ended |
| | | 12/31/07 | | 12/31/06 | | 12/31/05 | | 12/31/04 | | 12/31/03 |
| | | | | | | | | | |
| | | | | | | | | | |
| Per share data (for a share outstanding throughout each year): | | | | | | | | | | |
Net asset value - Beginning of year | | $9.84 | | $9.90 | | $9.52 | | $8.83 | | $6.67 |
| | | | | | | | | | |
Income from investment operations: | | | | | | | | | | |
Net investment income | | 0.15 | | 0.15 | | 0.11 | | 0.08 | | 0.07 |
Net realized and unrealized gain on investments | | 1.12 | | 2.01 | | 1.21 | | 1.44 | | 2.72 |
| | | | | | | | | | |
Total from investment operations | | 1.27 | | 2.16 | | 1.32 | | 1.52 | | 2.79 |
| | | | | | | | | | |
Less distributions to shareholders: | | | | | | | | | | |
From net investment income | | (0.14) | | (0.15) | | (0.11) | | (0.08) | | (0.06) |
From net realized gain on investments | | (0.10) | | (2.07) | | (0.83) | | (0.75) | | (0.57) |
| | | | | | | | | | |
Total distributions to shareholders | | (0.24) | | (2.22) | | (0.94) | | (0.83) | | (0.63) |
| | | | | | | | | | |
Net asset value - End of year | | $10.87 | | $9.84 | | $9.90 | | $9.52 | | $8.83 |
| | | | | | | | | | |
Total return1 | | 13.01% | | 21.96% | | 13.99% | | 17.67% | | 42.10% |
| Ratios (to average net assets)/Supplemental Data: | | | | | | | | | | |
Expenses | | 1.16% | | 1.18% | | 1.24% | | 1.29% | | 1.30%* |
Net investment income | | 1.47% | | 1.39% | | 1.10% | | 0.86% | | 0.94% |
Portfolio turnover | | 20% | | 30% | | 35% | | 19% | | 46% |
Net assets - End of year (000’s omitted) | | $270,080 | | $215,981 | | $193,168 | | $165,917 | | $129,479 |
| | | | | | | | | | |
|
*The investment advisor did not impose all of its management fee and is not eligible to recoup any expenses that have been waived or reimbursed in prior years. If these expenses had been incurred by the Series, the expense ratio (to average net assets) for the year ended 12/31/03 would have been increased by 0.02%. |
1Represents aggregate total return for the year indicated, and assumes reinvestment of all distributions. Total return would have been lower had certain expenses not been waived during the year ended 12/31/03.
| | |
| 14 | | The accompanying notes are an integral part of the financial statements. |
Notes to Financial Statements
International Series (the “Series”) is a no-load diversified series of Manning & Napier Fund, Inc. (the “Fund”). The Fund is organized in Maryland and is registered under the Investment Company Act of 1940, as amended, as an open-end management investment company.
The Series’ investment objective is to provide long-term growth by investing principally in the common stocks of companies located outside the United States.
The Fund’s Advisor is Manning & Napier Advisors, Inc. (the “Advisor”). Shares of the Series are offered to investors, clients and employees of the Advisor and its affiliates. The Series resumed offering shares directly to investors on May 18, 2004, as it had done previously from time to time. The total authorized capital stock of the Fund consists of 5.0 billion shares of common stock each having a par value of $0.01. As of December 31, 2007, 3.33 billion shares have been designated in total among 27 series, of which 100 million have been designated as International Series Class A common stock.
| 2. | SIGNIFICANT ACCOUNTING POLICIES |
Security Valuation
Portfolio securities, including domestic equities, foreign equities, exchange-traded funds and options, listed on an exchange other than the NASDAQ National Market System are valued at the latest quoted sales price of the exchange on which the security is primarily traded. Securities not traded on valuation date or securities not listed on an exchange are valued at the latest quoted bid price provided by the Fund’s pricing service. Securities listed on the NASDAQ National Market System are valued in accordance with the NASDAQ Official Closing Price.
Securities for which representative valuations or prices are not available from the Fund’s pricing service may be valued at fair value. Due to the inherent uncertainty of valuations of such securities, the fair value may differ significantly from the values that would have been used had a ready market for such securities existed. If trading or events occurring after the close of the principal market in which securities are traded are expected to materially affect the value of those securities, then they may be valued at their fair value, taking this trading or these events into account. Fair value is determined in good faith by the Advisor under procedures approved by and under the general supervision and responsibility of the Fund’s Board of Directors (the “Board”).
Short-term investments that mature in sixty days or less are valued at amortized cost, which approximates market value. Investments in open-end investment companies are valued at their net asset value per share on valuation date, with the exception of exchange-traded funds, which are valued at the closing price on the exchange.
Security Transactions, Investment Income and Expenses
Security transactions are accounted for on trade date. Dividend income is recorded on the ex-dividend date, except that if the ex-dividend date has passed, certain dividends from foreign securities are recorded as soon as the Fund is informed of the ex-dividend date. Non-cash dividends, if any, are recorded at the fair market value of the securities received. Interest income, including amortization of premium and accretion of discounts using the effective interest method, is earned from settlement date and accrued daily.
Expenses are recorded on an accrual basis. Most expenses of the Fund can be attributed to a specific series. Expenses which cannot be directly attributed are apportioned among the series in
Notes to Financial Statements
| 2. | SIGNIFICANT ACCOUNTING POLICIES (continued) |
Security Transactions, Investment Income and Expenses (continued)
the Fund in such a manner as deemed equitable by the Fund’s Board, taking into consideration, among other things, the nature and type of expense.
The Series uses the identified cost method for determining realized gain or loss on investments for both financial statement and federal income tax reporting purposes.
Foreign Currency Translation
The books and records of the Series are maintained in U.S. dollars. Foreign currencies, investments and other assets and liabilities are translated into U.S. dollars at the current exchange rates. Purchases and sales of investment securities and income and expenses are translated on the respective dates of such transactions. The Series does not isolate realized and unrealized gains and losses attributable to changes in the exchange rates from gains and losses that arise from changes in the market value of investments. Such fluctuations are included with net realized and unrealized gain or loss on investments. Net realized foreign currency gains and losses represent foreign currency gains and losses between trade date and settlement date on securities transactions, gains and losses on disposition of foreign currencies and the difference between the amount of income and foreign withholding taxes recorded on the books of the Series and the amounts actually received or paid.
Federal Taxes
The Series’ policy is to comply with the provisions of the Internal Revenue Code applicable to regulated investment companies. The Series is not subject to federal income tax or excise tax to the extent that the Series distributes to shareholders each year its taxable income, including any net realized gains on investments, in accordance with requirements of the Internal Revenue Code. Accordingly, no provision for federal income tax or excise tax has been made in the financial statements.
On June 29, 2007, the Series adopted Financial Accounting Standards Board Interpretation No. 48 - Accounting for Uncertainty in Income Taxes (“FIN 48”). FIN 48 prescribes the minimum recognition threshold a tax position must meet in connection with accounting for uncertainties in income tax positions taken or expected to be taken by an entity before being measured and recognized in the financial statements. Management has determined that FIN 48 did not have a material impact on the Series’ financial statements. The Series files income tax returns in the U.S. federal jurisdiction, various states and foreign jurisdictions, as required. No income tax returns are currently under investigation. The statute of limitations on the Series’ tax returns remains open for the years ended December 31, 2004 through December 31, 2007.
Additionally, based on the Fund’s understanding of the tax rules and rates related to income, gains and transactions for foreign jurisdictions in which it invests, the Series will provide for foreign taxes, and where appropriate, deferred foreign tax.
Distributions of Income and Gains
Distributions to shareholders of net investment income and net realized gains are made annually. An additional distribution may be necessary to avoid taxation of the Series. Distributions are recorded on the ex-dividend date.
Notes to Financial Statements
| 2. | SIGNIFICANT ACCOUNTING POLICIES (continued) |
Indemnifications
The Fund’s organizational documents provide former and current directors and officers with a limited indemnification against liabilities arising in connection with the performance of their duties to the Fund. In the normal course of business, the Fund may also enter into contracts that provide general indemnifications. The Fund’s maximum exposure under these arrangements is unknown as this would be dependent on future claims that may be made against the Fund. The risk of material loss from such claims is considered remote.
Other
The preparation of financial statements in conformity with accounting principles generally accepted in the United States of America requires management to make estimates and assumptions that affect the reported amounts of assets and liabilities and the disclosure of contingent assets and liabilities at the date of the financial statements and the reported amounts of income and expenses during the reporting period. Actual results could differ from those estimates.
| 3. | TRANSACTIONS WITH AFFILIATES |
The Fund has an Investment Advisory Agreement (the “Agreement”) with the Advisor, for which the Series pays a fee, computed daily and payable monthly, at an annual rate of 1.00% of the Series’ average daily net assets.
Under the Agreement, personnel of the Advisor provide the Series with advice and assistance in the choice of investments and the execution of securities transactions, and otherwise maintain the Series’ organization. The Advisor also provides the Fund with necessary office space and fund administration and support services. The salaries of all officers of the Fund (except a percentage of the Fund’s Chief Compliance Officer’s salary, which is paid by the Fund), and of all Directors who are “affiliated persons” of the Fund, or of the Advisor, and all personnel of the Fund, or of the Advisor, performing services relating to research, statistical and investment activities, are paid by the Advisor. Each “non-affiliated” Director receives an annual stipend, which is allocated among all the active series of the Fund. In addition, these Directors also receive a fee per Board meeting attended for each active series of the Fund plus a fee for each committee meeting attended.
Manning & Napier Investor Services, Inc., a registered broker-dealer affiliate of the Advisor, acts as distributor for the Fund’s shares. The services of Manning & Napier Investor Services, Inc. are provided at no additional cost to the Series.
For fund accounting and transfer agent services, the Fund pays the Advisor an annual fee of 0.11% of the Fund’s average daily net assets up to $900 million, 0.07% of the Fund’s average daily net assets between $900 million and $1.5 billion, and 0.04% of the Fund’s average daily net assets over $1.5 billion. Additionally, certain transaction and account-based fees and out-of-pocket expenses, including charges for reporting relating to the Fund’s compliance program, are charged. Expenses not directly attributable to a series are allocated based on each series’ relative net assets or number of accounts, depending on the expense. The Advisor has an agreement with Citi Fund Services Ohio, Inc. (“Citi”) (formerly BISYS Fund Services Ohio, Inc.) under which Citi serves as sub-accountant and sub-transfer agent.
Notes to Financial Statements
| 4. | PURCHASES AND SALES OF SECURITIES |
For the year ended December 31, 2007, purchases and sales of securities, other than United States Government securities and short-term securities, were $76,665,421 and $47,035,810, respectively. There were no purchases or sales of United States Government securities.
| 5. | CAPITAL STOCK TRANSACTIONS |
Transactions in shares of International Series were:
| | | | | | | | | | | | | | |
| | | For the Year
Ended 12/31/07 | | | For the Year
Ended 12/31/06 | |
| | | Shares | | | Amount | | | Shares | | | Amount | |
| | | | | | | | | | | | | | |
Sold | | 3,568,001 | | | $ | 37,679,971 | | | 3,790,447 | | | $ | 40,831,406 | |
Reinvested | | 546,829 | | | | 5,789,599 | | | 3,944,903 | | | | 38,787,300 | |
Repurchased | | (1,215,615 | ) | | | (12,949,041 | ) | | (5,307,703 | ) | | | (59,228,356 | ) |
| | | | | | | | | | | | | | |
Total | | 2,899,215 | | | $ | 30,520,529 | | | 2,427,647 | | | $ | 20,390,350 | |
| | | | | | | | | | | | | | |
Substantially all of the Series’ shares represent investments by fiduciary accounts over which the Advisor has sole investment discretion.
The Series may trade in financial instruments with off-balance sheet risk in the normal course of its investing activities to assist in managing exposure to various market risks. These financial instruments include written options, forward foreign currency exchange contracts and futures contracts and may involve, to a varying degree, elements of risk in excess of the amounts recognized for financial statement purposes. No such investments were held by the Series on December 31, 2007.
Investing in securities of foreign companies and foreign governments involves special risks and considerations not typically associated with investing in securities of domestic companies and the United States Government. These risks include revaluation of currencies and future adverse political and economic developments. Moreover, securities of foreign companies and foreign governments and their markets may be less liquid and their prices more volatile than those of comparable domestic companies and the United States Government.
| 8. | FEDERAL INCOME TAX INFORMATION |
The amount and characterization of certain income and capital gains to be distributed are determined in accordance with federal income tax regulations, which may differ from accounting principles generally accepted in the United States of America. These differences are primarily due to differing book and tax treatments in the timing of the recognition of net investment income or gains and losses, including foreign currency gains and losses. The Series may periodically make reclassifications among its capital accounts to reflect income and gains available for distribution (or available capital loss carryovers) under income tax regulations, without impacting the Series’ net asset value. Any such reclassifications are not reflected in the financial highlights.
Notes to Financial Statements
| 8. | FEDERAL INCOME TAX INFORMATION (continued) |
The tax character of distributions paid were as follows:
| | | | | | |
| | | For the Year
Ended 12/31/07 | | For the Year
Ended 12/31/06 |
Ordinary income | | $ | 5,217,302 | | $ | 5,289,902 |
Long-term capital gains | | | 684,527 | | | 34,035,695 |
At December 31, 2007, the tax basis components of distributable earnings and the net unrealized appreciation based on identified cost for federal income tax purposes were as follows:
| | | | |
Cost for federal income tax purposes | | $ | 185,568,096 | |
| |
Unrealized appreciation | | $ | 89,968,155 | |
Unrealized depreciation | | | (5,972,448 | ) |
| | | | |
Net unrealized appreciation | | $ | 83,995,707 | |
Undistributed ordinary income | | | 3,231,026 | |
Undistributed long-term capital gains | | | 1,405,685 | |
| 9. | RECENT ACCOUNTING PRONOUNCEMENTS |
In September 2006, FASB Statement of Financial Accounting Standards No. 157, Fair Value Measurements (“FAS 157”) was issued, and is effective for fiscal years beginning after November 15, 2007. FAS 157 defines fair value, establishes a framework for measuring fair value, and expands disclosure about fair value measurements. The standard does not expand the use of fair value in any new circumstances, but provides clarification on acceptable fair value methods and applications. At this time, management is evaluating the implications of FAS 157, but it is not expected to materially impact the Series’ financial statements.
Report of Independent Registered Public Accounting Firm
To the Board of Directors of Manning & Napier Fund, Inc. and Shareholders of International Series:
In our opinion, the accompanying statement of assets and liabilities, including the investment portfolio, and the related statements of operations and of changes in net assets and the financial highlights present fairly, in all material respects, the financial position of the International Series (a series of Manning & Napier Fund, Inc., hereafter referred to as the “Series”) at December 31, 2007, and the results of its operations for the year then ended, the changes in its net assets for each of the two years in the period then ended and the financial highlights for each of the five years in the period then ended, in conformity with accounting principles generally accepted in the United States of America. These financial statements and financial highlights (hereafter referred to as “financial statements”) are the responsibility of the Series’ management; our responsibility is to express an opinion on these financial statements based on our audits. We conducted our audits of these financial statements in accordance with the standards of the Public Company Accounting Oversight Board (United States). Those standards require that we plan and perform the audit to obtain reasonable assurance about whether the financial statements are free of material misstatement. An audit includes examining, on a test basis, evidence supporting the amounts and disclosures in the financial statements, assessing the accounting principles used and significant estimates made by management, and evaluating the overall financial statement presentation. We believe that our audits, which included confirmation of securities at December 31, 2007 by correspondence with the custodian, provide a reasonable basis for our opinion.

Columbus, Ohio
February 20, 2008
Supplemental Tax Information (unaudited)
For federal income tax purposes, the Series designates for the current fiscal year $2,911,928 or, if different, the maximum amount allowable under the tax law as qualified dividend income.
Pursuant to Section 852 of the Internal Revenue Code, as amended, the Series hereby designates $684,527 as capital gains for its taxable year ended December 31, 2007.
Renewal of Investment Advisory Agreements (unaudited)
During the period covered by this shareholder report, the Board of Directors (the “Board”) of Manning & Napier Fund, Inc. (the “Fund”) considered approval of two separate investment advisory agreements with Manning & Napier Advisors, Inc. (the “Advisor”):
| | • | | At a meeting held on August 30, 2007, the Board approved a new investment advisory agreement between the Fund and the Advisor (the “New Investment Advisory Agreement”) and recommended that the New Investment Advisory Agreement be submitted to shareholders for approval. Shareholders approved the New Investment Advisory Agreement at a meeting held on December 17, 2007. |
| | • | | At a meeting held on November 12, 2007, the Board approved the continuation of the then-current investment advisory agreement between the Fund and the Advisor (the “Current Investment Advisory Agreement”), which was to be superseded by the New Investment Advisory Agreement upon its approval by the Fund’s shareholders. The continuation of the Current Investment Advisory Agreement was necessary as a result of the delay in obtaining the number of votes necessary to convene the shareholder meeting and approve the New Investment Advisory Agreement with respect to all investment portfolios of the Fund (the “Series”). |
Consideration of New Investment Advisory Agreement:
In response to recent regulatory and compliance initiatives promulgated by the SEC over the past year, the Fund engaged in a comprehensive review of all material aspects of the Fund’s operations, including the Fund’s Current Investment Advisory Agreement. As a result of its review, the Board determined that the Current Investment Advisory Agreement should be amended for the purpose of modernizing the form of the agreement and to include additional provisions in the agreement that are customarily included in investment advisory agreements between registered investment companies and their investment advisors, but which are not included in the Current Investment Advisory Agreement. Accordingly, at the Board meeting on November 16, 2006, representatives of the Advisor presented to the Board proposed changes to the Current Investment Advisory Agreement in order to address the Board’s request to update and modernize the Current Investment Advisory Agreement. As a result of the discussions between the Board and representatives of the Advisor at the November 2006 Board meeting, the Board determined to formally consider the approval of a new investment advisory agreement between the Fund and the Advisor, which would incorporate the changes proposed at the November 2006 Board meeting, at its in-person Board meeting in August 2007.
At an in-person meeting held on August 30, 2007, the Board considered the approval of the New Investment Advisory Agreement between the Fund and the Advisor. Based on the information it received at the meeting and the November 16, 2006 Board meeting, the Board approved the New Investment Advisory Agreement subject to its further approval by the Fund’s shareholders. Representatives of the Advisor attended the meeting and presented additional oral and written information to the Board to assist the Board in its considerations. At the meeting, the Board concluded it was reasonable to take into account the conclusions the Board made when considering and evaluating the renewal of the Current Investment Advisory Agreement (the “2006 Annual Review”), which occurred at the November 16, 2006 in-person Board meeting, as part of its considerations to approve the New Investment Advisory Agreement. The discussion immediately below outlines the materials and information presented to the Board in connection with the Board’s 2006 Annual Review of the Current Investment Advisory Agreement and the conclusions made by the Directors when determining to continue the Current Investment Advisory Agreement for an additional one-year period.
Renewal of Investment Advisory Agreements (unaudited)
In connection with its review and deliberations, the Board considered the following factors and reached a conclusion with respect to such factors.
| | • | | The Board considered the services provided by the Advisor under the Current Investment Advisory Agreement including, among others: deciding what securities to purchase and sell for each Series; arranging for the purchase and sale of such securities by placing orders with broker-dealers; administering the affairs of the Fund (including the books and records of the Fund not maintained by third party service providers such as the custodian or sub-transfer agent); arranging for the insurance coverage for the Fund; and supervising the preparation of tax returns, SEC filings (including registration statements) and reports to shareholders for the Fund. The Board also considered the nature and quality of such services provided under the Current Investment Advisory Agreement in light of the Advisor’s services provided to the Fund for 21 years. The Board discussed the quality of these services with representatives from the Advisor and concluded that the Advisor was performing its services to the Fund required under the Current Investment Advisory Agreement in a reasonable manner. |
| | • | | The Board considered the investment performance of the various Series of the Fund. The investment performance for each Series was reviewed on a cumulative basis since inception and on a one year basis. In addition, annualized performance for the following time periods was considered: inception, three year, five year, ten year, and current market cycle. A market cycle includes periods of both rising and falling markets. Returns for established benchmark indices for each Series were provided for each time period. The Board noted that all the Series were competitive against their respective benchmark indices over all time periods noted above through September 30, 2006. In addition, the Board considered at the meeting (and considers on a quarterly basis) a peer group performance analysis consisting of Morningstar universes of mutual funds with similar investment objectives. The Board discussed the performance with representatives from the Advisor and concluded that the investment performance of each of the Fund’s Series was reasonable based on the Fund’s actual performance and comparative performance, especially performance over the current market cycle. |
| | • | | The Board considered the costs of the Advisor’s services and the profits of the Advisor as they relate to the Advisor’s services to the Fund under the Current Investment Advisory Agreement. In reviewing the Advisor’s costs and profits, the Board discussed the Advisor’s revenues generated from the Fund (on both an actual and adjusted basis) and its expenses associated with providing the services under the Current Investment Advisory Agreement. In addition, the Board reviewed the Advisor’s expenses associated with Fund activities outside of the Current Investment Advisory Agreement (such as expense reimbursements pursuant to expense caps and payments made by the Advisor to third party platforms on which shares of the Fund are available for purchase). It was noted by representatives of the Advisor that 6 of the 18 active Series of the Fund are currently experiencing expenses above the capped expense ratios. After discussing the above costs and profits, the Board concluded that the Advisor’s profitability relating to its services provided under the Current Investment Advisory Agreement was reasonable. |
| | • | | The Board considered the fees and expenses of the various Series of the Fund. The Advisor presented the advisory fees and total expenses for each Series, including the |
Renewal of Investment Advisory Agreements (unaudited)
| | advisory fee adjusted for any expense waivers or reimbursements (either contractual or voluntary) paid by the Advisor. The advisory fees and expense ratios of each Series were compared to an average (on both a mean and median basis) of similar funds as disclosed on the Morningstar database. Representatives of the Advisor discussed with the Board the levels of its advisory fee for each Series of the Fund and as compared to the median and mean advisory fees for similar funds as listed on Morningstar. Expense ratios for every Series, except the High Yield Bond Series, are currently below the median and mean for similar funds as listed on Morningstar. Based on their review of the information provided, the Board concluded that the fees and expenses of each Series of the Fund were reasonable on a comparative basis. |
| | • | | The Board also considered the other benefits the Advisor derives from its relationship with the Fund. Such other benefits include certain research products provided by soft dollars. Given the level of soft dollar transactions involving the Fund, the Board concluded that these additional benefits to the Advisor were reasonable. |
| | • | | In addition to the factors described above, the Board considered the Advisor’s personnel, investment strategies, policies and procedures relating to compliance with personal securities transactions, and reputation, expertise and resources in domestic and foreign financial markets. The Board concluded that these factors support the conclusion that the Advisor performs its services in a reasonable manner. |
| | • | | The Board did not consider economies of scale at this time because of the multiple uses of the Fund (for the Advisor’s discretionary investment account clients in addition to direct investors), the current profitability of the Advisor’s services to the Fund under the Current Investment Advisory Agreement, and the overall size of the Fund complex. |
Based on the Board’s deliberations and their evaluation of the information described above, the Board, including a majority of Directors that are “not interested” as defined in the Investment Company Act of 1940 (the “1940 Act”), concluded that the compensation under the Current Investment Advisory Agreement was fair and reasonable in light of the services and expenses and such other matters as the Directors considered to be relevant in the exercise of their reasonable judgment. Accordingly, the Board approved the renewal of the Current Investment Advisory Agreement for another year. In the course of their deliberations, the Directors did not identify any particular information that was all important or controlling.
As stated above, at the August 30, 2007 Board meeting, the Board concluded it was reasonable to take into account the conclusions set forth above when determining whether to approve the New Investment Advisory Agreement. The Board’s conclusion in this regard was based on the fact that the New Investment Advisory Agreement is identical to the Current Investment Advisory Agreement except for certain provisions of the Agreement which have been updated and modernized in response to the Board’s specific request. Further, the Board’s conclusion in this regard was based on the fact that the New Investment Advisory Agreement does not change either the investment advisory fees payable by the Fund to the Advisor or the day-to-day investment management services the Advisor provides to the Fund.
In addition to the conclusions formed with respect to the 2006 Annual Review, the Directors considered specific information at the August 30, 2007 Board meeting concerning the additional provisions included in the New Investment Advisory Agreement. The Directors considered the fact that these additional provisions are designed to (i) address and memorialize certain standard practices and regulatory requirements of mutual funds and their investment advisors; (ii) further
Renewal of Investment Advisory Agreements (unaudited)
delineate the duties and obligations of the Fund and the Advisor; (iii) modernize the agreement to reflect current industry practice and applicable law; and (iv) generally improve the overall quality of the agreement. The Board further considered the fact that the New Investment Advisory Agreement does not alter the actual day-to-day investment management services provided by the Advisor to each Series of the Fund, and the investment advisory fee rate paid to the Advisor under the New Investment Advisory Agreement for a Series is the same as the fee rate paid by the Series under the Current Investment Advisory Agreement.
Based on its evaluation of the information and the conclusions with respect thereto at its meetings on November 16, 2006 and August 30, 2007, the Board unanimously concluded that: (a) the terms of the New Investment Advisory Agreement were fair and reasonable; (b) the approval of the New Investment Advisory Agreement would be in the best interests of the shareholders and the Fund; and (c) it would recommend the approval of the New Investment Advisory Agreement to shareholders. In the course of their deliberations, the Board did not identify any particular information or factor that was all-important or controlling.
Consideration of Current Investment Advisory Agreement
At a meeting held on November 12, 2007, the Board considered the continuation of the Current Investment Advisory Agreement and simultaneously conducted its annual review of the services provided to the Fund by the Adviser (the “2007 Annual Review”). Representatives of the Advisor attended the meeting and presented additional oral and written information to the Board to assist the Board in its considerations. The discussion immediately below outlines the materials and information presented to the Board in connection with the Board’s 2007 Annual Review of the Current Investment Advisory Agreement and the conclusions made by the Directors when determining to continue the Current Investment Advisory Agreement.
In connection with its review and deliberations, the Board considered the following factors and reached a conclusion with respect to such factors.
| | • | | The Board considered the services provided by the Advisor under the Current Investment Advisory Agreement including, among others: deciding what securities to purchase and sell for each Series; arranging for the purchase and sale of such securities by placing orders with broker-dealers; administering the affairs of the Fund (including the books and records of the Fund not maintained by third party service providers such as the custodian or sub-transfer agent); arranging for the insurance coverage for the Fund; and supervising the preparation of tax returns, SEC filings (including registration statements) and reports to shareholders for the Fund. The Board also considered the nature and quality of such services provided under the Current Investment Advisory Agreement in light of the Advisor’s services provided to the Fund for 21 years. The Board discussed the quality of these services with representatives from the Advisor and concluded that the Advisor was performing its services to the Fund required under the Current Investment Advisory Agreement in a reasonable manner. |
| | • | | The Board considered the investment performance of the various Series of the Fund. The investment performance for each Series was reviewed on a cumulative basis since inception and on a one year basis. In addition, annualized performance for the following time periods was considered: inception, three year, five year, ten year, and current market cycle. A market cycle includes periods of both rising and falling markets. Returns for established benchmark indices for each Series were provided for |
Renewal of Investment Advisory Agreements (unaudited)
| | each time period. The Board noted that all the Series were competitive against their respective benchmark indices over all time periods noted above through September 30, 2007. In addition, the Board considered at the meeting (and considers on a quarterly basis) a peer group performance analysis consisting of Morningstar universes of mutual funds with similar investment objectives. The Board discussed the performance with representatives from the Advisor and concluded that the investment performance of each of the Fund’s Series was reasonable based on the Fund’s actual performance and comparative performance, especially performance over the current market cycle. |
| | • | | The Board considered the costs of the Advisor’s services and the profits of the Advisor as they relate to the Advisor’s services to the Fund under the Current Investment Advisory Agreement. In reviewing the Advisor’s costs and profits, the Board discussed the Advisor’s revenues generated from the Fund (on both an actual and adjusted basis) and its expenses associated with providing the services under the Current Investment Advisory Agreement. In addition, the Board reviewed the Advisor’s expenses associated with Fund activities outside of the Current Investment Advisory Agreement (such as expense reimbursements pursuant to expense caps and payments made by the Advisor to third party platforms on which shares of the Fund are available for purchase). It was noted by representatives of the Advisor that 4 of the 18 active Series of the Fund are currently experiencing expenses above the capped expense ratios. After discussing the above costs and profits, the Board concluded that the Advisor’s profitability relating to its services provided under the Current Investment Advisory Agreement was reasonable. |
| | • | | The Board considered the fees and expenses of the various Series of the Fund. The Advisor presented the advisory fees and total expenses for each Series, including the advisory fee adjusted for any expense waivers or reimbursements (either contractual or voluntary) paid by the Advisor. The advisory fees and expense ratios of each Series were compared to an average (on both a mean and median basis) of similar funds as disclosed on the Morningstar database. Representatives of the Advisor discussed with the Board the levels of its advisory fee for each Series of the Fund and as compared to the median and mean advisory fees for similar funds as listed on Morningstar. Expense ratios for every Series, except the High Yield Bond Series and Global Fixed Income Series, are currently below the median and mean for similar funds as listed on Morningstar. Based on their review of the information provided, the Board concluded that the fees and expenses of each Series of the Fund were reasonable on a comparative basis. |
| | • | | The Board also considered the other benefits the Advisor derives from its relationship with the Fund. Such other benefits include certain research products provided by soft dollars. Given the level of soft dollar transactions involving the Fund, the Board concluded that these additional benefits to the Advisor were reasonable. |
| | • | | In addition to the factors described above, the Board considered the Advisor’s personnel, investment strategies, policies and procedures relating to compliance with personal securities transactions, and reputation, expertise and resources in domestic and foreign financial markets. The Board concluded that these factors support the conclusion that the Advisor performs its services in a reasonable manner. |
Renewal of Investment Advisory Agreements (unaudited)
| | • | | The Board did not consider economies of scale at this time because of the multiple uses of the Fund (for the Advisor’s discretionary investment account clients in addition to direct investors), the current profitability of the Advisor’s services to the Fund under the Current Investment Advisory Agreement, and the overall size of the Fund complex. |
Based on the Board’s deliberations and their evaluation of the information described above, the Board, including a majority of Directors that are not “interested persons” as defined in the 1940 Act, concluded that the compensation under the Current Investment Advisory Agreement was fair and reasonable in light of the services and expenses and such other matters as the Directors considered to be relevant in the exercise of their reasonable judgment. Accordingly, the Board approved the renewal of the Current Investment Advisory Agreement. In the course of their deliberations, the Directors did not identify any particular information that was all important or controlling.
Proxy Voting Results (unaudited)
A special meeting of the shareholders of Manning & Napier Fund, Inc. was held on November 12, 2007. The number of votes necessary to conduct the meeting and approve each proposal was obtained, and the results of the votes of shareholders on proposals before them are listed below:
Election of Directors.
| | | | |
| | | Number of Shares
voted for | | Number of Shares
withheld |
B. Reuben Auspitz | | 215,932,354.541 | | 15,898,685.154 |
Stephen B. Ashley | | 215,960,751.214 | | 15,870,288.481 |
Peter L. Faber | | 217,504,725.208 | | 14,326,314.487 |
Harris H. Rusitzky | | 215,924,013.609 | | 15,907,026.086 |
To approve the investment advisory agreement between Manning & Napier Advisors, Inc. and Manning & Napier Fund, Inc.
| | |
| | | Number of shares voted |
For | | 16,747,697.369 |
Against | | 0 |
Abstain (includes broker non-votes) | | 114,652.000 |
Eliminating, amending, or reclassifying certain fundamental investment policies or restrictions.
Proposal 3.A.i. To approve changes to the fundamental policy regarding borrowing money.
| | |
| | | Number of shares voted |
For | | 16,747,564.460 |
Against | | 132.909 |
Abstain (includes broker non-votes) | | 114,652.000 |
Proposal 3.A.ii. To approve changes to the fundamental policy regarding percentage of assets invested in any one industry.
| | |
| | | Number of shares voted |
For | | 16,747,697.369 |
Against | | 0 |
Abstain (includes broker non-votes) | | 114,652.000 |
Proposal 3.A.iii. To approve changes to the fundamental policy regarding loans.
| | |
| | | Number of shares voted |
For | | 16,747,697.369 |
Against | | 0 |
Abstain (includes broker non-votes) | | 114,652.000 |
Proxy Voting Results (unaudited)
Proposal 3.A.iv. To approve changes to the fundamental policy regarding issuance of senior securities or pledging its assets.
| | |
| | | Number of shares voted |
For | | 16,747,564.460 |
Against | | 132.909 |
Abstain (includes broker non-votes) | | 114,652.000 |
Proposal 3.A.v. To approve changes to the fundamental policy regarding buying or selling of commodities or commodity contracts.
| | |
| | | Number of shares voted |
For | | 16,747,697.369 |
Against | | 0 |
Abstain (includes broker non-votes) | | 114,652.000 |
Proposal 3.A.vi. To approve changes to the fundamental policy regarding underwriting of securities.
| | |
| | | Number of shares voted |
For | | 16,747,697.369 |
Against | | 0 |
Abstain (includes broker non-votes) | | 114,652.000 |
Proposal 3.A.vii. To approve changes to the fundamental policy regarding diversification.
| | |
| | | Number of shares voted |
For | | 16,747,697.369 |
Against | | 0 |
Abstain (includes broker non-votes) | | 114,652.000 |
Proposal 3.B.i. To approve changes to the policy/restriction regarding investment of its total net assets in securities of issuers that are restricted from being sold to the public without registration.
| | |
| | | Number of shares voted |
For | | 16,041,937.169 |
Against | | 705,760.200 |
Abstain (includes broker non-votes) | | 114,652.000 |
Proposal 3.B.ii. To approve changes to the policy/restriction regarding the purchase of securities on margin.
| | |
| | | Number of shares voted |
For | | 16,041,804.260 |
Against | | 705,893.109 |
Abstain (includes broker non-votes) | | 114,652.000 |
Proxy Voting Results (unaudited)
Proposal 3.B.iii. To approve changes to the policy/restriction regarding acquiring securities of other investment companies.
| | |
| | | Number of shares voted |
For | | 16,041,937.169 |
Against | | 705,760.200 |
Abstain (includes broker non-votes) | | 114,652.000 |
Proposal 3.B.iv. To approve changes to the policy/restriction regarding warrants.
| | |
| | | Number of shares voted |
For | | 16,041,804.260 |
Against | | 705,893.109 |
Abstain (includes broker non-votes) | | 114,652.000 |
Proposal 3.B.v. To approve changes to the policy/restriction regarding options on securities and with respect to stock index and currency futures and related options.
| | |
| | | Number of shares voted |
For | | 16,041,937.169 |
Against | | 705,760.200 |
Abstain (includes broker non-votes) | | 114,652.000 |
Proposal 3.B.vi. To approve changes to the policy/restriction regarding hedging and derivative transactions.
| | |
| | | Number of shares voted |
For | | 16,041,804.260 |
Against | | 705,893.109 |
Abstain (includes broker non-votes) | | 114,652.000 |
Proposal 3.B.vii. To approve changes to the policy/restriction regarding the purchase of foreign securities.
| | |
| | | Number of shares voted |
For | | 16,041,937.169 |
Against | | 705,760.200 |
Abstain (includes broker non-votes) | | 114,652.000 |
Proposal 3.C.i. To approve changes to the policy/restriction regarding investment for the purpose of exercising control over management.
| | |
| | | Number of shares voted |
For | | 16,747,564.460 |
Against | | 132.909 |
Abstain (includes broker non-votes) | | 114,652.000 |
Proxy Voting Results (unaudited)
Proposal 3.C.iii. To approve changes to the policy/restriction regarding short sales or short positions.
| | |
| | | Number of shares voted |
For | | 16,747,564.460 |
Against | | 132.909 |
Abstain (includes broker non-votes) | | 114,652.000 |
Proposal 3.C.iv. To approve changes to the policy/restriction regarding participation in a joint or joint and several basis in trading account in securities.
| | |
| | | Number of shares voted |
For | | 16,747,697.369 |
Against | | 0 |
Abstain (includes broker non-votes) | | 114,652.000 |
Proposal 3.C.v. To approve changes to the policy/restriction regarding investment in oil, gas or other mineral exploration or development programs.
| | |
| | | Number of shares voted |
For | | 16,747,564.460 |
Against | | 132.909 |
Abstain (includes broker non-votes) | | 114,652.000 |
Proposal 3.C.vi. To approve changes to the policy/restriction regarding officers and directors of the Fund.
| | |
| | | Number of shares voted |
For | | 16,747,564.460 |
Against | | 132.909 |
Abstain (includes broker non-votes) | | 114,652.000 |
Proposal 3.C.vii. To approve changes to the policy/restriction regarding investing in any company with less than three years continuous operation.
| | |
| | | Number of shares voted |
For | | 16,747,697.369 |
Against | | 0 |
Abstain (includes broker non-votes) | | 114,652.000 |
Directors’ and Officers’ Information (unaudited)
The Statement of Additional Information provides additional information about the Fund’s directors and officers and can be obtained without charge by calling 1-800-466-3863, at www.manningnapieradvisors.com, or on the EDGAR Database on the SEC Internet web site (http://www.sec.gov). The following chart shows certain information about the Fund’s officers and directors, including their principal occupations during the last five years. Unless specific dates are provided, the individuals have held the listed positions for longer than five years.
INTERESTED DIRECTOR/OFFICER
| | |
| Name: | | B. Reuben Auspitz* |
| Address: | | 290 Woodcliff Drive Fairport, NY 14450 |
| Age: | | 60 |
| Current Position(s) Held with Fund: | | Principal Executive Officer, President, Chairman & Director |
| Term of Office1 & Length of Time Served: | | Indefinite - Director since 1984; Vice President 1984 - 2003; President since 2004; Principal Executive Officer since 2002 |
| Principal Occupation(s) During Past 5 Years: | | Executive Vice President; Co-Executive Director; Executive Group Member**; Chief Compliance Officer since 2004 - Manning & Napier Advisors, Inc. President; Director - Manning & Napier Investor Services, Inc. Holds or has held one or more of the following titles for various subsidiaries and affiliates: President, Vice President, Director, Chairman, Treasurer, Chief Compliance Officer or Member. |
| Number of Portfolios Overseen within Fund Complex: | | 27 |
| Other Directorships Held Outside Fund Complex: | | N/A |
| |
| INDEPENDENT DIRECTORS | | |
| |
| Name: | | Stephen B. Ashley |
| Address: | | 290 Woodcliff Drive Fairport, NY 14450 |
| Age: | | 67 |
| Current Position(s) Held with Fund: | | Director, Audit Committee Member, Governance & Nominating Committee Member |
| Term of Office & Length of Time Served: | | Indefinite - Since 1996 |
| Principal Occupation(s) During Past 5 Years: | | Chairman, Director, President & Chief Executive Officer, The Ashley |
| | Group (property management and investment) |
| Number of Portfolios Overseen within Fund Complex: | | 27 |
| Other Directorships Held Outside Fund Complex: | | The Ashley Group Fannie Mae |
| Name: | | Peter L. Faber |
| Address: | | 290 Woodcliff Drive Fairport, NY 14450 |
| Age: | | 68 |
| Current Position(s) Held with Fund: | | Director, Governance & Nominating Committee Member |
| Term of Office & Length of Time Served: | | Indefinite - Since 1987 |
| Principal Occupation(s) During Past 5 Years: | | Senior Counsel, McDermott, Will & Emery LLP (law firm) |
| Number of Portfolios Overseen within Fund Complex: | | 27 |
| Other Directorships Held Outside Fund Complex: | | Partnership for New York City, Inc. New York Collegium Boston Early Music Festival |
| Name: | | Harris H. Rusitzky |
| Address: | | 290 Woodcliff Drive Fairport, NY 14450 |
| Age: | | 72 |
| Current Position(s) Held with Fund: | | Director, Audit Committee Member, Governance & Nominating Committee Member |
| Term of Office & Length of Time Served: | | Indefinite - Since 1985 |
| Principal Occupation(s) During Past 5 Years: | | President, The Greening Group (business consultants); Partner, The Restaurant Group (restaurants) |
| Number of Portfolios Overseen within Fund Complex: | | 27 |
| Other Directorships Held Outside Fund Complex: | | N/A |
Directors’ and Officers’ Information (unaudited)
| | |
| Name: | | Paul A. Brooke |
| Address: | | 290 Woodcliff Drive Fairport, NY 14450 |
| Age: | | 62 |
| Current Position(s) Held with Fund: | | Director, Audit Committee Member, Governance & Nominating Committee Member |
| Term of Office & Length of Time Served: | | Indefinite - Since 2007 |
| Principal Occupation(s) During Past 5 Years: | | Chairman & CEO, Alsius Corp. (investments); Managing Member, PMSV Holdings LLC (investments) |
| Number of Portfolios Overseen within Fund Complex: | | 27 |
| Other Directorships Held Outside Fund Complex: | | Incyte Corp. ViroPharma, Inc. HLTH Corp. Cheyne Capital International MPM Bio-equities GMP Companies HoustonPharma |
| OFFICERS | | |
| Name: | | Jeffrey S. Coons, Ph.D., CFA |
| Address: | | 290 Woodcliff Drive Fairport, NY 14450 |
| Age: | | 44 |
| Current Position(s) Held with Fund: | | Vice President |
| Term of Office1 & Length of Time Served: | | Since 2004 |
| Principal Occupation(s) During Past 5 Years: | | Co-Director of Research since 2002 & Executive Group Member**, Manning & Napier Advisors, Inc. Holds one or more of the following titles for various subsidiaries and affiliates: President, Director, Treasurer or Senior Trust Officer. |
| Number of Portfolios Overseen within Fund Complex: | | 27 |
| Other Directorships Held Outside Fund Complex: | | N/A |
| Name: | | Christine Glavin |
| Address: | | 290 Woodcliff Drive Fairport, NY 14450 |
| Age: | | 41 |
| Current Position(s) Held with Fund: | | Principal Financial Officer, Chief Financial Officer |
| Term of Office1 & Length of Time Served: | | Principal Financial Officer since 2002; Chief Financial Officer
since 2001 |
| Principal Occupation(s) During Past 5 Years: | | Fund Reporting Manager, Manning & Napier Advisors, Inc. |
| Number of Portfolios Overseen within Fund Complex: | | 27 |
| Other Directorships Held Outside Fund Complex: | | N/A |
| Name: | | Jodi L. Hedberg |
| Address: | | 290 Woodcliff Drive Fairport, NY 14450 |
| Age: | | 40 |
| Current Position(s) Held with Fund: | | Corporate Secretary, Chief Compliance Officer, Anti-Money Laundering Compliance Officer |
| Term of Office1 & Length of Time Served: | | Corporate Secretary since 1997; Chief Compliance Officer since 2004 |
| Principal Occupation(s) During Past 5 Years: | | Director of Compliance, Manning & Napier Advisors, Inc. and affiliates; Corporate Secretary, Manning & Napier Investor Services, Inc. since 2006 |
| Number of Portfolios Overseen within Fund Complex: | | 27 |
| Other Directorships Held Outside Fund Complex: | | N/A |
*Interested Director, within the meaning of the Investment Company Act of 1940 by reason of his position with the Fund’s investment advisor and distributor. Mr. Auspitz serves as the Executive Vice President and Director, Manning & Napier Advisors, Inc. and President and Director, Manning & Napier Investor Services, Inc., the Fund’s distributor.
**The Executive Group performs the duties of the Office of the Chief Executive of Manning & Napier Advisors, Inc.
1The term of office for President, Vice President, Chief Financial Officer, and Corporate Secretary is one year and until their respective successors are chosen and qualified. All other officers’ terms are indefinite.
Literature Requests (unaudited)
Proxy Voting Policies and Procedures
A description of the policies and procedures that the Fund uses to determine how to vote proxies relating to portfolio securities is available, without charge, upon request:
| | |
By phone | | 1-800-466-3863 |
On the Securities and Exchange Commission’s (SEC) web site | | http://www.sec.gov |
Proxy Voting Record
Information regarding how the Fund voted proxies relating to portfolio securities during the most recent 12-month period ended June 30th is available, without charge, upon request:
| | |
By phone | | 1-800-466-3863 |
On the SEC’s web site | | http://www.sec.gov |
Quarterly Portfolio Holdings
The Series’ complete schedule of portfolio holdings for the 1st and 3rd quarters of each fiscal year are provided on Form N-Q, and are available, without charge, upon request:
| | |
By phone | | 1-800-466-3863 |
On the SEC’s web site | | http://www.sec.gov |
The Series’ Form N-Q may be reviewed and copied at the SEC’s Public Reference Room in Washington, D.C. Information on the operation of the Public Reference Room may be obtained by calling 1-800-SEC-0330.
Prospectus and Statement of Additional Information (SAI)
The prospectus and SAI provide additional information about each Series, including charges, expenses and risks. These documents are available, without charge, upon request:
| | |
By phone | | 1-800-466-3863 |
On the SEC’s web site | | http://www.sec.gov |
On the Advisor’s web site | | http://www.manningnapieradvisors.com |
Additional information available at www.manningnapieradvisors.com
1. Fund Holdings - Month-End
2. Fund Holdings - Quarter-End
3. Shareholder Report - Annual
4. Shareholder Report - Semi-Annual
Manning & Napier Fund, Inc.
| | | | |
FINANCIAL SERVICES SERIES | | | | | Annual Report - December 31, 2007 |

Management Discussion and Analysis (unaudited)
Dear Shareholders:
The Financial Services Series closed its second full calendar year ahead of the Standard & Poor’s (“S&P”) 500 Financials Index, but trailed the broader S&P 500 Total Return Index as fallout from the housing market correction drove the Financials sector lower. For the year, the Series ended with a total return of -17.46% compared to -18.51% for the S&P 500 Financials Index and 5.51% for the S&P 500 Total Return Index. Since its inception on July 1, 2005, the Series has performed in line with the S&P 500 Financials Index, returning an annualized 2.37% versus the Index’s 2.31% return.
After a slow start to 2007 with returns through the first quarter down slightly from the 2006 year end, the sector rebounded in the second quarter. Unfortunately, the optimism was short-lived as data from the housing and mortgage markets soured in the third quarter, crippling the outlook for financial companies and sending share prices lower. With loan losses rising at an increasing rate, the value of complex financial instruments that are based on mortgage loans, including mortgage-backed securities (“MBS”) and collateralized debt obligations (“CDO”), was brought into question. At this point, many companies were forced to take charges for losses and increase their provisions for future expected losses. To exacerbate the problem, financial institutions tightened underwriting standards on most loan products, preventing much needed liquidity from entering the system and ultimately setting off a global credit crisis.
In an effort to slow deterioration in the sector and avert a recession, the Federal Reserve Bank lowered a key short-term interest rate on three separate occasions and made several liquidity injections with the expectation that these changes would help shore up balance sheets and jumpstart credit markets. Despite this, a steady flow of negative headlines, dismal third quarter profit reports, and a worsening near-term outlook remained the driving forces behind negative sector performance through year end.
The relative performance of the Series versus the S&P 500 Financials Index was due to a combination of our industry weightings and our selection of stocks within each industry. Two positive catalysts included our overweight positions in asset managers/custody banks and data processing/outsourced services. These were the only two areas within the Financials sector that finished the year with positive returns. However, these positives were muted given the Series’ overweight position in the banking industry, which finished the year with the poorest returns of any Financials sub-sector.
Despite a tumultuous year, our current outlook as it pertains to specific industry weightings is largely unchanged. We continue to hold our largest position in banks as they begin to benefit from their efforts over the last few years to build a strong capital base, cut costs and diversify into less interest sensitive fee generating businesses. Furthermore, competition has eased slightly as scores of smaller players, particularly in the mortgage lending sector, have ceased operation. Coupled with very low valuations, this dynamic has made many industry participants particularly attractive. In analyzing bank investments, we emphasize a company’s low cost deposit generating ability as this gives banks an advantage when there is pressure on lending margins.
During 2007 we made several purchases in the insurance sector. Several years of falling prices have led some players to rein in policy underwriting until prices stabilize. During this time profitability has suffered, which provided several compelling investment opportunities in 2007. In particular, we focused on title insurers given that they pay out only a fraction of their income on claims and lenders require that all home mortgages include insurance on the title.
Management Discussion and Analysis (unaudited)
Lastly, we continue to position the Series to take advantage of growth in outsourcing business processes. As evidenced by positive 2007 performance, despite extreme negative pressure sector-wide, many companies have realized the efficiencies that are gained through allowing back office functions to be outsourced.
We appreciate your business and wish you all the very best in the coming year.
Sincerely,
Manning & Napier Advisors, Inc.
Performance Update as of December 31, 2007 (unaudited)
| | | | | | |
| | | Average Annual Total Returns
As of December 31, 2007 | | |
| | | One
Year | | Since
Inception1 | | |
Manning & Napier Fund, Inc. - Financial Services Series2 | | -17.46% | | 2.37% | | |
Standard & Poor’s (S&P) 500 Total Return Index3 | | 5.51% | | 10.81% | | |
Standard & Poor’s (S&P) 500 Financials Index3 | | -18.51% | | 2.31% | | |
The following graph compares the value of a $10,000 investment in the Manning & Napier Fund, Inc. - Financial Services Series from its inception1 (7/1/05) to present (12/31/07) to the S&P 500 Total Return Index and the S&P 500 Financials Index.
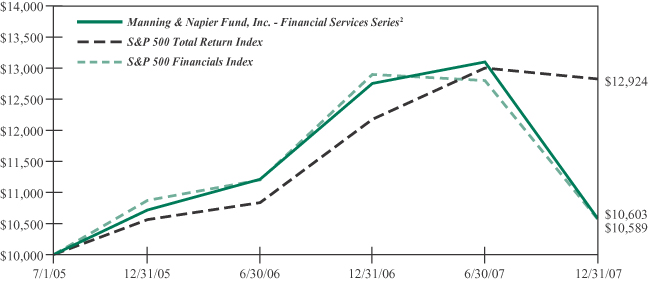
1Performance numbers for the Series and Indices are calculated from July 1, 2005, the Series’ inception date.
2The Series’ performance does not reflect the deduction of taxes that a shareholder would pay on fund distributions or the redemption of shares. The Series’ performance is historical and may not be indicative of future results. The performance returns shown are inclusive of the net expense ratio of the Series. For the year ended December 31, 2007, this net expense ratio was 1.15%. The gross expense ratio, which does not account for any voluntary or contractual waivers currently in effect, was 1.15% for the year ended December 31, 2007.
3The S&P 500 Total Return Index is an unmanaged capitalization-weighted measure of 500 widely held common stocks listed on the New York Stock Exchange, American Stock Exchange and the Over-the-Counter market. The S&P 500 Financials Index, a sub-index of the S&P 500 Total Return Index, includes the stocks of companies involved in the business of financial related products and services. Both Indices’ returns assume daily reinvestment of dividends and, unlike Series returns, do not reflect any fees or expenses.
Shareholder Expense Example (unaudited)
As a shareholder of the Series, you may incur two types of costs: (1) transaction costs, including potential wire charges on redemptions and (2) ongoing costs, including management fees and other Series expenses. This example is intended to help you understand your ongoing costs (in dollars) of investing in the Series and to compare these costs with the ongoing costs of investing in other mutual funds.
The example is based on an investment of $1,000 invested at the beginning of the period and held for the entire period (July 1, 2007 to December 31, 2007).
Actual Expenses
The first line of the table below provides information about actual account values and actual expenses. You may use the information in this line, together with the amount you invested, to estimate the expenses that you paid over the period. Simply divide your account value by $1,000 (for example, an $8,600 account value divided by $1,000 = 8.6), then multiply the result by the number in the first line under the heading entitled “Expenses Paid During Period” to estimate the expenses you paid on your account during this period.
Hypothetical Example for Comparison Purposes
The second line of the table below provides information about hypothetical account values and hypothetical expenses based on the Series’ actual expense ratio and an assumed rate of return of 5% per year before expenses, which is not the Series’ actual return. The hypothetical account values and expenses may not be used to estimate the actual ending account balance or expenses you paid during the period. You may use this information to compare the ongoing costs of investing in the Series and other funds. To do so, compare this 5% hypothetical example with the 5% hypothetical examples that appear in the shareholder reports of the other funds.
Please note that the expenses shown in the table are meant to highlight your ongoing costs only and do not reflect any transaction costs, such as potential wire charges on redemptions. Therefore, the second line of the table is useful in comparing ongoing costs only, and will not help you determine the relative total costs of owning different funds. In addition, if these transaction costs were included, your costs would have been higher.
| | | | | | | | | |
| | | Beginning
Account Value
7/1/07 | | Ending
Account Value
12/31/07 | | Expenses Paid
During Period*
7/1/07-12/31/07 |
Actual | | $ | 1,000.00 | | $ | 802.90 | | $ | 5.23 |
Hypothetical
(5% return before expenses) | | $ | 1,000.00 | | $ | 1,019.41 | | $ | 5.85 |
*Expenses are equal to the Series’ annualized expense ratio (for the six-month period) of 1.15%, multiplied by the average account value over the period, multiplied by 184/365 (to reflect the one-half year period). Expenses are based on the most recent fiscal half year; therefore, the expense ratio stated above may differ from the expense ratio stated in the financial highlights, which is based on one-year data.
Portfolio Composition as of December 31, 2007 (unaudited)
Sector Allocation1
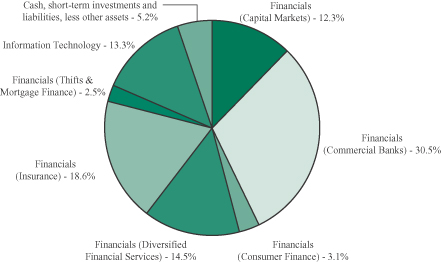
1As a percentage of net assets.
Top Ten Stock Holdings2
| | | | | | |
SEI Investments Co. | | 3.9% | | Bank of America Corp. | | 3.8% |
PNC Financial Services Group, Inc. | | 3.9% | | Wachovia Corp. | | 3.8% |
JPMorgan Chase & Co. | | 3.9% | | Citigroup, Inc. | | 3.8% |
U.S. Bancorp | | 3.9% | | Gevity HR, Inc. | | 3.5% |
Automatic Data Processing, Inc. | | 3.9% | | American International Group, Inc. | | 3.0% |
2As a percentage of total investments.
Investment Portfolio - December 31, 2007
| | | | | |
| | | Shares | | Value
(Note 2) |
| | | | | |
| | |
COMMON STOCKS - 94.8% | | | | | |
| | |
Financials - 81.5% | | | | | |
Capital Markets - 12.3% | | | | | |
Bank of New York Mellon Corp.1 | | 55,000 | | $ | 2,681,800 |
Franklin Resources, Inc. | | 40,000 | | | 4,577,200 |
Merrill Lynch & Co., Inc. | | 120,300 | | | 6,457,704 |
Morgan Stanley | | 85,100 | | | 4,519,661 |
SEI Investments Co. | | 277,650 | | | 8,932,001 |
| | | | | |
| | | | | 27,168,366 |
| | | | | |
Commercial Banks - 30.5% | | | | | |
The Bancorp, Inc.* | | 267,000 | | | 3,593,820 |
Boston Private Financial Holdings, Inc. | | 128,700 | | | 3,485,196 |
HSBC Holdings plc - ADR (United Kingdom) (Note 7) | | 65,600 | | | 5,491,376 |
Huntington Bancshares, Inc. | | 157,500 | | | 2,324,700 |
KeyCorp | | 49,690 | | | 1,165,231 |
PNC Financial Services Group, Inc. | | 135,500 | | | 8,895,575 |
Royal Bank of Scotland Group plc (United Kingdom) (Note 7) | | 512,900 | | | 4,532,704 |
Societe Generale - ADR (France) (Note 7) | | 155,100 | | | 4,486,764 |
SunTrust Banks, Inc. | | 30,600 | | | 1,912,194 |
TCF Financial Corp. | | 252,300 | | | 4,523,739 |
U.S. Bancorp | | 276,600 | | | 8,779,284 |
Wachovia Corp. | | 226,100 | | | 8,598,583 |
Webster Financial Corp. | | 66,600 | | | 2,129,202 |
Wells Fargo & Co. | | 107,900 | | | 3,257,501 |
Wilmington Trust Corp. | | 64,200 | | | 2,259,840 |
Zions Bancorporation | | 37,200 | | | 1,736,868 |
| | | | | |
| | | | | 67,172,577 |
| | | | | |
Consumer Finance - 3.1% | | | | | |
Capital One Financial Corp. | | 95,200 | | | 4,499,152 |
Nelnet, Inc. - Class A | | 182,200 | | | 2,315,762 |
| | | | | |
| | | | | 6,814,914 |
| | | | | |
Diversified Financial Services - 14.5% | | | | | |
Bank of America Corp. | | 211,000 | | | 8,705,860 |
Citigroup, Inc. | | 292,000 | | | 8,596,480 |
Financiere Marc de Lacharriere S.A. (Fimalac) (France) (Note 7) | | 24,726 | | | 1,698,909 |
JPMorgan Chase & Co. | | 201,700 | | | 8,804,205 |
Moody’s Corp. | | 117,200 | | | 4,184,040 |
| | | | | |
| | | | | 31,989,494 |
| | | | | |
| | |
| 6 | | The accompanying notes are an integral part of the financial statements. |
Investment Portfolio - December 31, 2007
| | | | | | | |
| | | Shares/
Principal Amount | | Value
(Note 2) | |
| | | | | | | |
| | |
COMMON STOCKS (continued) | | | | | | | |
| | |
Financials (continued) | | | | | | | |
Insurance - 18.6% | | | | | | | |
Allianz SE (Germany) (Note 7) | | | 21,500 | | $ | 4,654,289 | |
American International Group, Inc. | | | 115,500 | | | 6,733,650 | |
First American Corp. | | | 167,800 | | | 5,725,336 | |
LandAmerica Financial Group, Inc. | | | 107,900 | | | 3,609,255 | |
Philadelphia Consolidated Holding Corp.* | | | 55,700 | | | 2,191,795 | |
Principal Financial Group, Inc. | | | 63,400 | | | 4,364,456 | |
The Progressive Corp. | | | 303,800 | | | 5,820,808 | |
Torchmark Corp. | | | 36,100 | | | 2,185,133 | |
Willis Group Holdings Ltd. (United Kingdom) (Note 7) | | | 147,200 | | | 5,589,184 | |
| | | | | | | |
| | | | | | 40,873,906 | |
| | | | | | | |
Thrifts & Mortgage Finance - 2.5% | | | | | | | |
First Niagara Financial Group, Inc. | | | 91,800 | | | 1,105,272 | |
Flagstar Bancorp, Inc. | | | 311,300 | | | 2,169,761 | |
IndyMac Bancorp, Inc. | | | 365,400 | | | 2,174,130 | |
| | | | | | | |
| | | | | | 5,449,163 | |
| | | | | | | |
Total Financials | | | | | | 179,468,420 | |
| | | | | | | |
Information Technology - 13.3% | | | | | | | |
Internet Software & Services - 2.7% | | | | | | | |
Online Resources Corp.* | | | 498,000 | | | 5,936,160 | |
| | | | | | | |
IT Services - 10.6% | | | | | | | |
Automatic Data Processing, Inc. | | | 196,450 | | | 8,747,919 | |
Gevity HR, Inc. | | | 1,024,000 | | | 7,874,560 | |
Paychex, Inc. | | | 58,975 | | | 2,136,074 | |
Western Union Co. | | | 185,000 | | | 4,491,800 | |
| | | | | | | |
| | | | | | 23,250,353 | |
| | | | | | | |
Total Information Technology | | | | | | 29,186,513 | |
| | | | | | | |
TOTAL COMMON STOCKS
(Identified Cost $227,722,035) | | | | | | 208,654,933 | |
| | | | | | | |
| | |
SHORT-TERM INVESTMENTS - 8.0% | | | | | | | |
Dreyfus Treasury Cash Management - Institutional Shares | | | 7,515,771 | | | 7,515,771 | |
Fannie Mae Discount Note, 1/7/2008 | | $ | 10,000,000 | | | 9,991,783 | |
| | | | | | | |
TOTAL SHORT-TERM INVESTMENTS
(Identified Cost $17,508,658) | | | | | | 17,507,554 | |
| | | | | | | |
TOTAL INVESTMENTS - 102.8%
(Identified Cost $245,230,693) | | | | | | 226,162,487 | |
| | |
LIABILITIES, LESS OTHER ASSETS - (2.8%) | | | | | | (6,065,785 | ) |
| | | | | | | |
NET ASSETS - 100% | | | | | $ | 220,096,702 | |
| | | | | | | |
*Non-income producing security
ADR - American Depository Receipt
1Bank of New York Mellon Corp. is the parent company of Mellon Trust of New England N.A., the Fund’s custodian.
| | |
| The accompanying notes are an integral part of the financial statements. | | 7 |
Statement of Assets and Liabilities
December 31, 2007
| | | | |
ASSETS: | | | | |
| | | | |
| |
Investments, at value (identified cost $245,230,693) (Note 2) | | $ | 226,162,487 | |
Cash | | | 1,958,066 | |
Foreign currency, at value (cost $1) | | | 1 | |
Receivable for fund shares sold | | | 595,946 | |
Dividends receivable | | | 335,365 | |
Foreign tax reclaims receivable | | | 5,594 | |
| | | | |
TOTAL ASSETS | | | 229,057,459 | |
| | | | |
| LIABILITIES: | | | | |
| |
Accrued management fees (Note 3) | | | 135,170 | |
Accrued fund accounting and transfer agent fees (Note 3) | | | 9,536 | |
Accrued Chief Compliance Officer service fees (Note 3) | | | 723 | |
Payable for securities purchased | | | 8,682,274 | |
Payable for fund shares repurchased | | | 82,907 | |
Audit fees payable | | | 30,250 | |
Other payables and accrued expenses | | | 19,897 | |
| | | | |
TOTAL LIABILITIES | | | 8,960,757 | |
| | | | |
TOTAL NET ASSETS | | $ | 220,096,702 | |
| | | | |
NET ASSETS CONSIST OF: | | | | |
| |
Capital stock | | $ | 235,544 | |
Additional paid-in-capital | | | 240,755,605 | |
Undistributed net investment income | | | 256,898 | |
Accumulated net realized loss on investments, foreign currency and
other assets and liabilities | | | (2,083,586 | ) |
Net unrealized depreciation on investments, foreign currency and other assets and liabilities | | | (19,067,759 | ) |
| | | | |
TOTAL NET ASSETS | | $ | 220,096,702 | |
| | | | |
NET ASSET VALUE, OFFERING PRICE AND REDEMPTION PRICE PER SHARE ($220,096,702/23,554,448 shares) | | $ | 9.34 | |
| | | | |
| | |
| 8 | | The accompanying notes are an integral part of the financial statements. |
Statement of Operations
For the Year Ended December 31, 2007
| | | | |
INVESTMENT INCOME: | | | | |
| | | | |
| |
Dividends (net of foreign tax withheld, $20,616) | | $ | 3,821,424 | |
Interest | | | 274,085 | |
| | | | |
Total Investment Income | | | 4,095,509 | |
| | | | |
| EXPENSES: | | | | |
| |
Management fees (Note 3) | | | 1,426,297 | |
Fund accounting and transfer agent fees (Note 3) | | | 97,249 | |
Directors’ fees (Note 3) | | | 7,774 | |
Chief Compliance Officer service fees (Note 3) | | | 6,100 | |
Custodian fees | | | 12,000 | |
Miscellaneous | | | 88,699 | |
| | | | |
Total Expenses | | | 1,638,119 | |
| | | | |
NET INVESTMENT INCOME | | | 2,457,390 | |
| | | | |
| REALIZED AND UNREALIZED GAIN (LOSS) ON INVESTMENTS: | | | | |
| |
Net realized gain on - | | | | |
Investments | | | 6,103,911 | |
Foreign currency and other assets and liabilities | | | 3,538 | |
| | | | |
| | | 6,107,449 | |
| | | | |
| |
Net change in unrealized appreciation (depreciation) on - | | | | |
Investments | | | (34,698,470 | ) |
Foreign currency and other assets and liabilities | | | 30 | |
| | | | |
| | | (34,698,440 | ) |
| | | | |
| |
NET REALIZED AND UNREALIZED GAIN (LOSS) ON INVESTMENTS | | | (28,590,991 | ) |
| | | | |
NET DECREASE IN NET ASSETS RESULTING FROM OPERATIONS | | $ | (26,133,601 | ) |
| | | | |
| | |
| The accompanying notes are an integral part of the financial statements. | | 9 |
Statements of Changes in Net Assets
| | | | | | | | |
| | | For the
Year Ended
12/31/07 | | | For the
Year Ended
12/31/06 | |
| | | | | | | | |
| INCREASE (DECREASE) IN NET ASSETS: | | | | | | | | |
| | |
| OPERATIONS: | | | | | | | | |
| | |
Net investment income | | $ | 2,457,390 | | | $ | 1,092,834 | |
Net realized gain on investments and foreign currency | | | 6,107,449 | | | | 3,533,109 | |
Net change in unrealized appreciation (depreciation) on investments and foreign currency | | | (34,698,440 | ) | | | 12,688,149 | |
| | | | | | | | |
Net increase (decrease) from operations | | | (26,133,601 | ) | | | 17,314,092 | |
| | | | | | | | |
| DISTRIBUTIONS TO SHAREHOLDERS (Note 9): | | | | | | | | |
| | |
From net investment income | | | (2,228,398 | ) | | | (1,089,560 | ) |
From net realized gain on investments | | | (10,081,395 | ) | | | (1,860,551 | ) |
| | | | | | | | |
Total distributions to shareholders | | | (12,309,793 | ) | | | (2,950,111 | ) |
| | | | | | | | |
| CAPITAL STOCK ISSUED AND REPURCHASED: | | | | | | | | |
| | |
Net increase from capital share transactions (Note 5) | | | 125,684,727 | | | | 68,817,354 | |
| | | | | | | | |
Net increase in net assets | | | 87,241,333 | | | | 83,181,335 | |
| | |
| NET ASSETS: | | | | | | | | |
| | |
Beginning of year | | | 132,855,369 | | | | 49,674,034 | |
| | | | | | | | |
End of year (including undistributed net investment income of $256,898 and $40,469, respectively) | | $ | 220,096,702 | | | $ | 132,855,369 | |
| | | | | | | | |
| | |
| 10 | | The accompanying notes are an integral part of the financial statements. |
Financial Highlights
| | | | | | |
| | | For the
Year Ended 12/31/07 | | For the
Year Ended 12/31/06 | | For the
Period 7/1/051
to 12/31/05 |
| | | | | | |
| | | | | | |
| Per share data (for a share outstanding throughout each period): | | | | | | |
Net asset value - Beginning of period | | $12.51 | | $10.70 | | $10.00 |
| | | | | | |
Income (loss) from investment operations: | | | | | | |
Net investment income | | 0.19 | | 0.10 | | 0.05 |
Net realized and unrealized gain (loss) on investments | | (2.36) | | 2.00 | | 0.69 |
| | | | | | |
Total from investment operations | | (2.17) | | 2.10 | | 0.74 |
| | | | | | |
Less distributions to shareholders: | | | | | | |
From net investment income | | (0.18) | | (0.11) | | (0.04) |
From net realized gain on investments | | (0.82) | | (0.18) | | — |
| | | | | | |
Total distributions to shareholders | | (1.00) | | (0.29) | | (0.04) |
| | | | | | |
Net asset value - End of period | | $9.34 | | $12.51 | | $10.70 |
| | | | | | |
Total return2 | | (17.46%) | | 19.62% | | 7.39% |
| Ratios (to average net assets)/Supplemental Data: | | | | | | |
Expenses | | 1.15% | | 1.18% | | 1.20%3* |
Net investment income | | 1.72% | | 1.14% | | 0.95%3 |
Portfolio turnover | | 38% | | 30% | | 6% |
Net assets - End of period (000’s omitted) | | $220,097 | | $132,855 | | $49,674 |
| | | | | | |
|
*The investment advisor did not impose all of its management fee. If these expenses had been incurred by the Series, the expense ratio (to average net assets) for the period ended 12/31/05 would have been increased by 0.16%3. |
1Commencement of operations.
2Represents aggregate total return for the period indicated, and assumes reinvestment of all distributions. Total return would have been lower had certain expenses not been waived during the period ended December 31, 2005. Periods less than one year are not annualized.
3Annualized.
| | |
| The accompanying notes are an integral part of the financial statements. | | 11 |
Notes to Financial Statements
Financial Services Series (the “Series”) is a no-load non-diversified series of Manning & Napier Fund, Inc. (the “Fund”). The Fund is organized in Maryland and is registered under the Investment Company Act of 1940, as amended, as an open-end management investment company.
The Series’ investment objective is to provide long-term growth by investing principally in the common stocks of companies in the financial services industry.
The Fund’s Advisor is Manning & Napier Advisors, Inc. (the “Advisor”). Shares of the Series are offered to investors, clients and employees of the Advisor and its affiliates. The total authorized capital stock of the Fund consists of 5.0 billion shares of common stock each having a par value of $0.01. As of December 31, 2007, 3.33 billion shares have been designated in total among 27 series, of which 100 million have been designated as Financial Services Series Class A common stock.
| 2. | SIGNIFICANT ACCOUNTING POLICIES |
Security Valuation
Portfolio securities, including domestic equities, foreign equities, exchange-traded funds and options, listed on an exchange other than the NASDAQ National Market System are valued at the latest quoted sales price of the exchange on which the security is primarily traded. Securities not traded on valuation date or securities not listed on an exchange are valued at the latest quoted bid price provided by the Fund’s pricing service. Securities listed on the NASDAQ National Market System are valued in accordance with the NASDAQ Official Closing Price.
Securities for which representative valuations or prices are not available from the Fund’s pricing service may be valued at fair value. Due to the inherent uncertainty of valuations of such securities, the fair value may differ significantly from the values that would have been used had a ready market for such securities existed. If trading or events occurring after the close of the principal market in which securities are traded are expected to materially affect the value of those securities, then they may be valued at their fair value, taking this trading or these events into account. Fair value is determined in good faith by the Advisor under procedures approved by and under the general supervision and responsibility of the Fund’s Board of Directors (the “Board”).
Short-term investments that mature in sixty days or less are valued at amortized cost, which approximates market value. Investments in open-end investment companies are valued at their net asset value per share on valuation date, with the exception of exchange-traded funds, which are valued at the closing price on the exchange.
Security Transactions, Investment Income and Expenses
Security transactions are accounted for on trade date. Dividend income is recorded on the ex-dividend date, except that if the ex-dividend date has passed, certain dividends from foreign securities are recorded as soon as the Fund is informed of the ex-dividend date. Non-cash dividends, if any, are recorded at the fair market value of the securities received. Interest income, including amortization of premium and accretion of discounts using the effective interest method, is earned from settlement date and accrued daily.
Expenses are recorded on an accrual basis. Most expenses of the Fund can be attributed to a specific series. Expenses which cannot be directly attributed are apportioned among the series in the Fund in such a manner as deemed equitable by the Fund’s Board, taking into consideration, among other things, the nature and type of expense.
Notes to Financial Statements
| 2. | SIGNIFICANT ACCOUNTING POLICIES (continued) |
Security Transactions, Investment Income and Expenses (continued)
The Series uses the identified cost method for determining realized gain or loss on investments for both financial statement and federal income tax reporting purposes.
Foreign Currency Translation
The books and records of the Series are maintained in U.S. dollars. Foreign currencies, investments and other assets and liabilities are translated into U.S. dollars at the current exchange rates. Purchases and sales of investment securities and income and expenses are translated on the respective dates of such transactions. The Series does not isolate realized and unrealized gains and losses attributable to changes in the exchange rates from gains and losses that arise from changes in the market value of investments. Such fluctuations are included with net realized and unrealized gain or loss on investments. Net realized foreign currency gains and losses represent foreign currency gains and losses between trade date and settlement date on securities transactions, gains and losses on disposition of foreign currencies and the difference between the amount of income and foreign withholding taxes recorded on the books of the Series and the amounts actually received or paid.
Federal Taxes
The Series’ policy is to comply with the provisions of the Internal Revenue Code applicable to regulated investment companies. The Series is not subject to federal income tax or excise tax to the extent that the Series distributes to shareholders each year its taxable income, including any net realized gains on investments, in accordance with requirements of the Internal Revenue Code. Accordingly, no provision for federal income tax or excise tax has been made in the financial statements.
On June 29, 2007, the Series adopted Financial Accounting Standards Board Interpretation No. 48 - Accounting for Uncertainty in Income Taxes (“FIN 48”). FIN 48 prescribes the minimum recognition threshold a tax position must meet in connection with accounting for uncertainties in income tax positions taken or expected to be taken by an entity before being measured and recognized in the financial statements. Management has determined that FIN 48 did not have a material impact on the Series’ financial statements. The Series files income tax returns in the U.S. federal jurisdiction, various states and foreign jurisdictions, as required. No income tax returns are currently under investigation. The statute of limitations on the Series’ tax returns remains open for the years ended December 31, 2005 through December 31, 2007.
Additionally, based on the Fund’s understanding of the tax rules and rates related to income, gains and transactions for foreign jurisdictions in which it invests, the Series will provide for foreign taxes, and where appropriate, deferred foreign tax.
Distributions of Income and Gains
Distributions to shareholders of net investment income and net realized gains are made annually. An additional distribution may be necessary to avoid taxation of the Series. Distributions are recorded on the ex-dividend date.
Indemnifications
The Fund’s organizational documents provide former and current directors and officers with a limited indemnification against liabilities arising in connection with the performance of their duties to the Fund. In the normal course of business, the Fund may also enter into contracts that
Notes to Financial Statements
| 2. | SIGNIFICANT ACCOUNTING POLICIES (continued) |
Indemnifications (continued)
provide general indemnifications. The Fund’s maximum exposure under these arrangements is unknown as this would be dependent on future claims that may be made against the Fund. The risk of material loss from such claims is considered remote.
Other
The preparation of financial statements in conformity with accounting principles generally accepted in the United States of America requires management to make estimates and assumptions that affect the reported amounts of assets and liabilities and the disclosure of contingent assets and liabilities at the date of the financial statements and the reported amounts of income and expenses during the reporting period. Actual results could differ from those estimates.
| 3. | TRANSACTIONS WITH AFFILIATES |
The Fund has an Investment Advisory Agreement (the “Agreement”) with the Advisor, for which the Series pays a fee, computed daily and payable monthly, at an annual rate of 1.00% of the Series’ average daily net assets.
Under the Agreement, personnel of the Advisor provide the Series with advice and assistance in the choice of investments and the execution of securities transactions, and otherwise maintain the Series’ organization. The Advisor also provides the Fund with necessary office space and fund administration and support services. The salaries of all officers of the Fund (except a percentage of the Fund’s Chief Compliance Officer’s salary, which is paid by the Fund), and of all Directors who are “affiliated persons” of the Fund, or of the Advisor, and all personnel of the Fund, or of the Advisor, performing services relating to research, statistical and investment activities, are paid by the Advisor. Each “non-affiliated” Director receives an annual stipend, which is allocated among all the active series of the Fund. In addition, these Directors also receive a fee per Board meeting attended for each active series of the Fund plus a fee for each committee meeting attended.
The Advisor has contractually agreed, until at least April 30, 2009, to waive its fee and, if necessary, pay other operating expenses of the Series in order to maintain total direct annual fund operating expenses for the Series at no more than 1.20% of average daily net assets each year. For the year ended December 31, 2007, the Advisor did not waive its management fee or reimburse any expenses of the Series. The Advisor is not eligible to recoup any expenses that have been waived or reimbursed in prior years.
Manning & Napier Investor Services, Inc., a registered broker-dealer affiliate of the Advisor, acts as distributor for the Fund’s shares. The services of Manning & Napier Investor Services, Inc. are provided at no additional cost to the Series.
For fund accounting and transfer agent services, the Fund pays the Advisor an annual fee of 0.11% of the Fund’s average daily net assets up to $900 million, 0.07% of the Fund’s average daily net assets between $900 million and $1.5 billion, and 0.04% of the Fund’s average daily net assets over $1.5 billion. Additionally, certain transaction and account-based fees and out-of-pocket expenses, including charges for reporting relating to the Fund’s compliance program, are charged. Expenses not directly attributable to a series are allocated based on each series’ relative net assets or number of accounts, depending on the expense. The Advisor has an agreement with Citi Fund Services Ohio, Inc. (“Citi”) (formerly BISYS Fund Services Ohio, Inc.) under which Citi serves as sub-accountant and sub-transfer agent.
Notes to Financial Statements
| 4. | PURCHASES AND SALES OF SECURITIES |
For the year ended December 31, 2007, purchases and sales of securities, other than United States Government securities and short-term securities, were $163,181,142 and $52,680,957, respectively. There were no purchases or sales of United States Government securities.
| 5. | CAPITAL STOCK TRANSACTIONS |
Transactions in shares of Financial Services Series were:
| | | | | | | | | | | | | | |
| | | For the Year
Ended 12/31/07 | | | For the Year
Ended 12/31/06 | |
| | | Shares | | | Amount | | | Shares | | | Amount | |
| | | | | | | | | | | | | | |
Sold | | 12,112,146 | | | $ | 118,943,581 | | | 6,045,105 | | | $ | 69,415,961 | |
Reinvested | | 1,269,156 | | | | 12,123,485 | | | 232,171 | | | | 2,891,162 | |
Repurchased | | (448,824 | ) | | | (5,382,339 | ) | | (297,702 | ) | | | (3,489,769 | ) |
| | | | | | | | | | | | | | |
Total | | 12,932,478 | | | $ | 125,684,727 | | | 5,979,574 | | | $ | 68,817,354 | |
| | | | | | | | | | | | | | |
Substantially all of the Series’ shares represent investments by fiduciary accounts over which the Advisor has sole investment discretion.
The Series may trade in financial instruments with off-balance sheet risk in the normal course of its investing activities to assist in managing exposure to various market risks. These financial instruments include written options, forward foreign currency exchange contracts and futures contracts and may involve, to a varying degree, elements of risk in excess of the amounts recognized for financial statement purposes. No such investments were held by the Series on December 31, 2007.
Investing in securities of foreign companies and foreign governments involves special risks and considerations not typically associated with investing in securities of domestic companies and the United States Government. These risks include revaluation of currencies and future adverse political and economic developments. Moreover, securities of foreign companies and foreign governments and their markets may be less liquid and their prices more volatile than those of comparable domestic companies and the United States Government.
| 8. | FINANCIAL SERVICES SECURITIES |
The Series may focus its investments in certain related financial services industries; hence, the Series may subject itself to a greater degree of risk than a series that is more diversified.
| 9. | FEDERAL INCOME TAX INFORMATION |
The amount and characterization of certain income and capital gains to be distributed are determined in accordance with federal income tax regulations, which may differ from accounting principles generally accepted in the United States of America. These differences are primarily due to differing book and tax treatments in the timing of the recognition of net investment income or gains and losses, including foreign currency gains and losses and Post-October losses. The Series may periodically make reclassifications among its capital accounts to reflect income and gains available for distribution (or available capital loss carryovers) under income tax regulations, without impacting the Series’ net asset value. Any such reclassifications are not reflected in the financial highlights.
Notes to Financial Statements
| 9. | FEDERAL INCOME TAX INFORMATION (continued) |
The tax character of distributions paid were as follows:
| | | | | | |
| | | For the Year
Ended 12/31/07 | | For the Year
Ended 12/31/06 |
Ordinary income | | $ | 7,602,829 | | $ | 2,451,358 |
Long-term capital gains | | | 4,706,964 | | | 498,753 |
For the year ended December 31, 2007, the Series elected to defer $2,083,586 of capital losses attributable to Post-October losses.
At December 31, 2007, the tax basis components of distributable earnings and the net unrealized depreciation based on identified cost for federal income tax purposes were as follows:
| | | | |
Cost for federal income tax purposes | | $ | 245,230,693 | |
| |
Unrealized appreciation | | $ | 6,343,567 | |
Unrealized depreciation | | | (25,411,773 | ) |
| | | | |
Net unrealized depreciation | | $ | (19,068,206 | ) |
Undistributed ordinary income | | | 256,898 | |
| 10. | RECENT ACCOUNTING PRONOUNCEMENTS |
In September 2006, FASB Statement of Financial Accounting Standards No. 157, Fair Value Measurements (“FAS 157”) was issued, and is effective for fiscal years beginning after November 15, 2007. FAS 157 defines fair value, establishes a framework for measuring fair value, and expands disclosure about fair value measurements. The standard does not expand the use of fair value in any new circumstances, but provides clarification on acceptable fair value methods and applications. At this time, management is evaluating the implications of FAS 157, but it is not expected to materially impact the Series’ financial statements.
Report of Independent Registered Public Accounting Firm
To the Board of Directors of Manning & Napier Fund, Inc. and Shareholders of Financial Services Series:
In our opinion, the accompanying statement of assets and liabilities, including the investment portfolio, and the related statements of operations and of changes in net assets and the financial highlights present fairly, in all material respects, the financial position of the Financial Services Series (a series of Manning & Napier Fund, Inc., hereafter referred to as the “Series”) at December 31, 2007, and the results of its operations for the year then ended, the changes in its net assets for each of the two years in the period then ended and the financial highlights for each of the periods indicated, in conformity with accounting principles generally accepted in the United States of America. These financial statements and financial highlights (hereafter referred to as “financial statements”) are the responsibility of the Series’ management; our responsibility is to express an opinion on these financial statements based on our audits. We conducted our audits of these financial statements in accordance with the standards of the Public Company Accounting Oversight Board (United States). Those standards require that we plan and perform the audit to obtain reasonable assurance about whether the financial statements are free of material misstatement. An audit includes examining, on a test basis, evidence supporting the amounts and disclosures in the financial statements, assessing the accounting principles used and significant estimates made by management, and evaluating the overall financial statement presentation. We believe that our audits, which included confirmation of securities at December 31, 2007 by correspondence with the custodian and brokers, provide a reasonable basis for our opinion.

Columbus, Ohio
February 20, 2008
Supplemental Tax Information (unaudited)
For federal income tax purposes, the Series designates for the current fiscal year $5,586,865 or, if different, the maximum amount allowable under the tax law as qualified dividend income.
For corporate shareholders, the percentage of investment income (dividend income plus short-term gains, if any) that qualifies for the dividends received deduction for the current fiscal year is 36.9%.
Pursuant to Section 852 of the Internal Revenue Code, as amended, the Series hereby designates $4,706,964 as capital gains for its taxable year ended December 31, 2007.
Renewal of Investment Advisory Agreements (unaudited)
During the period covered by this shareholder report, the Board of Directors (the “Board”) of Manning & Napier Fund, Inc. (the “Fund”) considered approval of two separate investment advisory agreements with Manning & Napier Advisors, Inc. (the “Advisor”):
| | • | | At a meeting held on August 30, 2007, the Board approved a new investment advisory agreement between the Fund and the Advisor (the “New Investment Advisory Agreement”) and recommended that the New Investment Advisory Agreement be submitted to shareholders for approval. Shareholders approved the New Investment Advisory Agreement at a meeting held on December 17, 2007. |
| | • | | At a meeting held on November 12, 2007, the Board approved the continuation of the then-current investment advisory agreement between the Fund and the Advisor (the “Current Investment Advisory Agreement”), which was to be superseded by the New Investment Advisory Agreement upon its approval by the Fund’s shareholders. The continuation of the Current Investment Advisory Agreement was necessary as a result of the delay in obtaining the number of votes necessary to convene the shareholder meeting and approve the New Investment Advisory Agreement with respect to all investment portfolios of the Fund (the “Series”). |
Consideration of New Investment Advisory Agreement:
In response to recent regulatory and compliance initiatives promulgated by the SEC over the past year, the Fund engaged in a comprehensive review of all material aspects of the Fund’s operations, including the Fund’s Current Investment Advisory Agreement. As a result of its review, the Board determined that the Current Investment Advisory Agreement should be amended for the purpose of modernizing the form of the agreement and to include additional provisions in the agreement that are customarily included in investment advisory agreements between registered investment companies and their investment advisors, but which are not included in the Current Investment Advisory Agreement. Accordingly, at the Board meeting on November 16, 2006, representatives of the Advisor presented to the Board proposed changes to the Current Investment Advisory Agreement in order to address the Board’s request to update and modernize the Current Investment Advisory Agreement. As a result of the discussions between the Board and representatives of the Advisor at the November 2006 Board meeting, the Board determined to formally consider the approval of a new investment advisory agreement between the Fund and the Advisor, which would incorporate the changes proposed at the November 2006 Board meeting, at its in-person Board meeting in August 2007.
At an in-person meeting held on August 30, 2007, the Board considered the approval of the New Investment Advisory Agreement between the Fund and the Advisor. Based on the information it received at the meeting and the November 16, 2006 Board meeting, the Board approved the New Investment Advisory Agreement subject to its further approval by the Fund’s shareholders. Representatives of the Advisor attended the meeting and presented additional oral and written information to the Board to assist the Board in its considerations. At the meeting, the Board concluded it was reasonable to take into account the conclusions the Board made when considering and evaluating the renewal of the Current Investment Advisory Agreement (the “2006 Annual Review”), which occurred at the November 16, 2006 in-person Board meeting, as part of its considerations to approve the New Investment Advisory Agreement. The discussion immediately below outlines the materials and information presented to the Board in connection with the Board’s 2006 Annual Review of the Current Investment Advisory Agreement and the conclusions made by the Directors when determining to continue the Current Investment Advisory Agreement for an additional one-year period.
Renewal of Investment Advisory Agreements (unaudited)
In connection with its review and deliberations, the Board considered the following factors and reached a conclusion with respect to such factors.
| | • | | The Board considered the services provided by the Advisor under the Current Investment Advisory Agreement including, among others: deciding what securities to purchase and sell for each Series; arranging for the purchase and sale of such securities by placing orders with broker-dealers; administering the affairs of the Fund (including the books and records of the Fund not maintained by third party service providers such as the custodian or sub-transfer agent); arranging for the insurance coverage for the Fund; and supervising the preparation of tax returns, SEC filings (including registration statements) and reports to shareholders for the Fund. The Board also considered the nature and quality of such services provided under the Current Investment Advisory Agreement in light of the Advisor’s services provided to the Fund for 21 years. The Board discussed the quality of these services with representatives from the Advisor and concluded that the Advisor was performing its services to the Fund required under the Current Investment Advisory Agreement in a reasonable manner. |
| | • | | The Board considered the investment performance of the various Series of the Fund. The investment performance for each Series was reviewed on a cumulative basis since inception and on a one year basis. In addition, annualized performance for the following time periods was considered: inception, three year, five year, ten year, and current market cycle. A market cycle includes periods of both rising and falling markets. Returns for established benchmark indices for each Series were provided for each time period. The Board noted that all the Series were competitive against their respective benchmark indices over all time periods noted above through September 30, 2006. In addition, the Board considered at the meeting (and considers on a quarterly basis) a peer group performance analysis consisting of Morningstar universes of mutual funds with similar investment objectives. The Board discussed the performance with representatives from the Advisor and concluded that the investment performance of each of the Fund’s Series was reasonable based on the Fund’s actual performance and comparative performance, especially performance over the current market cycle. |
| | • | | The Board considered the costs of the Advisor’s services and the profits of the Advisor as they relate to the Advisor’s services to the Fund under the Current Investment Advisory Agreement. In reviewing the Advisor’s costs and profits, the Board discussed the Advisor’s revenues generated from the Fund (on both an actual and adjusted basis) and its expenses associated with providing the services under the Current Investment Advisory Agreement. In addition, the Board reviewed the Advisor’s expenses associated with Fund activities outside of the Current Investment Advisory Agreement (such as expense reimbursements pursuant to expense caps and payments made by the Advisor to third party platforms on which shares of the Fund are available for purchase). It was noted by representatives of the Advisor that 6 of the 18 active Series of the Fund are currently experiencing expenses above the capped expense ratios. After discussing the above costs and profits, the Board concluded that the Advisor’s profitability relating to its services provided under the Current Investment Advisory Agreement was reasonable. |
| | • | | The Board considered the fees and expenses of the various Series of the Fund. The Advisor presented the advisory fees and total expenses for each Series, including the |
Renewal of Investment Advisory Agreements (unaudited)
| | advisory fee adjusted for any expense waivers or reimbursements (either contractual or voluntary) paid by the Advisor. The advisory fees and expense ratios of each Series were compared to an average (on both a mean and median basis) of similar funds as disclosed on the Morningstar database. Representatives of the Advisor discussed with the Board the levels of its advisory fee for each Series of the Fund and as compared to the median and mean advisory fees for similar funds as listed on Morningstar. Expense ratios for every Series, except the High Yield Bond Series, are currently below the median and mean for similar funds as listed on Morningstar. Based on their review of the information provided, the Board concluded that the fees and expenses of each Series of the Fund were reasonable on a comparative basis. |
| | • | | The Board also considered the other benefits the Advisor derives from its relationship with the Fund. Such other benefits include certain research products provided by soft dollars. Given the level of soft dollar transactions involving the Fund, the Board concluded that these additional benefits to the Advisor were reasonable. |
| | • | | In addition to the factors described above, the Board considered the Advisor’s personnel, investment strategies, policies and procedures relating to compliance with personal securities transactions, and reputation, expertise and resources in domestic and foreign financial markets. The Board concluded that these factors support the conclusion that the Advisor performs its services in a reasonable manner. |
| | • | | The Board did not consider economies of scale at this time because of the multiple uses of the Fund (for the Advisor’s discretionary investment account clients in addition to direct investors), the current profitability of the Advisor’s services to the Fund under the Current Investment Advisory Agreement, and the overall size of the Fund complex. |
Based on the Board’s deliberations and their evaluation of the information described above, the Board, including a majority of Directors that are “not interested” as defined in the Investment Company Act of 1940 (the “1940 Act”), concluded that the compensation under the Current Investment Advisory Agreement was fair and reasonable in light of the services and expenses and such other matters as the Directors considered to be relevant in the exercise of their reasonable judgment. Accordingly, the Board approved the renewal of the Current Investment Advisory Agreement for another year. In the course of their deliberations, the Directors did not identify any particular information that was all important or controlling.
As stated above, at the August 30, 2007 Board meeting, the Board concluded it was reasonable to take into account the conclusions set forth above when determining whether to approve the New Investment Advisory Agreement. The Board’s conclusion in this regard was based on the fact that the New Investment Advisory Agreement is identical to the Current Investment Advisory Agreement except for certain provisions of the Agreement which have been updated and modernized in response to the Board’s specific request. Further, the Board’s conclusion in this regard was based on the fact that the New Investment Advisory Agreement does not change either the investment advisory fees payable by the Fund to the Advisor or the day-to-day investment management services the Advisor provides to the Fund.
In addition to the conclusions formed with respect to the 2006 Annual Review, the Directors considered specific information at the August 30, 2007 Board meeting concerning the additional provisions included in the New Investment Advisory Agreement. The Directors considered the fact that these additional provisions are designed to (i) address and memorialize certain standard practices and regulatory requirements of mutual funds and their investment advisors; (ii) further
Renewal of Investment Advisory Agreements (unaudited)
delineate the duties and obligations of the Fund and the Advisor; (iii) modernize the agreement to reflect current industry practice and applicable law; and (iv) generally improve the overall quality of the agreement. The Board further considered the fact that the New Investment Advisory Agreement does not alter the actual day-to-day investment management services provided by the Advisor to each Series of the Fund, and the investment advisory fee rate paid to the Advisor under the New Investment Advisory Agreement for a Series is the same as the fee rate paid by the Series under the Current Investment Advisory Agreement.
Based on its evaluation of the information and the conclusions with respect thereto at its meetings on November 16, 2006 and August 30, 2007, the Board unanimously concluded that: (a) the terms of the New Investment Advisory Agreement were fair and reasonable; (b) the approval of the New Investment Advisory Agreement would be in the best interests of the shareholders and the Fund; and (c) it would recommend the approval of the New Investment Advisory Agreement to shareholders. In the course of their deliberations, the Board did not identify any particular information or factor that was all-important or controlling.
Consideration of Current Investment Advisory Agreement
At a meeting held on November 12, 2007, the Board considered the continuation of the Current Investment Advisory Agreement and simultaneously conducted its annual review of the services provided to the Fund by the Adviser (the “2007 Annual Review”). Representatives of the Advisor attended the meeting and presented additional oral and written information to the Board to assist the Board in its considerations. The discussion immediately below outlines the materials and information presented to the Board in connection with the Board’s 2007 Annual Review of the Current Investment Advisory Agreement and the conclusions made by the Directors when determining to continue the Current Investment Advisory Agreement.
In connection with its review and deliberations, the Board considered the following factors and reached a conclusion with respect to such factors.
| | • | | The Board considered the services provided by the Advisor under the Current Investment Advisory Agreement including, among others: deciding what securities to purchase and sell for each Series; arranging for the purchase and sale of such securities by placing orders with broker-dealers; administering the affairs of the Fund (including the books and records of the Fund not maintained by third party service providers such as the custodian or sub-transfer agent); arranging for the insurance coverage for the Fund; and supervising the preparation of tax returns, SEC filings (including registration statements) and reports to shareholders for the Fund. The Board also considered the nature and quality of such services provided under the Current Investment Advisory Agreement in light of the Advisor’s services provided to the Fund for 21 years. The Board discussed the quality of these services with representatives from the Advisor and concluded that the Advisor was performing its services to the Fund required under the Current Investment Advisory Agreement in a reasonable manner. |
| | • | | The Board considered the investment performance of the various Series of the Fund. The investment performance for each Series was reviewed on a cumulative basis since inception and on a one year basis. In addition, annualized performance for the following time periods was considered: inception, three year, five year, ten year, and current market cycle. A market cycle includes periods of both rising and falling markets. Returns for established benchmark indices for each Series were provided for |
Renewal of Investment Advisory Agreements (unaudited)
| | each time period. The Board noted that all the Series were competitive against their respective benchmark indices over all time periods noted above through September 30, 2007. In addition, the Board considered at the meeting (and considers on a quarterly basis) a peer group performance analysis consisting of Morningstar universes of mutual funds with similar investment objectives. The Board discussed the performance with representatives from the Advisor and concluded that the investment performance of each of the Fund’s Series was reasonable based on the Fund’s actual performance and comparative performance, especially performance over the current market cycle. |
| | • | | The Board considered the costs of the Advisor’s services and the profits of the Advisor as they relate to the Advisor’s services to the Fund under the Current Investment Advisory Agreement. In reviewing the Advisor’s costs and profits, the Board discussed the Advisor’s revenues generated from the Fund (on both an actual and adjusted basis) and its expenses associated with providing the services under the Current Investment Advisory Agreement. In addition, the Board reviewed the Advisor’s expenses associated with Fund activities outside of the Current Investment Advisory Agreement (such as expense reimbursements pursuant to expense caps and payments made by the Advisor to third party platforms on which shares of the Fund are available for purchase). It was noted by representatives of the Advisor that 4 of the 18 active Series of the Fund are currently experiencing expenses above the capped expense ratios. After discussing the above costs and profits, the Board concluded that the Advisor’s profitability relating to its services provided under the Current Investment Advisory Agreement was reasonable. |
| | • | | The Board considered the fees and expenses of the various Series of the Fund. The Advisor presented the advisory fees and total expenses for each Series, including the advisory fee adjusted for any expense waivers or reimbursements (either contractual or voluntary) paid by the Advisor. The advisory fees and expense ratios of each Series were compared to an average (on both a mean and median basis) of similar funds as disclosed on the Morningstar database. Representatives of the Advisor discussed with the Board the levels of its advisory fee for each Series of the Fund and as compared to the median and mean advisory fees for similar funds as listed on Morningstar. Expense ratios for every Series, except the High Yield Bond Series and Global Fixed Income Series, are currently below the median and mean for similar funds as listed on Morningstar. Based on their review of the information provided, the Board concluded that the fees and expenses of each Series of the Fund were reasonable on a comparative basis. |
| | • | | The Board also considered the other benefits the Advisor derives from its relationship with the Fund. Such other benefits include certain research products provided by soft dollars. Given the level of soft dollar transactions involving the Fund, the Board concluded that these additional benefits to the Advisor were reasonable. |
| | • | | In addition to the factors described above, the Board considered the Advisor’s personnel, investment strategies, policies and procedures relating to compliance with personal securities transactions, and reputation, expertise and resources in domestic and foreign financial markets. The Board concluded that these factors support the conclusion that the Advisor performs its services in a reasonable manner. |
Renewal of Investment Advisory Agreements (unaudited)
| | • | | The Board did not consider economies of scale at this time because of the multiple uses of the Fund (for the Advisor’s discretionary investment account clients in addition to direct investors), the current profitability of the Advisor’s services to the Fund under the Current Investment Advisory Agreement, and the overall size of the Fund complex. |
Based on the Board’s deliberations and their evaluation of the information described above, the Board, including a majority of Directors that are not “interested persons” as defined in the 1940 Act, concluded that the compensation under the Current Investment Advisory Agreement was fair and reasonable in light of the services and expenses and such other matters as the Directors considered to be relevant in the exercise of their reasonable judgment. Accordingly, the Board approved the renewal of the Current Investment Advisory Agreement. In the course of their deliberations, the Directors did not identify any particular information that was all important or controlling.
Proxy Voting Results (unaudited)
A special meeting of the shareholders of Manning & Napier Fund, Inc. was held on November 12, 2007. The number of votes necessary to conduct the meeting and approve each proposal was obtained, and the results of the votes of shareholders on proposals before them are listed below:
PROPOSAL 1:
Election of Directors.
| | | | |
| | | Number of Shares
voted for | | Number of Shares
withheld |
B. Reuben Auspitz | | 215,932,354.541 | | 15,898,685.154 |
Stephen B. Ashley | | 215,960,751.214 | | 15,870,288.481 |
Peter L. Faber | | 217,504,725.208 | | 14,326,314.487 |
Harris H. Rusitzky | | 215,924,013.609 | | 15,907,026.086 |
PROPOSAL 2:
To approve the investment advisory agreement between Manning & Napier Advisors, Inc. and Manning & Napier Fund, Inc.
| | |
| | | Number of
shares voted |
For | | 8,697,370.284 |
Against | | 0 |
Abstain (includes broker non-votes) | | 65,549.000 |
PROPOSAL 3:
Eliminating, amending, or reclassifying certain fundamental investment policies or restrictions.
Proposal 3.A.i. To approve changes to the fundamental policy regarding borrowing money.
| | |
| | | Number of
shares voted |
For | | 8,697,370.284 |
Against | | 0 |
Abstain (includes broker non-votes) | | 65,549.000 |
Proposal 3.A.v. To approve changes to the fundamental policy regarding buying or selling of commodities or commodity contracts.
| | |
| | | Number of
shares voted |
For | | 8,697,370.284 |
Against | | 0 |
Abstain (includes broker non-votes) | | 65,549.000 |
Directors’ and Officers’ Information (unaudited)
The Statement of Additional Information provides additional information about the Fund’s directors and officers and can be obtained without charge by calling 1-800-466-3863, at www.manningnapieradvisors.com, or on the EDGAR Database on the SEC Internet web site (http://www.sec.gov). The following chart shows certain information about the Fund’s officers and directors, including their principal occupations during the last five years. Unless specific dates are provided, the individuals have held the listed positions for longer than five years.
INTERESTED DIRECTOR/OFFICER
| | |
| Name: | | B. Reuben Auspitz* |
| Address: | | 290 Woodcliff Drive Fairport, NY 14450 |
| Age: | | 60 |
| Current Position(s) Held with Fund: | | Principal Executive Officer, President, Chairman & Director |
| Term of Office1 & Length of Time Served: | | Indefinite - Director since 1984; Vice President 1984 - 2003; President since 2004; Principal Executive Officer since 2002 |
| Principal Occupation(s) During Past 5 Years: | | Executive Vice President; Co-Executive Director; Executive Group Member**; Chief Compliance Officer since 2004 - Manning & Napier Advisors, Inc. President; Director - Manning & Napier Investor Services, Inc. Holds or has held one or more of the following titles for various subsidiaries and affiliates: President, Vice President, Director, Chairman, Treasurer, Chief Compliance Officer or Member. |
| Number of Portfolios Overseen within Fund Complex: | | 27 |
| Other Directorships Held Outside Fund Complex: | | N/A |
| |
| INDEPENDENT DIRECTORS | | |
| |
| Name: | | Stephen B. Ashley |
| Address: | | 290 Woodcliff Drive Fairport, NY 14450 |
| Age: | | 67 |
| Current Position(s) Held with Fund: | | Director, Audit Committee Member, Governance & Nominating Committee Member |
| Term of Office & Length of Time Served: | | Indefinite - Since 1996 |
| Principal Occupation(s) During Past 5 Years: | | Chairman, Director, President & Chief Executive Officer, The Ashley Group (property management and investment) |
| Number of Portfolios Overseen within Fund Complex: | | 27 |
| Other Directorships Held Outside Fund Complex: | | The Ashley Group Fannie Mae |
| Name: | | Peter L. Faber |
| Address: | | 290 Woodcliff Drive Fairport, NY 14450 |
| Age: | | 68 |
| Current Position(s) Held with Fund: | | Director, Governance & Nominating Committee Member |
| Term of Office & Length of Time Served: | | Indefinite - Since 1987 |
| Principal Occupation(s) During Past 5 Years: | | Senior Counsel, McDermott, Will & Emery LLP (law firm) |
| Number of Portfolios Overseen within Fund Complex: | | 27 |
| Other Directorships Held Outside Fund Complex: | | Partnership for New York City, Inc. New York Collegium Boston Early Music Festival |
| Name: | | Harris H. Rusitzky |
| Address: | | 290 Woodcliff Drive Fairport, NY 14450 |
| Age: | | 72 |
| Current Position(s) Held with Fund: | | Director, Audit Committee Member, Governance & Nominating Committee Member |
| Term of Office & Length of Time Served: | | Indefinite - Since 1985 |
| Principal Occupation(s) During Past 5 Years: | | President, The Greening Group (business consultants); Partner, The Restaurant Group (restaurants) |
| Number of Portfolios Overseen within Fund Complex: | | 27 |
| Other Directorships Held Outside Fund Complex: | | N/A |
Directors’ and Officers’ Information (unaudited)
| | |
| Name: | | Paul A. Brooke |
| Address: | | 290 Woodcliff Drive Fairport, NY 14450 |
| Age: | | 62 |
| Current Position(s) Held with Fund: | | Director, Audit Committee Member, Governance & Nominating Committee Member |
| Term of Office & Length of Time Served: | | Indefinite - Since 2007 |
| Principal Occupation(s) During Past 5 Years: | | Chairman & CEO, Alsius Corp. (investments); Managing Member, PMSV Holdings LLC (investments) |
| Number of Portfolios Overseen within Fund Complex: | | 27 |
| Other Directorships Held Outside Fund Complex: | | Incyte Corp. ViroPharma, Inc. HLTH Corp. Cheyne Capital International MPM Bio-equities GMP Companies HoustonPharma |
| |
| OFFICERS | | |
| |
| Name: | | Jeffrey S. Coons, Ph.D., CFA |
| Address: | | 290 Woodcliff Drive Fairport, NY 14450 |
| Age: | | 44 |
| Current Position(s) Held with Fund: | | Vice President |
| Term of Office1 & Length of Time Served: | | Since 2004 |
| Principal Occupation(s) During Past 5 Years: | | Co-Director of Research since 2002 & Executive Group Member**, Manning & Napier Advisors, Inc. Holds one or more of the following titles for various subsidiaries and affiliates: President, Director, Treasurer or Senior Trust Officer. |
| Number of Portfolios Overseen within Fund Complex: | | 27 |
| Other Directorships Held Outside Fund Complex: | | N/A |
| Name: | | Christine Glavin |
| Address: | | 290 Woodcliff Drive Fairport, NY 14450 |
| Age: | | 41 |
| Current Position(s) Held with Fund: | | Principal Financial Officer, Chief Financial Officer |
| Term of Office1 & Length of Time Served: | | Principal Financial Officer since 2002; Chief Financial Officer since 2001 |
| Principal Occupation(s) During Past 5 Years: | | Fund Reporting Manager, Manning & Napier Advisors, Inc. |
| Number of Portfolios Overseen within Fund Complex: | | 27 |
| Other Directorships Held Outside Fund Complex: | | N/A |
| Name: | | Jodi L. Hedberg |
| Address: | | 290 Woodcliff Drive Fairport, NY 14450 |
| Age: | | 40 |
| Current Position(s) Held with Fund: | | Corporate Secretary, Chief Compliance Officer, Anti-Money Laundering Compliance Officer |
| Term of Office1 & Length of Time Served: | | Corporate Secretary since 1997; Chief Compliance Officer since 2004 |
| Principal Occupation(s) During Past 5 Years: | | Director of Compliance, Manning & Napier Advisors, Inc. and affiliates; Corporate Secretary, Manning & Napier Investor Services, Inc. since 2006 |
| Number of Portfolios Overseen within Fund Complex: | | 27 |
| Other Directorships Held Outside Fund Complex: | | N/A |
*Interested Director, within the meaning of the Investment Company Act of 1940 by reason of his position with the Fund’s investment advisor and distributor. Mr. Auspitz serves as the Executive Vice President and Director, Manning & Napier Advisors, Inc. and President and Director, Manning & Napier Investor Services, Inc., the Fund’s distributor.
**The Executive Group performs the duties of the Office of the Chief Executive of Manning & Napier Advisors, Inc.
1The term of office for President, Vice President, Chief Financial Officer, and Corporate Secretary is one year and until their respective successors are chosen and qualified. All other officers’ terms are indefinite.
(THISPAGEINTENTIONALLYLEFTBLANK)
(THISPAGEINTENTIONALLYLEFTBLANK)
Literature Requests (unaudited)
Proxy Voting Policies and Procedures
A description of the policies and procedures that the Fund uses to determine how to vote proxies relating to portfolio securities is available, without charge, upon request:
| | |
By phone | | 1-800-466-3863 |
On the Securities and Exchange Commission’s (SEC) web site | | http://www.sec.gov |
Proxy Voting Record
Information regarding how the Fund voted proxies relating to portfolio securities during the most recent 12-month period ended June 30th is available, without charge, upon request:
| | |
By phone | | 1-800-466-3863 |
On the SEC’s web site | | http://www.sec.gov |
Quarterly Portfolio Holdings
The Series’ complete schedule of portfolio holdings for the 1st and 3rd quarters of each fiscal year are provided on Form N-Q, and are available, without charge, upon request:
| | |
By phone | | 1-800-466-3863 |
On the SEC’s web site | | http://www.sec.gov |
The Series’ Form N-Q may be reviewed and copied at the SEC’s Public Reference Room in Washington, D.C. Information on the operation of the Public Reference Room may be obtained by calling 1-800-SEC-0330.
Prospectus and Statement of Additional Information (SAI)
The prospectus and SAI provide additional information about each Series, including charges, expenses and risks. These documents are available, without charge, upon request:
| | |
By phone | | 1-800-466-3863 |
On the SEC’s web site | | http://www.sec.gov |
On the Advisor’s web site | | http://www.manningnapieradvisors.com |
Additional information available at www.manningnapieradvisors.com
1. Fund Holdings - Month-End
2. Fund Holdings - Quarter-End
3. Shareholder Report - Annual
4. Shareholder Report - Semi-Annual
(a) The registrant has adopted a code of ethics that applies to its principal executive officer, principal financial officer and principal accounting officer. A copy of the registrant’s code of ethics is filed herewith as Exhibit 12(a)(1).
(b) During the period covered by this report, no amendments were made to the provisions of the code of ethics adopted in 2 (a) above.
(c) During the period covered by this report, no implicit or explicit waivers to the provisions of the code of ethics adopted in 2 (a) above were granted.
| (d) | Not applicable to the registrant due to the response given in 2 (c) above. |
| ITEM 3: | AUDIT COMMITTEE FINANCIAL EXPERT |
All of the members of the Audit committee have been determined by the Registrant’s Board of Directors to be Audit Committee Financial Experts as defined in this item. The members of the Audit Committee are: Harris H. Rusitzky, Stephen B. Ashley and Paul A. Brooke. All Audit Committee members are independent under applicable rules. This designation will not increase the designee’s duties, obligations or liability as compared to their duties, obligations and liability as a member of the Audit Committee and of the Board.
| ITEM 4: | PRINCIPAL ACCOUNTANT FEES AND SERVICES |
Principal Accountant Fees and Services
Aggregate fees for professional services rendered for the Manning & Napier Fund, Inc. (Small Cap Series, International Series, World Opportunities Series, Life Sciences Series, Technology Series, Financial Services Series, New York Tax Exempt Series, Ohio Tax Exempt Series, Diversified Tax Exempt Series, Core Bond Series, and Core Plus Bond Series, collectively the “Fund”) by PricewaterhouseCoopers LLP (“PwC”) as of and for the years ended December 31, 2007 and 2006 were:
| | | | | | |
| | | 2007 | | 2006 |
Audit Fees (a) | | $ | 271,460 | | $ | 255,736 |
Audit Related Fees (b) | | | — | | | — |
Tax Fees (c) | | | 68,400 | | | 65,120 |
All Other Fees (d) | | | — | | | — |
| | | | | | |
| | $ | 339,860 | | $ | 320,856 |
| | | | | | |
These fees relate to professional services rendered by PwC for the audit of the Fund’s annual financial statements or services normally provided by the accountant in connection with statutory and regulatory filing or engagements. These services include the audits of the financial statements of the Fund, issuance of consents, income tax provision procedures and assistance with review of documents filed with the SEC.
These fees relate to assurance and related services by PwC that are reasonably related to the performance of the audit of the Fund’s financial statements and are not reported under “Audit Fees” above.
These fees relate to professional services rendered by PwC for tax compliance, tax advice and tax planning. The tax services provided by PwC related to the preparation of the Fund’s federal and state income tax returns, excise tax calculations and returns, a review of the Fund’s calculations of capital gain and income distributions, and additional tax research for compliance purposes.
These fees relate to products and services provided by PwC other than those reported above under “Audit Fees,” “Audit-Related Fees,” and “Tax Fees” above.
There were no amounts that were approved by the Audit Committee pursuant to the de minimus exception (Rule 2-01(c)(7) of Regulation S-X) for the fiscal years ended December 31, 2007 and 2006.
Non-Audit Services to the Fund’s Service Affiliates that were Pre-Approved by the Fund’s Audit Committee
The Fund’s Audit Committee is required to pre-approve non-audit services which meet both the following criteria:
| i) | Directly relate to the Fund’s operations and financial reporting; and |
| ii) | Rendered by PwC to the Fund’s advisor, Manning & Napier Advisors, Inc., and entities in a control relationship with the advisor (“service affiliate”) that provide ongoing services to the Fund. For purposes of disclosure, Manning & Napier Investor Services, Inc. is considered to be a service affiliate. |
| | | | | | |
| | | 2007 | | 2006 |
Audit Related Fees | | $ | 9,092 | | $ | 8,792 |
Tax Fees | | | — | | | — |
| | | | | | |
| | $ | 9,092 | | $ | 8,792 |
| | | | | | |
The Audit Related fees for the years ended December 31, 2007 and 2006 were for 17Ad-13 internal control examinations, a license for proprietary automated financial statement disclosure software and a license for proprietary authoritative financial reporting and assurance literature library software.
There were no amounts that were approved by the Audit Committee pursuant to the de minimus exception (Rule 2-01(c)(7) of Regulation S-X) for the fiscal years ended December 31, 2007 and 2006.
Aggregate Fees
Aggregate fees billed to the Fund for non-audit services for 2007 and 2006 were $68,400 and $65,120, respectively. Aggregate fees billed to the Fund’s advisor and service affiliates for non-audit services were $9,092 and $8,792, respectively. These amounts include fees for non-audit services required to be pre-approved and fees for non-audit services that did not require pre-approval since they did not relate to the Fund’s operations and financial reporting.
The Fund’s Audit Committee has considered whether the provisions for non-audit services to the Fund’s advisor and service affiliates, that did not require pre-approval, is compatible with maintaining PwC’s independence.
| ITEM 5: | AUDIT COMMITTEE OF LISTED REGISTRANTS |
Not Applicable.
| ITEM 6: | SCHEDULE OF INVESTMENTS |
See Investment Portfolios under Item 1 on this Form N-CSR.
| ITEM 7: | DISCLOSURE OF PROXY VOTING POLICIES AND PROCEDURES FOR CLOSED-END MANAGEMENT INVESTMENT COMPANIES |
Not applicable.
| ITEM 8: | PORTFOLIO MANAGERS OF CLOSED-END MANAGEMENT INVESTMENT COMPANIES |
Not applicable.
| ITEM 9: | PURCHASES OF EQUITY SECURITIES BY CLOSED-END MANAGEMENT INVESTMENT COMPANY AND AFFILIATED PURCHASERS |
Not applicable.
| ITEM 10: | SUBMISSION OF MATTERS TO A VOTE OF SECURITY HOLDERS |
There have been no material changes to the procedure by which shareholders may recommend nominees to the registrant’s board of directors.
| ITEM 11: | CONTROLS AND PROCEDURES |
(a) Based on their evaluation of the Funds’ disclosure controls and procedures, as of a date within 90 days of the filing date, the Funds’ Principal Executive Officer and Principal Financial Officer have concluded that the Funds’ disclosure controls and procedures are: (i) reasonably designed to ensure that information required to be disclosed in this report is appropriately communicated to the Funds’ officers to allow timely decisions regarding disclosures required in this report; (ii) reasonably designed to ensure that information required to be disclosed in this report is recorded, processed, summarized and reported in a timely manner; and (iii) are effective in achieving the goals described in (i) and (ii) above.
(b) During the second fiscal quarter of the period covered by this report, there have been no changes in the Funds’ internal control over financial reporting that the above officers believe to have materially affected, or to be reasonably likely to materially affect, the Funds’ internal control over financial reporting.
(a)(1) Code of ethics that is subject to the disclosure of Item 2 above.
(a)(2) Separate certifications for the Registrant’s principal executive officer and principal financial officer, as required by Section 302 of the Sarbanes-Oxley Act of 2002 and Rule 30a-2(a) under the Investment Company Act of 1940, are attached as EX-99.CERT.
(a)(3) Not applicable.
(b) A certification of the Registrant’s principal executive officer and principal financial officer, as required by 18 U.S.C Section 1350, as adopted pursuant to Section 906 of the Sarbanes-Oxley Act of 2002, and Rule 30a-2(b) under the Investment Company Act of 1940, is attached as EX-99.906CERT. The certification furnished pursuant to this paragraph is not deemed to be “filed” for purposes of Section 18 of the Securities Exchange Act of 1934, or otherwise subject to the liability of that section. Such certification is not deemed to be incorporated by reference into any filing under the Securities Act of 1933 or the Securities Exchange Act of 1934, except to the extent that the Registrant specifically incorporates them by reference.
SIGNATURES
Pursuant to the requirements of the Securities Exchange Act of 1934 and the Investment Company Act of 1940, the registrant has duly caused this report to be signed on its behalf by the undersigned, thereunto duly authorized.
|
Manning & Napier Fund, Inc. |
|
/s/ B. Reuben Auspitz |
B. Reuben Auspitz President & Principal Executive Officer of Manning & Napier Fund, Inc. |
February 29, 2008
Pursuant to the requirements of the Securities Exchange Act of 1934 and the Investment Company Act of 1940, this report has been signed below by the following persons on behalf of the registrant and in the capacities and on the dates indicated.
|
|
/s/ B. Reuben Auspitz |
B. Reuben Auspitz President & Principal Executive Officer of Manning & Napier Fund, Inc. |
February 29, 2008
|
|
/s/ Christine Glavin |
Christine Glavin Chief Financial Officer & Principal Financial Officer of Manning & Napier Fund, Inc. |
February 29, 2008