UNITED STATES
SECURITIES AND EXCHANGE COMMISSION
Washington, D.C. 20549
FORM N-CSR
CERTIFIED SHAREHOLDER REPORT OF REGISTERED
MANAGEMENT INVESTMENT COMPANIES
| | |
Investment Company Act file number | | 811-04087 |
Manning & Napier Fund, Inc.
|
| (Exact name of registrant as specified in charter) |
| | |
| 290 Woodcliff Drive, Fairport, NY | | 14450 |
| (Address of principal executive offices) | | (Zip Code) |
B. Reuben Auspitz 290 Woodcliff Drive, Fairport, NY 14450
|
| (Name and address of agent for service) |
Registrant’s telephone number, including area code: 585-325-6880
Date of fiscal year end: December 31, 2008
Date of reporting period: January 1, 2008 through December 31, 2008
Form N-CSR is to be used by management investment companies to file reports with the Commission not later than 10 days after the transmission to stockholders of any report that is required to be transmitted to stockholders under Rule 30e-1 under the Investment Company Act of 1940 (17 CFR 270.30e-1). The Commission may use the information provided on Form N-CSR in its regulatory, disclosure review, inspection, and policymaking roles.
A registrant is required to disclose the information specified by Form N-CSR, and the Commission will make this information public. A registrant is not required to respond to the collection of information contained in Form N-CSR unless the Form displays a currently valid Office of Management and Budget (“OMB”) control number. Please direct comments concerning the accuracy of the information collection burden estimate and any suggestions for reducing the burden to Secretary, Securities and Exchange Commission, 450 Fifth Street, NW, Washington, DC 20549-0609. The OMB has reviewed this collection of information under the clearance requirements of 44 U.S.C. Section 3507.
| ITEM 1: | REPORTS TO STOCKHOLDERS |
Manning & Napier Fund, Inc.
| | | | |
| SMALL CAP SERIES | | | | | Annual Report - December 31, 2008 |

Management Discussion and Analysis (unaudited)
Dear Shareholders:
2008 was the worst year for small company stocks since 1973 and a difficult year for the Small Cap Series, as well. The Series finished the year down 50.68%, underperforming the Standard & Poor’s (S&P) 500 Total Return Index (down 36.99%) as well as the Russell 2000® Index (down 33.79%), which is the key benchmark measuring the performance of small company stocks. The Small Cap Series continues to post a positive annualized return of 0.91% over the current market cycle (since October 1, 1002), but trails the Russell 2000® Index, which has posted a 6.61% annualized return over the market cycle.
While most of the absolute losses occurred during the final quarter of the year, the majority of the Series’ underperformance relative to the Russell 2000® Index occurred during the first three quarters of the year. Apart from overall market weakness, the Series’ performance was hurt by a sizeable position in Energy companies, which was the worst performing sector within the Russell 2000® Index, as well as weak performance from select investments in the Health Care and Information Technology sectors.
We believe the credit crisis and the manner in which it affected some of our holdings was likely the most significant factor driving our underperformance in 2008. We maintained an underweight position in financial services companies, especially banks and insurance companies, due to the growing impact of the credit crisis on banks, insurance companies and other financial services firms. We would have expected this approach to have generally served us well in this time of financial crisis. Surprisingly, this was not the case. Despite the high profile problems at large financial services companies like Bear Stearns and Lehman Brothers, smaller financial institutions did not have as much exposure to troubled assets, tended to stick to traditional lending activities and actually performed relatively well in 2008. As a result, the financial services component of the Russell 2000® Index actually outperformed the rest of the Index by over 10%, and the Series’ underweight position in financial services companies was a drag on relative performance.
Making matters worse, the problems at large financial companies resulted in a significant curtailment of liquidity and capital availability which is often critical to the operations of smaller companies. The Small Cap Series held positions in a number of companies across a variety of industries that depended on access to capital and liquidity for ongoing financing of business activities. As the credit crisis gained momentum, many of these holdings experienced more severe stock price declines than we expected.
In response to market conditions, we made a number of portfolio adjustments, particularly in the second half of the year. Specifically, we have reduced the number of positions we hold and focused on larger, more financially stable companies that attempt to leverage key investment themes such as health care information technology, enterprise IT resource optimization and security, beneficiaries of environmental regulations, and cable. We are also focusing on several industries experiencing weak demand and low returns; these conditions often lead to supply curtailments which serve to tighten capacity and lead to improved returns when demand recovers. In the current environment, we are finding many industries that fit this strategy, including trucking, airlines, energy and retail.
While 2008 was a difficult year for investors, we recognize that our job is to remain focused on company-specific fundamentals. In a year where emotion - a crisis of confidence - was a strong driver of returns no matter the market, we are not surprised that our fundamentals-based approach produced disappointing returns. However, looking back over our 38-year history, this approach has served our clients well over the long-term.
As always, we appreciate your business.
Sincerely,
Manning & Napier Advisors, Inc.
Performance Update as of December 31, 2008 (unaudited)
| | | | | | | | | | |
| | | Average Annual Total Returns
As of December 31, 2008 | | |
| | | One
Year | | Five
Year | | Ten
Year | | Since
Inception1 | | |
Manning & Napier Fund, Inc. - Small Cap Series2 | | -50.68% | | -6.31% | | 1.92% | | 4.64% | | |
Standard & Poor’s (S&P) 500 Total Return Index3 | | -36.99% | | -2.18% | | -1.38% | | 6.85% | | |
Russell 2000® Index3 | | -33.79% | | -0.93% | | 3.02% | | 7.23% | | |
The following graph compares the value of a $10,000 investment in the Manning & Napier Fund, Inc. - Small Cap Series for the ten years ended December 31, 2008 to the S&P 500 Total Return Index and the Russell 2000® Index.
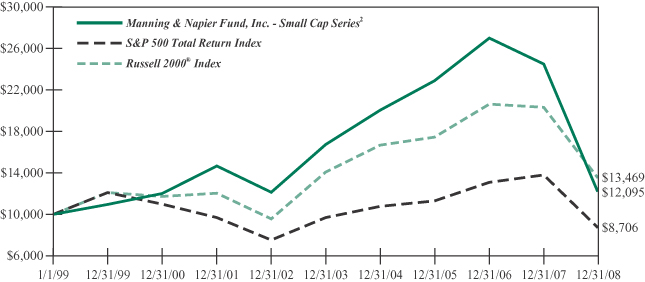
1Performance numbers for the Series and Indices are calculated from April 30, 1992, the Series’ current activation date.
2The Series’ performance does not reflect the deduction of taxes that a shareholder would pay on fund distributions or the redemption of shares. The Series’ performance is historical and may not be indicative of future results. The performance returns shown are inclusive of the net expense ratio of the Series. For the year ended December 31, 2008, this net expense ratio was 1.15%. The gross expense ratio, which does not account for any voluntary or contractual waivers currently in effect, was 1.15% for the year ended December 31, 2008.
3The S&P 500 Total Return Index is an unmanaged capitalization-weighted measure of 500 widely held common stocks listed on the New York Stock Exchange, American Stock Exchange and the Over-the-Counter market. The Index returns assume daily reinvestment of dividends. The Russell 2000® Index is an unmanaged index that consists of 2,000 U.S. small-capitalization stocks. The Index returns are based on a market capitalization-weighted average of relative price changes of the component stocks plus dividends whose reinvestments are compounded daily. Both Indices’ returns, unlike Series returns, do not reflect any fees or expenses.
Shareholder Expense Example (unaudited)
As a shareholder of the Series, you may incur two types of costs: (1) transaction costs, including potential wire charges on redemptions and (2) ongoing costs, including management fees and other Series expenses. This example is intended to help you understand your ongoing costs (in dollars) of investing in the Series and to compare these costs with the ongoing costs of investing in other mutual funds.
The example is based on an investment of $1,000 invested at the beginning of the period and held for the entire period (July 1, 2008 to December 31, 2008).
Actual Expenses
The first line of the table below provides information about actual account values and actual expenses. You may use the information in this line, together with the amount you invested, to estimate the expenses that you paid over the period. Simply divide your account value by $1,000 (for example, an $8,600 account value divided by $1,000 = 8.6), then multiply the result by the number in the first line under the heading entitled “Expenses Paid During Period” to estimate the expenses you paid on your account during this period.
Hypothetical Example for Comparison Purposes
The second line of the table below provides information about hypothetical account values and hypothetical expenses based on the Series’ actual expense ratio and an assumed rate of return of 5% per year before expenses, which is not the Series’ actual return. The hypothetical account values and expenses may not be used to estimate the actual ending account balance or expenses you paid during the period. You may use this information to compare the ongoing costs of investing in the Series and other funds. To do so, compare this 5% hypothetical example with the 5% hypothetical examples that appear in the shareholder reports of the other funds.
Please note that the expenses shown in the table are meant to highlight your ongoing costs only and do not reflect any transaction costs, such as potential wire charges on redemptions. Therefore, the second line of the table is useful in comparing ongoing costs only, and will not help you determine the relative total costs of owning different funds. In addition, if these transaction costs were included, your costs would have been higher.
| | | | | | | | | |
| | | Beginning
Account Value
7/1/08 | | Ending
Account Value
12/31/08 | | Expenses Paid
During Period*
7/1/08-12/31/08 |
Actual | | $ | 1,000.00 | | $ | 624.80 | | $ | 4.74 |
Hypothetical
(5% return before expenses) | | $ | 1,000.00 | | $ | 1,019.30 | | $ | 5.89 |
*Expenses are equal to the Series’ annualized expense ratio (for the six-month period) of 1.16%, multiplied by the average account value over the period, multiplied by 184/366 (to reflect the one-half year period). Expenses are based on the most recent fiscal half year; therefore, the expense ratio stated above may differ from the expense ratio stated in the financial highlights, which is based on one-year data.
Portfolio Composition as of December 31, 2008 (unaudited)
Sector Allocation1
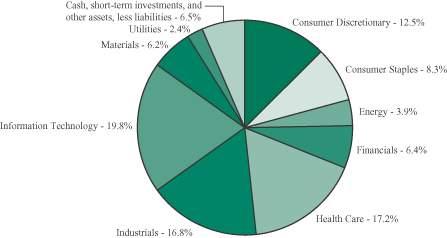
1As a percentage of net assets.
Market Capitalization
| | |
Average | | $1,136 Million |
Median | | 873 Million |
Weighted Average | | 1,170 Million |
Top Ten Stock Holdings2
| | |
Netlogic Microsystems, Inc. | | 3.5% |
Mediacom Communications Corp. - Class A | | 3.3% |
Riverbed Technology, Inc. | | 3.2% |
Owens Corning, Inc. | | 3.1% |
Eclipsys Corp. | | 2.7% |
Calgon Carbon Corp. | | 2.6% |
Rodobens Negocios Imobiliarios S.A. (Brazil) | | 2.5% |
Mirant Corp. | | 2.4% |
Dean Foods Co. | | 2.4% |
Cerner Corp. | | 2.3% |
2As a percentage of total investments.
Investment Portfolio - December 31, 2008
| | | | | |
| | | Shares | | Value
(Note 2) |
| | | | | |
| | |
COMMON STOCKS - 93.5% | | | | | |
| | |
Consumer Discretionary - 12.5% | | | | | |
Auto Components - 1.4% | | | | | |
Hankook Tire Co. Ltd. (South Korea) (Note 7) | | 140,910 | | $ | 1,711,865 |
| | | | | |
Diversified Consumer Services - 1.3% | | | | | |
Jackson Hewitt Tax Service, Inc. | | 98,270 | | | 1,541,856 |
| | | | | |
Household Durables - 2.5% | | | | | |
Rodobens Negocios Imobiliarios S.A. (Brazil) (Note 7) | | 885,350 | | | 2,981,552 |
| | | | | |
Media - 3.5% | | | | | |
Charter Communications, Inc. - Class A* | | 4,523,830 | | | 370,049 |
Mediacom Communications Corp. - Class A* | | 907,190 | | | 3,900,917 |
| | | | | |
| | | | | 4,270,966 |
| | | | | |
Specialty Retail - 3.8% | | | | | |
Dick’s Sporting Goods, Inc.* | | 156,100 | | | 2,202,571 |
Tractor Supply Co.* | | 64,630 | | | 2,335,728 |
| | | | | |
| | | | | 4,538,299 |
| | | | | |
Total Consumer Discretionary | | | | | 15,044,538 |
| | | | | |
Consumer Staples - 8.3% | | | | | |
Beverages - 0.5% | | | | | |
National Beverage Corp.* | | 74,400 | | | 669,600 |
| | | | | |
Food & Staples Retailing - 2.2% | | | | | |
BJ’s Wholesale Club, Inc.* | | 76,310 | | | 2,614,381 |
| | | | | |
Food Products - 4.5% | | | | | |
Dean Foods Co.* | | 159,930 | | | 2,873,942 |
Sanderson Farms, Inc. | | 43,020 | | | 1,486,771 |
Tootsie Roll Industries, Inc. | | 40,500 | | | 1,037,205 |
| | | | | |
| | | | | 5,397,918 |
| | | | | |
Personal Products - 1.1% | | | | | |
Alberto-Culver Co. | | 53,000 | | | 1,299,030 |
| | | | | |
Total Consumer Staples | | | | | 9,980,929 |
| | | | | |
Energy - 3.9% | | | | | |
Energy Equipment & Services - 2.5% | | | | | |
Calfrac Well Services Ltd. (Canada) (Note 7) | | 132,210 | | | 931,961 |
Dril-Quip, Inc.* | | 54,370 | | | 1,115,129 |
Trican Well Service Ltd. (Canada) (Note 7) | | 144,080 | | | 929,247 |
| | | | | |
| | | | | 2,976,337 |
| | | | | |
Oil, Gas & Consumable Fuels - 1.4% | | | | | |
Edge Petroleum Corp.* | | 1,138,140 | | | 180,964 |
| | |
| The accompanying notes are an integral part of the financial statements. | | 5 |
Investment Portfolio - December 31, 2008
| | | | | |
| | | Shares | | Value
(Note 2) |
| | | | | |
| | |
COMMON STOCKS (continued) | | | | | |
| | |
Energy (continued) | | | | | |
Oil, Gas & Consumable Fuels (continued) | | | | | |
Forest Oil Corp.* | | 45,980 | | $ | 758,210 |
Mariner Energy, Inc.* | | 70,511 | | | 719,212 |
| | | | | |
| | | | | 1,658,386 |
| | | | | |
Total Energy | | | | | 4,634,723 |
| | | | | |
Financials - 6.4% | | | | | |
Capital Markets - 2.1% | | | | | |
Federated Investors, Inc. | | 73,000 | | | 1,238,080 |
Janus Capital Group, Inc. | | 157,860 | | | 1,267,616 |
| | | | | |
| | | | | 2,505,696 |
| | | | | |
Commercial Banks - 2.5% | | | | | |
Potomac Bancshares, Inc. | | 13,208 | | | 125,476 |
TCF Financial Corp. | | 132,480 | | | 1,809,677 |
Wilmington Trust Corp. | | 46,940 | | | 1,043,946 |
| | | | | |
| | | | | 2,979,099 |
| | | | | |
Insurance - 0.7% | | | | | |
First American Corp. | | 30,720 | | | 887,501 |
| | | | | |
Thrifts & Mortgage Finance - 1.1% | | | | | |
First Niagara Financial Group, Inc. | | 85,160 | | | 1,377,037 |
| | | | | |
Total Financials | | | | | 7,749,333 |
| | | | | |
Health Care - 17.2% | | | | | |
Biotechnology - 1.1% | | | | | |
Medarex, Inc.* | | 95,520 | | | 533,002 |
Senomyx, Inc.* | | 268,405 | | | 748,850 |
| | | | | |
| | | | | 1,281,852 |
| | | | | |
Health Care Equipment & Supplies - 6.9% | | | | | |
Abaxis, Inc.* | | 87,380 | | | 1,400,701 |
The Cooper Companies, Inc. | | 161,460 | | | 2,647,944 |
Inverness Medical Innovations, Inc.* | | 140,260 | | | 2,652,317 |
OraSure Technologies, Inc.* | | 436,500 | | | 1,606,320 |
| | | | | |
| | | | | 8,307,282 |
| | | | | |
Health Care Providers & Services - 1.8% | | | | | |
Diagnosticos da America S.A. (Brazil) (Note 7) | | 230,120 | | | 2,219,261 |
| | | | | |
Health Care Technology - 5.0% | | | | | |
Cerner Corp.* | | 72,150 | | | 2,774,167 |
Eclipsys Corp.* | | 226,090 | | | 3,208,217 |
| | | | | |
| | | | | 5,982,384 |
| | | | | |
| | |
| 6 | | The accompanying notes are an integral part of the financial statements. |
Investment Portfolio - December 31, 2008
| | | | | |
| | | Shares | | Value
(Note 2) |
| | | | | |
| | |
COMMON STOCKS (continued) | | | | | |
| | |
Health Care (continued) | | | | | |
Life Sciences Tools & Services - 2.4% | | | | | |
Exelixis, Inc.* | | 114,340 | | $ | 573,987 |
PerkinElmer, Inc. | | 168,150 | | | 2,338,966 |
| | | | | |
| | | | | 2,912,953 |
| | | | | |
Total Health Care | | | | | 20,703,732 |
| | | | | |
Industrials - 16.8% | | | | | |
Airlines - 4.0% | | | | | |
Continental Airlines, Inc. - Class B* | | 70,960 | | | 1,281,538 |
Delta Air Lines, Inc.* | | 122,070 | | | 1,398,922 |
JetBlue Airways Corp.* | | 302,490 | | | 2,147,679 |
| | | | | |
| | | | | 4,828,139 |
| | | | | |
Building Products - 3.1% | | | | | |
Owens Corning, Inc.* | | 213,450 | | | 3,692,685 |
| | | | | |
Commercial Services & Supplies - 1.2% | | | | | |
Tomra Systems ASA (Norway) (Note 7) | | 434,340 | | | 1,464,828 |
| | | | | |
Electrical Equipment - 1.2% | | | | | |
General Cable Corp.* | | 78,630 | | | 1,390,965 |
| | | | | |
Machinery - 1.9% | | | | | |
FreightCar America, Inc. | | 128,590 | | | 2,349,339 |
| | | | | |
Road & Rail - 4.4% | | | | | |
Heartland Express, Inc. | | 134,640 | | | 2,121,926 |
Knight Transportation, Inc. | | 137,200 | | | 2,211,664 |
Old Dominion Freight Line, Inc.* | | 32,190 | | | 916,127 |
| | | | | |
| | | | | 5,249,717 |
| | | | | |
Trading Companies & Distributors - 1.0% | | | | | |
Rush Enterprises, Inc. - Class A* | | 143,130 | | | 1,226,624 |
| | | | | |
Total Industrials | | | | | 20,202,297 |
| | | | | |
Information Technology - 19.8% | | | | | |
Communications Equipment - 7.9% | | | | | |
BigBand Networks, Inc.* | | 228,580 | | | 1,261,762 |
Blue Coat Systems, Inc.* | | 248,700 | | | 2,089,080 |
Infinera Corp.* | | 258,930 | | | 2,320,013 |
Riverbed Technology, Inc.* | | 333,100 | | | 3,794,009 |
| | | | | |
| | | | | 9,464,864 |
| | | | | |
Electronic Equipment, Instruments & Components - 1.0% | | | |
LoJack Corp.* | | 307,110 | | | 1,265,293 |
| | | | | |
IT Services - 2.3% | | | | | |
Online Resources Corp.* | | 575,570 | | | 2,728,202 |
| | | | | |
| | |
| The accompanying notes are an integral part of the financial statements. | | 7 |
Investment Portfolio - December 31, 2008
| | | | | | |
| | | Shares/ Principal Amount | | Value
(Note 2) |
| | | | | | |
| | |
COMMON STOCKS (continued) | | | | | | |
| | |
Information Technology (continued) | | | | | | |
Semiconductors & Semiconductor Equipment - 3.5% | | | |
Netlogic Microsystems, Inc.* | | | 190,770 | | $ | 4,198,848 |
| | | | | | |
Software - 5.1% | | | | | | |
THQ, Inc.* | | | 270,400 | | | 1,132,976 |
TIBCO Software, Inc.* | | | 478,190 | | | 2,481,806 |
UbiSoft Entertainment S.A.* (France) (Note 7) | | | 128,160 | | | 2,484,895 |
| | | | | | |
| | | | | | 6,099,677 |
| | | | | | |
Total Information Technology | | | | | | 23,756,884 |
| | | | | | |
Materials - 6.2% | | | | | | |
Chemicals - 4.6% | | | | | | |
Calgon Carbon Corp.* | | | 201,650 | | | 3,097,344 |
The Scotts Miracle-Gro Co. - Class A | | | 80,530 | | | 2,393,352 |
| | | | | | |
| | | | | | 5,490,696 |
| | | | | | |
Containers & Packaging - 1.6% | | | | | | |
Bemis Co., Inc. | | | 81,100 | | | 1,920,448 |
| | | | | | |
Total Materials | | | | | | 7,411,144 |
| | | | | | |
Utilities - 2.4% | | | | | | |
Independent Power Producers & Energy Traders - 2.4% | | | |
Mirant Corp.* | | | 153,310 | | | 2,892,960 |
| | | | | | |
TOTAL COMMON STOCKS
(Identified Cost $163,142,134) | | | | | | 112,376,540 |
| | | | | | |
| | |
SHORT-TERM INVESTMENTS - 5.0% | | | | | | |
Dreyfus Cash Management, Inc. - Institutional Shares | | | 4,021,689 | | | 4,021,689 |
Fannie Mae Discount Note, 3/3/2009 | | $ | 2,000,000 | | | 1,999,766 |
| | | | | | |
TOTAL SHORT-TERM INVESTMENTS
(Identified Cost $6,021,351) | | | | | | 6,021,455 |
| | | | | | |
TOTAL INVESTMENTS - 98.5%
(Identified Cost $169,163,485) | | | | | | 118,397,995 |
| | |
OTHER ASSETS, LESS LIABILITIES - 1.5% | | | | | | 1,764,298 |
| | | | | | |
NET ASSETS - 100% | | | | | $ | 120,162,293 |
| | | | | | |
*Non-income producing security
| | |
| 8 | | The accompanying notes are an integral part of the financial statements. |
Statement of Assets and Liabilities
December 31, 2008
| | | | |
ASSETS: | | | | |
| | | | |
| |
Investments, at value (identified cost $169,163,485) (Note 2) | | $ | 118,397,995 | |
Receivable for securities sold | | | 2,263,242 | |
Receivable for fund shares sold | | | 40,827 | |
Dividends receivable | | | 35,091 | |
Foreign tax reclaims receivable | | | 6,466 | |
| | | | |
TOTAL ASSETS | | | 120,743,621 | |
| | | | |
| LIABILITIES: | | | | |
| |
Accrued management fees (Note 3) | | | 97,060 | |
Accrued fund accounting and transfer agent fees (Note 3) | | | 8,085 | |
Accrued Chief Compliance Officer service fees (Note 3) | | | 477 | |
Payable for fund shares repurchased | | | 432,348 | |
Audit fees payable | | | 31,130 | |
Other payables and accrued expenses | | | 12,228 | |
| | | | |
TOTAL LIABILITIES | | | 581,328 | |
| | | | |
TOTAL NET ASSETS | | $ | 120,162,293 | |
| | | | |
NET ASSETS CONSIST OF: | | | | |
| |
Capital stock | | $ | 241,073 | |
Additional paid-in-capital | | | 242,032,911 | |
Accumulated net investment loss | | | (92,455 | ) |
Accumulated net realized loss on investments, foreign currency and other assets and liabilities | | | (71,253,037 | ) |
Net unrealized depreciation on investments and other assets and liabilities | | | (50,766,199 | ) |
| | | | |
TOTAL NET ASSETS | | $ | 120,162,293 | |
| | | | |
NET ASSET VALUE, OFFERING PRICE AND REDEMPTION PRICE PER SHARE - CLASS A ($120,162,293/24,107,295 shares) | | $ | 4.98 | |
| | | | |
| | |
| The accompanying notes are an integral part of the financial statements. | | 9 |
Statement of Operations
For the Year Ended December 31, 2008
| | | | |
INVESTMENT INCOME: | | | | |
| | | | |
| |
Dividends (net of foreign tax withheld, $34,908) | | $ | 1,054,673 | |
Interest | | | 103,403 | |
| | | | |
Total Investment Income | | | 1,158,076 | |
| | | | |
| EXPENSES: | | | | |
| |
Management fees (Note 3) | | | 1,526,890 | |
Fund accounting and transfer agent fees (Note 3) | | | 106,546 | |
Directors’ fees (Note 3) | | | 12,599 | |
Chief Compliance Officer service fees (Note 3) | | | 4,301 | |
Custodian fees | | | 19,700 | |
Miscellaneous | | | 78,591 | |
| | | | |
Total Expenses | | | 1,748,627 | |
| | | | |
NET INVESTMENT LOSS | | | (590,551 | ) |
| | | | |
| REALIZED AND UNREALIZED LOSS ON INVESTMENTS: | | | | |
| |
Net realized loss on - | | | | |
Investments | | | (71,253,037 | ) |
Foreign currency and other assets and liabilities | | | (93,206 | ) |
| | | | |
| | | (71,346,243 | ) |
| | | | |
| |
Net change in unrealized depreciation on - | | | | |
Investments | | | (26,248,498 | ) |
Foreign currency and other assets and liabilities | | | (1,137 | ) |
| | | | |
| | | (26,249,635 | ) |
| | | | |
| |
NET REALIZED AND UNREALIZED LOSS ON INVESTMENTS | | | (97,595,878 | ) |
| | | | |
NET DECREASE IN NET ASSETS RESULTING FROM OPERATIONS | | $ | (98,186,429 | ) |
| | | | |
| | |
| 10 | | The accompanying notes are an integral part of the financial statements. |
Statements of Changes in Net Assets
| | | | | | | | |
| | | For the
Year Ended
12/31/08 | | | For the
Year Ended
12/31/07 | |
| | | | | | | | |
| INCREASE (DECREASE) IN NET ASSETS: | | | | | | | | |
| | |
| OPERATIONS: | | | | | | | | |
| | |
Net investment loss | | $ | (590,551 | ) | | $ | (153,161 | ) |
Net realized gain (loss) on investments and foreign currency | | | (71,346,243 | ) | | | 25,830,490 | |
Net change in unrealized depreciation on investments and foreign currency | | | (26,249,635 | ) | | | (45,239,311 | ) |
| | | | | | | | |
Net decrease from operations | | | (98,186,429 | ) | | | (19,561,982 | ) |
| | | | | | | | |
| DISTRIBUTIONS TO SHAREHOLDERS (Note 8): | | | | | | | | |
| | |
From net realized gain on investments | | | (1,696,201 | ) | | | (24,981,501 | ) |
| | | | | | | | |
| CAPITAL STOCK ISSUED AND REPURCHASED: | | | | | | | | |
| | |
Net increase from capital share transactions (Note 5) | | | 35,046,424 | | | | 54,050,690 | |
| | | | | | | | |
Net increase (decrease) in net assets | | | (64,836,206 | ) | | | 9,507,207 | |
| | |
| NET ASSETS: | | | | | | | | |
| | |
Beginning of year | | | 184,998,499 | | | | 175,491,292 | |
| | | | | | | | |
End of year (including accumulated net investment loss of $92,455 and $499, respectively) | | $ | 120,162,293 | | | $ | 184,998,499 | |
| | | | | | | | |
| | |
| The accompanying notes are an integral part of the financial statements. | | 11 |
Financial Highlights
| | | | | | | | | | |
| | | For the Years Ended |
| | | 12/31/08 | | 12/31/07 | | 12/31/06 | | 12/31/05 | | 12/31/04 |
| | | | | | | | | | |
| Per share data (for a share outstanding throughout each year): | | | | | | | | | | |
Net asset value - Beginning of year | | $10.21 | | $13.08 | | $13.66 | | $15.01 | | $13.12 |
| | | | | | | | | | |
Income (loss) from investment operations: | | | | | | | | | | |
Net investment loss | | (0.02) | | (0.01) | | (0.05) | | (0.07) | | (0.07) |
Net realized and unrealized gain (loss) on investments | | (5.12) | | (1.25) | | 2.55 | | 2.20 | | 2.66 |
| | | | | | | | | | |
Total from investment operations | | (5.14) | | (1.26) | | 2.50 | | 2.13 | | 2.59 |
| | | | | | | | | | |
| | | | | |
Less distributions to shareholders: | | | | | | | | | | |
From net realized gain on investments | | (0.09) | | (1.61) | | (3.08) | | (3.48) | | (0.70) |
| | | | | | | | | | |
Net asset value - End of year | | $4.98 | | $10.21 | | $13.08 | | $13.66 | | $15.01 |
| | | | | | | | | | |
Net assets - End of year (000’s omitted) | | $120,162 | | $184,998 | | $175,491 | | $154,416 | | $169,438 |
| | | | | | | | | | |
Total return1 | | (50.68%) | | (9.32%) | | 18.06% | | 14.11% | | 19.81% |
| Ratios (to average net assets)/Supplemental Data: | | | | | | | | | | |
Expenses | | 1.15% | | 1.14% | | 1.16% | | 1.19% | | 1.22%* |
Net investment loss | | (0.39%) | | (0.08%) | | (0.40%) | | (0.51%) | | (0.54%) |
Portfolio turnover | | 68% | | 64% | | 85% | | 55% | | 61% |
| | | | | | | | | | |
|
*The investment advisor did not impose all of its management fee and is not eligible to recoup any expenses that have been waived or reimbursed in prior years. If these expenses had been incurred by the Series, the expense ratio (to average net assets) for the year ended 12/31/04 would have been increased by 0.01%. |
1Represents aggregate total return for the year indicated, and assumes reinvestment of all distributions. Total return would have been lower had certain expenses not been waived during the year ended 12/31/04.
| | |
| 12 | | The accompanying notes are an integral part of the financial statements. |
Notes to Financial Statements
Small Cap Series (the “Series”) is a no-load diversified series of Manning & Napier Fund, Inc. (the “Fund”). The Fund is organized in Maryland and is registered under the Investment Company Act of 1940, as amended, as an open-end management investment company.
The Series’ investment objective is to provide long-term growth by investing principally in the common stocks of companies with small market capitalizations.
The Series is authorized to issue five classes of shares (Class A, B, D, E and Z). Currently, only Class A shares have been issued. Each class of shares is substantially the same, except that class-specific distribution and shareholder servicing expenses are borne by the specific class of shares to which they relate.
The Fund’s Advisor is Manning & Napier Advisors, Inc. (the “Advisor”). Shares of the Series are offered to investors, clients and employees of the Advisor and its affiliates. The total authorized capital stock of the Fund consists of 5.0 billion shares of common stock each having a par value of $0.01. As of December 31, 2008, 4.5 billion shares have been designated in total among 28 series, of which 87.5 million have been designated as Small Cap Series Class A common stock.
| 2. | SIGNIFICANT ACCOUNTING POLICIES |
Security Valuation
Portfolio securities, including domestic equities, foreign equities, exchange-traded funds and options, listed on an exchange other than the NASDAQ National Market System are valued at the latest quoted sales price of the exchange on which the security is primarily traded. Securities not traded on valuation date or securities not listed on an exchange are valued at the latest quoted bid price provided by the Fund’s pricing service. Securities listed on the NASDAQ National Market System are valued in accordance with the NASDAQ Official Closing Price.
Securities for which representative valuations or prices are not available from the Fund’s pricing service may be valued at fair value. Due to the inherent uncertainty of valuations of such securities, the fair value may differ significantly from the values that would have been used had a ready market for such securities existed. If trading or events occurring after the close of the principal market in which securities are traded are expected to materially affect the value of those securities, then they may be valued at their fair value, taking this trading or these events into account. Fair value is determined in good faith by the Advisor under procedures approved by and under the general supervision and responsibility of the Fund’s Board of Directors (the “Board”).
Short-term investments that mature in sixty days or less are valued at amortized cost, which approximates market value. Investments in open-end investment companies are valued at their net asset value per share on valuation date, with the exception of exchange-traded funds, which are valued at the closing price on the exchange.
In September 2006, FASB Statement of Financial Accounting Standards No. 157, Fair Value Measurements (“FAS 157”) was issued, effective for fiscal years beginning after November 15, 2007. This standard clarifies the definition of fair value for financial reporting, establishes a framework for measuring fair value and requires additional disclosures about the use of fair
Notes to Financial Statements
| 2. | SIGNIFICANT ACCOUNTING POLICIES (continued) |
Security Valuation (continued)
value measurements. FAS 157 became effective for the Series as of January 1, 2008, the beginning of its current fiscal year. The three levels of the fair value hierarchy under FAS 157 are described below:
Level 1 - quoted prices in active markets for identical securities
Level 2 - other significant observable inputs (including quoted prices for similar securities, interest rates, prepayment speeds, credit risk, etc.)
Level 3 - significant unobservable inputs (including the Series’ own assumptions in determining the fair value of investments.)
The inputs or methodology used for valuing securities are not necessarily an indication of the risk associated with investing in those securities. The following is a summary of the inputs used to value the Series’ assets as of December 31, 2008:
| | | | | | |
Valuation Inputs | | Investments In
Securities | | Other Financial
Instruments* |
| | | | | | |
Level 1 - Quoted Prices | | $ | 116,398,229 | | $ | — |
Level 2 - Other Significant Observable Inputs | | | 1,999,766 | | | — |
Level 3 - Significant Unobservable Inputs | | | — | | | — |
| | | | | | |
Total | | $ | 118,397,995 | | $ | — |
| | | | | | |
*Other financial instruments are derivative instruments not reflected in the Investment Portfolio, such as futures, forwards and swap contracts, which are valued at the unrealized appreciation/depreciation on the instrument. As of December 31, 2008, the Series did not hold any derivative instruments.
There were no Level 3 securities held by the Series as of December 31, 2007 or December 31, 2008.
Security Transactions, Investment Income and Expenses
Security transactions are accounted for on trade date. Dividend income is recorded on the ex-dividend date, except that if the ex-dividend date has passed, certain dividends from foreign securities are recorded as soon as the Fund is informed of the ex-dividend date. Non-cash dividends, if any, are recorded at the fair market value of the securities received. Interest income, including amortization of premium and accretion of discounts using the effective interest method, is earned from settlement date and accrued daily.
Expenses are recorded on an accrual basis. Most expenses of the Fund can be attributed to a specific series. Expenses which cannot be directly attributed are apportioned among the series in the Fund in such a manner as deemed equitable by the Fund’s Board, taking into consideration, among other things, the nature and type of expense.
The Series uses the identified cost method for determining realized gain or loss on investments for both financial statement and federal income tax reporting purposes.
Foreign Currency Translation
The books and records of the Series are maintained in U.S. dollars. Foreign currencies, investments and other assets and liabilities are translated into U.S. dollars at the current exchange rates. Purchases and sales of investment securities and income and expenses are translated on the respective dates of such transactions. The Series does not isolate realized and unrealized gains and losses attributable to changes in the exchange rates from gains and losses
Notes to Financial Statements
| 2. | SIGNIFICANT ACCOUNTING POLICIES (continued) |
Foreign Currency Translation (continued)
that arise from changes in the market value of investments. Such fluctuations are included with net realized and unrealized gain or loss on investments. Net realized foreign currency gains and losses represent foreign currency gains and losses between trade date and settlement date on securities transactions, gains and losses on disposition of foreign currencies and the difference between the amount of income and foreign withholding taxes recorded on the books of the Series and the amounts actually received or paid.
Federal Taxes
The Series’ policy is to comply with the provisions of the Internal Revenue Code applicable to regulated investment companies. The Series is not subject to federal income tax or excise tax to the extent that the Series distributes to shareholders each year its taxable income, including any net realized gains on investments, in accordance with requirements of the Internal Revenue Code. Accordingly, no provision for federal income tax or excise tax has been made in the financial statements.
On June 29, 2007, the Series adopted Financial Accounting Standards Board Interpretation No. 48 - Accounting for Uncertainty in Income Taxes (“FIN 48”). FIN 48 prescribes the minimum recognition threshold a tax position must meet in connection with accounting for uncertainties in income tax positions taken or expected to be taken by an entity before being measured and recognized in the financial statements. Management has determined that the adoption of FIN 48 did not have a material impact on the Series’ financial statements. The Series files income tax returns in the U.S. federal jurisdiction, various states and foreign jurisdictions, as required. No income tax returns are currently under investigation. The statute of limitations on the Series’ tax returns remains open for the years ended December 31, 2005 through December 31, 2008.
Additionally, based on the Fund’s understanding of the tax rules and rates related to income, gains and transactions for foreign jurisdictions in which it invests, the Series will provide for foreign taxes, and where appropriate, deferred foreign tax.
Distributions of Income and Gains
Distributions to shareholders of net investment income and net realized gains are made annually. An additional distribution may be necessary to avoid taxation of the Series. Distributions are recorded on the ex-dividend date.
Indemnifications
The Fund’s organizational documents provide former and current directors and officers with a limited indemnification against liabilities arising in connection with the performance of their duties to the Fund. In the normal course of business, the Fund may also enter into contracts that provide general indemnifications. The Fund’s maximum exposure under these arrangements is unknown as this would be dependent on future claims that may be made against the Fund. The risk of material loss from such claims is considered remote.
Other
The preparation of financial statements in conformity with accounting principles generally accepted in the United States of America requires management to make estimates and assumptions that affect the reported amounts of assets and liabilities and the disclosure of contingent assets and liabilities at the date of the financial statements and the reported amounts of income and expenses during the reporting period. Actual results could differ from those estimates.
Notes to Financial Statements
| 3. | TRANSACTIONS WITH AFFILIATES |
The Fund has an Investment Advisory Agreement (the “Agreement”) with the Advisor, for which the Series pays a fee, computed daily and payable monthly, at an annual rate of 1.00% of the Series’ average daily net assets.
Under the Agreement, personnel of the Advisor provide the Series with advice and assistance in the choice of investments and the execution of securities transactions, and otherwise maintain the Series’ organization. The Advisor also provides the Fund with necessary office space and fund administration and support services. The salaries of all officers of the Fund (except a percentage of the Fund’s Chief Compliance Officer’s salary, which is paid by the Fund), and of all Directors who are “affiliated persons” of the Fund, or of the Advisor, and all personnel of the Fund, or of the Advisor, performing services relating to research, statistical and investment activities, are paid by the Advisor. Each “non-affiliated” Director receives an annual stipend, which is allocated among all the active series of the Fund. In addition, these Directors also receive a fee per Board meeting attended for each active series of the Fund plus a fee for each committee meeting attended.
Manning & Napier Investor Services, Inc., a registered broker-dealer affiliate of the Advisor, acts as distributor for the Fund’s shares. The services of Manning & Napier Investor Services, Inc. are provided at no additional cost to the Series.
For fund accounting and transfer agent services, through October 31, 2008, the Fund paid the Advisor an annual fee of 0.11% of the Fund’s average daily net assets up to $900 million, 0.07% of the Fund’s average daily net assets between $900 million and $1.5 billion, and 0.04% of the Fund’s average daily net assets over $1.5 billion. Effective November 1, 2008, the fee rates are as follows: 0.055% of the Fund’s average daily net assets up to $4.5 billion, 0.03% of the Fund’s average daily net assets between $4.5 billion and $7.5 billion, and 0.02% of the Fund’s average daily net assets over $7.5 billion. Additionally, certain transaction and account-based fees and out-of-pocket expenses, including charges for reporting relating to the Fund’s compliance program, are charged. Expenses not directly attributable to a series are allocated based on each series’ relative net assets or number of accounts, depending on the expense. The Advisor has an agreement with Citi Fund Services Ohio, Inc. (“Citi”) under which Citi serves as sub-accountant and sub-transfer agent.
| 4. | PURCHASES AND SALES OF SECURITIES |
For the year ended December 31, 2008, purchases and sales of securities, other than United States Government securities and short-term securities, were $130,095,440 and $99,189,138, respectively. There were no purchases or sales of United States Government securities.
| 5. | CAPITAL STOCK TRANSACTIONS |
Transactions in Class A shares of Small Cap Series were:
| | | | | | | | | | | | | | |
| | | For the Year
Ended 12/31/08 | | | For the Year
Ended 12/31/07 | |
| | | Shares | | | Amount | | | Shares | | | Amount | |
| | | | | | | | | | | | | | |
Sold | | 9,626,461 | | | $ | 62,628,594 | | | 2,951,632 | | | $ | 38,717,750 | |
Reinvested | | 210,004 | | | | 1,675,830 | | | 2,455,169 | | | | 24,508,650 | |
Repurchased | | (3,840,314 | ) | | | (29,258,000 | ) | | (712,445 | ) | | | (9,175,710 | ) |
| | | | | | | | | | | | | | |
Total | | 5,996,151 | | | $ | 35,046,424 | | | 4,694,356 | | | $ | 54,050,690 | |
| | | | | | | | | | | | | | |
Approximately 85% of the Series’ shares represent investments by fiduciary accounts over which the Advisor has sole investment discretion.
Notes to Financial Statements
The Series may trade in financial instruments with off-balance sheet risk in the normal course of its investing activities to assist in managing exposure to various market risks. These financial instruments include written options, forward foreign currency exchange contracts and futures contracts and may involve, to a varying degree, elements of risk in excess of the amounts recognized for financial statement purposes. No such investments were held by the Series on December 31, 2008.
Investing in securities of foreign companies and foreign governments involves special risks and considerations not typically associated with investing in securities of domestic companies and the United States Government. These risks include revaluation of currencies and future adverse political and economic developments. Moreover, securities of foreign companies and foreign governments and their markets may be less liquid and their prices more volatile than those of comparable domestic companies and the United States Government.
| 8. | FEDERAL INCOME TAX INFORMATION |
The amount and characterization of certain income and capital gains to be distributed are determined in accordance with federal income tax regulations, which may differ from accounting principles generally accepted in the United States of America. These differences are primarily due to differing book and tax treatments in the timing of the recognition of net investment income or gains and losses, including net operating losses, the tax practice known as equalization, foreign currency gains and losses and Post-October losses. The Series may periodically make reclassifications among its capital accounts to reflect income and gains available for distribution (or available capital loss carryovers) under income tax regulations, without impacting the Series’ net asset value. Any such reclassifications are not reflected in the financial highlights.
The tax character of distributions paid were as follows:
| | | | | | |
| | | For the Year
Ended 12/31/08 | | For the Year
Ended 12/31/07 |
| | | | | | |
Ordinary income | | $ | 242,042 | | $ | 11,710,286 |
Long-term capital gains | | | 1,454,159 | | | 13,271,215 |
For the year ended December 31, 2008, the Series elected to defer $30,186,055 and $92,455 of capital and currency losses, respectively, attributable to Post-October losses.
At December 31, 2008, the tax basis components of distributable earnings and the net unrealized depreciation based on identified cost for federal income tax purposes were as follows:
| | | | |
Cost for federal income tax purposes | | $ | 169,163,485 | |
Unrealized appreciation | | $ | 3,870,761 | |
Unrealized depreciation | | | (54,636,251 | ) |
| | | | |
Net unrealized depreciation | | $ | (50,765,490 | ) |
Capital loss carryover | | | 41,066,982 | |
The capital loss carryover, disclosed above, available to the extent allowed by tax law to offset future net capital gain, if any, will expire on December 31, 2016.
Notes to Financial Statements
| 9. | RECENT ACCOUNTING PRONOUNCEMENTS |
In September 2008, FASB Staff Position No. FAS 133-1 and FIN 45-4, “Disclosures about Credit Derivatives and Certain Guarantees: An Amendment of FASB Statement No. 133 and FASB Interpretation No. 45” (the “Position”) was issued and is effective for fiscal years and interim periods beginning after November 15, 2008. The Position amends FASB Statement No. 133 (“FAS 133”), Accounting for Derivative Instruments and Hedging Activities, and also amends FASB Interpretation No. 45 (“FIN 45”), Guarantor’s Accounting and Disclosure Requirements for Guarantees, Including Indirect Guarantees of Indebtedness of Others. The amendments to FAS 133 include required disclosure for (i) the nature and terms of the credit derivative, reasons for entering into the credit derivative, the events or circumstances that would require the seller to perform under the credit derivative, and the current status of the payment performance risk of the credit derivative, (ii) the maximum potential amount of future payments (undiscounted) the seller could be required to make under the credit derivative, (iii) the fair value of the credit derivative, and (iv) the nature of any recourse provisions and assets held either as collateral or by third parties. The amendments to FIN 45 require additional disclosures about the current status of the payment/performance risk of a guarantee. At this time, Management is evaluating the implications of FAS 133-1 and FIN 45-4, but they are not expected to materially impact the Series’ financial statements.
In March 2008, FASB Statement of Financial Accounting Standards No. 161, Disclosures about Derivative Instruments and Hedging Activities (“FAS 161”) was issued and is effective for fiscal years and interim periods beginning after November 15, 2008. FAS 161 requires enhanced disclosures about the Series’ derivative and hedging activities, including how such activities are accounted for and their effect on the Series’ financial position and performance. Management is currently evaluating the impact of the adoption of FAS 161, but it is not expected to materially impact the Series’ financial statements.
Report of Independent Registered Public Accounting Firm
To the Board of Directors of Manning & Napier Fund, Inc. and Shareholders of Small Cap Series:
In our opinion, the accompanying statement of assets and liabilities, including the investment portfolio, and the related statements of operations and of changes in net assets and the financial highlights present fairly, in all material respects, the financial position of the Small Cap Series (a series of Manning & Napier Fund, Inc., hereafter referred to as the “Series”) at December 31, 2008, and the results of its operations for the year then ended, the changes in its net assets for each of the two years in the period then ended and the financial highlights for each of the five years in the period then ended, in conformity with accounting principles generally accepted in the United States of America. These financial statements and financial highlights (hereafter referred to as “financial statements”) are the responsibility of the Series’ management; our responsibility is to express an opinion on these financial statements based on our audits. We conducted our audits of these financial statements in accordance with the standards of the Public Company Accounting Oversight Board (United States). Those standards require that we plan and perform the audit to obtain reasonable assurance about whether the financial statements are free of material misstatement. An audit includes examining, on a test basis, evidence supporting the amounts and disclosures in the financial statements, assessing the accounting principles used and significant estimates made by management, and evaluating the overall financial statement presentation. We believe that our audits, which included confirmation of securities at December 31, 2008 by correspondence with the custodian, provide a reasonable basis for our opinion.

Columbus, Ohio
February 13, 2009
Supplemental Tax Information (unaudited)
For federal income tax purposes, the Series designates for the current fiscal year $29,069 or, if different, the maximum amount allowable under the tax law as qualified dividend income.
Pursuant to Section 852 of the Internal Revenue Code, as amended, the Series hereby designates $1,454,159 as capital gains for its taxable year ended December 31, 2008.
Renewal of Investment Advisory Agreement (unaudited)
At the Manning & Napier Fund, Inc. (the “Fund”) Board of Directors’ (the “Board”) meeting, held on November 5, 2008, the Investment Advisory Agreement (the “Agreement”) between the Fund and Manning & Napier Advisors, Inc. (the “Advisor”) was reviewed by the Board for renewal. In connection with the decision whether to renew the Agreement, a variety of material was prepared for and reviewed by the Board.
Representatives of the Advisor attended the meeting and presented additional oral and written information to the Board to assist the Board in its considerations. The discussion immediately below outlines the materials and information presented to the Board in connection with the Board’s 2008 Annual Review of the Agreement and the conclusions made by the Directors when determining to continue the Agreement.
| | • | | The Board considered the services provided by the Advisor under the Agreement including, among others: deciding what securities to purchase and sell for each Series; arranging for the purchase and sale of such securities by placing orders with broker-dealers; administering the affairs of the Fund (including the books and records of the Fund not maintained by third party service providers such as the custodian or sub-transfer agent); arranging for the insurance coverage for the Fund; and supervising the preparation of tax returns, SEC filings (including registration statements) and reports to shareholders for the Fund. The Board also considered the nature and quality of such services provided under the Agreement in light of the Advisor’s services provided to the Fund for 22 years. The Board discussed the quality of these services with representatives from the Advisor and concluded that the Advisor was performing its services to the Fund required under the Agreement in a reasonable manner. |
| | • | | The Board considered the investment performance of the various Series of the Fund. The investment performance for each Series was reviewed on a cumulative basis since inception and on a one year basis. In addition, annualized performance for the following time periods was considered: inception, three year, five year, ten year, and current market cycle. A market cycle includes periods of both rising and falling markets. Returns for established benchmark indices for each Series were provided for each time period. The Board noted that the various Series were competitive against their respective benchmarks and/or peer groups over various time periods, but in particular over the full market cycle period relevant for the Series. In addition, the Board considered at the meeting (and considers on a quarterly basis) a peer group performance analysis consisting of Morningstar universes of mutual funds with similar investment objectives. The Board discussed the performance with representatives from the Advisor and concluded that the investment performance of each of the Fund’s Series was reasonable based on the Fund’s actual performance and comparative performance, especially performance over the current market cycle. |
| | • | | The Board considered the costs of the Advisor’s services and the profits of the Advisor as they relate to the Advisor’s services to the Fund under the Agreement. In reviewing the Advisor’s costs and profits, the Board discussed the Advisor’s revenues generated from the Fund (on both an actual and adjusted basis) and its expenses associated with providing the services under the Agreement. In addition, the Board reviewed the Advisor’s expenses associated with Fund activities outside of the Agreement (such as expense reimbursements pursuant to expense caps and payments made by the Advisor to third party platforms on which shares of the Fund are available for purchase). It was noted by representatives of the Advisor that 15 of the 25 active Series of the Fund are |
Renewal of Investment Advisory Agreement (unaudited)
| | currently experiencing expenses above the capped expense ratios. After discussing the above costs and profits, the Board concluded that the Advisor’s profitability relating to its services provided under the Agreement was reasonable. |
| | • | | The Board considered the fees and expenses of the various Series of the Fund. The Advisor presented the advisory fees and total expenses for each Series, including the advisory fee adjusted for any expense waivers or reimbursements (either contractual or voluntary) paid by the Advisor. The advisory fees and expense ratios of each Series were compared to an average (on both a mean and median basis) of similar funds as disclosed on the Morningstar database. Representatives of the Advisor discussed with the Board the levels of its advisory fee for each Series of the Fund and as compared to the median and mean advisory fees for similar funds as listed on Morningstar. Expense ratios for every Series, except the High Yield Bond Series, Global Fixed Income Series and the Target Series Class R and Class C, are currently below the median and mean for similar funds as listed on Morningstar. Based on their review of the information provided, the Board concluded that the fees and expenses of each Series of the Fund were reasonable on a comparative basis. |
| | • | | The Board also considered the other benefits the Advisor derives from its relationship with the Fund. Such other benefits include certain research products provided by soft dollars. Given the level of soft dollar transactions involving the Fund, the Board concluded that these additional benefits to the Advisor were reasonable. |
| | • | | In addition to the factors described above, the Board considered the Advisor’s personnel, investment strategies, policies and procedures relating to compliance with personal securities transactions, and reputation, expertise and resources in domestic and foreign financial markets. The Board concluded that these factors support the conclusion that the Advisor performs its services in a reasonable manner. |
| | • | | The Board did not consider economies of scale at this time because of the multiple uses of the Fund (for the Advisor’s discretionary investment account clients in addition to direct investors), the current profitability of the Advisor’s services to the Fund under the Agreement, and the overall size of the Fund complex. |
Based on the Board’s deliberations and their evaluation of the information described above, the Board, including a majority of Directors that are not “interested persons” as defined in the Investment Company Act of 1940, concluded that the compensation under the Agreement was fair and reasonable in light of the services and expenses and such other matters as the Directors considered to be relevant in the exercise of their reasonable judgment. Accordingly, the Board approved the renewal of the Agreement. In the course of their deliberations, the Directors did not identify any particular information that was all important or controlling.
Directors’ and Officers’ Information (unaudited)
The Statement of Additional Information provides additional information about the Fund’s directors and officers and can be obtained without charge by calling 1-800-466-3863, at www.manningnapieradvisors.com, or on the EDGAR Database on the SEC Internet web site (http://www.sec.gov). The following chart shows certain information about the Fund’s officers and directors, including their principal occupations during the last five years. Unless specific dates are provided, the individuals have held the listed positions for longer than five years.
INTERESTED DIRECTOR/OFFICER
| | |
| Name: | | B. Reuben Auspitz* |
| Address: | | 290 Woodcliff Drive |
| | Fairport, NY 14450 |
| Age: | | 61 |
| Current Position(s) Held with Fund: | | Principal Executive Officer, President, Chairman & Director |
| Term of Office1 & Length of Time Served: | | Indefinite - Director since 1984; Vice President 1984 - 2003; President since 2004; Principal Executive Officer since 2002 |
| Principal Occupation(s) During Past 5 Years: | | Executive Vice President; Co-Executive Director; Executive Group Member**; Chief Compliance Officer since 2004 - Manning & Napier Advisors, Inc. President; Director - Manning & Napier Investor Services, Inc. Holds or has held one or more of the following titles for various subsidiaries and affiliates: President, Vice President, Director, Chairman, Treasurer, Chief Compliance Officer or Member. |
| Number of Portfolios Overseen within Fund Complex: | | 28 |
| Other Directorships Held Outside Fund Complex: | | N/A |
| |
| INDEPENDENT DIRECTORS | | |
| |
| Name: | | Stephen B. Ashley |
| Address: | | 290 Woodcliff Drive |
| | Fairport, NY 14450 |
| Age: | | 68 |
| Current Position(s) Held with Fund: | | Director, Audit Committee Member, Governance & Nominating Committee Member |
| Term of Office & Length of Time Served: | | Indefinite - Since 1996 |
| Principal Occupation(s) During Past 5 Years: | | Chairman, Director, President & Chief Executive Officer, The Ashley Group (property management and investment). Chairman (non-executive) 2004-2008; Director 1995-2008 - Fannie Mae (mortgage) |
| Number of Portfolios Overseen within Fund Complex: | | 28 |
| Other Directorships Held Outside Fund Complex: | | The Ashley Group |
| Name: | | Peter L. Faber |
| Address: | | 290 Woodcliff Drive |
| | Fairport, NY 14450 |
| Age: | | 70 |
| Current Position(s) Held with Fund: | | Director, Governance & Nominating Committee Member |
| Term of Office & Length of Time Served: | | Indefinite - Since 1987 |
| Principal Occupation(s) During Past 5 Years: | | Senior Counsel, McDermott, Will & Emery LLP (law firm) |
| Number of Portfolios Overseen within Fund Complex: | | 28 |
| Other Directorships Held Outside Fund Complex: | | Partnership for New York City, Inc. |
| | New York Collegium |
| | | Boston Early Music Festival |
| Name: | | Harris H. Rusitzky |
| Address: | | 290 Woodcliff Drive |
| | Fairport, NY 14450 |
| Age: | | 73 |
| Current Position(s) Held with Fund: | | Director, Audit Committee Member, Governance & Nominating Committee Member |
| Term of Office & Length of Time Served: | | Indefinite - Since 1985 |
| Principal Occupation(s) During Past 5 Years: | | President, The Greening Group (business consultants); Partner, The Restaurant Group (restaurants) |
| Number of Portfolios Overseen within Fund Complex: | | 28 |
| Other Directorships Held Outside Fund Complex: | | N/A |
Directors’ and Officers’ Information (unaudited)
| | |
| |
| INDEPENDENT DIRECTORS (continued) | | |
| |
| Name: | | Paul A. Brooke |
| Address: | | 290 Woodcliff Drive |
| | Fairport, NY 14450 |
| Age: | | 63 |
| Current Position(s) Held with Fund: | | Director, Audit Committee Member, Governance & Nominating Committee Member |
| Term of Office & Length of Time Served: | | Indefinite - Since 2007 |
| Principal Occupation(s) During Past 5 Years: | | Chairman & CEO, Alsius Corp. (investments); Managing Member, PMSV Holdings LLC (investments) |
| Number of Portfolios Overseen within Fund Complex: | | 28 |
| Other Directorships Held Outside Fund Complex: | | Incyte Corp. |
| | ViroPharma, Inc. |
| | HLTH Corp. |
| | Cheyne Captial International |
| | MPM Bio-equities |
| | GMP Companies |
| | | HoustonPharma |
| |
| OFFICERS | | |
| |
| Name: | | Jeffrey S. Coons, Ph.D., CFA |
| Address: | | 290 Woodcliff Drive |
| | Fairport, NY 14450 |
| Age: | | 45 |
| Current Position(s) Held with Fund: | | Vice President |
| Term of Office1 & Length of Time Served: | | Since 2004 |
| Principal Occupation(s) During Past 5 Years: | | Co-Director of Research since 2002 & Executive Group Member**, Manning & Napier Advisors, Inc. Holds one or more of the following titles for various subsidiaries and affiliates: President, Director, Treasurer or Senior Trust Officer. |
| Number of Portfolios Overseen within Fund Complex: | | 28 |
| Other Directorships Held Outside Fund Complex: | | N/A |
| Name: | | Christine Glavin |
| Address: | | 290 Woodcliff Drive |
| | Fairport, NY 14450 |
| Age: | | 42 |
| Current Position(s) Held with Fund: | | Principal Financial Officer, Chief Financial Officer |
| Term of Office1 & Length of Time Served: | | Principal Financial Officer since 2002; Chief Financial Officer since 2001 |
| Principal Occupation(s) During Past 5 Years: | | Fund Reporting Manager, Manning & Napier Advisors, Inc. |
| Number of Portfolios Overseen within Fund Complex: | | 28 |
| Other Directorships Held Outside Fund Complex: | | N/A |
| Name: | | Jodi L. Hedberg |
| Address: | | 290 Woodcliff Drive |
| | Fairport, NY 14450 |
| Age: | | 41 |
| Current Position(s) Held with Fund: | | Corporate Secretary, Chief Compliance Officer, Anti-Money Laundering Compliance Officer |
| Term of Office1 & Length of Time Served: | | Corporate Secretary since 1997; Chief Compliance Officer since 2004 |
| Principal Occupation(s) During Past 5 Years: | | Director of Compliance, Manning & Napier Advisors, Inc. and affiliates; Corporate Secretary, Manning & Napier Investor Services, Inc. since 2006 |
| Number of Portfolios Overseen within Fund Complex: | | 28 |
| Other Directorships Held Outside Fund Complex: | | N/A |
*Interested Director, within the meaning of the Investment Company Act of 1940 by reason of his position with the Fund’s investment advisor and distributor. Mr. Auspitz serves as the Executive Vice President and Director, Manning & Napier Advisors, Inc. and President and Director, Manning & Napier Investor Services, Inc., the Fund’s distributor.
**The Executive Group performs the duties of the Office of the Chief Executive of Manning & Napier Advisors, Inc.
1The term of office for President, Vice President, Chief Financial Officer, and Corporate Secretary is one year and until their respective successors are chosen and qualified. All other officers’ terms are indefinite.
(THISPAGEINTENTIONALLYLEFTBLANK)
Literature Requests (unaudited)
Proxy Voting Policies and Procedures
A description of the policies and procedures that the Fund uses to determine how to vote proxies relating to portfolio securities is available, without charge, upon request:
| | |
By phone | | 1-800-466-3863 |
On the Securities and Exchange Commission’s (SEC) web site | | http://www.sec.gov |
Proxy Voting Record
Information regarding how the Fund voted proxies relating to portfolio securities during the most recent 12-month period ended June 30th is available, without charge, upon request:
| | |
By phone | | 1-800-466-3863 |
On the SEC’s web site | | http://www.sec.gov |
Quarterly Portfolio Holdings
The Series’ complete schedule of portfolio holdings for the 1st and 3rd quarters of each fiscal year are provided on Form N-Q, and are available, without charge, upon request:
| | |
By phone | | 1-800-466-3863 |
On the SEC’s web site | | http://www.sec.gov |
The Series’ Form N-Q may be reviewed and copied at the SEC’s Public Reference Room in Washington, D.C. Information on the operation of the Public Reference Room may be obtained by calling 1-800-SEC-0330.
Prospectus and Statement of Additional Information (SAI)
The prospectus and SAI provide additional information about each Series, including charges, expenses and risks. These documents are available, without charge, upon request:
| | |
By phone | | 1-800-466-3863 |
On the SEC’s web site | | http://www.sec.gov |
On the Advisor’s web site | | http://www.manningnapieradvisors.com |
Additional information available at www.manningnapieradvisors.com
1. Fund Holdings - Month-End
2. Fund Holdings - Quarter-End
3. Shareholder Report - Annual
4. Shareholder Report - Semi-Annual
Manning & Napier Fund, Inc.
| | | | |
| LIFE SCIENCES SERIES | | | | | Annual Report - December 31, 2008 |

Management Discussion and Analysis (unaudited)
Dear Shareholders:
Market conditions in 2008 were extremely challenging; the Life Sciences Series achieved a return that was below the return of the Standard & Poor’s (S&P) 500 Health Care Index for the first time in nine years. The Series also underperformed the S&P 500 Total Return Index. Over the calendar year 2008, the Life Sciences Series generated a total return of -38.77%, versus the -22.81% return of the S&P 500 Health Care Index and the -36.99% return of the S&P 500 Total Return Index. However, performance over the full market cycle (since 10/1/02) remains competitive, both on an absolute basis and as compared to the benchmarks. The Series’ average annualized total return from October 1, 2002 through December 31, 2008 was 3.64%, which exceeds the 2.48% average annualized total return of the S&P 500 Health Care Index and narrowly beats the 3.63% average annualized total return of the S&P 500 Total Return Index.
The relative underperformance of the Series versus the benchmarks in 2008 was due in large part to the weak performance of our small-cap holdings. There were several reasons for the broader decline of small-cap stocks, including capital rotation into what were perceived as less risky large-cap stocks, as well as general credit and financing concerns around the small-cap companies. In addition, there was an unprecedented amount of forced selling and redemptions by institutional and retail investors, especially in the fourth quarter, with an exaggerated impact on small-cap equities due to liquidity. Smaller companies in general were disproportionately punished by investors, with what we regard as fundamentally solid companies often being indiscriminately sold.
We believe the fundamentals of our small-cap holdings remain largely sound; therefore, we are continuing to hold them despite what we believe to be exaggerated short-term worries in the marketplace. However, in response to market conditions, we made certain portfolio adjustments throughout the course of the year. For example, we placed a higher emphasis on more financially stable companies that fit within our long-term investment themes such as diagnostics, life science tools, and healthcare information technology. We also decreased the Series’ exposure to small-cap holdings that were failing to track our investment thesis positively.
The Series also continues to invest in companies related to our long-term themes that we believe have secular (non-cyclical) tailwinds and that we believe to be less exposed to government scrutiny and pricing pressure than some other companies. Existing and new products and services from our thematic investments are intended to improve the quality of healthcare while, at the same time, increasing efficiency in the delivery of care.
We believe it is prudent to remain disciplined in our investment approach and philosophy, which we have followed in a variety of market conditions for over 38 years. While 2008 was a difficult year for investors, we recognize that our job is to remain focused on company-specific fundamentals. In a year where emotion - a crisis of confidence - was a strong driver of returns no matter the market, we are not surprised that our fundamentals-based approach produced disappointing returns. However, looking back over our history, this approach has served our clients well over the long-term.
As always, we appreciate your business.
Sincerely,
Manning & Napier Advisors, Inc.
Performance Update as of December 31, 2008 (unaudited)
| | | | | | | | |
| | | Average Annual Total Returns
As of December 31, 2008 | | |
| | | One
Year | | Five
Year | | Since
Inception1 | | |
Manning & Napier Fund, Inc. - Life Sciences Series2 | | -38.77% | | -2.16% | | 8.72% | | |
Standard & Poor’s (S&P) 500 Total Return Index3 | | -36.99% | | -2.18% | | -2.78% | | |
Standard & Poor’s (S&P) 500 Health Care Index3 | | -22.81% | | -0.73% | | -0.26% | | |
The following graph compares the value of a $10,000 investment in the Manning & Napier Fund, Inc. - Life Sciences Series from its current activation1 (11/5/99) to present (12/31/08) to the S&P 500 Total Return Index and the S&P 500 Health Care Index.
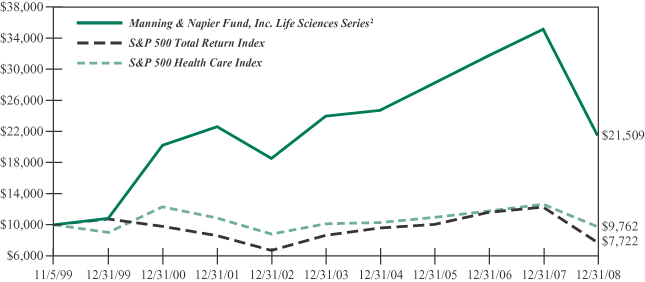
1Performance numbers for the Series and Indices are calculated from November 5, 1999, the Series’ current activation date.
2The Series’ performance does not reflect the deduction of taxes that a shareholder would pay on fund distributions or the redemption of shares. The Series’ performance is historical and may not be indicative of future results. The performance returns shown are inclusive of the net expense ratio of the Series. For the year ended December 31, 2008, this net expense ratio was 1.12%. The gross expense ratio, which does not account for any voluntary or contractual waivers currently in effect, was 1.12% for the year ended December 31, 2008.
3The S&P 500 Total Return Index is an unmanaged capitalization-weighted measure of 500 widely held common stocks listed on the New York Stock Exchange, American Stock Exchange and the Over-the-Counter market. The S&P 500 Health Care Index, a sub-index of the S&P 500 Total Return Index, includes the stocks of companies involved in the business of health care related products and services. Both Indices’ returns assume daily reinvestment of dividends and, unlike Series returns, do not reflect any fees or expenses.
Shareholder Expense Example (unaudited)
As a shareholder of the Series, you may incur two types of costs: (1) transaction costs, including potential wire charges on redemptions and (2) ongoing costs, including management fees and other Series expenses. This example is intended to help you understand your ongoing costs (in dollars) of investing in the Series and to compare these costs with the ongoing costs of investing in other mutual funds.
The example is based on an investment of $1,000 invested at the beginning of the period and held for the entire period (July 1, 2008 to December 31, 2008).
Actual Expenses
The first line of the table below provides information about actual account values and actual expenses. You may use the information in this line, together with the amount you invested, to estimate the expenses that you paid over the period. Simply divide your account value by $1,000 (for example, an $8,600 account value divided by $1,000 = 8.6), then multiply the result by the number in the first line under the heading entitled “Expenses Paid During Period” to estimate the expenses you paid on your account during this period.
Hypothetical Example for Comparison Purposes
The second line of the table below provides information about hypothetical account values and hypothetical expenses based on the Series’ actual expense ratio and an assumed rate of return of 5% per year before expenses, which is not the Series’ actual return. The hypothetical account values and expenses may not be used to estimate the actual ending account balance or expenses you paid during the period. You may use this information to compare the ongoing costs of investing in the Series and other funds. To do so, compare this 5% hypothetical example with the 5% hypothetical examples that appear in the shareholder reports of the other funds.
Please note that the expenses shown in the table are meant to highlight your ongoing costs only and do not reflect any transaction costs, such as potential wire charges on redemptions. Therefore, the second line of the table is useful in comparing ongoing costs only, and will not help you determine the relative total costs of owning different funds. In addition, if these transaction costs were included, your costs would have been higher.
| | | | | | | | | |
| | | Beginning
Account Value
7/1/08 | | Ending
Account Value
12/31/08 | | Expenses Paid
During Period*
7/1/08-12/31/08 |
Actual | | $ | 1,000.00 | | $ | 744.50 | | $ | 4.96 |
Hypothetical
(5% return before expenses) | | $ | 1,000.00 | | $ | 1,019.46 | | $ | 5.74 |
*Expenses are equal to the Series’ annualized expense ratio (for the six-month period) of 1.13%, multiplied by the average account value over the period, multiplied by 184/366 (to reflect the one-half year period). Expenses are based on the most recent fiscal half year; therefore, the expense ratio stated above may differ from the expense ratio stated in the financial highlights, which is based on one-year data.
Portfolio Composition as of December 31, 2008 (unaudited)
Sector Allocation1
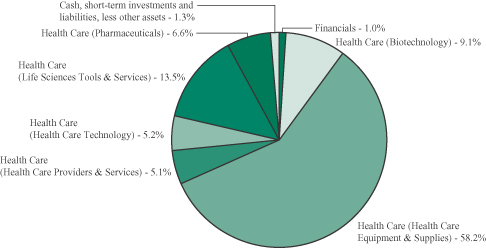
1As a percentage of net assets.
Top Ten Stock Holdings2
| | | | | | |
Mylan, Inc. | | 6.6% | | Covidien Ltd. (Bermuda) | | 4.3% |
Inverness Medical Innovations, Inc. | | 5.3% | | Luminex Corp. | | 4.1% |
Eclipsys, Corp. | | 5.2% | | Celera Corp. | | 4.0% |
bioMerieux (France) | | 4.7% | | Sonic Healthcare Ltd. (Australia) | | 3.8% |
Beckman Coulter, Inc. | | 4.7% | | Synthes, Inc. | | 3.6% |
2As a percentage of total investments.
Investment Portfolio - December 31, 2008
| | | | | |
| | | Shares | | Value
(Note 2) |
| | | | | |
| | |
COMMON STOCKS - 97.6% | | | | | |
| | |
Health Care - 97.6% | | | | | |
Biotechnology - 9.1% | | | | | |
Celera Corp.* | | 665,100 | | $ | 7,402,563 |
Cepheid, Inc.* | | 343,000 | | | 3,560,340 |
Genomic Health, Inc.* | | 205,000 | | | 3,993,400 |
QLT, Inc.* (Canada) (Note 7) | | 690,000 | | | 1,662,900 |
| | | | | |
| | | | | 16,619,203 |
| | | | | |
Health Care Equipment & Supplies - 58.2% | | | | | |
Abaxis, Inc.* | | 265,000 | | | 4,247,950 |
Align Technology, Inc.* | | 675,000 | | | 5,906,250 |
Alsius Corp.*1,6 | | 196,317 | | | 113,864 |
AtriCure, Inc.* | | 234,000 | | | 519,480 |
Beckman Coulter, Inc. | | 195,000 | | | 8,568,300 |
bioMerieux (France) (Note 7) | | 104,252 | | | 8,693,946 |
C.R. Bard, Inc. | | 58,200 | | | 4,903,932 |
The Cooper Companies, Inc. | | 100,000 | | | 1,640,000 |
Covidien Ltd. (Bermuda) (Note 7) | | 220,000 | | | 7,972,800 |
DENTSPLY International, Inc. | | 135,000 | | | 3,812,400 |
Dexcom, Inc.* | | 1,323,200 | | | 3,652,032 |
ev3, Inc.* | | 514,800 | | | 3,140,280 |
Gen-Probe, Inc.* | | 127,000 | | | 5,440,680 |
IDEXX Laboratories, Inc.* | | 97,000 | | | 3,499,760 |
Inverness Medical Innovations, Inc.* | | 395,000 | | | 7,469,450 |
Inverness Medical Innovations, Inc.*2,3 | | 122,000 | | | 2,307,020 |
Micrus Endovascular Corp.* | | 283,194 | | | 3,287,882 |
Nobel Biocare Holding AG (Switzerland) (Note 7) | | 60,000 | | | 1,208,008 |
OraSure Technologies, Inc.* | | 1,246,000 | | | 4,585,280 |
Orthofix International N.V.* (Netherlands) (Note 7) | | 311,815 | | | 4,780,124 |
Sirona Dental Systems, Inc.* | | 385,000 | | | 4,042,500 |
STAAR Surgical Co.* | | 1,116,000 | | | 2,656,080 |
Straumann Holding AG (Switzerland) (Note 7) | | 22,917 | | | 3,995,774 |
Synthes, Inc. | | 53,000 | | | 6,645,549 |
Zimmer Holdings, Inc.* | | 78,000 | | | 3,152,760 |
| | | | | |
| | | | | 106,242,101 |
| | | | | |
Health Care Providers & Services - 5.1% | | | | | |
Diagnosticos da America S.A. (Brazil) (Note 7) | | 250,000 | | | 2,410,982 |
Sonic Healthcare Ltd. (Australia) (Note 7) | | 680,000 | | | 6,900,859 |
| | | | | |
| | | | | 9,311,841 |
| | | | | |
Health Care Technology - 5.2% | | | | | |
Eclipsys Corp.* | | 670,000 | | | 9,507,300 |
| | | | | |
| | |
| The accompanying notes are an integral part of the financial statements. | | 5 |
Investment Portfolio - December 31, 2008
| | | | | | |
| | | Shares | | Value
(Note 2) | |
| | | | | | |
| | |
COMMON STOCKS (continued) | | | | | | |
| | |
Health Care (continued) | | | | | | |
Life Sciences Tools & Services - 13.4% | | | | | | |
Caliper Life Sciences, Inc.* | | 2,578,423 | | $ | 2,501,070 | |
Exelixis, Inc.* | | 1,050,400 | | | 5,273,008 | |
Life Technologies Corp.* | | 118,000 | | | 2,750,580 | |
Luminex Corp.* | | 350,000 | | | 7,476,000 | |
QIAGEN N.V.* (Netherlands) (Note 7) | | 369,000 | | | 6,479,640 | |
| | | | | | |
| | | | | 24,480,298 | |
| | | | | | |
Pharmaceuticals - 6.6% | | | | | | |
Mylan, Inc.* | | 1,227,000 | | | 12,135,030 | |
| | | | | | |
TOTAL COMMON STOCKS
(Identified Cost $245,052,644) | | | | | 178,295,773 | |
| | | | | | |
| | |
PREFERRED STOCKS - 1.0% | | | | | | |
Financials - 1.0% | | | | | | |
Insurance - 1.0% | | | | | | |
Avalon HealthCare Holdings, Inc. - Series D*2,4,5,6
(Identified Cost $2,312,500) | | 925,000 | | | 1,850,000 | |
| | | | | | |
WARRANTS - 0.1% | | | | | | |
Health Care - 0.1% | | | | | | |
Life Sciences Tools & Services - 0.1% | | | | | | |
Caliper Life Sciences, Inc., 8/15/20102,4,7 | | 285,000 | | | 61,387 | |
Caliper Life Sciences, Inc., 8/10/2011 | | 401,109 | | | 16,044 | |
| | | | | | |
| | |
TOTAL WARRANTS
(Identified Cost $541,581) | | | | | 77,431 | |
| | | | | | |
| | |
SHORT-TERM INVESTMENTS - 1.8% | | | | | | |
Dreyfus Cash Management, Inc. - Institutional Shares
(Identified Cost $3,326,455) | | 3,326,455 | | | 3,326,455 | |
| | | | | | |
TOTAL INVESTMENTS - 100.5%
(Identified Cost $251,233,180) | | | | | 183,549,659 | |
| | |
LIABILITIES, LESS OTHER ASSETS - (0.5%) | | | | | (845,381 | ) |
| | | | | | |
NET ASSETS - 100% | | | | $ | 182,704,278 | |
| | | | | | |
*Non-income producing security
1The Chairman and CEO of the company serves as a director of the Fund (see Note 2 to the financial statements).
2Restricted securities - Investment in securities that are restricted as to public resale under the Securities Act of 1933, as amended. These securities amount to $4,218,407, or 2.3%, of the Series’ net assets as of December 31, 2008 (see Note 2 to the financial statements).
| | |
| 6 | | The accompanying notes are an integral part of the financial statements. |
Investment Portfolio - December 31, 2008
3This security was acquired on February 3, 2006 at a cost of $2,978,020 ($24.41 per share) and has been determined to be liquid under guidelines established by the Board of Directors (see Note 2 to the financial statements).
4Security has been valued at fair value (see Note 2 to the financial statements).
5This security was acquired June 22, 2007 at a cost of $2,312,500 ($2.50 per share) and has been determined to be illiquid under guidelines established by the Board of Directors (see Note 2 to the financial statements).
6See Note 2 to the financial statements regarding affiliated companies.
7This security was acquired on August 11, 2005 at a cost of $365,484 ($1.28 per warrant) and has been determined to be illiquid under guidelines established by the Board of Directors (see Note 2 to the financial statements).
| | |
| The accompanying notes are an integral part of the financial statements. | | 7 |
Statement of Assets and Liabilities
December 31, 2008
| | | | |
ASSETS: | | | | |
| | | | |
| |
Investments, at value (identified cost $251,233,180) (Note 2) | | $ | 183,549,659 | |
Receivable for fund shares sold | | | 68,425 | |
Receivable for securities sold | | | 50,402 | |
Foreign tax reclaims receivable | | | 15,996 | |
Dividends receivable | | | 8,236 | |
| | | | |
TOTAL ASSETS | | | 183,692,718 | |
| | | | |
| LIABILITIES: | | | | |
| |
Accrued management fees (Note 3) | | | 148,109 | |
Accrued fund accounting and transfer agent fees (Note 3) | | | 10,865 | |
Accrued Chief Compliance Officer service fees (Note 3) | | | 477 | |
Payable for fund shares repurchased | | | 630,320 | |
Payable for securities purchased | | | 156,538 | |
Audit fees payable | | | 31,487 | |
Other payables and accrued expenses | | | 10,644 | |
| | | | |
TOTAL LIABILITIES | | | 988,440 | |
| | | | |
TOTAL NET ASSETS | | $ | 182,704,278 | |
| | | | |
NET ASSETS CONSIST OF: | | | | |
| |
Capital stock | | $ | 261,435 | |
Additional paid-in-capital | | | 285,582,291 | |
Accumulated net realized loss on investments, foreign currency and other assets and liabilities | | | (35,455,035 | ) |
Net unrealized depreciation on investments and other assets and liabilities | | | (67,684,413 | ) |
| | | | |
TOTAL NET ASSETS | | $ | 182,704,278 | |
| | | | |
NET ASSET VALUE, OFFERING PRICE AND REDEMPTION PRICE PER SHARE ($182,704,278/26,143,526 shares) | | $ | 6.99 | |
| | | | |
| | |
| 8 | | The accompanying notes are an integral part of the financial statements. |
Statement of Operations
For the Year Ended December 31, 2008
| | | | |
INVESTMENT INCOME: | | | | |
| | | | |
| |
Dividends (net of foreign tax withheld, $12,959) | | $ | 1,069,979 | |
Interest | | | 87,676 | |
| | | | |
Total Investment Income | | | 1,157,655 | |
| | | | |
| EXPENSES: | | | | |
| |
Management fees (Note 3) | | | 2,470,357 | |
Fund accounting and transfer agent fees (Note 3) | | | 159,073 | |
Directors’ fees (Note 3) | | | 12,599 | |
Chief Compliance Officer service fees (Note 3) | | | 4,301 | |
Custodian fees | | | 28,699 | |
Miscellaneous | | | 77,918 | |
| | | | |
Total Expenses | | | 2,752,947 | |
| | | | |
NET INVESTMENT LOSS | | | (1,595,292 | ) |
| | | | |
| REALIZED AND UNREALIZED LOSS ON INVESTMENTS: | | | | |
| |
Net realized loss on - | | | | |
Investments | | | (34,533,197 | ) |
Foreign currency and other assets and liabilities | | | (45,994 | ) |
| | | | |
| | | (34,579,191 | ) |
| | | | |
| |
Net change in unrealized appreciation (depreciation) on - | | | | |
Investments | | | (81,006,571 | ) |
Foreign currency and other assets and liabilities | | | (892 | ) |
| | | | |
| | | (81,007,463 | ) |
| | | | |
| |
NET REALIZED AND UNREALIZED LOSS ON
INVESTMENTS | | | (115,586,654 | ) |
| | | | |
NET DECREASE IN NET ASSETS RESULTING FROM OPERATIONS | | $ | (117,181,946 | ) |
| | | | |
| | |
| The accompanying notes are an integral part of the financial statements. | | 9 |
Statements of Changes in Net Assets
| | | | | | | | |
| | | For the
Year Ended
12/31/08 | | | For the
Year Ended
12/31/07 | |
| | | | | | | | |
| INCREASE (DECREASE) IN NET ASSETS: | | | | | | | | |
| | |
| OPERATIONS: | | | | | | | | |
| | |
Net investment loss | | $ | (1,595,292 | ) | | $ | (2,014,096 | ) |
Net realized gain (loss) on investments and foreign currency | | | (34,579,191 | ) | | | 26,465,274 | |
Net change in unrealized appreciation (depreciation) on investments and foreign currency | | | (81,007,463 | ) | | | 2,626,310 | |
| | | | | | | | |
Net increase (decrease) from operations | | | (117,181,946 | ) | | | 27,077,488 | |
| | | | | | | | |
| DISTRIBUTIONS TO SHAREHOLDERS (Note 9): | | | | | | | | |
| | |
From net realized gain on investments | | | (2,894,633 | ) | | | (24,823,184 | ) |
| | | | | | | | |
| CAPITAL STOCK ISSUED AND REPURCHASED: | | | | | | | | |
| | |
Net increase from capital share transactions (Note 5) | | | 3,111,722 | | | | 64,342,733 | |
| | | | | | | | |
Net increase (decrease) in net assets | | | (116,964,857 | ) | | | 66,597,037 | |
| | |
| NET ASSETS: | | | | | | | | |
| | |
Beginning of year | | | 299,669,135 | | | | 233,072,098 | |
| | | | | | | | |
End of year (including undistributed net investment income of $0 and $0, respectively) | | $ | 182,704,278 | | | $ | 299,669,135 | |
| | | | | | | | |
| | |
| 10 | | The accompanying notes are an integral part of the financial statements. |
Financial Highlights
| | | | | | | | | | |
| | | For the Years Ended |
| | | 12/31/08 | | 12/31/07 | | 12/31/06 | | 12/31/05 | | 12/31/04 |
| | | | | | | | | | |
| Per share data (for a share outstanding throughout each year): | | | | | | | | | | |
Net asset value - Beginning of year | | $11.54 | | $11.41 | | $12.10 | | $11.89 | | $11.96 |
| | | | | | | | | | |
Income (loss) from investment operations: | | | | | | | | | | |
Net investment loss | | (0.06) | | (0.08) | | (0.05) | | (0.04) | | (0.07) |
Net realized and unrealized gain (loss) on investments | | (4.38) | | 1.25 | | 1.56 | | 1.71 | | 0.43 |
| | | | | | | | | | |
Total from investment operations | | (4.44) | | 1.17 | | 1.51 | | 1.67 | | 0.36 |
| | | | | | | | | | |
| | | | | |
Less distributions to shareholders: | | | | | | | | | | |
From net realized gain on investments | | (0.11) | | (1.04) | | (2.20) | | (1.46) | | (0.43) |
| | | | | | | | | | |
Net asset value - End of year | | $6.99 | | $11.54 | | $11.41 | | $12.10 | | $11.89 |
| | | | | | | | | | |
Net assets - End of year (000’s omitted) | | $182,704 | | $299,669 | | $233,072 | | $221,302 | | $185,487 |
| | | | | | | | | | |
Total return1 | | (38.77%) | | 10.62% | | 12.52% | | 14.16% | | 3.03% |
| Ratios (to average net assets)/Supplemental Data: | | | | | | | | | | |
Expenses | | 1.12% | | 1.12% | | 1.14% | | 1.17% | | 1.18%* |
Net investment loss | | (0.65%) | | (0.75%) | | (0.51%) | | (0.32%) | | (0.62%) |
Portfolio turnover | | 94% | | 95% | | 93% | | 110% | | 109% |
|
*The investment advisor did not impose all of its management fee and is not eligible to recoup any expenses that have been waived or reimbursed in prior years. If these expenses had been incurred by the Series, the expense ratio (to average net assets) for the year ended 12/31/04 would have been increased by 0.04%. |
1Represents aggregate total return for the year indicated, and assumes reinvestment of all distributions. Total return would have been lower had certain expenses not been waived during the year ended 12/31/04.
| | |
| The accompanying notes are an integral part of the financial statements. | | 11 |
Notes to Financial Statements
Life Sciences Series (the “Series”) is a no-load non-diversified series of Manning & Napier Fund, Inc. (the “Fund”). The Fund is organized in Maryland and is registered under the Investment Company Act of 1940 (the “1940 Act”), as amended, as an open-end management investment company.
The Series’ investment objective is to provide long-term growth by investing principally in the common stocks of companies in the life sciences industry.
The Fund’s Advisor is Manning & Napier Advisors, Inc. (the “Advisor”). On November 5, 1999, the Series resumed sales of shares to advisory clients and employees of the Advisor and its affiliates. On May 1, 2001, the Series began offering shares directly to investors. Previously, the Series was available from time to time to advisory clients and employees of the Advisor. The total authorized capital stock of the Fund consists of 5.0 billion shares of common stock each having a par value of $0.01. As of December 31, 2008, 4.5 billion shares have been designated in total among 28 series, of which 100 million have been designated as Life Sciences Series Class A common stock.
| 2. | SIGNIFICANT ACCOUNTING POLICIES |
Security Valuation
Portfolio securities, including domestic equities, foreign equities, exchange-traded funds, warrants and options, listed on an exchange other than the NASDAQ National Market System are valued at the latest quoted sales price of the exchange on which the security is primarily traded. Securities not traded on valuation date or securities not listed on an exchange are valued at the latest quoted bid price provided by the Fund’s pricing service. Securities listed on the NASDAQ National Market System are valued in accordance with the NASDAQ Official Closing Price.
Securities for which representative valuations or prices are not available from the Fund’s pricing service may be valued at fair value. Due to the inherent uncertainty of valuations of such securities, the fair value may differ significantly from the values that would have been used had a ready market for such securities existed. If trading or events occurring after the close of the principal market in which securities are traded are expected to materially affect the value of those securities, then they may be valued at their fair value, taking this trading or these events into account. Fair value is determined in good faith by the Advisor under procedures approved by and under the general supervision and responsibility of the Fund’s Board of Directors (the “Board”).
Short-term investments that mature in sixty days or less are valued at amortized cost, which approximates market value. Investments in open-end investment companies are valued at their net asset value per share on valuation date, with the exception of exchange-traded funds, which are valued at the closing price on the exchange.
In September 2006, FASB Statement of Financial Accounting Standards No. 157, Fair Value Measurements (“FAS 157”) was issued, effective for fiscal years beginning after November 15, 2007. This standard clarifies the definition of fair value for financial reporting, establishes a framework for measuring fair value and requires additional disclosures about the use of fair value measurements. FAS 157 became effective for the Series as of January 1, 2008, the
Notes to Financial Statements
| 2. | SIGNIFICANT ACCOUNTING POLICIES (continued) |
Security Valuation (continued)
beginning of its current fiscal year. The three levels of the fair value hierarchy under FAS 157 are described below:
Level 1 - quoted prices in active markets for identical securities
Level 2 - other significant observable inputs (including quoted prices for similar securities, interest rates, prepayment speeds, credit risk, etc.)
Level 3 - significant unobservable inputs (including the Series’ own assumptions in determining the fair value of investments.)
The inputs or methodology used for valuing securities are not necessarily an indication of the risk associated with investing in those securities. The following is a summary of the inputs used to value the Series’ assets as of December 31, 2008:
| | | | | | |
Valuation Inputs | | Investments
in Securities | | Other Financial
instruments* |
Level 1 - Quoted Prices | | $ | 181,638,272 | | $ | — |
Level 2 - Other Significant Observable Inputs | | | — | | | — |
Level 3 - Significant Unobservable Inputs | | | 1,911,387 | | | — |
| | | | | | |
Total | | $ | 183,549,659 | | $ | — |
| | | | | | |
*Other financial instruments are derivative instruments not reflected in the Investment Portfolio, such as futures, forwards and swap contracts, which are valued at the unrealized appreciation/depreciation on the instrument. As of December 31, 2008, the Series did not hold any derivative instruments.
The following is a reconciliation of Level 3 assets for which significant unobservable inputs were used to determine fair value:
| | | | |
| | | Investments
in Securities | |
Balance as of 12/31/07 | | $ | 2,557,022 | |
Realized gain/loss | | | — | |
Change in unrealized appreciation (depreciation) | | | (645,635 | ) |
Net purchases (sales) | | | — | |
Transfers in and/or out of Level 3 | | | — | |
| | | | |
Balance as of 12/31/08 | | $ | 1,911,387 | |
| | | | |
Security Transactions, Investment Income and Expenses
Security transactions are accounted for on trade date. Dividend income is recorded on the ex-dividend date, except that if the ex-dividend date has passed, certain dividends from foreign securities are recorded as soon as the Fund is informed of the ex-dividend date. Non-cash dividends, if any, are recorded at the fair market value of the securities received. Interest income, including amortization of premium and accretion of discounts using the effective interest method, is earned from settlement date and accrued daily.
Expenses are recorded on an accrual basis. Most expenses of the Fund can be attributed to a specific series. Expenses which cannot be directly attributed are apportioned among the series in the Fund in such a manner as deemed equitable by the Fund’s Board, taking into consideration, among other things, the nature and type of expense.
Notes to Financial Statements
| 2. | SIGNIFICANT ACCOUNTING POLICIES (continued) |
Security Transactions, Investment Income and Expenses (continued)
The Series uses the identified cost method for determining realized gain or loss on investments for both financial statement and federal income tax reporting purposes.
Foreign Currency Translation
The books and records of the Series are maintained in U.S. dollars. Foreign currencies, investments and other assets and liabilities are translated into U.S. dollars at the current exchange rates. Purchases and sales of investment securities and income and expenses are translated on the respective dates of such transactions. The Series does not isolate realized and unrealized gains and losses attributable to changes in the exchange rates from gains and losses that arise from changes in the market value of investments. Such fluctuations are included with net realized and unrealized gain or loss on investments. Net realized foreign currency gains and losses represent foreign currency gains and losses between trade date and settlement date on securities transactions, gains and losses on disposition of foreign currencies and the difference between the amount of income and foreign withholding taxes recorded on the books of the Series and the amounts actually received or paid.
Restricted Securities
Restricted securities are purchased in private placement transactions, are not registered under the Securities Act of 1933, as amended, and may have contractual restrictions on resale. Information regarding restricted securities is included at the end of the Series’ Investment Portfolio.
Illiquid Securities
A security may be considered illiquid if so deemed in good faith by the Advisor under procedures approved by and under the general supervision and responsibility of the Fund’s Board. Securities that are illiquid are marked with the applicable footnote on the Investment Portfolio. As of December 31, 2008, the aggregate value of securities deemed illiquid was $1,911,387, representing 1.0% of the Series’ net assets.
Affiliated Companies
The 1940 Act defines “affiliated companies” to include securities in which a series owns 5% or more of the outstanding voting securities of the issuer. The following transactions were effected in shares of Avalon Healthcare Holdings, Inc. for the year ended December 31, 2008:
| | | | | | | | | | | | | | | | | |
Name of
Issuer | | Number of
Shares
Held
as of
12/31/07 | | Gross
Additions | | Gross
Reductions | | Number of
Shares
Held
as of
12/31/08 | | Value
as of
12/31/08 | | Invest-
ment
Income | | Realized
Gain |
Avalon Healthcare Holdings, Inc. | | 925,000 | | — | | — | | 925,000 | | $ | 1,850,000 | | $ | — | | $ | — |
Notes to Financial Statements
| 2. | SIGNIFICANT ACCOUNTING POLICIES (continued) |
Affiliated Companies (continued)
The Chairman and CEO of Alsius Corp. serves as a director of the Fund. Therefore, Alsius Corp. (formerly Ithaka Acquisition Corp.) is considered an “affiliated company”, as defined in the 1940 Act. The following transactions were effected in shares of Alsius Corp. for the year ended December 31, 2008:
| | | | | | | | | | | | | | | | | |
Name of
Issuer | | Number of
Shares
Held
as of
12/31/07 | | Gross
Additions | | Gross
Reductions | | Number of
Shares
Held
as of
12/31/08 | | Value
as of
12/31/08 | | Invest-
ment
Income | | Realized
Loss |
Alsius Corp | | 490,000 | | 321,819 | | 615,502 | | 196,317 | | $ | 113,864 | | $ | — | | $ | 2,024,747 |
Alsius Corp., 8/3/2009 Warrants* | | 1,770,000 | | — | | 1,770,000 | | — | | $ | — | | $ | — | | $ | — |
*The warrants were exercised into new common shares of Alsius Corp. during the year.
Federal Taxes
The Series’ policy is to comply with the provisions of the Internal Revenue Code applicable to regulated investment companies. The Series is not subject to federal income tax or excise tax to the extent that the Series distributes to shareholders each year its taxable income, including any net realized gains on investments, in accordance with requirements of the Internal Revenue Code. Accordingly, no provision for federal income tax or excise tax has been made in the financial statements.
On June 29, 2007, the Series adopted Financial Accounting Standards Board Interpretation No. 48 - Accounting for Uncertainty in Income Taxes (“FIN 48”). FIN 48 prescribes the minimum recognition threshold a tax position must meet in connection with accounting for uncertainties in income tax positions taken or expected to be taken by an entity before being measured and recognized in the financial statements. Management has determined that the adoption of FIN 48 did not have a material impact on the Series’ financial statements. The Series files income tax returns in the U.S. federal jurisdiction, various states and foreign jurisdictions, as required. No income tax returns are currently under investigation. The statute of limitations on the Series’ tax returns remains open for the years ended December 31, 2005 through December 31, 2008.
Additionally, based on the Fund’s understanding of the tax rules and rates related to income, gains and transactions for foreign jurisdictions in which it invests, the Series will provide for foreign taxes, and where appropriate, deferred foreign tax.
Distributions of Income and Gains
Distributions to shareholders of net investment income and net realized gains are made annually. An additional distribution may be necessary to avoid taxation of the Series. Distributions are recorded on the ex-dividend date.
Indemnifications
The Fund’s organizational documents provide former and current directors and officers with a limited indemnification against liabilities arising in connection with the performance of their duties to the Fund. In the normal course of business, the Fund may also enter into contracts that
Notes to Financial Statements
| 2. | SIGNIFICANT ACCOUNTING POLICIES (continued) |
Indemnifications (continued)
provide general indemnifications. The Fund’s maximum exposure under these arrangements is unknown as this would be dependent on future claims that may be made against the Fund. The risk of material loss from such claims is considered remote.
Other
The preparation of financial statements in conformity with accounting principles generally accepted in the United States of America requires management to make estimates and assumptions that affect the reported amounts of assets and liabilities and the disclosure of contingent assets and liabilities at the date of the financial statements and the reported amounts of income and expenses during the reporting period. Actual results could differ from those estimates.
| 3. | TRANSACTIONS WITH AFFILIATES |
The Fund has an Investment Advisory Agreement (the “Agreement”) with the Advisor, for which the Series pays a fee, computed daily and payable monthly, at an annual rate of 1.00% of the Series’ average daily net assets.
Under the Agreement, personnel of the Advisor provide the Series with advice and assistance in the choice of investments and the execution of securities transactions, and otherwise maintain the Series’ organization. The Advisor also provides the Fund with necessary office space and fund administration and support services. The salaries of all officers of the Fund (except a percentage of the Fund’s Chief Compliance Officer’s salary, which is paid by the Fund), and of all Directors who are “affiliated persons” of the Fund, or of the Advisor, and all personnel of the Fund, or of the Advisor, performing services relating to research, statistical and investment activities, are paid by the Advisor. Each “non-affiliated” Director receives an annual stipend, which is allocated among all the active series of the Fund. In addition, these Directors also receive a fee per Board meeting attended for each active series of the Fund plus a fee for each committee meeting attended.
Manning & Napier Investor Services, Inc., a registered broker-dealer affiliate of the Advisor, acts as distributor for the Fund’s shares. The services of Manning & Napier Investor Services, Inc. are provided at no additional cost to the Series.
For fund accounting and transfer agent services, through October 31, 2008, the Fund paid the Advisor an annual fee of 0.11% of the Fund’s average daily net assets up to $900 million, 0.07% of the Fund’s average daily net assets between $900 million and $1.5 billion, and 0.04% of the Fund’s average daily net assets over $1.5 billion. Effective November 1, 2008, the fee rates are as follows: 0.055% of the Fund’s average daily net assets up to $4.5 billion, 0.03% of the Fund’s average daily net assets between $4.5 billion and $7.5 billion, and 0.02% of the Fund’s average daily net assets over $7.5 billion. Additionally, certain transaction and account-based fees and out-of-pocket expenses, including charges for reporting relating to the Fund’s compliance program, are charged. Expenses not directly attributable to a series are allocated based on each series’ relative net assets or number of accounts, depending on the expense. The Advisor has an agreement with Citi Fund Services Ohio, Inc. (“Citi”) under which Citi serves as sub-accountant and sub-transfer agent.
| 4. | PURCHASES AND SALES OF SECURITIES |
For the year ended December 31, 2008, purchases and sales of securities, other than United States Government securities and short-term securities, were $229,796,172 and $224,773,581, respectively. There were no purchases or sales of United States Government securities.
Notes to Financial Statements
| 5. | CAPITAL STOCK TRANSACTIONS |
Transactions in shares of Life Sciences Series were:
| | | | | | | | | | | | | | |
| | | For the Year
Ended 12/31/08 | | | For the Year
Ended 12/31/07 | |
| | | Shares | | | Amount | | | Shares | | | Amount | |
Sold | | 2,823,006 | | | $ | 26,015,765 | | | 4,659,826 | | | $ | 55,397,353 | |
Reinvested | | 282,518 | | | | 2,867,564 | | | 2,186,128 | | | | 24,561,918 | |
Repurchased | | (2,924,235 | ) | | | (25,771,607 | ) | | (1,306,611 | ) | | | (15,616,538 | ) |
| | | | | | | | | | | | | | |
Total | | 181,289 | | | $ | 3,111,722 | | | 5,539,343 | | | $ | 64,342,733 | |
| | | | | | | | | | | | | | |
Substantially all of the Series’ shares represent investments by fiduciary accounts over which the Advisor has sole investment discretion.
The Series may trade in financial instruments with off-balance sheet risk in the normal course of its investing activities to assist in managing exposure to various market risks. These financial instruments include written options, forward foreign currency exchange contracts and futures contracts and may involve, to a varying degree, elements of risk in excess of the amounts recognized for financial statement purposes. No such investments were held by the Series on December 31, 2008.
Investing in securities of foreign companies and foreign governments involves special risks and considerations not typically associated with investing in securities of domestic companies and the United States Government. These risks include revaluation of currencies and future adverse political and economic developments. Moreover, securities of foreign companies and foreign governments and their markets may be less liquid and their prices more volatile than those of comparable domestic companies and the United States Government.
| 8. | LIFE SCIENCES SECURITIES |
The Series may focus its investments in certain related life sciences industries; hence, the Series may subject itself to a greater degree of risk than a series that is more diversified.
| 9. | FEDERAL INCOME TAX INFORMATION |
The amount and characterization of certain income and capital gains to be distributed are determined in accordance with federal income tax regulations, which may differ from accounting principles generally accepted in the United States of America. These differences are primarily due to differing book and tax treatments in the timing of the recognition of net investment income or gains and losses, including net operating losses, foreign currency gains and losses, losses deferred due to wash sales and Post-October losses. The Series may periodically make reclassifications among its capital accounts to reflect income and gains available for distribution (or available capital loss carryovers) under income tax regulations, without impacting the Series’ net asset value. Any such reclassifications are not reflected in the financial highlights.
The tax character of distributions paid were as follows:
| | | | | | |
| | | For the Year
Ended 12/31/08 | | For the Year
Ended 12/31/07 |
Ordinary income | | $ | 1,967,508 | | $ | 10,394,257 |
Long-term capital gains | | | 927,125 | | | 14,428,927 |
Notes to Financial Statements
| 9. | FEDERAL INCOME TAX INFORMATION (continued) |
For the year ended December 31, 2008, the Series elected to defer $1,660,341 of capital losses attributable to Post-October losses.
At December 31, 2008, the tax basis components of distributable earnings and the net unrealized depreciation based on identified cost for federal income tax purposes were as follows:
| | | | |
Cost for federal income tax purposes | | $ | 251,869,170 | |
Unrealized appreciation | | $ | 6,009,787 | |
Unrealized depreciation | | | (74,329,298 | ) |
| | | | |
Net unrealized depreciation | | $ | (68,319,511 | ) |
Capital loss carryover | | | 33,158,704 | |
The capital loss carryover, disclosed above, available to the extent allowed by tax law to offset future net capital gain, if any, will expire on December 31, 2016.
| 10. | RECENT ACCOUNTING PRONOUNCEMENTS |
In September 2008, FASB Staff Position No. FAS 133-1 and FIN 45-4, “Disclosures about Credit Derivatives and Certain Guarantees: An Amendment of FASB Statement No. 133 and FASB Interpretation No. 45” (the “Position”) was issued and is effective for fiscal years and interim periods beginning after November 15, 2008. The Position amends FASB Statement No. 133 (“FAS 133”), Accounting for Derivative Instruments and Hedging Activities, and also amends FASB Interpretation No. 45 (“FIN 45”), Guarantor’s Accounting and Disclosure Requirements for Guarantees, Including Indirect Guarantees of Indebtedness of Others. The amendments to FAS 133 include required disclosure for (i) the nature and terms of the credit derivative, reasons for entering into the credit derivative, the events or circumstances that would require the seller to perform under the credit derivative, and the current status of the payment performance risk of the credit derivative, (ii) the maximum potential amount of future payments (undiscounted) the seller could be required to make under the credit derivative, (iii) the fair value of the credit derivative, and (iv) the nature of any recourse provisions and assets held either as collateral or by third parties. The amendments to FIN 45 require additional disclosures about the current status of the payment/performance risk of a guarantee. At this time, Management is evaluating the implications of FAS 133-1 and FIN 45-4, but they are not expected to materially impact the Series’ financial statements.
In March 2008, FASB Statement of Financial Accounting Standards No. 161, Disclosures about Derivative Instruments and Hedging Activities (“FAS 161”) was issued and is effective for fiscal years and interim periods beginning after November 15, 2008. FAS 161 requires enhanced disclosures about the Series’ derivative and hedging activities, including how such activities are accounted for and their effect on the Series’ financial position and performance. Management is currently evaluating the impact of the adoption of FAS 161, but it is not expected to materially impact the Series’ financial statements.
Report of Independent Registered Public Accounting Firm
To the Board of Directors of Manning & Napier Fund, Inc. and Shareholders of Life Sciences Series:
In our opinion, the accompanying statement of assets and liabilities, including the investment portfolio, and the related statements of operations and of changes in net assets and the financial highlights present fairly, in all material respects, the financial position of the Life Sciences Series (a series of Manning & Napier Fund, Inc., hereafter referred to as the “Series”) at December 31, 2008, and the results of its operations for the year then ended, the changes in its net assets for each of the two years in the period then ended and the financial highlights for each of the five years in the period then ended, in conformity with accounting principles generally accepted in the United States of America. These financial statements and financial highlights (hereafter referred to as “financial statements”) are the responsibility of the Series’ management; our responsibility is to express an opinion on these financial statements based on our audits. We conducted our audits of these financial statements in accordance with the standards of the Public Company Accounting Oversight Board (United States). Those standards require that we plan and perform the audit to obtain reasonable assurance about whether the financial statements are free of material misstatement. An audit includes examining, on a test basis, evidence supporting the amounts and disclosures in the financial statements, assessing the accounting principles used and significant estimates made by management, and evaluating the overall financial statement presentation. We believe that our audits, which included confirmation of securities at December 31, 2008 by correspondence with the custodian and brokers, provide a reasonable basis for our opinion.

Columbus, Ohio
February 13, 2009
Supplemental Tax Information (unaudited)
For federal income tax purposes, the Series designates for the current fiscal year $74,746 or, if different, the maximum amount allowable under the tax law as qualified dividend income.
Pursuant to Section 852 of the Internal Revenue Code, as amended, the Series hereby designates $927,125 as capital gains for its taxable year ended December 31, 2008.
Renewal of Investment Advisory Agreement (unaudited)
At the Manning & Napier Fund, Inc. (the “Fund”) Board of Directors’ (the “Board”) meeting, held on November 5, 2008, the Investment Advisory Agreement (the “Agreement”) between the Fund and Manning & Napier Advisors, Inc. (the “Advisor”) was reviewed by the Board for renewal. In connection with the decision whether to renew the Agreement, a variety of material was prepared for and reviewed by the Board.
Representatives of the Advisor attended the meeting and presented additional oral and written information to the Board to assist the Board in its considerations. The discussion immediately below outlines the materials and information presented to the Board in connection with the Board’s 2008 Annual Review of the Agreement and the conclusions made by the Directors when determining to continue the Agreement.
| | • | | The Board considered the services provided by the Advisor under the Agreement including, among others: deciding what securities to purchase and sell for each Series; arranging for the purchase and sale of such securities by placing orders with broker-dealers; administering the affairs of the Fund (including the books and records of the Fund not maintained by third party service providers such as the custodian or sub-transfer agent); arranging for the insurance coverage for the Fund; and supervising the preparation of tax returns, SEC filings (including registration statements) and reports to shareholders for the Fund. The Board also considered the nature and quality of such services provided under the Agreement in light of the Advisor’s services provided to the Fund for 22 years. The Board discussed the quality of these services with representatives from the Advisor and concluded that the Advisor was performing its services to the Fund required under the Agreement in a reasonable manner. |
| | • | | The Board considered the investment performance of the various Series of the Fund. The investment performance for each Series was reviewed on a cumulative basis since inception and on a one year basis. In addition, annualized performance for the following time periods was considered: inception, three year, five year, ten year, and current market cycle. A market cycle includes periods of both rising and falling markets. Returns for established benchmark indices for each Series were provided for each time period. The Board noted that the various Series were competitive against their respective benchmarks and/or peer groups over various time periods, but in particular over the full market cycle period relevant for the Series. In addition, the Board considered at the meeting (and considers on a quarterly basis) a peer group performance analysis consisting of Morningstar universes of mutual funds with similar investment objectives. The Board discussed the performance with representatives from the Advisor and concluded that the investment performance of each of the Fund’s Series was reasonable based on the Fund’s actual performance and comparative performance, especially performance over the current market cycle. |
| | • | | The Board considered the costs of the Advisor’s services and the profits of the Advisor as they relate to the Advisor’s services to the Fund under the Agreement. In reviewing the Advisor’s costs and profits, the Board discussed the Advisor’s revenues generated from the Fund (on both an actual and adjusted basis) and its expenses associated with providing the services under the Agreement. In addition, the Board reviewed the Advisor’s expenses associated with Fund activities outside of the Agreement (such as expense reimbursements pursuant to expense caps and payments made by the Advisor to third party platforms on which shares of the Fund are available for purchase). It was |
Renewal of Investment Advisory Agreement (unaudited)
| | noted by representatives of the Advisor that 15 of the 25 active Series of the Fund are currently experiencing expenses above the capped expense ratios. After discussing the above costs and profits, the Board concluded that the Advisor’s profitability relating to its services provided under the Agreement was reasonable. |
| | • | | The Board considered the fees and expenses of the various Series of the Fund. The Advisor presented the advisory fees and total expenses for each Series, including the advisory fee adjusted for any expense waivers or reimbursements (either contractual or voluntary) paid by the Advisor. The advisory fees and expense ratios of each Series were compared to an average (on both a mean and median basis) of similar funds as disclosed on the Morningstar database. Representatives of the Advisor discussed with the Board the levels of its advisory fee for each Series of the Fund and as compared to the median and mean advisory fees for similar funds as listed on Morningstar. Expense ratios for every Series, except the High Yield Bond Series, and Global Fixed Income Series and the Target Series Class R and Class C, are currently below the median and mean for similar funds as listed on Morningstar. Based on their review of the information provided, the Board concluded that the fees and expenses of each Series of the Fund were reasonable on a comparative basis. |
| | • | | The Board also considered the other benefits the Advisor derives from its relationship with the Fund. Such other benefits include certain research products provided by soft dollars. Given the level of soft dollar transactions involving the Fund, the Board concluded that these additional benefits to the Advisor were reasonable. |
| | • | | In addition to the factors described above, the Board considered the Advisor’s personnel, investment strategies, policies and procedures relating to compliance with personal securities transactions, and reputation, expertise and resources in domestic and foreign financial markets. The Board concluded that these factors support the conclusion that the Advisor performs its services in a reasonable manner. |
| | • | | The Board did not consider economies of scale at this time because of the multiple uses of the Fund (for the Advisor’s discretionary investment account clients in addition to direct investors), the current profitability of the Advisor’s services to the Fund under the Agreement, and the overall size of the Fund complex. |
Based on the Board’s deliberations and their evaluation of the information described above, the Board, including a majority of Directors that are not “interested persons” as defined in the Investment Company Act of 1940, concluded that the compensation under the Agreement was fair and reasonable in light of the services and expenses and such other matters as the Directors considered to be relevant in the exercise of their reasonable judgment. Accordingly, the Board approved the renewal of the Agreement. In the course of their deliberations, the Directors did not identify any particular information that was all important or controlling.
Directors’ and Officers’ Information (unaudited)
The Statement of Additional Information provides additional information about the Fund’s directors and officers and can be obtained without charge by calling 1-800-466-3863, at www.manningnapieradvisors.com, or on the EDGAR Database on the SEC Internet web site (http://www.sec.gov). The following chart shows certain information about the Fund’s officers and directors, including their principal occupations during the last five years. Unless specific dates are provided, the individuals have held the listed positions for longer than five years.
INTERESTED DIRECTOR/OFFICER
| | |
| Name: | | B. Reuben Auspitz* |
| Address: | | 290 Woodcliff Drive Fairport, NY 14450 |
| Age: | | 61 |
| Current Position(s) Held with Fund: | | Principal Executive Officer, President, Chairman & Director |
| Term of Office1 & Length of Time Served: | | Indefinite - Director since 1984; Vice President 1984 - 2003; President since 2004; Principal Executive Officer since 2002 |
| Principal Occupation(s) During Past 5 Years: | | Executive Vice President; Co-Executive Director; Executive Group Member**; Chief Compliance Officer since 2004 - Manning & Napier Advisors, Inc. President; Director - Manning & Napier Investor Services, Inc. Holds or has held one or more of the following titles for various subsidiaries and affiliates: President, Vice President, Director, Chairman, Treasurer, Chief Compliance Officer or Member. |
| Number of Portfolios Overseen within Fund Complex: | | 28 |
| Other Directorships Held Outside Fund Complex: | | N/A |
| |
| INDEPENDENT DIRECTORS | | |
| |
| Name: | | Stephen B. Ashley |
| Address: | | 290 Woodcliff Drive Fairport, NY 14450 |
| Age: | | 68 |
| Current Position(s) Held with Fund: | | Director, Audit Committee Member, Governance & Nominating Committee Member |
| Term of Office & Length of Time Served: | | Indefinite - Since 1996 |
| Principal Occupation(s) During Past 5 Years: | | Chairman, Director, President & Chief Executive Officer, The Ashley Group (property management and investment). Chairman (non-executive) 2004-2008; Director 1995-2008 - Fannie Mae (mortgage) |
| Number of Portfolios Overseen within Fund Complex: | | 28 |
| Other Directorships Held Outside Fund Complex: | | The Ashley Group |
| Name: | | Peter L. Faber |
| Address: | | 290 Woodcliff Drive Fairport, NY 14450 |
| Age: | | 70 |
| Current Position(s) Held with Fund: | | Director, Governance & Nominating Committee Member |
| Term of Office & Length of Time Served: | | Indefinite - Since 1987 |
| Principal Occupation(s) During Past 5 Years: | | Senior Counsel, McDermott, Will & Emery LLP (law firm) |
| Number of Portfolios Overseen within Fund Complex: | | 28 |
| Other Directorships Held Outside Fund Complex: | | Partnership for New York City, Inc. New York Collegium Boston Early Music Festival |
| Name: | | Harris H. Rusitzky |
| Address: | | 290 Woodcliff Drive Fairport, NY 14450 |
| Age: | | 73 |
| Current Position(s) Held with Fund: | | Director, Audit Committee Member, Governance & Nominating Committee Member |
| Term of Office & Length of Time Served: | | Indefinite - Since 1985 |
| Principal Occupation(s) During Past 5 Years: | | President, The Greening Group (business consultants); Partner, The Restaurant Group (restaurants) |
| Number of Portfolios Overseen within Fund Complex: | | 28 |
| Other Directorships Held Outside Fund Complex: | | N/A |
Directors’ and Officers’ Information (unaudited)
| | |
| INDEPENDENT DIRECTORS (continued) | | |
| Name: | | Paul A. Brooke |
| Address: | | 290 Woodcliff Drive Fairport, NY 14450 |
| Age: | | 63 |
| Current Position(s) Held with Fund: | | Director, Audit Committee Member, Governance & Nominating Committee Member |
| Term of Office & Length of Time Served: | | Indefinite - Since 2007 |
| Principal Occupation(s) During Past 5 Years: | | Chairman & CEO, Alsius Corp. (investments); Managing Member, PMSV Holdings LLC (investments) |
| Number of Portfolios Overseen within Fund Complex: | | 28 |
| Other Directorships Held Outside Fund Complex: | | Incyte Corp. ViroPharma, Inc. HLTH Corp. Cheyne Captial International MPM Bio-equities GMP Companies HoustonPharma |
OFFICERS
| | |
| |
| Name: | | Jeffrey S. Coons, Ph.D., CFA |
| Address: | | 290 Woodcliff Drive Fairport, NY 14450 |
| Age: | | 45 |
| Current Position(s) Held with Fund: | | Vice President |
| Term of Office1 & Length of Time Served: | | Since 2004 |
| Principal Occupation(s) During Past 5 Years: | | Co-Director of Research since 2002 & Executive Group Member**, Manning & Napier Advisors, Inc. Holds one or more of the following titles for various subsidiaries and affiliates: President, Director, Treasurer or Senior Trust Officer. |
| Number of Portfolios Overseen within Fund Complex: | | 28 |
| Other Directorships Held Outside Fund Complex: | | N/A |
| Name: | | Christine Glavin |
| Address: | | 290 Woodcliff Drive Fairport, NY 14450 |
| Age: | | 42 |
| Current Position(s) Held with Fund: | | Principal Financial Officer, Chief Financial Officer |
| Term of Office1 & Length of Time Served: | | Principal Financial Officer since 2002; Chief Financial Officer since 2001 |
| Principal Occupation(s) During Past 5 Years: | | Fund Reporting Manager, Manning & Napier Advisors, Inc. |
| Number of Portfolios Overseen within Fund Complex: | | 28 |
| Other Directorships Held Outside Fund Complex: | | N/A |
| Name: | | Jodi L. Hedberg |
| Address: | | 290 Woodcliff Drive Fairport, NY 14450 |
| Age: | | 41 |
| Current Position(s) Held with Fund: | | Corporate Secretary, Chief Compliance Officer, Anti-Money Laundering Compliance Officer |
| Term of Office1 & Length of Time Served: | | Corporate Secretary since 1997; Chief Compliance Officer since 2004 |
| Principal Occupation(s) During Past 5 Years: | | Director of Compliance, Manning & Napier Advisors, Inc. and affiliates; Corporate Secretary, Manning & Napier Investor Services, Inc. since 2006 |
| Number of Portfolios Overseen within Fund Complex: | | 28 |
| Other Directorships Held Outside Fund Complex: | | N/A |
*Interested Director, within the meaning of the Investment Company Act of 1940 by reason of his position with the Fund’s investment advisor and distributor. Mr. Auspitz serves as the Executive Vice President and Director, Manning & Napier Advisors, Inc. and President and Director, Manning & Napier Investor Services, Inc., the Fund’s distributor.
**The Executive Group performs the duties of the Office of the Chief Executive of Manning & Napier Advisors, Inc.
1The term of office for President, Vice President, Chief Financial Officer, and Corporate Secretary is one year and until their respective successors are chosen and qualified. All other officers’ terms are indefinite.
(THISPAGEINTENTIONALLYLEFTBLANK)
Literature Requests (unaudited)
Proxy Voting Policies and Procedures
A description of the policies and procedures that the Fund uses to determine how to vote proxies relating to portfolio securities is available, without charge, upon request:
| | |
By phone | | 1-800-466-3863 |
On the Securities and Exchange Commission’s (SEC) web site | | http://www.sec.gov |
Proxy Voting Record
Information regarding how the Fund voted proxies relating to portfolio securities during the most recent 12-month period ended June 30th is available, without charge, upon request:
| | |
By phone | | 1-800-466-3863 |
On the SEC’s web site | | http://www.sec.gov |
Quarterly Portfolio Holdings
The Series’ complete schedule of portfolio holdings for the 1st and 3rd quarters of each fiscal year are provided on Form N-Q, and are available, without charge, upon request:
| | |
By phone | | 1-800-466-3863 |
On the SEC’s web site | | http://www.sec.gov |
The Series’ Form N-Q may be reviewed and copied at the SEC’s Public Reference Room in Washington, D.C. Information on the operation of the Public Reference Room may be obtained by calling 1-800-SEC-0330.
Prospectus and Statement of Additional Information (SAI)
The prospectus and SAI provide additional information about each Series, including charges, expenses and risks. These documents are available, without charge, upon request:
| | |
By phone | | 1-800-466-3863 |
On the SEC’s web site | | http://www.sec.gov |
On the Advisor’s web site | | http://www.manningnapieradvisors.com |
Additional information available at www.manningnapieradvisors.com
1. Fund Holdings - Month-End
2. Fund Holdings - Quarter-End
3. Shareholder Report - Annual
4. Shareholder Report - Semi-Annual
Manning & Napier Fund, Inc.
| | | | |
| FINANCIAL SERVICES SERIES | | | | | Annual Report - December 31, 2008 |

Management Discussion and Analysis (unaudited)
Dear Shareholders:
The Financial Services Series closed its third full calendar year ahead of the Standard & Poor’s (S&P) 500 Financials Index, but it trailed the broader S&P 500 Total Return Index as losses from the housing sector continued to mount throughout the year. These declines led to the worst global financial crisis since the Great Depression. The Financial Services Series ended 2008 with a total return of -42.98% compared to -55.24% for the S&P 500 Financials Index and -36.99% for the S&P 500 Total Return Index.
Performance across the Financials sector was weak for the duration of 2008, although it took a dramatic turn downward during the 3rd to 4th quarter transition. The bad news relating to housing and subsequent negative asset value revisions eroded capital positions among financial institutions to levels so thin that virtually all forms of lending disappeared. To get a sense of the level of despair, one does not need to look further than the historic failures of investment banking giants Lehman Brothers and Bear Stearns. Former peer Merrill Lynch also succumbed to the environment and was absorbed by Bank of America. Similarly, banking giants Washington Mutual and Wachovia, among others, were forced into the arms of reluctant buyers that were only made willing with federal assistance. In the fourth quarter the National Bureau of Economic Research (NBER) officially announced that the U.S. was in a recession and had been since December of 2007. For many, this was simply confirmation of the obvious, but nonetheless the news has weighed on consumer and investor confidence.
The performance of the Series held up better than that of the S&P 500 Financials Index due to a combination of our sector weightings and our selection of stocks within each sector. Among positive catalysts were our comparatively small positions in investment banks and brokers, the weakest performing subsector within Financials during 2008. This is no surprise given the failures noted above. The Series also benefited from an underweight position relative to the Index in diversified financial services companies, like Citigroup, that lost ground in 2008 owing to large mortgage-related exposures and insufficient capital. Another bright spot in the Series’ subsector allocations was the data processing and outsourced services subsector, which posted the best returns of any within Financials during 2008, though this area still lost about a third of its value over the past 12 months.
Our current outlook as it pertains to specific industry weightings has changed notably from where we stood at the end of 2007. Owing to the historic nature of this financial crisis and the exorbitant losses that have been logged to date, we note the importance of proper positioning as we move forward into a recovery. We have taken proactive steps to invest in what we believe are the strongest companies within industries that typically follow the overall economic cycle. While banking remains our largest holding, we now have smaller positions than the benchmark in this category and have employed a more distinct focus in making banking investments. Here, our efforts are centered on owning companies with strong capital cushions and industry-leading credit quality. Given that many players have exited the industry and among those that remain, capital is so scarce it limits their ability to generate new loans, we have sought to identify the strongest players, which have a unique opportunity to gain market share through the trough and emerge stronger on the other side.
We have also begun to increase our holdings in the asset management sector. 2008 saw record outflows of money from equity products as markets faltered and investors grew increasingly risk averse. As we often do in out of favor sectors, we have added to holdings as valuations became increasingly attractive.
In similar fashion to the cyclical drivers of our asset management investments, we have also increased our allocation to consumer finance companies. To date, our investments are focused on what we perceive to be the strongest players as our analysis shows that they are the most well equipped to endure the declines in spending we have seen.
Management Discussion and Analysis (unaudited)
While 2008 was a difficult year for investors, we recognize that our job is to remain focused on company-specific fundamentals. In a year where emotion - a crisis of confidence - was a strong driver of returns no matter the market, we are not surprised that our fundamentals-based approach produced disappointing returns. However, looking back over our 38-year history, this approach has served our clients well over the long-term.
As always, we appreciate your business.
Sincerely,
Manning & Napier Advisors, Inc.
Performance Update as of December 31, 2008 (unaudited)
| | | | | | |
| | | Average Annual Total Returns
As of December 31, 2008 | | |
| | | One
Year | | Since
Inception1 | | |
Manning & Napier Fund, Inc. - Financial Services Series2 | | -42.98% | | -13.38% | | |
Standard & Poor’s (S&P) 500 Total Return Index3 | | -36.99% | | -5.70% | | |
Standard & Poor’s (S&P) 500 Financials Index3 | | -55.24% | | -19.21% | | |
The following graph compares the value of a $10,000 investment in the Manning & Napier Fund, Inc. - Financial Services Series from its inception1 (7/1/05) to present (12/31/08) to the S&P 500 Total Return Index and the S&P 500 Financials Index.
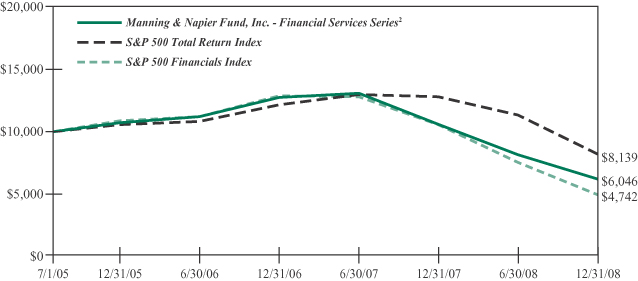
1Performance numbers for the Series and Indices are calculated from July 1, 2005, the Series’ inception date.
2The Series’ performance does not reflect the deduction of taxes that a shareholder would pay on fund distributions or the redemption of shares. The Series’ performance is historical and may not be indicative of future results. The performance returns shown are inclusive of the net expense ratio of the Series. For the year ended December 31, 2008, this net expense ratio was 1.12%. The gross expense ratio, which does not account for any voluntary or contractual waivers currently in effect, was 1.12% for the year ended December 31, 2008.
3The S&P 500 Total Return Index is an unmanaged capitalization-weighted measure of 500 widely held common stocks listed on the New York Stock Exchange, American Stock Exchange and the Over-the-Counter market. The S&P 500 Financials Index, a sub-index of the S&P 500 Total Return Index, includes the stocks of companies involved in the business of financial related products and services. Both Indices’ returns assume daily reinvestment of dividends and, unlike Series returns, do not reflect any fees or expenses.
Shareholder Expense Example (unaudited)
As a shareholder of the Series, you may incur two types of costs: (1) transaction costs, including potential wire charges on redemptions and (2) ongoing costs, including management fees and other Series expenses. This example is intended to help you understand your ongoing costs (in dollars) of investing in the Series and to compare these costs with the ongoing costs of investing in other mutual funds.
The example is based on an investment of $1,000 invested at the beginning of the period and held for the entire period (July 1, 2008 to December 31, 2008).
Actual Expenses
The first line of the table below provides information about actual account values and actual expenses. You may use the information in this line, together with the amount you invested, to estimate the expenses that you paid over the period. Simply divide your account value by $1,000 (for example, an $8,600 account value divided by $1,000 = 8.6), then multiply the result by the number in the first line under the heading entitled “Expenses Paid During Period” to estimate the expenses you paid on your account during this period.
Hypothetical Example for Comparison Purposes
The second line of the table below provides information about hypothetical account values and hypothetical expenses based on the Series’ actual expense ratio and an assumed rate of return of 5% per year before expenses, which is not the Series’ actual return. The hypothetical account values and expenses may not be used to estimate the actual ending account balance or expenses you paid during the period. You may use this information to compare the ongoing costs of investing in the Series and other funds. To do so, compare this 5% hypothetical example with the 5% hypothetical examples that appear in the shareholder reports of the other funds.
Please note that the expenses shown in the table are meant to highlight your ongoing costs only and do not reflect any transaction costs, such as potential wire charges on redemptions. Therefore, the second line of the table is useful in comparing ongoing costs only, and will not help you determine the relative total costs of owning different funds. In addition, if these transaction costs were included, your costs would have been higher.
| | | | | | | | | |
| | | Beginning
Account Value
7/1/08 | | Ending
Account Value
12/31/08 | | Expenses Paid
During Period*
7/1/08-12/31/08 |
Actual | | $ | 1,000.00 | | $ | 749.10 | | $ | 4.97 |
Hypothetical
(5% return before expenses) | | $ | 1,000.00 | | $ | 1,019.46 | | $ | 5.74 |
*Expenses are equal to the Series’ annualized expense ratio (for the six-month period) of 1.13%, multiplied by the average account value over the period, multiplied by 184/366 (to reflect the one-half year period). Expenses are based on the most recent fiscal half year; therefore, the expense ratio stated above may differ from the expense ratio stated in the financial highlights, which is based on one year data.
Portfolio Composition as of December 31, 2008 (unaudited)
Sector Allocation1
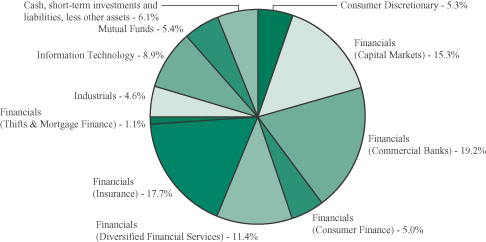
1As a percentage of net assets.
Top Ten Stock Holdings2
| | | | | | |
U.S. Bancorp | | 5.3% | | Automatic Data Processing, Inc. | | 4.2% |
PNC Financial Services Group, Inc. | | 5.1% | | HSBC Holdings plc - ADR (United Kingdom) | | 3.6% |
The Progressive Corp. | | 5.0% | | Jackson Hewitt Tax Service, Inc. | | 3.6% |
JPMorgan Chase & Co. | | 4.9% | | Willis Group Holdings Ltd. (United Kingdom) | | 3.4% |
SEI Investments Co. | | 4.4% | | Moody’s Corp. | | 3.4% |
2As a percentage of total investments.
Investment Portfolio - December 31, 2008
| | | | | |
| | | Shares | | Value
(Note 2) |
| | | | | |
| | |
COMMON STOCKS - 88.5% | | | | | |
| | |
Consumer Discretionary - 5.3% | | | | | |
Diversified Consumer Services - 3.7% | | | | | |
Jackson Hewitt Tax Service, Inc. | | 302,000 | | $ | 4,738,380 |
| | | | | |
Media - 1.6% | | | | | |
The McGraw-Hill Companies, Inc. | | 90,000 | | | 2,087,100 |
| | | | | |
Total Consumer Discretionary | | | | | 6,825,480 |
| | | | | |
Financials - 69.7% | | | | | |
Capital Markets - 15.3% | | | | | |
Bank of New York Mellon Corp.1 | | 88,000 | | | 2,493,040 |
The Charles Schwab Corp. | | 167,000 | | | 2,700,390 |
Federated Investors, Inc. | | 134,000 | | | 2,272,640 |
Franklin Resources, Inc. | | 40,000 | | | 2,551,200 |
Janus Capital Group, Inc. | | 357,000 | | | 2,866,710 |
SEI Investments Co. | | 368,000 | | | 5,781,280 |
T. Rowe Price Group, Inc. | | 32,000 | | | 1,134,080 |
| | | | | |
| | | | | 19,799,340 |
| | | | | |
Commercial Banks - 19.2% | | | | | |
The Bancorp, Inc.* | | 149,930 | | | 562,238 |
HSBC Holdings plc - ADR (United Kingdom) (Note 7) | | 98,000 | | | 4,769,660 |
PNC Financial Services Group, Inc. | | 135,500 | | | 6,639,500 |
Societe Generale - ADR (France) (Note 7) | | 155,100 | | | 1,613,040 |
TCF Financial Corp. | | 92,000 | | | 1,256,720 |
U.S. Bancorp | | 276,600 | | | 6,917,766 |
Webster Financial Corp. | | 103,600 | | | 1,427,608 |
Wilmington Trust Corp. | | 72,300 | | | 1,607,952 |
| | | | | |
| | | | | 24,794,484 |
| | | | | |
Consumer Finance - 5.0% | | | | | |
American Express Co. | | 181,900 | | | 3,374,245 |
Capital One Financial Corp. | | 95,200 | | | 3,035,928 |
| | | | | |
| | | | | 6,410,173 |
| | | | | |
Diversified Financial Services - 11.4% | | | | | |
Bank of America Corp. | | 211,000 | | | 2,970,880 |
Financiere Marc de Lacharriere S.A. (Fimalac) (France) (Note 7) | | 32,400 | | | 1,008,729 |
JPMorgan Chase & Co. | | 201,700 | | | 6,359,601 |
Moody’s Corp. | | 220,000 | | | 4,419,800 |
| | | | | |
| | | | | 14,759,010 |
| | | | | |
Insurance - 17.7% | | | | | |
Allianz SE (Germany) (Note 7) | | 34,500 | | | 3,591,552 |
| | |
| 6 | | The accompanying notes are an integral part of the financial statements. |
Investment Portfolio - December 31, 2008
| | | | | | |
| | | Shares/ Principal Amount | | Value
(Note 2) |
| | | | | | |
| | |
COMMON STOCKS (continued) | | | | | | |
| | |
Financials (continued) | | | | | | |
Insurance (continued) | | | | | | |
Brown & Brown, Inc. | | | 124,000 | | $ | 2,591,600 |
First American Corp. | | | 91,500 | | | 2,643,435 |
The Progressive Corp. | | | 444,800 | | | 6,587,488 |
Torchmark Corp. | | | 68,500 | | | 3,061,950 |
Willis Group Holdings Ltd. (United Kingdom) (Note 7) | | | 178,000 | | | 4,428,640 |
| | | | | | |
| | | | | | 22,904,665 |
| | | | | | |
Thrifts & Mortgage Finance - 1.1% | | | | | | |
First Niagara Financial Group, Inc. | | | 91,800 | | | 1,484,406 |
| | | | | | |
Total Financials | | | | | | 90,152,078 |
| | | | | | |
Industrials - 4.6% | | | | | | |
Professional Services - 4.6% | | | | | | |
Equifax, Inc. | | | 99,000 | | | 2,625,480 |
Experian plc (Ireland) (Note 7) | | | 540,000 | | | 3,353,169 |
| | | | | | |
Total Industrials | | | | | | 5,978,649 |
| | | | | | |
Information Technology - 8.9% | | | | | | |
IT Services - 8.9% | | | | | | |
Automatic Data Processing, Inc. | | | 139,550 | | | 5,489,897 |
Online Resources Corp.* | | | 614,000 | | | 2,910,360 |
Paychex, Inc. | | | 121,000 | | | 3,179,880 |
| | | | | | |
Total Information Technology | | | | | | 11,580,137 |
| | | | | | |
TOTAL COMMON STOCKS
(Identified Cost $170,683,800) | | | | | | 114,536,344 |
| | | | | | |
| | |
MUTUAL FUNDS - 5.4% | | | | | | |
Financial Select Sector SPDR Fund | | | 446,000 | | | 5,628,520 |
iShares S&P U.S. Preferred Stock Index Fund | | | 46,700 | | | 1,364,107 |
| | | | | | |
TOTAL MUTUAL FUNDS
(Identified Cost $6,870,308) | | | | | | 6,992,627 |
| | | | | | |
| | |
SHORT-TERM INVESTMENTS - 7.2% | | | | | | |
Dreyfus Cash Management, Inc. - Institutional Shares | | | 4,245,082 | | | 4,245,082 |
Fannie Mae Discount Note, 3/3/2009 | | $ | 2,000,000 | | | 1,999,766 |
Federal Home Loan Bank Discount Note, 1/5/2009 | | | 3,000,000 | | | 2,999,836 |
| | | | | | |
TOTAL SHORT-TERM INVESTMENTS
(Identified Cost $9,244,193) | | | | | | 9,244,684 |
| | | | | | |
| | |
| The accompanying notes are an integral part of the financial statements. | | 7 |
Investment Portfolio - December 31, 2008
| | | | | | |
| | | | | Value
(Note 2) | |
| | | | | | |
| | |
TOTAL INVESTMENTS - 101.1%
(Identified Cost $186,798,301) | | | | $ | 130,773,655 | |
LIABILITIES, LESS OTHER ASSETS - (1.1%) | | | | | (1,404,378 | ) |
| | | | | | |
NET ASSETS - 100% | | | | $ | 129,369,277 | |
| | | | | | |
*Non-income producing security
ADR - American Depository Receipt
1Bank of New York Mellon Corp. is the Fund’s custodian.
| | |
| 8 | | The accompanying notes are an integral part of the financial statements. |
Statement of Assets and Liabilities
December 31, 2008
| | | | |
ASSETS: | | | | |
| | | | |
| |
Investments, at value (identified cost $186,798,301) (Note 2) | | $ | 130,773,655 | |
Foreign currency (cost $2) | | | 2 | |
Dividends receivable | | | 562,866 | |
Receivable for securities sold | | | 344,148 | |
Receivable for fund shares sold | | | 55,854 | |
Foreign tax reclaims receivable | | | 10,026 | |
| | | | |
TOTAL ASSETS | | | 131,746,551 | |
| | | | |
| LIABILITIES: | | | | |
| |
Accrued management fees (Note 3) | | | 107,145 | |
Accrued fund accounting and transfer agent fees (Note 3) | | | 7,968 | |
Accrued Chief Compliance Officer service fees (Note 3) | | | 486 | |
Payable for securities purchased | | | 1,891,313 | |
Payable for fund shares repurchased | | | 330,018 | |
Audit fees payable | | | 31,309 | |
Other payables and accrued expenses | | | 9,035 | |
| | | | |
TOTAL LIABILITIES | | | 2,377,274 | |
| | | | |
TOTAL NET ASSETS | | $ | 129,369,277 | |
| | | | |
NET ASSETS CONSIST OF: | | | | |
| |
Capital stock | | $ | 251,886 | |
Additional paid-in-capital | | | 253,075,752 | |
Undistributed net investment income | | | 146,921 | |
Accumulated net realized loss on investments, foreign currency and other assets and liabilities | | | (68,079,330 | ) |
Net unrealized depreciation on investments, foreign currency and other assets and liabilities | | | (56,025,952 | ) |
| | | | |
TOTAL NET ASSETS | | $ | 129,369,277 | |
| | | | |
NET ASSET VALUE, OFFERING PRICE AND REDEMPTION PRICE PER SHARE ($129,369,277/25,188,616 shares) | | $ | 5.14 | |
| | | | |
| | |
| The accompanying notes are an integral part of the financial statements. | | 9 |
Statement of Operations
For the Year Ended December 31, 2008
| | | | |
INVESTMENT INCOME: | | | | |
| | | | |
| |
Dividends (net of foreign tax withheld, $43,300) | | $ | 6,188,014 | |
Interest | | | 150,480 | |
| | | | |
Total Investment Income | | | 6,338,494 | |
| | | | |
| EXPENSES: | | | | |
| |
Management fees (Note 3) | | | 1,835,962 | |
Fund accounting and transfer agent fees (Note 3) | | | 119,686 | |
Directors’ fees (Note 3) | | | 12,600 | |
Chief Compliance Officer service fees (Note 3) | | | 4,301 | |
Custodian fees | | | 13,100 | |
Miscellaneous | | | 70,571 | |
| | | | |
Total Expenses | | | 2,056,220 | |
| | | | |
NET INVESTMENT INCOME | | | 4,282,274 | |
| | | | |
| REALIZED AND UNREALIZED LOSS ON INVESTMENTS: | | | | |
| |
Net realized loss on - | | | | |
Investments | | | (65,995,744 | ) |
Foreign currency and other assets and liabilities | | | (10,295 | ) |
| | | | |
| | | (66,006,039 | ) |
| | | | |
| |
Net change in unrealized depreciation on - | | | | |
Investments | | | (36,956,440 | ) |
Foreign currency and other assets and liabilities | | | (1,753 | ) |
| | | | |
| | | (36,958,193 | ) |
| | | | |
| |
NET REALIZED AND UNREALIZED LOSS ON
INVESTMENTS | | | (102,964,232 | ) |
| | | | |
NET DECREASE IN NET ASSETS RESULTING FROM OPERATIONS | | $ | (98,681,958 | ) |
| | | | |
| | |
| 10 | | The accompanying notes are an integral part of the financial statements. |
Statements of Changes in Net Assets
| | | | | | | | |
| | | For the
Year Ended
12/31/08 | | | For the
Year Ended
12/31/07 | |
| | | | | | | | |
| INCREASE (DECREASE) IN NET ASSETS: | | | | | | | | |
| | |
| OPERATIONS: | | | | | | | | |
| | |
Net investment income | | $ | 4,282,274 | | | $ | 2,457,390 | |
Net realized gain (loss) on investments and foreign currency | | | (66,006,039 | ) | | | 6,107,449 | |
Net change in unrealized depreciation on investments and foreign currency | | | (36,958,193 | ) | | | (34,698,440 | ) |
| | | | | | | | |
Net decrease from operations | | | (98,681,958 | ) | | | (26,133,601 | ) |
| | | | | | | | |
| DISTRIBUTIONS TO SHAREHOLDERS (Note 9): | | | | | | | | |
| | |
From net investment income | | | (4,382,210 | ) | | | (2,228,398 | ) |
From net realized gain on investments | | | — | | | | (10,081,395 | ) |
| | | | | | | | |
Total distributions to shareholders | | | (4,382,210 | ) | | | (12,309,793 | ) |
| | | | | | | | |
| CAPITAL STOCK ISSUED AND REPURCHASED: | | | | | | | | |
| | |
Net increase from capital share transactions (Note 5) | | | 12,336,743 | | | | 125,684,727 | |
| | | | | | | | |
Net increase (decrease) in net assets | | | (90,727,425 | ) | | | 87,241,333 | |
| | |
| NET ASSETS: | | | | | | | | |
| | |
Beginning of year | | | 220,096,702 | | | | 132,855,369 | |
| | | | | | | | |
End of year (including undistributed net investment income of $146,921 and $256,898, respectively) | | $ | 129,369,277 | | | $ | 220,096,702 | |
| | | | | | | | |
| | |
| The accompanying notes are an integral part of the financial statements. | | 11 |
Financial Highlights
| | | | | | | | |
| | | For the Years Ended | | For the Period
7/1/051 to
12/31/05 |
| | | 12/31/08 | | 12/31/07 | | 12/31/06 | |
| | | | | | | | |
| | | | | | | | |
| Per share data (for a share outstanding throughout each period): | | | | | | | | |
Net asset value - Beginning of period | | $9.34 | | $12.51 | | $10.70 | | $10.00 |
| | | | | | | | |
Income (loss) from investment operations: | | | | | | | | |
Net investment income | | 0.17 | | 0.19 | | 0.10 | | 0.05 |
Net realized and unrealized gain (loss) on investments | | (4.19) | | (2.36) | | 2.00 | | 0.69 |
| | | | | | | | |
Total from investment operations | | (4.02) | | (2.17) | | 2.10 | | 0.74 |
| | | | | | | | |
| | | | |
Less distributions to shareholders: | | | | | | | | |
From net investment income | | (0.18) | | (0.18) | | (0.11) | | (0.04) |
From net realized gain on investments | | — | | (0.82) | | (0.18) | | — |
| | | | | | | | |
Total distributions to shareholders | | (0.18) | | (1.00) | | (0.29) | | (0.04) |
| | | | | | | | |
Net asset value - End of period | | $5.14 | | $9.34 | | $12.51 | | $10.70 |
| | | | | | | | |
Net assets - End of period (000’s omitted) | | $129,369 | | $220,097 | | $132,855 | | $49,674 |
| | | | | | | | |
Total return2 | | (42.98%) | | (17.46%) | | 19.62% | | 7.39% |
| Ratios (to average net assets)/Supplemental Data: | | | | | | | | |
Expenses | | 1.12% | | 1.15% | | 1.18% | | 1.20%3* |
Net investment income | | 2.34% | | 1.72% | | 1.14% | | 0.95%3 |
Portfolio turnover | | 41% | | 38% | | 30% | | 6% |
|
*The investment advisor did not impose all of its management fee. If these expenses had been incurred by the Series, the expense ratio (to average net assets) for the period ended 12/31/05 would have been increased by 0.16%3. |
1Commencement of operations.
2Represents aggregate total return for the period indicated, and assumes reinvestment of all distributions. Total return would have been lower had certain expenses not been waived during the period ended December 31, 2005. Periods less than one year are not annualized.
3Annualized.
| | |
| 12 | | The accompanying notes are an integral part of the financial statements. |
Notes to Financial Statements
Financial Services Series (the “Series”) is a no-load non-diversified series of Manning & Napier Fund, Inc. (the “Fund”). The Fund is organized in Maryland and is registered under the Investment Company Act of 1940, as amended, as an open-end management investment company.
The Series’ investment objective is to provide long-term growth by investing principally in the common stocks of companies in the financial services industry.
The Fund’s Advisor is Manning & Napier Advisors, Inc. (the “Advisor”). Shares of the Series are offered to investors, clients and employees of the Advisor and its affiliates. The total authorized capital stock of the Fund consists of 5.0 billion shares of common stock each having a par value of $0.01. As of December 31, 2008, 4.5 billion shares have been designated in total among 28 series, of which 100 million have been designated as Financial Services Series Class A common stock.
| 2. | SIGNIFICANT ACCOUNTING POLICIES |
Security Valuation
Portfolio securities, including domestic equities, foreign equities, exchange-traded funds and options, listed on an exchange other than the NASDAQ National Market System are valued at the latest quoted sales price of the exchange on which the security is primarily traded. Securities not traded on valuation date or securities not listed on an exchange are valued at the latest quoted bid price provided by the Fund’s pricing service. Securities listed on the NASDAQ National Market System are valued in accordance with the NASDAQ Official Closing Price.
Securities for which representative valuations or prices are not available from the Fund’s pricing service may be valued at fair value. Due to the inherent uncertainty of valuations of such securities, the fair value may differ significantly from the values that would have been used had a ready market for such securities existed. If trading or events occurring after the close of the principal market in which securities are traded are expected to materially affect the value of those securities, then they may be valued at their fair value, taking this trading or these events into account. Fair value is determined in good faith by the Advisor under procedures approved by and under the general supervision and responsibility of the Fund’s Board of Directors (the “Board”).
Short-term investments that mature in sixty days or less are valued at amortized cost, which approximates market value. Investments in open-end investment companies are valued at their net asset value per share on valuation date, with the exception of exchange-traded funds, which are valued at the closing price on the exchange.
In September 2006, FASB Statement of Financial Accounting Standards No. 157, Fair Value Measurements (“FAS 157”) was issued, effective for fiscal years beginning after November 15, 2007. This standard clarifies the definition of fair value for financial reporting, establishes a framework for measuring fair value and requires additional disclosures about the use of fair value measurements. FAS 157 became effective for the Series as of January 1, 2008, the beginning of its current fiscal year. The three levels of the fair value hierarchy under FAS 157 are described below:
Level 1 - quoted prices in active markets for identical securities
Level 2 - other significant observable inputs (including quoted prices for similar securities, interest rates, prepayment speeds, credit risk, etc.)
Notes to Financial Statements
| 2. | SIGNIFICANT ACCOUNTING POLICIES (continued) |
Security Valuation (continued)
Level 3 - significant unobservable inputs (including the Series’ own assumptions in determining the fair value of investments.)
The inputs or methodology used for valuing securities are not necessarily an indication of the risk associated with investing in those securities. The following is a summary of the inputs used to value the Series’ assets as of December 31, 2008:
| | | | | | |
Valuation Inputs | | Investments In
Securities | | Other Financial
Instruments* |
| | | | | | |
Level 1 - Quoted Prices | | $ | 124,161,013 | | $ | — |
Level 2 - Other Significant Observable Inputs | | | 6,612,642 | | | — |
Level 3 - Significant Unobservable Inputs | | | — | | | — |
| | | | | | |
Total | | $ | 130,773,655 | | $ | — |
| | | | | | |
*Other financial instruments are derivative instruments not reflected in the Investment Portfolio, such as futures, forwards and swap contracts, which are valued at the unrealized appreciation/depreciation on the instrument. As of December 31, 2008, the Series did not hold any derivative instruments.
There were no Level 3 securities held by the Series as of December 31, 2007 or December 31, 2008.
Security Transactions, Investment Income and Expenses
Security transactions are accounted for on trade date. Dividend income is recorded on the ex-dividend date, except that if the ex-dividend date has passed, certain dividends from foreign securities are recorded as soon as the Fund is informed of the ex-dividend date. Non-cash dividends, if any, are recorded at the fair market value of the securities received. Interest income, including amortization of premium and accretion of discounts using the effective interest method, is earned from settlement date and accrued daily.
Expenses are recorded on an accrual basis. Most expenses of the Fund can be attributed to a specific series. Expenses which cannot be directly attributed are apportioned among the series in the Fund in such a manner as deemed equitable by the Fund’s Board, taking into consideration, among other things, the nature and type of expense.
The Series uses the identified cost method for determining realized gain or loss on investments for both financial statement and federal income tax reporting purposes.
Foreign Currency Translation
The books and records of the Series are maintained in U.S. dollars. Foreign currencies, investments and other assets and liabilities are translated into U.S. dollars at the current exchange rates. Purchases and sales of investment securities and income and expenses are translated on the respective dates of such transactions. The Series does not isolate realized and unrealized gains and losses attributable to changes in the exchange rates from gains and losses that arise from changes in the market value of investments. Such fluctuations are included with net realized and unrealized gain or loss on investments. Net realized foreign currency gains and losses represent foreign currency gains and losses between trade date and settlement date on securities transactions, gains and losses on disposition of foreign currencies and the difference between the amount of income and foreign withholding taxes recorded on the books of the Series and the amounts actually received or paid.
Notes to Financial Statements
| 2. | SIGNIFICANT ACCOUNTING POLICIES (continued) |
Federal Taxes
The Series’ policy is to comply with the provisions of the Internal Revenue Code applicable to regulated investment companies. The Series is not subject to federal income tax or excise tax to the extent that the Series distributes to shareholders each year its taxable income, including any net realized gains on investments, in accordance with requirements of the Internal Revenue Code. Accordingly, no provision for federal income tax or excise tax has been made in the financial statements.
On June 29, 2007, the Series adopted Financial Accounting Standards Board Interpretation No. 48 - Accounting for Uncertainty in Income Taxes (“FIN 48”). FIN 48 prescribes the minimum recognition threshold a tax position must meet in connection with accounting for uncertainties in income tax positions taken or expected to be taken by an entity before being measured and recognized in the financial statements. Management has determined that the adoption of FIN 48 did not have a material impact on the Series’ financial statements. The Series files income tax returns in the U.S. federal jurisdiction, various states and foreign jurisdictions, as required. No income tax returns are currently under investigation. The statute of limitations on the Series’ tax returns remains open for the years ended December 31, 2005 through December 31, 2008.
Additionally, based on the Fund’s understanding of the tax rules and rates related to income, gains and transactions for foreign jurisdictions in which it invests, the Series will provide for foreign taxes, and where appropriate, deferred foreign tax.
Distributions of Income and Gains
Distributions to shareholders of net investment income and net realized gains are made annually. An additional distribution may be necessary to avoid taxation of the Series. Distributions are recorded on the ex-dividend date.
Indemnifications
The Fund’s organizational documents provide former and current directors and officers with a limited indemnification against liabilities arising in connection with the performance of their duties to the Fund. In the normal course of business, the Fund may also enter into contracts that provide general indemnifications. The Fund’s maximum exposure under these arrangements is unknown as this would be dependent on future claims that may be made against the Fund. The risk of material loss from such claims is considered remote.
Other
The preparation of financial statements in conformity with accounting principles generally accepted in the United States of America requires management to make estimates and assumptions that affect the reported amounts of assets and liabilities and the disclosure of contingent assets and liabilities at the date of the financial statements and the reported amounts of income and expenses during the reporting period. Actual results could differ from those estimates.
| 3. | TRANSACTIONS WITH AFFILIATES |
The Fund has an Investment Advisory Agreement (the “Agreement”) with the Advisor, for which the Series pays a fee, computed daily and payable monthly, at an annual rate of 1.00% of the Series’ average daily net assets.
Notes to Financial Statements
| 3. | TRANSACTIONS WITH AFFILIATES (continued) |
Under the Agreement, personnel of the Advisor provide the Series with advice and assistance in the choice of investments and the execution of securities transactions, and otherwise maintain the Series’ organization. The Advisor also provides the Fund with necessary office space and fund administration and support services. The salaries of all officers of the Fund (except a percentage of the Fund’s Chief Compliance Officer’s salary, which is paid by the Fund), and of all Directors who are “affiliated persons” of the Fund, or of the Advisor, and all personnel of the Fund, or of the Advisor, performing services relating to research, statistical and investment activities, are paid by the Advisor. Each “non-affiliated” Director receives an annual stipend, which is allocated among all the active series of the Fund. In addition, these Directors also receive a fee per Board meeting attended for each active series of the Fund plus a fee for each committee meeting attended.
The Advisor has contractually agreed, until at least April 30, 2010, to waive its fee and, if necessary, pay other operating expenses of the Series in order to maintain total direct annual fund operating expenses for the Series at no more than 1.20% of average daily net assets each year. For the year ended December 31, 2008, the Advisor did not waive its management fee or reimburse any expenses of the Series. The Advisor is not eligible to recoup any expenses that have been waived or reimbursed in prior years.
Manning & Napier Investor Services, Inc., a registered broker-dealer affiliate of the Advisor, acts as distributor for the Fund’s shares. The services of Manning & Napier Investor Services, Inc. are provided at no additional cost to the Series.
For fund accounting and transfer agent services, through October 31, 2008, the Fund paid the Advisor an annual fee of 0.11% of the Fund’s average daily net assets up to $900 million, 0.07% of the Fund’s average daily net assets between $900 million and $1.5 billion, and 0.04% of the Fund’s average daily net assets over $1.5 billion. Effective November 1, 2008, the fee rates are as follows: 0.055% of the Fund’s average daily net assets up to $4.5 billion, 0.03% of the Fund’s average daily net assets between $4.5 billion and $7.5 billion, and 0.02% of the Fund’s average daily net assets over $7.5 billion. Additionally, certain transaction and account-based fees and out-of-pocket expenses, including charges for reporting relating to the Fund’s compliance program, are charged. Expenses not directly attributable to a series are allocated based on each series’ relative net assets or number of accounts, depending on the expense. The Advisor has an agreement with Citi Fund Services Ohio, Inc. (“Citi”) under which Citi serves as sub-accountant and sub-transfer agent.
| 4. | PURCHASES AND SALES OF SECURITIES |
For the year ended December 31, 2008, purchases and sales of securities, other than United States Government securities and short-term securities, were $86,275,313 and $70,439,819, respectively. There were no purchases or sales of United States Government securities.
Notes to Financial Statements
| 5. | CAPITAL STOCK TRANSACTIONS |
Transactions in shares of Financial Services Series were:
| | | | | | | | | | | | | | |
| | | For the Year
Ended 12/31/08 | | | For the Year
Ended 12/31/07 | |
| | | Shares | | | Amount | | | Shares | | | Amount | |
| | | | | | | | | | | | | | |
Sold | | 3,484,154 | | | $ | 26,397,174 | | | 12,112,146 | | | $ | 118,943,581 | |
Reinvested | | 857,166 | | | | 4,243,277 | | | 1,269,156 | | | | 12,123,485 | |
Repurchased | | (2,707,152 | ) | | | (18,303,708 | ) | | (448,824 | ) | | | (5,382,339 | ) |
| | | | | | | | | | | | | | |
Total | | 1,634,168 | | | $ | 12,336,743 | | | 12,932,478 | | | $ | 125,684,727 | |
| | | | | | | | | | | | | | |
Substantially all of the Series’ shares represent investments by fiduciary accounts over which the Advisor has sole investment discretion.
The Series may trade in financial instruments with off-balance sheet risk in the normal course of its investing activities to assist in managing exposure to various market risks. These financial instruments include written options, forward foreign currency exchange contracts and futures contracts and may involve, to a varying degree, elements of risk in excess of the amounts recognized for financial statement purposes. No such investments were held by the Series on December 31, 2008.
Investing in securities of foreign companies and foreign governments involves special risks and considerations not typically associated with investing in securities of domestic companies and the United States Government. These risks include revaluation of currencies and future adverse political and economic developments. Moreover, securities of foreign companies and foreign governments and their markets may be less liquid and their prices more volatile than those of comparable domestic companies and the United States Government.
| 8. | FINANCIAL SERVICES SECURITIES |
The Series may focus its investments in certain related financial services industries; hence, the Series may subject itself to a greater degree of risk than a series that is more diversified.
| 9. | FEDERAL INCOME TAX INFORMATION |
The amount and characterization of certain income and capital gains to be distributed are determined in accordance with federal income tax regulations, which may differ from accounting principles generally accepted in the United States of America. These differences are primarily due to differing book and tax treatments in the timing of the recognition of net investment income or gains and losses, including net operating losses, foreign currency gains and losses and Post-October losses. The Series may periodically make reclassifications among its capital accounts to reflect income and gains available for distribution (or available capital loss carryovers) under income tax regulations, without impacting the Series’ net asset value. Any such reclassifications are not reflected in the financial highlights.
Notes to Financial Statements
| 9. | FEDERAL INCOME TAX INFORMATION (continued) |
The tax character of distributions paid were as follows:
| | | | | | |
| | | For the Year
Ended 12/31/08 | | For the Year
Ended 12/31/07 |
Ordinary income | | $ | 4,382,210 | | $ | 7,602,829 |
Long-term capital gains | | | — | | | 4,706,964 |
For the year ended December 31, 2008, the Series elected to defer $17,329,119 and $33 of capital and currency losses, respectively, attributable to Post-October losses.
At December 31, 2008, the tax basis components of distributable earnings and the net unrealized depreciation based on identified cost for federal income tax purposes were as follows:
| | | | |
| | | | |
Cost for federal income tax purposes | | $ | 186,798,301 | |
Unrealized appreciation | | $ | 1,664,707 | |
Unrealized depreciation | | | (57,689,353 | ) |
| | | | |
Net unrealized depreciation | | $ | (56,024,646 | ) |
Capital loss carryover | | | 50,750,211 | |
Undistributed ordinary income | | | 146,954 | |
The capital loss carryover, disclosed above, available to the extent allowed by tax law to offset future net capital gain, if any, will expire on December 31, 2016.
| 10. | RECENT ACCOUNTING PRONOUNCEMENTS |
In September 2008, FASB Staff Position No. FAS 133-1 and FIN 45-4, “Disclosures about Credit Derivatives and Certain Guarantees: An Amendment of FASB Statement No. 133 and FASB Interpretation No. 45” (the “Position”) was issued and is effective for fiscal years and interim periods beginning after November 15, 2008. The Position amends FASB Statement No. 133 (“FAS 133”), Accounting for Derivative Instruments and Hedging Activities, and also amends FASB Interpretation No. 45 (“FIN 45”), Guarantor’s Accounting and Disclosure Requirements for Guarantees, Including Indirect Guarantees of Indebtedness of Others. The amendments to FAS 133 include required disclosure for (i) the nature and terms of the credit derivative, reasons for entering into the credit derivative, the events or circumstances that would require the seller to perform under the credit derivative, and the current status of the payment performance risk of the credit derivative, (ii) the maximum potential amount of future payments (undiscounted) the seller could be required to make under the credit derivative, (iii) the fair value of the credit derivative, and (iv) the nature of any recourse provisions and assets held either as collateral or by third parties. The amendments to FIN 45 require additional disclosures about the current status of the payment/performance risk of a guarantee. At this time, Management is evaluating the implications of FAS 133-1 and FIN 45-4, but they are not expected to materially impact the Series’ financial statements.
In March 2008, FASB Statement of Financial Accounting Standards No. 161, Disclosures about Derivative Instruments and Hedging Activities (“FAS 161”) was issued and is effective for fiscal years and interim periods beginning after November 15, 2008. FAS 161 requires enhanced disclosures about the Series’ derivative and hedging activities, including how such activities are accounted for and their effect on the Series’ financial position and performance. Management is currently evaluating the impact of the adoption of FAS 161, but it is not expected to materially impact the Series’ financial statements.
Report of Independent Registered Public Accounting Firm
To the Board of Directors of Manning & Napier Fund, Inc. and Shareholders of Financial Services Series:
In our opinion, the accompanying statement of assets and liabilities, including the investment portfolio, and the related statements of operations and of changes in net assets and the financial highlights present fairly, in all material respects, the financial position of the Financial Services Series (a series of Manning & Napier Fund, Inc., hereafter referred to as the “Series”) at December 31, 2008, and the results of its operations for the year then ended, the changes in its net assets for each of the two years in the period then ended and the financial highlights for each of the periods indicated, in conformity with accounting principles generally accepted in the United States of America. These financial statements and financial highlights (hereafter referred to as “financial statements”) are the responsibility of the Series’ management; our responsibility is to express an opinion on these financial statements based on our audits. We conducted our audits of these financial statements in accordance with the standards of the Public Company Accounting Oversight Board (United States). Those standards require that we plan and perform the audit to obtain reasonable assurance about whether the financial statements are free of material misstatement. An audit includes examining, on a test basis, evidence supporting the amounts and disclosures in the financial statements, assessing the accounting principles used and significant estimates made by management, and evaluating the overall financial statement presentation. We believe that our audits, which included confirmation of securities at December 31, 2008 by correspondence with the custodian and brokers, provide a reasonable basis for our opinion.

Columbus, Ohio
February 13, 2009
Supplemental Tax Information (unaudited)
For federal income tax purposes, the Series designates for the current fiscal year $4,266,503 or, if different, the maximum amount allowable under the tax law as qualified dividend income.
For corporate shareholders, the percentage of investment income (dividend income plus short-term gains, if any) that qualifies for the dividends received deduction for the current fiscal year is 96.3%.
Renewal of Investment Advisory Agreement (unaudited)
At the Manning & Napier Fund, Inc. (the “Fund”) Board of Directors’ (the “Board”) meeting, held on November 5, 2008, the Investment Advisory Agreement (the “Agreement”) between the Fund and Manning & Napier Advisors, Inc. (the “Advisor”) was reviewed by the Board for renewal. In connection with the decision whether to renew the Agreement, a variety of material was prepared for and reviewed by the Board.
Representatives of the Advisor attended the meeting and presented additional oral and written information to the Board to assist the Board in its considerations. The discussion immediately below outlines the materials and information presented to the Board in connection with the Board’s 2008 Annual Review of the Agreement and the conclusions made by the Directors when determining to continue the Agreement.
| | • | | The Board considered the services provided by the Advisor under the Agreement including, among others: deciding what securities to purchase and sell for each Series; arranging for the purchase and sale of such securities by placing orders with broker-dealers; administering the affairs of the Fund (including the books and records of the Fund not maintained by third party service providers such as the custodian or sub-transfer agent); arranging for the insurance coverage for the Fund; and supervising the preparation of tax returns, SEC filings (including registration statements) and reports to shareholders for the Fund. The Board also considered the nature and quality of such services provided under the Agreement in light of the Advisor’s services provided to the Fund for 22 years. The Board discussed the quality of these services with representatives from the Advisor and concluded that the Advisor was performing its services to the Fund required under the Agreement in a reasonable manner. |
| | • | | The Board considered the investment performance of the various Series of the Fund. The investment performance for each Series was reviewed on a cumulative basis since inception and on a one year basis. In addition, annualized performance for the following time periods was considered: inception, three year, five year, ten year, and current market cycle. A market cycle includes periods of both rising and falling markets. Returns for established benchmark indices for each Series were provided for each time period. The Board noted that the various Series were competitive against their respective benchmarks and/or peer groups over various time periods, but in particular over the full market cycle period relevant for the Series. In addition, the Board considered at the meeting (and considers on a quarterly basis) a peer group performance analysis consisting of Morningstar universes of mutual funds with similar investment objectives. The Board discussed the performance with representatives from the Advisor and concluded that the investment performance of each of the Fund’s Series was reasonable based on the Fund’s actual performance and comparative performance, especially performance over the current market cycle. |
| | • | | The Board considered the costs of the Advisor’s services and the profits of the Advisor as they relate to the Advisor’s services to the Fund under the Agreement. In reviewing the Advisor’s costs and profits, the Board discussed the Advisor’s revenues generated from the Fund (on both an actual and adjusted basis) and its expenses associated with providing the services under the Agreement. In addition, the Board reviewed the Advisor’s expenses associated with Fund activities outside of the Agreement (such as expense reimbursements pursuant to expense caps and payments made by the Advisor to third party platforms on which shares of the Fund are available for purchase). It was noted by representatives of the Advisor that 15 of the 25 active Series of the Fund are |
Renewal of Investment Advisory Agreement (unaudited)
| | currently experiencing expenses above the capped expense ratios. After discussing the above costs and profits, the Board concluded that the Advisor’s profitability relating to its services provided under the Agreement was reasonable. |
| | • | | The Board considered the fees and expenses of the various Series of the Fund. The Advisor presented the advisory fees and total expenses for each Series, including the advisory fee adjusted for any expense waivers or reimbursements (either contractual or voluntary) paid by the Advisor. The advisory fees and expense ratios of each Series were compared to an average (on both a mean and median basis) of similar funds as disclosed on the Morningstar database. Representatives of the Advisor discussed with the Board the levels of its advisory fee for each Series of the Fund and as compared to the median and mean advisory fees for similar funds as listed on Morningstar. Expense ratios for every Series, except the High Yield Bond Series, Global Fixed Income Series and the Target Series Class R and Class C, are currently below the median and mean for similar funds as listed on Morningstar. Based on their review of the information provided, the Board concluded that the fees and expenses of each Series of the Fund were reasonable on a comparative basis. |
| | • | | The Board also considered the other benefits the Advisor derives from its relationship with the Fund. Such other benefits include certain research products provided by soft dollars. Given the level of soft dollar transactions involving the Fund, the Board concluded that these additional benefits to the Advisor were reasonable. |
| | • | | In addition to the factors described above, the Board considered the Advisor’s personnel, investment strategies, policies and procedures relating to compliance with personal securities transactions, and reputation, expertise and resources in domestic and foreign financial markets. The Board concluded that these factors support the conclusion that the Advisor performs its services in a reasonable manner. |
| | • | | The Board did not consider economies of scale at this time because of the multiple uses of the Fund (for the Advisor’s discretionary investment account clients in addition to direct investors), the current profitability of the Advisor’s services to the Fund under the Agreement, and the overall size of the Fund complex. |
Based on the Board’s deliberations and their evaluation of the information described above, the Board, including a majority of Directors that are not “interested persons” as defined in the Investment Company Act of 1940, concluded that the compensation under the Agreement was fair and reasonable in light of the services and expenses and such other matters as the Directors considered to be relevant in the exercise of their reasonable judgment. Accordingly, the Board approved the renewal of the Agreement. In the course of their deliberations, the Directors did not identify any particular information that was all important or controlling.
Directors’ and Officers’ Information (unaudited)
The Statement of Additional Information provides additional information about the Fund’s directors and officers and can be obtained without charge by calling 1-800-466-3863, at www.manningnapieradvisors.com, or on the EDGAR Database on the SEC Internet web site (http://www.sec.gov). The following chart shows certain information about the Fund’s officers and directors, including their principal occupations during the last five years. Unless specific dates are provided, the individuals have held the listed positions for longer than five years.
INTERESTED DIRECTOR/OFFICER
| | |
| Name: | | B. Reuben Auspitz* |
| Address: | | 290 Woodcliff Drive
Fairport, NY 14450 |
| Age: | | 61 |
| Current Position(s) Held with Fund: | | Principal Executive Officer, President, Chairman & Director |
| Term of Office1 & Length of Time Served: | | Indefinite - Director since 1984; Vice President 1984 - 2003; President since 2004; Principal Executive Officer since 2002 |
| Principal Occupation(s) During Past 5 Years: | | Executive Vice President; Co-Executive Director; Executive Group Member**; Chief Compliance Officer since 2004 - Manning & Napier Advisors, Inc. President; Director - Manning & Napier Investor Services, Inc. Holds or has held one or more of the following titles for various subsidiaries and affiliates: President, Vice President, Director, Chairman, Treasurer, Chief Compliance Officer or Member. |
| Number of Portfolios Overseen within Fund Complex: | | 28 |
| Other Directorships Held Outside Fund Complex: | | N/A |
| |
| INDEPENDENT DIRECTORS | | |
| |
| Name: | | Stephen B. Ashley |
| Address: | | 290 Woodcliff Drive
Fairport, NY 14450 |
| Age: | | 68 |
| Current Position(s) Held with Fund: | | Director, Audit Committee Member, Governance & Nominating Committee Member |
| Term of Office & Length of Time Served: | | Indefinite - Since 1996 |
| Principal Occupation(s) During Past 5 Years: | | Chairman, Director, President & Chief Executive Officer, The Ashley Group (property management and investment). Chairman (non-executive) 2004-2008; Director 1995-2008 - Fannie Mae (mortgage) |
| Number of Portfolios Overseen within Fund Complex: | | 28 |
| Other Directorships Held Outside Fund Complex: | | The Ashley Group |
| Name: | | Peter L. Faber |
| Address: | | 290 Woodcliff Drive Fairport, NY 14450 |
| Age: | | 70 |
| Current Position(s) Held with Fund: | | Director, Governance & Nominating Committee Member |
| Term of Office & Length of Time Served: | | Indefinite - Since 1987 |
| Principal Occupation(s) During Past 5 Years: | | Senior Counsel, McDermott, Will & Emery LLP (law firm) |
| Number of Portfolios Overseen within Fund Complex: | | 28 |
| Other Directorships Held Outside Fund Complex: | | Partnership for New York City, Inc. New York Collegium Boston Early Music Festival |
| Name: | | Harris H. Rusitzky |
| Address: | | 290 Woodcliff Drive Fairport, NY 14450 |
| Age: | | 73 |
| Current Position(s) Held with Fund: | | Director, Audit Committee Member, Governance & Nominating Committee Member |
| Term of Office & Length of Time Served: | | Indefinite - Since 1985 |
| Principal Occupation(s) During Past 5 Years: | | President, The Greening Group (business consultants); Partner, The Restaurant Group (restaurants) |
| Number of Portfolios Overseen within Fund Complex: | | 28 |
| Other Directorships Held Outside Fund Complex: | | N/A |
Directors’ and Officers’ Information (unaudited)
| | |
| |
INDEPENDENT DIRECTORS (continued) | | |
| Name: | | Paul A. Brooke |
| Address: | | 290 Woodcliff Drive Fairport, NY 14450 |
| Age: | | 63 |
| Current Position(s) Held with Fund: | | Director, Audit Committee Member, Governance & Nominating Committee Member |
| Term of Office & Length of Time Served: | | Indefinite - Since 2007 |
| Principal Occupation(s) During Past 5 Years: | | Chairman & CEO, Alsius Corp. (investments); Managing Member, PMSV Holdings LLC (investments) |
| Number of Portfolios Overseen within Fund Complex: | | 28 |
| Other Directorships Held Outside Fund Complex: | | Incyte Corp. ViroPharma, Inc. HLTH Corp. Cheyne Capital International MPM Bio-equities GMP Companies HoustonPharma |
OFFICERS
| | |
| Name: | | Jeffrey S. Coons, Ph.D., CFA |
| Address: | | 290 Woodcliff Drive Fairport, NY 14450 |
| Age: | | 45 |
| Current Position(s) Held with Fund: | | Vice President |
| Term of Office1 & Length of Time Served: | | Since 2004 |
| Principal Occupation(s) During Past 5 Years: | | Co-Director of Research since 2002 & Executive Group Member**, Manning & Napier Advisors, Inc. Holds one or more of the following titles for various subsidiaries and affiliates: President, Director, Treasurer or Senior Trust Officer. |
| Number of Portfolios Overseen within Fund Complex: | | 28 |
| Other Directorships Held Outside Fund Complex: | | N/A |
| Name: | | Christine Glavin |
| Address: | | 290 Woodcliff Drive Fairport, NY 14450 |
| Age: | | 42 |
| Current Position(s) Held with Fund: | | Principal Financial Officer, Chief Financial Officer |
| Term of Office1 & Length of Time Served: | | Principal Financial Officer since 2002; Chief Financial Officer since 2001 |
| Principal Occupation(s) During Past 5 Years: | | Fund Reporting Manager, Manning & Napier Advisors, Inc. |
| Number of Portfolios Overseen within Fund Complex: | | 28 |
| Other Directorships Held Outside Fund Complex: | | N/A |
| Name: | | Jodi L. Hedberg |
| Address: | | 290 Woodcliff Drive Fairport, NY 14450 |
| Age: | | 41 |
| Current Position(s) Held with Fund: | | Corporate Secretary, Chief Compliance Officer, Anti-Money Laundering Compliance Officer |
| Term of Office1 & Length of Time Served: | | Corporate Secretary since 1997; Chief Compliance Officer since 2004 |
| Principal Occupation(s) During Past 5 Years: | | Director of Compliance, Manning & Napier Advisors, Inc. and affiliates; Corporate Secretary, Manning & Napier Investor Services, Inc. since 2006 |
| Number of Portfolios Overseen within Fund Complex: | | 28 |
| Other Directorships Held Outside Fund Complex: | | N/A |
*Interested Director, within the meaning of the Investment Company Act of 1940 by reason of his position with the Fund’s investment advisor and distributor. Mr. Auspitz serves as the Executive Vice President and Director, Manning & Napier Advisors, Inc. and President and Director, Manning & Napier Investor Services, Inc., the Fund’s distributor.
**The Executive Group performs the duties of the Office of the Chief Executive of Manning & Napier Advisors, Inc.
1The term of office for President, Vice President, Chief Financial Officer, and Corporate Secretary is one year and until their respective successors are chosen and qualified. All other officers’ terms are indefinite.
(THISPAGEINTENTIONALLYLEFTBLANK)
Literature Requests (unaudited)
Proxy Voting Policies and Procedures
A description of the policies and procedures that the Fund uses to determine how to vote proxies relating to portfolio securities is available, without charge, upon request:
| | |
By phone | | 1-800-466-3863 |
On the Securities and Exchange Commission’s (SEC) web site | | http://www.sec.gov |
Proxy Voting Record
Information regarding how the Fund voted proxies relating to portfolio securities during the most recent 12-month period ended June 30th is available, without charge, upon request:
| | |
By phone | | 1-800-466-3863 |
On the SEC’s web site | | http://www.sec.gov |
Quarterly Portfolio Holdings
The Series’ complete schedule of portfolio holdings for the 1st and 3rd quarters of each fiscal year are provided on Form N-Q, and are available, without charge, upon request:
| | |
By phone | | 1-800-466-3863 |
On the SEC’s web site | | http://www.sec.gov |
The Series’ Form N-Q may be reviewed and copied at the SEC’s Public Reference Room in Washington, D.C. Information on the operation of the Public Reference Room may be obtained by calling 1-800-SEC-0330.
Prospectus and Statement of Additional Information (SAI)
The prospectus and SAI provide additional information about each Series, including charges, expenses and risks. These documents are available, without charge, upon request:
| | |
By phone | | 1-800-466-3863 |
On the SEC’s web site | | http://www.sec.gov |
On the Advisor’s web site | | http://www.manningnapieradvisors.com |
Additional information available at www.manningnapieradvisors.com
1. Fund Holdings - Month-End
2. Fund Holdings - Quarter-End
3. Shareholder Report - Annual
4. Shareholder Report - Semi-Annual
Manning & Napier Fund, Inc.
| | | | |
| WORLD OPPORTUNITIES SERIES | | | | | Annual Report - December 31, 2008 |

Management Discussion and Analysis (unaudited)
Dear Shareholders:
2008 was a very poor year in foreign markets. The World Opportunities Series fell -40.07% in the 2008 calendar year; however, it outperformed its benchmark index, the Morgan Stanley Capital International (MSCI) All Country World Index ex U.S., which lost -45.53%. The Series continues to outperform the benchmark over the current international stock market cycle (since April 1, 2003) with an annualized return of 12.04% compared to the benchmark’s annualized return of 9.95%.
The Series’ performance held up better than the benchmark due to a number of factors. A significant contributor to its relative performance was its lower weighting in the Financials sector compared to the benchmark. The Financials sector was the worst performing sector in the MSCI All Country World Index ex U.S. In addition, the Series steered away from the Materials sector, which was the second worst performing sector.
The Series was more defensively positioned than the benchmark, with a large portion of equities in the Consumer Staples and Health Care sectors. Both of these sectors held up better than the overall market.
Another important contributor to the relative performance of the Series was a currency hedge that was put on the Euro and British Pound for a portion of the year. We believed there was risk for the U.S. dollar to appreciate against foreign currencies, namely the Euro and the British Pound. Given mounting evidence of a global economic slowdown, we believed the Central Banks in England and the European Union would change their stance from being vigilant on inflation to aggressively cutting interest rates to help stem the slowdown. This action tends to lead to a weakening currency. Meanwhile, the U.S. had already been proactive at cutting the Fed Funds rate prior to the initiation of our hedge. The hedge was allowed to expire in October of 2008.
Detracting from performance was a lower weight to the Utilities and Telecommunication Services sectors than the benchmark. These traditionally defensive sectors held up better than the overall market in 2008. Stock selection in the Industrials sector and Energy sector were also detractors from performance. Weak performers included an aerospace manufacturer and an energy service company specializing in seismic surveying equipment. Concerns about potential order cancellations from airlines and a collapse of energy prices, respectively, helped push these stocks lower during the year.
On a country and regional basis, a general underweight as compared to the benchmark in emerging markets, especially avoiding stocks based in China, India, and Russia, aided relative performance versus the benchmark. These markets experienced significant underperformance in anticipation of the global economic slowdown and its impact on these countries’ exporting industries. However, an underweight position to Japan detracted from performance, as a strong Yen relative to other major currencies helped buoy the Japanese stock market. We did increase the Series’ holdings in Japan over the course of the year, although our position is still less than that of the benchmark.
During the year we reduced holdings in the Financials sector. The greater need to raise capital to offset mounting credit losses weakened our conviction surrounding the strength of the strategy fit for companies in the sector. Exposure to the Energy sector was also reduced as signs the global economy was starting to slow began to appear. We believed the dramatic rise in oil prices was unsustainable given the gloomy global economic outlook that presented itself during the first half of the year. We added to positions in more defensive sectors, particularly Health Care, throughout the year. Holdings within Health Care include diagnostic testing and medical device companies, along with firms engaged in the manufacturer and development of pharmaceuticals.
The World Opportunities Series remains predominantly invested in Western Europe, based in part on our view that Western Europe is in a long-term reform process. The corporate sector has experienced a removal of burdens, such as strict labor laws and higher taxes, in order to regain competitiveness lost to lower cost regions such as Eastern Europe and Asia. The crash of the credit markets in 2008 has shifted focus away from reform and towards the continent’s more immediate problems. On a positive note, valuations are becoming ever more attractive in Western Europe.
Management Discussion and Analysis (unaudited)
The Series maintained a significantly larger position in Brazil as compared to the benchmark in 2008. President Lula has taken positive steps to improve Brazil’s fiscal position and encourage growth. Brazil was successful in 2008 at avoiding a downturn, although some concerns are developing over the plummeting price of commodities.
While 2008 was a difficult year for investors, we recognize that our job is to remain focused on company-specific fundamentals. In a year where emotion - a crisis of confidence - was a strong driver of returns no matter the market, we are not surprised that our fundamentals-based approach produced disappointing returns. However, looking back over our 38-year history, this approach has served our clients well over the long-term.
As always, we appreciate your business.
Sincerely,
Manning & Napier Advisors, Inc.
Performance Update as of December 31, 2008 (unaudited)
| | | | | | | | | | |
| | | Average Annual Total Returns
As of December 31, 2008 | | |
| | | One
Year | | Five
Year | | Ten
Year | | Since
Inception1 | | |
Manning & Napier Fund, Inc. - World Opportunities Series2 | | -40.07% | | 5.22% | | 8.72% | | 7.69% | | |
Morgan Stanley Capital International (MSCI) All Country World Index ex U.S.3 | | -45.53% | | 2.56% | | 1.90% | | 2.98% | | |
The following graph compares the value of a $10,000 investment in the Manning & Napier Fund, Inc. - World Opportunities Series for the ten years ended December 31, 2008 to the MSCI All Country World Index ex U.S.
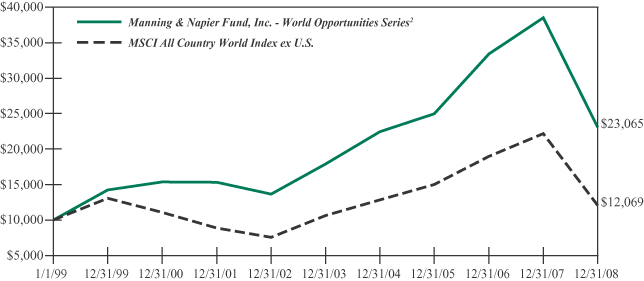
1Performance numbers for the Series are calculated from September 6, 1996, the Series’ inception date. Prior to 2001, the MSCI All Country World Index ex U.S. only published month-end numbers; therefore, performance numbers for the Index are calculated from September 30, 1996.
2The Series’ performance does not reflect the deduction of taxes that a shareholder would pay on fund distributions or the redemption of shares. The Series’ performance is historical and may not be indicative of future results. The performance returns shown are inclusive of the net expense ratio of the Series. For the year ended December 31, 2008, this net expense ratio was 1.16%. The gross expense ratio, which does not account for any voluntary or contractual waivers currently in effect, was 1.16% for the year ended December 31, 2008.
3The MSCI All Country World Index ex U.S. is a free float-adjusted market capitalization weighted index that is designed to measure equity market performance in the global developed and emerging markets and consists of 47 developed and emerging market country indices outside the United States. The Index is denominated in U.S. Dollars. The Index returns assume daily reinvestment of gross dividends (which do not account for foreign dividend taxation) from the inception of the Series (see Note 1 above) through December 31, 1998, as net returns were not available. Subsequent to December 31, 1998, the Index returns assume daily reinvestment of net dividends (thus accounting for foreign dividend taxation). Unlike Series returns, the Index returns do not reflect any fees or expenses.
Shareholder Expense Example (unaudited)
As a shareholder of the Series, you may incur two types of costs: (1) transaction costs, including potential wire charges on redemptions and (2) ongoing costs, including management fees and other Series expenses. This example is intended to help you understand your ongoing costs (in dollars) of investing in the Series and to compare these costs with the ongoing costs of investing in other mutual funds.
The example is based on an investment of $1,000 invested at the beginning of the period and held for the entire period (July 1, 2008 to December 31, 2008).
Actual Expenses
The first line of the table below provides information about actual account values and actual expenses. You may use the information in this line, together with the amount you invested, to estimate the expenses that you paid over the period. Simply divide your account value by $1,000 (for example, an $8,600 account value divided by $1,000 = 8.6), then multiply the result by the number in the first line under the heading entitled “Expenses Paid During Period” to estimate the expenses you paid on your account during this period.
Hypothetical Example for Comparison Purposes
The second line of the table below provides information about hypothetical account values and hypothetical expenses based on the Series’ actual expense ratio and an assumed rate of return of 5% per year before expenses, which is not the Series’ actual return. The hypothetical account values and expenses may not be used to estimate the actual ending account balance or expenses you paid during the period. You may use this information to compare the ongoing costs of investing in the Series and other funds. To do so, compare this 5% hypothetical example with the 5% hypothetical examples that appear in the shareholder reports of the other funds.
Please note that the expenses shown in the table are meant to highlight your ongoing costs only and do not reflect any transaction costs, such as potential wire charges on redemptions. Therefore, the second line of the table is useful in comparing ongoing costs only, and will not help you determine the relative total costs of owning different funds. In addition, if these transaction costs were included, your costs would have been higher.
| | | | | | | | | |
| | | Beginning
Account Value
7/1/08 | | Ending
Account Value
12/31/08 | | Expenses Paid
During Period*
7/1/08-12/31/08 |
Actual | | $ | 1,000.00 | | $ | 661.00 | | $ | 5.01 |
Hypothetical
(5% return before expenses) | | $ | 1,000.00 | | $ | 1,019.10 | | $ | 6.09 |
*Expenses are equal to the Series’ annualized expense ratio (for the six-month period) of 1.20%, multiplied by the average account value over the period, multiplied by 184/366 (to reflect the one-half year period). Expenses are based on the most recent fiscal half year; therefore, the expense ratio stated above may differ from the expense ratio stated in the financial highlights, which is based on one-year data.
Portfolio Composition as of December 31, 2008 (unaudited)
Country Allocation1
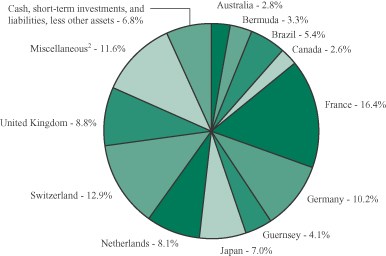
1As a percentage of net assets.
2Miscellaneous
Denmark 2.2%
Finland 2.2%
Hong Kong 0.3%
Israel 0.2%
Mexico 2.0%
South Korea 1.6%
Spain 1.0%
Thailand 0.6%
United States 1.5%
Sector Allocation3
3As a percentage of net assets.
Investment Portfolio - December 31, 2008
| | | | | |
| | | Shares | | Value
(Note 2) |
| | | | | |
| | |
COMMON STOCKS - 92.1% | | | | | |
| | |
Consumer Discretionary - 8.4% | | | | | |
Automobiles - 1.6% | | | | | |
Suzuki Motor Corp. (Japan) | | 1,564,500 | | $ | 21,198,345 |
| | | | | |
Hotels, Restaurants & Leisure - 0.8% | | | | | |
Club Mediterranee S.A.* (France) | | 633,245 | | | 10,544,108 |
| | | | | |
Leisure Equipment & Products - 1.0% | | | | | |
Sankyo Co. Ltd. (Japan) | | 277,900 | | | 13,798,411 |
| | | | | |
Media - 4.0% | | | | | |
Grupo Televisa S.A. - ADR (Mexico) | | 1,766,870 | | | 26,397,038 |
Societe Television Francaise 1 (France) | | 1,861,191 | | | 27,006,774 |
| | | | | |
| | | | | 53,403,812 |
| | | | | |
Textiles, Apparel & Luxury Goods - 1.0% | | | | | |
Adidas AG (Germany) | | 352,840 | | | 13,285,200 |
| | | | | |
Total Consumer Discretionary | | | | | 112,229,876 |
| | | | | |
Consumer Staples - 15.9% | | | | | |
Beverages - 4.2% | | | | | |
Carlsberg A/S - Class B (Denmark) | | 909,500 | | | 29,092,380 |
Heineken N.V. (Netherlands) | | 895,440 | | | 27,255,985 |
| | | | | |
| | | | | 56,348,365 |
| | | | | |
Food & Staples Retailing - 1.9% | | | | | |
Carrefour S.A. (France) | | 663,280 | | | 25,370,359 |
| | | | | |
Food Products - 7.0% | | | | | |
Cadbury plc (United Kingdom) | | 1,375,630 | | | 11,972,746 |
Nestle S.A. (Switzerland) | | 729,750 | | | 28,534,261 |
Unilever plc - ADR (United Kingdom) | | 2,316,800 | | | 53,332,736 |
| | | | | |
| | | | | 93,839,743 |
| | | | | |
Personal Products - 2.8% | | | | | |
L’Oreal S.A. (France) | | 309,140 | | | 26,768,530 |
Natura Cosmeticos S.A. (Brazil) | | 1,320,500 | | | 10,757,741 |
| | | | | |
| | | | | 37,526,271 |
| | | | | |
Total Consumer Staples | | | | | 213,084,738 |
| | | | | |
Energy - 4.3% | | | | | |
Energy Equipment & Services - 4.3% | | | | | |
Calfrac Well Services Ltd. (Canada) | | 2,339,700 | | | 16,492,781 |
Compagnie Generale de Geophysique - Veritas (CGG - Veritas)* (France) | | 1,798,670 | | | 26,499,558 |
Trican Well Service Ltd. (Canada) | | 2,249,280 | | | 14,506,781 |
| | | | | |
Total Energy | | | | | 57,499,120 |
| | | | | |
| | |
| 6 | | The accompanying notes are an integral part of the financial statements. |
Investment Portfolio - December 31, 2008
| | | | | |
| | | Shares | | Value
(Note 2) |
| | | | | |
| | |
COMMON STOCKS (continued) | | | | | |
| | |
Financials - 7.7% | | | | | |
Commercial Banks - 3.4% | | | | | |
HSBC Holdings plc (United Kingdom) | | 3,195,100 | | $ | 30,403,280 |
Societe Generale (France) | | 306,170 | | | 15,319,564 |
| | | | | |
| | | | | 45,722,844 |
| | | | | |
Diversified Financial Services - 0.9% | | | | | |
Financiere Marc de Lacharriere S.A. (Fimalac) (France) | | 393,026 | | | 12,236,313 |
| | | | | |
Insurance - 3.1% | | | | | |
Allianz SE (Germany) | | 260,540 | | | 27,122,986 |
Willis Group Holdings Ltd. (United Kingdom) | | 569,380 | | | 14,166,174 |
| | | | | |
| | | | | 41,289,160 |
| | | | | |
Thrifts & Mortgage Finance - 0.3% | | | | | |
Aareal Bank AG (Germany) | | 555,200 | | | 4,498,827 |
| | | | | |
Total Financials | | | | | 103,747,144 |
| | | | | |
Health Care - 19.6% | | | | | |
Health Care Equipment & Supplies - 5.9% | | | | | |
Covidien Ltd. (Bermuda) | | 801,000 | | | 29,028,240 |
Nobel Biocare Holding AG (Switzerland) | | 805,250 | | | 16,212,478 |
Straumann Holding AG (Switzerland) | | 80,860 | | | 14,098,628 |
Synthes, Inc. (United States) | | 158,810 | | | 19,912,825 |
| | | | | |
| | | | | 79,252,171 |
| | | | | |
Health Care Providers & Services - 5.2% | | | | | |
BML, Inc. (Japan) | | 375,700 | | | 8,203,799 |
Bumrungrad Hospital Public Co. Ltd. - NVDR (Thailand) | | 14,130,000 | | | 8,627,765 |
Diagnosticos da America S.A. (Brazil) | | 1,550,090 | | | 14,948,959 |
Sonic Healthcare Ltd. (Australia) | | 3,729,692 | | | 37,850,114 |
| | | | | |
| | | | | 69,630,637 |
| | | | | |
Life Sciences Tools & Services - 4.7% | | | | | |
Lonza Group AG (Switzerland) | | 393,231 | | | 36,055,723 |
QIAGEN N.V.* (Netherlands) | | 1,534,146 | | | 26,939,604 |
| | | | | |
| | | | | 62,995,327 |
| | | | | |
Pharmaceuticals - 3.8% | | | | | |
Novartis AG - ADR (Switzerland) | | 738,590 | | | 36,752,238 |
Santen Pharmaceutical Co. Ltd. (Japan) | | 474,200 | | | 14,179,433 |
| | | | | |
| | | | | 50,931,671 |
| | | | | |
Total Health Care | | | | | 262,809,806 |
| | | | | |
| | |
| The accompanying notes are an integral part of the financial statements. | | 7 |
Investment Portfolio - December 31, 2008
| | | | | |
| | | Shares | | Value
(Note 2) |
| | | | | |
| | |
COMMON STOCKS (continued) | | | | | |
| | |
Industrials - 16.1% | | | | | |
Aerospace & Defense - 3.5% | | | | | |
Empresa Brasileira de Aeronautica S.A. (Embraer) - ADR (Brazil) | | 2,913,880 | | $ | 47,233,995 |
| | | | | |
Air Freight & Logistics - 2.6% | | | | | |
TNT N.V. (Netherlands) | | 1,852,780 | | | 35,434,276 |
| | | | | |
Electrical Equipment - 4.9% | | | | | |
ABB Ltd. (Asea Brown Boveri) - ADR (Switzerland) | | 2,025,010 | | | 30,395,400 |
Gamesa Corporacion Tecnologica S.A. (Spain) | | 727,520 | | | 12,882,366 |
Nexans S.A. (France) | | 365,942 | | | 21,641,786 |
| | | | | |
| | | | | 64,919,552 |
| | | | | |
Industrial Conglomerates - 4.3% | | | | | |
Siemens AG (Germany) | | 577,410 | | | 42,365,978 |
Tyco International Ltd. (Bermuda) | | 705,390 | | | 15,236,424 |
| | | | | |
| | | | | 57,602,402 |
| | | | | |
Machinery - 0.8% | | | | | |
Schindler Holding AG (Switzerland) | | 238,910 | | | 10,801,364 |
| | | | | |
Total Industrials | | | | | 215,991,589 |
| | | | | |
Information Technology - 17.9% | | | | | |
Communications Equipment - 3.6% | | | | | |
Alcatel-Lucent - ADR* (France) | | 8,905,210 | | | 19,146,201 |
Nokia (Finland) | | 1,854,260 | | | 28,926,456 |
| | | | | |
| | | | | 48,072,657 |
| | | | | |
Semiconductors & Semiconductor Equipment - 3.1% | | | |
ASML Holding N.V. (Netherlands) | | 1,085,630 | | | 19,238,592 |
Tokyo Electron Limited (Japan) | | 631,000 | | | 21,583,361 |
| | | | | |
| | | | | 40,821,953 |
| | | | | |
Software - 11.2% | | | | | |
Aladdin Knowledge Systems Ltd.* (Israel) | | 336,260 | | | 2,071,362 |
Amdocs Ltd.* (Guernsey) | | 3,034,390 | | | 55,498,993 |
Misys plc (United Kingdom) | | 5,823,730 | | | 8,308,254 |
SAP AG - ADR (Germany) | | 974,780 | | | 35,306,532 |
Square Enix Holdings Co. Ltd. (Japan) | | 450,600 | | | 14,294,108 |
UbiSoft Entertainment S.A.* (France) | | 1,809,060 | | | 35,075,870 |
| | | | | |
| | | | | 150,555,119 |
| | | | | |
Total Information Technology | | | | | 239,449,729 |
| | | | | |
Materials - 0.3% | | | | | |
Paper & Forest Products - 0.3% | | | | | |
Norbord, Inc. (Canada) | | 7,911,480 | | | 4,487,146 |
| | | | | |
| | |
| 8 | | The accompanying notes are an integral part of the financial statements. |
Investment Portfolio - December 31, 2008
| | | | | | | |
| | | Shares/ Principal Amount | | Value
(Note 2) | |
| | | | | | | |
| | |
COMMON STOCKS (continued) | | | | | | | |
| | |
Telecommunication Services - 1.9% | | | | | | | |
Wireless Telecommunication Services - 1.9% | | | | | | | |
Hutchison Telecommunications International Ltd. (Hong Kong) | | | 11,900,000 | | $ | 3,193,806 | |
Hutchison Telecommunications International Ltd. - ADR (Hong Kong) | | | 135,670 | | | 549,463 | |
SK Telecom Co. Ltd. - ADR (South Korea) | | | 1,152,790 | | | 20,957,722 | |
| | | | | | | |
Total Telecommunication Services | | | | | | 24,700,991 | |
| | | | | | | |
TOTAL COMMON STOCKS
(Identified Cost $1,746,900,600) | | | | | | 1,234,000,139 | |
| | | | | | | |
| | |
PREFERRED STOCKS - 1.1% | | | | | | | |
Consumer Staples - 1.1% | | | | | | | |
Household Products - 1.1% | | | | | | | |
Henkel AG & Co. KGaA (Germany)
(Identified Cost $16,914,358) | | | 451,650 | | | 14,413,026 | |
| | | | | | | |
| | |
SHORT-TERM INVESTMENTS - 9.3% | | | | | | | |
Dreyfus Cash Management, Inc. - Institutional Shares | | | 64,753,492 | | | 64,753,492 | |
Federal Home Loan Bank Discount Note, 1/5/2009 | | $ | 60,000,000 | | | 59,996,720 | |
| | | | | | | |
TOTAL SHORT-TERM INVESTMENTS
(Identified Cost $124,742,491) | | | | | | 124,750,212 | |
| | | | | | | |
TOTAL INVESTMENTS - 102.5%
(Identified Cost $1,888,557,449) | | | | | | 1,373,163,377 | |
| | |
LIABILITIES, LESS OTHER ASSETS - (2.5%) | | | | | | (33,105,884 | ) |
| | | | | | | |
NET ASSETS - 100% | | | | | $ | 1,340,057,493 | |
| | | | | | | |
*Non-income producing security
ADR - American Depository Receipt
NVDR - Non-Voting Depository Receipt
The Series’ portfolio holds, as a percentage of net assets, greater than 10% in the following countries: France - 16.4%; Switzerland - 12.9%; Germany - 10.2%.
| | |
| The accompanying notes are an integral part of the financial statements. | | 9 |
Statement of Assets and Liabilities
December 31, 2008
| | | | |
ASSETS: | | | | |
| | | | |
| |
Investments, at value (identified cost $1,888,557,449) (Note 2) | | $ | 1,373,163,377 | |
Cash | | | 2,843,350 | |
Foreign currency, at value (cost $9) | | | 9 | |
Receivable for fund shares sold | | | 12,322,731 | |
Dividends receivable | | | 719,897 | |
Foreign tax reclaims receivable | | | 538,048 | |
Receivable for securities sold | | | 254,498 | |
| | | | |
TOTAL ASSETS | | | 1,389,841,910 | |
| | | | |
| LIABILITIES: | | | | |
| |
Accrued management fees (Note 3) | | | 1,014,724 | |
Accrued fund accounting and transfer agent fees (Note 3) | | | 252,375 | |
Accrued Chief Compliance Officer service fees (Note 3) | | | 477 | |
Payable for securities purchased | | | 45,196,403 | |
Payable for fund shares repurchased | | | 3,198,266 | |
Other payables and accrued expenses | | | 122,172 | |
| | | | |
TOTAL LIABILITIES | | | 49,784,417 | |
| | | | |
TOTAL NET ASSETS | | $ | 1,340,057,493 | |
| | | | |
NET ASSETS CONSIST OF: | | | | |
| |
Capital stock | | $ | 2,280,684 | |
Additional paid-in-capital | | | 1,877,913,144 | |
Undistributed net investment income | | | 16,759,172 | |
Accumulated net realized loss on investments, foreign currency and other assets and liabilities | | | (41,479,964 | ) |
Net unrealized depreciation on investments, foreign currency and other assets and liabilities | | | (515,415,543 | ) |
| | | | |
TOTAL NET ASSETS | | $ | 1,340,057,493 | |
| | | | |
NET ASSET VALUE, OFFERING PRICE AND REDEMPTION PRICE PER SHARE - CLASS A ($1,340,057,493/228,068,432 shares) | | $ | 5.88 | |
| | | | |
| | |
| 10 | | The accompanying notes are an integral part of the financial statements. |
Statement of Operations
For the Year Ended December 31, 2008
| | | | |
INVESTMENT INCOME: | | | | |
| | | | |
| |
Dividends (net of foreign tax withheld, $1,652,804) | | $ | 33,539,893 | |
Interest | | | 1,024,034 | |
| | | | |
Total Investment Income | �� | | 34,563,927 | |
| | | | |
| EXPENSES: | | | | |
| |
Management fees (Note 3) | | | 10,371,776 | |
Fund accounting and transfer agent fees (Note 3) | | | 1,105,325 | |
Directors’ fees (Note 3) | | | 12,599 | |
Chief Compliance Officer service fees (Note 3) | | | 4,301 | |
Custodian fees | | | 204,999 | |
Miscellaneous | | | 307,121 | |
| | | | |
Total Expenses | | | 12,006,121 | |
| | | | |
NET INVESTMENT INCOME | | | 22,557,806 | |
| | | | |
| REALIZED AND UNREALIZED GAIN (LOSS) ON INVESTMENTS: | | | | |
| |
Net realized gain (loss) on - | | | | |
Investments | | | (57,539,376 | ) |
Foreign currency, forward foreign currency exchange contracts and other assets and liabilities | | | 15,330,173 | |
| | | | |
| | | (42,209,203 | ) |
| | | | |
| |
Net change in unrealized appreciation (depreciation) on - | | | | |
Investments | | | (557,706,557 | ) |
Foreign currency and other assets and liabilities | | | (29,351 | ) |
| | | | |
| | | (557,735,908 | ) |
| | | | |
| |
NET REALIZED AND UNREALIZED GAIN (LOSS) ON INVESTMENTS | | | (599,945,111 | ) |
| | | | |
NET DECREASE IN NET ASSETS RESULTING FROM OPERATIONS | | $ | (577,387,305 | ) |
| | | | |
| | |
| The accompanying notes are an integral part of the financial statements. | | 11 |
Statements of Changes in Net Assets
| | | | | | | | |
| | | For the
Year Ended
12/31/08 | | | For the
Year Ended
12/31/07 | |
| | | | | | | | |
| INCREASE (DECREASE) IN NET ASSETS: | | | | | | | | |
| | |
| OPERATIONS: | | | | | | | | |
| | |
Net investment income | | $ | 22,557,806 | | | $ | 4,217,919 | |
Net realized gain (loss) on investments and foreign currency | | | (42,209,203 | ) | | | 86,506,752 | |
Net change in unrealized appreciation (depreciation) on investments and foreign currency | | | (557,735,908 | ) | | | (19,115,409 | ) |
| | | | | | | | |
Net increase (decrease) from operations | | | (577,387,305 | ) | | | 71,609,262 | |
| | | | | | | | |
| DISTRIBUTIONS TO SHAREHOLDERS (Note 8): | | | | | | | | |
| | |
From net investment income | | | (5,302,658 | ) | | | (4,199,452 | ) |
From net realized gain on investments | | | (25,379,417 | ) | | | (65,915,500 | ) |
| | | | | | | | |
Total distributions to shareholders | | | (30,682,075 | ) | | | (70,114,952 | ) |
| | | | | | | | |
| CAPITAL STOCK ISSUED AND REPURCHASED: | | | | | | | | |
| | |
Net increase from capital share transactions (Note 5) | | | 1,106,263,251 | | | | 523,247,936 | |
| | | | | | | | |
Net increase in net assets | | | 498,193,871 | | | | 524,742,246 | |
| | |
| NET ASSETS: | | | | | | | | |
| | |
Beginning of year | | | 841,863,622 | | | | 317,121,376 | |
| | | | | | | | |
End of year (including undistributed net investment income of $16,759,172 and $277,607, respectively) | | $ | 1,340,057,493 | | | $ | 841,863,622 | |
| | | | | | | | |
| | |
| 12 | | The accompanying notes are an integral part of the financial statements. |
Financial Highlights
| | | | | | | | | | |
| | | For the Years Ended |
| | | 12/31/08 | | 12/31/07 | | 12/31/06 | | 12/31/05 | | 12/31/04 |
| | | | | | | | | | |
| | | | | | | | | | |
| Per share data (for a share outstanding throughout each year): | | | | | | | | | | |
Net asset value - Beginning of year | | $10.07 | | $9.58 | | $8.46 | | $8.33 | | $6.84 |
| | | | | | | | | | |
Income (loss) from investment operations: | | | | | | | | | | |
Net investment income | | 0.10 | | 0.05 | | 0.12 | | 0.07 | | 0.05 |
Net realized and unrealized gain (loss) on investments | | (4.08) | | 1.36 | | 2.71 | | 0.87 | | 1.68 |
| | | | | | | | | | |
Total from investment operations | | (3.98) | | 1.41 | | 2.83 | | 0.94 | | 1.73 |
| | | | | | | | | | |
| | | | | |
Less distributions to shareholders: | | | | | | | | | | |
From net investment income | | (0.03) | | (0.05) | | (0.14) | | (0.07) | | (0.06) |
From net realized gain on investments | | (0.18) | | (0.87) | | (1.57) | | (0.74) | | (0.18) |
| | | | | | | | | | |
Total distributions to shareholders | | (0.21) | | (0.92) | | (1.71) | | (0.81) | | (0.24) |
| | | | | | | | | | |
Net asset value - End of year | | $5.88 | | $10.07 | | $9.58 | | $8.46 | | $8.33 |
| | | | | | | | | | |
Net assets - End of year (000’s omitted) | | $1,340,057 | | $841,864 | | $317,121 | | $206,636 | | $160,895 |
| | | | | | | | | | |
Total return1 | | (40.07%) | | 15.13% | | 33.88% | | 11.33% | | 25.42% |
| Ratios (to average net assets)/Supplemental Data: | | | | | | | | | | |
Expenses | | 1.16% | | 1.14% | | 1.16% | | 1.21% | | 1.26% |
Net investment income | | 2.17% | | 0.75% | | 1.35% | | 0.95% | | 0.75% |
Portfolio turnover | | 34% | | 49% | | 64% | | 46% | | 42% |
1Represents aggregate total return for the year indicated, and assumes reinvestment of all distributions.
| | |
| The accompanying notes are an integral part of the financial statements. | | 13 |
Notes to Financial Statements
World Opportunities Series (the “Series”) is a no-load diversified series of Manning & Napier Fund, Inc. (the “Fund”). The Fund is organized in Maryland and is registered under the Investment Company Act of 1940, as amended, as an open-end management investment company.
The Series’ investment objective is to provide long-term growth by investing principally in the common stocks of companies located around the world.
The Series is authorized to issue five classes of shares (Class A, B, D, E and Z). Currently, only Class A shares have been issued. Each class of shares is substantially the same, except that class-specific distribution and shareholder servicing expenses are borne by the specific class of shares to which they relate.
The Fund’s Advisor is Manning & Napier Advisors, Inc. (the “Advisor”). Shares of the Series are offered to investors, clients and employees of the Advisor and its affiliates. The total authorized capital stock of the Fund consists of 5.0 billion shares of common stock each having a par value of $0.01. As of December 31, 2008, 4.5 billion shares have been designated in total among 28 series, of which 1.2 billion have been designated as World Opportunities Series Class A common stock.
| 2. | SIGNIFICANT ACCOUNTING POLICIES |
Security Valuation
Portfolio securities, including domestic equities, foreign equities, exchange-traded funds and options, listed on an exchange other than the NASDAQ National Market System are valued at the latest quoted sales price of the exchange on which the security is primarily traded. Securities not traded on valuation date or securities not listed on an exchange are valued at the latest quoted bid price provided by the Fund’s pricing service. Securities listed on the NASDAQ National Market System are valued in accordance with the NASDAQ Official Closing Price.
Securities for which representative valuations or prices are not available from the Fund’s pricing service may be valued at fair value. Due to the inherent uncertainty of valuations of such securities, the fair value may differ significantly from the values that would have been used had a ready market for such securities existed. If trading or events occurring after the close of the principal market in which securities are traded are expected to materially affect the value of those securities, then they may be valued at their fair value, taking this trading or these events into account. Fair value is determined in good faith by the Advisor under procedures approved by and under the general supervision and responsibility of the Fund’s Board of Directors (the “Board”).
Short-term investments that mature in sixty days or less are valued at amortized cost, which approximates market value. Investments in open-end investment companies are valued at their net asset value per share on valuation date, with the exception of exchange-traded funds, which are valued at the closing price on the exchange.
In September 2006, FASB Statement of Financial Accounting Standards No. 157, Fair Value Measurements (“FAS 157”) was issued, effective for fiscal years beginning after November 15, 2007. This standard clarifies the definition of fair value for financial reporting, establishes a framework for measuring fair value and requires additional disclosures about the use of fair value
Notes to Financial Statements
| 2. | SIGNIFICANT ACCOUNTING POLICIES (continued) |
Security Valuation (continued)
measurements. FAS 157 became effective for the Series as of January 1, 2008, the beginning of its current fiscal year. The three levels of the fair value hierarchy under FAS 157 are described below:
Level 1 - quoted prices in active markets for identical securities
Level 2 - other significant observable inputs (including quoted prices for similar securities, interest rates, prepayment speeds, credit risk, etc.)
Level 3 - significant unobservable inputs (including the Series’ own assumptions in determining the fair value of investments.)
The inputs or methodology used for valuing securities are not necessarily an indication of the risk associated with investing in those securities. The following is a summary of the inputs used to value the Series’ assets as of December 31, 2008:
| | | | | | |
Valuation Inputs | | Investments In
Securities | | Other Financial
Instruments* |
| | | | | | |
Level 1 - Quoted Prices | | $ | 1,313,166,657 | | $ | — |
Level 2 - Other Significant Observable Inputs | | | 59,996,720 | | | — |
Level 3 - Significant Unobservable Inputs | | | — | | | — |
| | | | | | |
Total | | $ | 1,373,163,377 | | $ | — |
| | | | | | |
*Other financial instruments are derivative instruments not reflected in the Investment Portfolio, such as futures, forwards and swap contracts, which are valued at the unrealized appreciation/depreciation on the instrument. As of December 31, 2008, the Series did not hold any derivative investments.
There were no Level 3 securities held by the Series as of December 31, 2007 or December 31, 2008.
Security Transactions, Investment Income and Expenses
Security transactions are accounted for on trade date. Dividend income is recorded on the ex-dividend date, except that if the ex-dividend date has passed, certain dividends from foreign securities are recorded as soon as the Fund is informed of the ex-dividend date. Non-cash dividends, if any, are recorded at the fair market value of the securities received. Interest income, including amortization of premium and accretion of discounts using the effective interest method, is earned from settlement date and accrued daily.
Expenses are recorded on an accrual basis. Most expenses of the Fund can be attributed to a specific series. Expenses which cannot be directly attributed are apportioned among the series in the Fund in such a manner as deemed equitable by the Fund’s Board, taking into consideration, among other things, the nature and type of expense.
The Series uses the identified cost method for determining realized gain or loss on investments for both financial statement and federal income tax reporting purposes.
Foreign Currency Translation
The books and records of the Series are maintained in U.S. dollars. Foreign currencies, investments and other assets and liabilities are translated into U.S. dollars at the current exchange rates. Purchases and sales of investment securities and income and expenses are translated on the respective dates of such transactions. The Series does not isolate realized and unrealized gains and losses attributable to changes in the exchange rates from gains and losses that arise from changes in the market value of investments. Such fluctuations are included with net realized and unrealized gain or loss on investments. Net realized foreign currency gains and losses represent foreign currency gains and losses between trade date and settlement date on
Notes to Financial Statements
| 2. | SIGNIFICANT ACCOUNTING POLICIES (continued) |
Foreign Currency Translation (continued)
securities transactions, gains and losses on disposition of foreign currencies and the difference between the amount of income and foreign withholding taxes recorded on the books of the Series and the amounts actually received or paid.
Forward Foreign Currency Exchange Contracts
The Series may purchase or sell forward foreign currency exchange contracts in order to hedge a portfolio position or specific transaction. Risks may arise if the counterparties to a contract are unable to meet the terms of the contract or if the value of the foreign currency moves unfavorably.
All forward foreign currency exchange contracts are adjusted daily by the exchange rate of the underlying currency and, for financial statement purposes, any gain or loss is recorded as unrealized gain or loss until a contract has been closed. Realized and unrealized gain or loss arising from a transaction is included in net realized and unrealized gain (loss) on investments.
The Series may regularly trade forward foreign currency exchange contracts with off-balance sheet risk in the normal course of its investing activities to assist in managing exposure to changes in foreign currency exchange rates.
The notional or contractual amount of these instruments represents the investment the Series has in forward foreign currency exchange contracts and does not necessarily represent the amounts potentially at risk. The measurement of the risks associated with forward foreign currency exchange contracts is meaningful only when all related and offsetting transactions are considered. No such investments were held by the Series on December 31, 2008.
Federal Taxes
The Series’ policy is to comply with the provisions of the Internal Revenue Code applicable to regulated investment companies. The Series is not subject to federal income tax or excise tax to the extent that the Series distributes to shareholders each year its taxable income, including any net realized gains on investments, in accordance with requirements of the Internal Revenue Code. Accordingly, no provision for federal income tax or excise tax has been made in the financial statements.
On June 29, 2007, the Series adopted Financial Accounting Standards Board Interpretation No. 48 - Accounting for Uncertainty in Income Taxes (“FIN 48”). FIN 48 prescribes the minimum recognition threshold a tax position must meet in connection with accounting for uncertainties in income tax positions taken or expected to be taken by an entity before being measured and recognized in the financial statements. Management has determined that the adoption of FIN 48 did not have a material impact on the Series’ financial statements. The Series files income tax returns in the U.S. federal jurisdiction, various states and foreign jurisdictions, as required. No income tax returns are currently under investigation. The statute of limitations on the Series’ tax returns remains open for the years ended December 31, 2005 through December 31, 2008.
Additionally, based on the Fund’s understanding of the tax rules and rates related to income, gains and transactions for foreign jurisdictions in which it invests, the Series will provide for foreign taxes, and where appropriate, deferred foreign tax.
Distributions of Income and Gains
Distributions to shareholders of net investment income and net realized gains are made annually. An additional distribution may be necessary to avoid taxation of the Series. Distributions are recorded on the ex-dividend date.
Notes to Financial Statements
| 2. | SIGNIFICANT ACCOUNTING POLICIES (continued) |
Indemnifications
The Fund’s organizational documents provide former and current directors and officers with a limited indemnification against liabilities arising in connection with the performance of their duties to the Fund. In the normal course of business, the Fund may also enter into contracts that provide general indemnifications. The Fund’s maximum exposure under these arrangements is unknown as this would be dependent on future claims that may be made against the Fund. The risk of material loss from such claims is considered remote.
Other
The preparation of financial statements in conformity with accounting principles generally accepted in the United States of America requires management to make estimates and assumptions that affect the reported amounts of assets and liabilities and the disclosure of contingent assets and liabilities at the date of the financial statements and the reported amounts of income and expenses during the reporting period. Actual results could differ from those estimates.
| 3. | TRANSACTIONS WITH AFFILIATES |
The Fund has an Investment Advisory Agreement (the “Agreement”) with the Advisor, for which the Series pays a fee, computed daily and payable monthly, at an annual rate of 1.00% of the Series’ average daily net assets.
Under the Agreement, personnel of the Advisor provide the Series with advice and assistance in the choice of investments and the execution of securities transactions, and otherwise maintain the Series’ organization. The Advisor also provides the Fund with necessary office space and fund administration and support services. The salaries of all officers of the Fund (except a percentage of the Fund’s Chief Compliance Officer’s salary, which is paid by the Fund), and of all Directors who are “affiliated persons” of the Fund, or of the Advisor, and all personnel of the Fund, or of the Advisor, performing services relating to research, statistical and investment activities, are paid by the Advisor. Each “non-affiliated” Director receives an annual stipend, which is allocated among all the active series of the Fund. In addition, these Directors also receive a fee per Board meeting attended for each active series of the Fund plus a fee for each committee meeting attended.
Manning & Napier Investor Services, Inc., a registered broker-dealer affiliate of the Advisor, acts as distributor for the Fund’s shares. The services of Manning & Napier Investor Services, Inc. are provided at no additional cost to the Series.
For fund accounting and transfer agent services, through October 31, 2008, the Fund paid the Advisor an annual fee of 0.11% of the Fund’s average daily net assets up to $900 million, 0.07% of the Fund’s average daily net assets between $900 million and $1.5 billion, and 0.04% of the Fund’s average daily net assets over $1.5 billion. Effective November 1, 2008, the fee rates are as follows: 0.055% of the Fund’s average daily net assets up to $4.5 billion, 0.03% of the Fund’s average daily net assets between $4.5 billion and $7.5 billion, and 0.02% of the Fund’s average daily net assets over $7.5 billion. Additionally, certain transaction and account-based fees and out-of-pocket expenses, including charges for reporting relating to the Fund’s compliance program, are charged. Expenses not directly attributable to a series are allocated based on each series’ relative net assets or number of accounts, depending on the expense. The Advisor has an agreement with Citi Fund Services Ohio, Inc. (“Citi”) under which Citi serves as sub-accountant and sub-transfer agent.
Notes to Financial Statements
| 4. | PURCHASES AND SALES OF SECURITIES |
For the year ended December 31, 2008, purchases and sales of securities, other than United States Government securities and short-term securities, were $1,411,828,352 and $329,956,533, respectively. There were no purchases or sales of United States Government securities.
| 5. | CAPITAL STOCK TRANSACTIONS |
Transactions in Class A shares of World Opportunities Series were:
| | | | | | | | | | | | | | |
| | | For the Year
Ended 12/31/08 | | | For the Year
Ended 12/31/07 | |
| | | Shares | | | Amount | | | Shares | | | Amount | |
| | | | | | | | | | | | | | |
Sold | | 205,450,755 | | | $ | 1,542,940,375 | | | 55,314,981 | | | $ | 576,440,251 | |
Reinvested | | 3,218,909 | | | | 24,925,839 | | | 6,492,581 | | | | 63,491,004 | |
Repurchased | | (64,232,889 | ) | | | (461,602,963 | ) | | (11,273,014 | ) | | | (116,683,319 | ) |
| | | | | | | | | | | | | | |
Total | | 144,436,775 | | | $ | 1,106,263,251 | | | 50,534,548 | | | $ | 523,247,936 | |
| | | | | | | | | | | | | | |
Approximately 10% of the Series’ shares represent investments by fiduciary accounts over which the Advisor has sole investment discretion.
The Series may trade in financial instruments with off-balance sheet risk in the normal course of its investing activities to assist in managing exposure to various market risks. These financial instruments include written options, forward foreign currency exchange contracts and futures contracts and may involve, to a varying degree, elements of risk in excess of the amounts recognized for financial statement purposes. No such investments were held by the Series on December 31, 2008.
Investing in securities of foreign companies and foreign governments involves special risks and considerations not typically associated with investing in securities of domestic companies and the United States Government. These risks include revaluation of currencies and future adverse political and economic developments. Moreover, securities of foreign companies and foreign governments and their markets may be less liquid and their prices more volatile than those of comparable domestic companies and the United States Government.
| 8. | FEDERAL INCOME TAX INFORMATION |
The amount and characterization of certain income and capital gains to be distributed are determined in accordance with federal income tax regulations, which may differ from accounting principles generally accepted in the United States of America. These differences are primarily due to differing book and tax treatments in the timing of the recognition of net investment income or gains and losses, including losses deferred due to wash sales, foreign currency gains and losses and Post-October losses. The Series may periodically make reclassifications among its capital accounts to reflect income and gains available for distribution (or available capital loss carryovers) under income tax regulations, without impacting the Series’ net asset value. Any such reclassifications are not reflected in the financial highlights.
Notes to Financial Statements
| 8. | FEDERAL INCOME TAX INFORMATION (continued) |
The tax character of distributions paid were as follows:
| | | | | | |
| | | For the Year
Ended 12/31/08 | | For the Year
Ended 12/31/07 |
| | | | | | |
Ordinary income | | $ | 9,943,598 | | $ | 30,433,799 |
Long-term capital gains | | | 20,738,477 | | | 39,681,153 |
For the year ended December 31, 2008, the Series elected to defer $17,461,454 of capital losses attributable to Post-October losses.
At December 31, 2008, the tax basis components of distributable earnings and the net unrealized depreciation based on identified cost for federal income tax purposes were as follows:
| | | | |
Cost for federal income tax purposes | | $ | 1,888,585,094 | |
Unrealized appreciation | | $ | 8,797,936 | |
Unrealized depreciation | | | (524,219,653 | ) |
| | | | |
Net unrealized depreciation | | $ | (515,421,717 | ) |
Undistributed ordinary income | | | 16,759,172 | |
Capital loss carryover | | | 23,990,865 | |
The capital loss carryover, disclosed above, available to the extent allowed by tax law to offset future net capital gain, if any, will expire on December 31, 2016.
| 9. | RECENT ACCOUNTING PRONOUNCEMENTS |
In September 2008, FASB Staff Position No. FAS 133-1 and FIN 45-4, “Disclosures about Credit Derivatives and Certain Guarantees: An Amendment of FASB Statement No. 133 and FASB Interpretation No. 45” (the “Position”) was issued and is effective for fiscal years and interim periods beginning after November 15, 2008. The Position amends FASB Statement No. 133 (“FAS 133”), Accounting for Derivative Instruments and Hedging Activities, and also amends FASB Interpretation No. 45 (“FIN 45”), Guarantor’s Accounting and Disclosure Requirements for Guarantees, Including Indirect Guarantees of Indebtedness of Others. The amendments to FAS 133 include required disclosure for (i) the nature and terms of the credit derivative, reasons for entering into the credit derivative, the events or circumstances that would require the seller to perform under the credit derivative, and the current status of the payment performance risk of the credit derivative, (ii) the maximum potential amount of future payments (undiscounted) the seller could be required to make under the credit derivative, (iii) the fair value of the credit derivative, and (iv) the nature of any recourse provisions and assets held either as collateral or by third parties. The amendments to FIN 45 require additional disclosures about the current status of the payment/performance risk of a guarantee. At this time, Management is evaluating the implications of FAS 133-1 and FIN 45-4, but they are not expected to materially impact the Series’ financial statements.
In March 2008, FASB Statement of Financial Accounting Standards No. 161, Disclosures about Derivative Instruments and Hedging Activities (“FAS 161”) was issued and is effective for fiscal years and interim periods beginning after November 15, 2008. FAS 161 requires enhanced disclosures about the Series’ derivative and hedging activities, including how such activities are accounted for and their effect on the Series’ financial position and performance. Management is currently evaluating the impact of the adoption of FAS 161, but it is not expected to materially impact the Series’ financial statements.
Report of Independent Registered Public Accounting Firm
To the Board of Directors of Manning & Napier Fund, Inc. and Shareholders of World Opportunities Series:
In our opinion, the accompanying statement of assets and liabilities, including the investment portfolio, and the related statements of operations and of changes in net assets and the financial highlights present fairly, in all material respects, the financial position of the World Opportunities Series (a series of Manning & Napier Fund, Inc., hereafter referred to as the “Series”) at December 31, 2008, and the results of its operations for the year then ended, the changes in its net assets for each of the two years in the period then ended and the financial highlights for each of the five years in the period then ended, in conformity with accounting principles generally accepted in the United States of America. These financial statements and financial highlights (hereafter referred to as “financial statements”) are the responsibility of the Series’ management; our responsibility is to express an opinion on these financial statements based on our audits. We conducted our audits of these financial statements in accordance with the standards of the Public Company Accounting Oversight Board (United States). Those standards require that we plan and perform the audit to obtain reasonable assurance about whether the financial statements are free of material misstatement. An audit includes examining, on a test basis, evidence supporting the amounts and disclosures in the financial statements, assessing the accounting principles used and significant estimates made by management, and evaluating the overall financial statement presentation. We believe that our audits, which included confirmation of securities at December 31, 2008 by correspondence with the custodian and brokers, provide a reasonable basis for our opinion.

Columbus, Ohio
February 13, 2009
Supplemental Tax Information (unaudited)
For federal income tax purposes, the Series designates for the current fiscal year $6,174,880 or, if different, the maximum amount allowable under the tax law as qualified dividend income.
Pursuant to Section 852 of the Internal Revenue Code, as amended, the Series hereby designates $20,738,477 as capital gains for its taxable year ended December 31, 2008.
Renewal of Investment Advisory Agreement (unaudited)
At the Manning & Napier Fund, Inc. (the “Fund”) Board of Directors’ (the “Board”) meeting, held on November 5, 2008, the Investment Advisory Agreement (the “Agreement”) between the Fund and Manning & Napier Advisors, Inc. (the “Advisor”) was reviewed by the Board for renewal. In connection with the decision whether to renew the Agreement, a variety of material was prepared for and reviewed by the Board.
Representatives of the Advisor attended the meeting and presented additional oral and written information to the Board to assist the Board in its considerations. The discussion immediately below outlines the materials and information presented to the Board in connection with the Board’s 2008 Annual Review of the Agreement and the conclusions made by the Directors when determining to continue the Agreement.
| | • | | The Board considered the services provided by the Advisor under the Agreement including, among others: deciding what securities to purchase and sell for each Series; arranging for the purchase and sale of such securities by placing orders with broker-dealers; administering the affairs of the Fund (including the books and records of the Fund not maintained by third party service providers such as the custodian or sub-transfer agent); arranging for the insurance coverage for the Fund; and supervising the preparation of tax returns, SEC filings (including registration statements) and reports to shareholders for the Fund. The Board also considered the nature and quality of such services provided under the Agreement in light of the Advisor’s services provided to the Fund for 22 years. The Board discussed the quality of these services with representatives from the Advisor and concluded that the Advisor was performing its services to the Fund required under the Agreement in a reasonable manner. |
| | • | | The Board considered the investment performance of the various Series of the Fund. The investment performance for each Series was reviewed on a cumulative basis since inception and on a one year basis. In addition, annualized performance for the following time periods was considered: inception, three year, five year, ten year, and current market cycle. A market cycle includes periods of both rising and falling markets. Returns for established benchmark indices for each Series were provided for each time period. The Board noted that the various Series were competitive against their respective benchmarks and/or peer groups over various time periods, but in particular over the full market cycle period relevant for the Series. In addition, the Board considered at the meeting (and considers on a quarterly basis) a peer group performance analysis consisting of Morningstar universes of mutual funds with similar investment objectives. The Board discussed the performance with representatives from the Advisor and concluded that the investment performance of each of the Fund’s Series was reasonable based on the Fund’s actual performance and comparative performance, especially performance over the current market cycle. |
| | • | | The Board considered the costs of the Advisor’s services and the profits of the Advisor as they relate to the Advisor’s services to the Fund under the Agreement. In reviewing the Advisor’s costs and profits, the Board discussed the Advisor’s revenues generated from the Fund (on both an actual and adjusted basis) and its expenses associated with providing the services under the Agreement. In addition, the Board reviewed the Advisor’s expenses associated with Fund activities outside of the Agreement (such as expense reimbursements pursuant to expense caps and payments made by the Advisor to third party platforms on which shares of the Fund are available for purchase). It was noted by representatives of the Advisor that 15 of the 25 active Series of the Fund are |
Renewal of Investment Advisory Agreement (unaudited)
| | currently experiencing expenses above the capped expense ratios. After discussing the above costs and profits, the Board concluded that the Advisor’s profitability relating to its services provided under the Agreement was reasonable. |
| | • | | The Board considered the fees and expenses of the various Series of the Fund. The Advisor presented the advisory fees and total expenses for each Series, including the advisory fee adjusted for any expense waivers or reimbursements (either contractual or voluntary) paid by the Advisor. The advisory fees and expense ratios of each Series were compared to an average (on both a mean and median basis) of similar funds as disclosed on the Morningstar database. Representatives of the Advisor discussed with the Board the levels of its advisory fee for each Series of the Fund and as compared to the median and mean advisory fees for similar funds as listed on Morningstar. Expense ratios for every Series, except the High Yield Bond Series, Global Fixed Income Series and the Target Series Class R and Class C, are currently below the median and mean for similar funds as listed on Morningstar. Based on their review of the information provided, the Board concluded that the fees and expenses of each Series of the Fund were reasonable on a comparative basis. |
| | • | | The Board also considered the other benefits the Advisor derives from its relationship with the Fund. Such other benefits include certain research products provided by soft dollars. Given the level of soft dollar transactions involving the Fund, the Board concluded that these additional benefits to the Advisor were reasonable. |
| | • | | In addition to the factors described above, the Board considered the Advisor’s personnel, investment strategies, policies and procedures relating to compliance with personal securities transactions, and reputation, expertise and resources in domestic and foreign financial markets. The Board concluded that these factors support the conclusion that the Advisor performs its services in a reasonable manner. |
| | • | | The Board did not consider economies of scale at this time because of the multiple uses of the Fund (for the Advisor’s discretionary investment account clients in addition to direct investors), the current profitability of the Advisor’s services to the Fund under the Agreement, and the overall size of the Fund complex. |
Based on the Board’s deliberations and their evaluation of the information described above, the Board, including a majority of Directors that are not “interested persons” as defined in the Investment Company Act of 1940, concluded that the compensation under the Agreement was fair and reasonable in light of the services and expenses and such other matters as the Directors considered to be relevant in the exercise of their reasonable judgment. Accordingly, the Board approved the renewal of the Agreement. In the course of their deliberations, the Directors did not identify any particular information that was all important or controlling.
Directors’ and Officers’ Information (unaudited)
The Statement of Additional Information provides additional information about the Fund’s directors and officers and can be obtained without charge by calling 1-800-466-3863, at www.manningnapieradvisors.com, or on the EDGAR Database on the SEC Internet web site (http://www.sec.gov). The following chart shows certain information about the Fund’s officers and directors, including their principal occupations during the last five years. Unless specific dates are provided, the individuals have held the listed positions for longer than five years.
INTERESTED DIRECTOR/OFFICER
| | |
| Name: | | B. Reuben Auspitz* |
| Address: | | 290 Woodcliff Drive Fairport, NY 14450 |
| Age: | | 61 |
| Current Position(s) Held with Fund: | | Principal Executive Officer, President, Chairman & Director |
| Term of Office1 & Length of Time Served: | | Indefinite - Director since 1984; Vice President 1984 - 2003; President since 2004; Principal Executive Officer since 2002 |
| Principal Occupation(s) During Past 5 Years: | | Executive Vice President; Co-Executive Director; Executive Group Member**; Chief Compliance Officer since 2004 - Manning & Napier Advisors, Inc. President; Director - Manning & Napier Investor Services, Inc. Holds or has held one or more of the following titles for various subsidiaries and affiliates: President, Vice President, Director, Chairman, Treasurer, Chief Compliance Officer or Member. |
| Number of Portfolios Overseen within Fund Complex: | | 28 |
| Other Directorships Held Outside Fund Complex: | | N/A |
| |
| INDEPENDENT DIRECTORS | | |
| |
| Name: | | Stephen B. Ashley |
| Address: | | 290 Woodcliff Drive Fairport, NY 14450 |
| Age: | | 68 |
| Current Position(s) Held with Fund: | | Director, Audit Committee Member, Governance & Nominating Committee Member |
| Term of Office & Length of Time Served: | | Indefinite - Since 1996 |
| Principal Occupation(s) During Past 5 Years: | | Chairman, Director, President & Chief Executive Officer, The Ashley Group (property management and investment). Chairman (non-executive) 2004-2008; Director 1995-2008 - Fannie Mae (mortgage) |
| Number of Portfolios Overseen within Fund Complex: | | 28 |
| Other Directorships Held Outside Fund Complex: | | The Ashley Group |
| Name: | | Peter L. Faber |
| Address: | | 290 Woodcliff Drive Fairport, NY 14450 |
| Age: | | 70 |
| Current Position(s) Held with Fund: | | Director, Governance & Nominating Committee Member |
| Term of Office & Length of Time Served: | | Indefinite - Since 1987 |
| Principal Occupation(s) During Past 5 Years: | | Senior Counsel, McDermott, Will & Emery LLP (law firm) |
| Number of Portfolios Overseen within Fund Complex: | | 28 |
| Other Directorships Held Outside Fund Complex: | | Partnership for New York City, Inc. New York Collegium Boston Early Music Festival |
| Name: | | Harris H. Rusitzky |
| Address: | | 290 Woodcliff Drive Fairport, NY 14450 |
| Age: | | 73 |
| Current Position(s) Held with Fund: | | Director, Audit Committee Member, Governance & Nominating Committee Member |
| Term of Office & Length of Time Served: | | Indefinite - Since 1985 |
| Principal Occupation(s) During Past 5 Years: | | President, The Greening Group (business consultants); Partner, The Restaurant Group (restaurants) |
| Number of Portfolios Overseen within Fund Complex: | | 28 |
| Other Directorships Held Outside Fund Complex: | | N/A |
Directors’ and Officers’ Information (unaudited)
| | |
| |
| INDEPENDENT DIRECTORS (continued) | | |
| |
| Name: | | Paul A. Brooke |
| Address: | | 290 Woodcliff Drive Fairport, NY 14450 |
| Age: | | 63 |
| Current Position(s) Held with Fund: | | Director, Audit Committee Member, Governance & Nominating Committee Member |
| Term of Office & Length of Time Served: | | Indefinite - Since 2007 |
| Principal Occupation(s) During Past 5 Years: | | Chairman & CEO, Alsius Corp. (investments); Managing Member, PMSV Holdings LLC (investments) |
| Number of Portfolios Overseen within Fund Complex: | | 28 |
| Other Directorships Held Outside Fund Complex: | | Incyte Corp.
ViroPharma, Inc.
HLTH Corp.
Cheyne Capital International
MPM Bio-equities
GMP Companies
HoustonPharma |
| |
| OFFICERS | | |
| |
| Name: | | Jeffrey S. Coons, Ph.D., CFA |
| Address: | | 290 Woodcliff Drive Fairport, NY 14450 |
| Age: | | 45 |
| Current Position(s) Held with Fund: | | Vice President |
| Term of Office1 & Length of Time Served: | | Since 2004 |
| Principal Occupation(s) During Past 5 Years: | | Co-Director of Research since 2002 & Executive Group Member**, Manning & Napier Advisors, Inc. Holds one or more of the following titles for various subsidiaries and affiliates: President, Director, Treasurer or Senior Trust Officer. |
| Number of Portfolios Overseen within Fund Complex: | | 28 |
| Other Directorships Held Outside Fund Complex: | | N/A |
| Name: | | Christine Glavin |
| Address: | | 290 Woodcliff Drive Fairport, NY 14450 |
| Age: | | 42 |
| Current Position(s) Held with Fund: | | Principal Financial Officer, Chief Financial Officer |
| Term of Office1 & Length of Time Served: | | Principal Financial Officer since 2002; Chief Financial Officer since 2001 |
| Principal Occupation(s) During Past 5 Years: | | Fund Reporting Manager, Manning & Napier Advisors, Inc. |
| Number of Portfolios Overseen within Fund Complex: | | 28 |
| Other Directorships Held Outside Fund Complex: | | N/A |
| Name: | | Jodi L. Hedberg |
| Address: | | 290 Woodcliff Drive Fairport, NY 14450 |
| Age: | | 41 |
| Current Position(s) Held with Fund: | | Corporate Secretary, Chief Compliance Officer, Anti-Money Laundering Compliance Officer |
| Term of Office1 & Length of Time Served: | | Corporate Secretary since 1997; Chief Compliance Officer since 2004 |
| Principal Occupation(s) During Past 5 Years: | | Director of Compliance, Manning & Napier Advisors, Inc. and affiliates; Corporate Secretary, Manning & Napier Investor Services, Inc. since 2006 |
| Number of Portfolios Overseen within Fund Complex: | | 28 |
| Other Directorships Held Outside Fund Complex: | | N/A |
*Interested Director, within the meaning of the Investment Company Act of 1940 by reason of his position with the Fund’s investment advisor and distributor. Mr. Auspitz serves as the Executive Vice President and Director, Manning & Napier Advisors, Inc. and President and Director, Manning & Napier Investor Services, Inc., the Fund’s distributor.
**The Executive Group performs the duties of the Office of the Chief Executive of Manning & Napier Advisors, Inc.
1The term of office for President, Vice President, Chief Financial Officer, and Corporate Secretary is one year and until their respective successors are chosen and qualified. All other officers’ terms are indefinite.
Literature Requests (unaudited)
Proxy Voting Policies and Procedures
A description of the policies and procedures that the Fund uses to determine how to vote proxies relating to portfolio securities is available, without charge, upon request:
| | |
By phone | | 1-800-466-3863 |
On the Securities and Exchange Commission’s (SEC) web site | | http://www.sec.gov |
Proxy Voting Record
Information regarding how the Fund voted proxies relating to portfolio securities during the most recent 12-month period ended June 30th is available, without charge, upon request:
| | |
By phone | | 1-800-466-3863 |
On the SEC’s web site | | http://www.sec.gov |
Quarterly Portfolio Holdings
The Series’ complete schedule of portfolio holdings for the 1st and 3rd quarters of each fiscal year are provided on Form N-Q, and are available, without charge, upon request:
| | |
By phone | | 1-800-466-3863 |
On the SEC’s web site | | http://www.sec.gov |
The Series’ Form N-Q may be reviewed and copied at the SEC’s Public Reference Room in Washington, D.C. Information on the operation of the Public Reference Room may be obtained by calling 1-800-SEC-0330.
Prospectus and Statement of Additional Information (SAI)
The prospectus and SAI provide additional information about each Series, including charges, expenses and risks. These documents are available, without charge, upon request:
| | |
| By phone | | 1-800-466-3863 |
On the SEC’s web site | | http://www.sec.gov |
On the Advisor’s web site | | http://www.manningnapieradvisors.com |
Additional information available at www.manningnapieradvisors.com
1. Fund Holdings - Month-End
2. Fund Holdings - Quarter-End
3. Shareholder Report - Annual
4. Shareholder Report - Semi-Annual
Manning & Napier Fund, Inc.
| | | | |
| INTERNATIONAL SERIES | | | | | Annual Report - December 31, 2008 |

Management Discussion and Analysis (unaudited)
Dear Shareholders:
2008 was a very poor year for global markets. The International Series fell –33.25% for the 2008 calendar year. The Series held up better than its benchmark index; the Morgan Stanley Capital International (MSCI) All Country World Index (ACWI) ex. U.S., which had an even worse year, falling –45.53%.
The Series’ strong relative performance for the full year compared to the international benchmark can be attributed to a number of factors. The International Series had a lower weighting in the Financials sector than the benchmark; this was the worst performer of any sector this year. Also the Series was more defensively positioned versus the benchmark. This is evident in the Series’ higher weighting than the benchmark in Health Care and Consumer Staples, both of which had returns less negative than the overall benchmark. Finally, the most significant contributor to the relative performance of the Series was its holdings in fixed income securities, cash, and the currency hedge that was instituted on the Euro and British Pound for a portion of 2008. The MSCI ACWI ex U.S. does not hold any of these investments and is entirely composed of equities.
The International Series remains predominantly invested in Western Europe, based on our view that Western Europe is in a long-term reform process. The corporate sector has experienced a removal of burdens, such as strict labor laws and higher taxes, in order to regain competitiveness lost to lower-cost regions such as Eastern Europe and Asia. Western Europe has initiated a fair amount of reform over the last few years, but much more needs to be done. The crash of the credit markets in 2008 and the economic malaise that has ensued has shifted focus away from reform and towards the continent’s more immediate problems. On a positive note, valuations are becoming ever more attractive in Western Europe.
After a very strong 2007, Germany’s stock market had a poor year in 2008 similar to the global benchmark’s performance. The Series’ German holdings performed almost as poorly given our holdings in the German Financials sector. Germany is also the number one exporter in the world, with a strong focus on industrial products. The strong Euro and sharply weakening demand from its end markets, especially in the latter half of the year, put a damper on Germany’s economic outlook. Although restructuring at German companies did have a positive effect on earnings and employment over the last few years, the current global slowdown has led to decelerating growth, and plummeting industrial production and business sentiment. There is still potential for more reform to improve Germany’s global competitiveness once credit markets return to normal.
France had become more proactive on the reform front when President Sarkozy came to office in 2007. Upon taking office he immediately cut taxes on overtime pay in an effort to encourage increased working hours and give employees more discretionary income. He is also working towards eliminating discrepancies in the benefits between the private and public sector to decrease the burden on the state and increase labor flexibility. However, the current financial crisis, and Mr. Sarkozy’s duties as head of the rotating European Union Presidency for the final 6 months of 2008 has kept his attention focused on Europe more than on France’s long-term reform needs.
The Series also has other Western European holdings in the United Kingdom and Switzerland. These holdings are not held for their country of origin but rather because both countries have number of companies that are large, global, stable, and defensive in nature. Both of these baskets of equities performed well relative to the benchmark.
Japan had one of the least negative returns, in U.S. dollar terms, of any country in the Index. The strong Japanese Yen was a significant contributing factor to this performance. However, Japan’s economic situation rapidly deteriorated, especially in the latter half of the year. Japan has slipped back into recession, real GDP has turned negative on a year over year basis, wages are falling, retail sales are negative, industrial production is falling, and so are exports. Japan had made a number of positive reforms over the last few years such as postal privatization, cleaning up the banking sector, and loosening labor restrictions. Corporations, encouraged by the government reforms, have restructured, improving their balance sheets, and profitability. However, much of the growth came from strong export growth and now that the global economy is faltering, so is Japan. On the other hand, valuations remain very attractive relative to historical levels.
Management Discussion and Analysis (unaudited)
In the first half of the year the Series increased positions in South Korea. South Korea was undergoing dynamic change, as the economy was holding up well given the economic deterioration around the globe. The weaker Korean Won was keeping exports competitive and the domestic consumer remained strong in the early part of the year. However, South Korea’s fortunes deteriorated rapidly as the currency collapsed over concerns about refinancing public debt. We were more concerned with the high consumer debt levels and the effect that falling wages and rising interest rates would have on debt repayments. The risks were too high and much of the additions that were made in the first half of the year were sold in the second half of the year.
Brazil is another country in which the Series holds a position. This past year has been a hard one for Brazilian stocks. Falling commodity prices and a weakening currency are both worrying developments. However, we feel that Brazil, under the presidency of Lula Da Silva, has put itself in a much better position than in past economic downturns. President Lula has steered the economy in the right direction by improving Brazil’s fiscal position and reducing debt, encouraging market-friendly legislation, granting the central bank independence, keeping inflation at bay, and helping the poor climb out of poverty. We focus on two specific industries for the Series’ Brazilian holdings: water utilities and home builders. For the homebuilders, many of the positions were sold prior to the worst of the downturn. Other long-term positives for the Brazilian homebuilding industry include a positive mixture of pent up demand for housing, rising incomes of families, and new financing vehicles making home purchases possible for the middle and lower middle class through Brazil’s state-backed mortgage financing arm. Water utilities in Brazil are experiencing a number of tailwinds. Firstly, the market is not fully penetrated. In addition, as incomes grow, more people are demanding, and able to afford, water and sewage services.
As always, we appreciate your business.
Sincerely,
Manning & Napier Advisors, Inc.
Performance Update as of December 31, 2008 (unaudited)
| | | | | | | | | | |
| | | Average Annual Total Returns
As of December 31, 2008 | | |
| | | One
Year | | Five
Year | | Ten
Year | | Since
Inception1 | | |
Manning & Napier Fund, Inc. - International Series2 | | -33.25% | | 4.29% | | 3.97% | | 7.76% | | |
Standard & Poor’s (S&P) 500 Total Return Index3 | | -36.99% | | -2.18% | | -1.38% | | 6.93% | | |
Morgan Stanley Capital International (MSCI) All Country World Index ex U.S.3 | | -45.53% | | 2.56% | | 1.90% | | 5.11% | | |
The following graph compares the value of a $10,000 investment in the Manning & Napier Fund, Inc. - International Series for the ten years ended December 31, 2008 to the S&P 500 Total Return Index and the MSCI All Country World Index ex U.S.

1Performance numbers for the Series and the S&P 500 Total Return Index are calculated from August 27, 1992, the Series’ inception date. Prior to 2001, the MSCI All Country World Index ex U.S. only published month-end numbers; therefore, performance numbers for the Index are calculated from August 31, 1992.
2The Series’ performance does not reflect the deduction of taxes that a shareholder would pay on fund distributions or the redemption of shares. The Series’ performance is historical and may not be indicative of future results. The performance returns shown are inclusive of the net expense ratio of the Series. For the year ended December 31, 2008, this net expense ratio was 1.15%. The gross expense ratio, which does not account for any voluntary or contractual waivers currently in effect, was 1.15% for the year ended December 31, 2008.
3The S&P 500 Total Return Index is an unmanaged capitalization-weighted measure of 500 widely held common stocks listed on the New York Stock Exchange, American Stock Exchange and the Over-the-Counter market. The Index returns assume daily reinvestment of dividends. The MSCI All Country World Index ex U.S. is a free float-adjusted market capitalization weighted index that is designed to measure equity market performance in the global developed and emerging markets and consists of 47 developed and emerging market country indices outside the United States. The Index is denominated in U.S Dollars. The Index returns assume daily reinvestment of gross dividends (which do not account for foreign dividend taxation) from the inception of the Series (see Note 1 above) through December 31, 1998, as net returns were not available. Subsequent to December 31, 1998, the Index returns assume daily reinvestment of net dividends (thus accounting for foreign dividend taxation). Both Indices’ returns, unlike Series returns, do not reflect any fees or expenses.
Shareholder Expense Example (unaudited)
As a shareholder of the Series, you may incur two types of costs: (1) transaction costs, including potential wire charges on redemptions and (2) ongoing costs, including management fees and other Series expenses. This example is intended to help you understand your ongoing costs (in dollars) of investing in the Series and to compare these costs with the ongoing costs of investing in other mutual funds.
The example is based on an investment of $1,000 invested at the beginning of the period and held for the entire period (July 1, 2008 to December 31, 2008).
Actual Expenses
The first line of the table below provides information about actual account values and actual expenses. You may use the information in this line, together with the amount you invested, to estimate the expenses that you paid over the period. Simply divide your account value by $1,000 (for example, an $8,600 account value divided by $1,000 = 8.6), then multiply the result by the number in the first line under the heading entitled “Expenses Paid During Period” to estimate the expenses you paid on your account during this period.
Hypothetical Example for Comparison Purposes
The second line of the table below provides information about hypothetical account values and hypothetical expenses based on the Series’ actual expense ratio and an assumed rate of return of 5% per year before expenses, which is not the Series’ actual return. The hypothetical account values and expenses may not be used to estimate the actual ending account balance or expenses you paid during the period. You may use this information to compare the ongoing costs of investing in the Series and other funds. To do so, compare this 5% hypothetical example with the 5% hypothetical examples that appear in the shareholder reports of the other funds.
Please note that the expenses shown in the table are meant to highlight your ongoing costs only and do not reflect any transaction costs, such as potential wire charges on redemptions. Therefore, the second line of the table is useful in comparing ongoing costs only, and will not help you determine the relative total costs of owning different funds. In addition, if these transaction costs were included, your costs would have been higher.
| | | | | | | | | |
| | | Beginning
Account Value
7/1/08 | | Ending
Account Value
12/31/08 | | Expenses Paid
During Period*
7/1/08-12/31/08 |
Actual | | $ | 1,000.00 | | $ | 745.70 | | $ | 5.13 |
Hypothetical
(5% return before expenses) | | $ | 1,000.00 | | $ | 1,019.25 | | $ | 5.94 |
*Expenses are equal to the Series’ annualized expense ratio (for the six-month period) of 1.17%, multiplied by the average account value over the period, multiplied by 184/366 (to reflect the one-half year period). Expenses are based on the most recent fiscal half year; therefore, the expense ratio stated above may differ from the expense ratio stated in the financial highlights, which is based on one-year data.
Portfolio Composition as of December 31, 2008 (unaudited)
Country Allocation1
1As a percentage of net assets.
2Miscellaneous
Mexico 0.39%
Norway 0.41%
Portugal 0.95%
Spain 0.67%
Sector Allocation3
3As a percentage of net assets.
Investment Portfolio - December 31, 2008
| | | | | |
| | | Shares | | Value
(Note 2) |
| | | | | |
| | |
COMMON STOCKS - 89.07% | | | | | |
| | |
Consumer Discretionary - 8.10% | | | | | |
Auto Components - 0.95% | | | | | |
Hankook Tire Co. Ltd. (South Korea) | | 143,000 | | $ | 1,737,256 |
| | | | | |
Household Durables - 1.71% | | | | | |
Corporacion Geo S.A. de C.V. - Class B* (Mexico) | | 627,000 | | | 706,484 |
LG Electronics, Inc.* (South Korea) | | 26,000 | | | 1,544,227 |
Rodobens Negocios Imobiliarios S.A. (Brazil) | | 259,000 | | | 872,222 |
| | | | | |
| | | | | 3,122,933 |
| | | | | |
Media - 3.36% | | | | | |
Impresa S.A. (SGPS)* (Portugal) | | 338,000 | | | 394,618 |
Mediaset S.p.A. (Italy) | | 175,000 | | | 985,694 |
Reed Elsevier plc - ADR (United Kingdom) | | 48,131 | | | 1,436,229 |
Societe Television Francaise 1 (France) | | 86,800 | | | 1,259,510 |
Wolters Kluwer N.V. (Netherlands) | | 105,037 | | | 1,976,707 |
Zon Multimedia Servicos de Telecomunicacoes e Multimedia SGPS S.A. - ADR (Portugal) | | 13,275 | | | 68,460 |
| | | | | |
| | | | | 6,121,218 |
| | | | | |
Multiline Retail - 0.65% | | | | | |
PPR (France) | | 18,300 | | | 1,185,273 |
| | | | | |
Specialty Retail - 0.88% | | | | | |
KOMERI Co. Ltd. (Japan) | | 67,000 | | | 1,604,215 |
| | | | | |
Textiles, Apparel & Luxury Goods - 0.55% | | | | | |
LVMH S.A. (Louis Vuitton Moet Hennessy) (France) | | 14,920 | | | 990,616 |
| | | | | |
Total Consumer Discretionary | | | | | 14,761,511 |
| | | | | |
Consumer Staples - 18.80% | | | | | |
Beverages - 2.22% | | | | | |
Diageo plc (United Kingdom) | | 130,000 | | | 1,795,745 |
Kirin Holdings Co. Ltd. (Japan) | | 173,000 | | | 2,244,820 |
| | | | | |
| | | | | 4,040,565 |
| | | | | |
Food & Staples Retailing - 6.07% | | | | | |
Carrefour S.A. (France) | | 132,332 | | | 5,061,679 |
Casino Guichard-Perrachon S.A. (France) | | 27,300 | | | 2,060,363 |
President Chain Store Corp. (Taiwan) | | 495,000 | | | 1,184,182 |
Tesco plc (United Kingdom) | | 533,000 | | | 2,758,085 |
| | | | | |
| | | | | 11,064,309 |
| | | | | |
Food Products - 8.47% | | | | | |
Cadbury plc (United Kingdom) | | 657,920 | | | 5,726,183 |
Groupe Danone (France) | | 31,952 | | | 1,917,617 |
| | |
| 6 | | The accompanying notes are an integral part of the financial statements. |
Investment Portfolio - December 31, 2008
| | | | | |
| | | Shares | | Value
(Note 2) |
| | | | | |
| | |
COMMON STOCKS (continued) | | | | | |
| | |
Consumer Staples (continued) | | | | | |
Food Products (continued) | | | | | |
Nestle S.A. (Switzerland) | | 84,000 | | $ | 3,284,519 |
Suedzucker AG (Germany) | | 72,400 | | | 1,106,911 |
Unilever plc - ADR (United Kingdom) | | 148,000 | | | 3,406,960 |
| | | | | |
| | | | | 15,442,190 |
| | | | | |
Household Products - 2.04% | | | | | |
Kao Corp. (Japan) | | 47,000 | | | 1,405,384 |
Reckitt Benckiser Group plc (United Kingdom) | | 62,500 | | | 2,316,013 |
| | | | | |
| | | | | 3,721,397 |
| | | | | |
Total Consumer Staples | | | | | 34,268,461 |
| | | | | |
Energy - 9.00% | | | | | |
Oil, Gas & Consumable Fuels - 9.00% | | | | | |
BP plc (United Kingdom) | | 205,000 | | | 1,549,950 |
Eni S.p.A. (Italy) | | 143,154 | | | 3,330,736 |
Petroleo Brasileiro S.A. (Brazil) | | 182,300 | | | 3,720,743 |
Royal Dutch Shell plc - Class B - ADR (Netherlands) | | 70,100 | | | 3,605,243 |
Royal Dutch Shell plc - Class B (Netherlands) | | 70,500 | | | 1,749,073 |
Total S.A. (France) | | 45,160 | | | 2,442,286 |
| | | | | |
Total Energy | | | | | 16,398,031 |
| | | | | |
Financials - 14.52% | | | | | |
Capital Markets - 0.74% | | | | | |
Daiwa Securities Group, Inc. (Japan) | | 79,000 | | | 458,502 |
Nomura Holdings, Inc. (Japan) | | 63,000 | | | 506,753 |
OSK Holdings Berhad (Malaysia) | | 1,337,000 | | | 382,773 |
| | | | | |
| | | | | 1,348,028 |
| | | | | |
Commercial Banks - 6.58% | | | | | |
Banca Monte dei Paschi di Siena S.p.A. (Italy) | | 181,000 | | | 383,897 |
BNP Paribas (France) | | 26,000 | | | 1,093,151 |
The Chugoku Bank Ltd. (Japan) | | 137,000 | | | 2,086,064 |
Commerzbank AG (Germany) | | 62,500 | | | 584,624 |
Credit Agricole S.A. (France) | | 57,900 | | | 643,798 |
The Hachijuni Bank Ltd. (Japan) | | 244,000 | | | 1,375,747 |
Hong Leong Financial Group Berhad (Malaysia) | | 653,000 | | | 751,573 |
Intesa Sanpaolo (Italy) | | 159,799 | | | 563,587 |
Mitsubishi UFJ Financial Group, Inc. (Japan) | | 170,000 | | | 1,029,791 |
Royal Bank of Scotland Group plc (United Kingdom) | | 254,302 | | | 180,574 |
Societe Generale (France) | | 14,140 | | | 707,511 |
| | |
| The accompanying notes are an integral part of the financial statements. | | 7 |
Investment Portfolio - December 31, 2008
| | | | | |
| | | Shares | | Value
(Note 2) |
| | | | | |
| | |
COMMON STOCKS (continued) | | | | | |
| | |
Financials (continued) | | | | | |
Commercial Banks (continued) | | | | | |
The Sumitomo Trust & Banking Co. Ltd. (Japan) | | 247,000 | | $ | 1,406,289 |
UniCredit S.p.A. (Italy) | | 489,000 | | | 1,186,002 |
| | | | | |
| | | | | 11,992,608 |
| | | | | |
Diversified Financial Services - 0.37% | | | | | |
ING Groep N.V. (Netherlands) | | 65,395 | | | 666,239 |
| | | | | |
Insurance - 5.11% | | | | | |
Allianz SE (Germany) | | 32,620 | | | 3,395,839 |
AXA S.A. (France) | | 44,892 | | | 988,650 |
Muenchener Rueckver AG (Germany) | | 32,400 | | | 4,933,313 |
| | | | | |
| | | | | 9,317,802 |
| | | | | |
Real Estate Investment Trusts (REITS) - 0.98% | | | | | |
Alstria Office REIT AG (Germany) | | 250,000 | | | 1,789,487 |
| | | | | |
Real Estate Management & Development - 0.33% | | | | | |
IOI Properties Berhad* (Malaysia) | | 744,000 | | | 430,306 |
Klabin Segall S.A. (Brazil) | | 140,000 | | | 141,141 |
OSK Property Holdings Berhad (Malaysia) | | 243,091 | | | 27,065 |
| | | | | |
| | | | | 598,512 |
| | | | | |
Thrifts & Mortgage Finance - 0.41% | | | | | |
Aareal Bank AG (Germany) | | 92,000 | | | 745,483 |
| | | | | |
Total Financials | | | | | 26,458,159 |
| | | | | |
Health Care - 11.00% | | | | | |
Health Care Equipment & Supplies - 0.68% | | | | | |
Straumann Holding AG (Switzerland) | | 7,114 | | | 1,240,386 |
| | | | | |
Pharmaceuticals - 10.32% | | | | | |
AstraZeneca plc (United Kingdom) | | 22,300 | | | 899,757 |
AstraZeneca plc - ADR (United Kingdom) | | 37,000 | | | 1,518,110 |
Bayer AG (Germany) | | 107,350 | | | 6,175,594 |
GlaxoSmithKline plc (United Kingdom) | | 138,000 | | | 2,547,952 |
Novartis AG - ADR (Switzerland) | | 49,000 | | | 2,438,240 |
Sanofi-Aventis (France) | | 21,083 | | | 1,330,361 |
Shire plc (United Kingdom) | | 170,000 | | | 2,472,905 |
Takeda Pharmaceutical Co. Ltd. (Japan) | | 28,000 | | | 1,433,521 |
| | | | | |
| | | | | 18,816,440 |
| | | | | |
Total Health Care | | | | | 20,056,826 |
| | | | | |
Industrials - 7.63% | | | | | |
Airlines - 1.42% | | | | | |
Deutsche Lufthansa AG (Germany) | | 164,800 | | | 2,594,040 |
| | | | | |
| | |
| 8 | | The accompanying notes are an integral part of the financial statements. |
Investment Portfolio - December 31, 2008
| | | | | |
| | | Shares | | Value
(Note 2) |
| | | | | |
| | |
COMMON STOCKS (continued) | | | | | |
| | |
Industrials (continued) | | | | | |
Commercial Services & Supplies - 0.50% | | | | | |
Taiwan Secom (Taiwan) | | 627,210 | | $ | 909,083 |
| | | | | |
Electrical Equipment - 0.55% | | | | | |
Teco Electric & Machinery Co. Ltd. (Taiwan) | | 3,280,000 | | | 1,010,863 |
| | | | | |
Industrial Conglomerates - 3.97% | | | | | |
Siemens AG (Germany) | | 92,300 | | | 6,772,276 |
Sonae Capital S.A. (SGPS)* (Portugal) | | 83,637 | | | 51,148 |
Sonae S.A. (SGPS) (Portugal) | | 669,100 | | | 406,400 |
| | | | | |
| | | | | 7,229,824 |
| | | | | |
Machinery - 0.59% | | | | | |
FANUC Ltd. (Japan) | | 15,500 | | | 1,075,747 |
| | | | | |
Transportation Infrastructure - 0.60% | | | | | |
Malaysia Airports Holdings Berhad (Malaysia) | | 1,716,000 | | | 1,096,692 |
| | | | | |
Total Industrials | | | | | 13,916,249 |
| | | | | |
Information Technology - 3.35% | | | | | |
Communications Equipment - 0.30% | | | | | |
D-Link Corp. (Taiwan) | | 787,374 | | | 551,392 |
| | | | | |
Electronic Equipment, Instruments & Components - 0.73% | | | |
KEYENCE Corp. (Japan) | | 4,950 | | | 994,042 |
Yageo Corp. (Taiwan) | | 2,690,000 | | | 339,821 |
| | | | | |
| | | | | 1,333,863 |
| | | | | |
Semiconductors & Semiconductor Equipment - 1.14% | | | |
Hynix Semiconductor, Inc.* (South Korea) | | 66,000 | | | 351,120 |
Taiwan Semiconductor Manufacturing Co. Ltd. - ADR (Taiwan) | | 218,473 | | | 1,725,937 |
| | | | | |
| | | | | 2,077,057 |
| | | | | |
Software - 1.18% | | | | | |
SAP AG (Germany) | | 61,400 | | | 2,137,326 |
| | | | | |
Total Information Technology | | | | | 6,099,638 |
| | | | | |
Materials - 2.73% | | | | | |
Chemicals - 0.01% | | | | | |
Arkema (France) | | 1,129 | | | 19,223 |
| | | | | |
Construction Materials - 0.68% | | | | | |
Taiwan Cement Corp. (Taiwan) | | 1,518,827 | | | 1,249,005 |
| | | | | |
Metals & Mining - 2.04% | | | | | |
Antofagasta plc - ADR (United Kingdom) | | 303,800 | | | 3,717,084 |
| | | | | |
Total Materials | | | | | 4,985,312 |
| | | | | |
| | |
| The accompanying notes are an integral part of the financial statements. | | 9 |
Investment Portfolio - December 31, 2008
| | | | | |
| | | Shares | | Value
(Note 2) |
| | | | | |
| | |
COMMON STOCKS (continued) | | | | | |
| | |
Telecommunication Services - 7.10% | | | | | |
Diversified Telecommunication Services - 5.41% | | | | | |
France Telecom S.A. (France) | | 124,500 | | $ | 3,453,911 |
France Telecom S.A. - ADR (France) | | 31,000 | | | 870,170 |
Portugal Telecom S.A. (SGPS) - ADR (Portugal) | | 94,250 | | | 808,665 |
Swisscom AG - ADR (Switzerland) | | 85,000 | | | 2,748,050 |
Telefonica S.A. - ADR (Spain) | | 18,250 | | | 1,229,868 |
Telenor ASA - ADR (Norway) | | 36,250 | | | 743,125 |
| | | | | |
| | | | | 9,853,789 |
| | | | | |
Wireless Telecommunication Services - 1.69% | | | | | |
Digi.com Berhad (Malaysia) | | 227,000 | | | 1,431,058 |
SK Telecom Co. Ltd. - ADR (South Korea) | | 91,000 | | | 1,654,380 |
| | | | | |
| | | | | 3,085,438 |
| | | | | |
Total Telecommunication Services | | | | | 12,939,227 |
| | | | | |
Utilities - 6.84% | | | | | |
Electric Utilities - 2.80% | | | | | |
E.ON AG (Germany) | | 131,211 | | | 5,109,985 |
| | | | | |
Multi-Utilities - 2.35% | | | | | |
GDF Suez (France) | | 41,370 | | | 2,031,183 |
National Grid plc (United Kingdom) | | 229,000 | | | 2,251,488 |
| | | | | |
| | | | | 4,282,671 |
| | | | | |
Water Utilities - 1.69% | | | | | |
Companhia de Saneamento Basico do Estado de Sao Paulo (SABESP) (Brazil) | | 135,040 | | | 1,608,198 |
Companhia de Saneamento de Minas Gerais - Copasa MG (Brazil) | | 182,000 | | | 1,468,649 |
| | | | | |
| | | | | 3,076,847 |
| | | | | |
Total Utilities | | | | | 12,469,503 |
| | | | | |
TOTAL COMMON STOCKS
(Identified Cost $183,208,083) | | | | | 162,352,917 |
| | | | | |
| | |
| 10 | | The accompanying notes are an integral part of the financial statements. |
Investment Portfolio - December 31, 2008
| | | | | | | |
| | | Shares/
Principal Amount | | Value
(Note 2) | |
| | | | | | | |
| | |
SHORT-TERM INVESTMENTS - 12.91% | | | | | | | |
Dreyfus Cash Management, Inc. - Institutional Shares | | | 5,525,534 | | $ | 5,525,534 | |
Federal Home Loan Bank Discount Note, 2/23/2009 | | $ | 5,000,000 | | | 4,998,548 | |
U.S. Treasury Bill, 1/8/2009 | | | 13,000,000 | | | 12,999,432 | |
| | | | | | | |
TOTAL SHORT-TERM INVESTMENTS
(Identified Cost $23,519,097) | | | | | | 23,523,514 | |
| | | | | | | |
TOTAL INVESTMENTS - 101.98%
(Identified Cost $206,727,180) | | | | | | 185,876,431 | |
| | |
LIABILITIES, LESS OTHER ASSETS - (1.98%) | | | | | | (3,603,901 | ) |
| | | | | | | |
NET ASSETS - 100% | | | | | $ | 182,272,530 | |
| | | | | | | |
*Non-income producing security
ADR - American Depository Receipt
The Series’ portfolio holds, as a percentage of net assets, greater than 10% in the following countries: Germany - 19.39%; United Kingdom - 17.87%; France - 14.29%.
| | |
| The accompanying notes are an integral part of the financial statements. | | 11 |
Statement of Assets and Liabilities
December 31, 2008
| | | | |
ASSETS: | | | | |
| | | | |
| |
Investments, at value (identified cost $206,727,180) (Note 2) | | $ | 185,876,431 | |
Foreign currency, at value (cost $65,548) | | | 65,913 | |
Dividends receivable | | | 290,064 | |
Foreign tax reclaims receivable | | | 161,779 | |
Receivable for fund shares sold | | | 42,670 | |
| | | | |
TOTAL ASSETS | | | 186,436,857 | |
| | | | |
| LIABILITIES: | | | | |
| |
Accrued management fees (Note 3) | | | 148,213 | |
Accrued fund accounting and transfer agent fees (Note 3) | | | 10,516 | |
Accrued Chief Compliance Officer service fees (Note 3) | | | 477 | |
Payable for securities purchased | | | 3,590,315 | |
Payable for fund shares repurchased | | | 350,198 | |
Audit fees payable | | | 36,419 | |
Accrued custodian fees | | | 23,133 | |
Other payables and accrued expenses | | | 5,056 | |
| | | | |
TOTAL LIABILITIES | | | 4,164,327 | |
| | | | |
TOTAL NET ASSETS | | $ | 182,272,530 | |
| | | | |
NET ASSETS CONSIST OF: | | | | |
| |
Capital stock | | $ | 277,464 | |
Additional paid-in-capital | | | 202,652,144 | |
Undistributed net investment income | | | 237,351 | |
Accumulated net realized gain on investments, foreign currency and other assets and liabilities | | | 7,395 | |
Net unrealized depreciation on investments, foreign currency and other assets and liabilities | | | (20,901,824 | ) |
| | | | |
TOTAL NET ASSETS | | $ | 182,272,530 | |
| | | | |
NET ASSET VALUE, OFFERING PRICE AND REDEMPTION PRICE PER SHARE ($182,272,530/27,746,370 shares) | | $ | 6.57 | |
| | | | |
| | |
| 12 | | The accompanying notes are an integral part of the financial statements. |
Statement of Operations
For the Year Ended December 31, 2008
| | | | |
INVESTMENT INCOME: | | | | |
| | | | |
| |
Dividends (net of foreign tax withheld, $989,556) | | $ | 8,009,139 | |
Interest | | | 402,383 | |
| | | | |
Total Investment Income | | | 8,411,522 | |
| | | | |
| EXPENSES: | | | | |
| |
Management fees (Note 3) | | | 2,309,046 | |
Fund accounting and transfer agent fees (Note 3) | | | 148,745 | |
Directors’ fees (Note 3) | | | 12,599 | |
Chief Compliance Officer service fees (Note 3) | | | 4,301 | |
Custodian fees | | | 102,750 | |
Miscellaneous | | | 85,100 | |
| | | | |
Total Expenses | | | 2,662,541 | |
| | | | |
NET INVESTMENT INCOME | | | 5,748,981 | |
| | | | |
| REALIZED AND UNREALIZED GAIN (LOSS) ON INVESTMENTS: | | | | |
| |
Net realized gain on - | | | | |
Investments | | | 4,471,183 | |
Foreign currency, forward foreign currency exchange contracts and other assets and liabilities | | | 3,357,849 | |
| | | | |
| | | 7,829,032 | |
| | | | |
| |
Net change in unrealized appreciation (depreciation) on - | | | | |
Investments | | | (104,846,456 | ) |
Foreign currency and other assets and liabilities | | | (61,935 | ) |
| | | | |
| | | (104,908,391 | ) |
| | | | |
| |
NET REALIZED AND UNREALIZED GAIN (LOSS) ON INVESTMENTS | | | (97,079,359 | ) |
| | | | |
NET DECREASE IN NET ASSETS RESULTING FROM OPERATIONS | | $ | (91,330,378 | ) |
| | | | |
| | |
| The accompanying notes are an integral part of the financial statements. | | 13 |
Statements of Changes in Net Assets
| | | | | | | | |
| | | For the
Year Ended
12/31/08 | | | For the
Year Ended
12/31/07 | |
| | | | | | | | |
| INCREASE (DECREASE) IN NET ASSETS: | | | | | | | | |
| | |
| OPERATIONS: | | | | | | | | |
| | |
Net investment income | | $ | 5,748,981 | | | $ | 3,652,210 | |
Net realized gain on investments and foreign currency | | | 7,829,032 | | | | 6,805,411 | |
Net change in unrealized appreciation (depreciation) on investments and foreign currency | | | (104,908,391 | ) | | | 19,022,537 | |
| | | | | | | | |
Net increase (decrease) from operations | | | (91,330,378 | ) | | | 29,480,158 | |
| | | | | | | | |
| DISTRIBUTIONS TO SHAREHOLDERS (Note 8): | | | | | | | | |
| | |
From net investment income | | | (5,329,285 | ) | | | (3,469,574 | ) |
From net realized gain on investments | | | (12,640,693 | ) | | | (2,432,255 | ) |
| | | | | | | | |
Total distributions to shareholders | | | (17,969,978 | ) | | | (5,901,829 | ) |
| | | | | | | | |
| CAPITAL STOCK ISSUED AND REPURCHASED: | | | | | | | | |
| | |
Net increase from capital share transactions (Note 5) | | | 21,493,340 | | | | 30,520,529 | |
| | | | | | | | |
Net increase (decrease) in net assets | | | (87,807,016 | ) | | | 54,098,858 | |
| | |
| NET ASSETS: | | | | | | | | |
| | |
Beginning of year | | | 270,079,546 | | | | 215,980,688 | |
| | | | | | | | |
End of year (including undistributed net investment income of $237,351 and $36,293, respectively) | | $ | 182,272,530 | | | $ | 270,079,546 | |
| | | | | | | | |
| | |
| 14 | | The accompanying notes are an integral part of the financial statements. |
Financial Highlights
| | | | | | | | | | |
| | | For the Years Ended |
| | | 12/31/08 | | 12/31/07 | | 12/31/06 | | 12/31/05 | | 12/31/04 |
| | | | | | | | | | |
| Per share data (for a share outstanding throughout each year): | | | | | | | | | | |
Net asset value - Beginning of year | | $10.87 | | $9.84 | | $9.90 | | $9.52 | | $8.83 |
| | | | | | | | | | |
Income (loss) from investment operations: | | | | | | | | | | |
Net investment income | | 0.22 | | 0.15 | | 0.15 | | 0.11 | | 0.08 |
Net realized and unrealized gain (loss) on investments | | (3.82) | | 1.12 | | 2.01 | | 1.21 | | 1.44 |
| | | | | | | | | | |
Total from investment operations | | (3.60) | | 1.27 | | 2.16 | | 1.32 | | 1.52 |
| | | | | | | | | | |
| | | | | |
Less distributions to shareholders: | | | | | | | | | | |
From net investment income | | (0.21) | | (0.14) | | (0.15) | | (0.11) | | (0.08) |
From net realized gain on investments | | (0.49) | | (0.10) | | (2.07) | | (0.83) | | (0.75) |
| | | | | | | | | | |
Total distributions to shareholders | | (0.70) | | (0.24) | | (2.22) | | (0.94) | | (0.83) |
| | | | | | | | | | |
Net asset value - End of year | | $6.57 | | $10.87 | | $9.84 | | $9.90 | | $9.52 |
| | | | | | | | | | |
Net assets - End of year (000’s omitted) | | $182,273 | | $270,080 | | $215,981 | | $193,168 | | $165,917 |
| | | | | | | | | | |
Total return1 | | (33.25%) | | 13.01% | | 21.96% | | 13.99% | | 17.67% |
Ratios (to average net assets)/
Supplemental Data: | | | | | | | | | | |
Expenses | | 1.15% | | 1.16% | | 1.18% | | 1.24% | | 1.29% |
Net investment income | | 2.49% | | 1.47% | | 1.39% | | 1.10% | | 0.86% |
Portfolio turnover | | 9% | | 20% | | 30% | | 35% | | 19% |
1Represents aggregate total return for the year indicated, and assumes reinvestment of all distributions.
| | |
| The accompanying notes are an integral part of the financial statements. | | 15 |
Notes to Financial Statements
International Series (the “Series”) is a no-load diversified series of Manning & Napier Fund, Inc. (the “Fund”). The Fund is organized in Maryland and is registered under the Investment Company Act of 1940, as amended, as an open-end management investment company.
The Series’ investment objective is to provide long-term growth by investing principally in the common stocks of companies located outside the United States.
The Fund’s Advisor is Manning & Napier Advisors, Inc. (the “Advisor”). Shares of the Series are offered to investors, clients and employees of the Advisor and its affiliates. The Series resumed offering shares directly to investors on May 18, 2004, as it had done previously from time to time. The total authorized capital stock of the Fund consists of 5.0 billion shares of common stock each having a par value of $0.01. As of December 31, 2008, 4.5 billion shares have been designated in total among 28 series, of which 100 million have been designated as International Series Class A common stock.
| 2. | SIGNIFICANT ACCOUNTING POLICIES |
Security Valuation
Portfolio securities, including domestic equities, foreign equities, exchange-traded funds and options, listed on an exchange other than the NASDAQ National Market System are valued at the latest quoted sales price of the exchange on which the security is primarily traded. Securities not traded on valuation date or securities not listed on an exchange are valued at the latest quoted bid price provided by the Fund’s pricing service. Securities listed on the NASDAQ National Market System are valued in accordance with the NASDAQ Official Closing Price.
Securities for which representative valuations or prices are not available from the Fund’s pricing service may be valued at fair value. Due to the inherent uncertainty of valuations of such securities, the fair value may differ significantly from the values that would have been used had a ready market for such securities existed. If trading or events occurring after the close of the principal market in which securities are traded are expected to materially affect the value of those securities, then they may be valued at their fair value, taking this trading or these events into account. Fair value is determined in good faith by the Advisor under procedures approved by and under the general supervision and responsibility of the Fund’s Board of Directors (the “Board”).
Short-term investments that mature in sixty days or less are valued at amortized cost, which approximates market value. Investments in open-end investment companies are valued at their net asset value per share on valuation date, with the exception of exchange-traded funds, which are valued at the closing price on the exchange.
In September 2006, FASB Statement of Financial Accounting Standards No. 157, Fair Value Measurements (“FAS 157”) was issued, effective for fiscal years beginning after November 15, 2007. This standard clarifies the definition of fair value for financial reporting, establishes a framework for measuring fair value and requires additional disclosures about the use of fair value measurements. FAS 157 became effective for the Series as of January 1, 2008, the beginning of its current fiscal year. The three levels of the fair value hierarchy under FAS 157 are described below:
Level 1 - quoted prices in active markets for identical securities
Level 2 - other significant observable inputs (including quoted prices for similar securities, interest rates, prepayment speeds, credit risk, etc.)
Notes to Financial Statements
| 2. | SIGNIFICANT ACCOUNTING POLICIES (continued) |
Security Valuation (continued)
Level 3 - significant unobservable inputs (including the Series’ own assumptions in determining the fair value of investments.)
The inputs or methodology used for valuing securities are not necessarily an indication of the risk associated with investing in those securities. The following is a summary of the inputs used to value the Series’ assets as of December 31, 2008
| | | | | | |
Valuation Inputs | | Investments
in Securities | | Other Financial
instruments* |
Level 1 - Quoted Prices | | $ | 160,601,732 | | $ | — |
Level 2 - Other Significant Observable Inputs | | | 25,274,699 | | | — |
Level 3 - Significant Unobservable Inputs | | | — | | | — |
| | | | | | |
Total | | $ | 185,876,431 | | $ | — |
| | | | | | |
*Other financial instruments are derivative instruments not reflected in the Investment Portfolio, such as futures, forwards and swap contracts, which are valued at the unrealized appreciation/depreciation on the instrument. As of December 31, 2008, the Series did not hold any derivative instruments.
There were no Level 3 securities held by the Series as of December 31, 2007 or December 31, 2008.
Security Transactions, Investment Income and Expenses
Security transactions are accounted for on trade date. Dividend income is recorded on the ex-dividend date, except that if the ex-dividend date has passed, certain dividends from foreign securities are recorded as soon as the Fund is informed of the ex-dividend date. Non-cash dividends, if any, are recorded at the fair market value of the securities received. Interest income, including amortization of premium and accretion of discounts using the effective interest method, is earned from settlement date and accrued daily.
Expenses are recorded on an accrual basis. Most expenses of the Fund can be attributed to a specific series. Expenses which cannot be directly attributed are apportioned among the series in the Fund in such a manner as deemed equitable by the Fund’s Board, taking into consideration, among other things, the nature and type of expense.
The Series uses the identified cost method for determining realized gain or loss on investments for both financial statement and federal income tax reporting purposes.
Foreign Currency Translation
The books and records of the Series are maintained in U.S. dollars. Foreign currencies, investments and other assets and liabilities are translated into U.S. dollars at the current exchange rates. Purchases and sales of investment securities and income and expenses are translated on the respective dates of such transactions. The Series does not isolate realized and unrealized gains and losses attributable to changes in the exchange rates from gains and losses that arise from changes in the market value of investments. Such fluctuations are included with net realized and unrealized gain or loss on investments. Net realized foreign currency gains and losses represent foreign currency gains and losses between trade date and settlement date on securities transactions, gains and losses on disposition of foreign currencies and the difference between the amount of income and foreign withholding taxes recorded on the books of the Series and the amounts actually received or paid.
Notes to Financial Statements
| 2. | SIGNIFICANT ACCOUNTING POLICIES (continued) |
Forward Foreign Currency Exchange Contracts
The Series may purchase or sell forward foreign currency exchange contracts in order to hedge a portfolio position or specific transaction. Risks may arise if the counterparties to a contract are unable to meet the terms of the contract or if the value of the foreign currency moves unfavorably.
All forward foreign currency exchange contracts are adjusted daily by the exchange rate of the underlying currency and, for financial statement purposes, any gain or loss is recorded as unrealized gain or loss until a contract has been closed. Realized and unrealized gain or loss arising from a transaction is included in net realized and unrealized gain (loss) on investments.
The Series may regularly trade forward foreign currency exchange contracts with off-balance sheet risk in the normal course of its investing activities to assist in managing exposure to changes in foreign currency exchange rates.
The notional or contractual amount of these instruments represents the investment the Series has in forward foreign currency exchange contracts and does not necessarily represent the amounts potentially at risk. The measurement of the risks associated with forward foreign currency exchange contracts is meaningful only when all related and offsetting transactions are considered. No such investments were held by the Series on December 31, 2008.
Federal Taxes
The Series’ policy is to comply with the provisions of the Internal Revenue Code applicable to regulated investment companies. The Series is not subject to federal income tax or excise tax to the extent that the Series distributes to shareholders each year its taxable income, including any net realized gains on investments, in accordance with requirements of the Internal Revenue Code. Accordingly, no provision for federal income tax or excise tax has been made in the financial statements.
On June 29, 2007, the Series adopted Financial Accounting Standards Board Interpretation No. 48 - Accounting for Uncertainty in Income Taxes (“FIN 48”). FIN 48 prescribes the minimum recognition threshold a tax position must meet in connection with accounting for uncertainties in income tax positions taken or expected to be taken by an entity before being measured and recognized in the financial statements. Management has determined that the adoption of FIN 48 did not have a material impact on the Series’ financial statements. The Series files income tax returns in the U.S. federal jurisdiction, various states and foreign jurisdictions, as required. No income tax returns are currently under investigation. The statute of limitations on the Series’ tax returns remains open for the years ended December 31, 2005 through December 31, 2008.
Additionally, based on the Fund’s understanding of the tax rules and rates related to income, gains and transactions for foreign jurisdictions in which it invests, the Series will provide for foreign taxes, and where appropriate, deferred foreign tax.
Distributions of Income and Gains
Distributions to shareholders of net investment income and net realized gains are made annually. An additional distribution may be necessary to avoid taxation of the Series. Distributions are recorded on the ex-dividend date.
Notes to Financial Statements
| 2. | SIGNIFICANT ACCOUNTING POLICIES (continued) |
Indemnifications
The Fund’s organizational documents provide former and current directors and officers with a limited indemnification against liabilities arising in connection with the performance of their duties to the Fund. In the normal course of business, the Fund may also enter into contracts that provide general indemnifications. The Fund’s maximum exposure under these arrangements is unknown as this would be dependent on future claims that may be made against the Fund. The risk of material loss from such claims is considered remote.
Other
The preparation of financial statements in conformity with accounting principles generally accepted in the United States of America requires management to make estimates and assumptions that affect the reported amounts of assets and liabilities and the disclosure of contingent assets and liabilities at the date of the financial statements and the reported amounts of income and expenses during the reporting period. Actual results could differ from those estimates.
| 3. | TRANSACTIONS WITH AFFILIATES |
The Fund has an Investment Advisory Agreement (the “Agreement”) with the Advisor, for which the Series pays a fee, computed daily and payable monthly, at an annual rate of 1.00% of the Series’ average daily net assets.
Under the Agreement, personnel of the Advisor provide the Series with advice and assistance in the choice of investments and the execution of securities transactions, and otherwise maintain the Series’ organization. The Advisor also provides the Fund with necessary office space and fund administration and support services. The salaries of all officers of the Fund (except a percentage of the Fund’s Chief Compliance Officer’s salary, which is paid by the Fund), and of all Directors who are “affiliated persons” of the Fund, or of the Advisor, and all personnel of the Fund, or of the Advisor, performing services relating to research, statistical and investment activities, are paid by the Advisor. Each “non-affiliated” Director receives an annual stipend, which is allocated among all the active series of the Fund. In addition, these Directors also receive a fee per Board meeting attended for each active series of the Fund plus a fee for each committee meeting attended.
Manning & Napier Investor Services, Inc., a registered broker-dealer affiliate of the Advisor, acts as distributor for the Fund’s shares. The services of Manning & Napier Investor Services, Inc. are provided at no additional cost to the Series.
For fund accounting and transfer agent services, through October 31, 2008, the Fund paid the Advisor an annual fee of 0.11% of the Fund’s average daily net assets up to $900 million, 0.07% of the Fund’s average daily net assets between $900 million and $1.5 billion, and 0.04% of the Fund’s average daily net assets over $1.5 billion. Effective November 1, 2008, the fee rates are as follows: 0.055% of the Fund’s average daily net assets up to $4.5 billion, 0.03% of the Fund’s average daily net assets between $4.5 billion and $7.5 billion, and 0.02% of the Fund’s average daily net assets over $7.5 billion. Additionally, certain transaction and account-based fees and out-of-pocket expenses, including charges for reporting relating to the Fund’s compliance program, are charged. Expenses not directly attributable to a series are allocated based on each series’ relative net assets or number of accounts, depending on the expense. The Advisor has an agreement with Citi Fund Services Ohio, Inc. (“Citi”) under which Citi serves as sub-accountant and sub-transfer agent.
Notes to Financial Statements
| 4. | PURCHASES AND SALES OF SECURITIES |
For the year ended December 31, 2008, purchases and sales of securities, other than United States Government securities and short-term securities, were $32,874,654 and $17,938,459, respectively. There were no purchases or sales of United States Government securities.
| 5. | CAPITAL STOCK TRANSACTIONS |
Transactions in shares of International Series were:
| | | | | | | | | | | | | | |
| | | For the Year
Ended 12/31/08 | | | For the Year
Ended 12/31/07 | |
| | | Shares | | | Amount | | | Shares | | | Amount | |
| | | | | | | | | | | | | | |
Sold | | 3,218,386 | | | $ | 29,077,214 | | | 3,568,001 | | | $ | 37,679,971 | |
Reinvested | | 2,584,702 | | | | 17,625,216 | | | 546,829 | | | | 5,789,599 | |
Repurchased | | (2,903,240 | ) | | | (25,209,090 | ) | | (1,215,615 | ) | | | (12,949,041 | ) |
| | | | | | | | | | | | | | |
Total | | 2,899,848 | | | $ | 21,493,340 | | | 2,899,215 | | | $ | 30,520,529 | |
| | | | | | | | | | | | | | |
Substantially all of the Series’ shares represent investments by fiduciary accounts over which the Advisor has sole investment discretion.
The Series may trade in financial instruments with off-balance sheet risk in the normal course of its investing activities to assist in managing exposure to various market risks. These financial instruments include written options, forward foreign currency exchange contracts and futures contracts and may involve, to a varying degree, elements of risk in excess of the amounts recognized for financial statement purposes. No such investments were held by the Series on December 31, 2008.
Investing in securities of foreign companies and foreign governments involves special risks and considerations not typically associated with investing in securities of domestic companies and the United States Government. These risks include revaluation of currencies and future adverse political and economic developments. Moreover, securities of foreign companies and foreign governments and their markets may be less liquid and their prices more volatile than those of comparable domestic companies and the United States Government.
| 8. | FEDERAL INCOME TAX INFORMATION |
The amount and characterization of certain income and capital gains to be distributed are determined in accordance with federal income tax regulations, which may differ from accounting principles generally accepted in the United States of America. These differences are primarily due to differing book and tax treatments in the timing of the recognition of net investment income or gains and losses, including foreign currency gains and losses, investments in passive foreign investment companies and Post-October losses. The Series may periodically make reclassifications among its capital accounts to reflect income and gains available for distribution (or available capital loss carryovers) under income tax regulations, without impacting the Series’ net asset value. Any such reclassifications are not reflected in the financial highlights.
Notes to Financial Statements
| 8. | FEDERAL INCOME TAX INFORMATION (continued) |
The tax character of distributions paid were as follows:
| | | | | | |
| | | For the Year
Ended 12/31/08 | | For the Year
Ended 12/31/07 |
Ordinary income | | $ | 8,571,250 | | $ | 5,217,302 |
Long-term capital gains | | | 9,398,728 | | | 684,527 |
For the year ended December 31, 2008, the Series elected to defer $6 of currency losses attributable to Post-October losses.
At December 31, 2008, the tax basis components of distributable earnings and the net unrealized depreciation based on identified cost for federal income tax purposes were as follows:
| | | | |
Cost for federal income tax purposes | | $ | 206,812,018 | |
Unrealized appreciation | | $ | 21,658,778 | |
Unrealized depreciation | | $ | (42,594,365 | ) |
| | | | |
Net unrealized depreciation | | $ | (20,935,587 | ) |
Undistributed ordinary income | | | 329,590 | |
| 9. | RECENT ACCOUNTING PRONOUNCEMENTS |
In September 2008, FASB Staff Position No. FAS 133-1 and FIN 45-4, “Disclosures about Credit Derivatives and Certain Guarantees: An Amendment of FASB Statement No. 133 and FASB Interpretation No. 45” (the “Position”) was issued and is effective for fiscal years and interim periods beginning after November 15, 2008. The Position amends FASB Statement No. 133 (“FAS 133”), Accounting for Derivative Instruments and Hedging Activities, and also amends FASB Interpretation No. 45 (“FIN 45”), Guarantor’s Accounting and Disclosure Requirements for Guarantees, Including Indirect Guarantees of Indebtedness of Others. The amendments to FAS 133 include required disclosure for (i) the nature and terms of the credit derivative, reasons for entering into the credit derivative, the events or circumstances that would require the seller to perform under the credit derivative, and the current status of the payment performance risk of the credit derivative, (ii) the maximum potential amount of future payments (undiscounted) the seller could be required to make under the credit derivative, (iii) the fair value of the credit derivative, and (iv) the nature of any recourse provisions and assets held either as collateral or by third parties. The amendments to FIN 45 require additional disclosures about the current status of the payment/performance risk of a guarantee. At this time, Management is evaluating the implications of FAS 133-1 and FIN 45-4, but they are not expected to materially impact the Series’ financial statements.
In March 2008, FASB Statement of Financial Accounting Standards No. 161, Disclosures about Derivative Instruments and Hedging Activities (“FAS 161”) was issued and is effective for fiscal years and interim periods beginning after November 15, 2008. FAS 161 requires enhanced disclosures about the Series’ derivative and hedging activities, including how such activities are accounted for and their effect on the Series’ financial position and performance. Management is currently evaluating the impact of the adoption of FAS 161, but it is not expected to materially impact the Series’ financial statements.
Report of Independent Registered Public Accounting Firm
To the Board of Directors of Manning & Napier Fund, Inc. and Shareholders of International Series:
In our opinion, the accompanying statement of assets and liabilities, including the investment portfolio, and the related statements of operations and of changes in net assets and the financial highlights present fairly, in all material respects, the financial position of the International Series (a series of Manning & Napier Fund, Inc., hereafter referred to as the “Series”) at December 31, 2008, and the results of its operations for the year then ended, the changes in its net assets for each of the two years in the period then ended and the financial highlights for each of the five years in the period then ended, in conformity with accounting principles generally accepted in the United States of America. These financial statements and financial highlights (hereafter referred to as “financial statements”) are the responsibility of the Series’ management; our responsibility is to express an opinion on these financial statements based on our audits. We conducted our audits of these financial statements in accordance with the standards of the Public Company Accounting Oversight Board (United States). Those standards require that we plan and perform the audit to obtain reasonable assurance about whether the financial statements are free of material misstatement. An audit includes examining, on a test basis, evidence supporting the amounts and disclosures in the financial statements, assessing the accounting principles used and significant estimates made by management, and evaluating the overall financial statement presentation. We believe that our audits, which included confirmation of securities at December 31, 2008 by correspondence with the custodian and brokers, provide a reasonable basis for our opinion.

Columbus, Ohio
February 13, 2009
Supplemental Tax Information (unaudited)
For federal income tax purposes, the Series designates for the current fiscal year $7,265,369 or, if different, the maximum amount allowable under the tax law as qualified dividend income.
Pursuant to Section 852 of the Internal Revenue Code, as amended, the Series hereby designates $9,398,728 as capital gains for its taxable year ended December 31, 2008.
Renewal of Investment Advisory Agreement (unaudited)
At the Manning & Napier Fund, Inc. (the “Fund”) Board of Directors’ (the “Board”) meeting, held on November 5, 2008, the Investment Advisory Agreement (the “Agreement”) between the Fund and Manning & Napier Advisors, Inc. (the “Advisor”) was reviewed by the Board for renewal. In connection with the decision whether to renew the Agreement, a variety of material was prepared for and reviewed by the Board.
Representatives of the Advisor attended the meeting and presented additional oral and written information to the Board to assist the Board in its considerations. The discussion immediately below outlines the materials and information presented to the Board in connection with the Board’s 2008 Annual Review of the Agreement and the conclusions made by the Directors when determining to continue the Agreement.
| | • | | The Board considered the services provided by the Advisor under the Agreement including, among others: deciding what securities to purchase and sell for each Series; arranging for the purchase and sale of such securities by placing orders with broker-dealers; administering the affairs of the Fund (including the books and records of the Fund not maintained by third party service providers such as the custodian or sub-transfer agent); arranging for the insurance coverage for the Fund; and supervising the preparation of tax returns, SEC filings (including registration statements) and reports to shareholders for the Fund. The Board also considered the nature and quality of such services provided under the Agreement in light of the Advisor’s services provided to the Fund for 22 years. The Board discussed the quality of these services with representatives from the Advisor and concluded that the Advisor was performing its services to the Fund required under the Agreement in a reasonable manner. |
| | • | | The Board considered the investment performance of the various Series of the Fund. The investment performance for each Series was reviewed on a cumulative basis since inception and on a one year basis. In addition, annualized performance for the following time periods was considered: inception, three year, five year, ten year, and current market cycle. A market cycle includes periods of both rising and falling markets. Returns for established benchmark indices for each Series were provided for each time period. The Board noted that the various Series were competitive against their respective benchmarks and/or peer groups over various time periods, but in particular over the full market cycle period relevant for the Series. In addition, the Board considered at the meeting (and considers on a quarterly basis) a peer group performance analysis consisting of Morningstar universes of mutual funds with similar investment objectives. The Board discussed the performance with representatives from the Advisor and concluded that the investment performance of each of the Fund’s Series was reasonable based on the Fund’s actual performance and comparative performance, especially performance over the current market cycle. |
| | • | | The Board considered the costs of the Advisor’s services and the profits of the Advisor as they relate to the Advisor’s services to the Fund under the Agreement. In reviewing the Advisor’s costs and profits, the Board discussed the Advisor’s revenues generated from the Fund (on both an actual and adjusted basis) and its expenses associated with providing the services under the Agreement. In addition, the Board reviewed the Advisor’s expenses associated with Fund activities outside of the Agreement (such as expense reimbursements pursuant to expense caps and payments made by the Advisor to third party platforms on which shares of the Fund are available for purchase). It was noted by representatives of the Advisor that 15 of the 25 active Series of the Fund are |
Renewal of Investment Advisory Agreement (unaudited)
| | currently experiencing expenses above the capped expense ratios. After discussing the above costs and profits, the Board concluded that the Advisor’s profitability relating to its services provided under the Agreement was reasonable. |
| | • | | The Board considered the fees and expenses of the various Series of the Fund. The Advisor presented the advisory fees and total expenses for each Series, including the advisory fee adjusted for any expense waivers or reimbursements (either contractual or voluntary) paid by the Advisor. The advisory fees and expense ratios of each Series were compared to an average (on both a mean and median basis) of similar funds as disclosed on the Morningstar database. Representatives of the Advisor discussed with the Board the levels of its advisory fee for each Series of the Fund and as compared to the median and mean advisory fees for similar funds as listed on Morningstar. Expense ratios for every Series, except the High Yield Bond Series, Global Fixed Income Series and the Target Series Class R and Class C, are currently below the median and mean for similar funds as listed on Morningstar. Based on their review of the information provided, the Board concluded that the fees and expenses of each Series of the Fund were reasonable on a comparative basis. |
| | • | | The Board also considered the other benefits the Advisor derives from its relationship with the Fund. Such other benefits include certain research products provided by soft dollars. Given the level of soft dollar transactions involving the Fund, the Board concluded that these additional benefits to the Advisor were reasonable. |
| | • | | In addition to the factors described above, the Board considered the Advisor’s personnel, investment strategies, policies and procedures relating to compliance with personal securities transactions, and reputation, expertise and resources in domestic and foreign financial markets. The Board concluded that these factors support the conclusion that the Advisor performs its services in a reasonable manner. |
| | • | | The Board did not consider economies of scale at this time because of the multiple uses of the Fund (for the Advisor’s discretionary investment account clients in addition to direct investors), the current profitability of the Advisor’s services to the Fund under the Agreement, and the overall size of the Fund complex. |
Based on the Board’s deliberations and their evaluation of the information described above, the Board, including a majority of Directors that are not “interested persons” as defined in the Investment Company Act of 1940, concluded that the compensation under the Agreement was fair and reasonable in light of the services and expenses and such other matters as the Directors considered to be relevant in the exercise of their reasonable judgment. Accordingly, the Board approved the renewal of the Agreement. In the course of their deliberations, the Directors did not identify any particular information that was all important or controlling.
Directors’ and Officers’ Information (unaudited)
The Statement of Additional Information provides additional information about the Fund’s directors and officers and can be obtained without charge by calling 1-800-466-3863, at www.manningnapieradvisors.com, or on the EDGAR Database on the SEC Internet web site (http://www.sec.gov). The following chart shows certain information about the Fund’s officers and directors, including their principal occupations during the last five years. Unless specific dates are provided, the individuals have held the listed positions for longer than five years.
INTERESTED DIRECTOR/OFFICER
| | |
| Name: | | B. Reuben Auspitz* |
| Address: | | 290 Woodcliff Drive Fairport, NY 14450 |
| Age: | | 61 |
| Current Position(s) Held with Fund: | | Principal Executive Officer, President, Chairman & Director |
| Term of Office1 & Length of Time Served: | | Indefinite - Director since 1984; Vice President 1984 - 2003; President since 2004; Principal Executive Officer since 2002 |
| Principal Occupation(s) During Past 5 Years: | | Executive Vice President; Co-Executive Director; Executive Group Member**; Chief Compliance Officer since 2004 - Manning & Napier Advisors, Inc. President; Director - Manning & Napier Investor Services, Inc. Holds or has held one or more of the following titles for various subsidiaries and affiliates: President, Vice President, Director, Chairman, Treasurer, Chief Compliance Officer or Member. |
| Number of Portfolios Overseen within Fund Complex: | | 28 |
| Other Directorships Held Outside Fund Complex: | | N/A |
| |
| INDEPENDENT DIRECTORS | | |
| |
| Name: | | Stephen B. Ashley |
| Address: | | 290 Woodcliff Drive Fairport, NY 14450 |
| Age: | | 68 |
| Current Position(s) Held with Fund: | | Director, Audit Committee Member, Governance & Nominating Committee Member |
| Term of Office & Length of Time Served: | | Indefinite - Since 1996 |
| Principal Occupation(s) During Past 5 Years: | | Chairman, Director, President & Chief Executive Officer, The Ashley Group (property management and investment). Chairman (non-executive) 2004-2008; Director 1995-2008 - Fannie Mae (mortgage) |
| Number of Portfolios Overseen within Fund Complex: | | 28 |
| Other Directorships Held Outside Fund Complex: | | The Ashley Group |
| Name: | | Peter L. Faber |
| Address: | | 290 Woodcliff Drive Fairport, NY 14450 |
| Age: | | 70 |
| Current Position(s) Held with Fund: | | Director, Governance & Nominating Committee Member |
| Term of Office & Length of Time Served: | | Indefinite - Since 1987 |
| Principal Occupation(s) During Past 5 Years: | | Senior Counsel, McDermott, Will & Emery LLP (law firm) |
| Number of Portfolios Overseen within Fund Complex: | | 28 |
| Other Directorships Held Outside Fund Complex: | | Partnership for New York City, Inc.
New York Collegium
Boston Early Music Festival |
| Name: | | Harris H. Rusitzky |
| Address: | | 290 Woodcliff Drive Fairport, NY 14450 |
| Age: | | 73 |
| Current Position(s) Held with Fund: | | Director, Audit Committee Member, Governance & Nominating Committee Member |
| Term of Office & Length of Time Served: | | Indefinite - Since 1985 |
| Principal Occupation(s) During Past 5 Years: | | President, The Greening Group (business consultants); Partner, The Restaurant Group (restaurants) |
| Number of Portfolios Overseen within Fund Complex: | | 28 |
| Other Directorships Held Outside Fund Complex: | | N/A |
Directors’ and Officers’ Information (unaudited)
INDEPENDENT DIRECTORS (continued)
| | |
| |
| Name: | | Paul A. Brooke |
| Address: | | 290 Woodcliff Drive |
| | Fairport, NY 14450 |
| Age: | | 63 |
| Current Position(s) Held with Fund: | | Director, Audit Committee Member, Governance & Nominating Committee Member |
| Term of Office & Length of Time Served: | | Indefinite - Since 2007 |
| Principal Occupation(s) During Past 5 Years: | | Chairman & CEO, Alsius Corp. (investments); Managing Member, PMSV Holdings LLC (investments) |
| Number of Portfolios Overseen within Fund Complex: | | 28 |
| Other Directorships Held Outside Fund Complex: | | Incyte Corp.
ViroPharma, Inc.
HLTH Corp.
Cheyne Captial International
MPM Bio-equities
GMP Companies
HoustonPharma |
OFFICERS
| | |
| |
| Name: | | Jeffrey S. Coons, Ph.D., CFA |
| Address: | | 290 Woodcliff Drive
Fairport, NY 14450 |
| Age: | | 45 |
| Current Position(s) Held with Fund: | | Vice President |
| Term of Office1 & Length of Time Served: | | Since 2004 |
| Principal Occupation(s) During Past 5 Years: | | Co-Director of Research since 2002 & Executive Group Member**, Manning & Napier Advisors, Inc. Holds one or more of the following titles for various subsidiaries and affiliates: President, Director, Treasurer or Senior Trust Officer. |
| Number of Portfolios Overseen within Fund Complex: | | 28 |
| Other Directorships Held Outside Fund Complex: | | N/A |
| Name: | | Christine Glavin |
| Address: | | 290 Woodcliff Drive
Fairport, NY 14450 |
| Age: | | 42 |
| Current Position(s) Held with Fund: | | Principal Financial Officer, Chief Financial Officer |
| Term of Office1��& Length of Time Served: | | Principal Financial Officer since 2002; Chief Financial Officer since 2001 |
| Principal Occupation(s) During Past 5 Years: | | Fund Reporting Manager, Manning & Napier Advisors, Inc. |
| Number of Portfolios Overseen within Fund Complex: | | 28 |
| Other Directorships Held Outside Fund Complex: | | N/A |
| Name: | | Jodi L. Hedberg |
| Address: | | 290 Woodcliff Drive Fairport, NY 14450 |
| Age: | | 41 |
| Current Position(s) Held with Fund: | | Corporate Secretary, Chief Compliance Officer, Anti-Money Laundering Compliance Officer |
| Term of Office1 & Length of Time Served: | | Corporate Secretary since 1997; Chief Compliance Officer since 2004 |
| Principal Occupation(s) During Past 5 Years: | | Director of Compliance, Manning & Napier Advisors, Inc. and affiliates; Corporate Secretary, Manning & Napier Investor Services, Inc. since 2006 |
| Number of Portfolios Overseen within Fund Complex: | | 28 |
| Other Directorships Held Outside Fund Complex: | | N/A |
*Interested Director, within the meaning of the Investment Company Act of 1940 by reason of his position with the Fund’s investment advisor and distributor. Mr. Auspitz serves as the Executive Vice President and Director, Manning & Napier Advisors, Inc. and President and Director, Manning & Napier Investor Services, Inc., the Fund’s distributor.
**The Executive Group performs the duties of the Office of the Chief Executive of Manning & Napier Advisors, Inc.
1The term of office for President, Vice President, Chief Financial Officer, and Corporate Secretary is one year and until their respective successors are chosen and qualified. All other officers’ terms are indefinite.
(THISPAGEINTENTIONALLYLEFTBLANK)
(THISPAGEINTENTIONALLYLEFTBLANK)
Literature Requests (unaudited)
Proxy Voting Policies and Procedures
A description of the policies and procedures that the Fund uses to determine how to vote proxies relating to portfolio securities is available, without charge, upon request:
| | |
By phone | | 1-800-466-3863 |
On the Securities and Exchange Commission’s (SEC) web site | | http://www.sec.gov |
Proxy Voting Record
Information regarding how the Fund voted proxies relating to portfolio securities during the most recent 12-month period ended June 30th is available, without charge, upon request:
| | |
By phone | | 1-800-466-3863 |
On the SEC’s web site | | http://www.sec.gov |
Quarterly Portfolio Holdings
The Series’ complete schedule of portfolio holdings for the 1st and 3rd quarters of each fiscal year are provided on Form N-Q, and are available, without charge, upon request:
| | |
By phone | | 1-800-466-3863 |
On the SEC’s web site | | http://www.sec.gov |
The Series’ Form N-Q may be reviewed and copied at the SEC’s Public Reference Room in Washington, D.C. Information on the operation of the Public Reference Room may be obtained by calling 1-800-SEC-0330.
Prospectus and Statement of Additional Information (SAI)
The prospectus and SAI provide additional information about each Series, including charges, expenses and risks. These documents are available, without charge, upon request:
| | |
By phone | | 1-800-466-3863 |
On the SEC’s web site | | http://www.sec.gov |
On the Advisor’s web site | | http://www.manningnapieradvisors.com |
Additional information available at www.manningnapieradvisors.com
1. Fund Holdings - Month-End
2. Fund Holdings - Quarter-End
3. Shareholder Report - Annual
4. Shareholder Report - Semi-Annual
Manning & Napier Fund, Inc.
| | | | |
| CORE BOND SERIES | | | | | Annual Report - December 31, 2008 |

Management Discussion and Analysis (unaudited)
Dear Shareholders:
Credit risk is defined rather innocuously by Bloomberg as “the risk that an obligation will not be completed, with the result being a loss”. That hardly does it justice. In 2008, investors became intimately acquainted with credit risk, the problems it can create and, more importantly, the losses it can inflict. The greater the investor’s exposure to credit risk in 2008, the worse his or her relative performance happened to be. In the fixed income arena, credit risk is most prevalent in the corporate bond market; last year, investors in the high yield area lost more than 30%; investors in the investment-grade market lost more then 5%. Credit risk is also quite prevalent in the growing market for commercial mortgage-backed securities (CMBS); last year that market lost 17%.
A definition of credit risk that is more specific to the bond market is the risk of loss due to a debtor’s non-payment of a loan or some other line of credit, either the principal or interest/coupon, or both. The credit problems that engulfed the financial markets first started to show in the real estate area, specifically in subprime mortgages. They then spread to those that trafficked in such securities, hedge funds and investment banks, subsequently engulfed Fannie Mae and Freddie Mac, and sucked in commercial banks and assorted insurance companies, culminating in a full fledged credit crisis that defined the fourth quarter of 2008.
The markets were already struggling when the year began given the credit missteps that had surfaced in the prior year. Those problems carried over into the first quarter of 2008; however, it became apparent that they had begun to spill over into the overall economy. The situation was exacerbated by a concurrent spike in commodity prices. The problems led to the mid-March fire sale of a major Wall Street firm, Bear Stearns, to JP Morgan Chase that was brokered by the Federal Reserve.
As the credit crisis became more pronounced, investors reigned in their risk tolerances, which resulted in wider credit spreads (the difference in yields as compared to the U.S. Treasuries) in both the corporate bond and the municipal bond markets. It also drove U.S. T-bill yields to 50 year lows, caused the auction rate securities market to collapse, and contributed to the implosion of numerous hedge funds. As the prices of oil, gold, and other commodities increased, inflation risks were re-awakened, lowering risk tolerances even more.
Early in September, Fannie Mae and Freddie Mac, the two largest government sponsored entities, were forced into conservatorship, whereby the U.S. Government took control over both entities, along with their $5 trillion of financial obligations. The markets spent a week digesting that, and then came the week of September 14th, which will go down as one of the most cataclysmic weeks in the history of the financial markets.
On Sunday of that week, Lehman Brothers announced that it would file for bankruptcy. That news was quickly followed by more bad news, including the quick sale of Merrill Lynch to Bank of America, bankruptcy fears at insurer AIG, and a money market fund “breaking the buck.” The environment was so bad that the yield on 3-month U.S. Treasury Bills, universally considered to be the risk-free investment, was driven down to 0.02% as investors scrambled to find a safe harbor.
In hindsight, the Lehman bankruptcy seemed to be a watershed event that pushed the credit markets and U.S. economy over the precipice. The moves in the financial markets during the quarter were just as dismal. In the equity markets, both the Dow Industrial Index and Standard & Poor’s (S&P) 500 Total Return Index were down more than 20% for the quarter; the NASDAQ Composite was down 25%. It wasn’t just the equity markets that struggled, the corporate bond market and the municipal bond market both sold off quite dramatically. There was, however, a glimmer of hope, when both exhibited signs of recovery as the quarter and the year came to a close.
One market that did not struggle last year was the U.S. Treasury market; during times of economic stress, Treasuries typically benefit as investors seek out a safe-haven. The moves were magnified in 2008 with U.S. Treasury Bill rates
Management Discussion and Analysis (unaudited)
dropping to zero and longer-term Treasury yields dropping when the Federal Reserve suggested that that it would consider purchasing Treasuries outright. From the end of October through the end of December, 10-year U.S. Treasury yields fell almost in half, dropping from a yield of about 4% to a yield of about 2%. On a total return basis, U.S. Treasuries were up 8.95% in the fourth quarter, and 13.98% for the calendar year.
The Core Bond Series returned 1.66% in 2008. Those returns lagged the Merrill Lynch U.S. Corporate, Government & Mortgage Index, which includes all U.S. Treasury, U.S. Agency, investment-grade corporate bonds, and plain vanilla mortgage-backed securities with maturities of more than 1-year; it returned 6.20% in 2008. The Series’ underperformance versus the benchmark was strictly a function of the aforementioned strong performance of the U.S. Treasury market. An equally weighted portfolio of the Merrill Corporate Index and the Merrill Mortgage-Backed Index would have only returned 0.74%. The strong relative outperformance of U.S. Treasuries was an unprecedented phenomenon; historically, securities with yields above Treasuries tend to outperform Treasuries.
Over the longer-term, interest rates and spreads will fluctuate; sometimes the cyclical and/or policy pressures will push them both higher, sometimes they will push both lower, and other times, the various factors can push them in opposite directions. The key to investment success requires the investor to remain focused on the secular trends and the fundamental forces that drive each, an approach that we apply to all of our investment decisions.
As always, we appreciate your business.
Sincerely,
Manning & Napier Advisors, Inc.
Performance Update as of December 31, 2008 (unaudited)
| | | | | | |
| | | Average Annual Total Returns
As of December 31, 2008 | | |
| | | One
Year | | Since
Inception1 | | |
Manning & Napier Fund, Inc. - Core Bond Series2 | | 1.66% | | 3.42% | | |
Merrill Lynch U.S. Corporate, Government & Mortgage Index3 | | 6.20% | | 5.32% | | |
The following graph compares the value of a $10,000 investment in the Manning & Napier Fund, Inc. - Core Bond Series from its inception1 (4/21/05) to present (12/31/08) to the Merrill Lynch U.S. Corporate, Government & Mortgage Index.
1Performance numbers for the Series and Index are calculated from April 21, 2005, the Series’ inception date.
2The Series’ performance does not reflect the deduction of taxes that a shareholder would pay on fund distributions or the redemption of shares. The Series’ performance is historical and may not be indicative of future results. The performance returns shown are inclusive of the net expense ratio of the Series. For the year ended December 31, 2008, this net expense ratio was 0.80%. The gross expense ratio, which does not account for any voluntary or contractual waivers currently in effect, was 0.83% for the year ended December 31, 2008.
3The unmanaged Merrill Lynch U.S. Corporate, Government & Mortgage Index is a market value weighted measure that represents U.S. government, corporate, and pass-through securities issued by entities within the United States, by supranational entities, or by entities headquartered outside of the United States but who have issued dollar-denominated securities within the United States. The Index only includes investment-grade securities with maturities of greater than one year. The Index returns assume reinvestment of coupons and, unlike Series returns, do not reflect any fees of expenses.
Shareholder Expense Example (unaudited)
As a shareholder of the Series, you may incur two types of costs: (1) transaction costs, including potential wire charges on redemptions and (2) ongoing costs, including management fees and other Series expenses. This example is intended to help you understand your ongoing costs (in dollars) of investing in the Series and to compare these costs with the ongoing costs of investing in other mutual funds.
The example is based on an investment of $1,000 invested at the beginning of the period and held for the entire period (July 1, 2008 to December 31, 2008).
Actual Expenses
The first line of the table below provides information about actual account values and actual expenses. You may use the information in this line, together with the amount you invested, to estimate the expenses that you paid over the period. Simply divide your account value by $1,000 (for example, an $8,600 account value divided by $1,000 = 8.6), then multiply the result by the number in the first line under the heading entitled “Expenses Paid During Period” to estimate the expenses you paid on your account during this period.
Hypothetical Example for Comparison Purposes
The second line of the table below provides information about hypothetical account values and hypothetical expenses based on the Series’ actual expense ratio and an assumed rate of return of 5% per year before expenses, which is not the Series’ actual return. The hypothetical account values and expenses may not be used to estimate the actual ending account balance or expenses you paid during the period. You may use this information to compare the ongoing costs of investing in the Series and other funds. To do so, compare this 5% hypothetical example with the 5% hypothetical examples that appear in the shareholder reports of the other funds.
Please note that the expenses shown in the table are meant to highlight your ongoing costs only and do not reflect any transaction costs, such as potential wire charges on redemptions. Therefore, the second line of the table is useful in comparing ongoing costs only, and will not help you determine the relative total costs of owning different funds. In addition, if these transaction costs were included, your costs would have been higher.
| | | | | | | | | |
| | | Beginning
Account Value
7/1/08 | | Ending
Account Value
12/31/08 | | Expenses Paid
During Period*
7/1/08-12/31/08 |
Actual | | $ | 1,000.00 | | $ | 1,023.70 | | $ | 4.07 |
Hypothetical
(5% return before expenses) | | $ | 1,000.00 | | $ | 1,021.11 | | $ | 4.06 |
*Expenses are equal to the Series’ annualized expense ratio (for the six-month period) of 0.80%, multiplied by the average account value over the period, multiplied by 184/366 (to reflect the one-half year period). Expenses are based on the most recent fiscal half year; therefore, the expense ratio stated above may differ from the expense ratio stated in the financial highlights, which is based on one-year data. The Series’ total return would have been lower had certain expenses not been waived during the period.
Portfolio Composition as of December 31, 2008 (unaudited)
Sector Allocation1
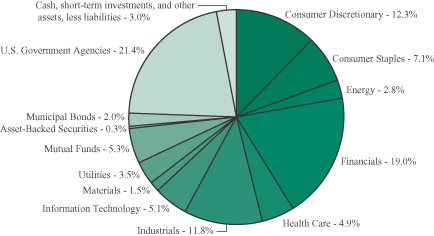
1As a percentage of net assets.
Credit Quality Ratings2,3
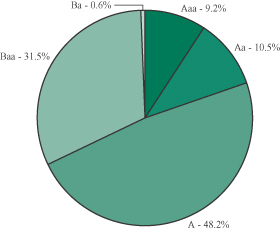
2As a percentage of total corporate bonds, preferred stock, asset backed securities, and municipal bonds.
3Based on ratings from Moody’s, or the S&P equivalent. The Series may use different ratings provided by other rating agencies for purposes of determining compliance with the Series’ investment policies.
Investment Portfolio - December 31, 2008
| | | | | | | | | |
| | | Credit
Rating1
(unaudited) | | | Principal
Amount | | Value
(Note 2) |
| | | | | | | | | |
| | |
CORPORATE BONDS - 65.7% | | | | | | | |
| | |
Convertible Corporate Bonds - 3.2% | | | | | | | |
Consumer Discretionary - 0.5% | | | | | | | |
Hotels, Restaurants & Leisure - 0.5% | | | | | | | |
Carnival Corp., 2.00%, 4/15/2021 | | A3 | | | $ | 305,000 | | $ | 275,262 |
| | | | | | | | | |
Health Care - 1.1% | | | | | | | | | |
Biotechnology - 0.9% | | | | | | | | | |
Amgen, Inc., 0.375%, 2/1/2013 | | A3 | | | | 530,000 | | | 504,163 |
| | | | | | | | | |
Health Care Equipment & Supplies - 0.2% | | | | | | | | | |
Medtronic, Inc., 1.625%, 4/15/2013 | | A1 | | | | 120,000 | | | 105,900 |
| | | | | | | | | |
Total Health Care | | | | | | | | | 610,063 |
| | | | | | | | | |
Information Technology - 1.6% | | | | | | | |
Computers & Peripherals - 0.7% | | | | | | | |
EMC Corp., 1.75%, 12/1/2013 | | A | 2 | | | 395,000 | | | 369,325 |
| | | | | | | | | |
Software - 0.9% | | | | | | | | | |
Amdocs Ltd., 0.50%, 3/15/2024 (Guernsey) (Note 7) | | Baa3 | | | | 465,000 | | | 459,188 |
| | | | | | | | | |
Total Information Technology | | | | | | | | | 828,513 |
| | | | | | | | | |
Total Convertible Corporate Bonds
(Identified Cost $1,965,901) | | | | | | | | | 1,713,838 |
| | | | | | | | | |
| |
Non-Convertible Corporate Bonds - 62.5% | | | |
Consumer Discretionary - 11.8% | | | | | | | |
Hotels, Restaurants & Leisure - 1.0% | | | | | | | |
McDonald’s Corp., 5.35%, 3/1/2018 | | A3 | | | | 525,000 | | | 545,362 |
| | | | | | | | | |
Household Durables - 1.0% | | | | | | | |
Fortune Brands, Inc., 5.375%, 1/15/2016 | | Baa2 | | | | 650,000 | | | 542,914 |
| | | | | | | | | |
Media - 5.2% | | | | | | | | | |
AOL Time Warner (now known as Time Warner, Inc.), 7.625%, 4/15/2031 | | Baa2 | | | | 510,000 | | | 501,233 |
British Sky Broadcasting Group plc, 8.20%, 7/15/2009 | | Baa2 | | | | 505,000 | | | 513,354 |
Comcast Corp.3, 5.11875%, 7/14/2009 | | Baa2 | | | | 145,000 | | | 143,019 |
Comcast Corp., 6.50%, 11/15/2035 | | Baa2 | | | | 570,000 | | | 567,287 |
Comcast Corp., 6.95%, 8/15/2037 | | Baa2 | | | | 290,000 | | | 305,385 |
The Walt Disney Co.3, 2.28938%, 9/10/2009 | | A2 | | | | 400,000 | | | 397,390 |
The Walt Disney Co., 7.00%, 3/1/2032 | | A2 | | | | 280,000 | | | 329,266 |
| | | | | | | | | |
| | | | | | | | | 2,756,934 |
| | | | | | | | | |
Multiline Retail - 1.0% | | | | | | | | | |
Target Corp., 5.875%, 3/1/2012 | | A2 | | | | 505,000 | | | 512,667 |
| | | | | | | | | |
| | |
| 6 | | The accompanying notes are an integral part of the financial statements. |
Investment Portfolio - December 31, 2008
| | | | | | | | |
| | | Credit
Rating1
(unaudited) | | Principal
Amount | | Value
(Note 2) |
| | | | | | | | |
| | |
CORPORATE BONDS (continued) | | | | | | |
| |
Non-Convertible Corporate Bonds (continued) | | | |
Specialty Retail - 2.8% | | | | | | | | |
Home Depot, Inc.3, 2.04625%, 12/16/2009 | | Baa1 | | $ | 450,000 | | $ | 425,129 |
Home Depot, Inc., 5.40%, 3/1/2016 | | Baa1 | | | 635,000 | | | 568,274 |
Lowe’s Companies, Inc., 8.25%, 6/1/2010 | | A1 | | | 485,000 | | | 503,812 |
| | | | | | | | |
| | | | | | | | 1,497,215 |
| | | | | | | | |
Textiles, Apparel & Luxury Goods - 0.8% | | | | | | | | |
VF Corp., 5.95%, 11/1/2017 | | A3 | | | 485,000 | | | 439,974 |
| | | | | | | | |
Total Consumer Discretionary | | | | | | | | 6,295,066 |
| | | | | | | | |
Consumer Staples - 7.1% | | | | | | | | |
Beverages - 2.3% | | | | | | | | |
The Coca-Cola Co., 5.35%, 11/15/2017 | | Aa3 | | | 535,000 | | | 577,216 |
Pepsico, Inc., 7.90%, 11/1/2018 | | Aa2 | | | 535,000 | | | 655,721 |
| | | | | | | | |
| | | | | | | | 1,232,937 |
| | | | | | | | |
Food & Staples Retailing - 1.8% | | | | | | | | |
The Kroger Co., 7.25%, 6/1/2009 | | Baa2 | | | 215,000 | | | 217,261 |
The Kroger Co., 6.75%, 4/15/2012 | | Baa2 | | | 510,000 | | | 514,773 |
The Kroger Co., 5.50%, 2/1/2013 | | Baa2 | | | 230,000 | | | 227,929 |
| | | | | | | | |
| | | | | | | | 959,963 |
| | | | | | | | |
Food Products - 3.0% | | | | | | | | |
General Mills, Inc.3, 4.18875%, 1/22/2010 | | Baa1 | | | 500,000 | | | 480,248 |
General Mills, Inc., 6.00%, 2/15/2012 | | Baa1 | | | 510,000 | | | 529,058 |
Kraft Foods Inc., 6.125%, 2/1/2018 | | Baa2 | | | 565,000 | | | 553,642 |
| | | | | | | | |
| | | | | | | | 1,562,948 |
| | | | | | | | |
Total Consumer Staples | | | | | | | | 3,755,848 |
| | | | | | | | |
Energy - 2.8% | | | | | | | | |
Energy Equipment & Services - 1.0% | | | | | | |
Baker Hughes, Inc., 7.50%, 11/15/2018 | | A2 | | | 490,000 | | | 543,242 |
| | | | | | | | |
Oil, Gas & Consumable Fuels - 1.8% | | | | | | | | |
Anadarko Petroleum Corp., 5.95%, 9/15/2016 | | Baa3 | | | 455,000 | | | 401,906 |
Apache Corp., 6.90%, 9/15/2018 | | A3 | | | 510,000 | | | 552,286 |
| | | | | | | | |
| | | | | | | | 954,192 |
| | | | | | | | |
Total Energy | | | | | | | | 1,497,434 |
| | | | | | | | |
Financials - 16.7% | | | | | | | | |
Capital Markets - 4.1% | | | | | | |
The Goldman Sachs Group, Inc., 4.50%, 6/15/2010 | | A1 | | | 250,000 | | | 246,347 |
The Goldman Sachs Group, Inc., 6.345%, 2/15/2034 | | A2 | | | 640,000 | | | 464,419 |
Merrill Lynch & Co., Inc., 4.125%, 9/10/2009 | | A2 | | | 350,000 | | | 346,966 |
| | |
| The accompanying notes are an integral part of the financial statements. | | 7 |
Investment Portfolio - December 31, 2008
| | | | | | | | |
| | | Credit
Rating1
(unaudited) | | Principal
Amount | | Value
(Note 2) |
| | | | | | | | |
| | |
CORPORATE BONDS (continued) | | | | | | |
| |
Non-Convertible Corporate Bonds (continued) | | | |
Financials (continued) | | | | | | | | |
Capital Markets (continued) | | | | | | |
Merrill Lynch & Co., Inc., 6.11%, 1/29/2037 | | A3 | | $ | 230,000 | | $ | 206,753 |
Morgan Stanley, 3.875%, 1/15/2009 | | A2 | | | 450,000 | | | 449,465 |
Morgan Stanley, 5.55%, 4/27/2017 | | A2 | | | 572,000 | | | 472,349 |
| | | | | | | | |
| | | | | | | | 2,186,299 |
| | | | | | | | |
Commercial Banks - 7.3% | | | | | | | | |
Household Finance Co. (now known as HSBC Finance Corp.), 6.375%, 11/27/2012 | | Aa3 | | | 95,000 | | | 92,946 |
HSBC Financial Corp., 7.00%, 5/15/2012 | | Aa3 | | | 700,000 | | | 701,063 |
Manufacturers & Traders Trust Co., 6.625%, 12/4/2017 | | A2 | | | 720,000 | | | 669,905 |
PNC Bank National Association, 5.25%, 1/15/2017 | | A1 | | | 880,000 | | | 834,139 |
U.S. Bank National Association, 6.375%, 8/1/2011 | | Aa2 | | | 625,000 | | | 650,177 |
Wachovia Corp., 6.375%, 2/1/2009 | | A2 | | | 115,000 | | | 114,773 |
Wachovia Corp., 3.625%, 2/17/2009 | | Aa3 | | | 275,000 | | | 274,169 |
Wachovia Corp., 5.25%, 8/1/2014 | | A1 | | | 590,000 | | | 549,593 |
| | | | | | | | |
| | | | | | | | 3,886,765 |
| | | | | | | | |
Consumer Finance - 2.3% | | | | | | |
American Express Centurion, 4.375%, 7/30/2009 | | A1 | | | 480,000 | | | 472,536 |
American Express Credit Co.4, 2.04875%, 10/4/2010 | | A1 | | | 415,000 | | | 371,284 |
Toyota Motor Credit Corp.3, 10.00%, 5/4/2022 | | Aaa | | | 400,000 | | | 340,000 |
| | | | | | | | |
| | | | | | | | 1,183,820 |
| | | | | | | | |
Diversified Financial Services - 0.7% | | | | | | |
Bank of America Corp. Capital Trust VI, 5.625%, 3/8/2035 | | Aa3 | | | 455,000 | | | 382,239 |
| | | | | | | | |
Insurance - 2.3% | | | | | | |
Ambac Financial Group, Inc., 5.95%, 12/5/2035 | | Ba1 | | | 820,000 | | | 244,500 |
American International Group, Inc., 4.25%, 5/15/2013 | | A3 | | | 660,000 | | | 486,411 |
International Lease Finance Corp., 3.50%, 4/1/2009 | | Baa1 | | | 500,000 | | | 474,753 |
| | | | | | | | |
| | | | | | | | 1,205,664 |
| | | | | | | | |
Total Financials | | | | | | | | 8,844,787 |
| | | | | | | | |
Health Care - 3.8% | | | | | | | | |
Pharmaceuticals - 3.8% | | | | | | |
Abbott Laboratories, 3.50%, 2/17/2009 | | A1 | | | 265,000 | | | 265,377 |
Abbott Laboratories, 5.60%, 11/30/2017 | | A1 | | | 495,000 | | | 535,679 |
Johnson & Johnson, 5.15%, 7/15/2018 | | Aaa | | | 515,000 | | | 567,093 |
| | |
| 8 | | The accompanying notes are an integral part of the financial statements. |
Investment Portfolio - December 31, 2008
| | | | | | | | |
| | | Credit
Rating1
(unaudited) | | Principal
Amount | | Value
(Note 2) |
| | | | | | | | |
| | |
CORPORATE BONDS (continued) | | | | | | |
| |
Non-Convertible Corporate Bonds (continued) | | | |
Health Care (continued) | | | | | | | | |
Pharmaceuticals (continued) | | | | | | |
Wyeth, 6.50%, 2/1/2034 | | A3 | | $ | 575,000 | | $ | 637,593 |
| | | | | | | | |
Total Health Care | | | | | | | | 2,005,742 |
| | | | | | | | |
Industrials - 11.8% | | | | | | | | |
Aerospace & Defense - 1.7% | | | | | | |
Boeing Capital Corp., 6.50%, 2/15/2012 | | A2 | | | 310,000 | | | 316,844 |
Honeywell International, Inc., 5.30%, 3/1/2018 | | A2 | | | 560,000 | | | 571,355 |
| | | | | | | | |
| | | | | | | | 888,199 |
| | | | | | | | |
Air Freight & Logistics - 1.4% | | | | | | |
FedEx Corp., 3.50%, 4/1/2009 | | Baa2 | | | 210,000 | | | 209,278 |
United Parcel Service, Inc., 5.50%, 1/15/2018 | | Aa2 | | | 530,000 | | | 566,112 |
| | | | | | | | |
| | | | | | | | 775,390 |
| | | | | | | | |
Airlines - 0.9% | | | | | | |
Southwest Airlines Co., 5.25%, 10/1/2014 | | Baa1 | | | 610,000 | | | 460,175 |
| | | | | | | | |
Commercial Services & Supplies - 0.4% | | | |
Waste Management Inc., 7.375%, 8/1/2010 | | Baa3 | | | 190,000 | | | 192,544 |
| | | | | | | | |
Industrial Conglomerates - 2.5% | | | | | | |
General Electric Capital Corp., 5.625%, 5/1/2018 | | Aaa | | | 350,000 | | | 352,537 |
General Electric Capital Corp., 6.75%, 3/15/2032 | | Aaa | | | 575,000 | | | 611,355 |
General Electric Co., 5.25%, 12/6/2017 | | Aaa | | | 370,000 | | | 368,870 |
| | | | | | | | |
| | | | | | | | 1,332,762 |
| | | | | | | | |
Machinery - 2.8% | | | | | | | | |
Caterpillar Financial Service Corp., 7.05%, 10/1/2018 | | A2 | | | 525,000 | | | 552,577 |
John Deere Capital Corp.3, 2.24250%, 9/1/2009 | | A2 | | | 145,000 | | | 141,272 |
John Deere Capital Corp., 5.50%, 4/13/2017 | | A2 | | | 225,000 | | | 214,669 |
John Deere Capital Corp., 5.75%, 9/10/2018 | | A2 | | | 590,000 | | | 574,243 |
| | | | | | | | |
| | | | | | | | 1,482,761 |
| | | | | | | | |
Road & Rail - 2.1% | | | | | | | | |
CSX Corp., 6.00%, 10/1/2036 | | Baa3 | | | 730,000 | | | 578,186 |
Union Pacific Corp., 5.65%, 5/1/2017 | | Baa2 | | | 575,000 | | | 551,615 |
| | | | | | | | |
| | | | | | | | 1,129,801 |
| | | | | | | | |
Total Industrials | | | | | | | | 6,261,632 |
| | | | | | | | |
Information Technology - 3.5% | | | | | | | | |
Communications Equipment - 2.4% | | | | | | | | |
Cisco Systems, Inc., 5.25%, 2/22/2011 | | A1 | | | 205,000 | | | 212,817 |
Cisco Systems, Inc., 5.50%, 2/22/2016 | | A1 | | | 515,000 | | | 545,476 |
| | |
| The accompanying notes are an integral part of the financial statements. | | 9 |
Investment Portfolio - December 31, 2008
| | | | | | | | |
| | | Credit
Rating1
(unaudited) | | Principal
Amount/
Shares | | Value
(Note 2) |
| | | | | | | | |
| | |
CORPORATE BONDS (continued) | | | | | | |
| |
Non-Convertible Corporate Bonds (continued) | | | |
Information Technology (continued) | | | | | | | | |
Communications Equipment (continued) | | | | | | | | |
Corning, Inc., 6.20%, 3/15/2016 | | Baa1 | | $ | 610,000 | | $ | 521,409 |
| | | | | | | | |
| | | | | | | | 1,279,702 |
| | | | | | | | |
Computers & Peripherals - 1.1% | | | | | | | | |
IBM Corp., 5.70%, 9/14/2017 | | A1 | | | 530,000 | | | 566,631 |
| | | | | | | | |
Total Information Technology | | | | | | | | 1,846,333 |
| | | | | | | | |
Materials - 1.5% | | | | | | | | |
Chemicals - 1.0% | | | | | | | | |
Dupont EI Nemour, 6.00%, 7/15/2018 | | A2 | | | 535,000 | | | 561,902 |
| | | | | | | | |
Metals & Mining - 0.5% | | | | | | | | |
Alcoa, Inc., 5.87%, 2/23/2022 | | Baa1 | | | 350,000 | | | 248,141 |
| | | | | | | | |
Total Materials | | | | | | | | 810,043 |
| | | | | | | | |
Utilities - 3.5% | | | | | | | | |
Electric Utilities - 2.0% | | | | | | | | |
American Electric Power Co., Inc., 5.375%, 3/15/2010 | | Baa2 | | | 515,000 | | | 511,221 |
Exelon Generation Co. LLC, 5.35%, 1/15/2014 | | A3 | | | 580,000 | | | 529,766 |
| | | | | | | | |
| | | | | | | | 1,040,987 |
| | | | | | | | |
Multi-Utilities - 1.5% | | | | | | | | |
CenterPoint Energy Resources Corp., 7.875%, 4/1/2013 | | Baa3 | | | 335,000 | | | 310,308 |
Duke Energy Field Services LLC (now known as DCP Midstream LLC), 7.875%, 8/16/2010 | | Baa2 | | | 280,000 | | | 275,273 |
Sempra Energy, 7.95%, 3/1/2010 | | Baa1 | | | 210,000 | | | 212,226 |
| | | | | | | | |
| | | | | | | | 797,807 |
| | | | | | | | |
Total Utilities | | | | | | | | 1,838,794 |
| | | | | | | | |
Total Non-Convertible Corporate Bonds
(Identified Cost $33,808,208) | | | | | | | | 33,155,679 |
| | | | | | | | |
TOTAL CORPORATE BONDS
(Identified Cost $35,774,109) | | | | | | | | 34,869,517 |
| | | | | | | | |
| | | |
PREFERRED STOCKS - 2.3% | | | | | | | | |
Financials - 2.3% | | | | | | | | |
Commerical Banks - 1.0% | | | | | | | | |
PNC Financial Services Group, Inc. - Series K | | A3 | | | 290,000 | | | 233,680 |
Wells Fargo & Co. - Series K | | A3 | | | 315,000 | | | 268,506 |
| | | | | | | | |
| | | | | | | | 502,186 |
| | | | | | | | |
| | |
| 10 | | The accompanying notes are an integral part of the financial statements. |
Investment Portfolio - December 31, 2008
| | | | | | | | | |
| | | Credit
Rating1
(unaudited) | | | Shares/
Principal
Amount | | Value
(Note 2) |
| | | | | | | | | |
| | | |
PREFERRED STOCKS (continued) | | | | | | | | | |
Financials (continued) | | | | | | | | | |
Diversified Financial Services - 1.3% | | | | | | | | | |
Bank of America Corp. - Series K | | A1 | | | | 315,000 | | $ | 226,576 |
Citigroup, Inc., - Series E | | Baa3 | | | | 340,000 | | | 224,498 |
JPMorgan Chase & Co. - Series 1 | | A1 | | | | 295,000 | | | 245,390 |
| | | | | | | | | |
| | | | | | | | | 696,464 |
| | | | | | | | | |
TOTAL PREFERRED STOCKS
(Identified Cost $1,291,763) | | | | | | | | | 1,198,650 |
| | | | | | | | | |
| | | |
ASSET-BACKED SECURITIES - 0.3% | | | | | | | | | |
College Loan Corporation Trust, 3.645%3, 4/25/2016
(Identified Cost $159,347) | | Aaa | | | $ | 159,609 | | | 159,709 |
| | | | | | | | | |
| | | |
MUNICIPAL BONDS - 2.0% | | | | | | | | | |
Burleson Texas Independent School District, School Building, G.O. Bond, 5.00%, 8/1/2038 | | Aaa | | | | 250,000 | | | 241,748 |
Canyon Independent School District, G.O. Bond, 4.50%, 2/15/2030 | | AAA | 2 | | | 100,000 | | | 89,818 |
Chapel Hill Texas Independent School District, School Building, G.O. Bond, 4.50%, 8/15/2032 | | Aaa | | | | 100,000 | | | 89,909 |
Commerce Independent School District, School Building, G.O. Bond, 4.50%, 8/15/2037 | | Aaa | | | | 100,000 | | | 87,745 |
Harlandale Independent School District, School Building, G.O. Bond, 4.75%, 8/15/2036 | | Aaa | | | | 100,000 | | | 92,884 |
Katy Texas Independent School District, School Building, Series B, G.O. Bond, 4.50%, 2/15/2031 | | Aaa | | | | 100,000 | | | 89,203 |
Keller Independent School District, School Building, G.O. Bond, 4.75%, 8/15/2032 | | Aaa | | | | 100,000 | | | 94,564 |
Spring Hill Texas Independent School District, School Building, G.O Bond, 5.00%, 2/15/2038 | | AAA | 2 | | | 250,000 | | | 241,797 |
| | | | | | | | | |
TOTAL MUNICIPAL BONDS
(Identified Cost $1,069,447) | | | | | | | | | 1,027,668 |
| | | | | | | | | |
| | | |
MUTUAL FUNDS - 5.3% | | | | | | | | | |
iShares iBoxx Investment Grade Corporate Bond Fund
(Identified Cost $2,537,042) | | | | | | 27,760 | | | 2,821,804 |
| | | | | | | | | |
| | | |
U.S. GOVERNMENT AGENCIES - 21.4% | | | | | | | | | |
Mortgage-Backed Securities - 21.4% | | | | | | | | | |
Fannie Mae, Pool #762352, 5.00%, 4/1/2019 | | | | | | 14,839 | | | 15,290 |
Fannie Mae, Pool #255274, 5.00%, 6/1/2019 | | | | | | 13,886 | | | 14,309 |
Fannie Mae, Pool #256114, 4.50%, 1/1/2021 | | | | | | 339,093 | | | 347,510 |
Fannie Mae, Pool #881624, 4.50%, 1/1/2021 | | | | | | 277,348 | | | 284,232 |
| | |
| The accompanying notes are an integral part of the financial statements. | | 11 |
Investment Portfolio - December 31, 2008
| | | | | | | | |
| | | | | Principal
Amount/
Shares | | Value
(Note 2) |
| | | | | | | | |
| | | |
U.S. GOVERNMENT AGENCIES (continued) | | | | | | | | |
Mortgage-Backed Securities (continued) | | | | | | | | |
Fannie Mae, Pool #902047, 5.00%, 11/1/2021 | | | | $ | 874,762 | | $ | 899,619 |
Fannie Mae, Pool #912409, 5.00%, 2/1/2022 | | | | | 130,322 | | | 134,025 |
Fannie Mae, Pool #254375, 6.50%, 7/1/2022 | | | | | 3,270 | | | 3,416 |
Federal Home Loan Mortgage Corp., Pool #M90974, 4.50%, 3/1/2010 | | | | | 49,608 | | | 49,985 |
Federal Home Loan Mortgage Corp., Pool #G12419, 5.00%, 10/1/2021 | | | | | 161,333 | | | 165,918 |
Federal Home Loan Mortgage Corp., Pool #G18182, 5.50%, 5/1/2022 | | | | | 584,944 | | | 603,277 |
Federal Home Loan Mortgage Corp., Pool #G12833, 4.50%, 9/1/2022 | | | | | 1,347,861 | | | 1,380,264 |
Federal Home Loan Mortgage Corp., Pool #J06711, 5.00%, 1/1/2023 | | | | | 1,558,159 | | | 1,601,860 |
Federal Home Loan Mortgage Corp., Pool #A52716, 6.50%, 10/1/2036 | | | | | 1,262,851 | | | 1,313,167 |
Federal Home Loan Mortgage Corp., Pool #A62373, 5.00%, 6/1/2037 | | | | | 2,887,901 | | | 2,954,644 |
Federal Home Loan Mortgage Corp., Pool #G03447, 5.50%, 10/1/2037 | | | | | 1,371,250 | | | 1,405,084 |
GNMA, Pool #487193, 5.00%, 4/15/2020 | | | | | 66,846 | | | 70,051 |
GNMA, Pool #563559, 6.50%, 4/15/2032 | | | | | 46,706 | | | 49,092 |
GNMA, Pool #631703, 6.50%, 9/15/2034 | | | | | 75,376 | | | 78,615 |
| | | | | | | | |
TOTAL U.S. GOVERNMENT AGENCIES
(Identified Cost $10,932,622) | | | | | | | | 11,370,358 |
| | | | | | | | |
| | | |
SHORT-TERM INVESTMENTS - 1.9% | | | | | | | | |
Dreyfus Cash Management, Inc. - Institutional Shares
(Identified Cost $1,014,490) | | | | | 1,014,490 | | | 1,014,490 |
| | | | | | | | �� |
TOTAL INVESTMENTS - 98.9%
(Identified Cost $52,778,820) | | | | | | | | 52,462,196 |
| | | |
OTHER ASSETS, LESS LIABILITIES - 1.1% | | | | | | | | 608,476 |
| | | | | | | | |
NET ASSETS - 100% | | | | | | | $ | 53,070,672 |
| | | | | | | | |
Key:
G.O. Bond - General Obligation Bond
1Credit ratings from Moody’s (unaudited).
2Credit ratings from S&P (unaudited).
3The coupon rate is a floating rate and is subject to change quarterly. The coupon rate stated is the rate as of December 31, 2008.
4The coupon rate is a floating rate and is subject to change monthly. The coupon rate stated is the rate as of December 31, 2008.
| | |
| 12 | | The accompanying notes are an integral part of the financial statements. |
Statement of Assets and Liabilities
December 31, 2008
| | | | |
ASSETS: | | | | |
| | | | |
| |
Investments, at value (identified cost, $52,778,820) (Note 2) | | $ | 52,462,196 | |
Interest receivable | | | 633,800 | |
Dividends receivable | | | 41,735 | |
| | | | |
TOTAL ASSETS | | | 53,137,731 | |
| | | | |
| LIABILITIES: | | | | |
| |
Accrued management fees (Note 3) | | | 27,748 | |
Accrued fund accounting and transfer agent fees (Note 3) | | | 3,052 | |
Accrued Chief Compliance Officer service fees (Note 3) | | | 485 | |
Audit fees payable | | | 30,827 | |
Other payables and accrued expenses | | | 4,947 | |
| | | | |
TOTAL LIABILITIES | | | 67,059 | |
| | | | |
TOTAL NET ASSETS | | $ | 53,070,672 | |
| | | | |
NET ASSETS CONSIST OF: | | | | |
| |
Capital stock | | $ | 54,761 | |
Additional paid-in-capital | | | 54,385,738 | |
Undistributed net investment income | | | 9,911 | |
Accumulated net realized loss on investments | | | (1,063,114 | ) |
Net unrealized depreciation on investments | | | (316,624 | ) |
| | | | |
TOTAL NET ASSETS | | $ | 53,070,672 | |
| | | | |
NET ASSET VALUE, OFFERING PRICE AND REDEMPTION
PRICE PER SHARE ($53,070,672/5,476,115 shares) | | $ | 9.69 | |
| | | | |
| | |
| The accompanying notes are an integral part of the financial statements. | | 13 |
Statement of Operations
For the Year Ended December 31, 2008
| | | | |
INVESTMENT INCOME: | | | | |
| | | | |
| |
Interest | | $ | 2,649,204 | |
Dividends | | | 120,304 | |
| | | | |
Total Investment Income | | | 2,769,508 | |
| | | | |
| EXPENSES: | | | | |
| |
Management fees (Note 3) | | | 300,333 | |
Fund accounting and transfer agent fees (Note 3) | | | 36,482 | |
Directors’ fees (Note 3) | | | 12,599 | |
Chief Compliance Officer service fees (Note 3) | | | 4,301 | |
Audit fees | | | 30,700 | |
Custodian fees | | | 5,300 | |
Miscellaneous | | | 24,739 | |
| | | | |
Total Expenses | | | 414,454 | |
Less reduction of expenses (Note 3) | | | (13,938 | ) |
| | | | |
Net Expenses | | | 400,516 | |
| | | | |
NET INVESTMENT INCOME | | | 2,368,992 | |
| | | | |
| REALIZED AND UNREALIZED LOSS ON INVESTMENTS: | | | | |
Net realized loss on investments | | | (1,063,114 | ) |
Net change in unrealized appreciation (depreciation) on investments | | | (377,532 | ) |
| | | | |
| |
NET REALIZED AND UNREALIZED LOSS ON INVESTMENTS | | | (1,440,646 | ) |
| | | | |
NET INCREASE IN NET ASSETS RESULTING FROM OPERATIONS | | $ | 928,346 | |
| | | | |
| | |
| 14 | | The accompanying notes are an integral part of the financial statements. |
Statements of Changes in Net Assets
| | | | | | | | |
| | | For the
Year Ended
12/31/08 | | | For the
Year Ended
12/31/07 | |
| | | | | | | | |
| INCREASE (DECREASE) IN NET ASSETS: | | | | | | | | |
| | |
| OPERATIONS: | | | | | | | | |
| | |
Net investment income | | $ | 2,368,992 | | | $ | 1,975,387 | |
Net realized gain (loss) on investments | | | (1,063,114 | ) | | | 580,680 | |
Net change in unrealized appreciation (depreciation) on investments | | | (377,532 | ) | | | 87,790 | |
| | | | | | | | |
Net increase from operations | | | 928,346 | | | | 2,643,857 | |
| | | | | | | | |
| DISTRIBUTIONS TO SHAREHOLDERS (Note 8): | | | | | | | | |
| | |
From net investment income | | | (2,422,528 | ) | | | (1,978,671 | ) |
From net realized gain on investments | | | (247,034 | ) | | | (300,431 | ) |
| | | | | | | | |
Total distributions to shareholders | | | (2,669,562 | ) | | | (2,279,102 | ) |
| | | | | | | | |
| CAPITAL STOCK ISSUED AND REPURCHASED: | | | | | | | | |
| | |
Net increase from capital share transactions
(Note 5) | | | 4,903,137 | | | | 3,847,920 | |
| | | | | | | | |
Net increase in net assets | | | 3,161,921 | | | | 4,212,675 | |
| | |
| NET ASSETS: | | | | | | | | |
| | |
Beginning of year | | | 49,908,751 | | | | 45,696,076 | |
| | | | | | | | |
End of year (including undistributed net investment income of $9,911 and $4,622, respectively) | | $ | 53,070,672 | | | $ | 49,908,751 | |
| | | | | | | | |
| | |
| The accompanying notes are an integral part of the financial statements. | | 15 |
Financial Highlights
| | | | | | | | |
| | | For the Years Ended | | For the
Period 4/21/051
to 12/31/05 |
| | | 12/31/08 | | 12/31/07 | | 12/31/06 | |
| | | | | | | | |
| | | | | | | | |
| Per share data (for a share outstanding throughout each period): | | | | | | | | |
Net asset value - Beginning of period | | $10.05 | | $9.98 | | $9.89 | | $10.00 |
| | | | | | | | |
Income (loss) from investment operations: | | | | | | | | |
Net investment income | | 0.45 | | 0.42 | | 0.36 | | 0.21 |
Net realized and unrealized gain (loss) on investments | | (0.30) | | 0.13 | | 0.09 | | (0.11) |
| | | | | | | | |
Total from investment operations | | 0.15 | | 0.55 | | 0.45 | | 0.10 |
| | | | | | | | |
| | | | |
Less distributions to shareholders: | | | | | | | | |
From net investment income | | (0.46) | | (0.42) | | (0.36) | | (0.21) |
From net realized gain on investments | | (0.05) | | (0.06) | | — | | — |
| | | | | | | | |
Total distributions to shareholders | | (0.51) | | (0.48) | | (0.36) | | (0.21) |
| | | | | | | | |
Net asset value - End of period | | $9.69 | | $10.05 | | $9.98 | | $9.89 |
| | | | | | | | |
Net assets - End of period (000’s omitted) | | $53,071 | | $49,909 | | $45,696 | | $28,578 |
| | | | | | | | |
Total return2 | | 1.66% | | 5.58% | | 4.51% | | 0.98% |
| Ratios (to average net assets)/Supplemental Data: | | | | | | | | |
Expenses* | | 0.80% | | 0.80% | | 0.80% | | 0.80%3 |
Net investment income | | 4.73% | | 4.21% | | 3.87% | | 3.08%3 |
Portfolio turnover | | 53% | | 346% | | 313% | | 293% |
|
*The investment advisor did not impose all of its management fee. If these expenses had been incurred by the Series, the expense ratio (to average net assets) would have been increased by the following amount: |
| | 0.03% | | 0.04% | | 0.08% | | 0.20%3 |
1Commencement of operations.
2Represents aggregate total return for the period indicated, and assumes reinvestment of all distributions. Total return would have been lower had certain expenses not been waived during the period. Periods less than one year are not annualized.
3Annualized.
| | |
| 16 | | The accompanying notes are an integral part of the financial statements. |
Notes to Financial Statements
Core Bond Series (the “Series”) is a no-load non-diversified series of Manning & Napier Fund, Inc. (the “Fund”). The Fund is organized in Maryland and is registered under the Investment Company Act of 1940, as amended, as an open-end management investment company.
The Series’ investment objective is to provide long-term total return by investing primarily in investment-grade bonds and other financial instruments, including derivatives, with economic characteristics similar to bonds.
The Fund’s Advisor is Manning & Napier Advisors, Inc. (the “Advisor”). Shares of the Series are offered to investors, clients and employees of the Advisor and its affiliates. The total authorized capital stock of the Fund consists of 5.0 billion shares of common stock each having a par value of $0.01. As of December 31, 2008, 4.5 billion shares have been designated in total among 28 series, of which 125 million have been designated as Core Bond Series Class A common stock.
| 2. | SIGNIFICANT ACCOUNTING POLICIES |
Security Valuation
Portfolio securities, including domestic equities, listed on an exchange other than the NASDAQ National Market System are valued at the latest quoted sales price of the exchange on which the security is primarily traded. Securities not traded on valuation date or securities not listed on an exchange are valued at the latest quoted bid price provided by the Fund’s pricing service. Securities listed on the NASDAQ National Market System are valued in accordance with the NASDAQ Official Closing Price.
Debt securities, including government bonds, sovereign bonds, corporate bonds and mortgage-backed securities, will normally be valued on the basis of evaluated bid prices provided by an independent pricing service. Certain investments in securities held by the Series may be valued on a basis of a price provided by a principal market maker. These prices may differ from the value that would have been used had a broader market for securities existed.
Municipal securities will normally be valued on the basis of market valuations provided by an independent pricing service that utilizes the latest price quotations and a matrix system (which considers such factors as security prices of similar securities, yields, maturities and ratings).
Securities for which representative valuations or prices are not available from the Fund’s pricing service may be valued at fair value. Due to the inherent uncertainty of valuations of such securities, the fair value may differ significantly from the values that would have been used had a ready market for such securities existed. If trading or events occurring after the close of the principal market in which securities are traded are expected to materially affect the value of those securities, then they may be valued at their fair value, taking this trading or these events into account. Fair value is determined in good faith by the Advisor under procedures approved by and under the general supervision and responsibility of the Fund’s Board of Directors (the “Board”).
Short-term investments that mature in sixty days or less are valued at amortized cost, which approximates market value. Investments in open-end investment companies are valued at their net asset value per share on valuation date.
In September 2006, FASB Statement of Financial Accounting Standards No. 157, Fair Value Measurements (“FAS 157”) was issued, effective for fiscal years beginning after November 15,
Notes to Financial Statements
| 2. | SIGNIFICANT ACCOUNTING POLICIES (continued) |
Security Valuation (continued)
2007. This standard clarifies the definition of fair value for financial reporting, establishes a framework for measuring fair value and requires additional disclosures about the use of fair value measurements. FAS 157 became effective for the Series as of January 1, 2008, the beginning of its current fiscal year. The three levels of the fair value hierarchy under FAS 157 are described below:
Level 1 - quoted prices in active markets for identical securities
Level 2 - other significant observable inputs (including quoted prices for similar securities, interest rates, prepayment speeds, credit risk, etc.)
Level 3 - significant unobservable inputs (including the Series’ own assumptions in determining the fair value of investments.)
The inputs or methodology used for valuing securities are not necessarily an indication of the risk associated with investing in those securities. The following is a summary of the inputs used to value the Series’ assets as of December 31, 2008:
| | | | | | |
Valuation Inputs | | Investments In
Securities | | Other Financial
Instruments* |
| | | | | | |
Level 1 - Quoted Prices | | $ | 3,836,294 | | $ | — |
Level 2 - Other Significant Observable Inputs | | | 48,625,902 | | | — |
Level 3 - Significant Unobservable Inputs | | | — | | | — |
| | | | | | |
Total | | $ | 52,462,196 | | $ | — |
| | | | | | |
*Other financial instruments are derivative instruments not reflected in the Investment Portfolio, such as futures, forwards and swap contracts, which are valued at the unrealized appreciation/depreciation on the instrument. As of December 31, 2008, the Series did not hold any derivative instruments.
There were no Level 3 securities held by the Series as of December 31, 2007 or December 31, 2008.
Security Transactions, Investment Income and Expenses
Security transactions are accounted for on trade date. Interest income, including amortization of premium and accretion of discounts using the effective interest method, is earned from settlement date and accrued daily. Dividend income is recorded on an accrual basis on ex-dividend date.
Expenses are recorded on an accrual basis. Most expenses of the Fund can be attributed to a specific series. Expenses which cannot be directly attributed are apportioned among the series in the Fund in such a manner as deemed equitable by the Fund’s Board, taking into consideration, among other things, the nature and type of expense.
The Series uses the identified cost method for determining realized gain or loss on investments for both financial statement and federal income tax reporting purposes.
Securities Purchased on a When-Issued Basis or Forward Commitment
The Series may purchase securities on a when-issued basis or forward commitment. These transactions involve a commitment by the Series to purchase securities for a predetermined price with payment and delivery taking place beyond the customary settlement period. When such purchases are outstanding, the Series will designate liquid assets in an amount sufficient to meet the purchase price. When purchasing a security on a delayed delivery basis, the Series assumes
Notes to Financial Statements
| 2. | SIGNIFICANT ACCOUNTING POLICIES (continued) |
Securities Purchased on a When-Issued Basis or Forward Commitment (continued)
the rights and risks of ownership of the security, including the risk of price and yield fluctuations, and takes such fluctuations into account when determining its net asset value. The Series may sell the when-issued securities before they are delivered, which may result in a capital gain or loss. No such investments were held by the Series on December 31, 2008.
In connection with its ability to purchase or sell securities on a forward commitment basis, the Series may enter into forward roll transactions principally using To Be Announced (TBA) securities. Forward roll transactions require the sale of securities for delivery in the current month, and a simultaneous agreement to repurchase substantially similar (same type, coupon and maturity) securities on a specified future date. Risks of entering into forward roll transactions include the potential inability of the counterparty to meet the terms of the agreement; the potential of the Series to receive inferior securities at redelivery as compared to the securities sold to the counterparty; counterparty credit risk; and the potential pay down speed variance between the mortgage-backed pools. During the roll period, the Series forgoes principal and interest paid on the securities. The Series accounts for such dollar rolls as purchases and sales. No such investments were held by the Series on December 31, 2008.
Restricted Securities
Restricted securities are purchased in private placement transactions, are not registered under the Securities Act of 1933, as amended, and may have contractual restrictions on resale. No such investments were held by the Series on December 31, 2008.
Illiquid Securities
A security may be considered illiquid if so deemed in good faith by the Advisor under procedures approved by and under the general supervision and responsibility of the Fund’s Board. No such investments were held by the Series on December 31, 2008.
Federal Taxes
The Series’ policy is to comply with the provisions of the Internal Revenue Code applicable to regulated investment companies. The Series is not subject to federal income tax or excise tax to the extent that the Series distributes to shareholders each year its taxable income, including any net realized gains on investments, in accordance with requirements of the Internal Revenue Code. Accordingly, no provision for federal income tax or excise tax has been made in the financial statements.
On June 29, 2007, the Series adopted Financial Accounting Standards Board Interpretation No. 48 - Accounting for Uncertainty in Income Taxes (“FIN 48”). FIN 48 prescribes the minimum recognition threshold a tax position must meet in connection with accounting for uncertainties in income tax positions taken or expected to be taken by an entity before being measured and recognized in the financial statements. Management has determined that the adoption of FIN 48 did not have a material impact on the Series’ financial statements. The Series files income tax returns in the U.S. federal jurisdiction, various states and foreign jurisdictions, as required. No income tax returns are currently under investigation. The statute of limitations on the Series’ tax returns remains open for the years ended December 31, 2005 through December 31, 2008.
Additionally, based on the Fund’s understanding of the tax rules and rates related to income, gains and transactions for foreign jurisdictions in which it invests, the Series will provide for foreign taxes, and where appropriate, deferred foreign tax.
Notes to Financial Statements
| 2. | SIGNIFICANT ACCOUNTING POLICIES (continued) |
Distributions of Income and Gains
Distributions to shareholders of net investment income and net realized gains are made annually. An additional distribution may be necessary to avoid taxation of the Series. Distributions are recorded on the ex-dividend date.
Indemnifications
The Fund’s organizational documents provide former and current directors and officers with a limited indemnification against liabilities arising in connection with the performance of their duties to the Fund. In the normal course of business, the Fund may also enter into contracts that provide general indemnifications. The Fund’s maximum exposure under these arrangements is unknown as this would be dependent on future claims that may be made against the Fund. The risk of material loss from such claims is considered remote.
Other
The preparation of financial statements in conformity with accounting principles generally accepted in the United States of America requires management to make estimates and assumptions that affect the reported amounts of assets and liabilities and the disclosure of contingent assets and liabilities at the date of the financial statements and the reported amounts of income and expenses during the reporting period. Actual results could differ from those estimates.
| 3. | TRANSACTIONS WITH AFFILIATES |
The Fund has an Investment Advisory Agreement (the “Agreement”) with the Advisor, for which the Series pays a fee, computed daily and payable monthly, at an annual rate of 0.60% of the Series’ average daily net assets.
Under the Agreement, personnel of the Advisor provide the Series with advice and assistance in the choice of investments and the execution of securities transactions, and otherwise maintain the Series’ organization. The Advisor also provides the Fund with necessary office space and fund administration and support services. The salaries of all officers of the Fund (except a percentage of the Fund’s Chief Compliance Officer’s salary, which is paid by the Fund), and of all Directors who are “affiliated persons” of the Fund, or of the Advisor, and all personnel of the Fund, or of the Advisor, performing services relating to research, statistical and investment activities, are paid by the Advisor. Each “non-affiliated” Director receives an annual stipend, which is allocated among all the active series of the Fund. In addition, these Directors also receive a fee per Board meeting attended for each active series of the Fund plus a fee for each committee meeting attended.
The Advisor has contractually agreed, until at least April 30, 2010, to waive its fee and, if necessary, pay other operating expenses of the Series in order to maintain total direct annual fund operating expenses for the Series at no more than 0.80% of average daily net assets each year. Accordingly, the Advisor waived fees of $13,938 for the year ended December 31, 2008, which is reflected as a reduction of expenses on the Statement of Operations. The Advisor is not eligible to recoup any expenses that have been waived or reimbursed in prior years.
Manning & Napier Investor Services, Inc., a registered broker-dealer affiliate of the Advisor, acts as distributor for the Fund’s shares. The services of Manning & Napier Investor Services, Inc. are provided at no additional cost to the Series.
Notes to Financial Statements
| 3. | TRANSACTIONS WITH AFFILIATES (continued) |
For fund accounting and transfer agent services, through October 31, 2008, the Fund paid the Advisor an annual fee of 0.11% of the Fund’s average daily net assets up to $900 million, 0.07% of the Fund’s average daily net assets between $900 million and $1.5 billion, and 0.04% of the Fund’s average daily net assets over $1.5 billion. Effective November 1, 2008, the fee rates are as follows: 0.055% of the Fund’s average daily net assets up to $4.5 billion, 0.03% of the Fund’s average daily net assets between $4.5 billion and $7.5 billion, and 0.02% of the Fund’s average daily net assets over $7.5 billion. Additionally, certain transaction and account-based fees and out-of-pocket expenses, including charges for reporting relating to the Fund’s compliance program, are charged. Expenses not directly attributable to a series are allocated based on each series’ relative net assets or number of accounts, depending on the expense. The Advisor has an agreement with Citi Fund Services Ohio, Inc. (“Citi”) under which Citi serves as sub-accountant and sub-transfer agent.
| 4. | PURCHASES AND SALES OF SECURITIES |
For the year ended December 31, 2008, purchases and sales of securities, other than United States Government securities and short-term securities, were $26,580,022 and $3,570,630, respectively. Purchases and sales of United States Government securities, other than short-term securities, were $6,174,608 and $21,725,974 respectively.
| 5. | CAPITAL STOCK TRANSACTIONS |
Transactions in shares of Core Bond Series were:
| | | | | | | | | | | | | | |
| | | For the Year
Ended 12/31/08 | | | For the Year
Ended 12/31/07 | |
| | | Shares | | | Amount | | | Shares | | | Amount | |
| | | | | | | | | | | | | | |
Sold | | 938,735 | | | $ | 9,172,442 | | | 587,661 | | | $ | 5,932,540 | |
Reinvested | | 280,365 | | | | 2,638,138 | | | 225,784 | | | | 2,243,435 | |
Repurchased | | (708,923 | ) | | | (6,907,443 | ) | | (426,400 | ) | | | (4,328,055 | ) |
| | | | | | | | | | | | | | |
Total | | 510,177 | | | $ | 4,903,137 | | | 387,045 | | | $ | 3,847,920 | |
| | | | | | | | | | | | | | |
Substantially all of the Series’ shares represent investments by fiduciary accounts over which the Advisor has sole investment discretion.
The Series may trade in financial instruments with off-balance sheet risk in the normal course of its investing activities to assist in managing exposure to various market risks. These financial instruments include written options, forward foreign currency exchange contracts and futures contracts and may involve, to a varying degree, elements of risk in excess of the amounts recognized for financial statement purposes. No such investments were held by the Series on December 31, 2008.
Investing in securities of foreign companies and foreign governments involves special risks and considerations not typically associated with investing in securities of domestic companies and the United States Government. These risks include revaluation of currencies and future adverse political and economic developments. Moreover, securities of foreign companies and foreign
Notes to Financial Statements
| 7. | FOREIGN SECURITIES (continued) |
governments and their markets may be less liquid and their prices more volatile than those of comparable domestic companies and the United States Government.
| 8. | FEDERAL INCOME TAX INFORMATION |
The amount and characterization of certain income and capital gains to be distributed are determined in accordance with federal income tax regulations, which may differ from accounting principles generally accepted in the United States of America. These differences are primarily due to differing book and tax treatments in the timing of the recognition of net investment income or gains and losses, including Post-October losses. The Series may periodically make reclassifications among its capital accounts to reflect income and gains available for distribution (or available capital loss carryovers) under income tax regulations, without impacting the Series’ net asset value. Any such reclassifications are not reflected in the financial highlights.
The tax character of distributions paid were as follows:
| | | | | | |
| | | For the Year
Ended 12/31/08 | | For the Year
Ended 12/31/07 |
Ordinary income | | $ | 2,576,550 | | $ | 2,029,563 |
Long-term capital gains | | | 93,012 | | | 249,539 |
For the year ended December 31, 2008, the Series elected to defer $222,810 of capital losses attributable to Post-October losses.
At December 31, 2008, the tax basis components of distributable earnings and the net unrealized depreciation based on identified cost for federal income tax purposes were as follows:
| | | | |
Cost for federal income tax purposes | | $ | 52,801,303 | |
Unrealized appreciation | | $ | 1,908,665 | |
Unrealized depreciation | | | (2,247,772 | ) |
| | | | |
Net unrealized depreciation | | $ | (339,107 | ) |
Undistributed ordinary income | | | 32,394 | |
Capital loss carryover | | | 840,304 | |
The capital loss carryover, disclosed above, available to the extent allowed by tax law to offset future net capital gain, if any, will expire on December 31, 2016.
| 9. | RECENT ACCOUNTING PRONOUNCEMENTS |
In September 2008, FASB Staff Position No. FAS 133-1 and FIN 45-4, “Disclosures about Credit Derivatives and Certain Guarantees: An Amendment of FASB Statement No. 133 and FASB Interpretation No. 45” (the “Position”) was issued and is effective for fiscal years and interim periods beginning after November 15, 2008. The Position amends FASB Statement No. 133 (“FAS 133”), Accounting for Derivative Instruments and Hedging Activities, and also amends FASB Interpretation No. 45 (“FIN 45”), Guarantor’s Accounting and Disclosure Requirements for Guarantees, Including Indirect Guarantees of Indebtedness of Others. The amendments to FAS 133 include required disclosure for (i) the nature and terms of the credit derivative, reasons for entering into the credit derivative, the events or circumstances that would require the seller to perform under the credit derivative, and the current status of the payment performance risk of the credit derivative, (ii) the maximum potential amount of future payments
Notes to Financial Statements
| 9. | RECENT ACCOUNTING PRONOUNCEMENTS (continued) |
(undiscounted) the seller could be required to make under the credit derivative, (iii) the fair value of the credit derivative, and (iv) the nature of any recourse provisions and assets held either as collateral or by third parties. The amendments to FIN 45 require additional disclosures about the current status of the payment/performance risk of a guarantee. At this time, Management is evaluating the implications of FAS 133-1 and FIN 45-4, but they are not expected to materially impact the Series’ financial statements.
In March 2008, FASB Statement of Financial Accounting Standards No. 161, Disclosures about Derivative Instruments and Hedging Activities (“FAS 161”) was issued and is effective for fiscal years and interim periods beginning after November 15, 2008. FAS 161 requires enhanced disclosures about the Series’ derivative and hedging activities, including how such activities are accounted for and their effect on the Series’ financial position and performance. Management is currently evaluating the impact of the adoption of FAS 161, but it is not expected to materially impact the Series’ financial statements.
Report of Independent Registered Public Accounting Firm
To the Board of Directors of Manning & Napier Fund, Inc. and Shareholders of Core Bond Series:
In our opinion, the accompanying statement of assets and liabilities, including the investment portfolio (except for credit ratings), and the related statements of operations and of changes in net assets and the financial highlights present fairly, in all material respects, the financial position of the Core Bond Series (a series of Manning & Napier Fund, Inc., hereafter referred to as the “Series”) at December 31, 2008, and the results of its operations for the year then ended, the changes in its net assets for each of the two years in the period then ended, and the financial highlights for each of the periods indicated, in conformity with accounting principles generally accepted in the United States of America. These financial statements and financial highlights (hereafter referred to as “financial statements”) are the responsibility of the Series’ management; our responsibility is to express an opinion on these financial statements based on our audits. We conducted our audits of these financial statements in accordance with the standards of the Public Company Accounting Oversight Board (United States). Those standards require that we plan and perform the audit to obtain reasonable assurance about whether the financial statements are free of material misstatement. An audit includes examining, on a test basis, evidence supporting the amounts and disclosures in the financial statements, assessing the accounting principles used and significant estimates made by management, and evaluating the overall financial statement presentation. We believe that our audits, which included confirmation of securities at December 31, 2008 by correspondence with the custodian, provide a reasonable basis for our opinion.

Columbus, Ohio
February 13, 2009
Supplemental Tax Information (unaudited)
For federal income tax purposes, the Series designates for the current fiscal year $22,861 or, if different, the maximum amount allowable under the tax law as qualified dividend income.
Pursuant to Section 852 of the Internal Revenue Code, as amended, the Series herby designates $93,012 as capital gains for its taxable year ended December 31, 2008.
Renewal of Investment Advisory Agreement (unaudited)
At the Manning & Napier Fund, Inc. (the “Fund”) Board of Directors’ (the “Board”) meeting, held on November 5, 2008, the Investment Advisory Agreement (the “Agreement”) between the Fund and Manning & Napier Advisors, Inc. (the “Advisor”) was reviewed by the Board for renewal. In connection with the decision whether to renew the Agreement, a variety of material was prepared for and reviewed by the Board.
Representatives of the Advisor attended the meeting and presented additional oral and written information to the Board to assist the Board in its considerations. The discussion immediately below outlines the materials and information presented to the Board in connection with the Board’s 2008 Annual Review of the Agreement and the conclusions made by the Directors when determining to continue the Agreement.
| | • | | The Board considered the services provided by the Advisor under the Agreement including, among others: deciding what securities to purchase and sell for each Series; arranging for the purchase and sale of such securities by placing orders with broker-dealers; administering the affairs of the Fund (including the books and records of the Fund not maintained by third party service providers such as the custodian or sub-transfer agent); arranging for the insurance coverage for the Fund; and supervising the preparation of tax returns, SEC filings (including registration statements) and reports to shareholders for the Fund. The Board also considered the nature and quality of such services provided under the Agreement in light of the Advisor’s services provided to the Fund for 22 years. The Board discussed the quality of these services with representatives from the Advisor and concluded that the Advisor was performing its services to the Fund required under the Agreement in a reasonable manner. |
| | • | | The Board considered the investment performance of the various Series of the Fund. The investment performance for each Series was reviewed on a cumulative basis since inception and on a one year basis. In addition, annualized performance for the following time periods was considered: inception, three year, five year, ten year, and current market cycle. A market cycle includes periods of both rising and falling markets. Returns for established benchmark indices for each Series were provided for each time period. The Board noted that the various Series were competitive against their respective benchmarks and/or peer groups over various time periods, but in particular over the full market cycle period relevant for the Series. In addition, the Board considered at the meeting (and considers on a quarterly basis) a peer group performance analysis consisting of Morningstar universes of mutual funds with similar investment objectives. The Board discussed the performance with representatives from the Advisor and concluded that the investment performance of each of the Fund’s Series was reasonable based on the Fund’s actual performance and comparative performance, especially performance over the current market cycle. |
| | • | | The Board considered the costs of the Advisor’s services and the profits of the Advisor as they relate to the Advisor’s services to the Fund under the Agreement. In reviewing the Advisor’s costs and profits, the Board discussed the Advisor’s revenues generated from the Fund (on both an actual and adjusted basis) and its expenses associated with providing the services under the Agreement. In addition, the Board reviewed the Advisor’s expenses associated with Fund activities outside of the Agreement (such as expense reimbursements pursuant to expense caps and payments made by the Advisor to third party platforms on which shares of the Fund are available for purchase). It was |
Renewal of Investment Advisory Agreement (unaudited)
| | noted by representatives of the Advisor that 15 of the 25 active Series of the Fund are currently experiencing expenses above the capped expense ratios. After discussing the above costs and profits, the Board concluded that the Advisor’s profitability relating to its services provided under the Agreement was reasonable. |
| | • | | The Board considered the fees and expenses of the various Series of the Fund. The Advisor presented the advisory fees and total expenses for each Series, including the advisory fee adjusted for any expense waivers or reimbursements (either contractual or voluntary) paid by the Advisor. The advisory fees and expense ratios of each Series were compared to an average (on both a mean and median basis) of similar funds as disclosed on the Morningstar database. Representatives of the Advisor discussed with the Board the levels of its advisory fee for each Series of the Fund and as compared to the median and mean advisory fees for similar funds as listed on Morningstar. Expense ratios for every Series, except the High Yield Bond Series, Global Fixed Income Series and the Target Series Class R and Class C, are currently below the median and mean for similar funds as listed on Morningstar. Based on their review of the information provided, the Board concluded that the fees and expenses of each Series of the Fund were reasonable on a comparative basis. |
| | • | | The Board also considered the other benefits the Advisor derives from its relationship with the Fund. Such other benefits include certain research products provided by soft dollars. Given the level of soft dollar transactions involving the Fund, the Board concluded that these additional benefits to the Advisor were reasonable. |
| | • | | In addition to the factors described above, the Board considered the Advisor’s personnel, investment strategies, policies and procedures relating to compliance with personal securities transactions, and reputation, expertise and resources in domestic and foreign financial markets. The Board concluded that these factors support the conclusion that the Advisor performs its services in a reasonable manner. |
| | • | | The Board did not consider economies of scale at this time because of the multiple uses of the Fund (for the Advisor’s discretionary investment account clients in addition to direct investors), the current profitability of the Advisor’s services to the Fund under the Agreement, and the overall size of the Fund complex. |
Based on the Board’s deliberations and their evaluation of the information described above, the Board, including a majority of Directors that are not “interested persons” as defined in the Investment Company Act of 1940, concluded that the compensation under the Agreement was fair and reasonable in light of the services and expenses and such other matters as the Directors considered to be relevant in the exercise of their reasonable judgment. Accordingly, the Board approved the renewal of the Agreement. In the course of their deliberations, the Directors did not identify any particular information that was all important or controlling.
Directors’ and Officers’ Information (unaudited)
The Statement of Additional Information provides additional information about the Fund’s directors and officers and can be obtained without charge by calling 1-800-466-3863, at www.manningnapieradvisors.com, or on the EDGAR Database on the SEC Internet web site (http://www.sec.gov). The following chart shows certain information about the Fund’s officers and directors, including their principal occupations during the last five years. Unless specific dates are provided, the individuals have held the listed positions for longer than five years.
INTERESTED DIRECTOR/OFFICER
| | |
| Name: | | B. Reuben Auspitz* |
| Address: | | 290 Woodcliff Drive |
| | Fairport, NY 14450 |
| Age: | | 61 |
| Current Position(s) Held with Fund: | | Principal Executive Officer, President, Chairman & Director |
| Term of Office1 & Length of Time Served: | | Indefinite - Director since 1984; Vice President 1984 - 2003; President since 2004; Principal Executive Officer since 2002 |
| Principal Occupation(s) During Past 5 Years: | | Executive Vice President; Co-Executive Director; Executive Group Member**; Chief Compliance Officer since 2004 - Manning & Napier Advisors, Inc. President; Director - Manning & Napier Investor Services, Inc. Holds or has held one or more of the following titles for various subsidiaries and affiliates: President, Vice President, Director, Chairman, Treasurer, Chief Compliance Officer or Member. |
| Number of Portfolios Overseen within Fund Complex: | | 28 |
| Other Directorships Held Outside Fund Complex: | | N/A |
| |
| INDEPENDENT DIRECTORS | | |
| |
| Name: | | Stephen B. Ashley |
| Address: | | 290 Woodcliff Drive |
| | Fairport, NY 14450 |
| Age: | | 68 |
| Current Position(s) Held with Fund: | | Director, Audit Committee Member, Governance & Nominating Committee Member |
| Term of Office & Length of Time Served: | | Indefinite - Since 1996 |
| Principal Occupation(s) During Past 5 Years: | | Chairman, Director, President & Chief Executive Officer, The Ashley Group (property management and investment). Chairman (non-executive) 2004-2008; Director 1995-2008 - Fannie Mae (mortgage) |
| Number of Portfolios Overseen within Fund Complex: | | 28 |
| Other Directorships Held Outside Fund Complex: | | The Ashley Group |
| Name: | | Peter L. Faber |
| Address: | | 290 Woodcliff Drive |
| | Fairport, NY 14450 |
| Age: | | 70 |
| Current Position(s) Held with Fund: | | Director, Governance & Nominating Committee Member |
| Term of Office & Length of Time Served: | | Indefinite - Since 1987 |
| Principal Occupation(s) During Past 5 Years: | | Senior Counsel, McDermott, Will & Emery LLP (law firm) |
| Number of Portfolios Overseen within Fund Complex: | | 28 |
| Other Directorships Held Outside Fund Complex: | | Partnership for New York City, Inc. New York Collegium Boston Early Music Festival |
| Name: | | Harris H. Rusitzky |
| Address: | | 290 Woodcliff Drive |
| | Fairport, NY 14450 |
| Age: | | 73 |
| Current Position(s) Held with Fund: | | Director, Audit Committee Member, Governance & Nominating Committee Member |
| Term of Office & Length of Time Served: | | Indefinite - Since 1985 |
| Principal Occupation(s) During Past 5 Years: | | President, The Greening Group (business consultants); Partner, The Restaurant Group (restaurants) |
| Number of Portfolios Overseen within Fund Complex: | | 28 |
| Other Directorships Held Outside Fund Complex: | | N/A |
Directors’ and Officers’ Information (unaudited)
INDEPENDENT DIRECTORS (continued)
| | |
| Name: | | Paul A. Brooke |
| Address: | | 290 Woodcliff Drive |
| | Fairport, NY 14450 |
| Age: | | 63 |
| Current Position(s) Held with Fund: | | Director, Audit Committee Member, Governance & Nominating Committee Member |
| Term of Office & Length of Time Served: | | Indefinite - Since 2007 |
| Principal Occupation(s) During Past 5 Years: | | Chairman & CEO, Alsius Corp. (investments); Managing Member, PMSV Holdings LLC (investments) |
| Number of Portfolios Overseen within Fund Complex: | | 28 |
| Other Directorships Held Outside Fund Complex: | | Incyte Corp. ViroPharma, Inc. HLTH Corp. Cheyne Captial International MPM Bio-equities GMP Companies HoustonPharma |
| |
| OFFICERS | | |
| |
| Name: | | Jeffrey S. Coons, Ph.D., CFA |
| Address: | | 290 Woodcliff Drive |
| | Fairport, NY 14450 |
| Age: | | 45 |
| Current Position(s) Held with Fund: | | Vice President |
| Term of Office1 & Length of Time Served: | | Since 2004 |
| Principal Occupation(s) During Past 5 Years: | | Co-Director of Research since 2002 & Executive Group Member**, Manning & Napier Advisors, Inc. Holds one or more of the following titles for various subsidiaries and affiliates: President, Director, Treasurer or Senior Trust Officer. |
| Number of Portfolios Overseen within Fund Complex: | | 28 |
| Other Directorships Held Outside Fund Complex: | | N/A |
| Name: | | Christine Glavin |
| Address: | | 290 Woodcliff Drive |
| | Fairport, NY 14450 |
| Age: | | 42 |
| Current Position(s) Held with Fund: | | Principal Financial Officer, Chief Financial Officer |
| Term of Office1 & Length of Time Served: | | Principal Financial Officer since 2002; Chief Financial Officer since 2001 |
| Principal Occupation(s) During Past 5 Years: | | Fund Reporting Manager, Manning & Napier Advisors, Inc. |
| Number of Portfolios Overseen within Fund Complex: | | 28 |
| Other Directorships Held Outside Fund Complex: | | N/A |
| Name: | | Jodi L. Hedberg |
| Address: | | 290 Woodcliff Drive |
| | Fairport, NY 14450 |
| Age: | | 41 |
| Current Position(s) Held with Fund: | | Corporate Secretary, Chief Compliance Officer, Anti-Money Laundering Compliance Officer |
| Term of Office1 & Length of Time Served: | | Corporate Secretary since 1997; Chief Compliance Officer since 2004 |
| Principal Occupation(s) During Past 5 Years: | | Director of Compliance, Manning & Napier Advisors, Inc. and affiliates; Corporate Secretary, Manning & Napier Investor Services, Inc. since 2006 |
| Number of Portfolios Overseen within Fund Complex: | | 28 |
| Other Directorships Held Outside Fund Complex: | | N/A |
*Interested Director, within the meaning of the Investment Company Act of 1940 by reason of his position with the Fund’s investment advisor and distributor. Mr. Auspitz serves as the Executive Vice President and Director, Manning & Napier Advisors, Inc. and President and Director, Manning & Napier Investor Services, Inc., the Fund’s distributor.
**The Executive Group performs the duties of the Office of the Chief Executive of Manning & Napier Advisors, Inc.
1The term of office for President, Vice President, Chief Financial Officer, and Corporate Secretary is one year and until their respective successors are chosen and qualified. All other officers’ terms are indefinite.
Literature Requests (unaudited)
Proxy Voting Policies and Procedures
A description of the policies and procedures that the Fund uses to determine how to vote proxies relating to portfolio securities is available, without charge, upon request:
| | |
By phone | | 1-800-466-3863 |
On the Securities and Exchange Commission’s (SEC) web site | | http://www.sec.gov |
Proxy Voting Record
Information regarding how the Fund voted proxies relating to portfolio securities during the most recent 12-month period ended June 30th is available, without charge, upon request:
| | |
By phone | | 1-800-466-3863 |
On the SEC’s web site | | http://www.sec.gov |
Quarterly Portfolio Holdings
The Series’ complete schedule of portfolio holdings for the 1st and 3rd quarters of each fiscal year are provided on Form N-Q, and are available, without charge, upon request:
| | |
By phone | | 1-800-466-3863 |
On the SEC’s web site | | http://www.sec.gov |
The Series’ Form N-Q may be reviewed and copied at the SEC’s Public Reference Room in Washington, D.C. Information on the operation of the Public Reference Room may be obtained by calling 1-800-SEC-0330.
Prospectus and Statement of Additional Information (SAI)
The prospectus and SAI provide additional information about each Series, including charges, expenses and risks. These documents are available, without charge, upon request:
| | |
By phone | | 1-800-466-3863 |
On the SEC’s web site | | http://www.sec.gov |
On the Advisor’s web site | | http://www.manningnapieradvisors.com |
Additional information available at www.manningnapieradvisors.com
1. Fund Holdings - Month-End
2. Fund Holdings - Quarter-End
3. Shareholder Report - Annual
4. Shareholder Report - Semi-Annual
Manning & Napier Fund, Inc.
| | | | |
| CORE PLUS BOND SERIES | | | | | Annual Report - December 31, 2008 |

Management Discussion and Analysis (unaudited)
Dear Shareholders:
Credit risk is defined rather innocuously by Bloomberg as “the risk that an obligation will not be completed, with the result being a loss”. That hardly does it justice. In 2008, investors became intimately acquainted with credit risk, the problems it can create and, more importantly, the losses it can inflict. The greater the investor’s exposure to credit risk in 2008, the worse his or her relative performance happened to be. In the fixed income arena, credit risk is most prevalent in the corporate bond market; last year, investors in the high yield area lost more than 30%; investors in the investment-grade market lost more then 5%. Credit risk is also quite prevalent in the growing market for commercial mortgage-backed securities (CMBS); last year that market lost 17%.
A definition of credit risk that is more specific to the bond market is the risk of loss due to a debtor’s non-payment of a loan or some other line of credit, either the principal or interest/coupon, or both. The credit problems that engulfed the financial markets first started to show in the real estate area, specifically in subprime mortgages. They then spread to those that trafficked in such securities, hedge funds and investment banks, subsequently engulfed Fannie Mae and Freddie Mac, and sucked in commercial banks and assorted insurance companies, culminating in a full fledged credit crisis that defined the fourth quarter of 2008.
The markets were already struggling when the year began given the credit missteps that had surfaced in the prior year. Those problems carried over into the first quarter of 2008; however, it became apparent that they had begun to spill over into the overall economy. The situation was exacerbated by a concurrent spike in commodity prices. The problems led to the mid-March fire sale of a major Wall Street firm, Bear Stearns, to JP Morgan Chase that was brokered by the Federal Reserve.
As the credit crisis became more pronounced, investors reigned in their risk tolerances, which resulted in wider credit spreads (the difference in yields as compared to the U.S. Treasuries) in both the corporate bond and the municipal bond markets. It also drove U.S. T-bill yields to 50 year lows, caused the auction rate securities market to collapse, and contributed to the implosion of numerous hedge funds. As the prices of oil, gold, and other commodities increased, inflation risks were re-awakened, lowering risk tolerances even more.
Early in September, Fannie Mae and Freddie Mac, the two largest government sponsored entities, were forced into conservatorship, whereby the U.S. Government took control over both entities, along with their $5 trillion of financial obligations. The markets spent a week digesting that, and then came the week of September 14th, which will go down as one of the most cataclysmic weeks in the history of the financial markets.
On Sunday of that week, Lehman Brothers announced that it would file for bankruptcy. That news was quickly followed by more bad news, including the quick sale of Merrill Lynch to Bank of America, bankruptcy fears at insurer AIG, and a money market fund “breaking the buck.” The environment was so bad that the yield on 3-month U.S. Treasury Bills, universally considered to be the risk-free investment, was driven down to 0.02% as investors scrambled to find a safe harbor.
In hindsight, the Lehman bankruptcy seemed to be a watershed event that pushed the credit markets and U.S. economy over the precipice. The moves in the financial markets during the quarter were just as dismal. In the equity markets, both the Dow Industrial Index and Standard & Poor’s (S&P) 500 Total Return Index were down more than 20% for the quarter; the NASDAQ Composite was down 25%. It wasn’t just the equity markets that struggled, the corporate bond market and the municipal bond market both sold off quite dramatically. There was, however, a glimmer of hope, when both exhibited signs of recovery as the quarter and the year came to a close.
One market that did not struggle last year was the U.S. Treasury market; during times of economic stress, Treasuries typically benefit as investors seek out a safe-haven. The moves were magnified in 2008 with U.S. Treasury Bill rates dropping to zero and longer-term Treasury yields dropping when the Federal Reserve suggested that that it would
Management Discussion and Analysis (unaudited)
consider purchasing Treasuries outright. From the end of October through the end of December, 10-year U.S. Treasury yields fell almost in half, dropping from a yield of about 4% to a yield of about 2%. On a total return basis, U.S. Treasuries were up 8.95% in the fourth quarter, and 13.98% for the calendar year.
The Core Plus Bond Series returned 1.24% in 2008. Those returns lagged the Merrill Lynch U.S. Corporate, Government & Mortgage Index, which includes all U.S. Treasury, U.S. Agency, investment-grade corporate bonds, and plain vanilla mortgage-backed securities with maturities of more than 1-year; it returned 6.20% in 2008. The Series’ underperformance versus the benchmark was strictly a function of the aforementioned strong performance of the U.S. Treasury market. An equally weighted portfolio of the Merrill Corporate Index and the Merrill Mortgage-Backed Index would have only returned 0.74%. The strong relative outperformance of U.S. Treasuries was an unprecedented phenomenon; historically, securities with yields above Treasuries tend to outperform Treasuries.
Over the longer-term, interest rates and spreads will fluctuate; sometimes the cyclical and/or policy pressures will push them both higher, sometimes they will push both lower, and other times, the various factors can push them in opposite directions. The key to investment success requires the investor to remain focused on the secular trends and the fundamental forces that drive each, an approach that we apply to all of our investment decisions.
As always, we appreciate your business.
Sincerely,
Manning & Napier Advisors, Inc.
Performance Update as of December 31, 2008 (unaudited)
| | | | | | |
| | | Average Annual Total Returns
As of December 31, 2008 | | |
| | | One
Year | | Since
Inception1 | | |
Manning & Napier Fund, Inc. - Core Plus Bond Series2 | | 1.24% | | 3.02% | | |
Merrill Lynch U.S. Corporate, Government & Mortgage Index3 | | 6.20% | | 5.32% | | |
The following graph compares the value of a $10,000 investment in the Manning & Napier Fund, Inc. - Core Plus Bond Series from its inception1 (4/21/05) to present (12/31/08) to the Merrill Lynch U.S. Corporate, Government & Mortgage Index.
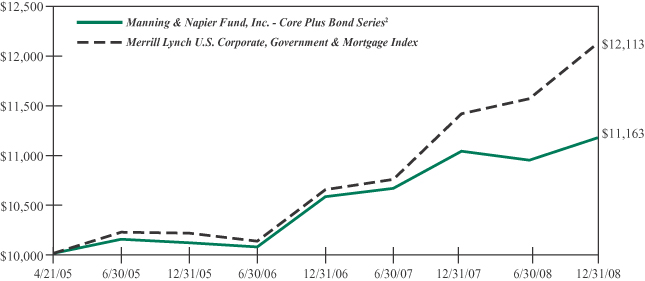
1Performance numbers for the Series and Index are calculated from April 21, 2005, the Series’ inception date.
2The Series’ performance does not reflect the deduction of taxes that a shareholder would pay on fund distributions or the redemption of shares. The Series’ performance is historical and may not be indicative of future results. The performance returns shown are inclusive of the net expense ratio of the Series. For the year ended December 31, 2008, this net expense ratio was 0.80%. The gross expense ratio, which does not account for any voluntary or contractual waivers currently in effect, was 0.80% for the year ended December 31, 2008.
3The unmanaged Merrill Lynch U.S. Corporate, Government & Mortgage Index is a market value weighted measure that represents U.S. government, corporate, and pass-through securities issued by entities within the United States, by supranational entities, or by entities headquartered outside of the United States but who have issued dollar-denominated securities within the United States. The Index only includes investment-grade securities with maturities of greater than one year. The Index returns assume reinvestment of coupons and, unlike Series returns, do not reflect any fees or expenses.
Shareholder Expense Example (unaudited)
As a shareholder of the Series, you may incur two types of costs: (1) transaction costs, including potential wire charges on redemptions and (2) ongoing costs, including management fees and other Series expenses. This example is intended to help you understand your ongoing costs (in dollars) of investing in the Series and to compare these costs with the ongoing costs of investing in other mutual funds.
The example is based on an investment of $1,000 invested at the beginning of the period and held for the entire period (July 1, 2008 to December 31, 2008).
Actual Expenses
The first line of the table below provides information about actual account values and actual expenses. You may use the information in this line, together with the amount you invested, to estimate the expenses that you paid over the period. Simply divide your account value by $1,000 (for example, an $8,600 account value divided by $1,000 = 8.6), then multiply the result by the number in the first line under the heading entitled “Expenses Paid During Period” to estimate the expenses you paid on your account during this period.
Hypothetical Example for Comparison Purposes
The second line of the table below provides information about hypothetical account values and hypothetical expenses based on the Series’ actual expense ratio and an assumed rate of return of 5% per year before expenses, which is not the Series’ actual return. The hypothetical account values and expenses may not be used to estimate the actual ending account balance or expenses you paid during the period. You may use this information to compare the ongoing costs of investing in the Series and other funds. To do so, compare this 5% hypothetical example with the 5% hypothetical examples that appear in the shareholder reports of the other funds.
Please note that the expenses shown in the table are meant to highlight your ongoing costs only and do not reflect any transaction costs, such as potential wire charges on redemptions. Therefore, the second line of the table is useful in comparing ongoing costs only, and will not help you determine the relative total costs of owning different funds. In addition, if these transaction costs were included, your costs would have been higher.
| | | | | | | | | |
| | | Beginning
Account Value
7/1/08 | | Ending
Account Value
12/31/08 | | Expenses Paid
During Period*
7/1/08-12/31/08 |
Actual | | $ | 1,000.00 | | $ | 1,020.50 | | $ | 4.06 |
Hypothetical
(5% return before expenses) | | $ | 1,000.00 | | $ | 1,021.11 | | $ | 4.06 |
*Expenses are equal to the Series’ annualized expense ratio (for the six-month period) of 0.80%, multiplied by the average account value over the period, multiplied by 184/366 (to reflect the one-half year period). Expenses are based on the most recent fiscal half year; therefore, the expense ratio stated above may differ from the expense ratio stated in the financial highlights, which is based on one-year data.
Portfolio Composition as of December 31, 2008 (unaudited)
Sector Allocation1
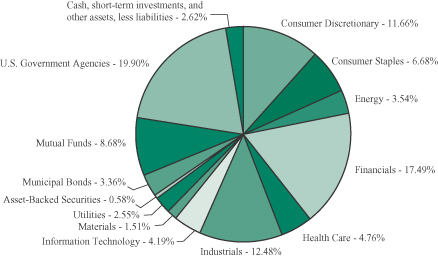
1As a percentage of net assets.
Credit Quality Ratings2,3
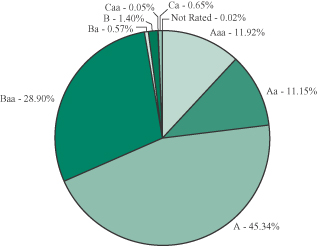
2As a percentage of total corporate bonds, preferred stocks, asset-backed securities, and municipal bonds.
3Based on ratings from Moody’s, or the S&P equivalent. The Series may use different ratings provided by other rating agencies for purposes of determining compliance with the Series’ investment policies.
Investment Portfolio - December 31, 2008
| | | | | | | | | |
| | | Credit
Rating1
(unaudited) | | | Principal
Amount | | Value
(Note 2) |
| | | | | | | | | |
| | | |
CORPORATE BONDS - 62.60% | | | | | | | | | |
| | | |
Convertible Corporate Bonds - 3.10% | | | | | | | | | |
Consumer Discretionary - 0.46% | | | | | | | | | |
Hotels, Restaurants & Leisure - 0.44% | | | | | | | | | |
Carnival Corp., 2.00%, 4/15/2021 | | A3 | | | $ | 1,680,000 | | $ | 1,516,200 |
| | | | | | | | | |
Media - 0.02% | | | | | | | | | |
Charter Communications, Inc., 6.50%, 10/1/2027 | | Ca | | | | 4,272,000 | | | 53,400 |
| | | | | | | | | |
Total Consumer Discretionary | | | | | | | | | 1,569,600 |
| | | | | | | | | |
Health Care - 1.09% | | | | | | | | | |
Biotechnology - 0.92% | | | | | | | | | |
Amgen, Inc., 0.375%, 2/1/2013 | | A3 | | | | 3,270,000 | | | 3,110,587 |
| | | | | | | | | |
Health Care Equipment & Supplies - 0.17% | | | | | | | | | |
Medtronic, Inc., 1.625%, 4/15/2013 | | A1 | | | | 665,000 | | | 586,863 |
| | | | | | | | | |
Total Health Care | | | | | | | | | 3,697,450 |
| | | | | | | | | |
Industrials - 0.43% | | | | | | | | | |
Airlines - 0.43% | | | | | | | | | |
JetBlue Airways Corp., 3.75%, 3/15/2035 | | Ca | | | | 1,900,000 | | | 1,463,000 |
| | | | | | | | | |
Information Technology - 1.12% | | | | | | | | | |
Computers & Peripherals - 0.46% | | | | | | | | | |
EMC Corp., 1.75%, 12/1/2013 | | A | 2 | | | 1,685,000 | | | 1,575,475 |
| | | | | | | | | |
Software - 0.66% | | | | | | | | | |
Amdocs Ltd., 0.50%, 3/15/2024 (Guernsey) (Note 7) | | Baa3 | | | | 2,280,000 | | | 2,251,500 |
| | | | | | | | | |
Total Information Technology | | | | | | | | | 3,826,975 |
| | | | | | | | | |
Total Convertible Corporate Bonds
(Identified Cost $15,572,087) | | | | | | | | | 10,557,025 |
| | | | | | | | | |
| | | |
Non-Convertible Corporate Bonds - 59.50% | | | | | | | | | |
Consumer Discretionary - 11.20% | | | | | | | | | |
Hotels, Restaurants & Leisure - 1.03% | | | | | | | | | |
McDonald’s Corp., 5.35%, 3/1/2018 | | A3 | | | | 3,380,000 | | | 3,511,093 |
| | | | | | | | | |
Household Durables - 1.02% | | | | | | | | | |
Fortune Brands, Inc., 5.375%, 1/15/2016 | | Baa2 | | | | 4,160,000 | | | 3,474,653 |
| | | | | | | | | |
Media - 4.71% | | | | | | | | | |
AOL Time Warner (now known as Time Warner, Inc.), 7.625%, 4/15/2031 | | Baa2 | | | | 2,725,000 | | | 2,678,157 |
British Sky Broadcasting Group plc, 8.20%, 7/15/2009 | | Baa2 | | | | 3,250,000 | | | 3,303,765 |
Comcast Corp.4, 5.11875%, 7/14/2009 | | Baa2 | | | | 920,000 | | | 907,433 |
Comcast Corp., 6.50%, 11/15/2035 | | Baa2 | | | | 3,105,000 | | | 3,090,220 |
| | |
| 6 | | The accompanying notes are an integral part of the financial statements. |
Investment Portfolio - December 31, 2008
| | | | | | | | |
| | | Credit
Rating1
(unaudited) | | Principal
Amount | | Value
(Note 2) |
| | | | | | | | |
| | | |
CORPORATE BONDS (continued) | | | | | | | | |
| | | |
Non-Convertible Corporate Bonds (continued) | | | | | | | | |
Consumer Discretionary (continued) | | | | | | | | |
Media (continued) | | | | | | | | |
Comcast Corp., 6.95%, 8/15/2037 | | Baa2 | | $ | 1,855,000 | | $ | 1,953,411 |
The Walt Disney Co.4, 2.28938%, 9/10/2009 | | A2 | | | 2,100,000 | | | 2,086,298 |
The Walt Disney Co., 7.00%, 3/1/2032 | | A2 | | | 1,720,000 | | | 2,022,632 |
| | | | | | | | |
| | | | | | | | 16,041,916 |
| | | | | | | | |
Multiline Retail - 0.96% | | | | | | | | |
Target Corp., 5.875%, 3/1/2012 | | A2 | | | 3,240,000 | | | 3,289,193 |
| | | | | | | | |
Specialty Retail - 2.73% | | | | | | | | |
Home Depot, Inc.4, 2.04625%, 12/16/2009 | | Baa1 | | | 2,550,000 | | | 2,409,064 |
Home Depot, Inc., 5.40%, 3/1/2016 | | Baa1 | | | 4,065,000 | | | 3,637,850 |
Lowe’s Companies, Inc., 8.25%, 6/1/2010 | | A1 | | | 3,120,000 | | | 3,241,015 |
| | | | | | | | |
| | | | | | | | 9,287,929 |
| | | | | | | | |
Textiles, Apparel & Luxury Goods - 0.75% | | | | | | | | |
VF Corp., 5.95%, 11/1/2017 | | A3 | | | 2,815,000 | | | 2,553,661 |
| | | | | | | | |
Total Consumer Discretionary | | | | | | | | 38,158,445 |
| | | | | | | | |
Consumer Staples - 6.68% | | | | | | | | |
Beverages - 2.28% | | | | | | | | |
The Coca-Cola Co., 5.35%, 11/15/2017 | | Aa3 | | | 3,440,000 | | | 3,711,447 |
Pepsico, Inc., 7.90%, 11/1/2018 | | Aa2 | | | 3,330,000 | | | 4,081,405 |
| | | | | | | | |
| | | | | | | | 7,792,852 |
| | | | | | | | |
Food & Staples Retailing - 1.44% | | | | | | | | |
The Kroger Co., 7.25%, 6/1/2009 | | Baa2 | | | 775,000 | | | 783,148 |
The Kroger Co., 6.80%, 4/1/2011 | | Baa2 | | | 775,000 | | | 800,195 |
The Kroger Co., 6.75%, 4/15/2012 | | Baa2 | | | 3,285,000 | | | 3,315,741 |
| | | | | | | | |
| | | | | | | | 4,899,084 |
| | | | | | | | |
Food Products - 2.95% | | | | | | | | |
General Mills, Inc.4, 4.18875%, 1/22/2010 | | Baa1 | | | 3,250,000 | | | 3,121,612 |
General Mills, Inc., 6.00%, 2/15/2012 | | Baa1 | | | 3,265,000 | | | 3,387,007 |
Kraft Foods Inc., 6.125%, 2/1/2018 | | Baa2 | | | 3,610,000 | | | 3,537,428 |
| | | | | | | | |
| | | | | | | | 10,046,047 |
| | | | | | | | |
Household Products - 0.01% | | | | | | | | |
The Procter & Gamble Co., 4.85%, 12/15/2015 | | Aa3 | | | 25,000 | | | 27,233 |
| | | | | | | | |
Total Consumer Staples | | | | | | | | 22,765,216 |
| | | | | | | | |
| | |
| The accompanying notes are an integral part of the financial statements. | | 7 |
Investment Portfolio - December 31, 2008
| | | | | | | | |
| | | Credit
Rating1
(unaudited) | | Principal
Amount | | Value
(Note 2) |
| | | | | | | | |
| | | |
CORPORATE BONDS (continued) | | | | | | | | |
| | | |
Non-Convertible Corporate Bonds (continued) | | | | | | | | |
Energy - 3.52% | | | | | | | | |
Energy Equipment & Services - 1.03% | | | | | | | | |
Baker Hughes, Inc., 7.50%, 11/15/2018 | | A2 | | $ | 3,155,000 | | $ | 3,497,816 |
| | | | | | | | |
Oil, Gas & Consumable Fuels - 2.49% | | | | | | | | |
Anadarko Petroleum Corp., 5.95%, 9/15/2016 | | Baa3 | | | 1,875,000 | | | 1,656,204 |
Apache Corp., 6.90%, 9/15/2018 | | A3 | | | 3,275,000 | | | 3,546,543 |
Arch Western Finance LLC, 6.75%, 7/1/2013 | | B1 | | | 3,765,000 | | | 3,275,550 |
| | | | | | | | |
| | | | | | | | 8,478,297 |
| | | | | | | | |
Total Energy | | | | | | | | 11,976,113 |
| | | | | | | | |
Financials - 15.25% | | | | | | | | |
Capital Markets - 3.78% | | | | | | | | |
The Goldman Sachs Group, Inc., 4.50%, 6/15/2010 | | A1 | | | 1,750,000 | | | 1,724,431 |
The Goldman Sachs Group, Inc., 6.345%, 2/15/2034 | | A2 | | | 3,450,000 | | | 2,503,506 |
Merrill Lynch & Co., Inc., 4.125%, 9/10/2009 | | A2 | | | 2,150,000 | | | 2,131,360 |
Merrill Lynch & Co., Inc., 6.11%, 1/29/2037 | | A3 | | | 1,145,000 | | | 1,029,269 |
Morgan Stanley, 3.875%, 1/15/2009 | | A2 | | | 2,550,000 | | | 2,546,968 |
Morgan Stanley, 5.55%, 4/27/2017 | | A2 | | | 3,544,000 | | | 2,926,582 |
| | | | | | | | |
| | | | | | | | 12,862,116 |
| | | | | | | | |
Commercial Banks - 6.72% | | | | | | | | |
Household Finance Co. (now known as HSBC Finance Corp.), 6.375%, 11/27/2012 | | Aa3 | | | 815,000 | | | 797,380 |
HSBC Financial Corp., 7.00%, 5/15/2012 | | Aa3 | | | 4,300,000 | | | 4,306,527 |
Manufacturers & Traders Trust Co., 6.625%, 12/4/2017 | | A2 | | | 4,605,000 | | | 4,284,603 |
PNC Bank National Association, 5.25%, 1/15/2017 | | A1 | | | 5,640,000 | | | 5,346,071 |
U.S. Bank National Association, 6.375%, 8/1/2011 | | Aa2 | | | 85,000 | | | 88,424 |
U.S. Bank National Association, 6.30%, 2/4/2014 | | Aa2 | | | 2,980,000 | | | 3,085,927 |
Wachovia Corp., 3.625%, 2/17/2009 | | Aa3 | | | 1,725,000 | | | 1,719,786 |
Wachovia Corp., 5.25%, 8/1/2014 | | A1 | | | 3,490,000 | | | 3,250,984 |
| | | | | | | | |
| | | | | | | | 22,879,702 |
| | | | | | | | |
| | |
| 8 | | The accompanying notes are an integral part of the financial statements. |
Investment Portfolio - December 31, 2008
| | | | | | | | |
| | | Credit
Rating1
(unaudited) | | Principal
Amount | | Value
(Note 2) |
| | | | | | | | |
| | | |
CORPORATE BONDS (continued) | | | | | | | | |
| | | |
Non-Convertible Corporate Bonds (continued) | | | | | | | | |
Financials (continued) | | | | | | | | |
Consumer Finance - 2.11% | | | | | | | | |
American Express Centurion, 4.375%, 7/30/2009 | | A1 | | $ | 2,800,000 | | $ | 2,756,460 |
American Express Credit Co.5, 2.04875%, 10/4/2010 | | A1 | | | 2,680,000 | | | 2,397,692 |
Toyota Motor Credit Corp.4, 10.00%, 5/4/2022 | | Aaa | | | 2,400,000 | | | 2,040,000 |
| | | | | | | | |
| | | | | | | | 7,194,152 |
| | | | | | | | |
Diversified Financial Services - 1.02% | | | | | | | | |
Bank of America Corp., 5.75%, 8/15/2016 | | Aa3 | | | 3,715,000 | | | 3,472,106 |
| | | | | | | | |
Insurance - 1.62% | | | | | | | | |
Ambac Financial Group, Inc., 5.95%, 12/5/2035 | | Ba1 | | | 4,465,000 | | | 1,331,334 |
American International Group, Inc., 4.25%, 5/15/2013 | | A3 | | | 1,840,000 | | | 1,356,056 |
International Lease Finance Corp., 3.50%, 4/1/2009 | | Baa1 | | | 3,000,000 | | | 2,848,518 |
| | | | | | | | |
| | | | | | | | 5,535,908 |
| | | | | | | | |
Total Financials | | | | | | | | 51,943,984 |
| | | | | | | | |
Health Care - 3.67% | | | | | | | | |
Pharmaceuticals - 3.67% | | | | | | | | |
Abbott Laboratories, 3.50%, 2/17/2009 | | A1 | | | 1,305,000 | | | 1,306,859 |
Abbott Laboratories, 5.875%, 5/15/2016 | | A1 | | | 500,000 | | | 541,534 |
Abbott Laboratories, 5.60%, 11/30/2017 | | A1 | | | 2,707,000 | | | 2,929,459 |
Johnson & Johnson, 5.15%, 7/15/2018 | | Aaa | | | 3,305,000 | | | 3,639,307 |
Wyeth, 6.50%, 2/1/2034 | | A3 | | | 3,680,000 | | | 4,080,594 |
| | | | | | | | |
Total Health Care | | | | | | | | 12,497,753 |
| | | | | | | | |
Industrials - 12.05% | | | | | | | | |
Aerospace & Defense - 1.56% | | | | | | | | |
Boeing Capital Corp., 6.50%, 2/15/2012 | | A2 | | | 1,615,000 | | | 1,650,653 |
Honeywell International, Inc., 5.30%, 3/1/2018 | | A2 | | | 3,600,000 | | | 3,672,997 |
| | | | | | | | |
| | | | | | | | 5,323,650 |
| | | | | | | | |
Air Freight & Logistics - 1.45% | | | | | | | | |
FedEx Corp., 3.50%, 4/1/2009 | | Baa2 | | | 1,310,000 | | | 1,305,499 |
United Parcel Service, Inc., 5.50%, 1/15/2018 | | Aa2 | | | 3,395,000 | | | 3,626,318 |
| | | | | | | | |
| | | | | | | | 4,931,817 |
| | | | | | | | |
| | |
| The accompanying notes are an integral part of the financial statements. | | 9 |
Investment Portfolio - December 31, 2008
| | | | | | | | |
| | | Credit
Rating1
(unaudited) | | Principal
Amount | | Value
(Note 2) |
| | | | | | | | |
| | | |
CORPORATE BONDS (continued) | | | | | | | | |
| | | |
Non-Convertible Corporate Bonds (continued) | | | | | | | | |
Industrials (continued) | | | | | | | | |
Airlines - 0.87% | | | | | | | | |
Southwest Airlines Co., 5.25%, 10/1/2014 | | Baa1 | | $ | 3,925,000 | | $ | 2,960,965 |
| | | | | | | | |
Commercial Services & Supplies - 0.36% | | | | | | | | |
Waste Management Inc., 7.375%, 8/1/2010 | | Baa3 | | | 1,210,000 | | | 1,226,199 |
| | | | | | | | |
Industrial Conglomerates - 2.99% | | | | | | | | |
General Electric Co., 5.25%, 12/6/2017 | | Aaa | | | 4,100,000 | | | 4,087,483 |
General Electric Capital Corp., 5.625%, 5/1/2018 | | Aaa | | | 2,150,000 | | | 2,165,585 |
General Electric Capital Corp., 6.75%, 3/15/2032 | | Aaa | | | 3,695,000 | | | 3,928,620 |
| | | | | | | | |
| | | | | | | | 10,181,688 |
| | | | | | | | |
Machinery - 2.73% | | | | | | | | |
Caterpillar Financial Service Corp., 7.05%, 10/1/2018 | | A2 | | | 3,385,000 | | | 3,562,807 |
John Deere Capital Corp.4, 2.24250%, 9/1/2009 | | A2 | | | 875,000 | | | 852,502 |
John Deere Capital Corp., 5.50%, 4/13/2017 | | A2 | | | 1,240,000 | | | 1,183,064 |
John Deere Capital Corp., 5.75%, 9/10/2018 | | A2 | | | 3,795,000 | | | 3,693,647 |
| | | | | | | | |
| | | | | | | | 9,292,020 |
| | | | | | | | |
Road & Rail - 2.09% | | | | | | | | |
CSX Corp., 6.00%, 10/1/2036 | | Baa3 | | | 4,530,000 | | | 3,587,923 |
Union Pacific Corp., 5.65%, 5/1/2017 | | Baa2 | | | 3,675,000 | | | 3,525,538 |
| | | | | | | | |
| | | | | | | | 7,113,461 |
| | | | | | | | |
Total Industrials | | | | | | | | 41,029,800 |
| | | | | | | | |
Information Technology - 3.07% | | | | | | | | |
Communications Equipment - 2.01% | | | | | | | | |
Cisco Systems, Inc., 5.50%, 2/22/2016 | | A1 | | | 3,295,000 | | | 3,489,985 |
Corning, Inc., 6.20%, 3/15/2016 | | Baa1 | | | 3,915,000 | | | 3,346,421 |
| | | | | | | | |
| | | | | | | | 6,836,406 |
| | | | | | | | |
Computers & Peripherals - 1.06% | | | | | | | | |
IBM Corp., 5.70%, 9/14/2017 | | A1 | | | 3,390,000 | | | 3,624,300 |
| | | | | | | | |
Total Information Technology | | | | | | | | 10,460,706 |
| | | | | | | | |
Materials - 1.51% | | | | | | | | |
Chemicals - 1.06% | | | | | | | | |
Dupont EI Nemour, 6.00%, 7/15/2018 | | A2 | | | 3,435,000 | | | 3,607,729 |
| | | | | | | | |
Metals & Mining - 0.45% | | | | | | | | |
Alcoa, Inc., 5.87%, 2/23/2022 | | Baa1 | | | 2,185,000 | | | 1,549,110 |
| | | | | | | | |
Total Materials | | | | | | | | 5,156,839 |
| | | | | | | | |
| | |
| 10 | | The accompanying notes are an integral part of the financial statements. |
Investment Portfolio - December 31, 2008
| | | | | | | | | |
| | | Credit
Rating1
(unaudited) | | | Principal
Amount/
Shares | | Value
(Note 2) |
| | | | | | | | | |
| | | |
CORPORATE BONDS (continued) | | | | | | | | | |
| | | |
Non-Convertible Corporate Bonds (continued) | | | | | | | | | |
Utilities - 2.55% | | | | | | | | | |
Electric Utilities - 2.32% | | | | | | | | | |
Allegheny Energy Supply Co. LLC6,7, 8.25%, 4/15/2012 | | Baa3 | | | $ | 1,600,000 | | $ | 1,576,000 |
American Electric Power Co., Inc., 5.375%, 3/15/2010 | | Baa2 | | | | 3,304,000 | | | 3,279,755 |
Exelon Generation Co. LLC, 5.35%, 1/15/2014 | | A3 | | | | 3,355,000 | | | 3,064,423 |
| | | | | | | | | |
| | | | | | | | | 7,920,178 |
| | | | | | | | | |
Multi-Utilities - 0.23% | | | | | | | | | |
CenterPoint Energy Resources Corp., 7.875%, 4/1/2013 | | Baa3 | | | | 770,000 | | | 713,246 |
Duke Energy Field Services LLC (now known as DCP Midstream LLC), 7.875%, 8/16/2010 | | Baa2 | | | | 30,000 | | | 29,494 |
Sempra Energy, 7.95%, 3/1/2010 | | Baa1 | | | | 30,000 | | | 30,318 |
| | | | | | | | | |
| | | | | | | | | 773,058 |
| | | | | | | | | |
Total Utilities | | | | | | | | | 8,693,236 |
| | | | | | | | | |
Total Non-Convertible Corporate Bonds
(Identified Cost $203,736,560) | | | | | | | | | 202,682,092 |
| | | | | | | | | |
TOTAL CORPORATE BONDS
(Identified Cost $219,308,647) | | | | | | | | | 213,239,117 |
| | | | | | | | | |
| | | |
PREFERRED STOCKS - 2.26% | | | | | | | | | |
Energy - 0.02% | | | | | | | | | |
Oil, Gas & Consumable Fuels - 0.02% | | | | | | | | | |
Edge Petroleum Corp. - Series A | | NR | 3 | | | 35,050 | | | 58,183 |
| | | | | | | | | |
Financials - 2.24% | | | | | | | | | |
Commercial Banks - 0.94% | | | | | | | | | |
PNC Financial Services Group, Inc. - Series K | | A3 | | | | 1,850,000 | | | 1,490,715 |
Wells Fargo & Co. - Series K | | A3 | | | | 2,015,000 | | | 1,717,586 |
| | | | | | | | | |
| | | | | | | | | 3,208,301 |
| | | | | | | | | |
Diversified Financial Services - 1.30% | | | | | | | | | |
Bank of America Corp. - Series K | | A1 | | | | 2,010,000 | | | 1,445,769 |
Citigroup, Inc. - Series E | | Baa2 | | | | 2,175,000 | | | 1,436,131 |
JPMorgan Chase & Co. - Series 1 | | A1 | | | | 1,880,000 | | | 1,563,840 |
| | | | | | | | | |
| | | | | | | | | 4,445,740 |
| | | | | | | | | |
Total Financials | | | | | | | | | 7,654,041 |
| | | | | | | | | |
TOTAL PREFERRED STOCKS
(Identified Cost $9,688,634) | | | | | | | | | 7,712,224 |
| | | | | | | | | |
| | |
| The accompanying notes are an integral part of the financial statements. | | 11 |
Investment Portfolio - December 31, 2008
| | | | | | | | | |
| | | Credit
Rating1
(unaudited) | | | Principal
Amount/
Shares | | Value
(Note 2) |
| | | | | | | | | |
| | | |
ASSET-BACKED SECURITIES - 0.58% | | | | | | | | | |
College Loan Corp. Trust4, 3.645%, 4/25/2016 | | Aaa | | | $ | 1,117,264 | | $ | 1,117,962 |
SLM Student Loan Trust4, 2.13625%, 3/15/2017 | | Aaa | | | | 793,192 | | | 738,660 |
Terra 2007-1A B1 Static Synthetic CDO4,6,8, 2.525%, 3/20/2015 | | CCC | 2 | | | 1,000,000 | | | 108,900 |
| | | | | | | | | |
TOTAL ASSET-BACKED SECURITIES
(Identified Cost $2,890,347) | | | | | | | | | 1,965,522 |
| | | | | | | | | |
| | | |
MUNICIPAL BONDS - 3.36% | | | | | | | | | |
Beaumont Independent School District, G.O. Bond, 5.00%, 2/15/2033 | | Aaa | | | | 1,850,000 | | | 1,811,816 |
Burleson Independent School District, G.O. Bond, 5.00%, 8/1/2038 | | Aaa | | | | 2,000,000 | | | 1,933,980 |
Canyon Independent School District, G.O. Bond, 4.50%, 2/15/2030 | | AAA | 2 | | | 500,000 | | | 449,090 |
Central Puget Sound Regional Transportation Authority, Series A, Revenue Bond, 5.00%, 11/1/2034 | | Aa3 | | | | 1,300,000 | | | 1,219,322 |
Chapel Hill Independent School District, School Building, G.O. Bond, 4.50%, 8/15/2032 | | Aaa | | | | 500,000 | | | 449,545 |
Commerce Independent School District, School Building, G.O. Bond, 4.50%, 8/15/2037 | | Aaa | | | | 500,000 | | | 438,725 |
El Paso County Hospital District, Series A, G.O Bond, 5.00%, 8/15/2037 | | AAA | 2 | | | 1,000,000 | | | 860,310 |
Harlandale Independent School District, School Building, G.O. Bond, 4.75%, 8/15/2036 | | Aaa | | | | 500,000 | | | 464,420 |
Katy Independent School District, School Building, G.O. Bond, 4.50%, 2/15/2031 | | Aaa | | | | 500,000 | | | 446,015 |
Keller Independent School District, School Building, G.O. Bond, 4.75%, 8/15/2032 | | Aaa | | | | 500,000 | | | 472,820 |
Prosper Independent School District, G.O. Bond, 5.00%, 2/15/2041 | | AAA | 2 | | | 1,000,000 | | | 956,850 |
Spring Hill Independent School District, G.O. Bond, 5.00%, 2/15/2038 | | AAA | 2 | | | 2,000,000 | | | 1,934,380 |
| | | | | | | | | |
TOTAL MUNICIPAL BONDS
(Identified Cost $11,911,195) | | | | | | | | | 11,437,273 |
| | | | | | | | | |
| | | |
MUTUAL FUNDS - 8.68% | | | | | | | | | |
iShares iBoxx High Yield Corporate Bond Fund | | | | | | 148,550 | | | 11,301,684 |
| | |
| 12 | | The accompanying notes are an integral part of the financial statements. |
Investment Portfolio - December 31, 2008
| | | | | | | | |
| | | | | Shares/
Principal
Amount | | Value
(Note 2) |
| | | | | | | | |
| | | |
MUTUAL FUNDS (continued) | | | | | | | | |
iShares iBoxx Investment Grade Corporate Bond Fund | | | | | 178,200 | | $ | 18,114,030 |
John Hancock Preferred Income Fund | | | | | 10,500 | | | 145,530 |
| | | | | | | | |
TOTAL MUTUAL FUNDS
(Identified Cost $26,665,108) | | | | | | | | 29,561,244 |
| | | | | | | | |
| | | |
U.S. GOVERNMENT AGENCIES - 19.90% | | | | | | | | |
Mortgage-Backed Securities - 19.90% | | | | | | | | |
Fannie Mae, Pool #050972, 5.50%, 1/1/2009 | | | | $ | 88 | | | 88 |
Fannie Mae, Pool #190549, 5.50%, 1/1/2009 | | | | | 12 | | | 12 |
Fannie Mae, Pool #829068, 4.50%, 8/1/2020 | | | | | 81,180 | | | 83,195 |
Fannie Mae, Pool #825922, 4.50%, 9/1/2020 | | | | | 589,628 | | | 604,263 |
Fannie Mae, Pool #829070, 4.50%, 9/1/2020 | | | | | 70,486 | | | 72,236 |
Fannie Mae, Pool #837186, 4.50%, 12/1/2020 | | | | | 240,367 | | | 246,334 |
Fannie Mae, Pool #256114, 4.50%, 1/1/2021 | | | | | 170,136 | | | 174,359 |
Fannie Mae, Pool #852931, 4.50%, 4/1/2021 | | | | | 356,176 | | | 364,627 |
Fannie Mae, Pool #869204, 4.50%, 5/1/2021 | | | | | 373,893 | | | 382,765 |
Fannie Mae, Pool #256543, 5.00%, 11/1/2021 | | | | | 581,829 | | | 598,362 |
Fannie Mae, Pool #900880, 5.00%, 12/1/2021 | | | | | 633,880 | | | 651,892 |
Fannie Mae, Pool #904409, 5.00%, 12/1/2021 | | | | | 557,901 | | | 573,754 |
Fannie Mae, Pool #905666, 5.00%, 12/1/2021 | | | | | 250,257 | | | 257,368 |
Fannie Mae, Pool #906708, 5.00%, 12/1/2021 | | | | | 644,098 | | | 662,400 |
Fannie Mae, Pool #907113, 5.00%, 12/1/2021 | | | | | 589,381 | | | 606,129 |
Fannie Mae, Pool #899017, 5.00%, 1/1/2022 | | | | | 558,311 | | | 574,175 |
Fannie Mae, Pool #909352, 5.00%, 2/1/2022 | | | | | 19,850 | | | 20,407 |
Fannie Mae, Pool #912415, 5.00%, 2/1/2022 | | | | | 636,529 | | | 654,616 |
Federal Home Loan Mortgage Corp., Pool #M90974, 4.50%, 3/1/2010 | | | | | 329,216 | | | 331,719 |
Federal Home Loan Mortgage Corp., Pool #E01488, 5.00%, 10/1/2018 | | | | | 11,260 | | | 11,633 |
Federal Home Loan Mortgage Corp., Pool #J02511, 5.00%, 9/1/2020 | | | | | 158,503 | | | 163,130 |
Federal Home Loan Mortgage Corp., Pool #J00774, 5.00%, 12/1/2020 | | | | | 59,212 | | | 60,941 |
Federal Home Loan Mortgage Corp., Pool #G11896, 4.50%, 1/1/2021 | | | | | 4,611,170 | | | 4,727,067 |
| | |
| The accompanying notes are an integral part of the financial statements. | | 13 |
Investment Portfolio - December 31, 2008
| | | | | | | | |
| | | | | Principal
Amount | | Value
(Note 2) |
| | | | | | | | |
| | | |
U.S. GOVERNMENT AGENCIES (continued) | | | | | | | | |
| | | |
Mortgage-Backed Securities (continued) | | | | | | | | |
Federal Home Loan Mortgage Corp., Pool #G11981, 5.00%, 4/1/2021 | | | | $ | 58,520 | | $ | 60,183 |
Federal Home Loan Mortgage Corp., Pool #G18160, 5.00%, 11/1/2021 | | | | | 60,938 | | | 62,670 |
Federal Home Loan Mortgage Corp., Pool #G18156, 5.00%, 12/1/2021 | | | | | 2,615,111 | | | 2,689,420 |
Federal Home Loan Mortgage Corp., Pool #G12491, 5.00%, 1/1/2022 | | | | | 58,335 | | | 59,993 |
Federal Home Loan Mortgage Corp., Pool #J04222, 5.00%, 1/1/2022 | | | | | 690,154 | | | 709,511 |
Federal Home Loan Mortgage Corp., Pool #G18168, 5.00%, 2/1/2022 | | | | | 510,573 | | | 524,893 |
Federal Home Loan Mortgage Corp., Pool #G18182, 5.50%, 5/1/2022 | | | | | 3,088,801 | | | 3,185,607 |
Federal Home Loan Mortgage Corp., Pool #G12833, 4.50%, 9/1/2022 | | | | | 7,469,652 | | | 7,649,223 |
Federal Home Loan Mortgage Corp., Pool #J06711, 5.00%, 1/1/2023 | | | | | 8,636,240 | | | 8,878,456 |
Federal Home Loan Mortgage Corp., Pool #G02327, 6.50%, 8/1/2036 | | | | | 28,467 | | | 29,601 |
Federal Home Loan Mortgage Corp., Pool #A52364, 6.50%, 9/1/2036 | | | | | 9,172 | | | 9,537 |
Federal Home Loan Mortgage Corp., Pool #A52428, 6.50%, 9/1/2036 | | | | | 618,729 | | | 643,381 |
Federal Home Loan Mortgage Corp., Pool #A54391, 6.50%, 9/1/2036 | | | | | 12,273 | | | 12,777 |
Federal Home Loan Mortgage Corp., Pool #A61160, 6.50%, 9/1/2036 | | | | | 21,335 | | | 22,186 |
Federal Home Loan Mortgage Corp., Pool #A52716, 6.50%, 10/1/2036 | | | | | 4,039,734 | | | 4,200,692 |
Federal Home Loan Mortgage Corp., Pool #A52888, 6.50%, 10/1/2036 | | | | | 162,998 | | | 169,493 |
Federal Home Loan Mortgage Corp., Pool #G02433, 6.50%, 11/1/2036 | | | | | 647,149 | | | 672,934 |
Federal Home Loan Mortgage Corp., Pool #A55847, 6.50%, 12/1/2036 | | | | | 19,199 | | | 19,964 |
Federal Home Loan Mortgage Corp., Pool #A62373, 5.00%, 6/1/2037 | | | | | 15,983,234 | | | 16,352,628 |
Federal Home Loan Mortgage Corp., Pool #G03447, 5.50%, 10/1/2037 | | | | | 2,104,477 | | | 2,156,403 |
Federal Home Loan Mortgage Corp., Pool #A78837, 5.50%, 6/1/2038 | | | | | 98,494 | | | 100,914 |
| | |
| 14 | | The accompanying notes are an integral part of the financial statements. |
Investment Portfolio - December 31, 2008
| | | | | | | | |
| | | | | Principal
Amount/ Shares | | Value
(Note 2) |
| | | | | | | | |
| | | |
U.S. GOVERNMENT AGENCIES (continued) | | | | | | | | |
| | | |
Mortgage-Backed Securities (continued) | | | | | | | | |
Federal Home Loan Mortgage Corp., Pool #G04764, 5.50%, 9/1/2038 | | | | $ | 5,945,871 | | $ | 6,091,984 |
Federal Home Loan Mortgage Corp., Pool #A82556, 5.50%, 10/1/2038 | | | | | 71,860 | | | 73,626 |
GNMA, Pool #487193, 5.00%, 4/15/2020 | | | | | 435,754 | | | 456,647 |
GNMA, Pool #563559, 6.50%, 4/15/2032 | | | | | 484,174 | | | 508,908 |
GNMA, Pool #552765, 6.50%, 9/15/2032 | | | | | 596,042 | | | 626,491 |
| | | | | | | | |
TOTAL U.S. GOVERNMENT AGENCIES
(Identified Cost $65,138,931) | | | | | | | | 67,789,594 |
| | | | | | | | |
| | | |
SHORT-TERM INVESTMENTS - 1.72% | | | | | | | | |
Dreyfus Cash Management, Inc. - Institutional Shares
(Identified Cost $5,864,864) | | | | | 5,864,864 | | $ | 5,864,864 |
| | | | | | | | |
TOTAL INVESTMENTS - 99.10%
(Identified Cost $341,467,726) | | | | | | | | 337,569,838 |
| | | |
OTHER ASSETS, LESS LIABILITIES - 0.90% | | | | | | | | 3,061,206 |
| | | | | | | | |
NET ASSETS - 100% | | | | | | | $ | 340,631,044 |
| | | | | | | | |
Key:
G.O. Bond - General Obligation Bond
1Credit ratings from Moody’s (unaudited).
2Credit ratings from S&P (unaudited).
3There is no credit rating available as of December 31, 2008.
4The coupon rate is a floating rate and is subject to change quarterly. The coupon rate stated is the rate as of December 31, 2008.
5 The coupon rate is a floating rate and is subject to change monthly. The coupon rate stated is the rate as of December 31, 2008.
6Restricted securities - Investment in securities that are restricted as to public resale under the Securities Act of 1933, as amended. These securities amount to $1,684,900, or 0.5%, of the Series’ net assets as of December 31, 2008 (see Note 2 to the financial statements).
7This security has been sold under rule 144A and has been determined to be liquid under guidelines established by the Board of Directors (see Note 2 to the financial statements).
8This security was acquired on February 28, 2007 at a cost of $1,000,000 ($100.00 per share) and has been determined to be illiquid under guidelines established by the Board of Directors (see Note 2 to the financial statements).
| | |
| The accompanying notes are an integral part of the financial statements. | | 15 |
Statement of Assets and Liabilities
December 31, 2008
| | | | |
| | | | |
ASSETS: | | | | |
| |
Investments, at value (identified cost, $341,467,726) (Note 2) | | $ | 337,569,838 | |
Interest receivable | | | 4,099,083 | |
Dividends receivable | | | 344,748 | |
Receivable for fund shares sold | | | 37,106 | |
| | | | |
TOTAL ASSETS | | | 342,050,775 | |
| | | | |
| LIABILITIES: | | | | |
| |
Accrued management fees (Note 3) | | | 197,375 | |
Accrued fund accounting and transfer agent fees (Note 3) | | | 17,323 | |
Accrued Chief Compliance Officer service fees (Note 3) | | | 485 | |
Payable for fund shares repurchased | | | 1,160,840 | |
Audit fees payable | | | 31,484 | |
Other payables and accrued expenses | | | 12,224 | |
| | | | |
TOTAL LIABILITIES | | | 1,419,731 | |
| | | | |
TOTAL NET ASSETS | | $ | 340,631,044 | |
| | | | |
NET ASSETS CONSIST OF: | | | | |
| |
Capital stock | | $ | 352,467 | |
Additional paid-in-capital | | | 349,060,823 | |
Undistributed net investment income | | | 296,651 | |
Accumulated net realized loss on investments, foreign currency and other assets and liabilities | | | (5,181,009 | ) |
Net unrealized depreciation on investments and other assets and liabilities | | | (3,897,888 | ) |
| | | | |
TOTAL NET ASSETS | | $ | 340,631,044 | |
| | | | |
NET ASSET VALUE, OFFERING PRICE AND REDEMPTION PRICE PER SHARE ($340,631,044/35,246,691 shares) | | $ | 9.66 | |
| | | | |
| | |
| 16 | | The accompanying notes are an integral part of the financial statements. |
Statement of Operations
For the Year Ended December 31, 2008
| | | | |
| | | | |
INVESTMENT INCOME: | | | | |
| |
Interest | | $ | 15,394,667 | |
Dividends | | | 988,874 | |
| | | | |
Total Investment Income | | | 16,383,541 | |
| | | | |
| EXPENSES: | | | | |
| |
Management fees (Note 3) | | | 2,030,869 | |
Fund accounting and transfer agent fees (Note 3) | | | 180,446 | |
Directors’ fees (Note 3) | | | 12,600 | |
Chief Compliance Officer service fees (Note 3) | | | 4,301 | |
Custodian fees | | | 24,701 | |
Miscellaneous | | | 74,948 | |
| | | | |
Total Expenses | | | 2,327,865 | |
| | | | |
NET INVESTMENT INCOME | | | 14,055,676 | |
| | | | |
| REALIZED AND UNREALIZED GAIN (LOSS) ON INVESTMENTS: | | | | |
| |
Net realized gain (loss) on - | | | | |
Investments | | | (5,181,009 | ) |
Foreign currency and other assets and liabilities | | | 1,157,628 | |
| | | | |
| | | (4,023,381 | ) |
| | | | |
| |
Net change in unrealized depreciation on -
Investments | | | (3,467,226 | ) |
Foreign currency and other assets and liabilities | | | (5,622 | ) |
| | | | |
| | | (3,472,848 | ) |
| | | | |
| |
NET REALIZED AND UNREALIZED GAIN (LOSS) ON INVESTMENTS | | | (7,496,229 | ) |
| | | | |
NET INCREASE IN NET ASSETS RESULTING
FROM OPERATIONS | | $ | 6,559,447 | |
| | | | |
| | |
| The accompanying notes are an integral part of the financial statements. | | 17 |
Statement of Changes in Net Assets
| | | | | | | | |
| | | For the
Year Ended
12/31/08 | | | For the
Year Ended
12/31/07 | |
| | | | | | | | |
| INCREASE (DECREASE) IN NET ASSETS: | | | | | | | | |
| | |
| OPERATIONS: | | | | | | | | |
| | |
Net investment income | | $ | 14,055,676 | | | $ | 10,549,005 | |
Net realized gain (loss) on investments and foreign currency | | | (4,023,381 | ) | | | 718,868 | |
Net change in unrealized depreciation on investments and foreign currency | | | (3,472,848 | ) | | | (67,413 | ) |
| | | | | | | | |
Net increase from operations | | | 6,559,447 | | | | 11,200,460 | |
| | | | | | | | |
| DISTRIBUTIONS TO SHAREHOLDERS (Note 8): | | | | | | | | |
| | |
From net investment income | | | (15,280,303 | ) | | | (10,349,432 | ) |
From net realized gain on investments | | | (372,027 | ) | | | — | |
| | | | | | | | |
Total distributions to shareholders | | | (15,652,330 | ) | | | (10,349,432 | ) |
| | | | | | | | |
| CAPITAL STOCK ISSUED AND REPURCHASED: | | | | | | | | |
| | |
Net increase from capital share transactions (Note 5) | | | 71,229,591 | | | | 53,498,514 | |
| | | | | | | | |
Net increase in net assets | | | 62,136,708 | | | | 54,349,542 | |
| | |
| NET ASSETS: | | | | | | | | |
| | |
Beginning of year | | | 278,494,336 | | | | 224,144,794 | |
| | | | | | | | |
End of year (including undistributed net investment income of $296,651 and $160,737, respectively) | | $ | 340,631,044 | | | $ | 278,494,336 | |
| | | | | | | | |
| | |
| 18 | | The accompanying notes are an integral part of the financial statements. |
Financial Highlights
| | | | | | | | |
| | | For the Years Ended | | For the
Period 4/21/051
to 12/31/05 |
| | | 12/31/08 | | 12/31/07 | | 12/31/06 | |
| | | | | | | | |
| | | | | | | | |
Per share data (for a share outstanding
throughout each period): | | | | | | | | |
Net asset value - Beginning of period | | $10.02 | | $9.98 | | $9.89 | | $10.00 |
| | | | | | | | |
Income (loss) from investment operations: | | | | | | | | |
Net investment income | | 0.42 | | 0.40 | | 0.37 | | 0.22 |
Net realized and unrealized gain (loss) on investments | | (0.32) | | 0.03 | | 0.08 | | (0.12) |
| | | | | | | | |
Total from investment operations | | 0.10 | | 0.43 | | 0.45 | | 0.10 |
| | | | | | | | |
| | | | |
Less distributions to shareholders: | | | | | | | | |
From net investment income | | (0.45) | | (0.39) | | (0.36) | | (0.21) |
From net realized gain on investments | | (0.01) | | — | | — | | — |
| | | | | | | | |
Total distributions to shareholders | | (0.46) | | (0.39) | | (0.36) | | (0.21) |
| | | | | | | | |
Net asset value - End of period | | $9.66 | | $10.02 | | $9.98 | | $9.89 |
| | | | | | | | |
Net assets - End of period (000’s omitted) | | $340,631 | | $278,494 | | $224,145 | | $175,594 |
| | | | | | | | |
Total return2 | | 1.24% | | 4.34% | | 4.59% | | 1.04% |
| Ratios (to average net assets)/Supplemental Data: | | | | | | | | |
Expenses | | 0.80% | | 0.81% | | 0.83% | | 0.88%3 |
Net investment income | | 4.84% | | 4.20% | | 3.95% | | 3.12%3 |
Portfolio turnover | | 63% | | 341% | | 315% | | 290% |
1Commencement of operations.
2Represents aggregate total return for the period indicated, and assumes reinvestment of all distributions. Periods less than one year are not annualized.
3Annualized.
| | |
| The accompanying notes are an integral part of the financial statements. | | 19 |
Notes to Financial Statements
Core Plus Bond Series (the “Series”) is a no-load non-diversified series of Manning & Napier Fund, Inc. (the “Fund”). The Fund is organized in Maryland and is registered under the Investment Company Act of 1940, as amended, as an open-end management investment company.
The Series’ investment objective is to provide long-term total return by investing primarily in bonds and other financial instruments, including derivatives, with economic characteristics similar to bonds.
The Fund’s Advisor is Manning & Napier Advisors, Inc. (the “Advisor”). Shares of the Series are offered to investors, clients and employees of the Advisor and its affiliates. The total authorized capital stock of the Fund consists of 5.0 billion shares of common stock each having a par value of $0.01. As of December 31, 2008, 4.5 billion shares have been designated in total among 28 series, of which 125 million have been designated as Core Plus Bond Series Class A common stock.
| 2. | SIGNIFICANT ACCOUNTING POLICIES |
Security Valuation
Portfolio securities, including domestic equities, listed on an exchange other than the NASDAQ National Market System are valued at the latest quoted sales price of the exchange on which the security is primarily traded. Securities not traded on valuation date or securities not listed on an exchange are valued at the latest quoted bid price provided by the Funds’s pricing service. Securities listed on the NASDAQ National Market System are valued in accordance with the NASDAQ Official Closing Price.
Debt securities, including government bonds, foreign bonds, asset-backed securities, structured notes, supranational obligations, sovereign bonds, corporate bonds and mortgage-backed securities will normally be valued on the basis of evaluated bid prices provided by an independent pricing service. Certain investments in securities held by the Series may be valued on a basis of a price provided by a principal market maker. These prices may differ from the value that would have been used had a broader market for securities existed.
Municipal securities will normally be valued on the basis of market valuations provided by an independent pricing service that utilizes the latest price quotations and a matrix system (which considers such factors as security prices of similar securities, yields, maturities and ratings).
Securities for which representative valuations or prices are not available from the Fund’s pricing service may be valued at fair value. Due to the inherent uncertainty of valuations of such securities, the fair value may differ significantly from the values that would have been used had a ready market for such securities existed. If trading or events occurring after the close of the principal market in which securities are traded are expected to materially affect the value of those securities, then they may be valued at their fair value, taking this trading or these events into account. Fair value is determined in good faith by the Advisor under procedures approved by and under the general supervision and responsibility of the Fund’s Board of Directors (the “Board”).
Short-term investments that mature in sixty days or less are valued at amortized cost, which approximates market value. Investments in open-end investment companies are valued at their net asset value per share on valuation date.
Notes to Financial Statements
| 2. | SIGNIFICANT ACCOUNTING POLICIES (continued) |
Security Valuation (continued)
In September 2006, FASB Statement of Financial Accounting Standards No. 157, Fair Value Measurements (“FAS 157”) was issued, effective for fiscal years beginning after November 15, 2007. This standard clarifies the definition of fair value for financial reporting, establishes a framework for measuring fair value and requires additional disclosures about the use of fair value measurements. FAS 157 became effective for the Series as of January 1, 2008, the beginning of its current fiscal year. The three levels of the fair value hierarchy under FAS 157 are described below:
Level 1 - quoted prices in active markets for identical securities
Level 2 - other significant observable inputs (including quoted prices for similar securities, interest rates, prepayment speeds, credit risk, etc.)
Level 3 - significant unobservable inputs (including the Series’ own assumptions in determining the fair value of investments.)
The inputs or methodology used for valuing securities are not necessarily an indication of the risk associated with investing in those securities. The following is a summary of the inputs used to value the Series’ assets as of December 31, 2008:
| | | | | | |
Valuation Inputs | | Investments In
Securities | | Other Financial
Instruments* |
| | | | | | |
Level 1 - Quoted Prices | | $ | 35,484,291 | | $ | — |
Level 2 - Other Significant Observable Inputs | | | 301,976,647 | | | — |
Level 3 - Significant Unobservable Inputs | | | 108,900 | | | — |
| | | | | | |
Total | | $ | 337,569,838 | | $ | — |
| | | | | | |
*Other financial instruments are derivative instruments not reflected in the Investment Portfolio, such as futures, forwards and swap contracts, which are valued at the unrealized appreciation/depreciation on the instrument. As of December 31, 2008, the Series did not hold any derivative instruments.
The following is a reconciliation of Level 3 assets for which significant unobservable inputs were used to determine fair value:
| | | | |
| | | Investments in
Securities | |
Balance as of 12/31/07 | | $ | 843,100 | |
Accrued discounts/premiums | | | — | |
Realized gain/loss | | | — | |
Change in unrealized appreciation (depreciation) | | | (734,200 | ) |
Net purchases (sales) | | | — | |
Transfers in and/or out of Level 3 | | | — | |
| | | | |
Balance as of 12/31/08 | | $ | 108,900 | |
| | | | |
Security Transactions, Investment Income and Expenses
Security transactions are accounted for on trade date. Interest income, including amortization of premium and accretion of discounts using the effective interest method, is earned from settlement date and accrued daily. Dividend income is recorded on the ex-dividend date. Non-cash dividends, if any, are recorded at the fair market value of the securities received.
Notes to Financial Statements
| 2. | SIGNIFICANT ACCOUNTING POLICIES (continued) |
Security Transactions, Investment Income and Expenses (continued)
Expenses are recorded on an accrual basis. Most expenses of the Fund can be attributed to a specific series. Expenses which cannot be directly attributed are apportioned among the series in the Fund in such a manner as deemed equitable by the Fund’s Board, taking into consideration, among other things, the nature and type of expense.
The Series uses the identified cost method for determining realized gain or loss on investments for both financial statement and federal income tax reporting purposes.
Foreign Currency Translation
The books and records of the Series are maintained in U.S. dollars. Foreign currencies, investments and other assets and liabilities are translated into U.S. dollars at the current exchange rates. Purchases and sales of investment securities and income and expenses are translated on the respective dates of such transactions. The Series does not isolate realized and unrealized gains and losses attributable to changes in the exchange rates from gains and losses that arise from changes in the market value of investments. Such fluctuations are included with net realized and unrealized gain or loss on investments. Net realized foreign currency gains and losses represent foreign currency gains and losses between trade date and settlement date on securities transactions, gains and losses on disposition of foreign currencies and the difference between the amount of income and foreign withholding taxes recorded on the books of the Series and the amounts actually received or paid.
Securities Purchased on a When-Issued Basis or Forward Commitment
The Series may purchase securities on a when-issued basis or forward commitment. These transactions involve a commitment by the Series to purchase securities for a predetermined price with payment and delivery taking place beyond the customary settlement period. When such purchases are outstanding, the Series will designate liquid assets in an amount sufficient to meet the purchase price. When purchasing a security on a delayed delivery basis, the Series assumes the rights and risks of ownership of the security, including the risk of price and yield fluctuations, and takes such fluctuations into account when determining its net asset value. The Series may sell the when-issued securities before they are delivered, which may result in a capital gain or loss. No such investments were held by the Series on December 31, 2008.
In connection with its ability to purchase or sell securities on a forward commitment basis, the Series may enter into forward roll transactions principally using To Be Announced (TBA) securities. Forward roll transactions require the sale of securities for delivery in the current month, and a simultaneous agreement to repurchase substantially similar (same type, coupon and maturity) securities on a specified future date. Risks of entering into forward roll transactions include the potential inability of the counterparty to meet the terms of the agreement; the potential of the Series to receive inferior securities at redelivery as compared to the securities sold to the counterparty; counterparty credit risk; and the potential pay down speed variance between the mortgage-backed pools. During the roll period, the Series forgoes principal and interest paid on the securities. The Series accounts for such dollar rolls as purchases and sales. No such investments were held by the series on December 31, 2008.
Restricted Securities
Restricted securities are purchased in private placement transactions, are not registered under the Securities Act of 1933, as amended, and may have contractual restrictions on resale. Information regarding restricted securities is included at the end of the Series’ Investment Portfolio.
Notes to Financial Statements
| 2. | SIGNIFICANT ACCOUNTING POLICIES (continued) |
Illiquid Securities
A security may be considered illiquid if so deemed in good faith by the Advisor under procedures approved by and under the general supervision and responsibility of the Fund’s Board. Securities that are illiquid are marked with the applicable footnote on the Investment Portfolio. As of December 31, 2008, the aggregate value of securities deemed illiquid was $108,900, representing 0.03% of the Series’ net assets.
Federal Taxes
The Series’ policy is to comply with the provisions of the Internal Revenue Code applicable to regulated investment companies. The Series is not subject to federal income tax or excise tax to the extent that the Series distributes to shareholders each year its taxable income, including any net realized gains on investments, in accordance with requirements of the Internal Revenue Code. Accordingly, no provision for federal income tax or excise tax has been made in the financial statements.
On June 29, 2007, the Series adopted Financial Accounting Standards Board Interpretation No. 48 - Accounting for Uncertainty in Income Taxes (“FIN 48”). FIN 48 prescribes the minimum recognition threshold a tax position must meet in connection with accounting for uncertainties in income tax positions taken or expected to be taken by an entity before being measured and recognized in the financial statements. Management has determined that the adoption of FIN 48 did not have a material impact on the Series’ financial statements. The Series files income tax returns in the U.S. federal jurisdiction, various states and foreign jurisdictions, as required. No income tax returns are currently under investigation. The statute of limitations on the Series’ tax returns remains open for the years ended December 31, 2005 through December 31, 2008.
Additionally, based on the Fund’s understanding of the tax rules and rates related to income, gains and transactions for foreign jurisdictions in which it invests, the Series will provide for foreign taxes, and where appropriate, deferred foreign tax.
Distributions of Income and Gains
Distributions to shareholders of net investment income and net realized gains are made annually. An additional distribution may be necessary to avoid taxation of the Series. Distributions are recorded on the ex-dividend date.
Indemnifications
The Fund’s organizational documents provide former and current directors and officers with a limited indemnification against liabilities arising in connection with the performance of their duties to the Fund. In the normal course of business, the Fund may also enter into contracts that provide general indemnifications. The Fund’s maximum exposure under these arrangements is unknown as this would be dependent on future claims that may be made against the Fund. The risk of material loss from such claims is considered remote.
Other
The preparation of financial statements in conformity with accounting principles generally accepted in the United States of America requires management to make estimates and assumptions that affect the reported amounts of assets and liabilities and the disclosure of contingent assets and liabilities at the date of the financial statements and the reported amounts of income and expenses during the reporting period. Actual results could differ from those estimates.
Notes to Financial Statements
| 3. | TRANSACTIONS WITH AFFILIATES |
The Fund has an Investment Advisory Agreement (the “Agreement”) with the Advisor, for which the Series pays a fee, computed daily and payable monthly, at an annual rate of 0.70% of the Series’ average daily net assets.
Under the Agreement, personnel of the Advisor provide the Series with advice and assistance in the choice of investments and the execution of securities transactions, and otherwise maintain the Series’ organization. The Advisor also provides the Fund with necessary office space and fund administration and support services. The salaries of all officers of the Fund (except a percentage of the Fund’s Chief Compliance Officer’s salary, which is paid by the Fund), and of all Directors who are “affiliated persons” of the Fund, or of the Advisor, and all personnel of the Fund, or of the Advisor, performing services relating to research, statistical and investment activities, are paid by the Advisor. Each “non-affiliated” Director receives an annual stipend, which is allocated among all the active series of the Fund. In addition, these Directors also receive a fee per Board meeting attended for each active series of the Fund plus a fee for each committee meeting attended.
The Advisor has contractually agreed, until at least April 30, 2010, to waive its fee and, if necessary, pay other operating expenses of the Series in order to maintain total direct annual fund operating expenses for the Series at no more than 0.90% of average daily net assets each year. For the year ended December 31, 2008, the Advisor did not waive its management fee or reimburse any expenses of the Series. The Advisor is not eligible to recoup any expenses that have been waived or reimbursed in prior years.
Manning & Napier Investor Services, Inc., a registered broker-dealer affiliate of the Advisor, acts as distributor for the Fund’s shares. The services of Manning & Napier Investor Services, Inc. are provided at no additional cost to the Series.
For fund accounting and transfer agent services, through October 31, 2008, the Fund paid the Advisor an annual fee of 0.11% of the Fund’s average daily net assets up to $900 million, 0.07% of the Fund’s average daily net assets between $900 million and $1.5 billion, and 0.04% of the Fund’s average daily net assets over $1.5 billion. Effective November 1, 2008, the fee rates are as follows: 0.055% of the Fund’s average daily net assets up to $4.5 billion, 0.03% of the Fund’s average daily net assets between $4.5 billion and $7.5 billion, and 0.02% of the Fund’s average daily net assets over $7.5 billion. Additionally, certain transaction and account-based fees and out-of-pocket expenses, including charges for reporting relating to the Fund’s compliance program, are charged. Expenses not directly attributable to a series are allocated based on each series’ relative net assets or number of accounts, depending on the expense. The Advisor has an agreement with Citi Fund Services Ohio, Inc. (“Citi”) under which Citi serves as sub-accountant and sub-transfer agent.
| 4. | PURCHASES AND SALES OF SECURITIES |
For the year ended December 31, 2008, purchases and sales of securities, other than United States Government securities and short-term securities, were $208,251,216 and $58,977,396, respectively. Purchases and sales of United States Government securities, other than short-term securities, were $37,592,698 and $115,217,617, respectively.
Notes to Financial Statements
| 5. | CAPITAL STOCK TRANSACTIONS |
Transactions in shares of Core Plus Bond Series were:
| | | | | | | | | | | | | | |
| | | For the Year
Ended 12/31/08 | | | For the Year
Ended 12/31/07 | |
| | | Shares | | | Amount | | | Shares | | | Amount | |
Sold | | 9,178,936 | | | $ | 88,460,649 | | | 4,853,349 | | | $ | 49,066,123 | |
Reinvested | | 1,654,229 | | | | 15,379,707 | | | 1,024,246 | | | | 10,150,276 | |
Repurchased | | (3,371,107 | ) | | | (32,610,765 | ) | | (563,255 | ) | | | (5,717,885 | ) |
| | | | | | | | | | | | | | |
Total | | 7,462,058 | | | $ | 71,229,591 | | | 5,314,340 | | | $ | 53,498,514 | |
| | | | | | | | | | | | | | |
Substantially all of the Series’ shares represent investments by fiduciary accounts over which the Advisor has sole investment discretion.
The Series may trade in financial instruments with off-balance sheet risk in the normal course of its investing activities to assist in managing exposure to various market risks. These financial instruments include written options, forward foreign currency exchange contracts and futures contracts and may involve, to a varying degree, elements of risk in excess of the amounts recognized for financial statement purposes. No such investments were held by the Series on December 31, 2008.
Investing in securities of foreign companies and foreign governments involves special risks and considerations not typically associated with investing in securities of domestic companies and the United States Government. These risks include revaluation of currencies and future adverse political and economic developments. Moreover, securities of foreign companies and foreign governments and their markets may be less liquid and their prices more volatile than those of comparable domestic companies and the United States Government.
| 8. | FEDERAL INCOME TAX INFORMATION |
The amount and characterization of certain income and capital gains to be distributed are determined in accordance with federal income tax regulations, which may differ from accounting principles generally accepted in the United States of America. These differences are primarily due to differing book and tax treatments in the timing of the recognition of net investment income or gains and losses, including foreign currency gains and losses and Post-October losses. The Series may periodically make reclassifications among its capital accounts to reflect income and gains available for distribution (or available capital loss carryovers) under income tax regulations, without impacting the Series’ net asset value. Any such reclassifications are not reflected in the financial highlights.
The tax character of distributions paid were as follows:
| | | | | | |
| | | For the Year
Ended 12/31/08 | | For the Year
Ended 12/31/07 |
Ordinary income | | $ | 15,281,692 | | $ | 10,349,432 |
Long-term capital gains | | | 370,638 | | | — |
Notes to Financial Statements
| 8. | FEDERAL INCOME TAX INFORMATION (continued) |
For the year ended December 31, 2008, the Series elected to defer $1,361,948 of capital losses attributable to Post-October losses.
At December 31, 2008, the tax basis components of distributable earnings and the net unrealized depreciation based on identified cost for federal income tax purposes were as follows:
| | | | |
Cost for federal income tax purposes | | $ | 341,684,665 | |
Unrealized appreciation | | $ | 13,508,360 | |
Unrealized depreciation | | | (17,623,187 | ) |
| | | | |
Net unrealized depreciation | | $ | (4,114,827 | ) |
Undistributed ordinary income | | | 513,590 | |
Capital loss carryover | | | 3,819,061 | |
The capital loss carryover, disclosed above, available to the extent allowed by tax law to offset future net capital gain, if any, will expire on December 31, 2016.
| 9. | RECENT ACCOUNTING PRONOUNCEMENTS |
In September 2008, FASB Staff Position No. FAS 133-1 and FIN 45-4, “Disclosures about Credit Derivatives and Certain Guarantees: An Amendment of FASB Statement No. 133 and FASB Interpretation No. 45” (the “Position”) was issued and is effective for fiscal years and interim periods beginning after November 15, 2008. The Position amends FASB Statement No. 133 (“FAS 133”), Accounting for Derivative Instruments and Hedging Activities, and also amends FASB Interpretation No. 45 (“FIN 45”), Guarantor’s Accounting and Disclosure Requirements for Guarantees, Including Indirect Guarantees of Indebtedness of Others. The amendments to FAS 133 include required disclosure for (i) the nature and terms of the credit derivative, reasons for entering into the credit derivative, the events or circumstances that would require the seller to perform under the credit derivative, and the current status of the payment performance risk of the credit derivative, (ii) the maximum potential amount of future payments (undiscounted) the seller could be required to make under the credit derivative, (iii) the fair value of the credit derivative, and (iv) the nature of any recourse provisions and assets held either as collateral or by third parties. The amendments to FIN 45 require additional disclosures about the current status of the payment/performance risk of a guarantee. At this time, Management is evaluating the implications of FAS 133-1 and FIN 45-4, but they are not expected to materially impact the Series’ financial statements.
In March 2008, FASB Statement of Financial Accounting Standards No. 161, Disclosures about Derivative Instruments and Hedging Activities (“FAS 161”) was issued and is effective for fiscal years and interim periods beginning after November 15, 2008. FAS 161 requires enhanced disclosures about the Series’ derivative and hedging activities, including how such activities are accounted for and their effect on the Series’ financial position and performance. Management is currently evaluating the impact of the adoption of FAS 161, but it is not expected to materially impact the Series’ financial statements.
Report of Independent Registered Public Accounting Firm
To the Board of Directors of Manning & Napier Fund, Inc. and Shareholders of Core Plus Bond Series:
In our opinion, the accompanying statement of assets and liabilities, including the investment portfolio (except for credit ratings), and the related statements of operations and of changes in net assets and the financial highlights present fairly, in all material respects, the financial position of the Core Plus Bond Series (a series of Manning & Napier Fund, Inc., hereafter referred to as the “Series”) at December 31, 2008, and the results of its operations for the year then ended, the changes in its net assets for each of the two years in the period then ended and the financial highlights for each of the periods indicated, in conformity with accounting principles generally accepted in the United States of America. These financial statements and financial highlights (hereafter referred to as “financial statements”) are the responsibility of the Series’ management; our responsibility is to express an opinion on these financial statements based on our audits. We conducted our audits of these financial statements in accordance with the standards of the Public Company Accounting Oversight Board (United States). Those standards require that we plan and perform the audit to obtain reasonable assurance about whether the financial statements are free of material misstatement. An audit includes examining, on a test basis, evidence supporting the amounts and disclosures in the financial statements, assessing the accounting principles used and significant estimates made by management, and evaluating the overall financial statement presentation. We believe that our audits, which included confirmation of securities at December 31, 2008 by correspondence with the custodian, provide a reasonable basis for our opinion.

Columbus, Ohio
February 13, 2009
Supplemental Tax Information (unaudited)
For federal income tax purposes, the Series designates for the current fiscal year $196,814 or, if different, the maximum amount allowable under the tax law as qualified dividend income.
Pursuant to Section 852 of the Internal Revenue Code, as amended, the Series herby designates $370,638 as capital gains for its taxable year ended December 31, 2008.
Renewal of Investment Advisory Agreement (unaudited)
At the Manning & Napier Fund, Inc. (the “Fund”) Board of Directors’ (the “Board”) meeting, held on November 5, 2008, the Investment Advisory Agreement (the “Agreement”) between the Fund and Manning & Napier Advisors, Inc. (the “Advisor”) was reviewed by the Board for renewal. In connection with the decision whether to renew the Agreement, a variety of material was prepared for and reviewed by the Board.
Representatives of the Advisor attended the meeting and presented additional oral and written information to the Board to assist the Board in its considerations. The discussion immediately below outlines the materials and information presented to the Board in connection with the Board’s 2008 Annual Review of the Agreement and the conclusions made by the Directors when determining to continue the Agreement.
| | • | | The Board considered the services provided by the Advisor under the Agreement including, among others: deciding what securities to purchase and sell for each Series; arranging for the purchase and sale of such securities by placing orders with broker-dealers; administering the affairs of the Fund (including the books and records of the Fund not maintained by third party service providers such as the custodian or sub-transfer agent); arranging for the insurance coverage for the Fund; and supervising the preparation of tax returns, SEC filings (including registration statements) and reports to shareholders for the Fund. The Board also considered the nature and quality of such services provided under the Agreement in light of the Advisor’s services provided to the Fund for 22 years. The Board discussed the quality of these services with representatives from the Advisor and concluded that the Advisor was performing its services to the Fund required under the Agreement in a reasonable manner. |
| | • | | The Board considered the investment performance of the various Series of the Fund. The investment performance for each Series was reviewed on a cumulative basis since inception and on a one year basis. In addition, annualized performance for the following time periods was considered: inception, three year, five year, ten year, and current market cycle. A market cycle includes periods of both rising and falling markets. Returns for established benchmark indices for each Series were provided for each time period. The Board noted that the various Series were competitive against their respective benchmarks and/or peer groups over various time periods, but in particular over the full market cycle period relevant for the Series. In addition, the Board considered at the meeting (and considers on a quarterly basis) a peer group performance analysis consisting of Morningstar universes of mutual funds with similar investment objectives. The Board discussed the performance with representatives from the Advisor and concluded that the investment performance of each of the Fund’s Series was reasonable based on the Fund’s actual performance and comparative performance, especially performance over the current market cycle. |
| | • | | The Board considered the costs of the Advisor’s services and the profits of the Advisor as they relate to the Advisor’s services to the Fund under the Agreement. In reviewing the Advisor’s costs and profits, the Board discussed the Advisor’s revenues generated from the Fund (on both an actual and adjusted basis) and its expenses associated with providing the services under the Agreement. In addition, the Board reviewed the Advisor’s expenses associated with Fund activities outside of the Agreement (such as expense reimbursements pursuant to expense caps and payments made by the Advisor to third party platforms on which shares of the Fund are available for purchase). It was |
Renewal of Investment Advisory Agreement (unaudited)
| | noted by representatives of the Advisor that 15 of the 25 active Series of the Fund are currently experiencing expenses above the capped expense ratios. After discussing the above costs and profits, the Board concluded that the Advisor’s profitability relating to its services provided under the Agreement was reasonable. |
| | • | | The Board considered the fees and expenses of the various Series of the Fund. The Advisor presented the advisory fees and total expenses for each Series, including the advisory fee adjusted for any expense waivers or reimbursements (either contractual or voluntary) paid by the Advisor. The advisory fees and expense ratios of each Series were compared to an average (on both a mean and median basis) of similar funds as disclosed on the Morningstar database. Representatives of the Advisor discussed with the Board the levels of its advisory fee for each Series of the Fund and as compared to the median and mean advisory fees for similar funds as listed on Morningstar. Expense ratios for every Series, except the High Yield Bond Series, Global Fixed Income Series and the Target Series Class R and Class C are currently below the median and mean for similar funds as listed on Morningstar. Based on their review of the information provided, the Board concluded that the fees and expenses of each Series of the Fund were reasonable on a comparative basis. |
| | • | | The Board also considered the other benefits the Advisor derives from its relationship with the Fund. Such other benefits include certain research products provided by soft dollars. Given the level of soft dollar transactions involving the Fund, the Board concluded that these additional benefits to the Advisor were reasonable. |
| | • | | In addition to the factors described above, the Board considered the Advisor’s personnel, investment strategies, policies and procedures relating to compliance with personal securities transactions, and reputation, expertise and resources in domestic and foreign financial markets. The Board concluded that these factors support the conclusion that the Advisor performs its services in a reasonable manner. |
| | • | | The Board did not consider economies of scale at this time because of the multiple uses of the Fund (for the Advisor’s discretionary investment account clients in addition to direct investors), the current profitability of the Advisor’s services to the Fund under the Agreement, and the overall size of the Fund complex. |
Based on the Board’s deliberations and their evaluation of the information described above, the Board, including a majority of Directors that are not “interested persons” as defined in the Investment Company Act of 1940, concluded that the compensation under the Agreement was fair and reasonable in light of the services and expenses and such other matters as the Directors considered to be relevant in the exercise of their reasonable judgment. Accordingly, the Board approved the renewal of the Agreement. In the course of their deliberations, the Directors did not identify any particular information that was all important or controlling.
Directors’ and Officers’ Information (unaudited)
The Statement of Additional Information provides additional information about the Fund’s directors and officers and can be obtained without charge by calling 1-800-466-3863, at www.manningnapieradvisors.com, or on the EDGAR Database on the SEC Internet web site (http://www.sec.gov). The following chart shows certain information about the Fund’s officers and directors, including their principal occupations during the last five years. Unless specific dates are provided, the individuals have held the listed positions for longer than five years.
INTERESTED DIRECTOR/OFFICER
| | |
| Name: | | B. Reuben Auspitz* |
| Address: | | 290 Woodcliff Drive Fairport, NY 14450 |
| Age: | | 61 |
| Current Position(s) Held with Fund: | | Principal Executive Officer, President, Chairman & Director |
| Term of Office1 & Length of Time Served: | | Indefinite - Director since 1984; Vice President 1984 - 2003; President since 2004; Principal Executive Officer since 2002 |
| Principal Occupation(s) During Past 5 Years: | | Executive Vice President; Co-Executive Director; Executive Group Member**; Chief Compliance Officer since 2004 - Manning & Napier Advisors, Inc. President; Director - Manning & Napier Investor Services, Inc. Holds or has held one or more of the following titles for various subsidiaries and affiliates: President, Vice President, Director, Chairman, Treasurer, Chief Compliance Officer or Member. |
| Number of Portfolios Overseen within Fund Complex: | | 28 |
| Other Directorships Held Outside Fund Complex: | | N/A |
| |
| INDEPENDENT DIRECTORS | | |
| |
| Name: | | Stephen B. Ashley |
| Address: | | 290 Woodcliff Drive Fairport, NY 14450 |
| Age: | | 68 |
| Current Position(s) Held with Fund: | | Director, Audit Committee Member, Governance & Nominating Committee Member |
| Term of Office & Length of Time Served: | | Indefinite - Since 1996 |
| Principal Occupation(s) During Past 5 Years: | | Chairman, Director, President & Chief Executive Officer, The Ashley Group (property management and investment). Chairman (non-executive) 2004-2008; Director 1995-2008 - Fannie Mae (mortgage) |
| Number of Portfolios Overseen within Fund Complex: | | 28 |
| Other Directorships Held Outside Fund Complex: | | The Ashley Group |
| Name: | | Peter L. Faber |
| Address: | | 290 Woodcliff Drive Fairport, NY 14450 |
| Age: | | 70 |
| Current Position(s) Held with Fund: | | Director, Governance & Nominating Committee Member |
| Term of Office & Length of Time Served: | | Indefinite - Since 1987 |
| Principal Occupation(s) During Past 5 Years: | | Senior Counsel, McDermott, Will & Emery LLP (law firm) |
| Number of Portfolios Overseen within Fund Complex: | | 28 |
| Other Directorships Held Outside Fund Complex: | | Partnership for New York City, Inc. New York Collegium Boston Early Music Festival |
| Name: | | Harris H. Rusitzky |
| Address: | | 290 Woodcliff Drive Fairport, NY 14450 |
| Age: | | 73 |
| Current Position(s) Held with Fund: | | Director, Audit Committee Member, Governance & Nominating Committee Member |
| Term of Office & Length of Time Served: | | Indefinite - Since 1985 |
| Principal Occupation(s) During Past 5 Years: | | President, The Greening Group (business consultants); Partner, The Restaurant Group (restaurants) |
| Number of Portfolios Overseen within Fund Complex: | | 28 |
| Other Directorships Held Outside Fund Complex: | | N/A |
Directors’ and Officers’ Information (unaudited)
| | |
INDEPENDENT DIRECTORS (continued) |
| Name: | | Paul A. Brooke |
| Address: | | 290 Woodcliff Drive Fairport, NY 14450 |
| Age: | | 63 |
| Current Position(s) Held with Fund: | | Director, Audit Committee Member, Governance & Nominating Committee Member |
| Term of Office & Length of Time Served: | | Indefinite - Since 2007 |
| Principal Occupation(s) During Past 5 Years: | | Chairman & CEO, Alsius Corp. (investments); Managing Member, PMSV Holdings LLC (investments) |
| Number of Portfolios Overseen within Fund Complex: | | 28 |
| Other Directorships Held Outside Fund Complex: | | Incyte Corp. ViroPharma, Inc. HLTH Corp. Cheyne Captial International MPM Bio-equities GMP Companies HoustonPharma |
OFFICERS
| | |
| Name: | | Jeffrey S. Coons, Ph.D., CFA |
| Address: | | 290 Woodcliff Drive Fairport, NY 14450 |
| Age: | | 45 |
| Current Position(s) Held with Fund: | | Vice President |
| Term of Office1 & Length of Time Served: | | Since 2004 |
| Principal Occupation(s) During Past 5 Years: | | Co-Director of Research since 2002 & Executive Group Member**, Manning & Napier Advisors, Inc. Holds one or more of the following titles for various subsidiaries and affiliates: President, Director, Treasurer or Senior Trust Officer. |
| Number of Portfolios Overseen within Fund Complex: | | 28 |
| Other Directorships Held Outside Fund Complex: | | N/A |
| Name: | | Christine Glavin |
| Address: | | 290 Woodcliff Drive Fairport, NY 14450 |
| Age: | | 42 |
| Current Position(s) Held with Fund: | | Principal Financial Officer, Chief Financial Officer |
| Term of Office1 & Length of Time Served: | | Principal Financial Officer since 2002; Chief Financial Officer since 2001 |
| Principal Occupation(s) During Past 5 Years: | | Fund Reporting Manager, Manning & Napier Advisors, Inc. |
| Number of Portfolios Overseen within Fund Complex: | | 28 |
| Other Directorships Held Outside Fund Complex: | | N/A |
| Name: | | Jodi L. Hedberg |
| Address: | | 290 Woodcliff Drive Fairport, NY 14450 |
| Age: | | 41 |
| Current Position(s) Held with Fund: | | Corporate Secretary, Chief Compliance Officer, Anti-Money Laundering Compliance Officer |
| Term of Office1 & Length of Time Served: | | Corporate Secretary since 1997; Chief Compliance Officer since 2004 |
| Principal Occupation(s) During Past 5 Years: | | Director of Compliance, Manning & Napier Advisors, Inc. and affiliates; Corporate Secretary, Manning & Napier Investor Services, Inc. since 2006 |
| Number of Portfolios Overseen within Fund Complex: | | 28 |
| Other Directorships Held Outside Fund Complex: | | N/A |
*Interested Director, within the meaning of the Investment Company Act of 1940 by reason of his position with the Fund’s investment advisor and distributor. Mr. Auspitz serves as the Executive Vice President and Director, Manning & Napier Advisors, Inc. and President and Director, Manning & Napier Investor Services, Inc., the Fund’s distributor.
**The Executive Group performs the duties of the Office of the Chief Executive of Manning & Napier Advisors, Inc.
1The term of office for President, Vice President, Chief Financial Officer, and Corporate Secretary is one year and until their respective successors are chosen and qualified. All other officers’ terms are indefinite.
(THISPAGEINTENTIONALLYLEFTBLANK)
Literature Requests (unaudited)
Proxy Voting Policies and Procedures
A description of the policies and procedures that the Fund uses to determine how to vote proxies relating to portfolio securities is available, without charge, upon request:
| | |
By phone | | 1-800-466-3863 |
On the Securities and Exchange Commission’s (SEC) web site | | http://www.sec.gov |
Proxy Voting Record
Information regarding how the Fund voted proxies relating to portfolio securities during the most recent 12-month period ended June 30th is available, without charge, upon request:
| | |
By phone | | 1-800-466-3863 |
On the SEC’s web site | | http://www.sec.gov |
Quarterly Portfolio Holdings
The Series’ complete schedule of portfolio holdings for the 1st and 3rd quarters of each fiscal year are provided on Form N-Q, and are available, without charge, upon request:
| | |
By phone | | 1-800-466-3863 |
On the SEC’s web site | | http://www.sec.gov |
The Series’ Form N-Q may be reviewed and copied at the SEC’s Public Reference Room in Washington, D.C. Information on the operation of the Public Reference Room may be obtained by calling 1-800-SEC-0330.
Prospectus and Statement of Additional Information (SAI)
The prospectus and SAI provide additional information about each Series, including charges, expenses and risks. These documents are available, without charge, upon request:
| | |
By phone | | 1-800-466-3863 |
On the SEC’s web site | | http://www.sec.gov |
On the Advisor’s web site | | http://www.manningnapieradvisors.com |
Additional information available at www.manningnapieradvisors.com
1. Fund Holdings - Month-End
2. Fund Holdings - Quarter-End
3. Shareholder Report - Annual
4. Shareholder Report - Semi-Annual
Manning & Napier Fund, Inc.
| | | | |
| OHIO TAX EXEMPT SERIES | | | | | Annual Report - December 31, 2008 |

Management Discussion and Analysis (unaudited)
Dear Shareholders:
Credit risk is defined rather innocuously by Bloomberg as “the risk that an obligation will not be completed, with the result being a loss”. That hardly does it justice. In 2008, investors became intimately acquainted with credit risk, the problems it can create and, more importantly, the losses it can inflict. The greater the investor’s exposure to credit risk in 2008, the worse his or her relative performance happened to be. In the fixed income arena, credit risk is most prevalent in the corporate bond market; last year, investors in the high yield area lost more than 30%; investors in the investment-grade market lost more then 5%. Credit risk is also quite prevalent in the growing market for commercial mortgage-backed securities (CMBS); last year that market lost 17%. Credit risk is a key determinant of municipal bond performance; that market dropped by 4% in 2008 as measured by the Merrill Muni Master Index, which includes municipal bonds of all maturities.
A definition of credit risk that is more specific to the bond market is the risk of loss due to a debtor’s non-payment of a loan or some other line of credit, either the principal or interest/coupon, or both. The credit problems that engulfed the financial markets first started to show in the real estate area, specifically in subprime mortgages. They then spread to those that trafficked in such securities, hedge funds and investment banks, subsequently engulfed Fannie Mae and Freddie Mac, and sucked in commercial banks and assorted insurance companies, culminating in a full fledged credit crisis that defined the fourth quarter of 2008.
The markets were already struggling when the year began given the credit missteps that had surfaced in the prior year. Those problems carried over into the first quarter of 2008; however, it became apparent that they had begun to spill over into the overall economy. The situation was exacerbated by a concurrent spike in commodity prices. The problems led to the mid-March fire sale of a major Wall Street firm, Bear Stearns, to JP Morgan Chase that was brokered by the Federal Reserve.
As the credit crisis became more pronounced, investors reigned in their risk tolerances, which resulted in wider credit spreads (the difference in yields as compared to U.S. Treasuries) in both the corporate bond and the municipal bond markets. It also drove U.S. T-bill yields to 50 year lows, caused the auction rate securities market to collapse, and contributed to the implosion of numerous hedge funds. As the prices of oil, gold, and other commodities increased, inflation risks were re-awakened, lowering risk tolerances even more.
Early in September, Fannie Mae and Freddie Mac, the two largest government sponsored entities, were forced into conservatorship, whereby the U.S. Government took control over both entities, along with their $5 trillion of financial obligations. The markets spent a week digesting that, and then came the week of September 14th, which will go down as one of the most cataclysmic weeks in the history of the financial markets.
On Sunday of that week, Lehman Brothers announced that it would file for bankruptcy. That news was quickly followed by more bad news, including the quick sale of Merrill Lynch to Bank of America, bankruptcy fears at insurer AIG, and a money market fund “breaking the buck”. The environment was so bad that the yield on 3-month U.S. Treasury Bills, universally considered to be the risk-free investment, was driven down to 0.02% as investors scrambled to find a safe harbor.
In hindsight, the Lehman bankruptcy seemed to be a watershed event that pushed the U.S. economy over the precipice. And while the federal government spigot is likely to be turned on, state and local spending is poised to slow dramatically as evidenced by the state of California paying its vendors with IOU’s for the first time since the 1930’s.
The moves in the financial markets during the quarter were just as dismal. In the equity markets, both the Dow Industrial Index and Standard and Poor’s (S&P) 500 Total Return Index were down more than 20% for the quarter; the NASDAQ Composite was down 25%. It wasn’t just the equity markets that struggled, the corporate bond market and the municipal bond market both sold off quite dramatically. There was, however, a glimmer of hope, when both exhibited signs of recovery as the quarter and the year came to a close.
Management Discussion and Analysis (unaudited)
One area of the municipal market that did not struggle quite so much last year was the short-to-intermediate maturity sector. Not only did short-term municipals earn their coupons, they also generated modest capital gains. That was the exact opposite of what happened in the long-term municipal market; longer-term municipal bonds were down just under -15% last year.
As for the performance of the Ohio Tax Exempt Series in 2008, its total return was -1.74%. That lagged the Merrill Lynch 1-12 Year Municipal Bond Index, which only includes municipal bonds with maturities of 12 years or less; it returned 4.61% in 2008. The Series’ underperformance versus the benchmark was strictly a function of the aforementioned weak performance of longer-term municipals. With a significant percentage of the Series’ assets invested in longer-term municipal bonds, the Series simply could not compete with the benchmark in 2008. However, longer-term bonds have historically outperformed shorter-term ones.
As always, we appreciate your business.
Sincerely,
Manning & Napier Advisors, Inc.
Performance Update as of December 31, 2008 (unaudited)
| | | | | | | | | | |
| | | Average Annual Total Returns
As of December 31, 2008 | | |
| | | One
Year | | Five
Year | | Ten
Year | | Since
Inception1 | | |
Manning & Napier Fund, Inc. - Ohio Tax Exempt Series2 | | -1.74% | | 2.15% | | 3.37% | | 4.00% | | |
Merrill Lynch 1-12 Year Municipal Bond Index3 | | 4.61% | | 3.73% | | 4.83% | | 5.16% | | |
The following graph compares the value of a $10,000 investment in the Manning & Napier Fund, Inc. - Ohio Tax Exempt Series for the ten years ended December 31, 2008 to the Merrill Lynch 1-12 Year Municipal Bond Index.
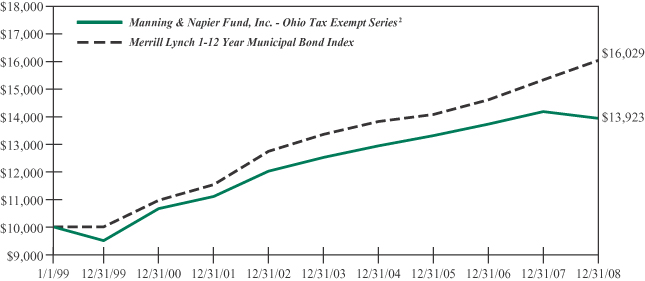
1Performance numbers for the Series and Index are calculated from February 14, 1994, the Series’ inception date.
2The Series’ performance does not reflect the deduction of taxes that a shareholder would pay on fund distributions or the redemption of shares. The Series’ performance is historical and may not be indicative of future results. The performance returns shown are inclusive of the net expense ratio of the Series. For the year ended December 31, 2008, this net expense ratio was 0.85%. The gross expense ratio, which does not account for any voluntary or contractual waivers currently in effect, was 0.86% for the year ended December 31, 2008.
3The Merrill Lynch 1-12 Year Municipal Bond Index is an unmanaged, market weighted index comprised of investment-grade, fixed rate, coupon bearing municipal bonds with maturities greater than one year but less than twelve years. The Index returns assume reinvestment of coupons and, unlike Series returns, do not reflect any fees or expenses.
Shareholder Expense Example (unaudited)
As a shareholder of the Series, you may incur two types of costs: (1) transaction costs, including potential wire charges on redemptions and (2) ongoing costs, including management fees and other Series expenses. This example is intended to help you understand your ongoing costs (in dollars) of investing in the Series and to compare these costs with the ongoing costs of investing in other mutual funds.
The example is based on an investment of $1,000 invested at the beginning of the period and held for the entire period (July 1, 2008 to December 31, 2008).
Actual Expenses
The first line of the table below provides information about actual account values and actual expenses. You may use the information in this line, together with the amount you invested, to estimate the expenses that you paid over the period. Simply divide your account value by $1,000 (for example, an $8,600 account value divided by $1,000 = 8.6), then multiply the result by the number in the first line under the heading entitled “Expenses Paid During Period” to estimate the expenses you paid on your account during this period.
Hypothetical Example for Comparison Purposes
The second line of the table below provides information about hypothetical account values and hypothetical expenses based on the Series’ actual expense ratio and an assumed rate of return of 5% per year before expenses, which is not the Series’ actual return. The hypothetical account values and expenses may not be used to estimate the actual ending account balance or expenses you paid during the period. You may use this information to compare the ongoing costs of investing in the Series and other funds. To do so, compare this 5% hypothetical example with the 5% hypothetical examples that appear in the shareholder reports of the other funds.
Please note that the expenses shown in the table are meant to highlight your ongoing costs only and do not reflect any transaction costs, such as potential wire charges on redemptions. Therefore, the second line of the table is useful in comparing ongoing costs only, and will not help you determine the relative total costs of owning different funds. In addition, if these transaction costs were included, your costs would have been higher.
| | | | | | | | | |
| | | Beginning
Account Value
7/1/08 | | Ending
Account Value
12/31/08 | | Expenses Paid
During Period*
7/1/08-12/31/08 |
Actual | | $ | 1,000.00 | | $ | 986.30 | | $ | 4.24 |
Hypothetical
(5% return before expenses) | | $ | 1,000.00 | | $ | 1,020.86 | | $ | 4.32 |
*Expenses are equal to the Series’ annualized expense ratio (for the six-month period) of 0.85%, multiplied by the average account value over the period, multiplied by 184/366 (to reflect the one-half year period). Expenses are based on the most recent fiscal half year; therefore, the expense ratio stated above may differ from the expense ratio stated in the financial highlights, which is based on one-year data. The Series’ total return would have been lower had certain expenses not been waived during the period.
Portfolio Composition as of December 31, 2008 (unaudited)
Bond Types1
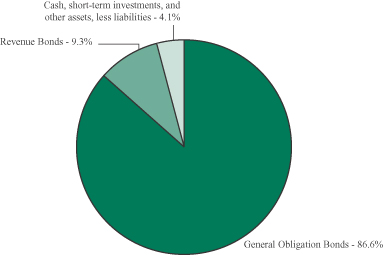
1As a percentage of net assets.
Credit Quality Ratings2,3
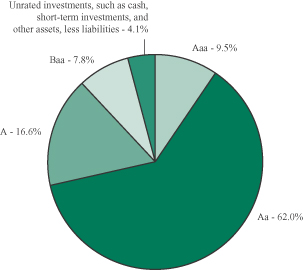
2As a percentage of net assets.
3Based on ratings from Moody’s or the S&P equivalent. The Series may use different ratings provided by other rating agencies for purposes of determining compliance with the Series’ investment policies.
Investment Portfolio - December 31, 2008
| | | | | | | | | | | | | | |
| | | Coupon
Rate | | | Maturity
Date | | Credit
Rating1
(unaudited) | | | Principal
Amount | | Value
(Note 2) |
| | | | | | | | | | | | | | |
| | | | | |
OHIO MUNICIPAL SECURITIES - 95.9% | | | | | | | | | | | | | | |
Bedford Heights, Series A, G.O. Bond, AMBAC | | 5.650 | % | | 12/1/2014 | | A2 | | | $ | 25,000 | | $ | 26,522 |
Big Walnut Local School District, Delaware County, School Facilities Construction & Impt., G.O. Bond, FSA | | 4.500 | % | | 12/1/2029 | | Aa3 | | | | 200,000 | | | 180,990 |
Canal Winchester Local School District, Prerefunded Balance, G.O. Bond, MBIA | | 5.000 | % | | 12/1/2025 | | A3 | | | | 355,000 | | | 407,533 |
Canal Winchester Local School District, G.O. Bond, FSA | | 4.250 | % | | 12/1/2027 | | Aa3 | | | | 500,000 | | | 412,565 |
Chillicothe Water System, Revenue Bond, MBIA | | 4.000 | % | | 12/1/2009 | | Baa1 | | | | 125,000 | | | 126,861 |
Cincinnati Water Systems, Series B, Revenue Bond, MBIA | | 5.000 | % | | 12/1/2023 | | Aa2 | | | | 600,000 | | | 616,656 |
Cleveland Heights & University Heights County School District, Library Impt., G.O. Bond | | 5.125 | % | | 12/1/2026 | | Aa3 | | | | 200,000 | | | 205,230 |
Cleveland, Income Tax, Revenue Bond | | 5.250 | % | | 5/15/2024 | | AA | 2 | | | 500,000 | | | 512,355 |
Columbus, Limited Tax, Series 2, G.O. Bond | | 5.000 | % | | 7/1/2017 | | Aaa | | | | 250,000 | | | 270,497 |
Columbus City School District, School Facilities Construction & Impt., G.O. Bond, FSA | | 4.250 | % | | 12/1/2032 | | Aa3 | | | | 500,000 | | | 421,790 |
Cuyahoga Falls, G.O. Bond, MBIA | | 5.000 | % | | 12/1/2021 | | Aa3 | | | | 750,000 | | | 767,100 |
Dublin City School District, School Facilities Construction & Impt., Prerefunded Balance, G.O. Bond | | 5.375 | % | | 12/1/2017 | | Aa1 | | | | 350,000 | | | 394,380 |
Eaton City School District, Prerefunded Balance, G.O. Bond, FGIC | | 5.000 | % | | 12/1/2029 | | A1 | | | | 200,000 | | | 224,398 |
Eaton Community City Schools, School Impt., G.O. Bond, FGRMB | | 4.125 | % | | 12/1/2026 | | A1 | | | | 500,000 | | | 401,965 |
Erie County, G.O. Bond, FGRMB | | 4.750 | % | | 10/1/2019 | | A1 | | | | 175,000 | | | 175,220 |
Euclid, G.O. Bond, MBIA | | 4.250 | % | | 12/1/2023 | | A1 | | | | 465,000 | | | 438,249 |
Fairbanks Local School District, School Facilities Construction & Impt., G.O. Bond, FSA | | 4.500 | % | | 12/1/2028 | | Aa3 | | | | 400,000 | | | 341,564 |
Fairfield County, Building Impt., G.O. Bond | | 5.000 | % | | 12/1/2018 | | Aa3 | | | | 250,000 | | | 261,222 |
Fairview Park City School District, School Impt., G.O. Bond, MBIA | | 5.000 | % | | 12/1/2029 | | A2 | | | | 315,000 | | | 285,384 |
Field Local School District, School Facilities Construction & Impt., G.O. Bond, AMBAC | | 5.000 | % | | 12/1/2026 | | Baa1 | | | | 200,000 | | | 186,956 |
Franklin County, G.O. Bond | | 5.000 | % | | 12/1/2027 | | Aaa | | | | 500,000 | | | 508,255 |
Granville Exempt Village School District, G.O. Bond, FSA | | 4.375 | % | | 12/1/2031 | | Aa2 | | | | 500,000 | | | 433,060 |
Greater Cleveland Regional Transit Authority, Capital Impts., G.O. Bond, FGRMB | | 4.125 | % | | 12/1/2023 | | Aa3 | | | | 450,000 | | | 384,849 |
Hamilton City School District, School Impt., G.O. Bond, FSA | | 4.250 | % | | 12/1/2030 | | Aa3 | | | | 500,000 | | | 420,890 |
| | |
| 6 | | The accompanying notes are an integral part of the financial statements. |
Investment Portfolio - December 31, 2008
| | | | | | | | | | | | | | |
| | | Coupon
Rate | | | Maturity
Date | | Credit
Rating1
(unaudited) | | | Principal
Amount | | Value
(Note 2) |
| | | | | | | | | | | | | | |
| | | | | |
OHIO MUNICIPAL SECURITIES (continued) | | | | | | | | | | | | | | |
Hancock County, Various Purposes, G.O. Bond, MBIA | | 4.000 | % | | 12/1/2016 | | Aa3 | | | $ | 200,000 | | $ | 208,968 |
Indian Hill Village School District, Hamilton County, School Impt., G.O. Bond | | 4.375 | % | | 12/1/2022 | | Aaa | | | | 250,000 | | | 244,710 |
Ironton City School District, G.O. Bond, MBIA | | 4.250 | % | | 12/1/2028 | | Baa1 | | | | 500,000 | | | 400,065 |
Jackson Local School District, Stark & Summit Counties, Construction & Impt., Prerefunded Balance, G.O. Bond, FGIC | | 5.000 | % | | 12/1/2030 | | AA | 2 | | | 200,000 | | | 227,820 |
Jackson Local School District, Stark & Summit Counties, G.O. Bond, FGRMB | | 3.500 | % | | 12/1/2011 | | AA | 2 | | | 210,000 | | | 217,531 |
Kettering City School District, School Impt., G.O. Bond, FSA | | 4.250 | % | | 12/1/2025 | | Aa3 | | | | 750,000 | | | 660,337 |
Lakewood, Water System, Revenue Bond, AMBAC | | 4.500 | % | | 7/1/2028 | | Baa1 | | | | 500,000 | | | 399,665 |
Licking Heights Local School District, School Facilities Construction & Impt., Series A, G.O. Bond, MBIA | | 5.000 | % | | 12/1/2022 | | A1 | | | | 250,000 | | | 252,585 |
Lorain City School District, Classroom Facilities Impt., Unrefunded Balance, G.O. Bond, MBIA | | 4.750 | % | | 12/1/2025 | | Aa2 | | | | 335,000 | | | 333,482 |
Marysville Exempt Village School District, G.O. Bond, FSA | | 5.000 | % | | 12/1/2023 | | Aa3 | | | | 500,000 | | | 493,875 |
Maumee, G.O. Bond, MBIA | | 4.125 | % | | 12/1/2018 | | Aa3 | | | | 375,000 | | | 382,504 |
Maumee City School District, School Facilities Construction & Impt., G.O. Bond, FSA | | 4.600 | % | | 12/1/2031 | | Aa3 | | | | 260,000 | | | 239,242 |
Minster Local School District, G.O. Bond, FSA | | 4.250 | % | | 12/1/2018 | | Aa3 | | | | 250,000 | | | 256,448 |
New Albany Plain Local School District, Prerefunded Balance, G.O. Bond, FGIC | | 5.000 | % | | 12/1/2025 | | Aa2 | | | | 45,000 | | | 49,524 |
New Albany Plain Local School District, Prerefunded Balance, G.O. Bond, FGIC | | 5.000 | % | | 12/1/2029 | | Aa2 | | | | 95,000 | | | 104,550 |
New Albany Plain Local School District, Unrefunded Balance, G.O. Bond, FGIC | | 5.000 | % | | 12/1/2029 | | Aa2 | | | | 130,000 | | | 117,194 |
New Albany Plain Local School District, Prerefunded Balance, G.O. Bond, FGIC | | 5.000 | % | | 12/1/2025 | | Aa2 | | | | 85,000 | | | 93,545 |
New Albany Plain Local School District, Unrefunded Balance, G.O. Bond, FGIC | | 5.000 | % | | 12/1/2025 | | Aa2 | | | | 185,000 | | | 178,442 |
North Royalton, G.O. Bond | | 5.250 | % | | 12/1/2028 | | Aa3 | | | | 1,025,000 | | | 1,029,674 |
Ohio State, Infrastructure Impt., Series A, G.O. Bond | | 5.000 | % | | 3/1/2017 | | Aa1 | | | | 250,000 | | | 277,575 |
Ohio State Water Development Authority, Pure Water, Series I, Revenue Bond, AMBAC | | 6.000 | % | | 12/1/2016 | | Aaa | | | | 40,000 | | | 45,301 |
Ohio State Water Development Authority, Pollution Control, Revenue Bond | | 5.250 | % | | 12/1/2015 | | Aaa | | | | 200,000 | | | 229,272 |
| | |
| The accompanying notes are an integral part of the financial statements. | | 7 |
Investment Portfolio - December 31, 2008
| | | | | | | | | | | | | | |
| | | Coupon
Rate | | | Maturity
Date | | Credit
Rating1
(unaudited) | | | Principal
Amount/Shares | | Value
(Note 2) |
| | | | | | | | | | | | | | |
| | | | | |
OHIO MUNICIPAL SECURITIES (continued) | | | | | | | | | | | | | | |
Olentangy Local School District, Series A, G.O. Bond, FSA | | 4.500 | % | | 12/1/2032 | | Aa2 | | | $ | 800,000 | | $ | 676,384 |
Orange City School District, G.O. Bond | | 4.500 | % | | 12/1/2023 | | Aaa | | | | 500,000 | | | 477,565 |
Painesville City School District, School Impt., G.O. Bond, FGRMB | | 4.500 | % | | 12/1/2025 | | A2 | | | | 170,000 | | | 148,101 |
Pickerington Local School District, G.O. Bond, MBIA | | 4.300 | % | | 12/1/2024 | | Baa1 | | | | 300,000 | | | 257,781 |
Plain Local School District, G.O. Bond, FGRMB | | 5.000 | % | | 12/1/2030 | | AA | 2 | | | 140,000 | | | 125,878 |
Sidney City School District, School Impt., Prerefunded Balance, Series B, G.O. Bond, FGIC | | 5.100 | % | | 12/1/2019 | | A2 | | | | 150,000 | | | 166,106 |
South-Western City School District, Franklin & Pickway County, G.O. Bond, FSA | | 4.250 | % | | 12/1/2026 | | Aa3 | | | | 600,000 | | | 502,392 |
Springboro Community City School District, School Impt., Prerefunded Balance, G.O. Bond, MBIA | | 5.000 | % | | 12/1/2025 | | A2 | | | | 280,000 | | | 319,407 |
Sugarcreek Local School District, School Impt., G.O. Bond, FSA | | 4.250 | % | | 12/1/2031 | | Aa3 | | | | 750,000 | | | 580,440 |
Tallmadge City School District, School Facilities, G.O. Bond, FSA | | 5.000 | % | | 12/1/2031 | | AAA | 2 | | | 200,000 | | | 197,840 |
Tecumseh Local School District, School Impt., G.O. Bond, FGRMB | | 4.750 | % | | 12/1/2027 | | A3 | | | | 195,000 | | | 171,986 |
Trotwood-Madison City School District, School Impt., G.O. Bond, FSA | | 4.250 | % | | 12/1/2022 | | Aa3 | | | | 250,000 | | | 225,065 |
Troy, G.O. Bond | | 4.750 | % | | 12/1/2024 | | Aa2 | | | | 250,000 | | | 250,725 |
Van Buren Local School District, School Facilities Construction & Impt., G.O. Bond, FSA | | 5.250 | % | | 12/1/2016 | | Aa3 | | | | 300,000 | | | 317,004 |
Vandalia, G.O. Bond, AMBAC | | 5.000 | % | | 12/1/2015 | | Baa1 | | | | 235,000 | | | 249,361 |
Washington Court House City School District, School Impt., G.O. Bond, FGRMB | | 5.000 | % | | 12/1/2029 | | A3 | | | | 500,000 | | | 452,990 |
Wood County, G.O. Bond | | 5.400 | % | | 12/1/2013 | | Aa3 | | | | 25,000 | | | 25,040 |
| | | | | | | | | | | | | | |
TOTAL OHIO MUNICIPAL SECURITIES (Identified Cost $21,327,503) | | | | | | | | | | | | | | 19,990,865 |
| | | | | | | | | | | | | | |
| | | | | |
SHORT-TERM INVESTMENTS - 3.8% | | | | | | | | | | | | | | |
Dreyfus AMT - Free Municipal Reserves - Class R (Identified Cost $785,256) | | | | | | | | | | | 785,256 | | | 785,256 |
| | | | | | | | | | | | | | |
TOTAL INVESTMENTS - 99.7%
(Identified Cost $22,112,759) | | | | | | | | | | | | | | 20,776,121 |
| | | | | |
OTHER ASSETS, LESS LIABILITIES - 0.3% | | | | | | | | | | | | | | 68,133 |
| | | | | | | | | | | | | | |
NET ASSETS - 100% | | | | | | | | | | | | | $ | 20,844,254 |
| | | | | | | | | | | | | | |
| | |
| 8 | | The accompanying notes are an integral part of the financial statements. |
Investment Portfolio - December 31, 2008
Key:
G.O. Bond - General Obligation Bond
Impt. - Improvement
Scheduled principal and interest payments are guaranteed by:
AMBAC (AMBAC Assurance Corp.)
FGIC (Financial Guaranty Insurance Co.)
FGRMB (FGIC reinsured by MBIA)
FSA (Financial Security Assurance)
MBIA (MBIA, Inc.)
The insurance does not guarantee the market value of the municipal bonds.
1Credit ratings from Moody’s (unaudited).
2Credit ratings from S&P (unaudited).
The Series’ portfolio holds, as a percentage of net assets, greater than 10% in bonds insured by the following companies: MBIA - 33.0%; FSA - 30.5%.
| | |
| The accompanying notes are an integral part of the financial statements. | | 9 |
Statement of Assets and Liabilities
December 31, 2008
| | | | |
ASSETS: | | | | |
| | | | |
| |
Investments, at value (identified cost $22,112,759) (Note 2) | | $ | 20,776,121 | |
Interest receivable | | | 121,152 | |
Dividends receivable | | | 1,062 | |
| | | | |
TOTAL ASSETS | | | 20,898,335 | |
| | | | |
| LIABILITIES: | | | | |
| |
Accrued management fees (Note 3) | | | 6,472 | |
Accrued fund accounting and transfer agent fees (Note 3) | | | 2,485 | |
Accrued Chief Compliance Officer service fees (Note 3) | | | 477 | |
Audit fees payable | | | 29,336 | |
Payable for fund shares repurchased | | | 11,774 | |
Other payables and accrued expenses | | | 3,537 | |
| | | | |
TOTAL LIABILITIES | | | 54,081 | |
| | | | |
TOTAL NET ASSETS | | $ | 20,844,254 | |
| | | | |
NET ASSETS CONSIST OF: | | | | |
| |
Capital stock | | $ | 21,224 | |
Additional paid-in-capital | | | 21,990,950 | |
Undistributed net investment income | | | 77,536 | |
Accumulated net realized gain on investments | | | 91,182 | |
Net unrealized depreciation on investments | | | (1,336,638 | ) |
| | | | |
TOTAL NET ASSETS | | $ | 20,844,254 | |
| | | | |
NET ASSET VALUE, OFFERING PRICE AND REDEMPTION PRICE PER SHARE ($20,844,254/2,122,407 shares) | | $ | 9.82 | |
| | | | |
| | |
| 10 | | The accompanying notes are an integral part of the financial statements. |
Statement of Operations
For the Year Ended December 31, 2008
| | | | |
INVESTMENT INCOME: | | | | |
| | | | |
| |
Interest | | $ | 1,052,861 | |
Dividends | | | 12,369 | |
| | | | |
Total Investment Income | | | 1,065,230 | |
| | | | |
| EXPENSES: | | | | |
| |
Management fees (Note 3) | | | 120,430 | |
Fund accounting and transfer agent fees (Note 3) | | | 27,895 | |
Directors’ fees (Note 3) | | | 12,599 | |
Chief Compliance Officer service fees (Note 3) | | | 4,301 | |
Audit fees | | | 29,251 | |
Custodian fees | | | 1,600 | |
Miscellaneous | | | 12,087 | |
| | | | |
Total Expenses | | | 208,163 | |
Less reduction of expenses (Note 3) | | | (3,565 | ) |
| | | | |
Net Expenses | | | 204,598 | |
| | | | |
NET INVESTMENT INCOME | | | 860,632 | |
| | | | |
| REALIZED AND UNREALIZED GAIN (LOSS) ON INVESTMENTS: | | | | |
| |
Net realized gain on investments | | | 184,021 | |
Net change in unrealized appreciation (depreciation) on investments | | | (1,700,851 | ) |
| | | | |
| |
NET REALIZED AND UNREALIZED GAIN (LOSS) ON INVESTMENTS | | | (1,516,830 | ) |
| | | | |
NET DECREASE IN NET ASSETS RESULTING FROM OPERATIONS | | $ | (656,198 | ) |
| | | | |
| | |
| The accompanying notes are an integral part of the financial statements. | | 11 |
Statement of Changes in Net Assets
| | | | | | | | |
| | | For the
Year Ended
12/31/08 | | | For the
Year Ended
12/31/07 | |
| | | | | | | | |
| INCREASE (DECREASE) IN NET ASSETS: | | | | | | | | |
| | |
| OPERATIONS: | | | | | | | | |
| | |
Net investment income | | $ | 860,632 | | | $ | 809,469 | |
Net realized gain on investments | | | 184,021 | | | | 978 | |
Net change in unrealized appreciation (depreciation) on investments | | | (1,700,851 | ) | | | (1,877 | ) |
| | | | | | | | |
Net increase (decrease) from operations | | | (656,198 | ) | | | 808,570 | |
| | | | | | | | |
| DISTRIBUTIONS TO SHAREHOLDERS (Note 8): | | | | | | | | |
| | |
From net investment income | | | (849,459 | ) | | | (832,869 | ) |
From net realized gain on investments | | | (119,985 | ) | | | — | |
| | | | | | | | |
Total distributions to shareholders | | | (969,444 | ) | | | (832,869 | ) |
| | | | | | | | |
| CAPITAL STOCK ISSUED AND REPURCHASED: | | | | | | | | |
| | |
Net increase (decrease) from capital share transactions (Note 5) | | | (3,962,597 | ) | | | 5,845,120 | |
| | | | | | | | |
Net increase (decrease) in net assets | | | (5,588,239 | ) | | | 5,820,821 | |
| | |
| NET ASSETS: | | | | | | | | |
| | |
Beginning of year | | | 26,432,493 | | | | 20,611,672 | |
| | | | | | | | |
End of year (including undistributed net investment income of $77,536 and $93,573, respectively) | | $ | 20,844,254 | | | $ | 26,432,493 | |
| | | | | | | | |
| | |
| 12 | | The accompanying notes are an integral part of the financial statements. |
Financial Highlights
| | | | | | | | | | |
| | | For the Years Ended |
| | | 12/31/08 | | 12/31/07 | | 12/31/06 | | 12/31/05 | | 12/31/04 |
| | | | | | | | | | |
| | | | | | | | | | |
| Per share data (for a share outstanding throughout each year): | | | | | | | | | | |
Net asset value - Beginning of year | | $10.43 | | $10.46 | | $10.52 | | $10.59 | | $10.75 |
| | | | | | | | | | |
Income (loss) from investment operations: | | | | | | | | | | |
Net investment income | | 0.38 | | 0.34 | | 0.38 | | 0.38 | | 0.38 |
Net realized and unrealized gain (loss) on investments | | (0.57) | | —2 | | (0.05) | | (0.08) | | (0.04) |
| | | | | | | | | | |
Total from investment operations | | (0.19) | | 0.34 | | 0.33 | | 0.30 | | 0.34 |
| | | | | | | | | | |
Less distributions to shareholders: | | | | | | | | | | |
From net investment income | | (0.36) | | (0.37) | | (0.38) | | (0.36) | | (0.49) |
From net realized gain on investments | | (0.06) | | — | | (0.01) | | (0.01) | | (0.01) |
| | | | | | | | | | |
Total distributions to shareholders | | (0.42) | | (0.37) | | (0.39) | | (0.37) | | (0.50) |
| | | | | | | | | | |
Net asset value - End of year | | $9.82 | | $10.43 | | $10.46 | | $10.52 | | $10.59 |
| | | | | | | | | | |
Net assets - End of year (000’s omitted) | | $20,844 | | $26,432 | | $20,612 | | $15,988 | | $14,120 |
| | | | | | | | | | |
Total return1 | | (1.74%) | | 3.28% | | 3.19% | | 2.85% | | 3.28% |
Ratios (to average net assets)/
Supplemental Data: | | | | | | | | | | |
Expenses* | | 0.85% | | 0.85% | | 0.85% | | 0.85% | | 0.85% |
Net investment income | | 3.58% | | 3.47% | | 3.81% | | 3.65% | | 3.64% |
Portfolio turnover | | 15% | | 3% | | 9% | | 9% | | 7% |
|
*The investment advisor did not impose all of its management fee. If these expenses had been incurred by the Series, the expense ratio (to average net assets) would have been increased by the following amount: |
| | 0.01% | | 0.00%3 | | 0.07% | | 0.15% | | 0.20% |
1Represents aggregate total return for the year indicated, and assumes reinvestment of all distributions. Total return would have been lower had certain expenses not been waived during the year.
2Less than $0.01 per share.
3Less than 0.01%.
| | |
| The accompanying notes are an integral part of the financial statements. | | 13 |
Notes to Financial Statements
Ohio Tax Exempt Series (the “Series”) is a no-load diversified series of Manning & Napier Fund, Inc. (the “Fund”). The Fund is organized in Maryland and is registered under the Investment Company Act of 1940, as amended, as an open-end management investment company.
The Series’ investment objective is to provide as high a level of current income exempt from federal income tax and Ohio State personal income tax as the Advisor believes is consistent with the preservation of capital.
The Fund’s Advisor is Manning & Napier Advisors, Inc. (the “Advisor”). Shares of the Series are offered to investors, clients and employees of the Advisor and its affiliates. The total authorized capital stock of the Fund consists of 5.0 billion shares of common stock each having a par value of $0.01. As of December 31, 2008, 4.5 billion shares have been designated in total among 28 series, of which 100 million have been designated as Ohio Tax Exempt Series Class A common stock.
| 2. | SIGNIFICANT ACCOUNTING POLICIES |
Security Valuation
Municipal securities will normally be valued on the basis of market valuations provided by an independent pricing service (the “Service”). The Service utilizes the latest price quotations and a matrix system (which considers such factors as security prices of similar securities, yields, maturities and ratings). The Service has been approved by the Fund’s Board of Directors (the “Board”).
Securities for which representative valuations or prices are not available from the Fund’s pricing service may be valued at fair value. Due to the inherent uncertainty of valuations of such securities, the fair value may differ significantly from the values that would have been used had a ready market for such securities existed. Fair value is determined in good faith by the Advisor under procedures approved by and under the general supervision and responsibility of the Fund’s Board.
Short-term investments that mature in sixty days or less are valued at amortized cost, which approximates market value. Investments in open-end investment companies are valued at their net asset value per share on valuation date.
In September 2006, FASB Statement of Financial Accounting Standards No. 157, Fair Value Measurements (“FAS 157”) was issued, effective for fiscal years beginning after November 15, 2007. This standard clarifies the definition of fair value for financial reporting, establishes a framework for measuring fair value and requires additional disclosures about the use of fair value measurements. FAS 157 became effective for the Series as of January 1, 2008, the beginning of its current fiscal year. The three levels of the fair value hierarchy under FAS 157 are described below:
Level 1 - quoted prices in active markets for identical securities
Level 2 - other significant observable inputs (including quoted prices for similar securities, interest rates, prepayment speeds, credit risk, etc.)
Level 3 - significant unobservable inputs (including the Series’ own assumptions in determining the fair value of investments.)
Notes to Financial Statements
| 2. | SIGNIFICANT ACCOUNTING POLICIES (continued) |
Security Valuation (continued)
The inputs or methodology used for valuing securities are not necessarily an indication of the risk associated with investing in those securities. The following is a summary of the inputs used to value the Series’ assets as of December 31, 2008:
| | | | | | |
Valuation Inputs | | Investments In
Securities | | Other Financial
Instruments* |
| | | | | | |
Level 1 - Quoted Prices | | $ | 785,256 | | $ | — |
Level 2 - Other Significant Observable Inputs | | | 19,990,865 | | | — |
Level 3 - Significant Unobservable Inputs | | | — | | | — |
| | | | | | |
Total | | $ | 20,776,121 | | $ | — |
| | | | | | |
*Other financial instruments are derivative instruments not reflected in the Investment Portfolio, such as futures, forwards and swap contracts, which are valued at the unrealized appreciation/depreciation on the instrument. As of December 31, 2008, the Series did not hold any derivative instruments.
There were no Level 3 securities held by the Series as of December 31, 2007 or December 31, 2008.
Security Transactions, Investment Income and Expenses
Security transactions are accounted for on trade date. Interest income, including amortization of premium and accretion of discounts using the effective interest method, is earned from settlement date and accrued daily. Dividend income is recorded on an accrual basis on ex-dividend date.
Expenses are recorded on an accrual basis. Most expenses of the Fund can be attributed to a specific series. Expenses which cannot be directly attributed are apportioned among the series in the Fund in such a manner as deemed equitable by the Fund’s Board, taking into consideration, among other things, the nature and type of expense.
The Series uses the identified cost method for determining realized gain or loss on investments for both financial statement and federal income tax reporting purposes.
Federal Taxes
The Series’ policy is to comply with the provisions of the Internal Revenue Code applicable to regulated investment companies. The Series is not subject to federal income tax or excise tax to the extent that the Series distributes to shareholders each year its taxable income, including any net realized gains on investments, in accordance with requirements of the Internal Revenue Code. Accordingly, no provision for federal income tax or excise tax has been made in the financial statements.
On June 29, 2007, the Series adopted Financial Accounting Standards Board Interpretation No. 48 - Accounting for Uncertainty in Income Taxes (“FIN 48”). FIN 48 prescribes the minimum recognition threshold a tax position must meet in connection with accounting for uncertainties in income tax positions taken or expected to be taken by an entity before being measured and recognized in the financial statements. Management has determined that the adoption of FIN 48 did not have a material impact on the Series’ financial statements. The Series files income tax returns in the U.S. federal jurisdiction and various states, as required. No income tax returns are currently under investigation. The statute of limitations on the Series’ tax returns remains open for the years ended December 31, 2005 through December 31, 2008.
Notes to Financial Statements
| 2. | SIGNIFICANT ACCOUNTING POLICIES (continued) |
Distributions of Income and Gains
Distributions to shareholders of net investment income are made quarterly. Distributions of net realized gains are made annually. An additional distribution may be necessary to avoid taxation of the Series. Distributions are recorded on the ex-dividend date.
Indemnifications
The Fund’s organizational documents provide former and current directors and officers with a limited indemnification against liabilities arising in connection with the performance of their duties to the Fund. In the normal course of business, the Fund may also enter into contracts that provide general indemnifications. The Fund’s maximum exposure under these arrangements is unknown as this would be dependent on future claims that may be made against the Fund. The risk of material loss from such claims is considered remote.
Other
The preparation of financial statements in conformity with accounting principles generally accepted in the United States of America requires management to make estimates and assumptions that affect the reported amounts of assets and liabilities and the disclosure of contingent assets and liabilities at the date of the financial statements and the reported amounts of income and expenses during the reporting period. Actual results could differ from those estimates.
| 3. | TRANSACTIONS WITH AFFILIATES |
The Fund has an Investment Advisory Agreement (the “Agreement”) with the Advisor, for which the Series pays a fee, computed daily and payable monthly, at an annual rate of 0.50% of the Series’ average daily net assets.
Under the Agreement, personnel of the Advisor provide the Series with advice and assistance in the choice of investments and the execution of securities transactions, and otherwise maintain the Series’ organization. The Advisor also provides the Fund with necessary office space and fund administration and support services. The salaries of all officers of the Fund (except a percentage of the Fund’s Chief Compliance Officer’s salary, which is paid by the Fund), and of all Directors who are “affiliated persons” of the Fund, or of the Advisor, and all personnel of the Fund, or of the Advisor, performing services relating to research, statistical and investment activities, are paid by the Advisor. Each “non-affiliated” Director receives an annual stipend, which is allocated among all the active series of the Fund. In addition, these Directors also receive a fee per Board meeting attended for each active series of the Fund plus a fee for each committee meeting attended.
The Advisor has contractually agreed, until at least April 30, 2010, to waive its fee and, if necessary, pay other operating expenses of the Series in order to maintain total direct annual fund operating expenses for the Series at no more than 0.85% of average daily net assets each year. Accordingly, the Advisor waived fees of $3,565 for the year ended December 31, 2008, which is reflected as a reduction of expenses on the Statement of Operations. The Advisor is not eligible to recoup any expenses that have been waived or reimbursed in prior years.
Manning & Napier Investor Services, Inc., a registered broker-dealer affiliate of the Advisor, acts as distributor for the Fund’s shares. The services of Manning & Napier Investor Services, Inc. are provided at no additional cost to the Series.
For fund accounting and transfer agent services, through October 31, 2008, the Fund paid the Advisor an annual fee of 0.11% of the Fund’s average daily net assets up to $900 million, 0.07%
Notes to Financial Statements
| 3. | TRANSACTIONS WITH AFFILIATES (continued) |
of the Fund’s average daily net assets between $900 million and $1.5 billion, and 0.04% of the Fund’s average daily net assets over $1.5 billion. Effective November 1, 2008, the fee rates are as follows: 0.055% of the Fund’s average daily net assets up to $4.5 billion, 0.03% of the Fund’s average daily net assets between $4.5 billion and $7.5 billion, and 0.02% of the Fund’s average daily net assets over $7.5 billion. Additionally, certain transaction and account-based fees and out-of-pocket expenses, including charges for reporting relating to the Fund’s compliance program, are charged. Expenses not directly attributable to a series are allocated based on each series’ relative net assets or number of accounts, depending on the expense. The Advisor has an agreement with Citi Fund Services Ohio, Inc. (“Citi”) under which Citi serves as sub-accountant and sub-transfer agent.
| 4. | PURCHASES AND SALES OF SECURITIES |
For the year ended December 31, 2008, purchases and sales of securities, other than United States Government securities and short-term securities, were $3,460,666 and $7,792,425, respectively. There were no purchases or sales of United States Government securities.
| 5. | CAPITAL STOCK TRANSACTIONS |
Transactions in shares of Ohio Tax Exempt Series were:
| | | | | | | | | | | | | | |
| | | For the Year
Ended 12/31/08 | | | For the Year
Ended 12/31/07 | |
| | | Shares | | | Amount | | | Shares | | | Amount | |
| | | | | | | | | | | | | | |
Sold | | 656,301 | | | $ | 6,716,037 | | | 696,089 | | | $ | 7,222,235 | |
Reinvested | | 95,854 | | | | 945,265 | | | 79,805 | | | | 825,938 | |
Repurchased | | (1,163,289 | ) | | | (11,623,899 | ) | | (212,265 | ) | | | (2,203,053 | ) |
| | | | | | | | | | | | | | |
Total | | (411,134 | ) | | $ | (3,962,597 | ) | | 563,629 | | | $ | 5,845,120 | |
| | | | | | | | | | | | | | |
Substantially all of the Series’ shares represent investments by fiduciary accounts over which the Advisor has sole investment discretion.
The Series may trade in financial instruments with off-balance sheet risk in the normal course of its investing activities to assist in managing exposure to various market risks. These financial instruments include written options and futures contracts and may involve, to a varying degree, elements of risk in excess of the amounts recognized for financial statement purposes. No such investments were held by the Series on December 31, 2008.
| 7. | CONCENTRATION OF CREDIT |
The Series primarily invests in debt obligations issued by the State of Ohio and its political subdivisions, agencies and public authorities to obtain funds for various public purposes. The Series is more susceptible to factors adversely affecting issues of Ohio municipal securities than is a municipal bond fund that is not concentrated in these issues to the same extent.
Notes to Financial Statements
| 8. | FEDERAL INCOME TAX INFORMATION |
The amount and characterization of certain income and capital gains to be distributed are determined in accordance with federal income tax regulations, which may differ from accounting principles generally accepted in the United States of America. These differences are primarily due to differing book and tax treatments in the timing of the recognition of net investment income or gains and losses, including market discount. The Series may periodically make reclassifications among its capital accounts to reflect income and gains available for distribution (or available capital loss carryovers) under income tax regulations, without impacting the Series’ net asset value. Any such reclassifications are not reflected in the financial highlights.
The tax character of distributions paid were as follows:
| | | | | | |
| | | For the Year
Ended 12/31/08 | | For the Year
Ended 12/31/07 |
Ordinary income | | $ | 6,865 | | $ | 83 |
Tax exempt income | | | 842,594 | | | 832,786 |
Long-term capital gains | | | 119,985 | | | — |
At December 31, 2008, the tax basis components of distributable earnings and the net unrealized depreciation based on identified cost for federal income tax purposes were as follows:
| | | | |
Cost for federal income tax purposes | | $ | 22,112,759 | |
Unrealized appreciation | | $ | 283,742 | |
Unrealized depreciation | | | (1,620,380 | ) |
| | | | |
Net unrealized depreciation | | $ | (1,336,638 | ) |
Undistributed tax exempt income | | | 77,536 | |
Undistributed long-term capital gains | | | 91,182 | |
| 9. | RECENT ACCOUNTING PRONOUNCEMENTS |
In September 2008, FASB Staff Position No. FAS 133-1 and FIN 45-4, “Disclosures about Credit Derivatives and Certain Guarantees: An Amendment of FASB Statement No. 133 and FASB Interpretation No. 45” (the “Position”) was issued and is effective for fiscal years and interim periods beginning after November 15, 2008. The Position amends FASB Statement No. 133 (“FAS 133”), Accounting for Derivative Instruments and Hedging Activities, and also amends FASB Interpretation No. 45 (“FIN 45”), Guarantor’s Accounting and Disclosure Requirements for Guarantees, Including Indirect Guarantees of Indebtedness of Others. The amendments to FAS 133 include required disclosure for (i) the nature and terms of the credit derivative, reasons for entering into the credit derivative, the events or circumstances that would require the seller to perform under the credit derivative, and the current status of the payment performance risk of the credit derivative, (ii) the maximum potential amount of future payments (undiscounted) the seller could be required to make under the credit derivative, (iii) the fair value of the credit derivative, and (iv) the nature of any recourse provisions and assets held either as collateral or by third parties. The amendments to FIN 45 require additional disclosures about the current status of the payment/performance risk of a guarantee. At this time, Management is evaluating the implications of FAS 133-1 and FIN 45-4, but they are not expected to materially impact the Series’ financial statements.
Notes to Financial Statements
| 9. | RECENT ACCOUNTING PRONOUNCEMENTS (continued) |
In March 2008, FASB Statement of Financial Accounting Standards No. 161, Disclosures about Derivative Instruments and Hedging Activities (“FAS 161”) was issued and is effective for fiscal years and interim periods beginning after November 15, 2008. FAS 161 requires enhanced disclosures about the Series’ derivative and hedging activities, including how such activities are accounted for and their effect on the Series’ financial position and performance. Management is currently evaluating the impact of the adoption of FAS 161, but it is not expected to materially impact the Series’ financial statements.
Report of Independent Registered Public Accounting Firm
To the Board of Directors of Manning & Napier Fund, Inc. and Shareholders of Ohio Tax Exempt Series:
In our opinion, the accompanying statement of assets and liabilities, including the investment portfolio (except for credit ratings), and the related statements of operations and of changes in net assets and the financial highlights present fairly, in all material respects, the financial position of the Ohio Tax Exempt Series (a series of Manning & Napier Fund, Inc., hereafter referred to as the “Series”) at December 31, 2008, and the results of its operations for the year then ended, the changes in its net assets for each of the two years in the period then ended and the financial highlights for each of the five years in the period then ended, in conformity with accounting principles generally accepted in the United States of America. These financial statements and financial highlights (hereafter referred to as “financial statements”) are the responsibility of the Series’ management; our responsibility is to express an opinion on these financial statements based on our audits. We conducted our audits of these financial statements in accordance with the standards of the Public Company Accounting Oversight Board (United States). Those standards require that we plan and perform the audit to obtain reasonable assurance about whether the financial statements are free of material misstatement. An audit includes examining, on a test basis, evidence supporting the amounts and disclosures in the financial statements, assessing the accounting principles used and significant estimates made by management, and evaluating the overall financial statement presentation. We believe that our audits, which included confirmation of securities at December 31, 2008 by correspondence with the custodian, provide a reasonable basis for our opinion.

Columbus, Ohio
February 13, 2009
Supplemental Tax Information (unaudited)
Pursuant to Section 852 of the Internal Revenue Code, as amended, the Series hereby designates $119,985 as capital gains for its taxable year ended December 31, 2008. In addition, the Series hereby designates $842,594 as tax exempt dividends for the year ended December 31, 2008.
Renewal of Investment Advisory Agreement (unaudited)
At the Manning & Napier Fund, Inc. (the “Fund”) Board of Directors’ (the “Board”) meeting, held on November 5, 2008, the Investment Advisory Agreement (the “Agreement”) between the Fund and Manning & Napier Advisors, Inc. (the “Advisor”) was reviewed by the Board for renewal. In connection with the decision whether to renew the Agreement, a variety of material was prepared for and reviewed by the Board.
Representatives of the Advisor attended the meeting and presented additional oral and written information to the Board to assist the Board in its considerations. The discussion immediately below outlines the materials and information presented to the Board in connection with the Board’s 2008 Annual Review of the Agreement and the conclusions made by the Directors when determining to continue the Agreement.
| | • | | The Board considered the services provided by the Advisor under the Agreement including, among others: deciding what securities to purchase and sell for each Series; arranging for the purchase and sale of such securities by placing orders with broker-dealers; administering the affairs of the Fund (including the books and records of the Fund not maintained by third party service providers such as the custodian or sub-transfer agent); arranging for the insurance coverage for the Fund; and supervising the preparation of tax returns, SEC filings (including registration statements) and reports to shareholders for the Fund. The Board also considered the nature and quality of such services provided under the Agreement in light of the Advisor’s services provided to the Fund for 22 years. The Board discussed the quality of these services with representatives from the Advisor and concluded that the Advisor was performing its services to the Fund required under the Agreement in a reasonable manner. |
| | • | | The Board considered the investment performance of the various Series of the Fund. The investment performance for each Series was reviewed on a cumulative basis since inception and on a one year basis. In addition, annualized performance for the following time periods was considered: inception, three year, five year, ten year, and current market cycle. A market cycle includes periods of both rising and falling markets. Returns for established benchmark indices for each Series were provided for each time period. The Board noted that the various Series were competitive against their respective benchmarks and/or peer groups over various time periods, but in particular over the full market cycle period relevant for the Series. In addition, the Board considered at the meeting (and considers on a quarterly basis) a peer group performance analysis consisting of Morningstar universes of mutual funds with similar investment objectives. The Board discussed the performance with representatives from the Advisor and concluded that the investment performance of each of the Fund’s Series was reasonable based on the Fund’s actual performance and comparative performance, especially performance over the current market cycle. |
| | • | | The Board considered the costs of the Advisor’s services and the profits of the Advisor as they relate to the Advisor’s services to the Fund under the Agreement. In reviewing the Advisor’s costs and profits, the Board discussed the Advisor’s revenues generated from the Fund (on both an actual and adjusted basis) and its expenses associated with providing the services under the Agreement. In addition, the Board reviewed the Advisor’s expenses associated with Fund activities outside of the Agreement (such as expense reimbursements pursuant to expense caps and payments made by the Advisor to third party platforms on which shares of the Fund are available for purchase). It was |
Renewal of Investment Advisory Agreement (unaudited)
| | noted by representatives of the Advisor that 15 of the 25 active Series of the Fund are currently experiencing expenses above the capped expense ratios. After discussing the above costs and profits, the Board concluded that the Advisor’s profitability relating to its services provided under the Agreement was reasonable. |
| | • | | The Board considered the fees and expenses of the various Series of the Fund. The Advisor presented the advisory fees and total expenses for each Series, including the advisory fee adjusted for any expense waivers or reimbursements (either contractual or voluntary) paid by the Advisor. The advisory fees and expense ratios of each Series were compared to an average (on both a mean and median basis) of similar funds as disclosed on the Morningstar database. Representatives of the Advisor discussed with the Board the levels of its advisory fee for each Series of the Fund and as compared to the median and mean advisory fees for similar funds as listed on Morningstar. Expense ratios for every Series, except the High Yield Bond Series, Global Fixed Income Series and the Target Series Class R and Class C, are currently below the median and mean for similar funds as listed on Morningstar. Based on their review of the information provided, the Board concluded that the fees and expenses of each Series of the Fund were reasonable on a comparative basis. |
| | • | | The Board also considered the other benefits the Advisor derives from its relationship with the Fund. Such other benefits include certain research products provided by soft dollars. Given the level of soft dollar transactions involving the Fund, the Board concluded that these additional benefits to the Advisor were reasonable. |
| | • | | In addition to the factors described above, the Board considered the Advisor’s personnel, investment strategies, policies and procedures relating to compliance with personal securities transactions, and reputation, expertise and resources in domestic and foreign financial markets. The Board concluded that these factors support the conclusion that the Advisor performs its services in a reasonable manner. |
| | • | | The Board did not consider economies of scale at this time because of the multiple uses of the Fund (for the Advisor’s discretionary investment account clients in addition to direct investors), the current profitability of the Advisor’s services to the Fund under the Agreement, and the overall size of the Fund complex. |
Based on the Board’s deliberations and their evaluation of the information described above, the Board, including a majority of Directors that are not “interested persons” as defined in the Investment Company Act of 1940, concluded that the compensation under the Agreement was fair and reasonable in light of the services and expenses and such other matters as the Directors considered to be relevant in the exercise of their reasonable judgment. Accordingly, the Board approved the renewal of the Agreement. In the course of their deliberations, the Directors did not identify any particular information that was all important or controlling.
Directors’ and Officers’ Information (unaudited)
The Statement of Additional Information provides additional information about the Fund’s directors and officers and can be obtained without charge by calling 1-800-466-3863, at www.manningnapieradvisors.com, or on the EDGAR Database on the SEC Internet web site (http://www.sec.gov). The following chart shows certain information about the Fund’s officers and directors, including their principal occupations during the last five years. Unless specific dates are provided, the individuals have held the listed positions for longer than five years.
INTERESTED DIRECTOR/OFFICER
| | |
| Name: | | B. Reuben Auspitz* |
| Address: | | 290 Woodcliff Drive Fairport, NY 14450 |
| Age: | | 61 |
| Current Position(s) Held with Fund: | | Principal Executive Officer, President, Chairman & Director |
| Term of Office1 & Length of Time Served: | | Indefinite - Director since 1984; Vice President 1984-2003; President since 2004; Principal Executive Officer since 2002 |
| Principal Occupation(s) During Past 5 Years: | | Executive Vice President; Co-Executive Director; Executive Group Member**; Chief Compliance Officer since 2004 - Manning & Napier Advisors, Inc. President; Director - Manning & Napier Investor Services, Inc. Holds or has held one or more of the following titles for various subsidiaries and affiliates: President, Vice President, Director, Chairman, Treasurer, Chief Compliance Officer or Member. |
| Number of Portfolios Overseen within Fund Complex: | | 28 |
| Other Directorships Held Outside Fund Complex: | | N/A |
| |
| INDEPENDENT DIRECTORS | | |
| |
| Name: | | Stephen B. Ashley |
| Address: | | 290 Woodcliff Drive
Fairport, NY 14450 |
| Age: | | 68 |
| Current Position(s) Held with Fund: | | Director, Audit Committee Member, Governance & Nominating Committee Member |
| Term of Office & Length of Time Served: | | Indefinite - Since 1996 |
| Principal Occupation(s) During Past 5 Years: | | Chairman, Director, President & Chief Executive Officer, The Ashley Group (property management and investment). Chairman (non-executive) 2004-2008; Director 1995-2008 - Fannie Mae (mortgage) |
| Number of Portfolios Overseen within Fund Complex: | | 28 |
| Other Directorships Held Outside Fund Complex: | | The Ashley Group |
| Name: | | Peter L. Faber |
| Address: | | 290 Woodcliff Drive Fairport, NY 14450 |
| Age: | | 70 |
| Current Position(s) Held with Fund: | | Director, Governance & Nominating Committee Member |
| Term of Office & Length of Time Served: | | Indefinite - Since 1987 |
| Principal Occupation(s) During Past 5 Years: | | Senior Counsel, McDermott, Will & Emery LLP (law firm) |
| Number of Portfolios Overseen within Fund Complex: | | 28 |
| Other Directorships Held Outside Fund Complex: | | Partnership for New York City, Inc. New York Collegium Boston Early Music Festival |
| Name: | | Harris H. Rusitzky |
| Address: | | 290 Woodcliff Drive Fairport, NY 14450 |
| Age: | | 73 |
| Current Position(s) Held with Fund: | | Director, Audit Committee Member, Governance & Nominating Committee Member |
| Term of Office & Length of Time Served: | | Indefinite - Since 1985 |
| Principal Occupation(s) During Past 5 Years: | | President, The Greening Group (business consultants); Partner, The Restaurant Group (restaurants) |
| Number of Portfolios Overseen within Fund Complex: | | 28 |
| Other Directorships Held Outside Fund Complex: | | N/A |
Directors’ and Officers’ Information (unaudited)
| | |
| INDEPENDENT DIRECTORS (continued) | | |
| |
| Name: | | Paul A. Brooke |
| Address: | | 290 Woodcliff Drive Fairport, NY 14450 |
| Age: | | 63 |
| Current Position(s) Held with Fund: | | Director, Audit Committee Member, Governance & Nominating Committee Member |
| Term of Office & Length of Time Served: | | Indefinite - Since 2007 |
| Principal Occupation(s) During Past 5 Years: | | Chairman & CEO, Alsius Corp. (investments); Managing Member, PMSV Holdings LLC (investments) |
| Number of Portfolios Overseen within Fund Complex: | | 28 |
| Other Directorships Held Outside Fund Complex: | | Incyte Corp. ViroPharma, Inc. HLTH Corp. Cheyne Captial International MPM Bio-equities GMP Companies HoustonPharma |
OFFICERS
| | |
| |
| Name: | | Jeffrey S. Coons, Ph.D., CFA |
| Address: | | 290 Woodcliff Drive Fairport, NY 14450 |
| Age: | | 45 |
| Current Position(s) Held with Fund: | | Vice President |
| Term of Office1 & Length of Time Served: | | Since 2004 |
| Principal Occupation(s) During Past 5 Years: | | Co-Director of Research since 2002 & Executive Group Member**, Manning & Napier Advisors, Inc. Holds one or more of the following titles for various subsidiaries and affiliates: President, Director, Treasurer or Senior Trust Officer. |
| Number of Portfolios Overseen within Fund Complex: | | 28 |
| Other Directorships Held Outside Fund Complex: | | N/A |
| Name: | | Christine Glavin |
| Address: | | 290 Woodcliff Drive Fairport, NY 14450 |
| Age: | | 42 |
| Current Position(s) Held with Fund: | | Principal Financial Officer, Chief Financial Officer |
| Term of Office1 & Length of Time Served: | | Principal Financial Officer since 2002; Chief Financial Officer since 2001 |
| Principal Occupation(s) During Past 5 Years: | | Fund Reporting Manager, Manning & Napier Advisors, Inc. |
| Number of Portfolios Overseen within Fund Complex: | | 28 |
| Other Directorships Held Outside Fund Complex: | | N/A |
| Name: | | Jodi L. Hedberg |
| Address: | | 290 Woodcliff Drive Fairport, NY 14450 |
| Age: | | 41 |
| Current Position(s) Held with Fund: | | Corporate Secretary, Chief Compliance Officer, Anti-Money Laundering Compliance Officer |
| Term of Office1 & Length of Time Served: | | Corporate Secretary since 1997; Chief Compliance Officer since 2004 |
| Principal Occupation(s) During Past 5 Years: | | Director of Compliance, Manning & Napier Advisors, Inc. and affiliates; Corporate Secretary, Manning & Napier Investor Services, Inc. since 2006 |
| Number of Portfolios Overseen within Fund Complex: | | 28 |
| Other Directorships Held Outside Fund Complex: | | N/A |
*Interested Director, within the meaning of the Investment Company Act of 1940 by reason of his position with the Fund’s investment advisor and distributor. Mr. Auspitz serves as the Executive Vice President and Director, Manning & Napier Advisors, Inc. and President and Director, Manning & Napier Investor Services, Inc., the Fund’s distributor.
**The Executive Group performs the duties of the Office of the Chief Executive of Manning & Napier Advisors, Inc.
1The term of office for President, Vice President, Chief Financial Officer, and Corporate Secretary is one year and until their respective successors are chosen and qualified. All other officers’ terms are indefinite.
Literature Requests (unaudited)
Proxy Voting Policies and Procedures
A description of the policies and procedures that the Fund uses to determine how to vote proxies relating to portfolio securities is available, without charge, upon request:
| | |
By phone | | 1-800-466-3863 |
On the Securities and Exchange
Commission’s (SEC) web site | | http://www.sec.gov |
Proxy Voting Record
Information regarding how the Fund voted proxies relating to portfolio securities during the most recent 12-month period ended June 30th is available, without charge, upon request:
| | |
By phone | | 1-800-466-3863 |
On the SEC’s web site | | http://www.sec.gov |
Quarterly Portfolio Holdings
The Series’ complete schedule of portfolio holdings for the 1st and 3rd quarters of each fiscal year are provided on Form N-Q, and are available, without charge, upon request:
| | |
By phone | | 1-800-466-3863 |
On the SEC’s web site | | http://www.sec.gov |
The Series’ Form N-Q may be reviewed and copied at the SEC’s Public Reference Room in Washington, D.C. Information on the operation of the Public Reference Room may be obtained by calling 1-800-SEC-0330.
Prospectus and Statement of Additional Information (SAI)
The prospectus and SAI provide additional information about each Series, including charges, expenses and risks. These documents are available, without charge, upon request:
| | |
By phone | | 1-800-466-3863 |
On the SEC’s web site | | http://www.sec.gov |
On the Advisor’s web site | | http://www.manningnapieradvisors.com |
Additional information available at www.manningnapieradvisors.com
1. Fund Holdings - Month-End
2. Fund Holdings - Quarter-End
3. Shareholder Report - Annual
4. Shareholder Report - Semi-Annual
Manning & Napier Fund, Inc.
| | | | |
| NEW YORK TAX EXEMPT SERIES | | | | | Annual Report - December 31, 2008 |

Management Discussion and Analysis (unaudited)
Dear Shareholders:
Credit risk is defined rather innocuously by Bloomberg as “the risk that an obligation will not be completed, with the result being a loss”. That hardly does it justice. In 2008, investors became intimately acquainted with credit risk, the problems it can create and, more importantly, the losses it can inflict. The greater the investor’s exposure to credit risk in 2008, the worse his or her relative performance happened to be. In the fixed income arena, credit risk is most prevalent in the corporate bond market; last year, investors in the high yield area lost more than 30%; investors in the investment-grade market lost more then 5%. Credit risk is also quite prevalent in the growing market for commercial mortgage-backed securities (CMBS); last year that market lost 17%. Credit risk is a key determinant of municipal bond performance; that market dropped by 4% in 2008 as measured by the Merrill Muni Master Index, which includes municipal bonds of all maturities.
A definition of credit risk that is more specific to the bond market is the risk of loss due to a debtor’s non-payment of a loan or some other line of credit, either the principal or interest/coupon, or both. The credit problems that engulfed the financial markets first started to show in the real estate area, specifically in subprime mortgages. They then spread to those that trafficked in such securities, hedge funds and investment banks, subsequently engulfed Fannie Mae and Freddie Mac, and sucked in commercial banks and assorted insurance companies, culminating in a full fledged credit crisis that defined the fourth quarter of 2008.
The markets were already struggling when the year began given the credit missteps that had surfaced in the prior year. Those problems carried over into the first quarter of 2008; however, it became apparent that they had begun to spill over into the overall economy. The situation was exacerbated by a concurrent spike in commodity prices. The problems led to the mid-March fire sale of a major Wall Street firm, Bear Stearns, to JP Morgan Chase that was brokered by the Federal Reserve.
As the credit crisis became more pronounced, investors reigned in their risk tolerances, which resulted in wider credit spreads (the difference in yields as compared to U.S. Treasuries) in both the corporate bond and the municipal bond markets. It also drove U.S. T-bill yields to 50 year lows, caused the auction rate securities market to collapse, and contributed to the implosion of numerous hedge funds. As the prices of oil, gold, and other commodities increased, inflation risks were re-awakened, lowering risk tolerances even more.
Early in September, Fannie Mae and Freddie Mac, the two largest government sponsored entities, were forced into conservatorship, whereby the U.S. Government took control over both entities, along with their $5 trillion of financial obligations. The markets spent a week digesting that, and then came the week of September 14th, which will go down as one of the most cataclysmic weeks in the history of the financial markets.
On Sunday of that week, Lehman Brothers announced that it would file for bankruptcy. That news was quickly followed by more bad news, including the quick sale of Merrill Lynch to Bank of America, bankruptcy fears at insurer AIG, and a money market fund “breaking the buck”. The environment was so bad that the yield on 3-month U.S. Treasury Bills, universally considered to be the risk-free investment, was driven down to 0.02% as investors scrambled to find a safe harbor.
In hindsight, the Lehman bankruptcy seemed to be a watershed event that pushed the U.S. economy over the precipice. And while the federal government spigot is likely to be turned on, state and local spending is poised to slow dramatically as evidenced by the state of California paying its vendors with IOU’s for the first time since the 1930’s.
The moves in the financial markets during the quarter were just as dismal. In the equity markets, both the Dow Industrial Index and Standard & Poor’s (S&P) 500 Total Return Index were down more than 20% for the quarter; the NASDAQ Composite was down 25%. It wasn’t just the equity markets that struggled, the corporate bond market and
Management Discussion and Analysis (unaudited)
the municipal bond market both sold off quite dramatically. There was, however, a glimmer of hope, when both exhibited signs of recovery as the quarter and the year came to a close.
One area of the municipal market that did not struggle quite so much last year was the short-to-intermediate maturity sector. Not only did short-term municipals earn their coupons, they also generated modest capital gains. That was the exact opposite of what happened in the long-term municipal market; longer-term municipal bonds were down just under -15% last year.
As for the performance of the New York Tax Exempt Series in 2008, its total return was -2.37%. That lagged the Merrill Lynch 1-12 Year Municipal Bond Index, which only includes municipal bonds with maturities of 12 years or less; it returned 4.61% in 2008. The Series’ underperformance versus the benchmark was strictly a function of the aforementioned weak performance of longer-term municipals. With a significant percentage of the Series’ assets invested in longer-term municipal bonds, the Series simply could not compete with the benchmark in 2008. However, longer-term bonds have historically outperformed shorter-term ones.
As always, we appreciate your business.
Sincerely,
Manning & Napier Advisors, Inc.
Performance Update as of December 31, 2008 (unaudited)
| | | | | | | | | | |
| | | Average Annual Total Returns
As of December 31, 2008 | | |
| | | One
Year | | Five
Year | | Ten
Year | | Since
Inception1 | | |
Manning & Napier Fund, Inc. - New York Tax Exempt Series2 | | -2.37% | | 1.92% | | 3.47% | | 4.04% | | |
Merrill Lynch 1-12 Year Municipal Bond Index3 | | 4.61% | | 3.73% | | 4.83% | | 5.14% | | |
The following graph compares the value of a $10,000 investment in the Manning & Napier Fund, Inc. - New York Tax Exempt Series for the ten years ended December 31, 2008 to the Merrill Lynch 1-12 Year Municipal Bond Index.
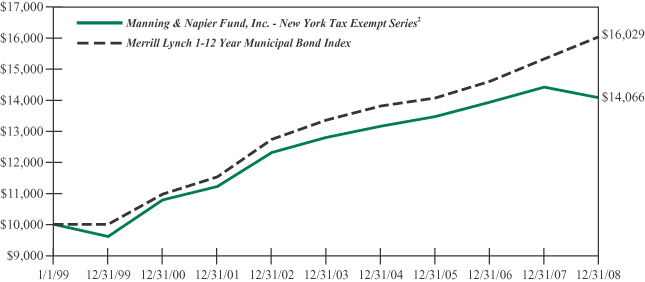
1Performance numbers for the Series and Index are calculated from January 17, 1994, the Series’ inception date.
2The Series’ performance does not reflect the deduction of taxes that a shareholder would pay on fund distributions or the redemption of shares. The Series’ performance is historical and may not be indicative of future results. The performance returns shown are inclusive of the net expense ratio of the Series. For the year ended December 31, 2008, this net expense ratio was 0.64%. The gross expense ratio, which does not account for any voluntary or contractual waivers currently in effect, was 0.64% for the year ended December 31, 2008.
3The Merrill Lynch 1-12 Year Municipal Bond Index is an unmanaged, market weighted index comprised of investment-grade, fixed rate, coupon bearing municipal bonds with maturities greater than one year but less than twelve years. The Index returns assume reinvestment of coupons and, unlike Series returns, do not reflect any fees or expenses.
Shareholder Expense Example (unaudited)
As a shareholder of the Series, you may incur two types of costs: (1) transaction costs, including potential wire charges on redemptions and (2) ongoing costs, including management fees and other Series expenses. This example is intended to help you understand your ongoing costs (in dollars) of investing in the Series and to compare these costs with the ongoing costs of investing in other mutual funds.
The example is based on an investment of $1,000 invested at the beginning of the period and held for the entire period (July 1, 2008 to December 31, 2008).
Actual Expenses
The first line of the table below provides information about actual account values and actual expenses. You may use the information in this line, together with the amount you invested, to estimate the expenses that you paid over the period. Simply divide your account value by $1,000 (for example, an $8,600 account value divided by $1,000 = 8.6), then multiply the result by the number in the first line under the heading entitled “Expenses Paid During Period” to estimate the expenses you paid on your account during this period.
Hypothetical Example for Comparison Purposes
The second line of the table below provides information about hypothetical account values and hypothetical expenses based on the Series’ actual expense ratio and an assumed rate of return of 5% per year before expenses, which is not the Series’ actual return. The hypothetical account values and expenses may not be used to estimate the actual ending account balance or expenses you paid during the period. You may use this information to compare the ongoing costs of investing in the Series and other funds. To do so, compare this 5% hypothetical example with the 5% hypothetical examples that appear in the shareholder reports of the other funds.
Please note that the expenses shown in the table are meant to highlight your ongoing costs only and do not reflect any transaction costs, such as potential wire charges on redemptions. Therefore, the second line of the table is useful in comparing ongoing costs only, and will not help you determine the relative total costs of owning different funds. In addition, if these transaction costs were included, your costs would have been higher.
| | | | | | | | | |
| | | Beginning
Account Value
7/1/08 | | Ending
Account Value
12/31/08 | | Expenses Paid
During Period*
7/1/08-12/31/08 |
Actual | | $ | 1,000.00 | | $ | 980.00 | | $ | 3.24 |
Hypothetical
(5% return before expenses) | | $ | 1,000.00 | | $ | 1,021.87 | | $ | 3.30 |
*Expenses are equal to the Series’ annualized expense ratio (for the six-month period) of 0.65%, multiplied by the average account value over the period, multiplied by 184/366 (to reflect the one-half year period). Expenses are based on the most recent fiscal half year; therefore, the expense ratio stated above may differ from the expense ratio stated in the financial highlights, which is based on one-year data.
Portfolio Composition as of December 31, 2008 (unaudited)
Bond Types1
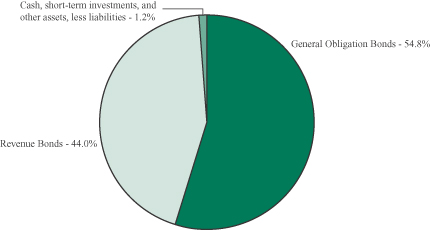
1As a percentage of net assets.
Credit Quality Ratings2,3
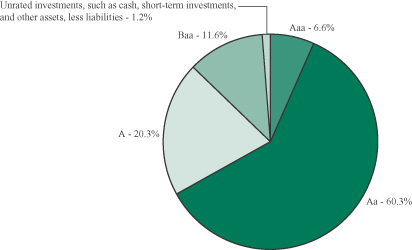
2As a percentage of net assets.
3Based on ratings from Moody’s, or the S&P equivalent. The Series may use different ratings provided by other rating agencies for purposes of determining compliance with the Series’ investment policies.
Investment Portfolio - December 31, 2008
| | | | | | | | | | | | | | |
| | | Coupon
Rate | | | Maturity
Date | | Credit
Rating1
(unaudited) | | | Principal
Amount | | Value
(Note 2) |
| | | | | | | | | | | | | | |
| | | | | |
NEW YORK MUNICIPAL BONDS - 98.8% | | | | | | | | | | | | | | |
Arlington Central School District, G.O. Bond, MBIA | | 4.625 | % | | 12/15/2024 | | A1 | | | $ | 845,000 | | $ | 808,006 |
Arlington Central School District, G.O. Bond, MBIA | | 4.625 | % | | 12/15/2025 | | A1 | | | | 365,000 | | | 344,560 |
Brookhaven, Public Impt., G.O. Bond, FGRMB | | 4.000 | % | | 5/1/2023 | | Aa3 | | | | 900,000 | | | 790,929 |
Brookhaven, Public Impt., G.O. Bond, FGRMB | | 4.000 | % | | 5/1/2024 | | Aa3 | | | | 815,000 | | | 702,750 |
Buffalo Fiscal Stability Authority, Sales Tax & State Aid, Series B, Revenue Bond, MBIA | | 5.000 | % | | 9/1/2016 | | Aa2 | | | | 525,000 | | | 573,825 |
Chautauqua County, Public Impt., Series B, G.O. Bond, MBIA | | 4.500 | % | | 12/15/2018 | | A2 | | | | 485,000 | | | 505,467 |
Clyde-Savannah Central School District, G.O. Bond, FGRMB | | 5.000 | % | | 6/1/2013 | | A2 | | | | 500,000 | | | 535,675 |
Dryden Central School District, G.O. Bond, FSA | | 5.500 | % | | 6/15/2011 | | Aa3 | | | | 200,000 | | | 203,256 |
Dutchess County, Public Impt., Prerefunded Balance, G.O. Bond, MBIA | | 4.000 | % | | 12/15/2016 | | Aa2 | | | | 315,000 | | | 348,954 |
Dutchess County, Public Impt., Unrefunded Balance, G.O. Bond, MBIA | | 4.000 | % | | 12/15/2016 | | Aa2 | | | | 360,000 | | | 374,666 |
Ellenville Central School District, G.O. Bond, FSA | | 5.375 | % | | 5/1/2009 | | Aa3 | | | | 210,000 | | | 212,589 |
Ellenville Central School District, G.O. Bond, AMBAC | | 5.700 | % | | 5/1/2011 | | A2 | | | | 700,000 | | | 706,895 |
Erie County, Public Impt., Series A, G.O. Bond, FGRMB | | 4.750 | % | | 10/1/2016 | | Baa2 | | | | 550,000 | | | 557,986 |
Erie County, Public Impt., Series A, G.O. Bond, FGRMB | | 5.000 | % | | 9/1/2014 | | Baa2 | | | | 500,000 | | | 520,155 |
Fairport Central School District, G.O. Bond, FSA | | 5.000 | % | | 6/1/2019 | | Aa3 | | | | 500,000 | | | 524,415 |
Franklin Square Union Free School District, G.O. Bond, FGRMB | | 5.000 | % | | 1/15/2021 | | A2 | | | | 520,000 | | | 523,593 |
Freeport, Series A, G.O. Bond, FGRMB | | 4.000 | % | | 1/15/2014 | | A3 | | | | 540,000 | | | 560,266 |
Greece Central School District, G.O. Bond, FSA | | 4.000 | % | | 6/15/2019 | | Aa3 | | | | 2,675,000 | | | 2,651,727 |
Hampton Bays Union Free School District, G.O. Bond, FSA | | 4.250 | % | | 9/15/2026 | | Aa3 | | | | 1,140,000 | | | 999,940 |
Haverstraw-Stony Point Central School District, G.O. Bond, FSA | | 4.500 | % | | 10/15/2032 | | Aa3 | | | | 2,000,000 | | | 1,689,380 |
Hempstead Town, Unrefunded Balance, Series B, G.O. Bond, FGIC | | 5.625 | % | | 2/1/2010 | | Aa1 | | | | 165,000 | | | 165,540 |
Huntington, G.O. Bond, MBIA | | 5.875 | % | | 9/1/2009 | | Aa1 | | | | 45,000 | | | 45,328 |
Islip, Public Impt., G.O. Bond, FGRMB | | 5.375 | % | | 6/15/2015 | | Aa2 | | | | 1,555,000 | | | 1,635,331 |
Jamesville-Dewitt Central School District, G.O. Bond, AMBAC | | 5.750 | % | | 6/15/2009 | | A1 | | | | 420,000 | | | 429,941 |
Johnson City Central School District, G.O. Bond, FGRMB | | 4.250 | % | | 6/15/2024 | | AA | 2 | | | 500,000 | | | 439,905 |
Johnson City Central School District, G.O. Bond, FGRMB | | 4.375 | % | | 6/15/2028 | | AA | 2 | | | 1,000,000 | | | 848,120 |
| | |
| 6 | | The accompanying notes are an integral part of the financial statements. |
Investment Portfolio - December 31, 2008
| | | | | | | | | | | | | | |
| | | Coupon
Rate | | | Maturity
Date | | Credit
Rating1
(unaudited) | | | Principal
Amount | | Value
(Note 2) |
| | | | | | | | | | | | | | |
| | | | | |
NEW YORK MUNICIPAL BONDS (continued) | | | | | | | | | | | | | | |
Johnson City Central School District, G.O. Bond, FGRMB | | 4.375 | % | | 6/15/2030 | | AA | 2 | | $ | 985,000 | | $ | 816,476 |
Long Island Power Authority, Electric Systems, Series F, Revenue Bond, MBIA | | 4.500 | % | | 5/1/2028 | | A3 | | | | 1,880,000 | | | 1,555,982 |
Long Island Power Authority, Electric Systems, Series A, Revenue Bond, FGRMB | | 5.000 | % | | 12/1/2019 | | A3 | | | | 1,000,000 | | | 1,008,960 |
Long Island Power Authority, Electric Systems, Series A, Revenue Bond, FGRMB | | 5.000 | % | | 12/1/2025 | | A3 | | | | 1,690,000 | | | 1,566,038 |
Metropolitan Transportation Authority, Transportation Facilities, Prerefunded Balance, Series B, Revenue Bond, AMBAC | | 5.000 | % | | 7/1/2018 | | Baa1 | | | | 1,500,000 | | | 1,644,180 |
Metropolitan Transportation Authority, Dedicated Tax Fund, Series A, Revenue Bond, MBIA | | 5.000 | % | | 11/15/2030 | | A1 | | | | 750,000 | | | 663,412 |
Metropolitan Transportation Authority, Series A, Revenue Bond, FGRMB | | 5.000 | % | | 11/15/2025 | | A2 | | | | 1,500,000 | | | 1,390,125 |
Metropolitan Transportation Authority, Series A, Revenue Bond, FSA | | 5.000 | % | | 11/15/2030 | | Aa3 | | | | 500,000 | | | 458,865 |
Metropolitan Transportation Authority, Series B, Revenue Bond, FSA | | 4.500 | % | | 11/15/2032 | | Aa3 | | | | 500,000 | | | 409,330 |
Monroe County, Public Impt., G.O. Bond, AMBAC | | 4.125 | % | | 6/1/2020 | | Baa1 | | | | 1,000,000 | | | 924,050 |
Monroe County Water Authority, Revenue Bond | | 5.000 | % | | 8/1/2019 | | Aa3 | | | | 1,700,000 | | | 1,719,890 |
Mount Morris Central School District, G.O. Bond, FGRMB | | 4.125 | % | | 6/15/2013 | | A2 | | | | 790,000 | | | 837,637 |
Nassau County, General Impt., Series C, G.O. Bond, FSA | | 5.125 | % | | 1/1/2014 | | Aa3 | | | | 500,000 | | | 525,095 |
Nassau County Interim Finance Authority, Sales Tax Secured, Series A, Revenue Bond, AMBAC | | 4.750 | % | | 11/15/2023 | | Aa2 | | | | 1,000,000 | | | 988,810 |
New Hyde Park Garden City Park, Union Free School District, G.O. Bond, FSA | | 4.125 | % | | 6/15/2023 | | Aa3 | | | | 200,000 | | | 179,730 |
New Hyde Park Garden City Park, Union Free School District, G.O. Bond, FSA | | 4.125 | % | | 6/15/2024 | | Aa3 | | | | 250,000 | | | 220,447 |
New York City, Series K, G.O. Bond, FSA | | 5.375 | % | | 8/1/2020 | | Aa3 | | | | 1,000,000 | | | 1,010,240 |
New York City, Series A, G.O. Bond, CIFG | | 5.000 | % | | 8/1/2024 | | Aa3 | | | | 1,000,000 | | | 951,190 |
New York City, G.O. Bond, XLCA | | 5.000 | % | | 9/1/2019 | | Aa3 | | | | 500,000 | | | 505,245 |
New York City, Unrefunded Balance, Series I, G.O. Bond, MBIA | | 5.000 | % | | 5/15/2028 | | AA | 2 | | | 1,725,000 | | | 1,586,258 |
New York City Municipal Water Finance Authority, Water & Sewer Systems, Series A, Revenue Bond, AMBAC | | 5.000 | % | | 6/15/2035 | | Aa2 | | | | 750,000 | | | 698,025 |
New York City Municipal Water Finance Authority, Series E, Revenue Bond, FGRMB | | 5.000 | % | | 6/15/2026 | | Aa2 | | | | 750,000 | | | 732,908 |
New York City Municipal Water Finance Authority, Water & Sewer Systems, Series D, Revenue Bond, AMBAC | | 4.500 | % | | 6/15/2036 | | Aa2 | | | | 500,000 | | | 414,815 |
| | |
| The accompanying notes are an integral part of the financial statements. | | 7 |
Investment Portfolio - December 31, 2008
| | | | | | | | | | | | | | |
| | | Coupon
Rate | | | Maturity
Date | | Credit
Rating1
(unaudited) | | | Principal
Amount | | Value
(Note 2) |
| | | | | | | | | | | | | | |
| | | | | |
NEW YORK MUNICIPAL BONDS (continued) | | | | | | | | | | | | | | |
New York City Municipal Water Finance Authority, Water & Sewer Systems, Series A, Revenue Bond | | 4.250 | % | | 6/15/2033 | | Aa2 | | | $ | 1,250,000 | | $ | 999,962 |
New York City Municipal Water Finance Authority, Water & Sewer Systems, Series A, Revenue Bond | | 4.500 | % | | 6/15/2037 | | Aa2 | | | | 1,000,000 | | | 825,900 |
New York City Municipal Water Finance Authority, Water & Sewer Systems, Series A, Revenue Bond | | 5.750 | % | | 6/15/2040 | | Aa2 | | | | 1,000,000 | | | 1,022,500 |
New York State, Series C, G.O. Bond, FSA | | 5.000 | % | | 4/15/2012 | | Aa3 | | | | 700,000 | | | 755,517 |
New York State, Series A, G.O. Bond | | 4.500 | % | | 3/15/2019 | | Aa3 | | | | 500,000 | | | 511,110 |
New York State, Series A, G.O. Bond | | 4.600 | % | | 3/15/2013 | | Aa3 | | | | 475,000 | | | 498,095 |
New York State Dormitory Authority, Columbia University, Series A, Revenue Bond | | 5.000 | % | | 7/1/2025 | | Aaa | | | | 500,000 | | | 502,705 |
New York State Environmental Facilities Corp., Pollution Control, Unrefunded Balance, Series B, Revenue Bond | | 5.200 | % | | 5/15/2014 | | Aaa | | | | 440,000 | | | 464,847 |
New York State Environmental Facilities Corp., Pollution Control, Series A, Revenue Bond | | 5.200 | % | | 6/15/2015 | | Aaa | | | | 25,000 | | | 25,065 |
New York State Environmental Facilities Corp., Clean Water & Drinking, Series B, Revenue Bond | | 5.000 | % | | 6/15/2027 | | Aaa | | | | 1,000,000 | | | 998,780 |
New York State Environmental Facilities Corp., Clean Water & Drinking, Revenue Bond | | 4.500 | % | | 6/15/2022 | | Aaa | | | | 300,000 | | | 294,999 |
New York State Environmental Facilities Corp., Clean Water & Drinking, Revenue Bond, MBIA | | 5.000 | % | | 6/15/2021 | | Aaa | | | | 600,000 | | | 613,398 |
New York State Environmental Facilities Corp., Personal Income Tax, Series A, Revenue Bond | | 5.000 | % | | 12/15/2019 | | AAA | 2 | | | 750,000 | | | 794,153 |
New York State Housing Finance Agency, State University Construction, Series A, Revenue Bond | | 8.000 | % | | 5/1/2011 | | A1 | | | | 150,000 | | | 162,128 |
New York State Environmental Facilities Corp., Clean Water & Drinking, Series A, Revenue Bond | | 4.500 | % | | 6/15/2036 | | Aaa | | | | 1,000,000 | | | 842,970 |
New York State Environmental Facilities Corp., Clean Water & Drinking, Series B, Revenue Bond | | 4.500 | % | | 6/15/2036 | | Aa1 | | | | 1,500,000 | | | 1,255,305 |
New York State Dormitory Authority, Personal Income Tax, Series F, Revenue Bond | | 5.000 | % | | 3/15/2023 | | Aa3 | | | | 1,475,000 | | | 1,487,729 |
New York State Thruway Authority, Series F, Revenue Bond, AMBAC | | 5.000 | % | | 1/1/2026 | | A1 | | | | 340,000 | | | 328,294 |
New York State Thruway Authority, Highway & Bridge, Series C, Revenue Bond, MBIA | | 5.250 | % | | 4/1/2011 | | Aa3 | | | | 1,000,000 | | | 1,062,140 |
| | |
| 8 | | The accompanying notes are an integral part of the financial statements. |
Investment Portfolio - December 31, 2008
| | | | | | | | | | | | | | |
| | | Coupon
Rate | | | Maturity
Date | | Credit
Rating1
(unaudited) | | | Principal
Amount | | Value
(Note 2) |
| | | | | | | | | | | | | | |
| | | | | |
NEW YORK MUNICIPAL BONDS (continued) | | | | | | | | | | | | | | |
New York State Thruway Authority, Highway & Bridge, Series C, Revenue Bond, AMBAC | | 5.000 | % | | 4/1/2020 | | Aa3 | | | $ | 750,000 | | $ | 761,468 |
New York State Thruway Authority, Highway & Bridge, Series B, Revenue Bond, AMBAC | | 5.000 | % | | 4/1/2021 | | Baa1 | | | | 1,500,000 | | | 1,524,360 |
New York State Thruway Authority, Highway & Bridge, Prerefunded Balance, Series A, Revenue Bond, FGIC | | 5.500 | % | | 4/1/2015 | | Aa3 | | | | 320,000 | | | 351,226 |
New York State Thruway Authority, Highway & Bridge, Prerefunded Balance, Series B, Revenue Bond, MBIA | | 5.250 | % | | 4/1/2016 | | Aa3 | | | | 300,000 | | | 329,337 |
New York State Thruway Authority, Personal Income Tax, Prerefunded Balance, Series A, Revenue Bond, FSA | | 5.000 | % | | 3/15/2014 | | Aa3 | | | | 500,000 | | | 560,760 |
New York State Thruway Authority, Personal Income Tax, Prerefunded Balance, Series A, Revenue Bond, MBIA | | 5.000 | % | | 3/15/2016 | | Aa3 | | | | 300,000 | | | 336,456 |
New York State Urban Development Corp., Correctional Capital Facilities, Series A, Revenue Bond, FSA | | 5.250 | % | | 1/1/2014 | | Aa3 | | | | 500,000 | | | 520,960 |
New York State Urban Development Corp., Personal Income Tax, Series C, Revenue Bond, MBIA | | 4.250 | % | | 3/15/2024 | | Baa1 | | | | 1,000,000 | | | 895,880 |
New York State Urban Development Corp., Service Contract, Series B, Revenue Bond | | 5.250 | % | | 1/1/2022 | | AA | 2 | | | 2,350,000 | | | 2,350,000 |
Niagara County, Series B, G.O. Bond, MBIA | | 5.200 | % | | 1/15/2011 | | Baa1 | | | | 400,000 | | | 406,752 |
Niagara Falls City School District, G.O. Bond, FSA | | 4.375 | % | | 9/15/2029 | | AAA | 2 | | | 885,000 | | | 755,940 |
Niagara-Wheatfield Central School District, G.O. Bond, FGRMB | | 4.125 | % | | 2/15/2019 | | A2 | | | | 610,000 | | | 612,867 |
Niagara-Wheatfield Central School District, G.O. Bond, FGRMB | | 4.125 | % | | 2/15/2020 | | A2 | | | | 850,000 | | | 831,190 |
Norwich City School District, G.O. Bond, FSA | | 5.000 | % | | 6/15/2010 | | Aa3 | | | | 250,000 | | | 262,380 |
Panama Central School District, G.O. Bond, FGRMB | | 5.000 | % | | 6/15/2019 | | A2 | | | | 595,000 | | | 606,507 |
Pavilion Central School District, G.O. Bond, FSA | | 5.625 | % | | 6/15/2018 | | Aa3 | | | | 880,000 | | | 909,102 |
Phelps-Clifton Springs Central School District, Series B, G.O. Bond, MBIA | | 5.000 | % | | 6/15/2021 | | A2 | | | | 850,000 | | | 848,810 |
Phelps-Clifton Springs Central School District, Series B, G.O. Bond, MBIA | | 5.000 | % | | 6/15/2022 | | A2 | | | | 450,000 | | | 441,527 |
Port Authority of New York & New Jersey, Revenue Bond | | 5.000 | % | | 7/15/2024 | | Aa3 | | | | 3,000,000 | | | 2,977,230 |
Port Authority of New York & New Jersey, Revenue Bond | | 4.750 | % | | 7/15/2030 | | Aa3 | | | | 495,000 | | | 448,817 |
Port Authority of New York & New Jersey, Revenue Bond | | 5.000 | % | | 10/1/2030 | | Aa3 | | | | 1,000,000 | | | 946,640 |
Pulaski Central School District, Series A, G.O. Bond, FGRMB | | 4.500 | % | | 6/15/2026 | | AA | 2 | | | 425,000 | | | 380,770 |
| | |
| The accompanying notes are an integral part of the financial statements. | | 9 |
Investment Portfolio - December 31, 2008
| | | | | | | | | | | | | | |
| | | Coupon
Rate | | | Maturity
Date | | Credit
Rating1
(unaudited) | | | Principal
Amount | | Value
(Note 2) |
| | | | | | | | | | | | | | |
| | | | | |
NEW YORK MUNICIPAL BONDS (continued) | | | | | | | | | | | | | | |
Ramapo, Public Impt., Series B, G.O. Bond, MBIA | | 4.375 | % | | 5/1/2031 | | Aa3 | | | $ | 435,000 | | $ | 369,106 |
Ramapo, Public Impt., Series B, G.O. Bond, MBIA | | 4.375 | % | | 5/1/2032 | | Aa3 | | | | 510,000 | | | 430,853 |
Ramapo, Public Impt., Series B, G.O. Bond, MBIA | | 4.500 | % | | 5/1/2033 | | Aa3 | | | | 410,000 | | | 355,831 |
Ravena Coeymans Selkirk Central School District, G.O. Bond, FSA | | 4.250 | % | | 6/15/2014 | | Aa3 | | | | 1,180,000 | | | 1,257,880 |
Rochester, Series A, G.O. Bond, AMBAC | | 5.000 | % | | 8/15/2020 | | A2 | | | | 250,000 | | | 266,148 |
Rochester, Series A, G.O. Bond, AMBAC | | 5.000 | % | | 8/15/2022 | | A2 | | | | 95,000 | | | 98,225 |
Rondout Valley Central School District, G.O. Bond, FSA | | 5.375 | % | | 3/1/2020 | | Aa3 | | | | 500,000 | | | 530,585 |
Sachem Central School District of Holbrook, G.O. Bond, FGRMB | | 4.250 | % | | 10/15/2028 | | AA | 2 | | | 330,000 | | | 279,230 |
Sachem Central School District of Holbrook, G.O. Bond, FGRMB | | 4.375 | % | | 10/15/2030 | | AA | 2 | | | 1,000,000 | | | 842,390 |
Sachem Central School District of Holbrook, Series B, G.O. Bond, FGRMB | | 4.250 | % | | 10/15/2026 | | AA | 2 | | | 1,200,000 | | | 1,041,792 |
St. Lawrence County, Public Impt., G.O. Bond, FGRMB | | 4.500 | % | | 5/15/2031 | | AA | 2 | | | 1,185,000 | | | 963,843 |
St. Lawrence County, Public Impt., G.O. Bond, FGRMB | | 4.500 | % | | 5/15/2032 | | AA | 2 | | | 1,000,000 | | | 805,220 |
Schenectady, G.O. Bond, MBIA | | 5.300 | % | | 2/1/2011 | | Baa1 | | | | 250,000 | | | 250,615 |
South Glens Falls Central School District, Unrefunded Balance, G.O. Bond, FGIC | | 5.375 | % | | 6/15/2018 | | A3 | | | | 95,000 | | | 97,089 |
South Huntington Union Free School District, G.O. Bond, FGRMB | | 5.000 | % | | 9/15/2016 | | Aa3 | | | | 325,000 | | | 333,310 |
South Huntington Union Free School District, G.O. Bond, FGRMB | | 5.100 | % | | 9/15/2017 | | Aa3 | | | | 100,000 | | | 102,581 |
Suffolk County, Public Impt., Series A, G.O. Bond, MBIA | | 4.250 | % | | 5/1/2024 | | Aa3 | | | | 1,000,000 | | | 904,040 |
Suffolk County Water Authority, Revenue Bond, MBIA | | 4.500 | % | | 6/1/2027 | | Baa1 | | | | 1,160,000 | | | 1,039,337 |
Suffolk County Water Authority, Revenue Bond, MBIA | | 5.100 | % | | 6/1/2009 | | Baa1 | | | | 55,000 | | | 56,043 |
Syracuse, Public Impt., Series C, G.O. Bond, AMBAC | | 5.400 | % | | 8/1/2017 | | A2 | | | | 700,000 | | | 753,907 |
Syracuse, Public Impt., Series C, G.O. Bond, AMBAC | | 5.500 | % | | 8/1/2018 | | A2 | | | | 850,000 | | | 916,793 |
Syracuse, Public Impt., Series A, G.O. Bond, MBIA | | 4.250 | % | | 6/15/2023 | | Baa1 | | | | 690,000 | | | 600,928 |
Syracuse, Public Impt., Series A, G.O. Bond, MBIA | | 4.375 | % | | 6/15/2025 | | Baa1 | | | | 990,000 | | | 843,084 |
Syracuse, Public Impt., Series A, G.O. Bond, FGRMB | | 4.250 | % | | 12/1/2028 | | A2 | | | | 600,000 | | | 489,138 |
Syracuse, Public Impt., Series A, G.O. Bond, FGRMB | | 4.250 | % | | 12/1/2029 | | A2 | | | | 600,000 | | | 482,520 |
| | |
| 10 | | The accompanying notes are an integral part of the financial statements. |
Investment Portfolio - December 31, 2008
| | | | | | | | | | | | | | |
| | | Coupon
Rate | | | Maturity
Date | | Credit
Rating1
(unaudited) | | | Principal
Amount/ Shares | | Value
(Note 2) |
| | | | | | | | | | | | | | |
| | | | | |
NEW YORK MUNICIPAL BONDS (continued) | | | | | | | | | | | | | | |
Tarrytown Union Free School District, G.O. Bond, AMBAC | | 4.375 | % | | 1/15/2032 | | A1 | | | $ | 1,090,000 | | $ | 909,681 |
Triborough Bridge & Tunnel Authority, General Purposes, Series B, Revenue Bond | | 5.000 | % | | 11/15/2020 | | Aa2 | | | | 750,000 | | | 762,353 |
Triborough Bridge & Tunnel Authority, General Purposes, Prerefunded Balance, Series A, Revenue Bond, MBIA | | 4.750 | % | | 1/1/2019 | | Baa1 | | | | 300,000 | | | 337,980 |
Triborough Bridge & Tunnel Authority, Subordinate Bonds, Revenue Bond, FGRMB | | 5.000 | % | | 11/15/2032 | | Aa3 | | | | 1,000,000 | | | 932,660 |
Triborough Bridge & Tunnel Authority, General Purposes, Prerefunded Balance, Series A, Revenue Bond, MBIA | | 5.000 | % | | 1/1/2032 | | Aa2 | | | | 1,695,000 | | | 1,857,923 |
Triborough Bridge & Tunnel Authority, General Purposes, Unrefunded Balance, Series A, Revenue Bond, MBIA | | 5.000 | % | | 1/1/2032 | | Aa2 | | | | 305,000 | | | 286,749 |
Ulster County, Public Impt., G.O. Bond, XLCA | | 4.500 | % | | 11/15/2026 | | AA | 2 | | | 560,000 | | | 517,160 |
Union Endicott Central School District, G.O. Bond, FGRMB | | 4.125 | % | | 6/15/2014 | | AA | 2 | | | 605,000 | | | 622,049 |
Union Endicott Central School District, G.O. Bond, FGRMB | | 4.125 | % | | 6/15/2015 | | AA | 2 | | | 865,000 | | | 883,831 |
Wayne County, Public Impt., G.O. Bond, MBIA | | 4.125 | % | | 6/1/2024 | | A1 | | | | 500,000 | | | 442,875 |
West Seneca Central School District, G.O. Bond, FSA | | 5.000 | % | | 5/1/2011 | | Aa3 | | | | 300,000 | | | 319,587 |
Westchester County, Series B, G.O. Bond | | 4.300 | % | | 12/15/2011 | | Aaa | | | | 15,000 | | | 16,193 |
Westchester County, Series B, G.O. Bond | | 3.700 | % | | 12/15/2015 | | Aaa | | | | 1,000,000 | | | 1,030,880 |
Westchester County, Unrefunded Balance, Series A, G.O. Bond | | 4.750 | % | | 12/15/2009 | | Aaa | | | | 5,000 | | | 5,079 |
Westhampton Beach Union Free School District, G.O. Bond, MBIA | | 4.000 | % | | 7/15/2018 | | Aa3 | | | | 726,000 | | | 731,525 |
Williamsville Central School District, G.O. Bond, MBIA | | 5.000 | % | | 6/15/2012 | | Aa3 | | | | 490,000 | | | 528,622 |
Yonkers, Series B, G.O. Bond, MBIA | | 5.000 | % | | 8/1/2023 | | Baa1 | | | | 1,125,000 | | | 901,103 |
Yonkers, Series B, G.O. Bond, MBIA | | 5.000 | % | | 8/1/2030 | | Baa1 | | | | 1,095,000 | | | 789,747 |
| | | | | | | | | | | | | | |
TOTAL NEW YORK MUNICIPAL BONDS
(Identified Cost $101,345,900) | | | | | | | | | | | | | | 95,997,968 |
| | | | | | | | | | | | | | |
| | | | | |
SHORT-TERM INVESTMENTS - 0.4% | | | | | | | | | | | | | | |
Dreyfus BASIC New York Municipal Money Market Fund (Identified Cost $436,282) | | | | | | | | | | | 436,282 | | | 436,282 |
| | | | | | | | | | | | | | |
TOTAL INVESTMENTS - 99.2%
(Identified Cost $101,782,182) | | | | | | | | | | | | | | 96,434,250 |
| | | | | |
OTHER ASSETS, LESS LIABILITIES - 0.8% | | | | | | | | | | | | | | 767,381 |
| | | | | | | | | | | | | | |
NET ASSETS - 100% | | | | | | | | | | | | | $ | 97,201,631 |
| | | | | | | | | | | | | | |
| | |
| The accompanying notes are an integral part of the financial statements. | | 11 |
Investment Portfolio - December 31, 2008
Key:
G.O. Bond - General Obligation Bond
Impt. - Improvement
Scheduled principal and interest payments are guaranteed by:
AMBAC (AMBAC Assurance Corp.)
CIFG (CIFG North America, Inc.)
FGIC (Financial Guaranty Insurance Co.)
FGRMB (FGIC reinsured by MBIA)
FSA (Financial Security Assurance)
MBIA (MBIA, Inc.)
XLCA (XL Capital Assurance)
The insurance does not guarantee the market value of the municipal bonds.
1Credit ratings from Moody’s (unaudited).
2Credit ratings from S&P (unaudited).
The Series’ portfolio holds, as a percentage of net assets, greater than 10% in bonds insured by the following companies: MBIA - 47.5%; FSA - 15.4%; AMBAC - 11.7%.
| | |
| 12 | | The accompanying notes are an integral part of the financial statements. |
Statement of Assets and Liabilities
December 31, 2008
| | | | |
ASSETS: | | | | |
| | | | |
| |
Investments, at value (identified cost $101,782,182) (Note 2) | | $ | 96,434,250 | |
Interest receivable | | | 1,010,871 | |
Dividends receivable | | | 244 | |
| | | | |
TOTAL ASSETS | | | 97,445,365 | |
| | | | |
| LIABILITIES: | | | | |
| |
Accrued management fees (Note 3) | | | 40,016 | |
Accrued fund accounting and transfer agent fees (Note 3) | | | 6,945 | |
Accrued Chief Compliance Officer service fees (Note 3) | | | 477 | |
Payable for fund shares repurchased | | | 161,927 | |
Audit fees payable | | | 29,344 | |
Other payables and accrued expenses | | | 5,025 | |
| | | | |
TOTAL LIABILITIES | | | 243,734 | |
| | | | |
TOTAL NET ASSETS | | $ | 97,201,631 | |
| | | | |
NET ASSETS CONSIST OF: | | | | |
| |
Capital stock | | $ | 99,306 | |
Additional paid-in-capital | | | 101,419,717 | |
Undistributed net investment income | | | 862,405 | |
Accumulated net realized gain on investments | | | 168,135 | |
Net unrealized depreciation on investments | | | (5,347,932 | ) |
| | | | |
TOTAL NET ASSETS | | $ | 97,201,631 | |
| | | | |
NET ASSET VALUE, OFFERING PRICE AND REDEMPTION PRICE PER SHARE ($97,201,631/9,930,645 shares) | | $ | 9.79 | |
| | | | |
| | |
| The accompanying notes are an integral part of the financial statements. | | 13 |
Statement of Operations
For the Year Ended December 31, 2008
| | | | |
INVESTMENT INCOME: | | | | |
| | | | |
| |
Interest | | $ | 4,587,533 | |
Dividends | | | 76,191 | |
| | | | |
Total Investment Income | | | 4,663,724 | |
| | | | |
| EXPENSES: | | | | |
| |
Management fees (Note 3) | | | 535,396 | |
Fund accounting and transfer agent fees (Note 3) | | | 85,836 | |
Directors’ fees (Note 3) | | | 12,600 | |
Chief Compliance Officer service fees (Note 3) | | | 4,301 | |
Custodian fees | | | 6,199 | |
Miscellaneous | | | 45,126 | |
| | | | |
Total Expenses | | | 689,458 | |
| | | | |
NET INVESTMENT INCOME | | | 3,974,266 | |
| | | | |
| REALIZED AND UNREALIZED GAIN (LOSS) ON INVESTMENTS: | | | | |
| |
Net realized gain on investments | | | 274,551 | |
Net change in unrealized appreciation (depreciation) on investments | | | (7,134,417 | ) |
| | | | |
| |
NET REALIZED AND UNREALIZED GAIN (LOSS) ON INVESTMENTS | | | (6,859,866 | ) |
| | | | |
NET DECREASE IN NET ASSETS RESULTING FROM OPERATIONS | | $ | (2,885,600 | ) |
| | | | |
| | |
| 14 | | The accompanying notes are an integral part of the financial statements. |
Statements of Changes in Net Assets
| | | | | | | | |
| | | For the
Year Ended
12/31/08 | | | For the
Year Ended
12/31/07 | |
| | | | | | | | |
| INCREASE (DECREASE) IN NET ASSETS: | | | | | | | | |
| | |
| OPERATIONS: | | | | | | | | |
| | |
Net investment income | | $ | 3,974,266 | | | $ | 3,779,189 | |
Net realized gain on investments | | | 274,551 | | | | 146,043 | |
Net change in unrealized appreciation (depreciation) on investments | | | (7,134,417 | ) | | | (353,504 | ) |
| | | | | | | | |
Net increase (decrease) from operations | | | (2,885,600 | ) | | | 3,571,728 | |
| | | | | | | | |
| DISTRIBUTIONS TO SHAREHOLDERS (Note 8): | | | | | | | | |
| | |
From net investment income | | | (3,812,340 | ) | | | (3,663,096 | ) |
From net realized gain on investments | | | (101,616 | ) | | | (170,028 | ) |
| | | | | | | | |
Total distributions to shareholders | | | (3,913,956 | ) | | | (3,833,124 | ) |
| | | | | | | | |
| CAPITAL STOCK ISSUED AND REPURCHASED: | | | | | | | | |
| | |
Net increase (decrease) from capital share transactions (Note 5) | | | (7,702,651 | ) | | | 19,054,978 | |
| | | | | | | | |
Net increase (decrease) in net assets | | | (14,502,207 | ) | | | 18,793,582 | |
| | |
| NET ASSETS: | | | | | | | | |
| | |
Beginning of year | | | 111,703,838 | | | | 92,910,256 | |
| | | | | | | | |
End of year (including undistributed net investment income of $862,405 and $695,679, respectively) | | $ | 97,201,631 | | | $ | 111,703,838 | |
| | | | | | | | |
| | |
| The accompanying notes are an integral part of the financial statements. | | 15 |
Financial Highlights
| | | | | | | | | | |
| | | For the Years Ended |
| | | 12/31/08 | | 12/31/07 | | 12/31/06 | | 12/31/05 | | 12/31/04 |
| | | | | | | | | | |
| Per share data (for a share outstanding throughout each year): | | | | | | | | | | |
Net asset value - Beginning of year | | $10.41 | | $10.44 | | $10.45 | | $10.58 | | $10.77 |
| | | | | | | | | | |
Income (loss) from investment operations: | | | | | | | | | | |
Net investment income | | 0.38 | | 0.37 | | 0.38 | | 0.37 | | 0.36 |
Net realized and unrealized loss on investments | | (0.63) | | (0.01) | | (0.02) | | (0.13) | | (0.07) |
| | | | | | | | | | |
Total from investment operations | | (0.25) | | 0.36 | | 0.36 | | 0.24 | | 0.29 |
| | | | | | | | | | |
| | | | | |
Less distributions to shareholders: | | | | | | | | | | |
From net investment income | | (0.36) | | (0.37) | | (0.36) | | (0.36) | | (0.45) |
From net realized gain on investments | | (0.01) | | (0.02) | | (0.01) | | (0.01) | | (0.03) |
| | | | | | | | | | |
Total distributions to shareholders | | (0.37) | | (0.39) | | (0.37) | | (0.37) | | (0.48) |
| | | | | | | | | | |
Net asset value - End of year | | $9.79 | | $10.41 | | $10.44 | | $10.45 | | $10.58 |
| | | | | | | | | | |
Net assets - End of year (000’s omitted) | | $97,202 | | $111,704 | | $92,910 | | $82,405 | | $75,820 |
| | | | | | | | | | |
Total return1 | | (2.37%) | | 3.44% | | 3.48% | | 2.33% | | 2.83% |
| Ratios (to average net assets)/Supplemental Data: | | | | | | | | | | |
Expenses | | 0.64% | | 0.65% | | 0.68% | | 0.72% | | 0.75% |
Net investment income | | 3.71% | | 3.66% | | 3.68% | | 3.55% | | 3.57% |
Portfolio turnover | | 11% | | 7% | | 8% | | 6% | | 7% |
1Represents aggregate total return for the year indicated, and assumes reinvestment of all distributions.
| | |
| 16 | | The accompanying notes are an integral part of the financial statements. |
Notes to Financial Statements
New York Tax Exempt Series (the “Series”) is a no-load diversified series of Manning & Napier Fund, Inc. (the “Fund”). The Fund is organized in Maryland and is registered under the Investment Company Act of 1940, as amended, as an open-end management investment company.
The Series’ investment objective is to provide as high a level of current income exempt from federal income tax and New York State personal income tax as the Advisor believes is consistent with the preservation of capital.
The Fund’s Advisor is Manning & Napier Advisors, Inc. (the “Advisor”). Shares of the Series are offered to investors, clients and employees of the Advisor and its affiliates. The total authorized capital stock of the Fund consists of 5.0 billion shares of common stock each having a par value of $0.01. As of December 31, 2008, 4.5 billion shares have been designated in total among 28 series, of which 100 million have been designated as New York Tax Exempt Series Class A common stock.
| 2. | SIGNIFICANT ACCOUNTING POLICIES |
Security Valuation
Municipal securities will normally be valued on the basis of market valuations provided by an independent pricing service (the “Service”). The Service utilizes the latest price quotations and a matrix system (which considers such factors as security prices of similar securities, yields, maturities and ratings). The Service has been approved by the Fund’s Board of Directors (the “Board”).
Securities for which representative valuations or prices are not available from the Fund’s pricing service may be valued at fair value. Due to the inherent uncertainty of valuations of such securities, the fair value may differ significantly from the values that would have been used had a ready market for such securities existed. Fair value is determined in good faith by the Advisor under procedures approved by and under the general supervision and responsibility of the Fund’s Board.
Short-term investments that mature in sixty days or less are valued at amortized cost, which approximates market value. Investments in open-end investment companies are valued at their net asset value per share on valuation date.
In September 2006, FASB Statement of Financial Accounting Standards No. 157, Fair Value Measurements (“FAS 157”) was issued, effective for fiscal years beginning after November 15, 2007. This standard clarifies the definition of fair value for financial reporting, establishes a framework for measuring fair value and requires additional disclosures about the use of fair value measurements. FAS 157 became effective for the Series as of January 1, 2008, the beginning of its current fiscal year. The three levels of the fair value hierarchy under FAS 157 are described below:
Level 1 - quoted prices in active markets for identical securities
Level 2 - other significant observable inputs (including quoted prices for similar securities, interest rates, prepayment speeds, credit risk, etc.)
Level 3 - significant unobservable inputs (including the Series’ own assumptions in determining the fair value of investments.)
Notes to Financial Statements
| 2. | SIGNIFICANT ACCOUNTING POLICIES (continued) |
Security Valuation (continued)
The inputs or methodology used for valuing securities are not necessarily an indication of the risk associated with investing in those securities. The following is a summary of the inputs used to value the Series’ assets as of December 31, 2008:
| | | | | | |
Valuation Inputs | | Investments In
Securities | | Other Financial
Instruments* |
| | | | | | |
Level 1 - Quoted Prices | | $ | 436,282 | | $ | — |
Level 2 - Other Significant Observable Inputs | | | 95,997,968 | | | — |
Level 3 - Significant Unobservable Inputs | | | — | | | — |
| | | | | | |
Total | | $ | 96,434,250 | | $ | — |
| | | | | | |
*Other financial instruments are derivative instruments not reflected in the Investment Portfolio, such as futures, forwards and swap contracts, which are valued at the unrealized appreciation/depreciation on the instrument. As of December 31, 2008, the Series did not hold any derivative instruments.
There were no Level 3 securities held by the Series as of December 31, 2007 or December 31, 2008.
Security Transactions, Investment Income and Expenses
Security transactions are accounted for on trade date. Interest income, including amortization of premium and accretion of discounts using the effective interest method, is earned from settlement date and accrued daily. Dividend income is recorded on an accrual basis on ex-dividend date.
Expenses are recorded on an accrual basis. Most expenses of the Fund can be attributed to a specific series. Expenses which cannot be directly attributed are apportioned among the series in the Fund in such a manner as deemed equitable by the Fund’s Board, taking into consideration, among other things, the nature and type of expense.
The Series uses the identified cost method for determining realized gain or loss on investments for both financial statement and federal income tax reporting purposes.
Federal Taxes
The Series’ policy is to comply with the provisions of the Internal Revenue Code applicable to regulated investment companies. The Series is not subject to federal income tax or excise tax to the extent that the Series distributes to shareholders each year its taxable income, including any net realized gains on investments, in accordance with requirements of the Internal Revenue Code. Accordingly, no provision for federal income tax or excise tax has been made in the financial statements.
On June 29, 2007, the Series adopted Financial Accounting Standards Board Interpretation No. 48 - Accounting for Uncertainty in Income Taxes (“FIN 48”). FIN 48 prescribes the minimum recognition threshold a tax position must meet in connection with accounting for uncertainties in income tax positions taken or expected to be taken by an entity before being measured and recognized in the financial statements. Management has determined that the adoption of FIN 48 did not have a material impact on the Series’ financial statements. The Series files income tax returns in the U.S. federal jurisdiction and various states, as required. No income tax returns are currently under investigation. The statute of limitations on the Series’ tax returns remains open for the years ended December 31, 2005 through December 31, 2008.
Notes to Financial Statements
| 2. | SIGNIFICANT ACCOUNTING POLICIES (continued) |
Distributions of Income and Gains
Distributions to shareholders of net investment income are made quarterly. Distributions of net realized gains are made annually. An additional distribution may be necessary to avoid taxation of the Series. Distributions are recorded on the ex-dividend date.
Indemnifications
The Fund’s organizational documents provide former and current directors and officers with a limited indemnification against liabilities arising in connection with the performance of their duties to the Fund. In the normal course of business, the Fund may also enter into contracts that provide general indemnifications. The Fund’s maximum exposure under these arrangements is unknown as this would be dependent on future claims that may be made against the Fund. The risk of material loss from such claims is considered remote.
Other
The preparation of financial statements in conformity with accounting principles generally accepted in the United States of America requires management to make estimates and assumptions that affect the reported amounts of assets and liabilities and the disclosure of contingent assets and liabilities at the date of the financial statements and the reported amounts of income and expenses during the reporting period. Actual results could differ from those estimates.
| 3. | TRANSACTIONS WITH AFFILIATES |
The Fund has an Investment Advisory Agreement (the “Agreement”) with the Advisor, for which the Series pays a fee, computed daily and payable monthly, at an annual rate of 0.50% of the Series’ average daily net assets.
Under the Agreement, personnel of the Advisor provide the Series with advice and assistance in the choice of investments and the execution of securities transactions, and otherwise maintain the Series’ organization. The Advisor also provides the Fund with necessary office space and fund administration and support services. The salaries of all officers of the Fund (except a percentage of the Fund’s Chief Compliance Officer’s salary, which is paid by the Fund), and of all Directors who are “affiliated persons” of the Fund, or of the Advisor, and all personnel of the Fund, or of the Advisor, performing services relating to research, statistical and investment activities, are paid by the Advisor. Each “non-affiliated” Director receives an annual stipend, which is allocated among all the active series of the Fund. In addition, these Directors also receive a fee per Board meeting attended for each active series of the Fund plus a fee for each committee meeting attended.
The Advisor has contractually agreed, until at least April 30, 2010, to waive its fee and, if necessary, pay other operating expenses of the Series in order to maintain total direct annual fund operating expenses for the Series at no more than 0.85% of average daily net assets each year. For the year ended December 31, 2008, the Advisor did not waive its management fee or reimburse any expenses of the Series. The Advisor is not eligible to recoup any expenses that have been waived or reimbursed in prior years.
Manning & Napier Investor Services, Inc., a registered broker-dealer affiliate of the Advisor, acts as distributor for the Fund’s shares. The services of Manning & Napier Investor Services, Inc. are provided at no additional cost to the Series.
Notes to Financial Statements
| 3. | TRANSACTIONS WITH AFFILIATES (continued) |
For fund accounting and transfer agent services, through October 31, 2008, the Fund paid the Advisor an annual fee of 0.11% of the Fund’s average daily net assets up to $900 million, 0.07% of the Fund’s average daily net assets between $900 million and $1.5 billion, and 0.04% of the Fund’s average daily net assets over $1.5 billion. Effective November 1, 2008, the fee rates are as follows: 0.055% of the Fund’s average daily net assets up to $4.5 billion, 0.03% of the Fund’s average daily net assets between $4.5 billion and $7.5 billion, and 0.02% of the Fund’s average daily net assets over $7.5 billion. Additionally, certain transaction and account-based fees and out-of-pocket expenses, including charges for reporting relating to the Fund’s compliance program, are charged. Expenses not directly attributable to a series are allocated based on each series’ relative net assets or number of accounts, depending on the expense. The Advisor has an agreement with Citi Fund Services Ohio, Inc. (“Citi”) under which Citi serves as sub-accountant and sub-transfer agent.
| 4. | PURCHASES AND SALES OF SECURITIES |
For the year ended December 31, 2008, purchases and sales of securities, other than United States Government securities and short-term securities, were $10,936,704 and $13,288,790, respectively. There were no purchases or sales of United States Government securities.
| 5. | CAPITAL STOCK TRANSACTIONS |
Transactions in shares of New York Tax Exempt Series were:
| | | | | | | | | | | | | | |
| | | For the Year
Ended 12/31/08 | | | For the Year
Ended 12/31/07 | |
| | | | | | | | | | | | | | |
| | | Shares | | | Amount | | | Shares | | | Amount | |
Sold | | 1,676,685 | | | $ | 16,976,063 | | | 2,874,855 | | | $ | 29,845,326 | |
Reinvested | | 378,913 | | | | 3,768,555 | | | 358,700 | | | | 3,706,760 | |
Repurchased | | (2,858,275 | ) | | | (28,447,269 | ) | | (1,397,205 | ) | | | (14,497,108 | ) |
| | | | | | | | | | | | | | |
Total | | (802,677 | ) | | $ | (7,702,651 | ) | | 1,836,350 | | | $ | 19,054,978 | |
| | | | | | | | | | | | | | |
Substantially all of the Series’ shares represent investments by fiduciary accounts over which the Advisor has sole investment discretion.
The Series may trade in financial instruments with off-balance sheet risk in the normal course of its investing activities to assist in managing exposure to various market risks. These financial instruments include written options and futures contracts and may involve, to a varying degree, elements of risk in excess of the amounts recognized for financial statement purposes. No such investments were held by the Series on December 31, 2008.
| 7. | CONCENTRATION OF CREDIT |
The Series primarily invests in debt obligations issued by the State of New York and its political subdivisions, agencies and public authorities to obtain funds for various public purposes. The Series is more susceptible to factors adversely affecting issues of New York municipal securities than is a municipal bond fund that is not concentrated in these issues to the same extent.
Notes to Financial Statements
| 8. | FEDERAL INCOME TAX INFORMATION |
The amount and characterization of certain income and capital gains to be distributed are determined in accordance with federal income tax regulations, which may differ from accounting principles generally accepted in the United States of America. These differences are primarily due to differing book and tax treatments in the timing of the recognition of net investment income or gains and losses, including market discount. The Series may periodically make reclassifications among its capital accounts to reflect income and gains available for distribution (or available capital loss carryovers) under income tax regulations, without impacting the Series’ net asset value. Any such reclassifications are not reflected in the financial highlights.
The tax character of distributions paid were as follows:
| | | | | | |
| | | For the Year
Ended 12/31/08 | | For the Year
Ended 12/31/07 |
| | | | | | |
Ordinary income | | $ | 25,021 | | $ | — |
Tax exempt income | | | 3,787,319 | | | 3,663,391 |
Long-term capital gains | | | 101,616 | | | 169,733 |
At December 31, 2008, the tax basis components of distributable earnings and the net unrealized depreciation based on identified cost for federal income tax purposes were as follows:
| | | | |
Cost for federal income tax purposes | | $ | 101,762,448 | |
Unrealized appreciation | | $ | 1,300,978 | |
Unrealized depreciation | | | (6,629,176 | ) |
| | | | |
Net unrealized depreciation | | $ | (5,328,198 | ) |
Undistributed tax exempt income | | | 842,671 | |
Undistributed long-term capital gains | | | 168,135 | |
| 9. | RECENT ACCOUNTING PRONOUNCEMENTS |
In September 2008, FASB Staff Position No. FAS 133-1 and FIN 45-4, “Disclosures about Credit Derivatives and Certain Guarantees: An Amendment of FASB Statement No. 133 and FASB Interpretation No. 45” (the “Position”) was issued and is effective for fiscal years and interim periods beginning after November 15, 2008. The Position amends FASB Statement No. 133 (“FAS 133”), Accounting for Derivative Instruments and Hedging Activities, and also amends FASB Interpretation No. 45 (“FIN 45”), Guarantor’s Accounting and Disclosure Requirements for Guarantees, Including Indirect Guarantees of Indebtedness of Others. The amendments to FAS 133 include required disclosure for (i) the nature and terms of the credit derivative, reasons for entering into the credit derivative, the events or circumstances that would require the seller to perform under the credit derivative, and the current status of the payment performance risk of the credit derivative, (ii) the maximum potential amount of future payments (undiscounted) the seller could be required to make under the credit derivative, (iii) the fair value of the credit derivative, and (iv) the nature of any recourse provisions and assets held either as collateral or by third parties. The amendments to FIN 45 require additional disclosures about the current status of the payment/performance risk of a guarantee. At this time, Management is evaluating the implications of FAS 133-1 and FIN 45-4, but they are not expected to materially impact the Series’ financial statements.
In March 2008, FASB Statement of Financial Accounting Standards No. 161, Disclosures about Derivative Instruments and Hedging Activities (“FAS 161”) was issued and is effective for fiscal years and interim periods beginning after November 15, 2008. FAS 161 requires enhanced disclosures about the Series’ derivative and hedging activities, including how such activities are
Notes to Financial Statements
| 9. | RECENT ACCOUNTING PRONOUNCEMENTS (continued) |
accounted for and their effect on the Series’ financial position and performance. Management is currently evaluating the impact of the adoption of FAS 161, but it is not expected to materially impact the Series’ financial statements.
Report of Independent Registered Public Accounting Firm
To the Board of Directors of Manning & Napier Fund, Inc. and Shareholders of New York Tax Exempt Series:
In our opinion, the accompanying statement of assets and liabilities, including the investment portfolio (except for credit ratings), and the related statements of operations and of changes in net assets and the financial highlights present fairly, in all material respects, the financial position of the New York Tax Exempt Series (a series of Manning & Napier Fund, Inc., hereafter referred to as the “Series”) at December 31, 2008, and the results of its operations for the year then ended, the changes in its net assets for each of the two years in the period then ended and the financial highlights for each of the five years in the period then ended, in conformity with accounting principles generally accepted in the United States of America. These financial statements and financial highlights (hereafter referred to as “financial statements”) are the responsibility of the Series’ management; our responsibility is to express an opinion on these financial statements based on our audits. We conducted our audits of these financial statements in accordance with the standards of the Public Company Accounting Oversight Board (United States). Those standards require that we plan and perform the audit to obtain reasonable assurance about whether the financial statements are free of material misstatement. An audit includes examining, on a test basis, evidence supporting the amounts and disclosures in the financial statements, assessing the accounting principles used and significant estimates made by management, and evaluating the overall financial statement presentation. We believe that our audits, which included confirmation of securities at December 31, 2008 by correspondence with the custodian, provide a reasonable basis for our opinion.
Columbus, Ohio
February 13, 2009
Supplemental Tax Information (unaudited)
Pursuant to Section 852 of the Internal Revenue Code, as amended, the Series hereby designates $101,616 as capital gains for its taxable year ended December 31, 2008. In addition, the Series hereby designates $3,787,319 as tax exempt dividends for the year ended December 31, 2008.
Renewal of Investment Advisory Agreement (unaudited)
At the Manning & Napier Fund, Inc. (the “Fund”) Board of Directors’ (the “Board”) meeting, held on November 5, 2008, the Investment Advisory Agreement (the “Agreement”) between the Fund and Manning & Napier Advisors, Inc. (the “Advisor”) was reviewed by the Board for renewal. In connection with the decision whether to renew the Agreement, a variety of material was prepared for and reviewed by the Board.
Representatives of the Advisor attended the meeting and presented additional oral and written information to the Board to assist the Board in its considerations. The discussion immediately below outlines the materials and information presented to the Board in connection with the Board’s 2008 Annual Review of the Agreement and the conclusions made by the Directors when determining to continue the Agreement.
| | • | | The Board considered the services provided by the Advisor under the Agreement including, among others: deciding what securities to purchase and sell for each Series; arranging for the purchase and sale of such securities by placing orders with broker-dealers; administering the affairs of the Fund (including the books and records of the Fund not maintained by third party service providers such as the custodian or sub-transfer agent); arranging for the insurance coverage for the Fund; and supervising the preparation of tax returns, SEC filings (including registration statements) and reports to shareholders for the Fund. The Board also considered the nature and quality of such services provided under the Agreement in light of the Advisor’s services provided to the Fund for 22 years. The Board discussed the quality of these services with representatives from the Advisor and concluded that the Advisor was performing its services to the Fund required under the Agreement in a reasonable manner. |
| | • | | The Board considered the investment performance of the various Series of the Fund. The investment performance for each Series was reviewed on a cumulative basis since inception and on a one year basis. In addition, annualized performance for the following time periods was considered: inception, three year, five year, ten year, and current market cycle. A market cycle includes periods of both rising and falling markets. Returns for established benchmark indices for each Series were provided for each time period. The Board noted that the various Series were competitive against their respective benchmarks and/or peer groups over various time periods, but in particular over the full market cycle period relevant for the Series. In addition, the Board considered at the meeting (and considers on a quarterly basis) a peer group performance analysis consisting of Morningstar universes of mutual funds with similar investment objectives. The Board discussed the performance with representatives from the Advisor and concluded that the investment performance of each of the Fund’s Series was reasonable based on the Fund’s actual performance and comparative performance, especially performance over the current market cycle. |
| | • | | The Board considered the costs of the Advisor’s services and the profits of the Advisor as they relate to the Advisor’s services to the Fund under the Agreement. In reviewing the Advisor’s costs and profits, the Board discussed the Advisor’s revenues generated from the Fund (on both an actual and adjusted basis) and its expenses associated with providing the services under the Agreement. In addition, the Board reviewed the Advisor’s expenses associated with Fund activities outside of the Agreement (such as expense reimbursements pursuant to expense caps and payments made by the Advisor to third party platforms on which shares of the Fund are available for purchase). It was noted by representatives of the Advisor that 15 of the 25 active Series of the Fund are |
Renewal of Investment Advisory Agreement (unaudited)
| | currently experiencing expenses above the capped expense ratios. After discussing the above costs and profits, the Board concluded that the Advisor’s profitability relating to its services provided under the Agreement was reasonable. |
| | • | | The Board considered the fees and expenses of the various Series of the Fund. The Advisor presented the advisory fees and total expenses for each Series, including the advisory fee adjusted for any expense waivers or reimbursements (either contractual or voluntary) paid by the Advisor. The advisory fees and expense ratios of each Series were compared to an average (on both a mean and median basis) of similar funds as disclosed on the Morningstar database. Representatives of the Advisor discussed with the Board the levels of its advisory fee for each Series of the Fund and as compared to the median and mean advisory fees for similar funds as listed on Morningstar. Expense ratios for every Series, except the High Yield Bond Series, Global Fixed Income Series and the Target Series Class R and Class C, are currently below the median and mean for similar funds as listed on Morningstar. Based on their review of the information provided, the Board concluded that the fees and expenses of each Series of the Fund were reasonable on a comparative basis. |
| | • | | The Board also considered the other benefits the Advisor derives from its relationship with the Fund. Such other benefits include certain research products provided by soft dollars. Given the level of soft dollar transactions involving the Fund, the Board concluded that these additional benefits to the Advisor were reasonable. |
| | • | | In addition to the factors described above, the Board considered the Advisor’s personnel, investment strategies, policies and procedures relating to compliance with personal securities transactions, and reputation, expertise and resources in domestic and foreign financial markets. The Board concluded that these factors support the conclusion that the Advisor performs its services in a reasonable manner. |
| | • | | The Board did not consider economies of scale at this time because of the multiple uses of the Fund (for the Advisor’s discretionary investment account clients in addition to direct investors), the current profitability of the Advisor’s services to the Fund under the Agreement, and the overall size of the Fund complex. |
Based on the Board’s deliberations and their evaluation of the information described above, the Board, including a majority of Directors that are not “interested persons” as defined in the Investment Company Act of 1940, concluded that the compensation under the Agreement was fair and reasonable in light of the services and expenses and such other matters as the Directors considered to be relevant in the exercise of their reasonable judgment. Accordingly, the Board approved the renewal of the Agreement. In the course of their deliberations, the Directors did not identify any particular information that was all important or controlling.
Directors’ and Officers’ Information (unaudited)
The Statement of Additional Information provides additional information about the Fund’s directors and officers and can be obtained without charge by calling 1-800-466-3863, at www.manningnapieradvisors.com, or on the EDGAR Database on the SEC Internet web site (http://www.sec.gov). The following chart shows certain information about the Fund’s officers and directors, including their principal occupations during the last five years. Unless specific dates are provided, the individuals have held the listed positions for longer than five years.
INTERESTED DIRECTOR/OFFICER
| | |
| Name: | | B. Reuben Auspitz* |
| Address: | | 290 Woodcliff Drive
Fairport, NY 14450 |
| Age: | | 61 |
| Current Position(s) Held with Fund: | | Principal Executive Officer, President, Chairman & Director |
| Term of Office1 & Length of Time Served: | | Indefinite - Director since 1984; Vice President 1984 - 2003; President since 2004; Principal Executive Officer since 2002 |
| Principal Occupation(s) During Past 5 Years: | | Executive Vice President; Co-Executive Director; Executive Group Member**; Chief Compliance Officer since 2004 - Manning & Napier Advisors, Inc. President; Director - Manning & Napier Investor Services, Inc. Holds or has held one or more of the following titles for various subsidiaries and affiliates: President, Vice President, Director, Chairman, Treasurer, Chief Compliance Officer or Member. |
| Number of Portfolios Overseen within Fund Complex: | | 28 |
| Other Directorships Held Outside Fund Complex: | | N/A |
| |
| INDEPENDENT DIRECTORS | | |
| |
| Name: | | Stephen B. Ashley |
| Address: | | 290 Woodcliff Drive
Fairport, NY 14450 |
| Age: | | 68 |
| Current Position(s) Held with Fund: | | Director, Audit Committee Member, Governance & Nominating Committee Member |
| Term of Office & Length of Time Served: | | Indefinite - Since 1996 |
| Principal Occupation(s) During Past 5 Years: | | Chairman, Director, President & Chief Executive Officer, The Ashley Group (property management and investment). Chairman (non-executive) 2004-2008; Director 1995-2008 - Fannie Mae (mortgage) |
| Number of Portfolios Overseen within Fund Complex: | | 28 |
| Other Directorships Held Outside Fund Complex: | | The Ashley Group |
| Name: | | Peter L. Faber |
| Address: | | 290 Woodcliff Drive
Fairport, NY 14450 |
| Age: | | 70 |
| Current Position(s) Held with Fund: | | Director, Governance & Nominating Committee Member |
| Term of Office & Length of Time Served: | | Indefinite - Since 1987 |
| Principal Occupation(s) During Past 5 Years: | | Senior Counsel, McDermott, Will & Emery LLP (law firm) |
| Number of Portfolios Overseen within Fund Complex: | | 28 |
| Other Directorships Held Outside Fund Complex: | | Partnership for New York City, Inc.
New York Collegium
Boston Early Music Festival |
| Name: | | Harris H. Rusitzky |
| Address: | | 290 Woodcliff Drive
Fairport, NY 14450 |
| Age: | | 73 |
| Current Position(s) Held with Fund: | | Director, Audit Committee Member, Governance & Nominating Committee Member |
| Term of Office & Length of Time Served: | | Indefinite - Since 1985 |
| Principal Occupation(s) During Past 5 Years: | | President, The Greening Group (business consultants); Partner, The Restaurant Group (restaurants) |
| Number of Portfolios Overseen within Fund Complex: | | 28 |
| Other Directorships Held Outside Fund Complex: | | N/A |
Directors’ and Officers’ Information (unaudited)
| | |
| |
INDEPENDENT DIRECTORS (continued) | | |
| Name: | | Paul A. Brooke |
| Address: | | 290 Woodcliff Drive
Fairport, NY 14450 |
| Age: | | 63 |
| Current Position(s) Held with Fund: | | Director, Audit Committee Member, Governance & Nominating Committee Member |
| Term of Office & Length of Time Served: | | Indefinite - Since 2007 |
| Principal Occupation(s) During Past 5 Years: | | Chairman & CEO, Alsius Corp. (investments); Managing Member, PMSV Holdings LLC (investments) |
| Number of Portfolios Overseen within Fund Complex: | | 28 |
| Other Directorships Held Outside Fund Complex: | | Incyte Corp.
ViroPharma, Inc.
HLTH Corp.
Cheyne Captial International
MPM Bio-equities
GMP Companies
HoustonPharma |
OFFICERS
| | |
| Name: | | Jeffrey S. Coons, Ph.D., CFA |
| Address: | | 290 Woodcliff Drive |
| | Fairport, NY 14450 |
| Age: | | 45 |
| Current Position(s) Held with Fund: | | Vice President |
| Term of Office1 & Length of Time Served: | | Since 2004 |
| Principal Occupation(s) During Past 5 Years: | | Co-Director of Research since 2002 & Executive Group Member**, |
| | Manning & Napier Advisors, Inc. Holds one or more of the following titles for various subsidiaries and affiliates: President, Director, Treasurer or Senior Trust Officer. |
| Number of Portfolios Overseen within Fund Complex: | | 28 |
| Other Directorships Held Outside Fund Complex: | | N/A |
| Name: | | Christine Glavin |
| Address: | | 290 Woodcliff Drive |
| | Fairport, NY 14450 |
| Age: | | 42 |
| Current Position(s) Held with Fund: | | Principal Financial Officer, Chief Financial Officer |
| Term of Office1 & Length of Time Served: | | Principal Financial Officer since 2002; Chief Financial Officer since 2001 |
| Principal Occupation(s) During Past 5 Years: | | Fund Reporting Manager, Manning & Napier Advisors, Inc. |
| Number of Portfolios Overseen within Fund Complex: | | 28 |
| Other Directorships Held Outside Fund Complex: | | N/A |
| Name: | | Jodi L. Hedberg |
| Address: | | 290 Woodcliff Drive |
| | Fairport, NY 14450 |
| Age: | | 41 |
| Current Position(s) Held with Fund: | | Corporate Secretary, Chief Compliance Officer, Anti-Money Laundering Compliance Officer |
| Term of Office1 & Length of Time Served: | | Corporate Secretary since 1997; Chief Compliance Officer since 2004 |
| Principal Occupation(s) During Past 5 Years: | | Director of Compliance, Manning & Napier Advisors, Inc. and affiliates; Corporate Secretary, Manning & Napier Investor Services, Inc. since 2006 |
| Number of Portfolios Overseen within Fund Complex: | | 28 |
| Other Directorships Held Outside Fund Complex: | | N/A |
*Interested Director, within the meaning of the Investment Company Act of 1940 by reason of his position with the Fund’s investment advisor and distributor. Mr. Auspitz serves as the Executive Vice President and Director, Manning & Napier Advisors, Inc. and President and Director, Manning & Napier Investor Services, Inc., the Fund’s distributor.
**The Executive Group performs the duties of the Office of the Chief Executive of Manning & Napier Advisors, Inc.
1The term of office for President, Vice President, Chief Financial Officer, and Corporate Secretary is one year and until their respective successors are chosen and qualified. All other officers’ terms are indefinite.
(THISPAGEINTENTIONALLYLEFTBLANK)
Literature Requests (unaudited)
Proxy Voting Policies and Procedures
A description of the policies and procedures that the Fund uses to determine how to vote proxies relating to portfolio securities is available, without charge, upon request:
| | |
By phone | | 1-800-466-3863 |
On the Securities and Exchange Commission’s (SEC) web site | | http://www.sec.gov |
Proxy Voting Record
Information regarding how the Fund voted proxies relating to portfolio securities during the most recent 12-month period ended June 30th is available, without charge, upon request:
| | |
By phone | | 1-800-466-3863 |
On the SEC’s web site | | http://www.sec.gov |
Quarterly Portfolio Holdings
The Series’ complete schedule of portfolio holdings for the 1st and 3rd quarters of each fiscal year are provided on Form N-Q, and are available, without charge, upon request:
| | |
By phone | | 1-800-466-3863 |
On the SEC’s web site | | http://www.sec.gov |
The Series’ Form N-Q may be reviewed and copied at the SEC’s Public Reference Room in Washington, D.C. Information on the operation of the Public Reference Room may be obtained by calling 1-800-SEC-0330.
Prospectus and Statement of Additional Information (SAI)
The prospectus and SAI provide additional information about each Series, including charges, expenses and risks. These documents are available, without charge, upon request:
| | |
By phone | | 1-800-466-3863 |
On the SEC’s web site | | http://www.sec.gov |
On the Advisor’s web site | | http://www.manningnapieradvisors.com |
Additional information available at www.manningnapieradvisors.com
1. Fund Holdings - Month-End
2. Fund Holdings - Quarter-End
3. Shareholder Report - Annual
4. Shareholder Report - Semi-Annual
Manning & Napier Fund, Inc.
| | | | |
| DIVERSIFIED TAX EXEMPT SERIES | | | | | Annual Report - December 31, 2008 |

Management Discussion and Analysis (unaudited)
Dear Shareholders:
Credit risk is defined rather innocuously by Bloomberg as “the risk that an obligation will not be completed, with the result being a loss”. That hardly does it justice. In 2008, investors became intimately acquainted with credit risk, the problems it can create and, more importantly, the losses it can inflict. The greater the investor’s exposure to credit risk in 2008, the worse his or her relative performance happened to be. In the fixed income arena, credit risk is most prevalent in the corporate bond market; last year, investors in the high yield area lost more than 30%; investors in the investment-grade market lost more then 5%. Credit risk is also quite prevalent in the growing market for commercial mortgage-backed securities (CMBS); last year that market lost 17%. Credit risk is a key determinant of municipal bond performance; that market dropped by 4% in 2008 as measured by the Merrill Muni Master Index, which includes municipal bonds of all maturities.
A definition of credit risk that is more specific to the bond market is the risk of loss due to a debtor’s non-payment of a loan or some other line of credit, either the principal or interest/coupon, or both. The credit problems that engulfed the financial markets first started to show in the real estate area, specifically in subprime mortgages. They then spread to those that trafficked in such securities, hedge funds and investment banks, subsequently engulfed Fannie Mae and Freddie Mac, and sucked in commercial banks and assorted insurance companies, culminating in a full fledged credit crisis that defined the fourth quarter of 2008.
The markets were already struggling when the year began given the credit missteps that had surfaced in the prior year. Those problems carried over into the first quarter of 2008; however, it became apparent that they had begun to spill over into the overall economy. The situation was exacerbated by a concurrent spike in commodity prices. The problems led to the mid-March fire sale of a major Wall Street firm, Bear Stearns, to JP Morgan Chase that was brokered by the Federal Reserve.
As the credit crisis became more pronounced, investors reigned in their risk tolerances, which resulted in wider credit spreads (the difference in yields as compared to U.S. Treasuries) in both the corporate bond and the municipal bond markets. It also drove U.S. T-bill yields to 50 year lows, caused the auction rate securities market to collapse, and contributed to the implosion of numerous hedge funds. As the prices of oil, gold, and other commodities increased, inflation risks were re-awakened, lowering risk tolerances even more.
Early in September, Fannie Mae and Freddie Mac, the two largest government sponsored entities, were forced into conservatorship, whereby the U.S. Government took control over both entities, along with their $5 trillion of financial obligations. The markets spent a week digesting that, and then came the week of September 14th, which will go down as one of the most cataclysmic weeks in the history of the financial markets.
On Sunday of that week, Lehman Brothers announced that it would file for bankruptcy. That news was quickly followed by more bad news, including the quick sale of Merrill Lynch to Bank of America, bankruptcy fears at insurer AIG, and a money market fund “breaking the buck”. The environment was so bad that the yield on 3-month U.S. Treasury Bills, universally considered to be the risk-free investment, was driven down to 0.02% as investors scrambled to find a safe harbor.
In hindsight, the Lehman bankruptcy seemed to be a watershed event that pushed the U.S. economy over the precipice. And while the federal government spigot is likely to be turned on, state and local spending is poised to slow dramatically as evidenced by the state of California paying its vendors with IOU’s for the first time since the 1930’s.
The moves in the financial markets during the quarter were just as dismal. In the equity markets, both the Dow Industrial Index and Standard and Poor’s (S&P) 500 Total Return Index were down more than 20% for the quarter; the NASDAQ Composite was down 25%. It wasn’t just the equity markets that struggled, the corporate bond market and the municipal bond market both sold off quite dramatically. There was, however, a glimmer of hope, when both exhibited signs of recovery as the quarter and the year came to a close.
Management Discussion and Analysis (unaudited)
One area of the municipal market that did not struggle quite so much last year was the short-to-intermediate maturity sector. Not only did short-term municipals earn their coupons, they also generated modest capital gains. That was the exact opposite of what happened in the long-term municipal market; longer-term municipal bonds were down just under -15% last year.
As for the performance of the Diversified Tax Exempt Series in 2008, its total return was -1.79%. That lagged the Merrill Lynch 1-12 Year Municipal Bond Index, which only includes municipal bonds with maturities of 12 years or less; it returned 4.61% in 2008. The Series’ underperformance versus the benchmark was strictly a function of the aforementioned weak performance of longer-term municipals. With a significant percentage of the Series’ assets invested in longer-term municipal bonds, the Series simply could not compete with the benchmark in 2008. However, longer-term bonds have historically outperformed shorter-term ones.
As always, we appreciate your business.
Sincerely,
Manning & Napier Advisors, Inc.
Performance Update as of December 31, 2008 (unaudited)
| | | | | | | | | | |
| | | Average Annual Total Returns
As of December 31, 2008 | | |
| | | One
Year | | Five
Year | | Ten
Year | | Since
Inception1 | | |
Manning & Napier Fund, Inc. - Diversified Tax Exempt Series2 | | -1.79% | | 2.33% | | 3.65% | | 4.23% | | |
Merrill Lynch 1-12 Year Municipal Bond Index3 | | 4.61% | | 3.73% | | 4.83% | | 5.16% | | |
The following graph compares the value of a $10,000 investment in the Manning & Napier Fund, Inc. - Diversified Tax Exempt Series for the ten years ended December 31, 2008 to the Merrill Lynch 1-12 Year Municipal Bond Index.
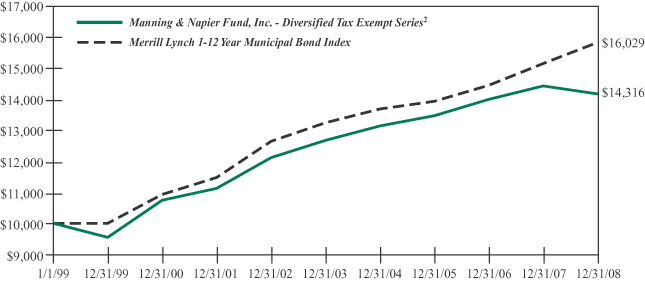
1Performance numbers for the Series and Index are calculated from February 14, 1994, the Series’ inception date.
2The Series’ performance does not reflect the deduction of taxes that a shareholder would pay on fund distributions or the redemption of shares. The Series’ performance is historical and may not be indicative of future results. The performance returns shown are inclusive of the net expense ratio of the Series. For the year ended December 31, 2008, this net expense ratio was 0.61%. The gross expense ratio, which does not account for any voluntary or contractual waivers currently in effect, was 0.61% for the year ended December 31, 2008.
3The Merrill Lynch 1-12 Year Municipal Bond Index is an unmanaged, market weighted index comprised of investment-grade, fixed rate, coupon bearing municipal bonds with maturities greater than one year but less than twelve years. The Index returns assume reinvestment of coupons and, unlike Series returns, do not reflect any fees or expenses.
Shareholder Expense Example (unaudited)
As a shareholder of the Series, you may incur two types of costs: (1) transaction costs, including potential wire charges on redemptions and (2) ongoing costs, including management fees and other Series expenses. This example is intended to help you understand your ongoing costs (in dollars) of investing in the Series and to compare these costs with the ongoing costs of investing in other mutual funds.
The example is based on an investment of $1,000 invested at the beginning of the period and held for the entire period (July 1, 2008 to December 31, 2008).
Actual Expenses
The first line of the table below provides information about actual account values and actual expenses. You may use the information in this line, together with the amount you invested, to estimate the expenses that you paid over the period. Simply divide your account value by $1,000 (for example, an $8,600 account value divided by $1,000 = 8.6), then multiply the result by the number in the first line under the heading entitled “Expenses Paid During Period” to estimate the expenses you paid on your account during this period.
Hypothetical Example for Comparison Purposes
The second line of the table below provides information about hypothetical account values and hypothetical expenses based on the Series’ actual expense ratio and an assumed rate of return of 5% per year before expenses, which is not the Series’ actual return. The hypothetical account values and expenses may not be used to estimate the actual ending account balance or expenses you paid during the period. You may use this information to compare the ongoing costs of investing in the Series and other funds. To do so, compare this 5% hypothetical example with the 5% hypothetical examples that appear in the shareholder reports of the other funds.
Please note that the expenses shown in the table are meant to highlight your ongoing costs only and do not reflect any transaction costs, such as potential wire charges on redemptions. Therefore, the second line of the table is useful in comparing ongoing costs only, and will not help you determine the relative total costs of owning different funds. In addition, if these transaction costs were included, your costs would have been higher.
| | | | | | | | | |
| | | Beginning
Account Value
7/1/08 | | Ending
Account Value
12/31/08 | | Expenses Paid
During Period*
7/1/08-12/31/08 |
Actual | | $ | 1,000.00 | | $ | 986.50 | | $ | 3.05 |
Hypothetical
(5% return before expenses) | | $ | 1,000.00 | | $ | 1,022.07 | | $ | 3.10 |
*Expenses are equal to the Series’ annualized expense ratio (for the six-month period) of 0.61%, multiplied by the average account value over the period, multiplied by 184/366 (to reflect the one-half year period). Expenses are based on the most recent fiscal half year; therefore, the expense ratio stated above may differ from the expense ratio stated in the financial highlights, which is based on one-year data.
Portfolio Composition as of December 31, 2008 (unaudited)
Bond Types1
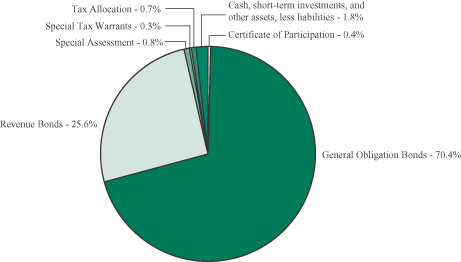
1As a percentage of net assets.
Credit Quality Ratings2,3
| | |
Aaa | | 17.0% |
Aa | | 56.1% |
A | | 15.3% |
Baa | | 9.4% |
Ba | | 0.2% |
| Unrated investments | | 0.2% |
Cash, short-term investments, and other
assets, less liabilities | | 1.8% |
2As a percentage of net assets.
3Based on ratings from Moody’s, or the S&P equivalent. The Series may use different ratings provided by other rating agencies for purposes of determining compliance with the Series’ investment policies.
Top Ten States4
| | |
Texas | | 6.9% |
Illinois | | 5.2% |
Michigan | | 5.1% |
New York | | 5.1% |
Washington | | 5.1% |
Ohio | | 4.7% |
Nevada | | 4.3% |
Indiana | | 4.2% |
California | | 3.9% |
Florida | | 3.8% |
4As a percentage of total investments.
Investment Portfolio - December 31, 2008
| | | | | | | | | | | | | |
| | | Coupon
Rate | | | Maturity
Date | | Credit
Rating1
(unaudited) | | Principal
Amount | | Value
(Note 2) |
| | | | | | | | | | | | | |
| | | | | | | | | | | | | |
| | | | | |
MUNICIPAL BONDS - 98.2% | | | | | | | | | | | | | |
| | | | | |
Alabama - 1.4% | | | | | | | | | | | | | |
Birmingham, Capital Impt., Prerefunded Balance, Series B, G.O. Bond, AMBAC | | 5.000 | % | | 12/1/2032 | | Aa3 | | $ | 1,005,000 | | $ | 1,118,304 |
Fort Payne Waterworks Board, Revenue Bond, AMBAC | | 3.500 | % | | 7/1/2015 | | Baa1 | | | 665,000 | | | 644,279 |
Hoover Board of Education, Capital Outlay Warrants, Special Tax Warrants, MBIA | | 5.250 | % | | 2/15/2017 | | A1 | | | 500,000 | | | 519,575 |
Odenville Utilities Board Water, Revenue Bond, MBIA | | 4.300 | % | | 8/1/2028 | | Baa1 | | | 500,000 | | | 475,175 |
| | | | | | | | | | | | | |
| | | | | | | | | | | | | 2,757,333 |
| | | | | | | | | | | | | |
Alaska - 0.2% | | | | | | | | | | | | | |
Alaska Municipal Banking Authority, Revenue Bond, MBIA | | 4.100 | % | | 6/1/2017 | | A1 | | | 455,000 | | | 450,104 |
| | | | | | | | | | | | | |
Arizona - 2.5% | | | | | | | | | | | | | |
Goodyear, G.O. Bond, MBIA | | 4.375 | % | | 7/1/2020 | | A1 | | | 680,000 | | | 644,021 |
Mesa, G.O. Bond, FGRMB | | 4.125 | % | | 7/1/2027 | | A1 | | | 2,215,000 | | | 1,855,328 |
Phoenix, Series B, G.O. Bond | | 4.200 | % | | 7/1/2021 | | Aa1 | | | 1,500,000 | | | 1,500,675 |
Yuma County Library District, Series A, G.O. Bond, AMBAC | | 4.500 | % | | 7/1/2035 | | A2 | | | 1,200,000 | | | 950,604 |
| | | | | | | | | | | | | |
| | | | | | | | | | | | | 4,950,628 |
| | | | | | | | | | | | | |
California - 3.9% | | | | | | | | | | | | | |
California State, G.O. Bond | | 4.750 | % | | 12/1/2028 | | A1 | | | 795,000 | | | 691,109 |
California State, G.O. Bond | | 5.250 | % | | 2/1/2023 | | A1 | | | 500,000 | | | 492,500 |
California State, Various Purposes, G.O. Bond, AMBAC | | 4.250 | % | | 12/1/2035 | | A1 | | | 1,140,000 | | | 811,053 |
Campbell Union School District, G.O. Bond, FSA | | 4.375 | % | | 8/1/2027 | | Aa3 | | | 1,810,000 | | | 1,575,533 |
Chula Vista Elementary School District, Series F, G.O. Bond, MBIA | | 4.800 | % | | 8/1/2024 | | Baa1 | | | 435,000 | | | 400,052 |
Chula Vista Elementary School District, Series F, G.O. Bond, MBIA | | 4.875 | % | | 8/1/2025 | | Baa1 | | | 425,000 | | | 389,950 |
Los Angeles Unified School District, Series B, G.O. Bond, AMBAC | | 4.500 | % | | 7/1/2027 | | Aa3 | | | 840,000 | | | 740,578 |
Oak Valley Hospital District, G.O. Bond, FGRMB | | 4.500 | % | | 7/1/2025 | | A3 | | | 1,395,000 | | | 1,217,500 |
Richmond Joint Powers Financing Authority, Series A, Tax Allocation, MBIA | | 5.250 | % | | 9/1/2025 | | Baa1 | | | 1,570,000 | | | 1,398,273 |
| | | | | | | | | | | | | |
| | | | | | | | | | | | | 7,716,548 |
| | | | | | | | | | | | | |
Colorado - 1.4% | | | | | | | | | | | | | |
Broomfield Water Activity, Enterprise Water, Revenue Bond, MBIA | | 5.000 | % | | 12/1/2015 | | A2 | | | 700,000 | | | 738,255 |
| | |
| 6 | | The accompanying notes are an integral part of the financial statements. |
Investment Portfolio - December 31, 2008
| | | | | | | | | | | | | | |
| | | Coupon
Rate | | | Maturity
Date | | Credit
Rating1
(unaudited) | | | Principal
Amount | | Value
(Note 2) |
| | | | | | | | | | | | | | |
| | | | | |
MUNICIPAL BONDS (continued) | | | | | | | | | | | | | | |
| | | | | |
Colorado (continued) | | | | | | | | | | | | | | |
Colorado Water Resources & Power Development Authority, Water Resource, Series D, Revenue Bond, FSA | | 4.375 | % | | 8/1/2035 | | Aa3 | | | $ | 1,420,000 | | $ | 1,149,007 |
Commerce City, Certificate of Participation, AMBAC | | 4.750 | % | | 12/15/2032 | | A | 2 | | | 1,000,000 | | | 728,480 |
Denver City & County School District No. 1, Unrefunded Balance, G.O. Bond, FGIC | | 5.000 | % | | 12/1/2023 | | Aa3 | | | | 105,000 | | | 105,476 |
| | | | | | | | | | | | | | |
| | | | | | | | | | | | | | 2,721,218 |
| | | | | | | | | | | | | | |
Connecticut - 0.8% | | | | | | | | | | | | | | |
Stamford, G.O. Bond | | 4.400 | % | | 2/15/2026 | | Aaa | | | | 1,545,000 | | | 1,468,476 |
| | | | | | | | | | | | | | |
Delaware - 1.3% | | | | | | | | | | | | | | |
New Castle County, Series A, G.O. Bond | | 4.250 | % | | 7/15/2025 | | Aaa | | | | 1,500,000 | | | 1,399,710 |
New Castle County, Series A, G.O. Bond | | 4.250 | % | | 7/15/2026 | | Aaa | | | | 1,265,000 | | | 1,157,526 |
| | | | | | | | | | | | | | |
| | | | | | | | | | | | | | 2,557,236 |
| | | | | | | | | | | | | | |
Florida - 3.7% | | | | | | | | | | | | | | |
Cape Coral Utility Impt. Assessment, Special Assessment, MBIA | | 4.500 | % | | 7/1/2021 | | Baa1 | | | | 1,890,000 | | | 1,538,914 |
Florida State Department of Transportation, G.O. Bond | | 5.000 | % | | 7/1/2027 | | Aa1 | | | | 1,000,000 | | | 979,910 |
Florida State Board of Education, Capital Outlay, Public Education, Series A, G.O. Bond, FSA | | 4.500 | % | | 6/1/2025 | | Aa1 | | | | 1,280,000 | | | 1,155,302 |
Florida State Board of Education, Capital Outlay, Public Education, Series C, G.O. Bond, AMBAC | | 5.000 | % | | 6/1/2011 | | Aa1 | | | | 425,000 | | | 452,021 |
Florida State Board of Education, Capital Outlay, Public Education, Series D, G.O. Bond | | 5.000 | % | | 6/1/2016 | | Aa1 | | | | 2,000,000 | | | 2,202,660 |
Miami-Dade County, Educational Facilities Authority, Prerefunded Balance, Series A, Revenue Bond, AMBAC | | 5.000 | % | | 4/1/2015 | | Baa1 | | | | 510,000 | | | 576,907 |
Tohopekaliga Water Authority, Utility System, Series A, Revenue Bond, FSA | | 5.000 | % | | 10/1/2028 | | Aa3 | | | | 510,000 | | | 475,402 |
| | | | | | | | | | | | | | |
| | | | | | | | | | | | | | 7,381,116 |
| | | | | | | | | | | | | | |
Georgia - 2.1% | | | | | | | | | | | | | | |
Atlanta, Prerefunded Balance, G.O. Bond | | 5.600 | % | | 12/1/2018 | | Aa3 | | | | 350,000 | | | 354,550 |
Atlanta, Water & Wastewater, Series A, Revenue Bond, MBIA | | 5.000 | % | | 11/1/2033 | | Baa1 | | | | 310,000 | | | 231,313 |
Atlanta, Water & Wastewater, Revenue Bond, FSA | | 5.000 | % | | 11/1/2043 | | Aa3 | | | | 1,500,000 | | | 1,277,925 |
Georgia State, Series B, G.O. Bond | | 4.000 | % | | 3/1/2022 | | Aaa | | | | 1,270,000 | | | 1,210,653 |
Georgia State, Series B, G.O. Bond | | 5.650 | % | | 3/1/2012 | | Aaa | | | | 5,000 | | | 5,573 |
| | |
| The accompanying notes are an integral part of the financial statements. | | 7 |
Investment Portfolio - December 31, 2008
| | | | | | | | | | | | | |
| | | Coupon
Rate | | | Maturity
Date | | Credit
Rating1
(unaudited) | | Principal
Amount | | Value
(Note 2) |
| | | | | | | | | | | | | |
| | | | | | | | | | | | | |
| | | | | |
MUNICIPAL BONDS (continued) | | | | | | | | | | | | | |
| | | | | |
Georgia (continued) | | | | | | | | | | | | | |
Georgia State, Unrefunded Balance, Series B, G.O. Bond | | 5.650 | % | | 3/1/2012 | | Aaa | | $ | 195,000 | | $ | 216,247 |
Madison Water & Sewer, Revenue Bond, AMBAC | | 4.625 | % | | 7/1/2030 | | Baa1 | | | 1,000,000 | | | 801,690 |
| | | | | | | | | | | | | |
| | | | | | | | | | | | | 4,097,951 |
| | | | | | | | | | | | | |
Illinois - 5.2% | | | | | | | | | | | | | |
Chicago, Series D, G.O. Bond, FGRMB | | 5.500 | % | | 1/1/2035 | | Aa3 | | | 1,000,000 | | | 982,360 |
Chicago, Series A, G.O. Bond, AMBAC | | 5.000 | % | | 1/1/2018 | | Aa3 | | | 2,255,000 | | | 2,419,254 |
Chicago, Series A, G.O. Bond, FSA | | 4.750 | % | | 1/1/2038 | | Aa3 | | | 1,500,000 | | | 1,318,215 |
Chicago, Prerefunded Balance, Series A, G.O. Bond, MBIA | | 5.000 | % | | 1/1/2034 | | Aa3 | | | 310,000 | | | 344,822 |
Chicago, Unrefunded Balance, Series A, G.O. Bond, MBIA | | 5.000 | % | | 1/1/2034 | | Aa3 | | | 520,000 | | | 482,908 |
Cook County, Series A, G.O. Bond, FGRMB | | 5.000 | % | | 11/15/2022 | | Aa2 | | | 750,000 | | | 754,477 |
Illinois State, G.O. Bond, MBIA | | 5.250 | % | | 10/1/2018 | | Aa3 | | | 2,000,000 | | | 2,109,440 |
Illinois State, G.O. Bond | | 5.000 | % | | 12/1/2027 | | Aa3 | | | 600,000 | | | 596,346 |
Illinois State, Series 1995 A, Certificate of Participation, MBIA | | 5.600 | % | | 7/1/2010 | | Baa1 | | | 100,000 | | | 100,747 |
Rock Island County School District No. 041 Rock Island, G.O. Bond, FSA | | 5.125 | % | | 12/1/2015 | | Aa3 | | | 200,000 | | | 200,480 |
Springfield Electric, Revenue Bond, MBIA | | 5.000 | % | | 3/1/2035 | | Aa3 | | | 1,000,000 | | | 877,080 |
| | | | | | | | | | | | | |
| | | | | | | | | | | | | 10,186,129 |
| | | | | | | | | | | | | |
Indiana - 4.2% | | | | | | | | | | | | | |
Avon Community School Building Corp., Revenue Bond, AMBAC | | 4.250 | % | | 7/15/2018 | | Baa1 | | | 1,450,000 | | | 1,420,898 |
Avon Community School Building Corp., Revenue Bond, AMBAC | | 4.750 | % | | 1/15/2032 | | Baa1 | | | 1,015,000 | | | 856,569 |
Frankfort High School Elementary School Building Corp., Revenue Bond, FSA | | 4.750 | % | | 7/15/2025 | | Aa3 | | | 1,500,000 | | | 1,440,975 |
La Porte County, G.O. Bond, FGRMB | | 5.200 | % | | 1/15/2018 | | A3 | | | 300,000 | | | 311,034 |
Noblesville Sewage Works, Revenue Bond, AMBAC | | 5.000 | % | | 1/1/2024 | | A1 | | | 550,000 | | | 540,326 |
North Lawrence Indiana Community Schools Building Corp., Revenue Bond, FSA | | 5.000 | % | | 7/15/2020 | | Aa3 | | | 450,000 | | | 462,956 |
Shelbyville Independent Central Renovation School Building Corp., Revenue Bond, MBIA | | 5.000 | % | | 7/15/2018 | | Baa1 | | | 3,000,000 | | | 3,192,900 |
| | | | | | | | | | | | | |
| | | | | | | | | | | | | 8,225,658 |
| | | | | | | | | | | | | |
Iowa - 1.9% | | | | | | | | | | | | | |
Indianola Community School District, G.O. Bond, FGRMB | | 5.200 | % | | 6/1/2021 | | A3 | | | 425,000 | | | 432,182 |
| | |
| 8 | | The accompanying notes are an integral part of the financial statements. |
Investment Portfolio - December 31, 2008
| | | | | | | | | | | | | | |
| | | Coupon
Rate | | | Maturity
Date | | Credit
Rating1
(unaudited) | | | Principal
Amount | | Value
(Note 2) |
| | | | | | | | | | | | | | |
| | | | | |
MUNICIPAL BONDS (continued) | | | | | | | | | | | | | | |
| | | | | |
Iowa (continued) | | | | | | | | | | | | | | |
Iowa City Community School District, G.O. Bond, FSA | | 4.000 | % | | 6/1/2018 | | Aa1 | | | $ | 425,000 | | $ | 427,210 |
Polk County, Series C, G.O. Bond | | 4.000 | % | | 6/1/2017 | | Aa1 | | | | 995,000 | | | 1,034,074 |
Polk County, Series C, G.O. Bond | | 4.125 | % | | 6/1/2025 | | Aa1 | | | | 2,075,000 | | | 1,883,851 |
| | | | | | | | | | | | | | |
| | | | | | | | | | | | | | 3,777,317 |
| | | | | | | | | | | | | | |
Kansas - 2.7% | | | | | | | | | | | | | | |
Johnson & Miami Counties Unified School District No. 230, G.O. Bond, FGRMB | | 4.000 | % | | 9/1/2022 | | A2 | | | | 1,000,000 | | | 859,130 |
Miami County Unified School District No. 416 Louisburg, G.O. Bond, MBIA | | 5.000 | % | | 9/1/2018 | | Baa1 | | | | 2,000,000 | | | 2,070,280 |
Sedgwick County Unified School District No. 265, G.O. Bond, FSA | | 5.000 | % | | 10/1/2025 | | Aa3 | | | | 1,090,000 | | | 1,106,950 |
Shawnee County Unified School District No. 450, Shawnee Heights, G.O. Bond, FSA | | 4.200 | % | | 9/1/2020 | | Aa3 | | | | 700,000 | | | 662,536 |
Shawnee County Unified School District No. 450, Shawnee Heights, G.O. Bond, FSA | | 4.250 | % | | 9/1/2021 | | Aa3 | | | | 580,000 | | | 538,014 |
Wyandotte County School District No. 204 Bonner Springs, Unrefunded Balance, Series A, G.O. Bond, FSA | | 5.375 | % | | 9/1/2015 | | Aa3 | | | | 110,000 | | | 114,593 |
| | | | | | | | | | | | | | |
| | | | | | | | | | | | | | 5,351,503 |
| | | | | | | | | | | | | | |
Kentucky - 0.8% | | | | | | | | | | | | | | |
Lexington-Fayette Urban County Government, Public Facilities Corp., Revenue Bond, MBIA | | 4.000 | % | | 10/1/2018 | | Aa3 | | | | 1,655,000 | | | 1,655,463 |
| | | | | | | | | | | | | | |
Louisiana - 1.1% | | | | | | | | | | | | | | |
Caddo Parish Parishwide School District, G.O. Bond, MBIA | | 4.350 | % | | 3/1/2026 | | Aa3 | | | | 660,000 | | | 583,988 |
Caddo Parish Parishwide School District, G.O. Bond, MBIA | | 4.375 | % | | 3/1/2027 | | Aa3 | | | | 1,090,000 | | | 956,333 |
New Orleans Sewage Service, Revenue Bond, FGIC | | 5.250 | % | | 6/1/2012 | | Ba2 | | | | 300,000 | | | 297,219 |
Orleans Parish Parishwide School District, Series A, G.O. Bond, FGIC | | 5.125 | % | | 9/1/2016 | | WR | 3 | | | 400,000 | | | 400,284 |
| | | | | | | | | | | | | | |
| | | | | | | | | | | | | | 2,237,824 |
| | | | | | | | | | | | | | |
Maine - 0.4% | | | | | | | | | | | | | | |
Kennebec Water District, Revenue Bond, FSA | | 5.125 | % | | 12/1/2021 | | Aa3 | | | | 750,000 | | | 751,305 |
| | | | | | | | | | | | | | |
Maryland - 1.8% | | | | | | | | | | | | | | |
Anne Arundel County, Water & Sewer, G.O. Bond | | 4.200 | % | | 3/1/2025 | | Aa1 | | | | 1,770,000 | | | 1,636,011 |
Anne Arundel County, Water & Sewer, G.O. Bond | | 4.125 | % | | 3/1/2024 | | Aa1 | | | | 345,000 | | | 321,012 |
| | |
| The accompanying notes are an integral part of the financial statements. | | 9 |
Investment Portfolio - December 31, 2008
| | | | | | | | | | | | | |
| | �� | Coupon
Rate | | | Maturity
Date | | Credit
Rating1
(unaudited) | | Principal
Amount | | Value
(Note 2) |
| | | | | | | | | | | | | |
| | | | | |
MUNICIPAL BONDS (continued) | | | | | | | | | | | | | |
| | | | | |
Maryland (continued) | | | | | | | | | | | | | |
Baltimore County, Metropolitan District, G.O. Bond | | 4.250 | % | | 9/1/2029 | | Aaa | | $ | 1,000,000 | | $ | 871,760 |
Maryland State, State & Local Facilities, G.O. Bond | | 4.250 | % | | 8/1/2021 | | Aaa | | | 750,000 | | | 755,880 |
| | | | | | | | | | | | | |
| | | | | | | | | | | | | 3,584,663 |
| | | | | | | | | | | | | |
Massachusetts - 2.8% | | | | | | | | | | | | | |
Boston, Series A, G.O. Bond, MBIA | | 4.125 | % | | 1/1/2021 | | Aa1 | | | 1,000,000 | | | 994,850 |
Boston, Series A, G.O. Bond, MBIA | | 4.125 | % | | 1/1/2022 | | Aa1 | | | 410,000 | | | 397,110 |
Cambridge, Series A, G.O. Bond | | 4.000 | % | | 2/1/2026 | | Aaa | | | 850,000 | | | 746,937 |
Cambridge, Series A, G.O. Bond | | 4.000 | % | | 2/1/2027 | | Aaa | | | 850,000 | | | 734,128 |
Lowell, State Qualified, G.O. Bond, AMBAC | | 5.000 | % | | 2/1/2020 | | Aa3 | | | 500,000 | | | 511,270 |
Massachusetts State, Series C, G.O. Bond, AMBAC | | 5.750 | % | | 8/1/2010 | | Aa2 | | | 400,000 | | | 425,124 |
Massachusetts State, Series D, G.O. Bond | | 5.250 | % | | 10/1/2014 | | Aa2 | | | 1,000,000 | | | 1,131,510 |
Plymouth, G.O. Bond, MBIA | | 5.250 | % | | 10/15/2020 | | Aa2 | | | 100,000 | | | 104,977 |
Richmond, G.O. Bond, MBIA | | 5.000 | % | | 4/15/2021 | | Aa3 | | | 400,000 | | | 404,804 |
| | | | | | | | | | | | | |
| | | | | | | | | | | | | 5,450,710 |
| | | | | | | | | | | | | |
Michigan - 5.0% | | | | | | | | | | | | | |
Bendle Public School District, School Building & Site, G.O. Bond, FGRMB | | 4.500 | % | | 5/1/2028 | | Aa3 | | | 640,000 | | | 563,661 |
Detroit City School District, School Building & Site Impt., Series B, G.O. Bond, FGIC | | 5.000 | % | | 5/1/2033 | | Aa3 | | | 750,000 | | | 684,052 |
Detroit Sewer Disposal System, Series B, Revenue Bond, FGRMB | | 4.625 | % | | 7/1/2034 | | A3 | | | 1,500,000 | | | 1,151,220 |
Detroit Water Supply System, Revenue Bond, MBIA | | 5.250 | % | | 7/1/2023 | | A3 | | | 2,000,000 | | | 1,940,780 |
Grand Rapids Public Schools, G.O. Bond, MBIA | | 4.125 | % | | 5/1/2023 | | Aa3 | | | 1,200,000 | | | 1,077,564 |
Holly Area School District, G.O. Bond, FGRMB | | 5.000 | % | | 5/1/2022 | | Aa3 | | | 500,000 | | | 500,345 |
Muskegon Public Schools, G.O. Bond, FSA | | 5.000 | % | | 5/1/2020 | | Aa3 | | | 1,000,000 | | | 1,028,670 |
Muskegon Water, Revenue Bond, FSA | | 4.750 | % | | 5/1/2019 | | Aa3 | | | 565,000 | | | 565,689 |
Saginaw City School District, School Building & Site, G.O. Bond, FSA | | 4.500 | % | | 5/1/2031 | | Aa3 | | | 1,695,000 | | | 1,406,850 |
St. Joseph County, Sewer Disposal Systems - Constantine, G.O. Bond, FSA | | 5.000 | % | | 4/1/2012 | | Aa3 | | | 100,000 | | | 100,763 |
Warren Woods Public Schools, School Building & Site, G.O. Bond, FSA | | 4.500 | % | | 5/1/2026 | | Aa3 | | | 1,015,000 | | | 926,827 |
| | | | | | | | | | | | | |
| | | | | | | | | | | | | 9,946,421 |
| | | | | | | | | | | | | |
Minnesota - 2.7% | | | | | | | | | | | | | |
Brooklyn Center Independent School District No. 286, School Building, Series A, G.O. Bond, MBIA | | 4.375 | % | | 2/1/2026 | | Aa2 | | | 1,105,000 | | | 927,217 |
| | |
| 10 | | The accompanying notes are an integral part of the financial statements. |
Investment Portfolio - December 31, 2008
| | | | | | | | | | | | | | |
| | | Coupon
Rate | | | Maturity
Date | | Credit
Rating1
(unaudited) | | | Principal
Amount | | Value
(Note 2) |
| | | | | | | | | | | | | | |
| | | | | |
MUNICIPAL BONDS (continued) | | | | | | | | | | | | | | |
| | | | | |
Minnesota (continued) | | | | | | | | | | | | | | |
Hennepin County, Series A, G.O. Bond | | 4.500 | % | | 12/1/2025 | | Aaa | | | $ | 1,500,000 | | $ | 1,475,685 |
Minnesota, G.O. Bond | | 5.000 | % | | 8/1/2013 | | Aa1 | | | | 2,000,000 | | | 2,221,900 |
Pine County, Series A, G.O. Bond, FGRMB | | 4.400 | % | | 2/1/2028 | | AAA | 2 | | | 555,000 | | | 481,379 |
Western Minnesota Municipal Power Agency, Revenue Bond | | 6.625 | % | | 1/1/2016 | | Aaa | | | | 175,000 | | | 204,859 |
| | | | | | | | | | | | | | |
| | | | | | | | | | | | | | 5,311,040 |
| | | | | | | | | | | | | | |
Mississippi - 0.8% | | | | | | | | | | | | | | |
Biloxi Public School District, Revenue Bond, MBIA | | 5.000 | % | | 4/1/2017 | | A3 | | | | 500,000 | | | 508,985 |
De Soto County School District, G.O. Bond, FSA | | 5.000 | % | | 2/1/2013 | | Aa3 | | | | 1,000,000 | | | 1,066,390 |
| | | | | | | | | | | | | | |
| | | | | | | | | | | | | | 1,575,375 |
| | | | | | | | | | | | | | |
Missouri - 1.4% | | | | | | | | | | | | | | |
Metropolitan St. Louis Sewer District Wastewater System, Series A, Revenue Bond, MBIA | | 3.600 | % | | 5/1/2013 | | Aa2 | | | | 600,000 | | | 620,112 |
Missouri Water Pollution Control, Series A, G.O. Bond | | 4.500 | % | | 12/1/2030 | | Aaa | | | | 2,375,000 | | | 2,181,105 |
| | | | | | | | | | | | | | |
| | | | | | | | | | | | | | 2,801,217 |
| | | | | | | | | | | | | | |
Nebraska - 1.1% | | | | | | | | | | | | | | |
Omaha Metropolitan Utilities District Water, Series A, Revenue Bond, FSA | | 4.375 | % | | 12/1/2031 | | Aa2 | | | | 2,640,000 | | | 2,195,477 |
| | | | | | | | | | | | | | |
Nevada - 4.2% | | | | | | | | | | | | | | |
Clark County Public Facilities, Unrefunded Balance, Series C, G.O. Bond, FGIC | | 5.000 | % | | 6/1/2024 | | Aa1 | | | | 110,000 | | | 110,031 |
Clark County Transportation, Series A, G.O. Bond, FGRMB | | 4.500 | % | | 12/1/2019 | | Aa1 | | | | 500,000 | | | 499,810 |
Clark County, G.O. Bond, FSA | | 4.750 | % | | 6/1/2027 | | Aa1 | | | | 3,000,000 | | | 2,709,180 |
Las Vegas Valley Water District, Water Impt., Series A, G.O. Bond, FSA | | 4.750 | % | | 6/1/2033 | | Aa1 | | | | 1,500,000 | | | 1,324,095 |
Nevada State, Project Nos. 66 & 67, Unrefunded Balance, Series A, G.O. Bond, FGIC | | 5.000 | % | | 5/15/2028 | | Aa1 | | | | 125,000 | | | 113,989 |
Nevada State, Capital Impt., G.O. Bond | | 5.000 | % | | 6/1/2019 | | Aa1 | | | | 2,040,000 | | | 2,184,962 |
North Las Vegas, G.O. Bond, MBIA | | 5.000 | % | | 5/1/2024 | | A1 | | | | 1,500,000 | | | 1,430,340 |
| | | | | | | | | | | | | | |
| | | | | | | | | | | | | | 8,372,407 |
| | | | | | | | | | | | | | |
New Jersey - 3.2% | | | | | | | | | | | | | | |
East Brunswick Township Board of Education, G.O. Bond, FSA | | 4.500 | % | | 11/1/2028 | | Aa2 | | | | 835,000 | | | 757,671 |
East Brunswick Township Board of Education, G.O. Bond, FSA | | 4.500 | % | | 11/1/2029 | | Aa2 | | | | 1,000,000 | | | 896,960 |
Essex County, Prerefunded Balance, Series A, G.O. Bond, MBIA | | 4.500 | % | | 5/1/2031 | | A1 | | | | 500,000 | | | 561,650 |
| | |
| The accompanying notes are an integral part of the financial statements. | | 11 |
Investment Portfolio - December 31, 2008
| | | | | | | | | | | | | | |
| | | Coupon
Rate | | | Maturity
Date | | Credit
Rating1
(unaudited) | | | Principal
Amount | | Value
(Note 2) |
| | | | | | | | | | | | | | |
| | | | | |
MUNICIPAL BONDS (continued) | | | | | | | | | | | | | | |
| | | | | |
New Jersey (continued) | | | | | | | | | | | | | | |
Hudson County, G.O. Bond, CIFG | | 4.250 | % | | 9/1/2021 | | A3 | | | $ | 930,000 | | $ | 890,856 |
Morris County Impt. Authority, School District, Morris Hills Regional District, Revenue Bond | | 3.700 | % | | 10/1/2018 | | Aaa | | | | 540,000 | | | 536,177 |
New Jersey Transportation Trust Fund Authority, Transportation System, Unrefunded Balance, Series A, Revenue Bond, FSA | | 4.250 | % | | 12/15/2022 | | Aa3 | | | | 2,000,000 | | | 1,844,120 |
Sparta Township School District, G.O. Bond, FSA | | 4.300 | % | | 2/15/2030 | | Aa2 | | | | 1,000,000 | | | 832,060 |
| | | | | | | | | | | | | | |
| | | | | | | | | | | | | | 6,319,494 |
| | | | | | | | | | | | | | |
New Mexico - 0.4% | | | | | | | | | | | | | | |
New Mexico Finance Authority, Public Project Revolving Fund, Series A, Revenue Bond, MBIA | | 3.250 | % | | 6/1/2013 | | Aa2 | | | | 785,000 | | | 800,810 |
| | | | | | | | | | | | | | |
New York - 5.0% | | | | | | | | | | | | | | |
Erie County, Public Impt., Series A, G.O. Bond, FGRMB | | 5.000 | % | | 9/1/2014 | | Baa2 | | | | 380,000 | | | 395,318 |
Hampton Bays Union Free School District, G.O. Bond, FSA | | 4.375 | % | | 9/15/2029 | | Aa3 | | | | 2,225,000 | | | 1,917,705 |
Mount Morris Central School District, G.O. Bond, FGRMB | | 4.125 | % | | 6/15/2014 | | A2 | | | | 1,290,000 | | | 1,374,353 |
New York City Municipal Water Finance Authority, Series A, Revenue Bond | | 5.750 | % | | 6/15/2040 | | Aa2 | | | | 2,590,000 | | | 2,648,275 |
New York City Municipal Water Finance Authority, Series E, Revenue Bond, FGRMB | | 5.000 | % | | 6/15/2026 | | Aa2 | | | | 750,000 | | | 732,907 |
New York State Urban Development Corp., Series B, Revenue Bond, MBIA | | 5.000 | % | | 1/1/2019 | | AA | 2 | | | 1,000,000 | | | 1,061,160 |
Sachem Central School District of Holbrook, G.O. Bond, FGRMB | | 4.375 | % | | 10/15/2030 | | AA | 2 | | | 2,000,000 | | | 1,684,780 |
Westchester County, Unrefunded Balance, G.O. Bond | | 4.750 | % | | 11/15/2016 | | Aaa | | | | 120,000 | | | 120,148 |
| | | | | | | | | | | | | | |
| | | | | | | | | | | | | | 9,934,646 |
| | | | | | | | | | | | | | |
North Carolina - 2.1% | | | | | | | | | | | | | | |
Cary, G.O. Bond | | 5.000 | % | | 3/1/2018 | | Aaa | | | | 700,000 | | | 737,030 |
Mecklenburg County, Public Impt., Series A, G.O. Bond | | 4.125 | % | | 2/1/2022 | | Aaa | | | | 1,455,000 | | | 1,411,394 |
North Carolina Grant Anticipation , Revenue Bond, MBIA | | 4.000 | % | | 3/1/2018 | | Aa3 | | | | 1,355,000 | | | 1,369,160 |
Raleigh, G.O. Bond | | 4.400 | % | | 6/1/2017 | | Aaa | | | | 250,000 | | | 256,215 |
Wilson, G.O. Bond, AMBAC | | 5.100 | % | | 6/1/2019 | | A1 | | | | 400,000 | | | 411,368 |
| | | | | | | | | | | | | | |
| | | | | | | | | | | | | | 4,185,167 |
| | | | | | | | | | | | | | |
North Dakota - 0.8% | | | | | | | | | | | | | | |
Fargo, Series A, G.O. Bond, MBIA | | 4.700 | % | | 5/1/2030 | | Aa2 | | | | 1,840,000 | | | 1,644,868 |
| | | | | | | | | | | | | | |
| | |
| 12 | | The accompanying notes are an integral part of the financial statements. |
Investment Portfolio - December 31, 2008
| | | | | | | | | | | | | | |
| | | Coupon
Rate | | | Maturity
Date | | Credit
Rating1
(unaudited) | | | Principal
Amount | | Value
(Note 2) |
| | | | | | | | | | | | | | |
| | | | | |
MUNICIPAL BONDS (continued) | | | | | | | | | | | | | | |
| | | | | |
Ohio - 4.6% | | | | | | | | | | | | | | |
Brookville Local School District, School Impt., G.O. Bond, FSA | | 4.125 | % | | 12/1/2026 | | Aa3 | | | $ | 660,000 | | $ | 540,619 |
Cleveland, Various Purposes, G.O. Bond, MBIA | | 5.000 | % | | 12/1/2012 | | A2 | | | | 1,140,000 | | | 1,234,506 |
Columbus, Limited Tax, Series 2, G.O. Bond | | 5.000 | % | | 7/1/2017 | | Aaa | | | | 1,000,000 | | | 1,081,990 |
Columbus City School District, Facilities Construction & Impt., G.O. Bond, FSA | | 4.375 | % | | 12/1/2032 | | Aa3 | | | | 1,000,000 | | | 860,210 |
Licking Heights Local School District, School Facilities Construction & Impt., Series A, G.O. Bond, MBIA | | 5.000 | % | | 12/1/2022 | | A1 | | | | 1,450,000 | | | 1,464,993 |
Newark City School District, School Impt., G.O. Bond, FGRMB | | 4.250 | % | | 12/1/2027 | | A3 | | | | 500,000 | | | 400,165 |
Ohio State Conservation Project, Series A, G.O. Bond | | 5.000 | % | | 3/1/2015 | | Aa1 | | | | 1,000,000 | | | 1,102,780 |
Pickerington Local School District, School Facilities Construction & Impt., G.O. Bond, MBIA | | 4.250 | % | | 12/1/2034 | | A1 | | | | 2,500,000 | | | 2,059,000 |
Springfield City School District, Prerefunded Balance, G.O. Bond, FGIC | | 5.200 | % | | 12/1/2023 | | Baa1 | | | | 325,000 | | | 363,516 |
| | | | | | | | | | | | | | |
| | | | | | | | | | | | | | 9,107,779 |
| | | | | | | | | | | | | | |
Oklahoma - 1.0% | | | | | | | | | | | | | | |
Oklahoma City, G.O. Bond, MBIA | | 4.250 | % | | 3/1/2023 | | Aa1 | | | | 2,000,000 | | | 1,876,200 |
| | | | | | | | | | | | | | |
Oregon - 2.5% | | | | | | | | | | | | | | |
Metro, G.O. Bond | | 5.000 | % | | 6/1/2022 | | Aaa | | | | 3,000,000 | | | 3,144,930 |
Salem Water & Sewer , Revenue Bond, FSA | | 5.000 | % | | 5/1/2014 | | Aa3 | | | | 1,120,000 | | | 1,248,117 |
Washington County School District No. 015 Forest Grove, Prerefunded Balance, G.O. Bond, FSA | | 5.500 | % | | 6/15/2017 | | Aa2 | | | | 500,000 | | | 547,615 |
| | | | | | | | | | | | | | |
| | | | | | | | | | | | | | 4,940,662 |
| | | | | | | | | | | | | | |
Pennsylvania - 2.3% | | | | | | | | | | | | | | |
Jenkintown School District, Series A, G.O. Bond, FGRMB | | 4.500 | % | | 5/15/2032 | | AA | 2 | | | 1,000,000 | | | 807,140 |
Lancaster School District, G.O. Bond, FSA | | 5.000 | % | | 6/1/2019 | | Aa3 | | | | 1,200,000 | | | 1,260,228 |
Pennsylvania State Turnpike Commission, Prerefunded Balance, Revenue Bond, AMBAC | | 5.375 | % | | 7/15/2019 | | A1 | | | | 530,000 | | | 583,440 |
Philadelphia, Water & Wastewater, Revenue Bond, MBIA | | 5.600 | % | | 8/1/2018 | | A3 | | | | 20,000 | | | 22,450 |
Plum Boro School District, Series A, G.O. Bond, FGRMB | | 4.500 | % | | 9/15/2030 | | AA | 2 | | | 855,000 | | | 705,024 |
Uniontown Area School District, G.O. Bond, FSA | | 4.350 | % | | 10/1/2034 | | Aa3 | | | | 1,500,000 | | | 1,176,405 |
| | | | | | | | | | | | | | |
| | | | | | | | | | | | | | 4,554,687 |
| | | | | | | | | | | | | | |
Rhode Island - 0.4% | | | | | | | | | | | | | | |
Rhode Island Clean Water Finance Agency, Series A, Revenue Bond, MBIA | | 5.000 | % | | 10/1/2035 | | Baa1 | | | | 1,000,000 | | | 732,950 |
| | | | | | | | | | | | | | |
| | |
| The accompanying notes are an integral part of the financial statements. | | 13 |
Investment Portfolio - December 31, 2008
| | | | | | | | | | | | | | |
| | | Coupon
Rate | | | Maturity
Date | | Credit
Rating1
(unaudited) | | | Principal
Amount | | Value
(Note 2) |
| | | | | | | | | | | | | | |
| | | | | |
MUNICIPAL BONDS (continued) | | | | | | | | | | | | | | |
| | | | | |
South Carolina - 2.3% | | | | | | | | | | | | | | |
Beaufort County, G.O. Bond, MBIA | | 4.250 | % | | 3/1/2024 | | Aa2 | | | $ | 790,000 | | $ | 724,880 |
Charleston County, Transportation Sales Tax, G.O. Bond | | 5.000 | % | | 11/1/2017 | | Aa1 | | | | 1,000,000 | | | 1,088,970 |
South Carolina, State Institutional—South Carolina State University, Series D, G.O. Bond | | 4.250 | % | | 10/1/2026 | | Aaa | | | | 1,250,000 | | | 1,139,488 |
South Carolina, Transportation Infrastructure Bank, Series B, Revenue Bond, AMBAC | | 4.250 | % | | 10/1/2027 | | A1 | | | | 2,000,000 | | | 1,587,020 |
| | | | | | | | | | | | | | |
| | | | | | | | | | | | | | 4,540,358 |
| | | | | | | | | | | | | | |
Texas - 6.8% | | | | | | | | | | | | | | |
Alamo Community College District, Series A, G.O. Bond, MBIA | | 5.000 | % | | 8/15/2024 | | Aa2 | | | | 1,020,000 | | | 1,024,947 |
Alvin Independent School District, G.O. Bond | | 4.375 | % | | 2/15/2024 | | Aaa | | | | 750,000 | | | 707,482 |
Brazos River Authority, Series B, Revenue Bond, FGIC | | 4.250 | % | | 12/1/2017 | | Baa2 | | | | 1,125,000 | | | 817,087 |
Canyon Independent School District, School Building, G.O. Bond | | 4.700 | % | | 2/15/2025 | | AAA | 2 | | | 1,440,000 | | | 1,415,160 |
Clear Creek Independent School District, G.O. Bond, FSA | | 4.000 | % | | 2/15/2029 | | Aa3 | | | | 2,340,000 | | | 1,897,202 |
Del Valle Independent School District, School Building, G.O. Bond | | 5.000 | % | | 6/15/2019 | | AAA | 2 | | | 1,845,000 | | | 1,975,054 |
Fort Bend County, G.O. Bond, MBIA | | 4.750 | % | | 3/1/2031 | | Aa2 | | | | 1,000,000 | | | 904,530 |
Huntsville Independent School District, G.O. Bond | | 4.500 | % | | 2/15/2029 | | Aaa | | | | 1,220,000 | | | 1,102,294 |
McKinney Waterworks & Sewer, Revenue Bond, FGRMB | | 4.750 | % | | 3/15/2024 | | Aa3 | | | | 1,000,000 | | | 966,910 |
San Antonio Water, Revenue Bond, FGRMB | | 4.375 | % | | 5/15/2029 | | Aa2 | | | | 1,400,000 | | | 1,175,664 |
University of Texas Financing System, Series F, Revenue Bond | | 4.750 | % | | 8/15/2028 | | Aaa | | | | 1,000,000 | | | 970,130 |
Waller Consolidated Independent School District, G.O. Bond | | 4.750 | % | | 2/15/2023 | | Aaa | | | | 500,000 | | | 501,535 |
| | | | | | | | | | | | | | |
| | | | | | | | | | | | | | 13,457,995 |
| | | | | | | | | | | | | | |
Utah - 1.6% | | | | | | | | | | | | | | |
Mountain Regional Water Special Service District, Revenue Bond, MBIA | | 5.000 | % | | 12/15/2030 | | Baa1 | | | | 1,240,000 | | | 951,340 |
Provo City School District, Series B, G.O. Bond | | 4.000 | % | | 6/15/2014 | | Aaa | | | | 1,100,000 | | | 1,171,335 |
St. George, Parks and Recreation, G.O. Bond, AMBAC | | 4.000 | % | | 8/1/2019 | | Aa3 | | | | 795,000 | | | 774,139 |
Utah State Building Ownership Authority, Series C, Revenue Bond, FSA | | 5.500 | % | | 5/15/2011 | | Aa1 | | | | 300,000 | | | 322,002 |
| | | | | | | | | | | | | | |
| | | | | | | | | | | | | | 3,218,816 |
| | | | | | | | | | | | | | |
| | |
| 14 | | The accompanying notes are an integral part of the financial statements. |
Investment Portfolio - December 31, 2008
| | | | | | | | | | | | | | |
| | | Coupon
Rate | | | Maturity
Date | | Credit
Rating1
(unaudited) | | | Principal
Amount | | Value
(Note 2) |
| | | | | | | | | | | | | | |
| | | | | |
MUNICIPAL BONDS (continued) | | | | | | | | | | | | | | |
| | | | | |
Vermont - 0.5% | | | | | | | | | | | | | | |
Vermont, Series D, G.O. Bond | | 4.500 | % | | 7/15/2025 | | Aaa | | | $ | 1,000,000 | | $ | 982,240 |
| | | | | | | | | | | | | | |
Virginia - 3.4% | | | | | | | | | | | | | | |
Fairfax County, Public Impt., Series A, G.O. Bond | | 4.000 | % | | 4/1/2017 | | Aaa | | | | 2,000,000 | | | 2,098,940 |
Fairfax County, Public Impt., Series A, G.O. Bond | | 4.250 | % | | 4/1/2027 | | Aaa | | | | 1,500,000 | | | 1,339,755 |
Norfolk, Capital Impt., G.O. Bond, MBIA | | 4.375 | % | | 3/1/2024 | | A1 | | | | 685,000 | | | 631,241 |
Norfolk, Capital Impt., G.O. Bond, FGRMB | | 4.250 | % | | 10/1/2024 | | A1 | | | | 2,500,000 | | | 2,236,400 |
Richmond, Series B, G.O. Bond, FSA | | 4.750 | % | | 7/15/2023 | | Aa3 | | | | 400,000 | | | 405,596 |
| | | | | | | | | | | | | | |
| | | | | | | | | | | | | | 6,711,932 |
| | | | | | | | | | | | | | |
Washington - 5.0% | | | | | | | | | | | | | | |
Franklin County, G.O. Bond, FGRMB | | 5.125 | % | | 12/1/2022 | | AA | 2 | | | 1,000,000 | | | 1,001,890 |
King County Sewer, G.O. Bond, FGRMB | | 5.000 | % | | 1/1/2035 | | Aa1 | | | | 1,255,000 | | | 1,172,032 |
King County School District No. 411 Issaquah, Series A, G.O. Bond, FSA | | 5.250 | % | | 12/1/2018 | | Aa1 | | | | 2,420,000 | | | 2,591,820 |
King County Sewer, Revenue Bond, FSA | | 5.000 | % | | 1/1/2024 | | Aa3 | | | | 1,460,000 | | | 1,469,037 |
King County Sewer, Series A, Revenue Bond, MBIA | | 4.500 | % | | 1/1/2032 | | Aa3 | | | | 1,070,000 | | | 906,579 |
Seattle, Drain & Wastewater, Revenue Bond, MBIA | | 4.375 | % | | 2/1/2026 | | Aa2 | | | | 2,000,000 | | | 1,781,280 |
Washington State, Motor Vehicle Fuel Tax, G.O. Bond, AMBAC | | 5.000 | % | | 1/1/2025 | | Aa1 | | | | 1,000,000 | | | 1,011,830 |
| | | | | | | | | | | | | | |
| | | | | | | | | | | | | | 9,934,468 |
| | | | | | | | | | | | | | |
West Virginia - 0.3% | | | | | | | | | | | | | | |
West Virginia State Water Development Authority, Series A, Revenue Bond, FGRMB | | 4.250 | % | | 11/1/2026 | | AA | 2 | | | 820,000 | | | 672,556 |
| | | | | | | | | | | | | | |
Wisconsin - 2.6% | | | | | | | | | | | | | | |
Central Brown County Water Authority, Water Systems, Revenue Bond, AMBAC | | 5.000 | % | | 12/1/2035 | | Baa1 | | | | 1,500,000 | | | 1,313,475 |
Eau Claire, Series B, G.O. Bond, MBIA | | 4.000 | % | | 4/1/2015 | | Aa2 | | | | 1,195,000 | | | 1,272,424 |
Kenosha, Series B, G.O. Bond, FSA | | 5.000 | % | | 9/1/2011 | | Aa3 | | | | 765,000 | | | 816,936 |
Oshkosh, Corporate Purposes, Series A, G.O. Bond, FGRMB | | 5.050 | % | | 12/1/2021 | | Aa3 | | | | 450,000 | | | 456,431 |
Stoughton Area School District, G.O. Bond, FGRMB | | 4.875 | % | | 4/1/2016 | | A1 | | | | 500,000 | | | 516,315 |
Wisconsin State Transportation, Series A, Revenue Bond, FSA | | 5.000 | % | | 7/1/2025 | | Aa3 | | | | 700,000 | | | 700,574 |
| | | | | | | | | | | | | | |
| | | | | | | | | | | | | | 5,076,155 |
| | | | | | | | | | | | | | |
TOTAL MUNICIPAL BONDS
(Identified Cost $206,499,450) | | | | | | | | | | | | | | 194,214,902 |
| | | | | | | | | | | | | | |
| | |
| The accompanying notes are an integral part of the financial statements. | | 15 |
Investment Portfolio - December 31, 2008
| | | | | | | | | | | |
| | | | | | | | | Shares | | Value
(Note 2) |
| | | | | | | | | | | |
| | | | | |
SHORT-TERM INVESTMENTS - 0.7% | | | | | | | | | | | |
Dreyfus AMT - Free Municipal Reserves - Class R (Identified Cost $1,295,127) | | | | | | | | 1,295,127 | | $ | 1,295,127 |
| | | | | | | | | | | |
TOTAL INVESTMENTS - 98.9%
(Identified Cost $207,794,577) | | | | | | | | | | | 195,510,029 |
| | | | | |
OTHER ASSETS, LESS LIABILITIES - 1.1% | | | | | | | | | | | 2,225,546 |
| | | | | | | | | | | |
NET ASSETS - 100% | | | | | | | | | | $ | 197,735,575 |
| | | | | | | | | | | |
Key:
G.O. Bond - General Obligation Bond
Impt. - Improvement
No. - Number
Scheduled principal and interest payments are guaranteed by:
AMBAC (AMBAC Assurance Corp.)
CIFG (CIFG North America, Inc.)
FGIC (Financial Guaranty Insurance Co.)
FGRMB (FGIC reinsured by MBIA)
FSA (Financial Security Assurance)
MBIA (MBIA, Inc.)
The insurance does not guarantee the market value of the municipal bonds.
1Credit ratings from Moody’s (unaudited).
2Credit ratings from S&P (unaudited).
3Credit rating has been withdrawn. As of December 31, 2008, there is no rating available.
The Series’ portfolio holds, as a percentage of net assets, greater than 10% in bonds insured by the following companies: MBIA - 36.7%; FSA - 22.3%; FGIC - 12.2%.
| | |
| 16 | | The accompanying notes are an integral part of the financial statements. |
Statement of Assets and Liabilities
December 31, 2008
| | | | |
ASSETS: | | | | |
| | | | |
| |
Investments, at value (identified cost $207,794,577) (Note 2) | | $ | 195,510,029 | |
Interest receivable | | | 2,564,713 | |
Receivable for fund shares sold | | | 134,635 | |
Dividends receivable | | | 527 | |
| | | | |
TOTAL ASSETS | | | 198,209,904 | |
| | | | |
| LIABILITIES: | | | | |
| |
Accrued management fees (Note 3) | | | 81,974 | |
Accrued fund accounting and transfer agent fees (Note 3) | | | 12,544 | |
Accrued Chief Compliance Officer service fees (Note 3) | | | 477 | |
Payable for fund shares repurchased | | | 343,008 | |
Audit fees payable | | | 29,656 | |
Other payables and accrued expenses | | | 6,670 | |
| | | | |
TOTAL LIABILITIES | | | 474,329 | |
| | | | |
TOTAL NET ASSETS | | $ | 197,735,575 | |
| | | | |
NET ASSETS CONSIST OF: | | | | |
| |
Capital stock | | $ | 191,311 | |
Additional paid-in-capital | | | 207,269,150 | |
Undistributed net investment income | | | 2,267,915 | |
Accumulated net realized gain on investments | | | 291,747 | |
Net unrealized depreciation on investments | | | (12,284,548 | ) |
| | | | |
TOTAL NET ASSETS | | $ | 197,735,575 | |
| | | | |
NET ASSET VALUE, OFFERING PRICE AND REDEMPTION PRICE PER SHARE ($197,735,575/19,131,125 shares) | | $ | 10.34 | |
| | | | |
| | |
| The accompanying notes are an integral part of the financial statements. | | 17 |
Statement of Operations
For the Year Ended December 31, 2008
| | | | |
INVESTMENT INCOME: | | | | |
| | | | |
| |
Interest | | $ | 9,687,886 | |
Dividends | | | 113,329 | |
| | | | |
Total Investment Income | | | 9,801,215 | |
| | | | |
| EXPENSES: | | | | |
| |
Management fees (Note 3) | | | 1,122,722 | |
Fund accounting and transfer agent fees (Note 3) | | | 162,718 | |
Directors’ fees (Note 3) | | | 12,599 | |
Chief Compliance Officer service fees (Note 3) | | | 4,301 | |
Custodian fees | | | 13,000 | |
Miscellaneous | | | 63,747 | |
| | | | |
Total Expenses | | | 1,379,087 | |
| | | | |
NET INVESTMENT INCOME | | | 8,422,128 | |
| | | | |
| REALIZED AND UNREALIZED GAIN (LOSS) ON INVESTMENTS: | | | | |
| |
Net realized gain on investments | | | 670,931 | |
Net change in unrealized appreciation (depreciation) on investments | | | (14,523,593 | ) |
| | | | |
| |
NET REALIZED AND UNREALIZED GAIN (LOSS) ON INVESTMENTS | | | (13,852,662 | ) |
| | | | |
NET DECREASE IN NET ASSETS RESULTING FROM OPERATIONS | | $ | (5,430,534 | ) |
| | | | |
| | |
| 18 | | The accompanying notes are an integral part of the financial statements. |
Statements of Changes in Net Assets
| | | | | | | | |
| | | | | | | | |
| | | For the
Year Ended
12/31/08 | | | For the
Year Ended
12/31/07 | |
| INCREASE (DECREASE) IN NET ASSETS: | | | | | | | | |
| | |
| OPERATIONS: | | | | | | | | |
| | |
Net investment income | | $ | 8,422,128 | | | $ | 7,527,019 | |
Net realized gain on investments | | | 670,931 | | | | 90,824 | |
Net change in unrealized appreciation (depreciation) on investments | | | (14,523,593 | ) | | | (603,383 | ) |
| | | | | | | | |
Net increase (decrease) from operations | | | (5,430,534 | ) | | | 7,014,460 | |
| | | | | | | | |
| DISTRIBUTIONS TO SHAREHOLDERS (Note 7): | | | | | | | | |
| | |
From net investment income | | | (7,556,016 | ) | | | (7,219,804 | ) |
From net realized gain on investments | | | (368,882 | ) | | | (66,160 | ) |
| | | | | | | | |
Total distributions to shareholders | | | (7,924,898 | ) | | | (7,285,964 | ) |
| | | | | | | | |
| CAPITAL STOCK ISSUED AND REPURCHASED: | | | | | | | | |
| | |
Net increase (decrease) from capital share transactions (Note 5) | | | (24,617,544 | ) | | | 68,291,443 | |
| | | | | | | | |
Net increase (decrease) in net assets | | | (37,972,976 | ) | | | 68,019,939 | |
| | |
| NET ASSETS: | | | | | | | | |
| | |
Beginning of year | | | 235,708,551 | | | | 167,688,612 | |
| | | | | | | | |
End of year (including undistributed net investment income of $2,267,915 and $1,366,837, respectively) | | $ | 197,735,575 | | | $ | 235,708,551 | |
| | | | | | | | |
| | |
| The accompanying notes are an integral part of the financial statements. | | 19 |
Financial Highlights
| | | | | | | | | | |
| | | For the Years Ended |
| | | 12/31/08 | | 12/31/07 | | 12/31/06 | | 12/31/05 | | 12/31/04 |
| | | | | | | | | | |
| | | | | | | | | | |
| Per share data (for a share outstanding throughout each year): | | | | | | | | | | |
Net asset value - Beginning of year | | $10.92 | | $10.95 | | $10.90 | | $10.99 | | $11.04 |
| | | | | | | | | | |
Income (loss) from investment operations: | | | | | | | | | | |
Net investment income | | 0.42 | | 0.36 | | 0.37 | | 0.37 | | 0.37 |
Net realized and unrealized gain (loss) on
investments | | (0.62) | | (0.02) | | 0.05 | | (0.09) | | 0.04 |
| | | | | | | | | | |
Total from investment operations | | (0.20) | | 0.34 | | 0.42 | | 0.28 | | 0.41 |
| | | | | | | | | | |
| | | | | |
Less distributions to shareholders: | | | | | | | | | | |
From net investment income | | (0.36) | | (0.37) | | (0.36) | | (0.36) | | (0.45) |
From net realized gain on investments | | (0.02) | | —2 | | (0.01) | | (0.01) | | (0.01) |
| | | | | | | | | | |
Total distributions to shareholders | | (0.38) | | (0.37) | | (0.37) | | (0.37) | | (0.46) |
| | | | | | | | | | |
Net asset value - End of year | | $10.34 | | $10.92 | | $10.95 | | $10.90 | | $10.99 |
| | | | | | | | | | |
Net assets - End of year
(000’s omitted) | | $197,736 | | $235,709 | | $167,689 | | $112,965 | | $86,441 |
| | | | | | | | | | |
Total return1 | | (1.79%) | | 3.20% | | 3.94% | | 2.60% | | 3.80% |
Ratios (to average net assets)/
Supplemental Data: | | | | | | | | | | |
Expenses | | 0.61% | | 0.62% | | 0.66% | | 0.71% | | 0.77% |
Net investment income | | 3.75% | | 3.65% | | 3.71% | | 3.58% | | 3.63% |
Portfolio turnover | | 7% | | 3% | | 5% | | 2% | | 5% |
1Represents aggregate total return for the year indicated, and assumes reinvestment of all distributions.
2Less than $0.01 per share.
| | |
| 20 | | The accompanying notes are an integral part of the financial statements. |
Notes to Financial Statements
Diversified Tax Exempt Series (the “Series”) is a no-load diversified series of Manning & Napier Fund, Inc. (the “Fund”). The Fund is organized in Maryland and is registered under the Investment Company Act of 1940, as amended, as an open-end management investment company.
The Series’ investment objective is to provide as high a level of current income exempt from federal income tax as the Advisor believes is consistent with the preservation of capital.
The Fund’s Advisor is Manning & Napier Advisors, Inc. (the “Advisor”). Shares of the Series are offered to investors, clients and employees of the Advisor and its affiliates. The total authorized capital stock of the Fund consists of 5.0 billion shares of common stock each having a par value of $0.01. As of December 31, 2008, 4.5 billion shares have been designated in total among 28 series, of which 100 million have been designated as Diversified Tax Exempt Series Class A common stock.
| 2. | SIGNIFICANT ACCOUNTING POLICIES |
Security Valuation
Municipal securities will normally be valued on the basis of market valuations provided by an independent pricing service (the “Service”). The Service utilizes the latest price quotations and a matrix system (which considers such factors as security prices of similar securities, yields, maturities and ratings). The Service has been approved by the Fund’s Board of Directors (the “Board”).
Securities for which representative valuations or prices are not available from the Fund’s pricing service may be valued at fair value. Due to the inherent uncertainty of valuations of such securities, the fair value may differ significantly from the values that would have been used had a ready market for such securities existed. Fair value is determined in good faith by the Advisor under procedures approved by and under the general supervision and responsibility of the Fund’s Board.
Short-term investments that mature in sixty days or less are valued at amortized cost, which approximates market value. Investments in open-end investment companies are valued at their net asset value per share on valuation date.
In September 2006, FASB Statement of Financial Accounting Standards No. 157, Fair Value Measurements (“FAS 157”) was issued, effective for fiscal years beginning after November 15, 2007. This standard clarifies the definition of fair value for financial reporting, establishes a framework for measuring fair value and requires additional disclosures about the use of fair value measurements. FAS 157 became effective for the Series as of January 1, 2008, the beginning of its current fiscal year. The three levels of the fair value hierarchy under FAS 157 are described below:
Level 1 - quoted prices in active markets for identical securities
Level 2 - other significant observable inputs (including quoted prices for similar securities, interest rates, prepayment speeds, credit risk, etc.)
Level 3 - significant unobservable inputs (including the Series’ own assumptions in determining the fair value of investments.)
Notes to Financial Statements
| 2. | SIGNIFICANT ACCOUNTING POLICIES (continued) |
Security Valuation (continued)
The inputs or methodology used for valuing securities are not necessarily an indication of the risk associated with investing in those securities. The following is a summary of the inputs used to value the Series’ assets as of December 31, 2008:
| | | | | | |
Valuation Inputs | | Investments In
Securities | | Other Financial
Instruments* |
| | | | | | |
Level 1 - Quoted Prices | | $ | 1,295,127 | | $ | — |
Level 2 - Other Significant Observable Inputs | | | 194,214,902 | | | — |
Level 3 - Significant Unobservable Inputs | | | — | | | — |
| | | | | | |
Total | | $ | 195,510,029 | | $ | — |
| | | | | | |
*Other financial instruments are derivative instruments not reflected in the Investment Portfolio, such as futures, forwards and swap contracts, which are valued at the unrealized appreciation/depreciation on the instrument. As of December 31, 2008, the Series did not hold any derivative instruments.
There were no Level 3 securities held by the Series as of December 31, 2007 or December 31, 2008.
Security Transactions, Investment Income and Expenses
Security transactions are accounted for on trade date. Interest income, including amortization of premium and accretion of discounts using the effective interest method, is earned from settlement date and accrued daily. Dividend income is recorded on an accrual basis on ex-dividend date.
Expenses are recorded on an accrual basis. Most expenses of the Fund can be attributed to a specific series. Expenses which cannot be directly attributed are apportioned among the series in the Fund in such a manner as deemed equitable by the Fund’s Board, taking into consideration, among other things, the nature and type of expense.
The Series uses the identified cost method for determining realized gain or loss on investments for both financial statement and federal income tax reporting purposes.
Federal Taxes
The Series’ policy is to comply with the provisions of the Internal Revenue Code applicable to regulated investment companies. The Series is not subject to federal income tax or excise tax to the extent that the Series distributes to shareholders each year its taxable income, including any net realized gains on investments, in accordance with requirements of the Internal Revenue Code. Accordingly, no provision for federal income tax or excise tax has been made in the financial statements.
On June 29, 2007, the Series adopted Financial Accounting Standards Board Interpretation No. 48 - Accounting for Uncertainty in Income Taxes (“FIN 48”). FIN 48 prescribes the minimum recognition threshold a tax position must meet in connection with accounting for uncertainties in income tax positions taken or expected to be taken by an entity before being measured and recognized in the financial statements. Management has determined that the adoption of FIN 48 did not have a material impact on the Series’ financial statements. The Series files income tax returns in the U.S. federal jurisdiction and various states, as required. No income tax returns are currently under investigation. The statute of limitations on the Series’ tax returns remains open for the years ended December 31, 2005 through December 31, 2008.
Notes to Financial Statements
| 2. | SIGNIFICANT ACCOUNTING POLICIES (continued) |
Distributions of Income and Gains
Distributions to shareholders of net investment income are made quarterly. Distributions of net realized gains are made annually. An additional distribution may be necessary to avoid taxation of the Series. Distributions are recorded on the ex-dividend date.
Indemnifications
The Fund’s organizational documents provide former and current directors and officers with a limited indemnification against liabilities arising in connection with the performance of their duties to the Fund. In the normal course of business, the Fund may also enter into contracts that provide general indemnifications. The Fund’s maximum exposure under these arrangements is unknown as this would be dependent on future claims that may be made against the Fund. The risk of material loss from such claims is considered remote.
Other
The preparation of financial statements in conformity with accounting principles generally accepted in the United States of America requires management to make estimates and assumptions that affect the reported amounts of assets and liabilities and the disclosure of contingent assets and liabilities at the date of the financial statements and the reported amounts of income and expenses during the reporting period. Actual results could differ from those estimates.
| 3. | TRANSACTIONS WITH AFFILIATES |
The Fund has an Investment Advisory Agreement (the “Agreement”) with the Advisor, for which the Series pays a fee, computed daily and payable monthly, at an annual rate of 0.50% of the Series’ average daily net assets.
Under the Agreement, personnel of the Advisor provide the Series with advice and assistance in the choice of investments and the execution of securities transactions, and otherwise maintain the Series’ organization. The Advisor also provides the Fund with necessary office space and fund administration and support services. The salaries of all officers of the Fund (except a percentage of the Fund’s Chief Compliance Officer’s salary, which is paid by the Fund), and of all Directors who are “affiliated persons” of the Fund, or of the Advisor, and all personnel of the Fund, or of the Advisor, performing services relating to research, statistical and investment activities, are paid by the Advisor. Each “non-affiliated” Director receives an annual stipend, which is allocated among all the active series of the Fund. In addition, these Directors also receive a fee per Board meeting attended for each active series of the Fund plus a fee for each committee meeting attended.
The Advisor has contractually agreed, until at least April 30, 2010, to waive its fee and, if necessary, pay other operating expenses of the Series in order to maintain total direct annual fund operating expenses for the Series at no more than 0.85% of average daily net assets each year. For the year ended December 31, 2008, the Advisor did not waive its management fee or reimburse any expenses of the Series. The Advisor is not eligible to recoup any expenses that have been waived or reimbursed in prior years.
Manning & Napier Investor Services, Inc., a registered broker-dealer affiliate of the Advisor, acts as distributor for the Fund’s shares. The services of Manning & Napier Investor Services, Inc. are provided at no additional cost to the Series.
Notes to Financial Statements
| 3. | TRANSACTIONS WITH AFFILIATES (continued) |
For fund accounting and transfer agent services, through October 31, 2008, the Fund paid the Advisor an annual fee of 0.11% of the Fund’s average daily net assets up to $900 million, 0.07% of the Fund’s average daily net assets between $900 million and $1.5 billion, and 0.04% of the Fund’s average daily net assets over $1.5 billion. Effective November 1, 2008, the fee rates are as follows: 0.055% of the Fund’s average daily net assets up to $4.5 billion, 0.03% of the Fund’s average daily net assets between $4.5 billion and $7.5 billion, and 0.02% of the Fund’s average daily net assets over $7.5 billion. Additionally, certain transaction and account-based fees and out-of-pocket expenses, including charges for reporting relating to the Fund’s compliance program, are charged. Expenses not directly attributable to a series are allocated based on each series’ relative net assets or number of accounts, depending on the expense. The Advisor has an agreement with Citi Fund Services Ohio, Inc. (“Citi”) under which Citi serves as sub-accountant and sub-transfer agent.
| 4. | PURCHASES AND SALES OF SECURITIES |
For the year ended December 31, 2008, purchases and sales of securities, other than United States Government securities and short-term securities, were $14,251,012 and $32,105,875, respectively. There were no purchases or sales of United States Government securities.
| 5. | CAPITAL STOCK TRANSACTIONS |
Transactions in shares of Diversified Tax Exempt Series were:
| | | | | | | | | | | | | | |
| | | For the Year
Ended 12/31/08 | | | For the Year
Ended 12/31/07 | |
| | | Shares | | | Amount | | | Shares | | | Amount | |
| | | | | | | | | | | | | | |
Sold | | 3,614,800 | | | $ | 38,536,015 | | | 8,230,257 | | | $ | 89,579,593 | |
Reinvested | | 708,211 | | | | 7,370,140 | | | 626,954 | | | | 6,788,154 | |
Repurchased | | (6,773,780 | ) | | | (70,523,699 | ) | | (2,593,583 | ) | | | (28,076,304 | ) |
| | | | | | | | | | | | | | |
Total | | (2,450,769 | ) | | $ | (24,617,544 | ) | | 6,263,628 | | | $ | 68,291,443 | |
| | | | | | | | | | | | | | |
Substantially all of the Series’ shares represent investments by fiduciary accounts over which the Advisor has sole investment discretion.
The Series may trade in financial instruments with off-balance sheet risk in the normal course of its investing activities to assist in managing exposure to various market risks. These financial instruments include written options and futures contracts and may involve, to a varying degree, elements of risk in excess of the amounts recognized for financial statement purposes. No such investments were held by the Series on December 31, 2008.
| 7. | FEDERAL INCOME TAX INFORMATION |
The amount and characterization of certain income and capital gains to be distributed are determined in accordance with federal income tax regulations, which may differ from accounting principles generally accepted in the United States of America. These differences are primarily due to differing book and tax treatments in the timing of the recognition of net investment income or gains and losses, including market discount. The Series may periodically make reclassifications among its capital accounts to reflect income and gains available for distribution (or available
Notes to Financial Statements
| 7. | FEDERAL INCOME TAX INFORMATION (continued) |
capital loss carryovers) under income tax regulations, without impacting the Series’ net asset value. Any such reclassifications are not reflected in the financial highlights.
The tax character of distributions paid were as follows:
| | | | | | |
| | | For the Year
Ended 12/31/08 | | For the Year
Ended 12/31/07 |
Ordinary income | | $ | 50,039 | | $ | 103,002 |
Tax exempt income | | | 7,521,726 | | | 7,116,802 |
Long-term capital gains | | | 353,133 | | | 66,160 |
At December 31, 2008, the tax basis components of distributable earnings and the net unrealized depreciation based on identified cost for federal income tax purposes were as follows:
| | | | |
Cost for federal income tax purposes | | $ | 207,744,815 | |
Unrealized appreciation | | $ | 1,863,858 | |
Unrealized depreciation | | | (14,098,644 | ) |
| | | | |
Net unrealized depreciation | | $ | (12,234,786 | ) |
Undistributed tax exempt income | | | 2,218,153 | |
Undistributed long-term capital gains | | | 291,747 | |
| 8. | RECENT ACCOUNTING PRONOUNCEMENTS |
In September 2008, FASB Staff Position No. FAS 133-1 and FIN 45-4, “Disclosures about Credit Derivatives and Certain Guarantees: An Amendment of FASB Statement No. 133 and FASB Interpretation No. 45” (the “Position”) was issued and is effective for fiscal years and interim periods beginning after November 15, 2008. The Position amends FASB Statement No. 133 (“FAS 133”), Accounting for Derivative Instruments and Hedging Activities, and also amends FASB Interpretation No. 45 (“FIN 45”), Guarantor’s Accounting and Disclosure Requirements for Guarantees, Including Indirect Guarantees of Indebtedness of Others. The amendments to FAS 133 include required disclosure for (i) the nature and terms of the credit derivative, reasons for entering into the credit derivative, the events or circumstances that would require the seller to perform under the credit derivative, and the current status of the payment performance risk of the credit derivative, (ii) the maximum potential amount of future payments (undiscounted) the seller could be required to make under the credit derivative, (iii) the fair value of the credit derivative, and (iv) the nature of any recourse provisions and assets held either as collateral or by third parties. The amendments to FIN 45 require additional disclosures about the current status of the payment/performance risk of a guarantee. At this time, Management is evaluating the implications of FAS 133-1 and FIN 45-4, but they are not expected to materially impact the Series’ financial statements.
In March 2008, FASB Statement of Financial Accounting Standards No. 161, Disclosures about Derivative Instruments and Hedging Activities (“FAS 161”) was issued and is effective for fiscal years and interim periods beginning after November 15, 2008. FAS 161 requires enhanced disclosures about the Series’ derivative and hedging activities, including how such activities are accounted for and their effect on the Series’ financial position and performance. Management is currently evaluating the impact of the adoption of FAS 161, but it is not expected to materially impact the Series’ financial statements.
Report of Independent Registered Public Accounting Firm
To the Board of Directors of Manning & Napier Fund, Inc. and Shareholders of Diversified Tax Exempt Series:
In our opinion, the accompanying statement of assets and liabilities, including the investment portfolio (except for credit ratings), and the related statements of operations and of changes in net assets and the financial highlights present fairly, in all material respects, the financial position of the Diversified Tax Exempt Series (a series of Manning & Napier Fund, Inc., hereafter referred to as the “Series”) at December 31, 2008, and the results of its operations for the year then ended, the changes in its net assets for each of the two years in the period then ended and the financial highlights for each of the five years in the period then ended, in conformity with accounting principles generally accepted in the United States of America. These financial statements and financial highlights (hereafter referred to as “financial statements”) are the responsibility of the Series’ management; our responsibility is to express an opinion on these financial statements based on our audits. We conducted our audits of these financial statements in accordance with the standards of the Public Company Accounting Oversight Board (United States). Those standards require that we plan and perform the audit to obtain reasonable assurance about whether the financial statements are free of material misstatement. An audit includes examining, on a test basis, evidence supporting the amounts and disclosures in the financial statements, assessing the accounting principles used and significant estimates made by management, and evaluating the overall financial statement presentation. We believe that our audits, which included confirmation of securities at December 31, 2008 by correspondence with the custodian, provide a reasonable basis for our opinion.

Columbus, Ohio
February 13, 2009
Supplemental Tax Information (unaudited)
Pursuant to Section 852 of the Internal Revenue Code, as amended, the Series hereby designates $353,133 as capital gains for its taxable year ended December 31, 2008. In addition, the Series hereby designates $7,521,726 as tax exempt dividends for the year ended December 31, 2008.
Renewal of Investment Advisory Agreement (unaudited)
At the Manning & Napier Fund, Inc. (the “Fund”) Board of Directors’ (the “Board”) meeting, held on November 5, 2008, the Investment Advisory Agreement (the “Agreement”) between the Fund and Manning & Napier Advisors, Inc. (the “Advisor”) was reviewed by the Board for renewal. In connection with the decision whether to renew the Agreement, a variety of material was prepared for and reviewed by the Board.
Representatives of the Advisor attended the meeting and presented additional oral and written information to the Board to assist the Board in its considerations. The discussion immediately below outlines the materials and information presented to the Board in connection with the Board’s 2008 Annual Review of the Agreement and the conclusions made by the Directors when determining to continue the Agreement.
| | • | | The Board considered the services provided by the Advisor under the Agreement including, among others: deciding what securities to purchase and sell for each Series; arranging for the purchase and sale of such securities by placing orders with broker-dealers; administering the affairs of the Fund (including the books and records of the Fund not maintained by third party service providers such as the custodian or sub-transfer agent); arranging for the insurance coverage for the Fund; and supervising the preparation of tax returns, SEC filings (including registration statements) and reports to shareholders for the Fund. The Board also considered the nature and quality of such services provided under the Agreement in light of the Advisor’s services provided to the Fund for 22 years. The Board discussed the quality of these services with representatives from the Advisor and concluded that the Advisor was performing its services to the Fund required under the Agreement in a reasonable manner. |
| | • | | The Board considered the investment performance of the various Series of the Fund. The investment performance for each Series was reviewed on a cumulative basis since inception and on a one year basis. In addition, annualized performance for the following time periods was considered: inception, three year, five year, ten year, and current market cycle. A market cycle includes periods of both rising and falling markets. Returns for established benchmark indices for each Series were provided for each time period. The Board noted that the various Series were competitive against their respective benchmarks and/or peer groups over various time periods, but in particular over the full market cycle period relevant for the Series. In addition, the Board considered at the meeting (and considers on a quarterly basis) a peer group performance analysis consisting of Morningstar universes of mutual funds with similar investment objectives. The Board discussed the performance with representatives from the Advisor and concluded that the investment performance of each of the Fund’s Series was reasonable based on the Fund’s actual performance and comparative performance, especially performance over the current market cycle. |
| | • | | The Board considered the costs of the Advisor’s services and the profits of the Advisor as they relate to the Advisor’s services to the Fund under the Agreement. In reviewing the Advisor’s costs and profits, the Board discussed the Advisor’s revenues generated from the Fund (on both an actual and adjusted basis) and its expenses associated with providing the services under the Agreement. In addition, the Board reviewed the Advisor’s expenses associated with Fund activities outside of the Agreement (such as expense reimbursements pursuant to expense caps and payments made by the Advisor to third party platforms on which shares of the Fund are available for purchase). It was noted by representatives of the Advisor that 15 of the 25 active Series of the Fund are |
Renewal of Investment Advisory Agreement (unaudited)
| | currently experiencing expenses above the capped expense ratios. After discussing the above costs and profits, the Board concluded that the Advisor’s profitability relating to its services provided under the Agreement was reasonable. |
| | • | | The Board considered the fees and expenses of the various Series of the Fund. The Advisor presented the advisory fees and total expenses for each Series, including the advisory fee adjusted for any expense waivers or reimbursements (either contractual or voluntary) paid by the Advisor. The advisory fees and expense ratios of each Series were compared to an average (on both a mean and median basis) of similar funds as disclosed on the Morningstar database. Representatives of the Advisor discussed with the Board the levels of its advisory fee for each Series of the Fund and as compared to the median and mean advisory fees for similar funds as listed on Morningstar. Expense ratios for every Series, except the High Yield Bond Series, Global Fixed Income Series and the Target Series Class R and Class C, are currently below the median and mean for similar funds as listed on Morningstar. Based on their review of the information provided, the Board concluded that the fees and expenses of each Series of the Fund were reasonable on a comparative basis. |
| | • | | The Board also considered the other benefits the Advisor derives from its relationship with the Fund. Such other benefits include certain research products provided by soft dollars. Given the level of soft dollar transactions involving the Fund, the Board concluded that these additional benefits to the Advisor were reasonable. |
| | • | | In addition to the factors described above, the Board considered the Advisor’s personnel, investment strategies, policies and procedures relating to compliance with personal securities transactions, and reputation, expertise and resources in domestic and foreign financial markets. The Board concluded that these factors support the conclusion that the Advisor performs its services in a reasonable manner. |
| | • | | The Board did not consider economies of scale at this time because of the multiple uses of the Fund (for the Advisor’s discretionary investment account clients in addition to direct investors), the current profitability of the Advisor’s services to the Fund under the Agreement, and the overall size of the Fund complex. |
Based on the Board’s deliberations and their evaluation of the information described above, the Board, including a majority of Directors that are not “interested persons” as defined in the Investment Company Act of 1940, concluded that the compensation under the Agreement was fair and reasonable in light of the services and expenses and such other matters as the Directors considered to be relevant in the exercise of their reasonable judgment. Accordingly, the Board approved the renewal of the Agreement. In the course of their deliberations, the Directors did not identify any particular information that was all important or controlling.
Directors’ and Officers’ Information (unaudited)
The Statement of Additional Information provides additional information about the Fund’s directors and officers and can be obtained without charge by calling 1-800-466-3863, at www.manningnapieradvisors.com, or on the EDGAR Database on the SEC Internet web site (http://www.sec.gov). The following chart shows certain information about the Fund’s officers and directors, including their principal occupations during the last five years. Unless specific dates are provided, the individuals have held the listed positions for longer than five years.
INTERESTED DIRECTOR/OFFICER
| | |
| Name: | | B. Reuben Auspitz* |
| Address: | | 290 Woodcliff Drive
Fairport, NY 14450 |
| Age: | | 61 |
| Current Position(s) Held with Fund: | | Principal Executive Officer, President, Chairman & Director |
| Term of Office1 & Length of Time Served: | | Indefinite - Director since 1984; Vice President 1984 - 2003; President since 2004; Principal Executive Officer since 2002 |
| Principal Occupation(s) During Past 5 Years: | | Executive Vice President; Co-Executive Director; Executive Group Member**; Chief Compliance Officer since 2004 - Manning & Napier Advisors, Inc. President; Director - Manning & Napier Investor Services, Inc. Holds or has held one or more of the following titles for various subsidiaries and affiliates: President, Vice President, Director, Chairman, Treasurer, Chief Compliance Officer or Member. |
| Number of Portfolios Overseen within Fund Complex: | | 28 |
| Other Directorships Held Outside Fund Complex: | | N/A |
| |
| INDEPENDENT DIRECTORS | | |
| |
| Name: | | Stephen B. Ashley |
| Address: | | 290 Woodcliff Drive
Fairport, NY 14450 |
| Age: | | 68 |
| Current Position(s) Held with Fund: | | Director, Audit Committee Member, Governance & Nominating Committee Member |
| Term of Office & Length of Time Served: | | Indefinite - Since 1996 |
| Principal Occupation(s) During Past 5 Years: | | Chairman, Director, President & Chief Executive Officer, The Ashley Group (property management and investment). Chairman (non-executive) 2004-2008; Director 1995-2008 - Fannie Mae (mortgage) |
| Number of Portfolios Overseen within Fund Complex: | | 28 |
| Other Directorships Held Outside Fund Complex: | | The Ashley Group |
| Name: | | Peter L. Faber |
| Address: | | 290 Woodcliff Drive
Fairport, NY 14450 |
| Age: | | 70 |
| Current Position(s) Held with Fund: | | Director, Governance & Nominating Committee Member |
| Term of Office & Length of Time Served: | | Indefinite - Since 1987 |
| Principal Occupation(s) During Past 5 Years: | | Senior Counsel, McDermott, Will & Emery LLP (law firm) |
| Number of Portfolios Overseen within Fund Complex: | | 28 |
| Other Directorships Held Outside Fund Complex: | | Partnership for New York City, Inc.
New York Collegium
Boston Early Music Festival |
| Name: | | Harris H. Rusitzky |
| Address: | | 290 Woodcliff Drive
Fairport, NY 14450 |
| Age: | | 73 |
| Current Position(s) Held with Fund: | | Director, Audit Committee Member, Governance & Nominating Committee Member |
| Term of Office & Length of Time Served: | | Indefinite - Since 1985 |
| Principal Occupation(s) During Past 5 Years: | | President, The Greening Group (business consultants); Partner, The Restaurant Group (restaurants) |
| Number of Portfolios Overseen within Fund Complex: | | 28 |
| Other Directorships Held Outside Fund Complex: | | N/A |
Directors’ and Officers’ Information (unaudited)
| | |
| |
| INDEPENDENT DIRECTORS (continued) | | |
| |
| Name: | | Paul A. Brooke |
| Address: | | 290 Woodcliff Drive
Fairport, NY 14450 |
| Age: | | 63 |
| Current Position(s) Held with Fund: | | Director, Audit Committee Member, Governance & Nominating Committee Member |
| Term of Office & Length of Time Served: | | Indefinite - Since 2007 |
| Principal Occupation(s) During Past 5 Years: | | Chairman & CEO, Alsius Corp. (investments); Managing Member, PMSV Holdings LLC (investments) |
| Number of Portfolios Overseen within Fund Complex: | | 28 |
| Other Directorships Held Outside Fund Complex: | | Incyte Corp.
ViroPharma, Inc.
HLTH Corp.
Cheyne Captial International
MPM Bio-equities
GMP Companies
HoustonPharma |
| |
| OFFICERS | | |
| |
| Name: | | Jeffrey S. Coons, Ph.D., CFA |
| Address: | | 290 Woodcliff Drive
Fairport, NY 14450 |
| Age: | | 45 |
| Current Position(s) Held with Fund: | | Vice President |
| Term of Office1 & Length of Time Served: | | Since 2004 |
| Principal Occupation(s) During Past 5 Years: | | Co-Director of Research since 2002 & Executive Group Member**, Manning & Napier Advisors, Inc. Holds one or more of the following titles for various subsidiaries and affiliates: President, Director, Treasurer or Senior Trust Officer. |
| Number of Portfolios Overseen within Fund Complex: | | 28 |
| Other Directorships Held Outside Fund Complex: | | N/A |
| Name: | | Christine Glavin |
| Address: | | 290 Woodcliff Drive
Fairport, NY 14450 |
| Age: | | 42 |
| Current Position(s) Held with Fund: | | Principal Financial Officer, Chief Financial Officer |
| Term of Office1 & Length of Time Served: | | Principal Financial Officer since 2002; Chief Financial Officer since 2001 |
| Principal Occupation(s) During Past 5 Years: | | Fund Reporting Manager, Manning & Napier Advisors, Inc. |
| Number of Portfolios Overseen within Fund Complex: | | 28 |
| Other Directorships Held Outside Fund Complex: | | N/A |
| Name: | | Jodi L. Hedberg |
| Address: | | 290 Woodcliff Drive
Fairport, NY 14450 |
| Age: | | 41 |
| Current Position(s) Held with Fund: | | Corporate Secretary, Chief Compliance Officer, Anti-Money Laundering Compliance Officer |
| Term of Office1 & Length of Time Served: | | Corporate Secretary since 1997; Chief Compliance Officer since 2004 |
| Principal Occupation(s) During Past 5 Years: | | Director of Compliance, Manning & Napier Advisors, Inc. and affiliates; Corporate Secretary, Manning & Napier Investor Services, Inc. since 2006 |
| Number of Portfolios Overseen within Fund Complex: | | 28 |
| Other Directorships Held Outside Fund Complex: | | N/A |
*Interested Director, within the meaning of the Investment Company Act of 1940 by reason of his position with the Fund’s investment advisor and distributor. Mr. Auspitz serves as the Executive Vice President and Director, Manning & Napier Advisors, Inc. and President and Director, Manning & Napier Investor Services, Inc., the Fund’s distributor.
**The Executive Group performs the duties of the Office of the Chief Executive of Manning & Napier Advisors, Inc.
1The term of office for President, Vice President, Chief Financial Officer, and Corporate Secretary is one year and until their respective successors are chosen and qualified. All other officers’ terms are indefinite.
(THISPAGEINTENTIONALLYLEFTBLANK)
(THISPAGEINTENTIONALLYLEFTBLANK)
Literature Requests (unaudited)
Proxy Voting Policies and Procedures
A description of the policies and procedures that the Fund uses to determine how to vote proxies relating to portfolio securities is available, without charge, upon request:
| | |
By phone | | 1-800-466-3863 |
On the Securities and Exchange Commission’s (SEC) web site | | http://www.sec.gov |
Proxy Voting Record
Information regarding how the Fund voted proxies relating to portfolio securities during the most recent 12-month period ended June 30th is available, without charge, upon request:
| | |
By phone | | 1-800-466-3863 |
On the SEC’s web site | | http://www.sec.gov |
Quarterly Portfolio Holdings
The Series’ complete schedule of portfolio holdings for the 1st and 3rd quarters of each fiscal year are provided on Form N-Q, and are available, without charge, upon request:
| | |
By phone | | 1-800-466-3863 |
On the SEC’s web site | | http://www.sec.gov |
The Series’ Form N-Q may be reviewed and copied at the SEC’s Public Reference Room in Washington, D.C. Information on the operation of the Public Reference Room may be obtained by calling 1-800-SEC-0330.
Prospectus and Statement of Additional Information (SAI)
The prospectus and SAI provide additional information about each Series, including charges, expenses and risks. These documents are available, without charge, upon request:
| | |
By phone | | 1-800-466-3863 |
On the SEC’s web site | | http://www.sec.gov |
On the Advisor’s web site | | http://www.manningnapieradvisors.com |
Additional information available at www.manningnapieradvisors.com
1. Fund Holdings - Month-End
2. Fund Holdings - Quarter-End
3. Shareholder Report - Annual
4. Shareholder Report - Semi-Annual
Manning & Napier Fund, Inc.
| | | | |
| TECHNOLOGY SERIES | | | | | Annual Report - December 31, 2008 |

Management Discussion and Analysis (unaudited)
Dear Shareholders:
In a year characterized by significant economic weakness, extreme declines in the broader equity indices, and underperformance of technology stocks relative to the market overall, the Technology Series underperformed its primary benchmark, the Standard and Poor’s (S&P) 500 Information Technology Index, in 2008. For the year, the Series declined by 45.86%, compared to a decline of 43.13% and 36.99% for S&P 500 Information Technology and S&P 500 Total Return indices, respectively. The result marked the first time in eight years (since the inception of the Series) that the Technology Series unperformed its primary benchmark. The Series continues to outperform both indices by a significant margin for the current stock market cycle (since October 1, 2002).
Undoubtedly, the main story of 2008 was the fallout related to the housing market, and the ensuing turmoil and credit crisis that gripped the financial sector in the second half of the year. As conditions in the credit markets became increasingly stressed and economic growth contracted, technology companies saw cyclical headwinds gain strength. Enterprises and consumers alike found themselves having less access to capital for large Information Technology (IT) projects and big ticket purchases, and corporate IT budgets and consumer spending saw increased uncertainty as the year wore on. The weak economic fundamentals in the U.S. quickly spilled over into foreign economies, which had been a strong source of IT growth in recent years. As unemployment rose and the U.S. dollar strengthened, investor optimism that the Information Technology sector would be relatively insulated from the broader economic concerns related to housing and the credit markets quickly deteriorated.
The corresponding negative technology stock performance was widespread and demonstrated little regard for the positive factors facing the Information Technology sector, including extremely healthy non-financial corporation balance sheets, the absence of the over-capacity and inventory issues associated with the technology bubble earlier this decade, equity valuations that in many cases were more favorable than seen during the trough of the bubble period and in prior economic recessions, and several industry-specific product cycles and secular (non-cyclical) trends. Despite our best efforts to adhere to the criteria associated with our investment strategies, much of the carnage in the Information Technology sector could not have been avoided unless one was not invested in the sector at all.
Given investors’ aversion to risk and equities in general and the broad-based market decline, several high-quality technology investment opportunities presented themselves later in the year. A key underpinning in the Series in the second half of 2008 was the re-allocation of investments towards companies favorably positioned in areas benefiting from long-term secular themes, and the increase in the weighting of some of the Series’ strongest strategy fits. These efforts helped the Series’ performance hold up better than the S&P 500 Information Technology Index in the second half of the year.
During the year, the Series had larger positions in the software and communications equipment industries compared to the Index, initiated a significant position in the semiconductor capital equipment industry, and maintained limited exposure to the semiconductor, telecommunications services, IT hardware, IT services, and electronic equipment industries.
The software industry was the largest weighting for the Series in 2008. We are of the opinion that the software industry is experiencing a wave of disruptive innovation that is yielding unique investment opportunities. Specifically, we believe software is moving away from a one-size-fits-all rigid product approach to one that allows more flexible computing infrastructures via more componentized software and the accessibility of software applications over the Internet. In addition, software technologies like virtualization are permitting greater asset efficiency and lower costs for enterprises by enabling more productive use of physical IT resources. Within software, our investments are focused on leading companies being influenced by these trends and span several sub-industries, including enterprise applications, infrastructure software, virtualization, telecom billing, speech recognition, design software, and software-as-a-service. While software stocks faired a little better than the Information Technology sector overall, the Series also benefited from the appreciation of some investments owing to mergers and acquisitions activity.
Management Discussion and Analysis (unaudited)
Communications equipment was the second-largest industry weighting in the Series for 2008, and our weighting increased over the course of the year as opportunities in industry leaders unfolded. We maintain a positive view of the long-term growth prospects of this industry given our belief that we are at the early stages of wireless data consumption and the secular migration towards the transmission of a variety of communications (voice, data, video) over Internet Protocol-based networks. Increasingly rich forms of content are soaking up bandwidth, and this, combined with opportunities to generate new revenue streams, consolidate networks to cut costs, and enhance communications of all kinds are positives for this area once the economy recovers. Overall, the communications equipment industry performed worse than the Information Technology sector in 2008. Our investments in this industry are focused on leaders in research and development and dominant companies in the areas of routing, switching, wide-area-network optimization, bandwidth management, and handsets.
Also during 2008, the Series initiated a significant investment in the semiconductor capital equipment industry in order to capitalize on extreme valuations in memory semiconductors, a key customer segment. Semiconductor industry capital spending contracted 35%+ in 2008, largely driven by memory producer spending cuts in response to excess capacity in memory markets following two years of over-investment. Our expectation was that the spending cuts would cause memory industry supply and demand to tighten, improving profitability, and in turn trigger renewed demand for semiconductor capital equipment. Unfortunately, the current macroeconomic events have impacted end product demand for memory semiconductors, prolonging the recovery in memory markets and resulting in further expected capital spending cuts for 2009. While our investments in this area have proven to be early, we are focused on vendors that dominate the fastest growth segments of semiconductor capital equipment, have strong balance sheets, and are expected to emerge from the current downturn with higher market share.
As we enter 2009, we are cognizant of the risks posed by the negative macroeconomic developments that continue to unfold. However, we also believe that, in contrast to the previous market downturn earlier this decade, the current downturn in technology stocks is a result of a crisis facing demand, rather than supply. We believe technology equity valuations are highly compelling at this time.
While 2008 was a difficult year for investors, we recognize that our job is to remain focused on company-specific fundamentals. In a year where emotion - a crisis of confidence - was a strong driver of returns no matter the market, we are not surprised that our fundamentals-based approach produced disappointing returns. However, looking back over our 38-year history, this approach has served our clients well over the long-term.
As always, we appreciate your business.
Sincerely,
Manning & Napier Advisors, Inc.
Performance Update as of December 31, 2008 (unaudited)
| | | | | | | | |
| | | Average Annual Total Returns
As of December 31, 2008 | | |
| | | One
Year | | Five
Year | | Since
Inception1 | | |
Manning & Napier Fund, Inc. - Technology Series2 | | -45.86% | | -1.48% | | -4.31% | | |
Standard & Poor’s (S&P) 500 Total Return Index3 | | -36.99% | | -2.18% | | -4.04% | | |
Standard & Poor’s (S&P) 500 Information Technology Index3 | | -43.13% | | -5.78% | | -13.41% | | |
The following graph compares the value of a $10,000 investment in the Manning & Napier Fund, Inc. - Technology Series from its current activation1 (8/8/00) to present (12/31/08) to the S&P 500 Total Return Index and the S&P 500 Information Technology Index.
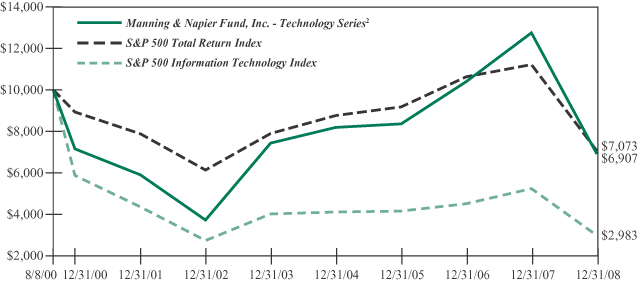
1Performance numbers for the Series and Indices are calculated from August 8, 2000, the Series’ current activation date.
2The Series’ performance does not reflect the deduction of taxes that a shareholder would pay on fund distributions or the redemption of shares. The Series’ performance is historical and may not be indicative of future results. The performance returns shown are inclusive of the net expense ratio of the Series. For the year ended December 31, 2008, this net expense ratio was 1.13%. The gross expense ratio, which does not account for any voluntary or contractual waivers currently in effect, was 1.13% for the year ended December 31, 2008.
3The S&P 500 Total Return Index is an unmanaged capitalization-weighted measure of 500 widely held common stocks listed on the New York Stock Exchange, American Stock Exchange and the Over-the-Counter market. The S&P 500 Information Technology Index, a sub-index of the S&P 500 Total Return Index, includes the stocks of companies involved in the business of technology related products and services. Both Indices’ returns assume daily reinvestment of dividends and, unlike Series returns, do not reflect any fees or expenses.
Shareholder Expense Example (unaudited)
As a shareholder of the Series, you may incur two types of costs: (1) transaction costs, including potential wire charges on redemptions and (2) ongoing costs, including management fees and other Series expenses. This example is intended to help you understand your ongoing costs (in dollars) of investing in the Series and to compare these costs with the ongoing costs of investing in other mutual funds.
The example is based on an investment of $1,000 invested at the beginning of the period and held for the entire period (July 1, 2008 to December 31, 2008).
Actual Expenses
The first line of the table below provides information about actual account values and actual expenses. You may use the information in this line, together with the amount you invested, to estimate the expenses that you paid over the period. Simply divide your account value by $1,000 (for example, an $8,600 account value divided by $1,000 = 8.6), then multiply the result by the number in the first line under the heading entitled “Expenses Paid During Period” to estimate the expenses you paid on your account during this period.
Hypothetical Example for Comparison Purposes
The second line of the table below provides information about hypothetical account values and hypothetical expenses based on the Series’ actual expense ratio and an assumed rate of return of 5% per year before expenses, which is not the Series’ actual return. The hypothetical account values and expenses may not be used to estimate the actual ending account balance or expenses you paid during the period. You may use this information to compare the ongoing costs of investing in the Series and other funds. To do so, compare this 5% hypothetical example with the 5% hypothetical examples that appear in the shareholder reports of the other funds.
Please note that the expenses shown in the table are meant to highlight your ongoing costs only and do not reflect any transaction costs, such as potential wire charges on redemptions. Therefore, the second line of the table is useful in comparing ongoing costs only, and will not help you determine the relative total costs of owning different funds. In addition, if these transaction costs were included, your costs would have been higher.
| | | | | | | | | |
| | | Beginning
Account Value
7/1/08 | | Ending
Account Value
12/31/08 | | Expenses Paid
During Period*
7/1/08-12/31/08 |
Actual | | $ | 1,000.00 | | $ | 692.20 | | $ | 4.85 |
Hypothetical
(5% return before expenses) | | $ | 1,000.00 | | $ | 1,019.41 | | $ | 5.79 |
*Expenses are equal to the Series’ annualized expense ratio (for the six-month period) of 1.14%, multiplied by the average account value over the period, multiplied by 184/366 (to reflect the one-half year period). Expenses are based on the most recent fiscal half year; therefore, the expense ratio stated above may differ from the expense ratio stated in the financial highlights, which is based on one year data.
Portfolio Composition as of December 31, 2008 (unaudited)
Sector Allocation1
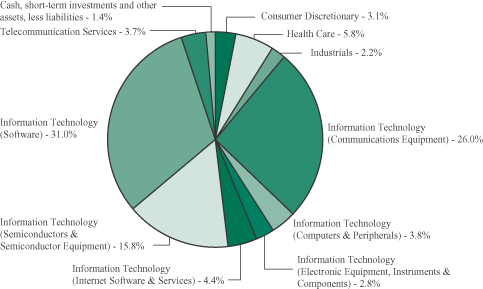
1As a percentage of net assets.
Top Ten Stock Holdings2
| | | | | | |
Infinera Corp. | | 4.5% | | SAP AG - ADR (Germany) | | 3.9% |
Salesforce.com, Inc. | | 4.4% | | EMC Corp. | | 3.8% |
Google, Inc. - Class A | | 4.4% | | Cerner Corp. | | 3.8% |
Riverbed Technology, Inc. | | 4.3% | | Juniper Networks, Inc. | | 3.8% |
BigBand Networks, Inc. | | 4.1% | | Cisco Systems, Inc. | | 3.8% |
2As a percentage of total investments.
Investment Portfolio - December 31, 2008
| | | | | |
| | | Shares | | Value
(Note 2) |
| | | | | |
| | |
COMMON STOCKS - 98.6% | | | | | |
| | |
Consumer Discretionary - 3.1% | | | | | |
Hotels, Restaurants & Leisure - 3.1% | | | | | |
International Game Technology | | 320,000 | | $ | 3,804,800 |
| | | | | |
Health Care - 5.8% | | | | | |
Health Care Technology - 5.8% | | | | | |
Cerner Corp.* | | 122,000 | | | 4,690,900 |
Eclipsys Corp.* | | 177,000 | | | 2,511,630 |
| | | | | |
Total Health Care | | | | | 7,202,530 |
| | | | | |
Industrials - 2.2% | | | | | |
Commercial Services & Supplies - 2.2% | | | | | |
Tomra Systems ASA (Norway) (Note 7) | | 800,000 | | | 2,698,029 |
| | | | | |
Information Technology - 83.8% | | | | | |
Communications Equipment - 26.0% | | | | | |
BigBand Networks, Inc.* | | 918,918 | | | 5,072,427 |
Blue Coat Systems, Inc.* | | 347,000 | | | 2,914,800 |
Cisco Systems, Inc.* | | 287,600 | | | 4,687,880 |
Infinera Corp.* | | 614,000 | | | 5,501,440 |
Juniper Networks, Inc.* | | 267,800 | | | 4,689,178 |
Nokia (Finland) (Note 7) | | 241,000 | | | 3,759,600 |
Riverbed Technology, Inc.* | | 468,000 | | | 5,330,520 |
| | | | | |
| | | | | 31,955,845 |
| | | | | |
Computers & Peripherals - 3.8% | | | | | |
EMC Corp.* | | 448,640 | | | 4,697,261 |
| | | | | |
Electronic Equipment, Instruments & Components - 2.8% | | | | | |
LoJack Corp.* | | 819,400 | | | 3,375,928 |
Planar Systems, Inc.* | | 100,934 | | | 61,570 |
| | | | | |
| | | | | 3,437,498 |
| | | | | |
Internet Software & Services - 4.4% | | | | | |
Google, Inc. - Class A* | | 17,600 | | | 5,414,640 |
| | | | | |
Semiconductors & Semiconductor Equipment - 15.8% | | | |
ASML Holding N.V. (Netherlands) (Note 7) | | 231,000 | | | 4,174,170 |
KLA-Tencor Corp. | | 180,000 | | | 3,922,200 |
Lam Research Corp.* | | 190,000 | | | 4,043,200 |
Netlogic Microsystems, Inc.* | | 140,000 | | | 3,081,400 |
Tokyo Electron Limited (Japan) (Note 7) | | 125,000 | | | 4,275,626 |
| | | | | |
| | | | | 19,496,596 |
| | | | | |
| | |
| 6 | | The accompanying notes are an integral part of the financial statements. |
Investment Portfolio - December 31, 2008
| | | | | |
| | | Shares | | Value
(Note 2) |
| | | | | |
| | |
COMMON STOCKS (continued) | | | | | |
| | |
Information Technology (continued) | | | | | |
Software - 31.0% | | | | | |
Aladdin Knowledge Systems Ltd.* (Israel) (Note 7) | | 385,000 | | $ | 2,371,600 |
Amdocs Ltd.* (Guernsey) (Note 7) | | 251,000 | | | 4,590,790 |
Autodesk, Inc.* | | 191,000 | | | 3,753,150 |
Intuit, Inc.* | | 183,000 | | | 4,353,570 |
Microsoft Corp. | | 230,400 | | | 4,478,976 |
Nuance Communications, Inc.* | | 355,000 | | | 3,677,800 |
Salesforce.com, Inc.* | | 170,000 | | | 5,441,700 |
SAP AG - ADR (Germany) (Note 7) | | 131,850 | | | 4,775,607 |
TIBCO Software, Inc.* | | 900,000 | | | 4,671,000 |
| | | | | |
| | | | | 38,114,193 |
| | | | | |
Total Information Technology | | | | | 103,116,033 |
| | | | | |
Telecommunication Services - 3.7% | | | | | |
Wireless Telecommunication Services - 3.7% | | | | | |
American Tower Corp.* | | 42,000 | | | 1,231,440 |
Crown Castle International Corp.* | | 120,000 | | | 2,109,600 |
SBA Communications Corp.* | | 78,000 | | | 1,272,960 |
| | | | | |
Total Telecommunication Services | | | | | 4,614,000 |
| | | | | |
TOTAL COMMON STOCKS
(Identified Cost $171,886,705) | | | | | 121,435,392 |
| | | | | |
| | |
SHORT-TERM INVESTMENTS - 1.3% | | | | | |
Dreyfus Cash Management, Inc. - Institutional Shares (Identified Cost $1,567,937) | | 1,567,937 | | | 1,567,937 |
| | | | | |
TOTAL INVESTMENTS - 99.9%
(Identified Cost $173,454,642) | | | | | 123,003,329 |
| | |
OTHER ASSETS, LESS LIABILITIES - 0.1% | | | | | 108,744 |
| | | | | |
NET ASSETS - 100% | | | | $ | 123,112,073 |
| | | | | |
*Non-income producing security
ADR - American Depository Receipt
| | |
| The accompanying notes are an integral part of the financial statements. | | 7 |
Statement of Assets and Liabilities
December 31, 2008
| | | | |
| | | | |
ASSETS: | | | | |
| |
Investments, at value (identified cost $173,454,642) (Note 2) | | $ | 123,003,329 | |
Receivable for securities sold | | | 437,796 | |
Dividends receivable | | | 47,033 | |
Receivable for fund shares sold | | | 34,509 | |
Foreign tax reclaims receivable | | | 8,444 | |
| | | | |
TOTAL ASSETS | | | 123,531,111 | |
| | | | |
| LIABILITIES: | | | | |
| |
Accrued management fees (Note 3) | | | 100,524 | |
Accrued fund accounting and transfer agent fees (Note 3) | | | 7,840 | |
Accrued Chief Compliance Officer service fees (Note 3) | | | 477 | |
Payable for fund shares repurchased | | | 269,209 | |
Audit fees payable | | | 31,245 | |
Other payables and accrued expenses | | | 9,743 | |
| | | | |
TOTAL LIABILITIES | | | 419,038 | |
| | | | |
TOTAL NET ASSETS | | $ | 123,112,073 | |
| | | | |
NET ASSETS CONSIST OF: | | | | |
| |
Capital stock | | $ | 204,898 | |
Additional paid-in-capital | | | 209,776,399 | |
Accumulated net investment loss | | | (271,716 | ) |
Accumulated net realized loss on investments, foreign currency and other assets and liabilities | | | (36,145,696 | ) |
Net unrealized depreciation on investments and other assets and liabilities | | | (50,451,812 | ) |
| | | | |
TOTAL NET ASSETS | | $ | 123,112,073 | |
| | | | |
NET ASSET VALUE, OFFERING PRICE AND REDEMPTION PRICE PER SHARE ($123,112,073/20,489,827 shares) | | $ | 6.01 | |
| | | | |
| | |
| 8 | | The accompanying notes are an integral part of the financial statements. |
Statement of Operations
For the Year Ended December 31, 2008
| | | | |
| | | | |
INVESTMENT INCOME: | | | | |
| |
Dividends (net of foreign tax withheld, $93,845) | | $ | 1,005,129 | |
Interest | | | 28,110 | |
| | | | |
Total Investment Income | | | 1,033,239 | |
| | | | |
| EXPENSES: | | | | |
| |
Management fees (Note 3) | | | 1,732,851 | |
Fund accounting and transfer agent fees (Note 3) | | | 115,075 | |
Directors’ fees (Note 3) | | | 12,600 | |
Chief Compliance Officer service fees (Note 3) | | | 4,301 | |
Custodian fees | | | 15,300 | |
Miscellaneous | | | 71,115 | |
| | | | |
Total Expenses | | | 1,951,242 | |
| | | | |
NET INVESTMENT LOSS | | | (918,003 | ) |
| | | | |
| REALIZED AND UNREALIZED LOSS ON INVESTMENTS: | | | | |
| |
Net realized loss on - | | | | |
Investments | | | (36,145,696 | ) |
Foreign currency and other assets and liabilities | | | (269,578 | ) |
| | | | |
| | | (36,415,274 | ) |
| | | | |
| |
Net change in unrealized appreciation (depreciation) on - | | | | |
Investments | | | (67,539,081 | ) |
Foreign currency and other assets and liabilities | | | (388 | ) |
| | | | |
| | | (67,539,469 | ) |
| | | | |
| |
NET REALIZED AND UNREALIZED LOSS ON
INVESTMENTS | | | (103,954,743 | ) |
| | | | |
NET DECREASE IN NET ASSETS RESULTING FROM OPERATIONS | | $ | (104,872,746 | ) |
| | | | |
| | |
| The accompanying notes are an integral part of the financial statements. | | 9 |
Statements of Changes in Net Assets
| | | | | | | | |
| | | For the
Year Ended
12/31/08 | | | For the
Year Ended
12/31/07 | |
| | | | | | | | |
| INCREASE (DECREASE) IN NET ASSETS: | | | | | | | | |
| | |
| OPERATIONS: | | | | | | | | |
| | |
Net investment loss | | $ | (918,003 | ) | | $ | (1,065,670 | ) |
Net realized gain (loss) on investments and foreign currency | | | (36,415,274 | ) | | | 39,476,721 | |
Net change in unrealized appreciation (depreciation) on investments | | | (67,539,469 | ) | | | 1,288,875 | |
| | | | | | | | |
Net increase (decrease) from operations | | | (104,872,746 | ) | | | 39,699,926 | |
| | | | | | | | |
| DISTRIBUTIONS TO SHAREHOLDERS (Note 9): | | | | | | | | |
| | |
From net realized gain on investments | | | (2,835,785 | ) | | | (24,934,190 | ) |
| | | | | | | | |
| CAPITAL STOCK ISSUED AND REPURCHASED: | | | | | | | | |
| | |
Net increase from capital share transactions (Note 5) | | | 3,141,958 | | | | 45,660,620 | |
| | | | | | | | |
Net increase (decrease) in net assets | | | (104,566,573 | ) | | | 60,426,356 | |
| | |
| NET ASSETS: | | | | | | | | |
| | |
Beginning of year | | | 227,678,646 | | | | 167,252,290 | |
| | | | | | | | |
End of year (including accumulated net investment loss of $271,716 and $708, respectively) | | $ | 123,112,073 | | | $ | 227,678,646 | |
| | | | | | | | |
| | |
| 10 | | The accompanying notes are an integral part of the financial statements. |
Financial Highlights
| | | | | | | | | | |
| |
| | | For the Years Ended |
| | | 12/31/08 | | 12/31/07 | | 12/31/06 | | 12/31/05 | | 12/31/04 |
| | | | | | | | | | |
| | | | | | | | | | |
| Per share data (for a share outstanding throughout each year): | | | | | | | | | | |
Net asset value - Beginning of year | | $11.29 | | $10.41 | | $8.37 | | $8.19 | | $7.44 |
| | | | | | | | | | |
Income (loss) from investment operations: | | | | | | | | | | |
Net investment loss | | (0.05) | | (0.05) | | (0.01) | | (0.03) | | (0.04)1 |
Net realized and unrealized gain (loss) on investments | | (5.09) | | 2.34 | | 2.05 | | 0.21 | | 0.79 |
| | | | | | | | | | |
Total from investment operations | | (5.14) | | 2.29 | | 2.04 | | 0.18 | | 0.75 |
| | | | | | | | | | |
| | | | | |
Less distributions to shareholders: | | | | | | | | | | |
From net realized gain on investments | | (0.14) | | (1.41) | | — | | — | | — |
| | | | | | | | | | |
Net asset value - End of year | | $6.01 | | $11.29 | | $10.41 | | $8.37 | | $8.19 |
| | | | | | | | | | |
Net assets - End of year (000’s omitted) | | $123,112 | | $227,679 | | $167,252 | | $110,656 | | $63,321 |
| | | | | | | | | | |
Total return2 | | (45.86%) | | 22.55% | | 24.37% | | 2.20% | | 10.08% |
| Ratios (to average net assets)/Supplemental Data: | | | | | | | | | | |
Expenses* | | 1.13% | | 1.13% | | 1.16% | | 1.20% | | 1.20% |
Net investment loss | | (0.53%) | | (0.53%) | | (0.14%) | | (0.48%) | | (0.52%) |
Portfolio turnover | | 65% | | 79% | | 83% | | 116% | | 50% |
|
*The investment advisor did not impose all of its management fee in some years. If these expenses had been incurred by the Series, the expense ratio (to average net assets) would have been increased by the following amount: |
| | N/A | | N/A | | N/A | | 0.03% | | 0.16% |
1Calculated based on average shares outstanding during the year.
2Represents aggregate total return for the year indicated, and assumes reinvestment of all distributions. Total return would have been lower had certain expenses not been waived during certain years.
| | |
| The accompanying notes are an integral part of the financial statements. | | 11 |
Notes to Financial Statements
Technology Series (the “Series”) is a no-load non-diversified series of Manning & Napier Fund, Inc. (the “Fund”). The Fund is organized in Maryland and is registered under the Investment Company Act of 1940, as amended, as an open-end management investment company.
The Series’ investment objective is to provide long-term growth by investing principally in the common stocks of companies in technology-based industries.
The Fund’s Advisor is Manning & Napier Advisors, Inc. (the “Advisor”). On August 8, 2000, the Series resumed sales of shares to advisory clients and employees of the Advisor and its affiliates. The Series resumed offering shares directly to investors on May 18, 2004, as it had done previously from time to time. The total authorized capital stock of the Fund consists of 5.0 billion shares of common stock each having a par value of $0.01. As of December 31, 2008, 4.5 billion shares have been designated in total among 28 series, of which 100 million have been designated as Technology Series Class A common stock.
| 2. | SIGNIFICANT ACCOUNTING POLICIES |
Security Valuation
Portfolio securities, including domestic equities, foreign equities, exchange-traded funds and options, listed on an exchange other than the NASDAQ National Market System are valued at the latest quoted sales price of the exchange on which the security is primarily traded. Securities not traded on valuation date or securities not listed on an exchange are valued at the latest quoted bid price provided by the Fund’s pricing service. Securities listed on the NASDAQ National Market System are valued in accordance with the NASDAQ Official Closing Price.
Securities for which representative valuations or prices are not available from the Fund’s pricing service may be valued at fair value. Due to the inherent uncertainty of valuations of such securities, the fair value may differ significantly from the values that would have been used had a ready market for such securities existed. If trading or events occurring after the close of the principal market in which securities are traded are expected to materially affect the value of those securities, then they may be valued at their fair value, taking this trading or these events into account. Fair value is determined in good faith by the Advisor under procedures approved by and under the general supervision and responsibility of the Fund’s Board of Directors (the “Board”).
Short-term investments that mature in sixty days or less are valued at amortized cost, which approximates market value. Investments in open-end investment companies are valued at their net asset value per share on valuation date, with the exception of exchange-traded funds, which are valued at the closing price on the exchange.
In September 2006, FASB Statement of Financial Accounting Standards No. 157, Fair Value Measurements (“FAS 157”) was issued, effective for fiscal years beginning after November 15, 2007. This standard clarifies the definition of fair value for financial reporting, establishes a framework for measuring fair value and requires additional disclosures about the use of fair value measurements. FAS 157 became effective for the Series as of January 1, 2008, the beginning of its current fiscal year. The three levels of the fair value hierarchy under FAS 157 are described below:
Level 1 - quoted prices in active markets for identical securities
Level 2 - other significant observable inputs (including quoted prices for similar securities, interest rates, prepayment speeds, credit risk, etc.)
Notes to Financial Statements
| 2. | SIGNIFICANT ACCOUNTING POLICIES (continued) |
Security Valuation (continued)
Level 3 - significant unobservable inputs (including the Series’ own assumptions in determining the fair value of investments.)
The inputs or methodology used for valuing securities are not necessarily an indication of the risk associated with investing in those securities. The following is a summary of the inputs used to value the Series’ assets as of December 31, 2008:
| | | | | | |
Valuation Inputs | | Investments In
Securities | | Other Financial
Instruments* |
| | | | | | |
Level 1 - Quoted Prices | | $ | 123,003,329 | | $ | — |
Level 2 - Other Significant Observable Inputs | | | — | | | — |
Level 3 - Significant Unobservable Inputs | | | — | | | — |
| | | | | | |
Total | | $ | 123,003,329 | | $ | — |
| | | | | | |
*Other financial instruments are derivative instruments not reflected in the Investment Portfolio, such as futures, forwards and swap contracts, which are valued at the unrealized appreciation/depreciation on the instrument. As of December 31, 2008, the Series did not hold any derivative instruments.
There were no Level 3 securities held by the Series as of December 31, 2007 or December 31, 2008.
Security Transactions, Investment Income and Expenses
Security transactions are accounted for on trade date. Dividend income is recorded on the ex-dividend date, except that if the ex-dividend date has passed, certain dividends from foreign securities are recorded as soon as the Fund is informed of the ex-dividend date. Non-cash dividends, if any, are recorded at the fair market value of the securities received. Interest income, including amortization of premium and accretion of discounts using the effective interest method, is earned from settlement date and accrued daily.
Expenses are recorded on an accrual basis. Most expenses of the Fund can be attributed to a specific series. Expenses which cannot be directly attributed are apportioned among the series in the Fund in such a manner as deemed equitable by the Fund’s Board, taking into consideration, among other things, the nature and type of expense.
The Series uses the identified cost method for determining realized gain or loss on investments for both financial statement and federal income tax reporting purposes.
Foreign Currency Translation
The books and records of the Series are maintained in U.S. dollars. Foreign currencies, investments and other assets and liabilities are translated into U.S. dollars at the current exchange rates. Purchases and sales of investment securities and income and expenses are translated on the respective dates of such transactions. The Series does not isolate realized and unrealized gains and losses attributable to changes in the exchange rates from gains and losses that arise from changes in the market value of investments. Such fluctuations are included with net realized and unrealized gain or loss on investments. Net realized foreign currency gains and losses represent foreign currency gains and losses between trade date and settlement date on securities transactions, gains and losses on disposition of foreign currencies and the difference between the amount of income and foreign withholding taxes recorded on the books of the Series and the amounts actually received or paid.
Notes to Financial Statements
| 2. | SIGNIFICANT ACCOUNTING POLICIES (continued) |
Federal Taxes
The Series’ policy is to comply with the provisions of the Internal Revenue Code applicable to regulated investment companies. The Series is not subject to federal income tax or excise tax to the extent that the Series distributes to shareholders each year its taxable income, including any net realized gains on investments, in accordance with requirements of the Internal Revenue Code. Accordingly, no provision for federal income tax or excise tax has been made in the financial statements.
On June 29, 2007, the Series adopted Financial Accounting Standards Board Interpretation No. 48 - Accounting for Uncertainty in Income Taxes (“FIN 48”). FIN 48 prescribes the minimum recognition threshold a tax position must meet in connection with accounting for uncertainties in income tax positions taken or expected to be taken by an entity before being measured and recognized in the financial statements. Management has determined that the adoption of FIN 48 did not have a material impact on the Series’ financial statements. The Series files income tax returns in the U.S. federal jurisdiction, various states and foreign jurisdictions, as required. No income tax returns are currently under investigation. The statute of limitations on the Series’ tax returns remains open for the years ended December 31, 2005 through December 31, 2008.
Additionally, based on the Fund’s understanding of the tax rules and rates related to income, gains and transactions for foreign jurisdictions in which it invests, the Series will provide for foreign taxes, and where appropriate, deferred foreign tax.
Distributions of Income and Gains
Distributions to shareholders of net investment income and net realized gains are made annually. An additional distribution may be necessary to avoid taxation of the Series. Distributions are recorded on the ex-dividend date.
Indemnifications
The Fund’s organizational documents provide former and current directors and officers with a limited indemnification against liabilities arising in connection with the performance of their duties to the Fund. In the normal course of business, the Fund may also enter into contracts that provide general indemnifications. The Fund’s maximum exposure under these arrangements is unknown as this would be dependent on future claims that may be made against the Fund. The risk of material loss from such claims is considered remote.
Other
The preparation of financial statements in conformity with accounting principles generally accepted in the United States of America requires management to make estimates and assumptions that affect the reported amounts of assets and liabilities and the disclosure of contingent assets and liabilities at the date of the financial statements and the reported amounts of income and expenses during the reporting period. Actual results could differ from those estimates.
| 3. | TRANSACTIONS WITH AFFILIATES |
The Fund has an Investment Advisory Agreement (the “Agreement”) with the Advisor, for which the Series pays a fee, computed daily and payable monthly, at an annual rate of 1.00% of the Series’ average daily net assets.
Under the Agreement, personnel of the Advisor provide the Series with advice and assistance in the choice of investments and the execution of securities transactions, and otherwise maintain the Series’ organization. The Advisor also provides the Fund with necessary office space and
Notes to Financial Statements
| 3. | TRANSACTIONS WITH AFFILIATES (continued) |
fund administration and support services. The salaries of all officers of the Fund (except a percentage of the Fund’s Chief Compliance Officer’s salary, which is paid by the Fund), and of all Directors who are “affiliated persons” of the Fund, or of the Advisor, and all personnel of the Fund, or of the Advisor, performing services relating to research, statistical and investment activities, are paid by the Advisor. Each “non-affiliated” Director receives an annual stipend, which is allocated among all the active series of the Fund. In addition, these Directors also receive a fee per Board meeting attended for each active series of the Fund plus a fee for each committee meeting attended.
The Advisor has contractually agreed, until at least April 30, 2010, to waive its fee and, if necessary, pay other operating expenses of the Series in order to maintain total direct annual fund operating expenses for the Series at no more than 1.20% of average daily net assets each year. For the year ended December 31, 2008, the Advisor did not waive its management fee or reimburse any expenses of the Series. The Advisor is not eligible to recoup any expenses that have been waived or reimbursed in prior years.
Manning & Napier Investor Services, Inc., a registered broker-dealer affiliate of the Advisor, acts as distributor for the Fund’s shares. The services of Manning & Napier Investor Services, Inc. are provided at no additional cost to the Series.
For fund accounting and transfer agent services, through October 31, 2008, the Fund paid the Advisor an annual fee of 0.11% of the Fund’s average daily net assets up to $900 million, 0.07% of the Fund’s average daily net assets between $900 million and $1.5 billion, and 0.04% of the Fund’s average daily net assets over $1.5 billion. Effective November 1, 2008, the fee rates are as follows: 0.055% of the Fund’s average daily net assets up to $4.5 billion, 0.03% of the Fund’s average daily net assets between $4.5 billion and $7.5 billion, and 0.02% of the Fund’s average daily net assets over $7.5 billion. Additionally, certain transaction and account-based fees and out-of-pocket expenses, including charges for reporting relating to the Fund’s compliance program, are charged. Expenses not directly attributable to a series are allocated based on each series’ relative net assets or number of accounts, depending on the expense. The Advisor has an agreement with Citi Fund Services Ohio, Inc. (“Citi”) under which Citi serves as sub-accountant and sub-transfer agent.
| 4. | PURCHASES AND SALES OF SECURITIES |
For the year ended December 31, 2008, purchases and sales of securities, other than United States Government securities and short-term securities, were $111,821,866 and $110,788,566, respectively. There were no purchases or sales of United States Government securities.
| 5. | CAPITAL STOCK TRANSACTIONS |
Transactions in shares of Technology Series were:
| | | | | | | | | | | | | | |
| | | For the Year
Ended 12/31/08 | | | For the Year
Ended 12/31/07 | |
| | | Shares | | | Amount | | | Shares | | | Amount | |
| | | | | | | | | | | | | | |
Sold | | 2,557,936 | | | $ | 21,273,855 | | | 2,875,916 | | | $ | 33,396,379 | |
Reinvested | | 341,587 | | | | 2,807,850 | | | 2,279,674 | | | | 24,643,270 | |
Repurchased | | (2,580,774 | ) | | | (20,939,747 | ) | | (1,048,508 | ) | | | (12,379,029 | ) |
| | | | | | | | | | | | | | |
Total | | 318,749 | | | $ | 3,141,958 | | | 4,107,082 | | | $ | 45,660,620 | |
| | | | | | | | | | | | | | |
Notes to Financial Statements
| 5. | CAPITAL STOCK TRANSACTIONS (continued) |
Substantially all of the Series’ shares represent investments by fiduciary accounts over which the Advisor has sole investment discretion.
The Series may trade in financial instruments with off-balance sheet risk in the normal course of its investing activities to assist in managing exposure to various market risks. These financial instruments include written options, forward foreign currency exchange contracts and futures contracts and may involve, to a varying degree, elements of risk in excess of the amounts recognized for financial statement purposes. No such investments were held by the Series on December 31, 2008.
Investing in securities of foreign companies and foreign governments involves special risks and considerations not typically associated with investing in securities of domestic companies and the United States Government. These risks include revaluation of currencies and future adverse political and economic developments. Moreover, securities of foreign companies and foreign governments and their markets may be less liquid and their prices more volatile than those of comparable domestic companies and the United States Government.
The Series may focus its investments in certain related technology industries; hence, the Series may subject itself to a greater degree of risk than a series that is more diversified.
| 9. | FEDERAL INCOME TAX INFORMATION |
The amount and characterization of certain income and capital gains to be distributed are determined in accordance with federal income tax regulations, which may differ from accounting principles generally accepted in the United States of America. These differences are primarily due to differing book and tax treatments in the timing of the recognition of net investment income or gains and losses, including net operating losses, foreign currency gains and losses and Post-October losses. The Series may periodically make reclassifications among its capital accounts to reflect income and gains available for distribution (or available capital loss carryovers) under income tax regulations, without impacting the Series’ net asset value. Any such reclassifications are not reflected in the financial highlights.
The tax character of distributions paid were as follows:
| | | | | | |
| | | For the Year
Ended 12/31/08 | | For the Year
Ended 12/31/07 |
Ordinary income | | $ | 2,835,785 | | $ | 6,784,096 |
Long-term capital gains | | | — | | | 18,150,094 |
For the year ended December 31, 2008, the Series elected to defer $16,502,270 and $271,716 of capital and currency losses, respectively, attributable to Post-October losses.
Notes to Financial Statements
| 9. | FEDERAL INCOME TAX INFORMATION (continued) |
At December 31, 2008, the tax basis components of distributable earnings and the net unrealized depreciation based on identified cost for federal income tax purposes were as follows:
| | | | |
| | | | |
Cost for federal income tax purposes | | $ | 173,454,642 | |
Unrealized appreciation | | $ | 1,601,691 | |
Unrealized depreciation | | | (52,053,004 | ) |
| | | | |
Net unrealized depreciation | | $ | (50,451,313 | ) |
Capital loss carryover | | | 19,643,426 | |
The capital loss carryover, disclosed above, available to the extent allowed by tax law to offset future net capital gain, if any, will expire on December 31, 2016.
| 10. | RECENT ACCOUNTING PRONOUNCEMENTS |
In September 2008, FASB Staff Position No. FAS 133-1 and FIN 45-4, “Disclosures about Credit Derivatives and Certain Guarantees: An Amendment of FASB Statement No. 133 and FASB Interpretation No. 45” (the “Position”) was issued and is effective for fiscal years and interim periods beginning after November 15, 2008. The Position amends FASB Statement No. 133 (“FAS 133”), Accounting for Derivative Instruments and Hedging Activities, and also amends FASB Interpretation No. 45 (“FIN 45”), Guarantor’s Accounting and Disclosure Requirements for Guarantees, Including Indirect Guarantees of Indebtedness of Others. The amendments to FAS 133 include required disclosure for (i) the nature and terms of the credit derivative, reasons for entering into the credit derivative, the events or circumstances that would require the seller to perform under the credit derivative, and the current status of the payment performance risk of the credit derivative, (ii) the maximum potential amount of future payments (undiscounted) the seller could be required to make under the credit derivative, (iii) the fair value of the credit derivative, and (iv) the nature of any recourse provisions and assets held either as collateral or by third parties. The amendments to FIN 45 require additional disclosures about the current status of the payment/performance risk of a guarantee. At this time, Management is evaluating the implications of FAS 133-1 and FIN 45-4, but they are not expected to materially impact the Series’ financial statements.
In March 2008, FASB Statement of Financial Accounting Standards No. 161, Disclosures about Derivative Instruments and Hedging Activities (“FAS 161”) was issued and is effective for fiscal years and interim periods beginning after November 15, 2008. FAS 161 requires enhanced disclosures about the Series’ derivative and hedging activities, including how such activities are accounted for and their effect on the Series’ financial position and performance. Management is currently evaluating the impact of the adoption of FAS 161, but it is not expected to materially impact the Series’ financial statements.
Report of Independent Registered Public Accounting Firm
To the Board of Directors of Manning & Napier Fund, Inc. and Shareholders of Technology Series:
In our opinion, the accompanying statement of assets and liabilities, including the investment portfolio, and the related statements of operations and of changes in net assets and the financial highlights present fairly, in all material respects, the financial position of the Technology Series (a series of Manning & Napier Fund, Inc., hereafter referred to as the “Series”) at December 31, 2008, and the results of its operations for the year then ended, the changes in its net assets for each of the two years in the period then ended and the financial highlights for each of the five years in the period then ended, in conformity with accounting principles generally accepted in the United States of America. These financial statements and financial highlights (hereafter referred to as “financial statements”) are the responsibility of the Series’ management; our responsibility is to express an opinion on these financial statements based on our audits. We conducted our audits of these financial statements in accordance with the standards of the Public Company Accounting Oversight Board (United States). Those standards require that we plan and perform the audit to obtain reasonable assurance about whether the financial statements are free of material misstatement. An audit includes examining, on a test basis, evidence supporting the amounts and disclosures in the financial statements, assessing the accounting principles used and significant estimates made by management, and evaluating the overall financial statement presentation. We believe that our audits, which included confirmation of securities at December 31, 2008 by correspondence with the custodian, provide a reasonable basis for our opinion.

Columbus, Ohio
February 13, 2009
Supplemental Tax Information (unaudited)
For federal income tax purposes, the Series designates for the current fiscal year $136,146 or, if different, the maximum amount allowable under the tax law as qualified dividend income.
Renewal of Investment Advisory Agreement (unaudited)
At the Manning & Napier Fund, Inc. (the “Fund”) Board of Directors’ (the “Board”) meeting, held on November 5, 2008, the Investment Advisory Agreement (the “Agreement”) between the Fund and Manning & Napier Advisors, Inc. (the “Advisor”) was reviewed by the Board for renewal. In connection with the decision whether to renew the Agreement, a variety of material was prepared for and reviewed by the Board.
Representatives of the Advisor attended the meeting and presented additional oral and written information to the Board to assist the Board in its considerations. The discussion immediately below outlines the materials and information presented to the Board in connection with the Board’s 2008 Annual Review of the Agreement and the conclusions made by the Directors when determining to continue the Agreement.
| | • | | The Board considered the services provided by the Advisor under the Agreement including, among others: deciding what securities to purchase and sell for each Series; arranging for the purchase and sale of such securities by placing orders with broker-dealers; administering the affairs of the Fund (including the books and records of the Fund not maintained by third party service providers such as the custodian or sub-transfer agent); arranging for the insurance coverage for the Fund; and supervising the preparation of tax returns, SEC filings (including registration statements) and reports to shareholders for the Fund. The Board also considered the nature and quality of such services provided under the Agreement in light of the Advisor’s services provided to the Fund for 22 years. The Board discussed the quality of these services with representatives from the Advisor and concluded that the Advisor was performing its services to the Fund required under the Agreement in a reasonable manner. |
| | • | | The Board considered the investment performance of the various Series of the Fund. The investment performance for each Series was reviewed on a cumulative basis since inception and on a one year basis. In addition, annualized performance for the following time periods was considered: inception, three year, five year, ten year, and current market cycle. A market cycle includes periods of both rising and falling markets. Returns for established benchmark indices for each Series were provided for each time period. The Board noted that the various Series were competitive against their respective benchmarks and/or peer groups over various time periods, but in particular over the full market cycle period relevant for the Series. In addition, the Board considered at the meeting (and considers on a quarterly basis) a peer group performance analysis consisting of Morningstar universes of mutual funds with similar investment objectives. The Board discussed the performance with representatives from the Advisor and concluded that the investment performance of each of the Fund’s Series was reasonable based on the Fund’s actual performance and comparative performance, especially performance over the current market cycle. |
| | • | | The Board considered the costs of the Advisor’s services and the profits of the Advisor as they relate to the Advisor’s services to the Fund under the Agreement. In reviewing the Advisor’s costs and profits, the Board discussed the Advisor’s revenues generated from the Fund (on both an actual and adjusted basis) and its expenses associated with providing the services under the Agreement. In addition, the Board reviewed the Advisor’s expenses associated with Fund activities outside of the Agreement (such as expense reimbursements pursuant to expense caps and payments made by the Advisor to third party platforms on which shares of the Fund are available for purchase). It was |
Renewal of Investment Advisory Agreement (unaudited)
| | noted by representatives of the Advisor that 15 of the 25 active Series of the Fund are currently experiencing expenses above the capped expense ratios. After discussing the above costs and profits, the Board concluded that the Advisor’s profitability relating to its services provided under the Agreement was reasonable. |
| | • | | The Board considered the fees and expenses of the various Series of the Fund. The Advisor presented the advisory fees and total expenses for each Series, including the advisory fee adjusted for any expense waivers or reimbursements (either contractual or voluntary) paid by the Advisor. The advisory fees and expense ratios of each Series were compared to an average (on both a mean and median basis) of similar funds as disclosed on the Morningstar database. Representatives of the Advisor discussed with the Board the levels of its advisory fee for each Series of the Fund and as compared to the median and mean advisory fees for similar funds as listed on Morningstar. Expense ratios for every Series, except the High Yield Bond Series, Global Fixed Income Series and the Target Series Class R and Class C, are currently below the median and mean for similar funds as listed on Morningstar. Based on their review of the information provided, the Board concluded that the fees and expenses of each Series of the Fund were reasonable on a comparative basis. |
| | • | | The Board also considered the other benefits the Advisor derives from its relationship with the Fund. Such other benefits include certain research products provided by soft dollars. Given the level of soft dollar transactions involving the Fund, the Board concluded that these additional benefits to the Advisor were reasonable. |
| | • | | In addition to the factors described above, the Board considered the Advisor’s personnel, investment strategies, policies and procedures relating to compliance with personal securities transactions, and reputation, expertise and resources in domestic and foreign financial markets. The Board concluded that these factors support the conclusion that the Advisor performs its services in a reasonable manner. |
| | • | | The Board did not consider economies of scale at this time because of the multiple uses of the Fund (for the Advisor’s discretionary investment account clients in addition to direct investors), the current profitability of the Advisor’s services to the Fund under the Agreement, and the overall size of the Fund complex. |
Based on the Board’s deliberations and their evaluation of the information described above, the Board, including a majority of Directors that are not “interested persons” as defined in the Investment Company Act of 1940, concluded that the compensation under the Agreement was fair and reasonable in light of the services and expenses and such other matters as the Directors considered to be relevant in the exercise of their reasonable judgment. Accordingly, the Board approved the renewal of the Agreement. In the course of their deliberations, the Directors did not identify any particular information that was all important or controlling.
Directors’ and Officers’ Information (unaudited)
The Statement of Additional Information provides additional information about the Fund’s directors and officers and can be obtained without charge by calling 1-800-466-3863, at www.manningnapieradvisors.com, or on the EDGAR Database on the SEC Internet web site (http://www.sec.gov). The following chart shows certain information about the Fund’s officers and directors, including their principal occupations during the last five years. Unless specific dates are provided, the individuals have held the listed positions for longer than five years.
INTERESTED DIRECTOR/OFFICER
| | |
| Name: | | B. Reuben Auspitz* |
| Address: | | 290 Woodcliff Drive |
| | Fairport, NY 14450 |
| Age: | | 61 |
| Current Position(s) Held with Fund: | | Principal Executive Officer, President, Chairman & Director |
| Term of Office1 & Length of Time Served: | | Indefinite - Director since 1984; Vice President 1984 - 2003; President since 2004; Principal Executive Officer since 2002 |
| Principal Occupation(s) During Past 5 Years: | | Executive Vice President; Co-Executive Director; Executive Group Member**; Chief Compliance Officer since 2004 - Manning & Napier Advisors, Inc. President; Director - Manning & Napier Investor Services, Inc. Holds or has held one or more of the following titles for various subsidiaries and affiliates: President, Vice President, Director, Chairman, Treasurer, Chief Compliance Officer or Member. |
| Number of Portfolios Overseen within Fund Complex: | | 28 |
| Other Directorships Held Outside Fund Complex: | | N/A |
| |
| INDEPENDENT DIRECTORS | | |
| |
| Name: | | Stephen B. Ashley |
| Address: | | 290 Woodcliff Drive |
| | Fairport, NY 14450 |
| Age: | | 68 |
| Current Position(s) Held with Fund: | | Director, Audit Committee Member, Governance & Nominating Committee Member |
| Term of Office & Length of Time Served: | | Indefinite - Since 1996 |
| Principal Occupation(s) During Past 5 Years: | | Chairman, Director, President & Chief Executive Officer, The Ashley Group (property management and investment). Chairman (non-executive) 2004-2008; Director 1995-2008 - Fannie Mae (mortgage) |
| Number of Portfolios Overseen within Fund Complex: | | 28 |
| Other Directorships Held Outside Fund Complex: | | The Ashley Group |
| Name: | | Peter L. Faber |
| Address: | | 290 Woodcliff Drive Fairport, NY 14450 |
| Age: | | 70 |
| Current Position(s) Held with Fund: | | Director, Governance & Nominating Committee Member |
| Term of Office & Length of Time Served: | | Indefinite - Since 1987 |
| Principal Occupation(s) During Past 5 Years: | | Senior Counsel, McDermott, Will & Emery LLP (law firm) |
| Number of Portfolios Overseen within Fund Complex: | | 28 |
| Other Directorships Held Outside Fund Complex: | | Partnership for New York City, Inc. |
| | New York Collegium |
| | | Boston Early Music Festival |
| Name: | | Harris H. Rusitzky |
| Address: | | 290 Woodcliff Drive |
| | Fairport, NY 14450 |
| Age: | | 73 |
| Current Position(s) Held with Fund: | | Director, Audit Committee Member, Governance & Nominating Committee Member |
| Term of Office & Length of Time Served: | | Indefinite - Since 1985 |
| Principal Occupation(s) During Past 5 Years: | | President, The Greening Group (business consultants); Partner, The Restaurant Group (restaurants) |
| Number of Portfolios Overseen within Fund Complex: | | 28 |
| Other Directorships Held Outside Fund Complex: | | N/A |
Directors’ and Officers’ Information (unaudited)
| | |
| |
INDEPENDENT DIRECTORS (continued) | | |
| Name: | | Paul A. Brooke |
| Address: | | 290 Woodcliff Drive |
| | Fairport, NY 14450 |
| Age: | | 63 |
| Current Position(s) Held with Fund: | | Director, Audit Committee Member, Governance & Nominating Committee Member |
| Term of Office & Length of Time Served: | | Indefinite - Since 2007 |
| Principal Occupation(s) During Past 5 Years: | | Chairman & CEO, Alsius Corp. (investments); Managing Member, PMSV Holdings LLC (investments) |
| Number of Portfolios Overseen within Fund Complex: | | 28 |
| Other Directorships Held Outside Fund Complex: | | Incyte Corp. |
| | ViroPharma, Inc. |
| | HLTH Corp. |
| | Cheyne Capital International |
| | MPM Bio-equities |
| | GMP Companies |
| | | HoustonPharma |
| |
| OFFICERS | | |
| |
| Name: | | Jeffrey S. Coons, Ph.D., CFA |
| Address: | | 290 Woodcliff Drive |
| | Fairport, NY 14450 |
| Age: | | 45 |
| Current Position(s) Held with Fund: | | Vice President |
| Term of Office1 & Length of Time Served: | | Since 2004 |
| Principal Occupation(s) During Past 5 Years: | | Co-Director of Research since 2002 & Executive Group Member**, Manning & Napier Advisors, Inc. Holds one or more of the following titles for various subsidiaries and affiliates: President, Director, Treasurer or Senior Trust Officer. |
| Number of Portfolios Overseen within Fund Complex: | | 28 |
| Other Directorships Held Outside Fund Complex: | | N/A |
| Name: | | Christine Glavin |
| Address: | | 290 Woodcliff Drive |
| | Fairport, NY 14450 |
| Age: | | 42 |
| Current Position(s) Held with Fund: | | Principal Financial Officer, Chief Financial Officer |
| Term of Office1 & Length of Time Served: | | Principal Financial Officer since 2002; Chief Financial Officer since 2001 |
| Principal Occupation(s) During Past 5 Years: | | Fund Reporting Manager, Manning & Napier Advisors, Inc. |
| Number of Portfolios Overseen within Fund Complex: | | 28 |
| Other Directorships Held Outside Fund Complex: | | N/A |
| Name: | | Jodi L. Hedberg |
| Address: | | 290 Woodcliff Drive |
| | Fairport, NY 14450 |
| Age: | | 41 |
| Current Position(s) Held with Fund: | | Corporate Secretary, Chief Compliance Officer, Anti-Money Laundering Compliance Officer |
| Term of Office1 & Length of Time Served: | | Corporate Secretary since 1997; Chief Compliance Officer since 2004 |
| Principal Occupation(s) During Past 5 Years: | | Director of Compliance, Manning & Napier Advisors, Inc. and affiliates; Corporate Secretary, Manning & Napier Investor Services, Inc. since 2006 |
| Number of Portfolios Overseen within Fund Complex: | | 28 |
| Other Directorships Held Outside Fund Complex: | | N/A |
*Interested Director, within the meaning of the Investment Company Act of 1940 by reason of his position with the Fund’s investment advisor and distributor. Mr. Auspitz serves as the Executive Vice President and Director, Manning & Napier Advisors, Inc. and President and Director, Manning & Napier Investor Services, Inc., the Fund’s distributor.
**The Executive Group performs the duties of the Office of the Chief Executive of Manning & Napier Advisors, Inc.
1The term of office for President, Vice President, Chief Financial Officer, and Corporate Secretary is one year and until their respective successors are chosen and qualified. All other officers’ terms are indefinite.
(THISPAGEINTENTIONALLYLEFTBLANK)
(THISPAGEINTENTIONALLYLEFTBLANK)
Literature Requests (unaudited)
Proxy Voting Policies and Procedures
A description of the policies and procedures that the Fund uses to determine how to vote proxies relating to portfolio securities is available, without charge, upon request:
| | |
By phone | | 1-800-466-3863 |
On the Securities and Exchange Commission’s (SEC) web site | | http://www.sec.gov |
Proxy Voting Record
Information regarding how the Fund voted proxies relating to portfolio securities during the most recent 12-month period ended June 30th is available, without charge, upon request:
| | |
By phone | | 1-800-466-3863 |
On the SEC’s web site | | http://www.sec.gov |
Quarterly Portfolio Holdings
The Series’ complete schedule of portfolio holdings for the 1st and 3rd quarters of each fiscal year are provided on Form N-Q, and are available, without charge, upon request:
| | |
By phone | | 1-800-466-3863 |
On the SEC’s web site | | http://www.sec.gov |
The Series’ Form N-Q may be reviewed and copied at the SEC’s Public Reference Room in Washington, D.C. Information on the operation of the Public Reference Room may be obtained by calling 1-800-SEC-0330.
Prospectus and Statement of Additional Information (SAI)
The prospectus and SAI provide additional information about each Series, including charges, expenses and risks. These documents are available, without charge, upon request:
| | |
By phone | | 1-800-466-3863 |
On the SEC’s web site | | http://www.sec.gov |
On the Advisor’s web site | | http://www.manningnapieradvisors.com |
Additional information available at www.manningnapieradvisors.com
1. Fund Holdings - Month-End
2. Fund Holdings - Quarter-End
3. Shareholder Report - Annual
4. Shareholder Report - Semi-Annual
(a) The registrant has adopted a code of ethics that applies to its principal executive officer, principal financial officer and principal accounting officer. A copy of the registrant’s code of ethics is filed herewith as Exhibit 12(a)(1).
(b) During the period covered by this report, no amendments were made to the provisions of the code of ethics adopted in 2 (a) above.
(c) During the period covered by this report, no implicit or explicit waivers to the provisions of the code of ethics adopted in 2 (a) above were granted.
| (d) | Not applicable to the registrant due to the response given in 2 (c) above. |
| ITEM 3: | AUDIT COMMITTEE FINANCIAL EXPERT |
All of the members of the Audit committee have been determined by the Registrant’s Board of Directors to be Audit Committee Financial Experts as defined in this item. The members of the Audit Committee are: Harris H. Rusitzky, Stephen B. Ashley and Paul A. Brooke. All Audit Committee members are independent under applicable rules. This designation will not increase the designee’s duties, obligations or liability as compared to their duties, obligations and liability as a member of the Audit Committee and of the Board.
| ITEM 4: | PRINCIPAL ACCOUNTANT FEES AND SERVICES |
Principal Accountant Fees and Services
Aggregate fees for professional services rendered for the Manning & Napier Fund, Inc. (Small Cap Series, International Series, World Opportunities Series, Life Sciences Series, Technology Series, Financial Services Series, New York Tax Exempt Series, Ohio Tax Exempt Series, Diversified Tax Exempt Series, Core Bond Series, and Core Plus Bond Series, collectively the “Fund”) by PricewaterhouseCoopers LLP (“PwC”) as of and for the years ended December 31, 2008 and 2007 were:
| | | | | | |
| | | 2008 | | 2007 |
Audit Fees (a) | | $ | 284,990 | | $ | 264,900 |
Audit Related Fees (b) | | | — | | | — |
Tax Fees (c) | | | 71,830 | | | 68,400 |
All Other Fees (d) | | | — | | | — |
| | | | | | |
| | $ | 356,820 | | $ | 333,300 |
| | | | | | |
These fees relate to professional services rendered by PwC for the audit of the Fund’s annual financial statements or services normally provided by the accountant in connection with statutory and regulatory filing or engagements. These services include the audits of the financial statements of the Fund, issuance of consents, income tax provision procedures and assistance with review of documents filed with the SEC.
These fees relate to assurance and related services by PwC that are reasonably related to the performance of the audit of the Fund’s financial statements and are not reported under “Audit Fees” above.
These fees relate to professional services rendered by PwC for tax compliance, tax advice and tax planning. The tax services provided by PwC related to the preparation of the Fund’s federal and state income tax returns, excise tax calculations and returns, a review of the Fund’s calculations of capital gain and income distributions, and additional tax research for compliance purposes.
These fees relate to products and services provided by PwC other than those reported above under “Audit Fees,” “Audit-Related Fees,” and “Tax Fees” above.
There were no amounts that were approved by the Audit Committee pursuant to the de minimus exception (Rule 2-01(c)(7) of Regulation S-X) for the fiscal years ended December 31, 2008 and 2007.
Non-Audit Services to the Fund’s Service Affiliates that were Pre-Approved by the Fund’s Audit Committee
The Fund’s Audit Committee is required to pre-approve non-audit services which meet both the following criteria:
| i) | Directly relate to the Fund’s operations and financial reporting; and |
| ii) | Rendered by PwC to the Fund’s advisor, Manning & Napier Advisors, Inc., and entities in a control relationship with the advisor (“service affiliate”) that provide ongoing services to the Fund. For purposes of disclosure, Manning & Napier Investor Services, Inc. is considered to be a service affiliate. |
| | | | | | |
| | | 2008 | | 2007 |
Audit Related Fees | | $ | 9,392 | | $ | 9,092 |
Tax Fees | | | 5,000 | | | — |
| | | | | | |
| | $ | 14,392 | | $ | 9,092 |
| | | | | | |
The Audit Related fees for the years ended December 31, 2008 and 2007 were for 17Ad-13 internal control examinations, a license for proprietary automated financial statement disclosure software and a license for proprietary authoritative financial reporting and assurance literature library software.
The Tax fees for the year ended December 31, 2008 relate to research on the tax implications for various funds holding a certain investment type.
There were no amounts that were approved by the Audit Committee pursuant to the de minimus exception (Rule 2-01(c)(7) of Regulation S-X) for the fiscal years ended December 31, 2008 and 2007.
Aggregate Fees
Aggregate fees billed to the Fund for non-audit services for 2008 and 2007 were $71,830 and $68,400, respectively. Aggregate fees billed to the Fund’s advisor and service affiliates for non-audit services were $14,392 and $9,092, respectively. These amounts include fees for non-audit services required to be pre-approved and fees for non-audit services that did not require pre-approval since they did not relate to the Fund’s operations and financial reporting.
The Fund’s Audit Committee has considered whether the provisions for non-audit services to the Fund’s advisor and service affiliates, which did not require pre-approval, are compatible with maintaining PwC’s independence.
| ITEM 5: | AUDIT COMMITTEE OF LISTED REGISTRANTS |
Not Applicable.
| ITEM 6: | SCHEDULE OF INVESTMENTS |
See Investment Portfolios under Item 1 on this Form N-CSR.
| ITEM 7: | DISCLOSURE OF PROXY VOTING POLICIES AND PROCEDURES FOR CLOSED-END MANAGEMENT INVESTMENT COMPANIES |
Not applicable.
| ITEM 8: | PORTFOLIO MANAGERS OF CLOSED-END MANAGEMENT INVESTMENT COMPANIES |
Not applicable.
| ITEM 9: | PURCHASES OF EQUITY SECURITIES BY CLOSED-END MANAGEMENT INVESTMENT COMPANY AND AFFILIATED PURCHASERS |
Not applicable.
| ITEM 10: | SUBMISSION OF MATTERS TO A VOTE OF SECURITY HOLDERS |
There have been no material changes to the procedure by which shareholders may recommend nominees to the registrant’s board of directors.
| ITEM 11: | CONTROLS AND PROCEDURES |
(a) Based on their evaluation of the Funds’ disclosure controls and procedures, as of a date within 90 days of the filing date, the Funds’ Principal Executive Officer and Principal Financial Officer have concluded that the Funds’ disclosure controls and procedures are: (i) reasonably designed to ensure that information required to be disclosed in this report is appropriately communicated to the Funds’ officers to allow timely decisions regarding disclosures required in this report; (ii) reasonably designed to ensure that information required to be disclosed in this report is recorded, processed, summarized and reported in a timely manner; and (iii) are effective in achieving the goals described in (i) and (ii) above.
(b) During the second fiscal quarter of the period covered by this report, there have been no changes in the Funds’ internal control over financial reporting that the above officers believe to have materially affected, or to be reasonably likely to materially affect, the Funds’ internal control over financial reporting.
(a)(1) Code of ethics that is subject to the disclosure of Item 2 above.
(a)(2) Separate certifications for the Registrant’s principal executive officer and principal financial officer, as required by Section 302 of the Sarbanes-Oxley Act of 2002 and Rule 30a-2(a) under the Investment Company Act of 1940, are attached as
EX-99.CERT.
(a)(3) Not applicable.
(b) A certification of the Registrant’s principal executive officer and principal financial officer, as required by 18 U.S.C Section 1350, as adopted pursuant to Section 906 of the Sarbanes-Oxley Act of 2002, and Rule 30a-2(b) under the Investment Company Act of 1940, is attached as EX-99.906CERT. The certification furnished pursuant to this paragraph is not deemed to be “filed” for purposes of Section 18 of the Securities Exchange Act of 1934, or otherwise subject to the liability of that section. Such certification is not deemed to be incorporated by reference into any filing under the Securities Act of 1933 or the Securities Exchange Act of 1934, except to the extent that the Registrant specifically incorporates them by reference.
SIGNATURES
Pursuant to the requirements of the Securities Exchange Act of 1934 and the Investment Company Act of 1940, the registrant has duly caused this report to be signed on its behalf by the undersigned, thereunto duly authorized.
Manning & Napier Fund, Inc.
/s/B. Reuben Auspitz
B. Reuben Auspitz
President & Principal Executive Officer of Manning & Napier Fund, Inc.
February 27, 2009
Pursuant to the requirements of the Securities Exchange Act of 1934 and the Investment Company Act of 1940, this report has been signed below by the following persons on behalf of the registrant and in the capacities and on the dates indicated.
/s/B. Reuben Auspitz
B. Reuben Auspitz
President & Principal Executive Officer of Manning & Napier Fund, Inc.
February 27, 2009
/s/Christine Glavin
Christine Glavin
Chief Financial Officer & Principal Financial Officer of Manning & Napier Fund, Inc.
February 27, 2009