UNITED STATES
SECURITIES AND EXCHANGE COMMISSION
Washington, D.C. 20549
FORM N-CSR
CERTIFIED SHAREHOLDER REPORT OF REGISTERED
MANAGEMENT INVESTMENT COMPANIES
Investment Company Act file number 811-04087
|
| Manning & Napier Fund, Inc. |
(Exact name of registrant as specified in charter)
|
| 290 Woodcliff Drive, Fairport, NY 14450 |
(Address of principal executive offices)(Zip Code)
|
| B. Reuben Auspitz 290 Woodcliff Drive, Fairport, NY 14450 |
(Name and address of agent for service)
Registrant’s telephone number, including area code: 585-325-6880
Date of fiscal year end: October 31, 2010
Date of reporting period: November 1, 2009 through October 31, 2010
Form N-CSR is to be used by management investment companies to file reports with the Commission not later than 10 days after the transmission to stockholders of any report that is required to be transmitted to stockholders under Rule 30e-1 under the Investment Company Act of 1940 (17 CFR 270.30e-1). The Commission may use the information provided on Form N-CSR in its regulatory, disclosure review, inspection, and policymaking roles.
A registrant is required to disclose the information specified by Form N-CSR, and the Commission will make this information public. A registrant is not required to respond to the collection of information contained in Form N-CSR unless the Form displays a currently valid Office of Management and Budget (“OMB”) control number. Please direct comments concerning the accuracy of the information collection burden estimate and any suggestions for reducing the burden to Secretary, Securities and Exchange Commission, 100 F Street, NE, Washington, DC 20549. The OMB has reviewed this collection of information under the clearance requirements of 44 U.S.C. § 3507.
| ITEM 1. | REPORTS TO STOCKHOLDERS. |

Management Discussion and Analysis (unaudited)
Dear Shareholders:
The twelve months ending October 31, 2010 were characterized by well-defined swings in investor sentiment. Optimism fueled strong market returns during the fourth quarter of 2009 and through much of the first quarter of 2010, as positive economic releases led investors to believe in the potential for a robust U.S. recovery. However, more negative economic releases into May and June of 2010, coupled with sovereign debt concerns in Europe, led to a dramatic swing in sentiment during the second quarter, with stock markets suffering notable losses. While volatility remained during the third quarter of 2010, September was a particularly strong month, which helped push market indexes into positive territory on a calendar year-to-date basis.
Despite several ups and downs over the past year, the markets made choppy progress, aided by the rally that began in September. For the twelve months ended October 2010, the S&P 500 Index gained 16.53%, while the Russell 3000 earned 18.34%.
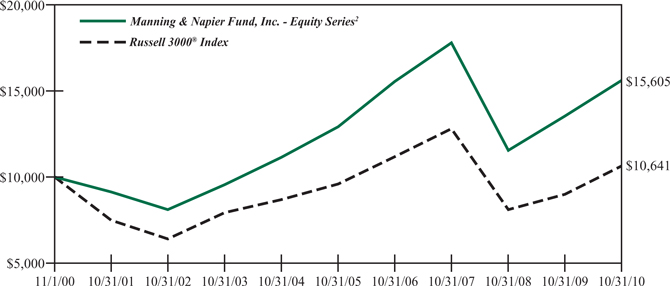
Over the current stock market cycle, which includes the bull market in stocks from October 2002 until November 2007 and the current bear market, the Equity Series continues to provide competitive absolute and relative results for long-term investors. With an annualized return of 9.72% over the current cycle, the Equity Series has outpaced the Russell 3000’s annualized return of 7.49%. While the Equity Series posted a double-digit 15.29% return for the year ending October 31, 2010, it trailed the Russell 3000 benchmark over the last twelve months.
While the Equity Series outperformed at the end of 2009, a bias toward quality and a lower exposure to economically sensitive stocks led the Series to lag behind market returns in early 2010 as investors were overly excited about a recovery. The subsequent market correction during the second quarter affected all equities, without discriminating between high-quality companies and lower quality ones. As a result, short-term swings hurt the Equity Series’ performance. The Series rebounded with the market rally in the third quarter but did not surpass the Russell 3000 benchmark for the year. Nonetheless, Manning & Napier has always been an investment manager that seeks to provide positive returns over full market cycles, which the Equity Series continues to deliver. In this pursuit of long-term gains, we realize that short-term comparisons may be difficult at times.
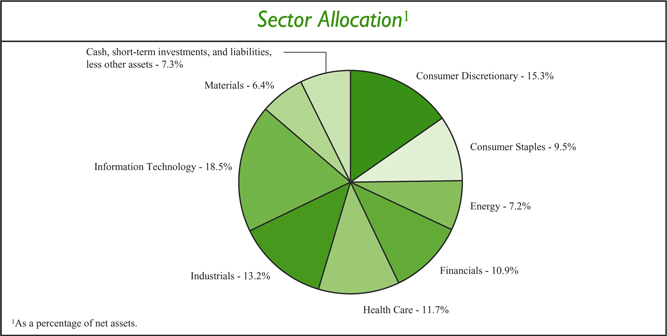
Over the last twelve months, the Equity Series had a relative overweight as compared to the benchmark in the Information Technology and Health Care sectors, as our analysts found quality companies with attractive growth potential in these areas. This higher allocation had a varied impact on the Series’ performance over the past year, yet specific stock selections within the Information Technology and Health Care sectors contributed to positive relative returns more recently during the third quarter. Meanwhile, the Equity Series had a low exposure to Financials relative to the benchmark because regulatory uncertainty and macroeconomic challenges such as indebted consumers, persistently high unemployment, a fragile housing market, and continued loan losses prevented many financial services companies from meeting the requirements of our investment strategies. This underweight to Financials aided returns relative to the benchmark during the past year, with the exception of the market rally in early 2010.
While the markets were volatile over the past twelve months, the outlook for the U.S. economy did not change materially over the past year. Despite swings in positive and negative sentiment, Manning & Napier continues to see a slow growth environment as the economy works through extensive consumer and government debt levels. In such an environment, we are focused on company-specific opportunities that can prosper. Specifically, we are seeking leading companies that can grow and gain market share despite a sluggish economy, particularly multinational businesses that may benefit from exposure to faster-growing foreign markets. Using our active stock selection strategies, we are also seeking opportunities in certain cyclical industries that have a tight relationship between supply and demand.
As 2010 comes to an end, economic momentum has begun to slow. With widespread challenges such as elevated unemployment levels and high government debt burdens, the growth prospects for the developed world remain a concern.
1
Management Discussion and Analysis (unaudited)
In this macroeconomic reality of slow growth, a focus on company and industry fundamentals remains important for identifying quality investment opportunities. Through our disciplined investment strategies, Manning & Napier continues to pursue specific areas of the market that are presenting opportunities, particularly winning companies that have favorable growth prospects. Such an active and flexible approach has been at the core of our investment process since Manning & Napier’s inception 40 years ago.
As always, we appreciate your business.
Sincerely,
Manning & Napier Advisors, Inc.
2
Performance Update as of October 31, 2010 (unaudited)
| | | | | | | | | | | | | | | | |
| | | Average Annual Total Returns
As of October 31, 2010 | |
| | One
Year | | | Five
Year | | | Ten
Year | | | Since
Inception1 | |
Manning & Napier Fund, Inc. - Equity Series2,3 | | | 15.29 | % | | | 3.84 | % | | | 4.55 | % | | | 6.50 | % |
Russell 3000® Index4 | | | 18.34 | % | | | 2.08 | % | | | 0.62 | % | | | 2.74 | % |
The following graph compares the value of a $10,000 investment in the Manning & Napier Fund, Inc. - Equity Series for the ten years ended October 31, 2010 to the Russell 3000® Index.
| 1 | Performance numbers for the Series and Index are calculated from May 1, 1998, the Collective’s inception date (see Note 3 below). |
| 2 | The Series’ performance does not reflect the deduction of taxes that a shareholder would pay on fund distributions or the redemption of shares. The Series’ performance is historical and may not be indicative of future results. The performance returns shown are inclusive of the net expense ratio of the Series. For the year ended October 31, 2010, this net expense ratio was 1.05%. The gross expense ratio, which does not account for any voluntary or contractual waivers currently in effect, was 1.07% for the year ended October 31, 2010. |
| 3 | For periods prior to the inception of the Series on July 10, 2002, the performance figures reflect the performance of the Exeter Trust Company Group Trust for Employee Benefit Plans - All-Equity Collective Investment Trust (the “Collective”), which was managed by the Advisor and reorganized into the Series. The Collective was not open to the public generally, or registered under the Investment Company Act of 1940 (the “1940 Act”), or subject to certain restrictions that are imposed by the 1940 Act. If the Collective had been registered under the 1940 Act, performance may have been adversely affected. Because the fees of the Collective were lower than the Series’ fees, historical performance would have been lower if the Collective had been subject to the same fees. |
| 4 | The Russell 3000® Index is an unmanaged index that consists of 3,000 of the largest U.S. companies based on total market capitalization. The Index returns are based on a market capitalization weighted average of relative price changes of the component stocks plus dividends whose reinvestments are compounded daily. The Index returns, unlike Series returns, do not reflect any fees or expenses. |
3
Shareholder Expense Example (unaudited)
As a shareholder of the Series, you may incur two types of costs: (1) transaction costs, including potential wire charges on redemptions and (2) ongoing costs, including management fees and other Series expenses. This example is intended to help you understand your ongoing costs (in dollars) of investing in the Series and to compare these costs with the ongoing costs of investing in other mutual funds.
The example is based on an investment of $1,000 invested at the beginning of the period and held for the entire period (May 1, 2010 to October 31, 2010).
Actual Expenses
The first line of the table below provides information about actual account values and actual expenses. You may use the information in this line, together with the amount you invested, to estimate the expenses that you paid over the period. Simply divide your account value by $1,000 (for example, an $8,600 account value divided by $1,000 = 8.6), then multiply the result by the number in the first line under the heading entitled “Expenses Paid During Period” to estimate the expenses you paid on your account during this period.
Hypothetical Example for Comparison Purposes
The second line of the table below provides information about hypothetical account values and hypothetical expenses based on the Series’ actual expense ratio and an assumed rate of return of 5% per year before expenses, which is not the Series’ actual return. The hypothetical account values and expenses may not be used to estimate the actual ending account balance or expenses you paid during the period. You may use this information to compare the ongoing costs of investing in the Series and other funds. To do so, compare this 5% hypothetical example with the 5% hypothetical examples that appear in the shareholder reports of the other funds.
Please note that the expenses shown in the table are meant to highlight your ongoing costs only and do not reflect any transaction costs. Therefore, the second line of the table is useful in comparing ongoing costs only, and will not help you determine the relative total costs of owning different funds. In addition, if these transaction costs were included, your costs would have been higher.
| | | | | | | | | | | | |
| | | Beginning
Account Value
5/1/10 | | | Ending
Account Value
10/31/10 | | | Expenses Paid
During Period*
5/1/10-10/31/10 | |
Actual | | $ | 1,000.00 | | | $ | 983.00 | | | $ | 5.25 | |
Hypothetical
(5% return before expenses) | | $ | 1,000.00 | | | $ | 1,019.91 | | | $ | 5.35 | |
| * | Expenses are equal to the Series’ annualized expense ratio (for the six-month period) of 1.05%, multiplied by the average account value over the period, multiplied by 184/365 (to reflect the one-half year period). Expenses are based on the most recent fiscal half year; therefore, the expense ratio stated above may differ from the expense ratio stated in the financial highlights, which is based on one-year data. The Series’ total return would have been lower had certain expenses not been waived during the period. |
4
Portfolio Composition as of October 31, 2010 (unaudited)
5
Investment Portfolio - October 31, 2010
| | | | | | | | |
| | | Shares | | | Value
(Note 2) | |
| | |
COMMON STOCKS - 92.7% | | | | | | | | |
| | |
Consumer Discretionary - 15.3% | | | | | | | | |
Hotels, Restaurants & Leisure - 1.5% | | | | | | | | |
Carnival Corp. | | | 541,870 | | | $ | 23,392,528 | |
| | | | | | | | |
Media - 7.7% | | | | | | | | |
Discovery Communications, Inc. - Class A* | | | 503,520 | | | | 22,462,027 | |
Time Warner, Inc. | | | 1,200,430 | | | | 39,025,979 | |
The Walt Disney Co. | | | 718,870 | | | | 25,958,396 | |
The Washington Post Co. - Class B | | | 84,460 | | | | 33,965,589 | |
| | | | | | | | |
| | | | | | | 121,411,991 | |
| | | | | | | | |
Multiline Retail - 2.8% | | | | | | | | |
Kohl’s Corp.* | | | 536,940 | | | | 27,491,328 | |
Nordstrom, Inc. | | | 440,260 | | | | 16,954,412 | |
| | | | | | | | |
| | | | | | | 44,445,740 | |
| | | | | | | | |
Specialty Retail - 3.3% | | | | | | | | |
Dick’s Sporting Goods, Inc.* | | | 549,140 | | | | 15,826,215 | |
The Home Depot, Inc. | | | 631,550 | | | | 19,502,264 | |
The Sherwin-Williams Co. | | | 243,200 | | | | 17,746,304 | |
| | | | | | | | |
| | | | | | | 53,074,783 | |
| | | | | | | | |
Total Consumer Discretionary | | | | | | | 242,325,042 | |
| | | | | | | | |
Consumer Staples - 9.5% | | | | | | | | |
Beverages - 3.1% | | | | | | | | |
The Coca-Cola Co. | | | 391,550 | | | | 24,009,846 | |
PepsiCo, Inc. | | | 382,950 | | | | 25,006,635 | |
| | | | | | | | |
| | | | | | | 49,016,481 | |
| | | | | | | | |
Food & Staples Retailing - 3.5% | | | | | | | | |
The Kroger Co. | | | 863,890 | | | | 19,005,580 | |
Safeway, Inc. | | | 879,350 | | | | 20,137,115 | |
Walgreen Co. | | | 455,180 | | | | 15,421,499 | |
| | | | | | | | |
| | | | | | | 54,564,194 | |
| | | | | | | | |
Food Products - 2.9% | | | | | | | | |
General Mills, Inc. | | | 306,320 | | | | 11,499,253 | |
H.J. Heinz Co. | | | 297,460 | | | | 14,608,260 | |
Kellogg Co. | | | 249,600 | | | | 12,544,896 | |
Kraft Foods, Inc. - Class A | | | 247,310 | | | | 7,980,694 | |
| | | | | | | | |
| | | | | | | 46,633,103 | |
| | | | | | | | |
Total Consumer Staples | | | | | | | 150,213,778 | |
| | | | | | | | |
Energy - 7.2% | | | | | | | | |
Energy Equipment & Services - 4.3% | | | | | | | | |
Baker Hughes, Inc. | | | 844,850 | | | | 39,141,900 | |
| | | | |
| 6 | | The accompanying notes are an integral part of the financial statements. | | |
Investment Portfolio - October 31, 2010
| | | | | | | | |
| | | Shares | | | Value
(Note 2) | |
| | |
COMMON STOCKS (continued) | | | | | | | | |
| | |
Energy (continued) | | | | | | | | |
Energy Equipment & Services (continued) | | | | | | | | |
Weatherford International Ltd. (Switzerland)* | | | 1,710,960 | | | $ | 28,761,238 | |
| | | | | | | | |
| | | | | | | 67,903,138 | |
| | | | | | | | |
Oil, Gas & Consumable Fuels - 2.9% | | | | | | | | |
Hess Corp. | | | 715,410 | | | | 45,092,292 | |
| | | | | | | | |
Total Energy | | | | | | | 112,995,430 | |
| | | | | | | | |
Financials - 10.9% | | | | | | | | |
Capital Markets - 6.8% | | | | | | | | |
The Bank of New York Mellon Corp.1 | | | 1,630,390 | | | | 40,857,573 | |
The Charles Schwab Corp. | | | 3,096,780 | | | | 47,690,412 | |
Northern Trust Corp. | | | 397,750 | | | | 19,740,333 | |
| | | | | | | | |
| | | | | | | 108,288,318 | |
| | | | | | | | |
Consumer Finance - 2.2% | | | | | | | | |
American Express Co. | | | 841,030 | | | | 34,869,104 | |
| | | | | | | | |
Insurance - 1.9% | | | | | | | | |
The Progressive Corp. | | | 1,399,770 | | | | 29,619,133 | |
| | | | | | | | |
Total Financials | | | | | | | 172,776,555 | |
| | | | | | | | |
Health Care - 11.7% | | | | | | | | |
Health Care Equipment & Supplies - 8.5% | | | | | | | | |
Alere, Inc.* | | | 1,414,130 | | | | 41,787,542 | |
Becton, Dickinson and Co. | | | 476,720 | | | | 36,001,894 | |
Boston Scientific Corp.* | | | 3,826,380 | | | | 24,412,304 | |
Gen-Probe, Inc.* | | | 655,900 | | | | 31,765,237 | |
| | | | | | | | |
| | | | | | | 133,966,977 | |
| | | | | | | | |
Health Care Technology - 2.0% | | | | | | | | |
Cerner Corp.* | | | 372,230 | | | | 32,692,961 | |
| | | | | | | | |
Life Sciences Tools & Services - 1.2% | | | | | | | | |
Thermo Fisher Scientific, Inc.* | | | 359,920 | | | | 18,507,087 | |
| | | | | | | | |
Total Health Care | | | | | | | 185,167,025 | |
| | | | | | | | |
Industrials - 13.2% | | | | | | | | |
Aerospace & Defense - 1.6% | | | | | | | | |
The Boeing Co. | | | 351,310 | | | | 24,816,538 | |
| | | | | | | | |
Air Freight & Logistics - 3.7% | | | | | | | | |
FedEx Corp. | | | 266,010 | | | | 23,334,397 | |
United Parcel Service, Inc. - Class B | | | 519,660 | | | | 34,993,905 | |
| | | | | | | | |
| | | | | | | 58,328,302 | |
| | | | | | | | |
Airlines - 1.7% | | | | | | | | |
Southwest Airlines Co. | | | 1,935,730 | | | | 26,635,645 | |
| | | | | | | | |
| | | | |
| | The accompanying notes are an integral part of the financial statements. | | 7 |
Investment Portfolio - October 31, 2010
| | | | | | | | |
| | | Shares | | | Value
(Note 2) | |
| | |
COMMON STOCKS (continued) | | | | | | | | |
| | |
Industrials (continued) | | | | | | | | |
Commercial Services & Supplies - 1.2% | | | | | | | | |
Waste Management, Inc. | | | 538,350 | | | $ | 19,229,862 | |
| | | | | | | | |
Construction & Engineering - 1.2% | | | | | | | | |
Quanta Services, Inc.* | | | 979,270 | | | | 19,252,448 | |
| | | | | | | | |
Machinery - 1.6% | | | | | | | | |
Pall Corp. | | | 587,800 | | | | 25,081,426 | |
| | | | | | | | |
Professional Services - 1.0% | | | | | | | | |
Manpower, Inc. | | | 286,200 | | | | 15,663,726 | |
| | | | | | | | |
Road & Rail - 1.2% | | | | | | | | |
Norfolk Southern Corp. | | | 314,290 | | | | 19,325,692 | |
| | | | | | | | |
Total Industrials | | | | | | | 208,333,639 | |
| | | | | | | | |
Information Technology - 18.5% | | | | | | | | |
Communications Equipment - 4.8% | | | | | | | | |
Cisco Systems, Inc.* | | | 1,558,130 | | | | 35,572,108 | |
Juniper Networks, Inc.* | | | 438,100 | | | | 14,190,059 | |
QUALCOMM, Inc. | | | 559,450 | | | | 25,247,978 | |
| | | | | | | | |
| | | | | | | 75,010,145 | |
| | | | | | | | |
Computers & Peripherals - 1.2% | | | | | | | | |
EMC Corp.* | | | 895,230 | | | | 18,808,782 | |
| | | | | | | | |
Electronic Equipment, Instruments & Components - 0.5% | | | | | | | | |
Amphenol Corp. - Class A | | | 152,490 | | | | 7,644,324 | |
| | | | | | | | |
Internet Software & Services - 3.5% | | | | | | | | |
Google, Inc. - Class A* | | | 90,110 | | | | 55,236,529 | |
| | | | | | | | |
IT Services - 6.9% | | | | | | | | |
Automatic Data Processing, Inc. | | | 576,140 | | | | 25,592,139 | |
MasterCard, Inc. - Class A | | | 110,800 | | | | 26,598,648 | |
Visa, Inc. - Class A | | | 331,670 | | | | 25,926,644 | |
The Western Union Co. | | | 1,731,490 | | | | 30,474,224 | |
| | | | | | | | |
| | | | | | | 108,591,655 | |
| | | | | | | | |
Software - 1.6% | | | | | | | | |
Autodesk, Inc.* | | | 718,970 | | | | 26,012,335 | |
| | | | | | | | |
Total Information Technology | | | | | | | 291,303,770 | |
| | | | | | | | |
Materials - 6.4% | | | | | | | | |
Chemicals - 3.4% | | | | | | | | |
Monsanto Co. | | | 895,420 | | | | 53,205,856 | |
| | | | | | | | |
Construction Materials - 1.7% | | | | | | | | |
Eagle Materials, Inc. | | | 121,017 | | | | 2,839,059 | |
Martin Marietta Materials, Inc. | | | 146,240 | | | | 11,769,395 | |
| | | | |
| 8 | | The accompanying notes are an integral part of the financial statements. | | |
Investment Portfolio - October 31, 2010
| | | | | | | | |
| | | Shares | | | Value
(Note 2) | |
| | |
COMMON STOCKS (continued) | | | | | | | | |
| | |
Materials (continued) | | | | | | | | |
Construction Materials (continued) | | | | | | | | |
Vulcan Materials Co. | | | 327,940 | | | $ | 11,973,090 | |
| | | | | | | | |
| | | | | | | 26,581,544 | |
| | | | | | | | |
Containers & Packaging - 1.3% | | | | | | | | |
Owens-Illinois, Inc.* | | | 745,040 | | | | 20,883,471 | |
| | | | | | | | |
Total Materials | | | | | | | 100,670,871 | |
| | | | | | | | |
TOTAL COMMON STOCKS
(Identified Cost $1,292,779,438) | | | | | | | 1,463,786,110 | |
| | | | | | | | |
| | |
SHORT-TERM INVESTMENTS - 7.8% | | | | | | | | |
| | |
Dreyfus Cash Management, Inc. - Institutional Shares2, 0.16%
(Identified Cost $122,681,901) | | | 122,681,901 | | | | 122,681,901 | |
| | | | | | | | |
TOTAL INVESTMENTS - 100.5%
(Identified Cost $1,415,461,339) | | | | | | | 1,586,468,011 | |
LIABILITIES, LESS OTHER ASSETS - (0.5%) | | | | | | | (7,145,367 | ) |
| | | | | | | | |
NET ASSETS - 100% | | | | | | $ | 1,579,322,644 | |
| | | | | | | | |
| * | Non-income producing security |
| 1 | The Bank of New York Mellon Corp. is the Series’ custodian and serves as sub-accountant and sub-transfer agent to the Series. |
| 2 | Rate shown is the current yield as of October 31, 2010. |
| | | | |
| | The accompanying notes are an integral part of the financial statements. | | 9 |
Statement of Assets and Liabilities
October 31, 2010
| | | | |
ASSETS: | | | | |
| |
Investments, at value (identified cost $1,415,461,339) (Note 2) | | $ | 1,586,468,011 | |
Receivable for securities sold | | | 8,142,532 | |
Receivable for fund shares sold | | | 3,253,984 | |
Dividends receivable | | | 633,599 | |
| | | | |
| |
TOTAL ASSETS | | | 1,598,498,126 | |
| | | | |
| |
LIABILITIES: | | | | |
| |
Accrued management fees (Note 3) | | | 1,279,092 | |
Accrued transfer agent fees (Note 3) | | | 93,686 | |
Accrued fund accounting and administration fees (Note 3) | | | 49,949 | |
Accrued Chief Compliance Officer service fees (Note 3) | | | 247 | |
Payable for securities purchased | | | 17,204,454 | |
Payable for fund shares repurchased | | | 427,946 | |
Other payables and accrued expenses | | | 120,108 | |
| | | | |
| |
TOTAL LIABILITIES | | | 19,175,482 | |
| | | | |
| |
TOTAL NET ASSETS | | $ | 1,579,322,644 | |
| | | | |
| |
NET ASSETS CONSIST OF: | | | | |
| |
Capital stock | | $ | 882,007 | |
Additional paid-in-capital | | | 1,434,343,574 | |
Undistributed net investment income | | | 1,887,468 | |
Accumulated net realized loss on investments | | | (28,797,077 | ) |
Net unrealized appreciation on investments | | | 171,006,672 | |
| | | | |
| |
TOTAL NET ASSETS | | $ | 1,579,322,644 | |
| | | | |
| |
NET ASSET VALUE, OFFERING PRICE AND REDEMPTION PRICE PER SHARE - Class A
($1,579,322,644/88,200,735 shares) | | $ | 17.91 | |
| | | | |
| | | | |
| 10 | | The accompanying notes are an integral part of the financial statements. | | |
Statement of Operations
For the Year Ended October 31, 2010
| | | | |
INVESTMENT INCOME: | | | | |
| |
Dividends | | $ | 15,658,446 | |
Interest | | | 4,961 | |
| | | | |
| |
Total Investment Income | | | 15,663,407 | |
| | | | |
| |
EXPENSES: | | | | |
| |
Management fees (Note 3) | | | 12,867,548 | |
Transfer agent fees (Note 3) | | | 374,441 | |
Fund accounting and administration fees (Note 3) | | | 202,745 | |
Directors’ fees (Note 3) | | | 21,651 | |
Chief Compliance Officer service fees (Note 3) | | | 2,724 | |
Custodian fees | | | 69,700 | |
Miscellaneous | | | 263,533 | |
| | | | |
| |
Total Expenses | | | 13,802,342 | |
Less reduction of expenses (Note 3) | | | (291,417 | ) |
| | | | |
| |
Net Expenses | | | 13,510,925 | |
| | | | |
| |
NET INVESTMENT INCOME | | | 2,152,482 | |
| | | | |
| |
REALIZED AND UNREALIZED GAIN ON INVESTMENTS: | | | | |
| |
Net realized gain on investments | | | 68,753,804 | |
Net change in unrealized appreciation on investments | | | 106,441,527 | |
| | | | |
| |
NET REALIZED AND UNREALIZED GAIN ON INVESTMENTS | | | 175,195,331 | |
| | | | |
| |
NET INCREASE IN NET ASSETS RESULTING FROM OPERATIONS | | $ | 177,347,813 | |
| | | | |
| | | | |
| | The accompanying notes are an integral part of the financial statements. | | 11 |
Statements of Changes in Net Assets
| | | | | | | | |
| | | For the
Year Ended
10/31/10 | | | For the
Year Ended
10/31/09 | |
INCREASE (DECREASE) IN NET ASSETS: | | | | | | | | |
| | |
OPERATIONS: | | | | | | | | |
| | |
Net investment income | | $ | 2,152,482 | | | $ | 1,741,459 | |
Net realized gain (loss) on investments | | | 68,753,804 | | | | (59,388,937 | ) |
Net change in unrealized appreciation (depreciation) on investments | | | 106,441,527 | | | | 195,678,137 | |
| | | | | | | | |
| | |
Net increase from operations | | | 177,347,813 | | | | 138,030,659 | |
| | | | | | | | |
| | |
DISTRIBUTIONS TO SHAREHOLDERS (Note 8): | | | | | | | | |
| | |
From net investment income | | | (1,082,233 | ) | | | (2,526,440 | ) |
| | | | | | | | |
| | |
CAPITAL STOCK ISSUED AND REPURCHASED: | | | | | | | | |
| | |
Net increase from capital share transactions (Note 5) | | | 400,013,978 | | | | 365,955,855 | |
| | | | | | | | |
| | |
Net increase in net assets | | | 576,279,558 | | | | 501,460,074 | |
| | |
NET ASSETS: | | | | | | | | |
| | |
Beginning of year | | | 1,003,043,086 | | | | 501,583,012 | |
| | | | | | | | |
| | |
End of year (including undistributed net investment income of $1,887,468 and $814,741, respectively) | | $ | 1,579,322,644 | | | $ | 1,003,043,086 | |
| | | | | | | | |
| | | | |
| 12 | | The accompanying notes are an integral part of the financial statements. | | |
Financial Highlights
| | | | | | | | | | | | | | | | | | | | |
| | | For the Years Ended | |
| | | 10/31/10 | | | 10/31/09 | | | 10/31/08 | | | 10/31/07 | | | 10/31/06 | |
Per share data (for a share outstanding throughout each year): | | | | | | | | | | | | | | | | | | | | |
Net asset value - Beginning of year | | $ | 15.55 | | | $ | 13.34 | | | $ | 21.43 | | | $ | 19.19 | | | $ | 17.24 | |
| | | | | | | | | | | | | | | | | | | | |
Income (loss) from investment operations: | | | | | | | | | | | | | | | | | | | | |
Net investment income | | | 0.03 | 1 | | | 0.04 | 1 | | | 0.07 | | | | 0.06 | | | | 0.04 | |
Net realized and unrealized gain (loss) on investments | | | 2.35 | | | | 2.24 | | | | (7.35 | ) | | | 2.65 | | | | 3.25 | |
| | | | | | | | | | | | | | | | | | | | |
Total from investment operations | | | 2.38 | | | | 2.28 | | | | (7.28 | ) | | | 2.71 | | | | 3.29 | |
| | | | | | | | | | | | | | | | | | | | |
Less distributions to shareholders: | | | | | | | | | | | | | | | | | | | | |
From net investment income | | | (0.02 | ) | | | (0.07 | ) | | | (0.07 | ) | | | (0.05 | ) | | | — | |
From net realized gain on investments | | | — | | | | — | | | | (0.74 | ) | | | (0.42 | ) | | | (1.34 | ) |
| | | | | | | | | | | | | | | | | | | | |
Total distributions to shareholders | | | (0.02 | ) | | | (0.07 | ) | | | (0.81 | ) | | | (0.47 | ) | | | (1.34 | ) |
| | | | | | | | | | | | | | | | | | | | |
Net asset value - End of year | | $ | 17.91 | | | $ | 15.55 | | | $ | 13.34 | | | $ | 21.43 | | | $ | 19.19 | |
| | | | | | | | | | | | | | | | | | | | |
Net assets - End of year (000’s omitted) | | $ | 1,579,323 | | | $ | 1,003,043 | | | $ | 501,583 | | | $ | 191,026 | | | $ | 8,310 | |
| | | | | | | | | | | | | | | | | | | | |
Total return2 | | | 15.29 | % | | | 17.23 | % | | | (35.09 | %) | | | 14.37 | % | | | 20.36 | % |
Ratios (to average net assets)/Supplemental Data: | | | | | | | | | | | | | | | | | | | | |
Expenses* | | | 1.05 | % | | | 1.05 | % | | | 1.05 | % | | | 1.05 | % | | | 1.05 | % |
Net investment income | | | 0.17 | % | | | 0.26 | % | | | 0.56 | % | | | 0.45 | % | | | 0.35 | % |
Portfolio turnover | | | 56 | % | | | 50 | % | | | 63 | % | | | 44 | % | | | 55 | % |
|
* The investment advisor did not impose all or a portion of its management fees, CCO fees, fund accounting and transfer agent fees, and other fees in some years and in some years paid a portion of the Series’ expenses. If these expenses had been incurred by the Series, the expense ratio (to average net assets) would have been increased by the following amount: | |
| | | | | |
| | | 0.02 | % | | | 0.06 | % | | | 0.06 | % | | | 0.11 | % | | | 1.24 | % |
| 1 | Calculated based on average shares outstanding during the year. |
| 2 | Represents aggregate total return for the years indicated, and assumes reinvestment of all distributions. Total returns would have been lower had certain expenses not been waived or reimbursed during certain years. |
| | | | |
| | The accompanying notes are an integral part of the financial statements. | | 13 |
Notes to Financial Statements
Equity Series (the “Series”) is a no-load diversified series of Manning & Napier Fund, Inc. (the “Fund”). The Fund is organized in Maryland and is registered under the Investment Company Act of 1940, as amended, as an open-end management investment company.
The Series’ investment objective is to provide long-term growth of capital, primarily through investments in U.S. common stocks.
The Fund’s Advisor is Manning & Napier Advisors, Inc. (the “Advisor”). Shares of the Series are offered to investors and employees of the Advisor and its affiliates. The total authorized capital stock of the Fund consists of 10.0 billion shares of common stock each having a par value of $0.01. As of October 31, 2010, 6.2 billion shares have been designated in total among 29 series, of which 200 million have been designated as Equity Series Class A common stock.
| 2. | SIGNIFICANT ACCOUNTING POLICIES |
Security Valuation
Portfolio securities, including domestic equities, listed on an exchange other than the NASDAQ National Market System are valued at the latest quoted sales price of the exchange on which the security is primarily traded. Securities not traded on valuation date or securities not listed on an exchange are valued at the latest quoted bid price provided by the Fund’s pricing service. Securities listed on the NASDAQ National Market System are valued in accordance with the NASDAQ Official Closing Price.
Short-term investments that mature in sixty days or less are valued at amortized cost, which approximates market value. Investments in open-end investment companies are valued at their net asset value per share on valuation date.
Volume and level of activity in established markets for an asset or liability are evaluated to determine whether recent transactions and quoted prices are determinative of fair value. Where there have been significant decreases in volume and level of activity, further analysis and adjustment may be necessary to estimate fair value. The Series measures fair value in these instances by the use of inputs and valuation techniques which may be based upon current market prices of securities that are comparable in coupon, rating, maturity and industry and/or expectation of future cash flows. As a result of trading in relatively thin markets and/or markets that experience significant volatility, the prices used by the Series to value these securities may differ from the value that would be realized if these securities were sold, and the differences could be material.
Securities for which representative valuations or prices are not available from the Fund’s pricing service may be valued at fair value. Due to the inherent uncertainty of valuations of such securities, the fair value may differ significantly from the values that would have been used had a ready market for such securities existed. If trading or events occurring after the close of the principal market in which securities are traded are expected to materially affect the value of those securities, then they may be valued at their fair value, taking this trading or these events into account. Fair value is determined in good faith by the Advisor under procedures approved by and under the general supervision and responsibility of the Fund’s Board of Directors (the “Board”).
Various inputs are used in determining the value of the Series’ assets or liabilities carried at market value. These inputs are summarized in three broad levels. Level 1 includes quoted prices in active markets for identical assets and liabilities. Level 2 includes other significant observable inputs (including quoted prices for similar securities, interest rates, prepayment speeds, credit risk, etc.). Level 3 includes significant unobservable inputs (including the Series’ own assumptions in determining the fair value of investments). The inputs or methodology used for valuing securities are not necessarily an indication of the risk associated with investing in those securities.
14
Notes to Financial Statements
| 2. | SIGNIFICANT ACCOUNTING POLICIES (continued) |
Security Valuation (continued)
The following is a summary of the valuation levels used for major security types as of October 31, 2010 in valuing the Series’ assets or liabilities carried at market value:
| | | | | | | | | | | | | | | | |
Description | | Total | | | Level 1 | | | Level 2 | | | Level 3 | |
Assets: | | | | | | | | | | | | | | | | |
Equity securities* | | $ | 1,463,786,110 | | | $ | 1,463,786,110 | | | $ | — | | | $ | — | |
Preferred securities | | | — | | | | — | | | | — | | | | — | |
Debt securities | | | — | | | | — | | | | — | | | | — | |
Mutual funds | | | 122,681,901 | | | | 122,681,901 | | | | — | | | | — | |
Other financial instruments**: | | | — | | | | — | | | | — | | | | — | |
| | | | | | | | | | | | | | | | |
Total assets: | | | 1,586,468,011 | | | | 1,586,468,011 | | | | — | | | | — | |
| | | | | | | | | | | | | | | | |
Liabilities: | | | | | | | | | | | | | | | | |
Other financial instruments**: | | | — | | | | — | | | | — | | | | — | |
| | | | | | | | | | | | | | | | |
Total Liabilities: | | | — | | | | — | | | | — | | | | — | |
| | | | | | | | | | | | | | | | |
Total | | $ | 1,586,468,011 | | | $ | 1,586,468,011 | | | $ | — | | | $ | — | |
| | | | | | | | | | | | | | | | |
| * | Includes common stock, warrants and rights. Please see the Investment Portfolio for industry classification. |
| ** | Other financial instruments are derivative instruments not reflected in the Investment Portfolio, such as futures, forwards and swap contracts, which are valued at the unrealized appreciation/depreciation on the instrument. As of October 31, 2010, the Series did not hold any derivative instruments. |
There were no Level 3 securities held by the Series as of October 31, 2009 or October 31, 2010.
The Fund’s policy is to recognize transfers in and transfers out of the valuation levels as of the beginning of the reporting period. There were no significant transfers between Level 1 and Level 2 during the year ended October 31, 2010.
Additional disclosure surrounding the activity in Level 3 fair value measurement will also be effective for fiscal years beginning after December 15, 2010. Management has concluded that this will not have a material impact on the Series’ financial statements.
Security Transactions, Investment Income and Expenses
Security transactions are accounted for on trade date. Dividend income is recorded on the ex-dividend date, except that if the ex-dividend date has passed, certain dividends from foreign securities are recorded as soon as the Fund is informed of the ex-dividend date. Non-cash dividends, if any, are recorded at the fair market value of the securities received. Interest income, including amortization of premium and accretion of discounts using the effective interest method, is earned from settlement date and accrued daily.
Expenses are recorded on an accrual basis. Most expenses of the Fund can be attributed to a specific series. Expenses which cannot be directly attributed are apportioned among the series in the Fund in such a manner as deemed equitable by the Fund’s Board, taking into consideration, among other things, the nature and type of expense.
The Series uses the identified cost method for determining realized gain or loss on investments for both financial statement and federal income tax reporting purposes.
15
Notes to Financial Statements
| 2. | SIGNIFICANT ACCOUNTING POLICIES (continued) |
Federal Taxes
The Series’ policy is to comply with the provisions of the Internal Revenue Code applicable to regulated investment companies. The Series is not subject to federal income tax or excise tax to the extent that the Series distributes to shareholders each year its taxable income, including any net realized gains on investments, in accordance with requirements of the Internal Revenue Code. Accordingly, no provision for federal income tax or excise tax has been made in the financial statements.
Management evaluates its tax positions to determine if the tax positions taken meet the minimum recognition threshold in connection with accounting for uncertainties in income tax positions taken or expected to be taken for the purposes of measuring and recognizing tax liabilities in the financial statements. Recognition of tax benefits of an uncertain tax position is required only when the position is “more likely than not” to be sustained assuming examination by taxing authorities. At October 31, 2010, the Series has recorded no liability for net unrecognized tax benefits relating to uncertain income tax positions taken or expected to be taken in future tax returns.
The Series files income tax returns in the U.S. federal jurisdiction, various states and foreign jurisdictions, as required. No income tax returns are currently under investigation. The statute of limitations on the Series’ tax returns remains open for the years ended October 31, 2007 through October 31, 2010. The Fund is not aware of any tax positions for which it is reasonably possible that the total amounts of unrecognized tax benefits will significantly change in the next twelve months.
Additionally, based on the Fund’s understanding of the tax rules and rates related to income, gains and transactions for foreign jurisdictions in which it invests, the Series will provide for foreign taxes, and where appropriate, deferred foreign tax.
Distributions of Income and Gains
Distributions to shareholders of net investment income and net realized gains are made annually. An additional distribution may be necessary to avoid taxation of the Series. Distributions are recorded on the ex-dividend date.
Indemnifications
The Fund’s organizational documents provide former and current directors and officers with a limited indemnification against liabilities arising in connection with the performance of their duties to the Fund. In the normal course of business, the Fund may also enter into contracts that provide general indemnifications. The Fund’s maximum exposure under these arrangements is unknown as this would be dependent on future claims that may be made against the Fund. The risk of material loss from such claims is considered remote.
Other
The preparation of financial statements in conformity with accounting principles generally accepted in the United States of America requires management to make estimates and assumptions that affect the reported amounts of assets and liabilities and the disclosure of contingent assets and liabilities at the date of the financial statements and the reported amounts of income and expenses during the reporting period. Actual results could differ from those estimates.
| 3. | TRANSACTIONS WITH AFFILIATES |
The Fund has an Investment Advisory Agreement (the “Agreement”) with the Advisor, for which the Series pays a fee, computed daily and payable monthly, at an annual rate of 1.00% of the Series’ average daily net assets.
Under the Agreement, personnel of the Advisor provide the Series with advice and assistance in the choice of investments and the execution of securities transactions, and otherwise maintain the Series’ organization. The Advisor also provides the Fund with necessary office space and fund administration and support services. The salaries of
16
Notes to Financial Statements
| 3. | TRANSACTIONS WITH AFFILIATES (continued) |
all officers of the Fund (except a percentage of the Fund’s Chief Compliance Officer’s salary, which is paid by the Fund), and of all Directors who are “affiliated persons” of the Fund, or of the Advisor, and all personnel of the Fund, or of the Advisor, performing services relating to research, statistical and investment activities, are paid by the Advisor. Each “non-affiliated” Director receives an annual stipend, which is allocated among all the active series of the Fund. In addition, these Directors also receive a fee per Board meeting attended for each active series of the Fund plus a fee for each committee meeting attended.
The Advisor has contractually agreed, until at least February 28, 2011, to waive its fee and, if necessary, pay other operating expenses of the Series in order to maintain total direct annual fund operating expenses for the Series at no more than 1.05% of average daily net assets each year. Accordingly, the Advisor waived fees of $290,658 for the year ended October 31, 2010, which is included as a reduction of expenses on the Statement of Operations. The Advisor voluntarily waived additional fees of $759 for the year ended October 31, 2010, which is also included as a reduction of expenses on the Statement of Operations. The Advisor is not eligible to recoup any expenses that have been waived or reimbursed in prior years.
Manning & Napier Investor Services, Inc., a registered broker-dealer affiliate of the Advisor, acts as distributor for the Fund’s shares. The services of Manning & Napier Investor Services, Inc. are provided at no additional cost to the Series.
For fund accounting and transfer agent services through November 7, 2009, the Fund paid the Advisor an annual fee of 0.055% of the Fund’s average daily net assets up to $4.5 billion, 0.03% of the Fund’s average daily net assets between $4.5 billion and $7.5 billion, and 0.02% of the Fund’s average daily net assets over $7.5 billion. Additionally, certain transaction and account-based fees and out-of-pocket expenses, including charges for reporting relating to the Fund’s compliance program, were charged. Prior to October 12, 2009 (for sub-accountant) and November 9, 2009 (for sub-transfer agent), the Advisor had an agreement with Citi Fund Services Ohio, Inc. (“Citi”) under which Citi served as sub-accountant and sub-transfer agent.
The Advisor has entered into agreements dated October 12, 2009 and November 9, 2009 with PNC Global Investment Servicing (“PNCGIS”) under which PNCGIS serves as sub-accountant services agent and sub-transfer agent, respectively. Effective November 7, 2009 under the amended master services agreement, the Fund pays the Advisor an annual fee related to Fund Accounting and administration of 0.0175% on the first $3 billion of average daily net assets (excluding Target Series); 0.015% on the next $3 billion of average daily net assets (excluding Target Series); and 0.01% of the average daily net assets in excess of $6 billion (excluding Target Series); plus a base fee of $25,500 per Series. Transfer Agent fees are charged to the Fund on a per account basis. Additionally, certain transaction-, cusip-based fees and out-of-pocket expenses, including charges for reporting relating to the Fund’s compliance program, are charged.
Effective July 1, 2010, PNCGIS, which serves as the Series’ sub-accountant services agent and sub-transfer agent, was sold to The Bank of New York Mellon Corporation, the Series’ custodian. At the close of the sale, PNCGIS changed its name to BNY Mellon Investment Servicing (U.S.) Inc. (“BNY”).
Expenses not directly attributable to a Series are allocated based on each Series’ relative net assets or number of accounts, depending on the expense.
| 4. | PURCHASES AND SALES OF SECURITIES |
For the year ended October 31, 2010, purchases and sales of securities, other than U.S. Government securities and short-term securities, were $1,015,979,296 and $683,982,759, respectively. There were no purchases or sales of U.S. Government securities.
17
Notes to Financial Statements
| 5. | CAPITAL STOCK TRANSACTIONS |
Transactions in shares of Equity Series were:
| | | | | | | | | | | | | | | | |
| | | For the Year
Ended 10/31/10 | | | For the Year
Ended 10/31/09 | |
| | | Shares | | | Amount | | | Shares | | | Amount | |
Sold | | | 41,139,303 | | | $ | 693,732,694 | | | | 45,553,334 | | | $ | 605,942,070 | |
Reinvested | | | 26,609 | | | | 443,305 | | | | 81,554 | | | | 954,994 | |
Repurchased | | | (17,450,351 | ) | | | (294,162,021 | ) | | | (18,762,919 | ) | | | (240,941,209 | ) |
| | | | | | | | | | | | | | | | |
Total | | | 23,715,561 | | | $ | 400,013,978 | | | | 26,871,969 | | | $ | 365,955,855 | |
| | | | | | | | | | | | | | | | |
At October 31, 2010, the retirement plan of the Advisor and its affiliates owned 190,301 shares of the Series (0.2% of shares outstanding) valued at $3,408,296.
The Series may trade in instruments including written and purchased options, forward foreign currency exchange contracts and futures contracts and other derivatives in the normal course of investing activities to assist in managing exposure to various market risks. The Series may be subject to various elements of risk and may involve, to a varying degree, elements of risk in excess of the amounts recognized for financial statement purposes. These risks include: the risk that changes in the value of a derivative may not correlate perfectly with the underlying asset, rate or index, counterparty credit risk related to over the counter derivatives counterparties’ failure to perform under contract terms, liquidity risk related to the lack of a liquid market for these contracts allowing the fund to close out its position(s) and documentation risk relating to disagreement over contract terms. No such investments were held by the Series on October 31, 2010.
Investing in securities of foreign companies and foreign governments involves special risks and considerations not typically associated with investing in securities of domestic companies and the U.S. Government. These risks include revaluation of currencies and future adverse political and economic developments. Moreover, securities of foreign companies and foreign governments and their markets may be less liquid and their prices more volatile than those of comparable domestic companies and the U.S. Government.
| 8. | FEDERAL INCOME TAX INFORMATION |
The amount and characterization of certain income and capital gains to be distributed are determined in accordance with federal income tax regulations, which may differ from accounting principles generally accepted in the United States of America. These differences are primarily due to differing book and tax treatments in the timing of the recognition of net investment income or gains and losses, including losses deferred due to wash sales. The Series may periodically make reclassifications among its capital accounts to reflect income and gains available for distribution (or available capital loss carryovers) under income tax regulations, without impacting the Series’ net asset value. Any such reclassifications are not reflected in the financial highlights.
18
Notes to Financial Statements
| 8. | FEDERAL INCOME TAX INFORMATION (continued) |
The tax character of distributions paid were as follows:
| | | | | | | | |
| | | For the Year
Ended
10/31/10 | | | For the Year
Ended
10/31/09 | |
Ordinary income | | $ | 1,082,233 | | | $ | 2,526,440 | |
At October 31, 2010, the tax basis of components of distributable earnings and the net unrealized appreciation based on the identified cost for federal income tax purposes were as follows:
| | | | |
Cost for federal income tax purposes | | $ | 1,426,866,971 | |
Unrealized appreciation | | $ | 194,351,494 | |
Unrealized depreciation | | | (34,750,454 | ) |
| | | | |
Net unrealized appreciation | | $ | 159,601,040 | |
| | | | |
Undistributed ordinary income | | | 1,887,468 | |
Capital loss carryover | | | 17,391,445 | |
The capital loss carryover, disclosed above, available to the extent allowed by tax law to offset future net capital gain, if any, will expire on October 31, 2017.
The capital loss carryover utilized in the current year was $62,116,175.
19
Report of Independent Registered Public Accounting Firm
To the Board of Directors of Manning & Napier Fund, Inc. and Shareholders of Equity Series:
In our opinion, the accompanying statement of assets and liabilities, including the investment portfolio, and the related statements of operations and of changes in net assets and the financial highlights present fairly, in all material respects, the financial position of the Equity Series (a series of Manning & Napier Fund, Inc., hereafter referred to as the “Series”) at October 31, 2010, and the results of its operations for the year then ended, the changes in its net assets for each of the two years in the period then ended and the financial highlights for each of the five years in the period then ended, in conformity with accounting principles generally accepted in the United States of America. These financial statements and financial highlights (hereafter referred to as “financial statements”) are the responsibility of the Series’ management. Our responsibility is to express an opinion on these financial statements based on our audits. We conducted our audits of these financial statements in accordance with the standards of the Public Company Accounting Oversight Board (United States). Those standards require that we plan and perform the audit to obtain reasonable assurance about whether the financial statements are free of material misstatement. An audit includes examining, on a test basis, evidence supporting the amounts and disclosures in the financial statements, assessing the accounting principles used and significant estimates made by management, and evaluating the overall financial statement presentation. We believe that our audits, which included confirmation of securities at October 31, 2010 by correspondence with the custodian and brokers, provide a reasonable basis for our opinion.

New York, New York
December 21, 2010
20
Supplemental Tax Information (unaudited)
All designations are based on financial information available as of the date of this annual report and, accordingly are subject to change.
For federal income tax purposes, the Series designates for the current fiscal year $1,082,233 or, if different, the maximum amount allowable under the tax law, as qualified dividend income.
For corporate shareholders, the percentage of investment income (dividend income plus short-term gains, if any) that qualifies for the dividends received deduction for the current fiscal year is 99.85%.
21
Directors’ and Officers’ Information (unaudited)
The Statement of Additional Information provides additional information about the Fund’s directors and officers and can be obtained without charge by calling 1-800-466-3863, at www.manningnapieradvisors.com, or on the EDGAR Database on the SEC Internet web site (http:// www.sec.gov). The following chart shows certain information about the Fund’s officers and directors, including their principal occupations during the last five years. Unless specific dates are provided, the individuals have held the listed positions for longer than five years.
INTERESTED DIRECTOR/OFFICER
| | |
| Name: | | B. Reuben Auspitz* |
| Address: | | 290 Woodcliff Drive Fairport, NY 14450 |
| Age: | | 63 |
| Current Position(s) Held with Fund: | | Principal Executive Officer, President, Chairman & Director |
| Term of Office1 & Length of Time Served: | | Indefinite - Director since 1984; Vice President 1984 - 2003; President since 2004; Principal Executive Officer since 2002 |
| Principal Occupation(s) During Past 5 Years: | | Executive Vice President; Executive Group Member**; Chief Compliance Officer since 2004; Vice Chairman since June 2010; Co-Executive Director from 2003-2010 - Manning & Napier Advisors, Inc. President; Director - Manning & Napier Investor Services, Inc. Holds or has held one or more of the following titles for various subsidiaries and affiliates: President, Vice President, Director, Chairman, Treasurer, Chief Compliance Officer or Member. |
| Number of Portfolios Overseen within Fund Complex: | | 29 |
| Other Directorships Held Outside Fund Complex: | | N/A |
| |
| INDEPENDENT DIRECTORS | | |
| Name: | | Stephen B. Ashley |
| Address: | | 290 Woodcliff Drive |
| | Fairport, NY 14450 |
| Age: | | 70 |
| Current Position(s) Held with Fund: | | Director, Audit Committee Member, Governance & Nominating Committee Member |
| Term of Office & Length of Time Served: | | Indefinite - Since 1996 |
| Principal Occupation(s) During Past 5 Years: | | Chairman, Director, President & Chief Executive Officer, The Ashley Group (property management and investment). Chairman (non-executive) 2004-2008; Director 1995-2008 - Fannie Mae (mortgage) |
| Number of Portfolios Overseen within Fund Complex: | | 29 |
| Other Directorships Held Outside Fund Complex: | | The Ashley Group (1995-2008) |
| | | Genesee Corporation (1987-2007) |
| Name: | | Peter L. Faber |
| Address: | | 290 Woodcliff Drive |
| | Fairport, NY 14450 |
| Age: | | 72 |
| Current Position(s) Held with Fund: | | Director, Governance & Nominating Committee Member |
| Term of Office & Length of Time Served: | | Indefinite - Since 1987 |
| Principal Occupation(s) During Past 5 Years: | | Senior Counsel since 2006, Partner (1995 - 2006) - McDermott, Will & Emery LLP (law firm) |
| Number of Portfolios Overseen within Fund Complex: | | 29 |
| Other Directorships Held Outside Fund Complex: | | Partnership for New York City, Inc. (non-profit) New York Collegium (non-profit) Boston Early Music Festival (non-profit) |
22
Directors’ and Officers’ Information (unaudited)
INDEPENDENT DIRECTORS (continued)
| | |
| Name: | | Harris H. Rusitzky |
| Address: | | 290 Woodcliff Drive |
| | Fairport, NY 14450 |
| Age: | | 75 |
| Current Position(s) Held with Fund: | | Director, Audit Committee Member, Governance & Nominating Committee Member |
| Term of Office & Length of Time Served: | | Indefinite - Since 1985 |
| Principal Occupation(s) During Past 5 Years: | | President, The Greening Group (business consultants) since 1994; |
| | Partner, The Restaurant Group (restaurants) since 2006 |
| Number of Portfolios Overseen within Fund Complex: | | 29 |
| Other Directorships Held Outside Fund Complex: | | N/A |
| |
| Name: | | Paul A. Brooke |
| Address: | | 290 Woodcliff Drive |
| | Fairport, NY 14450 |
| Age: | | 64 |
| Current Position(s) Held with Fund: | | Director, Audit Committee Member, Governance & Nominating Committee Member |
| Term of Office & Length of Time Served: | | Indefinite - Since 2007 |
| Principal Occupation(s) During Past 5 Years: | | Chairman & CEO, Alsius Corp. (investments); Managing Member, PMSV Holdings LLC (investments) |
| Number of Portfolios Overseen within Fund Complex: | | 29 |
| Other Directorships Held Outside Fund Complex: | | Incyte Corp. (2000-present) |
| | ViroPharma, Inc. (2000-present) |
| | HLTH Corp. (2000-present) |
| | Cheyne Capital International (2000-present) |
| | MPM Bio-equities (2000-present) |
| | GMP Companies (2000-present) |
| | | HoustonPharma (2000-present) |
| |
| Name: | | Richard M. Hurwitz |
| Address: | | 290 Woodcliff Drive |
| | Fairport, NY 14450 |
| Age: | | 47 |
| Current Position(s) Held with Fund: | | Director, Audit Committee Member, Governance & Nominating Committee Member |
| Term of Office & Length of Time Served: | | Indefinite - Since 2009 |
Principal Occupation(s) During Past 5 Years: | | Chief Executive Officer, Pictometry International Corp. since August 2010 (provider of georeferenced, aerial image libraries and related software) Managing Partner (2006-July 2010) - - Aegis Investment Partners, LLC (investments); Founder and Managing Partner (2004-2005) - Village Markets, LLC (groceries) |
| Number of Portfolios Overseen within Fund Complex: | | 29 |
| Other Directorships Held Outside Fund Complex: | | Pictometry International Corp. (2000-2010) |
| | Pioneering Technologies (2006-2009) |
| | | Vensearch Capital Corp. (2003-2007) |
23
Directors’ and Officers’ Information (unaudited)
OFFICERS
| | |
| Name: | | Jeffrey S. Coons, Ph.D., CFA |
| Address: | | 290 Woodcliff Drive |
| | Fairport, NY 14450 |
| Age: | | 47 |
| Current Position(s) Held with Fund: | | Vice President |
| Term of Office1 & Length of Time Served: | | Since 2004 |
| Principal Occupation(s) During Past 5 Years: | | President since 2010, Co-Director of Research since 2002, Executive |
| | Group Member** since 2003, - Manning & Napier Advisors, Inc. |
| | Holds one or more of the following titles for various subsidiaries and |
| | affiliates: President, Director, Treasurer or Senior Trust Officer. |
| Number of Portfolios Overseen within Fund Complex: | | 29 |
| Other Directorships Held Outside Fund Complex: | | N/A |
| |
| Name: | | Beth Galusha |
| Address: | | 290 Woodcliff Drive |
| | Fairport, NY 14450 |
| Age: | | 49 |
| Current Position(s) Held with Fund: | | Assistant Chief Financial Officer |
| Term of Office1 & Length of Time Served: | | Assistant Chief Financial Officer since 2010 |
| Principal Occupation(s) During Past 5 Years: | | Chief Financial Officer and Treasurer, Manning & Napier Advisors, Inc. |
| | Holds one or more of the following titles for various affiliates: Chief Financial Officer, Director, or Treasurer |
| Number of Portfolios Overseen within Fund Complex: | | 29 |
| Other Directorships Held Outside Fund Complex: | | N/A |
| |
| Name: | | Christine Glavin |
| Address: | | 290 Woodcliff Drive |
| | Fairport, NY 14450 |
| Age: | | 44 |
| Current Position(s) Held with Fund: | | Principal Financial Officer, Chief Financial Officer |
| Term of Office1 & Length of Time Served: | | Principal Financial Officer since 2002; Chief Financial Officer since 2001 |
| Principal Occupation(s) During Past 5 Years: | | Fund Reporting Manager, Manning & Napier Advisors, Inc. since 1997 |
| Number of Portfolios Overseen within Fund Complex: | | 29 |
| Other Directorships Held Outside Fund Complex: | | N/A |
| |
| Name: | | Jodi L. Hedberg |
| Address: | | 290 Woodcliff Drive |
| | Fairport, NY 14450 |
| Age: | | 42 |
| Current Position(s) Held with Fund: | | Corporate Secretary, Chief Compliance Officer, Anti-Money Laundering |
| | Compliance Officer |
| Term of Office1 & Length of Time Served: | | Corporate Secretary since 1997; Chief Compliance Officer since 2004 |
| Principal Occupation(s) During Past 5 Years: | | Director of Compliance, Manning & Napier Advisors, Inc. and affiliates since 1990 (title change in 2005 from Compliance Manager to Director of Compliance); Corporate Secretary, Manning & Napier Investor Services, Inc. since 2006 |
| Number of Portfolios Overseen within Fund Complex: | | 29 |
| Other Directorships Held Outside Fund Complex: | | N/A |
| * | Interested Director, within the meaning of the Investment Company Act of 1940 by reason of his position with the Fund’s investment advisor and distributor. Mr. Auspitz serves as the Executive Vice President and Director, Manning & Napier Advisors, Inc. and President and Director, Manning & Napier Investor Services, Inc., the Fund’s distributor. |
| ** | Prior to June 2010, the Executive Group, consisting of senior executive employee-owners, performed the duties of the Office of the Chief Executive of the Advisor. |
Effective June 2010, The Executive Group serves as an advisory board to the Chief Executive Officer.
| 1 | The term of office for President, Vice President, Chief Financial Officer, Assistant Chief Financial Officer, and Corporate Secretary is one year and until their respective successors are chosen and qualified. All other officers’ terms are indefinite. |
24
This Page Intentionally Left Blank
25
Literature Requests (unaudited)
Proxy Voting Policies and Procedures
A description of the policies and procedures that the Fund uses to determine how to vote proxies relating to portfolio securities is available, without charge, upon request:
| | |
| By phone | | 1-800-466-3863 |
On the Securities and Exchange Commission’s (SEC) web site | | http://www.sec.gov |
Proxy Voting Record
Information regarding how the Fund voted proxies relating to portfolio securities during the most recent 12-month period ended June 30th is available, without charge, upon request:
| | |
| By phone | | 1-800-466-3863 |
On the SEC’s web site | | http://www.sec.gov |
Quarterly Portfolio Holdings
The Series’ complete schedule of portfolio holdings for the 1st and 3rd quarters of each fiscal year are provided on Form N-Q, and are available, without charge, upon request:
| | |
| By phone | | 1-800-466-3863 |
On the SEC’s web site | | http://www.sec.gov |
The Series’ Form N-Q may be reviewed and copied at the SEC’s Public Reference Room in Washington, D.C. Information on the operation of the Public Reference Room may be obtained by calling 1-800-SEC-0330.
Prospectus and Statement of Additional Information (SAI)
The prospectus and SAI provide additional information about each Series, including charges, expenses and risks. These documents are available, without charge, upon request:
| | |
By phone | | 1-800-466-3863 |
On the SEC’s web site | | http://www.sec.gov |
On the Advisor’s web site | | http://www.manningnapieradvisors.com |
Additional information available at www.manningnapieradvisors.com
1. Fund Holdings - Month-End
2. Fund Holdings - Quarter-End
3. Shareholder Report - Annual
4. Shareholder Report - Semi-Annual
MNEQY-10/10-AR

Management Discussion and Analysis (unaudited)
Dear Shareholders:
The twelve months ending October 31, 2010 were characterized by well-defined swings in investor sentiment. Optimism fueled strong market returns during the fourth quarter of 2009 and through much of the first quarter of 2010, as positive economic releases led investors to believe in the potential for a robust U.S. recovery. However, more negative economic releases into May and June of 2010, coupled with sovereign debt concerns in Europe, led to a dramatic swing in sentiment during the second quarter, with stock markets suffering notable losses. While volatility remained during the third quarter of 2010, September was a particularly strong month, which helped push market indexes into positive territory on a calendar year-to-date basis.
Despite several ups and downs over the past year, the markets made choppy progress, aided by the rally that began in September. For the twelve months ended October, 2010, the S&P 500 Index gained 16.53%, while the Russell 3000 earned 18.34%. Similar to domestic equities, international stocks experienced pronounced fluctuations over the last year. After climbing considerably the last two months, the Morgan Stanley Capital International (MSCI) All Country World ex U.S. (ACWI x US) was up 12.62% the past year through October.
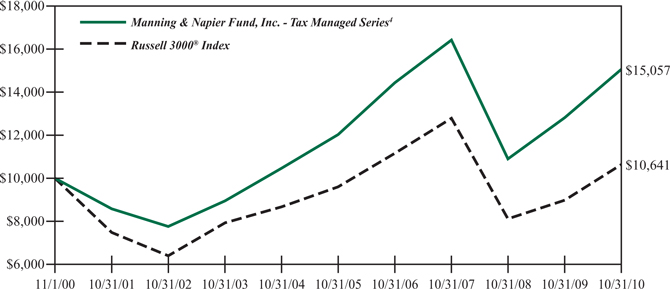
Over the current stock market cycle, which includes the bull market in stocks from October 2002 until November 2007 and the current bear market, the Tax Managed Series continues to provide competitive absolute and relative results for long-term investors. With an annualized return of 9.35% over the current full cycle, the Series has outpaced its blended benchmark’s annualized return of 8.53%. While the Tax Managed Series posted a double-digit return of 17.50% for the year ending October 31, 2010, it trailed the Russell 3000 benchmark over the last twelve months.
While the Tax Managed Series outperformed at the end of 2009, a bias toward quality and a lower exposure to economically sensitive stocks led the Series to lag behind market returns in early 2010 as investors were overly excited about a recovery. The subsequent market correction during the second quarter affected all equities, without discriminating between high-quality companies and lower quality ones. As a result, short-term swings hurt the Series’ performance. However, the Tax Managed Series rebounded with the market rally in the third quarter.
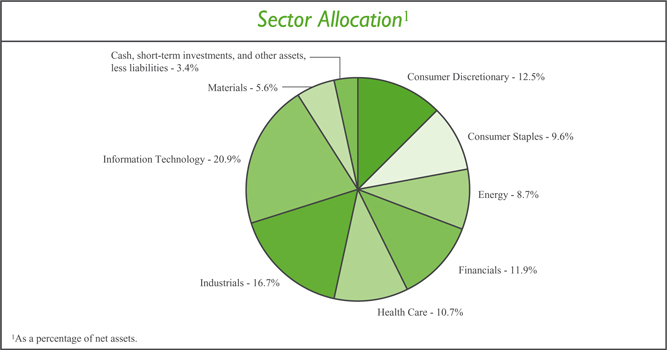
Throughout the last twelve months, the Series had a relative overweight as compared to the benchmark in the Information Technology and Health Care sectors, as our analysts found quality companies with attractive growth potential in these areas. This higher allocation had a varied impact on the Series’ performance over the past year, yet specific stock selections within the Information Technology and Health Care sectors contributed to positive relative returns more recently during the third quarter. Meanwhile, the Tax Managed Series had a low exposure to Financials relative to the benchmark because regulatory uncertainty and macroeconomic challenges such as indebted consumers, persistently high unemployment, a fragile housing market, and continued loan losses prevented many financial services companies from meeting the requirements of our investment strategies. This underweight to Financials aided returns relative to the benchmark during the past year, with the exception of the market rally in early 2010.
While the markets were volatile over the past twelve months, the outlook for the U.S. economy did not change materially over the past year. Despite swings in positive and negative sentiment, Manning & Napier continues to see a slow growth environment as the economy works through extensive consumer and government debt levels. In such an environment, we are focused on company-specific opportunities that can prosper. Specifically, we are seeking leading companies that can grow and gain market share despite a sluggish economy, particularly multinational businesses that may benefit from exposure to faster-growing foreign markets. Using our active stock selection strategies, we are also seeking opportunities in certain cyclical industries that have a tight relationship between supply and demand.
As 2010 comes to an end, economic momentum has begun to slow. With widespread challenges such as elevated unemployment levels and high government debt burdens, the growth prospects for the developed world remain a concern. In this macroeconomic reality of slow growth, a focus on company and industry fundamentals remains important for
1
Management Discussion and Analysis (unaudited)
identifying quality investment opportunities. Through our disciplined investment strategies, Manning & Napier continues to pursue specific areas of the market that are presenting opportunities, particularly winning companies that have favorable growth prospects. Such an active and flexible approach has been at the core of our investment process since Manning & Napier’s inception 40 years ago.
As always, we appreciate your business.
Sincerely,
Manning & Napier Advisors, Inc.
2
Performance Update as of October 31, 2010 (unaudited)
| | | | | | | | | | | | | | | | |
| | | Average Annual Total Returns
As of October 31, 2010 | |
| | | One
Year | | | Five
Year | | | Ten
Year | | | Since
Inception1 | |
Manning & Napier Fund, Inc. - Tax Managed Series | | | | | | | | | | | | | | | | |
Returns Before Taxes2,4 | | | 17.50 | % | | | 4.58 | % | | | 4.18 | % | | | 8.90 | % |
Returns After Taxes on Distributions3,4 | | | 17.47 | % | | | 3.83 | % | | | 3.66 | % | | | 8.46 | % |
Returns After Taxes on Distributions and Sale of Series Shares3,4 | | | 11.41 | % | | | 3.87 | % | | | 3.54 | % | | | 7.94 | % |
Russell 3000® Index5 | | | 18.34 | % | | | 2.08 | % | | | 0.62 | % | | | 6.92 | % |
The following graph compares the value of a $10,000 investment in the Manning & Napier Fund, Inc. - Tax Managed Series (returns before taxes) for the ten years ended October 31, 2010 to the Russell 3000® Index.
| 1 | Performance numbers for the Series and Index are calculated from November 1, 1995, the Series’ inception date. |
| 2 | Returns before taxes do not reflect the deduction of taxes that a shareholder would pay on fund distributions or the redemption of shares. The performance returns shown are inclusive of the net expense ratio of the Series. For the year ended October 31, 2010, this net expense ratio was 1.20%. The gross expense ratio, which does not account for any voluntary or contractual waivers currently in effect, was 1.34% for the year ended October 31, 2010. |
| 3 | Returns after taxes on distributions assume that an investor owned the Series during the entire period and paid taxes on the Series’ distributions. Returns after taxes on distributions and sale of Series shares assume that an investor paid taxes on the Series’ distributions and sold all shares at the end of each period. After-tax returns reflect the historical highest individual federal marginal income tax rates and do not reflect state and local taxes. Actual after-tax returns depend on an investor’s tax situation and may differ from those shown. After-tax returns reflect past tax effects and are not indicative of future tax effects. After-tax returns are not relevant to those investing through 401(k) plans, IRAs or other tax-deferred arrangements. |
| 4 | The Series’ performance is historical and may not be indicative of future results. |
| 5 | The Russell 3000® Index is an unmanaged index that consists of 3,000 of the largest U.S. companies based on total market capitalization. The Index returns are based on a market capitalization weighted average of relative price changes of the component stocks plus dividends whose reinvestments are compounded daily. The Index returns, unlike Series returns, do not reflect any fees or expenses. |
3
Shareholder Expense Example (unaudited)
As a shareholder of the Series, you may incur two types of costs: (1) transaction costs, including potential wire charges on redemptions and (2) ongoing costs, including management fees and other Series expenses. This example is intended to help you understand your ongoing costs (in dollars) of investing in the Series and to compare these costs with the ongoing costs of investing in other mutual funds.
The example is based on an investment of $1,000 invested at the beginning of the period and held for the entire period (May 1, 2010 to October 31, 2010).
Actual Expenses
The first line of the table below provides information about actual account values and actual expenses. You may use the information in this line, together with the amount you invested, to estimate the expenses that you paid over the period. Simply divide your account value by $1,000 (for example, an $8,600 account value divided by $1,000 = 8.6), then multiply the result by the number in the first line under the heading entitled “Expenses Paid During Period” to estimate the expenses you paid on your account during this period.
Hypothetical Example for Comparison Purposes
The second line of the table below provides information about hypothetical account values and hypothetical expenses based on the Series’ actual expense ratio and an assumed rate of return of 5% per year before expenses, which is not the Series’ actual return. The hypothetical account values and expenses may not be used to estimate the actual ending account balance or expenses you paid during the period. You may use this information to compare the ongoing costs of investing in the Series and other funds. To do so, compare this 5% hypothetical example with the 5% hypothetical examples that appear in the shareholder reports of the other funds.
Please note that the expenses shown in the table are meant to highlight your ongoing costs only and do not reflect any transaction costs. Therefore, the second line of the table is useful in comparing ongoing costs only, and will not help you determine the relative total costs of owning different funds. In addition, if these transaction costs were included, your costs would have been higher.
| | | | | | | | | | | | |
| | | Beginning
Account Value
5/1/10 | | | Ending
Account Value
10/31/10 | | | Expenses Paid
During Period*
5/1/10-10/31/10 | |
Actual | | $ | 1,000.00 | | | $ | 1,013.40 | | | $ | 6.09 | |
Hypothetical
(5% return before expenses) | | $ | 1,000.00 | | | $ | 1,019.16 | | | $ | 6.11 | |
| * | Expenses are equal to the Series’ annualized expense ratio (for the six-month period) of 1.20%, multiplied by the average account value over the period, multiplied by 184/365 (to reflect the one-half year period). Expenses are based on the most recent fiscal half year; therefore, the expense ratio stated above may differ from the expense ratio stated in the financial highlights, which is based on one-year data. The Series’ total return would have been lower had certain expenses not been waived during the period. |
4
Portfolio Composition as of October 31, 2010 (unaudited)
5
Investment Portfolio - October 31, 2010
| | | | | | | | |
| | | Shares | | | Value
(Note 2) | |
| | |
COMMON STOCKS - 96.6% | | | | | | | | |
| | |
Consumer Discretionary - 12.5% | | | | | | | | |
Automobiles - 1.0% | | | | | | | | |
Bayerische Motoren Werke AG (BMW) (Germany)1 | | | 6,760 | | | $ | 484,505 | |
| | | | | | | | |
Media - 9.4% | | | | | | | | |
Discovery Communications, Inc. - Class A* | | | 13,240 | | | | 590,636 | |
Liberty Global, Inc. - Class A* | | | 9,860 | | | | 372,609 | |
Mediaset S.p.A. (Italy)1 | | | 35,930 | | | | 265,279 | |
Reed Elsevier plc (United Kingdom)1 | | | 52,560 | | | | 450,932 | |
Time Warner, Inc. | | | 22,170 | | | | 720,747 | |
Virgin Media, Inc. (United Kingdom) | | | 16,000 | | | | 406,880 | |
The Walt Disney Co. | | | 17,460 | | | | 630,481 | |
The Washington Post Co. - Class B | | | 2,020 | | | | 812,343 | |
| | | | | | | | |
| | | | | | | 4,249,907 | |
| | | | | | | | |
Specialty Retail - 2.1% | | | | | | | | |
Dick’s Sporting Goods, Inc.* | | | 17,310 | | | | 498,874 | |
The Sherwin-Williams Co. | | | 6,150 | | | | 448,766 | |
| | | | | | | | |
| | | | | | | 947,640 | |
| | | | | | | | |
Total Consumer Discretionary | | | | | | | 5,682,052 | |
| | | | | | | | |
Consumer Staples - 9.6% | | | | | | | | |
Beverages - 2.6% | | | | | | | | |
The Coca-Cola Co. | | | 10,250 | | | | 628,530 | |
PepsiCo, Inc. | | | 8,530 | | | | 557,009 | |
| | | | | | | | |
| | | | | | | 1,185,539 | |
| | | | | | | | |
Food & Staples Retailing - 2.2% | | | | | | | | |
The Kroger Co. | | | 21,500 | | | | 473,000 | |
Safeway, Inc. | | | 21,810 | | | | 499,449 | |
| | | | | | | | |
| | | | | | | 972,449 | |
| | | | | | | | |
Food Products - 4.8% | | | | | | | | |
General Mills, Inc. | | | 12,180 | | | | 457,237 | |
Kellogg Co. | | | 5,900 | | | | 296,534 | |
Nestle S.A. (Switzerland)1 | | | 14,170 | | | | 776,154 | |
Unilever plc - ADR (United Kingdom) | | | 21,980 | | | | 637,860 | |
| | | | | | | | |
| | | | | | | 2,167,785 | |
| | | | | | | | |
Total Consumer Staples | | | | | | | 4,325,773 | |
| | | | | | | | |
Energy - 8.7% | | | | | | | | |
Energy Equipment & Services - 4.5% | | | | | | | | |
Baker Hughes, Inc. | | | 15,320 | | | | 709,776 | |
Schlumberger Ltd. | | | 10,550 | | | | 737,340 | |
Weatherford International Ltd. (Switzerland)* | | | 34,540 | | | | 580,617 | |
| | | | | | | | |
| | | | | | | 2,027,733 | |
| | | | | | | | |
| | | | |
| 6 | | The accompanying notes are an integral part of the financial statements. | | |
Investment Portfolio - October 31, 2010
| | | | | | | | |
| | | Shares | | | Value
(Note 2) | |
| | |
COMMON STOCKS (continued) | | | | | | | | |
| | |
Energy (continued) | | | | | | | | |
Oil, Gas & Consumable Fuels - 4.2% | | | | | | | | |
Cameco Corp. (Canada) | | | 24,210 | | | $ | 749,542 | |
Hess Corp. | | | 18,580 | | | | 1,171,097 | |
| | | | | | | | |
| | | | | | | 1,920,639 | |
| | | | | | | | |
Total Energy | | | | | | | 3,948,372 | |
| | | | | | | | |
Financials - 11.9% | | | | | | | | |
Capital Markets - 6.2% | | | | | | | | |
The Bank of New York Mellon Corp.2 | | | 42,210 | | | | 1,057,782 | |
The Charles Schwab Corp. | | | 81,610 | | | | 1,256,794 | |
Northern Trust Corp. | | | 10,260 | | | | 509,204 | |
| | | | | | | | |
| | | | | | | 2,823,780 | |
| | | | | | | | |
Commercial Banks - 1.0% | | | | | | | | |
HSBC Holdings plc (United Kingdom)1 | | | 44,630 | | | | 464,496 | |
| | | | | | | | |
Consumer Finance - 2.0% | | | | | | | | |
American Express Co. | | | 21,800 | | | | 903,828 | |
| | | | | | | | |
Diversified Financial Services - 1.1% | | | | | | | | |
Deutsche Boerse AG (Germany)1 | | | 7,240 | | | | 509,325 | |
| | | | | | | | |
Insurance - 1.6% | | | | | | | | |
The Progressive Corp. | | | 33,300 | | | | 704,628 | |
| | | | | | | | |
Total Financials | | | | | | | 5,406,057 | |
| | | | | | | | |
Health Care - 10.7% | | | | | | | | |
Biotechnology - 0.4% | | | | | | | | |
Genzyme Corp.* | | | 2,440 | | | | 175,997 | |
| | | | | | | | |
Health Care Equipment & Supplies - 6.8% | | | | | | | | |
Alere, Inc.* | | | 30,070 | | | | 888,568 | |
Becton, Dickinson and Co. | | | 12,890 | | | | 973,453 | |
Boston Scientific Corp.* | | | 112,510 | | | | 717,814 | |
Gen-Probe, Inc.* | | | 10,300 | | | | 498,829 | |
| | | | | | | | |
| | | | | | | 3,078,664 | |
| | | | | | | | |
Health Care Technology - 1.7% | | | | | | | | |
Cerner Corp.* | | | 8,680 | | | | 762,365 | |
| | | | | | | | |
Life Sciences Tools & Services - 1.8% | | | | | | | | |
Lonza Group AG (Switzerland)1 | | | 2,960 | | | | 259,126 | |
Thermo Fisher Scientific, Inc.* | | | 10,740 | | | | 552,251 | |
| | | | | | | | |
| | | | | | | 811,377 | |
| | | | | | | | |
Total Health Care | | | | | | | 4,828,403 | |
| | | | | | | | |
Industrials - 16.7% | | | | | | | | |
Aerospace & Defense - 1.3% | | | | | | | | |
The Boeing Co. | | | 8,230 | | | | 581,367 | |
| | | | | | | | |
| | | | |
| | The accompanying notes are an integral part of the financial statements. | | 7 |
Investment Portfolio - October 31, 2010
| | | | | | | | |
| | | Shares | | | Value
(Note 2) | |
| | |
COMMON STOCKS (continued) | | | | | | | | |
| | |
Industrials (continued) | | | | | | | | |
Air Freight & Logistics - 3.4% | | | | | | | | |
FedEx Corp. | | | 7,040 | | | $ | 617,549 | |
United Parcel Service, Inc. - Class B | | | 13,600 | | | | 915,824 | |
| | | | | | | | |
| | | | | | | 1,533,373 | |
| | | | | | | | |
Airlines - 2.8% | | | | | | | | |
Ryanair Holdings plc - ADR (Ireland) | | | 16,750 | | | | 546,553 | |
Southwest Airlines Co. | | | 51,340 | | | | 706,438 | |
| | | | | | | | |
| | | | | | | 1,252,991 | |
| | | | | | | | |
Commercial Services & Supplies - 1.2% | | | | | | | | |
Waste Management, Inc. | | | 14,730 | | | | 526,156 | |
| | | | | | | | |
Construction & Engineering - 1.1% | | | | | | | | |
Quanta Services, Inc.* | | | 25,910 | | | | 509,390 | |
| | | | | | | | |
Machinery - 1.5% | | | | | | | | |
Pall Corp. | | | 15,660 | | | | 668,212 | |
| | | | | | | | |
Professional Services - 4.3% | | | | | | | | |
Adecco S.A. (Switzerland)1 | | | 12,320 | | | | 689,326 | |
Manpower, Inc. | | | 14,920 | | | | 816,572 | |
Randstad Holding N.V. (Netherlands)*,1 | | | 9,340 | | | | 444,946 | |
| | | | | | | | |
| | | | | | | 1,950,844 | |
| | | | | | | | |
Road & Rail - 1.1% | | | | | | | | |
Norfolk Southern Corp. | | | 8,490 | | | | 522,050 | |
| | | | | | | | |
Total Industrials | | | | | | | 7,544,383 | |
| | | | | | | | |
Information Technology - 20.9% | | | | | | | | |
Communications Equipment - 4.5% | | | | | | | | |
Cisco Systems, Inc.* | | | 44,280 | | | | 1,010,913 | |
Juniper Networks, Inc.* | | | 10,610 | | | | 343,658 | |
QUALCOMM, Inc. | | | 14,810 | | | | 668,375 | |
| | | | | | | | |
| | | | | | | 2,022,946 | |
| | | | | | | | |
Computers & Peripherals - 2.1% | | | | | | | | |
EMC Corp.* | | | 45,920 | | | | 964,779 | |
| | | | | | | | |
Electronic Equipment, Instruments & Components - 0.9% | | | | | | | | |
Amphenol Corp. - Class A | | | 8,500 | | | | 426,105 | |
| | | | | | | | |
Internet Software & Services - 4.0% | | | | | | | | |
Google, Inc. - Class A* | | | 2,470 | | | | 1,514,085 | |
VistaPrint N.V. (Netherlands)* | | | 7,080 | | | | 297,856 | |
| | | | | | | | |
| | | | | | | 1,811,941 | |
| | | | | | | | |
IT Services - 7.8% | | | | | | | | |
Accenture plc - Class A (Ireland) | | | 12,930 | | | | 578,100 | |
Amadeus IT Holding S.A. - Class A (Spain)*,1 | | | 13,600 | | | | 277,503 | |
| | |
| 8 | | The accompanying notes are an integral part of the financial statements. |
Investment Portfolio - October 31, 2010
| | | | | | | | |
| | | Shares | | | Value
(Note 2) | |
| | |
COMMON STOCKS (continued) | | | | | | | | |
| | |
Information Technology (continued) | | | | | | | | |
IT Services (continued) | | | | | | | | |
Automatic Data Processing, Inc. | | | 15,070 | | | $ | 669,410 | |
MasterCard, Inc. - Class A | | | 2,880 | | | | 691,373 | |
Visa, Inc. - Class A | | | 7,970 | | | | 623,015 | |
The Western Union Co. | | | 40,430 | | | | 711,568 | |
| | | | | | | | |
| | | | | | | 3,550,969 | |
| | | | | | | | |
Semiconductors & Semiconductor Equipment - 0.1% | | | | | | | | |
Advantest Corp. (Japan)1 | | | 1,800 | | | | 34,188 | |
| | | | | | | | |
Software - 1.5% | | | | | | | | |
Autodesk, Inc.* | | | 18,200 | | | | 658,476 | |
| | | | | | | | |
Total Information Technology | | | | | | | 9,469,404 | |
| | | | | | | | |
Materials - 5.6% | | | | | | | | |
Chemicals - 3.1% | | | | | | | | |
Monsanto Co. | | | 23,680 | | | | 1,407,066 | |
| | | | | | | | |
Construction Materials - 1.4% | | | | | | | | |
Martin Marietta Materials, Inc. | | | 3,910 | | | | 314,677 | |
Vulcan Materials Co. | | | 8,660 | | | | 316,176 | |
| | | | | | | | |
| | | | | | | 630,853 | |
| | | | | | | | |
Containers & Packaging - 1.1% | | | | | | | | |
Owens-Illinois, Inc.* | | | 17,640 | | | | 494,449 | |
| | | | | | | | |
Total Materials | | | | | | | 2,532,368 | |
| | | | | | | | |
TOTAL COMMON STOCKS
(Identified Cost $36,865,140) | | | | | | | 43,736,812 | |
| | | | | | | | |
| | |
SHORT-TERM INVESTMENTS - 2.5% | | | | | | | | |
| | |
Dreyfus Cash Management, Inc. - Institutional Shares3, 0.16%
(Identified Cost $1,123,658) | | | 1,123,658 | | | | 1,123,658 | |
| | | | | | | | |
TOTAL INVESTMENTS - 99.1%
(Identified Cost $37,988,798) | | | | | | | 44,860,470 | |
OTHER ASSETS, LESS LIABILITIES - 0.9% | | | | | | | 415,303 | |
| | | | | | | | |
NET ASSETS - 100% | | | | | | $ | 45,275,773 | |
| | | | | | | | |
ADR - American Depository Receipt
| * | Non-income producing security |
| 1 | International Fair Value factor from pricing service was applied. |
| 2 | The Bank of New York Mellon Corp. is the Series’ custodian and serves as sub-accountant and sub-transfer agent to the Series. |
| 3 | Rate shown is the current yield as of October 31, 2010. |
| | | | |
| | The accompanying notes are an integral part of the financial statements. | | 9 |
Statement of Assets and Liabilities
October 31, 2010
| | | | |
ASSETS: | | | | |
| |
Investments, at value (identified cost $37,988,798) (Note 2) | | $ | 44,860,470 | |
Cash | | | 270,478 | |
Receivable for securities sold | | | 600,195 | |
Foreign tax reclaims receivable | | | 29,366 | |
Dividends receivable | | | 24,333 | |
Receivable for fund shares sold | | | 1,435 | |
| | | | |
| |
TOTAL ASSETS | | | 45,786,277 | |
| | | | |
| |
LIABILITIES: | | | | |
| |
Accrued management fees (Note 3) | | | 46,795 | |
Accrued fund accounting and administration fees (Note 3) | | | 5,838 | |
Accrued transfer agent fees (Note 3) | | | 3,328 | |
Accrued directors’ fees (Note 3) | | | 612 | |
Accrued Chief Compliance Officer service fees (Note 3) | | | 247 | |
Payable for securities purchased | | | 418,901 | |
Audit fees payable | | | 29,757 | |
Other payables and accrued expenses | | | 5,026 | |
| | | | |
| |
TOTAL LIABILITIES | | | 510,504 | |
| | | | |
| |
TOTAL NET ASSETS | | $ | 45,275,773 | |
| | | | |
| |
NET ASSETS CONSIST OF: | | | | |
| |
Capital stock | | $ | 18,106 | |
Additional paid-in-capital | | | 41,299,793 | |
Undistributed net investment income | | | 96,837 | |
Accumulated net realized loss on investments, foreign currency and translation of other assets and liabilities | | | (3,012,285 | ) |
Net unrealized appreciation on investments, foreign currency and translation of other assets and liabilities | | | 6,873,322 | |
| | | | |
| |
TOTAL NET ASSETS | | $ | 45,275,773 | |
| | | | |
| |
NET ASSET VALUE, OFFERING PRICE AND REDEMPTION PRICE PER SHARE - Class A
($45,275,773/1,810,607 shares) | | $ | 25.01 | |
| | | | |
| | | | |
| 10 | | The accompanying notes are an integral part of the financial statements. | | |
Statement of Operations
For the Year Ended October 31, 2010
| | | | |
INVESTMENT INCOME: | | | | |
| |
Dividends (net of foreign taxes withheld, $22,782) | | $ | 542,493 | |
Interest | | | 25 | |
| | | | |
| |
Total Investment Income | | | 542,518 | |
| | | | |
| |
EXPENSES: | | | | |
| |
Management fees (Note 3) | | | 367,062 | |
Fund accounting and administration fees (Note 3) | | | 32,097 | |
Directors’ fees (Note 3) | | | 10,651 | |
Transfer agent fees (Note 3) | | | 10,203 | |
Chief Compliance Officer service fees (Note 3) | | | 2,724 | |
Audit fees | | | 30,031 | |
Registration and filing fees | | | 22,251 | |
Custodian fees | | | 4,374 | |
Miscellaneous | | | 12,599 | |
| | | | |
| |
Total Expenses | | | 491,992 | |
Less reduction of expenses (Note 3) | | | (51,517 | ) |
| | | | |
| |
Net Expenses | | | 440,475 | |
| | | | |
| |
NET INVESTMENT INCOME | | | 102,043 | |
| | | | |
| |
REALIZED AND UNREALIZED GAIN ON INVESTMENTS AND FOREIGN CURRENCY: | | | | |
| |
Net realized gain on- | | | | |
Investments | | | 1,665,783 | |
Foreign currency and translation of other assets and liabilities | | | 11 | |
| | | | |
| |
| | | 1,665,794 | |
| | | | |
Net change in unrealized appreciation on- | | | | |
Investments | | | 3,915,115 | |
Foreign currency and translation of other assets and liabilities | | | 747 | |
| | | | |
| |
| | | 3,915,862 | |
| | | | |
| |
NET REALIZED AND UNREALIZED GAIN ON INVESTMENTS AND FOREIGN CURRENCY | | | 5,581,656 | |
| | | | |
| |
NET INCREASE IN NET ASSETS RESULTING FROM OPERATIONS | | $ | 5,683,699 | |
| | | | |
| | | | |
| | The accompanying notes are an integral part of the financial statements. | | 11 |
Statements of Changes in Net Assets
| | | | | | | | |
| | | For the
Year Ended
10/31/10 | | | For the
Year Ended
10/31/09 | |
INCREASE (DECREASE) IN NET ASSETS: | | | | | | | | |
| | |
OPERATIONS: | | | | | | | | |
| | |
Net investment income | | $ | 102,043 | | | $ | 65,162 | |
Net realized gain (loss) on investments and foreign currency | | | 1,665,794 | | | | (1,837,316 | ) |
Net change in unrealized appreciation (depreciation) on investments and foreign currency | | | 3,915,862 | | | | 6,428,424 | |
| | | | | | | | |
| | |
Net increase from operations | | | 5,683,699 | | | | 4,656,270 | |
| | | | | | | | |
| | |
DISTRIBUTIONS TO SHAREHOLDERS (Note 8): | | | | | | | | |
| | |
From net investment income | | | (50,092 | ) | | | (99,078 | ) |
| | | | | | | | |
| | |
CAPITAL STOCK ISSUED AND REPURCHASED: | | | | | | | | |
| | |
Net increase from capital share transactions (Note 5) | | | 10,383,291 | | | | 9,171,810 | |
| | | | | | | | |
| | |
Net increase in net assets | | | 16,016,898 | | | | 13,729,002 | |
| | |
NET ASSETS: | | | | | | | | |
| | |
Beginning of year | | | 29,258,875 | | | | 15,529,873 | |
| | | | | | | | |
| | |
End of year (including undistributed net investment income of $96,837 and $44,797, respectively) | | $ | 45,275,773 | | | $ | 29,258,875 | |
| | | | | | | | |
| | | | |
| 12 | | The accompanying notes are an integral part of the financial statements. | | |
Financial Highlights
| | | | | | | | | | | | | | | | | | | | |
| | | For the Years Ended | |
| | | 10/31/10 | | | 10/31/09 | | | 10/31/08 | | | 10/31/07 | | | 10/31/06 | |
Per share data (for a share outstanding throughout each year): | | | | | | | | | | | | | | | | | | | | |
Net asset value - Beginning of year | | $ | 21.32 | | | $ | 18.26 | | | $ | 28.44 | | | $ | 27.01 | | | $ | 25.60 | |
| | | | | | | | | | | | | | | | | | | | |
Income (loss) from investment operations: | | | | | | | | | | | | | | | | | | | | |
Net investment income | | | 0.06 | 1 | | | 0.06 | 1 | | | 0.12 | | | | 0.08 | | | | 0.13 | |
Net realized and unrealized gain (loss) on investments | | | 3.67 | | | | 3.11 | | | | (9.42 | ) | | | 3.44 | | | | 4.41 | |
| | | | | | | | | | | | | | | | | | | | |
Total from investment operations | | | 3.73 | | | | 3.17 | | | | (9.30 | ) | | | 3.52 | | | | 4.54 | |
| | | | | | | | | | | | | | | | | | | | |
Less distributions to shareholders: | | | | | | | | | | | | | | | | | | | | |
From net investment income | | | (0.04 | ) | | | (0.11 | ) | | | (0.09 | ) | | | (0.14 | ) | | | (0.06 | ) |
From net realized gain on investments | | | — | | | | — | | | | (0.79 | ) | | | (1.95 | ) | | | (3.07 | ) |
| | | | | | | | | | | | | | | | | | | | |
Total distributions to shareholders | | | (0.04 | ) | | | (0.11 | ) | | | (0.88 | ) | | | (2.09 | ) | | | (3.13 | ) |
| | | | | | | | | | | | | | | | | | | | |
Net asset value - End of year | | $ | 25.01 | | | $ | 21.32 | | | $ | 18.26 | | | $ | 28.44 | | | $ | 27.01 | |
| | | | | | | | | | | | | | | | | | | | |
Net assets - End of year
(000’s omitted) | | $ | 45,276 | | | $ | 29,259 | | | $ | 15,530 | | | $ | 25,695 | | | $ | 7,585 | |
| | | | | | | | | | | | | | | | | | | | |
Total return2 | | | 17.50 | % | | | 17.57 | % | | | (33.62 | %) | | | 13.65 | % | | | 20.01 | % |
Ratios (to average net assets)/Supplemental Data: | | | | | | | | | | | | | | | | | | | | |
Expenses* | | | 1.20 | % | | | 1.20 | % | | | 1.20 | % | | | 1.20 | % | | | 1.20 | % |
Net investment income | | | 0.28 | % | | | 0.31 | % | | | 0.44 | % | | | 0.38 | % | | | 0.54 | % |
Portfolio turnover | | | 56 | % | | | 48 | % | | | 96 | % | | | 65 | % | | | 61 | % |
|
* The investment advisor did not impose all of its management fees, CCO fees, fund accounting and transfer agent fees, and other fees in some years and in some years paid a portion of the Series’ expenses. If these expenses had been incurred by the Series, the expense ratio (to average net assets) would have been increased by the following amounts: | |
| | | | | |
| | | 0.14 | % | | | 0.24 | % | | | 0.20 | % | | | 0.25 | % | | | 0.78 | % |
| 1 | Calculated based on average shares outstanding during the year. |
| 2 | Represents aggregate total return for the years indicated, and assumes reinvestment of all distributions. Total returns would have been lower had certain expenses not been waived or reimbursed during certain years. |
| | | | |
| | The accompanying notes are an integral part of the financial statements. | | 13 |
Notes to Financial Statements
Tax Managed Series (the “Series”) is a no-load diversified series of Manning & Napier Fund, Inc. (the “Fund”). The Fund is organized in Maryland and is registered under the Investment Company Act of 1940, as amended, as an open-end management investment company.
The Series’ investment objective is to maximize long-term growth while attempting to minimize the impact of taxes on the total return earned by shareholders.
The Series is authorized to issue five classes of shares (Class A, B, D, E and Z). Currently, only Class A shares have been issued. Each class of shares is substantially the same, except that class specific distribution and shareholder servicing expenses are borne by the specific class of shares to which they relate.
The Fund’s Advisor is Manning & Napier Advisors, Inc. (the “Advisor”). Shares of the Series are offered to investors and employees of the Advisor and its affiliates. The total authorized capital stock of the Fund consists of 10.0 billion shares of common stock each having a par value of $0.01. As of October 31, 2010, 6.2 billion shares have been designated in total among 29 series, of which 87.5 million have been designated as Tax Managed Series Class A common stock.
| 2. | SIGNIFICANT ACCOUNTING POLICIES |
Security Valuation
Portfolio securities, including domestic equities, foreign equities, warrants and options, listed on an exchange other than the NASDAQ National Market System are valued at the latest quoted sales price of the exchange on which the security is primarily traded. Securities not traded on valuation date or securities not listed on an exchange are valued at the latest quoted bid price provided by the Fund’s pricing service. Securities listed on the NASDAQ National Market System are valued in accordance with the NASDAQ Official Closing Price.
Short-term investments that mature in sixty days or less are valued at amortized cost, which approximates market value. Investments in open-end investment companies are valued at their net asset value per share on valuation date.
Volume and level of activity in established markets for an asset or liability are evaluated to determine whether recent transactions and quoted prices are determinative of fair value. Where there have been significant decreases in volume and level of activity, further analysis and adjustment may be necessary to estimate fair value. The Series measures fair value in these instances by the use of inputs and valuation techniques which may be based upon current market prices of securities that are comparable in coupon, rating, maturity and industry and/or expectation of future cash flows. As a result of trading in relatively thin markets and/or markets that experience significant volatility, the prices used by the Series to value these securities may differ from the value that would be realized if these securities were sold, and the differences could be material.
Securities for which representative valuations or prices are not available from the Fund’s pricing service may be valued at fair value. Due to the inherent uncertainty of valuations of such securities, the fair value may differ significantly from the values that would have been used had a ready market for such securities existed. If trading or events occurring after the close of the principal market in which securities are traded are expected to materially affect the value of those securities, then they may be valued at their fair value, taking this trading or these events into account. Fair value is determined in good faith by the Advisor under procedures approved by and under the general supervision and responsibility of the Fund’s Board of Directors (the “Board”). In accordance with the procedures approved by the Board, the Series apply fair value pricing on a daily basis except for North American, Central American, South American and Caribbean equity securities. Fair valuing of securities is determined with the assistance of a pricing service using calculations or factors based on indices of domestic securities and other appropriate indicators, such as prices of relevant American Depository Receipts and futures contracts, to adjust local market prices for subsequent
14
Notes to Financial Statements
| 2. | SIGNIFICANT ACCOUNTING POLICIES (continued) |
Security Valuation (continued)
movements through the time the Fund calculates its net asset value. The value of securities used for net asset value calculation under these procedures may differ from published prices for the same securities. It is the Fund’s policy to classify each equity security, except for those in the regions noted above, as Level 2 securities due to the fact the pricing service evaluated what factor was applied to the calculated end of day market price.
Various inputs are used in determining the value of the Series’ assets or liabilities carried at market value. These inputs are summarized in three broad levels. Level 1 includes quoted prices in active markets for identical assets and liabilities. Level 2 includes other significant observable inputs (including quoted prices for similar securities, interest rates, prepayment speeds, credit risk, etc.). Level 3 includes significant unobservable inputs (including the Series’ own assumptions in determining the fair value of investments). The inputs or methodology used for valuing securities are not necessarily an indication of the risk associated with investing in those securities.
The following is a summary of the valuation levels used for major security types as of October 31, 2010 in valuing the Series’ assets or liabilities carried at market value:
| | | | | | | | | | | | | | | | |
Description | | Total | | | Level 1 | | | Level 2 | | | Level 3 | |
Assets: | | | | | | | | | | | | | | | | |
Equity securities* | | $ | 43,736,812 | | | $ | 39,081,032 | | | $ | 4,655,780 | | | $ | — | |
Preferred securities | | | — | | | | — | | | | — | | | | — | |
Debt securities | | | — | | | | — | | | | — | | | | — | |
Mutual funds | | | 1,123,658 | | | | 1,123,658 | | | | — | | | | — | |
Other financial instruments**: | | | — | | | | — | | | | — | | | | — | |
| | | | | | | | | | | | | | | | |
Total assets: | | | 44,860,470 | | | | 40,204,690 | | | | 4,655,780 | | | | — | |
| | | | | | | | | | | | | | | | |
Liabilities: | | | | | | | | | | | | | | | | |
Other financial instruments**: | | | — | | | | — | | | | — | | | | — | |
| | | | | | | | | | | | | | | | |
Total Liabilities: | | | — | | | | — | | | | — | | | | — | |
| | | | | | | | | | | | | | | | |
Total | | $ | 44,860,470 | | | $ | 40,204,690 | | | $ | 4,655,780 | | | $ | — | |
| | | | | | | | | | | | | | | | |
| * | Includes common stock, warrants and rights. Please see the Investment Portfolio for industry classification and for securities where International Fair Value factor from pricing service was applied to value the security. Such securities are classified as Level 2. |
| ** | Other financial instruments are derivative instruments not reflected in the Investment Portfolio, such as futures, forwards and swap contracts, which are valued at the unrealized appreciation/depreciation on the instrument. As of October 31, 2010, the Series did not hold any derivative instruments. |
There were no Level 3 securities held by the Series as of October 31, 2009 or October 31, 2010.
The Fund’s policy is to recognize transfers in and transfers out of the valuation levels as of the beginning of the reporting period. During the year ended October 31, 2010, the Fund had a significant amount of foreign equity securities transfer from Level 1 to Level 2 due to the implementation of new international fair value pricing procedures. The following is a summary of the foreign equity securities that transferred from Level 1 to Level 2:
15
Notes to Financial Statements
| 2. | SIGNIFICANT ACCOUNTING POLICIES (continued) |
Security Valuation (continued)
| | | | | | | | | | | | | | | | |
| | | Total #
Securities
Level 1 at
beginning and
Level 2 at end
of period | | | Total Market
Value
Beginning of
period | | | Total Market
Value
End of period | | | Change in
Market Value | |
| | | 3 | | | $ | 1,028,554 | | | $ | 1,069,468 | | | $ | 40,914 | |
Additional disclosure surrounding the activity in Level 3 fair value measurement will also be effective for fiscal years beginning after December 15, 2010. Management has concluded that this will not have a material impact on the Series’ financial statements.
Security Transactions, Investment Income and Expenses
Security transactions are accounted for on trade date. Dividend income is recorded on the ex-dividend date, except that if the ex-dividend date has passed, certain dividends from foreign securities are recorded as soon as the Fund is informed of the ex-dividend date. Non-cash dividends, if any, are recorded at the fair market value of the securities received. Interest income, including amortization of premium and accretion of discounts using the effective interest method, is earned from settlement date and accrued daily.
Expenses are recorded on an accrual basis. Most expenses of the Fund can be attributed to a specific series. Expenses which cannot be directly attributed are apportioned among the series in the Fund in such a manner as deemed equitable by the Fund’s Board, taking into consideration, among other things, the nature and type of expense.
The Series uses the identified cost method for determining realized gain or loss on investments for both financial statement and federal income tax reporting purposes.
Foreign Currency Translation
The books and records of the Series are maintained in U.S. dollars. Foreign currencies, investments and other assets and liabilities are translated into U.S. dollars at the current exchange rates. Purchases and sales of investment securities and income and expenses are translated on the respective dates of such transactions. The Series does not isolate realized and unrealized gains and losses attributable to changes in the exchange rates from gains and losses that arise from changes in the market value of investments. Such fluctuations are included with net realized and unrealized gain or loss on investments. Net realized foreign currency gains and losses represent foreign currency gains and losses between trade date and settlement date on securities transactions, gains and losses on disposition of foreign currencies and the difference between the amount of income and foreign withholding taxes recorded on the books of the Series and the amounts actually received or paid.
Federal Taxes
The Series’ policy is to comply with the provisions of the Internal Revenue Code applicable to regulated investment companies. The Series is not subject to federal income tax or excise tax to the extent that the Series distributes to shareholders each year its taxable income, including any net realized gains on investments, in accordance with requirements of the Internal Revenue Code. Accordingly, no provision for federal income tax or excise tax has been made in the financial statements.
Management evaluates its tax positions to determine if the tax positions taken meet the minimum recognition threshold in connection with accounting for uncertainties in income tax positions taken or expected to be taken for the purposes of measuring and recognizing tax liabilities in the financial statements. Recognition of tax benefits of an uncertain tax position is required only when the position is “more likely than not” to be sustained assuming examination by
16
Notes to Financial Statements
| 2. | SIGNIFICANT ACCOUNTING POLICIES (continued) |
Federal Taxes (continued)
taxing authorities. At October 31, 2010, the Series has recorded no liability for net unrecognized tax benefits relating to uncertain income tax positions taken or expected to be taken in future tax returns.
The Series files income tax returns in the U.S. federal jurisdiction, various states and foreign jurisdictions, as required. No income tax returns are currently under investigation. The statute of limitations on the Series’ tax returns remains open for the years ended October 31, 2007 through October 31, 2010. The Fund is not aware of any tax positions for which it is reasonably possible that the total amounts of unrecognized tax benefits will significantly change in the next twelve months.
Additionally, based on the Fund’s understanding of the tax rules and rates related to income, gains and transactions for foreign jurisdictions in which it invests, the Series will provide for foreign taxes, and where appropriate, deferred foreign tax.
Distributions of Income and Gains
Distributions to shareholders of net investment income and net realized gains are made annually. An additional distribution may be necessary to avoid taxation of the Series. Distributions are recorded on the ex-dividend date.
Indemnifications
The Fund’s organizational documents provide former and current directors and officers with a limited indemnification against liabilities arising in connection with the performance of their duties to the Fund. In the normal course of business, the Fund may also enter into contracts that provide general indemnifications. The Fund’s maximum exposure under these arrangements is unknown as this would be dependent on future claims that may be made against the Fund. The risk of material loss from such claims is considered remote.
Other
The preparation of financial statements in conformity with accounting principles generally accepted in the United States of America requires management to make estimates and assumptions that affect the reported amounts of assets and liabilities and the disclosure of contingent assets and liabilities at the date of the financial statements and the reported amounts of income and expenses during the reporting period. Actual results could differ from those estimates.
| 3. | TRANSACTIONS WITH AFFILIATES |
The Fund has an Investment Advisory Agreement (the “Agreement”) with the Advisor, for which the Series pays a fee, computed daily and payable monthly, at an annual rate of 1.00% of the Series’ average daily net assets.
Under the Agreement, personnel of the Advisor provide the Series with advice and assistance in the choice of investments and the execution of securities transactions, and otherwise maintain the Series’ organization. The Advisor also provides the Fund with necessary office space and fund administration and support services. The salaries of all officers of the Fund (except a percentage of the Fund’s Chief Compliance Officer’s salary, which is paid by the Fund), and of all Directors who are “affiliated persons” of the Fund, or of the Advisor, and all personnel of the Fund, or of the Advisor, performing services relating to research, statistical and investment activities, are paid by the Advisor. Each “non-affiliated” Director receives an annual stipend, which is allocated among all the active series of the Fund. In addition, these Directors also receive a fee per Board meeting attended for each active series of the Fund plus a fee for each committee meeting attended.
The Advisor has contractually agreed, until at least February 28, 2011, to waive its fee and, if necessary, pay other operating expenses of the Series in order to maintain total direct annual fund operating expenses for the Class A Series at no more than 1.20% of average daily net assets each year. Accordingly, the Advisor waived fees of $50,759 for
17
Notes to Financial Statements
| 3. | TRANSACTIONS WITH AFFILIATES (continued) |
the year ended October 31, 2010, which is included as a reduction of expenses on the Statement of Operations. The Advisor voluntarily waived additional fees of $758 for the year ended October 31, 2010, which is also included as a reduction of expenses on the Statement of Operations. The Advisor is not eligible to recoup any expenses that have been waived or reimbursed in prior years.
Manning & Napier Investor Services, Inc., a registered broker-dealer affiliate of the Advisor, acts as distributor for the Fund’s shares. The services of Manning & Napier Investor Services, Inc. are provided at no additional cost to the Series.
For fund accounting and transfer agent services through November 7, 2009, the Fund paid the Advisor an annual fee of 0.055% of the Fund’s average daily net assets up to $4.5 billion, 0.03% of the Fund’s average daily net assets between $4.5 billion and $7.5 billion, and 0.02% of the Fund’s average daily net assets over $7.5 billion. Additionally, certain transaction and account-based fees and out-of-pocket expenses, including charges for reporting relating to the Fund’s compliance program, were charged. Prior to October 12, 2009 (for sub-accountant) and November 9, 2009 (for sub-transfer agent), the Advisor had an agreement with Citi Fund Services Ohio, Inc. (“Citi”) under which Citi served as the sub-accountant and sub-transfer agent.
The Advisor has entered into agreements dated October 12, 2009 and November 9, 2009 with PNC Global Investment Servicing U.S. Inc. (“PNCGIS”) under which PNCGIS serves as sub-accountant services agent and sub-transfer agent, respectively. Effective November 7, 2009 under the amended master services agreement, the Fund pays the Advisor an annual fee related to Fund Accounting and administration of 0.0175% on the first $3 billion of average daily net assets (excluding Target Series); 0.015% on the next $3 billion of average daily net assets (excluding Target Series); and 0.01% of the average daily net assets in excess of $6 billion (excluding Target Series); plus a base fee of $25,500 per Series. Transfer Agent fees are charged to the Fund on a per account basis. Additionally, certain transaction-, cusip-based fees and out-of-pocket expenses, including charges for reporting relating to the Fund’s compliance program, are charged.
Effective July 1, 2010, PNCGIS, which serves as the Series’ sub-accountant services agent and sub-transfer agent, was sold to The Bank of New York Mellon Corporation, the Series’ custodian. At the close of the sale, PNCGIS changed its name to BNY Mellon Investment Servicing (U.S.) Inc. (“BNY”).
Expenses not directly attributable to a Series are allocated based on each Series’ relative net assets or number of accounts, depending on the expense.
| 4. | PURCHASES AND SALES OF SECURITIES |
For the year ended October 31, 2010, purchases and sales of securities, other than U.S. Government securities and short-term securities, were $29,159,857 and $19,504,772, respectively. There were no purchases or sales of U.S. Government securities.
18
Notes to Financial Statements
| 5. | CAPITAL STOCK TRANSACTIONS |
Transactions in Class A shares of Tax Managed Series were:
| | | | | | | | | | | | | | | | |
| | | For the Year
Ended 10/31/10 | | | For the Year
Ended 10/31/09 | |
| | | Shares | | | Amount | | | Shares | | | Amount | |
Sold | | | 775,764 | | | $ | 18,247,624 | | | | 691,302 | | | $ | 12,064,908 | |
Reinvested | | | 692 | | | | 15,838 | | | | 2,642 | | | | 43,004 | |
Repurchased | | | (338,176 | ) | | | (7,880,171 | ) | | | (172,173 | ) | | | (2,936,102 | ) |
| | | | | | | | | | | | | | | | |
Total | | | 438,280 | | | $ | 10,383,291 | | | | 521,771 | | | $ | 9,171,810 | |
| | | | | | | | | | | | | | | | |
At October 31, 2010, one omnibus account owned 1,136,178 shares of the Series (62.75% of shares outstanding) valued at $28,415,801. Investment activities of this shareholder may have a material effect on the Series.
The Series may trade in instruments including written and purchased options, forward foreign currency exchange contracts and futures contracts and other derivatives in the normal course of investing activities to assist in managing exposure to various market risks. The Series may be subject to various elements of risk and may involve, to a varying degree, elements of risk in excess of the amounts recognized for financial statement purposes. These risks include: the risk that changes in the value of a derivative may not correlate perfectly with the underlying asset, rate or index, counterparty credit risk related to over the counter derivatives counterparties failure to perform under contract terms, liquidity risk related to the lack of a liquid market for these contracts allowing the fund to close out its position(s) and documentation risk relating to disagreement over contract terms. No such investments were held by the Series on October 31, 2010.
Investing in securities of foreign companies and foreign governments involves special risks and considerations not typically associated with investing in securities of domestic companies and the U.S. Government. These risks include revaluation of currencies and future adverse political and economic developments. Moreover, securities of foreign companies and foreign governments and their markets may be less liquid and their prices more volatile than those of comparable domestic companies and the U.S. Government.
| 8. | FEDERAL INCOME TAX INFORMATION |
The amount and characterization of certain income and capital gains to be distributed are determined in accordance with federal income tax regulations, which may differ from accounting principles generally accepted in the United States of America. These differences are primarily due to differing book and tax treatments in the timing of the recognition of net investment income or gains and losses, including losses deferred due to wash sales and foreign currency gains and losses. The Series may periodically make reclassifications among its capital accounts to reflect income and gains available for distribution (or available capital loss carryovers) under income tax regulations, without impacting the Series’ net asset value. Any such reclassifications are not reflected in the financial highlights.
19
Notes to Financial Statements
| 8. | FEDERAL INCOME TAX INFORMATION (continued) |
The tax character of distributions paid were as follows:
| | | | | | | | |
| | | For the Year
Ended
10/31/10 | | | For the Year
Ended
10/31/09 | |
Ordinary income | | $ | 50,092 | | | $ | 99,078 | |
At October 31, 2010, the tax basis of distributable earnings and the net unrealized appreciation based on identified cost of investments for federal income tax purposes were as follows:
| | | | |
Cost for federal income tax purposes | | $ | 38,090,091 | |
Unrealized appreciation | | $ | 7,120,808 | |
Unrealized depreciation | | | (350,429 | ) |
| | | | |
Net unrealized appreciation | | $ | 6,770,379 | |
| | | | |
Undistributed ordinary income | | | 96,837 | |
Capital loss carryover | | | 2,910,992 | |
The capital loss carryover, disclosed above, available to the extent allowed by tax law to offset future net capital gain, if any, will expire as follows:
| | | | | | | | |
| | | Loss Carryover | | | Expiration Date | |
| | $ | 1,141,000 | | | | October 31, 2016 | |
| | $ | 1,769,992 | | | | October 31, 2017 | |
The capital loss carryover utilized in the current year was $1,439,370.
20
Report of Independent Registered Public Accounting Firm
To the Board of Directors of Manning & Napier Fund, Inc. and Shareholders of Tax Managed Series:
In our opinion, the accompanying statement of assets and liabilities, including the investment portfolio, and the related statements of operations and of changes in net assets and the financial highlights present fairly, in all material respects, the financial position of the Tax Managed Series (a series of Manning & Napier Fund, Inc., hereafter referred to as the “Series”) at October 31, 2010, and the results of its operations for the year then ended, the changes in its net assets for each of the two years in the period then ended and the financial highlights for each of the five years in the period then ended, in conformity with accounting principles generally accepted in the United States of America. These financial statements and financial highlights (hereafter referred to as “financial statements”) are the responsibility of the Series’ management. Our responsibility is to express an opinion on these financial statements based on our audits. We conducted our audits of these financial statements in accordance with the standards of the Public Company Accounting Oversight Board (United States). Those standards require that we plan and perform the audit to obtain reasonable assurance about whether the financial statements are free of material misstatement. An audit includes examining, on a test basis, evidence supporting the amounts and disclosures in the financial statements, assessing the accounting principles used and significant estimates made by management, and evaluating the overall financial statement presentation. We believe that our audits, which included confirmation of securities at October 31, 2010 by correspondence with the custodian and brokers, provide a reasonable basis for our opinion.

New York, New York
December 21, 2010
21
Supplemental Tax Information (unaudited)
All designations are based on financial information available as of the date of this annual report and, accordingly are subject to change.
For federal income tax purposes, the Series designates for the current fiscal year $50,092 or, if different, the maximum amount allowable under the tax law, as qualified dividend income.
For corporate shareholders, the percentage of investment income (dividend income plus short-term gains, if any) that qualifies for the dividends received deduction for the current fiscal year is 99.96%.
22
Directors’ and Officers’ Information (unaudited)
The Statement of Additional Information provides additional information about the Fund’s directors and officers and can be obtained without charge by calling 1-800-466-3863, at www.manningnapieradvisors.com, or on the EDGAR Database on the SEC Internet web site (http:// www.sec.gov). The following chart shows certain information about the Fund’s officers and directors, including their principal occupations during the last five years. Unless specific dates are provided, the individuals have held the listed positions for longer than five years.
| | |
INTERESTED DIRECTOR/OFFICER | | |
| |
Name: | | B. Reuben Auspitz* |
Address: | | 290 Woodcliff Drive Fairport, NY 14450 |
Age: | | 63 |
Current Position(s) Held with Fund: | | Principal Executive Officer, President, Chairman & Director |
Term of Office1 & Length of Time Served: | | Indefinite - Director since 1984; Vice President 1984 - 2003; President since 2004; Principal Executive Officer since 2002 |
Principal Occupation(s) During Past 5 Years: | | Executive Vice President; Executive Group Member**; Chief Compliance |
| | Officer since 2004; Vice Chairman since June 2010; Co-Executive |
| | Director from 2003-2010 - Manning & Napier Advisors, Inc. President; |
| | Director - Manning & Napier Investor Services, Inc. |
| | Holds or has held one or more of the following titles for various |
| | subsidiaries and affiliates: President, Vice President, Director, Chairman, |
| | Treasurer, Chief Compliance Officer or Member. |
| Number of Portfolios Overseen within Fund Complex: | | 29 |
Other Directorships Held Outside Fund Complex: | | N/A |
INDEPENDENT DIRECTORS | | |
| |
Name: | | Stephen B. Ashley |
Address: | | 290 Woodcliff Drive |
| | Fairport, NY 14450 |
Age: | | 70 |
Current Position(s) Held with Fund: | | Director, Audit Committee Member, Governance & Nominating |
| | Committee Member |
Term of Office & Length of Time Served: | | Indefinite - Since 1996 |
Principal Occupation(s) During Past 5 Years: | | Chairman, Director, President & Chief Executive Officer, The Ashley |
| | Group (property management and investment). Chairman |
| | (non-executive) 2004-2008; Director 1995-2008 - Fannie Mae (mortgage) |
| Number of Portfolios Overseen within Fund Complex: | | 29 |
Other Directorships Held Outside Fund Complex: | | The Ashley Group (1995-2008) |
| | | Genesee Corporation (1987-2007) |
Name: | | Peter L. Faber |
Address: | | 290 Woodcliff Drive |
| | Fairport, NY 14450 |
Age: | | 72 |
Current Position(s) Held with Fund: | | Director, Governance & Nominating Committee Member |
Term of Office & Length of Time Served: | | Indefinite - Since 1987 |
Principal Occupation(s) During Past 5 Years: | | Senior Counsel since 2006, Partner (1995 - 2006) - McDermott, Will & |
| | Emery LLP (law firm) |
| Number of Portfolios Overseen within Fund Complex: | | 29 |
Other Directorships Held Outside Fund Complex: | | Partnership for New York City, Inc. (non-profit) |
| | New York Collegium (non-profit) |
| | | Boston Early Music Festival (non-profit) |
23
Directors’ and Officers’ Information (unaudited)
| | |
INDEPENDENT DIRECTORS (continued) | | |
| |
Name: | | Harris H. Rusitzky |
Address: | | 290 Woodcliff Drive |
| | Fairport, NY 14450 |
Age: | | 75 |
Current Position(s) Held with Fund: | | Director, Audit Committee Member, Governance & Nominating |
| | Committee Member |
Term of Office & Length of Time Served: | | Indefinite - Since 1985 |
Principal Occupation(s) During Past 5 Years: | | President, The Greening Group (business consultants) since 1994; |
| | Partner, The Restaurant Group (restaurants) since 2006 |
| Number of Portfolios Overseen within Fund Complex: | | 29 |
Other Directorships Held Outside Fund Complex: | | N/A |
Name: | | Paul A. Brooke |
Address: | | 290 Woodcliff Drive |
| | Fairport, NY 14450 |
Age: | | 64 |
Current Position(s) Held with Fund: | | Director, Audit Committee Member, Governance & Nominating |
| | Committee Member |
Term of Office & Length of Time Served: | | Indefinite - Since 2007 |
Principal Occupation(s) During Past 5 Years: | | Chairman & CEO, Alsius Corp. (investments); Managing Member, PMSV |
| | Holdings LLC (investments) |
| Number of Portfolios Overseen within Fund Complex: | | 29 |
Other Directorships Held Outside Fund Complex: | | Incyte Corp. (2000-present) |
| | ViroPharma, Inc. (2000-present) |
| | HLTH Corp. (2000-present) |
| | Cheyne Capital International (2000-present) |
| | MPM Bio-equities (2000-present) |
| | GMP Companies (2000-present) |
| | | HoustonPharma (2000-present) |
Name: | | Richard M. Hurwitz |
Address: | | 290 Woodcliff Drive |
| | Fairport, NY 14450 |
Age: | | 47 |
Current Position(s) Held with Fund: | | Director, Audit Committee Member, Governance & Nominating |
| | Committee Member |
Term of Office & Length of Time Served: | | Indefinite - Since 2009 |
Principal Occupation(s) During Past 5 Years: | | Chief Executive Officer, Pictometry International Corp. since August 2010 |
| | (provider of georeferenced, aerial image libraries and related software) |
| | Managing Partner (2006-July 2010) - Aegis Investment Partners, LLC |
| | (investments); Founder and Managing Partner (2004-2005) - Village |
| | Markets, LLC (groceries) |
| Number of Portfolios Overseen within Fund Complex: | | 29 |
Other Directorships Held Outside Fund Complex: | | Pictometry International Corp. (2000-2010) |
| | Pioneering Technologies (2006-2009) |
| | | Vensearch Capital Corp. (2003-2007) |
24
Directors’ and Officers’ Information (unaudited)
| | |
OFFICERS | | |
| |
| Name: | | Jeffrey S. Coons, Ph.D., CFA |
| Address: | | 290 Woodcliff Drive |
| | Fairport, NY 14450 |
| Age: | | 47 |
| Current Position(s) Held with Fund: | | Vice President |
| Term of Office1 & Length of Time Served: | | Since 2004 |
| Principal Occupation(s) During Past 5 Years: | �� | President since 2010, Co-Director of Research since 2002 & Executive |
| | Group Member** since 2003, - Manning & Napier Advisors, Inc. Holds |
| | one or more of the following titles for various subsidiaries and affiliates: |
| | President, Director, Treasurer or Senior Trust Officer. |
| Number of Portfolios Overseen within Fund Complex: | | 29 |
| Other Directorships Held Outside Fund Complex: | | N/A |
| Name: | | Beth Galusha |
| Address: | | 290 Woodcliff Drive |
| | Fairport, NY 14450 |
| Age: | | 49 |
| Current Position(s) Held with Fund: | | Assistant Chief Financial Officer |
| Term of Office1 & Length of Time Served: | | Assistant Chief Financial Officer since 2010 |
| Principal Occupation(s) During Past 5 Years: | | Chief Financial Officer and Treasurer, Manning & Napier Advisors, Inc. |
| | Holds one or more of the following titles for various affiliates: Chief |
| | Financial Officer, Director, or Treasurer |
| Number of Portfolios Overseen within Fund Complex: | | 29 |
| Other Directorships Held Outside Fund Complex: | | N/A |
| Name: | | Christine Glavin |
| Address: | | 290 Woodcliff Drive |
| | Fairport, NY 14450 |
| Age: | | 44 |
| Current Position(s) Held with Fund: | | Principal Financial Officer, Chief Financial Officer |
| Term of Office1 & Length of Time Served: | | Principal Financial Officer since 2002; Chief Financial Officer since 2001 |
| Principal Occupation(s) During Past 5 Years: | | Fund Reporting Manager, Manning & Napier Advisors, Inc. since 1997 |
| Number of Portfolios Overseen within Fund Complex: | | 29 |
| Other Directorships Held Outside Fund Complex: | | N/A |
| Name: | | Jodi L. Hedberg |
| Address: | | 290 Woodcliff Drive |
| | Fairport, NY 14450 |
| Age: | | 42 |
| Current Position(s) Held with Fund: | | Corporate Secretary, Chief Compliance Officer, Anti-Money Laundering |
| | Compliance Officer |
| Term of Office1 & Length of Time Served: | | Corporate Secretary since 1997; Chief Compliance Officer since 2004 |
| Principal Occupation(s) During Past 5 Years: | | Director of Compliance, Manning & Napier Advisors, Inc. and affiliates |
| | since 1990 (title change in 2005 from Compliance Manager to Director of |
| | Compliance); Corporate Secretary, Manning & Napier Investor Services, |
| | Inc. since 2006 |
| Number of Portfolios Overseen within Fund Complex: | | 29 |
| Other Directorships Held Outside Fund Complex: | | N/A |
| * | Interested Director, within the meaning of the Investment Company Act of 1940 by reason of his position with the Fund’s investment advisor and distributor. Mr. Auspitz serves as the Executive Vice President and Director, Manning & Napier Advisors, Inc. and President and Director, Manning & Napier Investor Services, Inc., the Fund’s distributor. |
| ** | Prior to June 2010, the Executive Group, consisting of senior executive employee-owners, performed the duties of the Office of the Chief Executive of the Advisor. |
| | Effective June 2010, The Executive Group serves as an advisory board to the Chief Executive Officer. |
| 1 | The term of office for President, Vice President, Chief Financial Officer, Assistant Chief Financial Officer, and Corporate Secretary is one year and until their respective successors are chosen and qualified. All other officers’ terms are indefinite. |
25
Literature Requests (unaudited)
Proxy Voting Policies and Procedures
A description of the policies and procedures that the Fund uses to determine how to vote proxies relating to portfolio securities is available, without charge, upon request:
| | | | |
By phone | | 1-800-466-3863 | | |
On the Securities and Exchange Commission’s (SEC) web site | | http://www.sec.gov | | |
Proxy Voting Record
Information regarding how the Fund voted proxies relating to portfolio securities during the most recent 12-month period ended June 30th is available, without charge, upon request:
| | | | |
By phone | | 1-800-466-3863 | | |
On the SEC’s web site | | http://www.sec.gov | | |
Quarterly Portfolio Holdings
The Series’ complete schedule of portfolio holdings for the 1st and 3rd quarters of each fiscal year are provided on Form N-Q, and are available, without charge, upon request:
| | | | |
By phone | | 1-800-466-3863 | | |
On the SEC’s web site | | http://www.sec.gov | | |
The Series’ Form N-Q may be reviewed and copied at the SEC’s Public Reference Room in Washington, D.C. Information on the operation of the Public Reference Room may be obtained by calling 1-800-SEC-0330.
Prospectus and Statement of Additional Information (SAI)
The prospectus and SAI provide additional information about each Series, including charges, expenses and risks. These documents are available, without charge, upon request:
| | | | |
By phone | | 1-800-466-3863 | | |
On the SEC’s web site | | http://www.sec.gov | | |
On the Advisor’s web site | | http://manningnapieradvisors.com | | |
Additional information available at www.manningnapieradvisors.com
1. Fund Holdings - Month-End
2. Fund Holdings - Quarter-End
3. Shareholder Report - Annual
4. Shareholder Report - Semi-Annual
MNTAX-10/10-AR


|
TARGET INCOME SERIES |
TARGET 2010 SERIES |
TARGET 2020 SERIES |
TARGET 2030 SERIES |
TARGET 2040 SERIES |
TARGET 2050 SERIES |
Management Discussion and Analysis (unaudited)
Dear Shareholders:
The twelve months ending October 31, 2010 were characterized by well-defined swings in investor sentiment. Optimism fueled strong market returns during the fourth quarter of 2009 and through much of the first quarter of 2010, as positive economic releases led investors to believe in the potential for a robust U.S. recovery. However, more negative economic releases into May and June of 2010, coupled with sovereign debt concerns in Europe, led to a dramatic swing in sentiment during the second quarter, with stock markets suffering notable losses. While volatility remained during the third quarter of 2010, September was a particularly strong month, which helped push market indexes into positive territory on a calendar year-to-date basis.
Despite several ups and downs over the past year, the markets made choppy progress. For the twelve months ended October 2010, the S&P 500 Index gained 16.53%, aided by the rally that began in September. Similar to domestic equities, international stocks experienced pronounced fluctuations over the last year. After climbing considerably the last two months, the Morgan Stanley Capital International (MSCI) All Country World ex U.S. (ACWI x US) was up 12.62% the past year through October. The fixed income markets delivered more stable returns throughout the short-term market swings, with the Barclay’s Capital Aggregate Bond Index advancing 8.01% over the past twelve months.
The Target Series represent six distinct mutual funds, each managed to a designated target date. The investment objective of each Series automatically becomes more conservative over time as the specified target date approaches. Over the current stock market cycle, which includes the bull market in stocks from October 2002 until November 2007 and the current bear market, all six Target Series continue to provide competitive absolute returns for long-term investors. The Target Income Series (i.e., the most fixed income oriented Series) has delivered similar results to its blended index benchmark over the current stock market cycle. Meanwhile, the more growth-oriented Target Series continue to outperform their respective blended index benchmarks over the most recent full cycle.
For the last twelve months ending October 31, 2010, each of the Target Series posted double-digit positive returns. Furthermore, all six beat their respective blended index benchmarks over the past one-year period.
Manning & Napier’s fundamentals-based investment process led to a higher than average allocation to equities in each of the Series during the past year, as our analysts uncovered stock opportunities that met our strategy and valuation disciplines. This higher allocation to equities helped absolute and relative returns in the last quarter of 2009 and the first quarter of 2010. During the market correction in the second quarter of 2010, this modest overweight to stocks hurt relative results. However, this higher exposure to equities has benefited each of the Target Series on an absolute and relative basis since the markets rebounded in the third quarter.
Within the underlying equity holdings of the Target Series’ portfolios, we had an overweight in the Information Technology and Health Care sectors relative to the blended benchmarks. This higher allocation had a varied impact on the Series’ performance over the past year, yet specific stock selections within the Information Technology and Health Care sectors contributed to positive relative returns more recently during the third quarter. On the other hand, the Series had a low exposure to Financials relative to their respective blended benchmarks because regulatory uncertainty and macroeconomic challenges such as indebted consumers, persistently high unemployment, a fragile housing market, and continued loan losses prevented many financial services companies from meeting the requirements of our investment strategies. This underweight to Financials aided returns relative to the blended benchmarks during the past year, with the exception of the market rally in early 2010.
Within the underlying fixed income portion of the Series’ portfolios, we have shifted assets away from U.S. Treasury securities and toward sectors that offer additional yield potential. The Target 2030 and Target 2020, which are geared towards growth, and the Target 2010 and Income Series, which are respectively managed to reduce volatility and preserve capital, all have a bias toward investment grade corporate securities, with a modest allocation to high yield bonds as well.
1
Management Discussion and Analysis (unaudited)
Additionally, each of the Series has noteworthy exposure to U.S. Agency securities. While the Target Series’ fixed income returns trailed the fixed income portion of their respective blended benchmarks in the last quarter of 2009, this current positioning provided favorable results relative to the blended benchmarks throughout the second and third quarters of 2010.
While the markets were volatile over the past twelve months, the outlook for the U.S. economy did not change materially over the past year. Despite swings in positive and negative sentiment, Manning & Napier continues to see a slow growth environment as the economy works through extensive consumer and government debt levels. In such an environment, we are focused on company-specific opportunities that can prosper. Specifically, we are seeking leading companies that can grow and gain market share despite a sluggish economy, particularly multinational businesses that may benefit from exposure to faster-growing foreign markets. Using our active stock selection strategies, we are also seeking opportunities in certain cyclical industries that have a tight relationship between supply and demand.
As 2010 comes to an end, economic momentum has begun to slow. With widespread challenges such as elevated unemployment levels and high government debt burdens, the growth prospects for the developed world remain a concern. In this macroeconomic reality of slow growth, a focus on company and industry fundamentals remains important for identifying quality investment opportunities. Through our disciplined investment strategies, Manning & Napier continues to pursue specific areas of the market that are presenting opportunities, particularly winning companies that have favorable growth prospects. Such an active and flexible approach has been at the core of our investment process since Manning & Napier’s inception 40 years ago.
As always, we appreciate your business.
Sincerely,
Manning & Napier Advisors, Inc.
2
Performance Update - Target Income Series (unaudited)
| | | | | | | | |
| | | Average Annual Total Returns
As of October 31, 2010 | |
| | | One
Year | | | Since
Inception1 | |
Manning & Napier Fund, Inc. - Target Income Series - Class K2 | | | 11.22 | % | | | 5.76 | % |
Manning & Napier Fund, Inc. - Target Income Series - Class R2 | | | 10.97 | % | | | 5.49 | % |
Manning & Napier Fund, Inc. - Target Income Series - Class C2 | | | 10.38 | % | | | 4.95 | % |
Manning & Napier Fund, Inc. - Target Income Series - Class I2 | | | 11.44 | % | | | 6.02 | % |
Barclays Capital Intermediate U.S. Aggregate Bond Index3,5 | | | 7.57 | % | | | 6.42 | % |
Target Income Blended Index3,4,5 | | | 9.73 | % | | | 5.23 | % |
The following graph compares the value of a $10,000 investment in the Manning & Napier Fund, Inc. - Target Income Series - Class K from its inception1 (3/28/08) to present (10/31/10) to the Barclays Capital Intermediate U.S. Aggregate Bond Index and the Target Income Blended Index.
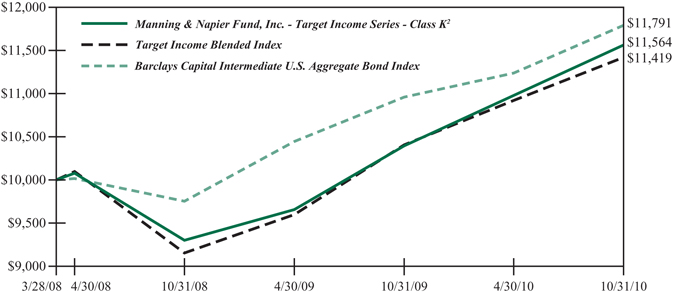
| 1 | Performance numbers for the Series are calculated from March 28, 2008, the Series’ inception date. The Barclays Capital Intermediate U.S. Aggregate Bond Index only publishes month-end numbers; therefore, performance numbers for the Index are calculated from March 31, 2008. |
| 2 | The Series’ performance does not reflect the deduction of taxes that a shareholder would pay on fund distributions or the redemption of shares. The Series’ performance is historical and may not be indicative of future results. The performance returns shown are inclusive of the net expense ratio of the Series. For the year ended October 31, 2010, this net expense ratio was 0.28% for Class K, 0.54% for Class R, 0.99% for Class C and 0.05% for Class I. The gross expense ratio, which does not account for any voluntary or contractual waivers currently in effect, was 0.53% for Class K, 0.91% for Class R, 1.28% for Class C and 0.38% for Class I for the year ended October 31, 2010. |
| 3 | The Barclays Capital Intermediate U.S. Aggregate Bond Index is an unmanaged index that represents the U.S. domestic investment-grade bond market. It is a market value weighted index of investment grade debt issues, including government, corporate, asset-backed and mortgage-backed securities, with maturities greater than one year but less than ten years. The Index returns assume reinvestment of income and, unlike Series returns, do not reflect any fees or expenses. |
| 4 | The Target Income Blended Index is a 5%/15%/80% Blended Index which is made up of 5% Morgan Stanley Capital International (MSCI) All Country World Index ex U.S., 15% Russell 3000® Index, and 80% Barclays Capital Intermediate U.S. Aggregate Bond Index. The MSCI All Country World Index ex U.S. is a free float-adjusted market capitalization weighted index that is designed to measure equity market performance in the global developed and emerging markets and consists of 47 developed and emerging market county indices outside the United States. The Index is denominated in U.S. Dollars. The Index returns assume daily reinvestment of net dividends (which do account for foreign dividend taxation). The Russell 3000® Index is an unmanaged index that consists of 3,000 of the largest U.S. companies based on total market capitalization. The Index returns are based on a market capitalization weighted average of relative price changes of the component stocks plus dividends whose reinvestments are compounded daily. Both Indices’ returns, unlike Series returns, do not reflect any fees or expenses. |
| 5 | Because the Series’ asset allocation will vary over time, the composition of the Series’ portfolio may not match the composition of the comparative Index portfolios. |
3
Performance Update - Target 2010 Series (unaudited)
| | | | | | | | |
| | | Average Annual Total Returns
As of October 31, 2010 | |
| | | One
Year | | | Since
Inception1 | |
Manning & Napier Fund, Inc. - Target 2010 - Class K2 | | | 12.85 | % | | | 4.01 | % |
Manning & Napier Fund, Inc. - Target 2010 - Class R2 | | | 12.64 | % | | | 3.78 | % |
Manning & Napier Fund, Inc. - Target 2010 - Class C2 | | | 12.12 | % | | | 3.31 | % |
Manning & Napier Fund, Inc. - Target 2010 - Class I2 | | | 13.10 | % | | | 4.28 | % |
Barclays Capital U.S. Aggregate Bond Index3,5 | | | 8.01 | % | | | 6.69 | % |
Target 2010 Blended Index3,4,5 | | | 12.05 | % | | | 3.95 | % |
The following graph compares the value of a $10,000 investment in the Manning & Napier Fund, Inc. - Target 2010 Series - Class K from its inception1 (3/28/08) to present (10/31/10) to the Barclays Capital U.S. Aggregate Bond Index and the Target 2010 Blended Index.
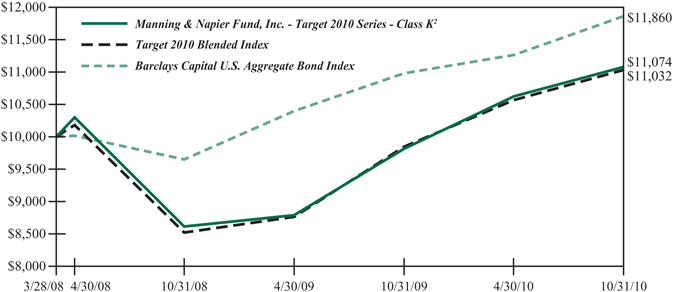
| 1 | Performance numbers for the Series are calculated from March 28, 2008, the Series’ inception date. The Barclays Capital U.S. Aggregate Bond Index only publishes month-end numbers; therefore, performance numbers for the Index are calculated from March 31, 2008. |
| 2 | The Series’ performance does not reflect the deduction of taxes that a shareholder would pay on fund distributions or the redemption of shares. The Series’ performance is historical and may not be indicative of future results. The performance returns shown are inclusive of the net expense ratio of the Series. For the year ended October 31, 2010, this net expense ratio was 0.29% for Class K, 0.52% for Class R, 0.98% for Class C and 0.05% for Class I. The gross expense ratio, which does not account for any voluntary or contractual waivers currently in effect, was 0.71% for Class K, 0.93% for Class R, 1.42% for Class C and 0.48% for Class I for the year ended October 31, 2010. |
| 3 | The Barclays Capital U.S. Aggregate Bond Index is an unmanaged index that represents the U.S. domestic investment-grade bond market. It is a market value weighted index of investment-grade debt issues, including government, corporate, asset-backed and mortgage-backed securities, with maturities of one year or more. The Index returns assume reinvestment of income and, unlike Series returns, do not reflect any fees or expenses. |
| 4 | The Target 2010 Blended Index is a 10%/30%/60% Blended Index which is made up of 10% Morgan Stanley Capital International (MSCI) All Country World Index ex U.S., 30% Russell 3000® Index, and 60% Barclays Capital U.S. Aggregate Bond Index. The MSCI All Country World Index ex U.S. is a free float-adjusted market capitalization weighted index that is designed to measure equity market performance in the global developed and emerging markets and consists of 47 developed and emerging market country indices outside the United States. The Index is denominated in U.S. Dollars. The Index returns assume daily reinvestment of net dividends (which do account for foreign dividend taxation). The Russell 3000® Index is an unmanaged index that consists of 3,000 of the largest U.S. companies based on total market capitalization. The Index returns are based on a market capitalization weighted average of relative price changes of the component stocks plus dividends whose reinvestments are compounded daily. Both Indices’ returns, unlike Series returns, do not reflect any fees or expenses. |
| 5 | Because the Series’ asset allocation will vary over time, the composition of the Series’ portfolio may not match the composition of the comparative Index portfolios. |
4
Performance Update - Target 2020 Series (unaudited)
| | | | | | | | |
| | | Average Annual Total Returns
As of October 31, 2010 | |
| | | One
Year | | | Since
Inception1 | |
Manning & Napier Fund, Inc. - Target 2020 Series - Class K2 | | | 14.89 | % | | | 3.09 | % |
Manning & Napier Fund, Inc. - Target 2020 Series - Class R2 | | | 14.72 | % | | | 2.78 | % |
Manning & Napier Fund, Inc. - Target 2020 Series - Class C2 | | | 14.24 | % | | | 2.33 | % |
Manning & Napier Fund, Inc. - Target 2020 Series - Class I2 | | | 15.24 | % | | | 3.35 | % |
Barclays Capital U.S. Aggregate Bond Index3,5 | | | 8.01 | % | | | 6.69 | % |
Target 2020 Blended Index3,4,5 | | | 13.34 | % | | | 2.68 | % |
The following graph compares the value of a $10,000 investment in the Manning & Napier Fund, Inc. - Target 2020 Series - Class K from its inception1 (3/28/08) to present (10/31/10) to the Barclays Capital U.S. Aggregate Bond Index and the Target 2020 Blended Index.
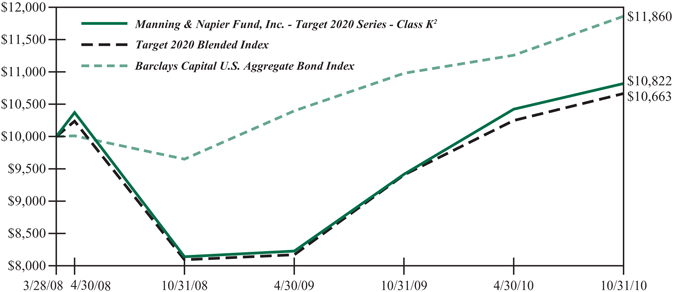
| 1 | Performance numbers for the Series are calculated from March 28, 2008, the Series’ inception date. The Barclays Capital U.S. Aggregate Bond Index only publishes month-end numbers; therefore, performance numbers for the Index are calculated from March 31, 2008. |
| 2 | The Series’ performance does not reflect the deduction of taxes that a shareholder would pay on fund distributions or the redemption of shares. The Series’ performance is historical and may not be indicative of future results. The performance returns shown are inclusive of the net expense ratio of the Series. For the year ended October 31, 2010, this net expense ratio was 0.29% for Class K, 0.52% for Class R, 0.98% for Class C and 0.05% for Class I. The gross expense ratio, which does not account for any voluntary or contractual waivers currently in effect, was 0.46% for Class K, 0.70% for Class R, 1.16% for Class C and 0.24% for Class I for the year ended October 31, 2010. |
| 3 | The Barclays Capital (formerly Lehman Brothers) U.S. Aggregate Bond Index is an unmanaged index that represents the U.S. domestic investment-grade bond market. It is a market value weighted index of investment-grade debt issues, including government, corporate, asset-backed and mortgage-backed securities, with maturities of one year or more. The Index returns assume reinvestment of income and, unlike Series returns, do not reflect any fees or expenses. |
| 4 | The Target 2020 Blended Index is a 15%/40%/45% Blended Index which is made up of 15% Morgan Stanley Capital International (MSCI) All Country World Index ex U.S., 40% Russell 3000® Index, and 45% Barclays Capital U.S. Aggregate Bond Index. The MSCI All Country World Index ex U.S. is a free float-adjusted market capitalization weighted index that is designed to measure equity market performance in the global developed and emerging markets and consists of 47 developed and emerging market country indices outside the United States. The Index is denominated in U.S. Dollars. The Index returns assume daily reinvestment of net dividends (which do account for foreign dividend taxation). The Russell 3000® Index is an unmanaged index that consists of 3,000 of the largest U.S. companies based on total market capitalization. The Index returns are based on a market capitalization weighted average of relative price changes of the component stocks plus dividends whose reinvestments are compounded daily. Both Indices’ returns, unlike Series returns, do not reflect any fees or expenses. |
| 5 | Because the Series’ asset allocation will vary over time, the composition of the Series’ portfolio may not match the composition of the comparative Index portfolios. |
5
Performance Update - Target 2030 Series (unaudited)
| | | | | | | | |
| | | Average Annual Total Returns
As of October 31, 2010 | |
| | | One
Year | | | Since
Inception1 | |
Manning & Napier Fund, Inc. - Target 2030 Series - Class K2 | | | 16.34 | % | | | 2.06 | % |
Manning & Napier Fund, Inc. - Target 2030 Series - Class R2 | | | 16.01 | % | | | 1.87 | % |
Manning & Napier Fund, Inc. - Target 2030 Series - Class C2 | | | 15.50 | % | | | 1.42 | % |
Manning & Napier Fund, Inc. - Target 2030 Series - Class I2 | | | 16.76 | % | | | 2.43 | % |
Russell 3000® Index3,6 | | | 18.34 | % | | | -1.24 | % |
Barclays Capital U.S. Aggregate Bond Index4,6 | | | 8.01 | % | | | 6.69 | % |
Target 2030 Blended Index3,4,5,6 | | | 8.90 | % | | | 0.83 | % |
The following graph compares the value of a $10,000 investment in the Manning & Napier Fund, Inc. - Target 2030 Series - Class K from its inception1 (3/28/08) to present (10/31/10) to the Russell 3000® Index and the Target 2030 Blended Index.
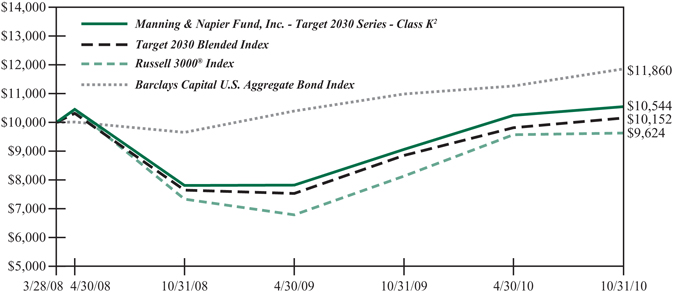
| 1 | Performance numbers for the Series are calculated from March 28, 2008, the Series’ inception date. The Barclays Capital U.S. Aggregate Bond Index only publishes month-end numbers; therefore, performance numbers for the Index are calculated from March 31, 2008. |
| 2 | The Series’ performance does not reflect the deduction of taxes that a shareholder would pay on fund distributions or the redemption of shares. The Series’ performance is historical and may not be indicative of future results. The performance returns shown are inclusive of the net expense ratio of the Series. For the year ended October 31, 2010, this net expense ratio was 0.29% for Class K, 0.54% for Class R, 1.00% for Class C and 0.05% for Class I. The gross expense ratio, which does not account for any voluntary or contractual waivers currently in effect, was 0.49% for Class K, 0.72% for Class R, 1.22% for Class C and 0.27% for Class I for the year ended October 31, 2010. |
| 3 | The Russell 3000® Index is an unmanaged index that consists of 3,000 of the largest U.S. companies based on total market capitalization. The Index returns are based on a market capitalization weighted average of relative price changes of the component stocks plus dividends whose reinvestments are compounded daily. The Index returns, unlike Series returns, do not reflect any fees or expenses. |
| 4 | The Barclays Capital U.S. Aggregate Bond Index is an unmanaged index that represents the U.S. domestic investment-grade bond market. It is a market value weighted index of investment-grade debt issues, including government, corporate, asset-backed and mortgage-backed securities, with maturities of one year or more. The Index returns assume reinvestment of income. The Index returns, unlike Series returns, do not reflect any fees or expenses. |
| 5 | The Target 2030 Blended Index is 60% of a 20%/65%/15% Blended Index which is made up of 20% Morgan Stanley Capital International (MSCI) All Country World Index ex U.S., 65% Russell 3000® Index, and 15% Barclays Capital U.S. Aggregate Bond Index and 40% of a 15%/40%/45% Blended Index which is 15% Morgan Stanley Capital International (MSCI) All Country World Index ex U.S., 40% Russell 3000® Index, and 45% Barclays Capital U.S. Aggregate Bond Index. The MSCI All Country World Index ex U.S. is a free float-adjusted market capitalization weighted index that is designed to measure equity market performance in the global developed and emerging markets and consists of 47 developed and emerging market county indices outside the United States. The Index is denominated in U.S. Dollars. The Index returns assume daily reinvestment of net dividends (which do account for foreign dividend taxation). The Index returns, unlike Series returns, do not reflect any fees or expenses. |
| 6 | Because the Series’ asset allocation will vary over time, the composition of the Series’ portfolio may not match the composition of the comparative Index portfolios. |
6
Performance Update - Target 2040 Series (unaudited)
| | | | | | | | |
| | | Average Annual Total Returns
As of October 31, 2010 | |
| | | One
Year | | | Since
Inception1 | |
Manning & Napier Fund, Inc. - Target 2040 - Class K2 | | | 17.10 | % | | | 2.00 | % |
Manning & Napier Fund, Inc. - Target 2040 - Class R2 | | | 16.85 | % | | | 1.79 | % |
Manning & Napier Fund, Inc. - Target 2040 - Class C2 | | | 16.32 | % | | | 1.34 | % |
Manning & Napier Fund, Inc. - Target 2040 - Class I2 | | | 17.52 | % | | | 2.33 | % |
Russell 3000® Index3,5 | | | 18.34 | % | | | -1.24 | % |
Target 2040 Blended Index3,4,5 | | | 15.94 | % | | | -0.12 | % |
The following graph compares the value of a $10,000 investment in the Manning & Napier Fund, Inc. - Target 2040 Series - Class K from its inception1 (3/28/08) to present (10/31/10) to the Russell 3000® Index and the Target 2040 Blended Index.
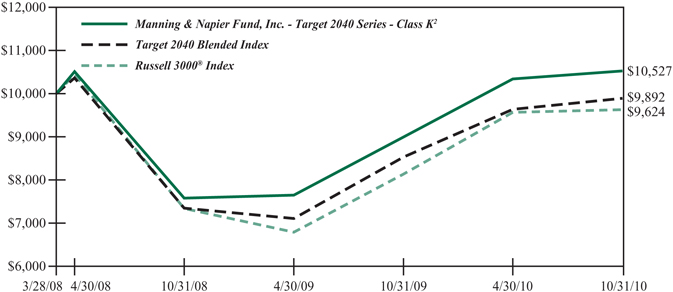
| 1 | Performance numbers for the Series are calculated from March 28, 2008, the Series’ inception date. The Barclays Capital U.S. Aggregate Bond Index, a component of the Target 2040 Blended Index, only publishes month-end numbers; therefore, performance numbers for the Index are calculated from March 31, 2008. |
| 2 | The Series’ performance does not reflect the deduction of taxes that a shareholder would pay on fund distributions or the redemption of shares. The Series’ performance is historical and may not be indicative of future results. The performance returns shown are inclusive of the net expense ratio of the Series. For the year ended October 31, 2010, this net expense ratio was 0.29% for Class K, 0.52% for Class R, 0.99% for Class C and 0.05% for Class I. The gross expense ratio, which does not account for any voluntary or contractual waivers currently in effect, was 0.61% for Class K, 0.83% for Class R, 1.36% for Class C and 0.41% for Class I for the year ended October 31, 2010. |
| 3 | The Russell 3000® Index is an unmanaged index that consists of 3,000 of the largest U.S. companies based on total market capitalization. The Index returns are based on a market capitalization weighted average of relative price changes of the component stocks plus dividends whose reinvestments are compounded daily. The Index returns, unlike Series returns, do not reflect any fees or expenses. |
| 4 | The Target 2040 Blended Index is a 20%/65%/15% Blended Index which is made up of 20% Morgan Stanley Capital International (MSCI) All Country World Index ex U.S., 65% Russell 3000® Index, and 15% Barclays Capital U.S. Aggregate Bond Index. The MSCI All Country World Index ex U.S. is a free float-adjusted market capitalization weighted index that is designed to measure equity market performance in the global developed and emerging markets and consists of 47 developed and emerging market county indices outside the United States. The Index is denominated in U.S. Dollars. The Index returns assume daily reinvestment of net dividends (which do account for foreign dividend taxation). The Barclays Capital U.S. Aggregate Bond Index is an unmanaged index that represents the U.S. domestic investment-grade bond market. It is a market value weighted index of investment-grade debt issues, including government, corporate, asset-backed and mortgage-backed securities, with maturities of one year or more. The Index returns assume reinvestment of income. Both Indices’ returns, unlike Series returns, do not reflect any fees or expenses. |
| 5 | Because the Series’ asset allocation will vary over time, the composition of the Series’ portfolio may not match the composition of the comparative Index portfolios. |
7
Performance Update - Target 2050 Series (unaudited)
| | | | | | | | |
| | | Average Annual Total Returns
As of October 31, 2010 | |
| | | One
Year | | | Since
Inception1 | |
Manning & Napier Fund, Inc. - Target 2050 - Class K2 | | | 17.16 | % | | | 2.71 | % |
Manning & Napier Fund, Inc. - Target 2050 - Class R2 | | | 16.85 | % | | | 2.48 | % |
Manning & Napier Fund, Inc. - Target 2050 - Class C2 | | | 16.34 | % | | | 2.00 | % |
Manning & Napier Fund, Inc. - Target 2050 - Class I2 | | | 17.40 | % | | | 3.02 | % |
Russell 3000® Index3,5 | | | 18.34 | % | | | -1.24 | % |
Target 2050 Blended Index3,4,5 | | | 15.94 | % | | | -0.12 | % |
The following graph compares the value of a $10,000 investment in the Manning & Napier Fund, Inc. - Target 2050 Series - Class K from its inception1 (3/28/08) to present (10/31/10) to the Russell 3000® Index and the Target 2050 Blended Index.
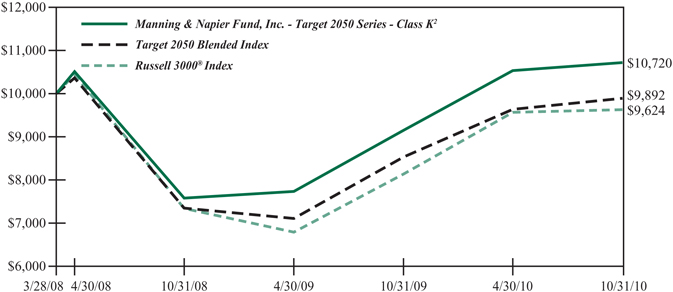
| 1 | Performance numbers for the Series are calculated from March 28, 2008, the Series’ inception date. The Barclays Capital U.S. Aggregate Bond Index, a component of the Target 2050 Blended Index, only publishes month-end numbers; therefore, performance numbers for the Index are calculated from March 31, 2008. |
| 2 | The Series’ performance does not reflect the deduction of taxes that a shareholder would pay on fund distributions or the redemption of shares. The Series’ performance is historical and may not be indicative of future results. The performance returns shown are inclusive of the net expense ratio of the Series. For the year ended October 31, 2010, this net expense ratio was 0.30% for Class K, 0.53% for Class R, 1.02% for Class C and 0.05% for Class I. The gross expense ratio, which does not account for any voluntary or contractual waivers currently in effect, was 1.37% for Class K, 1.97% for Class R, 2.25% for Class C and 1.95% for Class I for the year ended October 31, 2010. |
| 3 | The Russell 3000® Index is an unmanaged index that consists of 3,000 of the largest U.S. companies based on total market capitalization. The Index returns are based on a market capitalization weighted average of relative price changes of the component stocks plus dividends whose reinvestments are compounded daily. The Index returns, unlike Series returns, do not reflect any fees or expenses. |
| 4 | The Target 2050 Blended Index is a 20%/65%/15% Blended Index which is made up of 20% Morgan Stanley Capital International (MSCI) All Country World Index ex U.S., 65% Russell 3000® Index, and 15% Barclays Capital U.S. Aggregate Bond Index. The MSCI All Country World Index ex U.S. is a free float-adjusted market capitalization weighted index that is designed to measure equity market performance in the global developed and emerging markets and consists of 47 developed and emerging market county indices outside the United States. The Index is denominated in U.S. Dollars. The Index returns assume daily reinvestment of net dividends (which do account for foreign dividend taxation). The Barclays Capital U.S. Aggregate Bond Index is an unmanaged index that represents the U.S. domestic investment-grade bond market. It is a market value weighted index of investment-grade debt issues, including government, corporate, asset-backed and mortgage-backed securities, with maturities of one year or more. The Index returns assume reinvestment of income. Both Indices’ returns, unlike Series returns, do not reflect any fees or expenses. |
| 5 | Because the Series’ asset allocation will vary over time, the composition of the Series’ portfolio may not match the composition of the comparative Index portfolios. |
8
Shareholder Expense Example (unaudited)
As a shareholder of the Series, you may incur two types of costs: (1) transaction costs, including potential wire charges on redemptions and (2) ongoing costs, including management fees and other Series expenses. This example is intended to help you understand your ongoing costs (in dollars) of investing in the Series and to compare these costs with the ongoing costs of investing in other mutual funds.
The example is based on an investment of $1,000 invested at the beginning of the period and held for the six month period (May 1, 2010 to October 31, 2010).
Actual Expenses
The Actual lines of the following tables provide information about actual account values and actual expenses. You may use the information in these lines, together with the amount you invested, to estimate the expenses that you paid over the period. Simply divide your account value by $1,000 (for example, an $8,600 account value divided by $1,000 = 8.6), then multiply the result by the number in the Actual line for the Series and Class in which you have invested under the heading entitled “Expenses Paid During Period” to estimate the expenses you paid on your account during this period.
Hypothetical Example for Comparison Purposes
The Hypothetical lines of the following tables provide information about hypothetical account values and hypothetical expenses based on the Class’ actual expense ratio and an assumed rate of return of 5% per year before expenses, which is not the Class’ actual return. The hypothetical account values and expenses may not be used to estimate the actual ending account balance or expenses you paid during the period. You may use this information to compare the ongoing costs of investing in the Series and other funds. To do so, compare this 5% hypothetical example for the Series and Class in which you have invested with the 5% hypothetical examples that appear in the shareholder reports of the other funds.
Please note that the expenses shown in the tables are meant to highlight your ongoing costs only and do not reflect any transaction costs. Therefore, the Hypothetical lines of the tables are useful in comparing ongoing costs only, and will not help you determine the relative total costs of owning different funds. In addition, if these transaction costs were included, your costs would have been higher.
| | | | | | | | | | | | | | | | |
| | | Beginning
Account Value
5/1/10 | | | Ending
Account Value
10/31/10 | | | Expenses Paid
During Period
5/1/10-10/31/101 | | | Annualized
Expense
Ratio2 | |
Target Income | | | | | | | | | | | | | | | | |
Actual (Class K) | | $ | 1,000.00 | | | $ | 1,053.40 | | | $ | 1.35 | | | | 0.26 | % |
Hypothetical3 | | $ | 1,000.00 | | | $ | 1,023.89 | | | $ | 1.33 | | | | 0.26 | % |
| | | | |
Actual (Class R) | | $ | 1,000.00 | | | $ | 1,052.00 | | | $ | 2.79 | | | | 0.54 | % |
Hypothetical3 | | $ | 1,000.00 | | | $ | 1,022.48 | | | $ | 2.75 | | | | 0.54 | % |
| | | | |
Actual (Class C) | | $ | 1,000.00 | | | $ | 1,049.30 | | | $ | 4.96 | | | | 0.96 | % |
Hypothetical3 | | $ | 1,000.00 | | | $ | 1,020.37 | | | $ | 4.89 | | | | 0.96 | % |
| | | | |
Actual (Class I) | | $ | 1,000.00 | | | $ | 1,054.40 | | | $ | 0.26 | | | | 0.05 | % |
Hypothetical3 | | $ | 1,000.00 | | | $ | 1,024.95 | | | $ | 0.26 | | | | 0.05 | % |
9
Shareholder Expense Example (unaudited)
| | | | | | | | | | | | | | | | |
| | | Beginning
Account Value
5/1/10 | | | Ending
Account Value
10/31/10 | | | Expenses Paid
During Period
5/1/10-10/31/101 | | | Annualized
Expense
Ratio2 | |
Target 2010 | | | | | | | | | | | | | | | | |
Actual (Class K) | | $ | 1,000.00 | | | $ | 1,042.70 | | | $ | 1.39 | | | | 0.27 | % |
Hypothetical3 | | $ | 1,000.00 | | | $ | 1,023.84 | | | $ | 1.38 | | | | 0.27 | % |
| | | | |
Actual (Class R) | | $ | 1,000.00 | | | $ | 1,041.30 | | | $ | 2.57 | | | | 0.50 | % |
Hypothetical3 | | $ | 1,000.00 | | | $ | 1,022.68 | | | $ | 2.55 | | | | 0.50 | % |
| | | | |
Actual (Class C) | | $ | 1,000.00 | | | $ | 1,039.50 | | | $ | 4.78 | | | | 0.93 | % |
Hypothetical3 | | $ | 1,000.00 | | | $ | 1,020.52 | | | $ | 4.74 | | | | 0.93 | % |
| | | | |
Actual (Class I) | | $ | 1,000.00 | | | $ | 1,043.60 | | | $ | 0.26 | | | | 0.05 | % |
Hypothetical3 | | $ | 1,000.00 | | | $ | 1,024.95 | | | $ | 0.26 | | | | 0.05 | % |
| | | | |
| | | Beginning
Account Value
5/1/10 | | | Ending
Account Value
10/31/10 | | | Expenses Paid
During Period
5/1/10-10/31/101 | | | Annualized
Expense
Ratio2 | |
Target 2020 | | | | | | | | | | | | | | | | |
Actual (Class K) | | $ | 1,000.00 | | | $ | 1,038.20 | | | $ | 1.44 | | | | 0.28 | % |
Hypothetical3 | | $ | 1,000.00 | | | $ | 1,023.79 | | | $ | 1.43 | | | | 0.28 | % |
| | | | |
Actual (Class R) | | $ | 1,000.00 | | | $ | 1,038.20 | | | $ | 2.62 | | | | 0.51 | % |
Hypothetical3 | | $ | 1,000.00 | | | $ | 1,022.63 | | | $ | 2.60 | | | | 0.51 | % |
| | | | |
Actual (Class C) | | $ | 1,000.00 | | | $ | 1,036.60 | | | $ | 4.72 | | | | 0.92 | % |
Hypothetical3 | | $ | 1,000.00 | | | $ | 1,020.57 | | | $ | 4.69 | | | | 0.92 | % |
| | | | |
Actual (Class I) | | $ | 1,000.00 | | | $ | 1,040.20 | | | $ | 0.26 | | | | 0.05 | % |
Hypothetical3 | | $ | 1,000.00 | | | $ | 1,024.95 | | | $ | 0.26 | | | | 0.05 | % |
| | | | |
| | | Beginning
Account Value
5/1/10 | | | Ending
Account Value
10/31/10 | | | Expenses Paid
During Period
5/1/10-10/31/101 | | | Annualized
Expense
Ratio2 | |
Target 2030 | | | | | | | | | | | | | | | | |
Actual (Class K) | | $ | 1,000.00 | | | $ | 1,029.80 | | | $ | 1.43 | | | | 0.28 | % |
Hypothetical3 | | $ | 1,000.00 | | | $ | 1,023.79 | | | $ | 1.43 | | | | 0.28 | % |
| | | | |
Actual (Class R) | | $ | 1,000.00 | | | $ | 1,028.10 | | | $ | 2.71 | | | | 0.53 | % |
Hypothetical3 | | $ | 1,000.00 | | | $ | 1,022.53 | | | $ | 2.70 | | | | 0.53 | % |
| | | | |
Actual (Class C) | | $ | 1,000.00 | | | $ | 1,026.60 | | | $ | 4.90 | | | | 0.96 | % |
Hypothetical3 | | $ | 1,000.00 | | | $ | 1,020.37 | | | $ | 4.89 | | | | 0.96 | % |
| | | | |
Actual (Class I) | | $ | 1,000.00 | | | $ | 1,031.70 | | | $ | 0.26 | | | | 0.05 | % |
Hypothetical3 | | $ | 1,000.00 | | | $ | 1,024.95 | | | $ | 0.26 | | | | 0.05 | % |
10
Shareholder Expense Example (unaudited)
| | | | | | | | | | | | | | | | |
| | | Beginning
Account Value
5/1/10 | | | Ending
Account Value
10/31/10 | | | Expenses Paid
During Period
5/1/10-10/31/101 | | | Annualized
Expense
Ratio2 | |
Target 2040 | | | | | | | | | | | | | | | | |
Actual (Class K) | | $ | 1,000.00 | | | $ | 1,018.20 | | | $ | 1.42 | | | | 0.28 | % |
Hypothetical3 | | $ | 1,000.00 | | | $ | 1,023.79 | | | $ | 1.43 | | | | 0.28 | % |
| | | | |
Actual (Class R) | | $ | 1,000.00 | | | $ | 1,016.90 | | | $ | 2.59 | | | | 0.51 | % |
Hypothetical3 | | $ | 1,000.00 | | | $ | 1,022.63 | | | $ | 2.60 | | | | 0.51 | % |
| | | | |
Actual (Class C) | | $ | 1,000.00 | | | $ | 1,014.10 | | | $ | 4.82 | | | | 0.95 | % |
Hypothetical3 | | $ | 1,000.00 | | | $ | 1,020.42 | | | $ | 4.84 | | | | 0.95 | % |
| | | | |
Actual (Class I) | | $ | 1,000.00 | | | $ | 1,020.10 | | | $ | 0.25 | | | | 0.05 | % |
Hypothetical3 | | $ | 1,000.00 | | | $ | 1,024.95 | | | $ | 0.26 | | | | 0.05 | % |
| | | | |
| | | Beginning
Account Value
5/1/10 | | | Ending
Account Value
10/31/10 | | | Expenses Paid
During Period
5/1/10-10/31/101 | | | Annualized
Expense
Ratio2 | |
Target 2050 | | | | | | | | | | | | | | | | |
Actual (Class K) | | $ | 1,000.00 | | | $ | 1,018.20 | | | $ | 1.53 | | | | 0.30 | % |
Hypothetical3 | | $ | 1,000.00 | | | $ | 1,023.69 | | | $ | 1.53 | | | | 0.30 | % |
| | | | |
Actual (Class R) | | $ | 1,000.00 | | | $ | 1,015.90 | | | $ | 2.64 | | | | 0.52 | % |
Hypothetical3 | | $ | 1,000.00 | | | $ | 1,022.58 | | | $ | 2.65 | | | | 0.52 | % |
| | | | |
Actual (Class C) | | $ | 1,000.00 | | | $ | 1,015.10 | | | $ | 5.13 | | | | 1.01 | % |
Hypothetical3 | | $ | 1,000.00 | | | $ | 1,020.11 | | | $ | 5.14 | | | | 1.01 | % |
| | | | |
Actual (Class I) | | $ | 1,000.00 | | | $ | 1,019.10 | | | $ | 0.25 | | | | 0.05 | % |
Hypothetical3 | | $ | 1,000.00 | | | $ | 1,024.95 | | | $ | 0.26 | | | | 0.05 | % |
| 1 | Expenses are equal to the Class’ annualized expense ratio (for the six-month period), multiplied by the average account value over the period, multiplied by 184/365 (to reflect the one-half year period). Expenses are based on the most recent fiscal half year; therefore, the expense ratios stated above may differ from the expense ratios stated in the financial highlights, which is based on one-year data. The Class’ total returns would have been lower had certain expenses not been reimbursed during the period. |
| 2 | Expense ratios of the Class do not include fees and expenses indirectly incurred by the underlying funds. If these expenses were included, the expense ratios would have been higher. |
| 3 | Assumes 5% annual return before expenses. |
11
Portfolio Composition as of October 31, 2010 - Asset Allocation1 (unaudited)
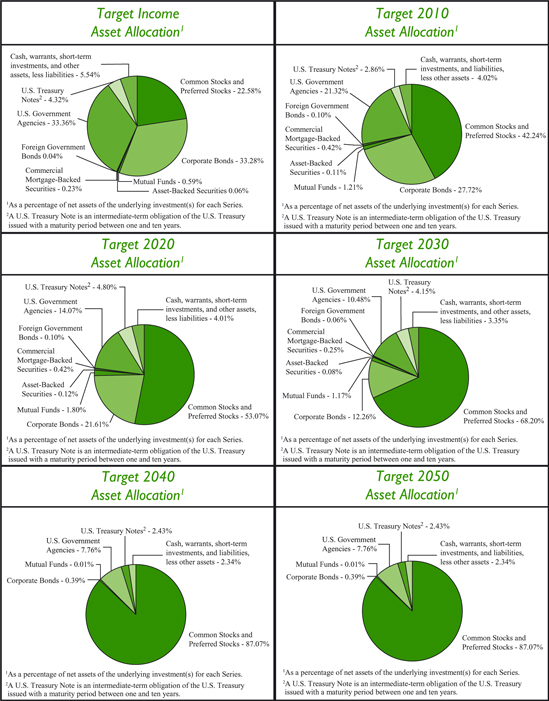
| 1 | As a percentage of net assets of the underlying investment(s) for each Series. |
| 2 | A U.S. Treasury Note is an intermediate-term obligation of the U.S. Treasury issued with a maturity period between one and ten years. |
12
Statements of Assets and Liabilities October 31, 2010
| | | | | | | | | | | | | | | | | | | | | | | | |
| | | Target
Income | | | Target
2010 | | | Target
2020 | | | Target
2030 | | | Target
2040 | | | Target
2050 | |
ASSETS: | | | | | | | | | | | | | | | | | | | | | | | | |
Manning & Napier Pro-Blend® Maximum Term Series - Class I (3,088,947 shares, 5,192,489 shares, and 1,814,913 shares, respectively) | | $ | — | | | $ | — | | | $ | — | | | $ | 31,260,145 | | | $ | 52,547,985 | | | $ | 18,366,922 | |
Manning & Napier Pro-Blend® Extended Term Series - Class I (6,578,008 shares and 4,613,410 shares, respectively) | | | — | | | | — | | | | 67,490,359 | | | | 47,333,581 | | | | — | | | | — | |
Manning & Napier Pro-Blend® Moderate Term Series - Class I (3,328,708 shares and 1,572,709 shares, respectively) | | | — | | | | 35,284,308 | | | | 16,670,719 | | | | — | | | | — | | | | — | |
Manning & Napier Pro-Blend® Conservative Term Series - Class I (4,419,580 shares) | | | 48,747,964 | | | | — | | | | — | | | | — | | | | — | | | | — | |
| | | | | | | | | | | | | | | | | | | | | | | | |
Total investments in securities: | | | | | | | | | | | | | | | | | | | | | | | | |
At value* | | | 48,747,964 | | | | 35,284,308 | | | | 84,161,078 | | | | 78,593,726 | | | | 52,547,985 | | | | 18,366,922 | |
Receivable for fund shares sold | | | 3,254 | | | | 9,858 | | | | 34,530 | | | | 48,575 | | | | 41,645 | | | | 49,650 | |
Receivable for securities sold | | | 127,126 | | | | — | | | | — | | | | — | | | | — | | | | — | |
Receivable from investment Advisor (Note 3) | | | 18,185 | | | | 28,324 | | | | 16,378 | | | | 18,980 | | | | 26,132 | | | | 37,891 | |
| | | | | | | | | | | | | | | | | | | | | | | | |
TOTAL ASSETS | | | 48,896,529 | | | | 35,322,490 | | | | 84,211,986 | | | | 78,661,281 | | | | 52,615,762 | | | | 18,454,463 | |
| | | | | | | | | | | | | | | | | | | | | | | | |
LIABILITIES: | | | | | | | | | | | | | | | | | | | | | | | | |
Accrued distribution and service (Rule 12b-1) fees (Note 3) | | | 11,102 | | | | 9,339 | | | | 21,856 | | | | 18,497 | | | | 12,996 | | | | 4,694 | |
Accrued fund accounting and administration fees (Note 3) | | | 8,977 | | | | 8,936 | | | | 9,155 | | | | 9,106 | | | | 9,001 | | | | 8,873 | |
Accrued transfer agent fees (Note 3) | | | 520 | | | | 1,464 | | | | 1,599 | | | | 1,467 | | | | 1,432 | | | | 1,388 | |
Directors’ fees (Note 3) | | | 331 | | | | 321 | | | | 509 | | | | 622 | | | | 335 | | | | 336 | |
Accrued Chief Compliance Officer service fees (Note 3) | | | 277 | | | | 252 | | | | 252 | | | | 252 | | | | 252 | | | | 252 | |
Payable for fund shares repurchased | | | 130,352 | | | | 1,030 | | | | 32,489 | | | | 1,977 | | | | 2,791 | | | | 64 | |
Audit fees payable | | | 18,303 | | | | 18,192 | | | | 18,230 | | | | 18,262 | | | | 18,256 | | | | 18,201 | |
Payable for securities purchased | | | — | | | | 8,829 | | | | 1,676 | | | | 45,162 | | | | 38,653 | | | | 49,458 | |
Accrued Registration and filing fees | | | 538 | | | | 1,906 | | | | 4,731 | | | | 5,035 | | | | 3,821 | | | | 1,812 | |
Other payables and accrued expenses | | | 999 | | | | 1,112 | | | | 1,959 | | | | 1,526 | | | | 1,180 | | | | 1,378 | |
| | | | | | | | | | | | | | | | | | | | | | | | |
TOTAL LIABILITIES | | | 171,399 | | | | 51,381 | | | | 92,456 | | | | 101,906 | | | | 88,717 | | | | 86,456 | |
| | | | | | | | | | | | | | | | | | | | | | | | |
TOTAL NET ASSETS | | $ | 48,725,130 | | | $ | 35,271,109 | | | $ | 84,119,530 | | | $ | 78,559,375 | | | $ | 52,527,045 | | | $ | 18,368,007 | |
| | | | | | | | | | | | | | | | | | | | | | | | |
NET ASSETS CONSIST OF: | | | | | | | | | | | | | | | | | | | | | | | | |
Capital stock | | | 44,230 | | | | 33,193 | | | | 81,555 | | | | 77,455 | | | | 51,535 | | | | 17,992 | |
Additional paid-in-capital | | | 40,439,294 | | | | 30,189,936 | | | | 72,316,961 | | | | 68,235,161 | | | | 46,197,601 | | | | 16,992,105 | |
Undistributed net investment income | | | 94,858 | | | | 42,735 | | | | 114,966 | | | | 83,935 | | | | 25,540 | | | | 5,372 | |
Accumulated net realized gain on underlying series | | | 509,413 | | | | 670,397 | | | | 2,829,490 | | | | 2,355,723 | | | | 499,242 | | | | 32,916 | |
Net unrealized appreciation on underlying series | | | 7,637,335 | | | | 4,334,848 | | | | 8,776,558 | | | | 7,807,101 | | | | 5,753,127 | | | | 1,319,622 | |
| | | | | | | | | | | | | | | | | | | | | | | | |
TOTAL NET ASSETS | | $ | 48,725,130 | | | $ | 35,271,109 | | | $ | 84,119,530 | | | $ | 78,559,375 | | | $ | 52,527,045 | | | $ | 18,368,007 | |
| | | | | | | | | | | | | | | | | | | | | | | | |
The accompanying notes are an integral part of the financial statements.
13
Statements of Assets and Liabilities October 31, 2010
| | | | | | | | | | | | | | | | | | | | | | | | |
| | | Target
Income | | | Target
2010 | | | Target
2020 | | | Target
2030 | | | Target
2040 | | | Target
2050 | |
Class K | | | | | | | | | | | | | | | | | | | | | | | | |
Net Assets | | $ | 46,885,644 | | | $ | 27,903,838 | | | $ | 64,612,995 | | | $ | 66,235,091 | | | $ | 42,417,105 | | | $ | 15,241,614 | |
Shares Outstanding | | | 4,254,056 | | | | 2,622,690 | | | | 6,253,470 | | | | 6,526,618 | | | | 4,157,252 | | | | 1,491,057 | |
Net Asset Value, Offering Price, and Redemption Price per share | | $ | 11.02 | | | $ | 10.64 | | | $ | 10.33 | | | $ | 10.15 | | | $ | 10.20 | | | $ | 10.22 | |
Class R | | | | | | | | | | | | | | | | | | | | | | | | |
Net Assets | | $ | 346,824 | | | $ | 3,655,323 | | | $ | 12,229,367 | | | $ | 7,161,734 | | | $ | 8,168,025 | | | $ | 2,154,406 | |
Shares Outstanding | | | 31,743 | | | | 345,928 | | | | 1,194,585 | | | | 709,729 | | | | 805,292 | | | | 211,950 | |
Net Asset Value, Offering Price, and Redemption Price per share | | $ | 10.93 | | | $ | 10.57 | | | $ | 10.24 | | | $ | 10.09 | | | $ | 10.14 | | | $ | 10.16 | |
Class C | | | | | | | | | | | | | | | | | | | | | | | | |
Net Assets | | $ | 1,195,153 | | | $ | 2,246,887 | | | $ | 3,803,455 | | | $ | 2,231,049 | | | $ | 875,452 | | | $ | 843,077 | |
Shares Outstanding | | | 110,251 | | | | 213,469 | | | | 372,359 | | | | 222,073 | | | | 87,015 | | | | 83,663 | |
Net Asset Value, Offering Price, and Redemption Price per share | | $ | 10.84 | | | $ | 10.53 | | | $ | 10.21 | | | $ | 10.05 | | | $ | 10.06 | | | $ | 10.08 | |
Class I | | | | | | | | | | | | | | | | | | | | | | | | |
Net Assets | | $ | 297,509 | | | $ | 1,465,061 | | | $ | 3,473,713 | | | $ | 2,931,501 | | | $ | 1,066,463 | | | $ | 128,910 | |
Shares Outstanding | | | 26,921 | | | | 137,192 | | | | 335,123 | | | | 287,075 | | | | 103,987 | | | | 12,540 | |
Net Asset Value, Offering Price, and Redemption Price per share | | $ | 11.05 | | | $ | 10.68 | | | $ | 10.37 | | | $ | 10.21 | | | $ | 10.26 | | | $ | 10.28 | |
| | | | | | |
* At identified cost | | $ | 41,110,629 | | | $ | 30,949,460 | | | $ | 75,384,520 | | | $ | 70,786,625 | | | $ | 46,794,858 | | | $ | 17,047,300 | |
| | | | | | | | | | | | | | | | | | | | | | | | |
The accompanying notes are an integral part of the financial statements.
14
Statements of Operations
For the Year Ended October 31, 2010
| | | | | | | | | | | | | | | | | | | | | | | | |
| | | Target
Income | | | Target
2010 | | | Target
2020 | | | Target
2030 | | | Target
2040 | | | Target
2050 | |
INVESTMENT INCOME: | | | | | | | | | | | | | | | | | | | | | | | | |
Income distributions from underlying series | | $ | 961,051 | | | $ | 453,756 | | | $ | 1,141,750 | | | $ | 701,662 | | | $ | 296,507 | | | $ | 72,891 | |
| | | | | | | | | | | | | | | | | | | | | | | | |
EXPENSES: | | | | | | | | | | | | | | | | | | | | | | | | |
Distribution and services (Rule 12b-1) fees (Class K) (Note 3) | | | 102,411 | | | | 57,401 | | | | 126,251 | | | | 125,539 | | | | 79,795 | | | | 26,098 | |
Distribution and services (Rule 12b-1) fees (Class C) (Note 3) | | | 7,308 | | | | 18,526 | | | | 29,712 | | | | 17,323 | | | | 6,512 | | | | 3,764 | |
Distribution and services (Rule 12b-1) fees (Class R) (Note 3) | | | 974 | | | | 11,707 | | | | 35,679 | | | | 15,338 | | | | 22,788 | | | | 5,376 | |
Fund accounting and administration fees (Note 3) | | | 42,346 | | | | 41,961 | | | | 42,927 | | | | 42,721 | | | | 42,200 | | | | 41,521 | |
Directors’ fees (Note 3) | | | 10,001 | | | | 10,001 | | | | 10,201 | | | | 10,300 | | | | 10,001 | | | | 10,001 | |
Transfer agent fees (Note 3) | | | 6,687 | | | | 8,244 | | | | 9,930 | | | | 8,853 | | | | 8,384 | | | | 7,907 | |
Chief Compliance Officer service fees (Note 3) | | | 2,749 | | | | 2,725 | | | | 2,724 | | | | 2,724 | | | | 2,724 | | | | 2,724 | |
Registration and filing fees | | | 46,635 | | | | 49,265 | | | | 52,050 | | | | 53,320 | | | | 51,625 | | | | 49,935 | |
Audit fees | | | 19,282 | | | | 19,082 | | | | 19,182 | | | | 19,182 | | | | 19,132 | | | | 19,032 | |
Legal fees | | | 4,828 | | | | 4,828 | | | | 4,828 | | | | 4,828 | | | | 4,828 | | | | 4,828 | |
Custodian fees | | | 1,441 | | | | 1,460 | | | | 2,660 | | | | 2,764 | | | | 1,449 | | | | 1,500 | |
Miscellaneous | | | 4,824 | | | | 4,987 | | | | 7,847 | | | | 6,491 | | | | 5,578 | | | | 4,572 | |
| | | | | | | | | | | | | | | | | | | | | | | | |
Total Expenses | | | 249,486 | | | | 230,187 | | | | 343,991 | | | | 309,383 | | | | 255,016 | | | | 177,258 | |
Less reduction of expenses (Note 3) | | | (115,861 | ) | | | (127,519 | ) | | | (118,861 | ) | | | (121,387 | ) | | | (126,153 | ) | | | (135,932 | ) |
| | | | | | | | | | | | | | | | | | | | | | | | |
Net Expenses | | | 133,625 | | | | 102,668 | | | | 225,130 | | | | 187,996 | | | | 128,863 | | | | 41,326 | |
| | | | | | | | | | | | | | | | | | | | | | | | |
NET INVESTMENT INCOME | | | 827,426 | | | | 351,088 | | | | 916,620 | | | | 513,666 | | | | 167,644 | | | | 31,565 | |
| | | | | | | | | | | | | | | | | | | | | | | | |
REALIZED AND UNREALIZED GAIN ON UNDERLYING SERIES: | | | | | | | | | | | | | | | | | | | | | | | | |
Net realized gain on underlying series | | | 511,837 | | | | 674,697 | | | | 2,862,910 | | | | 2,369,522 | | | | 513,686 | | | | 36,638 | |
Net change in unrealized appreciation on underlying series | | | 3,565,063 | | | | 2,454,350 | | | | 5,060,321 | | | | 4,842,147 | | | | 4,297,538 | | | | 1,289,112 | |
| | | | | | | | | | | | | | | | | | | | | | | | |
NET REALIZED AND UNREALIZED GAIN ON UNDERLYING SERIES | | | 4,076,900 | | | | 3,129,047 | | | | 7,923,231 | | | | 7,211,669 | | | | 4,811,224 | | | | 1,325,750 | |
| | | | | | | | | | | | | | | | | | | | | | | | |
NET INCREASE IN NET ASSETS RESULTING FROM OPERATIONS | | $ | 4,904,326 | | | $ | 3,480,135 | | | $ | 8,839,851 | | | $ | 7,725,335 | | | $ | 4,978,868 | | | $ | 1,357,315 | |
| | | | | | | | | | | | | | | | | | | | | | | | |
The accompanying notes are an integral part of the financial statements.
15
Statements of Changes in Net Assets
| | | | | | | | | | | | | | | | | | | | | | | | |
| | | Target Income | | | Target 2010 | | | Target 2020 | |
| | | For the
Year Ended
10/31/10 | | | For the
Year Ended
10/31/09 | | | For the
Year Ended
10/31/10 | | | For the
Year Ended
10/31/09 | | | For the
Year Ended
10/31/10 | | | For the
Year Ended
10/31/09 | |
INCREASE (DECREASE) IN NET ASSETS: | | | | | | | | | | | | | | | | | | | | | | | | |
OPERATIONS: | | | | | | | | | | | | | | | | | | | | | | | | |
Net investment income | | $ | 827,426 | | | $ | 90,626 | | | $ | 351,088 | | | $ | 17,147 | | | $ | 916,620 | | | $ | 52,778 | |
Net realized gain on underlying series | | | 511,837 | | | | 146,214 | | | | 674,697 | | | | 38,159 | | | | 2,862,910 | | | | 51,411 | |
Net change in unrealized appreciation on underlying series | | | 3,565,063 | | | | 4,071,769 | | | | 2,454,350 | | | | 1,880,027 | | | | 5,060,321 | | | | 3,752,187 | |
| | | | | | | | | | | | | | | | | | | | | | | | |
| | | | | | |
Net increase from operations | | | 4,904,326 | | | | 4,308,609 | | | | 3,480,135 | | | | 1,935,333 | | | | 8,839,851 | | | | 3,856,376 | |
| | | | | | | | | | | | | | | | | | | | | | | | |
| | | | | | |
DISTRIBUTIONS TO SHAREHOLDERS (Note 8): | | | | | | | | | | | | | | | | | | | | | | | | |
From net investment income (Class K) | | | (807,484 | ) | | | (1,841 | ) | | | (260,461 | ) | | | (3,846 | ) | | | (652,921 | ) | �� | | (9,533 | ) |
From net investment income (Class R) | | | (1,805 | ) | | | (2 | ) | | | (30,890 | ) | | | (2 | ) | | | (96,319 | ) | | | (2 | ) |
From net investment income (Class C) | | | (7,538 | ) | | | (3 | ) | | | (12,836 | ) | | | (2,116 | ) | | | (32,396 | ) | | | (5,417 | ) |
From net investment income (Class I) | | | (4,468 | ) | | | (53 | ) | | | (14,208 | ) | | | (1,141 | ) | | | (50,997 | ) | | | (6,847 | ) |
From net realized gain on investments (Class K) | | | (146,108 | ) | | | — | | | | (33,958 | ) | | | — | | | | (62,557 | ) | | | — | |
From net realized gain on investments (Class R) | | | (189 | ) | | | — | | | | (4,015 | ) | | | — | | | | (8,716 | ) | | | — | |
From net realized gain on investments (Class C) | | | (1,727 | ) | | | — | | | | (3,071 | ) | | | — | | | | (5,355 | ) | | | — | |
From net realized gain on investments (Class I) | | | (614 | ) | | | — | | | | (1,415 | ) | | | — | | | | (4,520 | ) | | | — | |
| | | | | | | | | | | | | | | | | | | | | | | | |
| | | | | | |
Total distributions to shareholders | | | (969,933 | ) | | | (1,899 | ) | | | (360,854 | ) | | | (7,105 | ) | | | (913,781 | ) | | | (21,799 | ) |
| | | | | | | | | | | | | | | | | | | | | | | | |
| | | | | | |
CAPITAL STOCK ISSUED AND REPURCHASED: | | | | | | | | | | | | | | | | | | | | | | | | |
| | | | | | |
Net increase from capital share transactions (Note 6) | | | 2,233,393 | | | | 38,179,735 | | | | 14,145,573 | | | | 15,878,343 | | | | 41,491,953 | | | | 30,587,054 | |
| | | | | | | | | | | | | | | | | | | | | | | | |
Net increase in net assets | | | 6,167,786 | | | | 42,486,445 | | | | 17,264,854 | | | | 17,806,571 | | | | 49,418,023 | | | | 34,421,631 | |
| | | | | | |
NET ASSETS: | | | | | | | | | | | | | | | | | | | | | | | | |
| | | | | | |
Beginning of year | | | 42,557,344 | | | | 70,899 | | | | 18,006,255 | | | | 199,684 | | | | 34,701,507 | | | | 279,876 | |
| | | | | | | | | | | | | | | | | | | | | | | | |
| | | | | | |
End of year1 | | $ | 48,725,130 | | | $ | 42,557,344 | | | $ | 35,271,109 | | | $ | 18,006,255 | | | $ | 84,119,530 | | | $ | 34,701,507 | |
| | | | | | | | | | | | | | | | | | | | | | | | |
1 Including undistributed net investment income (loss) of: | | | 94,858 | | | | 88,727 | | | | 42,735 | | | | 10,042 | | | | 114,966 | | | | 30,979 | |
The accompanying notes are an integral part of the financial statements.
16
Statements of Changes in Net Assets
| | | | | | | | | | | | | | | | | | | | | | | | |
| | | Target 2030 | | | Target 2040 | | | Target 2050 | |
| | | For the
Year Ended
10/31/10 | | | For the
Year Ended
10/31/09 | | | For the
Year Ended
10/31/10 | | | For the
Year Ended
10/31/09 | | | For the
Year Ended
10/31/10 | | | For the
Year Ended
10/31/09 | |
INCREASE (DECREASE) IN NET ASSETS: | | | | | | | | | | | | | | | | | | | | | | | | |
OPERATIONS: | | | | | | | | | | | | | | | | | | | | | | | | |
Net investment income | | $ | 513,666 | | | $ | 21,881 | | | $ | 167,644 | | | $ | 3,415 | | | $ | 31,565 | | | $ | 100 | |
Net realized gain on underlying series | | | 2,369,522 | | | | 76,189 | | | | 513,686 | | | | 41,791 | | | | 36,638 | | | | 14,093 | |
Net change in unrealized appreciation on underlying series | | | 4,842,147 | | | | 2,964,896 | | | | 4,297,538 | | | | 1,462,728 | | | | 1,289,112 | | | | 34,743 | |
| | | | | | | | | | | | | | | | | | | | | | | | |
| | | | | | |
Net increase from operations | | | 7,725,335 | | | | 3,062,966 | | | | 4,978,868 | | | | 1,507,934 | | | | 1,357,315 | | | | 48,936 | |
| | | | | | | | | | | | | | | | | | | | | | | | |
| | | | | | |
DISTRIBUTIONS TO SHAREHOLDERS (Note 8): | | | | | | | | | | | | | | | | | | | | | | | | |
From net investment income (Class K) | | | (387,868 | ) | | | (5 | ) | | | (112,496 | ) | | | (797 | ) | | | (21,109 | ) | | | (2 | ) |
From net investment income (Class R) | | | (22,289 | ) | | | (2 | ) | | | (23,144 | ) | | | (2 | ) | | | (4,197 | ) | | | (2 | ) |
From net investment income (Class C) | | | (7,995 | ) | | | (828 | ) | | | (1,401 | ) | | | (2 | ) | | | (169 | ) | | | (2 | ) |
From net investment income (Class I) | | | (26,729 | ) | | | (5,897 | ) | | | (6,411 | ) | | | (1,266 | ) | | | (718 | ) | | | (760 | ) |
From net realized gain on investments (Class K) | | | (78,169 | ) | | | — | | | | (42,807 | ) | | | — | | | | (10,313 | ) | | | — | |
From net realized gain on investments (Class R) | | | (3,056 | ) | | | — | | | | (9,808 | ) | | | — | | | | (5,129 | ) | | | — | |
From net realized gain on investments (Class C) | | | (3,577 | ) | | | — | | | | (1,490 | ) | | | — | | | | (1,001 | ) | | | — | |
From net realized gain on investments (Class I) | | | (5,186 | ) | | | — | | | | (2,126 | ) | | | — | | | | (703 | ) | | | — | |
| | | | | | | | | | | | | | | | | | | | | | | | |
| | | | | | |
Total distributions to shareholders | | | (534,869 | ) | | | (6,732 | ) | | | (199,683 | ) | | | (2,067 | ) | | | (43,339 | ) | | | (766 | ) |
| | | | | | | | | | | | | | | | | | | | | | | | |
| | | | | | |
CAPITAL STOCK ISSUED AND REPURCHASED: | | | | | | | | | | | | | | | | | | | | | | | | |
| | | | | | |
Net increase from capital share transactions (Note 6) | | | 45,093,229 | | | | 23,206,581 | | | | 33,495,044 | | | | 12,718,183 | | | �� | 15,228,648 | | | | 1,759,123 | |
| | | | | | | | | | | | | | | | | | | | | | | | |
Net increase in net assets | | | 52,283,695 | | | | 26,262,815 | | | | 38,274,229 | | | | 14,224,050 | | | | 16,542,624 | | | | 1,807,293 | |
| | | | | | |
NET ASSETS: | | | | | | | | | | | | | | | | | | | | | | | | |
Beginning of year | | | 26,275,680 | | | | 12,865 | | | | 14,252,816 | | | | 28,766 | | | | 1,825,383 | | | | 18,090 | |
| | | | | | | | | | | | | | | | | | | | | | | | |
| | | | | | |
End of year1 | | $ | 78,559,375 | | | $ | 26,275,680 | | | $ | 52,527,045 | | | $ | 14,252,816 | | | $ | 18,368,007 | | | $ | 1,825,383 | |
| | | | | | | | | | | | | | | | | | | | | | | | |
1 Including undistributed net investment income (loss) of: | | | 83,935 | | | | 15,150 | | | | 25,540 | | | | 1,348 | | | | 5,372 | | | | — | |
The accompanying notes are an integral part of the financial statements.
17
Financial Highlights
Target Income Series Class K
| | | | | | | | | | | | |
| | | For the Year
Ended
10/31/10 | | | For the Year
Ended
10/31/09 | | | For the Period
3/28/081 to
10/31/08 | |
Per share data (for a share outstanding throughout each period): | | | | | | | | | | | | |
Net asset value - Beginning of period | | $ | 10.13 | | | $ | 9.30 | | | $ | 10.00 | |
| | | | | | | | | | | | |
Income (loss) from investment operations: | | | | | | | | | | | | |
Net investment income (loss)2 | | | 0.19 | | | | 0.03 | | | | (0.01 | ) |
Net realized and unrealized gain (loss) on underlying series | | | 0.92 | | | | 1.04 | | | | (0.69 | ) |
| | | | | | | | | | | | |
Total from investment operations | | | 1.11 | | | | 1.07 | | | | (0.70 | ) |
| | | | | | | | | | | | |
Less distributions to shareholders: | | | | | | | | | | | | |
From net investment income | | | (0.19 | ) | | | (0.24 | ) | | | — | |
From net realized gain on investments | | | (0.03 | ) | | | — | | | | — | |
| | | | | | | | | | | | |
Total distributions to shareholders | | | (0.22 | ) | | | (0.24 | ) | | | — | |
| | | | | | | | | | | | |
Net asset value - End of period | | $ | 11.02 | | | $ | 10.13 | | | $ | 9.30 | |
| | | | | | | | | | | | |
Net assets - End of period (000’s omitted) | | $ | 46,886 | | | $ | 42,116 | | | $ | 70,620 | 3 |
| | | | | | | | | | | | |
Total return4 | | | 11.22 | % | | | 11.80 | % | | | (7.00 | %) |
Ratios (to average net assets)/Supplemental Data: | | | | | | | | | | | | |
Expenses*5 | | | 0.28 | %6 | | | 0.30 | % | | | 0.30 | %7 |
Net investment income (loss) | | | 1.83 | % | | | 0.31 | % | | | (0.27 | %)7 |
Series portfolio turnover8 | | | 9 | % | | | 13 | % | | | 0 | % |
|
* The investment advisor paid a portion of the Series’ expenses. If these expenses had been incurred by the Series, the expense ratios (to average net assets) would have been increased by the following amounts5: | |
| | | |
| | | 0.25 | % | | | 0.41 | % | | | 1,571 | %7,9 |
Target Income Series Class R
| | | | | | | | | | | | |
| | | For the Year
Ended
10/31/10 | | | For the Year
Ended
10/31/09 | | | For the Period
3/28/081 to
10/31/08 | |
Per share data (for a share outstanding throughout each period): | | | | | | | | | | | | |
Net asset value - Beginning of period | | $ | 10.08 | | | $ | 9.29 | | | $ | 10.00 | |
| | | | | | | | | | | | |
Income (loss) from investment operations: | | | | | | | | | | | | |
Net investment income (loss)2 | | | 0.09 | | | | (0.05 | ) | | | 0.02 | |
Net realized and unrealized gain (loss) on underlying series | | | 0.99 | | | | 1.09 | | | | (0.73 | ) |
| | | | | | | | | | | | |
Total from investment operations | | | 1.08 | | | | 1.04 | | | | (0.71 | ) |
| | | | | | | | | | | | |
Less distributions to shareholders: | | | | | | | | | | | | |
From net investment income | | | (0.20 | ) | | | (0.25 | ) | | | — | |
From net realized gain on investments | | | (0.03 | ) | | | — | | | | — | |
| | | | | | | | | | | | |
Total distributions to shareholders | | | (0.23 | ) | | | (0.25 | ) | | | — | |
| | | | | | | | | | | | |
Net asset value - End of period | | $ | 10.93 | | | $ | 10.08 | | | $ | 9.29 | |
| | | | | | | | | | | | |
Net assets - End of period (000’s omitted) | | $ | 347 | | | $ | 54 | | | $ | 93 | 3 |
| | | | | | | | | | | | |
Total return4 | | | 10.97 | % | | | 11.44 | % | | | (7.10 | %) |
Ratios (to average net assets)/Supplemental Data: | | | | | | | | | | | | |
Expenses*5 | | | 0.54 | %6 | | | 0.55 | % | | | 0.55 | %7 |
Net investment income (loss) | | | 0.81 | % | | | (0.51 | %) | | | 0.34 | %7 |
Series portfolio turnover8 | | | 9 | % | | | 13 | % | | | 0 | % |
|
* The investment advisor paid a portion of the Series’ expenses. If these expenses had been incurred by the Series, the expense ratios (to average net assets) would have been increased by the following amounts5: | |
| | | |
| | | 0.37 | % | | | 169.34 | % | | | 43,127 | %7,9 |
| 1 | Commencement of operations. |
| 2 | Calculated based on average shares outstanding during the period. |
| 3 | Represents the whole number without rounding to the 000’s. |
| 4 | Represents aggregate total return for the period indicated, and assumes reinvestment of all distributions. Total return would have been lower had certain expenses not been reimbursed during the period. Periods less than one year are not annualized. |
| 5 | Expense ratios do not include expenses of the underlying series in which the Series invests. The expense ratio of the underlying series was 0.70%. |
| 6 | During the year ended October 31, 2010, due to the timing of the renewal of the Series’ distribution plan under Rule 12b-1, the Series incurred approximately 11 months of distribution expense. The expense ratio would have been higher and the net investment income ratio and total return would have been lower had the Series incurred a full year of distribution expense. |
| 8 | Reflects activity of the Series and does not include the activity of the underlying series. |
| 9 | The increase to the expense ratios (to average net assets) is largely due to the small net assets in each class. |
The accompanying notes are an integral part of the financial statements.
18
Financial Highlights
Target Income Series Class C
| | | | | | | | | | | | |
| | | For the Year
Ended
10/31/10 | | | For the Year
Ended
10/31/09 | | | For the Period
3/28/081 to
10/31/08 | |
Per share data (for a share outstanding throughout each period): | | | | | | | | | | | | |
Net asset value - Beginning of period | | $ | 10.00 | | | $ | 9.26 | | | $ | 10.00 | |
| | | | | | | | | | | | |
Income (loss) from investment operations: | | | | | | | | | | | | |
Net investment income (loss)2 | | | 0.07 | | | | (0.03 | ) | | | (0.01 | ) |
Net realized and unrealized gain (loss) on underlying series | | | 0.95 | | | | 1.02 | | | | (0.73 | ) |
| | | | | | | | | | | | |
Total from investment operations | | | 1.02 | | | | 0.99 | | | | (0.74 | ) |
| | | | | | | | | | | | |
Less distributions to shareholders: | | | | | | | | | | | | |
From net investment income | | | (0.15 | ) | | | (0.25 | ) | | | — | |
From net realized gain on investments | | | (0.03 | ) | | | — | | | | — | |
| | | | | | | | | | | | |
Total distributions to shareholders | | | (0.18 | ) | | | (0.25 | ) | | | — | |
| | | | | | | | | | | | |
Net asset value - End of period | | $ | 10.84 | | | $ | 10.00 | | | $ | 9.26 | |
| | | | | | | | | | | | |
Net assets - End of period (000’s omitted) | | $ | 1,195 | | | $ | 330 | | | $ | 93 | 3 |
| | | | | | | | | | | | |
Total return4 | | | 10.38 | % | | | 10.91 | % | | | (7.40 | %) |
Ratios (to average net assets)/Supplemental Data: | | | | | | | | | | | | |
Expenses*5 | | | 0.99 | %6 | | | 1.05 | % | | | 1.05 | %7 |
Net investment income (loss) | | | 0.66 | % | | | (0.30 | %) | | | (0.15 | %)7 |
Series portfolio turnover8 | | | 9 | % | | | 13 | % | | | 0 | % |
|
* The investment advisor paid a portion of the Series’ expenses. If these expenses had been incurred by the Series, the expense ratios (to average net assets) would have been increased by the following amounts5: | |
| | | |
| | | 0.29 | % | | | 10.70 | % | | | 43,147 | %7,9 |
Target Income Series Class I
| | | | | | | | | | | | |
| | | For the Year
Ended
10/31/10 | | | For the Year
Ended
10/31/09 | | | For the Period
3/28/081 to
10/31/08 | |
Per share data (for a share outstanding throughout each period): | | | | | | | | | | | | |
Net asset value - Beginning of period | | $ | 10.17 | | | $ | 9.32 | | | $ | 10.00 | |
| | | | | | | | | | | | |
Income (loss) from investment operations: | | | | | | | | | | | | |
Net investment income2 | | | 0.19 | | | | 0.06 | | | | 0.05 | |
Net realized and unrealized gain (loss) on underlying series | | | 0.94 | | | | 1.04 | | | | (0.73 | ) |
| | | | | | | | | | | | |
Total from investment operations | | | 1.13 | | | | 1.10 | | | | (0.68 | ) |
| | | | | | | | | | | | |
Less distributions to shareholders: | | | | | | | | | | | | |
From net investment income | | | (0.22 | ) | | | (0.25 | ) | | | — | |
From net realized gain on investments | | | (0.03 | ) | | | — | | | | — | |
| | | | | | | | | | | | |
Total distributions to shareholders | | | (0.25 | ) | | | (0.25 | ) | | | — | |
| | | | | | | | | | | | |
Net asset value - End of period | | $ | 11.05 | | | $ | 10.17 | | | $ | 9.32 | |
| | | | | | | | | | | | |
Net assets - End of period (000’s omitted) | | $ | 298 | | | $ | 58 | | | $ | 93 | 3 |
| | | | | | | | | | | | |
Total return4 | | | 11.44 | % | | | 12.06 | % | | | (6.80 | %) |
Ratios (to average net assets)/Supplemental Data: | | | | | | | | | | | | |
Expenses*5 | | | 0.05 | % | | | 0.05 | % | | | 0.05 | %7 |
Net investment income | | | 1.85 | % | | | 0.66 | % | | | 0.85 | %7 |
Series portfolio turnover8 | | | 9 | % | | | 13 | % | | | 0 | % |
|
* The investment advisor paid a portion of the Series’ expenses. If these expenses had been incurred by the Series, the expense ratios (to average net assets) would have been increased by the following amounts5: | |
| | | |
| | | 0.33 | % | | | 54.69 | % | | | 43,107 | %7,9 |
| 1 | Commencement of operations. |
| 2 | Calculated based on average shares outstanding during the period. |
| 3 | Represents the whole number without rounding to the 000’s. |
| 4 | Represents aggregate total return for the period indicated, and assumes reinvestment of all distributions. Total return would have been lower had certain expenses not been reimbursed during the period. Periods less than one year are not annualized. |
| 5 | Expense ratios do not include expenses of the underlying series in which the Series invests. The expense ratio of the underlying series was 0.70%. |
| 6 | During the year ended October 31, 2010, due to the timing of the renewal of the Series’ distribution plan under Rule 12b-1, the Series incurred approximately 11 months of distribution expense. The expense ratio would have been higher and the net investment income ratio and total return would have been lower had the Series incurred a full year of distribution expense. |
| 8 | Reflects activity of the Series and does not include the activity of the underlying series. |
| 9 | The increase to the expense ratios (to average net assets) is largely due to the small net assets in each class. |
The accompanying notes are an integral part of the financial statements.
19
Financial Highlights
Target 2010 Series Class K
| | | | | | | | | | | | |
| | | For the Year
Ended
10/31/10 | | | For the Year
Ended
10/31/09 | | | For the Period
3/28/081 to
10/31/08 | |
Per share data (for a share outstanding throughout each period): | | | | | | | | | | | | |
Net asset value - Beginning of period | | $ | 9.58 | | | $ | 8.61 | | | $ | 10.00 | |
| | | | | | | | | | | | |
Income (loss) from investment operations: | | | | | | | | | | | | |
Net investment income (loss)2 | | | 0.12 | | | | 0.02 | | | | (0.01 | ) |
Net realized and unrealized gain (loss) on underlying series | | | 1.10 | | | | 1.15 | | | | (1.38 | ) |
| | | | | | | | | | | | |
Total from investment operations | | | 1.22 | | | | 1.17 | | | | (1.39 | ) |
| | | | | | | | | | | | |
Less distributions to shareholders: | | | | | | | | | | | | |
From net investment income | | | (0.14 | ) | | | (0.20 | ) | | | — | |
From net realized gain on investments | | | (0.02 | ) | | | — | | | | — | |
| | | | | | | | | | | | |
Total distributions to shareholders | | | (0.16 | ) | | | (0.20 | ) | | | — | |
| | | | | | | | | | | | |
Net asset value - End of period | | $ | 10.64 | | | $ | 9.58 | | | $ | 8.61 | |
| | | | | | | | | | | | |
Net assets - End of period (000’s omitted) | | $ | 27,904 | | | $ | 15,782 | | | $ | 101,213 | 3 |
| | | | | | | | | | | | |
Total return4 | | | 12.85 | % | | | 13.97 | % | | | (13.90 | %) |
Ratios (to average net assets)/Supplemental Data: | | | | | | | | | | | | |
Expenses* | | | 0.29 | %5,6 | | | 0.30 | %7 | | | 0.30 | %7,8 |
Net investment income (loss) | | | 1.20 | % | | | 0.19 | % | | | (0.28 | %)8 |
Series portfolio turnover9 | | | 11 | % | | | 9 | % | | | 0 | % |
|
* The investment advisor paid a portion of the Series’ expenses. If these expenses had been incurred by the Series, the expense ratios (to average net assets) would have been increased by the following amounts: | |
| | | |
| | | 0.42 | %6 | | | 1.31 | %7 | | | 1,071 | %7,8,10 |
Target 2010 Series Class R
| | | | | | | | | | | | |
| | | For the Year
Ended
10/31/10 | | | For the Year
Ended
10/31/09 | | | For the Period
3/28/081 to
10/31/08 | |
Per share data (for a share outstanding throughout each period): | | | | | | | | | | | | |
Net asset value - Beginning of period | | $ | 9.54 | | | $ | 8.61 | | | $ | 10.00 | |
| | | | | | | | | | | | |
Income (loss) from investment operations: | | | | | | | | | | | | |
Net investment income (loss)2 | | | 0.12 | | | | (0.05 | ) | | | 0.02 | |
Net realized and unrealized gain (loss) on underlying series | | | 1.07 | | | | 1.18 | | | | (1.41 | ) |
| | | | | | | | | | | | |
Total from investment operations | | | 1.19 | | | | 1.13 | | | | (1.39 | ) |
| | | | | | | | | | | | |
Less distributions to shareholders: | | | | | | | | | | | | |
From net investment income | | | (0.14 | ) | | | (0.20 | ) | | | — | |
From net realized gain on investments | | | (0.02 | ) | | | — | | | | — | |
| | | | | | | | | | | | |
Total distributions to shareholders | | | (0.16 | ) | | | (0.20 | ) | | | — | |
| | | | | | | | | | | | |
Net asset value - End of period | | $ | 10.57 | | | $ | 9.54 | | | $ | 8.61 | |
| | | | | | | | | | | | |
Net assets - End of period (000’s omitted) | | $ | 3,655 | | | $ | 284 | | | $ | 86 | 3 |
| | | | | | | | | | | | |
Total return4 | | | 12.64 | % | | | 13.54 | % | | | (13.90 | %) |
Ratios (to average net assets)/Supplemental Data: | | | | | | | | | | | | |
Expenses* | | | 0.52 | %5,6 | | | 0.55 | %7 | | | 0.55 | %7,8 |
Net investment income (loss) | | | 1.16 | % | | | (0.55 | %) | | | 0.36 | %8 |
Series portfolio turnover9 | | | 11 | % | | | 9 | % | | | 0 | % |
|
* The investment advisor paid a portion of the Series’ expenses. If these expenses had been incurred by the Series, the expense ratios (to average net assets) would have been increased by the following amounts: | |
| | | |
| | | 0.41 | %6 | | | 25.36 | %7 | | | 42,882 | %7,8,10 |
| 1 | Commencement of operations. |
| 2 | Calculated based on average shares outstanding during the period. |
| 3 | Represents the whole number without rounding to the 000’s. |
| 4 | Represents aggregate total return for the period indicated, and assumes reinvestment of all distributions. Total return would have been lower had certain expenses not been reimbursed during the period. Periods less than one year are not annualized. |
| 5 | During the year ended October 31, 2010, due to the timing of the renewal of the Series’ distribution plan under Rule 12b-1, the Series incurred approximately 11 months of distribution expense. The expense ratio would have been higher and the net investment income ratio and total return would have been lower had the Series incurred a full year of distribution expense. |
| 6 | Expense ratios do not include expenses of the underlying series in which the Series invests. The expense ratio of the underlying series was 0.84%. |
| 7 | Expense ratios do not include expenses of the underlying series in which the Series invests. The expense ratio of the underlying series was 0.85%. |
| 9 | Reflects activity of the Series and does not include the activity of the underlying series. |
| 10 | The increase to the expense ratios (to average net assets) is largely due to the small net assets in each class. |
The accompanying notes are an integral part of the financial statements.
20
Financial Highlights
Target 2010 Series Class C
| | | | | | | | | | | | |
| | | For the Year
Ended
10/31/10 | | | For the Year
Ended
10/31/09 | | | For the Period
3/28/081 to
10/31/08 | |
Per share data (for a share outstanding throughout each period): | | | | | | | | | | | | |
Net asset value - Beginning of period | | $ | 9.49 | | | $ | 8.58 | | | $ | 10.00 | |
| | | | | | | | | | | | |
Income (loss) from investment operations: | | | | | | | | | | | | |
Net investment income (loss)2 | | | 0.06 | | | | (0.01 | ) | | | (0.05 | ) |
Net realized and unrealized gain (loss) on underlying series | | | 1.08 | | | | 1.10 | | | | (1.37 | ) |
| | | | | | | | | | | | |
Total from investment operations | | | 1.14 | | | | 1.09 | | | | (1.42 | ) |
| | | | | | | | | | | | |
Less distributions to shareholders: | | | | | | | | | | | | |
From net investment income | | | (0.08 | ) | | | (0.18 | ) | | | — | |
From net realized gain on investments | | | (0.02 | ) | | | — | | | | — | |
| | | | | | | | | | | | |
Total distributions to shareholders | | | (0.10 | ) | | | (0.18 | ) | | | — | |
| | | | | | | | | | | | |
Net asset value - End of period | | $ | 10.53 | | | $ | 9.49 | | | $ | 8.58 | |
| | | | | | | | | | | | |
Net assets - End of period (000’s omitted) | | $ | 2,247 | | | $ | 1,471 | | | $ | 98,226 | 3 |
| | | | | | | | | | | | |
Total return4 | | | 12.12 | % | | | 13.13 | % | | | (14.20 | %) |
Ratios (to average net assets)/Supplemental Data: | | | | | | | | | | | | |
Expenses* | | | 0.98 | %5,6 | | | 1.05 | %7 | | | 1.05 | %7,8 |
Net investment income (loss) | | | 0.58 | % | | | (0.12 | %) | | | (1.03 | %)8 |
Series portfolio turnover9 | | | 11 | % | | | 9 | % | | | 0 | % |
|
* The investment advisor paid a portion of the Series’ expenses. If these expenses had been incurred by the Series, the expense ratios (to average net assets) would have been increased by the following amounts: | |
| | | |
| | | 0.44 | %6 | | | 5.01 | %7 | | | 919 | %7,8,10 |
Target 2010 Series Class I
| | | | | | | | | | | | |
| | | For the Year
Ended
10/31/10 | | | For the Year
Ended
10/31/09 | | | For the Period
3/28/081 to
10/31/08 | |
Per share data (for a share outstanding throughout each period): | | | | | | | | | | | | |
Net asset value - Beginning of period | | $ | 9.62 | | | $ | 8.63 | | | $ | 10.00 | |
| | | | | | | | | | | | |
Income (loss) from investment operations: | | | | | | | | | | | | |
Net investment income2 | | | 0.14 | | | | 0.07 | | | | 0.05 | |
Net realized and unrealized gain (loss) on underlying series | | | 1.10 | | | | 1.12 | | | | (1.42 | ) |
| | | | | | | | | | | | |
Total from investment operations | | | 1.24 | | | | 1.19 | | | | (1.37 | ) |
| | | | | | | | | | | | |
Less distributions to shareholders: | | | | | | | | | | | | |
From net investment income | | | (0.16 | ) | | | (0.20 | ) | | | — | |
From net realized gain on investments | | | (0.02 | ) | | | — | | | | — | |
| | | | | | | | | | | | |
Total distributions to shareholders | | | (0.18 | ) | | | (0.20 | ) | | | — | |
| | | | | | | | | | | | |
Net asset value - End of period | | $ | 10.68 | | | $ | 9.62 | | | $ | 8.63 | |
| | | | | | | | | | | | |
Net assets - End of period (000’s omitted) | | $ | 1,465 | | | $ | 469 | | | $ | 159 | 3 |
| | | | | | | | | | | | |
Total return4 | | | 13.10 | % | | | 14.23 | % | | | (13.70 | %) |
Ratios (to average net assets)/Supplemental Data: | | | | | | | | | | | | |
Expenses* | | | 0.05 | %6 | | | 0.05 | %7 | | | 0.05 | %7,8 |
Net investment income | | | 1.44 | % | | | 0.83 | % | | | 0.86 | %8 |
Series portfolio turnover9 | | | 11 | % | | | 9 | % | | | 0 | % |
|
* The investment advisor paid a portion of the Series’ expenses. If these expenses had been incurred by the Series, the expense ratios (to average net assets) would have been increased by the following amounts: | |
| | | |
| | | 0.43 | %6 | | | 8.26 | %7 | | | 42,439 | %7,8,10 |
| 1 | Commencement of operations. |
| 2 | Calculated based on average shares outstanding during the period. |
| 3 | Represents the whole number without rounding to the 000’s. |
| 4 | Represents aggregate total return for the period indicated, and assumes reinvestment of all distributions. Total return would have been lower had certain expenses not been reimbursed during the period. Periods less than one year are not annualized. |
| 5 | During the year ended October 31, 2010, due to the timing of the renewal of the Series’ distribution plan under Rule 12b-1, the Series incurred approximately 11 months of distribution expense. The expense ratio would have been higher and the net investment income ratio and total return would have been lower had the Series incurred a full year of distribution expense. |
| 6 | Expense ratios do not include expenses of the underlying series in which the Series invests. The expense ratio of the underlying series was 0.84%. |
| 7 | Expense ratios do not include expenses of the underlying series in which the Series invests. The expense ratio of the underlying series was 0.85%. |
| 9 | Reflects activity of the Series and does not include the activity of the underlying series. |
| 10 | The increase to the expense ratios (to average net assets) is largely due to the small net assets in each class. |
The accompanying notes are an integral part of the financial statements.
21
Financial Highlights
Target 2020 Series Class K
| | | | | | | | | | | | |
| | | For the Year
Ended
10/31/10 | | | For the Year
Ended
10/31/09 | | | For the Period
3/28/081 to
10/31/08 | |
Per share data (for a share outstanding throughout each period): | | | | | | | | | | | | |
Net asset value - Beginning of period | | $ | 9.16 | | | $ | 8.14 | | | $ | 10.00 | |
| | | | | | | | | | | | |
Income (loss) from investment operations: | | | | | | | | | | | | |
Net investment income2 | | | 0.13 | | | | 0.02 | | | | 0.04 | |
Net realized and unrealized gain (loss) on underlying series | | | 1.23 | | | | 1.21 | | | | (1.90 | ) |
| | | | | | | | | | | | |
Total from investment operations | | | 1.36 | | | | 1.23 | | | | (1.86 | ) |
| | | | | | | | | | | | |
Less distributions to shareholders: | | | | | | | | | | | | |
From net investment income | | | (0.17 | ) | | | (0.21 | ) | | | — | |
From net realized gain on investments | | | (0.02 | ) | | | — | | | | — | |
| | | | | | | | | | | | |
Total distributions to shareholders | | | (0.19 | ) | | | (0.21 | ) | | | — | |
| | | | | | | | | | | | |
Net asset value - End of period | | $ | 10.33 | | | $ | 9.16 | | | $ | 8.14 | |
| | | | | | | | | | | | |
Net assets - End of period (000’s omitted) | | $ | 64,613 | | | $ | 30,089 | | | $ | 157 | 3 |
| | | | | | | | | | | | |
Total return4 | | | 14.89 | % | | | 15.72 | % | | | (18.60 | %) |
Ratios (to average net assets)/Supplemental Data: | | | | | | | | | | | | |
Expenses* | | | 0.29 | %5,6 | | | 0.30 | %7 | | | 0.30 | %7,8 |
Net investment income | | | 1.38 | % | | | 0.28 | % | | | 0.74 | %8 |
Series portfolio turnover9 | | | 20 | % | | | 9 | % | | | 31 | % |
|
* The investment advisor paid a portion of the Series’ expenses. If these expenses had been incurred by the Series, the expense ratios (to average net assets) would have been increased by the following amounts: | |
| | | |
| | | 0.17 | %6 | | | 0.72 | %7 | | | 34,421 | %7,8,10 |
Target 2020 Series Class R
| | | | | | | | | | | | |
| | | For the Year
Ended
10/31/10 | | | For the Year
Ended
10/31/09 | | | For the Period
3/28/081 to
10/31/08 | |
Per share data (for a share outstanding throughout each period): | | | | | | | | | | | | |
Net asset value - Beginning of period | | $ | 9.10 | | | $ | 8.13 | | | $ | 10.00 | |
| | | | | | | | | | | | |
Income (loss) from investment operations: | | | | | | | | | | | | |
Net investment income (loss)2 | | | 0.12 | | | | (0.05 | ) | | | 0.04 | |
Net realized and unrealized gain (loss) on underlying series | | | 1.21 | | | | 1.23 | | | | (1.91 | ) |
| | | | | | | | | | | | |
Total from investment operations | | | 1.33 | | | | 1.18 | | | | (1.87 | ) |
| | | | | | | | | | | | |
Less distributions to shareholders: | | | | | | | | | | | | |
From net investment income | | | (0.17 | ) | | | (0.21 | ) | | | — | |
From net realized gain on investments | | | (0.02 | ) | | | — | | | | — | |
| | | | | | | | | | | | |
Total distributions to shareholders | | | (0.19 | ) | | | (0.21 | ) | | | — | |
| | | | | | | | | | | | |
Net asset value - End of period | | $ | 10.24 | | | $ | 9.10 | | | $ | 8.13 | |
| | | | | | | | | | | | |
Net assets - End of period (000’s omitted) | | $ | 12,229 | | | $ | 562 | | | $ | 81 | 3 |
| | | | | | | | | | | | |
Total return4 | | | 14.72 | % | | | 15.13 | % | | | (18.70 | %) |
Ratios (to average net assets)/Supplemental Data: | | | | | | | | | | | | |
Expenses* | | | 0.52 | %5,6 | | | 0.55 | %7 | | | 0.55 | %7,8 |
Net investment income (loss) | | | 1.25 | % | | | (0.54 | %) | | | 0.62 | %8 |
Series portfolio turnover9 | | | 20 | % | | | 9 | % | | | 31 | % |
|
* The investment advisor paid a portion of the Series’ expenses. If these expenses had been incurred by the Series, the expense ratios (to average net assets) would have been increased by the following amounts: | |
| | | |
| | | 0.18 | %6 | | | 14.54 | %7 | | | 38,136 | %7,8,10 |
| 1 | Commencement of operations. |
| 2 | Calculated based on average shares outstanding during the period. |
| 3 | Represents the whole number without rounding to the 000’s. |
| 4 | Represents aggregate total return for the period indicated, and assumes reinvestment of all distributions. Total return would have been lower had certain expenses not been reimbursed during the period. Periods less than one year are not annualized. |
| 5 | During the year ended October 31, 2010, due to the timing of the renewal of the Series’ distribution plan under Rule 12b-1, the Series incurred approximately 11 months of distribution expense. The expense ratio would have been higher and the net investment income ratio and total return would have been lower had the Series incurred a full year of distribution expense. |
| 6 | Expense ratios do not include expenses of the underlying series in which the Series invests. The expense ratios of the underlying series were 0.84% for Manning & Napier Pro-Blend® Moderate Term Series - Class I and 0.83% for Manning & Napier Pro-Blend® Extended Term Series - Class I. |
| 7 | Expense ratios do not include expenses of the underlying series in which the Series invests. The expense ratio of the underlying series was 0.85%. |
| 9 | Reflects activity of the Series and does not include the activity of the underlying series. |
| 10 | The increase to the expense ratios (to average net assets) is largely due to the small net assets in each class. |
The accompanying notes are an integral part of the financial statements.
22
Financial Highlights
Target 2020 Series Class C
| | | | | | | | | | | | |
| | | For the Year
Ended
10/31/10 | | | For the Year
Ended
10/31/09 | | | For the Period
3/28/081 to
10/31/08 | |
Per share data (for a share outstanding throughout each period): | | | | | | | | | | | | |
Net asset value - Beginning of period | | $ | 9.06 | | | $ | 8.10 | | | $ | 10.00 | |
| | | | | | | | | | | | |
Income (loss) from investment operations: | | | | | | | | | | | | |
Net investment income (loss)2 | | | 0.10 | | | | 0.02 | | | | (0.05 | ) |
Net realized and unrealized gain (loss) on underlying series | | | 1.18 | | | | 1.13 | | | | (1.85 | ) |
| | | | | | | | | | | | |
Total from investment operations | | | 1.28 | | | | 1.15 | | | | (1.90 | ) |
| | | | | | | | | | | | |
Less distributions to shareholders: | | | | | | | | | | | | |
From net investment income | | | (0.11 | ) | | | (0.19 | ) | | | — | |
From net realized gain on investments | | | (0.02 | ) | | | — | | | | — | |
| | | | | | | | | | | | |
Total distributions to shareholders | | | (0.13 | ) | | | (0.19 | ) | | | — | |
| | | | | | | | | | | | |
Net asset value - End of period | | $ | 10.21 | | | $ | 9.06 | | | $ | 8.10 | |
| | | | | | | | | | | | |
Net assets - End of period (000’s omitted) | | $ | 3,803 | | | $ | 2,123 | | | $ | 228,171 | 3 |
| | | | | | | | | | | | |
Total return4 | | | 14.24 | % | | | 14.74 | % | | | (19.00 | %) |
Ratios (to average net assets)/Supplemental Data: | | | | | | | | | | | | |
Expenses* | | | 0.98 | %5,6 | | | 1.05 | %7 | | | 1.05 | %7,8 |
Net investment income (loss) | | | 1.03 | % | | | 0.25 | % | | | (1.05 | %)8 |
Series portfolio turnover9 | | | 20 | % | | | 9 | % | | | 31 | % |
|
* The investment advisor paid a portion of the Series’ expenses. If these expenses had been incurred by the Series, the expense ratios (to average net assets) would have been increased by the following amounts: | |
| | | |
| | | 0.18 | %6 | | | 3.08 | %7 | | | 158 | %7,8,10 |
Target 2020 Series Class I
| | | | | | | | | | | | |
| | | For the Year
Ended
10/31/10 | | | For the Year
Ended
10/31/09 | | | For the Period
3/28/081 to
10/31/08 | |
Per share data (for a share outstanding throughout each period): | | | | | | | | | | | | |
Net asset value - Beginning of period | | $ | 9.19 | | | $ | 8.15 | | | $ | 10.00 | |
| | | | | | | | | | | | |
Income (loss) from investment operations: | | | | | | | | | | | | |
Net investment income2 | | | 0.18 | | | | 0.10 | | | | — | 11 |
Net realized and unrealized gain (loss) on underlying series | | | 1.21 | | | | 1.15 | | | | (1.85 | ) |
| | | | | | | | | | | | |
Total from investment operations | | | 1.39 | | | | 1.25 | | | | (1.85 | ) |
| | | | | | | | | | | | |
Less distributions to shareholders: | | | | | | | | | | | | |
From net investment income | | | (0.19 | ) | | | (0.21 | ) | | | — | |
From net realized gain on investments | | | (0.02 | ) | | | — | | | | — | |
| | | | | | | | | | | | |
Total distributions to shareholders | | | (0.21 | ) | | | (0.21 | ) | | | — | |
| | | | | | | | | | | | |
Net asset value - End of period | | $ | 10.37 | | | $ | 9.19 | | | $ | 8.15 | |
| | | | | | | | | | | | |
Net assets - End of period (000’s omitted) | | $ | 3,474 | | | $ | 1,927 | | | $ | 51,467 | 3 |
| | | | | | | | | | | | |
Total return4 | | | 15.24 | % | | | 15.98 | % | | | (18.50 | %) |
Ratios (to average net assets)/Supplemental Data: | | | | | | | | | | | | |
Expenses* | | | 0.05 | %6 | | | 0.05 | %7 | | | 0.05 | %7,8 |
Net investment income (loss) | | | 1.89 | % | | | 1.22 | % | | | (0.02 | %)8 |
Series portfolio turnover9 | | | 20 | % | | | 9 | % | | | 31 | % |
|
* The investment advisor paid a portion of the Series’ expenses. If these expenses had been incurred by the Series, the expense ratios (to average net assets) would have been increased by the following amounts: | |
| | | |
| | | 0.19 | %6 | | | 2.90 | %7 | | | 871 | %7,8,10 |
| 1 | Commencement of operations. |
| 2 | Calculated based on average shares outstanding during the period. |
| 3 | Represents the whole number without rounding to the 000’s. |
| 4 | Represents aggregate total return for the period indicated, and assumes reinvestment of all distributions. Total return would have been lower had certain expenses not been reimbursed during the period. Periods less than one year are not annualized. |
| 5 | During the year ended October 31, 2010, due to the timing of the renewal of the Series’ distribution plan under Rule 12b-1, the Series incurred approximately 11 months of distribution expense. The expense ratio would have been higher and the net investment income ratio and total return would have been lower had the Series incurred a full year of distribution expense. |
| 6 | Expense ratios do not include expenses of the underlying series in which the Series invests. The expense ratios of the underlying series were 0.84% for Manning & Napier Pro-Blend® Moderate Term Series - Class I and 0.83% for Manning & Napier Pro-Blend® Extended Term Series - Class I. |
| 7 | Expense ratios do not include expenses of the underlying series in which the Series invests. The expense ratio of the underlying series was 0.85%. |
| 9 | Reflects activity of the Series and does not include the activity of the underlying series. |
| 10 | The increase to the expense ratios (to average net assets) is largely due to the small net assets in each class. |
The accompanying notes are an integral part of the financial statements.
23
Financial Highlights
Target 2030 Series Class K
| | | | | | | | | | | | |
| | | For the Year
Ended
10/31/10 | | | For the Year
Ended
10/31/09 | | | For the Period
3/28/081 to
10/31/08 | |
Per share data (for a share outstanding throughout each period): | | | | | | | | | | | | |
Net asset value - Beginning of period | | $ | 8.85 | | | $ | 7.81 | | | $ | 10.00 | |
| | | | | | | | | | | | |
Income (loss) from investment operations: | | | | | | | | | | | | |
Net investment income2 | | | 0.08 | | | | 0.01 | | | | 0.03 | |
Net realized and unrealized gain (loss) on underlying series | | | 1.36 | | | | 1.20 | | | | (2.22 | ) |
| | | | | | | | | | | | |
Total from investment operations | | | 1.44 | | | | 1.21 | | | | (2.19 | ) |
| | | | | | | | | | | | |
Less distributions to shareholders: | | | | | | | | | | | | |
From net investment income | | | (0.11 | ) | | | (0.17 | ) | | | — | |
From net realized gain on investments | | | (0.03 | ) | | | — | | | | — | |
| | | | | | | | | | | | |
Total distributions to shareholders | | | (0.14 | ) | | | (0.17 | ) | | | — | |
| | | | | | | | | | | | |
Net asset value - End of period | | $ | 10.15 | | | $ | 8.85 | | | $ | 7.81 | |
| | | | | | | | | | | | |
Net assets - End of period (000’s omitted) | | $ | 66,235 | | | $ | 23,597 | | | $ | 118 | 3 |
| | | | | | | | | | | | |
Total return4 | | | 16.34 | % | | | 16.05 | % | | | (21.90 | %) |
Ratios (to average net assets)/Supplemental Data: | | | | | | | | | | | | |
Expenses* | | | 0.29 | %5,6 | | | 0.30 | %7 | | | 0.30 | %7,8 |
Net investment income | | | 0.87 | % | | | 0.14 | % | | | 0.54 | %8 |
Series portfolio turnover9 | | | 15 | % | | | 9 | % | | | — | %10 |
|
* The investment advisor paid a portion of the Series’ expenses. If these expenses had been incurred by the Series, the expense ratios (to average net assets) would have been increased by the following amounts: | |
| | | |
| | | 0.20 | %6 | | | 0.97 | %7 | | | 37,175 | %7,8,11 |
Target 2030 Series Class R
| | | | | | | | | | | | |
| | | For the Year
Ended
10/31/10 | | | For the Year
Ended
10/31/09 | | | For the Period
3/28/081 to
10/31/08 | |
Per share data (for a share outstanding throughout each period): | | | | | | | | | | | | |
Net asset value - Beginning of period | | $ | 8.83 | | | $ | 7.79 | | | $ | 10.00 | |
| | | | | | | | | | | | |
Income (loss) from investment operations: | | | | | | | | | | | | |
Net investment income (loss)2 | | | 0.06 | | | | (0.05 | ) | | | 0.02 | |
Net realized and unrealized gain (loss) on underlying series | | | 1.35 | | | | 1.26 | | | | (2.23 | ) |
| | | | | | | | | | | | |
Total from investment operations | | | 1.41 | | | | 1.21 | | | | (2.21 | ) |
| | | | | | | | | | | | |
Less distributions to shareholders: | | | | | | | | | | | | |
From net investment income | | | (0.12 | ) | | | (0.17 | ) | | | — | |
From net realized gain on investments | | | (0.03 | ) | | | — | | | | — | |
| | | | | | | | | | | | |
Total distributions to shareholders | | | (0.15 | ) | | | (0.17 | ) | | | — | |
| | | | | | | | | | | | |
Net asset value - End of period | | $ | 10.09 | | | $ | 8.83 | | | $ | 7.79 | |
| | | | | | | | | | | | |
Net assets - End of period (000’s omitted) | | $ | 7,162 | | | $ | 328 | | | $ | 78 | 3 |
| | | | | | | | | | | | |
Total return4 | | | 16.01 | % | | | 16.09 | % | | | (22.10 | %) |
Ratios (to average net assets)/Supplemental Data: | | | | | | | | | | | | |
Expenses* | | | 0.54 | %5,6 | | | 0.55 | %7 | | | 0.55 | %7,8 |
Net investment income (loss) | | | 0.68 | % | | | (0.53 | %) | | | 0.31 | %8 |
Series portfolio turnover9 | | | 15 | % | | | 9 | % | | | — | %10 |
|
* The investment advisor paid a portion of the Series’ expenses. If these expenses had been incurred by the Series, the expense ratios (to average net assets) would have been increased by the following amounts: | |
| | | |
| | | 0.18 | %6 | | | 28.67 | %7 | | | 38,768 | %7,8,11 |
| 1 | Commencement of operations. |
| 2 | Calculated based on average shares outstanding during the period. |
| 3 | Represents the whole number without rounding to the 000’s. |
| 4 | Represents aggregate total return for the period indicated, and assumes reinvestment of all distributions. Total return would have been lower had certain expenses not been reimbursed during the period. Periods less than one year are not annualized. |
| 5 | During the year ended October 31, 2010, due to the timing of the renewal of the Series’ distribution plan under Rule 12b-1, the Series incurred approximately 11 months of distribution expense. The expense ratio would have been higher and the net investment income ratio and total return would have been lower had the Series incurred a full year of distribution expense. |
| 6 | Expense ratios do not include expenses of the underlying series in which the Series invests. The expense ratios of the underlying series were 0.83% for Manning & Napier Pro-Blend® Extended Term Series - Class I and 0.85% for Manning & Napier Pro-Blend® Maximum Term Series - Class I. |
| 7 | Expense ratios do not include expenses of the underlying series in which the Series invests. The expense ratio of the underlying series was 0.85%. |
| 9 | Reflects activity of the Series and does not include the activity of the underlying series. |
| 11 | The increase to the expense ratios (to average net assets) is largely due to the small net assets in each class. |
The accompanying notes are an integral part of the financial statements.
24
Financial Highlights
Target 2030 Series Class C
| | | | | | | | | | | | |
| | | For the Year
Ended
10/31/10 | | | For the Year
Ended
10/31/09 | | | For the Period
3/28/081 to
10/31/08 | |
Per share data (for a share outstanding throughout each period): | | | | | | | | | | | | |
Net asset value - Beginning of period | | $ | 8.78 | | | $ | 7.77 | | | $ | 10.00 | |
| | | | | | | | | | | | |
Income (loss) from investment operations: | | | | | | | | | | | | |
Net investment income (loss)2 | | | 0.03 | | | | (0.02 | ) | | | (0.01 | ) |
Net realized and unrealized gain (loss) on underlying series | | | 1.33 | | | | 1.19 | | | | (2.22 | ) |
| | | | | | | | | | | | |
Total from investment operations | | | 1.36 | | | | 1.17 | | | | (2.23 | ) |
| | | | | | | | | | | | |
Less distributions to shareholders: | | | | | | | | | | | | |
From net investment income | | | (0.06 | ) | | | (0.16 | ) | | | — | |
From net realized gain on investments | | | (0.03 | ) | | | — | | | | — | |
| | | | | | | | | | | | |
Total distributions to shareholders | | | (0.09 | ) | | | (0.16 | ) | | | — | |
| | | | | | | | | | | | |
Net asset value - End of period | | $ | 10.05 | | | $ | 8.78 | | | $ | 7.77 | |
| | | | | | | | | | | | |
Net assets - End of period (000’s omitted) | | $ | 2,231 | | | $ | 1,034 | | | $ | 78 | 3 |
| | | | | | | | | | | | |
Total return4 | | | 15.50 | % | | | 15.57 | % | | | (22.30 | %) |
Ratios (to average net assets)/Supplemental Data: | | | | | | | | | | | | |
Expenses* | | | 1.00 | %5,6 | | | 1.05 | %7 | | | 1.05 | %7,8 |
Net investment income (loss) | | | 0.31 | % | | | (0.22 | %) | | | (0.17 | %)8 |
Series portfolio turnover9 | | | 15 | % | | | 9 | % | | | — | %10 |
|
* The investment advisor paid a portion of the Series’ expenses. If these expenses had been incurred by the Series, the expense ratios (to average net assets) would have been increased by the following amounts: | |
| | | |
| | | 0.22 | %6 | | | 5.84 | %7 | | | 38,789 | %7,8,11 |
Target 2030 Series Class I
| | | | | | | | | | | | |
| | | For the Year
Ended
10/31/10 | | | For the Year
Ended
10/31/09 | | | For the Period
3/28/081 to
10/31/08 | |
Per share data (for a share outstanding throughout each period): | | | | | | | | | | | | |
Net asset value - Beginning of period | | $ | 8.90 | | | $ | 7.82 | | | $ | 10.00 | |
| | | | | | | | | | | | |
Income (loss) from investment operations: | | | | | | | | | | | | |
Net investment income2 | | | 0.13 | | | | 0.11 | | | | 0.01 | |
Net realized and unrealized gain (loss) on underlying series | | | 1.35 | | | | 1.14 | | | | (2.19 | ) |
| | | | | | | | | | | | |
Total from investment operations | | | 1.48 | | | | 1.25 | | | | (2.18 | ) |
| | | | | | | | | | | | |
Less distributions to shareholders: | | | | | | | | | | | | |
From net investment income | | | (0.14 | ) | | | (0.17 | ) | | | — | |
From net realized gain on investments | | | (0.03 | ) | | | — | | | | — | |
| | | | | | | | | | | | |
Total distributions to shareholders | | | (0.17 | ) | | | (0.17 | ) | | | — | |
| | | | | | | | | | | | |
Net asset value - End of period | | $ | 10.21 | | | $ | 8.90 | | | $ | 7.82 | |
| | | | | | | | | | | | |
Net assets - End of period (000’s omitted) | | $ | 2,932 | | | $ | 1,316 | | | $ | 12,591 | 3 |
| | | | | | | | | | | | |
Total return4 | | | 16.76 | % | | | 16.56 | % | | | (21.80 | %) |
Ratios (to average net assets)/Supplemental Data: | | | | | | | | | | | | |
Expenses* | | | 0.05 | %6 | | | 0.05 | %7 | | | 0.05 | %7,8 |
Net investment income | | | 1.34 | % | | | 1.37 | % | | | 0.16 | %8 |
Series portfolio turnover9 | | | 15 | % | | | 9 | % | | | — | %10 |
|
* The investment advisor paid a portion of the Series’ expenses. If these expenses had been incurred by the Series, the expense ratios (to average net assets) would have been increased by the following amounts: | |
| | | |
| | | 0.22 | %6 | | | 6.18 | %7 | | | 14,979 | %7,8,11 |
| 1 | Commencement of operations. |
| 2 | Calculated based on average shares outstanding during the period. |
| 3 | Represents the whole number without rounding to the 000’s. |
| 4 | Represents aggregate total return for the period indicated, and assumes reinvestment of all distributions. Total return would have been lower had certain expenses not been reimbursed during the period. Periods less than one year are not annualized. |
| 5 | During the year ended October 31, 2010, due to the timing of the renewal of the Series’ distribution plan under Rule 12b-1, the Series incurred approximately 11 months of distribution expense. The expense ratio would have been higher and the net investment income ratio and total return would have been lower had the Series incurred a full year of distribution expense. |
| 6 | Expense ratios do not include expenses of the underlying series in which the Series invests. The expense ratios of the underlying series were 0.83% for Manning & Napier Pro-Blend® Extended Term Series - Class I and 0.85% for Manning & Napier Pro-Blend® Maximum Term Series - Class I. |
| 7 | Expense ratios do not include expenses of the underlying series in which the Series invests. The expense ratio of the underlying series was 0.85%. |
| 9 | Reflects activity of the Series and does not include the activity of the underlying series. |
| 11 | The increase to the expense ratios (to average net assets) is largely due to the small net assets in each class. |
The accompanying notes are an integral part of the financial statements.
25
Financial Highlights
Target 2040 Series Class K
| | | | | | | | | | | | |
| | | For the Year
Ended
10/31/10 | | | For the Year
Ended
10/31/09 | | | For the Period
3/28/081 to
10/31/08 | |
Per share data (for a share outstanding throughout each period): | | | | | | | | | | | | |
Net asset value - Beginning of period | | $ | 8.79 | | | $ | 7.58 | | | $ | 10.00 | |
| | | | | | | | | | | | |
Income (loss) from investment operations: | | | | | | | | | | | | |
Net investment income2 | | | 0.04 | | | | — | 3 | | | 0.02 | |
Net realized and unrealized gain (loss) on underlying series | | | 1.46 | | | | 1.36 | | | | (2.44 | ) |
| | | | | | | | | | | | |
Total from investment operations | | | 1.50 | | | | 1.36 | | | | (2.42 | ) |
| | | | | | | | | | | | |
Less distributions to shareholders: | | | | | | | | | | | | |
From net investment income | | | (0.06 | ) | | | (0.15 | ) | | | — | |
From net realized gain on investments | | | (0.03 | ) | | | — | | | | — | |
| | | | | | | | | | | | |
Total distributions to shareholders | | | (0.09 | ) | | | (0.15 | ) | | | — | |
| | | | | | | | | | | | |
Net asset value - End of period | | $ | 10.20 | | | $ | 8.79 | | | $ | 7.58 | |
| | | | | | | | | | | | |
Net assets - End of period (000’s omitted) | | $ | 42,417 | | | $ | 12,880 | | | $ | 76 | 4 |
| | | | | | | | | | | | |
Total return5 | | | 17.10 | % | | | 18.60 | % | | | (24.20 | %) |
Ratios (to average net assets)/Supplemental Data: | | | | | | | | | | | | |
Expenses*6 | | | 0.29 | %7 | | | 0.30 | % | | | 0.30 | %8 |
Net investment income | | | 0.43 | % | | | 0.05 | % | | | 0.40 | %8 |
Series portfolio turnover9 | | | 4 | % | | | 7 | % | | | — | %10 |
|
* The investment advisor paid a portion of the Series’ expenses. If these expenses had been incurred by the Series, the expense ratios (to average net assets) would have been increased by the following amounts6: | |
| | | |
| | | 0.32 | % | | | 2.10 | % | | | 28,865 | %8,11 |
Target 2040 Series Class R
| | | | | | | | | | | | |
| | | For the Year
Ended
10/31/10 | | | For the Year
Ended
10/31/09 | | | For the Period
3/28/081 to
10/31/08 | |
Per share data (for a share outstanding throughout each period): | | | | | | | | | | | | |
Net asset value - Beginning of period | | $ | 8.76 | | | $ | 7.58 | | | $ | 10.00 | |
| | | | | | | | | | | | |
Income (loss) from investment operations: | | | | | | | | | | | | |
Net investment income (loss)2 | | | 0.04 | | | | (0.02 | ) | | | 0.01 | |
Net realized and unrealized gain (loss) on underlying series | | | 1.43 | | | | 1.35 | | | | (2.43 | ) |
| | | | | | | | | | | | |
Total from investment operations | | | 1.47 | | | | 1.33 | | | | (2.42 | ) |
| | | | | | | | | | | | |
Less distributions to shareholders: | | | | | | | | | | | | |
From net investment income | | | (0.06 | ) | | | (0.15 | ) | | | — | |
From net realized gain on investments | | | (0.03 | ) | | | — | | | | — | |
| | | | | | | | | | | | |
Total distributions to shareholders | | | (0.09 | ) | | | (0.15 | ) | | | — | |
| | | | | | | | | | | | |
Net asset value - End of period | | $ | 10.14 | | | $ | 8.76 | | | $ | 7.58 | |
| | | | | | | | | | | | |
Net assets - End of period (000’s omitted) | | $ | 8,168 | | | $ | 504 | | | $ | 76 | 4 |
| | | | | | | | | | | | |
Total return5 | | | 16.85 | % | | | 18.21 | % | | | (24.20 | %) |
Ratios (to average net assets)/Supplemental Data: | | | | | | | | | | | | |
Expenses*6 | | | 0.52 | %7 | | | 0.55 | % | | | 0.55 | %8 |
Net investment income (loss) | | | 0.40 | % | | | (0.21 | %) | | | 0.14 | %8 |
Series portfolio turnover9 | | | 4 | % | | | 7 | % | | | — | %10 |
|
* The investment advisor paid a portion of the Series’ expenses. If these expenses had been incurred by the Series, the expense ratios (to average net assets) would have been increased by the following amounts6: | |
| | | |
| | | 0.31 | % | | | 16.27 | % | | | 28,865 | %8,11 |
| 1 | Commencement of operations. |
| 2 | Calculated based on average shares outstanding during the period. |
| 4 | Represents the whole number without rounding to the 000’s. |
| 5 | Represents aggregate total return for the period indicated, and assumes reinvestment of all distributions. Total return would have been lower had certain expenses not been reimbursed during the period. Periods less than one year are not annualized. |
| 6 | Expense ratios do not include expenses of the underlying series in which the Series invests. The expense ratio of the underlying series was 0.85%. |
| 7 | During the year ended October 31, 2010, due to the timing of the renewal of the Series’ distribution plan under Rule 12b-1, the Series incurred approximately 11 months of distribution expense. The expense ratio would have been higher and the net investment income ratio and total return would have been lower had the Series incurred a full year of distribution expense. |
| 9 | Reflects activity of the Series and does not include the activity of the underlying series. |
| 11 | The increase to the expense ratios (to average net assets) is largely due to the small net assets in each class. |
The accompanying notes are an integral part of the financial statements.
26
Financial Highlights
Target 2040 Series Class C
| | | | | | | | | | | | |
| | | For the Year
Ended
10/31/10 | | | For the Year
Ended
10/31/09 | | | For the Period
3/28/081 to
10/31/08 | |
Per share data (for a share outstanding throughout each period): | | | | | | | | | | | | |
Net asset value - Beginning of period | | $ | 8.70 | | | $ | 7.55 | | | $ | 10.00 | |
| | | | | | | | | | | | |
Income (loss) from investment operations: | | | | | | | | | | | | |
Net investment loss2 | | | (0.01 | ) | | | (0.06 | ) | | | (0.02 | ) |
Net realized and unrealized gain (loss) on underlying series | | | 1.43 | | | | 1.36 | | | | (2.43 | ) |
| | | | | | | | | | | | |
Total from investment operations | | | 1.42 | | | | 1.30 | | | | (2.45 | ) |
| | | | | | | | | | | | |
Less distributions to shareholders: | | | | | | | | | | | | |
From net investment income | | | (0.03 | ) | | | (0.15 | ) | | | — | |
From net realized gain on investments | | | (0.03 | ) | | | — | | | | — | |
| | | | | | | | | | | | |
Total distributions to shareholders | | | (0.06 | ) | | | (0.15 | ) | | | — | |
| | | | | | | | | | | | |
Net asset value - End of period | | $ | 10.06 | | | $ | 8.70 | | | $ | 7.55 | |
| | | | | | | | | | | | |
Net assets - End of period (000’s omitted) | | $ | 875 | | | $ | 440 | | | $ | 75 | 3 |
| | | | | | | | | | | | |
Total return4 | | | 16.32 | % | | | 17.88 | % | | | (24.50 | %) |
Ratios (to average net assets)/Supplemental Data: | | | | | | | | | | | | |
Expenses*5 | | | 0.99 | %6 | | | 1.05 | % | | | 1.05 | %7 |
Net investment loss | | | (0.12 | %) | | | (0.65 | %) | | | (0.36 | %)7 |
Series portfolio turnover8 | | | 4 | % | | | 7 | % | | | — | %9 |
|
* The investment advisor paid a portion of the Series’ expenses. If these expenses had been incurred by the Series, the expense ratios (to average net assets) would have been increased by the following amounts5: | |
| | | |
| | | 0.37 | % | | | 15.19 | % | | | 28,898 | %7,10 |
Target 2040 Series Class I
| | | | | | | | | | | | |
| | | For the Year
Ended
10/31/10 | | | For the Year
Ended
10/31/09 | | | For the Period
3/28/081 to
10/31/08 | |
Per share data (for a share outstanding throughout each period): | | | | | | | | | | | | |
Net asset value - Beginning of period | | $ | 8.83 | | | $ | 7.60 | | | $ | 10.00 | |
| | | | | | | | | | | | |
Income (loss) from investment operations: | | | | | | | | | | | | |
Net investment income2 | | | 0.08 | | | | 0.07 | | | | — | 11 |
Net realized and unrealized gain (loss) on underlying series | | | 1.46 | | | | 1.32 | | | | (2.40 | ) |
| | | | | | | | | | | | |
Total from investment operations | | | 1.54 | | | | 1.39 | | | | (2.40 | ) |
| | | | | | | | | | | | |
Less distributions to shareholders: | | | | | | | | | | | | |
From net investment income | | | (0.08 | ) | | | (0.16 | ) | | | — | |
From net realized gain on investments | | | (0.03 | ) | | | — | | | | — | |
| | | | | | | | | | | | |
Total distributions to shareholders | | | (0.11 | ) | | | (0.16 | ) | | | — | |
| | | | | | | | | | | | |
Net asset value - End of period | | $ | 10.26 | | | $ | 8.83 | | | $ | 7.60 | |
| | | | | | | | | | | | |
Net assets - End of period (000’s omitted) | | $ | 1,066 | | | $ | 428 | | | $ | 28,539 | 3 |
| | | | | | | | | | | | |
Total return4 | | | 17.52 | % | | | 18.86 | % | | | (24.00 | %) |
Ratios (to average net assets)/Supplemental Data: | | | | | | | | | | | | |
Expenses*5 | | | 0.05 | % | | | 0.05 | % | | | 0.05 | %7 |
Net investment income (loss) | | | 0.84 | % | | | 0.93 | % | | | (0.04 | %)7 |
Series portfolio turnover8 | | | 4 | % | | | 7 | % | | | — | %9 |
|
* The investment advisor paid a portion of the Series’ expenses. If these expenses had been incurred by the Series, the expense ratios (to average net assets) would have been increased by the following amounts5: | |
| | | |
| | | 0.36 | % | | | 18.65 | % | | | 767 | %7,10 |
| 1 | Commencement of operations. |
| 2 | Calculated based on average shares outstanding during the period. |
| 3 | Represents the whole number without rounding to the 000’s. |
| 4 | Represents aggregate total return for the period indicated, and assumes reinvestment of all distributions. Total return would have been lower had certain expenses not been reimbursed during the period. Periods less than one year are not annualized. |
| 5 | Expense ratios do not include expenses of the underlying series in which the Series invests. The expense ratio of the underlying series was 0.85%. |
| 6 | During the year ended October 31, 2010, due to the timing of the renewal of the Series’ distribution plan under Rule 12b-1, the Series incurred approximately 11 months of distribution expense. The expense ratio would have been higher and the net investment income ratio and total return would have been lower had the Series incurred a full year of distribution expense. |
| 8 | Reflects activity of the Series and does not include the activity of the underlying series. |
| 10 | The increase to the expense ratios (to average net assets) is largely due to the small net assets in each class. |
The accompanying notes are an integral part of the financial statements.
27
Financial Highlights
Target 2050 Series Class K
| | | | | | | | | | | | |
| | | For the Year
Ended
10/31/10 | | | For the Year
Ended
10/31/09 | | | For the Period
3/28/081 to
10/31/08 | |
Per share data (for a share outstanding throughout each period): | | | | | | | | | | | | |
Net asset value - Beginning of period | | $ | 8.85 | | | $ | 7.58 | | | $ | 10.00 | |
| | | | | | | | | | | | |
Income (loss) from investment operations: | | | | | | | | | | | | |
Net investment income (loss)2 | | | 0.03 | | | | (0.02 | ) | | | 0.02 | |
Net realized and unrealized gain (loss) on underlying series | | | 1.48 | | | | 1.52 | | | | (2.44 | ) |
| | | | | | | | | | | | |
Total from investment operations | | | 1.51 | | | | 1.50 | | | | (2.42 | ) |
| | | | | | | | | | | | |
Less distributions to shareholders: | | | | | | | | | | | | |
From net investment income | | | (0.06 | ) | | | (0.23 | ) | | | — | |
From net realized gain on investments | | | (0.08 | ) | | | — | | | | — | |
| | | | | | | | | | | | |
Total distributions to shareholders | | | (0.14 | ) | | | (0.23 | ) | | | — | |
| | | | | | | | | | | | |
Net asset value - End of period | | $ | 10.22 | | | $ | 8.85 | | | $ | 7.58 | |
| | | | | | | | | | | | |
Net assets - End of period (000’s omitted) | | $ | 15,242 | | | $ | 1,047 | | | $ | 76 | 3 |
| | | | | | | | | | | | |
Total return4 | | | 17.16 | % | | | 20.71 | % | | | (24.20 | %) |
Ratios (to average net assets)/Supplemental Data: | | | | | | | | | | | | |
Expenses*5 | | | 0.30 | %6 | | | 0.30 | % | | | 0.30 | %7 |
Net investment income (loss) | | | 0.28 | % | | | (0.24 | %) | | | 0.40 | %7 |
Series portfolio turnover8 | | | 3 | % | | | 46 | % | | | 1 | % |
|
* The investment advisor paid a portion of the Series’ expenses. If these expenses had been incurred by the Series, the expense ratios (to average net assets) would have been increased by the following amounts5: | |
| | | |
| | | 1.07 | % | | | 25.10 | % | | | 35,232 | %7,9 |
Target 2050 Series Class R
| | | | | | | | | | | | |
| | | For the Year
Ended
10/31/10 | | | For the Year
Ended
10/31/09 | | | For the Period
3/28/081 to
10/31/08 | |
Per share data (for a share outstanding throughout each period): | | | | | | | | | | | | |
Net asset value - Beginning of period | | $ | 8.82 | | | $ | 7.58 | | | $ | 10.00 | |
| | | | | | | | | | | | |
Income (loss) from investment operations: | | | | | | | | | | | | |
Net investment income (loss)2 | | | 0.03 | | | | (0.05 | ) | | | 0.01 | |
Net realized and unrealized gain (loss) on underlying series | | | 1.44 | | | | 1.52 | | | | (2.43 | ) |
| | | | | | | | | | | | |
Total from investment operations | | | 1.47 | | | | 1.47 | | | | (2.42 | ) |
| | | | | | | | | | | | |
Less distributions to shareholders: | | | | | | | | | | | | |
From net investment income | | | (0.05 | ) | | | (0.23 | ) | | | — | |
From net realized gain on investments | | | (0.08 | ) | | | — | | | | — | |
| | | | | | | | | | | | |
Total distributions to shareholders | | | (0.13 | ) | | | (0.23 | ) | | | — | |
| | | | | | | | | | | | |
Net asset value - End of period | | $ | 10.16 | | | $ | 8.82 | | | $ | 7.58 | |
| | | | | | | | | | | | |
Net assets - End of period (000’s omitted) | | $ | 2,154 | | | $ | 601 | | | $ | 76 | 3 |
| | | | | | | | | | | | |
Total return4 | | | 16.85 | % | | | 20.31 | % | | | (24.20 | %) |
Ratios (to average net assets)/Supplemental Data: | | | | | | | | | | | | |
Expenses*5 | | | 0.53 | %6 | | | 0.55 | % | | | 0.55 | %7 |
Net investment income (loss) | | | 0.27 | % | | | (0.50 | %) | | | 0.14 | %7 |
Series portfolio turnover8 | | | 3 | % | | | 46 | % | | | 1 | % |
|
* The investment advisor paid a portion of the Series’ expenses. If these expenses had been incurred by the Series, the expense ratios (to average net assets) would have been increased by the following amounts5: | |
| | | |
| | | 1.44 | % | | | 242.05 | % | | | 35,243 | %7,9 |
| 1 | Commencement of operations. |
| 2 | Calculated based on average shares outstanding during the period. |
| 3 | Represents the whole number without rounding to the 000’s. |
| 4 | Represents aggregate total return for the period indicated, and assumes reinvestment of all distributions. Total return would have been lower had certain expenses not been reimbursed during the period. Periods less than one year are not annualized. |
| 5 | Expense ratios do not include expenses of the underlying series in which the Series invests. The expense ratio of the underlying series was 0.85%. |
| 6 | During the year ended October 31, 2010, due to the timing of the renewal of the Series’ distribution plan under Rule 12b-1, the Series incurred approximately 11 months of distribution expense. The expense ratio would have been higher and the net investment income ratio and total return would have been lower had the Series incurred a full year of distribution expense. |
| 8 | Reflects activity of the Series and does not include the activity of the underlying series. |
| 9 | The increase to the expense ratios (to average net assets) is largely due to the small net assets in each class. |
The accompanying notes are an integral part of the financial statements.
28
Financial Highlights
Target 2050 Series Class C
| | | | | | | | | | | | |
| | | For the Year
Ended
10/31/10 | | | For the Year
Ended
10/31/09 | | | For the Period
3/28/081 to
10/31/08 | |
Per share data (for a share outstanding throughout each period): | | | | | | | | | | | | |
Net asset value - Beginning of period | | $ | 8.75 | | | $ | 7.55 | | | $ | 10.00 | |
| | | | | | | | | | | | |
Income (loss) from investment operations: | | | | | | | | | | | | |
Net investment loss2 | | | (0.04 | ) | | | (0.06 | ) | | | (0.02 | ) |
Net realized and unrealized gain (loss) on underlying series | | | 1.46 | | | | 1.49 | | | | (2.43 | ) |
| | | | | | | | | | | | |
Total from investment operations | | | 1.42 | | | | 1.43 | | | | (2.45 | ) |
| | | | | | | | | | | | |
Less distributions to shareholders: | | | | | | | | | | | | |
From net investment income | | | (0.01 | ) | | | (0.23 | ) | | | — | |
From net realized gain on investments | | | (0.08 | ) | | | — | | | | — | |
| | | | | | | | | | | | |
Total distributions to shareholders | | | (0.09 | ) | | | (0.23 | ) | | | — | |
| | | | | | | | | | | | |
Net asset value - End of period | | $ | 10.08 | | | $ | 8.75 | | | $ | 7.55 | |
| | | | | | | | | | | | |
Net assets - End of period (000’s omitted) | | $ | 843 | | | $ | 99 | | | $ | 75 | 3 |
| | | | | | | | | | | | |
Total return4 | | | 16.34 | % | | | 19.84 | % | | | (24.50 | %) |
Ratios (to average net assets)/Supplemental Data: | | | | | | | | | | | | |
Expenses*5 | | | 1.02 | %6 | | | 1.05 | % | | | 1.05 | %7 |
Net investment loss | | | (0.44 | %) | | | (0.71 | %) | | | (0.36 | %)7 |
Series portfolio turnover8 | | | 3 | % | | | 46 | % | | | 1 | % |
|
* The investment advisor paid a portion of the Series’ expenses. If these expenses had been incurred by the Series, the expense ratios (to average net assets) would have been increased by the following amounts5: | |
| | | |
| | | 1.23 | % | | | 73.45 | % | | | 35,267 | %7,9 |
Target 2050 Series Class I
| | | | | | | | | | | | |
| | | For the Year
Ended
10/31/10 | | | For the Year
Ended
10/31/09 | | | For the Period
3/28/081 to
10/31/08 | |
Per share data (for a share outstanding throughout each period): | | | | | | | | | | | | |
Net asset value - Beginning of period | | $ | 8.90 | | | $ | 7.60 | | | $ | 10.00 | |
| | | | | | | | | | | | |
Income (loss) from investment operations: | | | | | | | | | | | | |
Net investment income2 | | | 0.07 | | | | 0.16 | | | | — | 10 |
Net realized and unrealized gain (loss) on underlying series | | | 1.47 | | | | 1.37 | | | | (2.40 | ) |
| | | | | | | | | | | | |
Total from investment operations | | | 1.54 | | | | 1.53 | | | | (2.40 | ) |
| | | | | | | | | | | | |
Less distributions to shareholders: | | | | | | | | | | | | |
From net investment income | | | (0.08 | ) | | | (0.23 | ) | | | — | |
From net realized gain on investments | | | (0.08 | ) | | | — | | | | — | |
| | | | | | | | | | | | |
Total distributions to shareholders | | | (0.16 | ) | | | (0.23 | ) | | | — | |
| | | | | | | | | | | | |
Net asset value - End of period | | $ | 10.28 | | | $ | 8.90 | | | $ | 7.60 | |
| | | | | | | | | | | | |
Net assets - End of period (000’s omitted) | | $ | 129 | | | $ | 79 | | | $ | 17,863 | 3 |
| | | | | | | | | | | | |
Total return4 | | | 17.40 | % | | | 21.07 | % | | | (24.00 | %) |
Ratios (to average net assets)/Supplemental Data: | | | | | | | | | | | | |
Expenses*5 | | | 0.05 | % | | | 0.05 | % | | | 0.05 | %7 |
Net investment income (loss) | | | 0.76 | % | | | 2.07 | % | | | (0.03 | %)7 |
Series portfolio turnover8 | | | 3 | % | | | 46 | % | | | 1 | % |
|
* The investment advisor paid a portion of the Series’ expenses. If these expenses had been incurred by the Series, the expense ratios (to average net assets) would have been increased by the following amounts5: | |
| | | |
| | | 1.90 | % | | | 141.53 | % | | | 1,903 | %7,9 |
| 1 | Commencement of operations. |
| 2 | Calculated based on average shares outstanding during the period. |
| 3 | Represents the whole number without rounding to the 000’s. |
| 4 | Represents aggregate total return for the period indicated, and assumes reinvestment of all distributions. Total return would have been lower had certain expenses not been reimbursed during the period. Periods less than one year are not annualized. |
| 5 | Expense ratios do not include expenses of the underlying series in which the Series invests. The expense ratio of the underlying series was 0.85%. |
| 6 | During the year ended October 31, 2010, due to the timing of the renewal of the Series’ distribution plan under Rule 12b-1, the Series incurred approximately 11 months of distribution expense. The expense ratio would have been higher and the net investment income ratio and total return would have been lower had the Series incurred a full year of distribution expense. |
| 8 | Reflects activity of the Series and does not include the activity of the underlying series. |
| 9 | The increase to the expense ratios (to average net assets) is largely due to the small net assets in each class. |
The accompanying notes are an integral part of the financial statements.
29
Notes to Financial Statements
Target Income Series, Target 2010 Series, Target 2020 Series, Target 2030 Series, Target 2040 Series and Target 2050 Series (each the “Series”) are no-load diversified series of Manning & Napier Fund, Inc. (the “Fund”). The Fund is organized in Maryland and is registered under the Investment Company Act of 1940 (the “1940 Act”), as amended, as an open-end management investment company.
Each Series seeks to achieve its investment objectives by investing in a combination of other Manning & Napier mutual funds (the “underlying series”) in order to meet its target asset allocations and investment style. The Series are designed to provide a single investment portfolio that adjusts over time to meet the changing risk and return objectives of investors over their expected investment horizon. As the target retirement date approaches, the Series’ portfolio becomes more conservative with a larger fixed-income investment component. The financial statements of the underlying series should be read in conjunction with the Series’ financial statements.
Each Series is authorized to issue four classes of shares (Class K, R, C and I). Each class of shares is substantially the same, except that class-specific distribution and shareholder servicing expenses are borne by the specific class of shares to which they relate.
The Fund’s Advisor is Manning & Napier Advisors, Inc. (the “Advisor”). Shares of each Series are offered to investors and employees of the Advisor and its affiliates. The total authorized capital stock of the Fund consists of 10.0 billion shares of common stock each having a par value of $0.01. As of October 31, 2010, 6.2 billion shares have been designated in total among 29 series, of which 10 million have been designated in each of the Series for Class C and I common stock and 40 million have been designated in each of the Series for Class K and R common stock.
| 2. | SIGNIFICANT ACCOUNTING POLICIES |
Security Valuation
Investments in the underlying series are valued at their net asset value per share on valuation date. In the absence of the availability of a net asset value per share on the underlying series, security valuations may be determined in good faith by the Advisor under procedures approved by and under the general supervision and responsibility of the Fund’s Board of Directors (the “Board”).
Volume and level of activity in established markets for an asset or liability are evaluated to determine whether recent transactions and quoted prices are determinative of fair value. Where there have been significant decreases in volume and level of activity, further analysis and adjustment may be necessary to estimate fair value. The Series measure fair value in these instances by the use of inputs and valuation techniques which may be based upon current market prices of securities that are comparable in coupon, rating, maturity and industry and/or expectation of future cash flows. As a result of trading in relatively thin markets and/or markets that experience significant volatility, the prices used by the Series to value these securities may differ from the value that would be realized if these securities were sold, and the differences could be material.
Securities for which representative valuations or prices are not available from the Fund’s pricing service may be valued at fair value. Due to the inherent uncertainty of valuations of such securities, the fair value may differ significantly from the values that would have been used had a ready market for such securities existed. If trading or events occurring after the close of the principal market in which securities are traded are expected to materially affect the value of those securities, then they may be valued at their fair value, taking this trading or these events into account. Fair value is determined in good faith by the Advisor under procedures approved by and under the general supervision and responsibility of the Board.
Various inputs are used in determining the value of the Series’ assets or liabilities carried at market value. These inputs are summarized in three broad levels. Level 1 includes quoted prices in active markets for identical assets and liabilities. Level 2 includes other significant observable inputs (including quoted prices for similar securities,
30
Notes to Financial Statements
| 2. | SIGNIFICANT ACCOUNTING POLICIES (continued) |
Security Valuation (continued)
interest rates, prepayment speeds, credit risk, etc.). Level 3 includes significant unobservable inputs (including the Series’ own assumptions in determining the fair value of investments). The inputs or methodology used for valuing securities are not necessarily an indication of the risk associated with investing in those securities.
The following is a summary of the valuation levels used for major security types as of October 31, 2010 in valuing the Series’ assets or liabilities carried at market value:
| | | | | | | | | | | | | | | | |
| | | | | | Target Income Series | | | | |
Description | | Total | | | Level 1 | | | Level 2 | | | Level 3 | |
Assets: | | | | | | | | | | | | | | | | |
Mutual funds | | $ | 48,747,964 | | | $ | 48,747,964 | | | $ | — | | | $ | — | |
Other financial instruments*: | | | — | | | | — | | | | — | | | | — | |
| | | | | | | | | | | | | | | | |
Total assets: | | | 48,747,964 | | | | 48,747,964 | | | | | | | | — | |
| | | | | | | | | | | | | | | | |
Liabilities: | | | | | | | | | | | | | | | | |
Other financial instruments*: | | | — | | | | — | | | | — | | | | — | |
| | | | | | | | | | | | | | | | |
Total liabilities: | | | — | | | | — | | | | — | | | | — | |
| | | | | | | | | | | | | | | | |
Total | | $ | 48,747,964 | | | $ | 48,747,964 | | | $ | — | | | $ | — | |
| | | | | | | | | | | | | | | | |
| | | |
| | | | | | Target 2010 Series | | | | |
Description | | Total | | | Level 1 | | | Level 2 | | | Level 3 | |
Assets: | | | | | | | | | | | | | | | | |
Mutual funds | | $ | 35,284,308 | | | $ | 35,284,308 | | | $ | — | | | $ | — | |
Other financial instruments*: | | | — | | | | — | | | | — | | | | — | |
| | | | | | | | | | | | | | | | |
Total assets: | | | 35,284,308 | | | | 35,284,308 | | | | | | | | — | |
| | | | | | | | | | | | | | | | |
Liabilities: | | | | | | | | | | | | | | | | |
Other financial instruments*: | | | — | | | | — | | | | — | | | | — | |
| | | | | | | | | | | | | | | | |
Total liabilities: | | | — | | | | — | | | | — | | | | — | |
| | | | | | | | | | | | | | | | |
Total | | $ | 35,284,308 | | | $ | 35,284,308 | | | $ | — | | | $ | — | |
| | | | | | | | | | | | | | | | |
31
Notes to Financial Statements
| 2. | SIGNIFICANT ACCOUNTING POLICIES (continued) |
Security Valuation (continued)
| | | | | | | | | | | | | | | | |
| | | | | | Target 2020 Series | | | | |
Description | | Total | | | Level 1 | | | Level 2 | | | Level 3 | |
Assets: | | | | | | | | | | | | | | | | |
Mutual funds | | $ | 84,161,078 | | | $ | 84,161,078 | | | $ | — | | | $ | — | |
Other financial instruments*: | | | — | | | | — | | | | — | | | | — | |
| | | | | | | | | | | | | | | | |
Total assets: | | | 84,161,078 | | | | 84,161,078 | | | | | | | | — | |
| | | | | | | | | | | | | | | | |
Liabilities: | | | | | | | | | | | | | | | | |
Other financial instruments*: | | | — | | | | — | | | | — | | | | — | |
| | | | | | | | | | | | | | | | |
Total liabilities: | | | — | | | | — | | | | — | | | | — | |
| | | | | | | | | | | | | | | | |
Total | | $ | 84,161,078 | | | $ | 84,161,078 | | | $ | — | | | $ | — | |
| | | | | | | | | | | | | | | | |
| | | |
| | | | | | Target 2030 Series | | | | |
Description | | Total | | | Level 1 | | | Level 2 | | | Level 3 | |
Assets: | | | | | | | | | | | | | | | | |
Mutual funds | | $ | 78,593,726 | | | $ | 78,593,726 | | | $ | — | | | $ | — | |
Other financial instruments*: | | | — | | | | — | | | | — | | | | — | |
| | | | | | | | | | | | | | | | |
Total assets: | | | 78,593,726 | | | | 78,593,726 | | | | | | | | — | |
| | | | | | | | | | | | | | | | |
Liabilities: | | | | | | | | | | | | | | | | |
Other financial instruments*: | | | — | | | | — | | | | — | | | | — | |
| | | | | | | | | | | | | | | | |
Total liabilities: | | | — | | | | — | | | | — | | | | — | |
| | | | | | | | | | | | | | | | |
Total | | $ | 78,593,726 | | | $ | 78,593,726 | | | $ | — | | | $ | — | |
| | | | | | | | | | | | | | | | |
| | | |
| | | | | | Target 2040 Series | | | | |
Description | | Total | | | Level 1 | | | Level 2 | | | Level 3 | |
Assets: | | | | | | | | | | | | | | | | |
Mutual funds | | $ | 52,547,985 | | | $ | 52,547,985 | | | $ | — | | | $ | — | |
Other financial instruments*: | | | — | | | | — | | | | — | | | | — | |
| | | | | | | | | | | | | | | | |
Total assets: | | | 52,547,985 | | | | 52,547,985 | | | | | | | | — | |
| | | | | | | | | | | | | | | | |
Liabilities: | | | | | | | | | | | | | | | | |
Other financial instruments*: | | | — | | | | — | | | | — | | | | — | |
| | | | | | | | | | | | | | | | |
Total liabilities: | | | — | | | | — | | | | — | | | | — | |
| | | | | | | | | | | | | | | | |
Total | | $ | 52,547,985 | | | $ | 52,547,985 | | | $ | — | | | $ | — | |
| | | | | | | | | | | | | | | | |
32
Notes to Financial Statements
| 2. | SIGNIFICANT ACCOUNTING POLICIES (continued) |
Security Valuation (continued)
| | | | | | | | | | | | | | | | |
| | | | | | Target 2050 Series | | | | |
Description | | Total | | | Level 1 | | | Level 2 | | | Level 3 | |
Assets: | | | | | | | | | | | | | | | | |
Mutual funds | | $ | 18,366,922 | | | $ | 18,366,922 | | | $ | — | | | $ | — | |
Other financial instruments*: | | | — | | | | — | | | | — | | | | — | |
| | | | | | | | | | | | | | | | |
Total assets: | | | 18,366,922 | | | | 18,366,922 | | | | | | | | — | |
| | | | | | | | | | | | | | | | |
Liabilities: | | | | | | | | | | | | | | | | |
Other financial instruments*: | | | — | | | | — | | | | — | | | | — | |
| | | | | | | | | | | | | | | | |
Total liabilities: | | | — | | | | — | | | | — | | | | — | |
| | | | | | | | | | | | | | | | |
Total | | $ | 18,366,922 | | | $ | 18,366,922 | | | $ | — | | | $ | — | |
| | | | | | | | | | | | | | | | |
| | * | Other financial instruments are derivative instruments such as futures, forwards and swap contracts, which are valued at the unrealized appreciation/depreciation on the instrument. As of October 31, 2010, the Series did not hold any derivative instruments. |
There were no Level 3 securities held by any of the Series as of October 31, 2009 or October 31, 2010.
The Fund’s policy is to recognize transfers in and transfers out of the valuation levels as of the beginning of the reporting period. There were no significant transfers between Level 1 and Level 2 during the year ended October 31, 2010.
Additional disclosure surrounding the activity in Level 3 fair value measurement will also be effective for fiscal years beginning after December 15, 2010. Management has concluded that this will not have a material impact on the Series’ financial statements.
Security Transactions, Investment Income and Expenses
Security transactions are accounted for on trade date. Dividend income is recorded on the ex-dividend date. Non-cash dividends, if any, are recorded at the fair market value of the securities received.
Expenses are recorded on an accrual basis. Most expenses of the Fund can be attributed to a specific series. Expenses which cannot be directly attributed are apportioned among the series in the Fund in such a manner as deemed equitable by the Fund’s Board, taking into consideration, among other things, the nature and type of expense. Expenses included in the accompanying statements of operations do not include any expense of the underlying series.
Income, expenses (other than class specific expenses), and realized and unrealized gains and losses are prorated among the classes based on the relative net assets of each class. Class specific expenses are directly charged to that Class.
The Series use the identified cost method for determining realized gain or loss on investments for both financial statement and federal income tax reporting purposes.
Federal Taxes
Each Series’ policy is to comply with the provisions of the Internal Revenue Code applicable to regulated investment companies. The Series are not subject to federal income tax or excise tax to the extent that each Series distributes
33
Notes to Financial Statements
| 2. | SIGNIFICANT ACCOUNTING POLICIES (continued) |
Federal Taxes (continued)
to shareholders each year its taxable income, including any net realized gains on investments, in accordance with requirements of the Internal Revenue Code. Accordingly, no provision for federal income tax or excise tax has been made in the financial statements.
Management evaluates its tax positions to determine if the tax positions taken meet the minimum recognition threshold in connection with accounting for uncertainties in income tax positions taken or expected to be taken for the purposes of measuring and recognizing tax liabilities in the financial statements. Recognition of tax benefits of an uncertain tax position is required only when the position is “more likely than not” to be sustained assuming examination by taxing authorities. At October 31, 2010, the Series have recorded no liability for net unrecognized tax benefits relating to uncertain income tax positions taken or expected to betaken in future tax returns.
The Series file income tax returns in the U.S. federal jurisdiction, various states and foreign jurisdictions, as required. No income tax returns are currently under investigation. The statute of limitations on the Series’ tax returns remains open for the years ended October 31, 2008 through October 31, 2010. The Fund is not aware of any tax positions for which it is reasonably possible that the total amounts of unrecognized tax benefits will significantly change in the next twelve months.
Additionally, based on the Series’ understanding of the tax rules and rates related to income, gains and transactions for foreign jurisdictions in which they invest, the Series will provide for foreign taxes, and where appropriate, deferred foreign tax.
Distributions of Income and Gains
Distributions to shareholders of net investment income are made semi-annually. Distributions of net realized gains are made annually. An additional distribution may be necessary to avoid taxation of a Series. Distributions are recorded on the ex-dividend date.
Indemnifications
The Fund’s organizational documents provide former and current directors and officers with a limited indemnification against liabilities arising in connection with the performance of their duties to the Fund. In the normal course of business, the Fund may also enter into contracts that provide general indemnifications. The Fund’s maximum exposure under these arrangements is unknown as this would be dependent on future claims that may be made against the Fund. The risk of material loss from such claims is considered remote.
Other
The preparation of financial statements in conformity with accounting principles generally accepted in the United States of America requires management to make estimates and assumptions that affect the reported amounts of assets and liabilities and the disclosure of contingent assets and liabilities at the date of the financial statements and the reported amounts of income and expenses during the reporting period. Actual results could differ from those estimates.
| 3. | TRANSACTIONS WITH AFFILIATES |
The Fund has an Investment Advisory Agreement (the “Agreement”) with the Advisor, for which the Advisor does not receive an advisory fee for the services it performs for the Series. However, the Advisor is entitled to receive an advisory fee from each of the underlying series in which the Series invest.
Under the Agreement, personnel of the Advisor provide the Series with advice and assistance in the choice of investments and the execution of securities transactions, and otherwise maintain the Series’ organization. The Advisor also provides the Fund with necessary office space and fund administration and support services. The salaries of
34
Notes to Financial Statements
| 3. | TRANSACTIONS WITH AFFILIATES (continued) |
all officers of the Fund (except a percentage of the Fund’s Chief Compliance Officer’s salary, which is paid by the Fund), and of all Directors who are “affiliated persons” of the Fund, or of the Advisor, and all personnel of the Fund, or of the Advisor, performing services relating to research, statistical and investment activities, are paid by the Advisor. Each “non-affiliated” Director receives an annual stipend, which is allocated among all the active series of the Fund. In addition, these Directors also receive a fee per Board meeting attended for each active series of the Fund plus a fee for each committee meeting attended.
The Advisor has contractually agreed, until at least February 28, 2020, to limit each class’ total direct annual fund operating expenses for the Series at no more than 0.05% for each class, exclusive of distribution and service fees, of average daily net assets each year. The Advisor’s agreement to limit each class’ operating expenses is limited to direct operating expenses and, therefore, does not apply to the indirect expenses incurred by the Series through their investments in the underlying series. For the year ended October 31, 2010, the Advisor reimbursed expenses of $115,103 for Target Income Series, $126,761 for Target 2010 Series, $118,103 for Target 2020 Series, $120,629 for Target 2030 Series, $125,395 for Target 2040 Series and $135,174 for Target 2050 Series, which is included as a reduction of expenses on the Statements of Operations. For the year ended October 31, 2010, the Advisor voluntarily waived additional fees of $758 for each Series, which is also included as a reduction of expenses on the Statements of Operations. The Advisor is not eligible to recoup any expenses that have been reimbursed in prior years.
Manning & Napier Investor Services, Inc., a registered broker-dealer affiliate of the Advisor, acts as distributor for the Fund’s shares. Each Series compensates the distributor for distributing and servicing the Series’ Class K, Class R and Class C shares pursuant to a distribution plan adopted under Rule 12b-1 of the 1940 Act, regardless of expenses actually incurred. Under the agreement, each Series pays distribution and services fees to the distributor at an annual rate of 0.25% of average daily net assets attributable to Class K shares, 0.50% of average daily net assets attributable to Class R shares, and 1.00% of average daily net assets attributable to Class C shares. There are no distribution and services fees on the Class I shares of each Series. The fees are accrued daily and paid monthly. During the year ended October 31, 2010, due to the timing of the renewal of the Series’ distribution plan under Rule 12b-1, the Series incurred approximately 11 months of distribution expense.
For fund accounting services through November 7, 2009, the Fund paid the Advisor an annual fee of $19,000 for each Target Series. For transfer agency services through November 7, 2009, the Fund pays the Advisor an annual fee of $12,000 per class for each Target Series. Additionally, certain transaction and account-based fees and out-of-pocket expenses, including charges for reporting relating to the Fund’s compliance program, are charged. Prior to October 12, 2009 (for sub-accountant) and November 9, 2009 (for sub-transfer agent), the Advisor had an agreement with Citi Fund Services, Ohio, Inc. (“Citi”) under which Citi served as sub-accountant and sub-transfer agent.
The Advisor has entered into agreements dated October 12, 2009 and November 9, 2009 with PNC Global Investment Servicing (U.S.) Inc. (“PNCGIS”) under which PNCGIS serves as sub-accountant services agent and sub-transfer agent, respectively. Effective November 7, 2009 under the amended master services agreement, the fee rates for these Series are as follows: An annual fee related to Fund Accounting and administration of 0.025% of the average daily net assets with an annual base fee of $40,500 per Series. Transfer Agent Fees are charged to the Fund on a per account basis. Additionally, certain cusip-based and out-of-pocket expenses are charged.
Effective July 1, 2010, PNCGIS, which serves as the Series’ sub-accountant services agent and sub-transfer agent, was sold to The Bank of New York Mellon Corporation, the Series’ custodian. At the close of the sale, PNCGIS changed its name to BNY Mellon Investment Servicing (U.S.) Inc. (“BNY”).
Expenses not directly attributable to a Series are allocated based on each series’ relative net assets or number of accounts, depending on the expense.
35
Notes to Financial Statements
| 4. | PURCHASES AND SALES OF SECURITIES |
For the year ended October 31, 2010, purchases and sales of underlying series were as follows:
| | | | | | | | |
Series | | Purchases | | | Sales | |
Target Income Series | | $ | 6,155,927 | | | $ | 4,066,511 | |
Target 2010 Series | | $ | 17,492,905 | | | $ | 3,353,271 | |
Target 2020 Series | | $ | 54,610,845 | | | $ | 13,091,092 | |
Target 2030 Series | | $ | 53,542,597 | | | $ | 8,447,830 | |
Target 2040 Series | | $ | 35,131,282 | | | $ | 1,653,275 | |
Target 2050 Series | | $ | 15,531,178 | | | $ | 315,791 | |
| 5. | INVESTMENTS IN AFFILIATED ISSUERS |
A summary of the Funds’ transactions in the shares of affiliated issuers during the year ended October 31, 2010 is set forth below:
| | | | | | | | | | | | | | | | | | | | | | | | | | | | |
Target Income Series | | Value at
10/31/09 | | | Purchase
Cost | | | Sales
Proceeds | | | Value at
10/31/10 | | | Shares Held at
10/31/10 | | | Dividend
Income
10/31/09
through
10/31/10 | | | Net Realized
Gain
10/31/09
through
10/31/10 | |
Manning & Napier
Pro-Blend®
Conservative Term
Series - Class I | | $ | 42,581,647 | | | $ | 6,155,927 | | | $ | 4,066,511 | | | $ | 48,747,964 | | | | 4,419,580 | | | $ | 961,051 | | | $ | 511,837 | |
| | | | | | | | | | | | | | | | | | | | | | | | | | | | |
| | $ | 42,581,647 | | | $ | 6,155,927 | | | $ | 4,066,511 | | | $ | 48,747,964 | | | | 4,419,580 | | | $ | 961,051 | | | $ | 511,837 | |
| | | | | | | | | | | | | | | | | | | | | | | | | | | | |
| | | | | | | |
Target 2010 Series | | Value at
10/31/09 | | | Purchase
Cost | | | Sales
Proceeds | | | Value at
10/31/10 | | | Shares Held at
10/31/10 | | | Dividend
Income
10/31/09
through
10/31/10 | | | Net Realized
Gain
10/31/09
through
10/31/10 | |
Manning & Napier
Pro-Blend®
Moderate Term
Series - Class I | | $ | 18,015,627 | | | $ | 17,492,905 | | | $ | 3,353,271 | | | $ | 35,284,308 | | | | 3,328,708 | | | $ | 453,756 | | | $ | 674,697 | |
| | | | | | | | | | | | | | | | | | | | | | | | | | | | |
| | $ | 18,015,627 | | | $ | 17,492,905 | | | $ | 3,353,271 | | | $ | 35,284,308 | | | | 3,328,708 | | | $ | 453,756 | | | $ | 674,697 | |
| | | | | | | | | | | | | | | | | | | | | | | | | | | | |
| | | | | | | |
Target 2020 Series | | Value at
10/31/09 | | | Purchase
Cost | | | Sales
Proceeds | | | Value at
10/31/10 | | | Shares Held at
10/31/10 | | | Dividend
Income
10/31/09
through
10/31/10 | | | Net Realized
Gain
10/31/09
through
10/31/10 | |
Manning & Napier
Pro-Blend®
Extended Term
Series - Class I | | $ | 34,718,093 | | | $ | 38,261,934 | | | $ | 12,260,597 | | | $ | 67,490,359 | | | | 6,578,008 | | | $ | 1,048,839 | | | $ | 2,849,424 | |
Manning & Napier
Pro-Blend®
Moderate Term
Series - Class I | | | — | | | | 16,348,911 | | | | 830,495 | | | | 16,670,719 | | | | 1,572,709 | | | | 92,911 | | | | 13,486 | |
| | | | | | | | | | | | | | | | | | | | | | | | | | | | |
| | $ | 34,718,093 | | | $ | 54,610,845 | | | $ | 13,091,092 | | | $ | 84,161,078 | | | | 8,150,717 | | | $ | 1,141,750 | | | $ | 2,862,910 | |
| | | | | | | | | | | | | | | | | | | | | | | | | | | | |
36
Notes to Financial Statements
| 5. | INVESTMENTS IN AFFILIATED ISSUERS (continued) |
| | | | | | | | | | | | | | | | | | | | | | | | | | | | |
Target 2030 Series | | Value at
10/31/09 | | | Purchase
Cost | | | Sales
Proceeds | | | Value at
10/31/10 | | | Shares
Held at
10/31/10 | | | Dividend
Income
10/31/09
through
10/31/10 | | | Net Realized
Gain
10/31/09
through
10/31/10 | |
Manning & Napier Pro-Blend® Maximum Term Series - Class I | | $ | 13,347,235 | | | $ | 20,249,738 | | | $ | 5,532,616 | | | $ | 31,260,145 | | | | 3,088,947 | | | $ | 198,020 | | | $ | 1,708,471 | |
Manning & Napier Pro-Blend® Extended Term Series - Class I | | | 12,940,055 | | | | 33,292,859 | | | | 2,915,214 | | | | 47,333,581 | | | | 4,613,410 | | | | 503,642 | | | | 661,051 | |
| | | | | | | | | | | | | | | | | | | | | | | | | | | | |
| | $ | 26,287,290 | | | $ | 53,542,597 | | | $ | 8,447,830 | | | $ | 78,593,726 | | | | 7,702,357 | | | $ | 701,662 | | | $ | 2,369,522 | |
| | | | | | | | | | | | | | | | | | | | | | | | | | | | |
| | | | | | | |
Target 2040 Series | | Value at
10/31/09 | | | Purchase
Cost | | | Sales
Proceeds | | | Value at
10/31/10 | | | Shares
Held at
10/31/10 | | | Dividend
Income
10/31/09
through
10/31/10 | | | Net Realized
Gain
10/31/09
through
10/31/10 | |
Manning & Napier Pro-Blend® Maximum Term Series - Class I | | $ | 14,250,754 | | | $ | 35,131,282 | | | $ | 1,653,275 | | | $ | 52,547,985 | | | | 5,192,489 | | | $ | 296,507 | | | $ | 513,686 | |
| | | | | | | | | | | | | | | | | | | | | | | | | | | | |
| | $ | 14,250,754 | | | $ | 35,131,282 | | | $ | 1,653,275 | | | $ | 52,547,985 | | | | 5,192,489 | | | $ | 296,507 | | | $ | 513,686 | |
| | | | | | | | | | | | | | | | | | | | | | | | | | | | |
| | | | | | | |
Target 2050 Series | | Value at
10/31/09 | | | Purchase
Cost | | | Sales
Proceeds | | | Value at
10/31/10 | | | Shares
Held at
10/31/10 | | | Dividend
Income
10/31/09
through
10/31/10 | | | Net Realized
Gain
10/31/09
through
10/31/10 | |
Manning & Napier Pro-Blend® Maximum Term Series - Class I | | $ | 1,825,785 | | | $ | 15,531,178 | | | $ | 315,791 | | | $ | 18,366,922 | | | | 1,814,913 | | | $ | 72,891 | | | $ | 36,638 | |
| | | | | | | | | | | | | | | | | | | | | | | | | | | | |
| | $ | 1,825,785 | | | $ | 15,531,178 | | | $ | 315,791 | | | $ | 18,366,922 | | | | 1,814,913 | | | $ | 72,891 | | | $ | 36,638 | |
| | | | | | | | | | | | | | | | | | | | | | | | | | | | |
| 6. | CAPITAL STOCK TRANSACTIONS |
Transactions in Class K, Class R, Class C and Class I shares:
| | | | | | | | | | | | | | | | | | | | | | | | | | | | | | | | |
Target Income Series: | | For the Year
Ended 10/31/10
Class K | | | For the Year
Ended 10/31/09
Class K | | | For the Year
Ended 10/31/10
Class R | | | For the Year
Ended 10/31/09
Class R | |
Sold | | | 448,219 | | | $ | 4,604,788 | | | | 4,514,355 | | | $ | 41,239,891 | | | | 32,298 | | | $ | 334,064 | | | | 5,379 | | | $ | 54,154 | |
Reinvested | | | 93,872 | | | | 953,592 | | | | 201 | | | | 1,841 | | | | 107 | | | | 1,091 | | | | — | * | | | 2 | |
Repurchased | | | (443,760 | ) | | | (4,605,012 | ) | | | (366,425 | ) | | | (3,488,850 | ) | | | (5,980 | ) | | | (65,129 | ) | | | (71 | ) | | | (718 | ) |
| | | | | | | | | | | | | | | | | | | | | | | | | | | | | | | | |
Total | | | 98,331 | | | $ | 953,368 | | | | 4,148,131 | | | $ | 37,752,882 | | | | 26,425 | | | $ | 270,026 | | | | 5,308 | | | $ | 53,438 | |
| | | | | | | | | | | | | | | | | | | | | | | | | | | | | | | | |
37
Notes to Financial Statements
| 6. | CAPITAL STOCK TRANSACTIONS (continued) |
| | | | | | | | | | | | | | | | | | | | | | | | | | | | | | | | |
Target Income Series: | | For the Year
Ended 10/31/10
Class C | | | For the Year
Ended 10/31/09
Class C | | | For the Year
Ended 10/31/10
Class I | | | For the Year
Ended 10/31/09
Class I | |
Sold | | | 86,050 | | | $ | 881,565 | | | | 38,623 | | | $ | 368,418 | | | | 27,493 | | | $ | 284,781 | | | | 10,821 | | | $ | 103,574 | |
Reinvested | | | 556 | | | | 5,571 | | | | — | * | | | 2 | | | | 499 | | | | 5,082 | | | | 6 | | | | 53 | |
Repurchased | | | (9,325 | ) | | | (94,978 | ) | | | (5,663 | ) | | | (49,236 | ) | | | (6,772 | ) | | | (72,022 | ) | | | (5,136 | ) | | | (49,396 | ) |
| | | | | | | | | | | | | | | | | | | | | | | | | | | | | | | | |
Total | | | 77,281 | | | $ | 792,158 | | | | 32,960 | | | $ | 319,184 | | | | 21,220 | | | $ | 217,841 | | | | 5,691 | | | $ | 54,231 | |
| | | | | | | | | | | | | | | | | | | | | | | | | | | | | | | | |
| | | | |
Target 2010 Series: | | For the Year
Ended 10/31/10
Class K | | | For the Year
Ended 10/31/09
Class K | | | For the Year
Ended 10/31/10
Class R | | | For the Year
Ended 10/31/09
Class R | |
Sold | | | 1,243,416 | | | $ | 12,287,574 | | | | 1,742,272 | | | $ | 14,833,594 | | | | 375,115 | | | $ | 3,683,609 | | | | 29,844 | | | $ | 281,376 | |
Reinvested | | | 30,080 | | | | 294,419 | | | | 472 | | | | 3,846 | | | | 3,588 | | | | 34,905 | | | | — | * | | | 2 | |
Repurchased | | | (297,763 | ) | | | (2,998,485 | ) | | | (107,542 | ) | | | (949,897 | ) | | | (62,518 | ) | | | (626,115 | ) | | | (111 | ) | | | (941 | ) |
| | | | | | | | | | | | | | | | | | | | | | | | | | | | | | | | |
Total | | | 975,733 | | | $ | 9,583,508 | | | | 1,635,202 | | | $ | 13,887,543 | | | | 316,185 | | | $ | 3,092,399 | | | | 29,733 | | | $ | 280,437 | |
| | | | | | | | | | | | | | | | | | | | | | | | | | | | | | | | |
| | | | |
Target 2010 Series: | | For the Year
Ended 10/31/10
Class C | | | For the Year
Ended 10/31/09
Class C | | | For the Year
Ended 10/31/10
Class I | | | For the Year
Ended 10/31/09
Class I | |
Sold | | | 134,180 | | | $ | 1,323,150 | | | | 143,296 | | | $ | 1,279,993 | | | | 125,923 | | | $ | 1,266,774 | | | | 51,725 | | | $ | 455,086 | |
Reinvested | | | 1,573 | | | | 15,238 | | | | 261 | | | | 2,116 | | | | 1,590 | | | | 15,623 | | | | 140 | | | | 1,141 | |
Repurchased | | | (77,293 | ) | | | (756,993 | ) | | | — | | | | — | | | | (39,049 | ) | | | (394,126 | ) | | | (3,155 | ) | | | (27,973 | ) |
| | | | | | | | | | | | | | | | | | | | | | | | | | | | | | | | |
Total | | | 58,460 | | | $ | 581,395 | | | | 143,557 | | | $ | 1,282,109 | | | | 88,464 | | | $ | 888,271 | | | | 48,710 | | | $ | 428,254 | |
| | | | | | | | | | | | | | | | | | | | | | | | | | | | | | | | |
| | | | |
Target 2020 Series: | | For the Year
Ended 10/31/10
Class K | | | For the Year
Ended 10/31/09
Class K | | | For the Year
Ended 10/31/10
Class R | | | For the Year
Ended 10/31/09
Class R | |
Sold | | | 3,428,623 | | | $ | 32,716,250 | | | | 3,443,211 | | | $ | 28,020,075 | | | | 1,271,570 | | | $ | 12,079,873 | | | | 61,784 | | | $ | 554,710 | |
Reinvested | | | 75,864 | | | | 715,478 | | | | 1,274 | | | | 9,533 | | | | 11,223 | | | | 105,035 | | | | — | * | | | 2 | |
Repurchased | | | (537,212 | ) | | | (5,209,739 | ) | | | (158,310 | ) | | | (1,363,931 | ) | | | (149,951 | ) | | | (1,441,758 | ) | | | (51 | ) | | | (379 | ) |
| | | | | | | | | | | | | | | | | | | | | | | | | | | | | | | | |
Total | | | 2,967,275 | | | $ | 28,221,989 | | | | 3,286,175 | | | $ | 26,665,677 | | | | 1,132,842 | | | $ | 10,743,150 | | | | 61,733 | | | $ | 554,333 | |
| | | | | | | | | | | | | | | | | | | | | | | | | | | | | | | | |
| | | | |
Target 2020 Series: | | For the Year
Ended 10/31/10
Class C | | | For the Year
Ended 10/31/09
Class C | | | For the Year
Ended 10/31/10
Class I | | | For the Year
Ended 10/31/09
Class I | |
Sold | | | 154,981 | | | $ | 1,470,332 | | | | 205,520 | | | $ | 1,694,895 | | | | 205,330 | | | $ | 1,990,302 | | | | 260,233 | | | $ | 2,131,142 | |
Reinvested | | | 4,034 | | | | 37,601 | | | | 727 | | | | 5,417 | | | | 5,874 | | | | 55,517 | | | | 913 | | | | 6,847 | |
Repurchased | | | (20,942 | ) | | | (199,108 | ) | | | (130 | ) | | | (1,200 | ) | | | (85,824 | ) | | | (827,830 | ) | | | (57,717 | ) | | | (470,057 | ) |
| | | | | | | | | | | | | | | | | | | | | | | | | | | | | | | | |
Total | | | 138,073 | | | $ | 1,308,825 | | | | 206,117 | | | $ | 1,699,112 | | | | 125,380 | | | $ | 1,217,989 | | | | 203,429 | | | $ | 1,667,932 | |
| | | | | | | | | | | | | | | | | | | | | | | | | | | | | | | | |
38
Notes to Financial Statements
| 6. | CAPITAL STOCK TRANSACTIONS (continued) |
| | | | | | | | | | | | | | | | | | | | | | | | | | | | | | | | |
Target 2030 Series: | | For the Year
Ended 10/31/10
Class K | | | For the Year
Ended 10/31/09
Class K | | | For the Year
Ended 10/31/10
Class R | | | For the Year
Ended 10/31/09
Class R | |
Sold | | | 4,443,289 | | | $ | 41,866,032 | | | | 2,794,177 | | | $ | 21,809,364 | | | | 715,219 | | | $ | 6,782,144 | | | | 37,951 | | | $ | 332,769 | |
Reinvested | | | 50,346 | | | | 466,037 | | | | 1 | | | | 5 | | | | 2,715 | | | | 25,049 | | | | — | * | | | 2 | |
Repurchased | | | (633,539 | ) | | | (5,919,500 | ) | | | (127,671 | ) | | | (1,047,780 | ) | | | (45,359 | ) | | | (420,314 | ) | | | (807 | ) | | | (5,692 | ) |
| | | | | | | | | | | | | | | | | | | | | | | | | | | | | | | | |
Total | | | 3,860,096 | | | $ | 36,412,569 | | | | 2,666,507 | | | $ | 20,761,589 | | | | 672,575 | | | $ | 6,386,879 | | | | 37,144 | | | $ | 327,079 | |
| | | | | | | | | | | | | | | | | | | | | | | | | | | | | | | | |
| | | | |
Target 2030
Series: | | For the Year
Ended 10/31/10
Class C | | | For the Year
Ended 10/31/09
Class C | | | For the Year
Ended 10/31/10
Class I | | | For the Year
Ended 10/31/09
Class I | |
Sold | | | 122,492 | | | $ | 1,143,648 | | | | 118,501 | | | $ | 958,524 | | | | 189,980 | | | $ | 1,812,436 | | | | 199,628 | | | $ | 1,570,440 | |
Reinvested | | | 1,262 | | | | 11,572 | | | | 119 | | | | 828 | | | | 3,434 | | | | 31,915 | | | | 838 | | | | 5,897 | |
Repurchased | | | (19,514 | ) | | | (180,906 | ) | | | (797 | ) | | | (7,212 | ) | | | (54,152 | ) | | | (524,884 | ) | | | (54,262 | ) | | | (410,564 | ) |
| | | | | | | | | | | | | | | | | | | | | | | | | | | | | | | | |
Total | | | 104,240 | | | $ | 974,314 | | | | 117,823 | | | $ | 952,140 | | | | 139,262 | | | $ | 1,319,467 | | | | 146,204 | | | $ | 1,165,773 | |
| | | | | | | | | | | | | | | | | | | | | | | | | | | | | | | | |
| | | | |
Target 2040 Series: | | For the Year
Ended 10/31/10
Class K | | | For the Year
Ended 10/31/09
Class K | | | For the Year
Ended 10/31/10
Class R | | | For the Year
Ended 10/31/09
Class R | |
Sold | | | 2,916,361 | | | $ | 27,809,525 | | | | 1,526,640 | | | $ | 11,952,261 | | | | 853,099 | | | $ | 7,955,763 | | | | 57,580 | | | $ | 486,565 | |
Reinvested | | | 16,658 | | | | 155,303 | | | | 118 | | | | 797 | | | | 3,551 | | | | 32,952 | | | | 1 | | | | 2 | |
Repurchased | | | (241,369 | ) | | | (2,289,814 | ) | | | (61,166 | ) | | | (497,219 | ) | | | (108,866 | ) | | | (1,031,969 | ) | | | (83 | ) | | | (698 | ) |
| | | | | | | | | | | | | | | | | | | | | | | | | | | | | | | | |
Total | | | 2,691,650 | | | $ | 25,675,014 | | | | 1,465,592 | | | $ | 11,455,839 | | | | 747,784 | | | $ | 6,956,746 | | | | 57,498 | | | $ | 485,869 | |
| | | | | | | | | | | | | | | | | | | | | | | | | | | | | | | | |
| | | | |
Target 2040 Series: | | For the Year
Ended 10/31/10
Class C | | | For the Year
Ended 10/31/09
Class C | | | For the Year
Ended 10/31/10
Class I | | | For the Year
Ended 10/31/09
Class I | |
Sold | | | 36,243 | | | $ | 341,034 | | | | 50,606 | | | $ | 434,520 | | | | 84,367 | | | $ | 801,764 | | | | 49,478 | | | $ | 378,200 | |
Reinvested | | | 278 | | | | 2,566 | | | | 1 | | | | 2 | | | | 913 | | | | 8,537 | | | | 186 | | | | 1,266 | |
Repurchased | | | (123 | ) | | | (1,158 | ) | | | — | | | | — | | | | (29,792 | ) | | | (289,459 | ) | | | (4,920 | ) | | | (37,513 | ) |
| | | | | | | | | | | | | | | | | | | | | | | | | | | | | | | | |
Total | | | 36,398 | | | $ | 342,442 | | | | 50,607 | | | $ | 434,522 | | | | 55,488 | | | $ | 520,842 | | | | 44,744 | | | $ | 341,953 | |
| | | | | | | | | | | | | | | | | | | | | | | | | | | | | | | | |
| | | | |
Target 2050 Series: | | For the Year
Ended 10/31/10
Class K | | | For the Year
Ended 10/31/09
Class K | | | For the Year
Ended 10/31/10
Class R | | | For the Year
Ended 10/31/09
Class R | |
Sold | | | 1,409,255 | | | $ | 13,529,763 | | | | 138,367 | | | $ | 1,163,926 | | | | 167,914 | | | $ | 1,555,085 | | | | 68,090 | | | $ | 614,158 | |
Reinvested | | | 3,364 | | | | 31,422 | | | | — | * | | | 2 | | | | 1,003 | | | | 9,326 | | | | — | * | | | 2 | |
Repurchased | | | (39,869 | ) | | | (375,994 | ) | | | (20,070 | ) | | | (155,126 | ) | | | (25,066 | ) | | | (232,676 | ) | | | (1 | ) | | | (4 | ) |
| | | | | | | | | | | | | | | | | | | | | | | | | | | | | | | | |
Total | | | 1,372,750 | | | $ | 13,185,191 | | | | 118,297 | | | $ | 1,008,802 | | | | 143,851 | | | $ | 1,331,735 | | | | 68,089 | | | $ | 614,156 | |
| | | | | | | | | | | | | | | | | | | | | | | | | | | | | | | | |
39
Notes to Financial Statements
| 6. | CAPITAL STOCK TRANSACTIONS (continued) |
| | | | | | | | | | | | | | | | | | | | | | | | | | | | | | | | |
Target 2050 Series: | | For the Year
Ended 10/31/10
Class C | | | For the Year
Ended 10/31/09
Class C | | | For the Year
Ended 10/31/10
Class I | | | For the Year
Ended 10/31/09
Class I | |
Sold | | | 77,153 | | | $ | 722,745 | | | | 11,569 | | | $ | 90,462 | | | | 10,214 | | | $ | 94,790 | | | | 7,680 | | | $ | 58,108 | |
Reinvested | | | 123 | | | | 1,139 | | | | — | * | | | 2 | | | | 152 | | | | 1,421 | | | | 113 | | | | 760 | |
Repurchased | | | (4,884 | ) | | | (45,731 | ) | | | (308 | ) | | | (2,800 | ) | | | (6,646 | ) | | | (62,642 | ) | | | (1,324 | ) | | | (10,367 | ) |
| | | | | | | | | | | | | | | | | | | | | | | | | | | | | | | | |
Total | | | 72,392 | | | $ | 678,153 | | | | 11,261 | | | $ | 87,664 | | | | 3,720 | | | $ | 33,569 | | | | 6,469 | | | $ | 48,501 | |
| | | | | | | | | | | | | | | | | | | | | | | | | | | | | | | | |
At October 31, 2010, one omnibus account owned the following in Target Income Series and Target 2050 Series and two omnibus accounts owned the following in Target 2010 Series, Target 2020 Series, Target 2030 Series and Target 2040 Series:
| | | | | | | | | | | | |
Series | | Shares
Owned | | | Percentage
of Series
Shares
Outstanding | | | Value | |
Target Income Series | | | 3,927,300 | | | | 88.6 | % | | $ | 43,278,850 | |
Target 2010 Series | | | 2,414,083 | | | | 72.8 | % | | | 25,685,847 | |
Target 2020 Series | | | 5,691,588 | | | | 69.8 | % | | | 58,737,190 | |
Target 2030 Series | | | 6,017,999 | | | | 77.7 | % | | | 61,022,514 | |
Target 2040 Series | | | 3,846,648 | | | | 74.7 | % | | | 39,235,811 | |
Target 2050 Series | | | 1,258,491 | | | | 70.1 | % | | | 12,861,777 | |
Investment activities of these shareholders may have a material effect on the Series.
The underlying Series may trade in instruments including written and purchased options, forward foreign currency exchange contracts and futures contracts and other derivatives in the normal course of investing activities to assist in managing exposure to various market risks. The underlying Series may be subject to various elements of risk and may involve, to a varying degree, elements of risk in excess of the amounts recognized for financial statement purposes. These risks include: the risk that changes in the value of a derivative may not correlate perfectly with the underlying asset, rate or index, counterparty credit risk related to over the counter derivatives counterparties failure to perform under contract terms, liquidity risk related to the lack of a liquid market for these contracts allowing the fund to close out its position(s) and documentation risk relating to disagreement over contract terms.
| 8. | FEDERAL INCOME TAX INFORMATION |
The amount and characterization of certain income and capital gains to be distributed are determined in accordance with federal income tax regulations, which may differ from accounting principles generally accepted in the United States of America. These differences are primarily due to differing book and tax treatments in the timing of the recognition of net investment income or gains and losses, including losses deferred due to wash sales. Each Series may periodically make reclassifications among its capital accounts to reflect income and gains available for distribution (or available capital loss carryovers) under income tax regulations, without impacting the Series’ net asset value. Any such reclassifications are not reflected in the financial highlights.
40
Notes to Financial Statements
| 8. | FEDERAL INCOME TAX INFORMATION (continued) |
The tax character of distributions were as follows:
| | | | | | | | | | | | | | | | | | | | | | | | |
| | | Target
Income
Series | | | Target
2010
Series | | | Target
2020
Series | | | Target
2030
Series | | | Target
2040
Series | | | Target
2050
Series | |
Ordinary income (2010) | | $ | 969,933 | | | $ | 360,854 | | | $ | 913,781 | | | $ | 534,869 | | | $ | 199,683 | | | $ | 43,339 | |
Ordinary income (2009) | | $ | 1,899 | | | $ | 7,105 | | | $ | 21,799 | | | $ | 6,732 | | | $ | 2,067 | | | $ | 766 | |
At October 31, 2010, the tax basis of components of distributable earnings and the net unrealized appreciation based on the identified cost for federal income tax purposes were as follows:
| | | | | | | | | | | | | | | | | | | | | | | | |
| | | Target
Income
Series | | | Target
2010
Series | | | Target
2020
Series | | | Target
2030
Series | | | Target
2040
Series | | | Target
2050
Series | |
Cost for federal income tax purposes | | $ | 41,112,768 | | | $ | 30,952,598 | | | $ | 75,392,907 | | | $ | 70,800,235 | | | $ | 46,797,947 | | | $ | 17,047,299 | |
Unrealized appreciation | | $ | 7,637,335 | | | $ | 4,334,848 | | | $ | 8,776,558 | | | $ | 7,807,101 | | | $ | 5,753,127 | | | $ | 1,319,623 | |
Unrealized depreciation | | | (2,139 | ) | | | (3,138 | ) | | | (8,387 | ) | | | (13,610 | ) | | | (3,089 | ) | | | — | |
| | | | | | | | | | | | | | | | | | | | | | | | |
Net unrealized appreciation | | $ | 7,635,196 | | | $ | 4,331,710 | | | $ | 8,768,171 | | | $ | 7,793,491 | | | $ | 5,750,038 | | | $ | 1,319,623 | |
| | | | | | | | | | | | | | | | | | | | | | | | |
Undistributed ordinary income | | | 221,969 | | | | 51,932 | | | | 154,716 | | | | 1,962,937 | | | | 107,330 | | | | 35,358 | |
Undistributed long-term capital gains | | | 384,441 | | | | 664,338 | | | | 2,798,127 | | | | 490,331 | | | | 424,720 | | | | 5,963 | |
Capital loss carryover | | | — | | | | — | | | | — | | | | — | | | | 4,179 | | | | 3,034 | |
At October 31, 2010, Target 2040 Series and Target 2050 Series had capital loss carryovers of $4,179 and $3,034, respectively, which are subject to limitations under Section 382-384 of The Internal Revenue Code, and are available to the extent allowed by tax law to offset future net capital gains, if any, which will expire on October 31, 2017 for Target 2040 Series and October 31, 2017 for Target 2050 Series.
Target 2040 Series and Target 2050 Series utilized $7,173 and $675, respectively, in capital loss carryovers in the current year.
41
Report of Independent Registered Public Accounting Firm
To the Board of Directors of Manning & Napier Fund, Inc. and Shareholders of – Target Income Series, Target 2010 Series, Target 2020 Series, Target 2030 Series, Target 2040 Series and Target 2050 Series:
In our opinion, the accompanying statements of assets and liabilities and the related statements of operations and of changes in net assets and the financial highlights present fairly, in all material respects, the financial position of Target Income Series, Target 2010 Series, Target 2020 Series, Target 2030 Series, Target 2040 Series and Target 2050 Series (each a series of Manning & Napier Fund, Inc., hereafter collectively referred to as the “Series”) at October 31, 2010, and the results of each of their operations, the changes in each of their net assets and the financial highlights for each of the periods presented, in conformity with accounting principles generally accepted in the United States of America. These financial statements and financial highlights (hereafter referred to as “financial statements”) are the responsibility of the Series’ management. Our responsibility is to express an opinion on these financial statements based on our audits. We conducted our audits of these financial statements in accordance with the standards of the Public Company Accounting Oversight Board (United States). Those standards require that we plan and perform the audit to obtain reasonable assurance about whether the financial statements are free of material misstatement. An audit includes examining, on a test basis, evidence supporting the amounts and disclosures in the financial statements, assessing the accounting principles used and significant estimates made by management, and evaluating the overall financial statement presentation. We believe that our audits, which included confirmation of securities at October 31, 2010 by correspondence with the transfer agent, provide a reasonable basis for our opinion.

New York, New York
December 21, 2010
42
Supplemental Tax Information (unaudited)
All designations are based on financial information available as of the date of this annual report and, accordingly are subject to change.
For federal income tax purposes, each of the Series designates for the current fiscal year the amount disclosed below or, if different, the maximum amount allowable under the tax law, as qualified dividend income (“QDI”).
| | | | |
Series | | QDI | |
Target Income Series | | $ | 163,623 | |
Target 2010 Series | | | 183,495 | |
Target 2020 Series | | | 655,424 | |
Target 2030 Series | | | 185,757 | |
Target 2040 Series | | | 198,647 | |
Target 2050 Series | | | 43,339 | |
For corporate shareholders, the percentage of investment income (dividend income plus short-term gain, if any) that qualifies for the dividends received deduction (DRD) for the current fiscal year is as follows:
| | | | |
Series | | DRD% | |
Target Income Series | | | 15.66 | % |
Target 2010 Series | | | 32.80 | % |
Target 2020 Series | | | 43.83 | % |
Target 2030 Series | | | 16.95 | % |
Target 2040 Series | | | 73.20 | % |
Target 2050 Series | | | 60.75 | % |
43
Directors’ and Officers’ Information (unaudited)
The Statement of Additional Information provides additional information about the Fund’s directors and officers and can be obtained without charge by calling 1-800-466-3863, at www.manningnapieradvisors.com, or on the EDGAR Database on the SEC Internet web site (http:// www.sec.gov). The following chart shows certain information about the Fund’s officers and directors, including their principal occupations during the last five years. Unless specific dates are provided, the individuals have held the listed positions for longer than five years.
INTERESTED DIRECTOR/OFFICER
| | |
| Name: | | B. Reuben Auspitz* |
| Address: | | 290 Woodcliff Drive Fairport, NY 14450 |
| Age: | | 63 |
| Current Position(s) Held with Fund: | | Principal Executive Officer, President, Chairman & Director |
| Term of Office1 & Length of Time Served: | | Indefinite - Director since 1984; Vice President 1984 - 2003; President since 2004; Principal Executive Officer since 2002 |
| Principal Occupation(s) During Past 5 Years: | | Executive Vice President; Executive Group Member**; Chief Compliance Officer since 2004; Vice Chairman since June 2010; Co-Executive Director from 2003-2010 - Manning & Napier Advisors, Inc. President; Director - Manning & Napier Investor Services, Inc. Holds or has held one or more of the following titles for various subsidiaries and affiliates: President, Vice President, Director, Chairman, Treasurer, Chief Compliance Officer or Member. |
| Number of Portfolios Overseen within Fund Complex: | | 29 |
| Other Directorships Held Outside Fund Complex: | | N/A |
| |
| INDEPENDENT DIRECTORS | | |
| |
| Name: | | Stephen B. Ashley |
| Address: | | 290 Woodcliff Drive Fairport, NY 14450 |
| Age: | | 70 |
| Current Position(s) Held with Fund: | | Director, Audit Committee Member, Governance & Nominating Committee Member |
| Term of Office & Length of Time Served: | | Indefinite - Since 1996 |
| Principal Occupation(s) During Past 5 Years: | | Chairman, Director, President & Chief Executive Officer, The Ashley Group (property management and investment). Chairman (non-executive) 2004-2008; Director 1995-2008 - Fannie Mae (mortgage) |
| Number of Portfolios Overseen within Fund Complex: | | 29 |
| Other Directorships Held Outside Fund Complex: | | The Ashley Group (1995-2008) Genesee Corporation (1987-2007) |
| |
| Name: | | Peter L. Faber |
| Address: | | 290 Woodcliff Drive Fairport, NY 14450 |
| Age: | | 72 |
| Current Position(s) Held with Fund: | | Director, Governance & Nominating Committee Member |
| Term of Office & Length of Time Served: | | Indefinite - Since 1987 |
| Principal Occupation(s) During Past 5 Years: | | Senior Counsel since 2006, Partner (1995 - 2006) - McDermott, Will & Emery LLP (law firm) |
| Number of Portfolios Overseen within Fund Complex: | | 29 |
| Other Directorships Held Outside Fund Complex: | | Partnership for New York City, Inc. (non-profit) New York Collegium (non-profit) Boston Early Music Festival (non-profit) |
44
Directors’ and Officers’ Information (unaudited)
INDEPENDENT DIRECTORS (continued)
| | |
| Name: | | Harris H. Rusitzky |
| Address: | | 290 Woodcliff Drive Fairport, NY 14450 |
| Age: | | 75 |
| Current Position(s) Held with Fund: | | Director, Audit Committee Member, Governance & Nominating Committee Member |
| Term of Office & Length of Time Served: | | Indefinite - Since 1985 |
| Principal Occupation(s) During Past 5 Years: | | President, The Greening Group (business consultants) since 1994; Partner, The Restaurant Group (restaurants) since 2006 |
| Number of Portfolios Overseen within Fund Complex: | | 29 |
| Other Directorships Held Outside Fund Complex: | | N/A |
| |
| Name: | | Paul A. Brooke |
| Address: | | 290 Woodcliff Drive Fairport, NY 14450 |
| Age: | | 64 |
| Current Position(s) Held with Fund: | | Director, Audit Committee Member, Governance & Nominating Committee Member |
| Term of Office & Length of Time Served: | | Indefinite - Since 2007 |
| Principal Occupation(s) During Past 5 Years: | | Chairman & CEO, Alsius Corp. (investments); Managing Member, PMSV Holdings LLC (investments) |
| Number of Portfolios Overseen within Fund Complex: | | 29 |
| Other Directorships Held Outside Fund Complex: | | Incyte Corp. (2000-present) ViroPharma, Inc. (2000-present) HLTH Corp. (2000-present) Cheyne Capital International (2000-present) MPM Bio-equities (2000-present) GMP Companies (2000-present) HoustonPharma (2000-present) |
| |
| Name: | | Richard M. Hurwitz |
| Address: | | 290 Woodcliff Drive Fairport, NY 14450 |
| Age: | | 47 |
| Current Position(s) Held with Fund: | | Director, Audit Committee Member, Governance & Nominating Committee Member |
| Term of Office & Length of Time Served: | | Indefinite - Since 2009 |
| Principal Occupation(s) During Past 5 Years: | | Chief Executive Officer, Pictometry International Corp. since August 2010 (provider of georeferenced, aerial image libraries and related software) Managing Partner (2006-July 2010) - Aegis Investment Partners, LLC (investments); Founder and Managing Partner (2004-2005) - Village Markets, LLC (groceries) |
| Number of Portfolios Overseen within Fund Complex: | | 29 |
| Other Directorships Held Outside Fund Complex: | | Pictometry International Corp. (2000-2010) Pioneering Technologies (2006-2009) Vensearch Capital Corp. (2003-2007) |
45
Directors’ and Officers’ Information (unaudited)
OFFICERS
| | |
| Name: | | Jeffrey S. Coons, Ph.D., CFA |
| Address: | | 290 Woodcliff Drive Fairport, NY 14450 |
| Age: | | 47 |
| Current Position(s) Held with Fund: | | Vice President |
| Term of Office1 & Length of Time Served: | | Since 2004 |
| Principal Occupation(s) During Past 5 Years: | | President since 2010, Co-Director of Research since 2002, Executive Group Member** since 2003, - Manning & Napier Advisors, Inc. Holds one or more of the following titles for various subsidiaries and affiliates: President, Director, Treasurer or Senior Trust Officer. |
| Number of Portfolios Overseen within Fund Complex: | | 29 |
| Other Directorships Held Outside Fund Complex: | | N/A |
| |
| Name: | | Beth Galusha |
| Address: | | 290 Woodcliff Drive Fairport, NY 14450 |
| Age: | | 49 |
| Current Position(s) Held with Fund: | | Assistant Chief Financial Officer |
| Term of Office1 & Length of Time Served: | | Assistant Chief Financial Officer since 2010 |
| Principal Occupation(s) During Past 5 Years: | | Chief Financial Officer and Treasurer, Manning & Napier Advisors, Inc. Holds one or more of the following titles for various affiliates: Chief Financial Officer, Director, or Treasurer |
| Number of Portfolios Overseen within Fund Complex: | | 29 |
| Other Directorships Held Outside Fund Complex: | | N/A |
| |
| Name: | | Christine Glavin |
| Address: | | 290 Woodcliff Drive Fairport, NY 14450 |
| Age: | | 44 |
| Current Position(s) Held with Fund: | | Principal Financial Officer, Chief Financial Officer |
| Term of Office1 & Length of Time Served: | | Principal Financial Officer since 2002; Chief Financial Officer since 2001 |
| Principal Occupation(s) During Past 5 Years: | | Fund Reporting Manager, Manning & Napier Advisors, Inc. since 1997 |
| Number of Portfolios Overseen within Fund Complex: | | 29 |
| Other Directorships Held Outside Fund Complex: | | N/A |
| |
| Name: | | Jodi L. Hedberg |
| Address: | | 290 Woodcliff Drive Fairport, NY 14450 |
| Age: | | 42 |
| Current Position(s) Held with Fund: | | Corporate Secretary, Chief Compliance Officer, Anti-Money Laundering Compliance Officer |
| Term of Office1 & Length of Time Served: | | Corporate Secretary since 1997; Chief Compliance Officer since 2004 |
| Principal Occupation(s) During Past 5 Years: | | Director of Compliance, Manning & Napier Advisors, Inc. and affiliates since 1990 (title change in 2005 from Compliance Manager to Director of Compliance); Corporate Secretary, Manning & Napier Investor Services, Inc. since 2006 |
| Number of Portfolios Overseen within Fund Complex: | | 29 |
| Other Directorships Held Outside Fund Complex: | | N/A |
| * | Interested Director, within the meaning of the Investment Company Act of 1940 by reason of his position with the Fund’s investment advisor and distributor. Mr. Auspitz serves as the Executive Vice President and Director, Manning & Napier Advisors, Inc. and President and Director, Manning & Napier Investor Services, Inc., the Fund’s distributor. |
| ** | Prior to June 2010, the Executive Group, consisting of senior executive employee-owners, performed the duties of the Office of the Chief Executive of the Advisor. |
Effective June 2010, the Executive Group serves as an advisory board to the Chief Executive Officer.
| 1 | The term of office for President, Vice President, Chief Financial Officer, and Corporate Secretary is one year and until their respective successors are chosen and qualified. All other officers’ terms are indefinite. |
46
Literature Requests (unaudited)
Proxy Voting Policies and Procedures
A description of the policies and procedures that the Fund uses to determine how to vote proxies relating to portfolio securities is available, without charge, upon request:
| | |
| By phone | | 1-800-466-3863 |
On the Securities and Exchange Commission’s (SEC) web site | | http://www.sec.gov |
Proxy Voting Record
Information regarding how the Fund voted proxies relating to portfolio securities during the most recent 12-month period ended June 30th is available, without charge, upon request:
| | |
| By phone | | 1-800-466-3863 |
| On the SEC’s web site | | http://www.sec.gov |
Quarterly Portfolio Holdings
The Series’ complete schedule of portfolio holdings for the 1st and 3rd quarters of each fiscal year are provided on Form N-Q, and are available, without charge, upon request:
| | |
| By phone | | 1-800-466-3863 |
| On the SEC’s web site | | http://www.sec.gov |
The Series’ Form N-Q may be reviewed and copied at the SEC’s Public Reference Room in Washington, D.C. Information on the operation of the Public Reference Room may be obtained by calling 1-800-SEC-0330.
Prospectus and Statement of Additional Information (SAI)
The prospectus and SAI provide additional information about each Series, including charges, expenses and risks. These documents are available, without charge, upon request:
| | |
| By phone | | 1-800-466-3863 |
| On the SEC’s web site | | http://www.sec.gov |
| On the Advisor’s web site | | http://www.manningnapieradvisors.com |
Additional information available at www.manningnapieradvisors.com
| 1. | Fund Holdings - Month-End |
| 2. | Fund Holdings - Quarter-End |
| 3. | Shareholder Report - Annual |
| 4. | Shareholder Report - Semi-Annual |
MNTGT-10/10-AR

Management Discussion and Analysis (unaudited)
Dear Shareholders:
The twelve months ending October 31, 2010 were characterized by well-defined swings in investor sentiment. Optimism fueled strong market returns during the fourth quarter of 2009 and through much of the first quarter of 2010, as positive economic releases led investors to believe in the potential for a robust U.S. recovery. However, more negative economic releases into May and June of 2010, coupled with sovereign debt concerns in Europe, led to a dramatic swing in sentiment during the second quarter, with stock markets suffering notable losses. While volatility remained during the third quarter of 2010, September was a particularly strong month, which helped push market indexes into positive territory on a calendar year-to-date basis.
Despite several ups and downs over the past year, the markets made choppy progress. For the twelve months ended October 2010, the Russell 3000 Index gained 18.34%, aided by the rally that began in September. Growth stocks generally exceeded value stocks, with the Russell 1000 Value Index earning 15.71% over the twelve months ending October 31, 2010, and the Russell 1000 Growth Index gaining 19.65%. The Dividend Focus Series also posted double-digit returns over the past year, although at 12.32% its results trail both the S&P 500 and the Russell 1000 Value Indices.
The Dividend Focus Series uses a quantitative investment approach to target companies that possess high dividends, high free cash flow, and a low risk of financial distress. With a quality bias, the Series seeks to provide competitive equity returns, as well as capital preservation during market downturns. Given this risk aversion, the Series has less than a 1% allocation to the Financial sector, which continues to suffer from regulatory uncertainty and macroeconomic challenges such as indebted consumers, persistently high unemployment, a fragile housing market, and continued loan losses. This near avoidance of financial companies aided performance relative to the benchmark over the past year, with the exception of during the market rally in early 2010.
As of October 2010, the Series had substantial exposure to the Consumer Staples and Health Care sectors, which contain quality companies with solid balance sheets and an established history of paying dividends. The higher allocation to Consumer Staples was a positive contributor to the Series’ relative performance for most of the last year, particularly in the first half of 2010. While this allocation slightly detracted from results relative to the benchmark over the third quarter, specific selections in the Consumer Staples sector benefited relative performance during that time. Meanwhile, the Dividend Focus Series also had an overweight to the Energy Sector, although individual holdings in this sector hurt results relative to the benchmark throughout much of the past year.
While the markets were volatile over the past twelve months, the outlook for the U.S. economy did not change materially over the past year. Despite swings in positive and negative sentiment, Manning & Napier continues to see a slow growth environment as the economy works through extensive consumer and government debt levels. In this macroeconomic reality of slow growth, a focus on quality companies remains important for identifying investment opportunities.
As always, we appreciate your business.
Sincerely,
Manning & Napier Advisors, Inc.
1
Performance Update as of October 31, 2010 (unaudited)
| | | | | | | | |
| | | Average Annual Total Returns
As of October 31, 2010 | |
| | | One
Year | | | Since
Inception1 | |
Manning & Napier Fund, Inc. - Dividend Focus Series2 | | | 12.32 | % | | | 14.20 | % |
Russell 1000® Value Index3 | | | 15.71 | % | | | 12.42 | % |
Standard & Poor’s (S&P) 500 Total Return Index3 | | | 16.53 | % | | | 15.48 | % |
The following graph compares the value of a $10,000 investment in the Manning & Napier Fund, Inc. - Dividend Focus Series from its inception1 (November 7, 2008) to present (October 31, 2010) to the Russell 1000® Value Index and the S&P 500 Total Return Index.
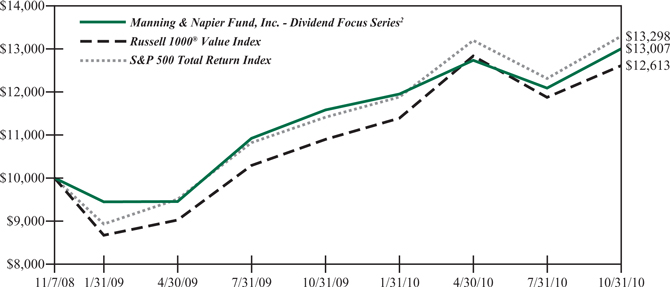
| 1 | Performance numbers for the Series and Index are calculated from November 7, 2008, the Series’ inception date. |
| 2 | The Series’ performance does not reflect the deduction of taxes that a shareholder would pay on fund distributions or the redemption of shares. The Series’ performance is historical and may not be indicative of future results. The performance returns shown are inclusive of the net expense ratio of the Series. For the year ended October 31, 2010, this annualized net expense ratio was 0.60%. The annualized gross expense ratio, which does not account for any voluntary or contractual waivers currently in effect, was 5.61% for the year ended October 31, 2010. |
| 3 | The Russell 1000® Value Index is an unmanaged, market capitalization-weighted index consisting of those Russell 1000® companies with lower price-to-book ratios and lower forecasted growth values. The Index returns are based on a market capitalization weighted average of relative price changes of the component stocks plus dividends whose reinvestments are compounded daily. The S&P 500 Total Return Index is an unmanaged capitalization-weighted measure of 500 widely held common stocks listed on the New York Stock Exchange, American Stock Exchange and the Over-the-Counter market. The Index returns assume daily reinvestment of dividends. Both Indices’ returns, unlike Series returns, do not reflect any fees or expenses. |
2
Shareholder Expense Example (unaudited)
As a shareholder of the Series, you may incur two types of costs: (1) transaction costs, including potential wire charges on redemptions and (2) ongoing costs, including management fees and other Series expenses. This example is intended to help you understand your ongoing costs (in dollars) of investing in the Series and to compare these costs with the ongoing costs of investing in other mutual funds.
The example is based on an investment of $1,000 invested at the beginning of the period and held for the entire period (May 1, 2010 to October 31, 2010).
Actual Expenses
The first line of the table below provides information about actual account values and actual expenses. You may use the information in this line, together with the amount you invested, to estimate the expenses that you paid over the period. Simply divide your account value by $1,000 (for example, an $8,600 account value divided by $1,000 = 8.6), then multiply the result by the number in the first line under the heading entitled “Expenses Paid During Period” to estimate the expenses you paid on your account during this period.
Hypothetical Example for Comparison Purposes
The second line of the table below provides information about hypothetical account values and hypothetical expenses based on the Series’ actual expense ratio and an assumed rate of return of 5% per year before expenses, which is not the Series’ actual return. The hypothetical account values and expenses may not be used to estimate the actual ending account balance or expenses you paid during the period. You may use this information to compare the ongoing costs of investing in the Series and other funds. To do so, compare this 5% hypothetical example with the 5% hypothetical examples that appear in the shareholder reports of the other funds.
Please note that the expenses shown in the table are meant to highlight your ongoing costs only and do not reflect any transaction costs. Therefore, the second line of the table is useful in comparing ongoing costs only, and will not help you determine the relative total costs of owning different funds. In addition, if these transaction costs were included, your costs would have been higher.
| | | | | | | | | | | | |
| | | Beginning
Account Value
5/1/10 | | | Ending
Account Value
10/31/10 | | | Expenses Paid
During Period*
5/1/10-10/31/10 | |
Actual | | $ | 1,000.00 | | | $ | 1,021.00 | | | $ | 3.06 | |
Hypothetical
(5% return before expenses) | | $ | 1,000.00 | | | $ | 1,022.18 | | | $ | 3.06 | |
| * | Expenses are equal to the Series’ annualized expense ratio (for the six-month period) of 0.60%, multiplied by the average account value over the period, multiplied by 184/365 (to reflect the one-half year period). Expenses are based on the most recent fiscal half year; therefore, the expense ratio stated above may differ from the expense ratio stated in the financial highlights, which is based on one-year data. The Series’ total return would have been lower had certain expenses not been waived during the period. |
3
Portfolio Composition as of October 31, 2010 (unaudited)
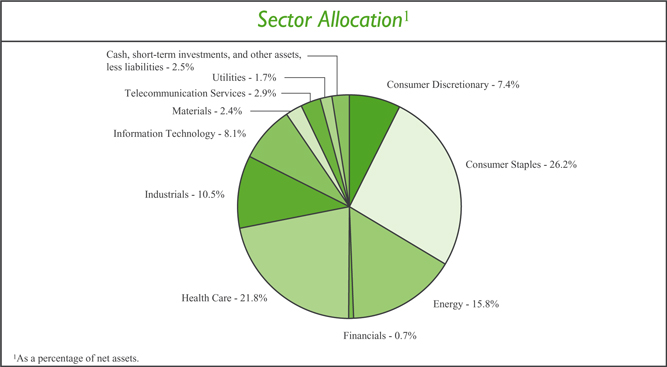
4
Investment Portfolio - October 31, 2010
| | | | | | | | |
| | | Shares | | | Value
(Note 2) | |
| | |
COMMON STOCKS - 97.5% | | | | | | | | |
| | |
Consumer Discretionary - 7.4% | | | | | | | | |
Distributors - 0.2% | | | | | | | | |
Genuine Parts Co. | | | 114 | | | $ | 5,456 | |
| | | | | | | | |
Hotels, Restaurants & Leisure - 2.8% | | | | | | | | |
Darden Restaurants, Inc. | | | 57 | | | | 2,605 | |
McDonald’s Corp. | | | 792 | | | | 61,594 | |
Yum! Brands, Inc. | | | 194 | | | | 9,615 | |
| | | | | | | | |
| | | | | | | 73,814 | |
| | | | | | | | |
Household Durables - 0.4% | | | | | | | | |
Garmin Ltd. | | | 87 | | | | 2,857 | |
Leggett & Platt, Inc. | | | 109 | | | | 2,222 | |
Tupperware Brands Corp. | | | 22 | | | | 986 | |
Whirlpool Corp. | | | 39 | | | | 2,957 | |
| | | | | | | | |
| | | | | | | 9,022 | |
| | | | | | | | |
Leisure Equipment & Products - 0.3% | | | | | | | | |
Hasbro, Inc. | | | 54 | | | | 2,497 | |
Mattel, Inc. | | | 263 | | | | 6,136 | |
| | | | | | | | |
| | | | | | | 8,633 | |
| | | | | | | | |
Media - 1.6% | | | | | | | | |
The McGraw-Hill Companies, Inc. | | | 241 | | | | 9,074 | |
Omnicom Group, Inc. | | | 135 | | | | 5,935 | |
Pearson plc - ADR (United Kingdom) | | | 444 | | | | 6,838 | |
Thomson Reuters Corp. | | | 538 | | | | 20,578 | |
| | | | | | | | |
| | | | | | | 42,425 | |
| | | | | | | | |
Specialty Retail - 1.9% | | | | | | | | |
The Home Depot, Inc. | | | 1,257 | | | | 38,816 | |
Limited Brands, Inc. | | | 242 | | | | 7,112 | |
The Sherwin-Williams Co. | | | 42 | | | | 3,065 | |
| | | | | | | | |
| | | | | | | 48,993 | |
| | | | | | | | |
Textiles, Apparel & Luxury Goods - 0.2% | | | | | | | | |
VF Corp. | | | 76 | | | | 6,326 | |
| | | | | | | | |
Total Consumer Discretionary | | | | | | | 194,669 | |
| | | | | | | | |
Consumer Staples - 26.2% | | | | | | | | |
Beverages - 9.2% | | | | | | | | |
Brown-Forman Corp. - Class B | | | 58 | | | | 3,527 | |
The Coca-Cola Co. | | | 1,799 | | | | 110,314 | |
Diageo plc - ADR (United Kingdom) | | | 444 | | | | 32,856 | |
Embotelladora Andina S.A. - ADR - Class B (Chile) | | | 53 | | | | 1,552 | |
Molson Coors Brewing Co. - Class B | | | 82 | | | | 3,873 | |
| | | | |
| 5 | | The accompanying notes are an integral part of the financial statements. | | |
Investment Portfolio - October 31, 2010
| | | | | | | | |
| | | Shares | | | Value
(Note 2) | |
| | |
COMMON STOCKS (continued) | | | | | | | | |
| | |
Consumer Staples (continued) | | | | | | | | |
Beverages (continued) | | | | | | | | |
PepsiCo, Inc. | | | 1,403 | | | $ | 91,616 | |
| | | | | | | | |
| | | | | | | 243,738 | |
| | | | | | | | |
Food & Staples Retailing - 3.3% | | | | | | | | |
Delhaize Group S.A. - ADR (Belgium) | | | 39 | | | | 2,748 | |
SYSCO Corp. | | | 433 | | | | 12,756 | |
Wal-Mart Stores, Inc. | | | 1,329 | | | | 71,992 | |
| | | | | | | | |
| | | | | | | 87,496 | |
| | | | | | | | |
Food Products - 4.5% | | | | | | | | |
Archer-Daniels-Midland Co. | | | 270 | | | | 8,996 | |
Campbell Soup Co. | | | 253 | | | | 9,171 | |
General Mills, Inc. | | | 457 | | | | 17,156 | |
H.J. Heinz Co. | | | 241 | | | | 11,836 | |
The Hershey Co. | | | 166 | | | | 8,215 | |
Hormel Foods Corp. | | | 58 | | | | 2,663 | |
The J.M. Smucker Co. | | | 70 | | | | 4,500 | |
Kellogg Co. | | | 278 | | | | 13,972 | |
Kraft Foods, Inc. - Class A | | | 954 | | | | 30,786 | |
McCormick & Co., Inc. - NVS | | | 85 | | | | 3,759 | |
Sara Lee Corp. | | | 518 | | | | 7,423 | |
| | | | | | | | |
| | | | | | | 118,477 | |
| | | | | | | | |
Household Products - 4.4% | | | | | | | | |
Colgate-Palmolive Co. | | | 202 | | | | 15,578 | |
Kimberly-Clark Corp. | | | 318 | | | | 20,142 | |
The Procter & Gamble Co. | | | 1,290 | | | | 82,006 | |
| | | | | | | | |
| | | | | | | 117,726 | |
| | | | | | | | |
Personal Products - 0.3% | | | | | | | | |
Avon Products, Inc. | | | 228 | | | | 6,942 | |
| | | | | | | | |
Tobacco - 4.5% | | | | | | | | |
Altria Group, Inc. | | | 1,534 | | | | 38,994 | |
Lorillard, Inc. | | | 87 | | | | 7,425 | |
Philip Morris International, Inc. | | | 1,105 | | | | 64,643 | |
Reynolds American, Inc. | | | 117 | | | | 7,593 | |
| | | | | | | | |
| | | | | | | 118,655 | |
| | | | | | | | |
Total Consumer Staples | | | | | | | 693,034 | |
| | | | | | | | |
Energy - 15.8% | | | | | | | | |
Energy Equipment & Services - 0.5% | | | | | | | | |
Tenaris S.A. - ADR (Luxembourg) | | | 335 | | | | 13,879 | |
| | | | | | | | |
| | | | |
| | The accompanying notes are an integral part of the financial statements. | | 6 |
Investment Portfolio - October 31, 2010
| | | | | | | | |
| | | Shares | | | Value
(Note 2) | |
| | |
COMMON STOCKS (continued) | | | | | | | | |
| | |
Energy (continued) | | | | | | | | |
Oil, Gas & Consumable Fuels - 15.3% | | | | | | | | |
Chevron Corp. | | | 1,278 | | | $ | 105,576 | |
ConocoPhillips | | | 1,080 | | | | 64,152 | |
Exxon Mobil Corp. | | | 1,077 | | | | 71,588 | |
Repsol YPF S.A. - ADR (Spain) | | | 851 | | | | 23,564 | |
Sasol Ltd. - ADR (South Africa) | | | 347 | | | | 15,702 | |
Statoil ASA - ADR (Norway) | | | 1,322 | | | | 28,859 | |
Total S.A. - ADR (France) | | | 1,719 | | | | 93,651 | |
| | | | | | | | |
| | | | | | | 403,092 | |
| | | | | | | | |
Total Energy | | | | | | | 416,971 | |
| | | | | | | | |
Financials - 0.7% | | | | | | | | |
Capital Markets - 0.2% | | | | | | | | |
Eaton Vance Corp. | | | 47 | | | | 1,352 | |
Federated Investors, Inc. - Class B | | | 75 | | | | 1,869 | |
Waddell & Reed Financial, Inc. - Class A | | | 46 | | | | 1,337 | |
| | | | | | | | |
| | | | | | | 4,558 | |
| | | | | | | | |
Insurance - 0.4% | | | | | | | | |
Marsh & McLennan Companies, Inc. | | | 389 | | | | 9,717 | |
| | | | | | | | |
Real Estate Investment Trusts (REITS) - 0.1% | | | | | | | | |
Plum Creek Timber Co., Inc. | | | 103 | | | | 3,794 | |
| | | | | | | | |
Total Financials | | | | | | | 18,069 | |
| | | | | | | | |
Health Care - 21.8% | | | | | | | | |
Health Care Equipment & Supplies - 0.9% | | | | | | | | |
Baxter International, Inc. | | | 274 | | | | 13,947 | |
Becton, Dickinson and Co. | | | 102 | | | | 7,703 | |
Teleflex, Inc. | | | 14 | | | | 780 | |
| | | | | | | | |
| | | | | | | 22,430 | |
| | | | | | | | |
Health Care Providers & Services - 0.3% | | | | | | | | |
Fresenius Medical Care AG & Co. KGaA - ADR (Germany) | | | 127 | | | | 8,082 | |
| | | | | | | | |
Life Sciences Tools & Services - 0.0%** | | | | | | | | |
Pharmaceutical Product Development, Inc. | | | 45 | | | | 1,161 | |
| | | | | | | | |
Pharmaceuticals - 20.6% | | | | | | | | |
Abbott Laboratories | | | 1,104 | | | | 56,657 | |
AstraZeneca plc - ADR (United Kingdom) | | | 1,099 | | | | 55,456 | |
Bristol-Myers Squibb Co. | | | 1,331 | | | | 35,804 | |
Eli Lilly & Co. | | | 868 | | | | 30,554 | |
GlaxoSmithKline plc - ADR (United Kingdom) | | | 2,192 | | | | 85,576 | |
Johnson & Johnson | | | 1,617 | | | | 102,954 | |
Merck & Co., Inc. | | | 2,157 | | | | 78,256 | |
Pfizer, Inc. | | | 5,585 | | | | 97,179 | |
| | | | |
| 7 | | The accompanying notes are an integral part of the financial statements. | | |
Investment Portfolio - October 31, 2010
| | | | | | | | |
| | | Shares | | | Value
(Note 2) | |
| | |
COMMON STOCKS (continued) | | | | | | | | |
| | |
Health Care (continued) | | | | | | | | |
Pharmaceuticals (continued) | | | | | | | | |
Valeant Pharmaceuticals International, Inc. - ADR (Canada) | | | 79 | | | $ | 2,181 | |
| | | | | | | | |
| | | | | | | 544,617 | |
| | | | | | | | |
Total Health Care | | | | | | | 576,290 | |
| | | | | | | | |
Industrials - 10.5% | | | | | | | | |
Aerospace & Defense - 3.6% | | | | | | | | |
Elbit Systems Ltd. - ADR (Israel) | | | 15 | | | | 812 | |
General Dynamics Corp. | | | 164 | | | | 11,171 | |
Honeywell International, Inc. | | | 418 | | | | 19,692 | |
ITT Corp. | | | 74 | | | | 3,492 | |
Lockheed Martin Corp. | | | 161 | | | | 11,478 | |
Northrop Grumman Corp. | | | 177 | | | | 11,188 | |
Raytheon Co. | | | 159 | | | | 7,327 | |
United Technologies Corp. | | | 397 | | | | 29,684 | |
| | | | | | | | |
| | | | | | | 94,844 | |
| | | | | | | | |
Building Products - 0.1% | | | | | | | | |
Masco Corp. | | | 249 | | | | 2,654 | |
| | | | | | | | |
Commercial Services & Supplies - 0.8% | | | | | | | | |
Avery Dennison Corp. | | | 76 | | | | 2,763 | |
Pitney Bowes, Inc. | | | 154 | | | | 3,379 | |
RR Donnelley & Sons Co. | | | 152 | | | | 2,804 | |
Waste Management, Inc. | | | 361 | | | | 12,895 | |
| | | | | | | | |
| | | | | | | 21,841 | |
| | | | | | | | |
Electrical Equipment - 2.2% | | | | | | | | |
ABB Ltd. (Asea Brown Boveri) - ADR (Switzerland)* | | | 991 | | | | 20,504 | |
Cooper Industries plc - Class A (Ireland) | | | 119 | | | | 6,238 | |
Emerson Electric Co. | | | 554 | | | | 30,414 | |
Hubbell, Inc. - Class B | | | 38 | | | | 2,053 | |
| | | | | | | | |
| | | | | | | 59,209 | |
| | | | | | | | |
Industrial Conglomerates - 2.7% | | | | | | | | |
3M Co. | | | 516 | | | | 43,458 | |
Koninklijke Philips Electronics N.V. - NY Shares (Netherlands) | | | 569 | | | | 17,326 | |
Tyco International Ltd. (Switzerland) | | | 246 | | | | 9,417 | |
| | | | | | | | |
| | | | | | | 70,201 | |
| | | | | | | | |
Machinery - 1.0% | | | | | | | | |
Dover Corp. | | | 103 | | | | 5,469 | |
Illinois Tool Works, Inc. | | | 389 | | | | 17,778 | |
Pentair, Inc. | | | 59 | | | | 1,931 | |
| | | | |
| | The accompanying notes are an integral part of the financial statements. | | 8 |
Investment Portfolio - October 31, 2010
| | | | | | | | |
| | | Shares | | | Value
(Note 2) | |
| | |
COMMON STOCKS (continued) | | | | | | | | |
| | |
Industrials (continued) | | | | | | | | |
Machinery (continued) | | | | | | | | |
Snap-On, Inc. | | | 36 | | | $ | 1,836 | |
| | | | | | | | |
| | | | | | | 27,014 | |
| | | | | | | | |
Professional Services - 0.1% | | | | | | | | |
Dun & Bradstreet Corp. | | | 18 | | | | 1,339 | |
| | | | | | | | |
Total Industrials | | | | | | | 277,102 | |
| | | | | | | | |
Information Technology - 8.1% | | | | | | | | |
Communications Equipment - 1.3% | | | | | | | | |
Harris Corp. | | | 51 | | | | 2,305 | |
Nokia Corp. - ADR (Finland) | | | 1,710 | | | | 18,263 | |
Telefonaktiebolaget LM Ericsson - ADR (Sweden) | | | 1,284 | | | | 14,111 | |
| | | | | | | | |
| | | | | | | 34,679 | |
| | | | | | | | |
IT Services - 1.0% | | | | | | | | |
Automatic Data Processing, Inc. | | | 376 | | | | 16,702 | |
Broadridge Financial Solutions, Inc. | | | 55 | | | | 1,210 | |
Paychex, Inc. | | | 274 | | | | 7,590 | |
| | | | | | | | |
| | | | | | | 25,502 | |
| | | | | | | | |
Semiconductors & Semiconductor Equipment - 5.8% | | | | | | | | |
Intel Corp. | | | 4,469 | | | | 89,693 | |
Linear Technology Corp. | | | 162 | | | | 5,221 | |
National Semiconductor Corp. | | | 103 | | | | 1,411 | |
Taiwan Semiconductor Manufacturing Co. Ltd. - ADR (Taiwan) | | | 3,807 | | | | 41,534 | |
Texas Instruments, Inc. | | | 533 | | | | 15,761 | |
| | | | | | | | |
| | | | | | | 153,620 | |
| | | | | | | | |
Software - 0.0%** | | | | | | | | |
Konami Corp. - ADR (Japan) | | | 58 | | | | 1,013 | |
| | | | | | | | |
Total Information Technology | | | | | | | 214,814 | |
| | | | | | | | |
Materials - 2.4% | | | | | | | | |
Chemicals - 1.8% | | | | | | | | |
E.I. du Pont de Nemours & Co. | | | 673 | | | | 31,819 | |
International Flavors & Fragrances, Inc. | | | 49 | | | | 2,458 | |
PPG Industries, Inc. | | | 120 | | | | 9,204 | |
RPM International, Inc. | | | 66 | | | | 1,367 | |
Valspar Corp. | | | 39 | | | | 1,252 | |
| | | | | | | | |
| | | | | | | 46,100 | |
| | | | | | | | |
Construction Materials - 0.2% | | | | | | | | |
CRH plc - ADR (Ireland) | | | 354 | | | | 6,255 | |
| | | | | | | | |
Containers & Packaging - 0.3% | | | | | | | | |
Bemis Co., Inc. | | | 80 | | | | 2,541 | |
| | | | |
| 9 | | The accompanying notes are an integral part of the financial statements. | | |
Investment Portfolio - October 31, 2010
| | | | | | | | |
| | | Shares | | | Value
(Note 2) | |
| | |
COMMON STOCKS (continued) | | | | | | | | |
| | |
Materials (continued) | | | | | | | | |
Containers & Packaging (continued) | | | | | | | | |
Greif, Inc. - Class A | | | 21 | | | $ | 1,234 | |
Packaging Corp. of America | | | 41 | | | | 1,002 | |
Sealed Air Corp. | | | 67 | | | | 1,551 | |
Sonoco Products Co. | | | 69 | | | | 2,311 | |
| | | | | | | | |
| | | | | | | 8,639 | |
| | | | | | | | |
Metals & Mining - 0.0%** | | | | | | | | |
Compass Minerals International, Inc. | | | 12 | | | | 946 | |
| | | | | | | | |
Paper & Forest Products - 0.1% | | | | | | | | |
MeadWestvaco Corp. | | | 67 | | | | 1,724 | |
| | | | | | | | |
Total Materials | | | | | | | 63,664 | |
| | | | | | | | |
Telecommunication Services - 2.9% | | | | | | | | |
Diversified Telecommunication Services - 0.9% | | | | | | | | |
Chunghwa Telecom Co. Ltd. - ADR (Taiwan) | | | 529 | | | | 12,379 | |
Magyar Telekom Telecommunications plc - ADR (Hungary) | | | 154 | | | | 2,190 | |
Telecom Corp. of New Zealand Ltd. - ADR (New Zealand) | | | 280 | | | | 2,189 | |
Telefonos de Mexico S.A.B. de C.V. (Telmex) - ADR - Class L (Mexico) | | | 498 | | | | 7,709 | |
| | | | | | | | |
| | | | | | | 24,467 | |
| | | | | | | | |
Wireless Telecommunication Services - 2.0% | | | | | | | | |
Cellcom Israel Ltd. (Israel) | | | 56 | | | | 1,892 | |
NTT DoCoMo, Inc. - ADR (Japan) | | | 1,870 | | | | 31,584 | |
Partner Communications Co. Ltd. - ADR (Israel) | | | 115 | | | | 2,338 | |
Philippine Long Distance Telephone Co. - ADR (Philippines) | | | 110 | | | | 6,835 | |
Rogers Communications, Inc. - Class B (Canada) | | | 250 | | | | 9,113 | |
| | | | | | | | |
| | | | | | | 51,762 | |
| | | | | | | | |
Total Telecommunication Services | | | | | | | 76,229 | |
| | | | | | | | |
Utilities - 1.7% | | | | | | | | |
Electric Utilities - 0.9% | | | | | | | | |
Companhia Energetica de Minas Gerais (CEMIG) - ADR (Brazil) | | | 208 | | | | 3,711 | |
DPL, Inc. | | | 63 | | | | 1,644 | |
Enersis S.A. - ADR (Chile) | | | 275 | | | | 6,273 | |
Exelon Corp. | | | 271 | | | | 11,062 | |
| | | | | | | | |
| | | | | | | 22,690 | |
| | | | | | | | |
Gas Utilities - 0.1% | | | | | | | | |
UGI Corp. | | | 43 | | | | 1,294 | |
| | | | | | | | |
Independent Power Producers & Energy Traders - 0.2% | | | | | | | | |
Empresa Nacional de Electricidad S.A. - ADR (Chile) | | | 115 | | | | 6,136 | |
| | | | | | | | |
Multi-Utilities - 0.4% | | | | | | | | |
Public Service Enterprise Group, Inc. | | | 362 | | | | 11,711 | |
| | | | | | | | |
| | | | |
| | The accompanying notes are an integral part of the financial statements. | | 10 |
Investment Portfolio - October 31, 2010
| | | | | | | | |
| | | Shares | | | Value
(Note 2) | |
| | |
COMMON STOCKS (continued) | | | | | | | | |
| | |
Utilities (continued) | | | | | | | | |
Water Utilities - 0.1% | | | | | | | | |
Companhia de Saneamento Basico do Estado de Sao Paulo (SABESP) - ADR (Brazil) | | | 79 | | | $ | 3,631 | |
| | | | | | | | |
Total Utilities | | | | | | | 45,462 | |
| | | | | | | | |
TOTAL COMMON STOCKS
(Identified Cost $2,387,127) | | | | | | | 2,576,304 | |
| | | | | | | | |
| | |
SHORT-TERM INVESTMENTS - 2.3% | | | | | | | | |
| | |
Dreyfus Cash Management, Inc. - Institutional Shares1, 0.16%
(Identified Cost $62,126) | | | 62,126 | | | | 62,126 | |
| | | | | | | | |
TOTAL INVESTMENTS - 99.8%
(Identified Cost $2,449,253) | | | | | | | 2,638,430 | |
OTHER ASSETS, LESS LIABILITIES - 0.2% | | | | | | | 4,734 | |
| | | | | | | | |
NET ASSETS - 100% | | | | | | $ | 2,643,164 | |
| | | | | | | | |
ADR - American Depository Receipt
NVS - Non-Voting Shares
| * | Non-income producing security |
| 1 | Rate shown is the current yield as of October 31, 2010. |
| | | | |
| 11 | | The accompanying notes are an integral part of the financial statements. | | |
Statement of Assets and Liabilities
October 31, 2010
| | | | |
ASSETS: | | | | |
| |
Investments, at value (identified cost $2,449,253) (Note 2) | | $ | 2,638,430 | |
Receivable from investment advisor (Note 3) | | | 40,624 | |
Dividends receivable | | | 4,194 | |
Receivable for fund shares sold | | | 1,016 | |
Foreign tax reclaims receivable | | | 561 | |
| | | | |
| |
TOTAL ASSETS | | | 2,684,825 | |
| | | | |
| |
LIABILITIES: | | | | |
| |
Accrued fund accounting and administration (Note 3) | | | 6,484 | |
Accrued transfer agent fees (Note 3) | | | 925 | |
Accrued directors’ fees (Note 3) | | | 321 | |
Accrued Chief Compliance Officer service fees (Note 3) | | | 219 | |
Audit fees payable | | | 29,656 | |
Other payables and accrued expenses | | | 4,056 | |
| | | | |
| |
TOTAL LIABILITIES | | | 41,661 | |
| | | | |
| |
TOTAL NET ASSETS | | $ | 2,643,164 | |
| | | | |
| |
NET ASSETS CONSIST OF: | | | | |
| |
Capital stock | | $ | 2,130 | |
Additional paid-in-capital | | | 2,172,539 | |
Undistributed net investment income | | | 16,249 | |
Accumulated net realized gain on investments | | | 263,069 | |
Net unrealized appreciation on investments | | | 189,177 | |
| | | | |
| |
TOTAL NET ASSETS | | $ | 2,643,164 | |
| | | | |
| |
NET ASSET VALUE, OFFERING PRICE AND REDEMPTION PRICE PER SHARE - Class A
($2,643,164/213,010 shares) | | $ | 12.41 | |
| | | | |
| | | | |
| | The accompanying notes are an integral part of the financial statements. | | 12 |
Statement of Operations
For the Year Ended October 31, 2010
| | | | |
INVESTMENT INCOME: | | | | |
| |
Dividends (net of foreign taxes withheld, $2,857) | | $ | 80,489 | |
| | | | |
| |
EXPENSES: | | | | |
| |
Fund accounting and administration fees (Note 3) | | | 31,138 | |
Management fees (Note 3) | | | 10,076 | |
Directors’ fees (Note 3) | | | 10,001 | |
Transfer agent fees (Note 3) | | | 3,388 | |
Chief Compliance Officer service fees (Note 3) | | | 2,695 | |
Audit fees | | | 29,830 | |
Registration and filing fees | | | 17,286 | |
Custodian fees | | | 8,300 | |
Printing fees | | | 7,571 | |
Legal fees | | | 3,628 | |
Postage fees | | | 1,135 | |
Miscellaneous | | | 637 | |
| | | | |
| |
Total Expenses | | | 125,685 | |
Less reduction of expenses (Note 3) | | | (112,250 | ) |
| | | | |
| |
Net Expenses | | | 13,435 | |
| | | | |
| |
NET INVESTMENT INCOME | | | 67,054 | |
| | | | |
| |
REALIZED AND UNREALIZED GAIN (LOSS) ON INVESTMENTS: | | | | |
| |
Net realized gain on investments | | | 276,470 | |
Net change in unrealized appreciation (depreciation) on investments | | | (72,060 | ) |
| | | | |
| |
NET REALIZED AND UNREALIZED GAIN (LOSS) ON INVESTMENTS | | | 204,410 | |
| | | | |
| |
NET INCREASE IN NET ASSETS RESULTING FROM OPERATIONS | | $ | 271,464 | |
| | | | |
| | | | |
| 13 | | The accompanying notes are an integral part of the financial statements. | | |
Statements of Changes in Net Assets
| | | | | | | | |
| | | For the
Year Ended
10/31/10 | | | For the Period
11/7/081 to
10/31/09 | |
INCREASE (DECREASE) IN NET ASSETS: | | | | | | | | |
| | |
OPERATIONS: | | | | | | | | |
| | |
Net investment income | | $ | 67,054 | | | $ | 36,381 | |
Net realized gain (loss) on investments | | | 276,470 | | | | (12,704 | ) |
Net change in unrealized appreciation (depreciation) on investments | | | (72,060 | ) | | | 261,237 | |
| | | | | | | | |
| | |
Net increase from operations | | | 271,464 | | | | 284,914 | |
| | | | | | | | |
| | |
DISTRIBUTIONS TO SHAREHOLDERS (Note 8): | | | | | | | | |
| | |
From net investment income | | | (65,478 | ) | | | (21,640 | ) |
From net realized gain on investments | | | (765 | ) | | | — | |
| | | | | | | | |
| | |
Total distributions to shareholders | | | (66,243 | ) | | | (21,640 | ) |
| | | | | | | | |
| | |
CAPITAL STOCK ISSUED AND REPURCHASED: | | | | | | | | |
| | |
Net increase from capital share transactions (Note 5) | | | 393,548 | | | | 1,781,121 | |
| | | | | | | | |
| | |
Net increase in net assets | | | 598,769 | | | | 2,044,395 | |
| | |
NET ASSETS: | | | | | | | | |
| | |
Beginning of period | | | 2,044,395 | | | | — | |
| | | | | | | | |
| | |
End of period (including undistributed net investment income of $16,249 and $14,733, respectively) | | $ | 2,643,164 | | | $ | 2,044,395 | |
| | | | | | | | |
| 1 | Commencement of operations. |
| | | | |
| | The accompanying notes are an integral part of the financial statements. | | 14 |
Financial Highlights
| | | | | | | | |
| | | For the
Year Ended
10/31/10 | | | For the Period
11/7/081 to
10/31/09 | |
Per share data (for a share outstanding throughout each period): | | | | | | | | |
Net asset value - Beginning of period | | $ | 11.38 | | | $ | 10.00 | |
| | | | | | | | |
| | |
Income from investment operations: | | | | | | | | |
Net investment income2 | | | 0.36 | | | | 0.34 | |
Net realized and unrealized gain on investments | | | 1.02 | | | | 1.22 | |
| | | | | | | | |
Total from investment operations | | | 1.38 | | | | 1.56 | |
| | | | | | | | |
| | |
Less distributions to shareholders: | | | | | | | | |
From net investment income | | | (0.35 | ) | | | (0.18 | ) |
From net realized gain on investments | | | — | 3 | | | — | |
| | | | | | | | |
Total distributions to shareholders | | | (0.35 | ) | | | (0.18 | ) |
| | | | | | | | |
Net asset value - End of period | | $ | 12.41 | | | $ | 11.38 | |
| | | | | | | | |
Net assets - End of period (000’s omitted) | | $ | 2,643 | | | $ | 2,044 | |
| | | | | | | | |
Total return4 | | | 12.32 | % | | | 15.81 | % |
Ratios (to average net assets)/Supplemental Data: | | | | | | | | |
Expenses* | | | 0.60 | % | | | 0.60 | %5 |
Net investment income | | | 2.99 | % | | | 3.33 | %5 |
Portfolio turnover | | | 73 | % | | | 28 | % |
|
* The investment advisor did not impose all or a portion of its management fees, CCO fees, fund accounting and transfer agent fees, and other fees in some periods and in some periods paid a portion of the Series’ expenses. If these expenses had been incurred by the Series, the expense ratio (to average net assets) would have been increased by the following amount: | |
| | |
| | | 5.01 | % | | | 6.21 | %5 |
| 1 | Commencement of operations. |
| 2 | Calculated based on average shares outstanding during the periods. |
| 3 | Less than $0.01 per share. |
| 4 | Represents aggregate total return for the periods indicated, and assumes reinvestment of all distributions. Total return would have been lower had certain expenses not been waived during certain periods. Periods less than one year are not annualized. |
| | | | |
| 15 | | The accompanying notes are an integral part of the financial statements. | | |
Notes to Financial Statements
Dividend Focus Series (the “Series”) is a no-load non-diversified series of Manning & Napier Fund, Inc. (the “Fund”). The Fund is organized in Maryland and is registered under the Investment Company Act of 1940, as amended, as an open-end management investment company.
The Series’ investment objective is to provide competitive returns consistent with the broad equity market while providing a level of capital protection during market downturns through a passive quantitative investment approach.
The Fund’s Advisor is Manning & Napier Advisors, Inc. (the “Advisor”). Shares of the Series are offered to investors and employees of the Advisor and its affiliates. The total authorized capital stock of the Fund consists of 10.0 billion shares of common stock each having a par value of $0.01. As of October 31, 2010, 6.2 billion shares have been designated in total among 29 series, of which 100 million have been designated as Dividend Focus Series Class A common stock.
| 2. | SIGNIFICANT ACCOUNTING POLICIES |
Security Valuation
Portfolio securities, including domestic equities, foreign equities, warrants and options, listed on an exchange other than the NASDAQ National Market System are valued at the latest quoted sales price of the exchange on which the security is primarily traded. Securities not traded on valuation date or securities not listed on an exchange are valued at the latest quoted bid price provided by the Fund’s pricing service. Securities listed on the NASDAQ National Market System are valued in accordance with the NASDAQ Official Closing Price.
Short-term investments that mature in sixty days or less are valued at amortized cost, which approximates market value. Investments in open-end investment companies are valued at their net asset value per share on valuation date.
Volume and level of activity in established markets for an asset or liability are evaluated to determine whether recent transactions and quoted prices are determinative of fair value. Where there have been significant decreases in volume and level of activity, further analysis and adjustment may be necessary to estimate fair value. The Series measures fair value in these instances by the use of inputs and valuation techniques which may be based upon current market prices of securities that are comparable in coupon, rating, maturity and industry and/or expectation of future cash flows. As a result of trading in relatively thin markets and/or markets that experience significant volatility, the prices used by the Series to value these securities may differ from the value that would be realized if these securities were sold, and the differences could be material.
Securities for which representative valuations or prices are not available from the Fund’s pricing service may be valued at fair value. Due to the inherent uncertainty of valuations of such securities, the fair value may differ significantly from the values that would have been used had a ready market for such securities existed. If trading or events occurring after the close of the principal market in which securities are traded are expected to materially affect the value of those securities, then they may be valued at their fair value, taking this trading or these events into account. Fair value is determined in good faith by the Advisor under procedures approved by and under the general supervision and responsibility of the Fund’s Board of Directors (the “Board”).
Various inputs are used in determining the value of the Series’ assets or liabilities carried at market value. These inputs are summarized in three broad levels. Level 1 includes quoted prices in active markets for identical assets and liabilities. Level 2 includes other significant observable inputs (including quoted prices for similar securities, interest rates, prepayment speeds, credit risk, etc.). Level 3 includes significant unobservable inputs (including the Series’ own assumptions in determining the fair value of investments). The inputs or methodology used for valuing securities are not necessarily an indication of the risk associated with investing in those securities.
16
Notes to Financial Statements
| 2. | SIGNIFICANT ACCOUNTING POLICIES (continued) |
Security Valuation (continued)
The following is a summary of the valuation levels used for major security types as of October 31, 2010 in valuing the Series’ assets or liabilities carried at market value:
| | | | | | | | | | | | | | | | |
| | | | |
Description | | Total | | | Level 1 | | | Level 2 | | | Level 3 | |
Assets: | | | | | | | | | | | | | | | | |
Equity securities* | | $ | 2,576,304 | | | $ | 2,576,304 | | | $ | — | | | $ | — | |
Preferred securities | | | — | | | | — | | | | — | | | | — | |
Debt securities | | | — | | | | — | | | | — | | | | — | |
Mutual funds | | | 62,126 | | | | 62,126 | | | | — | | | | — | |
Other financial instruments**: | | | — | | | | — | | | | — | | | | — | |
| | | | | | | | | | | | | | | | |
Total assets: | | | 2,638,430 | | | | 2,638,430 | | | | — | | | | — | |
| | | | | | | | | | | | | | | | |
Liabilities: | | | | | | | | | | | | | | | | |
Other financial instruments**: | | | — | | | | — | | | | — | | | | — | |
| | | | | | | | | | | | | | | | |
Total liabilities: | | | — | | | | — | | | | — | | | | — | |
| | | | | | | | | | | | | | | | |
Total | | $ | 2,638,430 | | | $ | 2,638,430 | | | $ | — | | | $ | — | |
| | | | | | | | | | | | | | | | |
| * | Includes common stock, warrants and rights. Please see the Investment Portfolio for industry classification. |
| ** | Other financial instruments are derivative instruments not reflected in the Investment Portfolio, such as futures, forwards and swap contracts, which are valued at the unrealized appreciation/depreciation on the instrument. As of October 31, 2010, the Series did not hold any derivative instruments. |
There were no Level 3 securities held by the Series as of October 31, 2009 or October 31, 2010.
The Fund’s policy is to recognize transfers in and transfers out of the valuation levels as of the beginning of the reporting period. There were no significant transfers between Level 1 and Level 2 during the year ended October 31, 2010.
Additional disclosure surrounding the activity in Level 3 fair value measurement will also be effective for fiscal years beginning after December 15, 2010. Management has concluded that this will not have a material impact on the Series’ financial statements.
Security Transactions, Investment Income and Expenses
Security transactions are accounted for on trade date. Dividend income is recorded on the ex-dividend date, except that if the ex-dividend date has passed, certain dividends from foreign securities are recorded as soon as the Fund is informed of the ex-dividend date. Non-cash dividends, if any, are recorded at the fair market value of the securities received. Interest income, including amortization of premium and accretion of discounts using the effective interest method, is earned from settlement date and accrued daily.
Expenses are recorded on an accrual basis. Most expenses of the Fund can be attributed to a specific series. Expenses which cannot be directly attributed are apportioned among the series in the Fund in such a manner as deemed equitable by the Fund’s Board, taking into consideration, among other things, the nature and type of expense.
The Series uses the identified cost method for determining realized gain or loss on investments for both financial statement and federal income tax reporting purposes.
17
Notes to Financial Statements
| 2. | SIGNIFICANT ACCOUNTING POLICIES (continued) |
Foreign Currency Translation
The books and records of the Series are maintained in U.S. dollars. Foreign currencies, investments and other assets and liabilities are translated into U.S. dollars at the current exchange rates. Purchases and sales of investment securities and income and expenses are translated on the respective dates of such transactions. The Series does not isolate realized and unrealized gains and losses attributable to changes in the exchange rates from gains and losses that arise from changes in the market value of investments. Such fluctuations are included with net realized and unrealized gain or loss on investments. Net realized foreign currency gains and losses represent foreign currency gains and losses between trade date and settlement date on securities transactions, gains and losses on disposition of foreign currencies and the difference between the amount of income and foreign withholding taxes recorded on the books of the Series and the amounts actually received or paid.
Federal Taxes
The Series’ policy is to comply with the provisions of the Internal Revenue Code applicable to regulated investment companies. The Series is not subject to federal income or excise tax to the extent that the Series distributes to shareholders each year its taxable income, including any net realized gains on investments, in accordance with requirements of the Internal Revenue Code. Accordingly, no provision for federal income tax or excise tax has been made in the financial statements.
Management evaluates its tax positions to determine if the tax positions taken meet the minimum recognition threshold in connection with accounting for uncertainties in income tax positions taken or expected to be taken for the purposes of measuring and recognizing tax liabilities in the financial statements. Recognition of tax benefits of an uncertain tax position is required only when the position is “more likely than not” to be sustained assuming examination by taxing authorities. At October 31, 2010, the Series has recorded no liability for net unrecognized tax benefits relating to uncertain income tax positions taken or expected to be taken in future tax returns.
The Series files income tax returns in the U.S. federal jurisdiction, various states and foreign jurisdictions, as required. No income tax returns are currently under investigation. The statute of limitations on the Series’ tax returns remains open for the period ended October 31, 2009 and the year ended October 31, 2010. The Fund is not aware of any tax positions for which it is reasonably possible that the total amounts of unrecognized tax benefits will significantly change in the next twelve months.
Additionally, based on the Fund’s understanding of the tax rules and rates related to income, gains and transactions for foreign jurisdictions in which it invests, the Series will provide for foreign taxes, and where appropriate, deferred foreign tax.
Distributions of Income and Gains
Distributions to shareholders of net investment income are made quarterly. Distributions of net realized gains are made annually. An additional distribution may be necessary to avoid taxation of the Series. Distributions are recorded on the ex-dividend date.
Indemnifications
The Fund’s organizational documents provide former and current directors and officers with a limited indemnification against liabilities arising in connection with the performance of their duties to the Fund. In the normal course of business, the Fund may also enter into contracts that provide general indemnifications. The Fund’s maximum exposure under these arrangements is unknown as this would be dependent on future claims that may be made against the Fund. The risk of material loss from such claims is considered remote.
18
Notes to Financial Statements
| 2. | SIGNIFICANT ACCOUNTING POLICIES (continued) |
Other
The preparation of financial statements in conformity with accounting principles generally accepted in the United States of America requires management to make estimates and assumptions that affect the reported amounts of assets and liabilities and the disclosure of contingent assets and liabilities at the date of the financial statements and the reported amounts of income and expenses during the reporting period. Actual results could differ from those estimates.
| 3. | TRANSACTIONS WITH AFFILIATES |
The Fund has an Investment Advisory Agreement (the “Agreement”) with the Advisor, for which the Series pays a fee, computed daily and payable monthly, at an annual rate of 0.45% of the Series’ average daily net assets.
Under the Agreement, personnel of the Advisor provide the Series with advice and assistance in the choice of investments and the execution of securities transactions, and otherwise maintain the Series’ organization. The Advisor also provides the Fund with necessary office space and fund administration and support services. The salaries of all officers of the Fund (except a percentage of the Fund’s Chief Compliance Officer’s salary, which is paid by the Fund), and of all Directors who are “affiliated persons” of the Fund, or of the Advisor, and all personnel of the Fund, or of the Advisor, performing services relating to research, statistical and investment activities, are paid by the Advisor. Each “non-affiliated” Director receives an annual stipend, which is allocated among all the active series of the Fund. In addition, these Directors also receive a fee per Board meeting attended for each active series of the Fund plus a fee for each committee meeting attended.
The Advisor has contractually agreed, until at least February 28, 2011, to waive its fee and, if necessary, pay other operating expenses of the Series in order to maintain total direct annual fund operating expenses for the Series at no more than 0.60% of average daily net assets each year. Accordingly, the Advisor waived fees of $111,492 for the year ended October 31, 2010, which is included as a reduction of expenses on the Statement of Operations. The Advisor voluntarily waived additional fees of $758 for the year ended October 31, 2010, which is also included as a reduction of expenses on the Statement of Operations. The Advisor is not eligible to recoup any expenses that have been waived or reimbursed in the prior period.
Manning & Napier Investor Services, Inc., a registered broker-dealer affiliate of the Advisor, acts as distributor for the Fund’s shares. The services of Manning & Napier Investor Services, Inc. are provided at no additional cost to the Series.
For fund accounting and transfer agent services through November 7, 2009, the Fund paid the Advisor an annual fee of 0.055% of the Fund’s average daily net assets up to $4.5 billion, 0.03% of the Fund’s average daily net assets between $4.5 billion and $7.5 billion, and 0.02% of the Fund’s average daily net assets over $7.5 billion. Additionally, certain transaction and account-based fees and out-of-pocket expenses, including charges for reporting relating to the Fund’s compliance program, are charged. Prior to October 12, 2009 (for sub-accountant) and November 9, 2009 (for sub-transfer agent), the Advisor had an agreement with Citi Fund Services Ohio, Inc. (“Citi”) under which Citi served as sub-accountant and sub-transfer agent.
The Advisor has entered into agreements dated October 12, 2009 and November 9, 2009 with PNC Global Investment Servicing (U.S.) Inc. (“PNCGIS”) under which PNCGIS serves as sub-accountant services agent and sub-transfer agent, respectively. Effective November 7, 2009 under the amended master services agreement, the Fund pays the Advisor an annual fee related to Fund Accounting and administration of 0.0175% on the first $3 billion of average daily net assets (excluding Target Series); 0.015% on the next $3 billion of average daily net assets (excluding Target Series); and 0.01% of the average daily net assets in excess of $6 billion (excluding Target Series); plus a base fee of $25,500 per Series. Transfer Agent fees are charged to the Fund on a per account basis. Additionally,
19
Notes to Financial Statements
| 3. | TRANSACTIONS WITH AFFILIATES (continued) |
certain transaction-, cusip-based fees and out-of-pocket expenses, including charges for reporting relating to the Fund’s compliance program, are charged.
Effective July 1, 2010, PNCGIS, which serves as the Series’ sub-accountant services agent and sub-transfer agent, was sold to The Bank of New York Mellon Corporation, the Series’ custodian. At the close of the sale, PNCGIS changed its name to BNY Mellon Investment Servicing (U.S.) Inc. (“BNY”).
Expenses not directly attributable to a Series are allocated based on each Series’ relative net assets or number of accounts, depending on the expense.
| 4. | PURCHASES AND SALES OF SECURITIES |
For the year ended October 31, 2010, purchases and sales of securities, other than U.S. Government securities and short-term securities, were $1,983,044 and $1,581,190, respectively. There were no purchases or sales of U.S. Government securities.
| 5. | CAPITAL STOCK TRANSACTIONS |
Transactions in shares of Dividend Focus Series were:
| | | | | | | | | | | | | | | | |
| | | For the Year
Ended 10/31/10 | | | For the period 11/7/08
(commencement of
operations) to 10/31/09 | |
| | | Shares | | | Amount | | | Shares | | | Amount | |
Sold | | | 133,419 | | | $ | 1,584,314 | | | | 205,149 | | | $ | 2,029,521 | |
Reinvested | | | 5,230 | | | | 62,470 | | | | 2,031 | | | | 21,640 | |
Repurchased | | | (105,342 | ) | | | (1,253,236 | ) | | | (27,477 | ) | | | (270,040 | ) |
| | | | | | | | | | | | | | | | |
Total | | | 33,307 | | | $ | 393,548 | | | | 179,703 | | | $ | 1,781,121 | |
| | | | | | | | | | | | | | | | |
At October 31, 2010, one shareholder owned 22,616 shares of the Series (10.6% of shares outstanding) valued at $280,670. In addition, the Advisor owned 52,407 shares (24.6% of shares outstanding) valued at $650,371 and the retirement plan of the Advisor and its affiliates owned 55,316 shares of the Series (26.0% of shares outstanding) valued at $686,477. Investment activities of these shareholders may have a material effect on the Series.
The Series may trade in instruments including written and purchased options, forward foreign currency exchange contracts and futures contracts and other derivatives in the normal course of investing activities to assist in managing exposure to various market risks. The Series may be subject to various elements of risk and may involve, to a varying degree, elements of risk in excess of the amounts recognized for financial statement purposes. These risks include: the risk that changes in the value of a derivative may not correlate perfectly with the underlying asset, rate or index, counterparty credit risk related to over the counter derivatives counterparties’ failure to perform under contract terms, liquidity risk related to the lack of a liquid market for these contracts allowing the fund to close out its position(s) and documentation risk relating to disagreement over contract terms. No such investments were held by the Series on October 31, 2010.
20
Notes to Financial Statements
Investing in securities of foreign companies and foreign governments involves special risks and considerations not typically associated with investing in securities of domestic companies and the U.S. Government. These risks include revaluation of currencies and future adverse political and economic developments. Moreover, securities of foreign companies and foreign governments and their markets may be less liquid and their prices more volatile than those of comparable domestic companies and the U.S. Government.
| 8. | FEDERAL INCOME TAX INFORMATION |
The amount and characterization of certain income and capital gains to be distributed are determined in accordance with federal income tax regulations, which may differ from accounting principles generally accepted in the United States of America. These differences are primarily due to differing book and tax treatments in the timing of the recognition of net investment income or gains and losses including losses deferred due to wash sales and investments in Real Estate Investment Trusts and Royalty Trusts. The Series may periodically make reclassifications among its capital accounts to reflect income and gains available for distribution (or available capital loss carryovers) under income tax regulations, without impacting the Series’ net asset value. Any such reclassifications are not reflected in the financial highlights.
The tax character of distributions paid were as follows:
| | | | | | | | |
| | | For the Year
Ended
10/31/10 | | | For the Period
11/7/08
(commencement
of
operations) to
10/31/09 | |
Ordinary income | | $ | 66,177 | | | $ | 21,640 | |
Long-term capital gains | | | 66 | | | | — | |
|
At October 31, 2010, the tax basis of distributable earnings and the net unrealized appreciation based on identified cost of investments for federal income tax purposes were as follows: | |
| | |
Cost for federal income tax purposes | | | | | | $ | 2,466,410 | |
Unrealized appreciation | | | | | | $ | 209,413 | |
Unrealized depreciation | | | | | | | (37,393 | ) |
| | | | | | | | |
Net unrealized appreciation | | | | | | $ | 172,020 | |
| | | | | | | | |
Undistributed ordinary income | | | | | | | 96,258 | |
Undistributed long-term capital gains | | | | | | | 200,217 | |
21
Report of Independent Registered Public Accounting Firm
To the Board of Directors of Manning & Napier Fund, Inc. and Shareholders of Dividend Focus Series:
In our opinion, the accompanying statement of assets and liabilities, including the investment portfolio, and the related statements of operations and of changes in net assets and the financial highlights present fairly, in all material respects, the financial position of the Dividend Focus Series (a series of Manning & Napier Fund, Inc., hereafter referred to as the “Series”) at October 31, 2010, the results of its operations for the year then ended, and the changes in its net assets and the financial highlights for the year then ended and for the period November 7, 2008 (commencement of operations) through October 31, 2009, in conformity with accounting principles generally accepted in the United States of America. These financial statements and financial highlights (hereafter referred to as “financial statements”) are the responsibility of the Series’ management. Our responsibility is to express an opinion on these financial statements based on our audits. We conducted our audits of these financial statements in accordance with the standards of the Public Company Accounting Oversight Board (United States). Those standards require that we plan and perform the audit to obtain reasonable assurance about whether the financial statements are free of material misstatement. An audit includes examining, on a test basis, evidence supporting the amounts and disclosures in the financial statements, assessing the accounting principles used and significant estimates made by management, and evaluating the overall financial statement presentation. We believe that our audits, which included confirmation of securities at October 31, 2010 by correspondence with the custodian, provide a reasonable basis for our opinion.

New York, New York
December 21, 2010
22
Supplemental Tax Information (unaudited)
All designations are based on financial information available as of the date of this annual report and, accordingly are subject to change.
For federal income tax purposes, the Series designates for the current fiscal year $43,737 or, if different, the maximum amount allowable under the tax law, as qualified dividend income.
For corporate shareholders, the percentage of investment income (dividend income plus short-term gains, if any) that qualifies for the dividends received deduction for the current fiscal year is 44.20%.
23
Directors’ and Officers’ Information (unaudited)
The Statement of Additional Information provides additional information about the Fund’s directors and officers and can be obtained without charge by calling 1-800-466-3863, at www.manningnapieradvisors.com, or on the EDGAR Database on the SEC Internet web site (http:// www.sec.gov). The following chart shows certain information about the Fund’s officers and directors, including their principal occupations during the last five years. Unless specific dates are provided, the individuals have held the listed positions for longer than five years.
INTERESTED DIRECTOR/OFFICER
| | |
| Name: | | B. Reuben Auspitz* |
| Address: | | 290 Woodcliff Drive |
| | Fairport, NY 14450 |
| Age: | | 63 |
| Current Position(s) Held with Fund: | | Principal Executive Officer, President, Chairman & Director |
| Term of Office1 & Length of Time Served: | | Indefinite - Director since 1984; Vice President 1984 - 2003; President since 2004; Principal Executive Officer since 2002 |
| Principal Occupation(s) During Past 5 Years: | | Executive Vice President; Executive Group Member**; Chief Compliance Officer since 2004; Vice Chairman since June 2010; Co-Executive Director from 2003-2010 - Manning & Napier Advisors, Inc. President; Director - Manning & Napier Investor Services, Inc. |
| | Holds or has held one or more of the following titles for various subsidiaries and affiliates: President, Vice President, Director, Chairman, Treasurer, Chief Compliance Officer or Member. |
| Number of Portfolios Overseen within Fund Complex: | | 29 |
| Other Directorships Held Outside Fund Complex: | | N/A |
| |
| INDEPENDENT DIRECTORS | | |
| Name: | | Stephen B. Ashley |
| Address: | | 290 Woodcliff Drive |
| | Fairport, NY 14450 |
| Age: | | 70 |
| Current Position(s) Held with Fund: | | Director, Audit Committee Member, Governance & Nominating Committee Member |
| Term of Office & Length of Time Served: | | Indefinite - Since 1996 |
| Principal Occupation(s) During Past 5 Years: | | Chairman, Director, President & Chief Executive Officer, The Ashley Group (property management and investment). Chairman (non-executive) 2004-2008; Director 1995-2008 - Fannie Mae (mortgage) |
| Number of Portfolios Overseen within Fund Complex: | | 29 |
| Other Directorships Held Outside Fund Complex: | | The Ashley Group (1995-2008) |
| | | Genesee Corporation (1987-2007) |
| Name: | | Peter L. Faber |
| Address: | | 290 Woodcliff Drive |
| | Fairport, NY 14450 |
| Age: | | 72 |
| Current Position(s) Held with Fund: | | Director, Governance & Nominating Committee Member |
| Term of Office & Length of Time Served: | | Indefinite - Since 1987 |
| Principal Occupation(s) During Past 5 Years: | | Senior Counsel since 2006, Partner (1995 - 2006) - McDermott, Will & Emery LLP (law firm) |
| Number of Portfolios Overseen within Fund Complex: | | 29 |
| Other Directorships Held Outside Fund Complex: | | Partnership for New York City, Inc. (non-profit) |
| | New York Collegium (non-profit) |
| | | Boston Early Music Festival (non-profit) |
24
Directors’ and Officers’ Information (unaudited)
| | |
| INDEPENDENT DIRECTORS (continued) | | |
| |
| Name: | | Harris H. Rusitzky |
| Address: | | 290 Woodcliff Drive |
| | Fairport, NY 14450 |
| Age: | | 75 |
| Current Position(s) Held with Fund: | | Director, Audit Committee Member, Governance & Nominating Committee Member |
| Term of Office & Length of Time Served: | | Indefinite - Since 1985 |
| Principal Occupation(s) During Past 5 Years: | | President, The Greening Group (business consultants) since 1994; Partner, The Restaurant Group (restaurants) since 2006 |
| Number of Portfolios Overseen within Fund Complex: | | 29 |
| Other Directorships Held Outside Fund Complex: | | N/A |
| |
| Name: | | Paul A. Brooke |
| Address: | | 290 Woodcliff Drive |
| | Fairport, NY 14450 |
| Age: | | 64 |
| Current Position(s) Held with Fund: | | Director, Audit Committee Member, Governance & Nominating Committee Member |
| Term of Office & Length of Time Served: | | Indefinite - Since 2007 |
| Principal Occupation(s) During Past 5 Years: | | Chairman & CEO, Alsius Corp. (investments); Managing Member, PMSV Holdings LLC (investments) |
| Number of Portfolios Overseen within Fund Complex: | | 29 |
| Other Directorships Held Outside Fund Complex: | | Incyte Corp. (2000-present) |
| | ViroPharma, Inc. (2000-present) |
| | HLTH Corp. (2000-present) |
| | Cheyne Capital International (2000-present) |
| | MPM Bio-equities (2000-present) |
| | GMP Companies (2000-present) |
| | | HoustonPharma (2000-present) |
| |
| Name: | | Richard M. Hurwitz |
| Address: | | 290 Woodcliff Drive |
| | Fairport, NY 14450 |
| Age: | | 47 |
| Current Position(s) Held with Fund: | | Director, Audit Committee Member, Governance & Nominating Committee Member |
| Term of Office & Length of Time Served: | | Indefinite - Since 2009 |
| Principal Occupation(s) During Past 5 Years: | | Chief Executive Officer, Pictometry International Corp. since August 2010 (provider of georeferenced, aerial image libraries and related software) Managing Partner (2006-July 2010) - Aegis Investment Partners, LLC (investments); Founder and Managing Partner (2004-2005) - Village Markets, LLC (groceries) |
| Number of Portfolios Overseen within Fund Complex: | | 29 |
| Other Directorships Held Outside Fund Complex: | | Pictometry International Corp. (2000-2010) |
| | Pioneering Technologies (2006-2009) |
| | | Vensearch Capital Corp. (2003-2007) |
25
Directors’ and Officers’ Information (unaudited)
| | |
| OFFICERS | | |
| |
Name: | | Jeffrey S. Coons, Ph.D., CFA |
Address: | | 290 Woodcliff Drive |
| | Fairport, NY 14450 |
Age: | | 47 |
Current Position(s) Held with Fund: | | Vice President |
Term of Office1 & Length of Time Served: | | Since 2004 |
Principal Occupation(s) During Past 5 Years: | | President since 2010, Co-Director of Research since 2002, Executive Group Member** since 2003, - Manning & Napier Advisors, Inc. Holds one or more of the following titles for various subsidiaries and affiliates: President, Director, Treasurer or Senior Trust Officer. |
Number of Portfolios Overseen within Fund Complex: | | 29 |
Other Directorships Held Outside Fund Complex: | | N/A |
| |
Name: | | Beth Galusha |
Address: | | 290 Woodcliff Drive |
| | Fairport, NY 14450 |
Age: | | 49 |
Current Position(s) Held with Fund: | | Assistant Chief Financial Officer |
Term of Office1 & Length of Time Served: | | Assistant Chief Financial Officer since 2010 |
Principal Occupation(s) During Past 5 Years: | | Chief Financial Officer and Treasurer, Manning & Napier Advisors, Inc. Holds one or more of the following titles for various affiliates: Chief Financial Officer, Director, or Treasurer |
Number of Portfolios Overseen within Fund Complex: | | 29 |
Other Directorships Held Outside Fund Complex: | | N/A |
| |
Name: | | Christine Glavin |
Address: | | 290 Woodcliff Drive |
| | Fairport, NY 14450 |
Age: | | 44 |
Current Position(s) Held with Fund: | | Principal Financial Officer, Chief Financial Officer |
Term of Office1 & Length of Time Served: | | Principal Financial Officer since 2002; Chief Financial Officer since 2001 |
Principal Occupation(s) During Past 5 Years: | | Fund Reporting Manager, Manning & Napier Advisors, Inc. since 1997 |
Number of Portfolios Overseen within Fund Complex: | | 29 |
Other Directorships Held Outside Fund Complex: | | N/A |
| |
Name: | | Jodi L. Hedberg |
Address: | | 290 Woodcliff Drive |
| | Fairport, NY 14450 |
Age: | | 42 |
Current Position(s) Held with Fund: | | Corporate Secretary, Chief Compliance Officer, Anti-Money Laundering Compliance Officer |
Term of Office1 & Length of Time Served: | | Corporate Secretary since 1997; Chief Compliance Officer since 2004 |
Principal Occupation(s) During Past 5 Years: | | Director of Compliance, Manning & Napier Advisors, Inc. and affiliates since 1990 (title change in 2005 from Compliance Manager to Director of Compliance); Corporate Secretary, Manning & Napier Investor Services, Inc. since 2006 |
Number of Portfolios Overseen within Fund Complex: | | 29 |
Other Directorships Held Outside Fund Complex: | | N/A |
| * | Interested Director, within the meaning of the Investment Company Act of 1940 by reason of his position with the Fund’s investment advisor and distributor. Mr. Auspitz serves as the Executive Vice President and Director, Manning & Napier Advisors, Inc. and President and Director, Manning & Napier Investor Services, Inc., the Fund’s distributor. |
| ** | Prior to June 2010, the Executive Group, consisting of senior executive employee-owners, performed the duties of the Office of the Chief Executive of the Advisor. |
Effective June 2010, the Executive Group serves as an advisory board to the Chief Executive Officer.
| 1 | The term of office for President, Vice President, Chief Financial Officer, and Corporate Secretary is one year and until their respective successors are chosen and qualified. All other officers’ terms are indefinite. |
26
Literature Requests (unaudited)
Proxy Voting Policies and Procedures
A description of the policies and procedures that the Fund uses to determine how to vote proxies relating to portfolio securities is available, without charge, upon request:
| | | | |
By phone | | 1-800-466-3863 | | |
On the Securities and Exchange Commission’s (SEC) web site | | http://www.sec.gov | | |
|
| Proxy Voting Record |
|
Information regarding how the Fund voted proxies relating to portfolio securities during the most recent 12-month period ended June 30th is available, without charge, upon request: |
| | |
By phone | | 1-800-466-3863 | | |
On the SEC’s web site | | http://www.sec.gov | | |
|
| Quarterly Portfolio Holdings |
|
The Series’ complete schedule of portfolio holdings for the 1st and 3rd quarters of each fiscal year are provided on Form N-Q, and are available, without charge, upon request: |
| | |
By phone | | 1-800-466-3863 | | |
On the SEC’s web site | | http://www.sec.gov | | |
|
The Series’ Form N-Q may be reviewed and copied at the SEC’s Public Reference Room in Washington, D.C. Information on the operation of the Public Reference Room may be obtained by calling 1-800-SEC-0330. |
|
| Prospectus and Statement of Additional Information (SAI) |
|
The prospectus and SAI provide additional information about each Series, including charges, expenses and risks. These documents are available, without charge, upon request: |
| | |
By phone | | 1-800-466-3863 | | |
On the SEC’s web site | | http://www.sec.gov | | |
On the Advisor’s web site | | http://manningnapieradvisors.com | | |
Additional information available at www.manningnapieradvisors.com
1. Fund Holdings - Month-End
2. Fund Holdings - Quarter-End
3. Shareholder Report - Annual
4. Shareholder Report - Semi-Annual
MNDIV-10/10-SAR


Management Discussion and Analysis (unaudited)
Dear Shareholders:
The twelve months ending October 31, 2010 were characterized by well-defined swings in investor sentiment. Optimism fueled strong market returns during the fourth quarter of 2009 and through much of the first quarter of 2010, as positive economic releases led investors to believe in the potential for a robust global recovery. Amid concerns about sovereign debt problems in Europe, sentiment shifted dramatically during the second quarter, with stock markets suffering notable losses. While volatility remained during the third quarter of 2010, September was a particularly strong month, which helped push market indexes into positive territory on a calendar year-to-date basis.
Despite several ups and downs over the past year, the international markets made choppy progress. After climbing the last two months, the Morgan Stanley Capital International (MSCI) All Country World ex U.S. (ACWI x US) was up 12.62% the past year through October.
The Overseas Series was also up considerably over the twelve months ending October 31, 2010, with a return of 12.68%, similar to its benchmark. Furthermore, the Series continues to provide competitive absolute and relative results over the current international stock market cycle, which includes both a bull and a bear market. Over this current cycle, the Overseas Series has earned an annualized return of 13.82% compared to the 13.52% return of the MSCI ACWIxUS.
Throughout the last twelve months, the Series had a relative overweight as compared to the benchmark in the Information Technology and Health Care sectors, as our analysts found quality companies with attractive long-term growth potential in these areas. This higher allocation had a varied impact on the Series’ performance over the past year, yet specific stock selections within the Information Technology and Health Care sectors contributed to positive relative returns more recently during the third quarter. Meanwhile, the Overseas Series had a low exposure to Financials relative to the benchmark because regulatory uncertainty and macroeconomic challenges, such as persistently high unemployment and continued loan losses, prevented many financial services companies from meeting the requirements of our investment strategies. Overall, this underweight to Financials aided returns relative to the benchmark during the past year, although this allocation decision hurt relative performance during the third quarter of 2010.
Looking at the world from a country viewpoint, equity selections in Developed Europe detracted from relative performance in the fourth quarter 2009 but significantly aided results relative to the benchmark for the rest of the past year. Specifically, holdings in countries such as Germany and the United Kingdom had a positive impact on the Series’ return compared to the benchmark. While the Overseas Series had a low allocation to Emerging Markets relative to the benchmark, investments in certain countries such as Brazil helped results. In contrast, specific stock decisions in Developed Asia hurt relative performance over the past year. In regards to country allocations, the Overseas Series had an overweight in France, Germany, Ireland, and the Netherlands, while the Series maintained an underweight in Japan.
While the markets were volatile over the past twelve months, the outlook for the developed world did not change materially over the past year. Despite swings in positive and negative sentiment, Manning & Napier continues to see a slow growth environment as developed economies work through extensive consumer and government debt levels. In contrast, emerging markets such as Brazil, China, and India have been experiencing more rapid rebounds. This divergence between fast-growing emerging markets and slow-growth developed markets will likely be apparent for some time. In such an environment, Manning & Napier is focused on company-specific opportunities that can prosper. We are seeking leading companies that can grow and gain market share despite a sluggish economy, particularly multinational businesses that may benefit from exposure to faster-growing foreign markets. Using our active stock selection strategies, we are also seeking opportunities in certain cyclical industries that have a tight relationship between supply and demand.
As 2010 comes to an end, economic momentum has begun to slow. With widespread challenges such as elevated unemployment levels and high government debt burdens, the growth prospects for the developed world remain a concern. In this macroeconomic reality of slow growth, a focus on company and industry fundamentals remains important for
1
Management Discussion and Analysis (unaudited)
identifying quality investment opportunities. Through our disciplined investment strategies, Manning & Napier continues to pursue specific areas of the market that are presenting opportunities, particularly winning companies that have favorable growth prospects. Such an active and flexible approach has been at the core of our investment process since Manning & Napier’s inception 40 years ago.
As always, we appreciate your business.
Sincerely,
Manning & Napier Advisors, Inc.
2
Performance Update as of October 31, 2010 (unaudited)
| | | | | | | | | | | | | | | | |
| | | Average Annual Total Returns
As of October 31, 2010 | |
| | | One
Year | | | Five
Year | | | Ten
Year | | | Since
Inception1 | |
Manning & Napier Fund, Inc. - Overseas Series2,3 | | | 12.68 | % | | | 7.75 | % | | | 8.30 | % | | | 10.13 | % |
Morgan Stanley Capital International (MSCI) All Country World Index ex U.S.4 | | | 12.62 | % | | | 5.74 | % | | | 5.02 | % | | | 6.76 | % |
The following graph compares the value of a $1,000,000 investment in the Manning & Napier Fund, Inc. - Overseas Series for the ten years ended October 31, 2010 to the MSCI All Country World Index ex U.S.
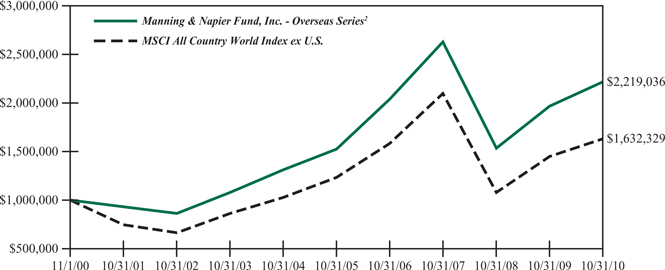
| 1 | Performance numbers for the Series are calculated from September 23, 1998, the Collective’s inception date (see Note 3 below). Prior to 2001, the MSCI All Country World Index ex U.S. only published month-end numbers; therefore, performance numbers for the Index are calculated from September 30, 1998. |
| 2 | The Series’ performance does not reflect the deduction of taxes that a shareholder would pay on fund distributions or the redemption of shares. The Series’ performance is historical and may not be indicative of future results. The performance returns shown are inclusive of the net expense ratio of the Series. For the year ended October 31, 2010, this net expense ratio was 0.75%. The gross expense ratio, which does not account for any voluntary or contractual waivers currently in effect, was 0.76% for the year ended October 31, 2010. |
| 3 | For periods prior to the inception of the Series on July 10, 2002, the performance figures reflect the performance of the Exeter Trust Company Group Trust for Employee Benefit Plans - International Equity Collective Investment Trust (the “Collective”), which was managed by the Advisor and reorganized into the Series. The Collective was not open to the public generally, or registered under the Investment Company Act of 1940 (the “1940 Act”), or subject to certain restrictions that are imposed by the 1940 Act. If the Collective had been registered under the 1940 Act, performance may have been adversely affected. Because the fees of the Collective were lower than the Series’ fees, historical performance would have been lower if the Collective had been subject to the same fees. |
| 4 | The MSCI All Country World Index ex U.S. is a free float-adjusted market capitalization weighted index that is designed to measure equity market performance in the global developed and emerging markets and consists of 47 developed and emerging market country indices outside the United States. The Index is denominated in U.S. Dollars. The Index returns assume daily reinvestment of gross dividends (which do not account for foreign dividend taxation) from the inception of the Collective (see note 1 above) through December 31, 1998, as net returns were not available. Subsequent to December 31, 1998, the Index returns assume daily reinvestment of net dividends (thus accounting for foreign dividend taxation). Unlike Series returns, the Index returns do not reflect any fees or expenses. |
3
Shareholder Expense Example (unaudited)
As a shareholder of the Series, you may incur two types of costs: (1) transaction costs, including potential wire charges on redemptions and (2) ongoing costs, including management fees and other Series expenses. This example is intended to help you understand your ongoing costs (in dollars) of investing in the Series and to compare these costs with the ongoing costs of investing in other mutual funds.
The example is based on an investment of $1,000 invested at the beginning of the period and held for the entire period
(May 1, 2010 to October 31, 2010).
Actual Expenses
The first line of the table below provides information about actual account values and actual expenses. You may use the information in this line, together with the amount you invested, to estimate the expenses that you paid over the period. Simply divide your account value by $1,000 (for example, an $8,600 account value divided by $1,000 = 8.6), then multiply the result by the number in the first line under the heading entitled “Expenses Paid During Period” to estimate the expenses you paid on your account during this period.
Hypothetical Example for Comparison Purposes
The second line of the table below provides information about hypothetical account values and hypothetical expenses based on the Series’ actual expense ratio and an assumed rate of return of 5% per year before expenses, which is not the Series’ actual return. The hypothetical account values and expenses may not be used to estimate the actual ending account balance or expenses you paid during the period. You may use this information to compare the ongoing costs of investing in the Series and other funds. To do so, compare this 5% hypothetical example with the 5% hypothetical examples that appear in the shareholder reports of the other funds.
Please note that the expenses shown in the table are meant to highlight your ongoing costs only and do not reflect any transaction costs. Therefore, the second line of the table is useful in comparing ongoing costs only, and will not help you determine the relative total costs of owning different funds. In addition, if these transaction costs were included, your costs would have been higher.
| | | | | | | | | | | | |
| | | Beginning
Account Value
5/1/10 | | | Ending
Account Value
10/31/10 | | | Expenses Paid
During Period*
5/1/10-10/31/10 | |
Actual | | $ | 1,000.00 | | | $ | 1,030.60 | | | $ | 3.84 | |
Hypothetical
(5% return before expenses) | | $ | 1,000.00 | | | $ | 1,021.42 | | | $ | 3.82 | |
| * | Expenses are equal to the Series’ annualized expense ratio (for the six-month period) of 0.75%, multiplied by the average account value over the period, multiplied by 184/365 (to reflect the one-half year period). Expenses are based on the most recent fiscal half year; therefore, the expense ratio stated above may differ from the expense ratio stated in the financial highlights, which is based on one-year data. The Series’ total return would have been lower had certain expenses not been waived during the period. |
4
Portfolio Composition as of October 31, 2010 (unaudited)
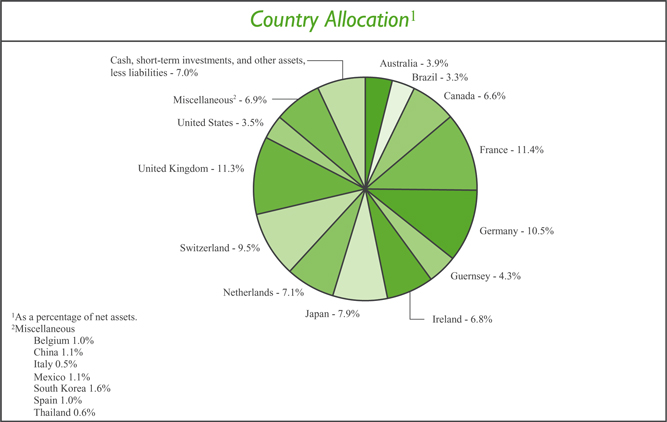
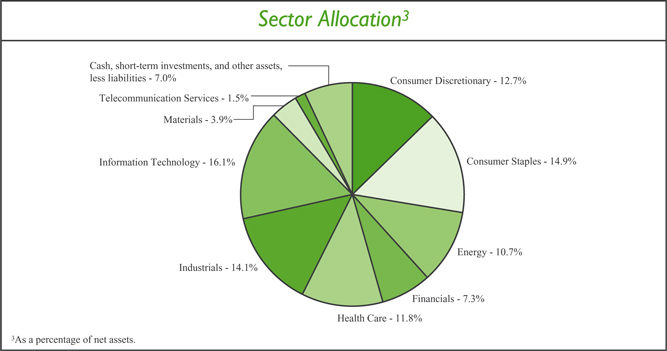
5
Investment Portfolio - October 31, 2010
| | | | | | | | |
| | | Shares | | | Value
(Note 2) | |
| | |
COMMON STOCKS - 92.1% | | | | | | | | |
| | |
Consumer Discretionary - 12.7% | | | | | | | | |
Automobiles - 2.3% | | | | | | | | |
Bayerische Motoren Werke AG (BMW) (Germany)1 | | | 226,390 | | | $ | 16,225,921 | |
Suzuki Motor Corp. (Japan)1 | | | 200,800 | | | | 4,900,846 | |
| | | | | | | | |
| | | | | | | 21,126,767 | |
| | | | | | | | |
Hotels, Restaurants & Leisure - 0.3% | | | | | | | | |
Club Mediterranee S.A. (France)*,1 | | | 143,168 | | | | 2,802,784 | |
| | | | | | | | |
Leisure Equipment & Products - 0.4% | | | | | | | | |
Sankyo Co. Ltd. (Japan)1 | | | 66,200 | | | | 3,527,066 | |
| | | | | | | | |
Media - 7.4% | | | | | | | | |
Grupo Televisa S.A. - ADR (Mexico) | | | 433,020 | | | | 9,721,299 | |
Liberty Global, Inc. - Class A (United States)* | | | 270,020 | | | | 10,204,056 | |
Mediaset S.p.A. (Italy)1 | | | 679,270 | | | | 5,015,189 | |
Reed Elsevier plc (United Kingdom)1 | | | 1,111,370 | | | | 9,534,868 | |
Societe Television Francaise 1 (France)1 | | | 1,402,540 | | | | 22,987,796 | |
Virgin Media, Inc. (United Kingdom) | | | 401,510 | | | | 10,210,399 | |
| | | | | | | | |
| | | | | | | 67,673,607 | |
| | | | | | | | |
Multiline Retail - 1.4% | | | | | | | | |
Marks & Spencer Group plc (United Kingdom)1 | | | 1,852,970 | | | | 12,699,109 | |
| | | | | | | | |
Textiles, Apparel & Luxury Goods - 0.9% | | | | | | | | |
Adidas AG (Germany)1 | | | 131,530 | | | | 8,566,837 | |
| | | | | | | | |
Total Consumer Discretionary | | | | | | | 116,396,170 | |
| | | | | | | | |
Consumer Staples - 14.0% | | | | | | | | |
Beverages - 3.0% | | | | | | | | |
Anheuser-Busch InBev N.V. (Belgium)1 | | | 150,950 | | | | 9,480,253 | |
Heineken N.V. (Netherlands)1 | | | 363,620 | | | | 18,459,276 | |
| | | | | | | | |
| | | | | | | 27,939,529 | |
| | | | | | | | |
Food & Staples Retailing - 5.3% | | | | | | | | |
Carrefour S.A. (France)1 | | | 437,000 | | | | 23,660,750 | |
Tesco plc (United Kingdom)1 | | | 3,582,880 | | | | 24,520,004 | |
| | | | | | | | |
| | | | | | | 48,180,754 | |
| | | | | | | | |
Food Products - 4.9% | | | | | | | | |
Danone S.A. (France)1 | | | 226,250 | | | | 14,345,528 | |
Nestle S.A. (Switzerland)1 | | | 357,620 | | | | 19,588,455 | |
Unilever plc - ADR (United Kingdom) | | | 392,720 | | | | 11,396,734 | |
| | | | | | | | |
| | | | | | | 45,330,717 | |
| | | | | | | | |
Personal Products - 0.8% | | | | | | | | |
Beiersdorf AG (Germany)1 | | | 105,970 | | | | 6,904,001 | |
| | | | | | | | |
Total Consumer Staples | | | | | | | 128,355,001 | |
| | | | | | | | |
The accompanying notes are an integral part of the financial statements.
6
Investment Portfolio - October 31, 2010
| | | | | | | | |
| | | Shares | | | Value
(Note 2) | |
| | |
COMMON STOCKS (continued) | | | | | | | | |
| | |
Energy - 10.7% | | | | | | | | |
Energy Equipment & Services - 7.2% | | | | | | | | |
Calfrac Well Services Ltd. (Canada) | | | 394,050 | | | $ | 9,906,306 | |
Compagnie Generale de Geophysique - Veritas (CGG - Veritas) (France)*,1 | | | 858,270 | | | | 20,048,174 | |
Schlumberger Ltd. (United States) | | | 318,790 | | | | 22,280,233 | |
Trican Well Service Ltd. (Canada) | | | 791,200 | | | | 13,715,478 | |
| | | | | | | | |
| | | | | | | 65,950,191 | |
| | | | | | | | |
Oil, Gas & Consumable Fuels - 3.5% | | | | | | | | |
Cameco Corp. (Canada) | | | 406,910 | | | | 12,597,934 | |
Talisman Energy, Inc. (Canada) | | | 1,073,100 | | | | 19,454,475 | |
| | | | | | | | |
| | | | | | | 32,052,409 | |
| | | | | | | | |
Total Energy | | | | | | | 98,002,600 | |
| | | | | | | | |
Financials - 7.3% | | | | | | | | |
Commercial Banks - 2.0% | | | | | | | | |
Banco Santander S.A. (Spain)1 | | | 717,540 | | | | 9,210,062 | |
HSBC Holdings plc (United Kingdom)1 | | | 922,470 | | | | 9,600,791 | |
| | | | | | | | |
| | | | | | | 18,810,853 | |
| | | | | | | | |
Diversified Financial Services - 2.4% | | | | | | | | |
Deutsche Boerse AG (Germany)1 | | | 265,060 | | | | 18,646,651 | |
Financiere Marc de Lacharriere S.A. (Fimalac) (France)1 | | | 74,940 | | | | 3,225,108 | |
| | | | | | | | |
| | | | | | | 21,871,759 | |
| | | | | | | | |
Insurance - 2.9% | | | | | | | | |
Allianz SE (Germany)1 | | | 135,040 | | | | 16,910,761 | |
Willis Group Holdings plc (United Kingdom) | | | 304,360 | | | | 9,678,648 | |
| | | | | | | | |
| | | | | | | 26,589,409 | |
| | | | | | | | |
Total Financials | | | | | | | 67,272,021 | |
| | | | | | | | |
Health Care - 11.8% | | | | | | | | |
Health Care Equipment & Supplies - 4.2% | | | | | | | | |
Cochlear Ltd. (Australia)1 | | | 136,630 | | | | 9,517,803 | |
Covidien plc (Ireland) | | | 365,760 | | | | 14,582,851 | |
Mindray Medical International Ltd. - ADR (China) | | | 166,530 | | | | 4,826,039 | |
Straumann Holding AG (Switzerland)1 | | | 47,010 | | | | 9,841,555 | |
| | | | | | | | |
| | | | | | | 38,768,248 | |
| | | | | | | | |
Health Care Providers & Services - 3.8% | | | | | | | | |
BML, Inc. (Japan)1 | | | 112,800 | | | | 2,807,090 | |
Bumrungrad Hospital Public Co. Ltd. - NVDR (Thailand)1 | | | 5,057,600 | | | | 5,818,007 | |
Sonic Healthcare Ltd. (Australia)1 | | | 2,445,720 | | | | 26,093,491 | |
| | | | | | | | |
| | | | | | | 34,718,588 | |
| | | | | | | | |
The accompanying notes are an integral part of the financial statements.
7
Investment Portfolio - October 31, 2010
| | | | | | | | |
| | | Shares | | | Value
(Note 2) | |
| | |
COMMON STOCKS (continued) | | | | | | | | |
| | |
Health Care (continued) | | | | | | | | |
Life Sciences Tools & Services - 3.0% | | | | | | | | |
Lonza Group AG (Switzerland)1 | | | 319,230 | | | $ | 27,946,261 | |
| | | | | | | | |
Pharmaceuticals - 0.8% | | | | | | | | |
Santen Pharmaceutical Co. Ltd. (Japan)1 | | | 203,600 | | | | 7,015,900 | |
| | | | | | | | |
Total Health Care | | | | | | | 108,448,997 | |
| | | | | | | | |
Industrials - 14.1% | | | | | | | | |
Aerospace & Defense - 1.0% | | | | | | | | |
Empresa Brasileira de Aeronautica S.A. (Embraer) - ADR (Brazil) | | | 339,160 | | | | 9,784,766 | |
| | | | | | | | |
Air Freight & Logistics - 3.1% | | | | | | | | |
TNT N.V. (Netherlands)1 | | | 1,064,390 | | | | 28,306,573 | |
| | | | | | | | |
Airlines - 2.1% | | | | | | | | |
Ryanair Holdings plc - ADR (Ireland) | | | 588,640 | | | | 19,207,323 | |
| | | | | | | | |
Electrical Equipment - 2.3% | | | | | | | | |
ABB Ltd. (Asea Brown Boveri) - ADR (Switzerland)* | | | 754,060 | | | | 15,601,501 | |
Nexans S.A. (France)1 | | | 76,450 | | | | 5,452,927 | |
| | | | | | | | |
| | | | | | | 21,054,428 | |
| | | | | | | | |
Industrial Conglomerates - 1.5% | | | | | | | | |
Siemens AG (Germany)1 | | | 122,820 | | | | 14,015,659 | |
| | | | | | | | |
Professional Services - 3.0% | | | | | | | | |
Adecco S.A. (Switzerland)1 | | | 248,730 | | | | 13,916,885 | |
Randstad Holding N.V. (Netherlands)*,1 | | | 279,980 | | | | 13,337,913 | |
| | | | | | | | |
| | | | | | | 27,254,798 | |
| | | | | | | | |
Road & Rail - 1.1% | | | | | | | | |
All America Latina Logistica S.A. (Brazil) | | | 629,430 | | | | 5,952,617 | |
Canadian National Railway Co. (Canada) | | | 59,360 | | | | 3,845,341 | |
| | | | | | | | |
| | | | | | | 9,797,958 | |
| | | | | | | | |
Total Industrials | | | | | | | 129,421,505 | |
| | | | | | | | |
Information Technology - 16.1% | | | | | | | | |
Communications Equipment - 1.3% | | | | | | | | |
Alcatel-Lucent - ADR (France)* | | | 3,549,620 | | | | 12,317,181 | |
| | | | | | | | |
Internet Software & Services - 0.6% | | | | | | | | |
VistaPrint N.V. (Netherlands)* | | | 125,120 | | | | 5,263,799 | |
| | | | | | | | |
IT Services - 6.9% | | | | | | | | |
Accenture plc - Class A (Ireland) | | | 211,200 | | | | 9,442,752 | |
Amdocs Ltd. (Guernsey)* | | | 1,283,490 | | | | 39,377,473 | |
Cielo S.A. (Brazil) | | | 874,530 | | | | 7,535,061 | |
Redecard S.A. (Brazil) | | | 536,590 | | | | 6,939,725 | |
| | | | | | | | |
| | | | | | | 63,295,011 | |
| | | | | | | | |
The accompanying notes are an integral part of the financial statements.
8
Investment Portfolio - October 31, 2010
| | | | | | | | |
| | | Shares | | | Value
(Note 2) | |
| | |
COMMON STOCKS (continued) | | | | | | | | |
| | |
Information Technology (continued) | | | | | | | | |
Semiconductors & Semiconductor Equipment - 4.7% | | | | | | | | |
Advantest Corp. (Japan)1 | | | 922,200 | | | $ | 17,515,827 | |
Sumco Corp. (Japan)*,1 | | | 722,860 | | | | 11,178,080 | |
Tokyo Electron Ltd. (Japan)1 | | | 168,400 | | | | 9,501,694 | |
Yingli Green Energy Holding Co. Ltd. - ADR (China)* | | | 413,690 | | | | 4,823,625 | |
| | | | | | | | |
| | | | | | | 43,019,226 | |
| | | | | | | | |
Software - 2.6% | | | | | | | | |
Misys plc (United Kingdom)*,1 | | | 1,618,520 | | | | 7,287,348 | |
SAP AG - ADR (Germany) | | | 136,020 | | | | 7,036,315 | |
Square Enix Holdings Co. Ltd. (Japan)1 | | | 452,600 | | | | 9,452,684 | |
| | | | | | | | |
| | | | | | | 23,776,347 | |
| | | | | | | | |
Total Information Technology | | | | | | | 147,671,564 | |
| | | | | | | | |
Materials - 3.9% | | | | | | | | |
Chemicals - 1.7% | | | | | | | | |
Johnson Matthey plc (United Kingdom)1 | | | 284,920 | | | | 8,737,624 | |
Shin-Etsu Chemical Co. Ltd. (Japan)1 | | | 134,700 | | | | 6,811,241 | |
| | | | | | | | |
| | | | | | | 15,548,865 | |
| | | | | | | | |
Construction Materials - 2.1% | | | | | | | | |
CRH plc (Ireland)1 | | | 1,114,000 | | | | 19,223,001 | |
| | | | | | | | |
Paper & Forest Products - 0.1% | | | | | | | | |
Norbord, Inc. (Canada)* | | | 111,782 | | | | 1,275,755 | |
| | | | | | | | |
Total Materials | | | | | | | 36,047,621 | |
| | | | | | | | |
Telecommunication Services - 1.5% | | | | | | | | |
Wireless Telecommunication Services - 1.5% | | | | | | | | |
SK Telecom Co. Ltd. - ADR (South Korea) | | | 781,540 | | | | 14,403,782 | |
| | | | | | | | |
TOTAL COMMON STOCKS
(Identified Cost $783,734,220) | | | | | | | 846,019,261 | |
| | | | | | | | |
| | |
PREFERRED STOCKS - 0.9% | | | | | | | | |
| | |
Consumer Staples - 0.9% | | | | | | | | |
Household Products - 0.9% | | | | | | | | |
Henkel AG & Co. KGaA (Germany)1
(Identified Cost $4,649,810) | | | 133,570 | | | | 7,878,601 | |
| | | | | | | | |
| | |
SHORT-TERM INVESTMENTS - 6.3% | | | | | | | | |
| | |
Dreyfus Cash Management, Inc. - Institutional Shares2, 0.16%
(Identified Cost $57,898,959) | | | 57,898,959 | | | | 57,898,959 | |
| | | | | | | | |
The accompanying notes are an integral part of the financial statements.
9
Investment Portfolio - October 31, 2010
| | | | |
| | | Value
(Note 2) | |
| |
TOTAL INVESTMENTS - 99.3%
(Identified Cost $846,282,989) | | $ | 911,796,821 | |
OTHER ASSETS, LESS LIABILITIES - 0.7% | | | 6,475,668 | |
| | | | |
NET ASSETS - 100% | | $ | 918,272,489 | |
| | | | |
ADR - American Depository Receipt
NVDR - Non-Voting Depository Receipt
| * | Non-income producing security |
| 1 | International Fair Value factor from pricing service was applied. |
| 2 | Rate shown is the current yield as of October 31, 2010. |
The Series’ portfolio holds, as a percentage of net assets, greater than 10% in the following countries:
France - 11.4%; United Kingdom - 11.3%; Germany - 10.5%.
The accompanying notes are an integral part of the financial statements.
10
Statement of Assets & Liabilities
October 31, 2010
| | | | |
ASSETS: | | | | |
| |
Investments, at value (identified cost $846,282,989) (Note 2) | | $ | 911,796,821 | |
Cash | | | 18,173,402 | |
Receivable for fund shares sold | | | 9,922,416 | |
Dividends receivable | | | 1,127,322 | |
Foreign tax reclaims receivable | | | 1,011,535 | |
| | | | |
| |
TOTAL ASSETS | | | 942,031,496 | |
| | | | |
| |
LIABILITIES: | | | | |
| |
Accrued management fees (Note 3) | | | 487,944 | |
Accrued fund accounting and administration fees (Note 3) | | | 28,732 | |
Accrued transfer agent fees (Note 3) | | | 1,616 | |
Accrued Chief Compliance Officer service fees (Note 3) | | | 247 | |
Payable for securities purchased | | | 23,073,994 | |
Payable for fund shares repurchased | | | 71,419 | |
Other payables and accrued expenses | | | 95,055 | |
| | | | |
| |
TOTAL LIABILITIES | | | 23,759,007 | |
| | | | |
| |
TOTAL NET ASSETS | | $ | 918,272,489 | |
| | | | |
| |
NET ASSETS CONSIST OF: | | | | |
| |
Capital stock | | $ | 379,080 | |
Additional paid-in-capital | | | 850,908,587 | |
Undistributed net investment income | | | 9,250,387 | |
Accumulated net realized loss on investments, foreign currency and translation of other assets and liabilities | | | (7,874,863 | ) |
Net unrealized appreciation on investments, foreign currency and translation of other assets and liabilities | | | 65,609,298 | |
| | | | |
| |
TOTAL NET ASSETS | | $ | 918,272,489 | |
| | | | |
| |
NET ASSET VALUE, OFFERING PRICE AND REDEMPTION PRICE PER SHARE - Class A ($918,272,489/37,908,043 shares) | | $ | 24.22 | |
| | | | |
The accompanying notes are an integral part of the financial statements.
11
Statement of Operations
For the Year Ended October 31, 2010
| | | | |
INVESTMENT INCOME: | | | | |
| |
Dividends (net of foreign taxes withheld, $1,537,778) | | $ | 14,150,599 | |
Interest | | | 552 | |
| | | | |
| |
Total Investment Income | | | 14,151,151 | |
| | | | |
| |
EXPENSES: | | | | |
| |
Management fees (Note 3) | | | 4,559,621 | |
Fund accounting and administration fees (Note 3) | | | 115,894 | |
Directors’ fees (Note 3) | | | 15,652 | |
Transfer agent fees (Note 3) | | | 5,087 | |
Chief Compliance Officer service fees (Note 3) | | | 2,724 | |
Custodian fees | | | 142,700 | |
Miscellaneous | | | 127,791 | |
| | | | |
| |
Total Expenses | | | 4,969,469 | |
Less reduction of expenses (Note 3) | | | (83,399 | ) |
| | | | |
| |
Net Expenses | | | 4,886,070 | |
| | | | |
| |
NET INVESTMENT INCOME | | | 9,265,081 | |
| | | | |
| |
REALIZED AND UNREALIZED GAIN ON INVESTMENTS AND FOREIGN CURRENCY: | | | | |
| |
Net realized gain on- | | | | |
Investments | | | 1,393,481 | |
Foreign currency and translation of other assets and liabilities | | | 4,257 | |
| | | | |
| | | 1,397,738 | |
| | | | |
| |
Net change in unrealized appreciation on- | | | | |
Investments | | | 69,198,253 | |
Foreign currency and translation of other assets and liabilities | | | 67,132 | |
| | | | |
| | | 69,265,385 | |
| | | | |
| |
NET REALIZED AND UNREALIZED GAIN ON INVESTMENTS AND FOREIGN CURRENCY | | | 70,663,123 | |
| | | | |
| |
NET INCREASE IN NET ASSETS RESULTING FROM OPERATIONS | | $ | 79,928,204 | |
| | | | |
The accompanying notes are an integral part of the financial statements.
12
Statements of Changes in Net Assets
| | | | | | | | |
| | | For the
Year Ended
10/31/10 | | | For the
Year Ended
10/31/09 | |
INCREASE (DECREASE) IN NET ASSETS: | | | | | | | | |
| | |
OPERATIONS: | | | | | | | | |
| | |
Net investment income | | $ | 9,265,081 | | | $ | 5,685,176 | |
Net realized gain (loss) on investments and foreign currency | | | 1,397,738 | | | | (9,203,449 | ) |
Net change in unrealized appreciation (depreciation) on investments and foreign currency | | | 69,265,385 | | | | 95,428,502 | |
| | | | | | | | |
| | |
Net increase from operations | | | 79,928,204 | | | | 91,910,229 | |
| | | | | | | | |
| | |
DISTRIBUTIONS TO SHAREHOLDERS (Note 8): | | | | | | | | |
| | |
From net investment income | | | (4,177,043 | ) | | | (4,819,796 | ) |
From net realized gain on investments | | | — | | | | (4,482,170 | ) |
| | | | | | | | |
| | |
Total distributions to shareholders | | | (4,177,043 | ) | | | (9,301,966 | ) |
| | | | | | | | |
| | |
CAPITAL STOCK ISSUED AND REPURCHASED: | | | | | | | | |
| | |
Net increase from capital share transactions (Note 5) | | | 394,080,109 | | | | 191,461,774 | |
| | | | | | | | |
| | |
Net increase in net assets | | | 469,831,270 | | | | 274,070,037 | |
| | |
NET ASSETS: | | | | | | | | |
| | |
Beginning of year | | | 448,441,219 | | | | 174,371,182 | |
| | | | | | | | |
| | |
End of year (including undistributed net investment income of $9,250,387 and $4,148,866, respectively) | | $ | 918,272,489 | | | $ | 448,441,219 | |
| | | | | | | | |
The accompanying notes are an integral part of the financial statements.
13
Financial Highlights
| | | | | | | | | | | | | | | | | | | | |
| | | For the Years Ended | |
| | | 10/31/10 | | | 10/31/09 | | | 10/31/08 | | | 10/31/07 | | | 10/31/06 | |
Per share data (for a share outstanding throughout each year): | | | | | | | | | | | | | | | | | | | | |
Net asset value - Beginning of year | | $ | 21.68 | | | $ | 17.78 | | | $ | 33.55 | | | $ | 26.69 | | | $ | 21.56 | |
| | | | | | | | | | | | | | | | | | | | |
Income (loss) from investment operations: | | | | | | | | | | | | | | | | | | | | |
Net investment income | | | 0.32 | 1 | | | 0.36 | 1 | | | 0.34 | | | | 0.40 | 1 | | | 0.42 | 1 |
Net realized and unrealized gain (loss) on investments | | | 2.41 | | | | 4.35 | | | | (13.17 | ) | | | 7.16 | | | | 6.42 | |
| | | | | | | | | | | | | | | | | | | | |
Total from investment operations | | | 2.73 | | | | 4.71 | | | | (12.83 | ) | | | 7.56 | | | | 6.84 | |
| | | | | | | | | | | | | | | | | | | | |
Less distributions to shareholders: | | | | | | | | | | | | | | | | | | | | |
From net investment income | | | (0.19 | ) | | | (0.42 | ) | | | (0.29 | ) | | | (0.17 | ) | | | (0.21 | ) |
From net realized gain on investments | | | — | | | | (0.39 | ) | | | (2.65 | ) | | | (0.53 | ) | | | (1.50 | ) |
| | | | | | | | | | | | | | | | | | | | |
Total distributions to shareholders | | | (0.19 | ) | | | (0.81 | ) | | | (2.94 | ) | | | (0.70 | ) | | | (1.71 | ) |
| | | | | | | | | | | | | | | | | | | | |
Net asset value - End of year | | $ | 24.22 | | | $ | 21.68 | | | $ | 17.78 | | | $ | 33.55 | | | $ | 26.69 | |
| | | | | | | | | | | | | | | | | | | | |
Net assets - End of year
(000’s omitted) | | $ | 918,272 | | | $ | 448,441 | | | $ | 174,371 | | | $ | 216,637 | | | $ | 87,418 | |
| | | | | | | | | | | | | | | | | | | | |
Total return2 | | | 12.68 | % | | | 28.10 | % | | | (41.58 | %) | | | 28.88 | % | | | 33.68 | % |
Ratios (to average net assets)/Supplemental Data: | | | | | | | | | | | | | | | | | | | | |
Expenses* | | | 0.75 | % | | | 0.75 | % | | | 0.80 | % | | | 0.84 | % | | | 0.95 | % |
Net investment income | | | 1.42 | % | | | 1.97 | % | | | 1.48 | % | | | 1.34 | % | | | 1.69 | % |
Portfolio turnover | | | 36 | % | | | 49 | % | | | 43 | % | | | 54 | % | | | 54 | % |
|
* The investment advisor did not impose all or a portion of its management fees, CCO fees, fund accounting and transfer agent fees, and other fees in some years and in some years paid a portion of the Series’ expenses. If these expenses had been incurred by the Series, the expense ratio (to average net assets) would have been increased by the following amount: | |
| | | | | |
| | | 0.01 | % | | | 0.05 | % | | | 0.03 | % | | | N/A | | | | 0.09 | % |
| 1 | Calculated based on average shares outstanding during the year. |
| 2 | Represents aggregate total return for the years indicated, and assumes reinvestment of all distributions. Total returns would have been lower had certain expenses not been waived or reimbursed during certain years. |
The accompanying notes are an integral part of the financial statements.
14
Notes to Financial Statements
Overseas Series (the “Series”) is a no-load diversified series of Manning & Napier Fund, Inc. (the “Fund”). The Fund is organized in Maryland and is registered under the Investment Company Act of 1940, as amended, as an open-end management investment company.
The Series’ investment objective is to provide long-term growth by investing primarily in common stocks of issuers from outside the United States.
The Fund’s Advisor is Manning & Napier Advisors, Inc. (the “Advisor”). Shares of the Series are offered to investors and employees of the Advisor and its affiliates. The total authorized capital stock of the Fund consists of 10.0 billion shares of common stock each having a par value of $0.01. As of October 31, 2010, 6.2 billion shares have been designated in total among 29 series, of which 100 million have been designated as Overseas Series Class A common stock.
| 2. | SIGNIFICANT ACCOUNTING POLICIES |
Security Valuation
Portfolio securities, including domestic equities, foreign equities, warrants and options, listed on an exchange other than the NASDAQ National Market System are valued at the latest quoted sales price of the exchange on which the security is primarily traded. Securities not traded on valuation date or securities not listed on an exchange are valued at the latest quoted bid price provided by the Fund’s pricing service. Securities listed on the NASDAQ National Market System are valued in accordance with the NASDAQ Official Closing Price.
Short-term investments that mature in sixty days or less are valued at amortized cost, which approximates market value. Investments in open-end investment companies are valued at their net asset value per share on valuation date.
Volume and level of activity in established markets for an asset or liability are evaluated to determine whether recent transactions and quoted prices are determinative of fair value. Where there have been significant decreases in volume and level of activity, further analysis and adjustment may be necessary to estimate fair value. The Series measures fair value in these instances by the use of inputs and valuation techniques which may be based upon current market prices of securities that are comparable in coupon, rating, maturity and industry and/or expectation of future cash flows. As a result of trading in relatively thin markets and/or markets that experience significant volatility, the prices used by the Series to value these securities may differ from the value that would be realized if these securities were sold, and the differences could be material.
Securities for which representative valuations or prices are not available from the Fund’s pricing service may be valued at fair value. Due to the inherent uncertainty of valuations of such securities, the fair value may differ significantly from the values that would have been used had a ready market for such securities existed. If trading or events occurring after the close of the principal market in which securities are traded are expected to materially affect the value of those securities, then they may be valued at their fair value, taking this trading or these events into account. Fair value is determined in good faith by the Advisor under procedures approved by and under the general supervision and responsibility of the Fund’s Board of Directors (the “Board”). In accordance with the procedures approved by the Board, the Series apply fair value pricing on a daily basis except for North American, Central American, South American and Caribbean equity securities. Fair valuing of securities is determined with the assistance of a pricing service using calculations or factors based on indices of domestic securities and other appropriate indicators, such as prices of relevant American Depository Receipts and futures contracts, to adjust local market prices for subsequent movements through the time the Fund calculates its net asset value. The value of securities used for net asset value calculation under these procedures may differ from published prices for the same securities. It is the Fund’s policy
15
Notes to Financial Statements
| 2. | SIGNIFICANT ACCOUNTING POLICIES (continued) |
Security Valuation (continued)
to classify each equity security, except for those in the regions noted above, as Level 2 securities due to the fact the pricing service evaluated what factor was applied to the calculated end of day market price.
Various inputs are used in determining the value of the Series’ assets or liabilities carried at market value. These inputs are summarized in three broad levels. Level 1 includes quoted prices in active markets for identical assets and liabilities. Level 2 includes other significant observable inputs (including quoted prices for similar securities, interest rates, prepayment speeds, credit risk, etc.). Level 3 includes significant unobservable inputs (including the Series’ own assumptions in determining the fair value of investments). The inputs or methodology used for valuing securities are not necessarily an indication of the risk associated with investing in those securities.
The following is a summary of the valuation levels used for major security types as of October 31, 2010 in valuing the Series’ assets or liabilities carried at market value:
| | | | | | | | | | | | | | | | |
Description | | Total | | | Level 1 | | | Level 2 | | | Level 3 | |
Assets: | | | | | | | | | | | | | | | | |
Equity securities* | | $ | 846,019,261 | | | $ | 311,381,468 | | | $ | 534,637,793 | | | $ | — | |
Preferred securities | | | 7,878,601 | | | | — | | | | 7,878,601 | | | | — | |
Debt securities | | | — | | | | — | | | | — | | | | — | |
Mutual funds | | | 57,898,959 | | | | 57,898,959 | | | | — | | | | — | |
Other financial instruments**: | | | — | | | | — | | | | — | | | | — | |
| | | | | | | | | | | | | | | | |
Total assets: | | | 911,796,821 | | | | 369,280,427 | | | | 542,516,394 | | | | — | |
| | | | | | | | | | | | | | | | |
Liabilities: | | | | | | | | | | | | | | | | |
Other financial instruments**: | | | — | | | | — | | | | — | | | | — | |
| | | | | | | | | | | | | | | | |
Total Liabilities: | | | — | | | | — | | | | — | | | | — | |
| | | | | | | | | | | | | | | | |
Total | | $ | 911,796,821 | | | $ | 369,280,427 | | | $ | 542,516,394 | | | $ | — | |
| | | | | | | | | | | | | | | | |
| * | Includes common stock, warrants and rights. Please see the Investment Portfolio for industry classification and for securities where International Fair Value factor from pricing service was applied to value the security. Such securities are classified as Level 2. |
| ** | Other financial instruments are derivative instruments not reflected in the Investment Portfolio, such as futures, forwards and swap contracts, which are valued at the unrealized appreciation/depreciation on the instrument. As of October 31, 2010, the Series did not hold any derivative instruments. |
There were no Level 3 securities held by the Series as of October 31, 2009 or October 31, 2010.
The Fund’s policy is to recognize transfers in and transfers out of the valuation levels as of the beginning of the reporting period. During the year ended October 31, 2010, the Fund had a significant amount of foreign equity securities transfer from Level 1 to Level 2 due to the implementation of new international fair value pricing procedures. The following is a summary of the foreign equity securities that transferred from Level 1 to Level 2:
16
Notes to Financial Statements
| 2. | SIGNIFICANT ACCOUNTING POLICIES (continued) |
Security Valuation (continued)
| | | | | | | | | | | | | | | | |
| | | Total #
Securities
Level 1 at
beginning and
Level 2 at end
of period | | | Total Market
Value
Beginning of
period | | | Total Market
Value
End of period | | | Change in
Market Value | |
| | | 27 | | | $ | 193,137,418 | | | $ | 366,079,119 | | | $ | 172,941,701 | |
Additional disclosure surrounding the activity in Level 3 fair value measurement will also be effective for fiscal years beginning after December 15, 2010. Management has concluded that this will not have a material impact on the Series’ financial statements.
Security Transactions, Investment Income and Expenses
Security transactions are accounted for on trade date. Dividend income is recorded on the ex-dividend date, except that if the ex-dividend date has passed, certain dividends from foreign securities are recorded as soon as the Fund is informed of the ex-dividend date. Non-cash dividends, if any, are recorded at the fair market value of the securities received. Interest income, including amortization of premium and accretion of discounts using the effective interest method, is earned from settlement date and accrued daily.
Expenses are recorded on an accrual basis. Most expenses of the Fund can be attributed to a specific series. Expenses which cannot be directly attributed are apportioned among the series in the Fund in such a manner as deemed equitable by the Fund’s Board, taking into consideration, among other things, the nature and type of expense.
The Series uses the identified cost method for determining realized gain or loss on investments for both financial statement and federal income tax reporting purposes.
Foreign Currency Translation
The books and records of the Series are maintained in U.S. dollars. Foreign currencies, investments and other assets and liabilities are translated into U.S. dollars at the current exchange rates. Purchases and sales of investment securities and income and expenses are translated on the respective dates of such transactions. The Series does not isolate realized and unrealized gains and losses attributable to changes in the exchange rates from gains and losses that arise from changes in the market value of investments. Such fluctuations are included with net realized and unrealized gain or loss on investments. Net realized foreign currency gains and losses represent foreign currency gains and losses between trade date and settlement date on securities transactions, gains and losses on disposition of foreign currencies and the difference between the amount of income and foreign withholding taxes recorded on the books of the Series and the amounts actually received or paid.
Federal Taxes
The Series’ policy is to comply with the provisions of the Internal Revenue Code applicable to regulated investment companies. The Series is not subject to federal income tax or excise tax to the extent that the Series distributes to shareholders each year its taxable income, including any net realized gains on investments, in accordance with requirements of the Internal Revenue Code. Accordingly, no provision for federal income tax or excise tax has been made in the financial statements.
Management evaluates its tax positions to determine if the tax positions taken meet the minimum recognition threshold in connection with accounting for uncertainties in income tax positions taken or expected to be taken for the purposes of measuring and recognizing tax liabilities in the financial statements. Recognition of tax benefits of an uncertain tax position is required only when the position is “more likely than not” to be sustained assuming examination by
17
Notes to Financial Statements
| 2. | SIGNIFICANT ACCOUNTING POLICIES (continued) |
Federal Taxes (continued)
taxing authorities. At October 31, 2010, the Series has recorded no liability for net unrecognized tax benefits relating to uncertain income tax positions taken or expected to be taken in future tax returns.
The Series files income tax returns in the U.S. federal jurisdiction, various states and foreign jurisdictions, as required. No income tax returns are currently under investigation. The statute of limitations on the Series’ tax returns remains open for the years ended October 31, 2007 through October 31, 2010. The Fund is not aware of any tax positions for which it is reasonably possible that the total amounts of unrecognized tax benefits will significantly change in the next twelve months.
Additionally, based on the Fund’s understanding of the tax rules and rates related to income, gains and transactions for foreign jurisdictions in which it invests, the Series will provide for foreign taxes, and where appropriate, deferred foreign tax.
Distributions of Income and Gains
Distributions to shareholders of net investment income and net realized gains are made annually. An additional distribution may be necessary to avoid taxation of the Series. Distributions are recorded on the ex-dividend date.
Indemnifications
The Fund’s organizational documents provide former and current directors and officers with a limited indemnification against liabilities arising in connection with the performance of their duties to the Fund. In the normal course of business, the Fund may also enter into contracts that provide general indemnifications. The Fund’s maximum exposure under these arrangements is unknown as this would be dependent on future claims that may be made against the Fund. The risk of material loss from such claims is considered remote.
Other
The preparation of financial statements in conformity with accounting principles generally accepted in the United States of America requires management to make estimates and assumptions that affect the reported amounts of assets and liabilities and the disclosure of contingent assets and liabilities at the date of the financial statements and the reported amounts of income and expenses during the reporting period. Actual results could differ from those estimates.
| 3. | TRANSACTIONS WITH AFFILIATES |
The Fund has an Investment Advisory Agreement (the “Agreement”) with the Advisor, for which the Series pays a fee, computed daily and payable monthly, at an annual rate of 0.70% of the Series’ average daily net assets.
Under the Agreement, personnel of the Advisor provide the Series with advice and assistance in the choice of investments and the execution of securities transactions, and otherwise maintain the Series’ organization. The Advisor also provides the Fund with necessary office space and fund administration and support services. The salaries of all officers of the Fund (except a percentage of the Fund’s Chief Compliance Officer’s salary, which is paid by the Fund), and of all Directors who are “affiliated persons” of the Fund, or of the Advisor, and all personnel of the Fund, or of the Advisor, performing services relating to research, statistical and investment activities, are paid by the Advisor. Each “non-affiliated” Director receives an annual stipend, which is allocated among all the active series of the Fund. In addition, these Directors also receive a fee per Board meeting attended for each active series of the Fund plus a fee for each committee meeting attended.
The Advisor has contractually agreed, until at least February 28, 2011, to waive its fee and, if necessary, pay other operating expenses of the Series in order to maintain total direct annual fund operating expenses for the Series at no more than 0.75% of average daily net assets each year. Accordingly, the Advisor waived fees of $82,640 for
18
Notes to Financial Statements
| 3. | TRANSACTIONS WITH AFFILIATES (continued) |
the year ended October 31, 2010, which is included as a reduction of expenses on the Statement of Operations. The Advisor voluntarily waived additional fees of $759 for the year ended October 31, 2010, which is also included as a reduction of expenses on the Statement of Operations. The Advisor is not eligible to recoup any expenses that have been waived or reimbursed in prior years.
Manning & Napier Investor Services, Inc., a registered broker-dealer affiliate of the Advisor, acts as distributor for the Fund’s shares. The services of Manning & Napier Investor Services, Inc. are provided at no additional cost to the Series.
For fund accounting and transfer agent services through November 7, 2009, the Fund paid the Advisor an annual fee of 0.055% of the Fund’s average daily net assets up to $4.5 billion, 0.03% of the Fund’s average daily net assets between $4.5 billion and $7.5 billion, and 0.02% of the Fund’s average daily net assets over $7.5 billion. Additionally, certain transaction and account-based fees and out-of-pocket expenses, including charges for reporting relating to the Fund’s compliance program, were charged. Prior to October 12, 2009 (for sub-accountant) and November 9, 2009 (for sub-transfer agent), the Advisor had an agreement with Citi Fund Services Ohio, Inc. (“Citi”) under which Citi served as sub-accountant and sub-transfer agent.
The Advisor has entered into agreements dated October 12, 2009 and November 9, 2009 with PNC Global Investment Servicing (U.S.) Inc. (“PNCGIS”) under which PNCGIS serves as sub-accountant services agent and sub-transfer agent, respectively. Effective November 7, 2009 under the amended master services agreement, the Fund pays the Advisor an annual fee related to Fund Accounting and administration of 0.0175% on the first $3 billion of average daily net assets (excluding Target Series); 0.015% on the next $3 billion of average daily net assets (excluding Target Series); and 0.01% of the average daily net assets in excess of $6 billion (excluding Target Series); plus a base fee of $25,500 per Series. Transfer Agent fees are charged to the Fund on a per account basis. Additionally, certain transaction-, cusip-based fees and out-of-pocket expenses, including charges for reporting relating to the Fund’s compliance program, are charged.
Effective July 1, 2010, PNCGIS, which serves as the Series’ sub-accountant services agent and sub-transfer agent, was sold to The Bank of New York Mellon Corporation, the Series’ custodian. At the close of the sale, PNCGIS changed its name to BNY Mellon Investment Servicing (U.S.) Inc. (“BNY”).
Expenses not directly attributable to a Series are allocated based on each Series’ relative net assets or number of accounts, depending on the expense.
| 4. | PURCHASES AND SALES OF SECURITIES |
For the year ended October 31, 2010, purchases and sales of securities, other than U.S. Government securities and short-term securities, were $582,581,636 and $218,297,082, respectively. There were no purchases or sales of U.S. Government securities.
19
Notes to Financial Statements
| 5. | CAPITAL STOCK TRANSACTIONS |
Transactions in Class A shares of Overseas Series were:
| | | | | | | | | | | | | | | | |
| | | For the Year
Ended 10/31/10 | | | For the Year
Ended 10/31/09 | |
| | | Shares | | | Amount | | | Shares | | | Amount | |
Sold | | | 20,854,822 | | | $ | 474,864,322 | | | | 12,172,723 | | | $ | 214,883,533 | |
Reinvested | | | 149,986 | | | | 3,353,687 | | | | 474,684 | | | | 7,609,183 | |
Repurchased | | | (3,776,695 | ) | | | (84,137,900 | ) | | | (1,775,090 | ) | | | (31,030,942 | ) |
| | | | | | | | | | | | | | | | |
Total | | | 17,228,113 | | | $ | 394,080,109 | | | | 10,872,317 | | | $ | 191,461,774 | |
| | | | | | | | | | | | | | | | |
At October 31, 2010, the retirement plan of the Advisor and its affiliates owned 142,305 shares of the Series (0.4% of shares outstanding) valued at $3,446,630.
The Series may trade in instruments including written and purchased options, forward foreign currency exchange contracts and futures contracts and other derivatives in the normal course of investing activities to assist in managing exposure to various market risks. The Series may be subject to various elements of risk and may involve, to a varying degree, elements of risk in excess of the amounts recognized for financial statement purposes. These risks include: the risk that changes in the value of a derivative may not correlate perfectly with the underlying asset, rate or index, counterparty credit risk related to over the counter derivatives counterparties failure to perform under contract terms, liquidity risk related to the lack of a liquid market for these contracts allowing the fund to close out its position(s) and documentation risk relating to disagreement over contract terms. No such investments were held by the Series on October 31, 2010.
Investing in securities of foreign companies and foreign governments involves special risks and considerations not typically associated with investing in securities of domestic companies and the U.S. Government. These risks include revaluation of currencies and future adverse political and economic developments. Moreover, securities of foreign companies and foreign governments and their markets may be less liquid and their prices more volatile than those of comparable domestic companies and the U.S. Government.
| 8. | FEDERAL INCOME TAX INFORMATION |
The amount and characterization of certain income and capital gains to be distributed are determined in accordance with federal income tax regulations, which may differ from accounting principles generally accepted in the United States of America. These differences are primarily due to differing book and tax treatments in the timing of the recognition of net investment income or gains and losses, including losses deferred due to wash sales and foreign currency gains and losses. The Series may periodically make reclassifications among its capital accounts to reflect income and gains available for distribution (or available capital loss carryovers) under income tax regulations, without impacting the Series’ net asset value. Any such reclassifications are not reflected in the financial highlights.
20
Notes to Financial Statements
| 8. | FEDERAL INCOME TAX INFORMATION (continued) |
The tax character of distributions paid were as follows:
| | | | | | | | |
| | | For the Year
Ended
10/31/10 | | | For the Year
Ended
10/31/09 | |
Ordinary income | | $ | 4,177,043 | | | $ | 5,226,572 | |
Long-term capital gains | | | — | | | | 4,075,394 | |
At October 31, 2010, the tax components of distributable earnings and the net unrealized appreciation based on the identified cost for federal income tax purposes were as follows:
| | | | |
Cost for federal income tax purposes | | $ | 854,187,716 | |
Unrealized appreciation | | $ | 90,591,332 | |
Unrealized depreciation | | | (32,982,227 | ) |
| | | | |
Net unrealized appreciation | | $ | 57,609,105 | |
| | | | |
Undistributed ordinary income | | | 9,280,251 | |
The capital loss carryover utilized in the current year was $5,298,244.
21
Report of Independent Registered Public Accounting Firm
To the Board of Directors of Manning & Napier Fund, Inc. and Shareholders of Overseas Series:
In our opinion, the accompanying statement of assets and liabilities, including the investment portfolio, and the related statements of operations and of changes in net assets and the financial highlights present fairly, in all material respects, the financial position of the Overseas Series (a series of Manning & Napier Fund, Inc., hereafter referred to as the “Series”) at October 31, 2010, and the results of its operations for the year then ended, the changes in its net assets for each of the two years in the period then ended and the financial highlights for each of the five years in the period then ended, in conformity with accounting principles generally accepted in the United States of America. These financial statements and financial highlights (hereafter referred to as “financial statements”) are the responsibility of the Series’ management. Our responsibility is to express an opinion on these financial statements based on our audits. We conducted our audits of these financial statements in accordance with the standards of the Public Company Accounting Oversight Board (United States). Those standards require that we plan and perform the audit to obtain reasonable assurance about whether the financial statements are free of material misstatement. An audit includes examining, on a test basis, evidence supporting the amounts and disclosures in the financial statements, assessing the accounting principles used and significant estimates made by management, and evaluating the overall financial statement presentation. We believe that our audits, which included confirmation of securities at October 31, 2010 by correspondence with the custodian and brokers, provide a reasonable basis for our opinion.

New York, New York
December 21, 2010
22
Supplemental Tax Information (unaudited)
All designations are based on financial information available as of the date of this annual report and, accordingly are subject to change.
For federal income tax purposes, the Series designates for the current fiscal year $3,868,367 or, if different, the maximum amount allowable under the tax law, as qualified dividend income.
For corporate shareholders, the percentage of investment income (dividend income plus short-term gains, if any) that qualifies for the dividends received deduction for the current fiscal year is 1.89%.
23
Directors’ and Officers’ Information (unaudited)
The Statement of Additional Information provides additional information about the Fund’s directors and officers and can be obtained without charge by calling 1-800-466-3863, at www.manningnapieradvisors.com, or on the EDGAR Database on the SEC Internet web site (http:// www.sec.gov). The following chart shows certain information about the Fund’s officers and directors, including their principal occupations during the last five years. Unless specific dates are provided, the individuals have held the listed positions for longer than five years.
INTERESTED DIRECTOR/OFFICER
| | |
Name: | | B. Reuben Auspitz* |
Address: | | 290 Woodcliff Drive |
| | Fairport, NY 14450 |
Age: | | 63 |
Current Position(s) Held with Fund: | | Principal Executive Officer, President, Chairman & Director |
Term of Office1 & Length of Time Served: | | Indefinite - Director since 1984; Vice President 1984 - 2003; President |
| | since 2004; Principal Executive Officer since 2002 |
Principal Occupation(s) During Past 5 Years: | | Executive Vice President; Executive Group Member**; Chief Compliance |
| | Officer since 2004; Vice Chairman since June 2010; Co-Executive |
| | Director from 2003-2010 - Manning & Napier Advisors, Inc. President; |
| | Director - Manning & Napier Investor Services, Inc. |
| | Holds or has held one or more of the following titles for various |
| | subsidiaries and affiliates: President, Vice President, Director, Chairman, |
| | Treasurer, Chief Compliance Officer or Member. |
Number of Portfolios Overseen within Fund Complex: | | 29 |
Other Directorships Held Outside Fund Complex: | | N/A |
| INDEPENDENT DIRECTORS | | |
| |
Name: | | Stephen B. Ashley |
Address: | | 290 Woodcliff Drive |
| | Fairport, NY 14450 |
Age: | | 70 |
Current Position(s) Held with Fund: | | Director, Audit Committee Member, Governance & Nominating |
| | Committee Member |
Term of Office & Length of Time Served: | | Indefinite - Since 1996 |
Principal Occupation(s) During Past 5 Years: | | Chairman, Director, President & Chief Executive Officer, The Ashley |
| | Group (property management and investment). Chairman |
| | (non-executive) 2004-2008; Director 1995-2008 - Fannie Mae (mortgage) |
Number of Portfolios Overseen within Fund Complex: | | 29 |
Other Directorships Held Outside Fund Complex: | | The Ashley Group (1995-2008) |
| | | Genesee Corporation (1987-2007) |
Name: | | Peter L. Faber |
Address: | | 290 Woodcliff Drive |
| | Fairport, NY 14450 |
Age: | | 72 |
Current Position(s) Held with Fund: | | Director, Governance & Nominating Committee Member |
Term of Office & Length of Time Served: | | Indefinite - Since 1987 |
Principal Occupation(s) During Past 5 Years: | | Senior Counsel since 2006, Partner (1995 - 2006) - McDermott, Will & |
| | Emery LLP (law firm) |
Number of Portfolios Overseen within Fund Complex: | | 29 |
Other Directorships Held Outside Fund Complex: | | Partnership for New York City, Inc. (non-profit) |
| | New York Collegium (non-profit) |
| | | Boston Early Music Festival (non-profit) |
24
Directors’ and Officers’ Information (unaudited)
INDEPENDENT DIRECTORS (continued)
| | |
Name: | | Harris H. Rusitzky |
Address: | | 290 Woodcliff Drive |
| | Fairport, NY 14450 |
Age: | | 75 |
Current Position(s) Held with Fund: | | Director, Audit Committee Member, Governance & Nominating |
| | Committee Member |
Term of Office & Length of Time Served: | | Indefinite - Since 1985 |
Principal Occupation(s) During Past 5 Years: | | President, The Greening Group (business consultants) since 1994; |
| | Partner, The Restaurant Group (restaurants) since 2006 |
Number of Portfolios Overseen within Fund Complex: | | 29 |
Other Directorships Held Outside Fund Complex: | | N/A |
Name: | | Paul A. Brooke |
Address: | | 290 Woodcliff Drive |
| | Fairport, NY 14450 |
Age: | | 64 |
Current Position(s) Held with Fund: | | Director, Audit Committee Member, Governance & Nominating |
| | Committee Member |
Term of Office & Length of Time Served: | | Indefinite - Since 2007 |
Principal Occupation(s) During Past 5 Years: | | Chairman & CEO, Alsius Corp. (investments); Managing Member, PMSV Holdings LLC (investments) |
Number of Portfolios Overseen within Fund Complex: | | 29 |
Other Directorships Held Outside Fund Complex: | | Incyte Corp. (2000-present) |
| | ViroPharma, Inc. (2000-present) |
| | HLTH Corp. (2000-present) |
| | Cheyne Capital International (2000-present) |
| | MPM Bio-equities (2000-present) |
| | GMP Companies (2000-present) |
| | | HoustonPharma (2000-present) |
Name: | | Richard M. Hurwitz |
Address: | | 290 Woodcliff Drive |
| | Fairport, NY 14450 |
Age: | | 47 |
Current Position(s) Held with Fund: | | Director, Audit Committee Member, Governance & Nominating |
| | Committee Member |
Term of Office & Length of Time Served: | | Indefinite - Since 2009 |
Principal Occupation(s) During Past 5 Years: | | Chief Executive Officer, Pictometry International Corp. since August 2010 (provider of georeferenced, aerial image libraries and related software) Managing Partner (2006-July 2010) - Aegis Investment Partners, LLC (investments); Founder and Managing Partner (2004-2005) - Village Markets, LLC (groceries) |
Number of Portfolios Overseen within Fund Complex: | | 29 |
Other Directorships Held Outside Fund Complex: | | Pictometry International Corp. (2000-2010) |
| | Pioneering Technologies (2006-2009) |
| | | Vensearch Capital Corp. (2003-2007) |
25
Directors’ and Officers’ Information (unaudited)
| | |
| OFFICERS | | |
| |
Name: | | Jeffrey S. Coons, Ph.D., CFA |
Address: | | 290 Woodcliff Drive |
| | Fairport, NY 14450 |
Age: | | 47 |
Current Position(s) Held with Fund: | | Vice President |
Term of Office1 & Length of Time Served: | | Since 2004 |
Principal Occupation(s) During Past 5 Years: | | President since 2010, Co-Director of Research since 2002 & Executive Group Member** since 2003, - Manning & Napier Advisors, Inc. Holds one or more of the following titles for various subsidiaries and affiliates: President, Director, Treasurer or Senior Trust Officer. |
Number of Portfolios Overseen within Fund Complex: | | 29 |
Other Directorships Held Outside Fund Complex: | | N/A |
| |
Name: | | Beth Galusha |
Address: | | 290 Woodcliff Drive |
| | Fairport, NY 14450 |
Age: | | 49 |
Current Position(s) Held with Fund: | | Assistant Chief Financial Officer |
Term of Office1 & Length of Time Served: | | Assistant Chief Financial Officer since 2010 |
Principal Occupation(s) During Past 5 Years: | | Chief Financial Officer and Treasurer, Manning & Napier Advisors, Inc. Holds one or more of the following titles for various affiliates: Chief |
| | Financial Officer, Director, or Treasurer |
Number of Portfolios Overseen within Fund Complex: | | 29 |
Other Directorships Held Outside Fund Complex: | | N/A |
| |
Name: | | Christine Glavin |
Address: | | 290 Woodcliff Drive |
| | Fairport, NY 14450 |
Age: | | 44 |
Current Position(s) Held with Fund: | | Principal Financial Officer, Chief Financial Officer |
Term of Office1 & Length of Time Served: | | Principal Financial Officer since 2002; Chief Financial Officer since 2001 |
Principal Occupation(s) During Past 5 Years: | | Fund Reporting Manager, Manning & Napier Advisors, Inc. since 1997 |
Number of Portfolios Overseen within Fund Complex: | | 29 |
Other Directorships Held Outside Fund Complex: | | N/A |
| |
Name: | | Jodi L. Hedberg |
Address: | | 290 Woodcliff Drive |
| | Fairport, NY 14450 |
Age: | | 42 |
Current Position(s) Held with Fund: | | Corporate Secretary, Chief Compliance Officer, Anti-Money Laundering Compliance Officer |
Term of Office1 & Length of Time Served: | | Corporate Secretary since 1997; Chief Compliance Officer since 2004 |
Principal Occupation(s) During Past 5 Years: | | Director of Compliance, Manning & Napier Advisors, Inc. and affiliates since 1990 (title change in 2005 from Compliance Manager to Director of Compliance); Corporate Secretary, Manning & Napier Investor Services, Inc. since 2006 |
Number of Portfolios Overseen within Fund Complex: | | 29 |
Other Directorships Held Outside Fund Complex: | | N/A |
| * | Interested Director, within the meaning of the Investment Company Act of 1940 by reason of his position with the Fund’s investment advisor and distributor. Mr. Auspitz serves as the Executive Vice President and Director, Manning & Napier Advisors, Inc. and President and Director, Manning & Napier Investor Services, Inc., the Fund’s distributor. |
| ** | Prior to June 2010, the Executive Group, consisting of senior executive employee-owners, performed the duties of the Office of the Chief Executive of the Advisor. |
Effective June 2010, The Executive Group serves as an advisory board to the Chief Executive Officer.
| 1 | The term of office for President, Vice President, Chief Financial Officer, Assistant Chief Financial Officer, and Corporate Secretary is one year and until their respective successors are chosen and qualified. All other officers’ terms are indefinite. |
26
Literature Requests (unaudited)
Proxy Voting Policies and Procedures
A description of the policies and procedures that the Fund uses to determine how to vote proxies relating to portfolio securities is available, without charge, upon request:
| | |
By phone | | 1-800-466-3863 |
On the Securities and Exchange
Commission’s (SEC) web site | | http://www.sec.gov |
Proxy Voting Record
Information regarding how the Fund voted proxies relating to portfolio securities during the most recent 12-month period ended June 30th is available, without charge, upon request:
| | |
By phone | | 1-800-466-3863 |
On the SEC’s web site | | http://www.sec.gov |
Quarterly Portfolio Holdings
The Series’ complete schedule of portfolio holdings for the 1st and 3rd quarters of each fiscal year are provided on Form N-Q, and are available, without charge, upon request:
| | |
By phone | | 1-800-466-3863 |
On the SEC’s web site | | http://www.sec.gov |
The Series’ Form N-Q may be reviewed and copied at the SEC’s Public Reference Room in Washington, D.C. Information on the operation of the Public Reference Room may be obtained by calling 1-800-SEC-0330.
Prospectus and Statement of Additional Information (SAI)
The prospectus and SAI provide additional information about each Series, including charges, expenses and risks. These documents are available, without charge, upon request:
| | |
By phone | | 1-800-466-3863 |
On the SEC’s web site | | http://www.sec.gov |
On the Advisor’s web site | | http://manningnapieradvisors.com |
Additional information available at www.manningnapieradvisors.com
1. Fund Holdings - Month-End
2. Fund Holdings - Quarter-End
3. Shareholder Report - Annual
4. Shareholder Report - Semi-Annual

| | | | |
| | PRO-BLEND® CONSERVATIVE TERM SERIES | | |
| | PRO-BLEND® MODERATE TERM SERIES | | |
| | PRO-BLEND® EXTENDED TERM SERIES | | |
| | PRO-BLEND® MAXIMUM TERM SERIES | | |
Management Discussion and Analysis (unaudited)
Dear Shareholders:
The twelve months ending October 31, 2010 were characterized by well-defined swings in investor sentiment. Optimism fueled strong market returns during the fourth quarter of 2009 and through much of the first quarter of 2010, as positive economic releases led investors to believe in the potential for a robust U.S. recovery. However, more negative economic releases into May and June of 2010, coupled with sovereign debt concerns in Europe, led to a dramatic swing in sentiment during the second quarter, with stock markets suffering notable losses. While volatility remained during the third quarter of 2010, September was a particularly strong month, which helped push market indexes into positive territory on a calendar year-to-date basis.
Despite several ups and downs over the past year, the markets made choppy progress. For the twelve months ended October 2010, the S&P 500 Index gained 16.53%, aided by the rally that began in September. Similar to domestic equities, international stocks experienced pronounced fluctuations over the last year. After climbing considerably the last two months, the Morgan Stanley Capital International (MSCI) All Country World ex U.S. (ACWI x US) was up 12.62% the past year through October. The fixed income markets delivered more stable returns throughout the short-term market swings, with the Barclay’s Capital Aggregate Bond Index advancing 8.01% over the past twelve months.
Over the current stock market cycle, which includes the bull market in stocks from October 2002 until November 2007 and the current bear market, all four Pro-Blend® Series continue to provide competitive absolute returns for long-term investors. The Conservative Term Series (i.e., the most fixed income oriented Series with an average of 80% in bonds) has delivered similar results to its blended index benchmark over the current stock market cycle. Meanwhile, the more growth-oriented Moderate Term Series, Extended Term Series, and Maximum Term Series each continue to outperform their respective blended index benchmarks over the most recent full cycle.
For the last twelve months ending October 31, 2010, each of the Pro-Blend® Series posted double-digit positive returns. Furthermore, all four Series beat their respective blended index benchmarks over the past one-year period.
Manning & Napier’s fundamentals-based investment process led to a higher than average allocation to equities in each of the Series during the past year, as our analysts uncovered stock opportunities that met our strategy and valuation disciplines. This higher allocation to equities helped absolute and relative returns in the last quarter of 2009 and the first quarter of 2010. During the market correction in the second quarter of 2010, this modest overweight to stocks hurt relative results. However, this higher exposure to equities has benefited all four of the Pro-Blend® Series on an absolute and relative basis since the markets rebounded in the third quarter.
Within the equity portion of the Pro-Blend® Series’ portfolios, we had an overweight in the Information Technology and Health Care sectors relative to the blended benchmarks. This higher allocation had a varied impact on the Series’ performance over the past year, yet specific stock selections within the Information Technology and Health Care sectors contributed to positive relative returns more recently during the third quarter. On the other hand, the Series had a low exposure to Financials relative to their respective blended benchmarks because regulatory uncertainty and macroeconomic challenges such as indebted consumers, persistently high unemployment, a fragile housing market, and continued loan losses prevented many financial services companies from meeting the requirements of our investment strategies. This underweight to Financials aided returns relative to the blended benchmarks during the past year, with the exception of the market rally in early 2010.
Within the fixed income portion of the Series’ portfolios, we have shifted assets away from U.S. Treasury securities and toward sectors that offer additional yield potential. The Conservative Term Series, Moderate Term Series, and Extended Term Series have a bias toward investment grade corporate securities, with a modest allocation to high yield bonds as well. Additionally, each of the Series has noteworthy exposure to U.S. Agency securities. While the Pro-Blend® Series’
Management Discussion and Analysis (unaudited)
fixed income returns trailed the fixed income portion of their respective blended benchmarks in the last quarter of 2009, this current positioning provided favorable results relative to the blended benchmarks throughout the second and third quarters of 2010.
While the markets were volatile over the past twelve months, the outlook for the U.S. economy did not change materially over the past year. Despite swings in positive and negative sentiment, Manning & Napier continues to see a slow growth environment as the economy works through extensive consumer and government debt levels. In such an environment, we are focused on company-specific opportunities that can prosper. Specifically, we are seeking leading companies that can grow and gain market share despite a sluggish economy, particularly multinational businesses that may benefit from exposure to faster-growing foreign markets. Using our active stock selection strategies, we are also seeking opportunities in certain cyclical industries that have a tight relationship between supply and demand.
As 2010 comes to an end, economic momentum has begun to slow. With widespread challenges such as elevated unemployment levels and high government debt burdens, the growth prospects for the developed world remain a concern. In this macroeconomic reality of slow growth, a focus on company and industry fundamentals remains important for identifying quality investment opportunities. Through our disciplined investment strategies, Manning & Napier continues to pursue specific areas of the market that are presenting opportunities, particularly winning companies that have favorable growth prospects. Such an active and flexible approach has been at the core of our investment process since Manning & Napier’s inception 40 years ago.
As always, we appreciate your business.
Sincerely,
Manning & Napier Advisors, Inc.
Performance Update - Pro-Blend® Conservative Term Series (unaudited)
| | | | | | | | | | | | | | | | |
| | | Average Annual Total Returns
As of October 31, 2010 | |
| | | One
Year | | | Five
Year | | | Ten
Year | | | Since
Inception1 | |
Manning & Napier Fund, Inc. - Pro-Blend® Conservative
Term Series - Class S2 | | | 11.26 | % | | | 6.15 | % | | | 6.13 | % | | | 6.24 | % |
Manning & Napier Fund, Inc. - Pro-Blend® Conservative
Term Series - Class I2,3 | | | 11.49 | % | | | 6.38 | % | | | 6.40 | % | | | 6.53 | % |
Manning & Napier Fund, Inc. - Pro-Blend® Conservative
Term Series - Class C2,3 | | | 10.33 | % | | | 5.34 | % | | | 5.36 | % | | | 5.48 | % |
Manning & Napier Fund, Inc. - Pro-Blend® Conservative
Term Series - Class R2,3 | | | 11.08 | % | | | 5.90 | % | | | 5.90 | % | | | 6.02 | % |
Barclays Capital Intermediate U.S. Aggregate Bond Index4,6 | | | 7.57 | % | | | 6.36 | % | | | 6.14 | % | | | 6.18 | % |
5%/15%/80% Blended Index4,5,6 | | | 9.73 | % | | | 5.99 | % | | | 5.52 | % | | | 6.55 | % |
The following graph compares the value of a $10,000 investment in the Manning & Napier Fund, Inc. - Pro-Blend® Conservative Term Series - Class S for the ten years ended October 31, 2010 to the Barclays Capital Intermediate U.S. Aggregate Bond Index and a 5%/15%/80% Blended Index.
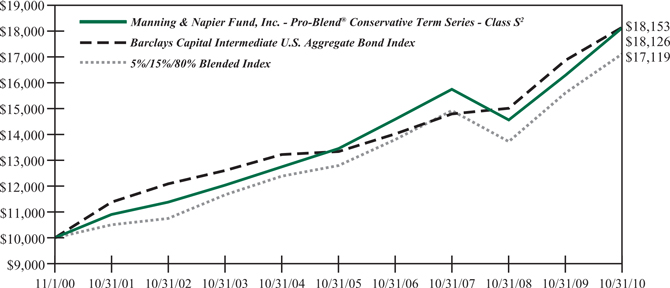
| 1 | Performance numbers for the Series and Indices are calculated from November 1, 1995, the Class S inception date. |
| 2 | The Series’ performance does not reflect the deduction of taxes that a shareholder would pay on fund distributions or the redemption of shares. The Series’ performance is historical and may not be indicative of future results. The performance returns shown are inclusive of the net expense ratio of the Series. For the year ended October 31, 2010, this net expense ratio was 0.90% for Class S, 0.70% for Class I, 1.70% for Class C and 1.20% for Class R. The gross expense ratio, which does not account for any voluntary or contractual waivers currently in effect, was 0.90% for Class S, 0.70% for Class I, 1.70% for Class C and 1.20% for Class R for the year ended October 31, 2010. |
| 3 | For periods prior to the inception of Class I on March 28, 2008, Class C on January 4, 2010 and Class R on June 30, 2010, the performance figures are hypothetical and reflect the performance of the Manning & Napier Fund, Inc. - Pro-Blend® Conservative Term Series - Class S adjusted for expense differences. |
| 4 | The Barclays Capital Intermediate U.S. Aggregate Bond Index is an unmanaged index that represents the U.S. domestic investment-grade bond market. It is a market value weighted index of investment-grade debt issues, including government, corporate, asset-backed and mortgage-backed securities, with maturities greater than one year but less than ten years. The Index returns assume reinvestment of income and, unlike Series returns, do not reflect any fees or expenses. |
| 5 | The 5%/15%/80% Blended Index is 5% Morgan Stanley Capital International (MSCI) All Country World Index ex U.S., 15% Russell 3000® Index, and 80% Barclays Capital Intermediate U.S. Aggregate Bond Index. The MSCI All Country World Index ex U.S. is a free float-adjusted market capitalization weighted index that is designed to measure equity market performance in the global developed and emerging markets and consists of 47 developed and emerging market country indices outside the United States. The Index is denominated in U.S. Dollars. The Index returns assume daily reinvestment of gross dividends (which do not account for foreign dividend taxation) from the inception of the Series through December 31, 1998, as net returns were not available. Subsequent to December 31, 1998, the Index returns assume daily reinvestment of net dividends (thus accounting for foreign dividend taxation). The Russell 3000® Index is an unmanaged index that consists of 3,000 of the largest U.S. companies based on total market capitalization. The Index returns are based on a market capitalization weighted average of relative price changes of the component stocks plus dividends whose reinvestments are compounded daily. Both Indices’ returns, unlike Series returns, do not reflect any fees or expenses. |
| 6 | Because the Series’ asset allocation will vary over time, the composition of the Series’ portfolio may not match the composition of the comparative Indices’ portfolios. |
Shareholder Expense Example - Pro-Blend® Conservative Term Series (unaudited)
As a shareholder of the Series, you may incur two types of costs: (1) transaction costs, including potential wire charges on redemptions and (2) ongoing costs, including management fees and other Series expenses. This example is intended to help you understand your ongoing costs (in dollars) of investing in the Series and to compare these costs with the ongoing costs of investing in other mutual funds.
The example is based on an investment of $1,000 invested at the beginning of the period and held for the entire period (May 1, 2010 to October 31, 2010, except for Class R Actual, which is from June 30, 2010* to October 31, 2010).
Actual Expenses
The Actual lines of the table below provide information about actual account values and actual expenses. You may use the information in these lines, together with the amount you invested, to estimate the expenses that you paid over the period. Simply divide your account value by $1,000 (for example, an $8,600 account value divided by $1,000 = 8.6), then multiply the result by the number in the Actual line for the Class in which you have invested under the heading entitled “Expenses Paid During Period” to estimate the expenses you paid on your account during this period.
Hypothetical Example for Comparison Purposes
The Hypothetical lines of the table below provide information about hypothetical account values and hypothetical expenses based on the Class’ actual expense ratio and an assumed rate of return of 5% per year before expenses, which is not the Class’ actual return. The hypothetical account values and expenses may not be used to estimate the actual ending account balance or expenses you paid during the period. You may use this information to compare the ongoing costs of investing in the Series and other funds. To do so, compare this 5% hypothetical example for the Class in which you have invested with the 5% hypothetical examples that appear in the shareholder reports of the other funds.
Please note that the expenses shown in the table are meant to highlight your ongoing costs only and do not reflect any transaction costs. Therefore, the Hypothetical lines of the table are useful in comparing ongoing costs only, and will not help you determine the relative total costs of owning different funds. In addition, if these transaction costs were included, your costs would have been higher.
| | | | | | | | | | | | | | | | |
| | | Beginning
Account Value
5/1/10* | | | Ending
Account Value
10/31/10 | | | Expenses Paid
During Period
5/1/10-10/31/10** | | | Annualized
Expense ratio | |
Class S | | | | | | | | | | | | | | | | |
Actual | | $ | 1,000.00 | | | $ | 1,054.00 | | | $ | 4.76 | | | | 0.92 | % |
Hypothetical
(5% return before expenses) | | $ | 1,000.00 | | | $ | 1,020.57 | | | $ | 4.69 | | | | 0.92 | % |
Class I | | | | | | | | | | | | | | | | |
Actual | | $ | 1,000.00 | | | $ | 1,054.90 | | | $ | 3.73 | | | | 0.72 | % |
Hypothetical
(5% return before expenses) | | $ | 1,000.00 | | | $ | 1,021.58 | | | $ | 3.67 | | | | 0.72 | % |
Class C | | | | | | | | | | | | | | | | |
Actual | | $ | 1,000.00 | | | $ | 1,048.90 | | | $ | 8.83 | | | | 1.71 | % |
Hypothetical
(5% return before expenses) | | $ | 1,000.00 | | | $ | 1,016.59 | | | $ | 8.69 | | | | 1.71 | % |
Class R | | | | | | | | | | | | | | | | |
Actual | | $ | 1,000.00 | | | $ | 1,076.00 | | | $ | 4.20 | | | | 1.20 | % |
Hypothetical
(5% return before expenses) | | $ | 1,000.00 | | | $ | 1,012.81 | | | $ | 4.07 | | | | 1.20 | % |
| * | Class R inception date was June 30, 2010. |
Shareholder Expense Example - Pro-Blend® Conservative Term Series (unaudited)
| ** | Expenses are equal to the Class’ annualized expense ratio (for the six-month period), multiplied by the average account value over the period, multiplied by 184/365 to reflect the one-half year period (except for the Series’ Class R Actual return information, which reflects the 123 day period ended October 31, 2010 due to its inception date of June 30, 2010). Expenses are based on the most recent fiscal half year; therefore, the expense ratios stated above may differ from the expense ratios stated in the financial highlights, which is based on one-year data. The Class’ total return would have been lower had certain expenses not been waived during the period. |
Portfolio Composition - Pro-Blend® Conservative Term Series (unaudited)
As of October 31, 2010
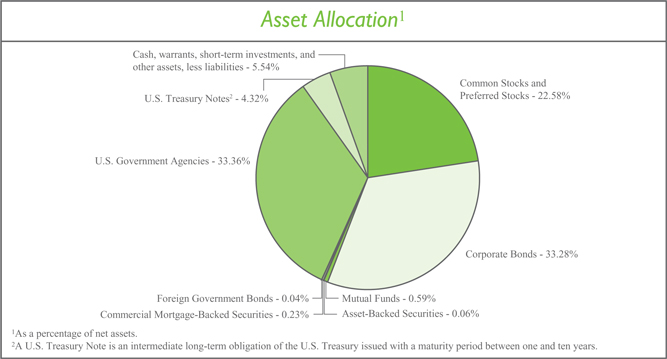
| | | | |
|
Sector Allocation3 | |
Financials | | | 18.47 | % |
Consumer Discretionary | | | 7.47 | % |
Industrials | | | 7.10 | % |
Information Technology | | | 6.63 | % |
Energy | | | 4.82 | % |
Consumer Staples | | | 4.64 | % |
Health Care | | | 3.33 | % |
Materials | | | 2.75 | % |
Utilities | | | 1.09 | % |
Telecommunication Services | | | 0.33 | % |
|
3 Including common stocks, preferred stocks, warrants, and corporate bonds, as a percentage of total investments. | |
| | | | |
|
Top Five Stock Holdings4 | |
Google, Inc. - Class A | | | 0.98 | % |
Monsanto Co. | | | 0.96 | % |
Cisco Systems, Inc. | | | 0.70 | % |
Hess Corp. | | | 0.66 | % |
Time Warner, Inc. | | | 0.64 | % |
| |
4 As a percentage of total investments. | | | | |
|
Top Five Bond Holdings5 | |
Freddie Mac, 0.875%, 10/28/2013 | | | 3.89 | % |
U.S. Treasury Note, 0.375%, 9/30/2012 | | | 2.05 | % |
Fannie Mae, 2.375%, 7/28/2015 | | | 1.96 | % |
Freddie Mac, 0.375%, 11/30/2012 | | | 1.81 | % |
Fannie Mae, 6.00%, 7/1/2038 | | | 1.64 | % |
| |
5 As a percentage of total investments. | | | | |
Investment Portfolio - October 31, 2010
| | | | | | | | |
Pro-Blend® Conservative Term Series | | Shares | | | Value
(Note 2) | |
| | |
COMMON STOCKS - 22.42% | | | | | | | | |
| | |
Consumer Discretionary - 2.66% | | | | | | | | |
Auto Components - 0.02% | | | | | | | | |
Hankook Tire Co. Ltd. (South Korea)1 | | | 5,450 | | | $ | 141,956 | |
| | | | | | | | |
Automobiles - 0.04% | | | | | | | | |
Bayerische Motoren Werke AG (BMW) (Germany)1 | | | 2,430 | | | | 174,164 | |
Suzuki Motor Corp. (Japan)1 | | | 1,900 | | | | 46,373 | |
Yamaha Motor Co. Ltd. (Japan)*,1 | | | 7,000 | | | | 107,405 | |
| | | | | | | | |
| | | | | | | 327,942 | |
| | | | | | | | |
Distributors - 0.02% | | | | | | | | |
Inchcape plc (United Kingdom)*,1 | | | 25,000 | | | | 139,707 | |
| | | | | | | | |
Hotels, Restaurants & Leisure - 0.06% | | | | | | | | |
Accor S.A. (France)1 | | | 2,050 | | | | 84,128 | |
Choice Hotels International, Inc. | | | 5,040 | | | | 191,671 | |
Club Mediterranee S.A. (France)*,1 | | | 305 | | | | 5,971 | |
Hyatt Hotels Corp. - Class A* | | | 2,890 | | | | 116,467 | |
Wendy’s - Arby’s Group, Inc. - Class A | | | 25,250 | | | | 116,150 | |
| | | | | | | | |
| | | | | | | 514,387 | |
| | | | | | | | |
Household Durables - 0.08% | | | | | | | | |
Corporacion Geo S.A.B. de C.V. - Class B (Mexico)* | | | 25,250 | | | | 80,159 | |
Harman International Industries, Inc.* | | | 3,230 | | | | 108,366 | |
Lennar Corp. - Class A | | | 5,620 | | | | 81,546 | |
LG Electronics, Inc. (South Korea)1 | | | 1,100 | | | | 96,863 | |
NVR, Inc.* | | | 100 | | | | 62,741 | |
Rodobens Negocios Imobiliarios S.A. (Brazil) | | | 19,610 | | | | 202,985 | |
Tupperware Brands Corp. | | | 1,300 | | | | 58,253 | |
| | | | | | | | |
| | | | | | | 690,913 | |
| | | | | | | | |
Leisure Equipment & Products** - 0.01% | | | | | | | | |
Sankyo Co. Ltd. (Japan)1 | | | 800 | | | | 42,623 | |
| | | | | | | | |
Media - 1.84% | | | | | | | | |
Gestevision Telecinco S.A. (Spain)1 | | | 16,730 | | | | 213,488 | |
Grupo Televisa S.A. - ADR (Mexico) | | | 6,070 | | | | 136,272 | |
Imax Corp. (Canada)* | | | 6,890 | | | | 149,169 | |
Liberty Global, Inc. - Class A* | | | 51,600 | | | | 1,949,964 | |
Mediacom Communications Corp. - Class A* | | | 8,560 | | | | 59,064 | |
Mediaset S.p.A. (Italy)1 | | | 4,980 | | | | 36,768 | |
Reed Elsevier plc (United Kingdom)1 | | | 10,380 | | | | 89,054 | |
Reed Elsevier plc - ADR (United Kingdom) | | | 1,308 | | | | 44,878 | |
Societe Television Francaise 1 (France)1 | | | 14,140 | | | | 231,756 | |
Time Warner, Inc. | | | 162,920 | | | | 5,296,529 | |
Virgin Media, Inc. (United Kingdom) | | | 140,180 | | | | 3,564,777 | |
The Walt Disney Co. | | | 100,900 | | | | 3,643,499 | |
| | |
| 7 | | The accompanying notes are an integral part of the financial statements. |
Investment Portfolio - October 31, 2010
| | | | | | | | |
Pro-Blend® Conservative Term Series | | Shares | | | Value
(Note 2) | |
| | |
COMMON STOCKS (continued) | | | | | | | | |
| | |
Consumer Discretionary (continued) | | | | | | | | |
Media (continued) | | | | | | | | |
Wolters Kluwer N.V. (Netherlands)1 | | | 3,680 | | | $ | 83,885 | |
| | | | | | | | |
| | | | | | | 15,499,103 | |
| | | | | | | | |
Multiline Retail - 0.03% | | | | | | | | |
Marks & Spencer Group plc (United Kingdom)1 | | | 18,990 | | | | 130,146 | |
Nordstrom, Inc. | | | 1,020 | | | | 39,280 | |
PPR (France)1 | | | 745 | | | | 122,533 | |
| | | | | | | | |
| | | | | | | 291,959 | |
| | | | | | | | |
Specialty Retail - 0.54% | | | | | | | | |
Chico’s FAS, Inc. | | | 5,560 | | | | 54,043 | |
Dick’s Sporting Goods, Inc.* | | | 5,330 | | | | 153,611 | |
The Finish Line, Inc. - Class A | | | 3,780 | | | | 57,834 | |
The Home Depot, Inc. | | | 83,966 | | | | 2,592,870 | |
KOMERI Co. Ltd. (Japan)1 | | | 1,500 | | | | 31,158 | |
Lumber Liquidators Holdings, Inc.* | | | 3,930 | | | | 94,634 | |
The Sherwin-Williams Co. | | | 21,680 | | | | 1,581,990 | |
| | | | | | | | |
| | | | | | | 4,566,140 | |
| | | | | | | | |
Textiles, Apparel & Luxury Goods - 0.02% | | | | | | | | |
Adidas AG (Germany)1 | | | 1,530 | | | | 99,652 | |
Skechers U.S.A., Inc. - Class A* | | | 3,230 | | | | 62,791 | |
| | | | | | | | |
| | | | | | | 162,443 | |
| | | | | | | | |
Total Consumer Discretionary | | | | | | | 22,377,173 | |
| | | | | | | | |
Consumer Staples - 2.82% | | | | | | | | |
Beverages - 0.47% | | | | | | | | |
The Coca-Cola Co. | | | 59,730 | | | | 3,662,644 | |
Diageo plc (United Kingdom)1 | | | 4,790 | | | | 88,364 | |
Heineken N.V. (Netherlands)1 | | | 3,670 | | | | 186,309 | |
| | | | | | | | |
| | | | | | | 3,937,317 | |
| | | | | | | | |
Food & Staples Retailing - 0.77% | | | | | | | | |
BJ’s Wholesale Club, Inc.* | | | 2,060 | | | | 85,964 | |
Carrefour S.A. (France)1 | | | 9,650 | | | | 522,486 | |
Casino Guichard-Perrachon S.A. (France)1 | | | 1,100 | | | | 103,489 | |
The Kroger Co. | | | 120,880 | | | | 2,659,360 | |
Safeway, Inc. | | | 115,870 | | | | 2,653,423 | |
SUPERVALU, Inc. | | | 8,980 | | | | 96,894 | |
Tesco plc (United Kingdom)1 | | | 52,995 | | | | 362,680 | |
| | | | | | | | |
| | | | | | | 6,484,296 | |
| | | | | | | | |
Food Products - 1.54% | | | | | | | | |
Diamond Foods, Inc. | | | 1,540 | | | | 68,068 | |
| | | | |
| The accompanying notes are an integral part of the financial statements. | | | 8 | |
Investment Portfolio - October 31, 2010
| | | | | | | | |
Pro-Blend® Conservative Term Series | | Shares | | | Value
(Note 2) | |
| | |
COMMON STOCKS (continued) | | | | | | | | |
| | |
Consumer Staples (continued) | | | | | | | | |
Food Products (continued) | | | | | | | | |
Flowers Foods, Inc. | | | 4,530 | | | $ | 115,424 | |
General Mills, Inc. | | | 37,380 | | | | 1,403,245 | |
Kellogg Co. | | | 23,460 | | | | 1,179,100 | |
Kraft Foods, Inc. - Class A | | | 103,050 | | | | 3,325,423 | |
Nestle S.A. (Switzerland)1 | | | 60,550 | | | | 3,316,596 | |
Sanderson Farms, Inc. | | | 1,650 | | | | 69,267 | |
Suedzucker AG (Germany)1 | | | 2,950 | | | | 69,652 | |
Unilever plc - ADR (United Kingdom) | | | 118,130 | | | | 3,428,133 | |
| | | | | | | | |
| | | | | | | 12,974,908 | |
| | | | | | | | |
Household Products - 0.02% | | | | | | | | |
Reckitt Benckiser Group plc (United Kingdom)1 | | | 2,325 | | | | 129,895 | |
| | | | | | | | |
Personal Products - 0.02% | | | | | | | | |
Alberto-Culver Co. | | | 3,190 | | | | 118,955 | |
Beiersdorf AG (Germany)1 | | | 930 | | | | 60,590 | |
| | | | | | | | |
| | | | | | | 179,545 | |
| | | | | | | | |
Total Consumer Staples | | | | | | | 23,705,961 | |
| | | | | | | | |
Energy - 2.25% | | | | | | | | |
Energy Equipment & Services - 1.49% | | | | | | | | |
Baker Hughes, Inc. | | | 84,405 | | | | 3,910,484 | |
Calfrac Well Services Ltd. (Canada) | | | 6,480 | | | | 162,905 | |
Compagnie Generale de Geophysique - Veritas (CGG - Veritas) (France)*,1 | | | 8,105 | | | | 189,323 | |
Dril-Quip, Inc.* | | | 1,980 | | | | 136,818 | |
Schlumberger Ltd. | | | 55,740 | | | | 3,895,669 | |
Trican Well Service Ltd. (Canada) | | | 16,420 | | | | 284,641 | |
Weatherford International Ltd. (Switzerland)* | | | 231,774 | | | | 3,896,121 | |
| | | | | | | | |
| | | | | | | 12,475,961 | |
| | | | | | | | |
Oil, Gas & Consumable Fuels - 0.76% | | | | | | | | |
Cameco Corp. (Canada) | | | 3,780 | | | | 117,029 | |
Forest Oil Corp.* | | | 1,205 | | | | 37,030 | |
Hess Corp. | | | 87,060 | | | | 5,487,392 | |
Mariner Energy, Inc.* | | | 2,861 | | | | 71,296 | |
Paladin Energy Ltd. (Australia)* | | | 33,810 | | | | 137,242 | |
Repsol YPF S.A. (Spain)1 | | | 1,990 | | | | 55,184 | |
Royal Dutch Shell plc - Class B (Netherlands)1 | | | 2,646 | | | | 84,677 | |
Royal Dutch Shell plc - Class B - ADR (Netherlands) | | | 2,580 | | | | 165,945 | |
Talisman Energy, Inc. (Canada) | | | 8,420 | | | | 152,648 | |
Total S.A. (France)1 | | | 1,820 | | | | 99,070 | |
| | | | | | | | |
| | | | | | | 6,407,513 | |
| | | | | | | | |
Total Energy | | | | | | | 18,883,474 | |
| | | | | | | | |
| | |
| 9 | | The accompanying notes are an integral part of the financial statements. |
Investment Portfolio - October 31, 2010
| | | | | | | | |
Pro-Blend® Conservative Term Series | | Shares | | | Value
(Note 2) | |
| | |
COMMON STOCKS (continued) | | | | | | | | |
| | |
Financials - 2.70% | | | | | | | | |
Capital Markets - 0.89% | | | | | | | | |
The Bank of New York Mellon Corp.2 | | | 130,210 | | | $ | 3,263,063 | |
The Charles Schwab Corp. | | | 219,650 | | | | 3,382,610 | |
Credit Suisse Group AG - ADR (Switzerland) | | | 830 | | | | 34,445 | |
Evercore Partners, Inc. - Class A | | | 2,190 | | | | 66,488 | |
Financial Engines, Inc.* | | | 3,590 | | | | 52,881 | |
GAM Holding AG (Switzerland)*,1 | | | 13,770 | | | | 217,551 | |
The Goldman Sachs Group, Inc. | | | 680 | | | | 109,446 | |
Greenhill & Co., Inc. | | | 700 | | | | 54,369 | |
Lazard Ltd. - Class A (Bermuda) | | | 1,590 | | | | 58,671 | |
Northern Trust Corp. | | | 1,690 | | | | 83,875 | |
State Street Corp. | | | 4,490 | | | | 187,502 | |
| | | | | | | | |
| | | | | | | 7,510,901 | |
| | | | | | | | |
Commercial Banks - 0.16% | | | | | | | | |
Banco Santander S.A. (Spain)1 | | | 6,050 | | | | 77,655 | |
Banco Santander S.A. - ADR (Spain) | | | 14,530 | | | | 186,129 | |
Barclays plc - ADR (United Kingdom) | | | 1,990 | | | | 35,124 | |
BNP Paribas (France)1 | | | 930 | | | | 68,026 | |
Credit Agricole S.A. (France)1 | | | 1,370 | | | | 22,469 | |
First Commonwealth Financial Corp. | | | 41,520 | | | | 241,646 | |
First Financial Bancorp | | | 6,190 | | | | 104,240 | |
The Hachijuni Bank Ltd. (Japan)1 | | | 4,800 | | | | 24,632 | |
HSBC Holdings plc (United Kingdom)1 | | | 8,500 | | | | 88,465 | |
HSBC Holdings plc - ADR (United Kingdom) | | | 3,177 | | | | 165,553 | |
ICICI Bank Ltd. - ADR (India) | | | 1,560 | | | | 82,025 | |
Societe Generale - ADR (France)3 | | | 3,250 | | | | 38,773 | |
The Sumitomo Trust & Banking Co. Ltd. (Japan)1 | | | 4,800 | | | | 26,207 | |
U.S. Bancorp | | | 7,920 | | | | 191,506 | |
| | | | | | | | |
| | | | | | | 1,352,450 | |
| | | | | | | | |
Consumer Finance - 0.44% | | | | | | | | |
American Express Co. | | | 87,600 | | | | 3,631,896 | |
Discover Financial Services | | | 2,070 | | | | 36,535 | |
| | | | | | | | |
| | | | | | | 3,668,431 | |
| | | | | | | | |
Diversified Financial Services - 0.11% | | | | | | | | |
Bank of America Corp. | | | 2,980 | | | | 34,091 | |
Deutsche Boerse AG (Germany)1 | | | 3,890 | | | | 273,657 | |
Financiere Marc de Lacharriere S.A. (Fimalac) (France)1 | | | 2,125 | | | | 91,451 | |
ING Groep N.V. (Netherlands)*,1 | | | 185 | | | | 1,980 | |
JPMorgan Chase & Co. | | | 6,430 | | | | 241,961 | |
Moody’s Corp. | | | 10,770 | | | | 291,436 | |
| | | | | | | | |
| | | | | | | 934,576 | |
| | | | | | | | |
| | | | |
| The accompanying notes are an integral part of the financial statements. | | | 10 | |
Investment Portfolio - October 31, 2010
| | | | | | | | |
Pro-Blend® Conservative Term Series | | Shares | | | Value
(Note 2) | |
| | |
COMMON STOCKS (continued) | | | | | | | | |
| | |
Financials (continued) | | | | | | | | |
Insurance - 0.23% | | | | | | | | |
Allianz SE (Germany)1 | | | 3,980 | | | $ | 498,407 | |
The Allstate Corp. | | | 4,370 | | | | 133,241 | |
Amil Participacoes S.A. (Brazil) | | | 12,540 | | | | 127,590 | |
AXA S.A. (France)1 | | | 1,230 | | | | 22,431 | |
Brown & Brown, Inc. | | | 7,020 | | | | 156,476 | |
Mapfre S.A. (Spain)1 | | | 32,000 | | | | 106,335 | |
Muenchener Rueckversicherungs AG (MunichRe) (Germany)1 | | | 1,195 | | | | 186,779 | |
The Progressive Corp. | | | 9,760 | | | | 206,522 | |
Willis Group Holdings plc (United Kingdom) | | | 7,325 | | | | 232,935 | |
Zurich Financial Services AG (Switzerland)1 | | | 910 | | | | 222,693 | |
| | | | | | | | |
| | | | | | | 1,893,409 | |
| | | | | | | | |
Real Estate Investment Trusts (REITS) - 0.80% | | | | | | | | |
Acadia Realty Trust | | | 4,520 | | | | 86,242 | |
Alexandria Real Estate Equities, Inc. | | | 3,070 | | | | 225,584 | |
Alstria Office REIT AG (Germany)1 | | | 9,950 | | | | 138,623 | |
American Campus Communities, Inc. | | | 7,780 | | | | 246,081 | |
Apartment Investment & Management Co. - Class A | | | 11,860 | | | | 276,456 | |
Associated Estates Realty Corp. | | | 4,790 | | | | 66,533 | |
AvalonBay Communities, Inc. | | | 1,690 | | | | 179,664 | |
BioMed Realty Trust, Inc. | | | 19,480 | | | | 357,458 | |
Boston Properties, Inc. | | | 2,400 | | | | 206,856 | |
British Land Co. plc (United Kingdom)1 | | | 9,730 | | | | 79,440 | |
Camden Property Trust | | | 4,090 | | | | 202,823 | |
Cogdell Spencer, Inc. | | | 24,100 | | | | 158,337 | |
Corporate Office Properties Trust | | | 13,190 | | | | 468,113 | |
DiamondRock Hospitality Co.* | | | 5,110 | | | | 54,064 | |
Digital Realty Trust, Inc. | | | 3,530 | | | | 210,847 | |
Douglas Emmett, Inc. | | | 4,380 | | | | 78,577 | |
DuPont Fabros Technology, Inc. | | | 11,570 | | | | 290,407 | |
Equity Lifestyle Properties, Inc. | | | 2,890 | | | | 164,499 | |
Equity One, Inc. | | | 3,910 | | | | 73,117 | |
Equity Residential | | | 4,010 | | | | 195,006 | |
HCP, Inc. | | | 5,470 | | | | 196,975 | |
Health Care REIT, Inc. | | | 3,060 | | | | 156,366 | |
Healthcare Realty Trust, Inc. | | | 7,970 | | | | 192,396 | |
Home Properties, Inc. | | | 3,880 | | | | 211,266 | |
Host Hotels & Resorts, Inc. | | | 14,737 | | | | 234,171 | |
LaSalle Hotel Properties | | | 3,270 | | | | 77,466 | |
Lexington Realty Trust | | | 8,540 | | | | 66,441 | |
Mack-Cali Realty Corp. | | | 2,170 | | | | 72,869 | |
Mid-America Apartment Communities, Inc. | | | 1,090 | | | | 66,523 | |
| | |
| 11 | | The accompanying notes are an integral part of the financial statements. |
Investment Portfolio - October 31, 2010
| | | | | | | | |
Pro-Blend® Conservative Term Series | | Shares | | | Value
(Note 2) | |
| | |
COMMON STOCKS (continued) | | | | | | | | |
| | |
Financials (continued) | | | | | | | | |
Real Estate Investment Trusts (REITS) (continued) | | | | | | | | |
National Health Investors, Inc. | | | 1,390 | | | $ | 64,357 | |
National Retail Properties, Inc. | | | 7,750 | | | | 210,025 | |
Omega Healthcare Investors, Inc. | | | 3,590 | | | | 82,570 | |
Pebblebrook Hotel Trust* | | | 11,790 | | | | 230,966 | |
Public Storage | | | 2,040 | | | | 202,409 | |
Realty Income Corp. | | | 6,100 | | | | 209,108 | |
Simon Property Group, Inc. | | | 2,224 | | | | 213,548 | |
Sovran Self Storage, Inc. | | | 2,840 | | | | 110,959 | |
Tanger Factory Outlet Centers | | | 4,130 | | | | 197,909 | |
UDR, Inc. | | | 8,560 | | | | 192,429 | |
| | | | | | | | |
| | | | | | | 6,747,480 | |
| | | | | | | | |
Real Estate Management & Development - 0.01% | | | | | | | | |
CB Richard Ellis Group, Inc. - Class A* | | | 3,590 | | | | 65,876 | |
Renhe Commercial Holdings Co. Ltd. (China)1 | | | 167,000 | | | | 31,944 | |
| | | | | | | | |
| | | | | | | 97,820 | |
| | | | | | | | |
Thrifts & Mortgage Finance - 0.06% | | | | | | | | |
Aareal Bank AG (Germany)*,1 | | | 3,745 | | | | 91,431 | |
First Niagara Financial Group, Inc. | | | 20,970 | | | | 248,494 | |
Hudson City Bancorp, Inc. | | | 3,890 | | | | 45,319 | |
People’s United Financial, Inc. | | | 10,160 | | | | 125,070 | |
| | | | | | | | |
| | | | | | | 510,314 | |
| | | | | | | | |
Total Financials | | | | | | | 22,715,381 | |
| | | | | | | | |
Health Care - 2.47% | | | | | | | | |
Biotechnology - 0.15% | | | | | | | | |
Acorda Therapeutics, Inc.* | | | 7,340 | | | | 198,473 | |
Amgen, Inc.* | | | 6,110 | | | | 349,431 | |
Basilea Pharmaceutica AG (Switzerland)*,1 | | | 3,220 | | | | 225,884 | |
Celera Corp.* | | | 82,140 | | | | 468,198 | |
| | | | | | | | |
| | | | | | | 1,241,986 | |
| | | | | | | | |
Health Care Equipment & Supplies - 1.66% | | | | | | | | |
Abaxis, Inc.* | | | 9,850 | | | | 236,498 | |
Alere, Inc.* | | | 21,560 | | | | 637,098 | |
Becton, Dickinson and Co. | | | 68,210 | | | | 5,151,219 | |
Boston Scientific Corp.* | | | 544,870 | | | | 3,476,271 | |
Cochlear Ltd. (Australia)1 | | | 7,160 | | | | 498,774 | |
Conceptus, Inc.* | | | 15,900 | | | | 225,939 | |
Covidien plc (Ireland) | | | 10,150 | | | | 404,680 | |
DENTSPLY International, Inc. | | | 12,950 | | | | 406,500 | |
DexCom, Inc.* | | | 24,280 | | | | 333,850 | |
| | | | |
| The accompanying notes are an integral part of the financial statements. | | | 12 | |
Investment Portfolio - October 31, 2010
| | | | | | | | |
Pro-Blend® Conservative Term Series | | Shares | | | Value
(Note 2) | |
| | |
COMMON STOCKS (continued) | | | | | | | | |
| | |
Health Care (continued) | | | | | | | | |
Health Care Equipment & Supplies (continued) | | | | | | | | |
Gen-Probe, Inc.* | | | 10,300 | | | $ | 498,829 | |
Hologic, Inc.* | | | 13,020 | | | | 208,580 | |
Insulet Corp.* | | | 23,290 | | | | 371,476 | |
Mindray Medical International Ltd. - ADR (China) | | | 1,220 | | | | 35,356 | |
OraSure Technologies, Inc.* | | | 24,480 | | | | 99,634 | |
Shandong Weigao Group Medical Polymer Co. Ltd. - Class H (China)1 | | | 9,000 | | | | 23,942 | |
Sirona Dental Systems, Inc.* | | | 5,920 | | | | 222,888 | |
Straumann Holding AG (Switzerland)1 | | | 2,305 | | | | 482,552 | |
Zoll Medical Corp.* | | | 20,820 | | | | 677,275 | |
| | | | | | | | |
| | | | | | | 13,991,361 | |
| | | | | | | | |
Health Care Providers & Services - 0.21% | | | | | | | | |
Bio-Reference Laboratories, Inc.* | | | 11,850 | | | | 255,486 | |
Bumrungrad Hospital Public Co. Ltd. - NVDR (Thailand)1 | | | 49,330 | | | | 56,747 | |
Diagnosticos da America S.A. (Brazil) | | | 47,230 | | | | 573,605 | |
Odontoprev S.A. (Brazil) | | | 15,910 | | | | 233,929 | |
Sonic Healthcare Ltd. (Australia)1 | | | 60,980 | | | | 650,598 | |
| | | | | | | | |
| | | | | | | 1,770,365 | |
| | | | | | | | |
Health Care Technology - 0.23% | | | | | | | | |
Allscripts Healthcare Solutions, Inc.* | | | 11,570 | | | | 220,871 | |
Cerner Corp.* | | | 19,220 | | | | 1,688,093 | |
| | | | | | | | |
| | | | | | | 1,908,964 | |
| | | | | | | | |
Life Sciences Tools & Services - 0.09% | | | | | | | | |
Caliper Life Sciences, Inc.* | | | 91,417 | | | | 411,377 | |
Sequenom, Inc.* | | | 53,160 | | | | 337,566 | |
| | | | | | | | |
| | | | | | | 748,943 | |
| | | | | | | | |
Pharmaceuticals - 0.13% | | | | | | | | |
AstraZeneca plc (United Kingdom)1 | | | 615 | | | | 30,936 | |
AstraZeneca plc - ADR (United Kingdom) | | | 1,510 | | | | 76,195 | |
Bayer AG (Germany)1 | | | 4,310 | | | | 321,472 | |
GlaxoSmithKline plc (United Kingdom)1 | | | 5,525 | | | | 107,890 | |
Sanofi-Aventis S.A. (France)1 | | | 851 | | | | 59,623 | |
Santen Pharmaceutical Co. Ltd. (Japan)1 | | | 1,500 | | | | 51,689 | |
Shire plc (Ireland)1 | | | 5,745 | | | | 134,819 | |
UCB S.A. (Belgium)1 | | | 9,240 | | | | 358,438 | |
| | | | | | | | |
| | | | | | | 1,141,062 | |
| | | | | | | | |
Total Health Care | | | | | | | 20,802,681 | |
| | | | | | | | |
Industrials - 2.04% | | | | | | | | |
Aerospace & Defense - 0.42% | | | | | | | | |
The Boeing Co. | | | 49,510 | | | | 3,497,386 | |
| | |
| 13 | | The accompanying notes are an integral part of the financial statements. |
Investment Portfolio - October 31, 2010
| | | | | | | | |
Pro-Blend® Conservative Term Series | | Shares | | | Value
(Note 2) | |
| | |
COMMON STOCKS (continued) | | | | | | | | |
| | |
Industrials (continued) | | | | | | | | |
Aerospace & Defense (continued) | | | | | | | | |
Empresa Brasileira de Aeronautica S.A. (Embraer) - ADR (Brazil) | | | 2,650 | | | $ | 76,453 | |
| | | | | | | | |
| | | | | | | 3,573,839 | |
| | | | | | | | |
Air Freight & Logistics - 0.83% | | | | | | | | |
Atlas Air Worldwide Holdings, Inc.* | | | 1,940 | | | | 101,384 | |
FedEx Corp. | | | 37,190 | | | | 3,262,307 | |
TNT N.V. (Netherlands)1 | | | 8,330 | | | | 221,529 | |
United Parcel Service, Inc. - Class B | | | 49,972 | | | | 3,365,115 | |
| | | | | | | | |
| | | | | | | 6,950,335 | |
| | | | | | | | |
Airlines - 0.46% | | | | | | | | |
Copa Holdings S.A. - Class A (Panama) | | | 1,770 | | | | 89,792 | |
Deutsche Lufthansa AG (Germany)*,1 | | | 6,570 | | | | 140,450 | |
Ryanair Holdings plc - ADR (Ireland) | | | 5,420 | | | | 176,855 | |
Southwest Airlines Co. | | | 254,775 | | | | 3,505,704 | |
| | | | | | | | |
| | | | | | | 3,912,801 | |
| | | | | | | | |
Commercial Services & Supplies - 0.05% | | | | | | | | |
Tomra Systems ASA (Norway)1 | | | 72,980 | | | | 444,717 | |
| | | | | | | | |
Construction & Engineering - 0.01% | | | | | | | | |
MYR Group, Inc.* | | | 3,040 | | | | 47,394 | |
| | | | | | | | |
Electrical Equipment - 0.07% | | | | | | | | |
ABB Ltd. (Asea Brown Boveri) - ADR (Switzerland)* | | | 12,480 | | | | 258,211 | |
Alstom S.A. (France)1 | | | 3,310 | | | | 167,162 | |
Nexans S.A. (France)1 | | | 1,040 | | | | 74,180 | |
Schneider Electric S.A. (France)1 | | | 860 | | | | 122,190 | |
| | | | | | | | |
| | | | | | | 621,743 | |
| | | | | | | | |
Industrial Conglomerates - 0.06% | | | | | | | | |
Siemens AG (Germany)1 | | | 4,290 | | | | 489,555 | |
| | | | | | | | |
Machinery - 0.06% | | | | | | | | |
ArvinMeritor, Inc.* | | | 3,900 | | | | 64,662 | |
Astec Industries, Inc.* | | | 1,630 | | | | 48,036 | |
Lindsay Corp. | | | 1,500 | | | | 86,475 | |
SmartHeat, Inc. (China)* | | | 2,410 | | | | 15,641 | |
Titan International, Inc. | | | 6,820 | | | | 103,459 | |
Wabtec Corp. | | | 2,380 | | | | 111,479 | |
Westport Innovations, Inc. (Canada)* | | | 3,190 | | | | 57,803 | |
| | | | | | | | |
| | | | | | | 487,555 | |
| | | | | | | | |
Professional Services - 0.01% | | | | | | | | |
Randstad Holding N.V. (Netherlands)*,1 | | | 990 | | | | 47,163 | |
| | | | | | | | |
| | | | |
| The accompanying notes are an integral part of the financial statements. | | | 14 | |
Investment Portfolio - October 31, 2010
| | | | | | | | |
Pro-Blend® Conservative Term Series | | Shares | | | Value
(Note 2) | |
| | |
COMMON STOCKS (continued) | | | | | | | | |
| | |
Industrials (continued) | | | | | | | | |
Road & Rail - 0.07% | | | | | | | | |
All America Latina Logistica S.A. (Brazil) | | | 31,400 | | | $ | 296,955 | |
Heartland Express, Inc. | | | 6,750 | | | | 100,642 | |
RailAmerica, Inc.* | | | 14,470 | | | | 167,852 | |
| | | | | | | | |
| | | | | | | 565,449 | |
| | | | | | | | |
Total Industrials | | | | | | | 17,140,551 | |
| | | | | | | | |
Information Technology - 5.74% | | | | | | | | |
Communications Equipment - 1.58% | | | | | | | | |
Alcatel-Lucent - ADR (France)* | | | 111,430 | | | | 386,662 | |
Cisco Systems, Inc.* | | | 254,808 | | | | 5,817,267 | |
Infinera Corp.* | | | 46,500 | | | | 380,835 | |
Juniper Networks, Inc.* | | | 74,416 | | | | 2,410,334 | |
QUALCOMM, Inc. | | | 86,720 | | | | 3,913,673 | |
Riverbed Technology, Inc.* | | | 5,640 | | | | 324,526 | |
| | | | | | | | |
| | | | | | | 13,233,297 | |
| | | | | | | | |
Computers & Peripherals - 0.25% | | | | | | | | |
Apple, Inc.* | | | 510 | | | | 153,444 | |
Compellent Technologies, Inc.* | | | 12,570 | | | | 317,644 | |
EMC Corp.* | | | 76,170 | | | | 1,600,331 | |
Immersion Corp.* | | | 10,320 | | | | 63,468 | |
| | | | | | | | |
| | | | | | | 2,134,887 | |
| | | | | | | | |
Electronic Equipment, Instruments & Components - 0.19% | | | | | | | | |
Amphenol Corp. - Class A | | | 20,250 | | | | 1,015,132 | |
Cogent, Inc.* | | | 32,900 | | | | 346,108 | |
Hitachi Ltd. (Japan)1 | | | 23,000 | | | | 103,952 | |
LoJack Corp.* | | | 28,340 | | | | 138,583 | |
| | | | | | | | |
| | | | | | | 1,603,775 | |
| | | | | | | | |
Internet Software & Services - 1.08% | | | | | | | | |
comScore, Inc.* | | | 6,140 | | | | 144,352 | |
Google, Inc. - Class A* | | | 13,265 | | | | 8,131,312 | |
NetEase.com, Inc. - ADR (China)* | | | 1,560 | | | | 65,208 | |
Tencent Holdings Ltd. (China)1 | | | 3,500 | | | | 80,456 | |
VistaPrint N.V. (Netherlands)* | | | 9,630 | | | | 405,134 | |
Vocus, Inc.* | | | 11,740 | | | | 260,041 | |
| | | | | | | | |
| | | | | | | 9,086,503 | |
| | | | | | | | |
IT Services - 1.74% | | | | | | | | |
Accenture plc - Class A (Ireland) | | | 8,250 | | | | 368,858 | |
Amadeus IT Holding S.A. - Class A (Spain)*,1 | | | 7,240 | | | | 147,730 | |
Amdocs Ltd. (Guernsey)* | | | 21,140 | | | | 648,575 | |
Automatic Data Processing, Inc. | | | 84,698 | | | | 3,762,285 | |
| | |
| 15 | | The accompanying notes are an integral part of the financial statements. |
Investment Portfolio - October 31, 2010
| | | | | | | | |
Pro-Blend® Conservative Term Series | | Shares | | | Value
(Note 2) | |
| | |
COMMON STOCKS (continued) | | | | | | | | |
| | |
Information Technology (continued) | | | | | | | | |
IT Services (continued) | | | | | | | | |
Cap Gemini S.A. (France)1 | | | 5,590 | | | $ | 285,361 | |
Cielo S.A. (Brazil) | | | 26,000 | | | | 224,019 | |
MasterCard, Inc. - Class A | | | 14,660 | | | | 3,519,280 | |
Redecard S.A. (Brazil) | | | 13,370 | | | | 172,914 | |
Visa, Inc. - Class A | | | 23,370 | | | | 1,826,833 | |
The Western Union Co. | | | 207,970 | | | | 3,660,272 | |
| | | | | | | | |
| | | | | | | 14,616,127 | |
| | | | | | | | |
Semiconductors & Semiconductor Equipment - 0.14% | | | | | | | | |
Advantest Corp. (Japan)1 | | | 15,400 | | | | 292,500 | |
Infineon Technologies AG (Germany)*,1 | | | 28,000 | | | | 220,282 | |
Sumco Corp. (Japan)*,1 | | | 22,300 | | | | 344,840 | |
Taiwan Semiconductor Manufacturing Co. Ltd. - ADR (Taiwan) | | | 9,041 | | | | 98,637 | |
Tokyo Electron Ltd. (Japan)1 | | | 3,900 | | | | 220,051 | |
Yingli Green Energy Holding Co. Ltd. - ADR (China)* | | | 2,670 | | | | 31,132 | |
| | | | | | | | |
| | | | | | | 1,207,442 | |
| | | | | | | | |
Software - 0.76% | | | | | | | | |
Adobe Systems, Inc.* | | | 1,860 | | | | 52,359 | |
Autodesk, Inc.* | | | 95,040 | | | | 3,438,547 | |
Electronic Arts, Inc.* | | | 128,830 | | | | 2,041,956 | |
Fortinet, Inc.* | | | 8,630 | | | | 258,900 | |
Misys plc (United Kingdom)*,1 | | | 15,155 | | | | 68,235 | |
SAP AG (Germany)1 | | | 2,290 | | | | 119,307 | |
SolarWinds, Inc.* | | | 15,000 | | | | 272,250 | |
Square Enix Holdings Co. Ltd. (Japan)1 | | | 4,200 | | | | 87,718 | |
| | | | | | | | |
| | | | | | | 6,339,272 | |
| | | | | | | | |
Total Information Technology | | | | | | | 48,221,303 | |
| | | | | | | | |
Materials - 1.63% | | | | | | | | |
Chemicals - 1.02% | | | | | | | | |
Arkema S.A. (France)1 | | | 2 | | | | 129 | |
BASF SE (Germany)1 | | | 1,660 | | | | 120,702 | |
Calgon Carbon Corp.* | | | 9,140 | | | | 137,191 | |
Johnson Matthey plc (United Kingdom)1 | | | 2,300 | | | | 70,534 | |
Monsanto Co. | | | 133,580 | | | | 7,937,324 | |
The Scotts Miracle-Gro Co. - Class A | | | 1,300 | | | | 69,420 | |
Shin-Etsu Chemical Co. Ltd. (Japan)1 | | | 4,300 | | | | 217,434 | |
| | | | | | | | |
| | | | | | | 8,552,734 | |
| | | | | | | | |
Construction Materials - 0.42% | | | | | | | | |
CRH plc (Ireland)1 | | | 9,200 | | | | 158,754 | |
Eagle Materials, Inc. | | | 3,020 | | | | 70,849 | |
| | | | |
| The accompanying notes are an integral part of the financial statements. | | | 16 | |
Investment Portfolio - October 31, 2010
| | | | | | | | |
Pro-Blend® Conservative Term Series | | Shares | | | Value
(Note 2) | |
| | |
COMMON STOCKS (continued) | | | | | | | | |
| | |
Materials (continued) | | | | | | | | |
Construction Materials (continued) | | | | | | | | |
Martin Marietta Materials, Inc. | | | 21,890 | | | $ | 1,761,707 | |
Vulcan Materials Co. | | | 43,150 | | | | 1,575,407 | |
| | | | | | | | |
| | | | | | | 3,566,717 | |
| | | | | | | | |
Containers & Packaging - 0.19% | | | | | | | | |
Owens-Illinois, Inc.* | | | 57,150 | | | | 1,601,914 | |
| | | | | | | | |
Paper & Forest Products - 0.00%** | | | | | | | | |
Norbord, Inc. (Canada)* | | | 577 | | | | 6,585 | |
| | | | | | | | |
Total Materials | | | | | | | 13,727,950 | |
| | | | | | | | |
Telecommunication Services - 0.05% | | | | | | | | |
Diversified Telecommunication Services - 0.03% | | | | | | | | |
France Telecom S.A. (France)1 | | | 4,780 | | | | 114,688 | |
Swisscom AG - ADR (Switzerland)3 | | | 3,150 | | | | 131,134 | |
| | | | | | | | |
| | | | | | | 245,822 | |
| | | | | | | | |
Wireless Telecommunication Services - 0.02% | | | | | | | | |
SK Telecom Co. Ltd. - ADR (South Korea) | | | 11,320 | | | | 208,628 | |
| | | | | | | | |
Total Telecommunication Services | | | | | | | 454,450 | |
| | | | | | | | |
Utilities - 0.06% | | | | | | | | |
Electric Utilities - 0.03% | | | | | | | | |
E.ON AG (Germany)1 | | | 4,875 | | | | 152,590 | |
Prime Infrastructure Group (Australia)1 | | | 17,290 | | | | 84,441 | |
| | | | | | | | |
| | | | | | | 237,031 | |
| | | | | | | | |
Independent Power Producers & Energy Traders - 0.01% | | | | | | | | |
Mirant Corp.* | | | 2,430 | | | | 25,782 | |
RRI Energy, Inc.* | | | 7,380 | | | | 27,749 | |
| | | | | | | | |
| | | | | | | 53,531 | |
| | | | | | | | |
Multi-Utilities - 0.01% | | | | | | | | |
National Grid plc (United Kingdom)1 | | | 8,760 | | | | 82,839 | |
| | | | | | | | |
Water Utilities - 0.01% | | | | | | | | |
Cia de Saneamento de Minas Gerais - Copasa MG (Brazil) | | | 5,860 | | | | 89,849 | |
| | | | | | | | |
Total Utilities | | | | | | | 463,250 | |
| | | | | | | | |
TOTAL COMMON STOCKS
(Identified Cost $171,431,467) | | | | | | | 188,492,174 | |
| | | | | | | | |
| | |
PREFERRED STOCKS - 0.16% | | | | | | | | |
| | |
Consumer Staples - 0.01% | | | | | | | | |
Household Products - 0.01% | | | | | | | | |
Henkel AG & Co. KGaA (Germany)1 | | | 1,540 | | | | 90,837 | |
| | | | | | | | |
| | |
| 17 | | The accompanying notes are an integral part of the financial statements. |
Investment Portfolio - October 31, 2010
| | | | | | | | |
Pro-Blend® Conservative Term Series | | Shares/
Principal Amount | | | Value
(Note 2) | |
| | |
PREFERRED STOCKS (continued) | | | | | | | | |
| | |
Financials - 0.15% | | | | | | | | |
Commercial Banks - 0.06% | | | | | | | | |
PNC Financial Services Group, Inc., Series K | | | 180,000 | | | $ | 188,780 | |
Wells Fargo & Co., Series K | | | 300,000 | | | | 315,000 | |
| | | | | | | | |
| | | | | | | 503,780 | |
| | | | | | | | |
Diversified Financial Services - 0.09% | | | | | | | | |
Bank of America Corp., Series K | | | 320,000 | | | | 322,934 | |
JPMorgan Chase & Co., Series 1 | | | 375,000 | | | | 399,754 | |
| | | | | | | | |
| | | | | | | 722,688 | |
| | | | | | | | |
Total Financials | | | | | | | 1,226,468 | |
| | | | | | | | |
TOTAL PREFERRED STOCKS
(Identified Cost $1,200,461) | | | | | | | 1,317,305 | |
| | | | | | | | |
| | |
WARRANTS - 0.00%** | | | | | | | | |
| | |
Health Care - 0.00%** | | | | | | | | |
Life Sciences Tools & Services - 0.00%** | | | | | | | | |
Caliper Life Sciences, Inc., 8/10/2011*
(Identified Cost $215) | | | 348 | | | | 12 | |
| | | | | | | | |
| | |
CORPORATE BONDS - 33.28% | | | | | | | | |
| | |
Convertible Corporate Bonds - 0.02% | | | | | | | | |
Health Care - 0.01% | | | | | | | | |
Biotechnology - 0.01% | | | | | | | | |
Amgen, Inc., 0.375%, 2/1/2013 | | $ | 110,000 | | | | 110,275 | |
| | | | | | | | |
Information Technology - 0.01% | | | | | | | | |
Computers & Peripherals - 0.01% | | | | | | | | |
EMC Corp., 1.75%, 12/1/2013 | | | 40,000 | | | | 57,050 | |
| | | | | | | | |
Total Convertible Corporate Bonds
(Identified Cost $154,673) | | | | | | | 167,325 | |
| | | | | | | | |
Non-Convertible Corporate Bonds - 33.26% | | | | | | | | |
Consumer Discretionary - 4.70% | | | | | | | | |
Hotels, Restaurants & Leisure - 0.95% | | | | | | | | |
Cedar Fair LP - Canada’s Wonderland Co. - Magnum Management Corp.4, 9.125%, 8/1/2018 | | | 110,000 | | | | 118,250 | |
International Game Technology, 7.50%, 6/15/2019 | | | 4,000,000 | | | | 4,702,024 | |
McDonald’s Corp., 5.80%, 10/15/2017 | | | 1,920,000 | | | | 2,294,076 | |
Scientific Games International, Inc.4, 7.875%, 6/15/2016 | | | 110,000 | | | | 113,300 | |
Wendy’s - Arby’s Restaurants LLC, 10.00%, 7/15/2016 | | | 225,000 | | | | 246,375 | |
Wyndham Worldwide Corp., 9.875%, 5/1/2014 | | | 90,000 | | | | 106,361 | |
Wyndham Worldwide Corp., 6.00%, 12/1/2016 | | | 370,000 | | | | 395,116 | |
| | | | | | | | |
| | | | | | | 7,975,502 | |
| | | | | | | | |
| | | | |
| The accompanying notes are an integral part of the financial statements. | | | 18 | |
Investment Portfolio - October 31, 2010
| | | | | | | | |
Pro-Blend® Conservative Term Series | | Principal Amount | | | Value
(Note 2) | |
| | |
CORPORATE BONDS (continued) | | | | | | | | |
| | |
Non-Convertible Corporate Bonds (continued) | | | | | | | | |
Consumer Discretionary (continued) | | | | | | | | |
Household Durables - 0.10% | | | | | | | | |
Newell Rubbermaid, Inc., 4.70%, 8/15/2020 | | $ | 820,000 | | | $ | 852,439 | |
| | | | | | | | |
Media - 3.17% | | | | | | | | |
Cablevision Systems Corp., 8.625%, 9/15/2017 | | | 425,000 | | | | 479,719 | |
Columbus International, Inc. (Barbados)4, 11.50%, 11/20/2014 | | | 130,000 | | | | 145,762 | |
Comcast Corp., 5.15%, 3/1/2020 | | | 2,000,000 | | | | 2,199,724 | |
Comcast Corp., 6.50%, 11/15/2035 | | | 540,000 | | | | 591,323 | |
Comcast Corp., 6.95%, 8/15/2037 | | | 490,000 | | | | 570,022 | |
DIRECTV Holdings LLC, 5.20%, 3/15/2020 | | | 6,000,000 | | | | 6,516,546 | |
Discovery Communications LLC, 5.05%, 6/1/2020 | | | 6,580,000 | | | | 7,246,093 | |
Interactive Data Corp.4, 10.25%, 8/1/2018 | | | 160,000 | | | | 175,000 | |
MDC Partners, Inc. (Canada)4, 11.00%, 11/1/2016 | | | 50,000 | | | | 55,500 | |
Sirius XM Radio, Inc.4, 9.75%, 9/1/2015 | | | 235,000 | | | | 263,494 | |
Time Warner, Inc., 4.875%, 3/15/2020 | | | 6,000,000 | | | | 6,586,422 | |
Time Warner, Inc., 7.625%, 4/15/2031 | | | 485,000 | | | | 590,382 | |
Unitymedia Hessen GmbH & Co. KG - Unitymedia NRW GmbH (Germany)4, 8.125%, 12/1/2017 | | | 100,000 | | | | 104,750 | |
Unitymedia Hessen GmbH & Co. KG - Unitymedia NRW GmbH (Germany)4, 8.125%, 12/1/2017 | | | 90,000 | | | | 130,900 | |
UPC Holding B.V. (Netherlands)4, 9.875%, 4/15/2018 | | | 305,000 | | | | 333,212 | |
Virgin Media Finance plc (United Kingdom), 8.375%, 10/15/2019 | | | 120,000 | | | | 133,800 | |
Virgin Media Finance plc, Series 1 (United Kingdom), 9.50%, 8/15/2016 | | | 90,000 | | | | 102,263 | |
WMG Acquisition Corp., 9.50%, 6/15/2016 | | | 215,000 | | | | 231,663 | |
XM Satellite Radio, Inc.4, 7.625%, 11/1/2018 | | | 170,000 | | | | 174,675 | |
| | | | | | | | |
| | | | | | | 26,631,250 | |
| | | | | | | | |
Multiline Retail - 0.05% | | | | | | | | |
Target Corp., 6.00%, 1/15/2018 | | | 325,000 | | | | 392,391 | |
| | | | | | | | |
Specialty Retail - 0.39% | | | | | | | | |
The Home Depot, Inc., 5.40%, 3/1/2016 | | | 510,000 | | | | 585,008 | |
Lowe’s Companies, Inc., 6.10%, 9/15/2017 | | | 1,800,000 | | | | 2,179,355 | |
Rent-A-Center, Inc.4, 6.625%, 11/15/2020 | | | 300,000 | | | | 303,000 | |
Toys R Us Property Co. LLC4, 8.50%, 12/1/2017 | | | 230,000 | | | | 248,975 | |
| | | | | | | | |
| | | | | | | 3,316,338 | |
| | | | | | | | |
Textiles, Apparel & Luxury Goods - 0.04% | | | | | | | | |
VF Corp., 5.95%, 11/1/2017 | | | 330,000 | | | | 385,208 | |
| | | | | | | | |
Total Consumer Discretionary | | | | | | | 39,553,128 | |
| | | | | | | | |
Consumer Staples - 1.75% | | | | | | | | |
Beverages - 0.12% | | | | | | | | |
CEDC Finance Corp. International, Inc.4, 9.125%, 12/1/2016 | | | 235,000 | | | | 253,800 | |
Constellation Brands, Inc., 8.375%, 12/15/2014 | | | 230,000 | | | | 259,038 | |
| | |
| 19 | | The accompanying notes are an integral part of the financial statements. |
Investment Portfolio - October 31, 2010
| | | | | | | | |
Pro-Blend® Conservative Term Series | | Principal Amount | | | Value
(Note 2) | |
| | |
CORPORATE BONDS (continued) | | | | | | | | |
| | |
Non-Convertible Corporate Bonds (continued) | | | | | | | | |
Consumer Staples (continued) | | | | | | | | |
Beverages (continued) | | | | | | | | |
PepsiCo, Inc., 5.00%, 6/1/2018 | | $ | 110,000 | | | $ | 125,244 | |
PepsiCo, Inc., 7.90%, 11/1/2018 | | | 290,000 | | | | 388,834 | |
| | | | | | | | |
| | | | | | | 1,026,916 | |
| | | | | | | | |
Food & Staples Retailing - 0.79% | | | | | | | | |
Ingles Markets, Inc., 8.875%, 5/15/2017 | | | 85,000 | | | | 93,925 | |
The Kroger Co., 6.15%, 1/15/2020 | | | 5,500,000 | | | | 6,490,545 | |
| | | | | | | | |
| | | | | | | 6,584,470 | |
| | | | | | | | |
Food Products - 0.80% | | | | | | | | |
Kraft Foods, Inc., 6.125%, 2/1/2018 | | | 335,000 | | | | 394,636 | |
Kraft Foods, Inc., 5.375%, 2/10/2020 | | | 5,665,000 | | | | 6,346,868 | |
| | | | | | | | |
| | | | | | | 6,741,504 | |
| | | | | | | | |
Personal Products - 0.04% | | | | | | | | |
Revlon Consumer Products Corp., 9.75%, 11/15/2015 | | | 335,000 | | | | 349,237 | |
| | | | | | | | |
Total Consumer Staples | | | | | | | 14,702,127 | |
| | | | | | | | |
Energy - 2.51% | | | | | | | | |
Energy Equipment & Services - 1.11% | | | | | | | | |
Baker Hughes, Inc., 7.50%, 11/15/2018 | | | 305,000 | | | | 394,496 | |
Cie Generale de Geophysique - Veritas (France), 7.75%, 5/15/2017 | | | 275,000 | | | | 288,063 | |
Complete Production Services, Inc., 8.00%, 12/15/2016 | | | 160,000 | | | | 168,400 | |
Hornbeck Offshore Services, Inc., 8.00%, 9/1/2017 | | | 70,000 | | | | 70,962 | |
Hornbeck Offshore Services, Inc., Series B, 6.125%, 12/1/2014 | | | 125,000 | | | | 125,000 | |
Key Energy Services, Inc., 8.375%, 12/1/2014 | | | 160,000 | | | | 171,400 | |
Thermon Industries, Inc.4, 9.50%, 5/1/2017 | | | 185,000 | | | | 195,637 | |
Weatherford International Ltd. (Switzerland), 9.625%, 3/1/2019 | | | 6,000,000 | | | | 7,923,654 | |
| | | | | | | | |
| | | | | | | 9,337,612 | |
| | | | | | | | |
Oil, Gas & Consumable Fuels - 1.40% | | | | | | | | |
Anadarko Petroleum Corp., 5.95%, 9/15/2016 | | | 2,950,000 | | | | 3,226,267 | |
Anadarko Petroleum Corp., 8.70%, 3/15/2019 | | | 1,220,000 | | | | 1,510,336 | |
Anadarko Petroleum Corp., 6.95%, 6/15/2019 | | | 3,000,000 | | | | 3,396,291 | |
Apache Corp., 6.90%, 9/15/2018 | | | 155,000 | | | | 194,868 | |
Aquilex Holdings LLC - Aquilex Finance Corp., 11.125%, 12/15/2016 | | | 115,000 | | | | 109,537 | |
Arch Coal, Inc., 8.75%, 8/1/2016 | | | 55,000 | | | | 61,738 | |
Arch Western Finance LLC, 6.75%, 7/1/2013 | | | 125,000 | | | | 126,250 | |
Chaparral Energy, Inc., 8.875%, 2/1/2017 | | | 230,000 | | | | 230,000 | |
Chesapeake Energy Corp., 9.50%, 2/15/2015 | | | 215,000 | | | | 249,400 | |
Coffeyville Resources LLC - Coffeyville Finance, Inc.4, 9.00%, 4/1/2015 | | | 90,000 | | | | 96,525 | |
Coffeyville Resources LLC - Coffeyville Finance, Inc.4, 10.875%, 4/1/2017 | | | 85,000 | | | | 90,525 | |
Crosstex Energy LP - Crosstex Energy Finance Corp., 8.875%, 2/15/2018 | | | 390,000 | | | | 421,200 | |
| | | | |
| The accompanying notes are an integral part of the financial statements. | | | 20 | |
Investment Portfolio - October 31, 2010
| | | | | | | | |
Pro-Blend® Conservative Term Series | | Principal Amount | | | Value
(Note 2) | |
| | |
CORPORATE BONDS (continued) | | | | | | | | |
| | |
Non-Convertible Corporate Bonds (continued) | | | | | | | | |
Energy (continued) | | | | | | | | |
Oil, Gas & Consumable Fuels (continued) | | | | | | | | |
Hess Corp., 5.60%, 2/15/2041 | | $ | 265,000 | | | $ | 270,438 | |
Linn Energy LLC - Linn Energy Finance Corp.4, 7.75%, 2/1/2021 | | | 260,000 | | | | 268,450 | |
MarkWest Energy Partners LP - MarkWest Energy Finance Corp., 6.75%, 11/1/2020 | | | 290,000 | | | | 296,525 | |
Martin Midstream Partners LP - Martin Midstream Finance Corp.4, 8.875%, 4/1/2018 | | | 180,000 | | | | 187,200 | |
Niska Gas Storage US LLC - Niska Gas Storage Canada ULC4, 8.875%, 3/15/2018 | | | 125,000 | | | | 136,562 | |
Plains Exploration & Production Co., 8.625%, 10/15/2019 | | | 360,000 | | | | 399,600 | |
Targa Resources Partners LP - Targa Resources Partners Finance Corp., 8.25%, 7/1/2016 | | | 175,000 | | | | 185,500 | |
Tesoro Corp., 9.75%, 6/1/2019 | | | 255,000 | | | | 283,050 | |
Whiting Petroleum Corp., 7.00%, 2/1/2014 | | | 35,000 | | | | 37,231 | |
| | | | | | | | |
| | | | | | | 11,777,493 | |
| | | | | | | | |
Total Energy | | | | | | | 21,115,105 | |
| | | | | | | | |
Financials - 15.37% | | | | | | | | |
Capital Markets - 2.00% | | | | | | | | |
The Charles Schwab Corp., 4.45%, 7/22/2020 | | | 7,000,000 | | | | 7,279,853 | |
Goldman Sachs Capital I, 6.345%, 2/15/2034 | | | 380,000 | | | | 363,297 | |
Goldman Sachs Capital II5, 5.793%, 12/29/2049 | | | 500,000 | | | | 429,375 | |
The Goldman Sachs Group, Inc.6, 3.25%, 6/15/2012 | | | 3,266,000 | | | | 3,416,484 | |
The Goldman Sachs Group, Inc., 6.15%, 4/1/2018 | | | 335,000 | | | | 375,117 | |
The Goldman Sachs Group, Inc., 5.375%, 3/15/2020 | | | 3,165,000 | | | | 3,348,804 | |
Merrill Lynch & Co., Inc., 6.11%, 1/29/2037 | | | 210,000 | | | | 199,916 | |
Morgan Stanley, 5.50%, 1/26/2020 | | | 1,325,000 | | | | 1,379,175 | |
| | | | | | | | |
| | | | | | | 16,792,021 | |
| | | | | | | | |
Commercial Banks - 3.39% | | | | | | | | |
Household Finance Co., 6.375%, 11/27/2012 | | | 515,000 | | | | 562,833 | |
KeyBank National Association6, 3.20%, 6/15/2012 | | | 3,476,000 | | | | 3,633,362 | |
KeyBank National Association, 5.45%, 3/3/2016 | | | 550,000 | | | | 599,254 | |
Manufacturers & Traders Trust Co., 6.625%, 12/4/2017 | | | 315,000 | | | | 368,507 | |
National City Corp., 6.875%, 5/15/2019 | | | 7,000,000 | | | | 8,155,441 | |
PNC Bank National Association, 5.25%, 1/15/2017 | | | 195,000 | | | | 211,651 | |
PNC Funding Corp.6, 2.30%, 6/22/2012 | | | 7,246,000 | | | | 7,464,162 | |
U.S. Bank National Association, 6.375%, 8/1/2011 | | | 30,000 | | | | 31,307 | |
U.S. Bank National Association, 6.30%, 2/4/2014 | | | 100,000 | | | | 114,712 | |
USB Capital XIII Trust, 6.625%, 12/15/2039 | | | 210,000 | | | | 213,669 | |
Wachovia Corp., 5.25%, 8/1/2014 | | | 5,935,000 | | | | 6,444,799 | |
Wells Fargo & Co.6, 3.00%, 12/9/2011 | | | 515,000 | | | | 530,254 | |
| | |
| 21 | | The accompanying notes are an integral part of the financial statements. |
Investment Portfolio - October 31, 2010
| | | | | | | | |
Pro-Blend® Conservative Term Series | | Principal Amount | | | Value
(Note 2) | |
CORPORATE BONDS (continued) | | | | | | | | |
Non-Convertible Corporate Bonds (continued) | | | | | | | | |
Financials (continued) | | | | | | | | |
Commercial Banks (continued) | | | | | | | | |
Wilmington Trust Corp., 8.50%, 4/2/2018 | | $ | 120,000 | | | $ | 122,754 | |
| | | | | | | | |
| | | | | | | 28,452,705 | |
| | | | | | | | |
Consumer Finance - 1.17% | | | | | | | | |
American Express Co., 8.125%, 5/20/2019 | | | 7,025,000 | | | | 9,024,090 | |
American Express Co.5, 6.80%, 9/1/2066 | | | 390,000 | | | | 391,463 | |
Credit Acceptance Corp.4, 9.125%, 2/1/2017 | | | 410,000 | | | | 430,500 | |
| | | | | | | | |
| | | | | | | 9,846,053 | |
| | | | | | | | |
Diversified Financial Services - 5.57% | | | | | | | | |
Bank of America Corp.6, 3.125%, 6/15/2012 | | | 5,518,000 | | | | 5,760,229 | |
Bank of America Corp., 4.875%, 1/15/2013 | | | 1,800,000 | | | | 1,899,500 | |
Bank of America Corp., 5.75%, 8/15/2016 | | | 205,000 | | | | 218,119 | |
Bank of America Corp., 7.625%, 6/1/2019 | | | 4,315,000 | | | | 5,051,394 | |
Citigroup Funding, Inc.6, 1.875%, 10/22/2012 | | | 1,520,000 | | | | 1,561,286 | |
Citigroup, Inc.6, 2.875%, 12/9/2011 | | | 10,788,000 | | | | 11,087,906 | |
Citigroup, Inc., 8.50%, 5/22/2019 | | | 7,080,000 | | | | 8,890,193 | |
JPMorgan Chase & Co.6, 2.625%, 12/1/2010 | | | 5,000,000 | | | | 5,010,240 | |
JPMorgan Chase & Co.6, 3.125%, 12/1/2011 | | | 3,600,000 | | | | 3,706,492 | |
JPMorgan Chase & Co., 6.30%, 4/23/2019 | | | 2,000,000 | | | | 2,334,034 | |
JPMorgan Chase & Co., 4.95%, 3/25/2020 | | | 1,255,000 | | | | 1,330,992 | |
| | | | | | | | |
| | | | | | | 46,850,385 | |
| | | | | | | | |
Insurance - 0.09% | | | | | | | | |
American International Group, Inc., 4.25%, 5/15/2013 | | | 200,000 | | | | 209,000 | |
Fidelity National Financial, Inc., 6.60%, 5/15/2017 | | | 210,000 | | | | 216,577 | |
Hartford Financial Services Group, Inc.5, 8.125%, 6/15/2038 | | | 340,000 | | | | 361,250 | |
| | | | | | | | |
| | | | | | | 786,827 | |
| | | | | | | | |
Real Estate Investment Trusts (REITS) - 3.15% | | | | | | | | |
AvalonBay Communities, Inc., 6.10%, 3/15/2020 | | | 2,145,000 | | | | 2,509,873 | |
Boston Properties LP, 5.875%, 10/15/2019 | | | 5,150,000 | | | | 5,809,978 | |
Camden Property Trust, 5.70%, 5/15/2017 | | | 2,270,000 | | | | 2,510,243 | |
DuPont Fabros Technology LP, 8.50%, 12/15/2017 | | | 305,000 | | | | 330,162 | |
Felcor Lodging LP, 10.00%, 10/1/2014 | | | 270,000 | | | | 303,750 | |
HCP, Inc., 6.70%, 1/30/2018 | | | 4,155,000 | | | | 4,610,193 | |
Health Care REIT, Inc., 6.20%, 6/1/2016 | | | 520,000 | | | | 594,532 | |
Host Hotels & Resorts LP, 6.875%, 11/1/2014 | | | 105,000 | | | | 108,347 | |
Host Hotels & Resorts LP, 6.375%, 3/15/2015 | | | 85,000 | | | | 87,125 | |
Mack-Cali Realty LP, 7.75%, 8/15/2019 | | | 315,000 | | | | 379,421 | |
National Retail Properties, Inc., 6.875%, 10/15/2017 | | | 280,000 | | | | 315,486 | |
Omega Healthcare Investors, Inc.4, 7.50%, 2/15/2020 | | | 165,000 | | | | 177,788 | |
| | | | |
| The accompanying notes are an integral part of the financial statements. | | | 22 | |
Investment Portfolio - October 31, 2010
| | | | | | | | |
Pro-Blend® Conservative Term Series | | Principal Amount | | | Value
(Note 2) | |
| | |
CORPORATE BONDS (continued) | | | | | | | | |
| | |
Non-Convertible Corporate Bonds (continued) | | | | | | | | |
Financials (continued) | | | | | | | | |
Real Estate Investment Trusts (REITS) (continued) | | | | | | | | |
Simon Property Group LP, 10.35%, 4/1/2019 | | $ | 6,180,000 | | | $ | 8,735,992 | |
| | | | | | | | |
| | | | | | | 26,472,890 | |
| | | | | | | | |
Total Financials | | | | | | | 129,200,881 | |
| | | | | | | | |
Health Care - 0.79% | | | | | | | | |
Biotechnology - 0.36% | | | | | | | | |
Amgen, Inc., 3.45%, 10/1/2020 | | | 3,000,000 | | | | 3,009,897 | |
| | | | | | | | |
Health Care Equipment & Supplies - 0.17% | | | | | | | | |
Alere, Inc., 7.875%, 2/1/2016 | | | 85,000 | | | | 89,038 | |
Alere, Inc., 9.00%, 5/15/2016 | | | 437,000 | | | | 466,498 | |
Becton Dickinson and Co., 6.00%, 5/15/2039 | | | 330,000 | | | | 381,531 | |
Fresenius Medical Care Capital Trust IV, 7.875%, 6/15/2011 | | | 75,000 | | | | 77,062 | |
Fresenius US Finance II, Inc.4, 9.00%, 7/15/2015 | | | 355,000 | | | | 414,462 | |
| | | | | | | | |
| | | | | | | 1,428,591 | |
| | | | | | | | |
Health Care Providers & Services - 0.12% | | | | | | | | |
BioScrip, Inc., 10.25%, 10/1/2015 | | | 165,000 | | | | 174,488 | |
HCA, Inc., 7.875%, 2/15/2020 | | | 315,000 | | | | 348,862 | |
Health Management Associates, Inc., 6.125%, 4/15/2016 | | | 255,000 | | | | 262,650 | |
LifePoint Hospitals, Inc.4, 6.625%, 10/1/2020 | | | 260,000 | | | | 273,650 | |
| | | | | | | | |
| | | | | | | 1,059,650 | |
| | | | | | | | |
Life Sciences Tools & Services - 0.02% | | | | | | | | |
PharmaNet Development Group, Inc.4, 10.875%, 4/15/2017 | | | 180,000 | | | | 187,200 | |
| | | | | | | | |
Pharmaceuticals - 0.12% | | | | | | | | |
Johnson & Johnson, 5.95%, 8/15/2037 | | | 160,000 | | | | 190,828 | |
Novartis Securities Investment Ltd. (Bermuda), 5.125%, 2/10/2019 | | | 525,000 | | | | 602,662 | |
Wyeth, 6.50%, 2/1/2034 | | | 155,000 | | | | 186,731 | |
| | | | | | | | |
| | | | | | | 980,221 | |
| | | | | | | | |
Total Health Care | | | | | | | 6,665,559 | |
| | | | | | | | |
Industrials - 4.96% | | | | | | | | |
Aerospace & Defense - 0.40% | | | | | | | | |
BE Aerospace, Inc., 6.875%, 10/1/2020 | | | 260,000 | | | | 276,250 | |
The Boeing Co., 6.00%, 3/15/2019 | | | 2,410,000 | | | | 2,890,038 | |
GeoEye, Inc., 9.625%, 10/1/2015 | | | 75,000 | | | | 83,531 | |
Kratos Defense & Security Solutions, Inc., 10.00%, 6/1/2017 | | | 115,000 | | | | 127,650 | |
| | | | | | | | |
| | | | | | | 3,377,469 | |
| | | | | | | | |
Air Freight & Logistics - 0.75% | | | | | | | | |
FedEx Corp., 8.00%, 1/15/2019 | | | 4,690,000 | | | | 6,043,295 | |
| | |
| 23 | | The accompanying notes are an integral part of the financial statements. |
Investment Portfolio - October 31, 2010
| | | | | | | | |
Pro-Blend® Conservative Term Series | | Principal Amount | | | Value
(Note 2) | |
| | |
CORPORATE BONDS (continued) | | | | | | | | |
| | |
Non-Convertible Corporate Bonds (continued) | | | | | | | | |
Industrials (continued) | | | | | | | | |
Air Freight & Logistics (continued) | | | | | | | | |
United Parcel Service, Inc., 6.20%, 1/15/2038 | | $ | 180,000 | | | $ | 214,940 | |
| | | | | | | | |
| | | | | | | 6,258,235 | |
| | | | | | | | |
Airlines - 0.28% | | | | | | | | |
Continental Airlines, Inc.4, 6.75%, 9/15/2015 | | | 250,000 | | | | 260,312 | |
Delta Air Lines Pass-Through Trust, Series 2001-1, Class A-2, 7.111%, 9/18/2011 | | | 150,000 | | | | 157,125 | |
Delta Air Lines Pass-Through Trust, Series 2007-1, Class A, 6.821%, 8/10/2022 | | | 142,198 | | | | 153,574 | |
Delta Air Lines, Inc.4, 9.50%, 9/15/2014 | | | 198,000 | | | | 217,800 | |
Southwest Airlines Co., 5.25%, 10/1/2014 | | | 355,000 | | | | 383,001 | |
Southwest Airlines Co., 5.75%, 12/15/2016 | | | 1,070,000 | | | | 1,172,413 | |
| | | | | | | | |
| | | | | | | 2,344,225 | |
| | | | | | | | |
Building Products - 0.05% | | | | | | | | |
Building Materials Corp. of America4, 6.875%, 8/15/2018 | | | 175,000 | | | | 175,000 | |
Building Materials Corp. of America4, 7.50%, 3/15/2020 | | | 85,000 | | | | 86,912 | |
Owens Corning, 9.00%, 6/15/2019 | | | 150,000 | | | | 181,835 | |
| | | | | | | | |
| | | | | | | 443,747 | |
| | | | | | | | |
Commercial Services & Supplies - 0.50% | | | | | | | | |
ACCO Brands Corp., 10.625%, 3/15/2015 | | | 80,000 | | | | 90,300 | |
Clean Harbors, Inc., 7.625%, 8/15/2016 | | | 149,000 | | | | 157,381 | |
Garda World Security Corp. (Canada)4, 9.75%, 3/15/2017 | | | 165,000 | | | | 175,725 | |
Waste Management, Inc., 7.375%, 3/11/2019 | | | 3,000,000 | | | | 3,778,626 | |
| | | | | | | | |
| | | | | | | 4,202,032 | |
| | | | | | | | |
Industrial Conglomerates - 1.79% | | | | | | | | |
GE Capital Trust I5, 6.375%, 11/15/2067 | | | 340,000 | | | | 336,175 | |
General Electric Capital Corp.6, 3.00%, 12/9/2011 | | | 5,798,000 | | | | 5,966,484 | |
General Electric Capital Corp., 5.625%, 5/1/2018 | | | 1,800,000 | | | | 2,011,514 | |
General Electric Capital Corp., 5.50%, 1/8/2020 | | | 2,115,000 | | | | 2,327,989 | |
General Electric Capital Corp., Series A, 6.75%, 3/15/2032 | | | 355,000 | | | | 395,975 | |
General Electric Co., 5.25%, 12/6/2017 | | | 180,000 | | | | 202,656 | |
Textron, Inc., 5.60%, 12/1/2017 | | | 3,150,000 | | | | 3,420,009 | |
Textron, Inc., 7.25%, 10/1/2019 | | | 350,000 | | | | 416,576 | |
| | | | | | | | |
| | | | | | | 15,077,378 | |
| | | | | | | | |
Machinery - 0.33% | | | | | | | | |
Caterpillar Financial Services Corp., 7.05%, 10/1/2018 | | | 305,000 | | | | 384,667 | |
John Deere Capital Corp., 5.75%, 9/10/2018 | | | 2,060,000 | | | | 2,426,264 | |
| | | | | | | | |
| | | | | | | 2,810,931 | |
| | | | | | | | |
| | | | |
| The accompanying notes are an integral part of the financial statements. | | | 24 | |
Investment Portfolio - October 31, 2010
| | | | | | | | |
Pro-Blend® Conservative Term Series | | Principal Amount | | | Value
(Note 2) | |
| | |
CORPORATE BONDS (continued) | | | | | | | | |
| | |
Non-Convertible Corporate Bonds (continued) | | | | | | | | |
Industrials (continued) | | | | | | | | |
Marine - 0.07% | | | | | | | | |
Navios Maritime Holdings, Inc. - Navios Maritime Finance US, Inc. (Marshall Island)4, 8.875%, 11/1/2017 | | $ | 415,000 | | | $ | 443,013 | |
United Maritime Group LLC - United Maritime Group Finance Corp., 11.75%, 6/15/2015 | | | 115,000 | | | | 114,856 | |
| | | | | | | | |
| | | | | | | 557,869 | |
| | | | | | | | |
Road & Rail - 0.79% | | | | | | | | |
CSX Corp., 7.375%, 2/1/2019 | | | 4,000,000 | | | | 5,032,776 | |
CSX Corp., 6.00%, 10/1/2036 | | | 355,000 | | | | 377,809 | |
JB Hunt Transport Services, Inc., 3.375%, 9/15/2015 | | | 935,000 | | | | 946,514 | |
RailAmerica, Inc., 9.25%, 7/1/2017 | | | 61,000 | | | | 67,558 | |
Union Pacific Corp., 5.65%, 5/1/2017 | | | 175,000 | | | | 201,991 | |
| | | | | | | | |
| | | | | | | 6,626,648 | |
| | | | | | | | |
Total Industrials | | | | | | | 41,698,534 | |
| | | | | | | | |
Information Technology - 0.80% | | | | | | | | |
Communications Equipment - 0.12% | | | | | | | | |
Alcatel-Lucent USA, Inc., 6.45%, 3/15/2029 | | | 205,000 | | | | 171,175 | |
Cisco Systems, Inc., 5.90%, 2/15/2039 | | | 440,000 | | | | 494,512 | |
Hughes Network Systems LLC - HNS Finance Corp., 9.50%, 4/15/2014 | | | 290,000 | | | | 302,325 | |
| | | | | | | | |
| | | | | | | 968,012 | |
| | | | | | | | |
Computers & Peripherals - 0.07% | | | | | | | | |
International Business Machines Corp., 5.60%, 11/30/2039 | | | 535,000 | | | | 596,272 | |
| | | | | | | | |
Electronic Equipment, Instruments & Components - 0.46% | | | | | | | | |
Corning, Inc., 6.625%, 5/15/2019 | | | 3,200,000 | | | | 3,863,901 | |
| | | | | | | | |
IT Services - 0.08% | | | | | | | | |
The Western Union Co., 5.253%, 4/1/2020 | | | 590,000 | | | | 644,579 | |
| | | | | | | | |
Semiconductors & Semiconductor Equipment - 0.05% | | | | | | | | |
Advanced Micro Devices, Inc., 8.125%, 12/15/2017 | | | 150,000 | | | | 162,000 | |
Advanced Micro Devices, Inc.4, 7.75%, 8/1/2020 | | | 85,000 | | | | 90,100 | |
MagnaChip Semiconductor S.A. - MagnaChip Semiconductor Finance Co.4, 10.50%, 4/15/2018 | | | 180,000 | | | | 193,050 | |
| | | | | | | | |
| | | | | | | 445,150 | |
| | | | | | | | |
Software - 0.02% | | | | | | | | |
Microsoft Corp., 5.20%, 6/1/2039 | | | 190,000 | | | | 201,744 | |
| | | | | | | | |
Total Information Technology | | | | | | | 6,719,658 | |
| | | | | | | | |
Materials - 1.08% | | | | | | | | |
Chemicals - 0.11% | | | | | | | | |
E.I. du Pont de Nemours & Co., 6.00%, 7/15/2018 | | | 320,000 | | | | 383,296 | |
| | |
| 25 | | The accompanying notes are an integral part of the financial statements. |
Investment Portfolio - October 31, 2010
| | | | | | | | |
Pro-Blend® Conservative Term Series | | Principal Amount | | | Value
(Note 2) | |
| | |
CORPORATE BONDS (continued) | | | | | | | | |
| | |
Non-Convertible Corporate Bonds (continued) | | | | | | | | |
Materials (continued) | | | | | | | | |
Chemicals (continued) | | | | | | | | |
Ferro Corp., 7.875%, 8/15/2018 | | $ | 260,000 | | | $ | 276,575 | |
Rhodia S.A. (France)4, 6.875%, 9/15/2020 | | | 265,000 | | | | 278,581 | |
| | | | | | | | |
| | | | | | | 938,452 | |
| | | | | | | | |
Containers & Packaging - 0.02% | | | | | | | | |
Reynolds Group Issuer, Inc. - Reynolds Group Issuer LLC4, 8.50%, 5/15/2018 | | | 190,000 | | | | 194,275 | |
| | | | | | | | |
Metals & Mining - 0.46% | | | | | | | | |
Alcoa, Inc., 5.72%, 2/23/2019 | | | 2,032,000 | | | | 2,081,707 | |
Alcoa, Inc., 5.87%, 2/23/2022 | | | 295,000 | | | | 301,329 | |
BHP Billiton Finance (USA) Ltd. (Australia), 6.50%, 4/1/2019 | | | 925,000 | | | | 1,146,884 | |
Steel Dynamics, Inc., 7.75%, 4/15/2016 | | | 335,000 | | | | 357,613 | |
| | | | | | | | |
| | | | | | | 3,887,533 | |
| | | | | | | | |
Paper & Forest Products - 0.49% | | | | | | | | |
Georgia-Pacific LLC4, 8.25%, 5/1/2016 | | | 145,000 | | | | 166,387 | |
International Paper Co., 9.375%, 5/15/2019 | | | 2,500,000 | | | | 3,301,325 | |
International Paper Co., 7.50%, 8/15/2021 | | | 490,000 | | | | 597,526 | |
| | | | | | | | |
| | | | | | | 4,065,238 | |
| | | | | | | | |
Total Materials | | | | | | | 9,085,498 | |
| | | | | | | | |
Telecommunication Services - 0.28% | | | | | | | | |
Diversified Telecommunication Services - 0.12% | | | | | | | | |
Clearwire Communications LLC - Clearwire Finance, Inc.4, 12.00%, 12/1/2015 | | | 60,000 | | | | 66,600 | |
Clearwire Communications LLC - Clearwire Finance, Inc.4, 12.00%, 12/1/2015 | | | 115,000 | | | | 127,363 | |
Inmarsat Finance plc (United Kingdom)4, 7.375%, 12/1/2017 | | | 250,000 | | | | 267,500 | |
Intelsat Subsidiary Holding Co. Ltd. (Bermuda)4, 8.875%, 1/15/2015 | | | 245,000 | | | | 252,350 | |
Wind Acquisition Finance S.A. (Luxembourg)4, 11.75%, 7/15/2017 | | | 230,000 | | | | 262,200 | |
| | | | | | | | |
| | | | | | | 976,013 | |
| | | | | | | | |
Wireless Telecommunication Services - 0.16% | | | | | | | | |
CC Holdings GS V LLC - Crown Castle GS III Corp.4, 7.75%, 5/1/2017 | | | 185,000 | | | | 207,662 | |
Crown Castle Towers LLC4, 6.113%, 1/15/2020 | | | 390,000 | | | | 433,758 | |
Crown Castle Towers LLC4, 4.883%, 8/15/2020 | | | 224,000 | | | | 228,202 | |
NII Capital Corp., 8.875%, 12/15/2019 | | | 230,000 | | | | 255,875 | |
SBA Tower Trust4, 5.101%, 4/15/2017 | | | 200,000 | | | | 215,122 | |
| | | | | | | | |
| | | | | | | 1,340,619 | |
| | | | | | | | |
Total Telecommunication Services | | | | | | | 2,316,632 | |
| | | | | | | | |
| | | | |
| The accompanying notes are an integral part of the financial statements. | | | 26 | |
Investment Portfolio - October 31, 2010
| | | | | | | | |
Pro-Blend® Conservative Term Series | | Principal Amount/
Shares | | | Value
(Note 2) | |
| | |
CORPORATE BONDS (continued) | | | | | | | | |
| | |
Non-Convertible Corporate Bonds (continued) | | | | | | | | |
Utilities - 1.02% | | | | | | | | |
Electric Utilities - 0.98% | | | | | | | | |
Allegheny Energy Supply Co. LLC4, 5.75%, 10/15/2019 | | $ | 365,000 | | | $ | 382,829 | |
Columbus Southern Power Co., Series C, 5.50%, 3/1/2013 | | | 1,800,000 | | | | 1,976,989 | |
Exelon Generation Co. LLC, 5.20%, 10/1/2019 | | | 5,000,000 | | | | 5,519,215 | |
Southwestern Electric Power Co., 6.45%, 1/15/2019 | | | 335,000 | | | | 380,239 | |
| | | | | | | | |
| | | | | | | 8,259,272 | |
| | | | | | | | |
Independent Power Producers & Energy Traders - 0.03% | | | | | | | | |
Mirant Mid Atlantic Pass-Through Trust, Series B, 9.125%, 6/30/2017 | | | 107,343 | | | | 115,394 | |
North American Energy Alliance LLC - North American Energy Alliance Finance Corp.4, 10.875%, 6/1/2016 | | | 75,000 | | | | 83,250 | |
| | | | | | | | |
| | | | | | | 198,644 | |
| | | | | | | | |
Multi-Utilities - 0.01% | | | | | | | | |
CenterPoint Energy Resources Corp., Series B, 7.875%, 4/1/2013 | | | 85,000 | | | | 97,886 | |
| | | | | | | | |
Total Utilities | | | | | | | 8,555,802 | |
| | | | | | | | |
Total Non-Convertible Corporate Bonds
(Identified Cost $263,521,841) | | | | | | | 279,612,924 | |
| | | | | | | | |
TOTAL CORPORATE BONDS
(Identified Cost $263,676,514) | | | | | | | 279,780,249 | |
| | | | | | | | |
| | |
MUTUAL FUNDS - 0.59% | | | | | | | | |
iShares Dow Jones US Real Estate Index Fund | | | 790 | | | | 43,387 | |
iShares iBoxx High Yield Corporate Bond Fund | | | 24,030 | | | | 2,180,482 | |
iShares iBoxx Investment Grade Corporate Bond Fund | | | 24,680 | | | | 2,773,045 | |
| | | | | | | | |
TOTAL MUTUAL FUNDS
(Identified Cost $4,555,357) | | | | | | | 4,996,914 | |
| | | | | | | | |
| | |
U.S. TREASURY SECURITIES - 4.32% | | | | | | | | |
| | |
U.S. Treasury Notes - 4.32% | | | | | | | | |
U.S. Treasury Note, 0.375%, 9/30/2012 | | $ | 17,000,000 | | | | 17,011,951 | |
U.S. Treasury Note, 2.25%, 5/31/2014 | | | 1,300,000 | | | | 1,371,500 | |
U.S. Treasury Note, 2.375%, 9/30/2014 | | | 2,490,000 | | | | 2,640,177 | |
U.S. Treasury Note, 1.875%, 8/31/2017 | | | 7,822,000 | | | | 7,831,778 | |
U.S. Treasury Note, 3.50%, 2/15/2018 | | | 3,700,000 | | | | 4,078,384 | |
U.S. Treasury Note, 3.75%, 11/15/2018 | | | 3,000,000 | | | | 3,345,936 | |
| | | | | | | | |
| | |
TOTAL U.S. TREASURY SECURITIES
(Identified Cost $35,391,096) | | | | | | | 36,279,726 | |
| | | | | | | | |
| | |
| 27 | | The accompanying notes are an integral part of the financial statements. |
Investment Portfolio - October 31, 2010
| | | | | | | | |
Pro-Blend® Conservative Term Series | | Principal Amount | | | Value
(Note 2) | |
| | |
ASSET-BACKED SECURITIES - 0.06% | | | | | | | | |
| | |
Hertz Vehicle Financing LLC, Series 2009-2A, Class A24, 5.29%, 3/25/2016 | | $ | 170,000 | | | $ | 188,278 | |
Hertz Vehicle Financing LLC, Series 2010-1A, Class A24, 3.74%, 2/25/2017 | | | 300,000 | | | | 314,252 | |
| | | | | | | | |
TOTAL ASSET-BACKED SECURITIES
(Identified Cost $469,889) | | | | | | | 502,530 | |
| | | | | | | | |
| | |
COMMERCIAL MORTGAGE-BACKED SECURITIES - 0.23% | | | | | | | | |
Banc of America Commercial Mortgage, Inc., Series 2006-2, Class A45, 5.740%, 5/10/2045 | | | 100,000 | | | | 111,467 | |
Banc of America Commercial Mortgage, Inc., Series 2006-4, Class A4, 5.634%, 7/10/2046 | | | 100,000 | | | | 107,975 | |
Bear Stearns Commercial Mortgage Securities, Series 2006-PW12, Class A45, 5.723%, 9/11/2038 | | | 100,000 | | | | 111,870 | |
Bear Stearns Commercial Mortgage Securities, Series 2006-PW13, Class A4, 5.540%, 9/11/2041 | | | 100,000 | | | | 109,298 | |
Citigroup Commercial Mortgage Trust, Series 2006-C4, Class A35, 5.728%, 3/15/2049 | | | 100,000 | | | | 109,394 | |
Commercial Mortgage Pass-Through Certificates, Series 2010-C1, Class A14,7, 3.156%, 11/1/2015 | | | 155,000 | | | | 159,650 | |
JP Morgan Chase Commercial Mortgage Securities Corp., Series 2005-LDP5, Class A45, 5.198%, 12/15/2044 | | | 100,000 | | | | 110,228 | |
JP Morgan Chase Commercial Mortgage Securities Corp., Series 2006-LDP7, Class A45, 5.872%, 4/15/2045 | | | 100,000 | | | | 110,951 | |
LB-UBS Commercial Mortgage Trust, Series 2006-C4, Class A45, 5.881%, 6/15/2038 | | | 100,000 | | | | 109,912 | |
Merrill Lynch - Countrywide Commercial Mortgage Trust, Series 2006-3, Class A45, 5.414%, 7/12/2046 | | | 100,000 | | | | 106,803 | |
Vornado DP LLC, Series 2010-VNO, Class A2FX4, 4.004%, 9/13/2028 | | | 155,000 | | | | 156,877 | |
Wachovia Bank Commercial Mortgage Trust, Series 2005-C21, Class A45, 5.202%, 10/15/2044 | | | 100,000 | | | | 110,451 | |
Wachovia Bank Commercial Mortgage Trust, Series 2006-C25, Class A45, 5.737%, 5/15/2043 | | | 100,000 | | | | 110,834 | |
Wachovia Bank Commercial Mortgage Trust, Series 2006-C26, Class A35, 6.011%, 6/15/2045 | | | 100,000 | | | | 110,281 | |
Wells Fargo Commercial Mortgage Trust, Series 2010-C1, Class A24,7, 4.393%, 11/18/2043 | | | 265,000 | | | | 272,935 | |
| | | | | | | | |
TOTAL COMMERCIAL MORTGAGE-BACKED SECURITIES
(Identified Cost $1,849,990) | | | | | | | 1,908,926 | |
| | | | | | | | |
| | |
FOREIGN GOVERNMENT BONDS - 0.04% | | | | | | | | |
| | |
Hellenic Republic Government Bond (Greece), 6.00%, 7/19/2019
(Identified Cost $493,011) | | | 380,000 | | | | 382,877 | |
| | | | | | | | |
| | | | |
| The accompanying notes are an integral part of the financial statements. | | | 28 | |
Investment Portfolio - October 31, 2010
| | | | | | | | | | | | | | |
Pro-Blend® Conservative Term Series | | Principal Amount | | | Value
(Note 2) | |
| | |
U.S. GOVERNMENT AGENCIES - 33.36% | | | | | | | | |
| | |
Mortgage-Backed Securities - 9.33% | | | | | | | | |
Fannie Mae, Pool #805347, 5.50%, 1/1/2020 | | $ | 9,695 | | | $ | 10,594 | |
Fannie Mae, Pool #816064, 4.50%, 4/1/2020 | | | 106,619 | | | | 114,271 | |
Fannie Mae, Pool #863151, 4.50%, 11/1/2020 | | | 56,780 | | | | 60,607 | |
Fannie Mae, Pool #851149, 5.00%, 4/1/2021 | | | 156,790 | | | | 167,574 | |
Fannie Mae, Pool #888468, 5.50%, 9/1/2021 | | | 5,458,269 | | | | 5,932,045 | |
Fannie Mae, Pool #995233, 5.50%, 10/1/2021 | | | 336,550 | | | | 366,499 | |
Fannie Mae, Pool #888017, 6.00%, 11/1/2021 | | | 414,900 | | | | 451,749 | |
Fannie Mae, Pool #995329, 5.50%, 12/1/2021 | | | 3,283,931 | | | | 3,568,975 | |
Fannie Mae, Pool #888136, 6.00%, 12/1/2021 | | | 550,012 | | | | 598,861 | |
Fannie Mae, Pool #899023, 4.50%, 1/1/2022 | | | 56,206 | | | | 59,713 | |
Fannie Mae, Pool #899287, 5.00%, 2/1/2022 | | | 62,129 | | | | 66,253 | |
Fannie Mae, Pool #888815, 4.50%, 11/1/2022 | | | 494,919 | | | | 525,798 | |
Fannie Mae, Pool #888810, 5.50%, 11/1/2022 | | | 5,758,841 | | | | 6,258,706 | |
Fannie Mae, Pool #AA1563, 4.50%, 2/1/2024 | | | 1,122,354 | | | | 1,187,470 | |
Fannie Mae, Pool #AA4537, 4.50%, 4/1/2024 | | | 127,608 | | | | 135,012 | |
Fannie Mae, Pool #AC0495, 4.50%, 9/1/2024 | | | 713,536 | | | | 754,934 | |
Fannie Mae, Pool #AC1557, 4.50%, 9/1/2024 | | | 1,046,656 | | | | 1,107,380 | |
Fannie Mae, Pool #AC5902, 4.50%, 10/1/2024 | | | 1,290,393 | | | | 1,365,258 | |
Fannie Mae, Pool #AD0462, 5.50%, 10/1/2024 | | | 352,428 | | | | 382,173 | |
Fannie Mae, Pool #357319, 6.00%, 12/1/2032 | | | 101,800 | | | | 113,119 | |
Fannie Mae, Pool #790393, 6.50%, 9/1/2034 | | | 2,521 | | | | 2,827 | |
Fannie Mae, Pool #745147, 4.50%, 12/1/2035 | | | 387,204 | | | | 409,010 | |
Fannie Mae, Pool #745418, 5.50%, 4/1/2036 | | | 8,459,120 | | | | 9,139,248 | |
Fannie Mae, Pool #900130, 6.00%, 9/1/2036 | | | 226,168 | | | | 246,366 | |
Fannie Mae, Pool #886904, 6.50%, 9/1/2036 | | | 816,681 | | | | 905,185 | |
Fannie Mae, Pool #901895, 6.50%, 9/1/2036 | | | 56,698 | | | | 62,843 | |
Fannie Mae, Pool #899393, 6.00%, 4/1/2037 | | | 104,069 | | | | 113,168 | |
Fannie Mae, Pool #939487, 5.00%, 6/1/2037 | | | 48,306 | | | | 51,387 | |
Fannie Mae, Pool #945845, 6.00%, 8/1/2037 | | | 91,016 | | | | 98,974 | |
Fannie Mae, Pool #949709, 6.50%, 9/1/2037 | | | 1,168 | | | | 1,290 | |
Fannie Mae, Pool #946148, 6.00%, 10/1/2037 | | | 521,575 | | | | 567,178 | |
Fannie Mae, Pool #950248, 6.00%, 10/1/2037 | | | 118,661 | | | | 129,036 | |
Fannie Mae, Pool #960196, 5.00%, 11/1/2037 | | | 36,369 | | | | 38,689 | |
Fannie Mae, Pool #933521, 5.00%, 1/1/2038 | | | 518,164 | | | | 551,110 | |
Fannie Mae, Pool #929084, 5.00%, 2/1/2038 | | | 198,340 | | | | 210,994 | |
Fannie Mae, Pool #969756, 5.00%, 2/1/2038 | | | 395,299 | | | | 420,433 | |
Fannie Mae, Pool #972107, 5.00%, 2/1/2038 | | | 649,796 | | | | 691,112 | |
Fannie Mae, Pool #961950, 5.00%, 3/1/2038 | | | 7,287 | | | | 7,905 | |
Fannie Mae, Pool #973091, 5.00%, 3/1/2038 | | | 19,656 | | | | 20,905 | |
Fannie Mae, Pool #889260, 5.00%, 4/1/2038 | | | 370,270 | | | | 393,891 | |
Fannie Mae, Pool #912948, 5.00%, 5/1/2038 | | | 985,519 | | | | 1,048,390 | |
Fannie Mae, Pool #975840, 5.00%, 5/1/2038 | | | 727,723 | | | | 773,994 | |
Fannie Mae, Pool #976516, 5.00%, 5/1/2038 | | | 23,799 | | | | 25,313 | |
| | |
| 29 | | The accompanying notes are an integral part of the financial statements. |
Investment Portfolio - October 31, 2010
| | | | | | | | | | | | | | |
Pro-Blend® Conservative Term Series | | Principal Amount | | | Value
(Note 2) | |
| | |
U.S. GOVERNMENT AGENCIES (continued) | | | | | | | | |
| | |
Mortgage-Backed Securities (continued) | | | | | | | | |
Fannie Mae, Pool #984379, 6.00%, 5/1/2038 | | $ | 638,355 | | | $ | 693,570 | |
Fannie Mae, Pool #981636, 5.00%, 6/1/2038 | | | 20,661 | | | | 21,975 | |
Fannie Mae, Pool #981650, 5.00%, 6/1/2038 | | | 306,261 | | | | 325,734 | |
Fannie Mae, Pool #985554, 5.00%, 6/1/2038 | | | 61,261 | | | | 65,156 | |
Fannie Mae, Pool #982317, 6.00%, 6/1/2038 | | | 76,577 | | | | 83,201 | |
Fannie Mae, Pool #934329, 5.00%, 7/1/2038 | | | 322,458 | | | | 342,960 | |
Fannie Mae, Pool #995196, 6.00%, 7/1/2038 | | | 12,500,000 | | | | 13,616,351 | |
Fannie Mae, Pool #986458, 6.00%, 8/1/2038 | | | 306,900 | | | | 333,445 | |
Fannie Mae, Pool #987831, 6.00%, 9/1/2038 | | | 1,025,168 | | | | 1,113,841 | |
Fannie Mae, Pool #988990, 6.00%, 9/1/2038 | | | 25,463 | | | | 27,665 | |
Fannie Mae, Pool #990503, 6.00%, 9/1/2038 | | | 85,181 | | | | 92,549 | |
Fannie Mae, Pool #990897, 6.00%, 9/1/2038 | | | 1,414,444 | | | | 1,536,787 | |
Fannie Mae, Pool #986889, 6.00%, 10/1/2038 | | | 604,309 | | | | 656,579 | |
Fannie Mae, Pool #983839, 5.00%, 11/1/2038 | | | 28,511 | | | | 30,323 | |
Fannie Mae, Pool #993920, 6.00%, 11/1/2038 | | | 527,997 | | | | 573,666 | |
Fannie Mae, Pool #257497, 6.00%, 12/1/2038 | | | 396,576 | | | | 430,878 | |
Fannie Mae, Pool #AA0675, 6.00%, 12/1/2038 | | | 267,945 | | | | 291,121 | |
Fannie Mae, Pool #971022, 5.00%, 1/1/2039 | | | 790,409 | | | | 840,665 | |
Fannie Mae, Pool #992293, 5.00%, 1/1/2039 | | | 265,367 | | | | 282,239 | |
Fannie Mae, Pool #994216, 5.00%, 1/1/2039 | | | 40,693 | | | | 43,280 | |
Fannie Mae, Pool #AA1717, 5.00%, 1/1/2039 | | | 465,362 | | | | 494,951 | |
Fannie Mae, Pool #AA1810, 5.00%, 1/1/2039 | | | 723,920 | | | | 769,876 | |
Fannie Mae, Pool #988811, 6.00%, 1/1/2039 | | | 303,695 | | | | 329,963 | |
Fannie Mae, Pool #983686, 5.00%, 2/1/2039 | | | 701,847 | | | | 746,402 | |
Fannie Mae, Pool #AA1686, 5.00%, 3/1/2039 | | | 212,903 | | | | 226,419 | |
Fannie Mae, Pool #AA4461, 5.00%, 3/1/2039 | | | 42,568 | | | | 45,270 | |
Fannie Mae, Pool #AA3636, 6.00%, 3/1/2039 | | | 325,306 | | | | 353,342 | |
Fannie Mae, Pool #AA5087, 5.00%, 4/1/2039 | | | 68,930 | | | | 73,305 | |
Fannie Mae, Pool #AA6788, 6.00%, 8/1/2039 | | | 924,323 | | | | 1,003,984 | |
Fannie Mae, Pool #AC2881, 6.00%, 8/1/2039 | | | 223,673 | | | | 243,020 | |
Fannie Mae, Pool #AC1901, 5.00%, 9/1/2039 | | | 212,330 | | | | 225,809 | |
Fannie Mae, Pool #AC0463, 5.00%, 11/1/2039 | | | 499,302 | | | | 530,999 | |
Fannie Mae, Pool #AC5111, 5.00%, 11/1/2039 | | | 1,168,330 | | | | 1,242,499 | |
Fannie Mae, Pool #MA0259, 5.00%, 12/1/2039 | | | 398,416 | | | | 423,708 | |
Fannie Mae, Pool #AC8573, 5.00%, 1/1/2040 | | | 869,393 | | | | 924,584 | |
Fannie Mae, Pool #AC8791, 5.00%, 1/1/2040 | | | 36,434 | | | | 38,747 | |
Freddie Mac, Pool #B16835, 5.50%, 10/1/2019 | | | 7,839 | | | | 8,518 | |
Freddie Mac, Pool #G11850, 5.50%, 7/1/2020 | | | 1,772,312 | | | | 1,925,870 | |
Freddie Mac, Pool #G11912, 5.50%, 3/1/2021 | | | 198,415 | | | | 217,838 | |
Freddie Mac, Pool #G12610, 6.00%, 3/1/2022 | | | 565,097 | | | | 616,169 | |
Freddie Mac, Pool #G12655, 6.00%, 5/1/2022 | | | 380,912 | | | | 415,337 | |
Freddie Mac, Pool #J06512, 5.00%, 12/1/2022 | | | 92,171 | | | | 98,109 | |
Freddie Mac, Pool #G12966, 5.50%, 1/1/2023 | | | 44,724 | | | | 48,403 | |
| | | | |
| The accompanying notes are an integral part of the financial statements. | | | 30 | |
Investment Portfolio - October 31, 2010
| | | | | | | | | | | | |
Pro-Blend® Conservative Term Series | | Principal Amount | | | Value
(Note 2) | |
| |
U.S. GOVERNMENT AGENCIES (continued) | | | | | |
| |
Mortgage-Backed Securities (continued) | | | | | |
Freddie Mac, Pool #G12988, 6.00%, 1/1/2023 | | $ | 315,167 | | | $ | 343,060 | |
Freddie Mac, Pool #G13078, 6.00%, 3/1/2023 | | | 552,461 | | | | 602,391 | |
Freddie Mac, Pool #G13136, 4.50%, 5/1/2023 | | | 78,473 | | | | 83,013 | |
Freddie Mac, Pool #G13331, 5.50%, 10/1/2023 | | | 293,860 | | | | 318,035 | |
Freddie Mac, Pool #G01736, 6.50%, 9/1/2034 | | | 6,406 | | | | 7,210 | |
GNMA, Pool #365225, 9.00%, 11/15/2024 | | | 1,930 | | | | 2,287 | |
GNMA, Pool #398655, 6.50%, 5/15/2026 | | | 863 | | | | 971 | |
GNMA, Pool #452826, 9.00%, 1/15/2028 | | | 2,032 | | | | 2,431 | |
GNMA, Pool #460820, 6.00%, 6/15/2028 | | | 9,711 | | | | 10,772 | |
GNMA, Pool #458983, 6.00%, 1/15/2029 | | | 25,196 | | | | 27,951 | |
GNMA, Pool #530481, 8.00%, 8/15/2030 | | | 16,414 | | | | 19,732 | |
GNMA, Pool #577796, 6.00%, 1/15/2032 | | | 17,838 | | | | 19,788 | |
GNMA, Pool #003808, 6.00%, 1/20/2036 | | | 290,668 | | | | 319,686 | |
GNMA, Pool #651235, 6.50%, 2/15/2036 | | | 224,124 | | | | 250,974 | |
GNMA, Pool #003830, 5.50%, 3/20/2036 | | | 689,844 | | | | 748,855 | |
GNMA, Pool #671304, 5.50%, 6/15/2037 | | | 108,934 | | | | 118,295 | |
GNMA, Pool #671531, 5.50%, 9/15/2037 | | | 68,334 | | | | 74,206 | |
GNMA, Pool #671161, 5.50%, 11/15/2037 | | | 285,968 | | | | 310,541 | |
GNMA, Pool #672715, 5.50%, 5/15/2038 | | | 218,285 | | | | 236,974 | |
GNMA, Pool #782639, 5.50%, 12/15/2038 | | | 629,196 | | | | 683,084 | |
GNMA, Pool #707098, 5.50%, 1/15/2039 | | | 788,623 | | | | 856,144 | |
GNMA, Pool #703481, 5.50%, 2/15/2039 | | | 1,716,331 | | | | 1,863,283 | |
| | | | | | | | |
Total Mortgage-Backed Securities
(Identified Cost $76,902,005) | | | | | | | 78,441,029 | |
| | | | | | | | |
Other Agencies - 24.03% | | | | | | | | |
Fannie Mae, 0.50%, 10/30/2012 | | | 8,000,000 | | | | 8,010,952 | |
Fannie Mae, 3.875%, 7/12/2013 | | | 11,000,000 | | | | 11,978,934 | |
Fannie Mae, 2.375%, 7/28/2015 | | | 15,500,000 | | | | 16,239,753 | |
Fannie Mae, 5.25%, 9/15/2016 | | | 9,500,000 | | | | 11,347,256 | |
Fannie Mae, 6.25%, 5/15/2029 | | | 2,429,000 | | | | 3,137,654 | |
Fannie Mae, 7.25%, 5/15/2030 | | | 2,910,000 | | | | 4,147,157 | |
Fannie Mae, 6.625%, 11/15/2030 | | | 2,339,000 | | | | 3,129,117 | |
Federal Farm Credit Bank, 5.125%, 8/25/2016 | | | 3,640,000 | | | | 4,356,319 | |
Federal Home Loan Bank, 4.625%, 10/10/2012 | | | 1,600,000 | | | | 1,732,438 | |
Federal Home Loan Bank, 4.50%, 11/15/2012 | | | 10,000 | | | | 10,827 | |
Federal Home Loan Bank, 3.375%, 2/27/2013 | | | 10,000 | | | | 10,667 | |
Federal Home Loan Bank, 3.625%, 10/18/2013 | | | 5,500,000 | | | | 5,997,321 | |
Federal Home Loan Bank, 5.25%, 6/18/2014 | | | 4,950,000 | | | | 5,748,252 | |
Federal Home Loan Bank, 5.00%, 11/17/2017 | | | 7,985,000 | | | | 9,536,709 | |
Freddie Mac, 0.375%, 11/30/2012 | | | 15,000,000 | | | | 14,978,850 | |
Freddie Mac, 0.875%, 10/28/2013 | | | 32,000,000 | | | | 32,213,184 | |
Freddie Mac, 3.00%, 7/28/2014 | | | 3,400,000 | | | | 3,661,674 | |
| | |
| 31 | | The accompanying notes are an integral part of the financial statements. |
Investment Portfolio - October 31, 2010
| | | | | | | | |
Pro-Blend® Conservative Term Series | | Principal Amount/
Shares | | | Value
(Note 2) | |
| | |
U.S. GOVERNMENT AGENCIES (continued) | | | | | | | | |
| | |
Other Agencies (continued) | | | | | | | | |
Freddie Mac, 2.875%, 2/9/2015 | | $ | 12,110,000 | | | $ | 12,984,390 | |
Freddie Mac, 1.75%, 9/10/2015 | | | 7,445,000 | | | | 7,572,779 | |
Freddie Mac, 5.50%, 7/18/2016 | | | 2,600,000 | | | | 3,145,165 | |
Freddie Mac, 5.125%, 10/18/2016 | | | 10,495,000 | | | | 12,465,898 | |
Freddie Mac, 5.50%, 8/23/2017 | | | 7,640,000 | | | | 9,300,653 | |
Freddie Mac, 5.125%, 11/17/2017 | | | 2,255,000 | | | | 2,699,400 | |
Freddie Mac, 3.75%, 3/27/2019 | | | 10,825,000 | | | | 11,839,703 | |
Freddie Mac, 6.75%, 3/15/2031 | | | 1,693,000 | | | | 2,308,475 | |
Freddie Mac, 6.25%, 7/15/2032 | | | 2,625,000 | | | | 3,426,397 | |
| | | | | | | | |
Total Other Agencies
(Identified Cost $194,290,830) | | | | | | | 201,979,924 | |
| | | | | | | | |
TOTAL U.S. GOVERNMENT AGENCIES
(Identified Cost $271,192,835) | | | | | | | 280,420,953 | |
| | | | | | | | |
| | |
SHORT-TERM INVESTMENTS - 4.16% | | | | | | | | |
| | |
Dreyfus Cash Management, Inc. - Institutional Shares8, 0.16%, | | | 27,131,892 | | | | 27,131,892 | |
Freddie Mac Discount Notes9, 0.175%, 11/29/2010 | | $ | 7,822,000 | | | | 7,821,270 | |
| | | | | | | | |
TOTAL SHORT-TERM INVESTMENTS
(Identified Cost $34,952,827) | | | | | | | 34,953,162 | |
| | | | | | | | |
| | |
TOTAL INVESTMENTS - 98.62%
(Identified Cost $785,213,662) | | | | | | | 829,034,828 | |
OTHER ASSETS, LESS LIABILITIES - 1.38% | | | | | | | 11,560,112 | |
| | | | | | | | |
NET ASSETS - 100% | | | | | | $ | 840,594,940 | |
| | | | | | | | |
FORWARD FOREIGN CURRENCY EXCHANGE CONTRACTS OPEN AT OCTOBER 31, 201010:
| | | | | | | | | | | | | | | | |
Settlement Date | | Contracts to Deliver | | | In Exchange
For | | | Contracts
At Value | | | Unrealized
Depreciation | |
| | | | |
11/30/2010 | | EUR | 400,000 | | | $ | 552,220 | | | $ | 556,513 | | | $ | (4,293 | ) |
ADR - American Depository Receipt
EUR - Euro currency
NVDR - Non-Voting Depository Receipt
| | | | |
| The accompanying notes are an integral part of the financial statements. | | | 32 | |
Investment Portfolio - October 31, 2010
|
Pro-Blend® Conservative Term Series |
| * | Non-income producing security |
| 1 | International Fair Value factor from pricing service was applied. |
| 2 | The Bank of New York Mellon Corp. is the Series’ custodian and serves as sub-accountant and sub-transfer agent to the Series. |
| 3 | Latest quoted sales price is not available and the latest quoted bid price was used to value the security. |
| 4 | Restricted securities - Investment in securities that are restricted as to public resale under the Securities Act of 1933, as amended. These securities have been sold under rule 144A and have been determined to be liquid. These securities amount to $10,779,100, or 1.28%, of the Series’ net assets as of October 31, 2010. |
| 5 | The coupon rate is floating and is the stated rate as of October 31, 2010. |
| 6 | Security insured under the Federal Deposit Insurance Corporation Temporary Liquidity Guarantee Program. |
| 7 | Security has been valued at fair value. |
| 8 | Rate shown is the current yield as of October 31, 2010. |
| 9 | Rate shown reflects the annualized yield at time of purchase. |
| 10 | The counterparty for all forward foreign currency exchange contracts is The Bank of New York Mellon Corp. |
| | |
| 33 | | The accompanying notes are an integral part of the financial statements. |
Statement of Assets and Liabilities - Pro-Blend® Conservative Term Series
October 31, 2010
| | | | |
ASSETS: | | | | |
Investments, at value (identified cost $785,213,662) (Note 2) | | $ | 829,034,828 | |
Cash | | | 143,297 | |
Receivable for securities sold | | | 40,238,774 | |
Interest receivable | | | 5,864,989 | |
Receivable for fund shares sold | | | 3,079,768 | |
Dividends receivable | | | 96,417 | |
Foreign tax reclaims receivable | | | 60,156 | |
| | | | |
| |
TOTAL ASSETS | | | 878,518,229 | |
| | | | |
| |
LIABILITIES: | | | | |
| |
Accrued management fees (Note 3) | | | 456,771 | |
Accrued shareholder services fees (Class S) (Note 3) | | | 111,448 | |
Accrued fund accounting and administration fees (Note 3) | | | 41,182 | |
Accrued transfer agent fees (Note 3) | | | 25,597 | |
Accrued distribution and service (Rule 12b-1) fees (Class C) (Class R) (Note 3) | | | 14,097 | |
Accrued directors’ fees (Note 3) | | | 631 | |
Accrued Chief Compliance Officer service fees (Note 3) | | | 247 | |
Payable for securities purchased | | | 36,904,835 | |
Payable for fund shares repurchased | | | 259,866 | |
Unrealized depreciation on foreign forward currency contracts (Note 2) | | | 4,293 | |
Other payables and accrued expenses | | | 104,322 | |
| | | | |
| |
TOTAL LIABILITIES | | | 37,923,289 | |
| | | | |
| |
TOTAL NET ASSETS | | $ | 840,594,940 | |
| | | | |
| |
NET ASSETS CONSIST OF: | | | | |
| |
Capital stock | | $ | 654,148 | |
Additional paid-in-capital | | | 765,450,498 | |
Undistributed net investment income | | | 8,279,669 | |
Accumulated net realized gain on investments, foreign currency and translation of other assets and liabilities | | | 22,387,752 | |
Net unrealized appreciation on investments, foreign currency and translation of other assets and liabilities | | | 43,822,873 | |
| | | | |
| |
TOTAL NET ASSETS | | $ | 840,594,940 | |
| | | | |
| | | | |
| The accompanying notes are an integral part of the financial statements. | | | 34 | |
Statement of Assets and Liabilities - Pro-Blend® Conservative Term Series
October 31, 2010
| | | | |
NET ASSET VALUE, OFFERING PRICE AND REDEMPTION PRICE PER SHARE - Class S
($683,681,219/51,140,666 shares) | | $ | 13.37 | |
| | | | |
| |
NET ASSET VALUE, OFFERING PRICE AND REDEMPTION PRICE PER SHARE - Class I
($139,398,683/12,642,470 shares) | | $ | 11.03 | |
| | | | |
| |
NET ASSET VALUE, OFFERING PRICE AND REDEMPTION PRICE PER SHARE - Class C
($17,513,897/1,631,559 shares) | | $ | 10.73 | |
| | | | |
| |
NET ASSET VALUE, OFFERING PRICE AND REDEMPTION PRICE PER SHARE - Class R
($1,141/106 shares) | | $ | 10.76 | |
| | | | |
| | |
| 35 | | The accompanying notes are an integral part of the financial statements. |
Statement of Operations - Pro-Blend® Conservative Term Series
For the Year Ended October 31, 2010
| | | | |
INVESTMENT INCOME: | | | | |
| |
Interest | | $ | 16,659,543 | |
Dividends (net of foreign taxes withheld, $61,128) | | | 2,377,378 | |
| | | | |
| |
Total Investment Income | | | 19,036,921 | |
| | | | |
| |
EXPENSES: | | | | |
| |
Management fees (Note 3) | | | 3,597,994 | |
Shareholder services fees (Class S) (Note 3) | | | 959,609 | |
Fund accounting and administration fees (Note 3) | | | 161,096 | |
Transfer agent fees (Note 3) | | | 79,235 | |
Distribution and service (Rule 12b-1) fees (Class C) (Note 3) | | | 63,027 | |
Directors’ fees (Note 3) | | | 15,652 | |
Chief Compliance Officer service fees (Note 3) | | | 2,724 | |
Custodian fees | | | 64,001 | |
Miscellaneous | | | 259,510 | |
| | | | |
| |
Total Expenses | | | 5,202,848 | |
Less reduction of expenses (Note 3) | | | (758 | ) |
| | | | |
| |
Net Expenses | | | 5,202,090 | |
| | | | |
| |
NET INVESTMENT INCOME | | | 13,834,831 | |
| | | | |
| |
REALIZED AND UNREALIZED GAIN (LOSS) ON INVESTMENTS AND FOREIGN CURRENCY: | | | | |
| |
Net realized gain (loss) on- | | | | |
Investments | | | 24,668,346 | |
Foreign currency and translation of other assets and liabilities | | | (15,245 | ) |
Forward foreign currency exchange contracts | | | (4,851 | ) |
| | | | |
| |
| | | 24,648,250 | |
| | | | |
| |
Net change in unrealized appreciation (depreciation) on- | | | | |
Investments | | | 29,245,463 | |
Foreign currency and translation of other assets and liabilities | | | 4,136 | |
Forward foreign currency exchange contracts | | | (4,293 | ) |
| | | | |
| |
| | | 29,245,306 | |
| | | | |
| |
NET REALIZED AND UNREALIZED GAIN ON INVESTMENTS AND FOREIGN CURRENCY | | | 53,893,556 | |
| | | | |
| |
NET INCREASE IN NET ASSETS RESULTING FROM OPERATIONS | | $ | 67,728,387 | |
| | | | |
| | | | |
| The accompanying notes are an integral part of the financial statements. | | | 36 | |
Statements of Changes in Net Assets - Pro-Blend® Conservative Term Series
| | | | | | | | |
| | | For the
Year Ended
10/31/10 | | | For the
Year Ended
10/31/09 | |
INCREASE (DECREASE) IN NET ASSETS: | | | | | | | | |
| | |
OPERATIONS: | | | | | | | | |
| | |
Net investment income | | $ | 13,834,831 | | | $ | 4,685,975 | |
Net realized gain on investments and foreign currency | | | 24,648,250 | | | | 244,460 | |
Net change in unrealized appreciation on investments and foreign currency | | | 29,245,306 | | | | 22,248,877 | |
| | | | | | | | |
| | |
Net increase from operations | | | 67,728,387 | | | | 27,179,312 | |
| | | | | | | | |
| | |
DISTRIBUTIONS TO SHAREHOLDERS (Note 8): | | | | | | | | |
| | |
From net investment income (Class S) | | | (6,599,872 | ) | | | (2,955,314 | ) |
From net investment income (Class C) | | | (60,752 | ) | | | — | |
From net investment income (Class I) | | | (2,249,942 | ) | | | (235,623 | ) |
| | | | | | | | |
| | |
Total distributions to shareholders | | | (8,910,566 | ) | | | (3,190,937 | ) |
| | | | | | | | |
| | |
CAPITAL STOCK ISSUED AND REPURCHASED: | | | | | | | | |
| | |
Net increase from capital share transactions (Note 5) | | | 357,696,696 | | | | 260,840,800 | |
| | | | | | | | |
| | |
Net increase in net assets | | | 416,514,517 | | | | 284,829,175 | |
| | |
NET ASSETS: | | | | | | | | |
| | |
Beginning of year | | | 424,080,423 | | | | 139,251,248 | |
| | | | | | | | |
| | |
End of year (including undistributed net investment income of $8,279,669 and $3,372,561, respectively) | | $ | 840,594,940 | | | $ | 424,080,423 | |
| | | | | | | | |
| | |
| 37 | | The accompanying notes are an integral part of the financial statements. |
Financial Highlights - Pro-Blend® Conservative Term Series - Class S
| | | | | | | | | | | | | | | | | | | | |
| | | For the Years Ended | |
| | | 10/31/10 | | | 10/31/09 | | | 10/31/08 | | | 10/31/07 | | | 10/31/06 | |
Per share data (for a share outstanding throughout each year): | | | | | | | | | | | | | | | | | | | | |
Net asset value - Beginning of year | | $ | 12.21 | | | $ | 11.13 | | | $ | 12.74 | | | $ | 12.35 | | | $ | 11.90 | |
| | | | | | | | | | | | | | | | | | | | |
Income (loss) from investment operations: | | | | | | | | | | | | | | | | | | | | |
Net investment income | | | 0.29 | 1 | | | 0.23 | 1 | | | 0.24 | | | | 0.30 | | | | 0.28 | |
Net realized and unrealized gain (loss) on investments | | | 1.07 | | | | 1.07 | | | | (1.15 | ) | | | 0.65 | | | | 0.69 | |
| | | | | | | | | | | | | | | | | | | | |
Total from investment operations | | | 1.36 | | | | 1.30 | | | | (0.91 | ) | | | 0.95 | | | | 0.97 | |
| | | | | | | | | | | | | | | | | | | | |
Less distributions to shareholders: | | | | | | | | | | | | | | | | | | | | |
From net investment income | | | (0.20 | ) | | | (0.22 | ) | | | (0.27 | ) | | | (0.31 | ) | | | (0.20 | ) |
From net realized gain on investments | | | — | | | | — | | | | (0.43 | ) | | | (0.25 | ) | | | (0.32 | ) |
| | | | | | | | | | | | | | | | | | | | |
Total distributions to shareholders | | | (0.20 | ) | | | (0.22 | ) | | | (0.70 | ) | | | (0.56 | ) | | | (0.52 | ) |
| | | | | | | | | | | | | | | | | | | | |
Net asset value - End of year | | $ | 13.37 | | | $ | 12.21 | | | $ | 11.13 | | | $ | 12.74 | | | $ | 12.35 | |
| | | | | | | | | | | | | | | | | | | | |
Net assets - End of year (000’s omitted) | | $ | 683,681 | | | $ | 328,201 | | | $ | 139,174 | | | $ | 110,567 | | | $ | 71,790 | |
| | | | | | | | | | | | | | | | | | | | |
Total return2 | | | 11.26 | % | | | 11.83 | % | | | (7.52 | %) | | | 7.95 | % | | | 8.49 | % |
Ratios (to average net assets)/Supplemental Data: | | | | | | | | | | | | | | | | | | | | |
Expenses* | | | 0.90 | % | | | 0.90 | % | | | 0.92 | % | | | 0.99 | % | | | 1.00 | % |
Net investment income | | | 2.28 | % | | | 1.97 | % | | | 2.33 | % | | | 2.73 | % | | | 2.65 | % |
Series portfolio turnover | | | 42 | % | | | 47 | % | | | 45 | % | | | 49 | % | | | 48 | % |
|
* The investment advisor did not impose all or a portion of its management fees, CCO fees, fund accounting and transfer agent fees and other fees in some years and in some years paid a portion of the Series’ expenses. If these expenses had been incurred by the Class, the expense ratio (to average net assets) would have been increased by the following amount: | |
| | | 0.00 | %3 | | | 0.03 | % | | | 0.05 | % | | | N/A | | | | 0.07 | % |
| 1 | Calculated based on average shares outstanding during the year. |
| 2 | Represents aggregate total return for the year indicated, and assumes reinvestment of all distributions. Total return would have been lower had certain expenses not been waived or reimbursed during certain years. |
| | | | |
| The accompanying notes are an integral part of the financial statements. | | | 38 | |
Financial Highlights - Pro-Blend® Conservative Term Series - Class I
| | | | | | | | | | | | |
| | | For the Years Ended | | | For the Period
3/28/081 to
10/31/08 | |
| | | 10/31/10 | | | 10/31/09 | | |
Per share data (for a share outstanding throughout each period): | | | | | | | | | | | | |
Net asset value - Beginning of period | | $ | 10.11 | | | $ | 9.27 | | | $ | 10.00 | |
| | | | | | | | | | | | |
Income (loss) from investment operations: | | | | | | | | | | | | |
Net investment income | | | 0.26 | 2 | | | 0.21 | 2 | | | 0.06 | |
Net realized and unrealized gain (loss) on investments | | | 0.88 | | | | 0.87 | | | | (0.74 | ) |
| | | | | | | | | | | | |
Total from investment operations | | | 1.14 | | | | 1.08 | | | | (0.68 | ) |
| | | | | | | | | | | | |
Less distributions to shareholders: | | | | | | | | | | | | |
From net investment income | | | (0.22 | ) | | | (0.24 | ) | | | (0.05 | ) |
| | | | | | | | | | | | |
Net asset value - End of period | | $ | 11.03 | | | $ | 10.11 | | | $ | 9.27 | |
| | | | | | | | | | | | |
Net assets - End of period (000’s omitted) | | $ | 139,399 | | | $ | 95,879 | | | $ | 77 | |
| | | | | | | | | | | | |
Total return3 | | | 11.49 | % | | | 11.94 | % | | | (6.81 | %) |
Ratios (to average net assets)/Supplemental Data: | | | | | | | | | | | | |
Expenses* | | | 0.70 | % | | | 0.70 | % | | | 0.70 | %4 |
Net investment income | | | 2.48 | % | | | 2.17 | % | | | 1.81 | %4 |
Series portfolio turnover | | | 42 | % | | | 47 | % | | | 45 | % |
|
* The investment advisor did not impose all or a portion of its management fees, CCO fees, fund accounting andtransfer agent fees and other fees in some periods and in some periods paid a portion of the Series’ expenses. Ifthese expenses had been incurred by the Class, the expense ratio (to average net assets) would have beenincreased by the following amount: | |
| | | 0.00 | %5 | | | 0.03 | % | | | 0.15 | %4 |
| 1 | Commencement of operations. |
| 2 | Calculated based on average shares outstanding during the year. |
| 3 | Represents aggregate total return for the periods indicated, and assumes reinvestment of all distributions. Total return would have been lower had certain expenses not been waived during the periods. Periods less than one year are not annualized. |
| | |
| 39 | | The accompanying notes are an integral part of the financial statements. |
Financial Highlights - Pro-Blend® Conservative Term Series - Class C
| | | | |
| | | For the Period
1/4/101 to
10/31/10 | |
Per share data (for a share outstanding throughout the period): | | | | |
Net asset value - Beginning of period | | $ | 10.00 | |
| | | | |
Income from investment operations: | | | | |
Net investment income | | | 0.12 | 2 |
Net realized and unrealized gain on investments | | | 0.68 | |
| | | | |
Total from investment operations | | | 0.80 | |
| | | | |
Less distributions to shareholders: | | | | |
From net investment income | | | (0.07 | ) |
| | | | |
Net asset value - End of period | | $ | 10.73 | |
| | | | |
Net assets - End of period (000’s omitted) | | $ | 17,514 | |
| | | | |
Total return3 | | | 8.03 | % |
Ratios (to average net assets)/Supplemental Data: | | | | |
Expenses* | | | 1.70 | %4 |
Net investment income | | | 1.43 | %4 |
Series portfolio turnover | | | 42 | % |
|
* The investment advisor did not impose all or a portion of its other fees during the period and paid a portion of the Series’ expenses. If these expenses had been incurred by the Class, the expense ratio (to average net assets)would have been increased by the following amount: | |
| | | 0.00 | %4,5 |
| 1 | Commencement of operations. |
| 2 | Calculated based on average shares outstanding during the period. |
| 3 | Represents aggregate total return for the period indicated, and assumes reinvestment of all distributions. Total return would have been lower had certain expenses not been waived or reimbursed during the period. Periods less than one year are not annualized. |
| | | | |
| The accompanying notes are an integral part of the financial statements. | | | 40 | |
Financial Highlights - Pro-Blend® Conservative Term Series - Class R
| | | | |
| | | For the Period
6/30/101 to
10/31/10 | |
Per share data (for a share outstanding throughout the period): | | | | |
Net asset value - Beginning of period | | $ | 10.00 | |
| | | | |
Income from investment operations: | | | | |
Net investment income | | | 0.05 | 2 |
Net realized and unrealized gain on investments | | | 0.71 | |
| | | | |
Total from investment operations | | | 0.76 | |
| | | | |
Net asset value - End of period | | $ | 10.76 | |
| | | | |
Net assets - End of period (000’s omitted) | | $ | 1 | |
| | | | |
Total return3 | | | 7.60 | % |
Ratios (to average net assets)/Supplemental Data: | | | | |
Expenses* | | | 1.20 | %4 |
Net investment income | | | 1.51 | %4 |
Series portfolio turnover | | | 42 | % |
| 1 | Commencement of operations. |
| 2 | Calculated based on average shares outstanding during the period. |
| 3 | Represents aggregate total return for the period indicated, and assumes reinvestment of all distributions. Total return would have been lower had certain expenses not been waived or reimbursed during the period. Periods less than one year are not annualized. |
| | |
| 41 | | The accompanying notes are an integral part of the financial statements. |
Performance Update - Pro-Blend® Moderate Term Series (unaudited)
| | | | | | | | | | | | | | | | |
| | | Average Annual Total Returns
As of October 31, 2010 | |
| | | One
Year | | | Five
Year | | | Ten
Year | | | Since
Inception1 | |
Manning & Napier Fund, Inc. - Pro-Blend® Moderate Term Series - Class S2 | | | 12.81 | % | | | 5.32 | % | | | 5.76 | % | | | 7.15 | % |
Manning & Napier Fund, Inc. - Pro-Blend® Moderate Term Series - Class I2,3 | | | 13.13 | % | | | 5.60 | % | | | 6.09 | % | | | 7.50 | % |
Manning & Napier Fund, Inc. - Pro-Blend® Moderate Term Series - Class C2,3 | | | 12.03 | % | | | 4.55 | % | | | 5.04 | % | | | 6.43 | % |
Manning & Napier Fund, Inc. - Pro-Blend® Moderate Term Series - Class R2,3 | | | 12.29 | % | | | 5.02 | % | | | 5.53 | % | | | 6.95 | % |
Barclays Capital U.S. Aggregate Bond Index4,6 | | | 8.01 | % | | | 6.45 | % | | | 6.38 | % | | | 6.26 | % |
10%/30%/60% Blended Index4,5,6 | | | 12.05 | % | | | 5.53 | % | | | 4.92 | % | | | 7.06 | % |
The following graph compares the value of a $10,000 investment in the Manning & Napier Fund, Inc. - Pro-Blend® Moderate Term Series - Class S for the ten years ended October 31, 2010 to the Barclays Capital U.S. Aggregate Bond Index and a 10%/30%/60% Blended Index.
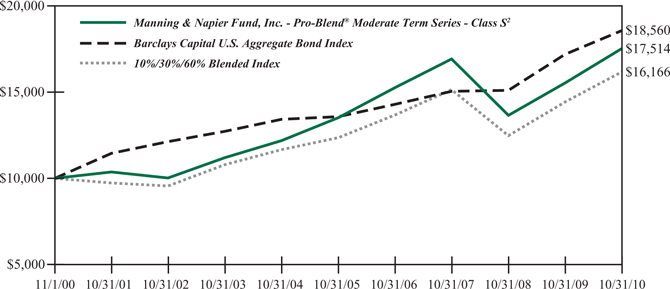
| 1 | Performance numbers for the Series are calculated from September 15, 1993, the Class S inception date. The Barclays Capital U.S. Aggregate Bond Index only publishes month-end numbers; therefore, performance numbers for the Indices are calculated from September 30, 1993. |
| 2 | The Series’ performance does not reflect the deduction of taxes that a shareholder would pay on fund distributions or the redemption of shares. The Series’ performance is historical and may not be indicative of future results. The performance returns shown are inclusive of the net expense ratio of the Series. For the year ended October 31, 2010, this net expense ratio was 1.09% for Class S, 0.84% for Class I, 1.84% for Class C and 1.34% for Class R. The gross expense ratio, which does not account for any voluntary or contractual waivers currently in effect, was 1.09% for Class S, 0.84% for Class I, 1.84% for class C and 1.34% for Class R for the year ended October 31, 2010. |
| 3 | For periods prior to the inception of Class I on March 28, 2008, Class C on January 4, 2010 and Class R on June 30, 2010, the performance figures are hypothetical and reflect the performance of the Manning & Napier Fund, Inc. - Pro-Blend® Moderate Term Series - Class S adjusted for expense differences. |
| 4 | The Barclays Capital U.S. Aggregate Bond Index is an unmanaged index that represents the U.S. domestic investment-grade bond market. It is a market value weighted index of investment-grade debt issues, including government, corporate, asset-backed and mortgage-backed securities, with maturities of one year or more. The Index returns assume reinvestment of income and, unlike Series returns, do not reflect any fees or expenses. |
| 5 | The 10%/30%/60% Blended Index is 10% Morgan Stanley Capital International (MSCI) All Country World Index ex U.S., 30% Russell 3000® Index, and 60% Barclays Capital U.S. Aggregate Bond Index. The MSCI All Country World Index ex U.S. is a free float-adjusted market capitalization weighted index that is designed to measure equity market performance in the global developed and emerging markets and consists of 47 developed and emerging market country indices outside the United States. The Index is denominated in U.S. Dollars. The Index returns assume daily reinvestment of gross dividends (which do not account for foreign dividend taxation) from the inception of the Series (see Note 1 above) through December 31, 1998, as net returns were not available. Subsequent to December 31, 1998, the Index returns assume daily reinvestment of net dividends (thus accounting for foreign dividend taxation). The Russell 3000® Index is an unmanaged index that consists of 3,000 of the largest U.S. companies based on total market capitalization. The Index returns are based on a market capitalization weighted average of relative price changes of the component stocks plus dividends whose reinvestments are compounded daily. Both Indices’ returns, unlike Series returns, do not reflect any fees or expenses. |
| 6 | Because the Series’ asset allocation will vary over time, the composition of the Series’ portfolio may not match the composition of the comparative Indices’ portfolios. |
Shareholder Expense Example - Pro-Blend® Moderate Term Series (unaudited)
As a shareholder of the Series, you may incur two types of costs: (1) transaction costs, including potential wire charges on redemptions and (2) ongoing costs, including management fees and other Series expenses. This example is intended to help you understand your ongoing costs (in dollars) of investing in the Series and to compare these costs with the ongoing costs of investing in other mutual funds.
The example is based on an investment of $1,000 invested at the beginning of the period and held for the entire period (May 1, 2010 to October 31, 2010, except for Class R Actual, which is from June 30, 2010* to October 31, 2010).
Actual Expenses
The Actual lines of the table below provide information about actual account values and actual expenses. You may use the information in these lines, together with the amount you invested, to estimate the expenses that you paid over the period. Simply divide your account value by $1,000 (for example, an $8,600 account value divided by $1,000 = 8.6), then multiply the result by the number in the Actual line for the Class in which you have invested under the heading entitled “Expenses Paid During Period” to estimate the expenses you paid on your account during this period.
Hypothetical Example for Comparison Purposes
The Hypothetical lines of the table below provide information about hypothetical account values and hypothetical expenses based on the Class’ actual expense ratio and an assumed rate of return of 5% per year before expenses, which is not the Class’ actual return. The hypothetical account values and expenses may not be used to estimate the actual ending account balance or expenses you paid during the period. You may use this information to compare the ongoing costs of investing in the Series and other funds. To do so, compare this 5% hypothetical example for the Class in which you have invested with the 5% hypothetical examples that appear in the shareholder reports of the other funds.
Please note that the expenses shown in the table are meant to highlight your ongoing costs only and do not reflect any transaction costs. Therefore, the Hypothetical lines of the table are useful in comparing ongoing costs only, and will not help you determine the relative total costs of owning different funds. In addition, if these transaction costs were included, your costs would have been higher.
| | | | | | | | | | | | | | | | |
| | | Beginning
Account Value
5/1/10* | | | Ending
Account Value
10/31/10 | | | Expenses Paid
During Period
5/1/10-10/30/10** | | | Annualized
Expense ratio | |
Class S | | | | | | | | | | | | | | | | |
Actual | | $ | 1,000.00 | | | $ | 1,042.00 | | | $ | 5.71 | | | | 1.11 | % |
Hypothetical
(5% return before expenses) | | $ | 1,000.00 | | | $ | 1,019.61 | | | $ | 5.65 | | | | 1.11 | % |
Class I | | | | | | | | | | | | | | | | |
Actual | | $ | 1,000.00 | | | $ | 1,043.80 | | | $ | 4.43 | | | | 0.86 | % |
Hypothetical
(5% return before expenses) | | $ | 1,000.00 | | | $ | 1,020.87 | | | $ | 4.38 | | | | 0.86 | % |
Class C | | | | | | | | | | | | | | | | |
Actual | | $ | 1,000.00 | | | $ | 1,037.80 | | | $ | 9.50 | | | | 1.85 | % |
Hypothetical
(5% return before expenses) | | $ | 1,000.00 | | | $ | 1,015.88 | | | $ | 9.40 | | | | 1.85 | % |
Class R | | | | | | | | | | | | | | | | |
Actual | | $ | 1,000.00 | | | $ | 1,099.00 | | | $ | 4.74 | | | | 1.34 | % |
Hypothetical
(5% return before expenses) | | $ | 1,000.00 | | | $ | 1,012.33 | | | $ | 4.54 | | | | 1.34 | % |
| * | Class R inception date was June 30, 2010. |
Shareholder Expense Example - Pro-Blend® Moderate Term Series (unaudited)
| ** | Expenses are equal to the Class’ annualized expense ratio (for the six-month period), multiplied by the average account value over the period, multiplied by 184/365 to reflect the one-half year period (except for the Series’ Class R Actual return information, which reflects the 123 day period ended October��31, 2010 due to its inception date of June 30, 2010). Expenses are based on the most recent fiscal half year; therefore, the expense ratios stated above may differ from the expense ratios stated in the financial highlights, which is based on one-year data. The Class’ total return would have been lower had certain expenses not been waived during the period. |
Portfolio Composition - Pro-Blend® Moderate Term Series (unaudited)
As of October 31, 2010
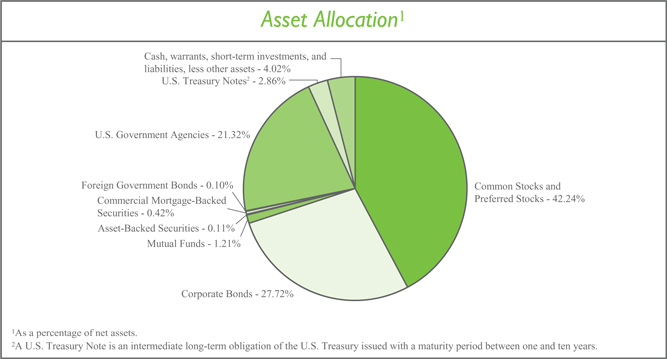
| | | | |
Sector Allocation3 | |
Financials | | | 17.39 | % |
Information Technology | | | 11.79 | % |
Industrials | | | 8.22 | % |
Consumer Discretionary | | | 7.15 | % |
Health Care | | | 6.36 | % |
Energy | | | 6.16 | % |
Consumer Staples | | | 6.07 | % |
Materials | | | 4.60 | % |
Telecommunication Services | | | 0.68 | % |
Utilities | | | 0.46 | % |
|
3 Including common stocks, preferred stocks, warrants and corporate bonds, as a percentage of total investments. | |
| | | | |
Top Ten Stock Holdings4 | |
Google, Inc. - Class A | | | 1.78 | % |
Monsanto Co. | | | 1.65 | % |
Hess Corp. | | | 1.23 | % |
Cisco Systems, Inc. | | | 1.19 | % |
Becton, Dickinson and Co. | | | 1.07 | % |
QUALCOMM, Inc. | | | 0.88 | % |
Schlumberger Ltd. | | | 0.87 | % |
Virgin Media, Inc. (United Kingdom) | | | 0.83 | % |
Baker Hughes, Inc. | | | 0.82 | % |
The Charles Schwab Corp. | | | 0.81 | % |
| 4 | As a percentage of total investments. |
Investment Portfolio - October 31, 2010
| | | | | | | | |
Pro-Blend® Moderate Term Series | | Shares | | | Value
(Note 2) | |
| | |
COMMON STOCKS - 41.94% | | | | | | | | |
| | |
Consumer Discretionary - 4.63% | | | | | | | | |
Auto Components - 0.03% | | | | | | | | |
Hankook Tire Co. Ltd. (South Korea)1 | | | 13,160 | | | $ | 342,777 | |
| | | | | | | | |
Automobiles - 0.08% | | | | | | | | |
Bayerische Motoren Werke AG (BMW) (Germany)1 | | | 5,960 | | | | 427,168 | |
Suzuki Motor Corp. (Japan)1 | | | 3,900 | | | | 95,186 | |
Yamaha Motor Co. Ltd. (Japan)*,1 | | | 16,000 | | | | 245,498 | |
| | | | | | | | |
| | | | | | | 767,852 | |
| | | | | | | | |
Distributors - 0.03% | | | | | | | | |
Inchcape plc (United Kingdom)*,1 | | | 53,446 | | | | 298,671 | |
| | | | | | | | |
Hotels, Restaurants & Leisure - 0.09% | | | | | | | | |
Accor S.A. (France)1 | | | 2,410 | | | | 98,901 | |
Choice Hotels International, Inc. | | | 8,860 | | | | 336,946 | |
Club Mediterranee S.A. (France)*,1 | | | 2,590 | | | | 50,704 | |
Hyatt Hotels Corp. - Class A* | | | 3,710 | | | | 149,513 | |
Wendy’s - Arby’s Group, Inc. - Class A | | | 57,080 | | | | 262,568 | |
| | | | | | | | |
| | | | | | | 898,632 | |
| | | | | | | | |
Household Durables - 0.16% | | | | | | | | |
Corporacion Geo S.A.B. de C.V. - Class B (Mexico)* | | | 55,360 | | | | 175,746 | |
Harman International Industries, Inc.* | | | 6,880 | | | | 230,824 | |
Lennar Corp. - Class A | | | 10,170 | | | | 147,567 | |
LG Electronics, Inc. (South Korea)1 | | | 2,400 | | | | 211,337 | |
NVR, Inc.* | | | 310 | | | | 194,497 | |
Rodobens Negocios Imobiliarios S.A. (Brazil) | | | 45,470 | | | | 470,665 | |
Tupperware Brands Corp. | | | 3,000 | | | | 134,430 | |
| | | | | | | | |
| | | | | | | 1,565,066 | |
| | | | | | | | |
Leisure Equipment & Products - 0.01% | | | | | | | | |
Sankyo Co. Ltd. (Japan)1 | | | 1,800 | | | | 95,902 | |
| | | | | | | | |
Media - 3.11% | | | | | | | | |
Gestevision Telecinco S.A. (Spain)1 | | | 39,070 | | | | 498,565 | |
Grupo Televisa S.A. - ADR (Mexico) | | | 15,190 | | | | 341,015 | |
Imax Corp. (Canada)* | | | 14,670 | | | | 317,605 | |
Liberty Global, Inc. - Class A* | | | 118,030 | | | | 4,460,354 | |
Mediacom Communications Corp. - Class A* | | | 19,200 | | | | 132,480 | |
Mediaset S.p.A. (Italy)1 | | | 12,340 | | | | 91,109 | |
Reed Elsevier plc (United Kingdom)1 | | | 24,510 | | | | 210,281 | |
Reed Elsevier plc - ADR (United Kingdom) | | | 4,434 | | | | 152,130 | |
Societe Television Francaise 1 (France)1 | | | 33,820 | | | | 554,314 | |
Time Warner, Inc. | | | 222,470 | | | | 7,232,500 | |
Virgin Media, Inc. (United Kingdom) | | | 317,660 | | | | 8,078,094 | |
The Walt Disney Co. | | | 208,920 | | | | 7,544,101 | |
| | | | |
| The accompanying notes are an integral part of the financial statements. | | | 46 | |
Investment Portfolio - October 31, 2010
| | | | | | | | |
Pro-Blend® Moderate Term Series | | Shares | | | Value
(Note 2) | |
| | |
COMMON STOCKS (continued) | | | | | | | | |
| | |
Consumer Discretionary (continued) | | | | | | | | |
Media (continued) | | | | | | | | |
Wolters Kluwer N.V. (Netherlands)1 | | | 8,395 | | | $ | 191,363 | |
| | | | | | | | |
| | | | | | | 29,803,911 | |
| | | | | | | | |
Multiline Retail - 0.07% | | | | | | | | |
Marks & Spencer Group plc (United Kingdom)1 | | | 42,270 | | | | 289,692 | |
Nordstrom, Inc. | | | 3,110 | | | | 119,766 | |
PPR (France)1 | | | 1,625 | | | | 267,270 | |
| | | | | | | | |
| | | | | | | 676,728 | |
| | | | | | | | |
Specialty Retail - 1.01% | | | | | | | | |
Chico’s FAS, Inc. | | | 12,480 | | | | 121,306 | |
Dick’s Sporting Goods, Inc.* | | | 11,070 | | | | 319,037 | |
The Finish Line, Inc. - Class A | | | 9,450 | | | | 144,585 | |
The Home Depot, Inc. | | | 170,170 | | | | 5,254,849 | |
KOMERI Co. Ltd. (Japan)1 | | | 4,800 | | | | 99,705 | |
Lumber Liquidators Holdings, Inc.* | | | 7,410 | | | | 178,433 | |
The Sherwin-Williams Co. | | | 48,470 | | | | 3,536,856 | |
| | | | | | | | |
| | | | | | | 9,654,771 | |
| | | | | | | | |
Textiles, Apparel & Luxury Goods - 0.04% | | | | | | | | |
Adidas AG (Germany)1 | | | 3,530 | | | | 229,917 | |
Skechers U.S.A., Inc. - Class A* | | | 6,880 | | | | 133,747 | |
| | | | | | | | |
| | | | | | | 363,664 | |
| | | | | | | | |
Total Consumer Discretionary | | | | | | | 44,467,974 | |
| | | | | | | | |
Consumer Staples - 5.35% | | | | | | | | |
Beverages - 0.90% | | | | | | | | |
The Coca-Cola Co. | | | 127,750 | | | | 7,833,630 | |
Diageo plc (United Kingdom)1 | | | 11,520 | | | | 212,517 | |
Heineken N.V. (Netherlands)1 | | | 8,110 | | | | 411,707 | |
Kirin Holdings Co. Ltd. (Japan)1 | | | 15,200 | | | | 208,296 | |
| | | | | | | | |
| | | | | | | 8,666,150 | |
| | | | | | | | |
Food & Staples Retailing - 1.40% | | | | | | | | |
BJ’s Wholesale Club, Inc.* | | | 4,670 | | | | 194,879 | |
Carrefour S.A. (France)1 | | | 23,260 | | | | 1,259,380 | |
Casino Guichard-Perrachon S.A. (France)1 | | | 2,420 | | | | 227,677 | |
The Kroger Co. | | | 243,300 | | | | 5,352,600 | |
Safeway, Inc. | | | 235,450 | | | | 5,391,805 | |
SUPERVALU, Inc. | | | 18,070 | | | | 194,975 | |
Tesco plc (United Kingdom)1 | | | 118,645 | | | | 811,966 | |
| | | | | | | | |
| | | | | | | 13,433,282 | |
| | | | | | | | |
| | |
| 47 | | The accompanying notes are an integral part of the financial statements. |
Investment Portfolio - October 31, 2010
| | | | | | | | |
Pro-Blend® Moderate Term Series | | Shares | | | Value
(Note 2) | |
| | |
COMMON STOCKS (continued) | | | | | | | | |
| | |
Consumer Staples (continued) | | | | | | | | |
Food Products - 2.97% | | | | | | | | |
Diamond Foods, Inc. | | | 3,290 | | | $ | 145,418 | |
Flowers Foods, Inc. | | | 12,090 | | | | 308,053 | |
General Mills, Inc. | | | 80,110 | | | | 3,007,330 | |
Kellogg Co. | | | 49,470 | | | | 2,486,362 | |
Kraft Foods, Inc. - Class A | | | 228,000 | | | | 7,357,560 | |
Nestle S.A. (Switzerland)1 | | | 131,880 | | | | 7,223,660 | |
Sanderson Farms, Inc. | | | 3,510 | | | | 147,350 | |
Suedzucker AG (Germany)1 | | | 6,710 | | | | 158,429 | |
Unilever plc - ADR (United Kingdom) | | | 263,849 | | | | 7,656,898 | |
| | | | | | | | |
| | | | | | | 28,491,060 | |
| | | | | | | | |
Household Products - 0.03% | | | | | | | | |
Reckitt Benckiser Group plc (United Kingdom)1 | | | 5,530 | | | | 308,954 | |
| | | | | | | | |
Personal Products - 0.05% | | | | | | | | |
Alberto-Culver Co. | | | 6,290 | | | | 234,554 | |
Beiersdorf AG (Germany)1 | | | 2,000 | | | | 130,301 | |
Kao Corp. (Japan)1 | | | 3,300 | | | | 83,876 | |
| | | | | | | | |
| | | | | | | 448,731 | |
| | | | | | | | |
Total Consumer Staples | | | | | | | 51,348,177 | |
| | | | | | | | |
Energy - 4.18% | | | | | | | | |
Energy Equipment & Services - 2.71% | | | | | | | | |
Baker Hughes, Inc. | | | 172,750 | | | | 8,003,508 | |
Calfrac Well Services Ltd. (Canada) | | | 18,400 | | | | 462,571 | |
Compagnie Generale de Geophysique - Veritas (CGG - Veritas) (France)*,1 | | | 15,460 | | | | 361,127 | |
Dril-Quip, Inc.* | | | 4,160 | | | | 287,456 | |
Schlumberger Ltd. | | | 120,735 | | | | 8,438,169 | |
Trican Well Service Ltd. (Canada) | | | 37,000 | | | | 641,396 | |
Weatherford International Ltd. (Switzerland)* | | | 461,440 | | | | 7,756,806 | |
| | | | | | | | |
| | | | | | | 25,951,033 | |
| | | | | | | | |
Oil, Gas & Consumable Fuels - 1.47% | | | | | | | | |
Cameco Corp. (Canada) | | | 9,110 | | | | 282,046 | |
Forest Oil Corp.* | | | 3,540 | | | | 108,784 | |
Hess Corp. | | | 190,070 | | | | 11,980,112 | |
Mariner Energy, Inc.* | | | 5,381 | | | | 134,095 | |
Paladin Energy Ltd. (Australia)* | | | 72,020 | | | | 292,345 | |
Repsol YPF S.A. (Spain)1 | | | 4,650 | | | | 128,947 | |
Royal Dutch Shell plc - Class B (Netherlands)1 | | | 6,202 | | | | 198,475 | |
Royal Dutch Shell plc - Class B - ADR (Netherlands) | | | 6,420 | | | | 412,934 | |
Talisman Energy, Inc. (Canada) | | | 21,070 | | | | 381,983 | |
| | | | |
| The accompanying notes are an integral part of the financial statements. | | | 48 | |
Investment Portfolio - October 31, 2010
| | | | | | | | |
Pro-Blend® Moderate Term Series | | Shares | | | Value
(Note 2) | |
| | |
COMMON STOCKS (continued) | | | | | | | | |
| | |
Energy (continued) | | | | | | | | |
Oil, Gas & Consumable Fuels (continued) | | | | | | | | |
Total S.A. (France)1 | | | 3,960 | | | $ | 215,560 | |
| | | | | | | | |
| | | | | | | 14,135,281 | |
| | | | | | | | |
Total Energy | | | | | | | 40,086,314 | |
| | | | | | | | |
Financials - 4.69% | | | | | | | | |
Capital Markets - 1.74% | | | | | | | | |
The Bank of New York Mellon Corp.2 | | | 273,230 | | | | 6,847,144 | |
The Charles Schwab Corp. | | | 509,880 | | | | 7,852,152 | |
Credit Suisse Group AG - ADR (Switzerland) | | | 2,140 | | | | 88,810 | |
Daiwa Securities Group, Inc. (Japan)1 | | | 7,000 | | | | 28,541 | |
Evercore Partners, Inc. - Class A | | | 4,660 | | | | 141,478 | |
Financial Engines, Inc.* | | | 8,050 | | | | 118,576 | |
GAM Holding AG (Switzerland)*,1 | | | 27,690 | | | | 437,472 | |
The Goldman Sachs Group, Inc. | | | 1,740 | | | | 280,053 | |
Greenhill & Co., Inc. | | | 1,580 | | | | 122,719 | |
Lazard Ltd. - Class A (Bermuda) | | | 3,570 | | | | 131,733 | |
Northern Trust Corp. | | | 4,850 | | | | 240,705 | |
State Street Corp. | | | 9,640 | | | | 402,566 | |
| | | | | | | | |
| | | | | | | 16,691,949 | |
| | | | | | | | |
Commercial Banks - 0.34% | | | | | | | | |
Banco Santander S.A. (Spain)1 | | | 13,010 | | | | 166,991 | |
Banco Santander S.A. - ADR (Spain) | | | 31,100 | | | | 398,391 | |
Barclays plc - ADR (United Kingdom) | | | 4,940 | | | | 87,191 | |
BNP Paribas (France)1 | | | 2,040 | | | | 149,218 | |
The Chugoku Bank Ltd. (Japan)1 | | | 9,800 | | | | 113,673 | |
Credit Agricole S.A. (France)1 | | | 4,505 | | | | 73,885 | |
First Commonwealth Financial Corp. | | | 90,920 | | | | 529,154 | |
First Financial Bancorp | | | 14,290 | | | | 240,644 | |
The Hachijuni Bank Ltd. (Japan)1 | | | 16,800 | | | | 86,212 | |
HSBC Holdings plc (United Kingdom)1 | | | 18,560 | | | | 193,167 | |
HSBC Holdings plc - ADR (United Kingdom) | | | 6,662 | | | | 347,157 | |
ICICI Bank Ltd. - ADR (India) | | | 3,620 | | | | 190,340 | |
Mitsubishi UFJ Financial Group, Inc. (Japan)1 | | | 11,200 | | | | 51,979 | |
Societe Generale - ADR (France)3 | | | 8,880 | | | | 105,938 | |
The Sumitomo Trust & Banking Co. Ltd. (Japan)1 | | | 16,800 | | | | 91,725 | |
U.S. Bancorp | | | 16,870 | | | | 407,916 | |
| | | | | | | | |
| | | | | | | 3,233,581 | |
| | | | | | | | |
Consumer Finance - 0.81% | | | | | | | | |
American Express Co. | | | 184,090 | | | | 7,632,371 | |
Discover Financial Services | | | 6,770 | | | | 119,491 | |
| | | | | | | | |
| | | | | | | 7,751,862 | |
| | | | | | | | |
| | |
| 49 | | The accompanying notes are an integral part of the financial statements. |
Investment Portfolio - October 31, 2010
| | | | | | | | |
Pro-Blend® Moderate Term Series | | Shares | | | Value
(Note 2) | |
| | |
COMMON STOCKS (continued) | | | | | | | | |
| | |
Financials (continued) | | | | | | | | |
Diversified Financial Services - 0.20% | | | | | | | | |
Bank of America Corp. | | | 5,910 | | | $ | 67,610 | |
Deutsche Boerse AG (Germany)1 | | | 8,290 | | | | 583,191 | |
Financiere Marc de Lacharriere S.A. (Fimalac) (France)1 | | | 3,453 | | | | 148,603 | |
ING Groep N.V. (Netherlands)*,1 | | | 4,775 | | | | 51,087 | |
JPMorgan Chase & Co. | | | 12,770 | | | | 480,535 | |
Moody’s Corp. | | | 23,060 | | | | 624,004 | |
| | | | | | | | |
| | | | | | | 1,955,030 | |
| | | | | | | | |
Insurance - 0.48% | | | | | | | | |
Allianz SE (Germany)1 | | | 9,280 | | | | 1,162,114 | |
The Allstate Corp. | | | 9,920 | | | | 302,461 | |
Amil Participacoes S.A. (Brazil) | | | 34,230 | | | | 348,279 | |
AXA S.A. (France)1 | | | 4,080 | | | | 74,407 | |
Brown & Brown, Inc. | | | 17,580 | | | | 391,858 | |
Mapfre S.A. (Spain)1 | | | 74,000 | | | | 245,899 | |
Muenchener Rueckversicherungs AG (MunichRe) (Germany)1 | | | 2,955 | | | | 461,869 | |
The Progressive Corp. | | | 23,010 | | | | 486,892 | |
Willis Group Holdings plc (United Kingdom) | | | 18,215 | | | | 579,237 | |
Zurich Financial Services AG (Switzerland)1 | | | 2,280 | | | | 557,956 | |
| | | | | | | | |
| | | | | | | 4,610,972 | |
| | | | | | | | |
Real Estate Investment Trusts (REITS) - 0.99% | | | | | | | | |
Acadia Realty Trust | | | 6,930 | | | | 132,224 | |
Alexandria Real Estate Equities, Inc. | | | 3,940 | | | | 289,511 | |
Alstria Office REIT AG (Germany)1 | | | 22,190 | | | | 309,151 | |
American Campus Communities, Inc. | | | 12,300 | | | | 389,049 | |
Apartment Investment & Management Co. - Class A | | | 14,110 | | | | 328,904 | |
Associated Estates Realty Corp. | | | 5,940 | | | | 82,507 | |
AvalonBay Communities, Inc. | | | 2,670 | | | | 283,848 | |
BioMed Realty Trust, Inc. | | | 25,010 | | | | 458,933 | |
Boston Properties, Inc. | | | 3,420 | | | | 294,770 | |
British Land Co. plc (United Kingdom)1 | | | 11,460 | | | | 93,564 | |
Camden Property Trust | | | 5,290 | | | | 262,331 | |
Cogdell Spencer, Inc. | | | 33,000 | | | | 216,810 | |
Corporate Office Properties Trust | | | 23,980 | | | | 851,050 | |
DiamondRock Hospitality Co.* | | | 8,050 | | | | 85,169 | |
Digital Realty Trust, Inc. | | | 4,570 | | | | 272,966 | |
Douglas Emmett, Inc. | | | 6,240 | | | | 111,946 | |
DuPont Fabros Technology, Inc. | | | 16,830 | | | | 422,433 | |
Equity Lifestyle Properties, Inc. | | | 4,180 | | | | 237,926 | |
Equity One, Inc. | | | 4,860 | | | | 90,882 | |
Equity Residential | | | 5,180 | | | | 251,903 | |
HCP, Inc. | | | 6,790 | | | | 244,508 | |
| | | | |
| The accompanying notes are an integral part of the financial statements. | | | 50 | |
Investment Portfolio - October 31, 2010
| | | | | | | | |
Pro-Blend® Moderate Term Series | | Shares | | | Value
(Note 2) | |
| | |
COMMON STOCKS (continued) | | | | | | | | |
| | |
Financials (continued) | | | | | | | | |
Real Estate Investment Trusts (REITS) (continued) | | | | | | | | |
Health Care REIT, Inc. | | | 4,480 | | | $ | 228,928 | |
Healthcare Realty Trust, Inc. | | | 10,240 | | | | 247,194 | |
Home Properties, Inc. | | | 7,390 | | | | 402,385 | |
Host Hotels & Resorts, Inc. | | | 19,394 | | | | 308,171 | |
LaSalle Hotel Properties | | | 5,520 | | | | 130,769 | |
Lexington Realty Trust | | | 12,000 | | | | 93,360 | |
Mack-Cali Realty Corp. | | | 3,590 | | | | 120,552 | |
National Health Investors, Inc. | | | 1,950 | | | | 90,285 | |
National Retail Properties, Inc. | | | 9,890 | | | | 268,019 | |
Omega Healthcare Investors, Inc. | | | 6,050 | | | | 139,150 | |
Pebblebrook Hotel Trust* | | | 13,890 | | | | 272,105 | |
Public Storage | | | 2,540 | | | | 252,019 | |
Realty Income Corp. | | | 7,880 | | | | 270,126 | |
Simon Property Group, Inc. | | | 3,238 | | | | 310,913 | |
Sovran Self Storage, Inc. | | | 3,280 | | | | 128,150 | |
Tanger Factory Outlet Centers | | | 5,340 | | | | 255,893 | |
UDR, Inc. | | | 13,650 | | | | 306,852 | |
| | | | | | | | |
| | | | | | | 9,535,256 | |
| | | | | | | | |
Real Estate Management & Development - 0.02% | | | | | | | | |
CB Richard Ellis Group, Inc. - Class A* | | | 5,000 | | | | 91,750 | |
Renhe Commercial Holdings Co. Ltd. (China)1 | | | 208,000 | | | | 39,786 | |
Thomas Properties Group, Inc.* | | | 12,800 | | | | 47,872 | |
| | | | | | | | |
| | | | | | | 179,408 | |
| | | | | | | | |
Thrifts & Mortgage Finance - 0.11% | | | | | | | | |
Aareal Bank AG (Germany)*,1 | | | 8,370 | | | | 204,346 | |
First Niagara Financial Group, Inc. | | | 42,410 | | | | 502,558 | |
Hudson City Bancorp, Inc. | | | 9,000 | | | | 104,850 | |
People’s United Financial, Inc. | | | 20,770 | | | | 255,679 | |
| | | | | | | | |
| | | | | | | 1,067,433 | |
| | | | | | | | |
Total Financials | | | | | | | 45,025,491 | |
| | | | | | | | |
Health Care - 4.87% | | | | | | | | |
Biotechnology - 0.33% | | | | | | | | |
Acorda Therapeutics, Inc.* | | | 15,520 | | | | 419,661 | |
Amgen, Inc.* | | | 12,980 | | | | 742,326 | |
Basilea Pharmaceutica AG (Switzerland)*,1 | | | 6,700 | | | | 470,007 | |
Celera Corp.* | | | 184,360 | | | | 1,050,852 | |
Cepheid, Inc.* | | | 24,070 | | | | 506,433 | |
| | | | | | | | |
| | | | | | | 3,189,279 | |
| | | | | | | | |
| | |
| 51 | | The accompanying notes are an integral part of the financial statements. |
Investment Portfolio - October 31, 2010
| | | | | | | | |
Pro-Blend® Moderate Term Series | | Shares | | | Value
(Note 2) | |
| | |
COMMON STOCKS (continued) | | | | | | | | |
| | |
Health Care (continued) | | | | | | | | |
Health Care Equipment & Supplies - 3.10% | | | | | | | | |
Abaxis, Inc.* | | | 22,140 | | | $ | 531,581 | |
Alere, Inc.* | | | 48,070 | | | | 1,420,468 | |
Becton, Dickinson and Co. | | | 138,470 | | | | 10,457,254 | |
Boston Scientific Corp.* | | | 1,201,820 | | | | 7,667,612 | |
Cochlear Ltd. (Australia)1 | | | 16,370 | | | | 1,140,353 | |
Conceptus, Inc.* | | | 36,200 | | | | 514,402 | |
Covidien plc (Ireland) | | | 21,040 | | | | 838,865 | |
DENTSPLY International, Inc. | | | 29,530 | | | | 926,947 | |
DexCom, Inc.* | | | 51,120 | | | | 702,900 | |
Gen-Probe, Inc.* | | | 23,450 | | | | 1,135,683 | |
Hologic, Inc.* | | | 27,610 | | | | 442,312 | |
Insulet Corp.* | | | 52,200 | | | | 832,590 | |
Mindray Medical International Ltd. - ADR (China) | | | 2,770 | | | | 80,275 | |
Sirona Dental Systems, Inc.* | | | 12,740 | | | | 479,661 | |
Straumann Holding AG (Switzerland)1 | | | 5,170 | | | | 1,082,341 | |
Zoll Medical Corp.* | | | 46,320 | | | | 1,506,790 | |
| | | | | | | | |
| | | | | | | 29,760,034 | |
| | | | | | | | |
Health Care Providers & Services - 0.47% | | | | | | | | |
Bio-Reference Laboratories, Inc.* | | | 24,930 | | | | 537,491 | |
Bumrungrad Hospital Public Co. Ltd. - NVDR (Thailand)1 | | | 108,540 | | | | 124,859 | |
Cross Country Healthcare, Inc.* | | | 75,450 | | | | 550,785 | |
Diagnosticos da America S.A. (Brazil) | | | 106,630 | | | | 1,295,012 | |
Odontoprev S.A. (Brazil) | | | 35,320 | | | | 519,320 | |
Sonic Healthcare Ltd. (Australia)1 | | | 140,860 | | | | 1,502,841 | |
| | | | | | | | |
| | | | | | | 4,530,308 | |
| | | | | | | | |
Health Care Technology - 0.43% | | | | | | | | |
Allscripts Healthcare Solutions, Inc.* | | | 24,640 | | | | 470,378 | |
Cerner Corp.* | | | 40,859 | | | | 3,588,646 | |
| | | | | | | | |
| | | | | | | 4,059,024 | |
| | | | | | | | |
Life Sciences Tools & Services - 0.25% | | | | | | | | |
Caliper Life Sciences, Inc.* | | | 214,397 | | | | 964,786 | |
Lonza Group AG (Switzerland)1 | | | 7,850 | | | | 687,210 | |
Sequenom, Inc.* | | | 111,770 | | | | 709,740 | |
| | | | | | | | |
| | | | | | | 2,361,736 | |
| | | | | | | | |
Pharmaceuticals - 0.29% | | | | | | | | |
AstraZeneca plc - ADR (United Kingdom) | | | 3,380 | | | | 170,555 | |
AstraZeneca plc (United Kingdom)1 | | | 1,890 | | | | 95,071 | |
Bayer AG (Germany)1 | | | 9,575 | | | | 714,175 | |
GlaxoSmithKline plc (United Kingdom)1 | | | 12,270 | | | | 239,604 | |
Sanofi-Aventis S.A. (France)1 | | | 1,960 | | | | 137,321 | |
| | | | |
| The accompanying notes are an integral part of the financial statements. | | | 52 | |
Investment Portfolio - October 31, 2010
| | | | | | | | |
Pro-Blend® Moderate Term Series | | Shares | | | Value
(Note 2) | |
| | |
COMMON STOCKS (continued) | | | | | | | | |
| | |
Health Care (continued) | | | | | | | | |
Pharmaceuticals (continued) | | | | | | | | |
Santen Pharmaceutical Co. Ltd. (Japan)1 | | | 3,900 | | | $ | 134,391 | |
Shire plc (Ireland)1 | | | 14,185 | | | | 332,883 | |
Takeda Pharmaceutical Co. Ltd. (Japan)1 | | | 2,400 | | | | 112,503 | |
UCB S.A. (Belgium)1 | | | 21,810 | | | | 846,054 | |
| | | | | | | | |
| | | | | | | 2,782,557 | |
| | | | | | | | |
Total Health Care | | | | | | | 46,682,938 | |
| | | | | | | | |
Industrials - 3.97% | | | | | | | | |
Aerospace & Defense - 0.76% | | | | | | | | |
The Boeing Co. | | | 101,490 | | | | 7,169,254 | |
Empresa Brasileira de Aeronautica S.A. (Embraer) - ADR (Brazil) | | | 6,020 | | | | 173,677 | |
| | | | | | | | |
| | | | | | | 7,342,931 | |
| | | | | | | | |
Air Freight & Logistics - 1.63% | | | | | | | | |
Atlas Air Worldwide Holdings, Inc.* | | | 4,130 | | | | 215,834 | |
FedEx Corp. | | | 82,980 | | | | 7,279,006 | |
TNT N.V. (Netherlands)1 | | | 19,380 | | | | 515,395 | |
United Parcel Service, Inc. - Class B | | | 112,725 | | | | 7,590,901 | |
| | | | | | | | |
| | | | | | | 15,601,136 | |
| | | | | | | | |
Airlines - 0.90% | | | | | | | | |
Copa Holdings S.A. - Class A (Panama) | | | 3,580 | | | | 181,613 | |
Deutsche Lufthansa AG (Germany)*,1 | | | 14,475 | | | | 309,440 | |
Ryanair Holdings plc - ADR (Ireland) | | | 13,340 | | | | 435,284 | |
Southwest Airlines Co. | | | 559,795 | | | | 7,702,779 | |
| | | | | | | | |
| | | | | | | 8,629,116 | |
| | | | | | | | |
Commercial Services & Supplies - 0.11% | | | | | | | | |
Tomra Systems ASA (Norway)1 | | | 171,650 | | | | 1,045,981 | |
| | | | | | | | |
Construction & Engineering - 0.01% | | | | | | | | |
MYR Group, Inc.* | | | 7,040 | | | | 109,754 | |
| | | | | | | | |
Electrical Equipment - 0.16% | | | | | | | | |
ABB Ltd. (Asea Brown Boveri) - ADR (Switzerland)* | | | 31,790 | | | | 657,735 | |
Alstom S.A. (France)1 | | | 8,380 | | | | 423,207 | |
Nexans S.A. (France)1 | | | 2,130 | | | | 151,926 | |
Schneider Electric S.A. (France)1 | | | 1,880 | | | | 267,114 | |
| | | | | | | | |
| | | | | | | 1,499,982 | |
| | | | | | | | |
Industrial Conglomerates - 0.13% | | | | | | | | |
Siemens AG (Germany)1 | | | 10,645 | | | | 1,214,759 | |
| | | | | | | | |
Machinery - 0.13% | | | | | | | | |
ArvinMeritor, Inc.* | | | 8,510 | | | | 141,096 | |
Astec Industries, Inc.* | | | 4,000 | | | | 117,880 | |
| | |
| 53 | | The accompanying notes are an integral part of the financial statements. |
Investment Portfolio - October 31, 2010
| | | | | | | | |
Pro-Blend® Moderate Term Series | | Shares | | | Value
(Note 2) | |
| | |
COMMON STOCKS (continued) | | | | | | | | |
| | |
Industrials (continued) | | | | | | | | |
Machinery (continued) | | | | | | | | |
FANUC Ltd. (Japan)1 | | | 1,400 | | | $ | 202,677 | |
Lindsay Corp. | | | 3,200 | | | | 184,480 | |
SmartHeat, Inc. (China)* | | | 6,120 | | | | 39,719 | |
Titan International, Inc. | | | 15,440 | | | | 234,225 | |
Wabtec Corp. | | | 4,960 | | | | 232,326 | |
Westport Innovations, Inc. (Canada)* | | | 7,160 | | | | 129,739 | |
| | | | | | | | |
| | | | | | | 1,282,142 | |
| | | | | | | | |
Professional Services - 0.01% | | | | | | | | |
Randstad Holding N.V. (Netherlands)*,1 | | | 3,110 | | | | 148,157 | |
| | | | | | | | |
Road & Rail - 0.13% | | | | | | | | |
All America Latina Logistica S.A. (Brazil) | | | 70,150 | | | | 663,419 | |
Heartland Express, Inc. | | | 15,600 | | | | 232,596 | |
RailAmerica, Inc.* | | | 28,410 | | | | 329,556 | |
| | | | | | | | |
| | | | | | | 1,225,571 | |
| | | | | | | | |
Total Industrials | | | | | | | 38,099,529 | |
| | | | | | | | |
Information Technology - 11.07% | | | | | | | | |
Communications Equipment - 2.84% | | | | | | | | |
Alcatel-Lucent - ADR (France)* | | | 247,680 | | | | 859,450 | |
Cisco Systems, Inc.* | | | 508,334 | | | | 11,605,265 | |
Infinera Corp.* | | | 84,570 | | | | 692,628 | |
Juniper Networks, Inc.* | | | 148,702 | | | | 4,816,458 | |
QUALCOMM, Inc. | | | 189,130 | | | | 8,535,437 | |
Riverbed Technology, Inc.* | | | 13,370 | | | | 769,310 | |
| | | | | | | | |
| | | | | | | 27,278,548 | |
| | | | | | | | |
Computers & Peripherals - 0.88% | | | | | | | | |
Apple, Inc.* | | | 1,080 | | | | 324,939 | |
Compellent Technologies, Inc.* | | | 27,810 | | | | 702,759 | |
EMC Corp.* | | | 346,410 | | | | 7,278,074 | |
Immersion Corp.* | | | 23,280 | | | | 143,172 | |
| | | | | | | | |
| | | | | | | 8,448,944 | |
| | | | | | | | |
Electronic Equipment, Instruments & Components - 0.40% | | | | | | | | |
Amphenol Corp. - Class A | | | 44,180 | | | | 2,214,743 | |
Cogent, Inc.* | | | 74,720 | | | | 786,054 | |
Hitachi Ltd. (Japan)1 | | | 52,000 | | | | 235,022 | |
Keyence Corp. (Japan)1 | | | 521 | | | | 129,079 | |
LoJack Corp.* | | | 86,205 | | | | 421,543 | |
| | | | | | | | |
| | | | | | | 3,786,441 | |
| | | | | | | | |
Internet Software & Services - 2.02% | | | | | | | | |
comScore, Inc.* | | | 14,250 | | | | 335,018 | |
| | | | |
| The accompanying notes are an integral part of the financial statements. | | | 54 | |
Investment Portfolio - October 31, 2010
| | | | | | | | |
Pro-Blend® Moderate Term Series | | Shares | | | Value
(Note 2) | |
| | |
COMMON STOCKS (continued) | | | | | | | | |
| | |
Information Technology (continued) | | | | | | | | |
Internet Software & Services (continued) | | | | | | | | |
Google, Inc. - Class A* | | | 28,226 | | | $ | 17,302,256 | |
NetEase.com, Inc. - ADR (China)* | | | 3,520 | | | | 147,136 | |
Tencent Holdings Ltd. (China)1 | | | 8,100 | | | | 186,198 | |
VistaPrint N.V. (Netherlands)* | | | 20,260 | | | | 852,338 | |
Vocus, Inc.* | | | 24,970 | | | | 553,085 | |
| | | | | | | | |
| | | | | | | 19,376,031 | |
| | | | | | | | |
IT Services - 3.26% | | | | | | | | |
Accenture plc - Class A (Ireland) | | | 18,620 | | | | 832,500 | |
Amadeus IT Holding S.A. - Class A (Spain)*,1 | | | 15,500 | | | | 316,272 | |
Amdocs Ltd. (Guernsey)* | | | 46,110 | | | | 1,414,655 | |
Automatic Data Processing, Inc. | | | 169,258 | | | | 7,518,440 | |
Cap Gemini S.A. (France)1 | | | 12,050 | | | | 615,134 | |
Cielo S.A. (Brazil) | | | 65,080 | | | | 560,738 | |
MasterCard, Inc. - Class A | | | 32,680 | | | | 7,845,161 | |
Redecard S.A. (Brazil) | | | 37,150 | | | | 480,461 | |
Visa, Inc. - Class A | | | 51,050 | | | | 3,990,579 | |
The Western Union Co. | | | 438,650 | | | | 7,720,240 | |
| | | | | | | | |
| | | | | | | 31,294,180 | |
| | | | | | | | |
Semiconductors & Semiconductor Equipment - 0.27% | | | | | | | | |
Advantest Corp. (Japan)1 | | | 33,100 | | | | 628,686 | |
Infineon Technologies AG (Germany)*,1 | | | 60,000 | | | | 472,031 | |
Sumco Corp. (Japan)*,1 | | | 40,400 | | | | 624,733 | |
Taiwan Semiconductor Manufacturing Co. Ltd. - ADR (Taiwan) | | | 20,106 | | | | 219,356 | |
Tokyo Electron Ltd. (Japan)1 | | | 9,860 | | | | 556,334 | |
Yingli Green Energy Holding Co. Ltd. - ADR (China)* | | | 7,260 | | | | 84,652 | |
| | | | | | | | |
| | | | | | | 2,585,792 | |
| | | | | | | | |
Software - 1.40% | | | | | | | | |
Autodesk, Inc.* | | | 199,510 | | | | 7,218,272 | |
Electronic Arts, Inc.* | | | 275,770 | | | | 4,370,954 | |
Fortinet, Inc.* | | | 19,330 | | | | 579,900 | |
Misys plc (United Kingdom)*,1 | | | 34,170 | | | | 153,850 | |
SAP AG (Germany)1 | | | 5,630 | | | | 293,318 | |
SolarWinds, Inc.* | | | 34,000 | | | | 617,100 | |
Square Enix Holdings Co. Ltd. (Japan)1 | | | 8,800 | | | | 183,791 | |
| | | | | | | | |
| | | | | | | 13,417,185 | |
| | | | | | | | |
Total Information Technology | | | | | | | 106,187,121 | |
| | | | | | | | |
Materials - 2.95% | | | | | | | | |
Chemicals - 1.82% | | | | | | | | |
Arkema S.A. (France)1 | | | 20 | | | | 1,292 | |
| | |
| 55 | | The accompanying notes are an integral part of the financial statements. |
Investment Portfolio - October 31, 2010
| | | | | | | | |
Pro-Blend® Moderate Term Series | | Shares | | | Value
(Note 2) | |
| | |
COMMON STOCKS (continued) | | | | | | | | |
| | |
Materials (continued) | | | | | | | | |
Chemicals (continued) | | | | | | | | |
BASF SE (Germany)1 | | | 4,120 | | | $ | 299,573 | |
Calgon Carbon Corp.* | | | 17,755 | | | | 266,503 | |
Johnson Matthey plc (United Kingdom)1 | | | 6,570 | | | | 201,482 | |
Monsanto Co. | | | 270,620 | | | | 16,080,240 | |
The Scotts Miracle-Gro Co. - Class A | | | 2,470 | | | | 131,898 | |
Shin-Etsu Chemical Co. Ltd. (Japan)1 | | | 9,300 | | | | 470,264 | |
| | | | | | | | |
| | | | | | | 17,451,252 | |
| | | | | | | | |
Construction Materials - 0.78% | | | | | | | | |
CRH plc (Ireland)1 | | | 20,860 | | | | 359,957 | |
Eagle Materials, Inc | | | 6,710 | | | | 157,417 | |
Martin Marietta Materials, Inc. | | | 45,550 | | | | 3,665,864 | |
Vulcan Materials Co. | | | 90,030 | | | | 3,286,995 | |
| | | | | | | | |
| | | | | | | 7,470,233 | |
| | | | | | | | |
Containers & Packaging - 0.35% | | | | | | | | |
Owens-Illinois, Inc.* | | | 119,610 | | | | 3,352,668 | |
| | | | | | | | |
Paper & Forest Products - 0.00%** | | | | | | | | |
Norbord, Inc. (Canada)* | | | 3,490 | | | | 39,831 | |
| | | | | | | | |
Total Materials | | | | | | | 28,313,984 | |
| | | | | | | | |
Telecommunication Services - 0.11% | | | | | | | | |
Diversified Telecommunication Services - 0.06% | | | | | | | | |
France Telecom S.A. (France)1 | | | 11,410 | | | | 273,763 | |
Swisscom AG - ADR (Switzerland)3 | | | 7,815 | | | | 325,339 | |
| | | | | | | | |
| | | | | | | 599,102 | |
| | | | | | | | |
Wireless Telecommunication Services - 0.05% | | | | | | | | |
SK Telecom Co. Ltd. - ADR (South Korea) | | | 25,050 | | | | 461,671 | |
| | | | | | | | |
Total Telecommunication Services | | | | | | | 1,060,773 | |
| | | | | | | | |
Utilities - 0.12% | | | | | | | | |
Electric Utilities - 0.05% | | | | | | | | |
E.ON AG (Germany)1 | | | 11,980 | | | | 374,980 | |
Prime Infrastructure Group (Australia)1 | | | 20,380 | | | | 99,532 | |
| | | | | | | | |
| | | | | | | 474,512 | |
| | | | | | | | |
Independent Power Producers & Energy Traders - 0.02% | | | | | | | | |
Mirant Corp.* | | | 7,590 | | | | 80,530 | |
RRI Energy, Inc.* | | | 23,170 | | | | 87,119 | |
| | | | | | | | |
| | | | | | | 167,649 | |
| | | | | | | | |
Multi-Utilities - 0.03% | | | | | | | | |
GDF Suez (France)1 | | | 3,795 | | | | 151,638 | |
| | | | |
| The accompanying notes are an integral part of the financial statements. | | | 56 | |
Investment Portfolio - October 31, 2010
| | | | | | | | |
Pro-Blend® Moderate Term Series | | Shares/
Principal Amount | | | Value
(Note 2) | |
| | |
COMMON STOCKS (continued) | | | | | | | | |
| | |
Utilities (continued) | | | | | | | | |
Multi-Utilities (continued) | | | | | | | | |
National Grid plc (United Kingdom)1 | | | 20,900 | | | $ | 197,641 | |
| | | | | | | | |
| | | | | | | 349,279 | |
| | | | | | | | |
Water Utilities - 0.02% | | | | | | | | |
Cia de Saneamento de Minas Gerais - Copasa MG (Brazil) | | | 13,330 | | | | 204,383 | |
| | | | | | | | |
Total Utilities | | | | | | | 1,195,823 | |
| | | | | | | | |
TOTAL COMMON STOCKS
(Identified Cost $370,631,798) | | | | | | | 402,468,124 | |
| | | | | | | | |
| | |
PREFERRED STOCKS - 0.30% | | | | | | | | |
| | |
Consumer Staples - 0.02% | | | | | | | | |
Household Products - 0.02% | | | | | | | | |
Henkel AG & Co. KGaA (Germany)1 | | | 3,390 | | | | 199,959 | |
| | | | | | | | |
Financials - 0.28% | | | | | | | | |
Commercial Banks - 0.11% | | | | | | | | |
PNC Financial Services Group, Inc., Series K | | | 350,000 | | | | 367,073 | |
Wells Fargo & Co., Series K | | | 610,000 | | | | 640,500 | |
| | | | | | | | |
| | | | | | | 1,007,573 | |
| | | | | | | | |
Diversified Financial Services - 0.17% | | | | | | | | |
Bank of America Corp., Series K | | | 650,000 | | | | 655,960 | |
JPMorgan Chase & Co., Series 1 | | | 910,000 | | | | 970,069 | |
| | | | | | | | |
| | | | | | | 1,626,029 | |
| | | | | | | | |
Total Financials | | | | | | | 2,633,602 | |
| | | | | | | | |
TOTAL PREFERRED STOCKS
(Identified Cost $2,579,072) | | | | | | | 2,833,561 | |
| | | | | | | | |
| | |
WARRANTS - 0.00%** | | | | | | | | |
| | |
Health Care - 0.00%** | | | | | | | | |
Life Sciences Tools & Services - 0.00%** | | | | | | | | |
Caliper Life Sciences, Inc., 8/10/2011*
(Identified Cost $5,086) | | | 10,455 | | | | 366 | |
| | | | | | | | |
| | |
CORPORATE BONDS - 27.72% | | | | | | | | |
| | |
Convertible Corporate Bonds - 0.08% | | | | | | | | |
Health Care - 0.05% | | | | | | | | |
Biotechnology - 0.04% | | | | | | | | |
Amgen, Inc., 0.375%, 2/1/2013 | | $ | 400,000 | | | | 401,000 | |
| | | | | | | | |
| | |
| 57 | | The accompanying notes are an integral part of the financial statements. |
Investment Portfolio - October 31, 2010
| | | | | | | | |
Pro-Blend® Moderate Term Series | | Principal Amount | | | Value
(Note 2) | |
| | |
CORPORATE BONDS (continued) | | | | | | | | |
| | |
Convertible Corporate Bonds (continued) | | | | | | | | |
Health Care (continued) | | | | | | | | |
Health Care Equipment & Supplies - 0.01% | | | | | | | | |
Medtronic, Inc., 1.625%, 4/15/2013 | | $ | 90,000 | | | $ | 90,562 | |
| | | | | | | | |
Total Health Care | | | | | | | 491,562 | |
| | | | | | | | |
Information Technology - 0.03% | | | | | | | | |
Computers & Peripherals - 0.03% | | | | | | | | |
EMC Corp., 1.75%, 12/1/2013 | | | 215,000 | | | | 306,644 | |
| | | | | | | | |
Total Convertible Corporate Bonds
(Identified Cost $746,527) | | | | | | | 798,206 | |
| | | | | | | | |
Non-Convertible Corporate Bonds - 27.64% | | | | | | | | |
Consumer Discretionary - 2.63% | | | | | | | | |
Hotels, Restaurants & Leisure - 0.55% | | | | | | | | |
Cedar Fair LP - Canada’s Wonderland Co. - Magnum Management Corp.4,
9.125%, 8/1/2018 | | | 245,000 | | | | 263,375 | |
International Game Technology, 7.50%, 6/15/2019 | | | 1,715,000 | | | | 2,015,993 | |
McDonald’s Corp., 5.80%, 10/15/2017 | | | 325,000 | | | | 388,320 | |
McDonald’s Corp., 6.30%, 10/15/2037 | | | 445,000 | | | | 531,605 | |
Scientific Games International, Inc.4, 7.875%, 6/15/2016 | | | 250,000 | | | | 257,500 | |
Wendy’s - Arby’s Restaurants LLC, 10.00%, 7/15/2016 | | | 590,000 | | | | 646,050 | |
Wyndham Worldwide Corp., 9.875%, 5/1/2014 | | | 230,000 | | | | 271,813 | |
Wyndham Worldwide Corp., 6.00%, 12/1/2016 | | | 805,000 | | | | 859,643 | |
| | | | | | | | |
| | | | | | | 5,234,299 | |
| | | | | | | | |
| | |
Household Durables - 0.14% | | | | | | | | |
Fortune Brands, Inc., 5.375%, 1/15/2016 | | | 1,295,000 | | | | 1,385,242 | |
| | | | | | | | |
Media - 1.40% | | | | | | | | |
Cablevision Systems Corp., 8.625%, 9/15/2017 | | | 1,040,000 | | | | 1,173,900 | |
Columbus International, Inc. (Barbados)4, 11.50%, 11/20/2014 | | | 210,000 | | | | 235,463 | |
Comcast Corp., 6.50%, 11/15/2035 | | | 1,310,000 | | | | 1,434,506 | |
Comcast Corp., 6.95%, 8/15/2037 | | | 950,000 | | | | 1,105,145 | |
DIRECTV Holdings LLC, 5.20%, 3/15/2020 | | | 1,360,000 | | | | 1,477,084 | |
Discovery Communications LLC, 5.05%, 6/1/2020 | | | 1,380,000 | | | | 1,519,697 | |
Interactive Data Corp.4, 10.25%, 8/1/2018 | | | 360,000 | | | | 393,750 | |
MDC Partners, Inc. (Canada)4, 11.00%, 11/1/2016 | | | 95,000 | | | | 105,450 | |
Sirius XM Radio, Inc.4, 9.75%, 9/1/2015 | | | 555,000 | | | | 622,294 | |
Time Warner, Inc., 7.625%, 4/15/2031 | | | 1,185,000 | | | | 1,442,480 | |
Unitymedia Hessen GmbH & Co. KG - Unitymedia NRW GmbH (Germany)4,
8.125%, 12/1/2017 | | | 260,000 | | | | 272,350 | |
Unitymedia Hessen GmbH & Co. KG - Unitymedia NRW GmbH (Germany)4,
8.125%, 12/1/2017 | | | 140,000 | | | | 203,622 | |
UPC Holding B.V. (Netherlands)4, 9.875%, 4/15/2018 | | | 720,000 | | | | 786,600 | |
Virgin Media Finance plc (United Kingdom), 8.375%, 10/15/2019 | | | 115,000 | | | | 128,225 | |
| | | | |
| The accompanying notes are an integral part of the financial statements. | | | 58 | |
Investment Portfolio - October 31, 2010
| | | | | | | | |
Pro-Blend® Moderate Term Series | | Principal Amount | | | Value
(Note 2) | |
| | |
CORPORATE BONDS (continued) | | | | | | | | |
| | |
Non-Convertible Corporate Bonds (continued) | | | | | | | | |
Consumer Discretionary (continued) | | | | | | | | |
Media (continued) | | | | | | | | |
Virgin Media Finance plc, Series 1 (United Kingdom), 9.50%, 8/15/2016 | | $ | 350,000 | | | $ | 397,688 | |
The Walt Disney Co., Series B, 7.00%, 3/1/2032 | | | 615,000 | | | | 777,331 | |
WMG Acquisition Corp., 9.50%, 6/15/2016 | | | 980,000 | | | | 1,055,950 | |
XM Satellite Radio, Inc.4, 7.625%, 11/1/2018 | | | 300,000 | | | | 308,250 | |
| | | | | | | | |
| | | | | | | 13,439,785 | |
| | | | | | | | |
Multiline Retail - 0.10% | | | | | | | | |
Target Corp., 6.00%, 1/15/2018 | | | 790,000 | | | | 953,813 | |
| | | | | | | | |
Specialty Retail - 0.36% | | | | | | | | |
The Home Depot, Inc., 5.40%, 3/1/2016 | | | 1,245,000 | | | | 1,428,107 | |
Lowe’s Companies, Inc., 6.10%, 9/15/2017 | | | 620,000 | | | | 750,667 | |
Rent-A-Center, Inc.4, 6.625%, 11/15/2020 | | | 630,000 | | | | 636,300 | |
Toys R Us Property Co. LLC4, 8.50%, 12/1/2017 | | | 595,000 | | | | 644,087 | |
| | | | | | | | |
| | | | | | | 3,459,161 | |
| | | | | | | | |
Textiles, Apparel & Luxury Goods - 0.08% | | | | | | | | |
VF Corp., 5.95%, 11/1/2017 | | | 640,000 | | | | 747,071 | |
| | | | | | | | |
Total Consumer Discretionary | | | | | | | 25,219,371 | |
| | | | | | | | |
Consumer Staples - 0.79% | | | | | | | | |
Beverages - 0.40% | | | | | | | | |
CEDC Finance Corp. International, Inc.4, 9.125%, 12/1/2016 | | | 605,000 | | | | 653,400 | |
The Coca-Cola Co., 5.35%, 11/15/2017 | | | 330,000 | | | | 387,473 | |
Constellation Brands, Inc., 8.375%, 12/15/2014 | | | 610,000 | | | | 687,012 | |
Constellation Brands, Inc., 7.25%, 9/1/2016 | | | 500,000 | | | | 550,000 | |
PepsiCo, Inc., 5.00%, 6/1/2018 | | | 315,000 | | | | 358,654 | |
PepsiCo, Inc., 7.90%, 11/1/2018 | | | 870,000 | | | | 1,166,502 | |
| | | | | | | | |
| | | | | | | 3,803,041 | |
| | | | | | | | |
Food & Staples Retailing - 0.06% | | | | | | | | |
Ingles Markets, Inc., 8.875%, 5/15/2017 | | | 215,000 | | | | 237,575 | |
The Kroger Co., 6.75%, 4/15/2012 | | | 315,000 | | | | 340,257 | |
| | | | | | | | |
| | | | | | | 577,832 | |
| | | | | | | | |
Food Products - 0.22% | | | | | | | | |
General Mills, Inc., 5.65%, 2/15/2019 | | | 860,000 | | | | 1,004,029 | |
Kraft Foods, Inc., 6.125%, 2/1/2018 | | | 950,000 | | | | 1,119,118 | |
| | | | | | | | |
| | | | | | | 2,123,147 | |
| | | | | | | | |
Personal Products - 0.11% | | | | | | | | |
Revlon Consumer Products Corp., 9.75%, 11/15/2015 | | | 1,035,000 | | | | 1,078,988 | |
| | | | | | | | |
Total Consumer Staples | | | | | | | 7,583,008 | |
| | | | | | | | |
| | |
| 59 | | The accompanying notes are an integral part of the financial statements. |
Investment Portfolio - October 31, 2010
| | | | | | | | |
Pro-Blend® Moderate Term Series | | Principal Amount | | | Value
(Note 2) | |
| | |
CORPORATE BONDS (continued) | | | | | | | | |
| | |
Non-Convertible Corporate Bonds (continued) | | | | | | | | |
Energy - 2.08% | | | | | | | | |
Energy Equipment & Services - 0.94% | | | | | | | | |
Baker Hughes, Inc., 7.50%, 11/15/2018 | | $ | 740,000 | | | $ | 957,137 | |
Cie Generale de Geophysique - Veritas (France), 7.75%, 5/15/2017 | | | 665,000 | | | | 696,588 | |
Complete Production Services, Inc., 8.00%, 12/15/2016 | | | 430,000 | | | | 452,575 | |
Hornbeck Offshore Services, Inc., Series B, 6.125%, 12/1/2014 | | | 490,000 | | | | 490,000 | |
Key Energy Services, Inc., 8.375%, 12/1/2014 | | | 410,000 | | | | 439,212 | |
Thermon Industries, Inc.4, 9.50%, 5/1/2017 | | | 465,000 | | | | 491,737 | |
Weatherford International Ltd. (Switzerland), 9.625%, 3/1/2019 | | | 4,175,000 | | | | 5,513,543 | |
| | | | | | | | |
| | | | | | | 9,040,792 | |
| | | | | | | | |
Oil, Gas & Consumable Fuels - 1.14% | | | | | | | | |
Anadarko Petroleum Corp., 5.95%, 9/15/2016 | | | 1,695,000 | | | | 1,853,737 | |
Anadarko Petroleum Corp., 8.70%, 3/15/2019 | | | 425,000 | | | | 526,142 | |
Apache Corp., 6.90%, 9/15/2018 | | | 625,000 | | | | 785,758 | |
Aquilex Holdings LLC - Aquilex Finance Corp., 11.125%, 12/15/2016 | | | 190,000 | | | | 180,975 | |
Arch Coal, Inc., 8.75%, 8/1/2016 | | | 125,000 | | | | 140,312 | |
Arch Western Finance LLC, 6.75%, 7/1/2013 | | | 303,000 | | | | 306,030 | |
Chaparral Energy, Inc., 8.875%, 2/1/2017 | | | 560,000 | | | | 560,000 | |
Chesapeake Energy Corp., 9.50%, 2/15/2015 | | | 475,000 | | | | 551,000 | |
Coffeyville Resources LLC - Coffeyville Finance, Inc.4, 9.00%, 4/1/2015 | | | 230,000 | | | | 246,675 | |
Coffeyville Resources LLC - Coffeyville Finance, Inc.4, 10.875%, 4/1/2017 | | | 215,000 | | | | 228,975 | |
Crosstex Energy LP - Crosstex Energy Finance Corp., 8.875%, 2/15/2018 | | | 830,000 | | | | 896,400 | |
Hess Corp., 5.60%, 2/15/2041 | | | 345,000 | | | | 352,079 | |
Linn Energy LLC - Linn Energy Finance Corp.4, 7.75%, 2/1/2021 | | | 560,000 | | | | 578,200 | |
MarkWest Energy Partners LP - MarkWest Energy Finance Corp., 6.75%,
11/1/2020 | | | 605,000 | | | | 618,612 | |
Martin Midstream Partners LP - Martin Midstream Finance Corp.4, 8.875%,
4/1/2018 | | | 460,000 | | | | 478,400 | |
Niska Gas Storage US LLC - Niska Gas Storage Canada ULC4, 8.875%,
3/15/2018 | | | 320,000 | | | | 349,600 | |
Plains Exploration & Production Co., 8.625%, 10/15/2019 | | | 850,000 | | | | 943,500 | |
Targa Resources Partners LP - Targa Resources Partners Finance Corp.,
8.25%, 7/1/2016 | | | 465,000 | | | | 492,900 | |
Tesoro Corp., 9.75%, 6/1/2019 | | | 655,000 | | | | 727,050 | |
Whiting Petroleum Corp., 7.00%, 2/1/2014 | | | 85,000 | | | | 90,419 | |
| | | | | | | | |
| | | | | | | 10,906,764 | |
| | | | | | | | |
Total Energy | | | | | | | 19,947,556 | |
| | | | | | | | |
Financials - 12.69% | | | | | | | | |
Capital Markets - 2.91% | | | | | | | | |
The Charles Schwab Corp., 4.45%, 7/22/2020 | | | 4,740,000 | | | | 4,929,501 | |
Goldman Sachs Capital I, 6.345%, 2/15/2034 | | | 795,000 | | | | 760,055 | |
| | | | |
| The accompanying notes are an integral part of the financial statements. | | | 60 | |
Investment Portfolio - October 31, 2010
| | | | | | | | |
Pro-Blend® Moderate Term Series | | Principal Amount | | | Value
(Note 2) | |
| | |
CORPORATE BONDS (continued) | | | | | | | | |
| | |
Non-Convertible Corporate Bonds (continued) | | | | | | | | |
Financials (continued) | | | | | | | | |
Capital Markets (continued) | | | | | | | | |
Goldman Sachs Capital II5, 5.793%, 12/29/2049 | | $ | 1,215,000 | | | $ | 1,043,381 | |
The Goldman Sachs Group, Inc.6, 3.25%, 6/15/2012 | | | 8,228,000 | | | | 8,607,113 | |
The Goldman Sachs Group, Inc., 6.15%, 4/1/2018 | | | 890,000 | | | | 996,578 | |
The Goldman Sachs Group, Inc., 5.375%, 3/15/2020 | | | 4,285,000 | | | | 4,533,847 | |
Merrill Lynch & Co., Inc., 6.875%, 4/25/2018 | | | 1,250,000 | | | | 1,402,943 | |
Merrill Lynch & Co., Inc., 6.11%, 1/29/2037 | | | 515,000 | | | | 490,269 | |
Morgan Stanley, 5.55%, 4/27/2017 | | | 687,000 | | | | 731,278 | |
Morgan Stanley, 5.50%, 1/26/2020 | | | 4,255,000 | | | | 4,428,974 | |
| | | | | | | | |
| | | | | | | 27,923,939 | |
| | | | | | | | |
| | |
Commercial Banks - 2.19% | | | | | | | | |
Household Finance Co., 6.375%, 11/27/2012 | | | 1,250,000 | | | | 1,366,099 | |
HSBC Finance Corp., 7.00%, 5/15/2012 | | | 575,000 | | | | 621,131 | |
KeyBank National Association6, 3.20%, 6/15/2012 | | | 3,506,000 | | | | 3,664,720 | |
KeyBank National Association, 5.45%, 3/3/2016 | | | 1,340,000 | | | | 1,460,000 | |
Manufacturers & Traders Trust Co., 6.625%, 12/4/2017 | | | 1,900,000 | | | | 2,222,742 | |
National City Corp., 6.875%, 5/15/2019 | | | 820,000 | | | | 955,352 | |
PNC Bank National Association, 5.25%, 1/15/2017 | | | 545,000 | | | | 591,536 | |
PNC Funding Corp.6, 2.30%, 6/22/2012 | | | 3,600,000 | | | | 3,708,389 | |
U.S. Bank National Association, 6.375%, 8/1/2011 | | | 315,000 | | | | 328,723 | |
U.S. Bank National Association, 6.30%, 2/4/2014 | | | 285,000 | | | | 326,930 | |
USB Capital XIII Trust, 6.625%, 12/15/2039 | | | 535,000 | | | | 544,346 | |
Wachovia Corp., 5.25%, 8/1/2014 | | | 1,300,000 | | | | 1,411,666 | |
Wells Fargo & Co.6, 3.00%, 12/9/2011 | | | 3,458,000 | | | | 3,560,426 | |
Wilmington Trust Corp., 8.50%, 4/2/2018 | | | 280,000 | | | | 286,426 | |
| | | | | | | | |
| | | | | | | 21,048,486 | |
| | | | | | | | |
| | |
Consumer Finance - 0.93% | | | | | | | | |
American Express Co., 8.125%, 5/20/2019 | | | 5,465,000 | | | | 7,020,164 | |
American Express Co.5, 6.80%, 9/1/2066 | | | 950,000 | | | | 953,563 | |
Credit Acceptance Corp.4, 9.125%, 2/1/2017 | | | 860,000 | | | | 903,000 | |
| | | | | | | | |
| | | | | | | 8,876,727 | |
| | | | | | | | |
| | |
Diversified Financial Services - 4.05% | | | | | | | | |
Bank of America Corp.6, 3.125%, 6/15/2012 | | | 6,028,000 | | | | 6,292,617 | |
Bank of America Corp., 5.75%, 8/15/2016 | | | 980,000 | | | | 1,042,717 | |
Bank of America Corp., 7.625%, 6/1/2019 | | | 4,455,000 | | | | 5,215,286 | |
Citigroup Funding, Inc.6, 1.875%, 10/22/2012 | | | 11,088,000 | | | | 11,389,172 | |
Citigroup, Inc.6, 2.875%, 12/9/2011 | | | 3,506,000 | | | | 3,603,467 | |
Citigroup, Inc., 8.50%, 5/22/2019 | | | 4,520,000 | | | | 5,675,660 | |
JPMorgan Chase & Co., 6.30%, 4/23/2019 | | | 1,130,000 | | | | 1,318,729 | |
| | |
| 61 | | The accompanying notes are an integral part of the financial statements. |
Investment Portfolio - October 31, 2010
| | | | | | | | |
Pro-Blend® Moderate Term Series | | Principal Amount | | | Value
(Note 2) | |
| | |
CORPORATE BONDS (continued) | | | | | | | | |
| | |
Non-Convertible Corporate Bonds (continued) | | | | | | | | |
Financials (continued) | | | | | | | | |
Diversified Financial Services (continued) | | | | | | | | |
JPMorgan Chase & Co., 4.95%, 3/25/2020 | | $ | 4,040,000 | | | $ | 4,284,626 | |
| | | | | | | | |
| | | | | | | 38,822,274 | |
| | | | | | | | |
| | |
Insurance - 0.20% | | | | | | | | |
American International Group, Inc., 4.25%, 5/15/2013 | | | 485,000 | | | | 506,825 | |
Fidelity National Financial, Inc., 6.60%, 5/15/2017 | | | 525,000 | | | | 541,442 | |
Hartford Financial Services Group, Inc.5, 8.125%, 6/15/2038 | | | 820,000 | | | | 871,250 | |
| | | | | | | | |
| | | | | | | 1,919,517 | |
| | | | | | | | |
| | |
Real Estate Investment Trusts (REITS) - 2.36% | | | | | | | | |
AvalonBay Communities, Inc., 6.10%, 3/15/2020 | | | 1,265,000 | | | | 1,480,182 | |
Boston Properties LP, 5.875%, 10/15/2019 | | | 1,285,000 | | | | 1,449,674 | |
Camden Property Trust, 5.70%, 5/15/2017 | | | 705,000 | | | | 779,613 | |
Digital Realty Trust LP4, 5.875%, 2/1/2020 | | | 4,750,000 | | | | 5,049,948 | |
DuPont Fabros Technology LP, 8.50%, 12/15/2017 | | | 790,000 | | | | 855,175 | |
Felcor Lodging LP, 10.00%, 10/1/2014 | | | 650,000 | | | | 731,250 | |
HCP, Inc., 6.70%, 1/30/2018 | | | 3,675,000 | | | | 4,077,607 | |
Health Care REIT, Inc., 6.20%, 6/1/2016 | | | 3,640,000 | | | | 4,161,721 | |
Host Hotels & Resorts LP, 6.875%, 11/1/2014 | | | 325,000 | | | | 335,359 | |
Host Hotels & Resorts LP, 6.375%, 3/15/2015 | | | 150,000 | | | | 153,750 | |
Mack-Cali Realty LP, 7.75%, 8/15/2019 | | | 770,000 | | | | 927,474 | |
National Retail Properties, Inc., 6.875%, 10/15/2017 | | | 650,000 | | | | 732,379 | |
Omega Healthcare Investors, Inc.4, 7.50%, 2/15/2020 | | | 425,000 | | | | 457,938 | |
Simon Property Group LP, 10.35%, 4/1/2019 | | | 1,060,000 | | | | 1,498,407 | |
| | | | | | | | |
| | | | | | | 22,690,477 | |
| | | | | | | | |
| | |
Real Estate Management & Development - 0.05% | | | | | | | | |
CB Richard Ellis Services, Inc.4, 6.625%, 10/15/2020 | | | 500,000 | | | | 507,500 | |
| | | | | | | | |
Total Financials | | | | | | | 121,788,920 | |
| | | | | | | | |
Health Care - 1.55% | | | | | | | | |
Biotechnology - 0.50% | | | | | | | | |
Amgen, Inc., 3.45%, 10/1/2020 | | | 4,750,000 | | | | 4,765,670 | |
| | | | | | | | |
Health Care Equipment & Supplies - 0.36% | | | | | | | | |
Alere, Inc., 7.875%, 2/1/2016 | | | 560,000 | | | | 586,600 | |
Alere, Inc., 9.00%, 5/15/2016 | | | 745,000 | | | | 795,288 | |
Becton Dickinson and Co., 6.00%, 5/15/2039 | | | 880,000 | | | | 1,017,416 | |
Fresenius Medical Care Capital Trust IV, 7.875%, 6/15/2011 | | | 165,000 | | | | 169,537 | |
Fresenius US Finance II, Inc.4, 9.00%, 7/15/2015 | | | 740,000 | | | | 863,950 | |
| | | | | | | | |
| | | | | | | 3,432,791 | |
| | | | | | | | |
| | |
Health Care Providers & Services - 0.27% | | | | | | | | |
BioScrip, Inc., 10.25%, 10/1/2015 | | | 425,000 | | | | 449,438 | |
| | | | |
| The accompanying notes are an integral part of the financial statements. | | | 62 | |
Investment Portfolio - October 31, 2010
| | | | | | | | |
Pro-Blend® Moderate Term Series | | Principal Amount | | | Value
(Note 2) | |
| | |
CORPORATE BONDS (continued) | | | | | | | | |
| | |
Non-Convertible Corporate Bonds (continued) | | | | | | | | |
Health Care (continued) | | | | | | | | |
Health Care Providers & Services (continued) | | | | | | | | |
HCA, Inc., 7.875%, 2/15/2020 | | $ | 765,000 | | | $ | 847,237 | |
Health Management Associates, Inc., 6.125%, 4/15/2016 | | | 690,000 | | | | 710,700 | |
LifePoint Hospitals, Inc.4, 6.625%, 10/1/2020 | | | 560,000 | | | | 589,400 | |
| | | | | | | | |
| | | | | | | 2,596,775 | |
| | | | | | | | |
Life Sciences Tools & Services - 0.05% | | | | | | | | |
PharmaNet Development Group, Inc.4, 10.875%, 4/15/2017 | | | 455,000 | | | | 473,200 | |
| | | | | | | | |
Pharmaceuticals - 0.37% | | | | | | | | |
Abbott Laboratories, 5.125%, 4/1/2019 | | | 980,000 | | | | 1,122,792 | |
Johnson & Johnson, 5.95%, 8/15/2037 | | | 440,000 | | | | 524,778 | |
Novartis Securities Investment Ltd. (Bermuda), 5.125%, 2/10/2019 | | | 1,275,000 | | | | 1,463,608 | |
Wyeth, 6.50%, 2/1/2034 | | | 365,000 | | | | 439,720 | |
| | | | | | | | |
| | | | | | | 3,550,898 | |
| | | | | | | | |
Total Health Care | | | | | | | 14,819,334 | |
| | | | | | | | |
Industrials - 4.38% | | | | | | | | |
Aerospace & Defense - 0.32% | | | | | | | | |
BE Aerospace, Inc., 6.875%, 10/1/2020 | | | 560,000 | | | | 595,000 | |
The Boeing Co., 6.00%, 3/15/2019 | | | 1,000,000 | | | | 1,199,186 | |
GeoEye, Inc., 9.625%, 10/1/2015 | | | 170,000 | | | | 189,337 | |
Honeywell International, Inc., 5.30%, 3/1/2018 | | | 680,000 | | | | 792,898 | |
Kratos Defense & Security Solutions, Inc., 10.00%, 6/1/2017 | | | 280,000 | | | | 310,800 | |
| | | | | | | | |
| | | | | | | 3,087,221 | |
| | | | | | | | |
Air Freight & Logistics - 0.16% | | | | | | | | |
FedEx Corp., 8.00%, 1/15/2019 | | | 570,000 | | | | 734,473 | |
United Parcel Service, Inc., 6.20%, 1/15/2038 | | | 660,000 | | | | 788,114 | |
| | | | | | | | |
| | | | | | | 1,522,587 | |
| | | | | | | | |
| | |
Airlines - 0.43% | | | | | | | | |
Continental Airlines, Inc.4, 6.75%, 9/15/2015 | | | 560,000 | | | | 583,100 | |
Delta Air Lines Pass-Through Trust, Series 2001-1, Class A-2, 7.111%, 9/18/2011 | | | 340,000 | | | | 356,150 | |
Delta Air Lines Pass-Through Trust, Series 2007-1, Class A, 6.821%, 8/10/2022 | | | 325,023 | | | | 351,025 | |
Delta Air Lines, Inc.4, 9.50%, 9/15/2014 | | | 435,000 | | | | 478,500 | |
Southwest Airlines Co., 5.25%, 10/1/2014 | | | 1,030,000 | | | | 1,111,241 | |
Southwest Airlines Co., 5.75%, 12/15/2016 | | | 1,120,000 | | | | 1,227,199 | |
| | | | | | | | |
| | | | | | | 4,107,215 | |
| | | | | | | | |
Building Products - 0.12% | | | | | | | | |
Building Materials Corp. of America4, 6.875%, 8/15/2018 | | | 345,000 | | | | 345,000 | |
Building Materials Corp. of America4, 7.50%, 3/15/2020 | | | 215,000 | | | | 219,837 | |
| | |
| 63 | | The accompanying notes are an integral part of the financial statements. |
Investment Portfolio - October 31, 2010
| | | | | | | | |
Pro-Blend® Moderate Term Series | | Principal Amount | | | Value
(Note 2) | |
| | |
CORPORATE BONDS (continued) | | | | | | | | |
| | |
Non-Convertible Corporate Bonds (continued) | | | | | | | | |
Industrials (continued) | | | | | | | | |
Building Products (continued) | | | | | | | | |
Owens Corning, 9.00%, 6/15/2019 | | $ | 460,000 | | | $ | 557,627 | |
| | | | | | | | |
| | | | | | | 1,122,464 | |
| | | | | | | | |
| | |
Commercial Services & Supplies - 0.33% | | | | | | | | |
ACCO Brands Corp., 10.625%, 3/15/2015 | | | 180,000 | | | | 203,175 | |
Clean Harbors, Inc., 7.625%, 8/15/2016 | | | 427,000 | | | | 451,019 | |
Garda World Security Corp. (Canada)4, 9.75%, 3/15/2017 | | | 430,000 | | | | 457,950 | |
Waste Management, Inc., 7.375%, 3/11/2019 | | | 1,665,000 | | | | 2,097,137 | |
| | | | | | | | |
| | | | | | | 3,209,281 | |
| | | | | | | | |
| | |
Industrial Conglomerates - 2.13% | | | | | | | | |
GE Capital Trust I5, 6.375%, 11/15/2067 | | | 690,000 | | | | 682,237 | |
General Electric Capital Corp.6, 3.00%, 12/9/2011 | | | 3,518,000 | | | | 3,620,230 | |
General Electric Capital Corp.6, 2.125%, 12/21/2012 | | | 8,208,000 | | | | 8,491,915 | |
General Electric Capital Corp., 5.625%, 5/1/2018 | | | 335,000 | | | | 374,365 | |
General Electric Capital Corp., 5.50%, 1/8/2020 | | | 3,950,000 | | | | 4,347,781 | |
General Electric Capital Corp., Series A, 6.75%, 3/15/2032 | | | 970,000 | | | | 1,081,958 | |
General Electric Co., 5.25%, 12/6/2017 | | | 550,000 | | | | 619,227 | |
Textron, Inc., 7.25%, 10/1/2019 | | | 1,000,000 | | | | 1,190,218 | |
| | | | | | | | |
| | | | | | | 20,407,931 | |
| | | | | | | | |
| | |
Machinery - 0.25% | | | | | | | | |
Caterpillar Financial Services Corp., 7.05%, 10/1/2018 | | | 595,000 | | | | 750,416 | |
Caterpillar Financial Services Corp., 7.15%, 2/15/2019 | | | 295,000 | | | | 379,041 | |
John Deere Capital Corp., 5.50%, 4/13/2017 | | | 120,000 | | | | 139,886 | |
John Deere Capital Corp., 5.75%, 9/10/2018 | | | 1,000,000 | | | | 1,177,798 | |
| | | | | | | | |
| | | | | | | 2,447,141 | |
| | | | | | | | |
| | |
Marine - 0.12% | | | | | | | | |
Navios Maritime Holdings, Inc. - Navios Maritime Finance US, Inc. (Marshall Island)4,
8.875%, 11/1/2017 | | | 885,000 | | | | 944,738 | |
United Maritime Group LLC - United Maritime Group Finance Corp., 11.75%, 6/15/2015 | | | 190,000 | | | | 189,762 | |
| | | | | | | | |
| | | | | | | 1,134,500 | |
| | | | | | | | |
| | |
Road & Rail - 0.52% | | | | | | | | |
CSX Corp., 6.00%, 10/1/2036 | | | 1,190,000 | | | | 1,266,460 | |
JB Hunt Transport Services, Inc., 3.375%, 9/15/2015 | | | 2,305,000 | | | | 2,333,384 | |
RailAmerica, Inc., 9.25%, 7/1/2017 | | | 309,000 | | | | 342,218 | |
Union Pacific Corp., 5.65%, 5/1/2017 | | | 365,000 | | | | 421,296 | |
| | | | |
| The accompanying notes are an integral part of the financial statements. | | | 64 | |
Investment Portfolio - October 31, 2010
| | | | | | | | |
Pro-Blend® Moderate Term Series | | Principal Amount | | | Value
(Note 2) | |
| | |
CORPORATE BONDS (continued) | | | | | | | | |
| | |
Non-Convertible Corporate Bonds (continued) | | | | | | | | |
Industrials (continued) | | | | | | | | |
Road & Rail (continued) | | | | | | | | |
Union Pacific Corp., 7.875%, 1/15/2019 | | $ | 495,000 | | | $ | 648,585 | |
| | | | | | | | |
| | | | | | | 5,011,943 | |
| | | | | | | | |
Total Industrials | | | | | | | 42,050,283 | |
| | | | | | | | |
Information Technology - 0.88% | | | | | | | | |
Communications Equipment - 0.33% | | | | | | | | |
Alcatel-Lucent USA, Inc., 6.45%, 3/15/2029 | | | 530,000 | | | | 442,550 | |
Cisco Systems, Inc., 5.90%, 2/15/2039 | | | 1,070,000 | | | | 1,202,564 | |
Hughes Network Systems LLC - HNS Finance Corp., 9.50%, 4/15/2014 | | | 665,000 | | | | 693,263 | |
Nokia Corp. (Finland), 5.375%, 5/15/2019 | | | 705,000 | | | | 784,726 | |
| | | | | | | | |
| | | | | | | 3,123,103 | |
| | | | | | | | |
Computers & Peripherals - 0.15% | | | | | | | | |
International Business Machines Corp., 5.60%, 11/30/2039 | | | 1,302,000 | | | | 1,451,115 | |
| | | | | | | | |
Electronic Equipment, Instruments & Components - 0.06% | | | | | | | | |
Corning, Inc., 6.625%, 5/15/2019 | | | 460,000 | | | | 555,436 | |
| | | | | | | | |
IT Services - 0.15% | | | | | | | | |
The Western Union Co., 5.253%, 4/1/2020 | | | 1,350,000 | | | | 1,474,884 | |
| | | | | | | | |
Semiconductors & Semiconductor Equipment - 0.11% | | | | | | | | |
Advanced Micro Devices, Inc., 8.125%, 12/15/2017 | | | 360,000 | | | | 388,800 | |
Advanced Micro Devices, Inc.4, 7.75%, 8/1/2020 | | | 170,000 | | | | 180,200 | |
MagnaChip Semiconductor S.A. - MagnaChip Semiconductor Finance Co.4,
10.50%, 4/15/2018 | | | 465,000 | | | | 498,712 | |
| | | | | | | | |
| | | | | | | 1,067,712 | |
| | | | | | | | |
Software - 0.08% | | | | | | | | |
Microsoft Corp., 5.20%, 6/1/2039 | | | 735,000 | | | | 780,430 | |
| | | | | | | | |
Total Information Technology | | | | | | | 8,452,680 | |
| | | | | | | | |
Materials - 1.72% | | | | | | | | |
Chemicals - 0.24% | | | | | | | | |
E.I. du Pont de Nemours & Co., 6.00%, 7/15/2018 | | | 910,000 | | | | 1,089,997 | |
Ferro Corp., 7.875%, 8/15/2018 | | | 560,000 | | | | 595,700 | |
Rhodia S.A. (France)4, 6.875%, 9/15/2020 | | | 575,000 | | | | 604,469 | |
| | | | | | | | |
| | | | | | | 2,290,166 | |
| | | | | | | | |
Containers & Packaging - 0.05% | | | | | | | | |
Reynolds Group Issuer, Inc. - Reynolds Group Issuer LLC4, 8.50%, 5/15/2018 | | | 480,000 | | | | 490,800 | |
| | | | | | | | |
Metals & Mining - 1.00% | | | | | | | | |
Alcoa, Inc., 5.72%, 2/23/2019 | | | 2,166,000 | | | | 2,218,985 | |
Alcoa, Inc., 5.87%, 2/23/2022 | | | 210,000 | | | | 214,505 | |
| | |
| 65 | | The accompanying notes are an integral part of the financial statements. |
Investment Portfolio - October 31, 2010
| | | | | | | | |
Pro-Blend® Moderate Term Series | | Principal Amount | | | Value
(Note 2) | |
| | |
CORPORATE BONDS (continued) | | | | | | | | |
| | |
Non-Convertible Corporate Bonds (continued) | | | | | | | | |
Materials (continued) | | | | | | | | |
Metals & Mining (continued) | | | | | | | | |
BHP Billiton Finance (USA) Ltd. (Australia), 6.50%, 4/1/2019 | | $ | 850,000 | | | $ | 1,053,894 | |
Cliffs Natural Resources, Inc., 5.90%, 3/15/2020 | | | 4,750,000 | | | | 5,219,124 | |
Steel Dynamics, Inc., 7.75%, 4/15/2016 | | | 810,000 | | | | 864,675 | |
| | | | | | | | |
| | | | | | | 9,571,183 | |
| | | | | | | | |
Paper & Forest Products - 0.43% | | | | | | | | |
Georgia-Pacific LLC4, 8.25%, 5/1/2016 | | | 295,000 | | | | 338,512 | |
International Paper Co., 9.375%, 5/15/2019 | | | 1,777,000 | | | | 2,346,582 | |
International Paper Co., 7.50%, 8/15/2021 | | | 1,195,000 | | | | 1,457,231 | |
| | | | | | | | |
| | | | | | | 4,142,325 | |
| | | | | | | | |
Total Materials | | | | | | | 16,494,474 | |
| | | | | | | | |
Telecommunication Services - 0.58% | | | | | | | | |
Diversified Telecommunication Services - 0.24% | | | | | | | | |
Clearwire Communications LLC - Clearwire Finance, Inc.4, 12.00%, 12/1/2015 | | | 110,000 | | | | 122,100 | |
Clearwire Communications LLC - Clearwire Finance, Inc.4, 12.00%, 12/1/2015 | | | 325,000 | | | | 359,938 | |
Inmarsat Finance plc (United Kingdom)4, 7.375%, 12/1/2017 | | | 565,000 | | | | 604,550 | |
Intelsat Subsidiary Holding Co. Ltd. (Bermuda)4, 8.875%, 1/15/2015 | | | 525,000 | | | | 540,750 | |
Wind Acquisition Finance S.A. (Luxembourg)4, 11.75%, 7/15/2017 | | | 580,000 | | | | 661,200 | |
| | | | | | | | |
| | | | | | | 2,288,538 | |
| | | | | | | | |
Wireless Telecommunication Services - 0.34% | | | | | | | | |
CC Holdings GS V LLC - Crown Castle GS III Corp.4, 7.75%, 5/1/2017 | | | 450,000 | | | | 505,125 | |
Crown Castle Towers LLC4, 6.113%, 1/15/2020 | | | 1,040,000 | | | | 1,156,687 | |
Crown Castle Towers LLC4, 4.883%, 8/15/2020 | | | 333,000 | | | | 339,247 | |
NII Capital Corp., 8.875%, 12/15/2019 | | | 585,000 | | | | 650,812 | |
SBA Tower Trust4, 5.101%, 4/15/2017 | | | 575,000 | | | | 618,475 | |
| | | | | | | | |
| | | | | | | 3,270,346 | |
| | | | | | | | |
Total Telecommunication Services | | | | | | | 5,558,884 | |
| | | | | | | | |
Utilities - 0.34% | | | | | | | | |
Electric Utilities - 0.28% | | | | | | | | |
Allegheny Energy Supply Co. LLC4, 5.75%, 10/15/2019 | | | 705,000 | | | | 739,438 | |
Exelon Generation Co. LLC, 5.35%, 1/15/2014 | | | 710,000 | | | | 789,141 | |
Exelon Generation Co. LLC, 5.20%, 10/1/2019 | | | 175,000 | | | | 193,172 | |
Southwestern Electric Power Co., 6.45%, 1/15/2019 | | | 850,000 | | | | 964,787 | |
| | | | | | | | |
| | | | | | | 2,686,538 | |
| | | | | | | | |
Independent Power Producers & Energy Traders - 0.06% | | | | | | | | |
Mirant Mid Atlantic Pass-Through Trust, Series B, 9.125%, 6/30/2017 | | | 130,601 | | | | 140,396 | |
Mirant Mid Atlantic Pass-Through Trust, Series C, 10.06%, 12/30/2028 | | | 194,859 | | | | 216,781 | |
| | | | |
| The accompanying notes are an integral part of the financial statements. | | | 66 | |
Investment Portfolio - October 31, 2010
| | | | | | | | |
Pro-Blend® Moderate Term Series | | Principal Amount/
Shares | | | Value
(Note 2) | |
| | |
CORPORATE BONDS (continued) | | | | | | | | |
| | |
Non-Convertible Corporate Bonds (continued) | | | | | | | | |
Utilities (continued) | | | | | | | | |
Independent Power Producers & Energy Traders (continued) | | | | | | | | |
North American Energy Alliance LLC - North American Energy Alliance Finance Corp.4, 10.875%, 6/1/2016 | | $ | 170,000 | | | $ | 188,700 | |
| | | | | | | | |
| | | | | | | 545,877 | |
| | | | | | | | |
Multi-Utilities - 0.00%** | | | | | | | | |
CenterPoint Energy Resources Corp., Series B, 7.875%, 4/1/2013 | | | 50,000 | | | | 57,580 | |
| | | | | | | | |
Total Utilities | | | | | | | 3,289,995 | |
| | | | | | | | |
Total Non-Convertible Corporate Bonds
(Identified Cost $249,228,875) | | | | | | | 265,204,505 | |
| | | | | | | | |
TOTAL CORPORATE BONDS
(Identified Cost $249,975,402) | | | | | | | 266,002,711 | |
| | | | | | | | |
| | |
MUTUAL FUNDS - 1.21% | | | | | | | | |
| | |
iShares Dow Jones US Real Estate Index Fund | | | 890 | | | | 48,879 | |
iShares iBoxx High Yield Corporate Bond Fund | | | 52,180 | | | | 4,734,813 | |
iShares iBoxx Investment Grade Corporate Bond Fund | | | 60,410 | | | | 6,787,667 | |
| | | | | | | | |
TOTAL MUTUAL FUNDS
(Identified Cost $10,480,587) | | | | | | | 11,571,359 | |
| | | | | | | | |
| | |
U.S. TREASURY SECURITIES - 2.86% | | | | | | | | |
| | |
U.S. Treasury Notes - 2.86% | | | | | | | | |
U.S. Treasury Note, 2.375%, 2/28/2015 | | $ | 16,270,000 | | | | 17,237,252 | |
U.S. Treasury Note, 4.00%, 8/15/2018 | | | 6,720,000 | | | | 7,629,297 | |
U.S. Treasury Note, 2.75%, 2/15/2019 | | | 2,500,000 | | | | 2,589,257 | |
| | | | | | | | |
TOTAL U.S. TREASURY SECURITIES
(Identified Cost $25,687,337) | | | | | | | 27,455,806 | |
| | | | | | | | |
| | |
ASSET-BACKED SECURITIES - 0.11% | | | | | | | | |
| | |
Hertz Vehicle Financing LLC, Series 2009-2A, Class A24, 5.29%, 3/25/2016 | | | 335,000 | | | | 371,018 | |
Hertz Vehicle Financing LLC, Series 2010-1A, Class A24, 3.74%, 2/25/2017 | | | 690,000 | | | | 722,779 | |
| | | | | | | | |
TOTAL ASSET-BACKED SECURITIES
(Identified Cost $1,024,748) | | | | | | | 1,093,797 | |
| | | | | | | | |
| | |
COMMERCIAL MORTGAGE-BACKED SECURITIES - 0.42% | | | | | | | | |
| | |
Banc of America Commercial Mortgage, Inc., Series 2006-2, Class A45, 5.740%, 5/10/2045 | | | 125,000 | | | | 139,334 | |
| | |
| 67 | | The accompanying notes are an integral part of the financial statements. |
Investment Portfolio - October 31, 2010
| | | | | | | | |
Pro-Blend® Moderate Term Series | | Principal Amount | | | Value
(Note 2) | |
| | |
COMMERCIAL MORTGAGE - BACKED SECURITIES (continued) | | | | | | | | |
| | |
Banc of America Commercial Mortgage, Inc., Series 2006-4, Class A4, 5.634%, 7/10/2046 | | $ | 100,000 | | | $ | 107,976 | |
Bear Stearns Commercial Mortgage Securities, Series 2005-PWR9, Class A4A, 4.871%, 9/11/2042 | | | 100,000 | | | | 106,899 | |
Bear Stearns Commercial Mortgage Securities, Series 2006-PW12, Class A45, 5.723%, 9/11/2038 | | | 150,000 | | | | 167,805 | |
Bear Stearns Commercial Mortgage Securities, Series 2006-PW13, Class A4, 5.540%, 9/11/2041 | | | 175,000 | | | | 191,271 | |
Citigroup Commercial Mortgage Trust, Series 2006-C4, Class A35, 5.728%, 3/15/2049 | | | 160,000 | | | | 175,031 | |
Commercial Mortgage Pass-Through Certificates, Series 2006-C7, Class A45, 5.767%, 6/10/2046 | | | 225,000 | | | | 249,292 | |
Commercial Mortgage Pass-Through Certificates, Series 2010-C1, Class A14,7, 3.156%, 11/1/2015 | | | 220,000 | | | | 226,600 | |
JP Morgan Chase Commercial Mortgage Securities Corp., Series 2005-LDP5, Class A45, 5.198%, 12/15/2044 | | | 225,000 | | | | 248,012 | |
JP Morgan Chase Commercial Mortgage Securities Corp., Series 2006-LDP7, Class A45, 5.872%, 4/15/2045 | | | 115,000 | | | | 127,594 | |
LB-UBS Commercial Mortgage Trust, Series 2006-C4, Class A45, 5.881%, 6/15/2038 | | | 175,000 | | | | 192,346 | |
Merrill Lynch - Countrywide Commercial Mortgage Trust, Series 2006-3, Class A45, 5.414%, 7/12/2046 | | | 175,000 | | | | 186,905 | |
Morgan Stanley Capital I, Series 2005-HQ7, Class A45, 5.206%, 11/14/2042 | | | 125,000 | | | | 137,506 | |
OBP Depositor LLC Trust, Series 2010-OBP, Class A4, 4.646%, 7/15/2045 | | | 115,000 | | | | 123,399 | |
Vornado DP LLC, Series 2010-VNO, Class A2FX4, 4.004%, 9/13/2028 | | | 350,000 | | | | 354,237 | |
Wachovia Bank Commercial Mortgage Trust, Series 2005-C21, Class A45, 5.202%, 10/15/2044 | | | 225,000 | | | | 248,516 | |
Wachovia Bank Commercial Mortgage Trust, Series 2006-C25, Class A45, 5.737%, 5/15/2043 | | | 215,000 | | | | 238,294 | |
Wachovia Bank Commercial Mortgage Trust, Series 2006-C26, Class A35, 6.011%, 6/15/2045 | | | 200,000 | | | | 220,563 | |
Wells Fargo Commercial Mortgage Trust, Series 2010-C1, Class A24,7, 4.393%, 11/18/2043 | | | 545,000 | | | | 561,318 | |
| | | | | | | | |
TOTAL COMMERCIAL MORTGAGE-BACKED SECURITIES
(Identified Cost $3,872,016) | | | | | | | 4,002,898 | |
| | | | | | | | |
| | |
FOREIGN GOVERNMENT BONDS - 0.10% | | | | | | | | |
| | |
Hellenic Republic Government Bond (Greece), 6.00%, 7/19/2019
(Identified Cost $1,271,452) | | | 980,000 | | | | 987,420 | |
| | | | | | | | |
| | | | |
| The accompanying notes are an integral part of the financial statements. | | | 68 | |
Investment Portfolio - October 31, 2010
| | | | | | | | |
Pro-Blend® Moderate Term Series | | Shares | | | Value
(Note 2) | |
| | |
U.S. GOVERNMENT AGENCIES - 21.32% | | | | | | | | |
| | |
Mortgage-Backed Securities - 5.31% | | | | | | | | |
Fannie Mae, Pool #888468, 5.50%, 9/1/2021 | | $ | 5,089,896 | | | $ | 5,531,696 | |
Fannie Mae, Pool #995233, 5.50%, 10/1/2021 | | | 316,467 | | | | 344,628 | |
Fannie Mae, Pool #888017, 6.00%, 11/1/2021 | | | 386,905 | | | | 421,268 | |
Fannie Mae, Pool #995329, 5.50%, 12/1/2021 | | | 3,062,067 | | | | 3,327,853 | |
Fannie Mae, Pool #888136, 6.00%, 12/1/2021 | | | 511,999 | | | | 557,472 | |
Fannie Mae, Pool #888810, 5.50%, 11/1/2022 | | | 5,368,486 | | | | 5,834,468 | |
Fannie Mae, Pool #AD0462, 5.50%, 10/1/2024 | | | 329,031 | | | | 356,801 | |
Fannie Mae, Pool #745418, 5.50%, 4/1/2036 | | | 8,535,622 | | | | 9,221,902 | |
Fannie Mae, Pool #995196, 6.00%, 7/1/2038 | | | 17,359,405 | | | | 18,909,739 | |
Fannie Mae, Pool #AD0207, 6.00%, 10/1/2038 | | | 2,278,177 | | | | 2,477,365 | |
Freddie Mac, Pool #G11850, 5.50%, 7/1/2020 | | | 1,652,818 | | | | 1,796,024 | |
Freddie Mac, Pool #G12610, 6.00%, 3/1/2022 | | | 526,737 | | | | 574,342 | |
Freddie Mac, Pool #G12655, 6.00%, 5/1/2022 | | | 355,539 | | | | 387,672 | |
Freddie Mac, Pool #G12988, 6.00%, 1/1/2023 | | | 294,131 | | | | 320,162 | |
Freddie Mac, Pool #G13078, 6.00%, 3/1/2023 | | | 515,324 | | | | 561,897 | |
Freddie Mac, Pool #G13331, 5.50%, 10/1/2023 | | | 277,789 | | | | 300,642 | |
GNMA, Pool #286310, 9.00%, 2/15/2020 | | | 1,481 | | | | 1,691 | |
GNMA, Pool #263096, 9.50%, 3/15/2020 | | | 1,739 | | | | 2,046 | |
GNMA, Pool #288873, 9.50%, 8/15/2020 | | | 25 | | | | 29 | |
| | | | | | | | |
Total Mortgage-Backed Securities
(Identified Cost $50,803,478) | | | | | | | 50,927,697 | |
| | | | | | | | |
Other Agencies - 16.01% | | | | | | | | |
Fannie Mae, 3.00%, 9/16/2014 | | | 250,000 | | | | 269,201 | |
Fannie Mae, 2.625%, 11/20/2014 | | | 3,500,000 | | | | 3,718,827 | |
Fannie Mae, 4.375%, 10/15/2015 | | | 8,900,000 | | | | 10,161,646 | |
Fannie Mae, 1.625%, 10/26/2015 | | | 10,000,000 | | | | 10,095,320 | |
Fannie Mae, 6.25%, 5/15/2029 | | | 3,416,000 | | | | 4,412,608 | |
Fannie Mae, 7.25%, 5/15/2030 | | | 3,036,000 | | | | 4,326,725 | |
Fannie Mae, 6.625%, 11/15/2030 | | | 3,239,000 | | | | 4,333,137 | |
Federal Home Loan Bank, 1.50%, 1/16/2013 | | | 20,175,000 | | | | 20,636,382 | |
Freddie Mac, 1.375%, 1/9/2013 | | | 8,410,000 | | | | 8,575,240 | |
Freddie Mac, 2.875%, 2/9/2015 | | | 20,000,000 | | | | 21,444,080 | |
Freddie Mac, 5.125%, 11/17/2017 | | | 15,850,000 | | | | 18,973,607 | |
Freddie Mac, 3.75%, 3/27/2019 | | | 34,790,000 | | | | 38,051,110 | |
Freddie Mac, 6.75%, 3/15/2031 | | | 3,145,000 | | | | 4,288,336 | |
Freddie Mac, 6.25%, 7/15/2032 | | | 3,315,000 | | | | 4,327,050 | |
| | | | | | | | |
Total Other Agencies
(Identified Cost $148,259,951) | | | | | | | 153,613,269 | |
| | | | | | | | |
TOTAL U.S. GOVERNMENT AGENCIES
(Identified Cost $199,063,429) | | | | | | | 204,540,966 | |
| | | | | | | | |
| | |
| 69 | | The accompanying notes are an integral part of the financial statements. |
Investment Portfolio - October 31, 2010
| | | | | | | | |
Pro-Blend® Moderate Term Series | | | | | | |
| | |
SHORT - TERM INVESTMENTS - 5.58% | | | | | | | | |
| | |
Dreyfus Cash Management, Inc. - Institutional Shares8, 0.16%,
(Identified Cost $53,583,443) | | | 53,583,443 | | | $ | 53,583,443 | |
| | | | | | | | |
| | |
TOTAL INVESTMENTS - 101.56%
(Identified Cost $918,174,370) | | | | | | | 974,540,451 | |
LIABILITIES, LESS OTHER ASSETS - (1.56%) | | | | | | | (14,980,236 | ) |
| | | | | | | | |
NET ASSETS - 100% | | | | | | $ | 959,560,215 | |
| | | | | | | | |
| | | | | | | | | | | | | | | | |
| FORWARD FOREIGN CURRENCY EXCHANGE CONTRACTS OPEN AT OCTOBER 31, 20109: | |
| | | | |
Settlement Date | | Contracts to Deliver | | | In Exchange
For | | | Contracts At
Value | | | Unrealized
Depreciation | |
11/30/2010 | | EUR | 1,040,000 | | | $ | 1,435,772 | | | $ | 1,446,933 | | | $ | (11,161 | ) |
ADR - American Depository Receipt
EUR- Euro Currency
NVDR - Non-Voting Depository Receipt
| * | Non-income producing security |
| 1 | International Fair Value factor from pricing service was applied. |
| 2 | The Bank of New York Mellon Corp. is the Series’ custodian and serves as sub-accountant and sub-transfer agent to the Series. |
| 3 | Latest quoted sales price is not available and the latest quoted bid price was used to value the security. |
| 4 | Restricted securities - Investment in securities that are restricted as to public resale under the Securities Act of 1933, as amended. These securities have been sold under rule 144A and have been determined to be liquid. These securities amount to $29,938,343, or 3.12%, of the Series’ net assets as of October 31, 2010. |
| 5 | The coupon rate is floating and is the stated rate as of October 31, 2010. |
| 6 | Security insured under the Federal Deposit Insurance Corporation Temporary Liquidity Guarantee Program. |
| 7 | Security has been valued at fair value. |
| 8 | Rate shown is the current yield as of October 31, 2010. |
| 9 | The counterparty for all forward foreign currency exchange contracts is The Bank of New York Mellon Corp. |
| | | | |
| The accompanying notes are an integral part of the financial statements. | | | 70 | |
Statement of Assets and Liabilities - Pro-Blend® Moderate Term Series
October 31, 2010
| | | | |
ASSETS: | | | | |
| |
Investments, at value (identified cost $918,174,370) (Note 2) | | $ | 974,540,451 | |
Cash | | | 308,156 | |
Receivable for securities sold | | | 8,865,638 | |
Interest receivable | | | 5,459,013 | |
Receivable for fund shares sold | | | 3,488,410 | |
Dividends receivable | | | 204,059 | |
Foreign tax reclaims receivable | | | 144,998 | |
| | | | |
| |
TOTAL ASSETS | | | 993,010,725 | |
| | | | |
| |
LIABILITIES: | | | | |
| |
Accrued management fees (Note 3) | | | 642,976 | |
Accrued shareholder services fees (Class S) (Note 3) | | | 131,334 | |
Accrued fund accounting and administration fees (Note 3) | | | 39,583 | |
Accrued transfer agent fees (Note 3) | | | 27,431 | |
Accrued distribution and service (Rule 12b-1) fees (Class C) (Class R) (Note 3) | | | 25,875 | |
Accrued directors’ fees (Note 3) | | | 2,217 | |
Accrued Chief Compliance Officer service fees (Note 3) | | | 247 | |
Payable for securities purchased | | | 31,787,790 | |
Payable for fund shares repurchased | | | 647,525 | |
Unrealized depreciation on foreign forward currency contracts (Note 2) | | | 11,161 | |
Other payables and accrued expenses | | | 134,371 | |
| | | | |
| |
TOTAL LIABILITIES | | | 33,450,510 | |
| | | | |
| |
TOTAL NET ASSETS | | $ | 959,560,215 | |
| | | | |
| |
NET ASSETS CONSIST OF: | | | | |
| |
Capital stock | | $ | 796,876 | |
Additional paid-in-capital | | | 880,713,213 | |
Undistributed net investment income | | | 7,449,640 | |
Accumulated net realized gain on investments, foreign currency and translation of other assets and liabilities | | | 14,232,102 | |
Net unrealized appreciation on investments, foreign currency and translation of other assets and liabilities | | | 56,368,384 | |
| | | | |
| |
TOTAL NET ASSETS | | $ | 959,560,215 | |
| | | | |
| | |
| 71 | | The accompanying notes are an integral part of the financial statements. |
Statement of Assets and Liabilities - Pro-Blend® Moderate Term Series
October 31, 2010
| | | | |
| |
NET ASSET VALUE, OFFERING PRICE AND REDEMPTION PRICE PER SHARE - Class S
($633,304,222/48,925,765 shares) | | $ | 12.94 | |
| | | | |
| |
NET ASSET VALUE, OFFERING PRICE AND REDEMPTION PRICE PER SHARE - Class I
($293,999,794/27,744,644 shares) | | $ | 10.60 | |
| | | | |
| |
NET ASSET VALUE, OFFERING PRICE AND REDEMPTION PRICE PER SHARE - Class C
($32,019,447/2,995,674 shares) | | $ | 10.69 | |
| | | | |
| |
NET ASSET VALUE, OFFERING PRICE AND REDEMPTION PRICE PER SHARE - Class R
($236,752/21,539 shares) | | $ | 10.99 | |
| | | | |
| | | | |
| The accompanying notes are an integral part of the financial statements. | | | 72 | |
Statement of Operations - Pro-Blend® Moderate Term Series
For the Year Ended October 31, 2010
| | | | |
| |
INVESTMENT INCOME: | | | | |
| |
Interest | | $ | 14,867,718 | |
Dividends (net of foreign taxes withheld, $165,169) | | | 5,474,556 | |
| | | | |
| |
Total Investment Income | | | 20,342,274 | |
| | | | |
| |
EXPENSES: | | | | |
| |
Management fees (Note 3) | | | 5,674,984 | |
Shareholder services fees (Class S) (Note 3) | | | 1,314,363 | |
Fund accounting and administration fees (Note 3) | | | 163,078 | |
Distribution and service (Rule 12b-1) fees (Class C) (Note 3) | | | 122,381 | |
Transfer agent fees (Note 3) | | | 85,090 | |
Directors’ fees (Note 3) | | | 17,151 | |
Chief Compliance Officer service fees (Note 3) | | | 2,724 | |
Distribution and service (Rule 12b-1) fees (Class R) (Note 3) | | | 39 | |
Custodian fees | | | 79,600 | |
Miscellaneous | | | 330,018 | |
| | | | |
| |
Total Expenses | | | 7,789,428 | |
Less reduction of expenses (Note 3) | | | (758 | ) |
| | | | |
| |
Net Expenses | | | 7,788,670 | |
| | | | |
| |
NET INVESTMENT INCOME | | | 12,553,604 | |
| | | | |
| |
REALIZED AND UNREALIZED GAIN (LOSS) ON INVESTMENTS AND FOREIGN CURRENCY: | | | | |
| |
Net realized gain (loss) on- | | | | |
Investments | | | 36,126,051 | |
Foreign currency and translation of other assets and liabilities | | | (27,379 | ) |
Forward foreign currency exchange contracts | | | (13,967 | ) |
| | | | |
| |
| | | 36,084,705 | |
| | | | |
| |
Net change in unrealized appreciation (depreciation) on- | | | | |
Investments | | | 39,892,244 | |
Foreign currency and translation of other assets and liabilities | | | 5,808 | |
Forward foreign currency exchange contracts | | | (11,161 | ) |
| | | | |
| |
| | | 39,886,891 | |
| | | | |
| |
NET REALIZED AND UNREALIZED GAIN ON INVESTMENTS AND FOREIGN CURRENCY | | | 75,971,596 | |
| | | | |
| |
NET INCREASE IN NET ASSETS RESULTING FROM OPERATIONS | | $ | 88,525,200 | |
| | | | |
| | |
| 73 | | The accompanying notes are an integral part of the financial statements. |
Statements of Changes in Net Assets - Pro-Blend® Moderate Term Series
| | | | | | | | |
| | | For the
Year Ended
10/31/10 | | | For the
Year Ended
10/31/09 | |
INCREASE (DECREASE) IN NET ASSETS: | | | | | | | | |
| | |
OPERATIONS: | | | | | | | | |
| | |
Net investment income | | $ | 12,553,604 | | | $ | 4,446,941 | |
Net realized gain (loss) on investments and foreign currency | | | 36,084,705 | | | | (13,731,805 | ) |
Net change in unrealized appreciation on investments and foreign currency | | | 39,886,891 | | | | 50,979,855 | |
| | | | | | | | |
| | |
Net increase from operations | | | 88,525,200 | | | | 41,694,991 | |
| | | | | | | | |
| | |
DISTRIBUTIONS TO SHAREHOLDERS (Note 8): | | | | | | | | |
| | |
From net investment income (Class S) | | | (5,933,684 | ) | | | (4,470,282 | ) |
From net investment income (Class C) | | | (79,607 | ) | | | — | |
From net investment income (Class I) | | | (2,101,821 | ) | | | (85,830 | ) |
| | | | | | | | |
| | |
Total distributions to shareholders | | | (8,115,112 | ) | | | (4,556,112 | ) |
| | | | | | | | |
| | |
CAPITAL STOCK ISSUED AND REPURCHASED: | | | | | | | | |
| | |
Net increase from capital share transactions (Note 5) | | | 438,089,089 | | | | 184,793,523 | |
| | | | | | | | |
| | |
Net increase in net assets | | | 518,499,177 | | | | 221,932,402 | |
| | |
NET ASSETS: | | | | | | | | |
| | |
Beginning of year | | | 441,061,038 | | | | 219,128,636 | |
| | | | | | | | |
| | |
End of year (including undistributed net investment income of $7,449,640 and $3,037,303, respectively) | | $ | 959,560,215 | | | $ | 441,061,038 | |
| | | | | | | | |
| | | | |
| The accompanying notes are an integral part of the financial statements. | | | 74 | |
Financial Highlights - Pro-Blend® Moderate Term Series - Class S
| | | | | | | | | | | | | | | | | | | | |
| | | For the Years Ended | |
| | | 10/31/10 | | | 10/31/09 | | | 10/31/08 | | | 10/31/07 | | | 10/31/06 | |
Per share data (for a share outstanding throughout each year): | | | | | | | | | | | | | | | | | | | | |
Net asset value - Beginning of year | | $ | 11.61 | | | $ | 10.41 | | | $ | 14.18 | | | $ | 13.55 | | | $ | 12.75 | |
| | | | | | | | | | | | | | | | | | | | |
Income (loss) from investment operations: | | | | | | | | | | | | | | | | | | | | |
Net investment income | | | 0.19 | 1 | | | 0.16 | 1 | | | 0.23 | | | | 0.24 | | | | 0.20 | |
Net realized and unrealized gain (loss) on investments | | | 1.28 | | | | 1.23 | | | | (2.75 | ) | | | 1.19 | | | | 1.36 | |
| | | | | | | | | | | | | | | | | | | | |
Total from investment operations | | | 1.47 | | | | 1.39 | | | | (2.52 | ) | | | 1.43 | | | | 1.56 | |
| | | | | | | | | | | | | | | | | | | | |
Less distributions to shareholders: | | | | | | | | | | | | | | | | | | | | |
From net investment income | | | (0.14 | ) | | | (0.19 | ) | | | (0.23 | ) | | | (0.23 | ) | | | (0.14 | ) |
From net realized gain on investments | | | — | | | | — | | | | (1.02 | ) | | | (0.57 | ) | | | (0.62 | ) |
| | | | | | | | | | | | | | | | | | | | |
Total distributions to shareholders | | | (0.14 | ) | | | (0.19 | ) | | | (1.25 | ) | | | (0.80 | ) | | | (0.76 | ) |
| | | | | | | | | | | | | | | | | | | | |
Net asset value - End of year | | $ | 12.94 | | | $ | 11.61 | | | $ | 10.41 | | | $ | 14.18 | | | $ | 13.55 | |
| | | | | | | | | | | | | | | | | | | | |
Net assets - End of year
(000’s omitted) | | $ | 633,304 | | | $ | 396,927 | | | $ | 218,807 | | | $ | 379,385 | | | $ | 297,096 | |
| | | | | | | | | | | | | | | | | | | | |
Total return2 | | | 12.81 | % | | | 13.65 | % | | | (19.28 | %) | | | 10.91 | % | | | 12.88 | % |
Ratios (to average net assets)/ Supplemental Data: | | | | | | | | | | | | | | | | | | | | |
Expenses* | | | 1.09 | % | | | 1.10 | % | | | 1.10 | % | | | 1.11 | % | | | 1.16 | % |
Net investment income | | | 1.60 | % | | | 1.49 | % | | | 1.74 | % | | | 1.86 | % | | | 1.75 | % |
Series portfolio turnover | | | 56 | % | | | 58 | % | | | 75 | % | | | 78 | % | | | 72 | % |
|
* The investment advisor did not impose all or a portion of its management fees, CCO fees, fund accounting and transfer agent fees and other fees in some years and in some years paid a portion of the Series’ expenses. If these expenses had been incurred by the Class, the expense ratio (to average net assets) would have been increased by the following amount: | |
| | | 0.00 | %3 | | | 0.02 | % | | | 0.02 | % | | | N/A | | | | N/A | |
| 1 | Calculated based on average shares outstanding during the year. |
| 2 | Represents aggregate total return for the year indicated, and assumes reinvestment of all distributions. Total return would have been lower had certain expenses not been waived or reimbursed during certain years. |
| | |
| 75 | | The accompanying notes are an integral part of the financial statements. |
Financial Highlights - Pro-Blend® Moderate Term Series - Class I
| | | | | | | | | | | | |
| | | For the Years Ended | | | For the Period
3/28/081 to
10/31/08 | |
| | | 10/31/10 | | | 10/31/09 | | |
Per share data (for a share outstanding throughout each period): | | | | | | | | | | | | |
Net asset value - Beginning of period | | $ | 9.54 | | | $ | 8.59 | | | $ | 10.00 | |
| | | | | | | | | | | | |
Income (loss) from investment operations: | | | | | | | | | | | | |
Net investment income | | | 0.18 | 2 | | | 0.15 | 2 | | | 0.06 | |
Net realized and unrealized gain (loss) on investments | | | 1.06 | | | | 1.02 | | | | (1.42 | ) |
| | | | | | | | | | | | |
Total from investment operations | | | 1.24 | | | | 1.17 | | | | (1.36 | ) |
| | | | | | | | | | | | |
Less distributions to shareholders: | | | | | | | | | | | | |
From net investment income | | | (0.18 | ) | | | (0.22 | ) | | | (0.05 | ) |
| | | | | | | | | | | | |
Net asset value - End of period | | $ | 10.60 | | | $ | 9.54 | | | $ | 8.59 | |
| | | | | | | | | | | | |
Net assets - End of period (000’s omitted) | | $ | 294,000 | | | $ | 44,134 | | | $ | 322 | |
| | | | | | | | | | | | |
Total return3 | | | 13.13 | % | | | 14.11 | % | | | (13.64 | %) |
Ratios (to average net assets)/Supplemental Data: | | | | | | | | | | | | |
Expenses* | | | 0.84 | % | | | 0.85 | % | | | 0.85 | %4 |
Net investment income | | | 1.85 | % | | | 1.67 | % | | | 1.47 | %4 |
Series portfolio turnover | | | 56 | % | | | 58 | % | | | 75 | % |
|
* The investment advisor did not impose all or a portion of its management fees, CCO fees, fund accounting and transfer agent fees and other fees in some periods and in some periods paid a portion of the Series’ expenses. If these expenses had been incurred by the Class, the expense ratio (to average net assets) would have been increased by the following amount: | |
| | | 0.00 | %5 | | | 0.02 | % | | | 0.10 | %4 |
| 1 | Commencement of operations. |
| 2 | Calculated based on average shares outstanding during the period. |
| 3 | Represents aggregate total return for the periods indicated, and assumes reinvestment of all distributions. Total return would have been lower had certain expenses not been waived or reimbursed during the periods. Periods less than one year are not annualized. |
| | | | |
| The accompanying notes are an integral part of the financial statements. | | | 76 | |
Financial Highlights - Pro-Blend® Moderate Term Series - Class C
| | | | |
| | | For the Period
1/4/101 to
10/31/10 | |
Per share data (for a share outstanding throughout the period): | | | | |
Net asset value - Beginning of period | | $ | 10.00 | |
| | | | |
Income from investment operations: | | | | |
Net investment income | | | 0.07 | 2 |
Net realized and unrealized gain on investments | | | 0.67 | |
| | | | |
Total from investment operations | | | 0.74 | |
| | | | |
Less distributions to shareholders: | | | | |
From net investment income | | | (0.05 | ) |
| | | | |
Net asset value - End of period | | $ | 10.69 | |
| | | | |
Net assets - End of period (000’s omitted) | | $ | 32,019 | |
| | | | |
Total return3 | | | 7.41 | % |
Ratios (to average net assets)/Supplemental Data: | | | | |
Expenses* | | | 1.84 | %4 |
Net investment income | | | 0.85 | %4 |
Series portfolio turnover | | | 56 | % |
* The investment advisor did not impose all or a portion of other fees during the period and paid a portion of the Series’ expenses. If these expenses had been incurred by the Class, the expense ratio (to average net assets) would have been increased by the following amount: | |
| | | 0.00 | %4,5 |
| 1 | Commencement of operations. |
| 2 | Calculated based on average shares outstanding during the period. |
| 3 | Represents aggregate total return for the period indicated, and assumes reinvestment of all distributions. Total return would have been lower had certain expenses not been waived during the period. Periods less than one year are not annualized. |
| | |
| 77 | | The accompanying notes are an integral part of the financial statements. |
Financial Highlights - Pro-Blend® Moderate Term Series - Class R
| | | | |
| | | For the Period
6/30/101 to
10/31/10 | |
Per share data (for a share outstanding throughout the period): | | | | |
Net asset value - Beginning of period | | $ | 10.00 | |
| | | | |
Income from investment operations: | | | | |
Net investment income | | | 0.02 | 2 |
Net realized and unrealized gain on investments | | | 0.97 | |
| | | | |
Total from investment operations | | | 0.99 | |
| | | | |
Net asset value - End of period | | $ | 10.99 | |
| | | | |
Net assets - End of period (000’s omitted) | | $ | 237 | |
| | | | |
Total return3 | | | 9.90 | % |
Ratios (to average net assets)/Supplemental Data: | | | | |
Expenses* | | | 1.34 | %4 |
Net investment income | | | 0.65 | %4 |
Series portfolio turnover | | | 56 | % |
| 1 | Commencement of operations. |
| 2 | Calculated based on average shares outstanding during the period. |
| 3 | Represents aggregate total return for the period indicated, and assumes reinvestment of all distributions. Total return would have been lower had certain expenses not been waived during the period. Periods less than one year are not annualized. |
| | | | |
| The accompanying notes are an integral part of the financial statements. | | | 78 | |
Performance Update - Pro-Blend® Extended Term Series (unaudited)
| | | | | | | | | | | | | | | | |
| | | Average Annual Total Returns | |
| | | As of October 31, 2010 | |
| | | One
Year | | | Five
Year | | | Ten
Year | | | Since
Inception1 | |
Manning & Napier Fund, Inc. - Pro-Blend® Extended Term Series - Class S2 | | | 15.17 | % | | | 5.30 | % | | | 6.05 | % | | | 8.84 | % |
Manning & Napier Fund, Inc. - Pro-Blend® Extended Term Series - Class I2,3 | | | 15.39 | % | | | 5.57 | % | | | 6.36 | % | | | 9.17 | % |
Manning & Napier Fund, Inc. - Pro-Blend® Extended Term Series - Class C2,3 | | | 14.48 | % | | | 4.56 | % | | | 5.32 | % | | | 8.10 | % |
Manning & Napier Fund, Inc. - Pro-Blend® Extended Term Series - Class R2,3 | | | 14.71 | % | | | 5.02 | % | | | 5.82 | % | | | 8.62 | % |
Barclays Capital U.S. Aggregate Bond Index4,6 | | | 8.01 | % | | | 6.45 | % | | | 6.38 | % | | | 6.27 | % |
15%/40%/45% Blended Index4,5,6 | | | 13.34 | % | | | 5.09 | % | | | 4.30 | % | | | 7.19 | % |
The following graph compares the value of a $10,000 investment in the Manning & Napier Fund, Inc. - Pro-Blend® Extended Term Series - Class S for the ten years ended October 31, 2010 to the Barclays Capital U.S. Aggregate Bond Index and a 15%/40%/45% Blended Index.
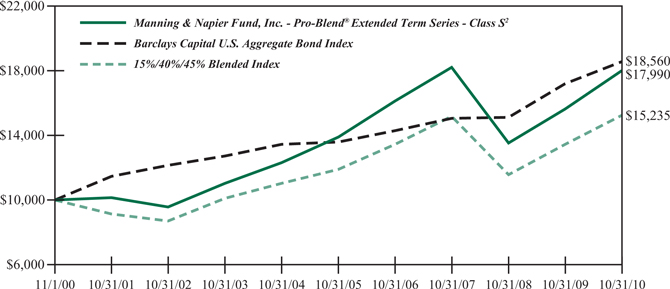
| 1 | Performance numbers for the Series are calculated from October 12, 1993, the Class S inception date. The Barclays Capital U.S. Aggregate Bond Index only publishes month-end numbers; therefore, performance numbers for the Indices are calculated from October 31, 1993. |
| 2 | The Series’ performance does not reflect the deduction of taxes that a shareholder would pay on fund distributions or the redemption of shares. The Series’ performance is historical and may not be indicative of future results. The performance returns shown are inclusive of the net expense ratio of the Series. For the year ended October 31, 2010, this net expense ratio was 1.07% for Class S, 0.83% for Class I, 1.83% for Class C and 1.33% for Class R. The gross expense ratio, which does not account for any voluntary or contractual waivers currently in effect, was 1.07% for Class S, 0.83% for Class I, 1.83% for Class C and 1.33% for Class R for the year ended October 31, 2010. |
| 3 | For periods prior to the inception of Class I on March 28, 2008, Class C on January 4, 2010, and Class R on June 30, 2010, the performance figures are hypothetical and reflect the performance of the Manning & Napier Fund, Inc. - Pro-Blend® Extended Term Series - Class S adjusted for expense differences. |
| 4 | The Barclays Capital U.S. Aggregate Bond Index is an unmanaged index that represents the U.S. domestic investment-grade bond market. It is a market value weighted index of investment-grade debt issues, including government, corporate, asset-backed and mortgage-backed securities, with maturities of one year or more. The Index returns assume reinvestment of income and, unlike Series returns, do not reflect any fees or expenses. |
| 5 | The 15%/40%/45% Blended Index is 15% Morgan Stanley Capital International (MSCI) All Country World Index ex U.S., 40% Russell 3000® Index, and 45% Barclays Capital U.S. Aggregate Bond Index. The MSCI All Country World Index ex U.S. is a free float-adjusted market capitalization weighted index that is designed to measure equity market performance in the global developed and emerging markets and consists of 47 developed and emerging market country indices outside the United States. The Index is denominated in U.S. Dollars. The Index returns assume daily reinvestment of gross dividends (which do not account for foreign dividend taxation) from the inception of the Series (see note 1 above) through December 31, 1998, as net returns were not available. Subsequent to December 31, 1998, the Index returns assume daily reinvestment of net dividends (thus accounting for foreign dividend taxation). The Russell 3000® Index is an unmanaged index that consists of 3,000 of the largest U.S. companies based on total market capitalization. The Index returns are based on a market capitalization weighted average of relative price changes of the component stocks plus dividends whose reinvestments are compounded daily. Both Indices’ returns, unlike Series returns, do not reflect any fees or expenses. |
| 6 | Because the Series’ asset allocation will vary over time, the composition of the Series’ portfolio may not match the composition of the comparative Indices’ portfolios. |
Shareholder Expense Example - Pro-Blend® Extended Term Series (unaudited)
As a shareholder of the Series, you may incur two types of costs: (1) transaction costs, including potential wire charges on redemptions and (2) ongoing costs, including management fees and other Series expenses. This example is intended to help you understand your ongoing costs (in dollars) of investing in the Series and to compare these costs with the ongoing costs of investing in other mutual funds.
The example is based on an investment of $1,000 invested at the beginning of the period and held for the entire period (May 1, 2010 to October 31, 2010, except for Class R Actual, which is from June 30, 2010* to October 31, 2010).
Actual Expenses
The Actual lines of the table below provide information about actual account values and actual expenses. You may use the information in these lines, together with the amount you invested, to estimate the expenses that you paid over the period. Simply divide your account value by $1,000 (for example, an $8,600 account value divided by $1,000 = 8.6), then multiply the result by the number in the Actual line for the Class in which you have invested under the heading entitled “Expenses Paid During Period” to estimate the expenses you paid on your account during this period.
Hypothetical Example for Comparison Purposes
The Hypothetical lines of the table below provide information about hypothetical account values and hypothetical expenses based on the Class’ actual expense ratio and an assumed rate of return of 5% per year before expenses, which is not the Class’ actual return. The hypothetical account values and expenses may not be used to estimate the actual ending account balance or expenses you paid during the period. You may use this information to compare the ongoing costs of investing in the Series and other funds. To do so, compare this 5% hypothetical example for the Class in which you have invested with the 5% hypothetical examples that appear in the shareholder reports of the other funds.
Please note that the expenses shown in the table are meant to highlight your ongoing costs only and do not reflect any transaction costs. Therefore, the Hypothetical lines of the table are useful in comparing ongoing costs only, and will not help you determine the relative total costs of owning different funds. In addition, if these transaction costs were included, your costs would have been higher.
| | | | | | | | | | | | | | | | |
| | | Beginning
Account Value
5/1/10* | | | Ending
Account Value
10/31/10 | | | Expenses Paid
During Period
5/1/10-10/31/10** | | | Annualized
Expense ratio | |
Class S | | | | | | | | | | | | | | | | |
Actual | | $ | 1,000.00 | | | $ | 1,039.50 | | | $ | 5.55 | | | | 1.08 | % |
Hypothetical | | | | | | | | | | | | | | | | |
(5% return before expenses) | | $ | 1,000.00 | | | $ | 1,019.76 | | | $ | 5.50 | | | | 1.08 | % |
Class I | | | | | | | | | | | | | | | | |
Actual | | $ | 1,000.00 | | | $ | 1,039.80 | | | $ | 4.32 | | | | 0.84 | % |
Hypothetical | | | | | | | | | | | | | | | | |
(5% return before expenses) | | $ | 1,000.00 | | | $ | 1,020.97 | | | $ | 4.28 | | | | 0.84 | % |
Class C | | | | | | | | | | | | | | | | |
Actual | | $ | 1,000.00 | | | $ | 1,036.20 | | | $ | 9.44 | | | | 1.84 | % |
Hypothetical | | | | | | | | | | | | | | | | |
(5% return before expenses) | | $ | 1,000.00 | | | $ | 1,015.93 | | | $ | 9.35 | | | | 1.84 | % |
Class R | | | | | | | | | | | | | | | | |
Actual | | $ | 1,000.00 | | | $ | 1,122.00 | | | $ | 4.76 | | | | 1.33 | % |
Hypothetical | | | | | | | | | | | | | | | | |
(5% return before expenses) | | $ | 1,000.00 | | | $ | 1,012.37 | | | $ | 4.51 | | | | 1.33 | % |
| * | Class R inception date was June 30, 2010. |
Shareholder Expense Example - Pro-Blend® Extended Term Series (unaudited)
| ** | Expenses are equal to the Class’ annualized expense ratio (for the six-month period), multiplied by the average account value over the period, multiplied by 184/365 to reflect the one-half year period (except for the Series’ Class R Actual return information, which reflects the 123 day period ended October 31, 2010 due to its inception date of June 30, 2010). Expenses are based on the most recent fiscal half year; therefore, the expense ratios stated above may differ from the expense ratios stated in the financial highlights, which is based on one-year data. The Class’ total return would have been lower had certain expenses not been waived during the period. |
Portfolio Composition - Pro-Blend® Extended Term Series (unaudited)
As of October 31, 2010
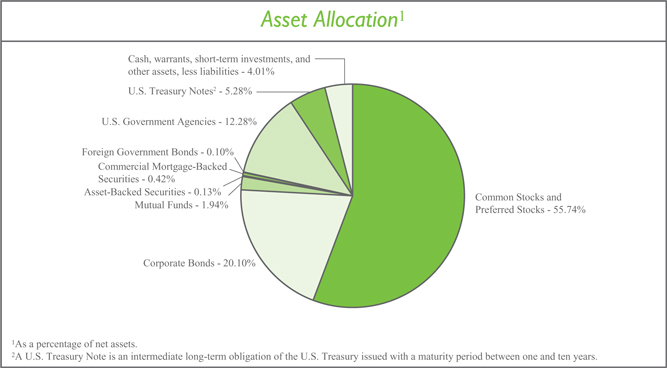
| | | | |
Sector Allocation3 | |
Information Technology | | | 15.93 | % |
Financials | | | 14.00 | % |
Industrials | | | 9.12 | % |
Consumer Discretionary | | | 8.35 | % |
Consumer Staples | | | 8.02 | % |
Energy | | | 7.53 | % |
Health Care | | | 7.41 | % |
Materials | | | 5.48 | % |
Telecommunication Services | | | 0.72 | % |
Utilities | | | 0.60 | % |
|
3 Including common stocks, preferred stocks, warrants and corporate bonds, as a percentage of total investments. | |
| | | | |
Top Ten Stock Holdings4 | |
Google, Inc. - Class A | | | 2.39 | % |
Monsanto Co. | | | 2.26 | % |
Hess Corp. | | | 1.77 | % |
Cisco Systems, Inc. | | | 1.62 | % |
Becton, Dickinson and Co. | | | 1.57 | % |
QUALCOMM, Inc. | | | 1.30 | % |
Schlumberger Ltd. | | | 1.18 | % |
The Charles Schwab Corp. | | | 1.17 | % |
Unilever plc - ADR (United Kingdom) | | | 1.17 | % |
The Western Union Co. | | | 1.17 | % |
| |
4 As a percentage of total investments. | | | | |
Investment Portfolio - October 31, 2010
| | | | | | | | |
Pro-Blend® Extended Term Series | | Shares | | | Value
(Note 2) | |
| | |
COMMON STOCKS - 55.40% | | | | | | | | |
| | |
Consumer Discretionary - 5.51% | | | | | | | | |
Auto Components - 0.04% | | | | | | | | |
Hankook Tire Co. Ltd. (South Korea)1 | | | 15,560 | | | $ | 405,290 | |
| | | | | | | | |
Automobiles - 0.10% | | | | | | | | |
Bayerische Motoren Werke AG (BMW) (Germany)1 | | | 7,480 | | | | 536,110 | |
Suzuki Motor Corp. (Japan)1 | | | 5,300 | | | | 129,355 | |
Yamaha Motor Co. Ltd. (Japan)*,1 | | | 21,000 | | | | 322,216 | |
| | | | | | | | |
| | | | | | | 987,681 | |
| | | | | | | | |
Distributors - 0.04% | | | | | | | | |
Inchcape plc (United Kingdom)*,1 | | | 70,200 | | | | 392,297 | |
| | | | | | | | |
Hotels, Restaurants & Leisure - 0.10% | | | | | | | | |
Accor S.A. (France)1 | | | 2,390 | | | | 98,081 | |
Choice Hotels International, Inc. | | | 9,670 | | | | 367,750 | |
Club Mediterranee S.A. (France)*,1 | | | 5,750 | | | | 112,567 | |
Hyatt Hotels Corp. - Class A* | | | 2,610 | | | | 105,183 | |
Wendy’s - Arby’s Group, Inc. - Class A | | | 70,260 | | | | 323,196 | |
| | | | | | | | |
| | | | | | | 1,006,777 | |
| | | | | | | | |
Household Durables - 0.20% | | | | | | | | |
Corporacion Geo S.A.B. de C.V. - Class B (Mexico)* | | | 63,860 | | | | 202,730 | |
Harman International Industries, Inc.* | | | 9,080 | | | | 304,634 | |
Lennar Corp. - Class A | | | 11,650 | | | | 169,042 | |
LG Electronics, Inc. (South Korea)1 | | | 2,710 | | | | 238,634 | |
NVR, Inc.* | | | 340 | | | | 213,319 | |
Rodobens Negocios Imobiliarios S.A. (Brazil) | | | 61,940 | | | | 641,148 | |
Tupperware Brands Corp. | | | 4,000 | | | | 179,240 | |
| | | | | | | | |
| | | | | | | 1,948,747 | |
| | | | | | | | |
Leisure Equipment & Products - 0.01% | | | | | | | | |
Sankyo Co. Ltd. (Japan)1 | | | 1,400 | | | | 74,591 | |
| | | | | | | | |
Media - 3.58% | | | | | | | | |
Gestevision Telecinco S.A. (Spain)1 | | | 52,000 | | | | 663,562 | |
Grupo Televisa S.A. - ADR (Mexico) | | | 17,800 | | | | 399,610 | |
Imax Corp. (Canada)* | | | 19,350 | | | | 418,928 | |
Liberty Global, Inc. - Class A* | | | 34,620 | | | | 1,308,290 | |
Mediacom Communications Corp. - Class A* | | | 25,970 | | | | 179,193 | |
Mediaset S.p.A. (Italy)1 | | | 16,470 | | | | 121,601 | |
Reed Elsevier plc (United Kingdom)1 | | | 30,540 | | | | 262,014 | |
Reed Elsevier plc - ADR (United Kingdom) | | | 7,379 | | | | 253,173 | |
Societe Television Francaise 1 (France)1 | | | 41,890 | | | | 686,582 | |
Time Warner, Inc. | | | 309,160 | | | | 10,050,792 | |
Virgin Media, Inc. (United Kingdom) | | | 416,010 | | | | 10,579,134 | |
The Walt Disney Co. | | | 277,960 | | | | 10,037,136 | |
| | |
| 83 | | The accompanying notes are an integral part of the financial statements. |
Investment Portfolio - October 31, 2010
| | | | | | | | |
Pro-Blend® Extended Term Series | | Shares | | | Value
(Note 2) | |
| | |
COMMON STOCKS (continued) | | | | | | | | |
| | |
Consumer Discretionary (continued) | | | | | | | | |
Media (continued) | | | | | | | | |
Wolters Kluwer N.V. (Netherlands)1 | | | 9,795 | | | $ | 223,276 | |
| | | | | | | | |
| | | | | | | 35,183,291 | |
| | | | | | | | |
Multiline Retail - 0.09% | | | | | | | | |
Marks & Spencer Group plc (United Kingdom)1 | | | 52,450 | | | | 359,460 | |
Nordstrom, Inc. | | | 3,210 | | | | 123,617 | |
PPR (France)1 | | | 2,230 | | | | 366,776 | |
| | | | | | | | |
| | | | | | | 849,853 | |
| | | | | | | | |
Specialty Retail - 1.31% | | | | | | | | |
Chico’s FAS, Inc. | | | 16,900 | | | | 164,268 | |
Dick’s Sporting Goods, Inc.* | | | 14,770 | | | | 425,671 | |
The Finish Line, Inc. - Class A | | | 12,670 | | | | 193,851 | |
The Home Depot, Inc. | | | 231,260 | | | | 7,141,309 | |
KOMERI Co. Ltd. (Japan)1 | | | 3,900 | | | | 81,010 | |
Lumber Liquidators Holdings, Inc.* | | | 8,770 | | | | 211,182 | |
The Sherwin-Williams Co. | | | 64,370 | | | | 4,697,079 | |
| | | | | | | | |
| | | | | | | 12,914,370 | |
| | | | | | | | |
Textiles, Apparel & Luxury Goods - 0.04% | | | | | | | | |
Adidas AG (Germany)1 | | | 3,760 | | | | 244,897 | |
Skechers U.S.A., Inc. - Class A* | | | 9,070 | | | | 176,321 | |
| | | | | | | | |
| | | | | | | 421,218 | |
| | | | | | | | |
Total Consumer Discretionary | | | | | | | 54,184,115 | |
| | | | | | | | |
Consumer Staples - 7.07% | | | | | | | | |
Beverages - 1.18% | | | | | | | | |
The Coca-Cola Co. | | | 172,740 | | | | 10,592,417 | |
Diageo plc (United Kingdom)1 | | | 13,175 | | | | 243,048 | |
Heineken N.V. (Netherlands)1 | | | 10,280 | | | | 521,867 | |
Kirin Holdings Co. Ltd. (Japan)1 | | | 17,000 | | | | 232,963 | |
| | | | | | | | |
| | | | | | | 11,590,295 | |
| | | | | | | | |
Food & Staples Retailing - 1.79% | | | | | | | | |
BJ’s Wholesale Club, Inc.* | | | 6,010 | | | | 250,797 | |
Carrefour S.A. (France)1 | | | 29,020 | | | | 1,571,247 | |
Casino Guichard - Perrachon S.A. (France)1 | | | 2,670 | | | | 251,197 | |
The Kroger Co. | | | 314,690 | | | | 6,923,180 | |
Safeway, Inc. | | | 320,190 | | | | 7,332,351 | |
SUPERVALU, Inc. | | | 20,170 | | | | 217,634 | |
Tesco plc (United Kingdom)1 | | | 158,400 | | | | 1,084,036 | |
| | | | | | | | |
| | | | | | | 17,630,442 | |
| | | | | | | | |
| | | | |
| The accompanying notes are an integral part of the financial statements. | | | 84 | |
Investment Portfolio - October 31, 2010
| | | | | | | | |
Pro-Blend® Extended Term Series | | Shares | | | Value
(Note 2) | |
| | |
COMMON STOCKS (continued) | | | | | | | | |
| | |
Consumer Staples (continued) | | | | | | | | |
Food Products - 4.01% | | | | | | | | |
Diamond Foods, Inc. | | | 4,340 | | | $ | 191,828 | |
Flowers Foods, Inc. | | | 14,880 | | | | 379,142 | |
General Mills, Inc. | | | 112,140 | | | | 4,209,736 | |
Kellogg Co. | | | 64,340 | | | | 3,233,728 | |
Kraft Foods, Inc. - Class A | | | 317,560 | | | | 10,247,661 | |
Nestle S.A. (Switzerland)1 | | | 174,070 | | | | 9,534,596 | |
Sanderson Farms, Inc. | | | 4,630 | | | | 194,367 | |
Suedzucker AG (Germany)1 | | | 7,300 | | | | 172,360 | |
Unilever plc - ADR (United Kingdom) | | | 390,335 | | | | 11,327,522 | |
| | | | | | | | |
| | | | | | | 39,490,940 | |
| | | | | | | | |
Household Products - 0.04% | | | | | | | | |
Reckitt Benckiser Group plc (United Kingdom)1 | | | 7,195 | | | | 401,976 | |
| | | | | | | | |
Personal Products - 0.05% | | | | | | | | |
Alberto-Culver Co. | | | 7,290 | | | | 271,844 | |
Beiersdorf AG (Germany)1 | | | 2,630 | | | | 171,346 | |
Kao Corp. (Japan)1 | | | 3,000 | | | | 76,251 | |
| | | | | | | | |
| | | | | | | 519,441 | |
| | | | | | | | |
Total Consumer Staples | | | | | | | 69,633,094 | |
| | | | | | | | |
Energy - 5.63% | | | | | | | | |
Energy Equipment & Services - 3.63% | | | | | | | | |
Baker Hughes, Inc. | | | 236,290 | | | | 10,947,316 | |
Calfrac Well Services Ltd. (Canada) | | | 22,540 | | | | 566,649 | |
Compagnie Generale de Geophysique - Veritas (CGG - Veritas) (France)*,1 | | | 20,185 | | | | 471,498 | |
Dril-Quip, Inc.* | | | 5,280 | | | | 364,848 | |
Schlumberger Ltd. | | | 162,840 | | | | 11,380,887 | |
Trican Well Service Ltd. (Canada) | | | 50,350 | | | | 872,819 | �� |
Weatherford International Ltd. (Switzerland)* | | | 662,300 | | | | 11,133,263 | |
| | | | | | | | |
| | | | | | | 35,737,280 | |
| | | | | | | | |
Oil, Gas & Consumable Fuels - 2.00% | | | | | | | | |
Cameco Corp. (Canada) | | | 11,000 | | | | 340,560 | |
Forest Oil Corp.* | | | 4,110 | | | | 126,301 | |
Hess Corp. | | | 271,030 | | | | 17,083,021 | |
Mariner Energy, Inc.* | | | 6,409 | | | | 159,712 | |
Paladin Energy Ltd. (Australia)* | | | 94,970 | | | | 385,504 | |
Repsol YPF S.A. (Spain)1 | | | 6,190 | | | | 171,652 | |
Royal Dutch Shell plc - Class B (Netherlands)1 | | | 7,169 | | | | 229,421 | |
Royal Dutch Shell plc - Class B - ADR (Netherlands) | | | 8,110 | | | | 521,635 | |
Talisman Energy, Inc. (Canada) | | | 24,520 | | | | 444,529 | |
| | |
| 85 | | The accompanying notes are an integral part of the financial statements. |
Investment Portfolio - October 31, 2010
| | | | | | | | |
Pro-Blend® Extended Term Series | | Shares | | | Value
(Note 2) | |
| | |
COMMON STOCKS (continued) | | | | | | | | |
| | |
Energy (continued) | | | | | | | | |
Oil, Gas & Consumable Fuels (continued) | | | | | | | | |
Total S.A. (France)1 | | | 4,390 | | | $ | 238,966 | |
| | | | | | | | |
| | | | | | | 19,701,301 | |
| | | | | | | | |
Total Energy | | | | | | | 55,438,581 | |
| | | | | | | | |
Financials - 6.06% | | | | | | | | |
Capital Markets - 2.35% | | | | | | | | |
The Bank of New York Mellon Corp.2 | | | 368,110 | | | | 9,224,837 | |
The Charles Schwab Corp. | | | 736,070 | | | | 11,335,478 | |
Credit Suisse Group AG - ADR (Switzerland) | | | 3,190 | | | | 132,385 | |
Daiwa Securities Group, Inc. (Japan)1 | | | 6,000 | | | | 24,463 | |
Evercore Partners, Inc. - Class A | | | 6,150 | | | | 186,714 | |
Financial Engines, Inc.* | | | 10,890 | | | | 160,410 | |
GAM Holding AG (Switzerland)*,1 | | | 36,530 | | | | 577,135 | |
The Goldman Sachs Group, Inc. | | | 2,310 | | | | 371,794 | |
Greenhill & Co., Inc. | | | 2,140 | | | | 166,214 | |
Lazard Ltd. - Class A (Bermuda) | | | 4,820 | | | | 177,858 | |
Northern Trust Corp. | | | 4,930 | | | | 244,676 | |
State Street Corp. | | | 13,290 | | | | 554,990 | |
| | | | | | | | |
| | | | | | | 23,156,954 | |
| | | | | | | | |
Commercial Banks - 0.42% | | | | | | | | |
Banco Santander S.A. (Spain)1 | | | 17,110 | | | | 219,617 | |
Banco Santander S.A. - ADR (Spain) | | | 41,850 | | | | 536,098 | |
Barclays plc - ADR (United Kingdom) | | | 6,940 | | | | 122,491 | |
BNP Paribas (France)1 | | | 2,320 | | | | 169,699 | |
The Chugoku Bank Ltd. (Japan)1 | | | 10,000 | | | | 115,992 | |
Credit Agricole S.A. (France)1 | | | 3,800 | | | | 62,323 | |
First Commonwealth Financial Corp. | | | 110,670 | | | | 644,099 | |
First Financial Bancorp | | | 19,050 | | | | 320,802 | |
The Hachijuni Bank Ltd. (Japan)1 | | | 18,000 | | | | 92,370 | |
HSBC Holdings plc (United Kingdom)1 | | | 23,090 | | | | 240,314 | |
HSBC Holdings plc - ADR (United Kingdom) | | | 8,962 | | | | 467,010 | |
ICICI Bank Ltd. - ADR (India) | | | 4,820 | | | | 253,436 | |
Mitsubishi UFJ Financial Group, Inc. (Japan)1 | | | 12,000 | | | | 55,692 | |
Societe Generale - ADR (France)3 | | | 12,410 | | | | 148,051 | |
The Sumitomo Trust & Banking Co. Ltd. (Japan)1 | | | 18,000 | | | | 98,276 | |
U.S. Bancorp | | | 22,250 | | | | 538,005 | |
| | | | | | | | |
| | | | | | | 4,084,275 | |
| | | | | | | | |
Consumer Finance - 1.15% | | | | | | | | |
American Express Co. | | | 269,340 | | | | 11,166,836 | |
Discover Financial Services | | | 9,720 | | | | 171,558 | |
| | | | | | | | |
| | | | | | | 11,338,394 | |
| | | | | | | | |
| | | | |
| The accompanying notes are an integral part of the financial statements. | | | 86 | |
Investment Portfolio - October 31, 2010
| | | | | | | | |
Pro-Blend® Extended Term Series | | Shares | | | Value
(Note 2) | |
| | |
COMMON STOCKS (continued) | | | | | | | | |
| | |
Financials (continued) | | | | | | | | |
Diversified Financial Services - 0.27% | | | | | | | | |
Bank of America Corp. | | | 11,390 | | | $ | 130,302 | |
Deutsche Boerse AG (Germany)1 | | | 11,140 | | | | 783,686 | |
Financiere Marc de Lacharriere S.A. (Fimalac) (France)1 | | | 6,420 | | | | 276,290 | |
ING Groep N.V. (Netherlands)*,1 | | | 4,650 | | | | 49,749 | |
JPMorgan Chase & Co. | | | 17,065 | | | | 642,156 | |
Moody’s Corp. | | | 28,320 | | | | 766,339 | |
| | | | | | | | |
| | | | | | | 2,648,522 | |
| | | | | | | | |
Insurance - 0.61% | | | | | | | | |
Allianz SE (Germany)1 | | | 11,530 | | | | 1,443,877 | |
The Allstate Corp. | | | 16,100 | | | | 490,889 | |
Amil Participacoes S.A. (Brazil) | | | 40,950 | | | | 416,653 | |
AXA S.A. (France)1 | | | 4,550 | | | | 82,978 | |
Brown & Brown, Inc. | | | 21,570 | | | | 480,795 | |
Mapfre S.A. (Spain)1 | | | 99,000 | | | | 328,974 | |
Muenchener Rueckversicherungs AG (MunichRe) (Germany)1 | | | 3,955 | | | | 618,169 | |
The Progressive Corp. | | | 33,500 | | | | 708,860 | |
Willis Group Holdings plc (United Kingdom) | | | 21,475 | | | | 682,905 | |
Zurich Financial Services AG (Switzerland)1 | | | 2,910 | | | | 712,128 | |
| | | | | | | | |
| | | | | | | 5,966,228 | |
| | | | | | | | |
Real Estate Investment Trusts (REITS) - 1.10% | | | | | | | | |
Acadia Realty Trust | | | 8,710 | | | | 166,187 | |
Alexandria Real Estate Equities, Inc. | | | 3,650 | | | | 268,202 | |
Alstria Office REIT AG (Germany)1 | | | 30,620 | | | | 426,598 | |
American Campus Communities, Inc. | | | 13,440 | | | | 425,107 | |
Apartment Investment & Management Co. - Class A | | | 14,030 | | | | 327,039 | |
Associated Estates Realty Corp. | | | 6,030 | | | | 83,757 | |
AvalonBay Communities, Inc. | | | 2,810 | | | | 298,731 | |
BioMed Realty Trust, Inc. | | | 25,090 | | | | 460,401 | |
Boston Properties, Inc. | | | 5,250 | | | | 452,497 | |
British Land Co. plc (United Kingdom)1 | | | 11,340 | | | | 92,585 | |
Camden Property Trust | | | 5,380 | | | | 266,794 | |
Cogdell Spencer, Inc. | | | 32,400 | | | | 212,868 | |
Corporate Office Properties Trust | | | 26,930 | | | | 955,746 | |
DiamondRock Hospitality Co.* | | | 7,400 | | | | 78,292 | |
Digital Realty Trust, Inc. | | | 4,280 | | | | 255,644 | |
Douglas Emmett, Inc. | | | 8,620 | | | | 154,643 | |
DuPont Fabros Technology, Inc. | | | 19,140 | | | | 480,414 | |
Equity Lifestyle Properties, Inc. | | | 4,240 | | | | 241,341 | |
Equity One, Inc. | | | 5,040 | | | | 94,248 | |
Equity Residential | | | 5,270 | | | | 256,280 | |
HCP, Inc. | | | 6,890 | | | | 248,109 | |
| | |
| 87 | | The accompanying notes are an integral part of the financial statements. |
Investment Portfolio - October 31, 2010
| | | | | | | | |
Pro-Blend® Extended Term Series | | Shares | | | Value
(Note 2) | |
| | |
COMMON STOCKS (continued) | | | | | | | | |
| | |
Financials (continued) | | | | | | | | |
Real Estate Investment Trusts (REITS) (continued) | | | | | | | | |
Health Care REIT, Inc. | | | 4,350 | | | $ | 222,285 | |
Healthcare Realty Trust, Inc. | | | 9,360 | | | | 225,950 | |
Home Properties, Inc. | | | 7,950 | | | | 432,878 | |
Host Hotels & Resorts, Inc. | | | 19,494 | | | | 309,760 | |
LaSalle Hotel Properties | | | 11,380 | | | | 269,592 | |
Lexington Realty Trust | | | 11,180 | | | | 86,980 | |
Mack-Cali Realty Corp. | | | 3,020 | | | | 101,412 | |
Mid-America Apartment Communities, Inc. | | | 5,683 | | | | 346,833 | |
National Health Investors, Inc. | | | 1,960 | | | | 90,748 | |
National Retail Properties, Inc. | | | 10,000 | | | | 271,000 | |
Omega Healthcare Investors, Inc. | | | 12,490 | | | | 287,270 | |
Pebblebrook Hotel Trust* | | | 13,740 | | | | 269,167 | |
Public Storage | | | 2,580 | | | | 255,988 | |
Realty Income Corp. | | | 13,800 | | | | 473,064 | |
Simon Property Group, Inc. | | | 2,866 | | | | 275,193 | |
Sovran Self Storage, Inc. | | | 3,330 | | | | 130,103 | |
Tanger Factory Outlet Centers | | | 5,360 | | | | 256,851 | |
UDR, Inc. | | | 12,910 | | | | 290,217 | |
| | | | | | | | |
| | | | | | | 10,840,774 | |
| | | | | | | | |
Real Estate Management & Development - 0.02% | | | | | | | | |
CB Richard Ellis Group, Inc. - Class A* | | | 5,210 | | | | 95,604 | |
Renhe Commercial Holdings Co. Ltd. (China)1 | | | 211,000 | | | | 40,360 | |
Thomas Properties Group, Inc.* | | | 12,980 | | | | 48,545 | |
| | | | | | | | |
| | | | | | | 184,509 | |
| | | | | | | | |
Thrifts & Mortgage Finance - 0.14% | | | | | | | | |
Aareal Bank AG (Germany)*,1 | | | 11,235 | | | | 274,293 | |
First Niagara Financial Group, Inc. | | | 57,350 | | | | 679,598 | |
Hudson City Bancorp, Inc. | | | 12,000 | | | | 139,800 | |
People’s United Financial, Inc. | | | 25,820 | | | | 317,844 | |
| | | | | | | | |
| | | | | | | 1,411,535 | |
| | | | | | | | |
Total Financials | | | | | | | 59,631,191 | |
| | | | | | | | |
Health Care - 6.28% | | | | | | | | |
Biotechnology - 0.37% | | | | | | | | |
Acorda Therapeutics, Inc.* | | | 13,330 | | | | 360,443 | |
Amgen, Inc.* | | | 16,630 | | | | 951,070 | |
Basilea Pharmaceutica AG (Switzerland)*,1 | | | 9,140 | | | | 641,174 | |
Celera Corp.* | | | 232,090 | | | | 1,322,913 | |
Cepheid, Inc.* | | | 19,030 | | | | 400,391 | |
| | | | | | | | |
| | | | | | | 3,675,991 | |
| | | | | | | | |
| | | | |
| The accompanying notes are an integral part of the financial statements. | | | 88 | |
Investment Portfolio - October 31, 2010
| | | | | | | | |
Pro-Blend® Extended Term Series | | Shares | | | Value
(Note 2) | |
| | |
COMMON STOCKS (continued) | | | | | | | | |
| | |
Health Care (continued) | | | | | | | | |
Health Care Equipment & Supplies - 4.10% | | | | | | | | |
Abaxis, Inc.* | | | 25,780 | | | $ | 618,978 | |
Alere, Inc.* | | | 60,800 | | | | 1,796,640 | |
Becton, Dickinson and Co. | | | 200,960 | | | | 15,176,499 | |
Boston Scientific Corp.* | | | 1,607,450 | | | | 10,255,531 | |
Cochlear Ltd. (Australia)1 | | | 20,560 | | | | 1,432,233 | |
Conceptus, Inc.* | | | 46,290 | | | | 657,781 | |
Covidien plc (Ireland) | | | 34,780 | | | | 1,386,679 | |
DENTSPLY International, Inc. | | | 35,030 | | | | 1,099,592 | |
DexCom, Inc.* | | | 66,455 | | | | 913,756 | |
Gen-Probe, Inc.* | | | 29,300 | | | | 1,418,999 | |
Hologic, Inc.* | | | 33,550 | | | | 537,471 | |
Insulet Corp.* | | | 65,670 | | | | 1,047,436 | |
Mindray Medical International Ltd. - ADR (China) | | | 3,740 | | | | 108,385 | |
Sirona Dental Systems, Inc.* | | | 16,780 | | | | 631,767 | |
Straumann Holding AG (Switzerland)1 | | | 6,235 | | | | 1,305,299 | |
Zoll Medical Corp.* | | | 58,920 | | | | 1,916,668 | |
| | | | | | | | |
| | | | | | | 40,303,714 | |
| | | | | | | | |
Health Care Providers & Services - 0.59% | | | | | | | | |
Bio-Reference Laboratories, Inc.* | | | 33,410 | | | | 720,319 | |
Bumrungrad Hospital Public Co. Ltd. - NVDR (Thailand)1 | | | 125,000 | | | | 143,794 | |
Cross Country Healthcare, Inc.* | | | 87,140 | | | | 636,122 | |
Diagnosticos da America S.A. (Brazil) | | | 144,130 | | | | 1,750,447 | |
Odontoprev S.A. (Brazil) | | | 48,080 | | | | 706,934 | |
Sonic Healthcare Ltd. (Australia)1 | | | 177,490 | | | | 1,893,648 | |
| | | | | | | | |
| | | | | | | 5,851,264 | |
| | | | | | | | |
Health Care Technology - 0.56% | | | | | | | | |
Allscripts Healthcare Solutions, Inc.* | | | 31,520 | | | | 601,717 | |
Cerner Corp.* | | | 55,423 | | | | 4,867,802 | |
| | | | | | | | |
| | | | | | | 5,469,519 | |
| | | | | | | | |
Life Sciences Tools & Services - 0.30% | | | | | | | | |
Caliper Life Sciences, Inc.* | | | 258,184 | | | | 1,161,828 | |
Lonza Group AG (Switzerland)1 | | | 9,570 | | | | 837,784 | |
Sequenom, Inc.* | | | 150,790 | | | | 957,516 | |
| | | | | | | | |
| | | | | | | 2,957,128 | |
| | | | | | | | |
Pharmaceuticals - 0.36% | | | | | | | | |
AstraZeneca plc (United Kingdom)1 | | | 2,540 | | | | 127,767 | |
AstraZeneca plc - ADR (United Kingdom) | | | 3,795 | | | | 191,496 | |
Bayer AG (Germany)1 | | | 13,685 | | | | 1,020,729 | |
GlaxoSmithKline plc (United Kingdom)1 | | | 16,925 | | | | 330,505 | |
Sanofi-Aventis S.A. (France)1 | | | 2,170 | | | | 152,035 | |
| | |
| 89 | | The accompanying notes are an integral part of the financial statements. |
Investment Portfolio - October 31, 2010
| | | | | | | | |
Pro-Blend® Extended Term Series | | Shares | | | Value
(Note 2) | |
| | |
COMMON STOCKS (continued) | | | | | | | | |
| | |
Health Care (continued) | | | | | | | | |
Pharmaceuticals (continued) | | | | | | | | |
Santen Pharmaceutical Co. Ltd. (Japan)1 | | | 4,800 | | | $ | 165,404 | |
Shire plc (Ireland)1 | | | 18,025 | | | | 422,997 | |
Takeda Pharmaceutical Co. Ltd. (Japan)1 | | | 3,000 | | | | 140,629 | |
UCB S.A. (Belgium)1 | | | 26,170 | | | | 1,015,187 | |
| | | | | | | | |
| | | | | | | 3,566,749 | |
| | | | | | | | |
Total Health Care | | | | | | | 61,824,365 | |
| | | | | | | | |
Industrials - 5.89% | | | | | | | | |
Aerospace & Defense - 1.01% | | | | | | | | |
The Boeing Co. | | | 137,400 | | | | 9,705,936 | |
Empresa Brasileira de Aeronautica S.A. (Embraer) - ADR (Brazil) | | | 8,120 | | | | 234,262 | |
| | | | | | | | |
| | | | | | | 9,940,198 | |
| | | | | | | | |
Air Freight & Logistics - 2.23% | | | | | | | | |
Atlas Air Worldwide Holdings, Inc.* | | | 5,440 | | | | 284,294 | |
FedEx Corp. | | | 111,070 | | | | 9,743,061 | |
TNT N.V. (Netherlands)1 | | | 24,200 | | | | 643,579 | |
United Parcel Service, Inc. - Class B | | | 167,165 | | | | 11,256,891 | |
| | | | | | | | |
| | | | | | | 21,927,825 | |
| | | | | | | | |
Airlines - 1.16% | | | | | | | | |
Copa Holdings S.A. - Class A (Panama) | | | 4,590 | | | | 232,851 | |
Deutsche Lufthansa AG (Germany)*,1 | | | 19,235 | | | | 411,197 | |
Ryanair Holdings plc - ADR (Ireland) | | | 17,990 | | | | 587,013 | |
Southwest Airlines Co. | | | 739,470 | | | | 10,175,107 | |
| | | | | | | | |
| | | | | | | 11,406,168 | |
| | | | | | | | |
Commercial Services & Supplies - 0.13% | | | | | | | | |
Tomra Systems ASA (Norway)1 | | | 213,010 | | | | 1,298,015 | |
| | | | | | | | |
Construction & Engineering - 0.02% | | | | | | | | |
MYR Group, Inc.* | | | 9,380 | | | | 146,234 | |
| | | | | | | | |
Electrical Equipment - 0.19% | | | | | | | | |
ABB Ltd. (Asea Brown Boveri) - ADR (Switzerland)* | | | 40,520 | | | | 838,359 | |
Alstom S.A. (France)1 | | | 11,070 | | | | 559,058 | |
Nexans S.A. (France)1 | | | 2,900 | | | | 206,848 | |
Schneider Electric S.A. (France)1 | | | 2,140 | | | | 304,055 | |
| | | | | | | | |
| | | | | | | 1,908,320 | |
| | | | | | | | |
Industrial Conglomerates - 0.16% | | | | | | | | |
Siemens AG (Germany)1 | | | 13,350 | | | | 1,523,441 | |
| | | | | | | | |
Machinery - 0.24% | | | | | | | | |
ArvinMeritor, Inc.* | | | 10,550 | | | | 174,919 | |
Astec Industries, Inc.* | | | 5,360 | | | | 157,959 | |
| | | | |
| The accompanying notes are an integral part of the financial statements. | | | 90 | |
Investment Portfolio - October 31, 2010
| | | | | | | | |
Pro-Blend® Extended Term Series | | Shares | | | Value
(Note 2) | |
| | |
COMMON STOCKS (continued) | | | | | | | | |
| | |
Industrials (continued) | | | | | | | | |
Machinery (continued) | | | | | | | | |
FANUC Ltd. (Japan)1 | | | 7,000 | | | $ | 1,013,388 | |
Lindsay Corp. | | | 4,220 | | | | 243,283 | |
SmartHeat, Inc. (China)* | | | 8,230 | | | | 53,413 | |
Titan International, Inc. | | | 20,920 | | | | 317,356 | |
Wabtec Corp. | | | 5,710 | | | | 267,456 | |
Westport Innovations, Inc. (Canada)* | | | 9,690 | | | | 175,583 | |
| | | | | | | | |
| | | | | | | 2,403,357 | |
| | | | | | | | |
Professional Services - 0.41% | | | | | | | | |
Manpower, Inc. | | | 71,562 | | | | 3,916,588 | |
Randstad Holding N.V. (Netherlands)*,1 | | | 3,260 | | | | 155,303 | |
| | | | | | | | |
| | | | | | | 4,071,891 | |
| | | | | | | | |
Road & Rail - 0.30% | | | | | | | | |
All America Latina Logistica S.A. (Brazil) | | | 88,020 | | | | 832,419 | |
Canadian National Railway Co. (Canada) | | | 1,650 | | | | 106,887 | |
Heartland Express, Inc. | | | 20,800 | | | | 310,128 | |
Knight Transportation, Inc. | | | 13,010 | | | | 232,489 | |
Norfolk Southern Corp. | | | 17,270 | | | | 1,061,932 | |
RailAmerica, Inc.* | | | 36,120 | | | | 418,992 | |
| | | | | | | | |
| | | | | | | 2,962,847 | |
| | | | | | | | |
Transportation Infrastructure - 0.04% | | | | | | | | |
Malaysia Airports Holdings Berhad (Malaysia)1 | | | 209,870 | | | | 409,684 | |
| | | | | | | | |
Total Industrials | | | | | | | 57,997,980 | |
| | | | | | | | |
Information Technology - 14.85% | | | | | | | | |
Communications Equipment - 3.83% | | | | | | | | |
Alcatel-Lucent - ADR (France)* | | | 310,710 | | | | 1,078,164 | |
Cisco Systems, Inc.* | | | 686,230 | | | | 15,666,631 | |
Infinera Corp.* | | | 111,390 | | | | 912,284 | |
Juniper Networks, Inc.* | | | 197,900 | | | | 6,409,981 | |
QUALCOMM, Inc. | | | 279,300 | | | | 12,604,809 | |
Riverbed Technology, Inc.* | | | 17,740 | | | | 1,020,760 | |
| | | | | | | | |
| | | | | | | 37,692,629 | |
| | | | | | | | |
Computers & Peripherals - 1.19% | | | | | | | | |
Apple, Inc.* | | | 1,450 | | | | 436,261 | |
Compellent Technologies, Inc.* | | | 34,470 | | | | 871,057 | |
EMC Corp.* | | | 484,360 | | | | 10,176,404 | |
Immersion Corp.* | | | 31,440 | | | | 193,356 | |
| | | | | | | | |
| | | | | | | 11,677,078 | |
| | | | | | | | |
Electronic Equipment, Instruments & Components - 0.51% | | | | | | | | |
Amphenol Corp. - Class A | | | 60,930 | | | | 3,054,421 | |
| | |
| 91 | | The accompanying notes are an integral part of the financial statements. |
Investment Portfolio - October 31, 2010
| | | | | | | | |
Pro-Blend® Extended Term Series | | Shares | | | Value
(Note 2) | |
| | |
COMMON STOCKS (continued) | | | | | | | | |
| | |
Information Technology (continued) | | | | | | | | |
Electronic Equipment, Instruments & Components (continued) | | | | | | | | |
Cogent, Inc.* | | | 92,580 | | | $ | 973,942 | |
Hitachi Ltd. (Japan)1 | | | 70,000 | | | | 316,375 | |
Keyence Corp. (Japan)1 | | | 563 | | | | 139,485 | |
LoJack Corp.* | | | 104,135 | | | | 509,220 | |
| | | | | | | | |
| | | | | | | 4,993,443 | |
| | | | | | | | |
Internet Software & Services - 2.63% | | | | | | | | |
comScore, Inc.* | | | 23,000 | | | | 540,730 | |
Google, Inc. - Class A* | | | 37,800 | | | | 23,171,022 | |
NetEase.com, Inc. - ADR (China)* | | | 4,750 | | | | 198,550 | |
Tencent Holdings Ltd. (China)1 | | | 10,800 | | | | 248,264 | |
VistaPrint N.V. (Netherlands)* | | | 24,930 | | | | 1,048,805 | |
Vocus, Inc.* | | | 30,950 | | | | 685,542 | |
| | | | | | | | |
| | | | | | | 25,892,913 | |
| | | | | | | | |
IT Services - 4.37% | | | | | | | | |
Accenture plc - Class A (Ireland) | | | 22,530 | | | | 1,007,316 | |
Amadeus IT Holding S.A. - Class A (Spain)*,1 | | | 20,410 | | | | 416,459 | |
Amdocs Ltd. (Guernsey)* | | | 57,810 | | | | 1,773,611 | |
Automatic Data Processing, Inc. | | | 229,324 | | | | 10,186,572 | |
Cap Gemini S.A. (France)1 | | | 15,400 | | | | 786,147 | |
Cielo S.A. (Brazil) | | | 76,090 | | | | 655,601 | |
MasterCard, Inc. - Class A | | | 45,410 | | | | 10,901,125 | |
Redecard S.A. (Brazil) | | | 44,820 | | | | 579,657 | |
Visa, Inc. - Class A | | | 69,200 | | | | 5,409,364 | |
The Western Union Co. | | | 641,240 | | | | 11,285,824 | |
| | | | | | | | |
| | | | | | | 43,001,676 | |
| | | | | | | | |
Semiconductors & Semiconductor Equipment - 0.33% | | | | | | | | |
Advantest Corp. (Japan)1 | | | 44,200 | | | | 839,514 | |
Infineon Technologies AG (Germany)*,1 | | | 79,000 | | | | 621,508 | |
Sumco Corp. (Japan)*,1 | | | 53,300 | | | | 824,214 | |
Taiwan Semiconductor Manufacturing Co. Ltd. - ADR (Taiwan) | | | 21,672 | | | | 236,442 | |
Tokyo Electron Ltd. (Japan)1 | | | 12,000 | | | | 677,080 | |
Yingli Green Energy Holding Co. Ltd. - ADR (China)* | | | 8,300 | | | | 96,778 | |
| | | | | | | | |
| | | | | | | 3,295,536 | |
| | | | | | | | |
Software - 1.99% | | | | | | | | |
Adobe Systems, Inc.* | | | 5,750 | | | | 161,862 | |
Autodesk, Inc.* | | | 265,455 | | | | 9,604,162 | |
Electronic Arts, Inc.* | | | 468,890 | | | | 7,431,907 | |
Fortinet, Inc.* | | | 26,930 | | | | 807,900 | |
Misys plc (United Kingdom)*,1 | | | 45,530 | | | | 204,998 | |
SAP AG (Germany)1 | | | 6,340 | | | | 330,309 | |
| | | | |
| The accompanying notes are an integral part of the financial statements. | | | 92 | |
Investment Portfolio - October 31, 2010
| | | | | | | | |
Pro-Blend® Extended Term Series | | Shares | | | Value
(Note 2) | |
| | |
COMMON STOCKS (continued) | | | | | | | | |
| | |
Information Technology (continued) | | | | | | | | |
Software (continued) | | | | | | | | |
SolarWinds, Inc.* | | | 45,000 | | | $ | 816,750 | |
Square Enix Holdings Co. Ltd. (Japan)1 | | | 11,600 | | | | 242,269 | |
| | | | | | | | |
| | | | | | | 19,600,157 | |
| | | | | | | | |
Total Information Technology | | | | | | | 146,153,432 | |
| | | | | | | | |
Materials - 3.84% | | | | | | | | |
Chemicals - 2.38% | | | | | | | | |
Arkema S.A. (France)1 | | | 67 | | | | 4,329 | |
BASF SE (Germany)1 | | | 5,500 | | | | 399,915 | |
Calgon Carbon Corp.* | | | 22,965 | | | | 344,705 | |
Johnson Matthey plc (United Kingdom)1 | | | 8,530 | | | | 261,589 | |
Monsanto Co. | | | 368,020 | | | | 21,867,748 | |
The Scotts Miracle-Gro Co. - Class A | | | 2,670 | | | | 142,578 | |
Shin-Etsu Chemical Co. Ltd. (Japan)1 | | | 7,300 | | | | 369,132 | |
| | | | | | | | |
| | | | | | | 23,389,996 | |
| | | | | | | | |
Construction Materials - 1.01% | | | | | | | | |
CRH plc (Ireland)1 | | | 28,130 | | | | 485,407 | |
Eagle Materials, Inc. | | | 9,130 | | | | 214,190 | |
Martin Marietta Materials, Inc. | | | 61,830 | | | | 4,976,078 | |
Vulcan Materials Co. | | | 117,520 | | | | 4,290,655 | |
| | | | | | | | |
| | | | | | | 9,966,330 | |
| | | | | | | | |
Containers & Packaging - 0.44% | | | | | | | | |
Owens-Illinois, Inc.* | | | 156,450 | | | | 4,385,294 | |
| | | | | | | | |
Paper & Forest Products - 0.01% | | | | | | | | |
Norbord, Inc. (Canada)* | | | 4,854 | | | | 55,398 | |
| | | | | | | | |
Total Materials | | | | | | | 37,797,018 | |
| | | | | | | | |
Telecommunication Services - 0.14% | | | | | | | | |
Diversified Telecommunication Services - 0.08% | | | | | | | | |
France Telecom S.A. (France)1 | | | 15,090 | | | | 362,058 | |
Swisscom AG - ADR (Switzerland)3 | | | 9,800 | | | | 407,974 | |
| | | | | | | | |
| | | | | | | 770,032 | |
| | | | | | | | |
Wireless Telecommunication Services - 0.06% | | | | | | | | |
SK Telecom Co. Ltd. - ADR (South Korea) | | | 31,600 | | | | 582,388 | |
| | | | | | | | |
Total Telecommunication Services | | | | | | | 1,352,420 | |
| | | | | | | | |
Utilities - 0.13% | | | | | | | | |
Electric Utilities - 0.06% | | | | | | | | |
E.ON AG (Germany)1 | | | 15,180 | | | | 475,141 | |
Prime Infrastructure Group (Australia)1 | | | 20,160 | | | | 98,458 | |
| | | | | | | | |
| | | | | | | 573,599 | |
| | | | | | | | |
| | |
| 93 | | The accompanying notes are an integral part of the financial statements. |
Investment Portfolio - October 31, 2010
| | | | | | | | |
Pro-Blend® Extended Term Series | | Shares | | | Value
(Note 2) | |
| | |
COMMON STOCKS (continued) | | | | | | | | |
| | |
Utilities (continued) | | | | | | | | |
Independent Power Producers & Energy Traders - 0.01% | | | | | | | | |
Mirant Corp.* | | | 6,150 | | | $ | 65,251 | |
RRI Energy, Inc.* | | | 18,780 | | | | 70,613 | |
| | | | | | | | |
| | | | | | | 135,864 | |
| | | | | | | | |
Multi-Utilities - 0.04% | | | | | | | | |
GDF Suez (France)1 | | | 4,147 | | | | 165,703 | |
National Grid plc (United Kingdom)1 | | | 22,535 | | | | 213,102 | |
| | | | | | | | |
| | | | | | | 378,805 | |
| | | | | | | | |
Water Utilities - 0.02% | | | | | | | | |
Cia de Saneamento de Minas Gerais - Copasa MG (Brazil) | | | 15,040 | | | | 230,602 | |
| | | | | | | | |
Total Utilities | | | | | | | 1,318,870 | |
| | | | | | | | |
TOTAL COMMON STOCKS
(Identified Cost $498,250,477) | | | | | | | 545,331,066 | |
| | | | | | | | |
| | |
PREFERRED STOCKS - 0.34% | | | | | | | | |
| | |
Consumer Staples - 0.02% | | | | | | | | |
Household Products - 0.02% | | | | | | | | |
Henkel AG & Co. KGaA (Germany)1 | | | 3,800 | | | | 224,142 | |
| | | | | | | | |
Financials - 0.32% | | | | | | | | |
Commercial Banks - 0.14% | | | | | | | | |
PNC Financial Services Group, Inc., Series K | | | 480,000 | | | | 503,414 | |
Wells Fargo & Co., Series K | | | 795,000 | | | | 834,750 | |
| | | | | | | | |
| | | | | | | 1,338,164 | |
| | | | | | | | |
Diversified Financial Services - 0.18% | | | | | | | | |
Bank of America Corp., Series K | | | 845,000 | | | | 852,749 | |
JPMorgan Chase & Co., Series 1 | | | 890,000 | | | | 948,749 | |
| | | | | | | | |
| | | | | | | 1,801,498 | |
| | | | | | | | |
Total Financials | | | | | | | 3,139,662 | |
| | | | | | | | |
TOTAL PREFERRED STOCKS
(Identified Cost $3,024,182) | | | | | | | 3,363,804 | |
| | | | | | | | |
| | |
WARRANTS - 0.00%** | | | | | | | | |
| | |
Health Care - 0.00%** | | | | | | | | |
Life Sciences Tools & Services - 0.00%** | | | | | | | | |
Caliper Life Sciences, Inc., 8/10/2011*
(Identified Cost $5,289) | | | 8,377 | | | | 293 | |
| | | | | | | | |
| | | | |
| The accompanying notes are an integral part of the financial statements. | | | 94 | |
Investment Portfolio - October 31, 2010
| | | | | | | | |
Pro-Blend® Extended Term Series | | Principal Amount | | | Value
(Note 2) | |
| | |
CORPORATE BONDS - 20.10% | | | | | | | | |
| | |
Convertible Corporate Bonds - 0.13% | | | | | | | | |
Health Care - 0.08% | | | | | | | | |
Biotechnology - 0.07% | | | | | | | | |
Amgen, Inc., 0.375%, 2/1/2013 | | $ | 635,000 | | | $ | 636,587 | |
| | | | | | | | |
Health Care Equipment & Supplies - 0.01% | | | | | | | | |
Medtronic, Inc., 1.625%, 4/15/2013 | | | 140,000 | | | | 140,875 | |
| | | | | | | | |
Total Health Care | | | | | | | 777,462 | |
| | | | | | | | |
Information Technology - 0.05% | | | | | | | | |
Computers & Peripherals - 0.05% | | | | | | | | |
EMC Corp., 1.75%, 12/1/2013 | | | 335,000 | | | | 477,794 | |
| | | | | | | | |
Total Convertible Corporate Bonds
(Identified Cost $1,174,218) | | | | | | | 1,255,256 | |
| | | | | | | | |
Non-Convertible Corporate Bonds - 19.97% | | | | | | | | |
Consumer Discretionary - 2.70% | | | | | | | | |
Hotels, Restaurants & Leisure - 0.54% | | | | | | | | |
Cedar Fair LP - Canada’s Wonderland Co. - Magnum Management Corp.4, 9.125%, 8/1/2018 | | | 250,000 | | | | 268,750 | |
International Game Technology, 7.50%, 6/15/2019 | | | 1,150,000 | | | | 1,351,832 | |
McDonald’s Corp., 5.80%, 10/15/2017 | | | 620,000 | | | | 740,795 | |
McDonald’s Corp., 6.30%, 10/15/2037 | | | 690,000 | | | | 824,287 | |
Scientific Games International, Inc.4, 7.875%, 6/15/2016 | | | 370,000 | | | | 381,100 | |
Wendy’s - Arby’s Restaurants LLC, 10.00%, 7/15/2016 | | | 560,000 | | | | 613,200 | |
Wyndham Worldwide Corp., 9.875%, 5/1/2014 | | | 230,000 | | | | 271,813 | |
Wyndham Worldwide Corp., 6.00%, 12/1/2016 | | | 795,000 | | | | 848,964 | |
| | | | | | | | |
| | | | | | | 5,300,741 | |
| | | | | | | | |
Household Durables - 0.14% | | | | | | | | |
Fortune Brands, Inc., 5.375%, 1/15/2016 | | | 1,265,000 | | | | 1,353,152 | |
| | | | | | | | |
Media - 1.44% | | | | | | | | |
Cablevision Systems Corp., 8.625%, 9/15/2017 | | | 1,005,000 | | | | 1,134,394 | |
Columbus International, Inc. (Barbados)4, 11.50%, 11/20/2014 | | | 295,000 | | | | 330,769 | |
Comcast Corp., 6.50%, 11/15/2035 | | | 2,315,000 | | | | 2,535,025 | |
Comcast Corp., 6.95%, 8/15/2037 | | | 1,310,000 | | | | 1,523,937 | |
DIRECTV Holdings LLC, 5.20%, 3/15/2020 | | | 1,330,000 | | | | 1,444,501 | |
Discovery Communications LLC, 5.05%, 6/1/2020 | | | 1,350,000 | | | | 1,486,660 | |
Interactive Data Corp.4, 10.25%, 8/1/2018 | | | 360,000 | | | | 393,750 | |
MDC Partners, Inc. (Canada)4, 11.00%, 11/1/2016 | | | 135,000 | | | | 149,850 | |
Sirius XM Radio, Inc.4, 9.75%, 9/1/2015 | | | 470,000 | | | | 526,988 | |
Time Warner, Inc., 7.625%, 4/15/2031 | | | 1,160,000 | | | | 1,412,048 | |
Unitymedia Hessen GmbH & Co. KG - Unitymedia NRW GmbH (Germany)4, 8.125%, 12/1/2017 | | | 175,000 | | | | 183,312 | |
Unitymedia Hessen GmbH & Co. KG - Unitymedia NRW GmbH (Germany)4, 8.125%, 12/1/2017 | | | 195,000 | | | | 283,616 | |
| | |
| 95 | | The accompanying notes are an integral part of the financial statements. |
Investment Portfolio - October 31, 2010
| | | | | | | | |
Pro-Blend® Extended Term Series | | Principal Amount | | | Value
(Note 2) | |
| | |
CORPORATE BONDS (continued) | | | | | | | | |
| | |
Non-Convertible Corporate Bonds (continued) | | | | | | | | |
Consumer Discretionary (continued) | | | | | | | | |
Media (continued) | | | | | | | | |
UPC Holding B.V. (Netherlands)4, 9.875%, 4/15/2018 | | $ | 710,000 | | | $ | 775,675 | |
Virgin Media Finance plc (United Kingdom), 8.375%, 10/15/2019 | | | 105,000 | | | | 117,075 | |
Virgin Media Finance plc, Series 1 (United Kingdom), 9.50%, 8/15/2016 | | | 370,000 | | | | 420,412 | |
The Walt Disney Co., Series B, 7.00%, 3/1/2032 | | | 380,000 | | | | 480,302 | |
WMG Acquisition Corp., 9.50%, 6/15/2016 | | | 480,000 | | | | 517,200 | |
XM Satellite Radio, Inc.4, 7.625%, 11/1/2018 | | | 425,000 | | | | 436,688 | |
| | | | | | | | |
| | | | | | | 14,152,202 | |
| | | | | | | | |
Multiline Retail - 0.10% | | | | | | | | |
Target Corp., 6.00%, 1/15/2018 | | | 845,000 | | | | 1,020,218 | |
| | | | | | | | |
Specialty Retail - 0.38% | | | | | | | | |
The Home Depot, Inc., 5.40%, 3/1/2016 | | | 1,220,000 | | | | 1,399,430 | |
Lowe’s Companies, Inc., 6.10%, 9/15/2017 | | | 850,000 | | | | 1,029,140 | |
Rent-A-Center, Inc.4, 6.625%, 11/15/2020 | | | 645,000 | | | | 651,450 | |
Toys R Us Property Co. LLC4, 8.50%, 12/1/2017 | | | 595,000 | | | | 644,088 | |
| | | | | | | | |
| | | | | | | 3,724,108 | |
| | | | | | | | |
Textiles, Apparel & Luxury Goods - 0.10% | | | | | | | | |
VF Corp., 5.95%, 11/1/2017 | | | 880,000 | | | | 1,027,222 | |
| | | | | | | | |
Total Consumer Discretionary | | | | | | | 26,577,643 | |
| | | | | | | | |
Consumer Staples - 0.78% | | | | | | | | |
Beverages - 0.38% | | | | | | | | |
CEDC Finance Corp. International, Inc.4, 9.125%, 12/1/2016 | | | 600,000 | | | | 648,000 | |
The Coca-Cola Co., 5.35%, 11/15/2017 | | | 630,000 | | | | 739,721 | |
Constellation Brands, Inc., 8.375%, 12/15/2014 | | | 590,000 | | | | 664,488 | |
PepsiCo, Inc., 5.00%, 6/1/2018 | | | 620,000 | | | | 705,921 | |
PepsiCo, Inc., 7.90%, 11/1/2018 | | | 760,000 | | | | 1,019,013 | |
| | | | | | | | |
| | | | | | | 3,777,143 | |
| | | | | | | | |
Food & Staples Retailing - 0.09% | | | | | | | | |
Ingles Markets, Inc., 8.875%, 5/15/2017 | | | 215,000 | | | | 237,575 | |
The Kroger Co., 6.75%, 4/15/2012 | | | 605,000 | | | | 653,509 | |
| | | | | | | | |
| | | | | | | 891,084 | |
| | | | | | | | |
Food Products - 0.21% | | | | | | | | |
General Mills, Inc., 5.65%, 2/15/2019 | | | 880,000 | | | | 1,027,379 | |
Kraft Foods, Inc., 6.125%, 2/1/2018 | | | 895,000 | | | | 1,054,327 | |
| | | | | | | | |
| | | | | | | 2,081,706 | |
| | | | | | | | |
Personal Products - 0.10% | | | | | | | | |
Revlon Consumer Products Corp., 9.75%, 11/15/2015 | | | 940,000 | | | | 979,950 | |
| | | | | | | | |
Total Consumer Staples | | | | | | | 7,729,883 | |
| | | | | | | | |
| | | | |
| The accompanying notes are an integral part of the financial statements. | | | 96 | |
Investment Portfolio - October 31, 2010
| | | | | | | | |
Pro-Blend® Extended Term Series | | Principal Amount | | | Value
(Note 2) | |
| | |
CORPORATE BONDS (continued) | | | | | | | | |
| | |
Non-Convertible Corporate Bonds (continued) | | | | | | | | |
Energy - 1.77% | | | | | | | | |
Energy Equipment & Services - 0.50% | | | | | | | | |
Baker Hughes, Inc., 7.50%, 11/15/2018 | | $ | 725,000 | | | $ | 937,736 | |
Cie Generale de Geophysique - Veritas (France), 7.75%, 5/15/2017 | | | 655,000 | | | | 686,112 | |
Complete Production Services, Inc., 8.00%, 12/15/2016 | | | 430,000 | | | | 452,575 | |
Hornbeck Offshore Services, Inc., 8.00%, 9/1/2017 | | | 90,000 | | | | 91,238 | |
Hornbeck Offshore Services, Inc., Series B, 6.125%, 12/1/2014 | | | 400,000 | | | | 400,000 | |
Key Energy Services, Inc., 8.375%, 12/1/2014 | | | 410,000 | | | | 439,213 | |
Thermon Industries, Inc.4, 9.50%, 5/1/2017 | | | 465,000 | | | | 491,737 | |
Weatherford International Ltd. (Switzerland), 9.625%, 3/1/2019 | | | 1,045,000 | | | | 1,380,036 | |
| | | | | | | | |
| | | | | | | 4,878,647 | |
| | | | | | | | |
| | |
Oil, Gas & Consumable Fuels - 1.27% | | | | | | | | |
Anadarko Petroleum Corp., 5.95%, 9/15/2016 | | | 1,690,000 | | | | 1,848,268 | |
Anadarko Petroleum Corp., 8.70%, 3/15/2019 | | | 580,000 | | | | 718,028 | |
Apache Corp., 6.90%, 9/15/2018 | | | 600,000 | | | | 754,327 | |
Aquilex Holdings LLC - Aquilex Finance Corp., 11.125%, 12/15/2016 | | | 245,000 | | | | 233,362 | |
Arch Coal, Inc., 8.75%, 8/1/2016 | | | 185,000 | | | | 207,663 | |
Arch Western Finance LLC, 6.75%, 7/1/2013 | | | 265,000 | | | | 267,650 | |
Chaparral Energy, Inc., 8.875%, 2/1/2017 | | | 550,000 | | | | 550,000 | |
Chesapeake Energy Corp., 9.50%, 2/15/2015 | | | 480,000 | | | | 556,800 | |
Coffeyville Resources LLC - Coffeyville Finance, Inc.4, 9.00%, 4/1/2015 | | | 225,000 | | | | 241,313 | |
Coffeyville Resources LLC - Coffeyville Finance, Inc.4, 10.875%, 4/1/2017 | | | 215,000 | | | | 228,975 | |
Crosstex Energy LP - Crosstex Energy Finance Corp., 8.875%, 2/15/2018 | | | 855,000 | | | | 923,400 | |
Hess Corp., 5.60%, 2/15/2041 | | | 1,670,000 | | | | 1,704,267 | |
Linn Energy LLC - Linn Energy Finance Corp.4, 7.75%, 2/1/2021 | | | 555,000 | | | | 573,038 | |
MarkWest Energy Partners LP - MarkWest Energy Finance Corp., 6.75%,
11/1/2020 | | | 625,000 | | | | 639,062 | |
Martin Midstream Partners LP - Martin Midstream Finance Corp.4, 8.875%,
4/1/2018 | | | 460,000 | | | | 478,400 | |
Niska Gas Storage US LLC - Niska Gas Storage Canada ULC4, 8.875%,
3/15/2018 | | | 320,000 | | | | 349,600 | |
Plains Exploration & Production Co., 8.625%, 10/15/2019 | | | 790,000 | | | | 876,900 | |
Targa Resources Partners LP - Targa Resources Partners Finance Corp.,
8.25%, 7/1/2016 | | | 465,000 | | | | 492,900 | |
Tesoro Corp., 9.75%, 6/1/2019 | | | 650,000 | | | | 721,500 | |
Whiting Petroleum Corp., 7.00%, 2/1/2014 | | | 125,000 | | | | 132,969 | |
| | | | | | | | |
| | | | | | | 12,498,422 | |
| | | | | | | | |
Total Energy | | | | | | | 17,377,069 | |
| | | | | | | | |
Financials - 7.38% | | | | | | | | |
Capital Markets - 2.38% | | | | | | | | |
Goldman Sachs Capital I, 6.345%, 2/15/2034 | | | 1,020,000 | | | | 975,165 | |
| | |
| 97 | | The accompanying notes are an integral part of the financial statements. |
Investment Portfolio - October 31, 2010
| | | | | | | | |
Pro-Blend® Extended Term Series | | Principal Amount | | | Value
(Note 2) | |
| | |
CORPORATE BONDS (continued) | | | | | | | | |
| | |
Non-Convertible Corporate Bonds (continued) | | | | | | | | |
Financials (continued) | | | | | | | | |
Capital Markets (continued) | | | | | | | | |
Goldman Sachs Capital II5, 5.793%, 12/29/2049 | | $ | 2,005,000 | | | $ | 1,721,794 | |
The Goldman Sachs Group, Inc.6, 3.25%, 6/15/2012 | | | 9,123,000 | | | | 9,543,351 | |
The Goldman Sachs Group, Inc., 6.15%, 4/1/2018 | | | 885,000 | | | | 990,980 | |
The Goldman Sachs Group, Inc., 5.375%, 3/15/2020 | | | 3,020,000 | | | | 3,195,383 | |
Merrill Lynch & Co., Inc., 6.11%, 1/29/2037 | | | 1,375,000 | | | | 1,308,971 | |
Morgan Stanley, 5.55%, 4/27/2017 | | | 2,425,000 | | | | 2,581,294 | |
Morgan Stanley, 5.50%, 1/26/2020 | | | 3,000,000 | | | | 3,122,661 | |
| | | | | | | | |
| | | | | | | 23,439,599 | |
| | | | | | | | |
| | |
Commercial Banks - 1.21% | | | | | | | | |
Household Finance Co., 6.375%, 11/27/2012 | | | 1,225,000 | | | | 1,338,777 | |
HSBC Finance Corp., 7.00%, 5/15/2012 | | | 700,000 | | | | 756,160 | |
KeyBank National Association, 5.45%, 3/3/2016 | | | 1,310,000 | | | | 1,427,313 | |
Manufacturers & Traders Trust Co., 6.625%, 12/4/2017 | | | 1,830,000 | | | | 2,140,851 | |
National City Corp., 6.875%, 5/15/2019 | | | 1,465,000 | | | | 1,706,817 | |
PNC Bank National Association, 5.25%, 1/15/2017 | | | 1,035,000 | | | | 1,123,377 | |
U.S. Bank National Association, 6.375%, 8/1/2011 | | | 575,000 | | | | 600,049 | |
U.S. Bank National Association, 6.30%, 2/4/2014 | | | 555,000 | | | | 636,653 | |
USB Capital XIII Trust, 6.625%, 12/15/2039 | | | 540,000 | | | | 549,434 | |
Wachovia Corp., 5.25%, 8/1/2014 | | | 1,270,000 | | | | 1,379,089 | |
Wilmington Trust Corp., 8.50%, 4/2/2018 | | | 280,000 | | | | 286,426 | |
| | | | | | | | |
| | | | | | | 11,944,946 | |
| | | | | | | | |
| | |
Consumer Finance - 0.60% | | | | | | | | |
American Express Co., 8.125%, 5/20/2019 | | | 3,130,000 | | | | 4,020,698 | |
American Express Co.5, 6.80%, 9/1/2066 | | | 930,000 | | | | 933,487 | |
Credit Acceptance Corp.4, 9.125%, 2/1/2017 | | | 880,000 | | | | 924,000 | |
| | | | | | | | |
| | | | | | | 5,878,185 | |
| | | | | | | | |
| | |
Diversified Financial Services - 1.60% | | | | | | | | |
Bank of America Corp., 5.75%, 8/15/2016 | | | 685,000 | | | | 728,838 | |
Bank of America Corp., 7.625%, 6/1/2019 | | | 3,355,000 | | | | 3,927,561 | |
Citigroup Funding, Inc.6, 1.875%, 10/22/2012 | | | 3,892,000 | | | | 3,997,715 | |
Citigroup, Inc., 8.50%, 5/22/2019 | | | 2,445,000 | | | | 3,070,130 | |
JPMorgan Chase & Co., 6.30%, 4/23/2019 | | | 860,000 | | | | 1,003,635 | |
JPMorgan Chase & Co., 4.95%, 3/25/2020 | | | 2,850,000 | | | | 3,022,570 | |
| | | | | | | | |
| | | | | | | 15,750,449 | |
| | | | | | | | |
| | |
Insurance - 0.28% | | | | | | | | |
American International Group, Inc., 4.25%, 5/15/2013 | | | 1,245,000 | | | | 1,301,025 | |
Fidelity National Financial, Inc., 6.60%, 5/15/2017 | | | 530,000 | | | | 546,599 | |
| | | | |
| The accompanying notes are an integral part of the financial statements. | | | 98 | |
Investment Portfolio - October 31, 2010
| | | | | | | | |
Pro-Blend® Extended Term Series | | Principal Amount | | | Value
(Note 2) | |
| | |
CORPORATE BONDS (continued) | | | | | | | | |
| | |
Non-Convertible Corporate Bonds (continued) | | | | | | | | |
Financials (continued) | | | | | | | | |
Insurance (continued) | | | | | | | | |
Hartford Financial Services Group, Inc.5, 8.125%, 6/15/2038 | | $ | 820,000 | | | $ | 871,250 | |
| | | | | | | | |
| | | | | | | 2,718,874 | |
| | | | | | | | |
| | |
Real Estate Investment Trusts (REITS) - 1.25% | | | | | | | | |
AvalonBay Communities, Inc., 6.10%, 3/15/2020 | | | 1,235,000 | | | | 1,445,078 | |
Boston Properties LP, 5.875%, 10/15/2019 | | | 1,255,000 | | | | 1,415,830 | |
Camden Property Trust, 5.70%, 5/15/2017 | | | 980,000 | | | | 1,083,717 | |
DuPont Fabros Technology LP, 8.50%, 12/15/2017 | | | 785,000 | | | | 849,762 | |
Felcor Lodging LP, 10.00%, 10/1/2014 | | | 580,000 | | | | 652,500 | |
HCP, Inc., 6.70%, 1/30/2018 | | | 1,270,000 | | | | 1,409,132 | |
Health Care REIT, Inc., 6.20%, 6/1/2016 | | | 1,240,000 | | | | 1,417,729 | |
Host Hotels & Resorts LP, 6.875%, 11/1/2014 | | | 295,000 | | | | 304,403 | |
Host Hotels & Resorts LP, 6.375%, 3/15/2015 | | | 160,000 | | | | 164,000 | |
Mack-Cali Realty LP, 7.75%, 8/15/2019 | | | 755,000 | | | | 909,407 | |
National Retail Properties, Inc., 6.875%, 10/15/2017 | | | 650,000 | | | | 732,379 | |
Omega Healthcare Investors, Inc.4, 7.50%, 2/15/2020 | | | 425,000 | | | | 457,938 | |
Simon Property Group LP, 10.35%, 4/1/2019 | | | 1,035,000 | | | | 1,463,067 | |
| | | | | | | | |
| | | | | | | 12,304,942 | |
| | | | | | | | |
| | |
Real Estate Management & Development - 0.06% | | | | | | | | |
CB Richard Ellis Services, Inc.4, 6.625%, 10/15/2020 | | | 600,000 | | | | 609,000 | |
| | | | | | | | |
Total Financials | | | | | | | 72,645,995 | |
| | | | | | | | |
Health Care - 0.93% | | | | | | | | |
Health Care Equipment & Supplies - 0.34% | | | | | | | | |
Alere, Inc., 7.875%, 2/1/2016 | | | 395,000 | | | | 413,762 | |
Alere, Inc., 9.00%, 5/15/2016 | | | 689,000 | | | | 735,508 | |
Becton Dickinson and Co., 6.00%, 5/15/2039 | | | 885,000 | | | | 1,023,196 | |
Fresenius Medical Care Capital Trust IV, 7.875%, 6/15/2011 | | | 245,000 | | | | 251,738 | |
Fresenius US Finance II, Inc.4, 9.00%, 7/15/2015 | | | 760,000 | | | | 887,300 | |
| | | | | | | | |
| | | | | | | 3,311,504 | |
| | | | | | | | |
| | |
Health Care Providers & Services - 0.24% | | | | | | | | |
BioScrip, Inc., 10.25%, 10/1/2015 | | | 430,000 | | | | 454,725 | |
HCA, Inc., 7.875%, 2/15/2020 | | | 615,000 | | | | 681,112 | |
Health Management Associates, Inc., 6.125%, 4/15/2016 | | | 670,000 | | | | 690,100 | |
LifePoint Hospitals, Inc.4, 6.625%, 10/1/2020 | | | 555,000 | | | | 584,138 | |
| | | | | | | | |
| | | | | | | 2,410,075 | |
| | | | | | | | |
| | |
Life Sciences Tools & Services - 0.05% | | | | | | | | |
PharmaNet Development Group, Inc.4, 10.875%, 4/15/2017 | | | 455,000 | | | | 473,200 | |
| | | | | | | | |
Pharmaceuticals - 0.30% | | | | | | | | |
Johnson & Johnson, 5.95%, 8/15/2037 | | | 565,000 | | | | 673,863 | |
| | |
| 99 | | The accompanying notes are an integral part of the financial statements. |
Investment Portfolio - October 31, 2010
| | | | | | | | |
Pro-Blend® Extended Term Series | | Principal Amount | | | Value
(Note 2) | |
| | |
CORPORATE BONDS (continued) | | | | | | | | |
| | |
Non-Convertible Corporate Bonds (continued) | | | | | | | | |
Health Care (continued) | | | | | | | | |
Pharmaceuticals (continued) | | | | | | | | |
Novartis Securities Investment Ltd. (Bermuda), 5.125%, 2/10/2019 | | $ | 1,245,000 | | | $ | 1,429,170 | |
Wyeth, 6.50%, 2/1/2034 | | | 700,000 | | | | 843,298 | |
| | | | | | | | |
| | | | | | | 2,946,331 | |
| | | | | | | | |
Total Health Care | | | | | | | 9,141,110 | |
| | | | | | | | |
Industrials - 3.08% | | | | | | | | |
Aerospace & Defense - 0.32% | | | | | | | | |
BE Aerospace, Inc., 6.875%, 10/1/2020 | | | 555,000 | | | | 589,688 | |
The Boeing Co., 6.00%, 3/15/2019 | | | 980,000 | | | | 1,175,202 | |
GeoEye, Inc., 9.625%, 10/1/2015 | | | 250,000 | | | | 278,438 | |
Honeywell International, Inc., 5.30%, 3/1/2018 | | | 660,000 | | | | 769,577 | |
Kratos Defense & Security Solutions, Inc., 10.00%, 6/1/2017 | | | 275,000 | | | | 305,250 | |
| | | | | | | | |
| | | | | | | 3,118,155 | |
| | | | | | | | |
Air Freight & Logistics - 0.18% | | | | | | | | |
FedEx Corp., 8.00%, 1/15/2019 | | | 785,000 | | | | 1,011,511 | |
United Parcel Service, Inc., 6.20%, 1/15/2038 | | | 645,000 | | | | 770,202 | |
| | | | | | | | |
| | | | | | | 1,781,713 | |
| | | | | | | | |
Airlines - 0.46% | | | | | | | | |
Continental Airlines, Inc.4, 6.75%, 9/15/2015 | | | 565,000 | | | | 588,306 | |
Delta Air Lines Pass-Through Trust, Series 2001-1, Class A-2, 7.111%, 9/18/2011 | | | 340,000 | | | | 356,150 | |
Delta Air Lines Pass-Through Trust, Series 2007-1, Class A, 6.821%, 8/10/2022 | | | 329,086 | | | | 355,413 | |
Delta Air Lines, Inc.4, 9.50%, 9/15/2014 | | | 445,000 | | | | 489,500 | |
Southwest Airlines Co., 5.25%, 10/1/2014 | | | 945,000 | | | | 1,019,537 | |
Southwest Airlines Co., 5.75%, 12/15/2016 | | | 1,580,000 | | | | 1,731,227 | |
| | | | | | | | |
| | | | | | | 4,540,133 | |
| | | | | | | | |
Building Products - 0.10% | | | | | | | | |
Building Materials Corp. of America4, 6.875%, 8/15/2018 | | | 340,000 | | | | 340,000 | |
Building Materials Corp. of America4, 7.50%, 3/15/2020 | | | 215,000 | | | | 219,837 | |
Owens Corning, 9.00%, 6/15/2019 | | | 335,000 | | | | 406,098 | |
| | | | | | | | |
| | | | | | | 965,935 | |
| | | | | | | | |
Commercial Services & Supplies - 0.26% | | | | | | | | |
ACCO Brands Corp., 10.625%, 3/15/2015 | | | 250,000 | | | | 282,188 | |
Clean Harbors, Inc., 7.625%, 8/15/2016 | | | 414,000 | | | | 437,287 | |
Garda World Security Corp. (Canada)4, 9.75%, 3/15/2017 | | | 425,000 | | | | 452,625 | |
Waste Management, Inc., 7.375%, 3/11/2019 | | | 1,110,000 | | | | 1,398,092 | |
| | | | | | | | |
| | | | | | | 2,570,192 | |
| | | | | | | | |
| | | | |
| The accompanying notes are an integral part of the financial statements. | | | 100 | |
Investment Portfolio - October 31, 2010
| | | | | | | | |
Pro-Blend® Extended Term Series | | Principal Amount | | | Value
(Note 2) | |
| | |
CORPORATE BONDS (continued) | | | | | | | | |
| | |
Non-Convertible Corporate Bonds (continued) | | | | | | | | |
Industrials (continued) | | | | | | | | |
Industrial Conglomerates - 0.83% | | | | | | | | |
GE Capital Trust I5, 6.375%, 11/15/2067 | | $ | 895,000 | | | $ | 884,931 | |
General Electric Capital Corp., 5.625%, 5/1/2018 | | | 460,000 | | | | 514,054 | |
General Electric Capital Corp., 5.50%, 1/8/2020 | | | 2,785,000 | | | | 3,065,461 | |
General Electric Capital Corp., Series A, 6.75%, 3/15/2032 | | | 1,545,000 | | | | 1,723,325 | |
General Electric Co., 5.25%, 12/6/2017 | | | 765,000 | | | | 861,288 | |
Textron, Inc., 7.25%, 10/1/2019 | | | 940,000 | | | | 1,118,805 | |
| | | | | | | | |
| | | | | | | 8,167,864 | |
| | | | | | | | |
Machinery - 0.29% | | | | | | | | |
Caterpillar Financial Services Corp., 7.05%, 10/1/2018 | | | 815,000 | | | | 1,027,881 | |
John Deere Capital Corp., 5.50%, 4/13/2017 | | | 275,000 | | | | 320,573 | |
John Deere Capital Corp., 5.75%, 9/10/2018 | | | 1,295,000 | | | | 1,525,248 | |
| | | | | | | | |
| | | | | | | 2,873,702 | |
| | | | | | | | |
Marine - 0.11% | | | | | | | | |
Navios Maritime Holdings, Inc. - Navios Maritime Finance US, Inc. (Marshall Island)4,
8.875%, 11/1/2017 | | | 805,000 | | | | 859,337 | |
United Maritime Group LLC - United Maritime Group Finance Corp., 11.75%, 6/15/2015 | | | 245,000 | | | | 244,694 | |
| | | | | | | | |
| | | | | | | 1,104,031 | |
| | | | | | | | |
Road & Rail - 0.53% | | | | | | | | |
CSX Corp., 6.00%, 10/1/2036 | | | 1,605,000 | | | | 1,708,124 | |
JB Hunt Transport Services, Inc., 3.375%, 9/15/2015 | | | 2,300,000 | | | | 2,328,322 | |
RailAmerica, Inc., 9.25%, 7/1/2017 | | | 285,000 | | | | 315,638 | |
Union Pacific Corp., 5.65%, 5/1/2017 | | | 700,000 | | | | 807,965 | |
| | | | | | | | |
| | | | | | | 5,160,049 | |
| | | | | | | | |
Total Industrials | | | | | | | 30,281,774 | |
| | | | | | | | |
Information Technology - 0.76% | | | | | | | | |
Communications Equipment - 0.29% | | | | | | | | |
Alcatel-Lucent USA, Inc., 6.45%, 3/15/2029 | | | 540,000 | | | | 450,900 | |
Cisco Systems, Inc., 5.90%, 2/15/2039 | | | 1,045,000 | | | | 1,174,467 | |
Hughes Network Systems LLC - HNS Finance Corp., 9.50%, 4/15/2014 | | | 650,000 | | | | 677,625 | |
Nokia Corp. (Finland), 5.375%, 5/15/2019 | | | 460,000 | | | | 512,020 | |
| | | | | | | | |
| | | | | | | 2,815,012 | |
| | | | | | | | |
Computers & Peripherals - 0.14% | | | | | | | | |
International Business Machines Corp., 5.60%, 11/30/2039 | | | 1,271,000 | | | | 1,416,565 | |
| | | | | | | | |
IT Services - 0.15% | | | | | | | | |
The Western Union Co., 5.253%, 4/1/2020 | | | 1,350,000 | | | | 1,474,884 | |
| | | | | | | | |
| | |
| 101 | | The accompanying notes are an integral part of the financial statements. |
Investment Portfolio - October 31, 2010
| | | | | | | | |
Pro-Blend® Extended Term Series | | Principal Amount | | | Value
(Note 2) | |
| | |
CORPORATE BONDS (continued) | | | | | | | | |
| | |
Non-Convertible Corporate Bonds (continued) | | | | | | | | |
Information Technology (continued) | | | | | | | | |
Semiconductors & Semiconductor Equipment - 0.11% | | | | | | | | |
Advanced Micro Devices, Inc., 8.125%, 12/15/2017 | | $ | 300,000 | | | $ | 324,000 | |
Advanced Micro Devices, Inc.4, 7.75%, 8/1/2020 | | | 240,000 | | | | 254,400 | |
MagnaChip Semiconductor S.A. - MagnaChip Semiconductor Finance Co.4, 10.50%, 4/15/2018 | | | 455,000 | | | | 487,988 | |
| | | | | | | | |
| | | | | | | 1,066,388 | |
| | | | | | | | |
Software - 0.07% | | | | | | | | |
Microsoft Corp., 5.20%, 6/1/2039 | | | 690,000 | | | | 732,648 | |
| | | | | | | | |
Total Information Technology | | | | | | | 7,505,497 | |
| | | | | | | | |
Materials - 1.54% | | | | | | | | |
Chemicals - 0.22% | | | | | | | | |
E.I. du Pont de Nemours & Co., 6.00%, 7/15/2018 | | | 855,000 | | | | 1,024,118 | |
Ferro Corp., 7.875%, 8/15/2018 | | | 555,000 | | | | 590,381 | |
Rhodia S.A. (France)4, 6.875%, 9/15/2020 | | | 570,000 | | | | 599,213 | |
| | | | | | | | |
| | | | | | | 2,213,712 | |
| | | | | | | | |
Containers & Packaging - 0.05% | | | | | | | | |
Reynolds Group Issuer, Inc. - Reynolds Group Issuer LLC4, 8.50%, 5/15/2018 | | | 480,000 | | | | 490,800 | |
| | | | | | | | |
Metals & Mining - 0.63% | | | | | | | | |
Alcoa, Inc., 5.72%, 2/23/2019 | | | 3,122,000 | | | | 3,198,370 | |
Alcoa, Inc., 5.87%, 2/23/2022 | | | 1,280,000 | | | | 1,307,463 | |
BHP Billiton Finance (USA) Ltd. (Australia), 6.50%, 4/1/2019 | | | 830,000 | | | | 1,029,096 | |
Steel Dynamics, Inc., 7.75%, 4/15/2016 | | | 610,000 | | | | 651,175 | |
| | | | | | | | |
| | | | | | | 6,186,104 | |
| | | | | | | | |
Paper & Forest Products - 0.64% | | | | | | | | |
Georgia-Pacific LLC4, 8.25%, 5/1/2016 | | | 290,000 | | | | 332,775 | |
International Paper Co., 9.375%, 5/15/2019 | | | 2,562,000 | | | | 3,383,198 | |
International Paper Co., 7.50%, 8/15/2021 | | | 2,120,000 | | | | 2,585,213 | |
| | | | | | | | |
| | | | | | | 6,301,186 | |
| | | | | | | | |
Total Materials | | | | | | | 15,191,802 | |
| | | | | | | | |
Telecommunication Services - 0.57% | | | | | | | | |
Diversified Telecommunication Services - 0.23% | | | | | | | | |
Clearwire Communications LLC - Clearwire Finance, Inc.4, 12.00%,
12/1/2015 | | | 130,000 | | | | 144,300 | |
Clearwire Communications LLC - Clearwire Finance, Inc.4, 12.00%,
12/1/2015 | | | 310,000 | | | | 343,325 | |
Inmarsat Finance plc (United Kingdom)4, 7.375%, 12/1/2017 | | | 575,000 | | | | 615,250 | |
Intelsat Subsidiary Holding Co. Ltd. (Bermuda)4, 8.875%, 1/15/2015 | | | 535,000 | | | | 551,050 | |
| | | | |
| The accompanying notes are an integral part of the financial statements. | | | 102 | |
Investment Portfolio - October 31, 2010
| | | | | | | | |
Pro-Blend® Extended Term Series | | Principal Amount/
Shares | | | Value
(Note 2) | |
| | |
CORPORATE BONDS (continued) | | | | | | | | |
| | |
Non-Convertible Corporate Bonds (continued) | | | | | | | | |
Telecommunication Services (continued) | | | | | | | | |
Diversified Telecommunication Services (continued) | | | | | | | | |
Wind Acquisition Finance S.A. (Luxembourg)4, 11.75%, 7/15/2017 | | $ | 585,000 | | | $ | 666,900 | |
| | | | | | | | |
| | | | | | | 2,320,825 | |
| | | | | | | | |
Wireless Telecommunication Services - 0.34% | | | | | | | | |
CC Holdings GS V LLC - Crown Castle GS III Corp.4, 7.75%, 5/1/2017 | | | 465,000 | | | | 521,962 | |
Crown Castle Towers LLC4, 6.113%, 1/15/2020 | | | 1,045,000 | | | | 1,162,248 | |
Crown Castle Towers LLC4, 4.883%, 8/15/2020 | | | 353,000 | | | | 359,623 | |
NII Capital Corp., 8.875%, 12/15/2019 | | | 590,000 | | | | 656,375 | |
SBA Tower Trust4, 5.101%, 4/15/2017 | | | 575,000 | | | | 618,475 | |
| | | | | | | | |
| | | | | | | 3,318,683 | |
| | | | | | | | |
Total Telecommunication Services | | | | | | | 5,639,508 | |
| | | | | | | | |
Utilities - 0.46% | | | | | | | | |
Electric Utilities - 0.38% | | | | | | | | |
Allegheny Energy Supply Co. LLC4, 5.75%, 10/15/2019 | | | 1,660,000 | | | | 1,741,088 | |
Exelon Generation Co. LLC, 5.35%, 1/15/2014 | | | 895,000 | | | | 994,762 | |
Southwestern Electric Power Co., 6.45%, 1/15/2019 | | | 880,000 | | | | 998,838 | |
| | | | | | | | |
| | | | | | | 3,734,688 | |
| | | | | | | | |
Independent Power Producers & Energy Traders - 0.06% | | | | | | | | |
Mirant Mid Atlantic Pass-Through Trust, Series B, 9.125%, 6/30/2017 | | | 319,346 | | | | 343,297 | |
North American Energy Alliance LLC - North American Energy Alliance Finance Corp.4, 10.875%, 6/1/2016 | | | 250,000 | | | | 277,500 | |
| | | | | | | | |
| | | | | | | 620,797 | |
| | | | | | | | |
Multi-Utilities - 0.02% | | | | | | | | |
CenterPoint Energy Resources Corp., Series B, 7.875%, 4/1/2013 | | | 135,000 | | | | 155,466 | |
| | | | | | | | |
Total Utilities | | | | | | | 4,510,951 | |
| | | | | | | | |
Total Non-Convertible Corporate Bonds
(Identified Cost $181,677,016) | | | | | | | 196,601,232 | |
| | | | | | | | |
TOTAL CORPORATE BONDS
(Identified Cost $182,851,234) | | | | | | | 197,856,488 | |
| | | | | | | | |
| | |
MUTUAL FUNDS - 1.94% | | | | | | | | |
| | |
iShares Dow Jones US Real Estate Index Fund | | | 880 | | | | 48,330 | |
iShares iBoxx High Yield Corporate Bond Fund | | | 105,941 | | | | 9,613,086 | |
iShares iBoxx Investment Grade Corporate Bond Fund | | | 83,883 | | | | 9,425,094 | |
| | | | | | | | |
TOTAL MUTUAL FUNDS
(Identified Cost $17,854,437) | | | | | | | 19,086,510 | |
| | | | | | | | |
| | |
| 103 | | The accompanying notes are an integral part of the financial statements. |
Investment Portfolio - October 31, 2010
| | | | | | | | |
Pro-Blend® Extended Term Series | | Principal Amount | | | Value
(Note 2) | |
| | |
U.S. TREASURY SECURITIES - 5.28% | | | | | | | | |
| | |
U.S. Treasury Notes - 5.28% | | | | | | | | |
U.S. Treasury Note, 2.375%, 2/28/2015 | | $ | 8,985,000 | | | $ | 9,519,158 | |
U.S. Treasury Note, 2.50%, 4/30/2015 | | | 25,000,000 | | | | 26,634,775 | |
U.S. Treasury Note, 2.125%, 5/31/2015 | | | 124,000 | | | | 129,958 | |
U.S. Treasury Note, 4.00%, 8/15/2018 | | | 10,150,000 | | | | 11,523,417 | |
U.S. Treasury Note, 2.75%, 2/15/2019 | | | 4,000,000 | | | | 4,142,812 | |
| | | | | | | | |
TOTAL U.S. TREASURY SECURITIES
(Identified Cost $48,370,925) | | | | | | | 51,950,120 | |
| | | | | | | | |
| | |
ASSET-BACKED SECURITIES - 0.13% | | | | | | | | |
| | |
Hertz Vehicle Financing LLC, Series 2009-2A, Class A24, 5.29%, 3/25/2016 | | | 470,000 | | | | 520,533 | |
Hertz Vehicle Financing LLC, Series 2010-1A, Class A24, 3.74%, 2/25/2017 | | | 700,000 | | | | 733,254 | |
| | | | | | | | |
TOTAL ASSET-BACKED SECURITIES
(Identified Cost $1,169,738) | | | | | | | 1,253,787 | |
| | | | | | | | |
| | |
COMMERCIAL MORTGAGE-BACKED SECURITIES - 0.42% | | | | | | | | |
Banc of America Commercial Mortgage, Inc., Series 2006-2, Class A45, 5.740%, 5/10/2045 | | | 125,000 | | | | 139,334 | |
Banc of America Commercial Mortgage, Inc., Series 2006-4, Class A4, 5.634%, 7/10/2046 | | | 100,000 | | | | 107,976 | |
Bear Stearns Commercial Mortgage Securities, Series 2005-PWR9, Class A4A, 4.871%, 9/11/2042 | | | 100,000 | | | | 106,899 | |
Bear Stearns Commercial Mortgage Securities, Series 2006-PW12, Class A45, 5.723%, 9/11/2038 | | | 130,000 | | | | 145,431 | |
Bear Stearns Commercial Mortgage Securities, Series 2006-PW13, Class A4, 5.540%, 9/11/2041 | | | 125,000 | | | | 136,622 | |
Citigroup Commercial Mortgage Trust, Series 2006-C4, Class A35, 5.728%, 3/15/2049 | | | 160,000 | | | | 175,031 | |
Commercial Mortgage Pass-Through Certificates, Series 2006-C7, Class A45, 5.767%, 6/10/2046 | | | 270,000 | | | | 299,151 | |
Commercial Mortgage Pass-Through Certificates, Series 2010-C1, Class A14,7, 3.156%, 11/1/2015 | | | 250,000 | | | | 257,499 | |
JP Morgan Chase Commercial Mortgage Securities Corp., Series 2005-LDP5, Class A45, 5.198%, 12/15/2044 | | | 225,000 | | | | 248,012 | |
JP Morgan Chase Commercial Mortgage Securities Corp., Series 2006-LDP7, Class A45, 5.872%, 4/15/2045 | | | 115,000 | | | | 127,594 | |
LB-UBS Commercial Mortgage Trust, Series 2006-C4, Class A45, 5.881%, 6/15/2038 | | | 175,000 | | | | 192,346 | |
Merrill Lynch - Countrywide Commercial Mortgage Trust, Series 2006-3, Class A45, 5.414%, 7/12/2046 | | | 175,000 | | | | 186,905 | |
Morgan Stanley Capital I, Series 2005-HQ7, Class A45, 5.206%, 11/14/2042 | | | 125,000 | | | | 137,506 | |
OBP Depositor LLC Trust, Series 2010-OBP, Class A4, 4.646%, 7/15/2045 | | | 115,000 | | | | 123,399 | |
Vornado DP LLC, Series 2010-VNO, Class A2FX4, 4.004%, 9/13/2028 | | | 350,000 | | | | 354,237 | |
| | | | |
| The accompanying notes are an integral part of the financial statements. | | | 104 | |
Investment Portfolio - October 31, 2010
| | | | | | | | |
Pro-Blend® Extended Term Series | | Principal Amount | | | Value
(Note 2) | |
| | |
COMMERCIAL MORTGAGE-BACKED SECURITIES (continued) | | | | | | | | |
| | |
Wachovia Bank Commercial Mortgage Trust, Series 2005-C21, Class A45, 5.202%, 10/15/2044 | | $ | 225,000 | | | $ | 248,516 | |
Wachovia Bank Commercial Mortgage Trust, Series 2006-C25, Class A45, 5.737%, 5/15/2043 | | | 215,000 | | | | 238,294 | |
Wachovia Bank Commercial Mortgage Trust, Series 2006-C26, Class A35, 6.011%, 6/15/2045 | | | 250,000 | | | | 275,704 | |
Wells Fargo Commercial Mortgage Trust, Series 2010-C1, Class A24,7, 4.393%, 11/18/2043 | | | 600,000 | | | | 617,965 | |
| | | | | | | | |
TOTAL COMMERCIAL MORTGAGE-BACKED SECURITIES
(Identified Cost $3,986,777) | | | | | | | 4,118,421 | |
| | | | | | | | |
| | |
FOREIGN GOVERNMENT BONDS - 0.10% | | | | | | | | |
| | |
Hellenic Republic Government Bond (Greece), 6.00%, 7/19/2019
(Identified Cost $1,264,965) | | | 975,000 | | | | 982,382 | |
| | | | | | | | |
| | |
U.S. GOVERNMENT AGENCIES - 12.28% | | | | | | | | |
| | |
Mortgage-Backed Securities - 4.10% | | | | | | | | |
Fannie Mae, Pool #621881, 5.50%, 1/1/2017 | | | 901 | | | | 978 | |
Fannie Mae, Pool #888468, 5.50%, 9/1/2021 | | | 3,712,257 | | | | 4,034,479 | |
Fannie Mae, Pool #995233, 5.50%, 10/1/2021 | | | 229,438 | | | | 249,855 | |
Fannie Mae, Pool #888017, 6.00%, 11/1/2021 | | | 282,103 | | | | 307,158 | |
Fannie Mae, Pool #995329, 5.50%, 12/1/2021 | | | 2,233,321 | | | | 2,427,173 | |
Fannie Mae, Pool #888136, 6.00%, 12/1/2021 | | | 374,118 | | | | 407,346 | |
Fannie Mae, Pool #888810, 5.50%, 11/1/2022 | | | 3,916,714 | | | | 4,256,683 | |
Fannie Mae, Pool #AD0462, 5.50%, 10/1/2024 | | | 239,827 | | | | 260,068 | |
Fannie Mae, Pool #AD0207, 6.00%, 10/1/2038 | | | 13,000,000 | | | | 14,136,630 | |
Freddie Mac, Pool #G11850, 5.50%, 7/1/2020 | | | 1,205,324 | | | | 1,309,758 | |
Freddie Mac, Pool #G12610, 6.00%, 3/1/2022 | | | 384,110 | | | | 418,824 | |
Freddie Mac, Pool #G12655, 6.00%, 5/1/2022 | | | 259,323 | | | | 282,760 | |
Freddie Mac, Pool #G12988, 6.00%, 1/1/2023 | | | 214,494 | | | | 233,477 | |
Freddie Mac, Pool #G13078, 6.00%, 3/1/2023 | | | 375,695 | | | | 409,649 | |
Freddie Mac, Pool #G13331, 5.50%, 10/1/2023 | | | 188,254 | | | | 203,741 | |
Freddie Mac, Pool #G04601, 5.50%, 7/1/2038 | | | 10,586,356 | | | | 11,425,939 | |
| | | | | | | | |
Total Mortgage-Backed Securities
(Identified Cost $40,240,057) | | | | | | | 40,364,518 | |
| | | | | | | | |
Other Agencies - 8.18% | | | | | | | | |
Fannie Mae, 4.375%, 10/15/2015 | | | 12,800,000 | | | | 14,614,502 | |
Fannie Mae, 1.625%, 10/26/2015 | | | 16,000,000 | | | | 16,152,512 | |
Fannie Mae, 5.00%, 5/11/2017 | | | 75,000 | | | | 88,746 | |
Fannie Mae, 6.25%, 5/15/2029 | | | 4,472,000 | | | | 5,776,693 | |
Fannie Mae, 7.25%, 5/15/2030 | | | 4,021,000 | | | | 5,730,488 | |
Fannie Mae, 6.625%, 11/15/2030 | | | 4,268,000 | | | | 5,709,735 | |
| | |
| 105 | | The accompanying notes are an integral part of the financial statements. |
Investment Portfolio - October 31, 2010
| | | | | | | | |
Pro-Blend® Extended Term Series | | Principal Amount/
Shares | | | Value
(Note 2) | |
| | |
U.S. GOVERNMENT AGENCIES (continued) | | | | | | | | |
| | |
Other Agencies (continued) | | | | | | | | |
Freddie Mac, 2.875%, 2/9/2015 | | $ | 1,000,000 | | | $ | 1,072,204 | |
Freddie Mac, 1.75%, 9/10/2015 | | | 9,000,000 | | | | 9,154,467 | |
Freddie Mac, 3.75%, 3/27/2019 | | | 15,740,000 | | | | 17,215,420 | |
Freddie Mac, 6.75%, 3/15/2031 | | | 1,841,000 | | | | 2,510,279 | |
Freddie Mac, 6.25%, 7/15/2032 | | | 1,931,000 | | | | 2,520,523 | |
| | | | | | | | |
Total Other Agencies
(Identified Cost $77,718,191) | | | | | | | 80,545,569 | |
| | | | | | | | |
TOTAL U.S. GOVERNMENT AGENCIES
(Identified Cost $117,958,248) | | | | | | | 120,910,087 | |
| | | | | | | | |
| | |
SHORT-TERM INVESTMENTS - 2.31% | | | | | | | | |
| | |
Dreyfus Cash Management, Inc. - Institutional Shares8, 0.16%,
(Identified Cost $22,700,876) | | | 22,700,876 | | | | 22,700,876 | |
| | | | | | | | |
TOTAL INVESTMENTS - 98.30%
(Identified Cost $897,437,148) | | | | | | | 967,553,834 | |
OTHER ASSETS, LESS LIABILITIES - 1.70% | | | | | | | 16,760,612 | |
| | | | | | | | |
NET ASSETS - 100% | | | | | | $ | 984,314,446 | |
| | | | | | | | |
FORWARD FOREIGN CURRENCY EXCHANGE CONTRACTS OPEN AT OCTOBER 31, 20109 :
| | | | | | | | | | | | |
Settlement Date | | Contracts to Deliver | | | In Exchange
For | | Contracts
At Value | | Unrealized
Depreciation | |
11/30/2010 | | EUR | 1,040,000 | | | $1,435,772 | | $1,446,934 | | $ | (11,162 | ) |
| ADR | - American Depository Receipt |
| NVDR | - Non-Voting Depository Receipt |
| * | Non-income producing security |
| 1 | International Fair Value factor from pricing service was applied. |
| 2 | The Bank of New York Mellon Corp. is the Series’ custodian and serves as sub-accountant and sub-transfer agent to the Series. |
| 3 | Latest quoted sales price is not available and the latest quoted bid price was used to value the security. |
| 4 | Restricted securities - Investment in securities that are restricted as to public resale under the Securities Act of 1933, as amended. These securities have been sold under rule 144A and have been determined to be liquid. These securities amount to $26,696,064, or 2.71%, of the Series’ net assets as of October 31, 2010. |
| 5 | The coupon rate is floating and is the stated rate as of October 31, 2010. |
| 6 | Security insured under the Federal Deposit Insurance Corporation Temporary Liquidity Guarantee Program. |
| 7 | Security has been valued at fair value. |
| 8 | Rate shown is the current yield as of October 31, 2010. |
| 9 | The counterparty for all forward foreign currency exchange contracts is The Bank of New York Mellon Corp. |
| | | | |
| The accompanying notes are an integral part of the financial statements. | | | 106 | |
Statement of Assets and Liabilities - Pro-Blend® Extended Term Series
October 31, 2010
| | | | |
ASSETS: | | | | |
| |
Investments, at value (identified cost $897,437,148) (Note 2) | | $ | 967,553,834 | |
Cash | | | 405,250 | |
Receivable for securities sold | | | 16,803,789 | |
Interest receivable | | | 4,387,933 | |
Receivable for fund shares sold | | | 1,258,960 | |
Dividends receivable | | | 276,201 | |
Foreign tax reclaims receivable | | | 240,187 | |
| | | | |
| |
TOTAL ASSETS | | | 990,926,154 | |
| | | | |
| |
LIABILITIES: | | | | |
| |
Accrued management fees (Note 3) | | | 632,341 | |
Accrued shareholder services fees (Class S) (Class R) (Note 3) | | | 140,411 | |
Accrued fund accounting and administration fees (Note 3) | | | 39,423 | |
Accrued transfer agent fees (Note 3) | | | 26,789 | |
Accrued distribution and services (Rule 12b-1) fees (Class C) (Note 3) | | | 23,353 | |
Accrued directors’ fees (Note 3) | | | 2,043 | |
Accrued Chief Compliance Officer service fees (Note 3) | | | 247 | |
Payable for securities purchased | | | 5,015,720 | |
Payable for fund shares repurchased | | | 630,124 | |
Audit fees payable | | | 33,778 | |
Unrealized depreciation on foreign forward currency contracts (Note 2) | | | 11,162 | |
Other payables and accrued expenses | | | 56,317 | |
| | | | |
| |
TOTAL LIABILITIES | | | 6,611,708 | |
| | | | |
| |
TOTAL NET ASSETS | | $ | 984,314,446 | |
| | | | |
| |
NET ASSETS CONSIST OF: | | | | |
| |
Capital stock | | $ | 745,057 | |
Additional paid-in-capital | | | 916,654,743 | |
Undistributed net investment income | | | 6,992,979 | |
Accumulated net realized loss on investments, foreign currency and translation of other assets and liabilities | | | (10,204,269 | ) |
Net unrealized appreciation on investments, foreign currency and translation of other assets and liabilities | | | 70,125,936 | |
| | | | |
| |
TOTAL NET ASSETS | | $ | 984,314,446 | |
| | | | |
| | |
| 107 | | The accompanying notes are an integral part of the financial statements. |
Statement of Assets and Liabilities - Pro-Blend® Extended Term Series
October 31, 2010
| | | | |
NET ASSET VALUE, OFFERING PRICE AND REDEMPTION PRICE PER SHARE - Class S
($676,524,218/44,622,378 shares) | | $ | 15.16 | |
| | | | |
| |
NET ASSET VALUE, OFFERING PRICE AND REDEMPTION PRICE PER SHARE - Class I
($278,210,218/27,129,133 shares) | | $ | 10.26 | |
| | | | |
| |
NET ASSET VALUE, OFFERING PRICE AND REDEMPTION PRICE PER SHARE - Class C
($29,467,609/2,744,149 shares) | | $ | 10.74 | |
| | | | |
| |
NET ASSET VALUE, OFFERING PRICE AND REDEMPTION PRICE PER SHARE - Class R
($112,401/10,014 shares) | | $ | 11.22 | |
| | | | |
| | | | |
| The accompanying notes are an integral part of the financial statements. | | | 108 | |
Statement of Operations - Pro-Blend® Extended Term Series
For the Year Ended October 31, 2010
| | | | |
INVESTMENT INCOME: | | | | |
| |
Interest | | $ | 13,038,615 | |
Dividends (net of foreign taxes withheld, $205,941) | | | 7,311,824 | |
| | | | |
| |
Total Investment Income | | | 20,350,439 | |
| | | | |
| |
EXPENSES: | | | | |
| |
Management fees (Note 3) | | | 5,882,589 | |
Shareholder services fees (Class S) (Note 3) | | | 1,484,090 | |
Fund accounting and administration fees (Note 3) | | | 165,536 | |
Transfer agent fees (Note 3) | | | 106,433 | |
Distribution and service (Rule 12b-1) fees (Class C) (Note 3) | | | 106,426 | |
Directors’ fees (Note 3) | | | 17,151 | |
Chief Compliance Officer service fees (Note 3) | | | 2,724 | |
Distribution and service (Rule 12b-1) fees (Class R) (Note 3) | | | 25 | |
Custodian fees | | | 76,300 | |
Miscellaneous | | | 227,399 | |
| | | | |
| |
Total Expenses | | | 8,068,673 | |
Less reduction of expenses (Note 3) | | | (758 | ) |
| | | | |
| |
Net Expenses | | | 8,067,915 | |
| | | | |
| |
NET INVESTMENT INCOME | | | 12,282,524 | |
| | | | |
| |
REALIZED AND UNREALIZED GAIN (LOSS) ON INVESTMENTS AND FOREIGN CURRENCY: | | | | |
| |
Net realized gain (loss) on- | | | | |
Investments | | | 44,652,111 | |
Foreign currency and translation of other assets and liabilities | | | (16,775 | ) |
Forward foreign currency exchange contracts | | | (14,232 | ) |
| | | | |
| | | 44,621,104 | |
| | | | |
| |
Net change in unrealized appreciation (depreciation) on- | | | | |
Investments | | | 55,601,958 | |
Foreign currency and translation of other assets and liabilities | | | 2,632 | |
Forward foreign currency exchange contracts | | | (11,162 | ) |
| | | | |
| | | 55,593,428 | |
| | | | |
NET REALIZED AND UNREALIZED GAIN ON INVESTMENTS AND FOREIGN CURRENCY | | | 100,214,532 | |
| | | | |
| |
NET INCREASE IN NET ASSETS RESULTING FROM OPERATIONS | | $ | 112,497,056 | |
| | | | |
| | |
| 109 | | The accompanying notes are an integral part of the financial statements. |
Statements of Changes in Net Assets - Pro-Blend® Extended Term Series
| | | | | | | | |
| | | For the
Year Ended
10/31/10 | | | For the
Year Ended
10/31/09 | |
INCREASE (DECREASE) IN NET ASSETS: | | | | | | | | |
| | |
OPERATIONS: | | | | | | | | |
| | |
Net investment income | | $ | 12,282,524 | | | $ | 6,906,566 | |
Net realized gain (loss) on investments and foreign currency | | | 44,621,104 | | | | (47,544,092 | ) |
Net change in unrealized appreciation (depreciation) on investments and foreign currency | | | 55,593,428 | | | | 109,759,591 | |
| | | | | | | | |
| | |
Net increase from operations | | | 112,497,056 | | | | 69,122,065 | |
| | | | | | | | |
| | |
DISTRIBUTIONS TO SHAREHOLDERS (Note 8): | | | | | | | | |
| | |
From net investment income (Class S) | | | (6,793,985 | ) | | | (7,399,150 | ) |
From net investment income (Class C) | | | (75,511 | ) | | | — | |
From net investment income (Class I) | | | (2,848,491 | ) | | | (270,130 | ) |
| | | | | | | | |
| | |
Total distributions to shareholders | | | (9,717,987 | ) | | | (7,669,280 | ) |
| | | | | | | | |
| | |
CAPITAL STOCK ISSUED AND REPURCHASED: | | | | | | | | |
| | |
Net increase from capital share transactions (Note 5) | | | 271,820,376 | | | | 122,302,231 | |
| | | | | | | | |
| | |
Net increase in net assets | | | 374,599,445 | | | | 183,755,016 | |
| | |
NET ASSETS: | | | | | | | | |
| | |
Beginning of year | | | 609,715,001 | | | | 425,959,985 | |
| | | | | | | | |
| | |
End of year (including undistributed net investment income of $6,992,979 and $4,449,612, respectively) | | $ | 984,314,446 | | | $ | 609,715,001 | |
| | | | | | | | |
| | | | |
| The accompanying notes are an integral part of the financial statements. | | | 110 | |
Financial Highlights - Pro-Blend® Extended Term Series - Class S
| | | | | | | | | | | | | | | | | | | | |
| | | For the Years Ended | |
| | | 10/31/10 | | | 10/31/09 | | | 10/31/08 | | | 10/31/07 | | | 10/31/06 | |
Per share data (for a share outstanding throughout each year): | | | | | | | | | | | | | | | | | | | | |
Net asset value - Beginning of year | | $ | 13.32 | | | $ | 11.75 | | | $ | 17.82 | | | $ | 17.12 | | | $ | 15.82 | |
| | | | | | | | | | | | | | | | | | | | |
Income (loss) from investment operations: | | | | | | | | | | | | | | | | | | | | |
Net investment income | | | 0.22 | 1 | | | 0.17 | 1 | | | 0.22 | | | | 0.22 | | | | 0.21 | |
Net realized and unrealized gain (loss) on investments | | | 1.78 | | | | 1.60 | | | | (4.36 | ) | | | 1.88 | | | | 2.18 | |
| | | | | | | | | | | | | | | | | | | | |
Total from investment operations | | | 2.00 | | | | 1.77 | | | | (4.14 | ) | | | 2.10 | | | | 2.39 | |
| | | | | | | | | | | | | | | | | | | | |
Less distributions to shareholders: | | | | | | | | | | | | | | | | | | | | |
From net investment income | | | (0.16 | ) | | | (0.20 | ) | | | (0.21 | ) | | | (0.25 | ) | | | (0.14 | ) |
From net realized gain on investments | | | — | | | | — | | | | (1.72 | ) | | | (1.15 | ) | | | (0.95 | ) |
| | | | | | | | | | | | | | | | | | | | |
Total distributions to shareholders | | | (0.16 | ) | | | (0.20 | ) | | | (1.93 | ) | | | (1.40 | ) | | | (1.09 | ) |
| | | | | | | | | | | | | | | | | | | | |
Net asset value - End of year | | $ | 15.16 | | | $ | 13.32 | | | $ | 11.75 | | | $ | 17.82 | | | $ | 17.12 | |
| | | | | | | | | | | | | | | | | | | | |
Net assets - End of year
(000’s omitted) | | $ | 676,524 | | | $ | 511,700 | | | $ | 424,876 | | | $ | 596,991 | | | $ | 484,003 | |
| | | | | | | | | | | | | | | | | | | | |
Total return2 | | | 15.17 | % | | | 15.47 | % | | | (25.70 | %) | | | 12.95 | % | | | 16.03 | % |
Ratios (to average net assets)/Supplemental Data: | | | | | | | | | | | | | | | | | | | | |
Expenses* | | | 1.07 | % | | | 1.10 | % | | | 1.10 | % | | | 1.11 | % | | | 1.14 | % |
Net investment income | | | 1.52 | % | | | 1.48 | % | | | 1.50 | % | | | 1.37 | % | | | 1.42 | % |
Series portfolio turnover | | | 62 | % | | | 62 | % | | | 76 | % | | | 82 | % | | | 82 | % |
|
* The investment advisor did not impose all or a portion of its management fees, CCO fees, fund accounting and transfer agent fees and other fees in some years and in some years paid a portion of the Series’ expenses. If these expenses had been incurred by the Class, the expense ratio (to average net assets) would have been increased by the following amount: | |
| | | 0.00 | %3 | | | 0.01 | % | | | 0.00 | %3 | | | N/A | | | | N/A | |
| 1 | Calculated based on average shares outstanding during the year. |
| 2 | Represents aggregate total return for the year indicated, and assumes reinvestment of all distributions. Total return would have been lower had certain expenses not been waived or reimbursed during certain years. |
| | |
| 111 | | The accompanying notes are an integral part of the financial statements. |
Financial Highlights - Pro-Blend® Extended Term Series - Class I
| | | | | | | | | | | | |
| | | For the Years Ended | | | For the Period
3/28/081 to
10/31/08 | |
| | | 10/31/10 | | | 10/31/09 | | |
Per share data (for a share outstanding throughout each period): | | | | | | | | | | | | |
Net asset value - Beginning of period | | $ | 9.08 | | | $ | 8.10 | | | $ | 10.00 | |
| | | | | | | | | | | | |
Income (loss) from investment operations: | | | | | | | | | | | | |
Net investment income | | | 0.17 | 2 | | | 0.13 | 2 | | | 0.08 | |
Net realized and unrealized gain (loss) on investments | | | 1.22 | | | | 1.10 | | | | (1.91 | ) |
| | | | | | | | | | | | |
Total from investment operations | | | 1.39 | | | | 1.23 | | | | (1.83 | ) |
| | | | | | | | | | | | |
Less distributions to shareholders: | | | | | | | | | | | | |
From net investment income | | | (0.21 | ) | | | (0.25 | ) | | | (0.07 | ) |
| | | | | | | | | | | | |
Net asset value - End of period | | $ | 10.26 | | | $ | 9.08 | | | $ | 8.10 | |
| | | | | | | | | | | | |
Net assets - End of period (000’s omitted) | | $ | 278,210 | | | $ | 98,015 | | | $ | 1,084 | |
| | | | | | | | | | | | |
Total return3 | | | 15.39 | % | | | 15.82 | % | | | (18.46 | %) |
Ratios (to average net assets)/Supplemental Data: | | | | | | | | | | | | |
Expenses* | | | 0.83 | % | | | 0.85 | % | | | 0.85 | %4 |
Net investment income | | | 1.76 | % | | | 1.59 | % | | | 1.62 | %4 |
Series portfolio turnover | | | 62 | % | | | 62 | % | | | 76 | % |
|
* The investment advisor did not impose all or a portion of its management fees, CCO fees, fund accounting and transfer agent fees and other fees in some periods and in some periods paid a portion of the Series’ expenses. If these expenses had been incurred by the Class, the expense ratio (to average net assets) would have been increased by the following amount: | |
| | | |
| | | 0.00 | %5 | | | 0.00 | %5 | | | 0.02 | %4 |
| 1 | Commencement of operations. |
| 2 | Calculated based on average shares outstanding during the period. |
| 3 | Represents aggregate total return for the periods indicated, and assumes reinvestment of all distributions. Total return would have been lower had certain expenses not been waived or reimbursed during the periods. Periods less than one year are not annualized. |
| | | | |
| The accompanying notes are an integral part of the financial statements. | | | 112 | |
Financial Highlights - Pro-Blend® Extended Term Series - Class C
| | | | |
| | | For the Period
1/4/101 to
10/31/10 | |
Per share data (for a share outstanding throughout the period): | | | | |
Net asset value - Beginning of period | | $ | 10.00 | |
| | | | |
Income from investment operations: | | | | |
Net investment income | | | 0.06 | 2 |
Net realized and unrealized gain on investments | | | 0.73 | |
| | | | |
Total from investment operations | | | 0.79 | |
| | | | |
Less distributions to shareholders: | | | | |
From net investment income | | | (0.05 | ) |
| | | | |
Net asset value - End of period | | $ | 10.74 | |
| | | | |
Net assets - End of period (000’s omitted) | | $ | 29,468 | |
| | | | |
Total return3 | | | 7.97 | % |
Ratios (to average net assets)/Supplemental Data: | | | | |
Expenses* | | | 1.83 | %4 |
Net investment income | | | 0.75 | %4 |
Series portfolio turnover | | | 62 | % |
| * | The investment advisor did not impose all or a portion of other fees during the period and paid a portion of the Series’ expenses. If these expenses had been incurred by the Class, the expense ratio (to average net assets) would have been increased by the following amount: |
| 1 | Commencement of operations. |
| 2 | Calculated based on average shares outstanding during the period. |
| 3 | Represents aggregate total return for the period indicated, and assumes reinvestment of all distributions. Total return would have been lower had certain expenses not been waived during the period. Periods less than one year are not annualized. |
| | |
| 113 | | The accompanying notes are an integral part of the financial statements. |
Financial Highlights - Pro-Blend® Extended Term Series - Class R
| | | | |
| | | For the Period
6/30/101 to
10/31/10 | |
Per share data (for a share outstanding throughout the period): | | | | |
Net asset value - Beginning of period | | $ | 10.00 | |
| | | | |
Income from investment operations: | | | | |
Net investment income | | | 0.02 | 2 |
Net realized and unrealized gain on investments | | | 1.20 | |
| | | | |
Total from investment operations | | | 1.22 | |
| | | | |
Net asset value - End of period | | $ | 11.22 | |
| | | | |
Net assets - End of period (000’s omitted) | | $ | 112 | |
| | | | |
Total return3 | | | 12.20 | % |
Ratios (to average net assets)/Supplemental Data: | | | | |
Expenses* | | | 1.33 | %4 |
Net investment income | | | 0.43 | %4 |
Series portfolio turnover | | | 62 | % |
| 1 | Commencement of operations. |
| 2 | Calculated based on average shares outstanding during the period. |
| 3 | Represents aggregate total return for the period indicated, and assumes reinvestment of all distributions. Total return would have been lower had certain expenses not been waived during the period. Periods less than one year are not annualized. |
| | | | |
| The accompanying notes are an integral part of the financial statements. | | | 114 | |
Performance Update - Pro-Blend® Maximum Term Series (unaudited)
| | | | | | | | | | | | | | | | |
| | | Average Annual Total Returns
As of October 31, 2010 | |
| | | One
Year | | | Five
Year | | | Ten
Year | | | Since
Inception1 | |
Manning & Napier Fund, Inc. - Pro-Blend® Maximum Term Series - Class S2 | | | 17.17 | % | | | 4.23 | % | | | 5.17 | % | | | 9.09 | % |
Manning & Napier Fund, Inc. - Pro-Blend® Maximum Term Series - Class I2,3 | | | 17.47 | % | | | 4.49 | % | | | 5.49 | % | | | 9.43 | % |
Manning & Napier Fund, Inc. - Pro-Blend® Maximum Term Series - Class C2,3 | | | 16.31 | % | | | 3.47 | % | | | 4.45 | % | | | 8.35 | % |
Manning & Napier Fund, Inc. - Pro-Blend® Maximum Term Series - Class R2,3 | | | 17.02 | % | | | 4.01 | % | | | 4.98 | % | | | 8.90 | % |
Russell 3000® Index4,6 | | | 18.34 | % | | | 2.08 | % | | | 0.62 | % | | | 6.92 | % |
20%/65%/15% Blended Index4,5,6 | | | 15.94 | % | | | 3.76 | % | | | 2.61 | % | | | 6.94 | % |
The following graph compares the value of a $10,000 investment in the Manning & Napier Fund, Inc. - Pro-Blend® Maximum Term Series - Class S for the ten years ended October 31, 2010 to the Russell 3000® Index and a 20%/65%/15% Blended Index.
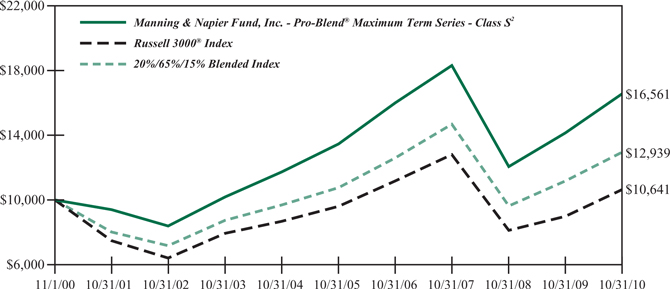
| 1 | Performance numbers for the Series and Indices are calculated from November 1, 1995, the Class S inception date. |
| 2 | The Series’ performance does not reflect the deduction of taxes that a shareholder would pay on fund distributions or the redemption of shares. The Series’ performance is historical and may not be indicative of future results. The performance returns shown are inclusive of the net expense ratio of the Series. For the year ended October 31, 2010, this net expense ratio was 1.10% for Class S, 0.85% for Class I, 1.85% for Class C and 1.35% for Class R. The gross expense ratio, which does not account for any voluntary or contractual waivers currently in effect, was 1.10% for Class S, 0.85% for Class I, 1.86% for Class C and 1.35% for Class R for the year ended October 31, 2010. |
| 3 | For periods prior to the inception of Class I on March 28, 2008, Class C on January 4, 2010 and Class R on June 30, 2010, the performance figures are hypothetical and reflect the performance of the Manning & Napier Fund, Inc. - Pro-Blend® Maximum Term Series - Class S adjusted for expense differences. |
| 4 | The Russell 3000® Index is an unmanaged index that consists of 3,000 of the largest U.S. companies based on total market capitalization. The Index returns are based on a market capitalization weighted average of relative price changes of the component stocks plus dividends whose reinvestments are compounded daily. The Index returns, unlike Series returns, do not reflect any fees or expenses. |
| 5 | The 20%/65%/15% Blended Index is 20% Morgan Stanley Capital International (MSCI) All Country World Index ex U.S., 65% Russell 3000® Index, and 15% Barclays Capital U.S. Aggregate Bond Index. The MSCI All Country World Index ex U.S. is a free float-adjusted market capitalization weighted index that is designed to measure equity market performance in the global developed and emerging markets and consists of 47 developed and emerging market country indices outside the United States. The Index is denominated in U.S. Dollars. The Index returns assume daily reinvestment of gross dividends (which do not account for foreign dividend taxation) from the inception of the Series through December 31, 1998, as net returns were not available. Subsequent to December 31, 1998, the Index returns assume daily reinvestment of net dividends (thus accounting for foreign dividend taxation). The Barclays Capital U.S.Aggregate Bond Index is an unmanaged index that represents the U.S. domestic investment-grade bond market. It is a market value weighted index of investment-grade debt issues, including government, corporate, asset-backed and mortgage-backed securities, with maturities of one year or more. The Index returns assume reinvestment of income. Both Indices’ returns, unlike Series returns, do not reflect any fees or expenses. |
| 6 | Because the Series’ asset allocation will vary over time, the composition of the Series’ portfolio may not match the composition of the comparative Indices’ portfolios. |
Shareholder Expense Example - Pro-Blend® Maximum Term Series (unaudited)
As a shareholder of the Series, you may incur two types of costs: (1) transaction costs, including potential wire charges on redemptions and (2) ongoing costs, including management fees and other Series expenses. This example is intended to help you understand your ongoing costs (in dollars) of investing in the Series and to compare these costs with the ongoing costs of investing in other mutual funds.
The example is based on an investment of $1,000 invested at the beginning of the period and held for the entire period (May 1, 2010 to October 31, 2010, except for Class R Actual, which is from June 30, 2010* to October 31, 2010).
Actual Expenses
The Actual lines of the table below provide information about actual account values and actual expenses. You may use the information in these lines, together with the amount you invested, to estimate the expenses that you paid over the period. Simply divide your account value by $1,000 (for example, an $8,600 account value divided by $1,000 = 8.6), then multiply the result by the number in the Actual line for the Class in which you have invested under the heading entitled “Expenses Paid During Period” to estimate the expenses you paid on your account during this period.
Hypothetical Example for Comparison Purposes
The Hypothetical lines of the table below provide information about hypothetical account values and hypothetical expenses based on the Class’ actual expense ratio and an assumed rate of return of 5% per year before expenses, which is not the Class’ actual return. The hypothetical account values and expenses may not be used to estimate the actual ending account balance or expenses you paid during the period. You may use this information to compare the ongoing costs of investing in the Series and other funds. To do so, compare this 5% hypothetical example for the Class in which you have invested with the 5% hypothetical examples that appear in the shareholder reports of the other funds.
Please note that the expenses shown in the table are meant to highlight your ongoing costs only and do not reflect any transaction costs. Therefore, the Hypothetical lines of the table are useful in comparing ongoing costs only, and will not help you determine the relative total costs of owning different funds. In addition, if these transaction costs were included, your costs would have been higher.
| | | | | | | | | | | | | | | | |
| | | Beginning
Account Value
5/1/10* | | | Ending
Account Value
10/31/10 | | | Expenses Paid
During Period
5/1/10-10/31/10** | | | Annualized
Expense ratio | |
Class S | | | | | | | | | | | | | | | | |
Actual | | $ | 1,000.00 | | | $ | 1,018.70 | | | $ | 5.60 | | | | 1.10 | % |
Hypothetical
(5% return before expenses) | | $ | 1,000.00 | | | $ | 1,019.66 | | | $ | 5.60 | | | | 1.10 | % |
Class I | | | | | | | | | | | | | | | | |
Actual | | $ | 1,000.00 | | | $ | 1,019.50 | | | $ | 4.33 | | | | 0.85 | % |
Hypothetical
(5% return before expenses) | | $ | 1,000.00 | | | $ | 1,020.92 | | | $ | 4.33 | | | | 0.85 | % |
Class C | | | | | | | | | | | | | | | | |
Actual | | $ | 1,000.00 | | | $ | 1,013.20 | | | $ | 9.39 | | | | 1.85 | % |
Hypothetical
(5% return before expenses) | | $ | 1,000.00 | | | $ | 1,015.88 | | | $ | 9.40 | | | | 1.85 | % |
Class R | | | | | | | | | | | | | | | | |
Actual | | $ | 1,000.00 | | | $ | 1,164.00 | | | $ | 4.92 | | | | 1.35 | % |
Hypothetical
(5% return before expenses) | | $ | 1,000.00 | | | $ | 1,012.30 | | | $ | 4.58 | | | | 1.35 | % |
| * | Class R inception date was June 30, 2010. |
Shareholder Expense Example - Pro-Blend® Maximum Term Series (unaudited)
| ** | Expenses are equal to the Class’ annualized expense ratio (for the six-month period), multiplied by the average account value over the period, multiplied by 184/365 to reflect the one-half year period (except for the Series’ Class R Actual return information, which reflects the 123 day period ended October 31, 2010 due to its inception date of June 30, 2010). Expenses are based on the most recent fiscal half year; therefore, the expense ratios stated above may differ from the expense ratios stated in the financial highlights, which is based on one-year data. The Class’ total return would have been lower had certain expenses not been waived during the period. |
Portfolio Composition - Pro-Blend® Maximum Term Series (unaudited)
As Of October 31, 2010
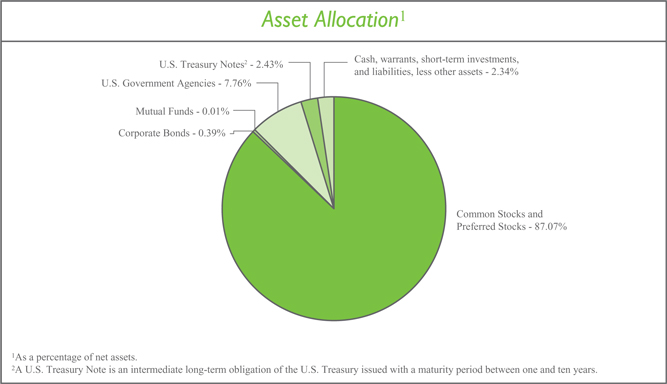
| | | | |
Sector Allocation3 | |
Information Technology | | | 17.91 | % |
Industrials | | | 13.72 | % |
Financials | | | 13.39 | % |
Health Care | | | 11.45 | % |
Consumer Discretionary | | | 10.32 | % |
Consumer Staples | | | 7.96 | % |
Energy | | | 7.44 | % |
Materials | | | 4.47 | % |
Telecommunication Services | | | 0.21 | % |
Utilities | | | 0.19 | % |
|
3 Including common stocks, preferred stocks, warrants and corporate bonds, as a percentage of total investments. | |
| | | | |
Top Ten Stock Holdings4 | |
Google, Inc. - Class A | | | 2.52 | % |
Monsanto Co. | | | 2.32 | % |
The Charles Schwab Corp. | | | 2.19 | % |
Hess Corp. | | | 2.03 | % |
United Parcel Service, Inc. - Class B | | | 1.83 | % |
Cisco Systems, Inc. | | | 1.81 | % |
Becton, Dickinson and Co. | | | 1.70 | % |
Alere, Inc. | | | 1.70 | % |
The Progressive Corp. | | | 1.68 | % |
Time Warner, Inc. | | | 1.66 | % |
| |
4 As a percentage of total investments. | | | | |
Investment Portfolio - October 31, 2010
| | | | | | | | |
Pro-Blend® Maximum Term Series | | Shares | | | Value
(Note 2) | |
| | |
COMMON STOCKS - 87.04% | | | | | | | | |
| | |
Consumer Discretionary - 10.37% | | | | | | | | |
Auto Components - 0.05% | | | | | | | | |
Hankook Tire Co. Ltd. (South Korea)1 | | | 15,270 | | | $ | 397,736 | |
| | | | | | | | |
Automobiles - 0.05% | | | | | | | | |
Suzuki Motor Corp. (Japan)1 | | | 4,600 | | | | 112,270 | |
Yamaha Motor Co. Ltd. (Japan)*,1 | | | 18,000 | | | | 276,186 | |
| | | | | | | | |
| | | | | | | 388,456 | |
| | | | | | | | |
Distributors - 0.05% | | | | | | | | |
Inchcape plc (United Kingdom)*,1 | | | 65,700 | | | | 367,150 | |
| | | | | | | | |
Hotels, Restaurants & Leisure - 0.14% | | | | | | | | |
Accor S.A. (France)1 | | | 2,100 | | | | 86,180 | |
Choice Hotels International, Inc. | | | 9,450 | | | | 359,383 | |
Club Mediterranee S.A. (France)*,1 | | | 6,455 | | | | 126,369 | |
Hyatt Hotels Corp. - Class A* | | | 3,650 | | | | 147,095 | |
Wendy’s - Arby’s Group, Inc. - Class A | | | 74,540 | | | | 342,884 | |
| | | | | | | | |
| | | | | | | 1,061,911 | |
| | | | | | | | |
Household Durables - 0.25% | | | | | | | | |
Corporacion Geo S.A.B. de C.V. - Class B (Mexico)* | | | 66,310 | | | | 210,508 | |
Harman International Industries, Inc.* | | | 8,420 | | | | 282,491 | |
Lennar Corp. - Class A | | | 11,080 | | | | 160,771 | |
LG Electronics, Inc. (South Korea)1 | | | 2,780 | | | | 244,798 | |
NVR, Inc.* | | | 330 | | | | 207,045 | |
Rodobens Negocios Imobiliarios S.A. (Brazil) | | | 55,190 | | | | 571,278 | |
Tupperware Brands Corp. | | | 3,880 | | | | 173,863 | |
| | | | | | | | |
| | | | | | | 1,850,754 | |
| | | | | | | | |
Leisure Equipment & Products - 0.02% | | | | | | | | |
Sankyo Co. Ltd. (Japan)1 | | | 2,100 | | | | 111,886 | |
| | | | | | | | |
Media - 8.34% | | | | | | | | |
Discovery Communications, Inc. - Class A* | | | 188,150 | | | | 8,393,372 | |
Gestevision Telecinco S.A. (Spain)1 | | | 47,880 | | | | 610,988 | |
Grupo Televisa S.A. - ADR (Mexico) | | | 17,470 | | | | 392,201 | |
Imax Corp. (Canada)* | | | 17,950 | | | | 388,617 | |
Liberty Global, Inc. - Class A* | | | 121,310 | | | | 4,584,305 | |
Mediacom Communications Corp. - Class A* | | | 24,070 | | | | 166,083 | |
Mediaset S.p.A. (Italy)1 | | | 520,480 | | | | 3,842,810 | |
Reed Elsevier plc (United Kingdom)1 | | | 843,130 | | | | 7,233,535 | |
Reed Elsevier plc - ADR (United Kingdom) | | | 5,125 | | | | 175,839 | |
Societe Television Francaise 1 (France)1 | | | 39,080 | | | | 640,526 | |
Time Warner, Inc. | | | 378,330 | | | | 12,299,508 | |
Virgin Media, Inc. (United Kingdom) | | | 206,610 | | | | 5,254,092 | |
The Walt Disney Co. | | | 215,200 | | | | 7,770,872 | |
| | |
| 119 | | The accompanying notes are an integral part of the financial statements. |
Investment Portfolio - October 31, 2010
| | | | | | | | |
Pro-Blend® Maximum Term Series | | Shares | | | Value
(Note 2) | |
| | |
COMMON STOCKS (continued) | | | | | | | | |
| | |
Consumer Discretionary (continued) | | | | | | | | |
Media (continued) | | | | | | | | |
The Washington Post Co. - Class B | | | 23,720 | | | $ | 9,538,998 | |
Wolters Kluwer N.V. (Netherlands)1 | | | 9,750 | | | | 222,250 | |
| | | | | | | | |
| | | | | | | 61,513,996 | |
| | | | | | | | |
Multiline Retail - 0.09% | | | | | | | | |
Marks & Spencer Group plc (United Kingdom)1 | | | 48,350 | | | | 331,361 | |
PPR (France)1 | | | 1,965 | | | | 323,190 | |
| | | | | | | | |
| | | | | | | 654,551 | |
| | | | | | | | |
Specialty Retail - 1.32% | | | | | | | | |
Chico’s FAS, Inc. | | | 15,650 | | | | 152,118 | |
Dick’s Sporting Goods, Inc.* | | | 189,430 | | | | 5,459,373 | |
The Finish Line, Inc. - Class A | | | 12,710 | | | | 194,463 | |
KOMERI Co. Ltd. (Japan)1 | | | 5,400 | | | | 112,168 | |
Lumber Liquidators Holdings, Inc.* | | | 9,950 | | | | 239,596 | |
The Sherwin-Williams Co. | | | 48,550 | | | | 3,542,693 | |
| | | | | | | | |
| | | | | | | 9,700,411 | |
| | | | | | | | |
Textiles, Apparel & Luxury Goods - 0.06% | | | | | | | | |
Adidas AG (Germany)1 | | | 4,050 | | | | 263,785 | |
Skechers U.S.A., Inc. - Class A* | | | 8,410 | | | | 163,491 | |
| | | | | | | | |
| | | | | | | 427,276 | |
| | | | | | | | |
Total Consumer Discretionary | | | | | | | 76,474,127 | |
| | | | | | | | |
Consumer Staples - 7.96% | | | | | | | | |
Beverages - 2.27% | | | | | | | | |
The Coca-Cola Co. | | | 138,180 | | | | 8,473,198 | |
Diageo plc (United Kingdom)1 | | | 13,970 | | | | 257,714 | |
Heineken N.V. (Netherlands)1 | | | 9,410 | | | | 477,701 | |
Kirin Holdings Co. Ltd. (Japan)1 | | | 18,000 | | | | 246,667 | |
PepsiCo, Inc. | | | 111,220 | | | | 7,262,666 | |
| | | | | | | | |
| | | | | | | 16,717,946 | |
| | | | | | | | |
Food & Staples Retailing - 2.00% | | | | | | | | |
BJ’s Wholesale Club, Inc.* | | | 6,090 | | | | 254,136 | |
Carrefour S.A. (France)1 | | | 24,970 | | | | 1,351,965 | |
Casino Guichard-Perrachon S.A. (France)1 | | | 2,880 | | | | 270,954 | |
The Kroger Co. | | | 264,850 | | | | 5,826,700 | |
Safeway, Inc. | | | 255,280 | | | | 5,845,912 | |
SUPERVALU, Inc. | | | 22,920 | | | | 247,307 | |
Tesco plc (United Kingdom)1 | | | 135,710 | | | | 928,753 | |
| | | | | | | | |
| | | | | | | 14,725,727 | |
| | | | | | | | |
| | | | |
| The accompanying notes are an integral part of the financial statements. | | | 120 | |
Investment Portfolio - October 31, 2010
| | | | | | | | |
Pro-Blend® Maximum Term Series | | Shares | | | Value
(Note 2) | |
| | |
COMMON STOCKS (continued) | | | | | | | | |
| | |
Consumer Staples (continued) | | | | | | | | |
Food Products - 3.57% | | | | | | | | |
Danone S.A. (France)1 | | | 8,770 | | | $ | 556,067 | |
Diamond Foods, Inc. | | | 4,020 | | | | 177,684 | |
Flowers Foods, Inc. | | | 13,620 | | | | 347,038 | |
General Mills, Inc. | | | 107,740 | | | | 4,044,560 | |
Kellogg Co. | | | 70,630 | | | | 3,549,864 | |
Nestle S.A. (Switzerland)1 | | | 153,290 | | | | 8,396,382 | |
Sanderson Farms, Inc. | | | 4,300 | | | | 180,514 | |
Suedzucker AG (Germany)1 | | | 6,820 | | | | 161,026 | |
Unilever plc - ADR (United Kingdom) | | | 308,944 | | | | 8,965,555 | |
| | | | | | | | |
| | | | | | | 26,378,690 | |
| | | | | | | | |
Household Products - 0.05% | | | | | | | | |
Reckitt Benckiser Group plc (United Kingdom)1 | | | 6,700 | | | | 374,321 | |
| | | | | | | | |
Personal Products - 0.07% | | | | | | | | |
Alberto-Culver Co. | | | 7,930 | | | | 295,710 | |
Beiersdorf AG (Germany)1 | | | 2,440 | | | | 158,967 | |
Kao Corp. (Japan)1 | | | 3,900 | | | | 99,126 | |
| | | | | | | | |
| | | | | | | 553,803 | |
| | | | | | | | |
Total Consumer Staples | | | | | | | 58,750,487 | |
| | | | | | | | |
Energy - 7.48% | | | | | | | | |
Energy Equipment & Services - 3.83% | | | | | | | | |
Baker Hughes, Inc. | | | 190,947 | | | | 8,846,575 | |
Calfrac Well Services Ltd. (Canada) | | | 24,560 | | | | 617,432 | |
Compagnie Generale de Geophysique - Veritas (CGG - Veritas) (France)*,1 | | | 16,850 | | | | 393,596 | |
Dril-Quip, Inc.* | | | 5,320 | | | | 367,612 | |
Schlumberger Ltd. | | | 129,100 | | | | 9,022,799 | |
Trican Well Service Ltd. (Canada) | | | 44,200 | | | | 766,208 | |
Weatherford International Ltd. (Switzerland)* | | | 490,726 | | | | 8,249,104 | |
| | | | | | | | |
| | | | | | | 28,263,326 | |
| | | | | | | | |
Oil, Gas & Consumable Fuels - 3.65% | | | | | | | | |
Cameco Corp. (Canada) | | | 309,730 | | | | 9,589,241 | |
Forest Oil Corp.* | | | 4,710 | | | | 144,738 | |
Hess Corp. | | | 239,040 | | | | 15,066,691 | |
Mariner Energy, Inc.* | | | 7,125 | | | | 177,555 | |
Paladin Energy Ltd. (Australia)* | | | 88,080 | | | | 357,536 | |
Repsol YPF S.A. (Spain)1 | | | 5,700 | | | | 158,064 | |
Royal Dutch Shell plc - Class B (Netherlands)1 | | | 7,474 | | | | 239,182 | |
Royal Dutch Shell plc - Class B - ADR (Netherlands) | | | 7,420 | | | | 477,254 | |
Talisman Energy, Inc. (Canada) | | | 23,710 | | | | 429,844 | |
| | |
| 121 | | The accompanying notes are an integral part of the financial statements. |
Investment Portfolio - October 31, 2010
| | | | | | | | |
Pro-Blend® Maximum Term Series | | Shares | | | Value
(Note 2) | |
| | |
COMMON STOCKS (continued) | | | | | | | | |
| | |
Energy (continued) | | | | | | | | |
Oil, Gas & Consumable Fuels (continued) | | | | | | | | |
Total S.A. (France)1 | | | 4,820 | | | $ | 262,373 | |
| | | | | | | | |
| | | | | | | 26,902,478 | |
| | | | | | | | |
Total Energy | | | | | | | 55,165,804 | |
| | | | | | | | |
Financials - 13.11% | | | | | | | | |
Capital Markets - 4.93% | | | | | | | | |
The Bank of New York Mellon Corp.2 | | | 477,920 | | | | 11,976,675 | |
The Charles Schwab Corp. | | | 1,053,970 | | | | 16,231,138 | |
Credit Suisse Group AG - ADR (Switzerland) | | | 3,250 | | | | 134,875 | |
Daiwa Securities Group, Inc. (Japan)1 | | | 4,000 | | | | 16,309 | |
Evercore Partners, Inc. - Class A | | | 5,420 | | | | 164,551 | |
Financial Engines, Inc.* | | | 9,590 | | | | 141,261 | |
GAM Holding AG (Switzerland)*,1 | | | 36,170 | | | | 571,447 | |
The Goldman Sachs Group, Inc. | | | 2,050 | | | | 329,948 | |
Greenhill & Co., Inc. | | | 1,880 | | | | 146,020 | |
Lazard Ltd. - Class A (Bermuda) | | | 4,250 | | | | 156,825 | |
Nomura Holdings, Inc. (Japan)1 | | | 7,000 | | | | 35,971 | |
Northern Trust Corp. | | | 120,670 | | | | 5,988,852 | |
State Street Corp. | | | 11,370 | | | | 474,811 | |
| | | | | | | | |
| | | | | | | 36,368,683 | |
| | | | | | | | |
Commercial Banks - 1.48% | | | | | | | | |
Banco Santander S.A. (Spain)1 | | | 15,870 | | | | 203,701 | |
Banco Santander S.A. - ADR (Spain) | | | 36,050 | | | | 461,800 | |
Barclays plc - ADR (United Kingdom) | | | 6,310 | | | | 111,372 | |
BNP Paribas (France)1 | | | 2,163 | | | | 158,215 | |
The Chugoku Bank Ltd. (Japan)1 | | | 11,100 | | | | 128,752 | |
Credit Agricole S.A. (France)1 | | | 5,240 | | | | 85,940 | |
First Commonwealth Financial Corp. | | | 114,370 | | | | 665,633 | |
First Financial Bancorp | | | 18,000 | | | | 303,120 | |
The Hachijuni Bank Ltd. (Japan)1 | | | 20,400 | | | | 104,686 | |
Hong Leong Financial Group Berhad (Malaysia)1 | | | 69,020 | | | | 202,512 | |
HSBC Holdings plc (United Kingdom)1 | | | 669,070 | | | | 6,963,480 | |
HSBC Holdings plc - ADR (United Kingdom) | | | 8,775 | | | | 457,265 | |
ICICI Bank Ltd. - ADR (India) | | | 4,810 | | | | 252,910 | |
Mitsubishi UFJ Financial Group, Inc. (Japan)1 | | | 14,000 | | | | 64,974 | |
Societe Generale - ADR (France)3 | | | 12,660 | | | | 151,034 | |
The Sumitomo Trust & Banking Co. Ltd. (Japan)1 | | | 19,000 | | | | 103,736 | |
U.S. Bancorp | | | 20,630 | | | | 498,833 | |
| | | | | | | | |
| | | | | | | 10,917,963 | |
| | | | | | | | |
Consumer Finance - 1.53% | | | | | | | | |
American Express Co. | | | 265,990 | | | | 11,027,945 | |
| | | | |
| The accompanying notes are an integral part of the financial statements. | | | 122 | |
Investment Portfolio - October 31, 2010
| | | | | | | | |
Pro-Blend® Maximum Term Series | | Shares | | | Value
(Note 2) | |
| | |
COMMON STOCKS (continued) | | | | | | | | |
| | |
Financials (continued) | | | | | | | | |
Consumer Finance (continued) | | | | | | | | |
Discover Financial Services | | | 14,140 | | | $ | 249,571 | |
| | | | | | | | |
| | | | | | | 11,277,516 | |
| | | | | | | | |
Diversified Financial Services - 1.25% | | | | | | | | |
Bank of America Corp. | | | 11,620 | | | | 132,933 | |
Deutsche Boerse AG (Germany)1 | | | 103,610 | | | | 7,288,838 | |
Financiere Marc de Lacharriere S.A. (Fimalac) (France)1 | | | 6,420 | | | | 276,290 | |
ING Groep N.V. (Netherlands)*,1 | | | 5,355 | | | | 57,292 | |
JPMorgan Chase & Co. | | | 18,951 | | | | 713,126 | |
Moody’s Corp. | | | 29,080 | | | | 786,905 | |
| | | | | | | | |
| | | | | | | 9,255,384 | |
| | | | | | | | |
Insurance - 2.37% | | | | | | | | |
Allianz SE (Germany)1 | | | 10,538 | | | | 1,319,651 | |
The Allstate Corp. | | | 16,340 | | | | 498,207 | |
Amil Participacoes S.A. (Brazil) | | | 39,510 | | | | 402,001 | |
AXA S.A. (France)1 | | | 4,615 | | | | 84,164 | |
Brown & Brown, Inc. | | | 21,890 | | | | 487,928 | |
Mapfre S.A. (Spain)1 | | | 91,000 | | | | 302,390 | |
Muenchener Rueckversicherungs AG (MunichRe) (Germany)1 | | | 3,343 | | | | 522,513 | |
The Progressive Corp. | | | 587,520 | | �� | | 12,431,923 | |
Willis Group Holdings plc (United Kingdom) | | | 22,805 | | | | 725,199 | |
Zurich Financial Services AG (Switzerland)1 | | | 2,910 | | | | 712,128 | |
| | | | | | | | |
| | | | | | | 17,486,104 | |
| | | | | | | | |
Real Estate Investment Trusts (REITS) - 1.35% | | | | | | | | |
Alexandria Real Estate Equities, Inc. | | | 4,000 | | | | 293,920 | |
Alstria Office REIT AG (Germany)1 | | | 26,740 | | | | 372,542 | |
American Campus Communities, Inc. | | | 13,590 | | | | 429,852 | |
Apartment Investment & Management Co. - Class A | | | 14,700 | | | | 342,657 | |
Associated Estates Realty Corp. | | | 5,310 | | | | 73,756 | |
AvalonBay Communities, Inc. | | | 2,540 | | | | 270,027 | |
BioMed Realty Trust, Inc. | | | 24,670 | | | | 452,694 | |
Boston Properties, Inc. | | | 4,870 | | | | 419,745 | |
British Land Co. plc (United Kingdom)1 | | | 9,990 | | | | 81,563 | |
Camden Property Trust | | | 5,330 | | | | 264,315 | |
Cogdell Spencer, Inc. | | | 31,400 | | | | 206,298 | |
Corporate Office Properties Trust | | | 25,750 | | | | 913,867 | |
DiamondRock Hospitality Co.* | | | 6,740 | | | | 71,309 | |
Digital Realty Trust, Inc. | | | 4,570 | | | | 272,966 | |
Douglas Emmett, Inc. | | | 6,740 | | | | 120,916 | |
DuPont Fabros Technology, Inc. | | | 17,690 | | | | 444,019 | |
Equity Lifestyle Properties, Inc. | | | 3,820 | | | | 217,434 | |
| | |
| 123 | | The accompanying notes are an integral part of the financial statements. |
Investment Portfolio - October 31, 2010
| | | | | | | | |
Pro-Blend® Maximum Term Series | | Shares | | | Value
(Note 2) | |
| | |
COMMON STOCKS (continued) | | | | | | | | |
| | |
Financials (continued) | | | | | | | | |
Real Estate Investment Trusts (REITS) (continued) | | | | | | | | |
Equity One, Inc. | | | 4,950 | | | $ | 92,565 | |
Equity Residential | | | 4,790 | | | | 232,938 | |
HCP, Inc. | | | 7,450 | | | | 268,274 | |
Health Care REIT, Inc. | | | 4,530 | | | | 231,483 | |
Healthcare Realty Trust, Inc. | | | 10,300 | | | | 248,642 | |
Home Properties, Inc. | | | 7,540 | | | | 410,553 | |
Host Hotels & Resorts, Inc. | | | 19,393 | | | | 308,155 | |
LaSalle Hotel Properties | | | 10,310 | | | | 244,244 | |
Lexington Realty Trust | | | 11,260 | | | | 87,603 | |
Mack-Cali Realty Corp. | | | 2,940 | | | | 98,725 | |
National Health Investors, Inc. | | | 1,830 | | | | 84,729 | |
National Retail Properties, Inc. | | | 10,070 | | | | 272,897 | |
Omega Healthcare Investors, Inc. | | | 11,300 | | | | 259,900 | |
Pebblebrook Hotel Trust* | | | 12,110 | | | | 237,235 | |
Public Storage | | | 2,670 | | | | 264,917 | |
Realty Income Corp. | | | 12,820 | | | | 439,470 | |
Simon Property Group, Inc. | | | 3,136 | | | | 301,119 | |
Sovran Self Storage, Inc. | | | 2,930 | | | | 114,475 | |
Tanger Factory Outlet Centers | | | 4,900 | | | | 234,808 | |
UDR, Inc. | | | 11,690 | | | | 262,791 | |
| | | | | | | | |
| | | | | | | 9,943,403 | |
| | | | | | | | |
Real Estate Management & Development - 0.02% | | | | | | | | |
CB Richard Ellis Group, Inc. - Class A* | | | 4,740 | | | | 86,979 | |
Renhe Commercial Holdings Co. Ltd. (China)1 | | | 186,000 | | | | 35,578 | |
Thomas Properties Group, Inc.* | | | 11,440 | | | | 42,786 | |
| | | | | | | | |
| | | | | | | 165,343 | |
| | | | | | | | |
Thrifts & Mortgage Finance - 0.18% | | | | | | | | |
Aareal Bank AG (Germany)*,1 | | | 9,707 | | | | 236,988 | |
First Niagara Financial Group, Inc. | | | 53,690 | | | | 636,226 | |
Hudson City Bancorp, Inc. | | | 11,050 | | | | 128,733 | |
People’s United Financial, Inc. | | | 25,930 | | | | 319,198 | |
| | | | | | | | |
| | | | | | | 1,321,145 | |
| | | | | | | | |
Total Financials | | | | | | | 96,735,541 | |
| | | | | | | | |
Health Care - 11.50% | | | | | | | | |
Biotechnology - 0.41% | | | | | | | | |
Acorda Therapeutics, Inc.* | | | 12,360 | | | | 334,215 | |
Amgen, Inc.* | | | 15,930 | | | | 911,037 | |
Basilea Pharmaceutica AG (Switzerland)*,1 | | | 8,420 | | | | 590,665 | |
Celera Corp.* | | | 209,940 | | | | 1,196,658 | |
| | | | | | | | |
| | | | | | | 3,032,575 | |
| | | | | | | | |
| | | | |
| The accompanying notes are an integral part of the financial statements. | | | 124 | |
Investment Portfolio - October 31, 2010
| | | | | | | | |
Pro-Blend® Maximum Term Series | | Shares | | | Value
(Note 2) | |
| | |
COMMON STOCKS (continued) | | | | | | | | |
| | |
Health Care (continued) | | | | | | | | |
Health Care Equipment & Supplies - 7.17% | | | | | | | | |
Abaxis, Inc.* | | | 25,470 | | | $ | 611,535 | |
Alere, Inc.* | | | 426,509 | | | | 12,603,341 | |
Becton, Dickinson and Co. | | | 167,130 | | | | 12,621,658 | |
Boston Scientific Corp.* | | | 1,306,440 | | | | 8,335,087 | |
Cochlear Ltd. (Australia)1 | | | 18,680 | | | | 1,301,270 | |
Conceptus, Inc.* | | | 43,970 | | | | 624,814 | |
Covidien plc (Ireland) | | | 34,620 | | | | 1,380,299 | |
DENTSPLY International, Inc. | | | 33,500 | | | | 1,051,565 | |
DexCom, Inc.* | | | 62,704 | | | | 862,180 | |
Gen-Probe, Inc.* | | | 172,720 | | | | 8,364,830 | |
Hologic, Inc.* | | | 33,590 | | | | 538,112 | |
Insulet Corp.* | | | 60,260 | | | | 961,147 | |
Mindray Medical International Ltd. - ADR (China) | | | 3,470 | | | | 100,561 | |
Sirona Dental Systems, Inc.* | | | 15,580 | | | | 586,587 | |
Straumann Holding AG (Switzerland)1 | | | 5,774 | | | | 1,208,788 | |
Zoll Medical Corp.* | | | 53,950 | | | | 1,754,993 | |
| | | | | | | | |
| | | | | | | 52,906,767 | |
| | | | | | | | |
Health Care Providers & Services - 0.73% | | | | | | | | |
Bio-Reference Laboratories, Inc.* | | | 30,670 | | | | 661,245 | |
Bumrungrad Hospital Public Co. Ltd. - NVDR (Thailand)1 | | | 124,000 | | | | 142,643 | |
Cross Country Healthcare, Inc.* | | | 86,140 | | | | 628,822 | |
Diagnosticos da America S.A. (Brazil) | | | 133,680 | | | | 1,623,533 | |
Odontoprev S.A. (Brazil) | | | 46,320 | | | | 681,056 | |
Sonic Healthcare Ltd. (Australia)1 | | | 157,370 | | | | 1,678,987 | |
| | | | | | | | |
| | | | | | | 5,416,286 | |
| | | | | | | | |
Health Care Technology - 1.11% | | | | | | | | |
Allscripts Healthcare Solutions, Inc.* | | | 30,080 | | | | 574,227 | |
Cerner Corp.* | | | 86,593 | | | | 7,605,463 | |
| | | | | | | | |
| | | | | | | 8,179,690 | |
| | | | | | | | |
Life Sciences Tools & Services - 1.64% | | | | | | | | |
Caliper Life Sciences, Inc.* | | | 267,440 | | | | 1,203,480 | |
Lonza Group AG (Switzerland)1 | | | 47,920 | | | | 4,195,047 | |
Sequenom, Inc.* | | | 138,940 | | | | 882,269 | |
Thermo Fisher Scientific, Inc.* | | | 112,510 | | | | 5,785,264 | |
| | | | | | | | |
| | | | | | | 12,066,060 | |
| | | | | | | | |
Pharmaceuticals - 0.44% | | | | | | | | |
AstraZeneca plc (United Kingdom)1 | | | 2,175 | | | | 109,407 | |
AstraZeneca plc - ADR (United Kingdom) | | | 4,000 | | | | 201,840 | |
Bayer AG (Germany)1 | | | 11,706 | | | | 873,121 | |
GlaxoSmithKline plc (United Kingdom)1 | | | 14,755 | | | | 288,130 | |
| | |
| 125 | | The accompanying notes are an integral part of the financial statements. |
Investment Portfolio - October 31, 2010
| | | | | | | | |
Pro-Blend® Maximum Term Series | | Shares | | | Value
(Note 2) | |
| | |
COMMON STOCKS (continued) | | | | | | | | |
| | |
Health Care (continued) | | | | | | | | |
Pharmaceuticals (continued) | | | | | | | | |
Sanofi-Aventis S.A. (France)1 | | | 1,987 | | | $ | 139,213 | |
Santen Pharmaceutical Co. Ltd. (Japan)1 | | | 4,800 | | | | 165,404 | |
Shire plc (Ireland)1 | | | 16,590 | | | | 389,322 | |
Takeda Pharmaceutical Co. Ltd. (Japan)1 | | | 2,700 | | | | 126,566 | |
UCB S.A. (Belgium)1 | | | 24,700 | | | | 958,163 | |
| | | | | | | | |
| | | | | | | 3,251,166 | |
| | | | | | | | |
Total Health Care | | | | | | | 84,852,544 | |
| | | | | | | | |
Industrials - 13.73% | | | | | | | | |
Aerospace & Defense - 1.11% | | | | | | | | |
The Boeing Co. | | | 112,880 | | | | 7,973,843 | |
Empresa Brasileira de Aeronautica S.A. (Embraer) - ADR (Brazil) | | | 7,520 | | | | 216,952 | |
| | | | | | | | |
| | | | | | | 8,190,795 | |
| | | | | | | | |
Air Freight & Logistics - 3.04% | | | | | | | | |
Atlas Air Worldwide Holdings, Inc.* | | | 5,050 | | | | 263,913 | |
FedEx Corp. | | | 91,890 | | | | 8,060,591 | |
TNT N.V. (Netherlands)1 | | | 21,390 | | | | 568,849 | |
United Parcel Service, Inc. - Class B | | | 201,113 | | | | 13,542,950 | |
| | | | | | | | |
| | | | | | | 22,436,303 | |
| | | | | | | | |
Airlines - 2.38% | | | | | | | | |
Copa Holdings S.A. - Class A (Panama) | | | 4,600 | | | | 233,358 | |
Deutsche Lufthansa AG (Germany)*,1 | | | 17,640 | | | | 377,100 | |
Ryanair Holdings plc - ADR (Ireland) | | | 260,470 | | | | 8,499,136 | |
Southwest Airlines Co. | | | 611,267 | | | | 8,411,034 | |
| | | | | | | | |
| | | | | | | 17,520,628 | |
| | | | | | | | |
Commercial Services & Supplies - 1.14% | | | | | | | | |
Tomra Systems ASA (Norway)1 | | | 192,870 | | | | 1,175,288 | |
Waste Management, Inc. | | | 202,690 | | | | 7,240,087 | |
| | | | | | | | |
| | | | | | | 8,415,375 | |
| | | | | | | | |
Construction & Engineering - 0.88% | | | | | | | | |
MYR Group, Inc.* | | | 9,090 | | | | 141,713 | |
Quanta Services, Inc.* | | | 321,700 | | | | 6,324,622 | |
| | | | | | | | |
| | | | | | | 6,466,335 | |
| | | | | | | | |
Electrical Equipment - 0.25% | | | | | | | | |
ABB Ltd. (Asea Brown Boveri) - ADR (Switzerland)* | | | 37,900 | | | | 784,151 | |
Alstom S.A. (France)1 | | | 10,550 | | | | 532,797 | |
Nexans S.A. (France)1 | | | 2,650 | | | | 189,016 | |
Schneider Electric S.A. (France)1 | | | 2,280 | | | | 323,947 | |
| | | | | | | | |
| | | | | | | 1,829,911 | |
| | | | | | | | |
| | | | |
| The accompanying notes are an integral part of the financial statements. | | | 126 | |
Investment Portfolio - October 31, 2010
| | | | | | | | |
Pro-Blend® Maximum Term Series | | Shares | | | Value
(Note 2) | |
| | |
COMMON STOCKS (continued) | | | | | | | | |
| | |
Industrials (continued) | | | | | | | | |
Industrial Conglomerates - 0.19% | | | | | | | | |
Siemens AG (Germany)1 | | | 12,250 | | | $ | 1,397,914 | |
| | | | | | | | |
Machinery - 1.49% | | | | | | | | |
ArvinMeritor, Inc.* | | | 9,780 | | | | 162,152 | |
Astec Industries, Inc.* | | | 5,340 | | | | 157,370 | |
FANUC Ltd. (Japan)1 | | | 1,500 | | | | 217,155 | |
Lindsay Corp. | | | 3,910 | | | | 225,412 | |
Pall Corp. | | | 220,420 | | | | 9,405,321 | |
SmartHeat, Inc. (China)* | | | 8,080 | | | | 52,439 | |
Titan International, Inc. | | | 20,620 | | | | 312,805 | |
Wabtec Corp. | | | 6,360 | | | | 297,902 | |
Westport Innovations, Inc. (Canada)* | | | 8,980 | | | | 162,718 | |
| | | | | | | | |
| | | | | | | 10,993,274 | |
| | | | | | | | |
Professional Services - 2.09% | | | | | | | | |
Adecco S.A. (Switzerland)1 | | | 94,990 | | | | 5,314,859 | |
Manpower, Inc. | | | 91,380 | | | | 5,001,228 | |
Randstad Holding N.V. (Netherlands)*,1 | | | 107,590 | | | | 5,125,459 | |
| | | | | | | | |
| | | | | | | 15,441,546 | |
| | | | | | | | |
Road & Rail - 1.11% | | | | | | | | |
All America Latina Logistica S.A. (Brazil) | | | 80,870 | | | | 764,800 | |
Heartland Express, Inc. | | | 20,160 | | | | 300,586 | |
Norfolk Southern Corp. | | | 109,660 | | | | 6,742,993 | |
RailAmerica, Inc.* | | | 34,000 | | | | 394,400 | |
| | | | | | | | |
| | | | | | | 8,202,779 | |
| | | | | | | | |
Transportation Infrastructure - 0.05% | | | | | | | | |
Malaysia Airports Holdings Berhad (Malaysia)1 | | | 183,830 | | | | 358,851 | |
| | | | | | | | |
Total Industrials | | | | | | | 101,253,711 | |
| | | | | | | | |
Information Technology - 18.00% | | | | | | | | |
Communications Equipment - 4.29% | | | | | | | | |
Alcatel-Lucent - ADR (France)* | | | 282,290 | | | | 979,546 | |
Cisco Systems, Inc.* | | | 588,800 | | | | 13,442,304 | |
Infinera Corp.* | | | 100,220 | | | | 820,802 | |
Juniper Networks, Inc.* | | | 168,258 | | | | 5,449,877 | |
QUALCOMM, Inc. | | | 221,390 | | | | 9,991,331 | |
Riverbed Technology, Inc.* | | | 16,480 | | | | 948,259 | |
| | | | | | | | |
| | | | | | | 31,632,119 | |
| | | | | | | | |
Computers & Peripherals - 1.27% | | | | | | | | |
Apple, Inc.* | | | 1,390 | | | | 418,209 | |
Compellent Technologies, Inc.* | | | 34,600 | | | | 874,342 | |
EMC Corp.* | | | 374,870 | | | | 7,876,019 | |
| | |
| 127 | | The accompanying notes are an integral part of the financial statements. |
Investment Portfolio - October 31, 2010
| | | | | | | | |
Pro-Blend® Maximum Term Series | | Shares | | | Value
(Note 2) | |
| | |
COMMON STOCKS (continued) | | | | | | | | |
| | |
Information Technology (continued) | | | | | | | | |
Computers & Peripherals (continued) | | | | | | | | |
Immersion Corp.* | | | 27,740 | | | $ | 170,601 | |
| | | | | | | | |
| | | | | | | 9,339,171 | |
| | | | | | | | |
Electronic Equipment, Instruments & Components - 0.57% | | | | | | | | |
Amphenol Corp. - Class A | | | 48,430 | | | | 2,427,796 | |
Cogent, Inc.* | | | 85,820 | | | | 902,826 | |
Hitachi Ltd. (Japan)1 | | | 61,000 | | | | 275,699 | |
Keyence Corp. (Japan)1 | | | 542 | | | | 134,282 | |
LoJack Corp.* | | | 100,326 | | | | 490,594 | |
| | | | | | | | |
| | | | | | | 4,231,197 | |
| | | | | | | | |
Internet Software & Services - 3.25% | | | | | | | | |
comScore, Inc.* | | | 23,000 | | | | 540,730 | |
Google, Inc. - Class A* | | | 30,439 | | | | 18,658,803 | |
NetEase.com, Inc. - ADR (China)* | | | 4,190 | | | | 175,142 | |
Tencent Holdings Ltd. (China)1 | | | 9,900 | | | | 227,575 | |
VistaPrint N.V. (Netherlands)* | | | 87,620 | | | | 3,686,173 | |
Vocus, Inc.* | | | 30,720 | | | | 680,448 | |
| | | | | | | | |
| | | | | | | 23,968,871 | |
| | | | | | | | |
| | |
IT Services - 6.39% | | | | | | | | |
Accenture plc - Class A (Ireland) | | | 139,570 | | | | 6,240,175 | |
Amadeus IT Holding S.A. - Class A (Spain)*,1 | | | 18,020 | | | | 367,691 | |
Amdocs Ltd. (Guernsey)* | | | 51,820 | | | | 1,589,838 | |
Automatic Data Processing, Inc. | | | 199,069 | | | | 8,842,645 | |
Cap Gemini S.A. (France)1 | | | 14,620 | | | | 746,329 | |
Cielo S.A. (Brazil) | | | 77,190 | | | | 665,079 | |
MasterCard, Inc. - Class A | | | 36,420 | | | | 8,742,985 | |
Redecard S.A. (Brazil) | | | 44,990 | | | | 581,856 | |
Visa, Inc. - Class A | | | 110,180 | | | | 8,612,771 | |
The Western Union Co. | | | 609,800 | | | | 10,732,480 | |
| | | | | | | | |
| | | | | | | 47,121,849 | |
| | | | | | | | |
Semiconductors & Semiconductor Equipment - 0.70% | | | | | | | | |
Advantest Corp. (Japan)1 | | | 156,660 | | | | 2,975,525 | |
Infineon Technologies AG (Germany)*,1 | | | 70,000 | | | | 550,703 | |
Sumco Corp. (Japan)*,1 | | | 47,600 | | | | 736,072 | |
Taiwan Semiconductor Manufacturing Co. Ltd. - ADR (Taiwan) | | | 23,653 | | | | 258,054 | |
Tokyo Electron Ltd. (Japan)1 | | | 9,300 | | | | 524,737 | |
Yingli Green Energy Holding Co. Ltd. - ADR (China)* | | | 8,040 | | | | 93,747 | |
| | | | | | | | |
| | | | | | | 5,138,838 | |
| | | | | | | | |
Software - 1.53% | | | | | | | | |
Adobe Systems, Inc.* | | | 5,310 | | | | 149,476 | |
| | | | |
| The accompanying notes are an integral part of the financial statements. | | | 128 | |
Investment Portfolio - October 31, 2010
| | | | | | | | |
Pro-Blend® Maximum Term Series | | Shares | | | Value
(Note 2) | |
| | |
COMMON STOCKS (continued) | | | | | | | | |
| | |
Information Technology (continued) | | | | | | | | |
Software (continued) | | | | | | | | |
Autodesk, Inc.* | | | 221,550 | | | $ | 8,015,679 | |
Fortinet, Inc.* | | | 24,950 | | | | 748,500 | |
Microsoft Corp. | | | 32,170 | | | | 857,009 | |
Misys plc (United Kingdom)*,1 | | | 46,020 | | | | 207,204 | |
SAP AG (Germany)1 | | | 6,540 | | | | 340,729 | |
SolarWinds, Inc.* | | | 42,350 | | | | 768,652 | |
Square Enix Holdings Co. Ltd. (Japan)1 | | | 10,600 | | | | 221,384 | |
| | | | | | | | |
| | | | | | | 11,308,633 | |
| | | | | | | | |
Total Information Technology | | | | | | | 132,740,678 | |
| | | | | | | | |
Materials - 4.49% | | | | | | | | |
Chemicals - 2.53% | | | | | | | | |
Arkema S.A. (France)1 | | | 40 | | | | 2,585 | |
BASF SE (Germany)1 | | | 5,200 | | | | 378,101 | |
Calgon Carbon Corp.* | | | 22,488 | | | | 337,545 | |
Johnson Matthey plc (United Kingdom)1 | | | 7,620 | | | | 233,682 | |
Monsanto Co. | | | 288,730 | | | | 17,156,337 | |
The Scotts Miracle-Gro Co. - Class A | | | 4,070 | | | | 217,338 | |
Shin-Etsu Chemical Co. Ltd. (Japan)1 | | | 6,500 | | | | 328,679 | |
| | | | | | | | |
| | | | | | | 18,654,267 | |
| | | | | | | | |
Construction Materials - 1.12% | | | | | | | | |
CRH plc (Ireland)1 | | | 26,080 | | | | 450,032 | |
Eagle Materials, Inc. | | | 8,810 | | | | 206,683 | |
Martin Marietta Materials, Inc. | | | 47,350 | | | | 3,810,728 | |
Vulcan Materials Co. | | | 104,240 | | | | 3,805,802 | |
| | | | | | | | |
| | | | | | | 8,273,245 | |
| | | | | | | | |
Containers & Packaging - 0.83% | | | | | | | | |
Owens-Illinois, Inc.* | | | 217,300 | | | | 6,090,919 | |
| | | | | | | | |
Paper & Forest Products - 0.01% | | | | | | | | |
Norbord, Inc. (Canada)* | | | 7,002 | | | | 79,913 | |
| | | | | | | | |
Total Materials | | | | | | | 33,098,344 | |
| | | | | | | | |
Telecommunication Services - 0.21% | | | | | | | | |
Diversified Telecommunication Services - 0.14% | | | | | | | | |
France Telecom S.A. (France)1 | | | 13,330 | | | | 319,830 | |
Swisscom AG - ADR (Switzerland)3 | | | 9,116 | | | | 379,499 | |
Telefonica S.A. - ADR (Spain) | | | 1,700 | | | | 137,938 | |
Telenor ASA - ADR (Norway)3 | | | 3,430 | | | | 165,326 | |
| | | | | | | | |
| | | | | | | 1,002,593 | |
| | | | | | | | |
| | |
| 129 | | The accompanying notes are an integral part of the financial statements. |
Investment Portfolio - October 31, 2010
| | | | | | | | |
Pro-Blend® Maximum Term Series | | Shares | | | Value
(Note 2) | |
| | |
COMMON STOCKS (continued) | | | | | | | | |
| | |
Telecommunication Services (continued) | | | | | | | | |
Wireless Telecommunication Services - 0.07% | | | | | | | | |
SK Telecom Co. Ltd. - ADR (South Korea) | | | 28,400 | | | $ | 523,412 | |
| | | | | | | | |
Total Telecommunication Services | | | | | | | 1,526,005 | |
| | | | | | | | |
Utilities - 0.19% | | | | | | | | |
Electric Utilities - 0.07% | | | | | | | | |
E.ON AG (Germany)1 | | | 13,630 | | | | 426,625 | |
Prime Infrastructure Group (Australia)1 | | | 17,760 | | | | 86,737 | |
| | | | | | | | |
| | | | | | | 513,362 | |
| | | | | | | | |
Independent Power Producers & Energy Traders - 0.03% | | | | | | | | |
Mirant Corp.* | | | 9,630 | | | | 102,174 | |
RRI Energy, Inc.* | | | 29,060 | | | | 109,266 | |
| | | | | | | | |
| | | | | | | 211,440 | |
| | | | | | | | |
Multi-Utilities - 0.06% | | | | | | | | |
GDF Suez (France)1 | | | 4,464 | | | | 178,369 | |
National Grid plc (United Kingdom)1 | | | 24,670 | | | | 233,292 | |
| | | | | | | | |
| | | | | | | 411,661 | |
| | | | | | | | |
Water Utilities - 0.03% | | | | | | | | |
Cia de Saneamento de Minas Gerais - Copasa MG (Brazil) | | | 15,510 | | | | 237,808 | |
| | | | | | | | |
Total Utilities | | | | | | | 1,374,271 | |
| | | | | | | | |
TOTAL COMMON STOCKS
(Identified Cost $588,396,356) | | | | | | | 641,971,512 | |
| | | | | | | | |
| | |
PREFERRED STOCKS - 0.03% | | | | | | | | |
| | |
Consumer Staples - 0.03% | | | | | | | | |
Household Products - 0.03% | | | | | | | | |
Henkel AG & Co. KGaA (Germany)1
(Identified Cost $134,525) | | | 3,790 | | | | 223,552 | |
| | | | | | | | |
| | |
WARRANTS - 0.00%** | | | | | | | | |
| | |
Health Care - 0.00%** | | | | | | | | |
Life Sciences Tools & Services - 0.00%** | | | | | | | | |
Caliper Life Sciences, Inc., 8/10/2011*
(Identified Cost $2,672) | | | 4,132 | | | | 145 | |
| | | | | | | | |
| | | | |
| The accompanying notes are an integral part of the financial statements. | | | 130 | |
Investment Portfolio - October 31, 2010
| | | | | | | | |
Pro-Blend® Maximum Term Series | | Principal Amount/
Shares | | | Value
(Note 2) | |
| | |
CORPORATE BONDS - 0.39% | | | | | | | | |
| | |
Non-Convertible Corporate Bonds - 0.39% | | | | | | | | |
Financials - 0.34% | | | | | | | | |
Capital Markets - 0.12% | | | | | | | | |
The Goldman Sachs Group, Inc., 5.375%, 3/15/2020 | | $ | 410,000 | | | $ | 433,810 | |
Morgan Stanley, 5.50%, 1/26/2020 | | | 405,000 | | | | 421,559 | |
| | | | | | | | |
| | | | | | | 855,369 | |
| | | | | | | | |
Consumer Finance - 0.05% | | | | | | | | |
American Express Co., 8.125%, 5/20/2019 | | | 315,000 | | | | 404,639 | |
| | | | | | | | |
Diversified Financial Services - 0.17% | | | | | | | | |
Bank of America Corp., 7.625%, 6/1/2019 | | | 340,000 | | | | 398,024 | |
Citigroup, Inc., 8.50%, 5/22/2019 | | | 330,000 | | | | 414,374 | |
JPMorgan Chase & Co., 4.95%, 3/25/2020 | | | 385,000 | | | | 408,312 | |
| | | | | | | | |
| | | | | | | 1,220,710 | |
| | | | | | | | |
Total Financials | | | | | | | 2,480,718 | |
| | | | | | | | |
Industrials - 0.05% | | | | | | | | |
Industrial Conglomerates - 0.05% | | | | | | | | |
General Electric Capital Corp., 5.50%, 1/8/2020 | | | 375,000 | | | | 412,764 | |
| | | | | | | | |
TOTAL CORPORATE BONDS
(Identified Cost $2,658,986) | | | | | | | 2,893,482 | |
| | | | | | | | |
| | |
MUTUAL FUNDS - 0.01% | | | | | | | | |
| | |
iShares Dow Jones US Real Estate Index Fund
(Identified Cost $42,823) | | | 990 | | | | 54,371 | |
| | | | | | | | |
| | |
U.S. TREASURY SECURITIES - 2.43% | | | | | | | | |
| | |
U.S. Treasury Notes - 2.43% | | | | | | | | |
U.S. Treasury Note, 4.875%, 4/30/2011 | | $ | 6,500,000 | | | | 6,651,326 | |
U.S. Treasury Note, 2.625%, 6/30/2014 | | | 750,000 | | | | 801,387 | |
U.S. Treasury Note, 2.625%, 12/31/2014 | | | 3,000,000 | | | | 3,210,000 | �� |
U.S. Treasury Note, 1.25%, 9/30/2015 | | | 7,200,000 | | | | 7,233,754 | |
TOTAL U.S. TREASURY SECURITIES
(Identified Cost $17,634,613) | | | | | | | 17,896,467 | |
| | | | | | | | |
| | |
U.S. GOVERNMENT AGENCIES - 7.76% | | | | | | | | |
| | |
Other Agencies - 7.76% | | | | | | | | |
Fannie Mae, 4.375%, 10/15/2015 | | | 5,000,000 | | | | 5,708,790 | |
Fannie Mae, 1.625%, 10/26/2015 | | | 20,400,000 | | | | 20,594,453 | |
Fannie Mae, 6.25%, 5/15/2029 | | | 4,825,000 | | | | 6,232,679 | |
Fannie Mae, 7.25%, 5/15/2030 | | | 4,330,000 | | | | 6,170,856 | |
Fannie Mae, 6.625%, 11/15/2030 | | | 4,610,000 | | | | 6,167,263 | |
Freddie Mac, 6.75%, 3/15/2031 | | | 4,540,000 | | | | 6,190,476 | |
| | |
| 131 | | The accompanying notes are an integral part of the financial statements. |
Investment Portfolio - October 31, 2010
| | | | | | | | |
Pro-Blend® Maximum Term Series | | Principal Amount/
Shares | | | Value
(Note 2) | |
| | |
U.S. GOVERNMENT AGENCIES (continued) | | | | | | | | |
| | |
Other Agencies (continued) | | | | | | | | |
Freddie Mac, 6.25%, 7/15/2032 | | $ | 4,760,000 | | | $ | 6,213,199 | |
| | | | | | | | |
TOTAL U.S. GOVERNMENT AGENCIES
(Identified Cost $54,259,617) | | | | | | | 57,277,716 | |
| | | | | | | | |
| | |
SHORT-TERM INVESTMENTS - 2.81% | | | | | | | | |
| | |
Dreyfus Cash Management, Inc. - Institutional Shares4, 0.16%,
(Identified Cost $20,714,253) | | | 20,714,253 | | | | 20,714,253 | |
| | | | | | | | |
TOTAL INVESTMENTS - 100.47%
(Identified Cost $683,843,845) | | | | | | | 741,031,498 | |
LIABILITIES, LESS OTHER ASSETS - (0.47%) | | | | | | | (3,493,150 | ) |
| | | | | | | | |
NET ASSETS - 100% | | | | | | $ | 737,538,348 | |
| | | | | | | | |
ADR - American Depository Receipt
NVDR - Non-Voting Depository Receipt
| * | Non-income producing security |
| 1 | International Fair Value factor from pricing service was applied. |
| 2 | The Bank of New York Mellon Corp. is the Series’ custodian and serves as sub-accountant and sub-transfer agent to the Series. |
| 3 | Latest quoted sales price is not available and the latest quoted bid price was used to value the security. |
| 4 | Rate shown is the current yield as of October 31, 2010. |
| | | | |
| The accompanying notes are an integral part of the financial statements. | | | 132 | |
Statement of Assets and Liabilities - Pro-Blend® Maximum Term Series
October 31, 2010
| | | | |
ASSETS: | | | | |
| |
Investments, at value (identified cost $683,843,845) (Note 2) | | $ | 741,031,498 | |
Cash | | | 375,921 | |
Receivable for securities sold | | | 3,357,265 | |
Interest receivable | | | 821,361 | |
Receivable for fund shares sold | | | 672,138 | |
Foreign tax reclaims receivable | | | 481,116 | |
Dividends receivable | | | 367,147 | |
| | | | |
| |
TOTAL ASSETS | | | 747,106,446 | |
| | | | |
| |
LIABILITIES: | | | | |
| |
Accrued management fees (Note 3) | | | 473,214 | |
Accrued shareholder services fees (Class S) (Note 3) | | | 112,667 | |
Accrued transfer agent fees (Note 3) | | | 41,625 | |
Accrued fund accounting and administration fees (Note 3) | | | 25,648 | |
Accrued distribution and service (Rule 12b-1) fees (Class C) (Class R) (Note 3) | | | 5,960 | |
Accrued directors’ fees (Note 3) | | | 3,034 | |
Accrued Chief Compliance Officer service fees (Note 3) | | | 247 | |
Payable for securities purchased | | | 8,367,296 | |
Payable for fund shares repurchased | | | 440,864 | |
Other payables and accrued expenses | | | 97,543 | |
| | | | |
| |
TOTAL LIABILITIES | | | 9,568,098 | |
| | | | |
| |
TOTAL NET ASSETS | | $ | 737,538,348 | |
| | | | |
| |
NET ASSETS CONSIST OF: | | | | |
| |
Capital stock | | $ | 541,207 | |
Additional paid-in-capital | | | 732,505,029 | |
Undistributed net investment income | | | 2,043,791 | |
Accumulated net realized loss on investments, foreign currency and translation of other assets and liabilities | | | (54,781,293 | ) |
Net unrealized appreciation on investments, foreign currency and translation of other assets and liabilities | | | 57,229,614 | |
| | | | |
| |
TOTAL NET ASSETS | | $ | 737,538,348 | |
| | | | |
| | |
| 133 | | The accompanying notes are an integral part of the financial statements. |
Statement of Assets and Liabilities - Pro-Blend® Maximum Term Series
October 31, 2010
| | | | |
NET ASSET VALUE, OFFERING PRICE AND REDEMPTION PRICE PER SHARE - Class S
($539,780,653/34,614,455 shares) | | $ | 15.59 | |
| | | | |
| |
NET ASSET VALUE, OFFERING PRICE AND REDEMPTION PRICE PER SHARE - Class I
($190,343,989/18,803,352 shares) | | $ | 10.12 | |
| | | | |
| |
NET ASSET VALUE, OFFERING PRICE AND REDEMPTION PRICE PER SHARE - Class C
($7,382,999/700,214 shares) | | $ | 10.54 | |
| | | | |
| |
NET ASSET VALUE, OFFERING PRICE AND REDEMPTION PRICE PER SHARE - Class R
($30,707/2,638 shares) | | $ | 11.64 | |
| | | | |
| | | | |
| The accompanying notes are an integral part of the financial statements. | | | 134 | |
Statement of Operations - Pro-Blend® Maximum Term Series
For the Year Ended October 31, 2010
| | | | |
INVESTMENT INCOME: | | | | |
| |
Dividends (net of foreign taxes withheld, $395,366) | | $ | 8,951,488 | |
Interest | | | 1,316,987 | |
| | | | |
| |
Total Investment Income | | | 10,268,475 | |
| | | | |
| |
EXPENSES: | | | | |
| |
Management fees (Note 3) | | | 4,701,062 | |
Shareholder services fees (Class S) (Note 3) | | | 1,247,672 | |
Transfer agent fees (Note 3) | | | 175,528 | |
Fund accounting and administration fees (Note 3) | | | 116,687 | |
Distribution and service (Rule 12b-1) fees (Class C) (Note 3) | | | 26,801 | |
Directors’ fees (Note 3) | | | 17,151 | |
Chief Compliance Officer service fees (Note 3) | | | 2,724 | |
Distribution and service (Rule 12b-1) fees (Class R) (Note 3) | | | 5 | |
Custodian fees | | | 71,000 | |
Miscellaneous | | | 242,637 | |
| | | | |
| |
Total Expenses | | | 6,601,267 | |
Less reduction of expenses (Note 3) | | | (20,981 | ) |
| | | | |
| |
Net Expenses | | | 6,580,286 | |
| | | | |
| |
NET INVESTMENT INCOME | | | 3,688,189 | |
| | | | |
| |
REALIZED AND UNREALIZED GAIN ON INVESTMENTS AND FOREIGN CURRENCY: | | | | |
| |
Net realized gain on- | | | | |
Investments | | | 41,516,226 | |
Foreign currency and translation of other assets and liabilities | | | 995 | |
| | | | |
| | | 41,517,221 | |
| | | | |
| |
Net change in unrealized appreciation on- | | | | |
Investments | | | 49,709,128 | |
Foreign currency and translation of other assets and liabilities | | | 22,381 | |
| | | | |
| | | 49,731,509 | |
| | | | |
NET REALIZED AND UNREALIZED GAIN ON INVESTMENTS AND FOREIGN CURRENCY | | | 91,248,730 | |
| | | | |
| |
NET INCREASE IN NET ASSETS RESULTING FROM OPERATIONS | | $ | 94,936,919 | |
| | | | |
| | |
| 135 | | The accompanying notes are an integral part of the financial statements. |
Statements of Changes in Net Assets - Pro-Blend® Maximum Term Series
| | | | | | | | |
| | | For the
Year Ended
10/31/10 | | | For the
Year Ended
10/31/09 | |
| | |
INCREASE (DECREASE) IN NET ASSETS: | | | | | | | | |
| | |
OPERATIONS: | | | | | | | | |
| | |
Net investment income | | $ | 3,688,189 | | | $ | 2,127,052 | |
Net realized gain (loss) on investments and foreign currency | | | 41,517,221 | | | | (50,764,850 | ) |
Net change in unrealized appreciation (depreciation) on investments andforeign currency | | | 49,731,509 | | | | 114,794,411 | |
| | | | | | | | |
| | |
Net increase from operations | | | 94,936,919 | | | | 66,156,613 | |
| | | | | | | | |
| | |
DISTRIBUTIONS TO SHAREHOLDERS (Note 8): | | | | | | | | |
| | |
From net investment income (Class S) | | | (1,623,955 | ) | | | (3,331,521 | ) |
From net investment income (Class C) | | | (9,558 | ) | | | — | |
From net investment income (Class I) | | | (967,601 | ) | | | (155,094 | ) |
| | | | | | | | |
| | |
Total distributions to shareholders | | | (2,601,114 | ) | | | (3,486,615 | ) |
| | | | | | | | |
| | |
CAPITAL STOCK ISSUED AND REPURCHASED: | | | | | | | | |
| | |
Net increase from capital share transactions (Note 5) | | | 149,161,357 | | | | 88,758,897 | |
| | | | | | | | |
| | |
Net increase in net assets | | | 241,497,162 | | | | 151,428,895 | |
| | |
NET ASSETS: | | | | | | | | |
| | |
Beginning of year | | | 496,041,186 | | | | 344,612,291 | |
| | | | | | | | |
| | |
End of year (including undistributed net investment income of $2,043,791 and $964,796, respectively) | | $ | 737,538,348 | | | $ | 496,041,186 | |
| | | | | | | | |
| | | | |
| The accompanying notes are an integral part of the financial statements. | | | 136 | |
Financial Highlights - Pro-Blend® Maximum Term Series - Class S
| | | | | | | | | | | | | | | | | | | | |
| | | For the Years Ended | |
| | | 10/31/10 | | | 10/31/09 | | | 10/31/08 | | | 10/31/07 | | | 10/31/06 | |
Per share data (for a share outstanding throughout each period): | | | | | | | | | | | | | | | | | | | | |
Net asset value - Beginning of year | | $ | 13.35 | | | $ | 11.50 | | | $ | 19.57 | | | $ | 18.35 | | | $ | 16.79 | |
| | | | | | | | | | | | | | | | | | | | |
Income (loss) from investment operations: | | | | | | | | | | | | | | | | | | | | |
Net investment income | | | 0.08 | 1 | | | 0.06 | 1 | | | 0.12 | | | | 0.11 | | | | 0.14 | |
Net realized and unrealized gain (loss) on investments | | | 2.21 | | | | 1.90 | | | | (6.22 | ) | | | 2.41 | | | | 2.80 | |
| | | | | | | | | | | | | | | | | | | | |
Total from investment operations | | | 2.29 | | | | 1.96 | | | | (6.10 | ) | | | 2.52 | | | | 2.94 | |
| | | | | | | | | | | | | | | | | | | | |
Less distributions to shareholders: | | | | | | | | | | | | | | | | | | | | |
From net investment income | | | (0.05 | ) | | | (0.11 | ) | | | (0.10 | ) | | | (0.15 | ) | | | (0.08 | ) |
From net realized gain on investments | | | — | | | | — | | | | (1.87 | ) | | | (1.15 | ) | | | (1.30 | ) |
| | | | | | | | | | | | | | | | | | | | |
Total distributions to shareholders | | | (0.05 | ) | | | (0.11 | ) | | | (1.97 | ) | | | (1.30 | ) | | | (1.38 | ) |
| | | | | | | | | | | | | | | | | | | | |
Net asset value - End of year | | $ | 15.59 | | | $ | 13.35 | | | $ | 11.50 | | | $ | 19.57 | | | $ | 18.35 | |
| | | | | | | | | | | | | | | | | | | | |
Net assets - End of year
(000’s omitted) | | $ | 539,781 | | | $ | 443,770 | | | $ | 342,015 | | | $ | 517,766 | | | $ | 285,714 | |
| | | | | | | | | | | | | | | | | | | | |
Total return2 | | | 17.17 | % | | | 17.34 | % | | | (34.19 | %) | | | 14.37 | % | | | 18.87 | % |
Ratios (to average net assets)/Supplemental Data: | | | | | | | | | | | | | | | | | | | | |
Expenses* | | | 1.10 | % | | | 1.10 | % | | | 1.10 | % | | | 1.12 | % | | | 1.16 | % |
Net investment income | | | 0.54 | % | | | 0.55 | % | | | 0.77 | % | | | 0.67 | % | | | 0.94 | % |
Series portfolio turnover | | | 68 | % | | | 67 | % | | | 82 | % | | | 61 | % | | | 56 | % |
|
* The investment advisor did not impose all or a portion of its management fees, CCO fees, fund accounting and transfer agent fees and other fees in some years and in some years paid a portion of the Series’ expenses. If these expenses had been incurred by the Class, the expense ratio (to average net assets) would have been increased by the following amount: | |
| | | 0.00 | %3 | | | 0.03 | % | | | 0.04 | % | | | N/A | | | | N/A | |
| 1 | Calculated based on average shares outstanding during the year. |
| 2 | Represents aggregate total return for the year indicated, and assumes reinvestment of all distributions. Total return would have been lower had certain expenses not been waived or reimbursed during certain years. |
| | |
| 137 | | The accompanying notes are an integral part of the financial statements. |
Financial Highlights - Pro-Blend® Maximum Term Series - Class I
| | | | | | | | | | | | |
| | | For the Years Ended | | | For the Period 3/28/081 to | |
| | | 10/31/10 | | | 10/31/09 | | | 10/31/08 | |
Per share data (for a share outstanding throughout each period): | | | | | | | | | | | | |
Net asset value - Beginning of period | | $ | 8.70 | | | $ | 7.57 | | | $ | 10.00 | |
| | | | | | | | | | | | |
Income (loss) from investment operations: | | | | | | | | | | | | |
Net investment income | | | 0.08 | 2 | | | 0.05 | 2 | | | 0.05 | |
Net realized and unrealized gain (loss) on investments | | | 1.43 | | | | 1.24 | | | | (2.44 | ) |
| | | | | | | | | | | | |
Total from investment operations | | | 1.51 | | | | 1.29 | | | | (2.39 | ) |
| | | | | | | | | | | | |
Less distributions to shareholders: | | | | | | | | | | | | |
From net investment income | | | (0.09 | ) | | | (0.16 | ) | | | (0.04 | ) |
| | | | | | | | | | | | |
Net asset value - End of period | | $ | 10.12 | | | $ | 8.70 | | | $ | 7.57 | |
| | | | | | | | | | | | |
Net assets - End of period (000’s omitted) | | $ | 190,344 | | | $ | 52,271 | | | $ | 2,597 | |
| | | | | | | | | | | | |
Total return3 | | | 17.47 | % | | | 17.58 | % | | | (24.01 | %) |
Ratios (to average net assets)/Supplemental Data: | | | | | | | | | | | | |
Expenses* | | | 0.85 | % | | | 0.85 | % | | | 0.85 | %4 |
Net investment income | | | 0.81 | % | | | 0.68 | % | | | 0.88 | %4 |
Series portfolio turnover | | | 68 | % | | | 67 | % | | | 82 | % |
|
* The investment advisor did not impose all or a portion of its management fees, CCO fees, fund accounting and transfer agent fees and other fees in some periods and in some periods paid a portion of the Series’ expenses. If these expenses had been incurred by the Class, the expense ratio (to average net assets) would have been increased by the following amount: | |
| | | |
| | | 0.00 | %5 | | | 0.02 | % | | | 0.08 | %4 |
| 1 | Commencement of operations. |
| 2 | Calculated based on average shares outstanding during the period. |
| 3 | Represents aggregate total return for the periods indicated, and assumes reinvestment of all distributions. Total return would have been lower had certain expenses not been waived or reimbursed during the periods. Periods less than one year are not annualized. |
| | | | |
| The accompanying notes are an integral part of the financial statements. | | | 138 | |
Financial Highlights - Pro-Blend® Maximum Term Series - Class C
| | | | |
| | | For the Period
1/4/101 to
10/31/10 | |
Per share data (for a share outstanding throughout the period): | | | | |
Net asset value - Beginning of period | | $ | 10.00 | |
| | | | |
Income (loss) from investment operations: | | | | |
Net investment loss | | | (0.01 | )2 |
Net realized and unrealized gain on investments | | | 0.58 | |
| | | | |
Total from investment operations | | | 0.57 | |
| | | | |
Less distributions to shareholders: | | | | |
From net investment income | | | (0.03 | ) |
| | | | |
Net asset value - End of period | | $ | 10.54 | |
| | | | |
Net assets - End of period (000’s omitted) | | $ | 7,383 | |
| | | | |
Total return3 | | | 5.68 | % |
Ratios (to average net assets)/Supplemental Data: | | | | |
Expenses* | | | 1.85 | %4 |
Net investment income | | | (0.13 | %)4 |
Series portfolio turnover | | | 68 | % |
|
* The investment advisor did not impose all or a portion of its management fees and other fees during the period and paid a portion of the Series’ expenses. If these expenses had been incurred by the Class, the expense ratio (to average net assets) would have been increased by the following amount: | |
| |
| | | 0.01 | %4 |
| 1 | Commencement of operations. |
| 2 | Calculated based on average shares outstanding during the period. |
| 3 | Represents aggregate total return for the period indicated, and assumes reinvestment of all distributions. Total return would have been lower had certain expenses not been waived or reimbursed during the period. Periods less than one year are not annualized. |
| | |
| 139 | | The accompanying notes are an integral part of the financial statements. |
Financial Highlights - Pro-Blend® Maximum Term Series - Class R
| | | | |
| | | For the Period
6/30/101 to
10/31/10 | |
Per share data (for a share outstanding throughout the period): | | | | |
Net asset value - Beginning of period | | $ | 10.00 | |
| | | | |
Income (loss) from investment operations: | | | | |
Net investment loss | | | (0.01 | )2 |
Net realized and unrealized gain on investments | | | 1.65 | |
| | | | |
Total from investment operations | | | 1.64 | |
| | | | |
Net asset value - End of period | | $ | 11.64 | |
| | | | |
Net assets - End of period (000’s omitted) | | $ | 31 | |
| | | | |
Total return3 | | | 16.40 | % |
Ratios (to average net assets)/Supplemental Data: | | | | |
Expenses* | | | 1.35 | %4 |
Net investment income | | | (0.38 | %)4 |
Series portfolio turnover | | | 68 | % |
| 1 | Commencement of operations. |
| 2 | Calculated based on average shares outstanding during the period. |
| 3 | Represents aggregate total return for the period indicated, and assumes reinvestment of all distributions. Total return would have been lower had certain expenses not been waived or reimbursed during the period. Periods less than one year are not annualized. |
| | | | |
| The accompanying notes are an integral part of the financial statements. | | | 140 | |
Notes to Financial Statements
Pro-Blend® Conservative Term Series, Pro-Blend® Moderate Term Series, Pro-Blend® Extended Term Series and Pro-Blend® Maximum Term Series (each the “Series”) are no-load diversified series of Manning & Napier Fund, Inc. (the “Fund”). The Fund is organized in Maryland and is registered under the Investment Company Act of 1940 (the “1940 Act”), as amended, as an open-end management investment company.
The Series are asset allocation funds. Each invests in a combination of stocks, bonds and cash and is managed according to specific goals. The goals are as follows: Pro-Blend® Conservative Term Series - primary goal is preservation of capital; secondary goal is long-term growth of capital. Pro-Blend® Moderate Term Series - equal emphasis on long-term growth of capital and preservation of capital. Pro-Blend® Extended Term Series - primary goal is long-term growth of capital; secondary goal is preservation of capital. Pro-Blend® Maximum Term Series - primary goal is long-term growth of capital.
Each Series is authorized to issue six classes of shares (Class C (formerly Class B), R (formerly Class D), E, I, S and Z). Currently, only Class S, I, C and R shares have been issued. Each class of shares is substantially the same, except that class-specific transfer agency distribution and shareholder servicing expenses are borne by the specific class of shares to which they relate.
The Fund’s Advisor is Manning & Napier Advisors, Inc. (the “Advisor”). Shares of each Series are offered to investors and employees of the Advisor and its affiliates. The total authorized capital stock of the Fund consists of 10.0 billion shares of common stock each having a par value of $0.01. As of October 31, 2010, 6.2 billion shares have been designated in total among 29 series, of which 87.5 million have been designated as Pro-Blend® Conservative Term Series Class S common stock, 75 million have been designated as Pro-Blend® Conservative Term Series Class I common stock, 125 million each have been designated as Class S common stock and Class I common stock for Pro-Blend® Moderate Term Series, 125 million each have been designated as Class S common stock for Pro-Blend® Extended Term Series and Pro-Blend® Maximum Term Series, 200 million each have been designated as Class I common stock for Pro-Blend® Extended Term Series and Pro-Blend® Maximum Term Series, 25 million each have been designated as Class C common stock for Pro-Blend® Conservative Term Series, Pro-Blend® Moderate Term Series, Pro-Blend® Extended Term Series and Pro-Blend® Maximum Term Series and 2.5 million each have been designated as Class R common stock for Pro-Blend® Conservative Term Series, Pro-Blend® Moderate Term Series, Pro-Blend® Extended Term Series and Pro-Blend® Maximum Term Series.
| 2. | SIGNIFICANT ACCOUNTING POLICIES |
Security Valuation
Portfolio securities, including domestic equities, foreign equities, warrants and options, listed on an exchange other than the NASDAQ National Market System are valued at the latest quoted sales price of the exchange on which the security is primarily traded. Securities not traded on valuation date or securities not listed on an exchange are valued at the latest quoted bid price provided by the Fund’s pricing service. Securities listed on the NASDAQ National Market System are valued in accordance with the NASDAQ Official Closing Price.
Debt securities, including government bonds, foreign bonds, asset-backed securities, structured notes, supranational obligations, sovereign bonds, corporate bonds and mortgage-backed securities will normally be valued on the basis of evaluated bid prices provided by an independent pricing service. Certain investments in securities held by the Series may be valued on a basis of a price provided by a principal market maker. These prices may differ from the value that would have been used had a broader market for securities existed.
Short-term investments that mature in sixty days or less are valued at amortized cost, which approximates market value. Investments in open-end investment companies are valued at their net asset value per share on valuation date.
Notes to Financial Statements
| 2. | SIGNIFICANT ACCOUNTING POLICIES (continued) |
Security Valuation (continued)
Volume and level of activity in established markets for an asset or liability are evaluated to determine whether recent transactions and quoted prices are determinative of fair value. Where there have been significant decreases in volume and level of activity, further analysis and adjustment may be necessary to estimate fair value. The Series measure fair value in these instances by the use of inputs and valuation techniques which may be based upon current market prices of securities that are comparable in coupon, rating, maturity and industry and/or expectation of future cash flows. As a result of trading in relatively thin markets and/or markets that experience significant volatility, the prices used by the Series to value these securities may differ from the value that would be realized if these securities were sold, and the differences could be material.
Securities for which representative valuations or prices are not available from the Fund’s pricing service may be valued at fair value. Due to the inherent uncertainty of valuations of such securities, the fair value may differ significantly from the values that would have been used had a ready market for such securities existed. If trading or events occurring after the close of the principal market in which securities are traded are expected to materially affect the value of those securities, then they may be valued at their fair value, taking this trading or these events into account. Fair value is determined in good faith by the Advisor under procedures approved by and under the general supervision and responsibility of the Fund’s Board of Directors (the “Board”). In accordance with the procedures approved by the Board, the Series apply fair value pricing on a daily basis except for North American, Central American, South American and Caribbean equity securities. Fair valuing of securities is determined with the assistance of a pricing service using calculations or factors based on indices of domestic securities and other appropriate indicators, such as prices of relevant American Depository Receipts and futures contracts, to adjust local market prices for subsequent movements through the time the Fund calculates its net asset value. The value of securities used for net asset value calculation under these procedures may differ from published prices for the same securities. It is the Fund’s policy to classify each equity security, except for those in the regions noted above, as Level 2 securities due to the fact the pricing service evaluated what factor was applied to the calculated end of day market price.
Various inputs are used in determining the value of the Series’ assets or liabilities carried at market value. These inputs are summarized in three broad levels. Level 1 includes quoted prices in active markets for identical assets and liabilities. Level 2 includes other significant observable inputs (including quoted prices for similar securities, interest rates, prepayment speeds, credit risk, etc.). Level 3 includes significant unobservable inputs (including the Series’ own assumptions in determining the fair value of investments). The inputs or methodology used for valuing securities are not necessarily an indication of the risk associated with investing in those securities.
Notes to Financial Statements
SIGNIFICANT ACCOUNTING POLICIES (continued)
Security Valuation (continued)
The following is a summary of the valuation levels used for major security types as of October 31, 2010 in valuing the Series’ assets or liabilities carried at market value:
| | | | | | | | | | | | | | | | |
| | | Pro-Blend®Conservative Term Series | |
Description | | Total | | | Level 1 | | | Level 2 | | | Level 3 | |
Assets: | | | | | | | | | | | | | | | | |
Equity securities* | | $ | 188,492,186 | | | $ | 171,223,305 | | | $ | 17,268,881 | | | $ | — | |
Preferred securities | | | 1,317,305 | | | | — | | | | 1,317,305 | | | | — | |
Debt securities: | | | | | | | | | | | | | | | | |
U.S. Treasury and other U.S. Government agencies | | | 324,521,949 | | | | — | | | | 324,521,949 | | | | — | |
States and political subdivisions (municipals) | | | — | | | | — | | | | — | | | | — | |
Corporate debt | | | 279,612,924 | | | | — | | | | 279,612,924 | | | | — | |
Convertible corporate debt | | | 167,325 | | | | — | | | | 167,325 | | | | — | |
Asset backed securities | | | 502,530 | | | | — | | | | 502,530 | | | | — | |
Commercial mortgage backed securities | | | 1,908,926 | | | | — | | | | 1,476,341 | | | | 432,585 | |
Foreign government bonds | | | 382,877 | | | | — | | | | 382,877 | | | | — | |
Mutual funds | | | 32,128,806 | | | | 32,128,806 | | | | — | | | | — | |
Other financial instruments**: | | | — | | | | — | | | | — | | | | — | |
| | | | | | | | | | | | | | | | |
Total assets: | | | 829,034,828 | | | | 203,352,111 | | | | 625,250,132 | | | | 432,585 | |
| | | | | | | | | | | | | | | | |
Liabilities: | | | | | | | | | | | | | | | | |
Other financial instruments**: | | | | | | | | | | | | | | | | |
Forward foreign currency exchange contracts | | | (4,293 | ) | | | — | | | | (4,293 | ) | | | — | |
| | | | | | | | | | | | | | | | |
Total liabilities: | | | (4,293 | ) | | | — | | | | (4,293 | ) | | | — | |
| | | | | | | | | | | | | | | | |
Total | | $ | 829,030,535 | | | $ | 203,352,111 | | | $ | 625,245,839 | | | $ | 432,585 | |
| | | | | | | | | | | | | | | | |
The following table is a reconciliation of Level 3 investments for which significant unobservable inputs were used to determine fair value:
| | | | | | | | |
Level 3 Reconciliation | | Corporate
Debt | | | Commercial
Mortgage-Backed
Securities | |
Balance as of October 31, 2009 (market value) | | $ | 51,925 | | | $ | — | |
Accrued discounts/premiums | | | 658 | | | | — | |
Realized gain (loss) | | | 10,214 | | | | — | |
Change in unrealized appreciation (depreciation)*** | | | 633 | | | | — | |
Net purchases (sales) | | | (63,430 | ) | | | 432,585 | |
| | | | | | | | |
Balance as of October 31, 2010 (market value) | | $ | — | | | $ | 432,585 | |
| | | | | | | | |
Notes to Financial Statements
| 2. | SIGNIFICANT ACCOUNTING POLICIES (continued) |
Security Valuation (continued)
| | | | | | | | | | | | | | | | |
| | | Pro-Blend®Moderate Term Series | |
Description | | Total | | | Level 1 | | | Level 2 | | | Level 3 | |
Assets: | | | | | | | | | | | | | | | | |
Equity securities* | | $ | 402,468,490 | | | $ | 361,750,306 | | | $ | 40,718,184 | | | $ | — | |
Preferred securities | | | 2,833,561 | | | | — | | | | 2,833,561 | | | | — | |
Debt securities: | | | | | | | | | | | | | | | | |
U.S. Treasury and other U.S. Government agencies | | | 231,996,772 | | | | — | | | | 231,996,772 | | | | — | |
States and political subdivisions (municipals) | | | — | | | | — | | | | — | | | | — | |
Corporate debt | | | 265,204,505 | | | | — | | | | 265,204,505 | | | | — | |
Convertible corporate debt | | | 798,206 | | | | — | | | | 798,206 | | | | — | |
Asset backed securities | | | 1,093,797 | | | | — | | | | 1,093,797 | | | | — | |
Commercial mortgage backed securities | | | 4,002,898 | | | | — | | | | 3,214,980 | | | | 787,918 | |
Foreign government bonds | | | 987,420 | | | | — | | | | 987,420 | | | | — | |
Mutual funds | | | 65,154,802 | | | | 65,154,802 | | | | — | | | | — | |
Other financial instruments**: | | | — | | | | — | | | | — | | | | — | |
| | | | | | | | | | | | | | | | |
Total assets: | | | 974,540,451 | | | | 426,905,108 | | | | 546,847,425 | | | | 787,918 | |
| | | | | | | | | | | | | | | | |
Liabilities: | | | | | | | | | | | | | | | | |
Other financial instruments**: | | | | | | | | | | | | | | | | |
Forward foreign currency exchange contracts | | | (11,161 | ) | | | — | | | | (11,161 | ) | | | — | |
| | | | | | | | | | | | | | | | |
Total liabilities: | | | (11,161 | ) | | | — | | | | (11,161 | ) | | | — | |
| | | | | | | | | | | | | | | | |
Total | | $ | 974,529,290 | | | $ | 426,905,108 | | | $ | 546,836,264 | | | $ | 787,918 | |
| | | | | | | | | | | | | | | | |
The following table is a reconciliation of Level 3 investments for which significant unobservable inputs were used to determine fair value:
| | | | | | | | |
Level 3 Reconciliation | | Corporate
Debt | | | Commercial
Mortgage-Backed
Securities | |
Balance as of October 31, 2009 (market value) | | $ | 100,965 | | | $ | — | |
Accrued discounts/premiums | | | 1,403 | | | | — | |
Realized gain (loss) | | | 22,477 | | | | — | |
Change in unrealized appreciation (depreciation)*** | | | 1,231 | | | | — | |
Net purchases (sales) | | | (126,076 | ) | | | 787,918 | |
| | | | | | | | |
Balance as of October 31, 2010 (market value) | | $ | — | | | $ | 787,918 | |
| | | | | | | | |
Notes to Financial Statements
| 2. | SIGNIFICANT ACCOUNTING POLICIES (continued) |
Security Valuation (continued)
| | | | | | | | | | | | | | | | |
| | | Pro-Blend®Extended Term Series | |
Description | | Total | | | Level 1 | | | Level 2 | | | Level 3 | |
Assets: | | | | | | | | | | | | | | | | |
Equity securities* | | $ | 545,331,359 | | | $ | 492,663,814 | | | $ | 52,667,545 | | | $ | — | |
Preferred securities | | | 3,363,804 | | | | — | | | | 3,363,804 | | | | — | |
Debt securities: | | | | | | | | | | | | | | | | |
U.S. Treasury and other U.S. Government agencies | | | 172,860,207 | | | | — | | | | 172,860,207 | | | | — | |
States and political subdivisions (municipals) | | | — | | | | — | | | | — | | | | — | |
Corporate debt | | | 196,601,232 | | | | — | | | | 196,601,232 | | | | — | |
Convertible corporate debt | | | 1,255,256 | | | | — | | | | 1,255,256 | | | | — | |
Asset backed securities | | | 1,253,787 | | | | — | | | | 1,253,787 | | | | — | |
Commercial mortgage backed securities | | | 4,118,421 | | | | — | | | | 3,242,957 | | | | 875,464 | |
Foreign government bonds | | | 982,382 | | | | — | | | | 982,382 | | | | — | |
Mutual funds | | | 41,787,386 | | | | 41,787,386 | | | | — | | | | — | |
Other financial instruments**: | | | — | | | | — | | | | — | | | | — | |
| | | | | | | | | | | | | | | | |
Total assets: | | | 967,553,834 | | | | 534,451,200 | | | | 432,227,170 | | | | 875,464 | |
| | | | | | | | | | | | | | | | |
Liabilities: | | | | | | | | | | | | | | | | |
Other financial instruments**: | | | | | | | | | | | | | | | | |
Forward foreign currency exchange contracts | | | (11,162 | ) | | | — | | | | (11,162 | ) | | | — | |
| | | | | | | | | | | | | | | | |
Total liabilities: | | | (11,162 | ) | | | — | | | | (11,162 | ) | | | — | |
| | | | | | | | | | | | | | | | |
Total | | $ | 967,542,672 | | | $ | 534,451,200 | | | $ | 432,216,008 | | | $ | 875,464 | |
| | | | | | | | | | | | | | | | |
The following table is a reconciliation of Level 3 investments for which significant unobservable inputs were used to determine fair value:
| | | | | | | | |
Level 3 Reconciliation | | Corporate
Debt | | | Commercial
Mortgage-Backed
Securities | |
Balance as of October 31, 2009 (market value) | | $ | 144,236 | | | $ | — | |
Accrued discounts/premiums | | | 1,770 | | | | — | |
Realized gain (loss) | | | 27,101 | | | | — | |
Change in unrealized appreciation (depreciation)*** | | | 1,758 | | | | — | |
Net purchases (sales) | | | (174,865 | ) | | | 875,464 | |
| | | | | | | | |
Balance as of October 31, 2010 (market value) | | $ | — | | | $ | 875,464 | |
| | | | | | | | |
Notes to Financial Statements
| 2. | SIGNIFICANT ACCOUNTING POLICIES (continued) |
Security Valuation (continued)
| | | | | | | | | | | | | | | | |
| | | Pro-Blend®Maximum Term Series | |
Description | | Total | | | Level 1 | | | Level 2 | | | Level 3 | |
Assets: | | | | | | | | | | | | | | | | |
Equity securities* | | $ | 641,971,657 | | | $ | 554,016,269 | | | $ | 87,955,388 | | | $ | — | |
Preferred securities | | | 223,552 | | | | — | | | | 223,552 | | | | — | |
Debt securities: | | | | | | | | | | | | | | | | |
U.S. Treasury and other U.S. Government agencies | | | 75,174,183 | | | | — | | | | 75,174,183 | | | | — | |
States and political subdivisions (municipals) | | | — | | | | — | | | | — | | | | — | |
Corporate debt | | | 2,893,482 | | | | — | | | | 2,893,482 | | | | — | |
Convertible corporate debt | | | — | | | | — | | | | — | | | | — | |
Asset backed securities | | | — | | | | — | | | | — | | | | — | |
Commercial mortgage backed securities | | | — | | | | — | | | | — | | | | — | |
Foreign government bonds | | | — | | | | — | | | | — | | | | — | |
Mutual funds | | | 20,768,624 | | | | 20,768,624 | | | | — | | | | — | |
Other financial instruments**: | | | — | | | | — | | | | — | | | | — | |
| | | | | | | | | | | | | | | | |
Total assets: | | | 741,031,498 | | | | 574,784,893 | | | | 166,246,605 | | | | — | |
| | | | | | | | | | | | | | | | |
Liabilities: | | | | | | | | | | | | | | | | |
Other financial instruments**: | | | | | | | | | | | | | | | | |
Forward foreign currency exchange contracts | | | — | | | | — | | | | — | | | | — | |
| | | | | | | | | | | | | | | | |
Total liabilities: | | | — | | | | — | | | | — | | | | — | |
| | | | | | | | | | | | | | | | |
Total | | $ | 741,031,498 | | | $ | 574,784,893 | | | $ | 166,246,605 | | | $ | — | |
| | | | | | | | | | | | | | | | |
There were no Level 3 securities held by Pro-Blend® Maximum Term Series as of October 31, 2009 or October 31, 2010.
| * | Includes common stock, warrants and rights. Please see the Investment Portfolio for each Series for industry classification and for securities where a latest quoted sales price is not available and the latest quoted bid price was used to value the security or foreign securities that had International Fair Value factor applied from the pricing service. Such securities are included in Level 2 in the table above. |
| ** | Other financial instruments are derivative instruments not reflected in the Investment Portfolio, such as futures, forwards and swap contracts, which are valued at the unrealized appreciation/depreciation on the instrument. As of October 31, 2010, Pro-Blend® Maximum Term Series did not hold any derivative instruments. |
| *** | The change in unrealized appreciation (depreciation) on securities still held at October 31, 2010 for the Pro-Blend® Conservative Term Series, Pro-Blend® Moderate Term Series and Pro-Blend® Extended Term Series was $0, $0 and $0, respectively, which is included in the related net change in unrealized appreciation/depreciation on the Statements of Operations. |
The Fund’s policy is to recognize transfers in and transfers out of the valuation levels as of the beginning of the reporting period. During the year ended October 31, 2010, the Funds had a significant amount of foreign equity securities transfer from Level 1 to Level 2 due to the implementation of new international fair value pricing procedures. The following is a summary of the foreign equity securities that transferred from Level 1 to Level 2:
Notes to Financial Statements
| 2. | SIGNIFICANT ACCOUNTING POLICIES (continued) |
Security Valuation (continued)
| | | | | | | | | | | | | | | | |
Fund | | Total #
Securities
Level 1 at
beginning and
Level 2 at end
of period | | | Total Market
Value
Beginning of
period | | | Total Market
Value
End of period | | | Change in
Market Value | |
Pro-Blend®Conservative Term Series | | | 63 | | | $ | 6,844,330 | | | $ | 13,231,387 | | | $ | 6,387,057 | |
Pro-Blend®Moderate Term Series | | | 72 | | | $ | 16,207,012 | | | $ | 31,952,156 | | | $ | 15,745,144 | |
Pro-Blend®Extended Term Series | | | 72 | | | $ | 27,747,999 | | | $ | 41,189,285 | | | $ | 13,441,286 | |
Pro-Blend®Maximum Term Series | | | 73 | | | $ | 31,465,832 | | | $ | 42,712,960 | | | $ | 11,247,128 | |
Additional disclosure surrounding the activity in Level 3 fair value measurement will also be effective for fiscal years beginning after December 15, 2010. Management has concluded that this will not have a material impact on the Series’ financial statements.
Security Transactions, Investment Income and Expenses
Security transactions are accounted for on trade date. Dividend income is recorded on the ex-dividend date, except that if the ex-dividend date has passed, certain dividends from foreign securities are recorded as soon as the Fund is informed of the ex-dividend date. Non-cash dividends, if any, are recorded at the fair market value of the securities received. Interest income, including amortization of premium and accretion of discounts using the effective interest method, is earned from settlement date and accrued daily.
Expenses are recorded on an accrual basis. Most expenses of the Fund can be attributed to a specific series. Expenses which cannot be directly attributed are apportioned among the series in the Fund in such a manner as deemed equitable by the Fund’s Board, taking into consideration, among other things, the nature and type of expense.
Income, expenses (other than class specific expenses), and realized and unrealized gains and losses are prorated among the classes based on the relative net assets of each class. Class specific expenses are directly charged to that Class.
The Series use the identified cost method for determining realized gain or loss on investments for both financial statement and federal income tax reporting purposes.
Foreign Currency Translation
The books and records of the Series are maintained in U.S. dollars. Foreign currencies, investments and other assets and liabilities are translated into U.S. dollars at the current exchange rates. Purchases and sales of investment securities and income and expenses are translated on the respective dates of such transactions. The Series do not isolate realized and unrealized gains and losses attributable to changes in the exchange rates from gains and losses that arise from changes in the market value of investments. Such fluctuations are included with net realized and unrealized gain or loss on investments. Net realized foreign currency gains and losses represent foreign currency gains and losses between trade date and settlement date on securities transactions, gains and losses on disposition of foreign currencies and the difference between the amount of income and foreign withholding taxes recorded on the books of the Series and the amounts actually received or paid.
Forward Foreign Currency Exchange Contracts
The Series may purchase or sell forward foreign currency exchange contracts in order to hedge a portfolio position or specific transaction. Risks may arise if the counterparties to a contract are unable to meet the terms of the contract or if the value of the foreign currency moves unfavorably.
Notes to Financial Statements
| 2. | SIGNIFICANT ACCOUNTING POLICIES (continued) |
Forward Foreign Currency Exchange Contracts (continued)
All forward foreign currency exchange contracts are adjusted daily by the exchange rate of the underlying currency and, for financial statement purposes, any gain or loss is recorded as unrealized gain or loss until a contract has been closed. Realized and unrealized gain or loss arising from a transaction is included in net realized and unrealized gain (loss) on investments.
Each Series may regularly trade forward foreign currency exchange contracts with off-balance sheet risk in the normal course of its investing activities to assist in managing exposure to changes in foreign currency exchange rates.
The notional or contractual amount of these instruments represents the investment the Series have in forward foreign currency exchange contracts and does not necessarily represent the amounts potentially at risk. The measurement of the risks associated with forward foreign currency exchange contracts is meaningful only when all related and offsetting transactions are considered. Investments in forward foreign currency exchange contacts held by each Series, if any, on October 31, 2010 are shown at the end of each Investment Portfolio, which is indicative of volume of derivative activity during the period.
Securities Purchased on a When-Issued Basis or Forward Commitment
Each Series may purchase securities on a when-issued basis or forward commitment. These transactions involve a commitment by the Series to purchase securities for a predetermined price with payment and delivery taking place beyond the customary settlement period. When such purchases are outstanding, the Series will designate liquid assets in an amount sufficient to meet the purchase price. When purchasing a security on a delayed delivery basis, the Series assumes the rights and risks of ownership of the security, including the risk of price and yield fluctuations, and takes such fluctuations into account when determining its net asset value. The Series may sell the when-issued securities before they are delivered, which may result in a capital gain or loss.
In connection with its ability to purchase or sell securities on a forward commitment basis, the Series may enter into forward roll transactions principally using To Be Announced (TBA) securities. Forward roll transactions require the sale of securities for delivery in the current month, and a simultaneous agreement to repurchase substantially similar (same type, coupon and maturity) securities on a specified future date. Risks of entering into forward roll transactions include the potential inability of the counterparty to meet the terms of the agreement; the potential of the Series to receive inferior securities at redelivery as compared to the securities sold to the counterparty; counterparty credit risk; and the potential pay down speed variance between the mortgage-backed pools. During the roll period, the Series forgoes principal and interest paid on the securities. The Series account for such dollar rolls as purchases and sales. Information regarding securities purchased on a when-issued basis is included in each applicable Series’ Investment Portfolio. None of the Series had TBA dollar rolls outstanding as of October 31, 2010.
Restricted Securities
Restricted securities are purchased in private placement transactions, are not registered under the Securities Act of 1933, as amended, and may have contractual restrictions on resale. Information regarding restricted securities is included at the end of each applicable Series’ Investment Portfolio.
Federal Taxes
Each Series’ policy is to comply with the provisions of the Internal Revenue Code applicable to regulated investment companies. The Series are not subject to federal income tax or excise tax to the extent that each Series distributes to shareholders each year its taxable income, including any net realized gains on investments, in accordance with requirements of the Internal Revenue Code. Accordingly, no provision for federal income tax or excise tax has been made in the financial statements.
Notes to Financial Statements
| 2. | SIGNIFICANT ACCOUNTING POLICIES (continued) |
Federal Taxes (continued)
Management evaluates its tax positions to determine if the tax positions taken meet the minimum recognition threshold in connection with accounting for uncertainties in income tax positions taken or expected to be taken for the purposes of measuring and recognizing tax liabilities in the financial statements. Recognition of tax benefits of an uncertain tax position is required only when the position is “more likely than not” to be sustained assuming examination by taxing authorities. At October 31, 2010, the Series has recorded no liability for net unrecognized tax benefits relating to uncertain income tax positions taken or expected to be taken in future tax returns.
The Series files income tax returns in the U.S. federal jurisdiction, various states and foreign jurisdictions, as required. No income tax returns are currently under investigation. The statute of limitations on the Series’ tax returns remains open for the years ended October 31, 2007 through October 31, 2010. The Fund is not aware of any tax positions for which it is reasonably possible that the total amounts of unrecognized tax benefits will significantly change in the next twelve months.
Additionally, based on the Fund’s understanding of the tax rules and rates related to income, gains and transactions for foreign jurisdictions in which it invests, the Series will provide for foreign taxes, and where appropriate, deferred foreign tax.
Distributions of Income and Gains
Distributions to shareholders of net investment income are made semi-annually. Distributions of net realized gains are made annually. An additional distribution may be necessary to avoid taxation of a Series. Distributions are recorded on the ex-dividend date.
Indemnifications
The Fund’s organizational documents provide former and current directors and officers with a limited indemnification against liabilities arising in connection with the performance of their duties to the Fund. In the normal course of business, the Fund may also enter into contracts that provide general indemnifications. The Fund’s maximum exposure under these arrangements is unknown as this would be dependent on future claims that may be made against the Fund. The risk of material loss from such claims is considered remote.
Other
The preparation of financial statements in conformity with accounting principles generally accepted in the United States of America requires management to make estimates and assumptions that affect the reported amounts of assets and liabilities and the disclosure of contingent assets and liabilities at the date of the financial statements and the reported amounts of income and expenses during the reporting period. Actual results could differ from those estimates.
| 3. | TRANSACTIONS WITH AFFILIATES |
The Fund has an Investment Advisory Agreement (the “Agreement”) with the Advisor, for which each Series pays a fee, computed daily and payable monthly, at an annual rate of 0.60% for Pro-Blend® Conservative Term Series and 0.75% for Pro-Blend® Moderate Term Series, Pro-Blend® Extended Term Series and Pro-Blend® Maximum Term Series, of the Series’ average daily net assets.
Under the Agreement, personnel of the Advisor provide the Series with advice and assistance in the choice of investments and the execution of securities transactions, and otherwise maintain the Series’ organization. The Advisor also provides the Fund with necessary office space and fund administration and support services. The salaries of all officers of the Fund (except a percentage of the Fund’s Chief Compliance Officer’s salary, which is paid by the Fund), and of all Directors who are “affiliated persons” of the Fund, or of the Advisor, and all personnel of the Fund, or of the Advisor, performing services relating to research, statistical and investment activities, are paid by the
Notes to Financial Statements
| 3. | TRANSACTIONS WITH AFFILIATES (continued) |
Advisor. Each “non-affiliated” Director receives an annual stipend, which is allocated among all the active series of the Fund. In addition, these Directors also receive a fee per Board meeting attended for each active series of the Fund plus a fee for each committee meeting attended.
Class S shares of each Series are subject to a shareholder services fee in accordance with a shareholder services plan adopted by the Fund’s Board. The shareholder services fee is intended to compensate financial intermediaries, including affiliates of the Fund, in connection with the provision of direct client service, personal services, maintenance of shareholder accounts and reporting services. For these services, Class S of each Series pays a fee, computed daily and payable monthly, at an annual rate of 0.20% for Pro-Blend® Conservative Term Series Class S and 0.25% for Pro-Blend® Moderate Term Series Class S, Pro-Blend® Extended Term Series Class S and Pro-Blend® Maximum Term Series Class S, of the Class’ average daily net assets. The Fund has a Shareholder Services Agreement with the Advisor, for which the Advisor receives the shareholder services fee as stated above.
The Advisor has contractually agreed, until at least February 28, 2011, to waive its fee and, if necessary, pay other operating expenses of the Series in order to maintain total direct annual fund operating expenses for the Series at no more than the following amounts, exclusive of shareholder services fees and distribution and service fees (12b-1), of average daily net assets each year:
| | | | |
Series/Class | | Expense Limit | |
Pro-Blend® Conservative Term Series Class S | | | 0.80 | % |
Pro-Blend® Conservative Term Series Class I | | | 0.70 | % |
Pro-Blend® Conservative Term Series Class C | | | 0.80 | % |
Pro-Blend® Conservative Term Series Class R | | | 0.80 | % |
Pro-Blend® Moderate Term Series Class S | | | 0.95 | % |
Pro-Blend® Moderate Term Series Class I | | | 0.85 | % |
Pro-Blend® Moderate Term Series Class C | | | 0.95 | % |
Pro-Blend® Moderate Term Series Class R | | | 0.95 | % |
Pro-Blend® Extended Term Series Class S | | | 0.95 | % |
Pro-Blend® Extended Term Series Class I | | | 0.85 | % |
Pro-Blend® Extended Term Series Class C | | | 0.95 | % |
Pro-Blend® Extended Term Series Class R | | | 0.95 | % |
Pro-Blend® Maximum Term Series Class S | | | 0.95 | % |
Pro-Blend® Maximum Term Series Class I | | | 0.85 | % |
Pro-Blend® Maximum Term Series Class C | | | 0.95 | % |
Pro-Blend® Maximum Term Series Class R | | | 0.95 | % |
In addition, the Advisor has voluntarily agreed to waive fees and reimburse expenses during the current fiscal year in order to keep total direct annual fund operating expenses from exceeding 0.90% for Pro-Blend® Conservative Term Series Class S, 1.70% for Pro-Blend® Conservative Term Series Class C, 1.10% for Pro-Blend® Moderate Term Series Class S, Pro-Blend® Extended Term Series Class S and Pro-Blend® Maximum Term Series Class S and 1.85% for Pro-Blend® Moderate Term Series Class C, Pro-Blend® Extended Term Series Class C and Pro-Blend® Maximum Term Series Class C, of the Class’ average daily net assets. The Advisor may change or eliminate all or part of its voluntary waiver at any time. Accordingly, the Advisor waived fees of $14,252 for Class S, $254 for Class C and $5,717 for Class I of the Pro-Blend® Maximum Term Series. For the year ended October 31, 2010, the Advisor voluntarily waived the following additional amounts which are included as a reduction of expenses on the Statements of Operations:
Notes to Financial Statements
| 3. | TRANSACTIONS WITH AFFILIATES (continued) |
| | | | |
Series/Class | | Waiver Amount | |
Pro-Blend® Conservative Term Series Class S | | $ | 615 | |
Pro-Blend® Conservative Term Series Class I | | | 137 | |
Pro-Blend® Conservative Term Series Class C | | | 6 | |
Pro-Blend® Moderate Term Series Class S | | | 521 | |
Pro-Blend® Moderate Term Series Class I | | | 228 | |
Pro-Blend® Moderate Term Series Class C | | | 9 | |
Pro-Blend® Extended Term Series Class S | | | 593 | |
Pro-Blend® Extended Term Series Class I | | | 156 | |
Pro-Blend® Extended Term Series Class C | | | 9 | |
Pro-Blend® Maximum Term Series Class S | | | 609 | |
Pro-Blend® Maximum Term Series Class I | | | 146 | |
Pro-Blend® Maximum Term Series Class C | | | 3 | |
The Advisor is not eligible to recoup any expenses that have been waived or reimbursed in prior years.
Manning & Napier Investor Services, Inc., a registered broker-dealer affiliate of the Advisor, acts as distributor for the Fund’s shares. Each Series compensates the distributor for distributing and servicing the Series’ Class C shares pursuant to a distribution plan adopted under Rule 12b-1 of the 1940 Act, regardless of expenses actually incurred. Under the agreement, each Series pays distribution and services fees to the distributor at an annual rate of 1.00% of average daily net assets attributable to Class C shares and an annual rate of 0.50% of daily net assets attributable to Class R shares. There are no distribution and services fees on the Class S or Class I shares of each Series. The fees are accrued daily and paid monthly.
For fund accounting and transfer agent services through November 7, 2009, the Fund paid the Advisor an annual fee of 0.055% of the Fund’s average daily net assets up to $4.5 billion, 0.03% of the Fund’s average daily net assets between $4.5 billion and $7.5 billion, and 0.02% of the Fund’s average daily net assets over $7.5 billion. Additionally, certain transaction and account-based fees and out-of-pocket expenses, including charges for reporting relating to the Fund’s compliance program, were charged. Prior to October 12, 2009 (sub-accountant) and November 9, 2009 (for sub-transfer agent), the Advisor had an agreement with Citi Fund Services Ohio, Inc. (“Citi”) under which Citi served as the sub-accountant and sub-transfer agent.
The Advisor has entered into agreements dated October 12, 2009 and November 9, 2009 with PNC Global Investment Servicing (U.S.) Inc. (“PNCGIS”) under which PNCGIS serves as sub-accountant services agent and sub-transfer agent, respectively. Effective November 7, 2009 under the amended master services agreement, the Fund pays the Advisor an annual fee related to Fund Accounting and administration of 0.0175% on the first $3 billion of average daily net assets (excluding Target Series); 0.015% on the next $3 billion of average daily net assets (excluding Target Series); and 0.01% of the average daily net assets in excess of $6 billion (excluding Target Series); plus a base fee of $25,500 per Series. Transfer Agent fees are charged to the Fund on a per account basis. Additionally, certain transaction-, cusip-based fees and out-of-pocket expenses, including charges for reporting relating to the Fund’s compliance program, are charged.
Effective July 1, 2010, PNCGIS, which serves as the Series’ sub-accountant services agent and sub-transfer agent, was sold to The Bank of New York Mellon Corporation, the Series’ custodian. At the close of the sale, PNCGIS changed its name to BNY Mellon Investment Servicing (U.S.) Inc. (“BNY”).
Expenses not directly attributable to a Series are allocated based on each Series’ relative net assets or number of accounts, depending on the expense.
Notes to Financial Statements
| 4. | PURCHASES AND SALES OF SECURITIES |
For the year ended October 31, 2010, purchases and sales of securities, other than short-term securities, were as follows:
| | | | | | | | | | | | | | | | |
| | | Purchases | | | Sales | |
Series | | Other
Issuers | | | Government | | | Other
Issuers | | | Government | |
Pro-Blend® Conservative Term Series | | $ | 359,443,638 | | | $ | 245,528,304 | | | $ | 147,231,046 | | | $ | 89,120,979 | |
Pro-Blend® Moderate Term Series | | | 560,308,335 | | | | 264,008,222 | | | | 252,241,202 | | | | 146,688,423 | |
Pro-Blend® Extended Term Series | | | 560,093,760 | | | | 161,536,576 | | | | 358,698,817 | | | | 108,422,892 | |
Pro-Blend® Maximum Term Series | | | 484,061,706 | | | | 64,628,729 | | | | 387,696,380 | | | | 2,713,281 | |
| 5. | CAPITAL STOCK TRANSACTIONS |
Transactions in Class S, Class I, Class C and Class R shares:
| | | | | | | | | | | | | | | | |
Pro-Blend® Conservative Term Series Class S: | | For the Year
Ended 10/31/10 | | | For the Year
Ended 10/31/09 | |
| | Shares | | | Amount | | | Shares | | | Amount | |
Sold | | | 34,858,771 | | | $ | 442,528,561 | | | | 21,638,922 | | | $ | 253,078,774 | |
Reinvested | | | 518,022 | | | | 6,418,262 | | | | 255,888 | | | | 2,852,616 | |
Repurchased | | | (11,119,570 | ) | | | (140,498,683 | ) | | | (7,514,628 | ) | | | (85,449,982 | ) |
| | | | | | | | | | | | | | | | |
Total | | | 24,257,223 | | | $ | 308,448,140 | | | | 14,380,182 | | | $ | 170,481,408 | |
| | | | | | | | | | | | | | | | |
| | |
Pro-Blend® Conservative Term Series Class I: | | For the Year
Ended 10/31/10 | | | For the Year
Ended 10/31/09 | |
| | Shares | | | Amount | | | Shares | | | Amount | |
Sold | | | 4,378,548 | | | $ | 45,352,823 | | | | 12,753,291 | | | $ | 123,336,525 | |
Reinvested | | | 126,133 | | | | 1,288,891 | | | | 5,873 | | | | 55,829 | |
Repurchased | | | (1,348,646 | ) | | | (14,122,365 | ) | | | (3,281,035 | ) | | | (33,032,962 | ) |
| | | | | | | | | | | | | | | | |
Total | | | 3,156,035 | | | | 32,519,349 | | | | 9,478,129 | | | $ | 90,359,392 | |
| | | | | | | | | | | | | | | | |
| | | | | | | | |
| |
Pro-Blend® Conservative Term Series Class C: | | For the Period 1/4/10
(commencement of
operations) to 10/31/10 | |
| | Shares | | | Amount | |
Sold | | | 1,705,614 | | | $ | 17,493,696 | |
Reinvested | | | 5,440 | | | | 54,727 | |
Repurchased | | | (79,495 | ) | | | (820,337 | ) |
| | | | | | | | |
Total | | | 1,631,559 | | | $ | 16,728,086 | |
| | | | | | | | |
| |
Pro-Blend® Conservative Term Series Class R: | | For the Period 6/30/10
(commencement of
operations) to 10/31/10 | |
| | Shares | | | Amount | |
Sold | | | 106 | | | $ | 1,122 | |
Reinvested | | | — | | | | — | |
Repurchased | | | — | * | | | (1 | ) |
| | | | | | | | |
Total | | | 106 | | | $ | 1,121 | |
| | | | | | | | |
Notes to Financial Statements
| | | | | | | | | | | | | | | | |
Pro-Blend® Moderate Term Series Class S: | | For the Year
Ended 10/31/10 | | | For the Year
Ended 10/31/09 | |
| | Shares | | | Amount | | | Shares | | | Amount | |
Sold | | | 29,382,191 | | | $ | 357,772,202 | | | | 21,461,762 | | | $ | 231,679,727 | |
Reinvested | | | 488,308 | | | | 5,834,846 | | | | 441,147 | | | | 4,403,673 | |
Repurchased | | | (15,128,014 | ) | | | (183,059,673 | ) | | | (8,747,293 | ) | | | (91,994,252 | ) |
| | | | | | | | | | | | | | | | |
Total | | | 14,742,485 | | | $ | 180,547,375 | | | | 13,155,616 | | | $ | 144,089,148 | |
| | | | | | | | | | | | | | | | |
| | |
Pro-Blend® ModerateTerm Series Class I: | | For the Year
Ended 10/31/10 | | | For the Year
Ended 10/31/09 | |
| | Shares | | | Amount | | | Shares | | | Amount | |
Sold | | | 25,689,070 | | | $ | 252,727,970 | | | | 5,930,221 | | | $ | 53,443,816 | |
Reinvested | | | 158,382 | | | | 1,555,153 | | | | 4,353 | | | | 37,717 | |
Repurchased | | | (2,731,164 | ) | | | (27,273,921 | ) | | | (1,343,646 | ) | | | (12,777,158 | ) |
| | | | | | | | | | | | | | | | |
Total | | | 23,116,288 | | | $ | 227,009,202 | | | | 4,590,928 | | | $ | 40,704,375 | |
| | | | | | | | | | | | | | | | |
| | | | | | | | |
Pro-Blend® Moderate Term Series Class C: | | For the Period 1/4/10
(commencement of
operations) to 10/31/10 | |
| | Shares | | | Amount | |
Sold | | | 3,053,483 | | | $ | 30,890,584 | |
Reinvested | | | 7,761 | | | | 77,302 | |
Repurchased | | | (65,570 | ) | | | (671,425 | ) |
| | | | | | | | |
Total | | | 2,995,674 | | | $ | 30,296,461 | |
| | | | | | | | |
| |
Pro-Blend® Moderate Term Series Class R: | | For the Period 6/30/10
(commencement of
operations) to 10/31/10 | |
| | Shares | | | Amount | |
Sold | | | 21,539 | | | $ | 236,052 | |
Reinvested | | | — | | | | — | |
Repurchased | | | — | * | | | (1 | ) |
| | | | | | | | |
Total | | | 21,539 | | | $ | 236,051 | |
| | | | | | | | |
| | | | | | | | | | | | | | | | |
Pro-Blend® Extended Term Series Class S: | | For the Year
Ended 10/31/10 | | | For the Year
Ended 10/31/09 | |
| | Shares | | | Amount | | | Shares | | | Amount | |
Sold | | | 19,420,470 | | | $ | 275,377,736 | | | | 13,079,024 | | | $ | 157,628,794 | |
Reinvested | | | 478,308 | | | | 6,625,922 | | | | 659,575 | | | | 7,271,279 | |
Repurchased | | | (13,689,312 | ) | | | (190,912,195 | ) | | | (11,496,524 | ) | | | (131,007,040 | ) |
| | | | | | | | | | | | | | | | |
Total | | | 6,209,466 | | | $ | 91,091,463 | | | | 2,242,075 | | | $ | 33,893,033 | |
| | | | | | | | | | | | | | | | |
Notes to Financial Statements
| | | | | | | | | | | | | | | | |
Pro-Blend® Extended Term Series Class I: | | For the Year
Ended 10/31/10 | | | For the Year
Ended 10/31/09 | |
| | Shares | | | Amount | | | Shares | | | Amount | |
Sold | | | 19,287,880 | | | $ | 181,303,210 | | | | 13,533,251 | | | $ | 113,607,736 | |
Reinvested | | | 138,139 | | | | 1,295,737 | | | | 16,605 | | | | 133,670 | |
Repurchased | | | (3,094,263 | ) | | | (29,774,808 | ) | | | (2,886,283 | ) | | | (25,332,208 | ) |
| | | | | | | | | | | | | | | | |
Total | | | 16,331,756 | | | $ | 152,824,139 | | | | 10,663,573 | | | $ | 88,409,198 | |
| | | | | | | | | | | | | | | | |
| | | | | | | | |
Pro-Blend® Extended Term Series Class C: | | For the Period 1/4/10
(commencement of
operations) to 10/31/10 | |
| | Shares | | | Amount | |
Sold | | | 2,869,017 | | | $ | 29,043,276 | |
Reinvested | | | 7,429 | | | | 73,698 | |
Repurchased | | | (132,297 | ) | | | (1,323,421 | ) |
| | | | | | | | |
Total | | | 2,744,149 | | | | 27,793,553 | |
| | | | | | | | |
| |
Pro-Blend® Extended Term Series Class R: | | For the Period 6/30/10
(commencement of
operations) to 10/31/10 | |
| | Shares | | | Amount | |
Sold | | | 10,014 | | | $ | 111,222 | |
Reinvested | | | — | | | | — | |
Repurchased | | | — | * | | | (1 | ) |
| | | | | | | | |
Total | | | 10,014 | | | | 111,221 | |
| | | | | | | | |
| | | | | | | | | | | | | | | | |
Pro-Blend® Maximum Term Series Class S: | | For the Year
Ended 10/31/10 | | | For the Year
Ended 10/31/09 | |
| | Shares | | | Amount | | | Shares | | | Amount | |
Sold | | | 11,833,795 | | | $ | 173,123,805 | | | | 12,286,406 | | | $ | 144,482,110 | |
Reinvested | | | 111,033 | | | | 1,581,117 | | | | 314,130 | | | | 3,280,777 | |
Repurchased | | | (10,577,239 | ) | | | (151,403,234 | ) | | | (9,095,502 | ) | | | (101,912,603 | ) |
| | | | | | | | | | | | | | | | |
Total | | | 1,367,589 | | | $ | 23,301,688 | | | | 3,505,034 | | | $ | 45,850,284 | |
| | | | | | | | | | | | | | | | |
| | |
Pro-Blend® Maximum Term Series Class I: | | For the Year
Ended 10/31/10 | | | For the Year
Ended 10/31/09 | |
| | Shares | | | Amount | | | Shares | | | Amount | |
Sold | | | 14,424,477 | | | $ | 134,302,190 | | | | 6,367,312 | | | $ | 47,837,218 | |
Reinvested | | | 40,321 | | | | 372,713 | | | | 14,888 | | | | 108,194 | |
Repurchased | | | (1,669,453 | ) | | | (15,793,046 | ) | | | (717,412 | ) | | | (5,036,799 | ) |
| | | | | | | | | | | | | | | | |
Total | | | 12,795,345 | | | $ | 118,881,857 | | | | 5,664,788 | | | $ | 42,908,613 | |
| | | | | | | | | | | | | | | | |
Notes to Financial Statements
| | | | | | | | |
Pro-Blend® Maximum Term Series Class C: | | For the Period 1/4/10
(commencement of
operations) to 10/31/10 | |
| | Shares | | | Amount | |
Sold | | | 706,866 | | | $ | 7,011,837 | |
Reinvested | | | 982 | | | | 9,490 | |
Repurchased | | | (7,634 | ) | | | (74,183 | ) |
| | | | | | | | |
Total | | | 700,214 | | | $ | 6,947,144 | |
| | | | | | | | |
| | | | | | | | |
Pro-Blend® Maximum Term Series Class R: | | For the Period 6/30/10
(commencement of
operations) to 10/31/10 | |
| | Shares | | | Amount | |
Sold | | | 2,638 | | | $ | 30,669 | |
Reinvested | | | — | | | | — | |
Repurchased | | | — | * | | | (1 | ) |
| | | | | | | | |
Total | | | 2,638 | | | $ | 30,668 | |
| | | | | | | | |
At October 31, 2010, the retirement plan of the Advisor and its affiliates owned the following:
| | | | | | | | | | | | |
Series | | Shares
Owned | | | Percentage
of Series
Shares
Outstanding | | | Value | |
Pro-Blend® Conservative Term Series | | | 63,780 | | | | 0.10 | % | | $ | 703,498 | |
Pro-Blend® Moderate Term Series | | | 225,178 | | | | 0.28 | % | | | 2,386,886 | |
Pro-Blend® Extended Term Series | | | 1,418,329 | | | | 1.90 | % | | | 14,552,057 | |
Pro-Blend® Maximum Term Series | | | 1,411,518 | | | | 2.61 | % | | | 14,284,563 | |
In addition, one shareholder owned 14,141,067 shares of Pro-Blend® Moderate Term Series (15.7% of shares outstanding) valued at $149,895,312. Investment activities of this shareholder may have a material effect on the Series.
The Series may trade in instruments including written and purchased options, forward foreign currency exchange contracts and futures contracts and other derivatives in the normal course of investing activities to assist in managing exposure to various market risks. The Series may be subject to various elements of risk and may involve, to a varying degree, elements of risk in excess of the amounts recognized for financial statement purposes. These risks include: the risk that changes in the value of a derivative may not correlate perfectly with the underlying asset, rate or index, counterparty credit risk related to over the counter derivatives counterparties failure to perform under contract terms, liquidity risk related to the lack of a liquid market for these contracts allowing the fund to close out its position(s) and documentation risk relating to disagreement over contract terms. No such investments were held by the Series on October 31, 2010, except forward foreign currency exchange contracts, held by Pro-Blend® Conservative Term Series, Pro-Blend® Moderate Term Series and Pro-Blend® Extended Term Series, as shown at the end of each Investment Portfolio.
Notes to Financial Statements
Investing in securities of foreign companies and foreign governments involves special risks and considerations not typically associated with investing in securities of domestic companies and the U.S. Government. These risks include revaluation of currencies and future adverse political and economic developments. Moreover, securities of foreign companies and foreign governments and their markets may be less liquid and their prices more volatile than those of comparable domestic companies and the U.S. Government.
| 8. | FEDERAL INCOME TAX INFORMATION |
The amount and characterization of certain income and capital gains to be distributed are determined in accordance with federal income tax regulations, which may differ from accounting principles generally accepted in the United States of America. These differences are primarily due to differing book and tax treatments in the timing of the recognition of net investment income or gains and losses, including foreign currency gains and losses, losses deferred due to wash sales, market discount, and investments in passive foreign investment companies (PFICs), real estate investment trusts, and hybrid securities. The Series may periodically make reclassifications among its capital accounts to reflect income and gains available for distribution (or available capital loss carryovers) under income tax regulations, without impacting the Series’ net asset value. Any such reclassifications are not reflected in the financial highlights.
The tax character of distributions paid were as follows:
| | | | | | | | | | | | | | | | |
| | | Pro-Blend® Conservative
Term Series | | | Pro-Blend® Moderate
Term Series | |
| | | For the Year
Ended 10/31/10 | | | For the Year
Ended 10/31/09 | | | For the Year
Ended 10/31/10 | | | For the Year
Ended 10/31/09 | |
Ordinary income | | $ | 8,910,566 | | | $ | 3,190,937 | | | $ | 8,115,112 | | | $ | 4,556,112 | |
| | |
| | | Pro-Blend® Extended
Term Series | | | Pro-Blend® Maximum
Term Series | |
| | | For the Year
Ended 10/31/10 | | | For the Year
Ended 10/31/09 | | | For the Year
Ended 10/31/10 | | | For the Year
Ended 10/31/09 | |
Ordinary income | | $ | 9,717,987 | | | $ | 7,669,280 | | | $ | 2,601,114 | | | $ | 3,486,615 | |
At October 31, 2010, the tax basis components of distributable earnings and the net unrealized appreciation based on the identified cost for federal income tax purposes were as follows:
| | | | | | | | | | | | | | | | |
| | | Pro-Blend®
Conservative
Term Series | | | Pro-Blend®
Moderate
Term Series | | | Pro-Blend®
Extended
Term Series | | | Pro-Blend®
Maximum
Term Series | |
Cost for federal income tax purposes | | $ | 785,583,628 | | | $ | 919,460,483 | | | $ | 900,025,296 | | | $ | 687,282,652 | |
Unrealized appreciation | | $ | 47,535,619 | | | $ | 66,903,422 | | | $ | 88,166,500 | | | $ | 73,587,288 | |
Unrealized depreciation | | | (4,084,419 | ) | | | (11,823,454 | ) | | | (20,637,962 | ) | | | (19,838,442 | ) |
| | | | | | | | | | | | | | | | |
Net unrealized appreciation | | $ | 43,451,200 | | | $ | 55,079,968 | | | $ | 67,528,538 | | | $ | 53,748,846 | |
Undistributed ordinary income | | | 15,310,534 | | | | 7,586,535 | | | | 7,399,849 | | | | 2,157,000 | |
Undistributed long-term gains | | | 15,704,819 | | | | 15,333,693 | | | | — | | | | — | |
Capital loss carryover | | | — | | | | — | | | | 8,084,042 | | | | 51,455,695 | |
Notes to Financial Statements
| 8. | FEDERAL INCOME TAX INFORMATION (continued) |
At October 31, 2010, each Series had a capital loss carryover, disclosed below, available to the extent allowed by tax law to offset future net capital gain, if any, which will expire as follows:
| | | | | | | | | | |
Pro-Blend® Extended
Term Series | | Pro-Blend® Maximum
Term Series |
Loss Carryover | | | Expiration Date | | Loss Carryover | | | Expiration Date |
| $ | 8,084,042 | | | October 31, 2017 | | $ | 7,236,320 | | | October 31, 2016 |
| | | | | | $ | 44,219,375 | | | October 31, 2017 |
The Pro-Blend® Conservative Term Series, the Pro-Blend® Moderate Term Series, the Pro-Blend® Extended Term Series and the Pro-Blend® Maximum Term Series utilized capital loss carryovers of $1,397,962, $18,735,464, $41,706,401 and $37,142,570, respectively, in the current year.
157
Report of Independent Registered Public Accounting Firm
To the Board of Directors of Manning & Napier Fund, Inc. and Shareholders of - Pro-Blend® Conservative Term Series, Pro-Blend® Moderate Term Series, Pro-Blend® Extended Term Series and Pro-Blend® Maximum Term Series:
In our opinion, the accompanying statements of assets and liabilities, including the investment portfolios, and the related statements of operations and of changes in net assets and the financial highlights present fairly, in all material respects, the financial position of Pro-Blend® Conservative Term Series, Pro-Blend® Moderate Term Series, Pro-Blend® Extended Term Series and Pro-Blend® Maximum Term Series (each a series of Manning & Napier Fund, Inc., hereafter collectively referred to as the “Series”) at October 31, 2010, and the results of each of their operations for the year then ended, the changes in each of their net assets for each of the two years in the period then ended and the financial highlights for each of the five years in the period then ended, in conformity with accounting principles generally accepted in the United States of America. These financial statements and financial highlights (hereafter referred to as “financial statements”) are the responsibility of the Series’ management. Our responsibility is to express an opinion on these financial statements based on our audits. We conducted our audits of these financial statements in accordance with the standards of the Public Company Accounting Oversight Board (United States). Those standards require that we plan and perform the audit to obtain reasonable assurance about whether the financial statements are free of material misstatement. An audit includes examining, on a test basis, evidence supporting the amounts and disclosures in the financial statements, assessing the accounting principles used and significant estimates made by management, and evaluating the overall financial statement presentation. We believe that our audits, which included confirmation of securities at October 31, 2010 by correspondence with the custodian, provide a reasonable basis for our opinion.

New York, New York
December 21, 2010
158
Supplemental Tax Information (unaudited)
All designations are based on financial information available as of the date of this annual report and, accordingly are subject to change.
For federal income tax purposes, each of the Series designates for the current fiscal year the amount disclosed below or, if different, the maximum amount allowable under the tax law as qualified dividend income (“QDI”).
| | | | | | |
Series | | QDI | | | |
Pro-Blend® Conservative Term Series | | $ | 1,416,873 | | |
Pro-Blend® Moderate Term Series | | | 3,304,830 | | |
Pro-Blend® Extended Term Series | | | 5,975,580 | | |
Pro-Blend® Maximum Term Series | | | 2,601,114 | | |
For corporate shareholders, the percentage of investment income (dividend income plus short-term gain, if any) that qualifies for the dividends received deduction (DRD) for the current fiscal year is as follows: |
Series | | DRD% | | | |
Pro-Blend® Conservative Term Series | | | 8.7 | % | |
Pro-Blend® Moderate Term Series | | | 27.4 | % | |
Pro-Blend® Extended Term Series | | | 39.1 | % | |
Pro-Blend® Maximum Term Series | | | 100.0 | % | |
The percentage of ordinary income distribution paid by the Series during the year ended October 31, 2010 which was derived from U.S. Treasury securities is as follows: |
Series | | U.S. Treasury% | | | |
Pro-Blend® Conservative Term Series | | | 4.9 | % | |
Pro-Blend® Moderate Term Series | | | 7.9 | % | |
Pro-Blend® Extended Term Series | | | 5.9 | % | |
Pro-Blend® Maximum Term Series | | | 1.5 | % | |
The law varies in each state as to whether and what percentage of dividend income attributable to U.S. Treasury securities is exempt from state and local income tax. It is recommended that you consult your tax advisor to determine if any portion of the dividends you received is exempt from income taxes.
159
Directors’ and Officers’ Information (unaudited)
The Statement of Additional Information provides additional information about the Fund’s directors and officers and can be obtained without charge by calling 1-800-466-3863, at www.manningnapieradvisors.com, or on the EDGAR Database on the SEC Internet web site (http:// www.sec.gov). The following chart shows certain information about the Fund’s officers and directors, including their principal occupations during the last five years. Unless specific dates are provided, the individuals have held the listed positions for longer than five years.
INTERESTED DIRECTOR/OFFICER
| | |
| Name: | | B. Reuben Auspitz* |
| Address: | | 290 Woodcliff Drive |
| | Fairport, NY 14450 |
| Age: | | 63 |
| Current Position(s) Held with Fund: | | Principal Executive Officer, President, Chairman & Director |
| Term of Office1 & Length of Time Served: | | Indefinite - Director since 1984; Vice President 1984 - 2003; President since 2004; Principal Executive Officer since 2002 |
| Principal Occupation(s) During Past 5 Years: | | Executive Vice President; Executive Group Member**; Chief Compliance Officer since 2004; Vice Chairman since June 2010; Co-Executive Director from 2003-2010 - Manning & Napier Advisors, Inc. President; Director - Manning & Napier Investor Services, Inc. |
| | Holds or has held one or more of the following titles for various subsidiaries and affiliates: President, Vice President, Director, Chairman, Treasurer, Chief Compliance Officer or Member. |
| Number of Portfolios Overseen within Fund Complex: | | 29 |
| Other Directorships Held Outside Fund Complex: | | N/A |
| INDEPENDENT DIRECTORS | | |
| |
| Name: | | Stephen B. Ashley |
| Address: | | 290 Woodcliff Drive |
| | Fairport, NY 14450 |
| Age: | | 70 |
| Current Position(s) Held with Fund: | | Director, Audit Committee Member, Governance & Nominating Committee Member |
| Term of Office & Length of Time Served: | | Indefinite - Since 1996 |
| Principal Occupation(s) During Past 5 Years: | | Chairman, Director, President & Chief Executive Officer, The Ashley Group (property management and investment). Chairman (non-executive) 2004-2008; Director 1995-2008 - Fannie Mae (mortgage) |
| Number of Portfolios Overseen within Fund Complex: | | 29 |
| Other Directorships Held Outside Fund Complex: | | The Ashley Group (1995-2008) |
| | | Genesee Corporation (1987-2007) |
| Name: | | Peter L. Faber |
| Address: | | 290 Woodcliff Drive |
| | Fairport, NY 14450 |
| Age: | | 72 |
| Current Position(s) Held with Fund: | | Director, Governance & Nominating Committee Member |
| Term of Office & Length of Time Served: | | Indefinite - Since 1987 |
| Principal Occupation(s) During Past 5 Years: | | Senior Counsel since 2006, Partner (1995 - 2006) - McDermott, Will & Emery LLP (law firm) |
| Number of Portfolios Overseen within Fund Complex: | | 29 |
| Other Directorships Held Outside Fund Complex: | | Partnership for New York City, Inc. (non-profit) |
| | New York Collegium (non-profit) |
| | | Boston Early Music Festival (non-profit) |
160
Directors’ and Officers’ Information (unaudited)
INDEPENDENT DIRECTORS (continued)
| | |
| Name: | | Harris H. Rusitzky |
| Address: | | 290 Woodcliff Drive |
| | Fairport, NY 14450 |
| Age: | | 75 |
| Current Position(s) Held with Fund: | | Director, Audit Committee Member, Governance & Nominating Committee Member |
| Term of Office & Length of Time Served: | | Indefinite - Since 1985 |
| Principal Occupation(s) During Past 5 Years: | | President, The Greening Group (business consultants) since 1994; Partner, The Restaurant Group (restaurants) since 2006 |
| Number of Portfolios Overseen within Fund Complex: | | 29 |
| Other Directorships Held Outside Fund Complex: | | N/A |
| Name: | | Paul A. Brooke |
| Address: | | 290 Woodcliff Drive |
| | Fairport, NY 14450 |
| Age: | | 64 |
| Current Position(s) Held with Fund: | | Director, Audit Committee Member, Governance & Nominating Committee Member |
| Term of Office & Length of Time Served: | | Indefinite - Since 2007 |
| Principal Occupation(s) During Past 5 Years: | | Chairman & CEO, Alsius Corp. (investments); Managing Member, PMSV Holdings LLC (investments) |
| Number of Portfolios Overseen within Fund Complex: | | 29 |
| Other Directorships Held Outside Fund Complex: | | Incyte Corp. (2000-present) |
| | ViroPharma, Inc. (2000-present) |
| | HLTH Corp. (2000-present) |
| | Cheyne Capital International (2000-present) |
| | MPM Bio-equities (2000-present) |
| | GMP Companies (2000-present) |
| | | HoustonPharma (2000-present) |
| Name: | | Richard M. Hurwitz |
| Address: | | 290 Woodcliff Drive |
| | Fairport, NY 14450 |
| Age: | | 47 |
| Current Position(s) Held with Fund: | | Director, Audit Committee Member, Governance & Nominating Committee Member |
| Term of Office & Length of Time Served: | | Indefinite - Since 2009 |
| Principal Occupation(s) During Past 5 Years: | | Chief Executive Officer, Pictometry International Corp. since August 2010 (provider of georeferenced, aerial image libraries and related software) Managing Partner (2006-July 2010) - Aegis Investment Partners, LLC (investments); Founder and Managing Partner (2004-2005) - Village Markets, LLC (groceries) |
| Number of Portfolios Overseen within Fund Complex: | | 29 |
| Other Directorships Held Outside Fund Complex: | | Pictometry International Corp. (2000-2010) |
| | Pioneering Technologies (2006-2009) |
| | | Vensearch Capital Corp. (2003-2007) |
161
Directors’ and Officers’ Information (unaudited)
OFFICERS
| | |
| Name: | | Jeffrey S. Coons, Ph.D., CFA |
| Address: | | 290 Woodcliff Drive |
| | Fairport, NY 14450 |
| Age: | | 47 |
| Current Position(s) Held with Fund: | | Vice President |
| Term of Office1 & Length of Time Served: | | Since 2004 |
| Principal Occupation(s) During Past 5 Years: | | President since 2010, Co-Director of Research since 2002, Executive Group Member** since 2003, - Manning & Napier Advisors, Inc. |
| | Holds one or more of the following titles for various subsidiaries and affiliates: President, Director, Treasurer or Senior Trust Officer. |
| Number of Portfolios Overseen within Fund Complex: | | 29 |
| Other Directorships Held Outside Fund Complex: | | N/A |
| Name: | | Beth Galusha |
| Address: | | 290 Woodcliff Drive |
| | Fairport, NY 14450 |
| Age: | | 49 |
| Current Position(s) Held with Fund: | | Assistant Chief Financial Officer |
| Term of Office1 & Length of Time Served: | | Assistant Chief Financial Officer since 2010 |
| Principal Occupation(s) During Past 5 Years: | | Chief Financial Officer and Treasurer, Manning & Napier Advisors, Inc. |
| | Holds one or more of the following titles for various affiliates: Chief Financial Officer, Director, or Treasurer |
| Number of Portfolios Overseen within Fund Complex: | | 29 |
| Other Directorships Held Outside Fund Complex: | | N/A |
| Name: | | Christine Glavin |
| Address: | | 290 Woodcliff Drive |
| | Fairport, NY 14450 |
| Age: | | 44 |
| Current Position(s) Held with Fund: | | Principal Financial Officer, Chief Financial Officer |
| Term of Office1 & Length of Time Served: | | Principal Financial Officer since 2002; Chief Financial Officer since 2001 |
| Principal Occupation(s) During Past 5 Years: | | Fund Reporting Manager, Manning & Napier Advisors, Inc. since 1997 |
| Number of Portfolios Overseen within Fund Complex: | | 29 |
| Other Directorships Held Outside Fund Complex: | | N/A |
| Name: | | Jodi L. Hedberg |
| Address: | | 290 Woodcliff Drive |
| | Fairport, NY 14450 |
| Age: | | 42 |
| Current Position(s) Held with Fund: | | Corporate Secretary, Chief Compliance Officer, Anti-Money Laundering Compliance Officer |
| Term of Office1 & Length of Time Served: | | Corporate Secretary since 1997; Chief Compliance Officer since 2004 |
| Principal Occupation(s) During Past 5 Years: | | Director of Compliance, Manning & Napier Advisors, Inc. and affiliates since 1990 (title change in 2005 from Compliance Manager to Director of Compliance); Corporate Secretary, Manning & Napier Investor Services, Inc. since 2006 |
| Number of Portfolios Overseen within Fund Complex: | | 29 |
| Other Directorships Held Outside Fund Complex: | | N/A |
| * | Interested Director, within the meaning of the Investment Company Act of 1940 by reason of his position with the Fund’s investment advisor and distributor. Mr. Auspitz serves as the Executive Vice President and Director, Manning & Napier Advisors, Inc. and President and Director, Manning & Napier Investor Services, Inc., the Fund’s distributor. |
| ** | Prior to June 2010, the Executive Group, consisting of senior executive employee-owners, performed the duties of the Office of the Chief Executive of the Advisor. |
Effective June 2010, the Executive Group serves as an advisory board to the Chief Executive Officer.
| 1 | The term of office for President, Vice President, Chief Financial Officer, and Corporate Secretary is one year and until their respective successors are chosen and qualified. All other officers’ terms are indefinite. |
162
Literature Requests (unaudited)
Proxy Voting Policies and Procedures
A description of the policies and procedures that the Fund uses to determine how to vote proxies relating to portfolio securities is available, without charge, upon request:
| | |
| By phone | | 1-800-466-3863 |
On the Securities and Exchange Commission’s (SEC) web site | | |
| | http://www.sec.gov |
Proxy Voting Record
Information regarding how the Fund voted proxies relating to portfolio securities during the most recent 12-month period ended June 30th is available, without charge, upon request:
| | |
| By phone | | 1-800-466-3863 |
| On the SEC’s web site | | http://www.sec.gov |
Quarterly Portfolio Holdings
The Series’ complete schedule of portfolio holdings for the 1st and 3rd quarters of each fiscal year are provided on Form N-Q, and are available, without charge, upon request:
| | |
| By phone | | 1-800-466-3863 |
| On the SEC’s web site | | http://www.sec.gov |
The Series’ Form N-Q may be reviewed and copied at the SEC’s Public Reference Room in Washington, D.C. Information on the operation of the Public Reference Room may be obtained by calling 1-800-SEC-0330.
Prospectus and Statement of Additional Information (SAI)
The prospectus and SAI provide additional information about each Series, including charges, expenses and risks. These documents are available, without charge, upon request:
| | |
| By phone | | 1-800-466-3863 |
| On the SEC’s web site | | http://www.sec.gov |
| On the Advisor’s web site | | http://www.manningnapieradvisors.com |
Additional information available at www.manningnapieradvisors.com
1. Fund Holdings - Month-End
2. Fund Holdings - Quarter-End
3. Shareholder Report - Annual
4. Shareholder Report - Semi-Annual
(a) The registrant has adopted a code of ethics that applies to its principal executive officer, principal financial officer and principal accounting officer. A copy of the registrant’s code of ethics is filed herewith as Exhibit 12(a)(1).
(b) During the period covered by this report, no amendments were made to the provisions of the code of ethics adopted in 2 (a) above.
(c) During the period covered by this report, no implicit or explicit waivers to the provisions of the code of ethics adopted in 2 (a) above were granted.
| (d) | Not applicable to the registrant due to the response given in 2 (c) above. |
| ITEM 3: | AUDIT COMMITTEE FINANCIAL EXPERT |
All of the members of the Audit committee have been determined by the Registrant’s Board of Directors to be Audit Committee Financial Experts as defined in this item. The members of the Audit Committee are: Harris H. Rusitzky, Stephen B. Ashley, Paul A. Brooke and Richard M. Hurwitz. All Audit Committee members are independent under applicable rules. This designation will not increase the designee’s duties, obligations or liability as compared to their duties, obligations and liability as a member of the Audit Committee and of the Board.
| ITEM 4: | PRINCIPAL ACCOUNTANT FEES AND SERVICES. |
Principal Accountant Fees and Services
Aggregate fees for professional services rendered for the Manning & Napier Fund, Inc. (Pro-Blend® Conservative Term Series, Pro-Blend® Moderate Term Series, Pro-Blend® Extended Term Series, Pro-Blend® Maximum Term Series, Tax Managed Series, Equity Series, Overseas Series, Dividend Focus Series, Target Income Series, Target 2010 Series, Target 2020 Series, Target 2030 Series, Target 2040 Series and Target 2050 Series, collectively the “Fund”) by PricewaterhouseCoopers LLP (“PwC”) as of and for the years ended October 31, 2010 and 2009 were:
| | | | | | | | |
| | | 2010 | | | 2009 | |
Audit Fees (a) | | | 267,175 | | | | 274,054 | |
Audit Related Fees (b) | | | — | | | | 15,624 | |
Tax Fees (c) | | | 78,200 | | | | 92,605 | |
All Other Fees (d) | | | — | | | | — | |
| | | | | | | | |
| | | 345,375 | | | | 382,283 | |
| | | | | | | | |
These fees relate to professional services rendered by PwC for the audit of the Fund’s annual financial statements or services normally provided by the accountant in connection with statutory and regulatory filing or engagements. These services include the audits of the financial statements of the Fund, issuance of consents, income tax provision procedures and assistance with review of documents filed with the SEC.
These fees relate to assurance and related services by PwC that are reasonably related to the performance of the audit of the Fund’s financial statements and are not reported under “Audit Fees” above. These fees relate to professional services provided by PwC in connection with service provider conversion.
These fees relate to professional services rendered by PwC for tax compliance, tax advice and tax planning. The tax services provided by PwC related to the preparation of the Fund’s federal and state income tax returns, excise tax calculations and returns, a review of the Fund’s calculations of capital gain and income distributions, and additional tax research for compliance purposes.
These fees relate to products and services provided by PwC other than those reported above under “Audit Fees,” “Audit-Related Fees,” and “Tax Fees” above.
There were no amounts that were approved by the Audit Committee pursuant to the de minimus exception (Rule 2-01(c)(7) of Regulation S-X) for the fiscal years ended October 31, 2010 and 2009.
Non-Audit Services to the Fund’s Service Affiliates that were Pre-Approved by the Fund’s Audit Committee
The Fund’s Audit Committee is required to pre-approve non-audit services which meet both the following criteria:
| i) | Directly relate to the Fund’s operations and financial reporting; and |
| ii) | Rendered by PwC to the Fund’s advisor, Manning & Napier Advisors, Inc., and entities in a control relationship with the advisor (“service affiliate”) that provide ongoing services to the Fund. For purposes of disclosure, Manning & Napier Investor Services, Inc. is considered to be a service affiliate. |
| | | | | | | | |
| | | 2010 | | | 2009 | |
Audit Related Fees | | | 153,644 | | | | 8,420 | |
Tax Fees | | | — | | | | 1,950 | |
| | | | | | | | |
| | | 153,644 | | | | 10,370 | |
| | | | | | | | |
The Audit Related fees for the years ended October 31, 2010 were for a license for proprietary authoritative financial reporting and assurance literature library software, a surprise examination pursuant to Rule 204-2(b) and 206(4)-2, and a Type II SAS 70 pursuant to Rule 206. In 2009, were for 17Ad-13 internal control examinations and the license for proprietary authoritative financial report and assurance literature library software.
The Tax fees for the year ended October 31, 2010 relate to research on the tax implications for various funds holding certain investment types. There were no amounts that were approved by the Audit Committee pursuant to the de minimus exception (Rule 2-01(c)(7) of Regulation S-X) for the fiscal years ended October 31, 2010 and 2009.
Aggregate Fees
Aggregate fees billed to the Fund for non-audit services for 2010 and 2009 each were $78,200 and $92,605, respectively. Aggregate fees billed to the Fund’s advisor and service affiliates for non-audit services were $153,644 and $10,370, respectively. These amounts include fees for non-audit services required to be pre-approved and fees for non-audit services that did not require pre-approval since they did not relate to the Fund’s operations and financial reporting.
The Fund’s Audit Committee has considered whether the provisions for non-audit services to the Fund’s advisor and service affiliates, which did not require pre-approval, are compatible with maintaining PwC’s independence.
| ITEM 5: | AUDIT COMMITTEE OF LISTED REGISTRANTS. |
Not applicable.
| (a) | See Investment Portfolios under Item 1 on this Form N-CSR. |
| ITEM 7: | DISCLOSURE OF PROXY VOTING POLICIES AND PROCEDURES FOR CLOSED- END MANAGEMENT INVESTMENT COMPANIES. |
Not applicable.
| ITEM 8: | PORTFOLIO MANAGERS OF CLOSED-END MANAGEMENT INVESTMENT COMPANIES. |
Not applicable.
| ITEM 9: | PURCHASES OF EQUITY SECURITIES BY CLOSED-END MANAGEMENT INVESTMENT COMPANY AND AFFILIATED PURCHASERS. |
Not applicable.
| ITEM 10: | SUBMISSION OF MATTERS TO A VOTE OF SECURITY HOLDERS. |
There have been no material changes to the procedure by which shareholders may recommend nominees to the registrant’s board of directors.
| ITEM 11: | CONTROLS AND PROCEDURES. |
(a) Based on their evaluation of the Funds’ disclosure controls and procedures, as of a date within 90 days of the filing date, the Funds’ Principal Executive Officer and Principal Financial Officer have concluded that the Funds’ disclosure controls and procedures are: (i) reasonably designed to ensure that information required to be disclosed in this report is appropriately communicated to the Funds’ officers to allow timely decisions regarding disclosures required in this report; (ii) reasonably designed to ensure that information required to be disclosed in this report is recorded, processed, summarized and reported in a timely manner; and (iii) are effective in achieving the goals described in (i) and (ii) above.
(b) During the second fiscal quarter of the period covered by this report, there have been no changes in the Funds’ internal control over financial reporting that the above officers believe to have materially affected, or to be reasonably likely to materially affect, the Funds’ internal control over financial reporting.
| | |
| (a)(1) | | Code of ethics that is subject to the disclosure of Item 2 above. |
| |
| (a)(2) | | Separate certifications for the Registrant’s principal executive officer and principal financial officer, as required by Section 302 of the Sarbanes-Oxley Act of 2002 and Rule 30a-2(a) under the Investment Company Act of 1940, are attached as EX-99.CERT. |
| |
| (a)(3) | | Not applicable. |
| |
| (b) | | A certification of the Registrant’s principal executive officer and principal financial officer, as required by 18 U.S.C Section 1350, as adopted pursuant to Section 906 of the Sarbanes-Oxley Act of 2002, and Rule 30a-2(b) under the Investment Company Act of 1940, is attached as EX- 99.906CERT. The certification furnished pursuant to this paragraph is not deemed to be “filed” for purposes of Section 18 of the Securities Exchange Act of 1934, or otherwise subject to the liability of that section. Such certification is not deemed to be incorporated by reference into any filing under the Securities Act of 1933 or the Securities Exchange Act of 1934, except to the extent that the Registrant specifically incorporates them by reference. |
SIGNATURES
Pursuant to the requirements of the Securities Exchange Act of 1934 and the Investment Company Act of 1940, the registrant has duly caused this report to be signed on its behalf by the undersigned, thereunto duly authorized.
Manning & Napier Fund, Inc.
|
/s/ B. Reuben Auspitz |
B. Reuben Auspitz |
President & Principal Executive Officer of Manning & Napier Fund, Inc.
December 30, 2010
Pursuant to the requirements of the Securities Exchange Act of 1934 and the Investment Company Act of 1940, this report has been signed below by the following persons on behalf of the registrant and in the capacities and on the dates indicated.
|
/s/ B. Reuben Auspitz |
B. Reuben Auspitz |
President & Principal Executive Officer of Manning & Napier Fund, Inc.
December 30, 2010
|
/s/ Christine Glavin |
Christine Glavin |
Chief Financial Officer & Principal Financial Officer of Manning & Napier Fund, Inc.
December 30, 2010


