UNITED STATES
SECURITIES AND EXCHANGE COMMISSION
Washington, D.C. 20549
FORM N-CSR
CERTIFIED SHAREHOLDER REPORT OF REGISTERED
MANAGEMENT INVESTMENT COMPANIES
Investment Company Act file number 811-04087
Manning & Napier Fund, Inc.
(Exact name of registrant as specified in charter)
290 Woodcliff Drive, Fairport, NY 14450
(Address of principal executive offices)(Zip Code)
B. Reuben Auspitz 290 Woodcliff Drive, Fairport, NY 14450
(Name and address of agent for service)
Registrant’s telephone number, including area code: 585-325-6880
Date of fiscal year end: December 31, 2010
Date of reporting period: January 1, 2010 through December 31, 2010
Form N-CSR is to be used by management investment companies to file reports with the Commission not later than 10 days after the transmission to stockholders of any report that is required to be transmitted to stockholders under Rule 30e-1 under the Investment Company Act of 1940 (17 CFR 270.30e-1). The Commission may use the information provided on Form N-CSR in its regulatory, disclosure review, inspection, and policymaking roles.
A registrant is required to disclose the information specified by Form N-CSR, and the Commission will make this information public. A registrant is not required to respond to the collection of information contained in Form N-CSR unless the Form displays a currently valid Office of Management and Budget (“OMB”) control number. Please direct comments concerning the accuracy of the information collection burden estimate and any suggestions for reducing the burden to Secretary, Securities and Exchange Commission, 100 F Street, NE, Washington, DC 20549. The OMB has reviewed this collection of information under the clearance requirements of 44 U.S.C. § 3507.
| ITEM 1. | REPORTS TO STOCKHOLDERS |

Management Discussion and Analysis (unaudited)
Dear Shareholders:
Over the course of 2010, the markets experienced several ups and downs driven by well-defined swings in investor sentiment. Optimism fueled strong market returns early in the year, as upbeat economic releases led investors to believe in the potential for a robust U.S. recovery. However, sentiment shifted drastically in May and June as more negative economic news and issues related to Europe’s government debt problems led to notable stock market losses. In another swing, the markets rebounded in the fall amid better economic developments and prospects that the Federal Reserve would enact another round of quantitative easing. That rally generally continued through the end of the year as the markets reacted positively to the U.S. tax compromise, which extended the Bush-era tax cuts for all income brackets.
With equities posting double-digit gains in the third and fourth quarters, the choppy year ended on a strong note, and broad equity indices have now produced back-to-back years of positive results. For the twelve months ending December 31, 2010, the S&P 500 Index returned 15.07%, while the S&P 500 Health Care Index earned only 2.9%, as Health Care was the lowest performing market sector in 2010.
The Life Sciences Series had a 14.80% return during 2010, noticeably outpacing the S&P 500 Health Care Index yet slightly lagging the broader stock market. More importantly, the Series continues to have a strong track record relative to the broad market and the sector-specific benchmark over the current market cycle, which includes both a bull and a bear market. Over this current cycle, the Life Sciences Series has earned an annualized return of 9.90%, compared to the 7.52% return of the S&P 500 Index and the 4.49% return of the S&P 500 Health Care Index.
In the volatile markets of 2010, Manning & Napier maintained a selective investment approach and focused on companies that we believe can grow market share. We continued to emphasize quality, targeting best-in-class companies expected to generate sales growth despite a muted economic backdrop, as well as “away game winners” expected to successfully compete in faster-growing markets overseas.
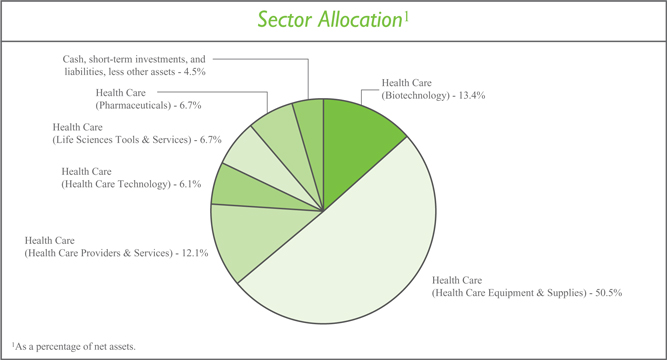
In the current health care environment, Manning & Napier is targeting companies that can lower costs and enhance quality. With this particular focus, over the past year the Series had a substantial weighting to diagnostics companies, which are part of the health care equipment and supplies industry. By emphasizing prevention and early detection, we believe diagnostics companies can improve health care treatment and help avoid expensive, unexpected hospital visits. The Series started 2010 with a significantly higher allocation to the health care equipment and supplies industry than the benchmark, and this exposure increased during the year. By the end of the year, about half of the portfolio consisted of companies within this industry.
The Advisor also sees opportunities in health care information technology companies. Over the last twelve months, the Series maintained an overweight to the health care technology industry relative to the benchmark, although this weighting is much smaller than that of the health care equipment and supplies industry. Additionally, the Series reduced exposure to health care providers and services over the past year, and the Series continued to have a noteworthy underweight to pharmaceuticals versus the benchmark, which aided relative returns.
Stock selection decisions were the primary drivers of outperformance for the Life Sciences Series in 2010. In particular, the Series’ relative results benefited from specific holdings in the health care equipment and supplies industry as well as the life sciences tools and services industry.
While economic developments turned more optimistic toward the end of 2010, the U.S. economy still faces significant headwinds, including a struggling housing market, a stagnant job market, a difficult consumer rebalancing act, and high government debt burdens. Given these long-term structural issues, the slow growth environment in the U.S. will likely remain a reality. As the markets fluctuated around this slow growth trend in 2010, Manning & Napier earned solid returns
1
Management Discussion and Analysis (unaudited)
by staying focused on the fundamentals and maintaining our selective investment process. This investment approach has proved beneficial for the past 40 years, and we believe these qualities will remain important as the market environment unfolds in 2011.
As always, we appreciate your business.
Sincerely,
Manning & Napier Advisors, Inc.
Performance Update as of December 31, 2010 (unaudited)
| | | | | | | | | | | | | | | | | | |
| | | | | | Average Annual Total Returns
As of December 31, 2010 | | | | | | |
| | | One
Year | | | Five Year | | | Ten Year | | | Since
Inception 1 | | | |
Manning & Napier Fund, Inc. - Life Sciences Series2 | | | 14.80 | % | | | 5.84% | | | | 6.36% | | | | 12.58% | | | |
S&P 500 Total Return Index3 | | | 15.07 | % | | | 2.30% | | | | 1.42% | | | | 1.05% | | | |
S&P 500 Health Care Index3 | | | 2.90 | % | | | 1.89% | | | | -0.23% | | | | 1.67% | | | |
| | | | | | | | | | | | | | | | | | | |
The following graph compares the value of a $10,000 investment in the Manning & Napier Fund, Inc. - Life Sciences Series for the ten years ended December 31, 2010 to the S&P 500 Total Return Index and the S&P 500 Health Care Index.

1Performance numbers for the Series and Indices are calculated from November 5, 1999, the Series’ current activation date.
2The Series’ performance does not reflect the deduction of taxes that a shareholder would pay on fund distributions or the redemption of shares. The Series’ performance is historical and may not be indicative of future results. The performance returns shown are inclusive of the net expense ratio of the Series. For the year ended December 31, 2010, this net expense ratio was 1.09%. The gross expense ratio, which does not account for any voluntary or contractual waivers currently in effect, was 1.09% for the year ended December 31, 2010.
3The S&P 500 Total Return Index is an unmanaged capitalization-weighted measure of 500 widely held common stocks listed on the New York Stock Exchange, American Stock Exchange and the Over-the-Counter market. The S&P 500 Health Care Index, a sub-index of the S&P 500 Total Return Index, includes the stocks of companies involved in the business of health care related products and services. Both Indices’ returns assume daily reinvestment of dividends and, unlike Series returns, do not reflect any fees or expenses.
Shareholder Expense Example (unaudited)
As a shareholder of the Series, you may incur two types of costs: (1) transaction costs and (2) ongoing costs, including management fees and other Series expenses. This example is intended to help you understand your ongoing costs (in dollars) of investing in the Series and to compare these costs with the ongoing costs of investing in other mutual funds.
The example is based on an investment of $1,000 invested at the beginning of the period and held for the entire period (July 1, 2010 to December 31, 2010).
Actual Expenses
The first line of the table below provides information about actual account values and actual expenses. You may use the information in this line, together with the amount you invested, to estimate the expenses that you paid over the period. Simply divide your account value by $1,000 (for example, an $8,600 account value divided by $1,000 = 8.6), then multiply the result by the number in the first line under the heading entitled “Expenses Paid During Period” to estimate the expenses you paid on your account during this period.
Hypothetical Example for Comparison Purposes
The second line of the table below provides information about hypothetical account values and hypothetical expenses based on the Series’ actual expense ratio and an assumed rate of return of 5% per year before expenses, which is not the Series’ actual return. The hypothetical account values and expenses may not be used to estimate the actual ending account balance or expenses you paid during the period. You may use this information to compare the ongoing costs of investing in the Series and other funds. To do so, compare this 5% hypothetical example with the 5% hypothetical examples that appear in the shareholder reports of the other funds.
Please note that the expenses shown in the table are meant to highlight your ongoing costs only and do not reflect any transaction costs. Therefore, the second line of the table is useful in comparing ongoing costs only, and will not help you determine the relative total costs of owning different funds. In addition, if these transaction costs were included, your costs would have been higher.
| | | | | | | | | | |
| | | Beginning
Account Value
7/1/10 | | | | Ending
Account Value
12/31/10 | | | | Expenses Paid
During Period*
7/1/10-12/31/10 |
Actual | | $1,000.00 | | | | $1,178.00 | | | | $6.04 |
Hypothetical
(5% return before expenses) | | $1,000.00 | | | | $1,019.66 | | | | $5.60 |
*Expenses are equal to the Series’ annualized expense ratio (for the six-month period) of 1.10%, multiplied by the average account value over the period, multiplied by 184/365 (to reflect the one-half year period). Expenses are based on the most recent fiscal half year; therefore, the expense ratio stated above may differ from the expense ratio stated in the financial highlights, which is based on one-year data. The Series’ total return would have been lower had certain expenses not been waived during the period.
Portfolio Composition as of December 31, 2010 (unaudited)
| | | | | | | | | | | | |
Top Ten Stock Holdings2 | |
Alere, Inc. | | | 5.8 | % | | | | Cerner Corp. | | | 4.0 | % |
Gen-Probe, Inc. | | | 5.8 | % | | | | Sequenom, Inc. | | | 3.5 | % |
Zoll Medical Corp. | | | 5.3 | % | | | | Insulet Corp. | | | 3.4 | % |
Cochlear Ltd. (Australia) | | | 4.7 | % | | | | Amgen, Inc. | | | 3.2 | % |
DexCom, Inc. | | | 4.5 | % | | | | UCB S.A. (Belgium) | | | 3.2 | % |
| | | | | |
2As a percentage of total investments. | | | | | | | | | | | | |
Investment Portfolio - December 31, 2010
| | | | | | | | |
| | | Shares | | | Value (Note 2) | |
| | |
COMMON STOCKS - 95.4% | | | | | | | | |
| | |
Financials - 0.0% | | | | | | | | |
Insurance - 0.0% | | | | | | | | |
Avalon HealthCare Holdings, Inc.*1,2,3,4 | | | 38,359 | | | $ | — | |
| | | | | | | | |
Health Care - 95.4% | | | | | | | | |
Biotechnology - 13.4% | | | | | | | | |
Amgen, Inc.* | | | 145,770 | | | | 8,002,773 | |
Basilea Pharmaceutica AG (Switzerland)*6 | | | 77,000 | | | | 5,354,529 | |
Cepheid, Inc.* | | | 155,000 | | | | 3,526,250 | |
Momenta Pharmaceuticals, Inc.* | | | 312,230 | | | | 4,674,083 | |
Swedish Orphan Biovitrum AB (Sweden)*6 | | | 740,501 | | | | 4,455,306 | |
United Therapeutics Corp.* | | | 114,500 | | | | 7,238,690 | |
| | | | | | | | |
| | | | | | | 33,251,631 | |
| | | | | | | | |
Health Care Equipment & Supplies - 50.5% | | | | | | | | |
Abaxis, Inc.* | | | 232,500 | | | | 6,242,625 | |
Alere, Inc.* | | | 273,000 | | | | 9,991,800 | |
Alere, Inc.*3,5 | | | 122,000 | | | | 4,465,200 | |
Becton, Dickinson and Co. | | | 57,000 | | | | 4,817,640 | |
Cochlear Ltd. (Australia)6 | | | 141,230 | | | | 11,625,969 | |
Conceptus, Inc.* | | | 405,000 | | | | 5,589,000 | |
Covidien plc (Ireland) | | | 148,601 | | | | 6,785,122 | |
DexCom, Inc.* | | | 815,000 | | | | 11,124,750 | |
Gen-Probe, Inc.*2 | | | 246,000 | | | | 14,354,100 | |
Hogy Medical Co. Ltd. (Japan)6 | | | 99,000 | | | | 4,811,432 | |
Hologic, Inc.* | | | 310,000 | | | | 5,834,200 | |
Insulet Corp.* | | | 550,970 | | | | 8,540,035 | |
Quidel Corp.* | | | 325,000 | | | | 4,696,250 | |
Sirona Dental Systems, Inc.* | | | 128,100 | | | | 5,352,018 | |
Straumann Holding AG (Switzerland)6 | | | 32,717 | | | | 7,492,365 | |
Zoll Medical Corp.*2 | | | 355,000 | | | | 13,216,650 | |
| | | | | | | | |
| | | | | | | 124,939,156 | |
| | | | | | | | |
Health Care Providers & Services - 12.1% | | | | | | | | |
Bio-Reference Laboratories, Inc.* | | | 280,000 | | | | 6,210,400 | |
China Cord Blood Corp. (Hong Kong)* | | | 894,000 | | | | 3,584,940 | |
Cross Country Healthcare, Inc.* | | | 640,300 | | | | 5,423,341 | |
Diagnosticos da America S.A. (Brazil) | | | 542,000 | | | | 7,346,385 | |
Sonic Healthcare Ltd. (Australia)6 | | | 614,000 | | | | 7,298,923 | |
| | | | | | | | |
| | | | | | | 29,863,989 | |
| | | | | | | | |
Health Care Technology - 6.1% | | | | | | | | |
Allscripts Healthcare Solutions, Inc.* | | | 277,000 | | | | 5,337,790 | |
Cerner Corp.* | | | 104,000 | | | | 9,852,960 | |
| | | | | | | | |
| | | | | | | 15,190,750 | |
| | | | | | | | |
| | |
| 6 | | The accompanying notes are an integral part of the financial statements. |
Investment Portfolio - December 31, 2010
| | | | | | | | |
| | | Shares | | | Value (Note 2) | |
| | |
COMMON STOCKS (continued) | | | | | | | | |
| | |
Health Care (continued) | | | | | | | | |
Life Sciences Tools & Services - 6.6% | | | | | | | | |
Caliper Life Sciences, Inc.* | | | 1,037,452 | | | $ | 6,577,446 | |
Sequenom, Inc.* | | | 1,085,000 | | | | 8,701,700 | |
WuXi PharmaTech (Cayman), Inc. - ADR (Cayman Islands)* | | | 70,000 | | | | 1,129,800 | |
| | | | | | | | |
| | | | | | | 16,408,946 | |
| | | | | | | | |
| | |
Pharmaceuticals - 6.7% | | | | | | | | |
Green Cross Corp. (South Korea)6 | | | 43,000 | | | | 5,260,298 | |
Teva Pharmaceutical Industries Ltd. - ADR (Israel) | | | 66,500 | | | | 3,466,645 | |
UCB S.A. (Belgium)6 | | | 228,939 | | | | 7,861,333 | |
| | | | | | | | |
| | | | | | | 16,588,276 | |
| | | | | | | | |
Total Health Care | | | | | | | 236,242,748 | |
| | | | | | | | |
TOTAL COMMON STOCKS
(Identified Cost $185,284,615) | | | | | | | 236,242,748 | |
| | | | | | | | |
| | |
PREFERRED STOCKS - 0.0% | | | | | | | | |
| | |
Financials - 0.0% | | | | | | | | |
Insurance - 0.0% | | | | | | | | |
Avalon HealthCare Holdings, Inc. - Series D*2,3,4,7
(Identified Cost $2,312,500) | | | 925,000 | | | | — | |
| | | | | | | | |
| | |
WARRANTS - 0.1% | | | | | | | | |
| | |
Financials - 0.0% | | | | | | | | |
Insurance - 0.0% | | | | | | | | |
Avalon HealthCare Holdings, Inc., 2/27/20142,3,4,8 | | | 38,359 | | | | — | |
| | | | | | | | |
Health Care - 0.1% | | | | | | | | |
Life Sciences Tools & Services - 0.1% | | | | | | | | |
Caliper Life Sciences, Inc., 8/10/2011 | | | 401,109 | | | | 248,687 | |
| | | | | | | | |
TOTAL WARRANTS
(Identified Cost $195,276) | | | | | | | 248,687 | |
| | | | | | | | |
| | |
SHORT-TERM INVESTMENTS - 4.7% | | | | | | | | |
| | |
Dreyfus Cash Management, Inc. - Institutional Shares9, 0.14%,
(Identified Cost $11,668,542) | | | 11,668,542 | | | | 11,668,542 | |
| | | | | | | | |
| | |
| The accompanying notes are an integral part of the financial statements. | | 7 |
Investment Portfolio - December 31, 2010
| | | | |
| | | Value (Note 2) | |
| |
TOTAL INVESTMENTS - 100.2%
(Identified Cost $199,460,933) | | $ | 248,159,977 | |
LIABILITIES, LESS OTHER ASSETS - (0.2%) | | | (596,067 | ) |
| | | | |
NET ASSETS - 100% | | $ | 247,563,910 | |
| | | | |
ADR - American Depository Receipt
*Non-income producing security
| 1 | This security was acquired on February 27, 2009 at a cost of $76,718 ($2.00 per share) and has been determined to be illiquid under guidelines established by the Board of Directors (see Note 2 to the financial statements). |
| 2 | Affiliated company as defined by the Investment Company Act of 1940 (see Note 2 to the financial statements). |
| 3 | Restricted securities - Investment in securities that are restricted as to public resale under the Securities Act of 1933, as amended. These securities amount to $4,465,200, or 1.8% of the Series’ net assets as of December 31, 2010 (see Note 2 to the financial statements). |
| 4 | Security has been valued at fair value (see Note 2 to the financial statements). |
| 5 | This security was acquired on February 3, 2006 at a cost of $2,978,020 ($24.41 per share) and has been determined to be liquid under guidelines established by the Board of Directors (see Note 2 to the financial statements). |
| 6 | International Fair Value factor from pricing service was applied. |
| 7 | This security was acquired on June 22, 2007 at a cost of $2,312,500 ($2.50 per share) and has been determined to be illiquid under guidelines established by the Board of Directors (see Note 2 to the financial statements). |
| 8 | This security was acquired on February 27, 2009 at a cost of $19,180 ($0.50 per warrant) and has been determined to be illiquid under guidelines established by the Board of Directors (see Note 2 to the financial statements). |
| 9 | Rate shown is the current yield as of December 31, 2010. |
| | |
| 8 | | The accompanying notes are an integral part of the financial statements. |
Statement of Assets and Liabilities
December 31, 2010
| | | | |
ASSETS: | | | | |
| |
Investments, at value (identified cost $199,460,933) (Note 2) | | $ | 248,159,977 | |
Receivable for fund shares sold | | | 157,402 | |
Foreign tax reclaims receivable | | | 131,557 | |
Dividends receivable | | | 75,196 | |
| | | | |
| |
TOTAL ASSETS | | | 248,524,132 | |
| | | | |
| |
LIABILITIES: | | | | |
| |
Accrued management fees (Note 3) | | | 204,807 | |
Accrued fund accounting and administration fees (Note 3) | | | 7,788 | |
Accrued transfer agent fees (Note 3) | | | 2,594 | |
Accrued Chief Compliance Officer service fees (Note 3) | | | 245 | |
Payable for fund shares repurchased | | | 355,159 | |
Payable for securities purchased | | | 326,716 | |
Other payables and accrued expenses | | | 62,913 | |
| | | | |
| |
TOTAL LIABILITIES | | | 960,222 | |
| | | | |
| |
TOTAL NET ASSETS | | $ | 247,563,910 | |
| | | | |
| |
NET ASSETS CONSIST OF: | | | | |
| |
Capital stock | | $ | 203,302 | |
Additional paid-in-capital | | | 219,578,943 | |
Undistributed net investment loss | | | (20,942 | ) |
Accumulated net realized loss on investments, foreign currency and translation of other assets and liabilities | | | (20,912,749 | ) |
Net unrealized appreciation on investments, foreign currency and translation of other assets and liabilities | | | 48,715,356 | |
| | | | |
| |
TOTAL NET ASSETS | | $ | 247,563,910 | |
| | | | |
| |
NET ASSET VALUE, OFFERING PRICE AND REDEMPTION PRICE PER SHARE - CLASS A
($247,563,910/20,330,172 shares) | | $ | 12.18 | |
| | | | |
| | |
| The accompanying notes are an integral part of the financial statements. | | 9 |
Statement of Operations
For the Year Ended December 31, 2010
| | | | |
INVESTMENT INCOME: | | | | |
| |
Dividends (net of foreign taxes withheld, $154,466) | | $ | 1,804,817 | |
Interest | | | 1,681 | |
| | | | |
| |
Total Investment Income | | | 1,806,498 | |
| | | | |
| |
EXPENSES: | | | | |
| |
Management fees (Note 3) | | | 2,650,046 | |
Fund accounting and administration fees (Note 3) | | | 61,888 | |
Transfer agent fees (Note 3) | | | 15,672 | |
Directors’ fees (Note 3) | | | 10,566 | |
Chief Compliance Officer service fees (Note 3) | | | 2,631 | |
Custodian fees | | | 52,878 | |
Miscellaneous | | | 102,561 | |
| | | | |
| |
Total Expenses | | | 2,896,242 | |
Less reduction of expenses (Note 3) | | | (758 | ) |
| | | | |
| |
Net Expenses | | | 2,895,484 | |
| | | | |
| |
NET INVESTMENT LOSS | | | (1,088,986 | ) |
| | | | |
| |
REALIZED AND UNREALIZED GAIN (LOSS) ON INVESTMENTS AND FOREIGN CURRENCY: | | | | |
| |
Net realized gain (loss) on- | | | | |
Investments | | | 18,309,383 | |
Foreign currency and translation of other assets and liabilities | | | (75,704 | ) |
| | | | |
| | | 18,233,679 | |
| | | | |
| |
Net change in unrealized appreciation appreciation on- | | | | |
Investments | | | 17,281,571 | |
Foreign currency and translation of other assets and liabilities | | | 12,605 | |
| | | | |
| |
| | | 17,294,176 | |
| | | | |
| |
NET REALIZED AND UNREALIZED GAIN ON INVESTMENTS AND FOREIGN CURRENCY | | | 35,527,855 | |
| | | | |
| |
NET INCREASE IN NET ASSETS RESULTING FROM OPERATIONS | | $ | 34,438,869 | |
| | | | |
| | |
| 10 | | The accompanying notes are an integral part of the financial statements. |
Statements of Changes in Net Assets
| | | | | | | | |
| | | For the Year Ended 12/31/10 | | | For the Year Ended 12/31/09 | |
INCREASE (DECREASE) IN NET ASSETS: | | | | | | | | |
| | |
OPERATIONS: | | | | | | | | |
| | |
Net investment loss | | $ | (1,088,986 | ) | | $ | (1,203,760 | ) |
Net realized gain (loss) on investments, foreign currency and written options | | | 18,233,679 | | | | (3,756,944 | ) |
Net change in unrealized appreciation on investments and foreign currency | | | 17,294,176 | | | | 99,105,593 | |
| | | | | | | | |
| | |
Net increase from operations | | | 34,438,869 | | | | 94,144,889 | |
| | | | | | | | |
| | |
CAPITAL STOCK ISSUED AND REPURCHASED: | | | | | | | | |
| | |
Net decrease from capital share transactions (Note 5) | | | (59,818,922 | ) | | | (3,905,204 | ) |
| | | | | | | | |
| | |
Net increase (decrease) in net assets | | | (25,380,053 | ) | | | 90,239,685 | |
| | |
NET ASSETS: | | | | | | | | |
| | |
Beginning of year | | | 272,943,963 | | | | 182,704,278 | |
| | | | | | | | |
| | |
End of year (including undistributed net investment income (loss) of $(20,942) and $0, respectively) | | $ | 247,563,910 | | | $ | 272,943,963 | |
| | | | | | | | |
| | |
| The accompanying notes are an integral part of the financial statements. | | 11 |
Financial Highlights
| | | | | | | | | | | | | | | | | | | | | | | | |
| | | | |
| | | | | | For the Years Ended | | | | | | | |
| | | 12/31/10 | | | 12/31/09 | | | 12/31/08 | | | 12/31/07 | | | 12/31/06 | | | | |
Per share data (for a share outstanding throughout each year): | | | | | | | | | | | | | | | | | | | | | | | | |
Net asset value - Beginning of year | | $ | 10.61 | | | $ | 6.99 | | | $ | 11.54 | | | $ | 11.41 | | | $ | 12.10 | | | | | |
| | | | | | | | | | | | | | | | | | | | | | | | |
Income (loss) from investment operations: | | | | | | | | | | | | | | | | | | | | | | | | |
Net investment loss | | | (0.04 | )1 | | | (0.05 | )1 | | | (0.06 | ) | | | (0.08 | ) | | | (0.05 | ) | | | | |
Net realized and unrealized gain (loss) on investments | | | 1.61 | | | | 3.67 | | | | (4.38 | ) | | | 1.25 | | | | 1.56 | | | | | |
| | | | | | | | | | | | | | | | | | | | | | | | |
| | | | | | |
Total from investment operations | | | 1.57 | | | | 3.62 | | | | (4.44 | ) | | | 1.17 | | | | 1.51 | | | | | |
| | | | | | | | | | | | | | | | | | | | | | | | |
| | | | | | |
Less distributions to shareholders: | | | | | | | | | | | | | | | | | | | | | | | | |
From net realized gain on investments | | | — | | | | — | | | | (0.11 | ) | | | (1.04 | ) | | | (2.20 | ) | | | | |
| | | | | | | | | | | | | | | | | | | | | | | | |
| | | | | | |
Net asset value - End of year | | $ | 12.18 | | | $ | 10.61 | | | $ | 6.99 | | | $ | 11.54 | | | $ | 11.41 | | | | | |
| | | | | | | | | | | | | | | | | | | | | | | | |
| | | | | | |
Net assets - End of year | | | | | | | | | | | | | | | | | | | | | | | | |
(000’s omitted) | | $ | 247,564 | | | $ | 272,944 | | | $ | 182,704 | | | $ | 299,669 | | | $ | 233,072 | | | | | |
| | | | | | | | | | | | | | | | | | | | | | | | |
Total return2 | | | 14.80% | | | | 51.79% | | | | (38.77%) | | | | 10.62% | | | | 12.52% | | | | | |
Ratios (to average net assets)/ | | | | | | | | | | | | | | | | | | | | | | | | |
Supplemental Data: | | | | | | | | | | | | | | | | | | | | | | | | |
Expenses* | | | 1.09% | | | | 1.11% | | | | 1.12% | | | | 1.12% | | | | 1.14% | | | | | |
Net investment loss | | | (0.41% | ) | | | (0.55% | ) | | | (0.65% | ) | | | (0.75% | ) | | | (0.51% | ) | | | | |
Portfolio turnover | | | 67% | | | | 95% | | | | 94% | | | | 95% | | | | 93% | | | | | |
|
*The investment advisor did not impose all or a portion of its management fees, CCO fees, fund accounting and transfer agent fees, and other fees in some years and in some years paid a portion of the Series’ expenses. If these expenses had been incurred by the Series, the expense ratio (to average net assets) would have been increased by the following amounts: | |
| | | 0.00%3 | | | | 0.01% | | | | N/A | | | | N/A | | | | N/A | | | | | |
1Calculated based on average shares outstanding during the year.
2Represents aggregate total return for the years indicated, and assumes reinvestment of all distributions. Total returns would have been lower had certain expenses not been waived or reimbursed during certain years.
3Less than 0.01%.
| | |
| 12 | | The accompanying notes are an integral part of the financial statements. |
Notes to Financial Statements
Life Sciences Series (the “Series”) is a no-load diversified series of Manning & Napier Fund, Inc. (the “Fund”). The Fund is organized in Maryland and is registered under the Investment Company Act of 1940 (the “1940 Act”), as amended, as an open-end management investment company.
The Series’ investment objective is to provide long-term growth by investing principally in the common stocks of companies in the life sciences industry.
The Fund’s Advisor is Manning & Napier Advisors, Inc. (the “Advisor”). On November 5, 1999, the Series resumed sales of shares to advisory clients and employees of the Advisor and its affiliates. On May 1, 2001, the Series began offering shares directly to investors. Previously, the Series was available from time to time to advisory clients and employees of the Advisor. The total authorized capital stock of the Fund consists of 10.0 billion shares of common stock each having a par value of $0.01. As of December 31, 2010, 6.2 billion shares have been designated in total among 29 series, of which 100 million have been designated as Life Sciences Series Class A common stock.
| 2. | SIGNIFICANT ACCOUNTING POLICIES |
Security Valuation
Portfolio securities, including domestic equities, foreign equities, warrants and options, listed on an exchange other than the NASDAQ National Market System are valued at the latest quoted sales price of the exchange on which the security is primarily traded. Securities not traded on valuation date or securities not listed on an exchange are valued at the latest quoted bid price provided by the Fund’s pricing service. Securities listed on the NASDAQ National Market System are valued in accordance with the NASDAQ Official Closing Price.
Short-term investments that mature in sixty days or less are valued at amortized cost, which approximates market value. Investments in open-end investment companies are valued at their net asset value per share on valuation date.
Volume and level of activity in established markets for an asset or liability are evaluated to determine whether recent transactions and quoted prices are determinative of fair value. Where there have been significant decreases in volume and level of activity, further analysis and adjustment may be necessary to estimate fair value. The Series measures fair value in these instances by the use of inputs and valuation techniques which may be based upon current market prices of securities that are comparable in coupon, rating, maturity and industry and/or expectation of future cash flows. As a result of trading in relatively thin markets and/or markets that experience significant volatility, the prices used by the Series to value these securities may differ from the value that would be realized if these securities were sold, and the differences could be material.
Securities for which representative valuations or prices are not available from the Fund’s pricing service may be valued at fair value. Due to the inherent uncertainty of valuations of such securities, the fair value may differ significantly from the values that would have been used had a ready market for such securities existed. If trading or events occurring after the close of the principal market in which securities are traded are expected to materially affect the value of those securities, then they may be valued at their fair value, taking this trading or these events into account. Fair value is determined in good faith by the Advisor under procedures approved by and under the general supervision and responsibility of the Fund’s Board of Directors (the “Board”). In accordance with the procedures approved by the Board, the Series applies fair value pricing on a daily basis except for North American, Central American, South American and Caribbean equity securities. Fair valuing of securities is determined with the assistance of a pricing service using calculations or factors based on indices of domestic securities and other appropriate indicators, such as prices of relevant American Depository Receipts and futures contracts, to adjust local market prices for subsequent movements through the time the Series calculates its net asset value. The value of securities used for the net asset value calculation under the procedures may differ from published prices for the same securities. It is the Fund’s
Notes to Financial Statements
| 2. | SIGNIFICANT ACCOUNTING POLICIES (continued) |
Security Valuation (continued)
policy to classify each foreign equity security, except for those in the regions noted above, as Level 2 securities due to the fact the pricing service evaluated what factor was applied to the calculated end of day market price.
Various inputs are used in determining the value of the Series’ assets or liabilities carried at market value. These inputs are summarized in three broad levels. Level 1 includes quoted prices in active markets for identical assets and liabilities. Level 2 includes other significant observable inputs (including quoted prices for similar securities, interest rates, prepayment speeds, credit risk, etc.). Level 3 includes significant unobservable inputs (including the Series’ own assumptions in determining the fair value of investments). The inputs or methodology used for valuing securities are not necessarily an indication of the risk associated with investing in those securities.
The following is a summary of the valuation levels used for major security types as of December 31, 2010 in valuing the Series’ assets or liabilities carried at market value:
| | | | | | | | | | | | | | | | |
| Description | | Total | | | Level 1 | | | Level 2 | | | Level 3 | |
Assets: | | | | | | | | | | | | | | | | |
Equity securities* | | $ | 236,491,435 | | | $ | 182,331,280 | | | $ | 54,160,155 | | | $ | — | **** |
Preferred securities | | | — | | | | — | | | | — | | | | — | |
Debt securities | | | — | | | | — | | | | — | | | | — | |
Mutual funds | | | 11,668,542 | | | | 11,668,542 | | | | — | | | | — | |
Other financial
instruments**: | | | — | | | | — | | | | — | | | | — | |
| | | | | | | | | | | | | | | | |
Total assets: | | | 248,159,977 | | | | 193,999,822 | | | | 54,160,155 | | | | — | |
| | | | | | | | | | | | | | | | |
Liabilities: | | | | | | | | | | | | | | | | |
Other financial
instruments**: | | | — | | | | — | | | | — | | | | — | |
| | | | | | | | | | | | | | | | |
Total liabilities: | | | — | | | | — | | | | — | | | | — | |
| | | | | | | | | | | | | | | | |
Total | | $ | 248,159,977 | | | $ | 193,999,822 | | | $ | 54,160,155 | | | $ | — | |
| | | | | | | | | | | | | | | | |
The following table is a reconciliation of Level 3 investments for which significant unobservable inputs were used to determine fair value:
| | | 000000000000 | | | 000000000000 | | | 000000000000 | |
| Level 3 reconciliation | | Equity Securities | | | | | Preferred Securities | |
Balance as of December 31, 2009 (market value) | | $ | 37,739 | | | | | $ | 231,250 | |
Realized gain (loss) | | | (365,484 | ) | | | | | — | |
Change in unrealized appreciation (depreciation)*** | | | 327,745 | | | | | | (231,250 | ) |
Net purchases (sales) | | | — | | | | | | — | |
Transfers in and/or out of Level 3 | | | — | | | | | | — | |
| | | | | | | | | | |
Balance as of December 31, 2010 (market value) | | $ | — | | | | | $ | — | |
| | | | | | | | | | |
*Includes common stock, warrants and rights. Please see the Investment Portfolio for industry classification and for securities where an International Fair Value factor from the pricing service was applied to value the security. Such securities are included in Level 2 in the table above.
**Other financial instruments are derivative instruments not reflected in the Investment Portfolio, such as futures, forwards and swap contracts, which are valued at the unrealized appreciation/depreciation on the instrument. As of December 31, 2010, the Series did not hold any derivative instruments.
Notes to Financial Statements
| 2. | SIGNIFICANT ACCOUNTING POLICIES (continued) |
Security Valuation (continued)
***The change in unrealized appreciation (depreciation) on securities still held at December 31, 2010 was $(241,223), which is included in the related net change in unrealized appreciation/depreciation on the Statement of Operations.
****Avalon Healthcare Holdings, Inc., Avalon Healthcare Holdings, Inc.- Series D, and Avalon Healthcare Holdings, Inc. 2/27/2014 are Level 3 as of December 31, 2010. However, there is no market value for these securities reported in the financial statements.
The Fund’s policy is to recognize transfers in and transfers out of the valuation levels as of the beginning of the reporting period. During the year ended December 31, 2010, the Fund had three foreign equity securities transfer from Level 1 to Level 2 due to the implementation of new international fair value pricing procedures. The following is a summary of the foreign equity securities that transferred from Level 1 to Level 2:
| | | | | | | | | | | | | | |
| | | Total # Securities Level 1 at beginning and Level 2 at end of period | | Total Market
Value
Beginning of
period | | | Total Market
Value End of period | | | Change in
Market Value | |
| | 3 | | $ | 30,576,707 | | | $ | 26,417,257 | | | $ | (4,159,450 | ) |
Additional disclosure surrounding the activity in Level 3 fair value measurement will be effective for fiscal years beginning after December 15, 2010. Management has concluded that this will not have a material impact on the Series’ financial statements.
Security Transactions, Investment Income and Expenses
Security transactions are accounted for on trade date. Dividend income is recorded on the ex-dividend date, except that if the ex-dividend date has passed, certain dividends from foreign securities are recorded as soon as the Fund is informed of the ex-dividend date. Non-cash dividends, if any, are recorded at the fair market value of the securities received. Interest income, including amortization of premium and accretion of discounts using the effective interest method, is earned from settlement date and accrued daily.
Expenses are recorded on an accrual basis. Most expenses of the Fund can be attributed to a specific series. Expenses which cannot be directly attributed are apportioned among the series in the Fund in such a manner as deemed equitable by the Fund’s Board, taking into consideration, among other things, the nature and type of expense.
The Series uses the identified cost method for determining realized gain or loss on investments for both financial statement and federal income tax reporting purposes.
Foreign Currency Translation
The books and records of the Series are maintained in U.S. dollars. Foreign currencies, investments and other assets and liabilities are translated into U.S. dollars at the current exchange rates. Purchases and sales of investment securities and income and expenses are translated on the respective dates of such transactions. The Series does not isolate realized and unrealized gains and losses attributable to changes in the exchange rates from gains and losses that arise from changes in the market value of investments. Such fluctuations are included with net realized and unrealized gain or loss on investments. Net realized foreign currency gains and losses represent foreign currency gains and losses between trade date and settlement date on securities transactions, gains and losses on disposition of foreign currencies and the difference between the amount of income and foreign withholding taxes recorded on the books of the Series and the amounts actually received or paid.
Notes to Financial Statements
Restricted securities
Restricted securities are purchased in private placement transactions, are not registered under the Securities Act of 1933, as amended, and may have contractual restrictions on resale. Information regarding restricted securities is included at the end of the Series’ Investment Portfolio.
Illiquid Securities
A security may be considered illiquid if so deemed in good faith by the Advisor under procedures approved by and under the general supervision and responsibility of the Fund’s Board. Securities that are illiquid are marked with the applicable footnote on the Investment Portfolio. As of December 31, 2010, the aggregate value of securities deemed illiquid was $0 representing 0% of the Series’ net assets.
Affiliated Companies
The 1940 Act defines “affiliated companies” to include securities in which a series owns 5% or more of the outstanding voting securities of the issuer. The following transactions were effected for the year ended December 31, 2010:
| | | | | | | | | | | | | | |
| Name of Issuer | | Value at
12/31/09 | | Purchase
Cost | | Sales
Proceeds | | Value at
12/31/10 | | Shares Held at
12/31/10 | | Dividend
Income
12/31/09
through
12/31/10 | | Net Realized
Gain (Loss)
12/31/09
through
12/31/10 |
Avalon | | | | | | | | | | | | | | |
HealthCare | | | | | | | | | | | | | | |
Holdings, Inc. - | | | | | | | | | | | | | | |
Series D | | $231,250 | | $— | | $— | | $— | | 925,000 | | $— | | $— |
Avalon | | | | | | | | | | | | | | |
HealthCare | | | | | | | | | | | | | | |
Holdings, Inc. | | 9,590 | | — | | — | | — | | 38,359 | | — | | — |
Avalon | | | | | | | | | | | | | | |
HealthCare | | | | | | | | | | | | | | |
Holdings, Inc. - | | | | | | | | | | | | | | |
Warrants | | | | | | | | | | | | | | |
2/27/2014 | | 383 | | — | | — | | — | | 38,359 | | — | | — |
| | | | | | | | | | | | | | |
| | $241,223 | | $— | | $— | | $— | | 1,001,718 | | $— | | $— |
| | | | | | | | | | | | | | |
Federal Taxes
The Series’ policy is to comply with the provisions of the Internal Revenue Code applicable to regulated investment companies. The Series is not subject to federal income tax or excise tax to the extent that the Series distributes to shareholders each year its taxable income, including any net realized gains on investments, in accordance with requirements of the Internal Revenue Code. Accordingly, no provision for federal income tax or excise tax has been made in the financial statements.
Management evaluates its tax positions to determine if the tax positions taken meet the minimum recognition threshold in connection with accounting for uncertainties in income tax positions taken or expected to be taken for the purposes of measuring and recognizing tax liabilities in the financial statements. Recognition of tax benefits of an uncertain tax position is required only when the position is “more likely than not” to be sustained assuming examination by taxing authorities. At December 31, 2010, the Series has recorded no liability for net unrecognized tax benefits relating to uncertain income tax positions taken or expected to be taken in future tax returns.
The Series files income tax returns in the U.S. federal jurisdiction, various states and foreign jurisdictions, as required. No income tax returns are currently under investigation. The statute of limitations on the Series’ tax returns remains open for the years ended December 31, 2007 through December 31, 2010. The Fund is not aware of any tax positions for which it is reasonably possible that the total amounts of unrecognized tax benefits will significantly change in the next twelve months.
Notes to Financial Statements
Additionally, based on the Fund’s understanding of the tax rules and rates related to income, gains and transactions for foreign jurisdictions in which it invests, the Series will provide for foreign taxes, and where appropriate, deferred foreign tax.
Distributions of Income and Gains
Distributions to shareholders of net investment income and net realized gains are made annually. An additional distribution may be necessary to avoid taxation of the Series. Distributions are recorded on the ex-dividend date.
Indemnifications
The Fund’s organizational documents provide former and current directors and officers with a limited indemnification against liabilities arising in connection with the performance of their duties to the Fund. In the normal course of business, the Fund may also enter into contracts that provide general indemnifications. The Fund’s maximum exposure under these arrangements is unknown as this would be dependent on future claims that may be made against the Fund. The risk of material loss from such claims is considered remote.
Other
The preparation of financial statements in conformity with accounting principles generally accepted in the United States of America requires management to make estimates and assumptions that affect the reported amounts of assets and liabilities and the disclosure of contingent assets and liabilities at the date of the financial statements and the reported amounts of income and expenses during the reporting period. Actual results could differ from those estimates.
| 3. | TRANSACTIONS WITH AFFILIATES |
The Fund has an Investment Advisory Agreement (the “Agreement”) with the Advisor, for which the Series pays a fee, computed daily and payable monthly, at an annual rate of 1.00% of the Series’ average daily net assets. Under the Agreement, personnel of the Advisor provide the Series with advice and assistance in the choice of investments and the execution of securities transactions, and otherwise maintain the Series’ organization. The Advisor also provides the Fund with necessary office space and fund administration and support services. The salaries of all officers of the Fund (except a percentage of the Fund’s Chief Compliance Officer’s salary, which is paid by the Fund), and of all Directors who are “affiliated persons” of the Fund, or of the Advisor, and all personnel of the Fund, or of the Advisor, performing services relating to research, statistical and investment activities, are paid by the Advisor. Each “non-affiliated” Director receives an annual stipend, which is allocated among all the active series of the Fund. In addition, these Directors also receive a fee per Board meeting attended plus a fee for each committee meeting attended.
Manning & Napier Investor Services, Inc., a registered broker-dealer affiliate of the Advisor, acts as distributor for the Fund’s shares. The services of Manning & Napier Investor Services, Inc. are provided at no additional cost to the Series.
For the year ended December 31, 2010, the Advisor voluntarily waived fees of $758, which is included as a reduction of expenses on the Statement of Operations. The Advisor is not eligible to recoup any expenses that have been waived or reimbursed in prior years.
The Advisor has agreements with PNC Global Investment Servicing (U.S.) Inc. (“PNCGIS”) under which PNCGIS serves as sub-accountant services agent and sub-transfer agent. The Fund pays the Advisor an annual fee related to fund accounting and administration of 0.0175% on the first $3 billion of average daily net assets (excluding Target Series); 0.015% on the next $3 billion of average daily net assets (excluding Target Series); and 0.01% of the average daily net assets in excess of $6 billion (excluding Target Series); plus a base fee of $25,500 per Series.
Notes to Financial Statements
| 3. | TRANSACTIONS WITH AFFILIATES (continued) |
Transfer Agent fees are charged to the Fund on a per account basis. Additionally, certain transaction- and cusip-based fees and out-of-pocket expenses, including charges for reporting relating to the Fund’s compliance program, are charged.
Effective July 1, 2010, PNCGIS, was sold to The Bank of New York Mellon Corporation, the Series’ custodian. At the close of the sale, PNCGIS changed its name to BNY Mellon Investment Servicing (U.S.) Inc. (“BNY”).
Expenses not directly attributable to a Series are allocated based on each Series’ relative net assets or number of accounts, depending on the expense.
| 4. | PURCHASES AND SALES OF SECURITIES |
For the year ended December 31, 2010, purchases and sales of securities, other than U.S. Government securities and short-term securities, were $166,102,061 and $233,048,440, respectively. There were no purchases or sales of U.S. Government securities.
| 5. | CAPITAL STOCK TRANSACTIONS |
Transactions in shares of Life Sciences Series were:
| | | | | | | | | | | | | | | | |
| | | For the Year Ended 12/31/10 | | | For the Year Ended 12/31/09 | |
| | | Shares | | | Amount | | | Shares | | | Amount | |
Sold | | | 2,426,114 | | | $ | 26,545,889 | | | | 3,589,547 | | | $ | 27,786,051 | |
Reinvested | | | — | | | | — | | | | — | | | | — | |
Repurchased | | | (7,813,236 | ) | | | (86,364,811 | ) | | | (4,015,779 | ) | | | (31,691,255 | ) |
| | | | | | | | | | | | | | | | |
Total | | | (5,387,122 | ) | | $ | (59,818,922 | ) | | | (426,232 | ) | | $ | (3,905,204 | ) |
| | | | | | | | | | | | | | | | |
Substantially all of the Series’ shares represent investments by fiduciary accounts over which the Advisor has sole investment discretion.
The Series may trade in instruments including written and purchased options, forward foreign currency exchange contracts and futures contracts and other derivatives in the normal course of investing activities to assist in managing exposure to various market risks. Investments in these instruments may subject the Series to various elements of risk, which may involve, to a varying degree, elements of risk in excess of the amounts recognized for financial statement purposes. These risks include: the risk that changes in the value of a derivative may not correlate perfectly with the underlying asset, rate or index, counterparty credit risk related to over the counter derivatives counterparties’ failure to perform under contract terms, liquidity risk related to the lack of a liquid market for these contracts allowing the fund to close out its position(s) and documentation risk relating to disagreement over contract terms. No such investments were held by the Series during the year ended December 31, 2010.
Investing in securities of foreign companies and foreign governments involves special risks and considerations not typically associated with investing in securities of domestic companies and the U.S. Government. These risks include revaluation of currencies and future adverse political and economic developments. Moreover, securities of foreign companies and foreign governments and their markets may be less liquid and their prices more volatile than those of comparable domestic companies and the U.S. Government.
Notes to Financial Statements
| 8. | LIFE SCIENCES SECURITIES |
The Series may focus its investments in certain related life sciences industries; hence, the Series may subject itself to a greater degree of risk than a series that is more diversified.
| 9. | FEDERAL INCOME TAX INFORMATION |
The amount and characterization of certain income and capital gains to be distributed are determined in accordance with federal income tax regulations, which may differ from accounting principles generally accepted in the United States of America. These differences are primarily due to differing book and tax treatments in the timing of the recognition of net investment income or gains and losses, including net operating losses, foreign currency gains and losses, losses deferred due to wash sales and post-October losses. The Series may periodically make reclassifications among its capital accounts to reflect income and gains available for distribution (or available capital loss carryovers) under income tax regulations without impacting the Series’ net asset value. Any such reclassifications are not reflected in the financial highlights.
There were no distributions to shareholders for the years ended December 31, 2010 or December 31, 2009. For the year ended December 31, 2010, the Series elected to defer $20,942 of currency losses, attributable to post-October losses.
At December 31, 2010, the tax basis of distributable earnings and the net unrealized appreciation based on the identified cost for federal income tax purposes were as follows:
| | | | | | |
Cost for federal income tax purposes | | $ | 199,954,537 | | | |
Unrealized appreciation | | $ | 54,788,657 | | | |
Unrealized depreciation | | | (6,583,217 | ) | | |
| | | | | | |
Net unrealized appreciation | | $ | 48,205,440 | | | |
| | | | | | |
Capital loss carryover | | | 20,419,145 | | | |
At December 31, 2010, the capital loss carryover, disclosed above, available to the extent allowed by tax law to offset future net capital gain, if any, will expire as follows:
| | | | |
| Loss Carryover | | Expiration Date | | |
$15,858,502 | | December 31, 2016 | | |
$ 4,560,643 | | December 31, 2017 | | |
The capital loss carryover utilized in the current year was $17,300,198.
Report of Independent Registered Public Accounting Firm
To the Board of Directors of Manning & Napier Fund, Inc. and Shareholders of Life Sciences Series:
In our opinion, the accompanying statement of assets and liabilities, including the investment portfolio, and the related statements of operations and of changes in net assets and the financial highlights present fairly, in all material respects, the financial position of the Life Sciences Series (a series of Manning & Napier Fund, Inc., hereafter referred to as the “Series”) at December 31, 2010, and the results of its operations for the year then ended, the changes in its net assets for each of the two years in the period then ended and the financial highlights for each of the five years in the period then ended, in conformity with accounting principles generally accepted in the United States of America. These financial statements and financial highlights (hereafter referred to as “financial statements”) are the responsibility of the Series’ management. Our responsibility is to express an opinion on these financial statements based on our audits. We conducted our audits of these financial statements in accordance with the standards of the Public Company Accounting Oversight Board (United States). Those standards require that we plan and perform the audit to obtain reasonable assurance about whether the financial statements are free of material misstatement. An audit includes examining, on a test basis, evidence supporting the amounts and disclosures in the financial statements, assessing the accounting principles used and significant estimates made by management, and evaluating the overall financial statement presentation. We believe that our audits, which included confirmation of securities at December 31, 2010 by correspondence with the custodian and brokers, provide a reasonable basis for our opinion.

New York, New York
February 22, 2011
Renewal of Investment Advisory Agreement (unaudited)
At the Manning & Napier Fund, Inc. (the “Fund”) Board of Directors’ (the “Board”) meeting, held on November 17, 2010, the Investment Advisory Agreement (the “Agreement”) between the Fund and Manning & Napier Advisors, Inc. (the “Advisor”) was reviewed by the Board for renewal. In connection with the decision whether to renew the Agreement, a variety of material was prepared for and reviewed by the Board.
Representatives of the Advisor attended the meeting and presented additional oral and written information to the Board to assist the Board in its considerations. The discussion immediately below outlines the materials and information presented to the Board in connection with the Board’s 2010 Annual Review of the Agreement and the conclusions made by the Directors when determining to continue the Agreement.
| | • | | The Board considered the services provided by the Advisor under the Agreement including, among others: deciding what securities to purchase and sell for each Series; arranging for the purchase and sale of such securities by placing orders with broker-dealers; administering the affairs of the Fund (including the books and records of the Fund not maintained by third party service providers such as the custodian or sub-transfer agent); arranging for the insurance coverage for the Fund; and supervising the preparation of tax returns, SEC filings (including registration statements) and reports to shareholders for the Fund. The Board also considered the nature and quality of such services provided under the Agreement in light of the Advisor’s services provided to the Fund for 24 years. The Board discussed the quality of these services with representatives from the Advisor and concluded that the Advisor was performing its services to the Fund required under the Agreement in a reasonable manner. |
| | • | | The Board considered the investment performance of the various Series of the Fund. The investment performance for each Series was reviewed on a cumulative basis since inception and on a one year basis. In addition, annualized performance for the following time periods was considered: inception, three year, five year, ten year, and current market cycle. A market cycle includes periods of both rising and falling markets. Returns for established benchmark indices for each Series were provided for each time period. The Board noted that the various Series were competitive against their respective benchmarks and/or peer groups over various time periods, but in particular over the full market cycle period relevant for the Series. In addition, the Board considered at the meeting (and considers on a quarterly basis) a peer group performance analysis consisting of Morningstar universes of mutual funds with similar investment objectives. The Board discussed the performance with representatives from the Advisor and concluded that the investment performance of each of the Fund’s Series was reasonable based on the Fund’s actual performance and comparative performance, especially performance over the current market cycle. |
| | • | | The Board considered the costs of the Advisor’s services and the profits of the Advisor as they relate to the Advisor’s services to the Fund under the Agreement. In reviewing the Advisor’s costs and profits, the Board discussed the Advisor’s revenues generated from the Fund (on both an actual and adjusted basis) and its expenses associated with providing the services under the Agreement. In addition, the Board reviewed the Advisor’s expenses associated with Fund activities outside of the Agreement (such as expense reimbursements pursuant to expense caps and payments made by the Advisor to third party platforms on which shares of the Fund are available for purchase). It was noted by representatives of the Advisor that 11 of the 27 active Series of the Fund are currently experiencing expenses above the capped expense ratios. After discussing the above costs and profits, the Board concluded that the Advisor’s profitability relating to its services provided under the Agreement was reasonable. |
| | • | | The Board considered the fees and expenses of the various Series of the Fund. The Advisor presented the advisory fees and total expenses for each Series, including the advisory fee adjusted for any expense waivers or reimbursements (either contractual or voluntary) paid by the Advisor. The advisory fees and expense ratios of each Series were compared to an average (on both a mean and median basis) of similar funds as disclosed on the Morningstar database. Representatives of the Advisor discussed with the Board the levels of its advisory |
Renewal of Investment Advisory Agreement (unaudited)
fee for each Series of the Fund and as compared to the median and mean advisory fees for similar funds as listed on Morningstar. Expense ratios for every Series, except the Pro-Blend’s Class R and Class C, and Target Class R and Class C, are currently below the median and mean for similar funds as listed on Morningstar. Based on their review of the information provided, the Board concluded that the fees and expenses of each Series of the Fund were reasonable on a comparative basis.
| | • | | The Board also considered the other benefits the Advisor derives from its relationship with the Fund. Such other benefits include certain research products provided by soft dollars. Given the level of soft dollar transactions involving the Fund, the Board concluded that these additional benefits to the Advisor were reasonable. |
| | • | | In addition to the factors described above, the Board considered the Advisor’s personnel, investment strategies, policies and procedures relating to compliance with personal securities transactions, and reputation, expertise and resources in domestic and foreign financial markets. The Board concluded that these factors support the conclusion that the Advisor performs its services in a reasonable manner. |
| | • | | The Board did not consider economies of scale at this time because of the multiple uses of the Fund (for the Advisor’s discretionary investment account clients in addition to direct investors), the current profitability of the Advisor’s services to the Fund under the Agreement, and the overall size of the Fund complex. |
Based on the Board’s deliberations and their evaluation of the information described above, the Board, including a majority of Directors that are not “interested persons” as defined in the Investment Company Act of 1940, concluded that the compensation under the Agreement was fair and reasonable in light of the services and expenses and such other matters as the Directors considered to be relevant in the exercise of their reasonable judgment. Accordingly, the Board approved the renewal of the Agreement. In the course of their deliberations, the Directors did not identify any particular information that was all important or controlling.
Directors’ and Officers’ Information (unaudited)
The Statement of Additional Information provides additional information about the Fund’s directors and officers and can be obtained without charge by calling 1-800-466-3863, at www.manningnapieradvisors.com, or on the EDGAR Database on the SEC Internet web site (http:// www.sec.gov). The following chart shows certain information about the Fund’s officers and directors, including their principal occupations during the last five years. Unless specific dates are provided, the individuals have held the listed positions for longer than five years.
| | |
INTERESTED DIRECTOR/OFFICER | | |
Name: | | B. Reuben Auspitz* |
Address: | | 290 Woodcliff Drive |
| | Fairport, NY 14450 |
Age: | | 63 |
Current Position(s) Held with Fund: | | Principal Executive Officer, President, Chairman & Director |
Term of Office1 & Length of Time Served: | | Indefinite - Director since 1984; Vice President 1984 - 2003; President since 2004; Principal Executive Officer since 2002 |
Principal Occupation(s) During Past 5 Years: | | Executive Vice President; Executive Group Member**; Chief Compliance Officer since 2004; Vice Chairman since June 2010; Co-Executive Director from 2003-2010 - Manning & Napier Advisors, Inc. President; |
| | Director - Manning & Napier Investor Services, Inc. |
| | Holds or has held one or more of the following titles for various subsidiaries and affiliates: President, Vice President, Director, Chairman, Treasurer, Chief Compliance Officer or Member. |
Number of Portfolios Overseen within Fund Complex: | | 29 |
Other Directorships Held Outside Fund Complex: | | N/A |
INDEPENDENT DIRECTORS | | |
Name: | | Paul A. Brooke |
Address: | | 290 Woodcliff Drive |
| | Fairport, NY 14450 |
Age: | | 65 |
Current Position(s) Held with Fund: | | Director, Audit Committee Member, Governance & Nominating Committee Member |
Term of Office & Length of Time Served: | | Indefinite - Since 2007 |
Principal Occupation(s) During Past 5 Years: | | Chairman & CEO, Alsius Corp. (investments); Managing Member, PMSV Holdings LLC (investments) |
Number of Portfolios Overseen within Fund Complex: | | 29 |
Other Directorships Held Outside Fund Complex: | | Incyte Corp. (2000-present) |
| | ViroPharma, Inc. (2000-present) |
| | HLTH Corp. (2000-present) |
| | Cheyne Capital International (2000-present) |
| | MPM Bio-equities (2000-present) |
| | GMP Companies (2000-present) |
| | | HoustonPharma (2000-present) |
Name: | | Richard M. Hurwitz |
Address: | | 290 Woodcliff Drive |
| | Fairport, NY 14450 |
Age: | | 47 |
Current Position(s) Held with Fund: | | Director, Audit Committee Member, Governance & Nominating Committee Member |
Term of Office & Length of Time Served: | | Indefinite - Since 2009 |
Principal Occupation(s) During Past 5 Years: | | Chief Executive Officer, Pictometry International Corp. since August 2010 (provider of georeferenced, aerial image libraries and related software) Managing Partner (2006-July 2010) - Aegis Investment Partners, LLC (investments); Founder and Managing Partner (2004-2005) - Village Markets, LLC (groceries) |
Number of Portfolios Overseen within Fund Complex: | | 29 |
Other Directorships Held Outside Fund Complex: | | Pictometry International Corp. (2000-2010) |
| | Pioneering Technologies (2006-2009) |
| | | Vensearch Capital Corp. (2003-2007) |
Directors’ and Officers’ Information (unaudited)
| | |
| INDEPENDENT DIRECTORS (continued) | | |
| |
Name: | | Stephen B. Ashley |
Address: | | 290 Woodcliff Drive |
| | Fairport, NY 14450 |
Age: | | 70 |
Current Position(s) Held with Fund: | | Director, Audit Committee Member, Governance & Nominating Committee Member |
Term of Office & Length of Time Served: | | Indefinite - Since 1996 |
Principal Occupation(s) During Past 5 Years: | | Chairman, Director, President & Chief Executive Officer, The Ashley Group (property management and investment). Chairman (non-executive) 2004-2008; Director 1995-2008 - Fannie Mae (mortgage) |
Number of Portfolios Overseen within Fund Complex: | | 29 |
Other Directorships Held Outside Fund Complex: | | The Ashley Group (1995-2008) |
| | | Genesee Corporation (1987-2007) |
Name: | | Peter L. Faber |
Address: | | 290 Woodcliff Drive |
| | Fairport, NY 14450 |
Age: | | 72 |
Current Position(s) Held with Fund: | | Director, Governance & Nominating Committee Member |
Term of Office & Length of Time Served: | | Indefinite - Since 1987 |
Principal Occupation(s) During Past 5 Years: | | Senior Counsel since 2006, Partner (1995 - 2006) - McDermott, Will & Emery LLP (law firm) |
Number of Portfolios Overseen within Fund Complex: | | 29 |
Other Directorships Held Outside Fund Complex: | | Partnership for New York City, Inc. (non-profit) |
| | New York Collegium (non-profit) |
| | | Boston Early Music Festival (non-profit) |
Name: | | Harris H. Rusitzky |
Address: | | 290 Woodcliff Drive |
| | Fairport, NY 14450 |
Age: | | 76 |
Current Position(s) Held with Fund: | | Director, Audit Committee Member, Governance & Nominating Committee Member |
Term of Office & Length of Time Served: | | Indefinite - Since 1985 |
Principal Occupation(s) During Past 5 Years: | | President, The Greening Group (business consultants) since 1994; Partner, The Restaurant Group (restaurants) since 2006 |
Number of Portfolios Overseen within Fund Complex: | | 29 |
Other Directorships Held Outside Fund Complex: | | N/A |
OFFICERS | | |
| |
Name: | | Jeffrey S. Coons, Ph.D., CFA |
Address: | | 290 Woodcliff Drive |
| | Fairport, NY 14450 |
Age: | | 47 |
Current Position(s) Held with Fund: | | Vice President |
Term of Office1 & Length of Time Served: | | Since 2004 |
Principal Occupation(s) During Past 5 Years: | | President since 2010, Co-Director of Research since 2002, Executive Group Member** since 2003, - Manning & Napier Advisors, Inc. Holds one or more of the following titles for various subsidiaries and affiliates: President, Director, Treasurer or Senior Trust Officer. |
Number of Portfolios Overseen within Fund Complex: | | 29 |
Other Directorships Held Outside Fund Complex: | | N/A |
Directors’ and Officers’ Information (unaudited)
| | |
OFFICERS (continued) | | |
Name: | | Beth Galusha |
Address: | | 290 Woodcliff Drive |
| | Fairport, NY 14450 |
Age: | | 49 |
Current Position(s) Held with Fund: | | Assistant Chief Financial Officer |
Term of Office1 & Length of Time Served: | | Assistant Chief Financial Officer since 2010 |
Principal Occupation(s) During Past 5 Years: | | Chief Financial Officer and Treasurer, Manning & Napier Advisors, Inc. |
| | Holds one or more of the following titles for various affiliates: Chief Financial Officer, Director, or Treasurer |
Number of Portfolios Overseen within Fund Complex: | | 29 |
Other Directorships Held Outside Fund Complex: | | N/A |
Name: | | Christine Glavin |
Address: | | 290 Woodcliff Drive |
| | Fairport, NY 14450 |
Age: | | 44 |
Current Position(s) Held with Fund: | | Principal Financial Officer, Chief Financial Officer |
Term of Office1 & Length of Time Served: | | Principal Financial Officer since 2002; Chief Financial Officer since 2001 |
Principal Occupation(s) During Past 5 Years: | | Fund Reporting Manager, Manning & Napier Advisors, Inc. since 1997 |
Number of Portfolios Overseen within Fund Complex: | | 29 |
Other Directorships Held Outside Fund Complex: | | N/A |
Name: | | Jodi L. Hedberg |
Address: | | 290 Woodcliff Drive |
| | Fairport, NY 14450 |
Age: | | 43 |
Current Position(s) Held with Fund: | | Corporate Secretary, Chief Compliance Officer, Anti-Money Laundering Compliance Officer |
Term of Office1 & Length of Time Served: | | Corporate Secretary since 1997; Chief Compliance Officer since 2004 |
Principal Occupation(s) During Past 5 Years: | | Director of Compliance, Manning & Napier Advisors, Inc. and affiliates since 1990 (title change in 2005 from Compliance Manager to Director of Compliance); Corporate Secretary, Manning & Napier Investor Services, Inc. since 2006 |
Number of Portfolios Overseen within Fund Complex: | | 29 |
Other Directorships Held Outside Fund Complex: | | N/A |
Name: | | Richard Yates |
Address: | | 290 Woodcliff Drive |
| | Fairport, NY 14450 |
Age: | | 45 |
Current Position(s) Held with Fund: | | Chief Legal Officer |
Term of Office1 & Length of Time Served: | | Chief Legal Officer since 2004 |
Principal Occupation(s) During Past 5 Years: | | Counsel - Manning & Napier Advisors, Inc. & affiliates since 2000; Holds one or more of the following titles for various affiliates; Director or Corporate Secretary |
Number of Portfolios Overseen within Fund Complex: | | 29 |
Other Directorships Held Outside Fund Complex: | | N/A |
*Interested Director, within the meaning of the Investment Company Act of 1940 by reason of his position with the Fund’s investment advisor and distributor. Mr. Auspitz serves as the Executive Vice President and Director, Manning & Napier Advisors, Inc. and President and Director, Manning & Napier Investor Services, Inc., the Fund’s distributor.
**Prior to June 2010, the Executive Group, consisting of senior executive employee-owners, performed the duties of the Office of the Chief Executive of the Advisor. Effective June 2010, the Executive Group serves as an advisory board to the Chief Executive Officer.
1The term of office for President, Vice President, Chief Financial Officer, Assistant Chief Financial Officer, Chief Legal Officer and Corporate Secretary is one year and until their respective successors are chosen and qualified. All other officers’ terms are indefinite.
Literature Requests (unaudited)
Proxy Voting Policies and Procedures
A description of the policies and procedures that the Fund uses to determine how to vote proxies relating to portfolio securities is available, without charge, upon request:
| | | | |
By phone | | 1-800-466-3863 |
On the Securities and Exchange
Commission’s (SEC)web site | | http://www.sec.gov |
| |
Proxy Voting Record
Information regarding how the Fund voted proxies relating to portfolio securities during the most recent 12-month period ended June 30th is available, without charge, upon request:
| | | | |
By phone | | 1-800-466-3863 |
On the SEC’s web site | | http://www.sec.gov |
Quarterly Portfolio Holdings
The Series’ complete schedule of portfolio holdings for the 1st and 3rd quarters of each fiscal year are provided on Form N-Q, and are available, without charge, upon request:
| | | | |
By phone | | 1-800-466-3863 |
On the SEC’s web site | | http://www.sec.gov |
The Series’ Form N-Q may be reviewed and copied at the SEC’s Public Reference Room in Washington, D.C. Information on the operation of the Public Reference Room may be obtained by calling 1-800-SEC-0330.
Prospectus and Statement of Additional Information (SAI)
The prospectus and SAI provide additional information about each Series, including charges, expenses and risks. These documents are available, without charge, upon request:
| | | | |
By phone | | 1-800-466-3863 |
On the SEC’s web site | | http://www.sec.gov |
On the Advisor’s web site | | http://www.manning-napier.com |
Additional information available at www.manning-napier.com
1. Fund Holdings - Month-End
2. Fund Holdings - Quarter-End
3. Shareholder Report - Annual
4. Shareholder Report - Semi-Annual
MNLFS-12/10-AR

Management Discussion and Analysis (unaudited)
Dear Shareholders:
Over the course of 2010, the markets experienced several ups and downs driven by well-defined swings in investor sentiment. Optimism fueled strong market returns early in the year, as upbeat economic releases led investors to believe in the potential for a robust U.S. recovery. However, sentiment shifted drastically in May and June as more negative economic news and issues related to Europe’s government debt problems led to notable stock market losses. In another swing, the markets rebounded in the fall amid better economic developments and prospects that the Federal Reserve would enact another round of quantitative easing. That rally generally continued through the end of the year as the markets reacted positively to the U.S. tax compromise, which extended the Bush-era tax cuts for all income brackets.
With equities posting double-digit gains in the third and fourth quarters, the choppy year ended on a strong note, and broad equity indices have now produced back-to-back years of positive results. During 2010, the Russell 2000 Index earned 26.85%, outpacing indexes such as the Russell 1000 and S&P 500, which are composed of larger cap stocks. Similar to the Russell 2000 Index, the Small Cap Series had a return of 25.71%, slightly trailing the index for the year.
In the volatile market environment of 2010, Manning & Napier maintained a selective investment approach and focused on companies that we believe can grow market share. We continued to emphasize quality, targeting best-in-class companies expected to generate sales growth despite a muted economic backdrop, as well as “away game winners” expected to successfully compete in faster-growing markets overseas. Using our active stock selection strategies, our analysts also identified opportunities in certain cyclical industries that have experienced supply cutbacks. Specifically, we have looked for well-positioned companies that can take market share and benefit from tight supply and demand dynamics in certain industries. Overall, the Small Cap Series continues to have a bias toward larger, more stable small cap companies.
During 2010, the Series had a heavy weighting to Energy and Industrials versus the benchmark, which benefited the Series’ relative performance. Additionally, the Series had a relatively high allocation to the Consumer Discretionary and Staples sectors. Meanwhile, noticeably lower exposure to Financials than the benchmark helped relative performance over the past year, yet an underweight to Information Technology detracted from relative returns.
Stock selection decisions modestly aided relative results over the past twelve months. In particular, security selections in the Energy, Industrials, and Information Technology sectors contributed to positive relative performance. Several key Technology and Industrials holdings were either acquired or the subject of takeover speculation in the second half of the year, which helped drive outperformance. In contrast, specific investments in the Consumer Staples, Materials, and Utilities sectors hurt relative returns in 2010.
While economic developments turned more optimistic toward the end of 2010, the U.S. economy still faces significant headwinds, including a struggling housing market, a stagnant job market, a difficult consumer rebalancing act, and high government debt burdens. Given these long-term structural issues, the slow growth environment in the U.S. will likely remain a reality. As the markets fluctuated around this slow growth trend in 2010, Manning & Napier earned solid returns by staying focused on the fundamentals and maintaining our selective investment process. This investment approach has proved beneficial for the past 40 years, and we believe these qualities will remain important as the market environment unfolds in 2011.
As always, we appreciate your business.
Sincerely,
Manning & Napier Advisors, Inc.
Performance Update as of December 31, 2010 (unaudited)
| | | | | | | | | | |
| | | | | | Average Annual Total Returns
As of December 31, 2010 | | |
| | | One
Year | | | Five Year | | Ten Year | | Since
Inception1 |
Manning & Napier Fund, Inc. - Small Cap Series2 | | | 25.71 | % | | -0.30% | | 6.50% | | 7.67% |
S&P 500 Total Return Index3 | | | 15.07 | % | | 2.30% | | 1.42% | | 8.25% |
Russell 2000® Index3 | | | 26.85 | % | | 4.47% | | 6.33% | | 9.20% |
The following graph compares the value of a $10,000 investment in the Manning & Napier Fund, Inc. - Small Cap Series for the ten years ended December 31, 2010 to the S&P 500 Total Return Index and the Russell 2000® Index.

1Performance numbers for the Series and Indices are calculated from April 30, 1992, the Series’ current activation date.
2The Series’ performance does not reflect the deduction of taxes that a shareholder would pay on fund distributions or the redemption of shares. The Series’ performance is historical and may not be indicative of future results. The performance returns shown are inclusive of the net expense ratio of the Series. For the year ended December 31, 2010, this net expense ratio was 1.12%. The gross expense ratio, which does not account for any voluntary or contractual waivers currently in effect, was 1.12% for the year ended December 31, 2010.
3The S&P 500 Total Return Index is an unmanaged capitalization-weighted measure of 500 widely held common stocks listed on the New York Stock Exchange, American Stock Exchange and the Over-the-Counter market. The Index returns assume daily reinvestment of dividends. The Russell 2000® Index is an unmanaged index that consists of 2,000 U.S. small-capitalization stocks. The Index returns are based on a market capitalization-weighted average of relative price changes of the component stocks plus dividends whose reinvestments are compounded daily. Both Indices’ returns, unlike Series returns, do not reflect any fees or expenses.
Shareholder Expense Example (unaudited)
As a shareholder of the Series, you may incur two types of costs: (1) transaction costs and (2) ongoing costs, including management fees and other Series expenses. This example is intended to help you understand your ongoing costs (in dollars) of investing in the Series and to compare these costs with the ongoing costs of investing in other mutual funds.
The example is based on an investment of $1,000 invested at the beginning of the period and held for the entire period (July 1, 2010 to December 31, 2010).
Actual Expenses
The first line of the table below provides information about actual account values and actual expenses. You may use the information in this line, together with the amount you invested, to estimate the expenses that you paid over the period. Simply divide your account value by $1,000 (for example, an $8,600 account value divided by $1,000 = 8.6), then multiply the result by the number in the first line under the heading entitled “Expenses Paid During Period” to estimate the expenses you paid on your account during this period.
Hypothetical Example for Comparison Purposes
The second line of the table below provides information about hypothetical account values and hypothetical expenses based on the Series’ actual expense ratio and an assumed rate of return of 5% per year before expenses, which is not the Series’ actual return. The hypothetical account values and expenses may not be used to estimate the actual ending account balance or expenses you paid during the period. You may use this information to compare the ongoing costs of investing in the Series and other funds. To do so, compare this 5% hypothetical example with the 5% hypothetical examples that appear in the shareholder reports of the other funds.
Please note that the expenses shown in the table are meant to highlight your ongoing costs only and do not reflect any transaction costs. Therefore, the second line of the table is useful in comparing ongoing costs only, and will not help you determine the relative total costs of owning different funds. In addition, if these transaction costs were included, your costs would have been higher.
| | | | | | |
| | | Beginning
Account Value
7/1/10 | | Ending
Account Value
12/31/10 | | Expenses Paid
During Period*
7/1/10-12/31/10 |
Actual | | $1,000.00 | | $1,358.20 | | $6.60 |
Hypothetical
(5% return before expenses) | | $1,000.00 | | $1,019.61 | | $5.65 |
*Expenses are equal to the Series’ annualized expense ratio (for the six-month period) of 1.11%, multiplied by the average account value over the period, multiplied by 184/365 (to reflect the one-half year period). Expenses are based on the most recent fiscal half year; therefore, the expense ratio stated above may differ from the expense ratio stated in the financial highlights, which is based on one-year data. The Series’ total return would have been lower had certain expenses not been waived during the period.
Portfolio Composition as of December 31, 2010 (unaudited)
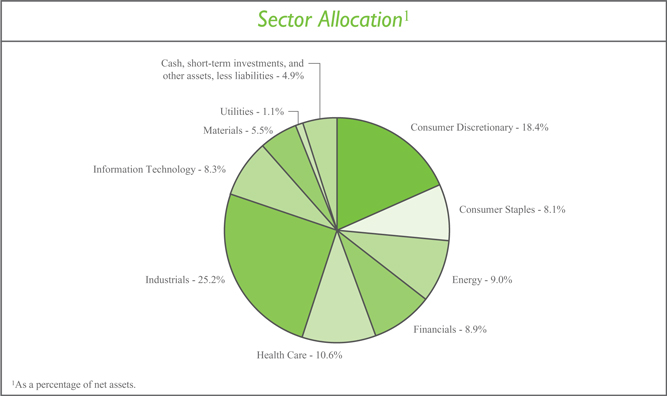
| | | | | | | | | | | | |
| Market Capitalization | | | | | TopTen Stock Holdings2 | |
Average | | | $2,143 Million | | | | | Tomra Systems ASA (Norway) | | | 3.1 | % |
Median | | | 1,595 Million | | | | | Zoll Medical Corp. | | | 2.9 | % |
Weighted Average | | | 1,963 Million | | | | | Imax Corp. (Canada) | | | 2.9 | % |
| | | | | | | | First Commonwealth Financial Corp. | | | 2.5 | % |
| | | | | | | | Paladin Energy Ltd. (Australia) | | | 2.5 | % |
| | | | | | | | RailAmerica, Inc. | | | 2.3 | % |
| | | | | | | | Alere, Inc. | | | 2.3 | % |
| | | | | | | | Infinera Corp. | | | 2.3 | % |
| | | | | | | | Calfrac Well Services Ltd. (Canada) | | | 2.2 | % |
| | | | | | | | Eagle Materials, Inc. | | | 2.2 | % |
| | | | | | | | 2As a percentage of total investments. | | | | |
Investment Portfolio - December 31, 2010
| | | | | | | | | | | | |
| | | Shares | | | Value (Note 2) | | | | |
| | | |
COMMON STOCKS - 95.1% | | | | | | | | | | | | |
| | | |
Consumer Discretionary - 18.4% | | | | | | | | | | | | |
Auto Components - 1.5% | | | | | | | | | | | | |
Cooper Tire & Rubber Co. | | | 131,190 | | | $ | 3,093,460 | | | | | |
| | | | | | | | | | | | |
Distributors - 1.9% | | | | | | | | | | | | |
Inchcape plc (United Kingdom)*1 | | | 714,271 | | | | 3,983,905 | | | | | |
| | | | | | | | | | | | |
Hotels, Restaurants & Leisure - 2.7% | | | | | | | | | | | | |
Choice Hotels International, Inc. | | | 52,060 | | | | 1,992,336 | | | | | |
Wendy’s - Arby’s Group, Inc. - Class A | | | 783,990 | | | | 3,622,034 | | | | | |
| | | | | | | | | | | | |
| | | | | | | 5,614,370 | | | | | |
| | | | | | | | | | | | |
| | | |
Household Durables - 2.9% | | | | | | | | | | | | |
Lennar Corp. - Class A | | | 89,340 | | | | 1,675,125 | | | | | |
Rodobens Negocios Imobiliarios S.A. (Brazil) | | | 253,670 | | | | 2,550,453 | | | | | |
Tupperware Brands Corp. | | | 36,310 | | | | 1,730,898 | | | | | |
| | | | | | | | | | | | |
| | | | | | | 5,956,476 | | | | | |
| | | | | | | | | | | | |
| | | |
Media - 2.8% | | | | | | | | | | | | |
Imax Corp. (Canada)* | | | 211,620 | | | | 5,935,941 | | | | | |
| | | | | | | | | | | | |
| | | |
Specialty Retail - 5.7% | | | | | | | | | | | | |
Chico’s FAS, Inc. | | | 183,690 | | | | 2,209,791 | | | | | |
Dick’s Sporting Goods, Inc.* | | | 96,700 | | | | 3,626,250 | | | | | |
The Finish Line, Inc. - Class A | | | 137,030 | | | | 2,355,546 | | | | | |
Lumber Liquidators Holdings, Inc.* | | | 132,110 | | | | 3,290,860 | | | | | |
Select Comfort Corp.* | | | 39,202 | | | | 357,914 | | | | | |
| | | | | | | | | | | | |
| | | | | | | 11,840,361 | | | | | |
| | | | | | | | | | | | |
| | | |
Textiles, Apparel & Luxury Goods - 0.9% | | | | | | | | | | | | |
Skechers U.S.A., Inc. - Class A* | | | 94,810 | | | | 1,896,200 | | | | | |
| | | | | | | | | | | | |
Total Consumer Discretionary | | | | | | | 38,320,713 | | | | | |
| | | | | | | | | | | | |
Consumer Staples - 8.1% | | | | | | | | | | | | |
Food & Staples Retailing - 3.0% | | | | | | | | | | | | |
BJ’s Wholesale Club, Inc.* | | | 40,940 | | | | 1,961,026 | | | | | |
SUPERVALU, Inc. | | | 449,320 | | | | 4,326,952 | | | | | |
| | | | | | | | | | | | |
| | | | | | | 6,287,978 | | | | | |
| | | | | | | | | | | | |
| | | |
Food Products - 5.1% | | | | | | | | | | | | |
Diamond Foods, Inc. | | | 45,430 | | | | 2,415,967 | | | | | |
Flowers Foods, Inc. | | | 146,030 | | | | 3,929,667 | | | | | |
Sanderson Farms, Inc. | | | 77,480 | | | | 3,033,342 | | | | | |
Tootsie Roll Industries, Inc. | | | 42,966 | | | | 1,244,725 | | | | | |
| | | | | | | | | | | | |
| | | | | | | 10,623,701 | | | | | |
| | | | | | | | | | | | |
Total Consumer Staples | | | | | | | 16,911,679 | | | | | |
| | | | | | | | | | | | |
| | |
| The accompanying notes are an integral part of the financial statements. | | 5 |
Investment Portfolio - December 31, 2010
| | | | | | | | | | | | |
| | | Shares | | | Value (Note 2) | | | | |
| | | |
COMMON STOCKS (continued) | | | | | | | | | | | | |
| | | |
Energy - 9.0% | | | | | | | | | | | | |
Energy Equipment & Services - 6.6% | | | | | | | | | | | | |
Calfrac Well Services Ltd. (Canada) | | | 132,210 | | | $ | 4,552,821 | | | | | |
Dril-Quip, Inc.* | | | 26,770 | | | | 2,080,564 | | | | | |
ION Geophysical Corp.* | | | 249,310 | | | | 2,114,149 | | | | | |
Petroleum Geo-Services ASA (Norway)*1 | | | 144,580 | | | | 2,272,693 | | | | | |
Trican Well Service Ltd. (Canada) | | | 131,340 | | | | 2,660,352 | | | | | |
| | | | | | | | | | | | |
| | | | | | | 13,680,579 | | | | | |
| | | | | | | | | | | | |
| | | |
Oil, Gas & Consumable Fuels - 2.4% | | | | | | | | | | | | |
Paladin Energy Ltd. (Australia)* | | | 1,011,270 | | | | 5,095,507 | | | | | |
| | | | | | | | | | | | |
Total Energy | | | | | | | 18,776,086 | | | | | |
| | | | | | | | | | | | |
Financials - 8.9% | | | | | | | | | | | | |
Commercial Banks - 3.6% | | | | | | | | | | | | |
First Commonwealth Financial Corp. | | | 733,470 | | | | 5,192,968 | | | | | |
First Financial Bancorp | | | 120,890 | | | | 2,234,047 | | | | | |
| | | | | | | | | | | | |
| | | | | | | 7,427,015 | | | | | |
| | | | | | | | | | | | |
| | | |
Real Estate Investment Trusts (REITS) - 4.1% | | | | | | | | | | | | |
American Campus Communities, Inc. | | | 63,600 | | | | 2,019,936 | | | | | |
Corporate Office Properties Trust | | | 85,740 | | | | 2,996,613 | | | | | |
DuPont Fabros Technology, Inc. | | | 65,620 | | | | 1,395,737 | | | | | |
Home Properties, Inc. | | | 37,670 | | | | 2,090,308 | | | | | |
| | | | | | | | | | | | |
| | | | | | | 8,502,594 | | | | | |
| | | | | | | | | | | | |
| | | |
Thrifts & Mortgage Finance - 1.2% | | | | | | | | | | | | |
First Niagara Financial Group, Inc. | | | 183,630 | | | | 2,567,147 | | | | | |
| | | | | | | | | | | | |
Total Financials | | | | | | | 18,496,756 | | | | | |
| | | | | | | | | | | | |
Health Care - 10.6% | | | | | | | | | | | | |
Health Care Equipment & Supplies - 5.2% | | | | | | | | | | | | |
Alere, Inc.* | | | 130,026 | | | | 4,758,952 | | | | | |
Zoll Medical Corp.* | | | 162,290 | | | | 6,042,057 | | | | | |
| | | | | | | | | | | | |
| | | | | | | 10,801,009 | | | | | |
| | | | | | | | | | | | |
| | | |
Health Care Providers & Services - 3.0% | | | | | | | | | | | | |
Cross Country Healthcare, Inc.* | | | 306,770 | | | | 2,598,342 | | | | | |
Diagnosticos da America S.A. (Brazil) | | | 277,760 | | | | 3,764,819 | | | | | |
| | | | | | | | | | | | |
| | | | | | | 6,363,161 | | | | | |
| | | | | | | | | | | | |
Life Sciences Tools & Services - 2.4% | | | | | | | | | | | | |
Sequenom, Inc.* | | | 543,940 | | | | 4,362,399 | | | | | |
WuXi PharmaTech (Cayman), Inc. - ADR (Cayman Islands)* | | | 37,940 | | | | 612,352 | | | | | |
| | | | | | | | | | | | |
| | | | | | | 4,974,751 | | | | | |
| | | | | | | | | | | | |
Total Health Care | | | | | | | 22,138,921 | | | | | |
| | | | | | | | | | | | |
| | |
| 6 | | The accompanying notes are an integral part of the financial statements. |
Investment Portfolio - December 31, 2010
| | | | | | | | | | |
| | | Shares | | | Value (Note 2) | | | |
COMMON STOCKS (continued) | | | | | | | | | | |
| | | |
Industrials - 25.2% | | | | | | | | | | |
Air Freight & Logistics - 1.5% | | | | | | | | | | |
Atlas Air Worldwide Holdings, Inc.* | | | 54,360 | | | $ | 3,034,919 | | | |
| | | | | | | | | | |
Airlines - 3.3% | | | | | | | | | | |
Copa Holdings S.A. - Class A (Panama) | | | 49,220 | | | | 2,896,105 | | | |
US Airways Group, Inc.* | | | 403,220 | | | | 4,036,232 | | | |
| | | | | | | | | | |
| | | | | | | 6,932,337 | | | |
| | | | | | | | | | |
Commercial Services & Supplies - 3.1% | | | | | | | | | | |
Tomra Systems ASA (Norway)1 | | | 962,570 | | | | 6,408,360 | | | |
| | | | | | | | | | |
Construction & Engineering - 1.3% | | | | | | | | | | |
MYR Group, Inc.* | | | 132,670 | | | | 2,786,070 | | | |
| | | | | | | | | | |
Machinery - 9.2% | | | | | | | | | | |
ArvinMeritor, Inc.* | | | 106,240 | | | | 2,180,045 | | | |
Astec Industries, Inc.* | | | 77,910 | | | | 2,525,063 | | | |
Lindsay Corp. | | | 41,890 | | | | 2,489,523 | | | |
Titan International, Inc. | | | 197,330 | | | | 3,855,828 | | | |
Wabash National Corp.* | | | 352,300 | | | | 4,174,755 | | | |
Wabtec Corp. | | | 38,840 | | | | 2,054,248 | | | |
Westport Innovations, Inc. (Canada)* | | | 101,140 | | | | 1,873,113 | | | |
| | | | | | | | | | |
| | | | | | | 19,152,575 | | | |
| | | | | | | | | | |
Marine - 1.0% | | | | | | | | | | |
D/S Norden (Denmark)1 | | | 58,760 | | | | 2,135,915 | | | |
| | | | | | | | | | |
Road & Rail - 5.8% | | | | | | | | | | |
Heartland Express, Inc. | | | 257,840 | | | | 4,130,597 | | | |
Knight Transportation, Inc. | | | 163,490 | | | | 3,106,310 | | | |
RailAmerica, Inc.* | | | 373,540 | | | | 4,837,343 | | | |
| | | | | | | | | | |
| | | | | | | 12,074,250 | | | |
| | | | | | | | | | |
Total Industrials | | | | | | | 52,524,426 | | | |
| | | | | | | | | | |
Information Technology - 8.3% | | | | | | | | | | |
Communications Equipment - 3.7% | | | | | | | | | | |
Infinera Corp.* | | | 454,180 | | | | 4,691,679 | | | |
Riverbed Technology, Inc.* | | | 82,700 | | | | 2,908,559 | | | |
| | | | | | | | | | |
| | | | | | | 7,600,238 | | | |
| | | | | | | | | | |
Computers & Peripherals - 0.5% | | | | | | | | | | |
Compellent Technologies, Inc.* | | | 38,570 | | | | 1,064,146 | | | |
| | | | | | | | | | |
Internet Software & Services - 1.1% | | | | | | | | | | |
VistaPrint N.V. (Netherlands)* | | | 49,000 | | | | 2,254,000 | | | |
| | | | | | | | | | |
Software - 3.0% | | | | | | | | | | |
Fortinet, Inc.* | | | 75,730 | | | | 2,449,865 | | | |
| | |
| The accompanying notes are an integral part of the financial statements. | | 7 |
Investment Portfolio - December 31, 2010
| | | | | | | | | | |
| | | Shares | | | Value (Note 2) | | | |
COMMON STOCKS (continued) | | | | | | | | | | |
Information Technology (continued) | | | | | | | | | | |
Software (continued) | | | | | | | | | | |
SolarWinds, Inc.* | | | 201,600 | | | $ | 3,880,800 | | | |
| | | | | | | | | | |
| | | | | | | 6,330,665 | | | |
| | | | | | | | | | |
Total Information Technology | | | | | | | 17,249,049 | | | |
| | | | | | | | | | |
Materials - 5.5% | | | | | | | | | | |
Chemicals - 3.3% | | | | | | | | | | |
Calgon Carbon Corp.* | | | 244,600 | | | | 3,698,352 | | | |
Flotek Industries, Inc.* | | | 253,510 | | | | 1,381,629 | | | |
The Scotts Miracle-Gro Co. - Class A | | | 35,400 | | | | 1,797,258 | | | |
| | | | | | | | | | |
| | | | | | | 6,877,239 | | | |
| | | | | | | | | | |
Construction Materials - 2.2% | | | | | | | | | | |
Eagle Materials, Inc. | | | 160,990 | | | | 4,547,968 | | | |
| | | | | | | | | | |
Total Materials | | | | | | | 11,425,207 | | | |
| | | | | | | | | | |
Utilities - 1.1% | | | | | | | | | | |
Independent Power Producers & Energy Traders - 1.1% | | | | | | | | | | |
GenOn Energy, Inc.* | | | 607,963 | | | | 2,316,339 | | | |
| | | | | | | | | | |
TOTAL COMMON STOCKS
(Identified Cost $156,046,584) | | | | | | | 198,159,176 | | | |
| | | | | | | | | | |
SHORT-TERM INVESTMENTS - 3.9% | | | | | | | | | | |
Dreyfus Cash Management, Inc. - Institutional Shares2, 0.14% (Identified Cost $8,181,636) | | | 8,181,636 | | | | 8,181,636 | | | |
| | | | | | | | | | |
TOTAL INVESTMENTS - 99.0% | | | | | | | | | | |
(Identified Cost $164,228,220) | | | | | | | 206,340,812 | | | |
OTHER ASSETS, LESS LIABILITIES - 1.0% | | | | | | | 2,056,296 | | | |
| | | | | | | | | | |
NET ASSETS - 100% | | | | | | $ | 208,397,108 | | | |
| | | | | | | | | | |
ADR - American Depository Receipt
*Non-income producing security
1International Fair Value factor from pricing service was applied.
2Rate shown is the current yield as of December 31, 2010.
| | |
| 8 | | The accompanying notes are an integral part of the financial statements. |
Statement of Assets and Liabilities
December 31, 2010
| | | | |
ASSETS: | | | | |
| |
Investments, at value (identified cost $164,228,220) (Note 2) | | $ | 206,340,812 | |
Cash | | | 80,722 | |
Receivable for securities sold | | | 8,975,034 | |
Dividends receivable | | | 137,758 | |
Receivable for fund shares sold | | | 125,007 | |
| | | | |
| |
TOTAL ASSETS | | | 215,659,333 | |
| | | | |
| |
LIABILITIES: | | | | |
| |
Accrued management fees (Note 3) | | | 173,847 | |
Accrued fund accounting and administration fees (Note 3) | | | 7,087 | |
Accrued transfer agent fees (Note 3) | | | 2,616 | |
Accrued Chief Compliance Officer service fees (Note 3) | | | 245 | |
Payable for securities purchased | | | 6,668,895 | |
Payable for fund shares repurchased | | | 348,981 | |
Other payables and accrued expenses | | | 60,554 | |
| | | | |
| |
TOTAL LIABILITIES | | | 7,262,225 | |
| | | | |
| |
TOTAL NET ASSETS | | $ | 208,397,108 | |
| | | | |
| |
NET ASSETS CONSIST OF: | | | | |
| |
Capital stock | | $ | 224,225 | |
Additional paid-in-capital | | | 231,014,775 | |
Accumulated net realized loss on investments, foreign currency and translation of other assets and liabilities | | | (64,954,922 | ) |
Net unrealized appreciation on investments, foreign currency and translation of other assets and liabilities | | | 42,113,030 | |
| | | | |
| |
TOTAL NET ASSETS | | $ | 208,397,108 | |
| | | | |
| |
NET ASSET VALUE, OFFERING PRICE AND REDEMPTION PRICE PER SHARE - CLASS A ($208,397,108/22,422,525 shares) | | $ | 9.29 | |
| | | | |
| | |
| The accompanying notes are an integral part of the financial statements. | | 9 |
Statement of Operations
For the Year Ended December 31, 2010
| | | | |
INVESTMENT INCOME: | | | | |
| |
Dividends (net of foreign taxes withheld, $22,940) | | $ | 1,740,239 | |
Interest | | | 55 | |
| | | | |
| |
Total Investment Income | | | 1,740,294 | |
| | | | |
| |
EXPENSES: | | | | |
| |
Management fees (Note 3) | | | 1,768,512 | |
Fund accounting and administration fees (Note 3) | | | 50,321 | |
Transfer agent fees (Note 3) | | | 16,169 | |
Directors’ fees (Note 3) | | | 9,389 | |
Chief Compliance Officer service fees (Note 3) | | | 2,631 | |
Custodian fees | | | 20,527 | |
Miscellaneous | | | 107,635 | |
| | | | |
| |
Total Expenses | | | 1,975,184 | |
Less reduction of expenses (Note 3) | | | (758 | ) |
| | | | |
| |
Net Expenses | | | 1,974,426 | |
| | | | |
| |
NET INVESTMENT LOSS | | | (234,132 | ) |
| | | | |
| |
REALIZED AND UNREALIZED GAIN (LOSS) ON INVESTMENTS AND FOREIGN CURRENCY: | | | | |
| |
Net realized gain (loss) on-
Investments | | | 28,499,262 | |
Foreign currency and translation of other assets and liabilities | | | (4,579 | ) |
| | | | |
| |
| | | 28,494,683 | |
| | | | |
| |
Net change in unrealized appreciation on-
Investments | | | 14,571,251 | |
Foreign currency and translation of other assets and liabilities | | | 229 | |
| | | | |
| |
| | | 14,571,480 | |
| | | | |
| |
NET REALIZED AND UNREALIZED GAIN ON INVESTMENTS AND FOREIGN CURRENCY | | | 43,066,163 | |
| | | | |
| |
NET INCREASE IN NET ASSETS RESULTING FROM OPERATIONS | | | $ 42,832,031 | |
| | | | |
| | |
| 10 | | The accompanying notes are an integral part of the financial statements. |
Statements of Changes in Net Assets
| | | | | | | | |
| | | For the Year Ended
12/31/10 | | | For the Year Ended
12/31/09 | |
| INCREASE IN NET ASSETS: | | | | | | |
| | |
| OPERATIONS: | | | | | | |
| | |
Net investment loss | | $ | (234,132 | ) | | $ | (481,098 | ) |
Net realized gain (loss) on investments and foreign currency | | | 28,494,683 | | | | (22,236,560 | ) |
Net change in unrealized appreciation on investments and foreign currency | | | 14,571,480 | | | | 78,307,749 | |
| | | | | | | | |
| | |
Net increase from operations | | | 42,832,031 | | | | 55,590,091 | |
| | | | | | | | |
| | |
CAPITAL STOCK ISSUED AND REPURCHASED: | | | | | | | | |
| | |
Net decrease from capital share transactions (Note 5) | | | (6,344,912 | ) | | | (3,842,395 | ) |
| | | | �� | | | | |
| | |
Net increase in net assets | | | 36,487,119 | | | | 51,747,696 | |
| | |
NET ASSETS: | | | | | | | | |
| | |
Beginning of year | | | 171,909,989 | | | | 120,162,293 | |
| | | | | | | | |
| | |
End of year (including undistributed net investment income of $0 and $0, respectively) | | $ | 208,397,108 | | | $ | 171,909,989 | |
| | | | | | | | |
| | |
| The accompanying notes are an integral part of the financial statements. | | 11 |
Financial Highlights
| | | | | | | | | | | | | | | | | | | | |
| | | For the Years Ended | |
| | | 12/31/10 | | | 12/31/09 | | | 12/31/08 | | | 12/31/07 | | | 12/31/06 | |
Per share data (for a share outstanding throughout each year): | | | | | | | | | | | | | | | | | | | | |
Net asset value - Beginning of year | | | $7.39 | | | | $4.98 | | | | $10.21 | | | | $13.08 | | | | $13.66 | |
| | | | | | | | | | | | | | | | | | | | |
|
Income (loss) from investment operations: | |
Net investment loss | | | (0.01 | )1 | | | (0.02 | )1 | | | (0.02 | ) | | | (0.01 | ) | | | (0.05 | ) |
Net realized and unrealized gain (loss) on investments | | | 1.91 | | | | 2.43 | | | | (5.12 | ) | | | (1.25 | ) | | | 2.55 | |
| | | | | | | | | | | | | | | | | | | | |
Total from investment operations | | | 1.90 | | | | 2.41 | | | | (5.14 | ) | | | (1.26 | ) | | | 2.50 | |
| | | | | | | | | | | | | | | | | | | | |
Less distributions to shareholders: | | | | | | | | | | | | | | | | | | | | |
From net realized gain on investments | | | — | | | | — | | | | (0.09 | ) | | | (1.61 | ) | | | (3.08 | ) |
| | | | | | | | | | | | | | | | | | | | |
Net asset value - End of year | | | $9.29 | | | $ | 7.39 | | | $ | 4.98 | | | $ | 10.21 | | | $ | 13.08 | |
| | | | | | | | | | | | | | | | | | | | |
Net assets - End of year
(000’s omitted) | | | $208,397 | | | $ | 171,910 | | | $ | 120,162 | | | $ | 184,998 | | | $ | 175,491 | |
| | | | | | | | | | | | | | | | | | | | |
Total return2 | | | 25.71% | | | | 48.39% | | | | (50.68% | ) | | | (9.32% | ) | | | 18.06% | |
Ratios (to average net assets)/ Supplemental Data: | | | | | | | | | | | | | | | | | | | | |
Expenses* | | | 1.12% | | | | 1.15% | | | | 1.15% | | | | 1.14% | | | | 1.16% | |
Net investment loss | | | (0.13% | ) | | | (0.34% | ) | | | (0.39% | ) | | | (0.08% | ) | | | (0.40% | ) |
Portfolio turnover | | | 75% | | | | 76% | | | | 68% | | | | 64% | | | | 85% | |
|
*The investment advisor did not impose all or a portion of its management fees, CCO fees, fund accounting and transfer agent fees, and other fees in some years and in some years paid a portion of the Series’ expenses. If these expenses had been incurred by the Series, the expense ratio (to average net assets) would have been increased by the following amounts: | |
| | | 0.00 | %3 | | | 0.00 | %3 | | | N/A | | | | N/A | | | | N/A | |
1Calculated based on average shares outstanding during the year.
2Represents aggregate total return for the years indicated, and assumes reinvestment of all distributions. Total returns would have been lower had certain expenses not been waived or reimbursed during certain years.
3Less than 0.01%.
| | |
| 12 | | The accompanying notes are an integral part of the financial statements. |
Notes to Financial Statements
Small Cap Series (the “Series”) is a no-load diversified series of Manning & Napier Fund, Inc. (the “Fund”). The Fund is organized in Maryland and is registered under the Investment Company Act of 1940, as amended, as an open-end management investment company.
The Series’ investment objective is to provide long-term growth by investing principally in the common stocks of companies with small market capitalizations.
The Series is authorized to issue five classes of shares (Class A, B, D, E and Z). Currently, only Class A shares have been issued. Each class of shares is substantially the same, except that class-specific distribution and shareholder servicing expenses are borne by the specific class of shares to which they relate.
The Fund’s Advisor is Manning & Napier Advisors, Inc. (the “Advisor”). Shares of the Series are offered to investors, clients and employees of the Advisor and its affiliates. The total authorized capital stock of the Fund consists of 10.0 billion shares of common stock each having a par value of $0.01. As of December 31, 2010, 6.2 billion shares have been designated in total among 29 series, of which 87.5 million have been designated as Small Cap Series Class A common stock.
| 2. | SIGNIFICANT ACCOUNTING POLICIES |
Security Valuation
Portfolio securities, including domestic equities, foreign equities, warrants and options, listed on an exchange other than the NASDAQ National Market System are valued at the latest quoted sales price of the exchange on which the security is primarily traded. Securities not traded on valuation date or securities not listed on an exchange are valued at the latest quoted bid price provided by the Fund’s pricing service. Securities listed on the NASDAQ National Market System are valued in accordance with the NASDAQ Official Closing Price.
Short-term investments that mature in sixty days or less are valued at amortized cost, which approximates market value. Investments in open-end investment companies are valued at their net asset value per share on valuation date.
Volume and level of activity in established markets for an asset or liability are evaluated to determine whether recent transactions and quoted prices are determinative of fair value. Where there have been significant decreases in volume and level of activity, further analysis and adjustment may be necessary to estimate fair value. The Series measures fair value in these instances by the use of inputs and valuation techniques which may be based upon current market prices of securities that are comparable in coupon, rating, maturity and industry and/or expectation of future cash flows. As a result of trading in relatively thin markets and/or markets that experience significant volatility, the prices used by the Series to value these securities may differ from the value that would be realized if these securities were sold, and the differences could be material.
Securities for which representative valuations or prices are not available from the Fund’s pricing service may be valued at fair value. Due to the inherent uncertainty of valuations of such securities, the fair value may differ significantly from the values that would have been used had a ready market for such securities existed. If trading or events occurring after the close of the principal market in which securities are traded are expected to materially affect the value of those securities, then they may be valued at their fair value, taking this trading or these events into account. Fair value is determined in good faith by the Advisor under procedures approved by and under the general supervision and responsibility of the Fund’s Board of Directors (the “Board”). In accordance with the procedures approved by the Board, the Series applies fair value pricing on a daily basis except for North American, Central American, South American and Caribbean equity securities. Fair valuing of securities is determined with the assistance of a pricing service using calculations or factors based on indices of domestic securities and other appropriate indicators, such as prices of relevant American Depository Receipts and futures contracts, to adjust local market prices for subsequent
Notes to Financial Statements
| 2. | SIGNIFICANT ACCOUNTING POLICIES (continued) |
Security Valuation (continued)
movements through the time the Series calculates its net asset value. The value of securities used for the net asset value calculation under the procedures may differ from published prices for the same securities. It is the Fund’s policy to classify each foreign equity security, except for those in the regions noted above, as Level 2 securities due to the fact the pricing service evaluated what factor was applied to the calculated end of day market price.
Various inputs are used in determining the value of the Series’ assets or liabilities carried at market value. These inputs are summarized in three broad levels. Level 1 includes quoted prices in active markets for identical assets and liabilities. Level 2 includes other significant observable inputs (including quoted prices for similar securities, interest rates, prepayment speeds, credit risk, etc.). Level 3 includes significant unobservable inputs (including the Series’ own assumptions in determining the fair value of investments). The inputs or methodology used for valuing securities are not necessarily an indication of the risk associated with investing in those securities.
The following is a summary of the valuation levels used for major security types as of December 31, 2010 in valuing the Series’ assets or liabilities carried at market value:
| | | 000000000000000 | | | | 000000000000000 | | | | 000000000000000 | | | | 000000000000000 | |
| Description | | Total | | | Level 1 | | | Level 2 | | | Level 3 | |
Assets: | | | | | | | | | | | | | | | | |
Equity securities* | | $ | 198,159,176 | | | $ | 183,358,303 | | | $ | 14,800,873 | | | $ | — | |
Preferred securities | | | — | | | | — | | | | — | | | | — | |
Debt securities | | | — | | | | — | | | | — | | | | — | |
Mutual funds | | | 8,181,636 | | | | 8,181,636 | | | | — | | | | — | |
Other financial instruments**: | | | — | | | | — | | | | — | | | | — | |
| | | | | | | | | | | | | | | | |
Total assets: | | | 206,340,812 | | | | 191,539,939 | | | | 14,800,873 | | | | — | |
| | | | | | | | | | | | | | | | |
Liabilities: | | | | | | | | | | | | | | | | |
Other financial instruments**: | | | — | | | | — | | | | — | | | | — | |
| | | | | | | | | | | | | | | | |
Total liabilities: | | | — | | | | — | | | | — | | | | — | |
| | | | | | | | | | | | | | | | |
Total | | $ | 206,340,812 | | | $ | 191,539,939 | | | $ | 14,800,873 | | | $ | — | |
| | | | | | | | | | | | | | | | |
*Includes common stock, warrants and rights. Please see the Investment Portfolio for industry classification and for securities where an International Fair Value factor from the pricing service was applied to value the security. Such securities are included in Level 2 in the table above.
**Other financial instruments are derivative instruments not reflected in the Investment Portfolio, such as futures, forwards and swap contracts, which are valued at the unrealized appreciation/depreciation on the instrument. As of December 31, 2010, the Series did not hold any derivative instruments.
There were no Level 3 securities held by the Series as of December 31, 2009 or December 31, 2010.
The Fund’s policy is to recognize transfers in and transfers out of the valuation levels as of the beginning of the reporting period. During the year ended December 31, 2010, the Fund had one foreign equity security transfer from Level 1 to Level 2 due to the implementation of new international fair value pricing procedures. The following is a summary of the foreign equity securities that transferred from Level 1 to Level 2:
Notes to Financial Statements
| 2. | SIGNIFICANT ACCOUNTING POLICIES (continued) |
Security Valuation (continued)
| | | | | | | | | | | | |
Total # Securities Level 1 at beginning and Level 2 at end of period | | Total Market
Value
Beginning of
period | | | Total Market
Value End of period | | | Change in
Market Value | |
1 | | $ | 4,605,200 | | | $ | 6,408,360 | | | $ | 1,803,160 | |
Additional disclosure surrounding the activity in Level 3 fair value measurement will be effective for fiscal years beginning after December 15, 2010. Management has concluded that this will not have a material impact on the Series’ financial statements.
Security Transactions, Investment Income and Expenses
Security transactions are accounted for on trade date. Dividend income is recorded on the ex-dividend date, except that if the ex-dividend date has passed, certain dividends from foreign securities are recorded as soon as the Fund is informed of the ex-dividend date. Non-cash dividends, if any, are recorded at the fair market value of the securities received. Interest income, including amortization of premium and accretion of discounts using the effective interest method, is earned from settlement date and accrued daily.
Expenses are recorded on an accrual basis. Most expenses of the Fund can be attributed to a specific series. Expenses which cannot be directly attributed are apportioned among the series in the Fund in such a manner as deemed equitable by the Fund’s Board, taking into consideration, among other things, the nature and type of expense.
The Series uses the identified cost method for determining realized gain or loss on investments for both financial statement and federal income tax reporting purposes.
Foreign Currency Translation
The books and records of the Series are maintained in U.S. dollars. Foreign currencies, investments and other assets and liabilities are translated into U.S. dollars at the current exchange rates. Purchases and sales of investment securities and income and expenses are translated on the respective dates of such transactions. The Series does not isolate realized and unrealized gains and losses attributable to changes in the exchange rates from gains and losses that arise from changes in the market value of investments. Such fluctuations are included with net realized and unrealized gain or loss on investments. Net realized foreign currency gains and losses represent foreign currency gains and losses between trade date and settlement date on securities transactions, gains and losses on disposition of foreign currencies and the difference between the amount of income and foreign withholding taxes recorded on the books of the Series and the amounts actually received or paid.
Federal Taxes
The Series’ policy is to comply with the provisions of the Internal Revenue Code applicable to regulated investment companies. The Series is not subject to federal income tax or excise tax to the extent that the Series distributes to shareholders each year its taxable income, including any net realized gains on investments, in accordance with requirements of the Internal Revenue Code. Accordingly, no provision for federal income tax or excise tax has been made in the financial statements.
Management evaluates its tax positions to determine if the tax positions taken meet the minimum recognition threshold in connection with accounting for uncertainties in income tax positions taken or expected to be taken for the purposes of measuring and recognizing tax liabilities in the financial statements. Recognition of tax benefits of an uncertain tax position is required only when the position is “more likely than not” to be sustained assuming examination by
Notes to Financial Statements
| 2. | SIGNIFICANT ACCOUNTING POLICIES (continued) |
Federal Taxes (continued)
taxing authorities. At December 31, 2010, the Series has recorded no liability for net unrecognized tax benefits relating to uncertain income tax positions taken or expected to be taken in future tax returns.
The Series files income tax returns in the U.S. federal jurisdiction, various states and foreign jurisdictions, as required. No income tax returns are currently under investigation. The statute of limitations on the Series’ tax returns remains open for the years ended December 31, 2007 through December 31, 2010. The Fund is not aware of any tax positions for which it is reasonably possible that the total amounts of unrecognized tax benefits will significantly change in the next twelve months.
Additionally, based on the Fund’s understanding of the tax rules and rates related to income, gains and transactions for foreign jurisdictions in which it invests, the Series will provide for foreign taxes, and where appropriate, deferred foreign tax.
Distributions of Income and Gains
Distributions to shareholders of net investment income and net realized gains are made annually. An additional distribution may be necessary to avoid taxation of the Series. Distributions are recorded on the ex-dividend date.
Indemnifications
The Fund’s organizational documents provide former and current directors and officers with a limited indemnification against liabilities arising in connection with the performance of their duties to the Fund. In the normal course of business, the Fund may also enter into contracts that provide general indemnifications. The Fund’s maximum exposure under these arrangements is unknown as this would be dependent on future claims that may be made against the Fund. The risk of material loss from such claims is considered remote.
Other
The preparation of financial statements in conformity with accounting principles generally accepted in the United States of America requires management to make estimates and assumptions that affect the reported amounts of assets and liabilities and the disclosure of contingent assets and liabilities at the date of the financial statements and the reported amounts of income and expenses during the reporting period. Actual results could differ from those estimates.
| 3. | TRANSACTIONS WITH AFFILIATES |
The Fund has an Investment Advisory Agreement (the “Agreement”) with the Advisor, for which the Series pays a fee, computed daily and payable monthly, at an annual rate of 1.00% of the Series’ average daily net assets.
Under the Agreement, personnel of the Advisor provide the Series with advice and assistance in the choice of investments and the execution of securities transactions, and otherwise maintain the Series’ organization. The Advisor also provides the Fund with necessary office space and fund administration and support services. The salaries of all officers of the Fund (except a percentage of the Fund’s Chief Compliance Officer’s salary, which is paid by the Fund), and of all Directors who are “affiliated persons” of the Fund, or of the Advisor, and all personnel of the Fund, or of the Advisor, performing services relating to research, statistical and investment activities, are paid by the Advisor. Each “non-affiliated” Director receives an annual stipend, which is allocated among all the active series of the Fund. In addition, these Directors also receive a fee per Board meeting attended plus a fee for each committee meeting attended.
Manning & Napier Investor Services, Inc., a registered broker-dealer affiliate of the Advisor, acts as distributor for the Fund’s shares. The services of Manning & Napier Investor Services, Inc. are provided at no additional cost to the Series.
Notes to Financial Statements
| 3. | TRANSACTIONS WITH AFFILIATES (continued) |
For the year ended December 31, 2010, the Advisor voluntarily waived fees of $758, which is included as a reduction of expenses on the Statement of Operations. The Advisor is not eligible to recoup any expenses that have been waived or reimbursed in prior years.
The Advisor has agreements with PNC Global Investment Servicing (U.S.) Inc. (“PNCGIS”) under which PNCGIS serves as sub-accountant services agent and sub-transfer agent. The Fund pays the Advisor an annual fee related to fund accounting and administration of 0.0175% on the first $3 billion of average daily net assets (excluding Target Series); 0.015% on the next $3 billion of average daily net assets (excluding Target Series); and 0.01% of the average daily net assets in excess of $6 billion (excluding Target Series); plus a base fee of $25,500 per Series.
Transfer Agent fees are charged to the Fund on a per account basis. Additionally, certain transaction- and cusip-based fees and out-of-pocket expenses, including charges for reporting relating to the Fund’s compliance program, are charged.
Effective July 1, 2010, PNCGIS was sold to The Bank of New York Mellon Corporation, the Series’ custodian. At the close of the sale, PNCGIS changed its name to BNY Mellon Investment Servicing (U.S.) Inc. (“BNY”).
Expenses not directly attributable to a Series are allocated based on each Series’ relative net assets or number of accounts, depending on the expense.
| 4. | PURCHASES AND SALES OF SECURITIES |
For the year ended December 31, 2010, purchases and sales of securities, other than U.S. Government securities and short-term securities, were $127,636,610 and $138,310,342, respectively. There were no purchases or sales of U.S. Government securities.
| 5. | CAPITAL STOCK TRANSACTIONS |
Transactions in Class A shares of Small Cap Series were:
| | | | | | | | | | | | | | | | |
| | | For the Year Ended 12/31/10 | | | For the Year Ended 12/31/09 | |
| | | Shares | | | Amount | | | Shares | | | Amount | |
Sold | | | 2,171,584 | | | $ | 16,811,321 | | | | 3,622,635 | | | $ | 20,933,139 | |
Reinvested | | | — | | | | — | | | | — | | | | — | |
Repurchased | | | (3,002,811 | ) | | | (23,156,233 | ) | | | (4,476,178 | ) | | | (24,775,534 | ) |
| | | | | | | | | | | | | | | | |
Total | | | (831,227 | ) | | $ | (6,344,912 | ) | | | (853,543 | ) | | $ | (3,842,395 | ) |
| | | | | | | | | | | | | | | | |
Approximately 90% of the Series’ shares represent investments by fiduciary accounts over which the Advisor has sole investment discretion.
The Series may trade in instruments including written and purchased options, forward foreign currency exchange contracts and futures contracts and other derivatives in the normal course of investing activities to assist in managing exposure to various market risks. Investments in these instruments may subject the Series to various elements of risk, which may involve, to a varying degree, elements of risk in excess of the amounts recognized for financial statement purposes. These risks include: the risk that changes in the value of a derivative may not correlate perfectly with the underlying asset, rate or index, counterparty credit risk related to over the counter derivatives counterparties’ failure to perform under contract terms, liquidity risk related to the lack of a liquid market for these contracts allowing
17
Notes to Financial Statements
| 6. | FINANCIAL INSTRUMENTS (continued) |
the fund to close out its position(s) and documentation risk relating to disagreement over contract terms. No such investments were held by the Series during the year ended December 31, 2010.
Investing in securities of foreign companies and foreign governments involves special risks and considerations not typically associated with investing in securities of domestic companies and the U.S. Government. These risks include revaluation of currencies and future adverse political and economic developments. Moreover, securities of foreign companies and foreign governments and their markets may be less liquid and their prices more volatile than those of comparable domestic companies and the U.S. Government.
| 8. | FEDERAL INCOME TAX INFORMATION |
The amount and characterization of certain income and capital gains to be distributed are determined in accordance with federal income tax regulations, which may differ from accounting principles generally accepted in the United States of America. These differences are primarily due to differing book and tax treatments in the timing of the recognition of net investment income or gains and losses, including net operating losses, losses deferred due to wash sales and foreign currency gains and losses. The Series may periodically make reclassifications among its capital accounts to reflect income and gains available for distribution (or available capital loss carryovers) under income tax regulations without impacting the Series’ net asset value. Any such reclassifications are not reflected in the financial highlights.
There were no distributions to shareholders for the years ended December 31, 2010 or December 31, 2009.
At December 31, 2010 , the tax basis of distributable earnings and the net unrealized appreciation based on identified cost of investments for federal income tax purposes were as follows:
| | | | | | | | |
| | Cost for federal income tax purposes | | $ | 164,228,221 | | | |
| | Unrealized appreciation | | $ | 45,444,657 | | | |
| | Unrealized depreciation | | | (3,332,066 | ) | | |
| | | | | | | | |
| | Net unrealized appreciation | | $ | 42,112,591 | | | |
| | | | | | | | |
| | Capital loss carryover | | | 64,954,922 | | | |
At December 31, 2010, the capital loss carryover, disclosed above, available to the extent allowed by tax law to offset future net capital gain, if any, will expire as follows:
| | | | |
| Loss Carryover | | Expiration Date | | |
$12,581,033 | | December 31, 2016 | | |
$52,373,889 | | December 31, 2017 | | |
The capital loss carryover utilized in the current year was $28,485,949.
Report of Independent Registered Public Accounting Firm
To the Board of Directors of Manning & Napier Fund, Inc. and Shareholders of Small Cap Series:
In our opinion, the accompanying statement of assets and liabilities, including the investment portfolio, and the related statements of operations and of changes in net assets and the financial highlights present fairly, in all material respects, the financial position of the Small Cap Series (a series of Manning & Napier Fund, Inc., hereafter referred to as the “Series”) at December 31, 2010, and the results of its operations for the year then ended, the changes in its net assets for each of the two years in the period then ended and the financial highlights for each of the five years in the period then ended, in conformity with accounting principles generally accepted in the United States of America. These financial statements and financial highlights (hereafter referred to as “financial statements”) are the responsibility of the Series’ management. Our responsibility is to express an opinion on these financial statements based on our audits. We conducted our audits of these financial statements in accordance with the standards of the Public Company Accounting Oversight Board (United States). Those standards require that we plan and perform the audit to obtain reasonable assurance about whether the financial statements are free of material misstatement. An audit includes examining, on a test basis, evidence supporting the amounts and disclosures in the financial statements, assessing the accounting principles used and significant estimates made by management, and evaluating the overall financial statement presentation. We believe that our audits, which included confirmation of securities at December 31, 2010 by correspondence with the custodian and brokers, provide a reasonable basis for our opinion.
New York, New York
February 22, 2011
Renewal of Investment Advisory Agreement (unaudited)
At the Manning & Napier Fund, Inc. (the “Fund”) Board of Directors’ (the “Board”) meeting, held on November 17, 2010, the Investment Advisory Agreement (the “Agreement”) between the Fund and Manning & Napier Advisors, Inc. (the “Advisor”) was reviewed by the Board for renewal. In connection with the decision whether to renew the Agreement, a variety of material was prepared for and reviewed by the Board.
Representatives of the Advisor attended the meeting and presented additional oral and written information to the Board to assist the Board in its considerations. The discussion immediately below outlines the materials and information presented to the Board in connection with the Board’s 2010 Annual Review of the Agreement and the conclusions made by the Directors when determining to continue the Agreement.
| | • | | The Board considered the services provided by the Advisor under the Agreement including, among others: deciding what securities to purchase and sell for each Series; arranging for the purchase and sale of such securities by placing orders with broker-dealers; administering the affairs of the Fund (including the books and records of the Fund not maintained by third party service providers such as the custodian or sub-transfer agent); arranging for the insurance coverage for the Fund; and supervising the preparation of tax returns, SEC filings (including registration statements) and reports to shareholders for the Fund. The Board also considered the nature and quality of such services provided under the Agreement in light of the Advisor’s services provided to the Fund for 24 years. The Board discussed the quality of these services with representatives from the Advisor and concluded that the Advisor was performing its services to the Fund required under the Agreement in a reasonable manner. |
| | • | | The Board considered the investment performance of the various Series of the Fund. The investment performance for each Series was reviewed on a cumulative basis since inception and on a one year basis. In addition, annualized performance for the following time periods was considered: inception, three year, five year, ten year, and current market cycle. A market cycle includes periods of both rising and falling markets. Returns for established benchmark indices for each Series were provided for each time period. The Board noted that the various Series were competitive against their respective benchmarks and/or peer groups over various time periods, but in particular over the full market cycle period relevant for the Series. In addition, the Board considered at the meeting (and considers on a quarterly basis) a peer group performance analysis consisting of Morningstar universes of mutual funds with similar investment objectives. The Board discussed the performance with representatives from the Advisor and concluded that the investment performance of each of the Fund’s Series was reasonable based on the Fund’s actual performance and comparative performance, especially performance over the current market cycle. |
| | • | | The Board considered the costs of the Advisor’s services and the profits of the Advisor as they relate to the Advisor’s services to the Fund under the Agreement. In reviewing the Advisor’s costs and profits, the Board discussed the Advisor’s revenues generated from the Fund (on both an actual and adjusted basis) and its expenses associated with providing the services under the Agreement. In addition, the Board reviewed the Advisor’s expenses associated with Fund activities outside of the Agreement (such as expense reimbursements pursuant to expense caps and payments made by the Advisor to third party platforms on which shares of the Fund are available for purchase). It was noted by representatives of the Advisor that 11 of the 27 active Series of the Fund are currently experiencing expenses above the capped expense ratios. After discussing the above costs and profits, the Board concluded that the Advisor’s profitability relating to its services provided under the Agreement was reasonable. |
| | • | | The Board considered the fees and expenses of the various Series of the Fund. The Advisor presented the advisory fees and total expenses for each Series, including the advisory fee adjusted for any expense waivers or reimbursements (either contractual or voluntary) paid by the Advisor. The advisory fees and expense ratios of each Series were compared to an average (on both a mean and median basis) of similar funds as disclosed on the Morningstar database. Representatives of the Advisor discussed with the Board the levels of its advisory |
Renewal of Investment Advisory Agreement (unaudited)
| | fee for each Series of the Fund and as compared to the median and mean advisory fees for similar funds as listed on Morningstar. Expense ratios for every Series, except the Pro-Blend’s Class R and Class C, and Target Class R and Class C, are currently below the median and mean for similar funds as listed on Morningstar. Based on their review of the information provided, the Board concluded that the fees and expenses of each Series of the Fund were reasonable on a comparative basis. |
| | • | | The Board also considered the other benefits the Advisor derives from its relationship with the Fund. Such other benefits include certain research products provided by soft dollars. Given the level of soft dollar transactions involving the Fund, the Board concluded that these additional benefits to the Advisor were reasonable. |
| | • | | In addition to the factors described above, the Board considered the Advisor’s personnel, investment strategies, policies and procedures relating to compliance with personal securities transactions, and reputation, expertise and resources in domestic and foreign financial markets. The Board concluded that these factors support the conclusion that the Advisor performs its services in a reasonable manner. |
| | • | | The Board did not consider economies of scale at this time because of the multiple uses of the Fund (for the Advisor’s discretionary investment account clients in addition to direct investors), the current profitability of the Advisor’s services to the Fund under the Agreement, and the overall size of the Fund complex. |
Based on the Board’s deliberations and their evaluation of the information described above, the Board, including a majority of Directors that are not “interested persons” as defined in the Investment Company Act of 1940, concluded that the compensation under the Agreement was fair and reasonable in light of the services and expenses and such other matters as the Directors considered to be relevant in the exercise of their reasonable judgment. Accordingly, the Board approved the renewal of the Agreement. In the course of their deliberations, the Directors did not identify any particular information that was all important or controlling.
Directors’ and Officers’ Information (unaudited)
The Statement of Additional Information provides additional information about the Fund’s directors and officers and can be obtained without charge by calling 1-800-466-3863, at www.manningnapieradvisors.com, or on the EDGAR Database on the SEC Internet web site (http:// www.sec.gov). The following chart shows certain information about the Fund’s officers and directors, including their principal occupations during the last five years. Unless specific dates are provided, the individuals have held the listed positions for longer than five years.
| | |
INTERESTED DIRECTOR/OFFICER | | |
Name: | | B. Reuben Auspitz* |
| Address: | | 290 Woodcliff Drive |
| | Fairport, NY 14450 |
| Age: | | 63 |
| Current Position(s) Held with Fund: | | Principal Executive Officer, President, Chairman & Director |
| Term of Office1 & Length of Time Served: | | Indefinite - Director since 1984; Vice President 1984 - 2003; President since 2004; Principal Executive Officer since 2002 |
| Principal Occupation(s) During Past 5 Years: | | Executive Vice President; Executive Group Member**; Chief Compliance Officer since 2004; Vice Chairman since June 2010; Co-Executive Director from 2003-2010 - Manning & Napier Advisors, Inc. President; Director - Manning & Napier Investor Services, Inc. Holds or has held one or more of the following titles for various subsidiaries and affiliates: President, Vice President, Director, Chairman, Treasurer, Chief Compliance Officer or Member. |
| Number of Portfolios Overseen within Fund Complex: | | 29 |
| Other Directorships Held Outside Fund Complex: | | N/A |
INDEPENDENT DIRECTORS | | |
Name: | | Paul A. Brooke |
| Address: | | 290 Woodcliff Drive |
| | Fairport, NY 14450 |
| Age: | | 65 |
| Current Position(s) Held with Fund: | | Director, Audit Committee Member, Governance & Nominating Committee Member |
| Term of Office & Length of Time Served: | | Indefinite - Since 2007 |
| Principal Occupation(s) During Past 5 Years: | | Chairman & CEO, Alsius Corp. (investments); Managing Member, PMSV Holdings LLC (investments) |
| Number of Portfolios Overseen within Fund Complex: | | 29 |
| Other Directorships Held Outside Fund Complex: | | Incyte Corp. (2000-present) |
| | ViroPharma, Inc. (2000-present) |
| | HLTH Corp. (2000-present) |
| | Cheyne Capital International (2000-present) |
| | MPM Bio-equities (2000-present) |
| | GMP Companies (2000-present) |
| | | HoustonPharma (2000-present) |
Name: | | Richard M. Hurwitz |
| Address: | | 290 Woodcliff Drive |
| | Fairport, NY 14450 |
| Age: | | 47 |
| Current Position(s) Held with Fund: | | Director, Audit Committee Member, Governance & Nominating Committee Member |
| Term of Office & Length of Time Served: | | Indefinite - Since 2009 |
| Principal Occupation(s) During Past 5 Years: | | Chief Executive Officer, Pictometry International Corp. since August 2010 (provider of georeferenced, aerial image libraries and related software) Managing Partner (2006-July 2010) - Aegis Investment Partners, LLC (investments); Founder and Managing Partner (2004-2005) - Village |
| | Markets, LLC (groceries) |
| Number of Portfolios Overseen within Fund Complex: | | 29 |
| Other Directorships Held Outside Fund Complex: | | Pictometry International Corp. (2000-2010) |
| | Pioneering Technologies (2006-2009) |
| | | Vensearch Capital Corp. (2003-2007) |
Directors’ and Officers’ Information (unaudited)
| | |
INDEPENDENT DIRECTORS (continued) | | |
| |
| Name: | | Stephen B. Ashley |
| Address: | | 290 Woodcliff Drive |
| | Fairport, NY 14450 |
| Age: | | 70 |
| Current Position(s) Held with Fund: | | Director, Audit Committee Member, Governance & Nominating Committee Member |
| Term of Office & Length of Time Served: | | Indefinite - Since 1996 |
| Principal Occupation(s) During Past 5 Years: | | Chairman, Director, President & Chief Executive Officer, The Ashley Group (property management and investment). Chairman (non-executive) 2004-2008; Director 1995-2008 - Fannie Mae (mortgage) |
| Number of Portfolios Overseen within Fund Complex: | | 29 |
| Other Directorships Held Outside Fund Complex: | | The Ashley Group (1995-2008) |
| | Genesee Corporation (1987-2007) |
| Name: | | Peter L. Faber |
| Address: | | 290 Woodcliff Drive |
| | Fairport, NY 14450 |
| Age: | | 72 |
| Current Position(s) Held with Fund: | | Director, Governance & Nominating Committee Member |
| Term of Office & Length of Time Served: | | Indefinite - Since 1987 |
| Principal Occupation(s) During Past 5 Years: | | Senior Counsel since 2006, Partner (1995 - 2006) - McDermott, Will & Emery LLP (law firm) |
| Number of Portfolios Overseen within Fund Complex: | | 29 |
| Other Directorships Held Outside Fund Complex: | | Partnership for New York City, Inc. (non-profit) |
| | New York Collegium (non-profit) |
| | Boston Early Music Festival (non-profit) |
| Name: | | Harris H. Rusitzky |
| Address: | | 290 Woodcliff Drive |
| | Fairport, NY 14450 |
| Age: | | 76 |
| Current Position(s) Held with Fund: | | Director, Audit Committee Member, Governance & Nominating Committee Member |
| Term of Office & Length of Time Served: | | Indefinite - Since 1985 |
| Principal Occupation(s) During Past 5 Years: | | President, The Greening Group (business consultants) since 1994; Partner, The Restaurant Group (restaurants) since 2006 |
| Number of Portfolios Overseen within Fund Complex: | | 29 |
| Other Directorships Held Outside Fund Complex: | | N/A |
OFFICERS | | |
| Name: | | Jeffrey S. Coons, Ph.D., CFA |
| Address: | | 290 Woodcliff Drive |
| | Fairport, NY 14450 |
| Age: | | 47 |
| Current Position(s) Held with Fund: | | Vice President |
| Term of Office1 & Length of Time Served: | | Since 2004 |
| Principal Occupation(s) During Past 5 Years: | | President since 2010, Co-Director of Research since 2002, Executive Group Member** since 2003, - Manning & Napier Advisors, Inc. Holds one or more of the following titles for various subsidiaries and affiliates: President, Director, Treasurer or Senior Trust Officer. |
| Number of Portfolios Overseen within Fund Complex: | | 29 |
| Other Directorships Held Outside Fund Complex: | | N/A |
Directors’ and Officers’ Information (unaudited)
| | |
| OFFICERS (continued) | | |
| |
| Name: | | Beth Galusha |
| Address: | | 290 Woodcliff Drive |
| | Fairport, NY 14450 |
| Age: | | 49 |
| Current Position(s) Held with Fund: | | Assistant Chief Financial Officer |
| Term of Office1 & Length of Time Served: | | Assistant Chief Financial Officer since 2010 |
| Principal Occupation(s) During Past 5 Years: | | Chief Financial Officer and Treasurer, Manning & Napier Advisors, Inc. Holds one or more of the following titles for various affiliates: Chief Financial Officer, Director, or Treasurer |
| Number of Portfolios Overseen within Fund Complex: | | 29 |
| Other Directorships Held Outside Fund Complex: | | N/A |
Name: | | Christine Glavin |
| Address: | | 290 Woodcliff Drive |
| | Fairport, NY 14450 |
| Age: | | 44 |
| Current Position(s) Held with Fund: | | Principal Financial Officer, Chief Financial Officer |
| Term of Office1 & Length of Time Served: | | Principal Financial Officer since 2002; Chief Financial Officer since 2001 |
| Principal Occupation(s) During Past 5 Years: | | Fund Reporting Manager, Manning & Napier Advisors, Inc. since 1997 |
| Number of Portfolios Overseen within Fund Complex: | | 29 |
| Other Directorships Held Outside Fund Complex: | | N/A |
Name: | | Jodi L. Hedberg |
| Address: | | 290 Woodcliff Drive |
| | Fairport, NY 14450 |
| Age: | | 43 |
| Current Position(s) Held with Fund: | | Corporate Secretary, Chief Compliance Officer, Anti-Money Laundering Compliance Officer |
| Term of Office1 & Length of Time Served: | | Corporate Secretary since 1997; Chief Compliance Officer since 2004 |
| Principal Occupation(s) During Past 5 Years: | | Director of Compliance, Manning & Napier Advisors, Inc. and affiliates since 1990 (title change in 2005 from Compliance Manager to Director of Compliance); Corporate Secretary, Manning & Napier Investor Services, Inc. since 2006 |
| Number of Portfolios Overseen within Fund Complex: | | 29 |
| Other Directorships Held Outside Fund Complex: | | N/A |
Name: | | Richard Yates |
| Address: | | 290 Woodcliff Drive |
| | Fairport, NY 14450 |
| Age: | | 45 |
| Current Position(s) Held with Fund: | | Chief Legal Officer |
| Term of Office1 & Length of Time Served: | | Chief Legal Officer since 2004 |
| Principal Occupation(s) During Past 5 Years: | | Counsel - Manning & Napier Advisors, Inc. & affiliates since 2000; Holds one or more of the following titles for various affiliates; Director or Corporate Secretary |
| Number of Portfolios Overseen within Fund Complex: | | 29 |
| Other Directorships Held Outside Fund Complex: | | N/A |
*Interested Director, within the meaning of the Investment Company Act of 1940 by reason of his position with the Fund’s investment advisor and distributor. Mr. Auspitz serves as the Executive Vice President and Director, Manning & Napier Advisors, Inc. and President and Director, Manning
& Napier Investor Services, Inc., the Fund’s distributor.
**Prior to June 2010, the Executive Group, consisting of senior executive employee-owners, performed the duties of the Office of the Chief Executive of the Advisor. Effective June 2010, the Executive Group serves as an advisory board to the Chief Executive Officer.
1The term of office for President, Vice President, Chief Financial Officer, Assistant Chief Financial Officer, Chief Legal Officer and Corporate Secretary is one year and until their respective successors are chosen and qualified. All other officers’ terms are indefinite.
This page Intentionally Left Blank
25
Literature Requests (unaudited)
Proxy Voting Policies and Procedures
A description of the policies and procedures that the Fund uses to determine how to vote proxies relating to portfolio securities is available, without charge, upon request:
| | |
By phone | | 1-800-466-3863 |
On the Securities and Exchange
Commission’s (SEC) web site | | http://www.sec.gov |
Proxy Voting Record
Information regarding how the Fund voted proxies relating to portfolio securities during the most recent 12-month period ended June 30th is available, without charge, upon request:
| | |
By phone | | 1-800-466-3863 |
On the SEC’s web site | | http://www.sec.gov |
Quarterly Portfolio Holdings
The Series’ complete schedule of portfolio holdings for the 1st and 3rd quarters of each fiscal year are provided on Form N-Q, and are available, without charge, upon request:
| | |
By phone | | 1-800-466-3863 |
On the SEC’s web site | | http://www.sec.gov |
The Series’ Form N-Q may be reviewed and copied at the SEC’s Public Reference Room in Washington, D.C. Information on the operation of the Public Reference Room may be obtained by calling 1-800-SEC-0330.
Prospectus and Statement of Additional Information (SAI)
The prospectus and SAI provide additional information about each Series, including charges, expenses and risks. These documents are available, without charge, upon request:
| | |
By phone | | 1-800-466-3863 |
On the SEC’s web site | | http://www.sec.gov |
On the Advisor’s web site | | http://www.manning-napier.com |
Additional information available at www.manning-napier.com
1. Fund Holdings - Month-End
2. Fund Holdings - Quarter-End
3. Shareholder Report - Annual
4. Shareholder Report - Semi-Annual
MNSCS-12/10-AR

Management Discussion and Analysis (unaudited)
Dear Shareholders:
Over the course of 2010, the markets experienced several ups and downs driven by well-defined swings in investor sentiment. Optimism fueled strong market returns early in the year, as upbeat economic releases led investors to believe in the potential for a robust U.S. recovery. However, sentiment shifted drastically in May and June as more negative economic news and issues related to Europe’s government debt problems led to notable stock market losses. In another swing, the markets rebounded in the fall amid better economic developments and prospects that the Federal Reserve would enact another round of quantitative easing. That rally generally continued through the end of the year as the markets reacted positively to the U.S. tax compromise, which extended the Bush-era tax cuts for all income brackets.
With equities posting double-digit gains in the third and fourth quarters, the choppy year ended on a strong note, and broad equity indices have now produced back-to-back years of positive results. For the twelve months ending December 31, 2010, the S&P 500 Index returned 15.07%, while the S&P 500 Information Technology Index earned 10.23%.
The Technology Series had a 19.53% return during 2010, outpacing the S&P 500 Information Technology Index as well as the broader stock market. More importantly, the Series continues to have a strong track record relative to the broad market and the sector-specific benchmark over the current market cycle, which includes both a bull and a bear market. Over this current cycle, the Technology Series has earned an annualized return of 20.44%, compared to the 7.52% return of the S&P 500 Index and the 11.11% return of the S&P 500 Information Technology Index.
In the volatile market environment of 2010, Manning & Napier maintained a selective investment approach and focused on companies that we believe can grow market share. We continued to emphasize quality, targeting best-in-class companies expected to generate sales growth despite a muted economic backdrop, as well as “away game winners” expected to successfully compete in faster-growing markets overseas.
Focusing on companies with strong fundamentals and favorable growth drivers, we took advantage of the market swings in 2010. During the market pullback in the second quarter, we added stocks with strong secular (i.e., non-cyclical) growth prospects that fit our Strategic Profile strategy, which seeks companies with a leading competitive advantage. Earlier in 2010 the Series reduced exposure to early cyclical companies, such as investments in the semiconductor capital equipment industry.
As the year progressed, there was an increased premium placed on sustainable, high-growth technology companies, particularly small and mid-cap stocks related to thematic trends such as cloud computing. Therefore, in the second half of the year, the Series benefited from owning some of these small and mid-cap holdings perceived to be long-term growth companies and attractive acquisition targets. Several of our selections were the subject of merger and acquisition activity and speculation, which led to outsized returns. In cases when the Advisor viewed the price appreciation as more speculative in nature, we took gains and trimmed the positions. Conversely, over the past year many large cap technology vendors with solid growth potential and sustainable competitive advantages have underperformed. At the end of the year, we began to increase exposure to many of these more attractively valued companies.
Over the last twelve months, specific stock selections significantly boosted the Technology Series’ outperformance. In particular, investments in the communications equipment, software, internet software & services, and wireless telecommunications services industries were the primary drivers of strong relative results. In contrast, security selections in the semiconductor capital equipment and IT services industries detracted from relative returns in 2010. The Series continues to maintain a heavy weighting to the communications equipment and internet software & services industries versus the benchmark.
While economic developments turned more optimistic toward the end of 2010, the U.S. economy still faces significant headwinds, including a struggling housing market, a stagnant job market, a difficult consumer rebalancing act, and high government debt burdens. Given these long-term structural issues, the slow growth environment in the U.S. will likely
Management Discussion and Analysis (unaudited)
remain a reality. As the markets fluctuated around this slow growth trend in 2010, Manning & Napier earned solid returns by staying focused on the fundamentals and maintaining our selective investment process. This investment approach has proved beneficial for the past 40 years, and we believe these qualities will remain important as the market environment unfolds in 2011.
As always, we appreciate your business.
Sincerely,
Manning & Napier Advisors, Inc.
Performance Update as of December 31, 2010 (unaudited)
| | | | | | | | | | | | | | | | |
| | | | | | Average Annual Total Returns
As of December 31, 2010 | | | | |
| | | One Year | | | Five Year | | | Ten Year | | | Since
Inception 1 | |
Manning & Napier Fund, Inc. - Technology Series2 | | | 19.53% | | | | 9.81% | | | | 6.44% | | | | 2.83% | |
S&P 500 Total Return Index3 | | | 15.07% | | | | 2.30% | | | | 1.42% | | | | 0.28% | |
S&P 500 Information Technology Index3 | | | 10.23% | | | | 5.04% | | | | -1.00% | | | | -5.89% | |
| | | | | | | | | | | | | | | | | |
The following graph compares the value of a $10,000 investment in the Manning & Napier Fund, Inc. - Technology Series from its current activation1 (8/8/00) to present (12/31/10) to the S&P 500 Total Return Index and the S&P 500 Information Technology Index.
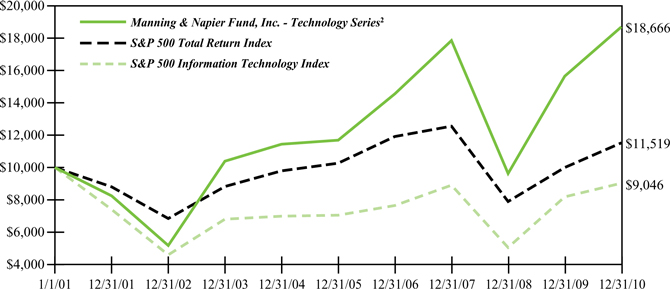
1Performance numbers for the Series and Indices are calculated from August 8, 2000, the Series’ current activation date.
2The Series’ performance does not reflect the deduction of taxes that a shareholder would pay on fund distributions or the redemption of shares. The Series’ performance is historical and may not be indicative of future results. The performance returns shown are inclusive of the net expense ratio of the Series. For the year ended December 31, 2010, this net expense ratio was 1.12%. The gross expense ratio, which does not account for any voluntary or contractual waivers currently in effect, was 1.12% for the year ended December 31, 2010.
3The S&P 500 Total Return Index is an unmanaged capitalization-weighted measure of 500 widely held common stocks listed on the New York Stock Exchange, American Stock Exchange and the Over-the-Counter market. The S&P 500 Information Technology Index, a sub-index of the S&P 500 Total Return Index, includes the stocks of companies involved in the business of technology related products and services. Both Indices’ returns assume daily reinvestment of dividends and, unlike Series returns, do not reflect any fees or expenses.
Shareholder Expense Example (unaudited)
As a shareholder of the Series, you may incur two types of costs: (1) transaction costs and (2) ongoing costs, including management fees and other Series expenses. This example is intended to help you understand your ongoing costs (in dollars) of investing in the Series and to compare these costs with the ongoing costs of investing in other mutual funds.
The example is based on an investment of $1,000 invested at the beginning of the period and held for the entire period (July 1, 2010 to December 31, 2010).
Actual Expenses
The first line of the table below provides information about actual account values and actual expenses. You may use the information in this line, together with the amount you invested, to estimate the expenses that you paid over the period. Simply divide your account value by $1,000 (for example, an $8,600 account value divided by $1,000 = 8.6), then multiply the result by the number in the first line under the heading entitled “Expenses Paid During Period” to estimate the expenses you paid on your account during this period.
Hypothetical Example for Comparison Purposes
The second line of the table below provides information about hypothetical account values and hypothetical expenses based on the Series’ actual expense ratio and an assumed rate of return of 5% per year before expenses, which is not the Series’ actual return. The hypothetical account values and expenses may not be used to estimate the actual ending account balance or expenses you paid during the period. You may use this information to compare the ongoing costs of investing in the Series and other funds. To do so, compare this 5% hypothetical example with the 5% hypothetical examples that appear in the shareholder reports of the other funds.
Please note that the expenses shown in the table are meant to highlight your ongoing costs only and do not reflect any transaction costs. Therefore, the second line of the table is useful in comparing ongoing costs only, and will not help you determine the relative total costs of owning different funds. In addition, if these transaction costs were included, your costs would have been higher.
| | | | | | |
| | | Beginning Account Value
7/1/10 | | Ending
Account Value
12/31/10 | | Expenses Paid During Period 7/1/10-12/31/10* |
Actual | | $1,000.00 | | $1,346.10 | | $6.56 |
Hypothetical
(5% return before expenses) | | $1,000.00 | | $1,019.61 | | $5.65 |
*Expenses are equal to the Series’ annualized expense ratio (for the six-month period) of 1.11%, multiplied by the average account value over the period, multiplied by 184/365 (to reflect the one-half year period). Expenses are based on the most recent fiscal half year; therefore, the expense ratio stated above may differ from the expense ratio stated in the financial highlights, which is based on one-year data. The Series’ total return would have been lower had certain expenses not been waived during the period.
Portfolio Composition as of December 31, 2010 (unaudited)
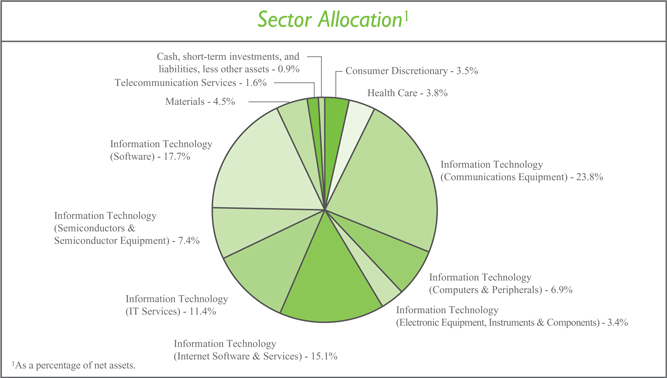
| | | | | | | | | | |
TopTen Stock Holdings2 | | | | |
QUALCOMM, Inc. | | | 4.8 | % | | Infinera Corp. | | | 3.9% | |
Microsoft Corp. | | | 4.8 | % | | Cerner Corp. | | | 3.8% | |
Cisco Systems, Inc. | | | 4.8 | % | | VistaPrint N.V. (Netherlands) | | | 3.8% | |
Google, Inc. - Class A | | | 4.3 | % | | Autodesk, Inc. | | | 3.6% | |
Juniper Networks, Inc. | | | 4.1 | % | | Liberty Global, Inc. - Class A | | | 3.5% | |
| | | | |
2As a percentage of total investments. | | | | | | | | | | |
Investment Portfolio - December 31, 2010
| | | | | | | | |
| | | Shares | | | Value (Note 2) | |
| | |
COMMON STOCKS - 97.5% | | | | | | | | |
| | |
Consumer Discretionary - 3.5% | | | | | | | | |
Media - 3.5% | | | | | | | | |
Liberty Global, Inc. - Class A* | | | 165,000 | | | $ | 5,837,700 | |
| | | | | | | | |
Health Care - 3.8% | | | | | | | | |
Health Care Technology - 3.8% | | | | | | | | |
Cerner Corp.* | | | 67,580 | | | | 6,402,529 | |
| | | | | | | | |
Information Technology - 85.7% | | | | | | | | |
Communications Equipment - 23.8% | | | | | | | | |
Alcatel-Lucent - ADR (France)* | | | 1,570,600 | | | | 4,648,976 | |
Cisco Systems, Inc.* | | | 394,000 | | | | 7,970,620 | |
Infinera Corp.* | | | 638,430 | | | | 6,594,982 | |
Juniper Networks, Inc.* | | | 187,800 | | | | 6,933,576 | |
QUALCOMM, Inc. | | | 164,130 | | | | 8,122,794 | |
Riverbed Technology, Inc.* | | | 160,000 | | | | 5,627,200 | |
| | | | | | | | |
| | | | | | | 39,898,148 | |
| | | | | | | | |
Computers & Peripherals - 6.9% | | | | | | | | |
Apple, Inc.* | | | 12,400 | | | | 3,999,744 | |
Compellent Technologies, Inc.* | | | 78,000 | | | | 2,152,020 | |
EMC Corp.* | | | 158,600 | | | | 3,631,940 | |
Immersion Corp.* | | | 257,000 | | | | 1,724,470 | |
| | | | | | | | |
| | | | | | | 11,508,174 | |
| | | | | | | | |
Electronic Equipment, Instruments & Components - 3.4% | | | | | | | | |
Amphenol Corp. - Class A | | | 107,850 | | | | 5,692,323 | |
| | | | | | | | |
Internet Software & Services - 15.1% | | | | | | | | |
comScore, Inc.* | | | 247,530 | | | | 5,522,394 | |
Google, Inc. - Class A* | | | 12,230 | | | | 7,264,253 | |
NetEase.com, Inc. - ADR (China)* | | | 34,960 | | | | 1,263,804 | |
Tencent Holdings Ltd. (China)1 | | | 91,500 | | | | 1,986,414 | |
VistaPrint N.V. (Netherlands)* | | | 139,000 | | | | 6,394,000 | |
Vocus, Inc.* | | | 105,000 | | | | 2,904,300 | |
| | | | | | | | |
| | | | | | | 25,335,165 | |
| | | | | | | | |
IT Services - 11.4% | | | | | | | | |
Accenture plc - Class A (Ireland) | | | 112,000 | | | | 5,430,880 | |
Amadeus IT Holding S.A. - Class A (Spain)*1 | | | 176,000 | | | | 3,698,695 | |
Amdocs Ltd. (Guernsey)* | | | 210,000 | | | | 5,768,700 | |
Cap Gemini S.A. (France)1 | | | 89,000 | | | | 4,160,718 | |
| | | | | | | | |
| | | | | | | 19,058,993 | |
| | | | | | | | |
Semiconductors & Semiconductor Equipment - 7.4% | | | | | | | | |
Advantest Corp. (Japan)1 | | | 196,000 | | | | 4,406,708 | |
Sumco Corp. (Japan)*1 | | | 330,500 | | | | 4,706,133 | |
| | |
| 6 | | The accompanying notes are an integral part of the financial statements. |
Investment Portfolio - December 31, 2010
| | | | | | | | | | |
| | | Shares/ Principal Amount | | Value (Note 2) |
| | |
COMMON STOCKS (continued) | | | | | | | | | | |
Information Technology (continued) | | | | | | | | | | |
Semiconductors & Semiconductor Equipment (continued) | | | | | | | | | | |
Tokyo Electron Ltd. (Japan)1 | | | | 51,000 | | | | $ | 3,211,021 | |
| | | | | | | | | | |
| | | | | | | | | 12,323,862 | |
| | | | | | | | | | |
Software - 17.7% | | | | | | | | | | |
Adobe Systems, Inc.* | | | | 48,650 | | | | | 1,497,447 | |
Autodesk, Inc.* | | | | 158,000 | | | | | 6,035,600 | |
Fortinet, Inc.* | | | | 143,000 | | | | | 4,626,050 | |
Microsoft Corp. | | | | 288,900 | | | | | 8,066,088 | |
SAP AG - ADR (Germany) | | | | 73,000 | | | | | 3,694,530 | |
SolarWinds, Inc.* | | | | 300,000 | | | | | 5,775,000 | |
| | | | | | | | | | |
| | | | | | | | | 29,694,715 | |
| | | | | | | | | | |
Total Information Technology | | | | | | | | | 143,511,380 | |
| | | | | | | | | | |
Materials - 4.5% | | | | | | | | | | |
Chemicals - 4.5% | | | | | | | | | | |
Monsanto Co. | | | | 57,790 | | | | | 4,024,496 | |
Shin-Etsu Chemical Co. Ltd. (Japan)1 | | | | 65,000 | | | | | 3,503,277 | |
| | | | | | | | | | |
Total Materials | | | | | | | | | 7,527,773 | |
| | | | | | | | | | |
TOTAL COMMON STOCKS
(Identified Cost $132,016,139) | | | | | | | | | 163,279,382 | |
| | | | | | | | | | |
CORPORATE BONDS - 1.6% | | | | | | | | | | |
| | |
Non-Convertible Corporate Bonds - 1.6% | | | | | | | | | | |
Telecommunication Services - 1.6% | | | | | | | | | | |
Diversified Telecommunication Services - 1.6% | | | | | | | | | | |
Clearwire Communications LLC - Clearwire Finance, Inc.2, 12.00%, 12/1/2015 (Identified Cost $2,516,553) | | | $ | 2,500,000 | | | | | 2,700,000 | |
| | | | | | | | | | |
SHORT-TERM INVESTMENTS - 1.1% | | | | | | | | | | |
Dreyfus Cash Management, Inc. - Institutional Shares3, 0.14%
(Identified Cost $1,754,448) | | | | 1,754,448 | | | | | 1,754,448 | |
| | | | | | | | | | |
TOTAL INVESTMENTS - 100.2%
(Identified Cost $136,287,140) | | | | | | | | | 167,733,830 | |
LIABILITIES, LESS OTHER ASSETS - (0.2%) | | | | | | | | | (333,985 | ) |
| | | | | | | | | | |
NET ASSETS - 100% | | | | | | | | $ | 167,399,845 | |
| | | | | | | | | | |
| | |
| The accompanying notes are an integral part of the financial statements. | | 7 |
Investment Portfolio - December 31, 2010
ADR - American Depository Receipt
*Non-income producing security
1International Fair Value factor from pricing service was applied.
2Restricted securities - Investment in securities that are restricted as to public resale under the Securities Act of 1933, as amended. This security has been sold under rule 144A and has been determined to be liquid under guidelines established by the Board of Directors. This security amounts to $2,700,000, or 1.6%, of the Series’ net assets as of December 31, 2010.
3Rate shown is the current yield as of December 31, 2010.
| | |
| 8 | | The accompanying notes are an integral part of the financial statements. |
Statement of Assets and Liabilities
December 31, 2010
| | | | |
| |
ASSETS: | | | | |
| |
Investments, at value (identified cost $136,287,140) (Note 2) | | $ | 167,733,830 | |
Receivable for fund shares sold | | | 109,207 | |
Interest receivable | | | 25,547 | |
Foreign tax reclaims receivable | | | 7,951 | |
Dividends receivable | | | 2,884 | |
| | | | |
| |
TOTAL ASSETS | | | 167,879,419 | |
| | | | |
| |
LIABILITIES: | | | | |
| |
Accrued management fees (Note 3) | �� | | 147,924 | |
Accrued fund accounting and administration fees (Note 3) | | | 6,690 | |
Accrued transfer agent fees (Note 3) | | | 2,219 | |
Accrued Chief Compliance Officer service fees (Note 3) | | | 245 | |
Payable for fund shares repurchased | | | 266,423 | |
Audit fees payable | | | 31,285 | |
Other payables and accrued expenses | | | 24,788 | |
| | | | |
| |
TOTAL LIABILITIES | | | 479,574 | |
| | | | |
| |
TOTAL NET ASSETS | | $ | 167,399,845 | |
| | | | |
| |
NET ASSETS CONSIST OF: | | | | |
| |
Capital stock | | $ | 143,927 | |
Additional paid-in-capital | | | 150,453,267 | |
Undistributed net investment loss | | | (169 | ) |
Accumulated net realized loss on investments, foreign currency and translation of other assets and liabilities | | | (14,643,870 | ) |
Net unrealized appreciation on investments | | | 31,446,690 | |
| | | | |
| |
TOTAL NET ASSETS | | $ | 167,399,845 | |
| | | | |
| |
NET ASSET VALUE, OFFERING PRICE AND REDEMPTION PRICE PER SHARE - CLASS A ($167,399,845/14,392,678 shares) | | $ | 11.63 | |
| | | | |
| | |
| The accompanying notes are an integral part of the financial statements. | | 9 |
Statement of Operations
For the Year Ended December 31, 2010
| | | | |
INVESTMENT INCOME: | | | | |
| |
Dividends (net of foreign taxes withheld, $45,896) | | $ | 569,714 | |
Interest | | | 297,916 | |
| | | | |
| |
Total Investment Income | | | 867,630 | |
| | | | |
| |
EXPENSES: | | | | |
| |
Management fees (Note 3) | | | 1,614,799 | |
Fund accounting and administration fees (Note 3) | | | 48,336 | |
Transfer agent fees (Note 3) | | | 13,289 | |
Directors’ fees (Note 3) | | | 9,348 | |
Chief Compliance Officer service fees (Note 3) | | | 2,630 | |
Custodian fees | | | 17,094 | |
Miscellaneous | | | 98,874 | |
| | | | |
| |
Total Expenses | | | 1,804,370 | |
Less reduction of expenses (Note 3) | | | (758 | ) |
| | | | |
| |
Net Expenses | | | 1,803,612 | |
| | | | |
| |
NET INVESTMENT LOSS | | | (935,982 | ) |
| | | | |
| |
REALIZED AND UNREALIZED GAIN (LOSS) ON INVESTMENTS: | | | | |
| |
Net realized gain (loss) on Investments | | | 16,824,084 | |
Foreign currency and translation of other assets and liabilities | | | (1,436 | ) |
| | | | |
| |
| | | 16,822,648 | |
| | | | |
| |
Net change in unrealized appreciation on investments | | | 14,923,959 | |
| | | | |
| |
NET REALIZED AND UNREALIZED GAIN ON INVESTMENTS | | | 31,746,607 | |
| | | | |
| |
NET INCREASE IN NET ASSETS RESULTING FROM OPERATIONS | | $ | 30,810,625 | |
| | | | |
| | |
| 10 | | The accompanying notes are an integral part of the financial statements. |
Statements of Changes in Net Assets
| | | | | | | | |
| | | For the Year Ended
12/31/10 | | | For the Year Ended
12/31/09 | |
INCREASE IN NET ASSETS: | | | | | | | | |
| | |
OPERATIONS: | | | | | | | | |
| | |
Net investment loss | | $ | (935,982 | ) | | $ | (1,012,429 | ) |
Net realized gain on investments and foreign currency | | | 16,822,648 | | | | 4,676,879 | |
Net change in unrealized appreciation on investments and foreign currency | | | 14,923,959 | | | | 66,974,543 | |
| | | | | | | | |
| | |
Net increase from operations | | | 30,810,625 | | | | 70,638,993 | |
| | | | | | | | |
| | |
CAPITAL STOCK ISSUED AND REPURCHASED: | | | | | | | | |
| | |
Net decrease from capital share transactions (Note 5) | | | (21,141,317 | ) | | | (36,020,529 | ) |
| | | | | | | | |
| | |
Net increase in net assets | | | 9,669,308 | | | | 34,618,464 | |
| | |
NET ASSETS: | | | | | | | | |
| | |
Beginning of year | | | 157,730,537 | | | | 123,112,073 | |
| | | | | | | | |
| | |
End of year (including undistributed net investment income (loss) of $(169) and $0, respectively) | | $ | 167,399,845 | | | $ | 157,730,537 | |
| | | | | | | | |
| | |
| The accompanying notes are an integral part of the financial statements. | | 11 |
Financial Highlights
| | | | | | | | | | | | | | | | | | | | |
| | | | | | | | | | |
| | | | | | | | | | |
| | | | | | For the Years Ended | | | | |
| | | 12/31/10 | | | 12/31/09 | | | 12/31/08 | | | 12/31/07 | | | 12/31/06 | |
Per share data (for a share outstanding throughout each year): | | | | | | | | | | | | | | | | | | | | |
Net asset value - Beginning of year | | | $9.73 | | | | $6.01 | | | | $11.29 | | | | $10.41 | | | | $8.37 | |
| | | | | | | | | | | | | | | | | | | | |
Income (loss) from investment operations: | | | | | | | | | | | | | | | | | | | | |
Net investment loss | | | (0.06 | )1 | | | (0.05 | )1 | | | (0.05 | ) | | | (0.05 | ) | | | (0.01 | ) |
Net realized and unrealized gain (loss) on investments | | | 1.96 | | | | 3.77 | | | | (5.09 | ) | | | 2.34 | | | | 2.05 | |
| | | | | | | | | | | | | | | | | | | | |
Total from investment operations | | | 1.90 | | | | 3.72 | | | | (5.14 | ) | | | 2.29 | | | | 2.04 | |
| | | | | | | | | | | | | | | | | | | | |
Less distributions to shareholders: | | | | | | | | | | | | | | | | | | | | |
From net realized gain on investments | | | — | | | | — | | | | (0.14 | ) | | | (1.41 | ) | | | — | |
| | | | | | | | | | | | | | | | | | | | |
Net asset value - End of year | | | $11.63 | | | | $9.73 | | | | $6.01 | | | | $11.29 | | | | $10.41 | |
| | | | | | | | | | | | | | | | | | | | |
| | | | | |
Net assets - End of year
(000’s omitted) | | | $167,400 | | | | $157,731 | | | | $123,112 | | | | $227,679 | | | | $167,252 | |
| | | | | | | | | | | | | | | | | | | | |
Total return2 | | | 19.53% | | | | 61.90% | | | | (45.86% | ) | | | 22.55% | | | | 24.37% | |
Ratios (to average net assets)/ Supplemental Data: | | | | | | | | | | | | | | | | | | | | |
Expenses* | | | 1.12% | | | | 1.13% | | | | 1.13% | | | | 1.13% | | | | 1.16% | |
Net investment loss | | | (0.58% | ) | | | (0.68% | ) | | | (0.53% | ) | | | (0.53% | ) | | | (0.14% | ) |
Portfolio turnover | | | 70% | | | | 55% | | | | 65% | | | | 79% | | | | 83% | |
|
*The investment advisor did not impose all or a portion of its management fees, CCO fees, fund accounting and transfer agent fees, and other fees in some years and in some years paid a portion of the Series’ expenses. If these expenses had been incurred by the Series, the expense ratio (to average net assets) would have been increased by the following amounts: | |
| | | | | |
| | | 0.00% | 3 | | | 0.00% | 3 | | | N/A | | | | N/A | | | | N/A | |
1Calculated based on average shares outstanding during the year.
2Represents aggregate total return for the years indicated, and assumes reinvestment of all distributions. Total returns would have been lower had certain expenses not been waived or reimbursed during certain years.
3Less than 0.01%.
| | |
| 12 | | The accompanying notes are an integral part of the financial statements. |
Notes to Financial Statements
Technology Series (the “Series”) is a no-load diversified series of Manning & Napier Fund, Inc. (the “Fund”). The Fund is organized in Maryland and is registered under the Investment Company Act of 1940, as amended, as an open-end management investment company.
The Series’ investment objective is to provide long-term growth by investing principally in the common stocks of companies in technology-based industries.
The Fund’s Advisor is Manning & Napier Advisors, Inc. (the “Advisor”). On August 8, 2000, the Series resumed sales of shares to advisory clients and employees of the Advisor and its affiliates. The Series resumed offering shares directly to investors on May 18, 2004, as it had done previously from time to time. The total authorized capital stock of the Fund consists of 10.0 billion shares of common stock each having a par value of $0.01. As of December 31, 2010, 6.2 billion shares have been designated in total among 29 series, of which 100 million have been designated as Technology Series Class A common stock.
| 2. | SIGNIFICANT ACCOUNTING POLICIES |
Security Valuation
Portfolio securities, including domestic equities, foreign equities, warrants and options, listed on an exchange other than the NASDAQ National Market System are valued at the latest quoted sales price of the exchange on which the security is primarily traded. Securities not traded on valuation date or securities not listed on an exchange are valued at the latest quoted bid price provided by the Fund’s pricing service. Securities listed on the NASDAQ National Market System are valued in accordance with the NASDAQ Official Closing Price.
Debt securities, including corporate bonds, will normally be valued on the basis of evaluated bid prices provided by an independent pricing service. Certain investments in securities held by the Series may be valued on a basis of a price provided directly by a principal market maker. These prices may differ from the value that would have been used had a broader market for securities existed.
Short-term investments that mature in sixty days or less are valued at amortized cost, which approximates market value. Investments in open-end investment companies are valued at their net asset value per share on valuation date.
Volume and level of activity in established markets for an asset or liability are evaluated to determine whether recent transactions and quoted prices are determinative of fair value. Where there have been significant decreases in volume and level of activity, further analysis and adjustment may be necessary to estimate fair value. The Series measures fair value in these instances by the use of inputs and valuation techniques which may be based upon current market prices of securities that are comparable in coupon, rating, maturity and industry and/or expectation of future cash flows. As a result of trading in relatively thin markets and/or markets that experience significant volatility, the prices used by the Series to value these securities may differ from the value that would be realized if these securities were sold, and the differences could be material.
Securities for which representative valuations or prices are not available from the Fund’s pricing service may be valued at fair value. Due to the inherent uncertainty of valuations of such securities, the fair value may differ significantly from the values that would have been used had a ready market for such securities existed. If trading or events occurring after the close of the principal market in which securities are traded are expected to materially affect the value of those securities, then they may be valued at their fair value, taking this trading or these events into account. Fair value is determined in good faith by the Advisor under procedures approved by and under the general supervision and responsibility of the Fund’s Board of Directors (the “Board”). In accordance with the procedures approved by the Board, the Series applies fair value pricing on a daily basis except for North American, Central American, South American and Caribbean equity securities. Fair valuing of securities is determined with the assistance of a pricing
Notes to Financial Statements
| 2. | SIGNIFICANT ACCOUNTING POLICIES (continued) |
Security Valuation (continued)
service using calculations or factors based on indices of domestic securities and other appropriate indicators, such as prices of relevant American Depository Receipts and futures contracts, to adjust local market prices for subsequent movements through the time the Series calculates its net asset value. The value of securities used for the net asset value calculation under the procedures may differ from published prices for the same securities. It is the Fund’s policy to classify each foreign equity security, except for those in the regions noted above, as Level 2 securities due to the fact the pricing service evaluated what factor was applied to the calculated end of day market price.
Various inputs are used in determining the value of the Series’ assets or liabilities carried at market value. These inputs are summarized in three broad levels. Level 1 includes quoted prices in active markets for identical assets and liabilities. Level 2 includes other significant observable inputs (including quoted prices for similar securities, interest rates, prepayment speeds, credit risk, etc.). Level 3 includes significant unobservable inputs (including the Series’ own assumptions in determining the fair value of investments). The inputs or methodology used for valuing securities are not necessarily an indication of the risk associated with investing in those securities.
The following is a summary of the valuation levels used for major security types as of December 31, 2010 in valuing the Series’ assets or liabilities carried at market value:
| | | | | | | | | | | | | | | | |
| Description | | Total | | | Level 1 | | | Level 2 | | | Level 3 | |
Assets: | | | | | | | | | | | | | | | | |
Equity securities* | | $ | 163,279,382 | | | $ | 137,606,416 | | | $ | 25,672,966 | | | $ | — | |
Preferred securities | | | — | | | | — | | | | — | | | | — | |
Debt securities: | | | — | | | | — | | | | | | | | — | |
Corporate debt | | | 2,700,000 | | | | — | | | | 2,700,000 | | | | — | |
Mutual funds | | | 1,754,448 | | | | 1,754,448 | | | | — | | | | — | |
Other financialinstruments**: | | | — | | | | — | | | | — | | | | — | |
| | | | | | | | | | | | | | | | |
Total assets: | | | 167,733,830 | | | | 139,360,864 | | | | 28,372,966 | | | | — | |
| | | | | | | | | | | | | | | | |
Liabilities: | | | | | | | | | | | | | | | | |
Other financial instruments**: | | | — | | | | — | | | | — | | | | — | |
| | | | | | | | | | | | | | | | |
Total liabilities: | | | — | | | | — | | | | — | | | | — | |
| | | | | | | | | | | | | | | | |
Total | | $ | 167,733,830 | | | $ | 139,360,864 | | | $ | 28,372,966 | | | $ | — | |
| | | | | | | | | | | | | | | | |
*Includes common stock, warrants and rights. Please see the Investment Portfolio for industry classification and for securities where an International Fair Value factor from the pricing service was applied to value the security. Such securities are included in Level 2 in the table above.
**Other financial instruments are derivative instruments not reflected in the Investment Portfolio, such as futures, forwards and swap contracts, which are valued at the unrealized appreciation/depreciation on the instrument. As of December 31, 2010, the Series did not hold any derivative instruments.
There were no Level 3 securities held by the Series as of December 31, 2009 or December 31, 2010.
The Fund’s policy is to recognize transfers in and transfers out of the valuation levels as of the beginning of the reporting period. During the year ended December 31, 2010, the Fund had three foreign equity securities transfer from Level 1 to Level 2 due to the implementation of new international fair value pricing procedures. The following is a summary of the foreign equity securities that transferred from Level 1 to Level 2:
Notes to Financial Statements
| 2. | SIGNIFICANT ACCOUNTING POLICIES (continued) |
Security Valuation (continued)
| | | | | | | | | | | | |
Total # Securities Level 1 at beginning and Level 2 at end of period | | Total Market Value Beginning of period | | | Total Market Value End of period | | | Change in Market Value | |
3 | | $ | 13,971,009 | | | $ | 11,778,448 | | | $ | (2,192,561 | ) |
Additional disclosure surrounding the activity in Level 3 fair value measurement will be effective for fiscal years beginning after December 15, 2010. Management has concluded that this will not have a material impact on the Series’ financial statements.
Security Transactions, Investment Income and Expenses
Security transactions are accounted for on trade date. Dividend income is recorded on the ex-dividend date, except that if the ex-dividend date has passed, certain dividends from foreign securities are recorded as soon as the Fund is informed of the ex-dividend date. Non-cash dividends, if any, are recorded at the fair market value of the securities received. Interest income, including amortization of premium and accretion of discounts using the effective interest method, is earned from settlement date and accrued daily.
Expenses are recorded on an accrual basis. Most expenses of the Fund can be attributed to a specific series. Expenses which cannot be directly attributed are apportioned among the series in the Fund in such a manner as deemed equitable by the Fund’s Board, taking into consideration, among other things, the nature and type of expense.
The Series uses the identified cost method for determining realized gain or loss on investments for both financial statement and federal income tax reporting purposes.
Foreign Currency Translation
The books and records of the Series are maintained in U.S. dollars. Foreign currencies, investments and other assets and liabilities are translated into U.S. dollars at the current exchange rates. Purchases and sales of investment securities and income and expenses are translated on the respective dates of such transactions. The Series does not isolate realized and unrealized gains and losses attributable to changes in the exchange rates from gains and losses that arise from changes in the market value of investments. Such fluctuations are included with net realized and unrealized gain or loss on investments. Net realized foreign currency gains and losses represent foreign currency gains and losses between trade date and settlement date on securities transactions, gains and losses on disposition of foreign currencies and the difference between the amount of income and foreign withholding taxes recorded on the books of the Series and the amounts actually received or paid.
Federal Taxes
The Series’ policy is to comply with the provisions of the Internal Revenue Code applicable to regulated investment companies. The Series is not subject to federal income tax or excise tax to the extent that the Series distributes to shareholders each year its taxable income, including any net realized gains on investments, in accordance with requirements of the Internal Revenue Code. Accordingly, no provision for federal income tax or excise tax has been made in the financial statements.
Management evaluates its tax positions to determine if the tax positions taken meet the minimum recognition threshold in connection with accounting for uncertainties in income tax positions taken or expected to be taken for the purposes of measuring and recognizing tax liabilities in the financial statements. Recognition of tax benefits of an uncertain tax position is required only when the position is “more likely than not” to be sustained assuming examination by
Notes to Financial Statements
| 2. | SIGNIFICANT ACCOUNTING POLICIES (continued) |
Federal Taxes (continued)
taxing authorities. At December 31, 2010, the Series has recorded no liability for net unrecognized tax benefits relating to uncertain income tax positions taken or expected to be taken in future tax returns.
The Series files income tax returns in the U.S. federal jurisdiction, various states and foreign jurisdictions, as required. No income tax returns are currently under investigation. The statute of limitations on the Series’ tax returns remains open for the years ended December 31, 2007 through December 31, 2010. The Fund is not aware of any tax positions for which it is reasonably possible that the total amounts of unrecognized tax benefits will significantly change in the next twelve months.
Additionally, based on the Fund’s understanding of the tax rules and rates related to income, gains and transactions for foreign jurisdictions in which it invests, the Series will provide for foreign taxes, and where appropriate, deferred foreign tax.
Distributions of Income and Gains
Distributions to shareholders of net investment income and net realized gains are made annually. An additional distribution may be necessary to avoid taxation of the Series. Distributions are recorded on the ex-dividend date.
Indemnifications
The Fund’s organizational documents provide former and current directors and officers with a limited indemnification against liabilities arising in connection with the performance of their duties to the Fund. In the normal course of business, the Fund may also enter into contracts that provide general indemnifications. The Fund’s maximum exposure under these arrangements is unknown as this would be dependent on future claims that may be made against the Fund. The risk of material loss from such claims is considered remote.
Other
The preparation of financial statements in conformity with accounting principles generally accepted in the United States of America requires management to make estimates and assumptions that affect the reported amounts of assets and liabilities and the disclosure of contingent assets and liabilities at the date of the financial statements and the reported amounts of income and expenses during the reporting period. Actual results could differ from those estimates.
| 3. | TRANSACTIONS WITH AFFILIATES |
The Fund has an Investment Advisory Agreement (the “Agreement”) with the Advisor, for which the Series pays a fee, computed daily and payable monthly, at an annual rate of 1.00% of the Series’ average daily net assets.
Under the Agreement, personnel of the Advisor provide the Series with advice and assistance in the choice of investments and the execution of securities transactions, and otherwise maintain the Series’ organization. The Advisor also provides the Fund with necessary office space and fund administration and support services. The salaries of all officers of the Fund (except a percentage of the Fund’s Chief Compliance Officer’s salary, which is paid by the Fund), and of all Directors who are “affiliated persons” of the Fund, or of the Advisor, and all personnel of the Fund, or of the Advisor, performing services relating to research, statistical and investment activities, are paid by the Advisor. Each “non-affiliated” Director receives an annual stipend, which is allocated among all the active series of the Fund. In addition, these Directors also receive a fee per Board meeting attended plus a fee for each committee meeting attended.
The Advisor has contractually agreed, until at least April 30, 2012, to waive its fee and, if necessary, pay other operating expenses of the Series in order to maintain total direct annual fund operating expenses for the Series at no more than 1.20% of average daily net assets each year. For the year ended December 31, 2010, the Advisor voluntarily
Notes to Financial Statements
| 3. | TRANSACTIONS WITH AFFILIATES (continued) |
waived fees of $758, which is included as a reduction of expenses on the Statement of Operations. The Advisor is not eligible to recoup any expenses that have been waived or reimbursed in prior years.
Manning & Napier Investor Services, Inc., a registered broker-dealer affiliate of the Advisor, acts as distributor for the Fund’s shares. The services of Manning & Napier Investor Services, Inc. are provided at no additional cost to the Series.
The Advisor has agreements with PNC Global Investment Servicing (U.S.) Inc. (“PNCGIS”) under which PNCGIS serves as sub-accountant services agent and sub-transfer agent. The Fund pays the Advisor an annual fee related to fund accounting and administration of 0.0175% on the first $3 billion of average daily net assets (excluding Target Series); 0.015% on the next $3 billion of average daily net assets (excluding Target Series); and 0.01% of the average daily net assets in excess of $6 billion (excluding Target Series); plus a base fee of $25,500 per Series.Transfer Agent fees are charged to the Fund on a per account basis. Additionally, certain transaction- and cusip-based fees and out-of-pocket expenses, including charges for reporting relating to the Fund’s compliance program, are charged.
Effective July 1, 2010, PNCGIS was sold to The Bank of New York Mellon Corporation, the Series’ custodian. At the close of the sale, PNCGIS changed its name to BNY Mellon Investment Servicing (U.S.) Inc. (“BNY”).
Expenses not directly attributable to a Series are allocated based on each Series’ relative net assets or number of accounts, depending on the expense.
| 4. | PURCHASES AND SALES OF SECURITIES |
For the year ended December 31, 2010, purchases and sales of securities, other than U.S. Government securities and short-term securities, were $103,664,949 and $112,200,278 respectively. There were no purchases or sales of U.S. Government securities.
| 5. | CAPITAL STOCK TRANSACTIONS |
Transactions in shares of Technology Series were:
| | | | | | | | | | | | | | | | |
| | | For the Year Ended 12/31/10 | | | For the Year Ended 12/31/09 | |
| | | Shares | | | Amount | | | Shares | | | Amount | |
Sold | | | 1,704,514 | | | $ | 17,060,290 | | | | 1,678,722 | | | $ | 12,866,101 | |
Reinvested | | | — | | | | — | | | | — | | | | — | |
Repurchased | | | (3,526,619 | ) | | | (38,201,607 | ) | | | (5,953,766 | ) | | | (48,886,630 | ) |
| | | | | | | | | | | | | | | | |
Total | | | (1,822,105 | ) | | $ | (21,141,317 | ) | | | (4,275,044 | ) | | $ | (36,020,529 | ) |
| | | | | | | | | | | | | | | | |
Substantially all of the Series’ shares represent investments by fiduciary accounts over which the Advisor has sole investment discretion.
The Series may trade in instruments including written and purchased options, forward foreign currency exchange contracts and futures contracts and other derivatives in the normal course of investing activities to assist in managing exposure to various market risks. Investments in these instruments may subject the Series to various elements of risk, which may involve, to a varying degree, elements of risk in excess of the amounts recognized for financial statement purposes. These risks include: the risk that changes in the value of a derivative may not correlate perfectly
Notes to Financial Statements
| 6. | FINANCIAL INSTRUMENTS (continued) |
with the underlying asset, rate or index, counterparty credit risk related to over the counter derivatives counterparties’ failure to perform under contract terms, liquidity risk related to the lack of a liquid market for these contracts allowing the fund to close out its position(s) and documentation risk relating to disagreement over contract terms. No such investments were held by the Series during the year ended December 31, 2010.
Investing in securities of foreign companies and foreign governments involves special risks and considerations not typically associated with investing in securities of domestic companies and the U.S. Government. These risks include revaluation of currencies and future adverse political and economic developments. Moreover, securities of foreign companies and foreign governments and their markets may be less liquid and their prices more volatile than those of comparable domestic companies and the U.S. Government.
The Series may focus its investments in certain related technology industries; hence, the Series may subject itself to a greater degree of risk than a series that is more diversified.
| 9. | FEDERAL INCOME TAX INFORMATION |
The amount and characterization of certain income and capital gains to be distributed are determined in accordance with federal income tax regulations, which may differ from accounting principles generally accepted in the United States of America. These differences are primarily due to differing book and tax treatments in the timing of the recognition of net investment income or gains and losses, including net operating losses, foreign currency gains and losses, losses deferred due to wash sales and post-October losses. The Series may periodically make reclassifications among its capital accounts to reflect income and gains available for distribution (or available capital loss carryovers) under income tax regulations without impacting the Series’ net asset value. Any such reclassifications are not reflected in the financial highlights.
There were no distributions to shareholders for the years ended December 31, 2010 or December 31, 2009.
For the year ended December 31, 2010, the Series elected to defer $169 of currency losses, attributable to post-October losses.
At December 31, 2010, the tax basis of distributable earnings and the net unrealized appreciation based on the identified cost for federal income tax purposes were as follows:
| | | | | | |
Cost for federal income tax purposes | | $ | 136,399,096 | | | |
Unrealized appreciation | | $ | 35,210,118 | | | |
Unrealized depreciation | | | (3,875,384 | ) | | |
| | | | | | |
Net unrealized appreciation | | $ | 31,334,734 | | | |
| | | | | | |
Capital loss carryover | | | 14,531,914 | | | |
At December 31, 2010, the capital loss carryover, disclosed above, available to the extent allowed by tax law to offset future net capital gain, if any, will expire as follows:
| | | | | | |
| | | Loss Carryover | | Expiration Date | |
| | $3,181,311 | | | December 31,2016 | |
| | $11,350,603 | | | December 31,2017 | |
The capital loss carryover utilized in the current year was $16,462,115.
Report of Independent Registered Public Accounting Firm
To the Board of Directors of Manning & Napier Fund, Inc. and Shareholders of Technology Series:
In our opinion, the accompanying statement of assets and liabilities, including the investment portfolio, and the related statements of operations and of changes in net assets and the financial highlights present fairly, in all material respects, the financial position of the Technology Series (a series of Manning & Napier Fund, Inc., hereafter referred to as the “Series”) at December 31, 2010, and the results of its operations for the year then ended, the changes in its net assets for each of the two years in the period then ended and the financial highlights for each of the five years in the period then ended, in conformity with accounting principles generally accepted in the United States of America. These financial statements and financial highlights (hereafter referred to as “financial statements”) are the responsibility of the Series’ management. Our responsibility is to express an opinion on these financial statements based on our audits. We conducted our audits of these financial statements in accordance with the standards of the Public Company Accounting Oversight Board (United States). Those standards require that we plan and perform the audit to obtain reasonable assurance about whether the financial statements are free of material misstatement. An audit includes examining, on a test basis, evidence supporting the amounts and disclosures in the financial statements, assessing the accounting principles used and significant estimates made by management, and evaluating the overall financial statement presentation. We believe that our audits, which included confirmation of securities at December 31, 2010 by correspondence with the custodian, provide a reasonable basis for our opinion.
New York, New York
February 22, 2011
Renewal of Investment Advisory Agreement (unaudited)
At the Manning & Napier Fund, Inc. (the “Fund”) Board of Directors’ (the “Board”) meeting, held on November 17, 2010, the Investment Advisory Agreement (the “Agreement”) between the Fund and Manning & Napier Advisors, Inc. (the “Advisor”) was reviewed by the Board for renewal. In connection with the decision whether to renew the Agreement, a variety of material was prepared for and reviewed by the Board.
Representatives of the Advisor attended the meeting and presented additional oral and written information to the Board to assist the Board in its considerations. The discussion immediately below outlines the materials and information presented to the Board in connection with the Board’s 2010 Annual Review of the Agreement and the conclusions made by the Directors when determining to continue the Agreement.
| | • | | The Board considered the services provided by the Advisor under the Agreement including, among others: deciding what securities to purchase and sell for each Series; arranging for the purchase and sale of such securities by placing orders with broker-dealers; administering the affairs of the Fund (including the books and records of the Fund not maintained by third party service providers such as the custodian or sub-transfer agent); arranging for the insurance coverage for the Fund; and supervising the preparation of tax returns, SEC filings (including registration statements) and reports to shareholders for the Fund. The Board also considered the nature and quality of such services provided under the Agreement in light of the Advisor’s services provided to the Fund for 24 years. The Board discussed the quality of these services with representatives from the Advisor and concluded that the Advisor was performing its services to the Fund required under the Agreement in a reasonable manner. |
| | • | | The Board considered the investment performance of the various Series of the Fund. The investment performance for each Series was reviewed on a cumulative basis since inception and on a one year basis. In addition, annualized performance for the following time periods was considered: inception, three year, five year, ten year, and current market cycle. A market cycle includes periods of both rising and falling markets. Returns for established benchmark indices for each Series were provided for each time period. The Board noted that the various Series were competitive against their respective benchmarks and/or peer groups over various time periods, but in particular over the full market cycle period relevant for the Series. In addition, the Board considered at the meeting (and considers on a quarterly basis) a peer group performance analysis consisting of Morningstar universes of mutual funds with similar investment objectives. The Board discussed the performance with representatives from the Advisor and concluded that the investment performance of each of the Fund’s Series was reasonable based on the Fund’s actual performance and comparative performance, especially performance over the current market cycle. |
| | • | | The Board considered the costs of the Advisor’s services and the profits of the Advisor as they relate to the Advisor’s services to the Fund under the Agreement. In reviewing the Advisor’s costs and profits, the Board discussed the Advisor’s revenues generated from the Fund (on both an actual and adjusted basis) and its expenses associated with providing the services under the Agreement. In addition, the Board reviewed the Advisor’s expenses associated with Fund activities outside of the Agreement (such as expense reimbursements pursuant to expense caps and payments made by the Advisor to third party platforms on which shares of the Fund are available for purchase). It was noted by representatives of the Advisor that 11 of the 27 active Series of the Fund are currently experiencing expenses above the capped expense ratios. After discussing the above costs and profits, the Board concluded that the Advisor’s profitability relating to its services provided under the Agreement was reasonable. |
| | • | | The Board considered the fees and expenses of the various Series of the Fund. The Advisor presented the advisory fees and total expenses for each Series, including the advisory fee adjusted for any expense waivers or reimbursements (either contractual or voluntary) paid by the Advisor. The advisory fees and expense ratios of each Series were compared to an average (on both a mean and median basis) of similar funds as disclosed on the Morningstar database. Representatives of the Advisor discussed with the Board the levels of its advisory |
Renewal of Investment Advisory Agreement (unaudited)
fee for each Series of the Fund and as compared to the median and mean advisory fees for similar funds as listed on Morningstar. Expense ratios for every Series, except the Pro-Blend’s Class R and Class C, and Target Class R and Class C, are currently below the median and mean for similar funds as listed on Morningstar. Based on their review of the information provided, the Board concluded that the fees and expenses of each Series of the Fund were reasonable on a comparative basis.
| | • | | The Board also considered the other benefits the Advisor derives from its relationship with the Fund. Such other benefits include certain research products provided by soft dollars. Given the level of soft dollar transactions involving the Fund, the Board concluded that these additional benefits to the Advisor were reasonable. |
| | • | | In addition to the factors described above, the Board considered the Advisor’s personnel, investment strategies, policies and procedures relating to compliance with personal securities transactions, and reputation, expertise and resources in domestic and foreign financial markets. The Board concluded that these factors support the conclusion that the Advisor performs its services in a reasonable manner. |
| | • | | The Board did not consider economies of scale at this time because of the multiple uses of the Fund (for the Advisor’s discretionary investment account clients in addition to direct investors), the current profitability of the Advisor’s services to the Fund under the Agreement, and the overall size of the Fund complex. |
Based on the Board’s deliberations and their evaluation of the information described above, the Board, including a majority of Directors that are not “interested persons” as defined in the Investment Company Act of 1940, concluded that the compensation under the Agreement was fair and reasonable in light of the services and expenses and such other matters as the Directors considered to be relevant in the exercise of their reasonable judgment. Accordingly, the Board approved the renewal of the Agreement. In the course of their deliberations, the Directors did not identify any particular information that was all important or controlling.
Directors’ and Officers’ Information (unaudited)
The Statement of Additional Information provides additional information about the Fund’s directors and officers and can be obtained without charge by calling 1-800-466-3863, at www.manningnapieradvisors.com, or on the EDGAR Database on the SEC Internet web site (http:// www.sec.gov). The following chart shows certain information about the Fund’s officers and directors, including their principal occupations during the last five years. Unless specific dates are provided, the individuals have held the listed positions for longer than five years.
INTERESTED DIRECTOR/OFFICER
| | |
Name: | | B. Reuben Auspitz* |
Address: | | 290 Woodcliff Drive Fairport, NY 14450 |
Age: | | 63 |
Current Position(s) Held with Fund: | | Principal Executive Officer, President, Chairman & Director |
Term of Office1 & Length of Time Served: | | Indefinite - Director since 1984; Vice President 1984 - 2003; President since 2004; Principal Executive Officer since 2002 |
Principal Occupation(s) During Past 5 Years: | | Executive Vice President; Executive Group Member**; Chief Compliance Officer since 2004; Vice Chairman since June 2010; Co-Executive Director from 2003-2010 - Manning & Napier Advisors, Inc. President; Director - Manning & Napier Investor Services, Inc. Holds or has held one or more of the following titles for various subsidiaries and affiliates: President, Vice President, Director, Chairman, Treasurer, Chief Compliance Officer or Member. |
Number of Portfolios Overseen within Fund Complex: | | 29 |
Other Directorships Held Outside Fund Complex: | | N/A |
INDEPENDENT DIRECTORS | | |
| |
Name: | | Paul A. Brooke |
Address: | | 290 Woodcliff Drive Fairport, NY 14450 |
Age: | | 65 |
Current Position(s) Held with Fund: | | Director, Audit Committee Member, Governance & Nominating Committee Member |
Term of Office & Length of Time Served: | | Indefinite - Since 2007 |
Principal Occupation(s) During Past 5 Years: | | Chairman & CEO, Alsius Corp. (investments); Managing Member, PMSV Holdings LLC (investments) |
Number of Portfolios Overseen within Fund Complex: | | 29 |
Other Directorships Held Outside Fund Complex: | | Incyte Corp. (2000-present) ViroPharma, Inc. (2000-present) HLTH Corp. (2000-present) Cheyne Capital International (2000-present) MPM Bio-equities (2000-present) GMP Companies (2000-present) HoustonPharma (2000-present) |
Name: | | Richard M. Hurwitz |
Address: | | 290 Woodcliff Drive Fairport, NY 14450 |
Age: | | 47 |
Current Position(s) Held with Fund: | | Director, Audit Committee Member, Governance & Nominating Committee Member |
Term of Office & Length of Time Served: | | Indefinite - Since 2009 |
Principal Occupation(s) During Past 5 Years: | | Chief Executive Officer, Pictometry International Corp. since August 2010 (provider of georeferenced, aerial image libraries and related software) Managing Partner (2006-July 2010) - Aegis Investment Partners, LLC (investments); Founder and Managing Partner (2004-2005) - Village Markets, LLC (groceries) |
Number of Portfolios Overseen within Fund Complex: | | 29 |
Other Directorships Held Outside Fund Complex: | | Pictometry International Corp. (2000-2010) Pioneering Technologies (2006-2009) Vensearch Capital Corp. (2003-2007) |
Directors’ and Officers’ Information (unaudited)
| | |
INDEPENDENT DIRECTORS (continued) |
| |
Name: | | Stephen B. Ashley |
Address: | | 290 Woodcliff Drive Fairport, NY 14450 |
Age: | | 70 |
Current Position(s) Held with Fund: | | Director, Audit Committee Member, Governance & Nominating Committee Member |
Term of Office & Length of Time Served: | | Indefinite - Since 1996 |
Principal Occupation(s) During Past 5 Years: | | Chairman, Director, President & Chief Executive Officer, The Ashley Group (property management and investment). Chairman (non-executive) 2004-2008; Director 1995-2008 - Fannie Mae (mortgage) |
Number of Portfolios Overseen within Fund Complex: | | 29 |
Other Directorships Held Outside Fund Complex: | | The Ashley Group (1995-2008) Genesee Corporation (1987-2007) |
Name: | | Peter L. Faber |
Address: | | 290 Woodcliff Drive Fairport, NY 14450 |
Age: | | 72 |
Current Position(s) Held with Fund: | | Director, Governance & Nominating Committee Member |
Term of Office & Length of Time Served: | | Indefinite - Since 1987 |
Principal Occupation(s) During Past 5 Years: | | Senior Counsel since 2006, Partner (1995 - 2006) - McDermott, Will & Emery LLP (law firm) |
Number of Portfolios Overseen within Fund Complex: | | 29 |
Other Directorships Held Outside Fund Complex: | | Partnership for New York City, Inc. (non-profit) New York Collegium (non-profit) Boston Early Music Festival (non-profit) |
Name: | | Harris H. Rusitzky |
Address: | | 290 Woodcliff Drive Fairport, NY 14450 |
Age: | | 76 |
Current Position(s) Held with Fund: | | Director, Audit Committee Member, Governance & Nominating Committee Member |
Term of Office & Length of Time Served: | | Indefinite - Since 1985 |
Principal Occupation(s) During Past 5 Years: | | President, The Greening Group (business consultants) since 1994; Partner, The Restaurant Group (restaurants) since 2006 |
Number of Portfolios Overseen within Fund Complex: | | 29 |
Other Directorships Held Outside Fund Complex: | | N/A |
OFFICERS | | |
| |
Name: | | Jeffrey S. Coons, Ph.D., CFA |
Address: | | 290 Woodcliff Drive Fairport, NY 14450 |
Age: | | 47 |
Current Position(s) Held with Fund: | | Vice President |
Term of Office1 & Length of Time Served: | | Since 2004 |
Principal Occupation(s) During Past 5 Years: | | President since 2010, Co-Director of Research since 2002, Executive Group Member** since 2003, - Manning & Napier Advisors, Inc. Holds one or more of the following titles for various subsidiaries and affiliates: President, Director, Treasurer or Senior Trust Officer. |
Number of Portfolios Overseen within Fund Complex: | | 29 |
Other Directorships Held Outside Fund Complex: | | N/A |
Directors’ and Officers’ Information (unaudited)
OFFICERS (continued)
| | |
Name: | | Beth Galusha |
Address: | | 290 Woodcliff Drive Fairport, NY 14450 |
Age: | | 49 |
Current Position(s) Held with Fund: | | Assistant Chief Financial Officer |
Term of Office1 & Length of Time Served: | | Assistant Chief Financial Officer since 2010 |
Principal Occupation(s) During Past 5 Years: | | Chief Financial Officer and Treasurer, Manning & Napier Advisors, Inc. Holds one or more of the following titles for various affiliates: Chief Financial Officer, Director, or Treasurer |
Number of Portfolios Overseen within Fund Complex: | | 29 |
Other Directorships Held Outside Fund Complex: | | N/A |
Name: | | Christine Glavin |
Address: | | 290 Woodcliff Drive Fairport, NY 14450 |
Age: | | 44 |
Current Position(s) Held with Fund: | | Principal Financial Officer, Chief Financial Officer |
Term of Office1 & Length of Time Served: | | Principal Financial Officer since 2002; Chief Financial Officer since 2001 |
Principal Occupation(s) During Past 5 Years: | | Fund Reporting Manager, Manning & Napier Advisors, Inc. since 1997 |
Number of Portfolios Overseen within Fund Complex: | | 29 |
Other Directorships Held Outside Fund Complex: | | N/A |
Name: | | Jodi L. Hedberg |
Address: | | 290 Woodcliff Drive Fairport, NY 14450 |
Age: | | 43 |
Current Position(s) Held with Fund: | | Corporate Secretary, Chief Compliance Officer, Anti-Money Laundering Compliance Officer |
Term of Office1 & Length of Time Served: | | Corporate Secretary since 1997; Chief Compliance Officer since 2004 |
Principal Occupation(s) During Past 5 Years: | | Director of Compliance, Manning & Napier Advisors, Inc. and affiliates since 1990 (title change in 2005 from Compliance Manager to Director of Compliance); Corporate Secretary, Manning & Napier Investor Services, Inc. since 2006 |
Number of Portfolios Overseen within Fund Complex: | | 29 |
Other Directorships Held Outside Fund Complex: | | N/A |
Name: | | Richard Yates |
Address: | | 290 Woodcliff Drive |
| | Fairport, NY 14450 |
Age: | | 45 |
Current Position(s) Held with Fund: | | Chief Legal Officer |
Term of Office1 & Length of Time Served: | | Chief Legal Officer since 2004 |
Principal Occupation(s) During Past 5 Years: | | Counsel - Manning & Napier Advisors, Inc. & affiliates since 2000; Holds one or more of the following titles for various affiliates; Director or Corporate Secretary |
Number of Portfolios Overseen within Fund Complex: | | 29 |
Other Directorships Held Outside Fund Complex: | | N/A |
*Interested Director, within the meaning of the Investment Company Act of 1940 by reason of his position with the Fund’s investment advisor and distributor. Mr. Auspitz serves as the Executive Vice President and Director, Manning & Napier Advisors, Inc. and President and Director, Manning & Napier Investor Services, Inc., the Fund’s distributor.
**Prior to June 2010, the Executive Group, consisting of senior executive employee-owners, performed the duties of the Office of the Chief Executive of the Advisor. Effective June 2010, the Executive Group serves as an advisory board to the Chief Executive Officer.
1The term of office for President, Vice President, Chief Financial Officer, Assistant Chief Financial Officer, Chief Legal Officer and Corporate Secretary is one year and until their respective successors are chosen and qualified. All other officers’ terms are indefinite.
This Page Intentionally Left Blank
25
Literature Requests (unaudited)
Proxy Voting Policies and Procedures
A description of the policies and procedures that the Fund uses to determine how to vote proxies relating to portfolio securities is available, without charge, upon request:
| | | | |
By phone | | 1-800-466-3863 | | |
On the Securities and Exchange Commission’s (SEC) web site | | http://www.sec.gov | | |
Proxy Voting Record
Information regarding how the Fund voted proxies relating to portfolio securities during the most recent 12-month period ended June 30th is available, without charge, upon request:
| | | | |
By phone | | 1-800-466-3863 | | |
On the SEC’s web site | | http://www.sec.gov | | |
Quarterly Portfolio Holdings
The Series’ complete schedule of portfolio holdings for the 1st and 3rd quarters of each fiscal year are provided on Form N-Q, and are available, without charge, upon request:
| | | | |
By phone | | 1-800-466-3863 | | |
On the SEC’s web site | | http://www.sec.gov | | |
The Series’ Form N-Q may be reviewed and copied at the SEC’s Public Reference Room in Washington, D.C. Information on the operation of the Public Reference Room may be obtained by calling 1-800-SEC-0330.
Prospectus and Statement of Additional Information (SAI)
The prospectus and SAI provide additional information about each Series, including charges, expenses and risks. These documents are available, without charge, upon request:
| | |
By phone | | 1-800-466-3863 |
On the SEC’s web site | | http://www.sec.gov |
On the Advisor’s web site | | http://www.manning-napier.com |
Additional information available at www.manning-napier.com
1. Fund Holdings - Month-End
2. Fund Holdings - Quarter-End
3. Shareholder Report - Annual
4. Shareholder Report - Semi-Annual
MNTEC-12/10-AR

Management Discussion and Analysis (unaudited)
Dear Shareholders:
Over the course of 2010, the markets experienced several ups and downs driven by well-defined swings in investor sentiment. Optimism fueled strong market returns early in the year, as upbeat economic releases led investors to believe in the potential for a robust U.S. recovery. However, sentiment shifted drastically in May and June as more negative economic news and issues related to Europe’s government debt problems led to notable stock market losses. In another swing, the markets rebounded in the fall amid better economic developments and prospects that the Federal Reserve would enact another round of quantitative easing. That rally generally continued through the end of the year as the markets reacted positively to the U.S. tax compromise, which extended the Bush-era tax cuts for all income brackets.
With equities posting double-digit gains in the third and fourth quarters, the choppy year ended on a strong note, and broad equity indices have now produced back-to-back years of positive results. For the twelve months ending December 31, 2010, the S&P 500 Index returned 15.07%, while the S&P 500 Financial Services Index earned 12.17%. With a return of 6.56% during 2010, the Financial Services Series lagged behind the broad market and the sector-specific benchmark.
In the volatile market environment of 2010, Manning & Napier maintained a selective investment approach and focused on companies that we believe can grow market share. We continued to emphasize quality, targeting best-in-class companies expected to generate sales growth despite a muted economic backdrop, as well as “away game winners” expected to successfully compete in faster-growing markets overseas. Specifically, the Financial Services Series has invested in institutions that are well capitalized and have firm profitability, which we believe should allow them to take market share as weaker competitors struggle in the difficult credit environment.
Over the past year, the Series increased exposure to diversified financial services and commercial banks. Focusing on institutions with strong capital and deposit bases, the Advisor looked to invest in those companies that could benefit from the challenging banking environment through loan growth and market share gains. We favored financial institutions that operate in faster-growing Emerging Markets, and thus the Series added exposure to international companies during 2010. During the latter half of the year, the Series trimmed positions in the insurance industry.
Stock selection decisions in the insurance and capital markets industries aided the Financial Services Series’ relative results over the last twelve months. However, security selections in the IT services and commercial banking industries hurt relative returns. An underweight to Real Estate Investment Trusts (REITS) versus the benchmark also detracted from relative performance.
While economic developments turned more optimistic toward the end of 2010, the global economy still faces significant headwinds, including high consumer and government debt burdens. Given these long-term structural issues, the slow growth environment in the developed world will likely remain a reality. As the markets fluctuated around this slow growth trend in 2010, Manning & Napier earned solid returns by staying focused on the fundamentals and maintaining our selective investment process. This investment approach has proved beneficial over the past 40 years, and we believe these qualities will remain important as the market environment unfolds in 2011.
As always, we appreciate your business.
Sincerely,
Manning & Napier Advisors, Inc.
1
Performance Update as of December 31, 2010 (unaudited)
| | | | | | | | |
| | | | | | Average Annual Total Returns As of December 31, 2010 | | |
| | | One Year | | | Five Year | | Since Inception1 |
Manning & Napier Fund, Inc. - Financial Services Series2 | | | 6.56% | | | -7.89% | | -5.98% |
S&P 500 Total Return Index3 | | | 15.07% | | | 2.30% | | 3.14% |
S&P 500 Financials Index3 | | | 12.17% | | | -10.56% | | -8.22% |
The following graph compares the value of a $10,000 investment in the Manning & Napier Fund, Inc. - Financial Services Series from its inception1 (7/1/05) to present (12/31/10) to the S&P 500 Total Return Index and the S&P 500 Financials Index.
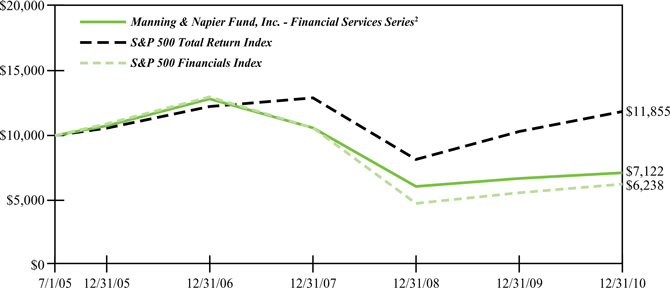
1Performance numbers for the Series and Indices are calculated from July 1, 2005, the Series’ inception date.
2The Series’ performance does not reflect the deduction of taxes that a shareholder would pay on fund distributions or the redemption of shares. The Series’ performance is historical and may not be indicative of future results. The performance returns shown are inclusive of the net expense ratio of the Series. For the year ended December 31, 2010, this net expense ratio was 1.14%. The gross expense ratio, which does not account for any voluntary or contractual waivers currently in effect, was 1.14% for the year ended December 31, 2010.
3The S&P 500 Total Return Index is an unmanaged capitalization-weighted measure of 500 widely held common stocks listed on the New York Stock Exchange, American Stock Exchange and the Over-the-Counter market. The S&P 500 Financials Index, a sub-index of the S&P 500 Total Return Index, includes the stocks of companies involved in the business of financial related products and services. Both Indices’ returns assume daily reinvestment of dividends and, unlike Series returns, do not reflect any fees or expenses.
Shareholder Expense Example (unaudited)
As a shareholder of the Series, you may incur two types of costs: (1) transaction costs and (2) ongoing costs, including management fees and other Series expenses. This example is intended to help you understand your ongoing costs (in dollars) of investing in the Series and to compare these costs with the ongoing costs of investing in other mutual funds.
The example is based on an investment of $1,000 invested at the beginning of the period and held for the entire period (July 1, 2010 to December 31, 2010).
Actual Expenses
The first line of the table below provides information about actual account values and actual expenses. You may use the information in this line, together with the amount you invested, to estimate the expenses that you paid over the period. Simply divide your account value by $1,000 (for example, an $8,600 account value divided by $1,000 = 8.6), then multiply the result by the number in the first line under the heading entitled “Expenses Paid During Period” to estimate the expenses you paid on your account during this period.
Hypothetical Example for Comparison Purposes
The second line of the table below provides information about hypothetical account values and hypothetical expenses based on the Series’ actual expense ratio and an assumed rate of return of 5% per year before expenses, which is not the Series’ actual return. The hypothetical account values and expenses may not be used to estimate the actual ending account balance or expenses you paid during the period. You may use this information to compare the ongoing costs of investing in the Series and other funds. To do so, compare this 5% hypothetical example with the 5% hypothetical examples that appear in the shareholder reports of the other funds.
Please note that the expenses shown in the table are meant to highlight your ongoing costs only and do not reflect any transaction costs. Therefore, the second line of the table is useful in comparing ongoing costs only, and will not help you determine the relative total costs of owning different funds. In addition, if these transaction costs were included, your costs would have been higher.
| | | | | | |
| | | Beginning Account Value
7/1/10 | | Ending Account Value
12/31/10 | | Expenses Paid During Period*
7/1/10-12/31/10 |
Actual | | $1,000.00 | | $1,164.20 | | $6.27 |
Hypothetical | | | | | | |
(5% return before expenses) | | $1,000.00 | | $1,019.41 | | $5.85 |
*Expenses are equal to the Series’ annualized expense ratio (for the six-month period) of 1.15%, multiplied by the average account value over the period, multiplied by 184/365 (to reflect the one-half year period). Expenses are based on the most recent fiscal half year; therefore, the expense ratio stated above may differ from the expense ratio stated in the financial highlights, which is based on one-year data. The Series’ total return would have been lower had certain expenses not been waived during the period.
Portfolio Composition as of December 31, 2010 (unaudited)
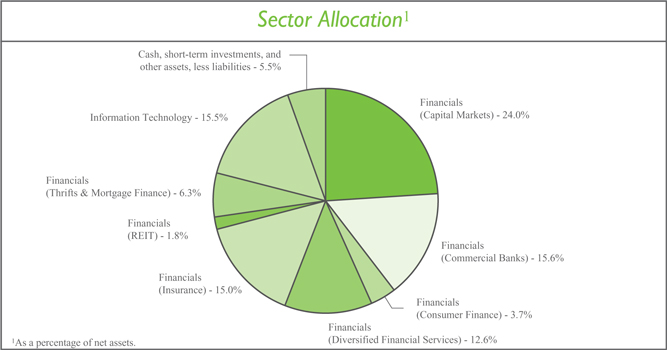
| | | | | | | | | | | | |
| TopTen Stock Holdings2 | |
Moody’s Corp. | | | 5.0 | % | | | | U.S. Bancorp | | | 3.2 | % |
JPMorgan Chase & Co. | | | 4.7 | % | | | | Brown & Brown, Inc. | | | 3.2 | % |
The Bank of New York Mellon Corp. | | | 4.6 | % | | | | The Charles Schwab Corp. | | | 3.1 | % |
The Western Union Co. | | | 3.9 | % | | | | State Street Corp. | | | 3.1 | % |
GAM Holding AG (Switzerland) | | | 3.9 | % | | | | Willis Group Holdings plc (United Kingdom) | | | 3.1 | % |
2As a percentage of total investments. | | | | | | | | | | | | |
Investment Portfolio - December 31, 2010
| | | | | | | | |
| | | Shares | | | Value (Note 2) | |
| | |
COMMON STOCKS - 94.5% | | | | | | | | |
| | |
Financials - 79.0% | | | | | | | | |
Capital Markets - 24.0% | | | | | | | | |
The Bank of New York Mellon Corp.1 | | | 219,000 | | | $ | 6,613,800 | |
The Charles Schwab Corp. | | | 264,000 | | | | 4,517,040 | |
Credit Suisse Group AG - ADR (Switzerland) | | | 28,600 | | | | 1,155,726 | |
Evercore Partners, Inc. - Class A | | | 46,700 | | | | 1,587,800 | |
Financial Engines, Inc.* | | | 83,000 | | | | 1,645,890 | |
GAM Holding AG (Switzerland)*2 | | | 342,110 | | | | 5,654,985 | |
The Goldman Sachs Group, Inc. | | | 18,300 | | | | 3,077,328 | |
Greenhill & Co., Inc. | | | 16,800 | | | | 1,372,224 | |
Lazard Ltd. - Class A (Bermuda) | | | 37,500 | | | | 1,480,875 | |
Northern Trust Corp. | | | 54,000 | | | | 2,992,140 | |
State Street Corp. | | | 97,000 | | | | 4,494,980 | |
| | | | | | | | |
| | | | | | | 34,592,788 | |
| | | | | | | | |
| | |
Commercial Banks - 15.6% | | | | | | | | |
Banco Santander S.A. - ADR (Spain) | | | 385,000 | | | | 4,100,250 | |
Barclays plc - ADR (United Kingdom) | | | 66,000 | | | | 1,090,320 | |
First Commonwealth Financial Corp. | | | 423,000 | | | | 2,994,840 | |
First Financial Bancorp | | | 80,000 | | | | 1,478,400 | |
HSBC Holdings plc - ADR (United Kingdom) | | | 83,540 | | | | 4,263,882 | |
Societe Generale - ADR (France)3 | | | 117,550 | | | | 1,277,769 | |
Standard Chartered plc (United Kingdom)2 | | | 98,700 | | | | 2,664,463 | |
U.S. Bancorp | | | 169,670 | | | | 4,576,000 | |
| | | | | | | | |
| | | | | | | 22,445,924 | |
| | | | | | | | |
| | |
Consumer Finance - 3.7% | | | | | | | | |
American Express Co. | | | 90,000 | | | | 3,862,800 | |
Discover Financial Services | | | 83,000 | | | | 1,537,990 | |
| | | | | | | | |
| | | | | | | 5,400,790 | |
| | | | | | | | |
| | |
Diversified Financial Services - 12.6% | | | | | | | | |
Bank of America Corp. | | | 119,000 | | | | 1,587,460 | |
Deutsche Boerse AG (Germany)2 | | | 37,000 | | | | 2,556,370 | |
JPMorgan Chase & Co. | | | 161,000 | | | | 6,829,620 | |
Moody’s Corp. | | | 271,000 | | | | 7,192,340 | |
| | | | | | | | |
| | | | | | | 18,165,790 | |
| | | | | | | | |
| | |
Insurance - 15.0% | | | | | | | | |
Allianz SE (Germany)2 | | | 37,000 | | | | 4,396,181 | |
The Allstate Corp. | | | 124,000 | | | | 3,953,120 | |
Brown & Brown, Inc. | | | 190,000 | | | | 4,548,600 | |
Willis Group Holdings plc (United Kingdom) | | | 128,000 | | | | 4,432,640 | |
Zurich Financial Services AG (Switzerland)2 | | | 16,500 | | | | 4,272,951 | |
| | | | | | | | |
| | | | | | | 21,603,492 | |
| | | | | | | | |
| | |
| The accompanying notes are an integral part of the financial statements. | | 5 |
Investment Portfolio - December 31, 2010
| | | | | | | | |
| | | Shares | | | Value (Note 2) | |
| | |
COMMON STOCKS (continued) | | | | | | | | |
| | |
Financials (continued) | | | | | | | | |
Real Estate Investment Trusts (REITS) - 1.8% | | | | | | | | |
Corporate Office Properties Trust | | | 76,000 | | | $ | 2,656,200 | |
| | | | | | | | |
Thrifts & Mortgage Finance -6.3% | | | | | | | | |
First Niagara Financial Group, Inc. | | | 296,000 | | | | 4,138,080 | |
Hudson City Bancorp, Inc. | | | 98,000 | | | | 1,248,520 | |
People’s United Financial, Inc. | | | 261,540 | | | | 3,664,175 | |
| | | | | | | | |
| | | | | | | 9,050,775 | |
| | | | | | | | |
Total Financials | | | | | | | 113,915,759 | |
| | | | | | | | |
Information Technology - 15.5% | | | | | | | | |
IT Services - 15.5% | | | | | | | | |
Automatic Data Processing, Inc. | | | 85,550 | | | | 3,959,254 | |
Cielo S.A. (Brazil) | | | 330,000 | | | | 2,673,795 | |
MasterCard, Inc. - Class A | | | 17,900 | | | | 4,011,569 | |
Redecard S.A. (Brazil) | | | 173,000 | | | | 2,193,765 | |
Visa, Inc. - Class A | | | 54,000 | | | | 3,800,520 | |
The Western Union Co. | | | 305,000 | | | | 5,663,850 | |
| | | | | | | | |
Total Information Technology | | | | | | | 22,302,753 | |
| | | | | | | | |
TOTAL COMMON STOCKS (Identified Cost $130,347,359) | | | | | | | 136,218,512 | |
| | | | | | | | |
| | |
SHORT-TERM INVESTMENTS - 5.5% | | | | | | | | |
Dreyfus Cash Management, Inc. - Institutional Shares4, 0.14% (Identified Cost $7,948,572) | | | 7,948,572 | | | | 7,948,572 | |
| | | | | | | | |
TOTAL INVESTMENTS - 100.0% (Identified Cost $138,295,931) | | | | | | | 144,167,084 | |
OTHER ASSETS, LESS LIABILITIES - 0.0%** | | | | | | | 12,368 | |
| | | | | | | | |
NET ASSETS - 100% | | | | | | $ | 144,179,452 | |
| | | | | | | | |
ADR - American Depository Receipt
*Non-income producing security
**Less than 0.1%
1The Bank of New York Mellon Corp. is the Series’ custodian and serves as sub-accountant and sub-transfer agent to the Series.
2International Fair Value factor from pricing service was applied.
3Latest quoted sales price is not available and the latest quoted bid price was used to value the security.
4Rate shown is the current yield as of December 31, 2010.
| | |
| 6 | | The accompanying notes are an integral part of the financial statements. |
Statement of Assets and Liabilities
December 31, 2010
| | | | |
| |
ASSETS: | | | | |
| |
Investments, at value (identified cost $138,295,931) (Note 2) | | $ | 144,167,084 | |
Dividends receivable | | | 192,168 | |
Receivable for fund shares sold | | | 130,496 | |
Foreign tax reclaims receivable | | | 77,884 | |
| | | | |
| |
TOTAL ASSETS | | | 144,567,632 | |
| | | | |
| |
LIABILITIES: | | | | |
| |
Accrued management fees (Note 3) | | | 120,821 | |
Accrued fund accounting and administration fees (Note 3) | | | 5,814 | |
Accrued transfer agent fees (Note 3) | | | 2,204 | |
Accrued Chief Compliance Officer service fees (Note 3) | | | 244 | |
Payable for fund shares repurchased | | | 196,774 | |
Audit fees payable | | | 31,404 | |
Other payables and accrued expenses | | | 30,919 | |
| | | | |
| |
TOTAL LIABILITIES | | | 388,180 | |
| | | | |
| |
TOTAL NET ASSETS | | $ | 144,179,452 | |
| | | | |
| |
NET ASSETS CONSIST OF: | | | | |
| |
Capital stock | | $ | 246,943 | |
Additional paid-in-capital | | | 245,783,982 | |
Undistributed net investment income | | | 47,982 | |
Accumulated net realized loss on investments, foreign currency and translation of other assets and liabilities | | | (107,777,337 | ) |
Net unrealized appreciation on investments, foreign currency and translation of other assets and liabilities | | | 5,877,882 | |
| | | | |
| |
TOTAL NET ASSETS | | $ | 144,179,452 | |
| | | | |
| |
NET ASSET VALUE, OFFERING PRICE AND REDEMPTION PRICE PER SHARE -
Class A ($144,179,452/24,694,313 shares) | | $ | 5.84 | |
| | | | |
| | |
| The accompanying notes are an integral part of the financial statements. | | 7 |
Statement of Operations
For the Year Ended December 31, 2010
| | | | |
| |
INVESTMENT INCOME: | | | | |
| |
Dividends (net of foreign taxes withheld, $109,907) | | $ | 3,283,753 | |
| | | | |
| |
EXPENSES: | | | | |
| |
Management fees (Note 3) | | | 1,335,265 | |
Fund accounting and administration fees (Note 3) | | | 44,538 | |
Transfer agent fees (Note 3) | | | 13,420 | |
Directors’ fees (Note 3) | | | 8,677 | |
Chief Compliance Officer service fees (Note 3) | | | 2,621 | |
Custodian fees | | | 22,739 | |
Miscellaneous | | | 102,337 | |
| | | | |
| |
Total Expenses | | | 1,529,597 | |
Less reduction of expenses (Note 3) | | | (758 | ) |
| | | | |
| |
Net Expenses | | | 1,528,839 | |
| | | | |
| |
NET INVESTMENT INCOME | | | 1,754,914 | |
| | | | |
| |
REALIZED AND UNREALIZED GAIN (LOSS) ON INVESTMENTS AND FOREIGN CURRENCY: | | | | |
| |
Net realized gain (loss) on- Investments | | | 2,654,084 | |
Foreign currency and translation of other assets and liabilities | | | (7,057 | ) |
| | | | |
| |
| | | 2,647,027 | |
| | | | |
| |
Net change in unrealized appreciation (depreciation) on- Investments | | | 4,470,053 | |
Foreign currency and translation of other assets and liabilities | | | 6,084 | |
| | | | |
| |
| | | 4,476,137 | |
| | | | |
| |
NET REALIZED AND UNREALIZED GAIN ON INVESTMENTS AND FOREIGN CURRENCY | | | 7,123,164 | |
| | | | |
| |
NET INCREASE IN NET ASSETS RESULTING FROM OPERATIONS | | $ | 8,878,078 | |
| | | | |
| | |
| 8 | | The accompanying notes are an integral part of the financial statements. |
Statements of Changes in Net Assets
| | | | | | | | |
| | | For the Year Ended
12/31/10 | | | For the Year Ended
12/31/09 | |
INCREASE IN NET ASSETS: | | | | | | | | |
| | |
OPERATIONS: | | | | | | | | |
| | |
Net investment income | | $ | 1,754,914 | | | $ | 2,884,947 | |
Net realized gain (loss) on investments and foreign currency | | | 2,647,027 | | | | (42,361,984 | ) |
Net change in unrealized appreciation on investments and foreign currency | | | 4,476,137 | | | | 57,427,697 | |
| | | | | | | | |
| | |
Net increase from operations | | | 8,878,078 | | | | 17,950,660 | |
| | | | | | | | |
| | |
DISTRIBUTIONS TO SHAREHOLDERS (Note 9): | | | | | | | | |
| | |
From net investment income | | | (1,786,293 | ) | | | (2,990,961 | ) |
| | | | | | | | |
| | |
CAPITAL STOCK ISSUED AND REPURCHASED: | | | | | | | | |
| | |
Net increase (decrease) from capital share transactions (Note 5) | | | 6,672,693 | | | | (13,914,002 | ) |
| | | | | | | | |
| | |
Net increase in net assets | | | 13,764,478 | | | | 1,045,697 | |
| | |
NET ASSETS: | | | | | | | | |
| | |
Beginning of year | | | 130,414,974 | | | | 129,369,277 | |
| | | | | | | | |
| | |
End of year (including undistributed net investment income of $47,982 and $43,192, respectively) | | $ | 144,179,452 | | | $ | 130,414,974 | |
| | | | | | | | |
| | |
| The accompanying notes are an integral part of the financial statements. | | 9 |
Financial Highlights
| | | | | | | | | | | | | | | | | | | | | | |
| | | | | | For the Years Ended | | | | | | |
| | | 12/31/10 | | | 12/31/09 | | | 12/31/08 | | | 12/31/07 | | | 12/31/06 | | | |
Per share data (for a share outstanding throughout each year): | | | | | | | | | | | | | | | | | | | | | | |
Net asset value - Beginning of year | | | $5.55 | | | | $5.14 | | | | $9.34 | | | | $12.51 | | | $10.70 | | | | |
| | | | | | | | | | | | | | | | | | | | | | |
Income (loss) from investment operations: | | | | | | | | | | | | | | | | | | | | | | |
Net investment income | | | 0.071 | | | | 0.101 | | | | 0.17 | | | | 0.19 | | | 0.10 | | | | |
Net realized and unrealized gain (loss) on investments | | | 0.29 | | | | 0.44 | | | | (4.19) | | | | (2.36) | | | 2.00 | | | | |
| | | | | | | | | | | | | | | | | | | | | | |
Total from investment operations | | | 0.36 | | | | 0.54 | | | | (4.02) | | | | (2.17) | | | 2.10 | | | | |
| | | | | | | | | | | | | | | | | | | | | | |
Less distributions to shareholders: | | | | | | | | | | | | | | | | | | | | | | |
From net investment income | | | (0.07) | | | | (0.13) | | | | (0.18) | | | | (0.18) | | | (0.11) | | | | |
From net realized gain on investments | | | — | | | | — | | | | — | | | | (0.82) | | | (0.18) | | | | |
| | | | | | | | | | | | | | | | | | | | | | |
Total distributions to shareholders | | | (0.07) | | | | (0.13) | | | | (0.18) | | | | (1.00) | | | (0.29) | | | | |
| | | | | | | | | | | | | | | | | | | | | | |
Net asset value - End of year | | | $5.84 | | | | $5.55 | | | | $5.14 | | | | $9.34 | | | $12.51 | | | | |
| | | | | | | | | | | | | | | | | | | | | | |
Net assets - End of year
(000’s omitted) | | | $144,179 | | | | $130,415 | | | | $129,369 | | | | $220,097 | | | $132,855 | | | | |
| | | | | | | | | | | | | | | | | | | | | | |
Total return2 | | | 6.56% | | | | 10.54% | | | | (42.98%) | | | | (17.46%) | | | 19.62% | | | | |
Ratios (to average net assets)/ | | | | | | | | | | | | | | | | | | | | | | |
Supplemental Data: | | | | | | | | | | | | | | | | | | | | | | |
Expenses* | | | 1.14% | | | | 1.14% | | | | 1.12% | | | | 1.15% | | | 1.18% | | | | |
Net investment income | | | 1.31% | | | | 2.01% | | | | 2.34% | | | | 1.72% | | | 1.14% | | | | |
Portfolio turnover | | | 49% | | | | 98% | | | | 41% | | | | 38% | | | 30% | | | | |
|
*The investment advisor did not impose all or a portion of its management fees, CCO fees and fund accounting and transfer agent fees, and other fees in some years and in some years paid a portion of the Series’ expenses. If these expenses had been incurred by the Series, the expense ratio (to average net assets) would have been increased by the following amounts: | |
| | | 0.00% | 3 | | | 0.00% | 3 | | | N/A | | | | N/A | | | N/A | | | | |
1Calculated based on average shares outstanding during the year.
2Represents aggregate total return for the years indicated, and assumes reinvestment of all distributions. Total returns would have been lower had
certain expenses not been waived or reimbursed during certain years.
3Less than 0.01%.
| | |
| 10 | | The accompanying notes are an integral part of the financial statements. |
Notes to Financial Statements
Financial Services Series (the “Series”) is a no-load diversified series of Manning & Napier Fund, Inc. (the “Fund”). The Fund is organized in Maryland and is registered under the Investment Company Act of 1940, as amended, as an open-end management investment company.
The Series’ investment objective is to provide long-term growth by investing principally in the common stocks of companies in the financial services industry.
The Fund’s Advisor is Manning & Napier Advisors, Inc. (the “Advisor”). Shares of the Series are offered to investors, clients and employees of the Advisor and its affiliates. The total authorized capital stock of the Fund consists of 10.0 billion shares of common stock each having a par value of $0.01. As of December 31, 2010, 6.2 billion shares have been designated in total among 29 series, of which 100 million have been designated as Financial Services Series Class A common stock.
| 2. | SIGNIFICANT ACCOUNTING POLICIES |
Security Valuation
Portfolio securities, including domestic equities, foreign equities, warrants and options, listed on an exchange other than the NASDAQ National Market System are valued at the latest quoted sales price of the exchange on which the security is primarily traded. Securities not traded on valuation date or securities not listed on an exchange are valued at the latest quoted bid price provided by the Fund’s pricing service. Securities listed on the NASDAQ National Market System are valued in accordance with the NASDAQ Official Closing Price.
Short-term investments that mature in sixty days or less are valued at amortized cost, which approximates market value. Investments in open-end investment companies are valued at their net asset value per share on valuation date.
Volume and level of activity in established markets for an asset or liability are evaluated to determine whether recent transactions and quoted prices are determinative of fair value. Where there have been significant decreases in volume and level of activity, further analysis and adjustment may be necessary to estimate fair value. The Series measures fair value in these instances by the use of inputs and valuation techniques which may be based upon current market prices of securities that are comparable in coupon, rating, maturity and industry and/or expectation of future cash flows. As a result of trading in relatively thin markets and/or markets that experience significant volatility, the prices used by the Series to value these securities may differ from the value that would be realized if these securities were sold, and the differences could be material.
Securities for which representative valuations or prices are not available from the Fund’s pricing service may be valued at fair value. Due to the inherent uncertainty of valuations of such securities, the fair value may differ significantly from the values that would have been used had a ready market for such securities existed. If trading or events occurring after the close of the principal market in which securities are traded are expected to materially affect the value of those securities, then they may be valued at their fair value, taking this trading or these events into account. Fair value is determined in good faith by the Advisor under procedures approved by and under the general supervision and responsibility of the Fund’s Board of Directors (the “Board”). In accordance with the procedures approved by the Board, the Series applies fair value pricing on a daily basis except for North American, Central American, South American and Caribbean equity securities. Fair valuing of securities is determined with the assistance of a pricing service using calculations or factors based on indices of domestic securities and other appropriate indicators, such as prices of relevant American Depository Receipts and futures contracts, to adjust local market prices for subsequent movements through the time the Series calculates its net asset value. The value of securities used for the net asset value calculation under the procedures may differ from published prices for the same securities. It is the Fund’s
Notes to Financial Statements
| 2. | SIGNIFICANT ACCOUNTING POLICIES (continued) |
Security Valuation (continued)
policy to classify each foreign equity security, except for those in the regions noted above, as Level 2 securities due to the fact the pricing service evaluated what factor was applied to the calculated end of day market price.
Various inputs are used in determining the value of the Series’ assets or liabilities carried at market value. These inputs are summarized in three broad levels. Level 1 includes quoted prices in active markets for identical assets and liabilities. Level 2 includes other significant observable inputs (including quoted prices for similar securities, interest rates, prepayment speeds, credit risk, etc.). Level 3 includes significant unobservable inputs (including the Series’ own assumptions in determining the fair value of investments). The inputs or methodology used for valuing securities are not necessarily an indication of the risk associated with investing in those securities.
The following is a summary of the valuation levels used for major security types as of December 31, 2010 in valuing the Series’ assets or liabilities carried at market value:
| | | 000000000000000 | | | | 000000000000000 | | | | 000000000000000 | | | | 000000000000000 | |
| Description | | Total | | | Level 1 | | | Level 2 | | | Level 3 | |
Assets: | | | | | | | | | | | | | | | | |
Equity securities* | | $ | 136,218,512 | | | $ | 115,395,793 | | | $ | 20,822,719 | | | $ | — | |
Preferred securities | | | — | | | | — | | | | — | | | | — | |
Debt securities | | | — | | | | — | | | | — | | | | — | |
Mutual funds | | | 7,948,572 | | | | 7,948,572 | | | | — | | | | — | |
Other financial instruments**: | | | — | | | | — | | | | — | | | | — | |
| | | | | | | | | | | | | | | | |
Total assets: | | | 144,167,084 | | | | 123,344,365 | | | | 20,822,719 | | | | — | |
| | | | | | | | | | | | | | | | |
Liabilities: | | | | | | | | | | | | | | | | |
Other financial instruments**: | | | — | | | | — | | | | — | | | | — | |
| | | | | | | | | | | | | | | | |
Total liabilities: | | | — | | | | — | | | | — | | | | — | |
| | | | | | | | | | | | | | | | |
Total | | $ | 144,167,084 | | | $ | 123,344,365 | | | $ | 20,822,719 | | | $ | — | |
| | | | | | | | | | | | | | | | |
*Includes common stock, warrants and rights. Please see the Investment Portfolio for industry classification and for securities where a latest quoted sales price is not available and the latest quoted bid price was used to value the security or foreign securities where an International Fair Value factor from the pricing service was applied to value the security. Such securities are included in Level 2 in the table above.
** Other financial instruments are derivative instruments not reflected in the Investment Portfolio, such as futures, forwards and swap contracts, which are valued at the unrealized appreciation/depreciation on the instrument. As of December 31, 2010, the Series did not hold any derivative instruments.
There were no Level 3 securities held by the Series as of December 31, 2009 or December 31, 2010.
The Fund’s policy is to recognize transfers in and transfers out of the valuation levels as of the beginning of the reporting period. During the year ended December 31, 2010, the Fund had three foreign equity securities transfer from Level 1 to Level 2 due to the implementation of new international fair value pricing procedures. The following is a summary of the foreign equity securities that transferred from Level 1 to Level 2:
Notes to Financial Statements
| 2. | SIGNIFICANT ACCOUNTING POLICIES (continued) |
Security Valuation (continued)
| | 000000000000000000 | | 000000000000000000 | | 000000000000000000 | | 000000000000000000 |
| | | Total # Securities Level 1 at beginning and Level 2 at end of period | | Total Market Value Beginning of period | | Total Market Value End of period | | Change in Market Value |
| | 3 | | $ 8,954,028 | | $ 14,324,117 | | $ 5,370,089 |
Additional disclosure surrounding the activity in Level 3 fair value measurement will be effective for fiscal years beginning after December 15, 2010. Management has concluded that this will not have a material impact on the Series’ financial statements.
Security Transactions, Investment Income and Expenses
Security transactions are accounted for on trade date. Dividend income is recorded on the ex-dividend date, except that if the ex-dividend date has passed, certain dividends from foreign securities are recorded as soon as the Fund is informed of the ex-dividend date. Non-cash dividends, if any, are recorded at the fair market value of the securities received. Interest income, including amortization of premium and accretion of discounts using the effective interest method, is earned from settlement date and accrued daily.
Expenses are recorded on an accrual basis. Most expenses of the Fund can be attributed to a specific series. Expenses which cannot be directly attributed are apportioned among the series in the Fund in such a manner as deemed equitable by the Fund’s Board, taking into consideration, among other things, the nature and type of expense.
The Series uses the identified cost method for determining realized gain or loss on investments for both financial statement and federal income tax reporting purposes.
Foreign Currency Translation
The books and records of the Series are maintained in U.S. dollars. Foreign currencies, investments and other assets and liabilities are translated into U.S. dollars at the current exchange rates. Purchases and sales of investment securities and income and expenses are translated on the respective dates of such transactions. The Series does not isolate realized and unrealized gains and losses attributable to changes in the exchange rates from gains and losses that arise from changes in the market value of investments. Such fluctuations are included with net realized and unrealized gain or loss on investments. Net realized foreign currency gains and losses represent foreign currency gains and losses between trade date and settlement date on securities transactions, gains and losses on disposition of foreign currencies and the difference between the amount of income and foreign withholding taxes recorded on the books of the Series and the amounts actually received or paid.
Federal Taxes
The Series’ policy is to comply with the provisions of the Internal Revenue Code applicable to regulated investment companies. The Series is not subject to federal income tax or excise tax to the extent that the Series distributes to shareholders each year its taxable income, including any net realized gains on investments, in accordance with requirements of the Internal Revenue Code. Accordingly, no provision for federal income tax or excise tax has been made in the financial statements.
Management evaluates its tax positions to determine if the tax positions taken meet the minimum recognition threshold in connection with accounting for uncertainties in income tax positions taken or expected to be taken for the purposes of measuring and recognizing tax liabilities in the financial statements. Recognition of tax benefits of an uncertain tax position is required only when the position is “more likely than not” to be sustained assuming examination by
Notes to Financial Statements
| 2. | SIGNIFICANT ACCOUNTING POLICIES (continued) |
Federal Taxes (continued)
taxing authorities. At December 31, 2010, the Series has recorded no liability for net unrecognized tax benefits relating to uncertain income tax positions taken or expected to be taken in future tax returns.
The Series files income tax returns in the U.S. federal jurisdiction, various states and foreign jurisdictions, as required. No income tax returns are currently under investigation. The statute of limitations on the Series’ tax returns remains open for the years ended December 31, 2007 through December 31, 2010. The Fund is not aware of any tax positions for which it is reasonably possible that the total amounts of unrecognized tax benefits will significantly change in the next twelve months.
Additionally, based on the Fund’s understanding of the tax rules and rates related to income, gains and transactions for foreign jurisdictions in which it invests, the Series will provide for foreign taxes, and where appropriate, deferred foreign tax.
Distributions of Income and Gains
Distributions to shareholders of net investment income and net realized gains are made annually. An additional distribution may be necessary to avoid taxation of the Series. Distributions are recorded on the ex-dividend date.
Indemnifications
The Fund’s organizational documents provide former and current directors and officers with a limited indemnification against liabilities arising in connection with the performance of their duties to the Fund. In the normal course of business, the Fund may also enter into contracts that provide general indemnifications. The Fund’s maximum exposure under these arrangements is unknown as this would be dependent on future claims that may be made against the Fund. The risk of material loss from such claims is considered remote.
Other
The preparation of financial statements in conformity with accounting principles generally accepted in the United States of America requires management to make estimates and assumptions that affect the reported amounts of assets and liabilities and the disclosure of contingent assets and liabilities at the date of the financial statements and the reported amounts of income and expenses during the reporting period. Actual results could differ from those estimates.
| 3. | TRANSACTIONS WITH AFFILIATES |
The Fund has an Investment Advisory Agreement (the “Agreement”) with the Advisor, for which the Series pays a fee, computed daily and payable monthly, at an annual rate of 1.00% of the Series’ average daily net assets.
Under the Agreement, personnel of the Advisor provide the Series with advice and assistance in the choice of investments and the execution of securities transactions, and otherwise maintain the Series’ organization. The Advisor also provides the Fund with necessary office space and fund administration and support services. The salaries of all officers of the Fund (except a percentage of the Fund’s Chief Compliance Officer’s salary, which is paid by the Fund), and of all Directors who are “affiliated persons” of the Fund, or of the Advisor, and all personnel of the Fund, or of the Advisor, performing services relating to research, statistical and investment activities, are paid by the Advisor. Each “non-affiliated” Director receives an annual stipend, which is allocated among all the active series of the Fund. In addition, these Directors also receive a fee per Board meeting attended plus a fee for each committee meeting attended.
The Advisor has contractually agreed, until at least April 30, 2012, to waive its fee and, if necessary, pay other operating expenses of the Series in order to maintain total direct annual fund operating expenses for the Series at no more than 1.20% of average daily net assets each year. For the year ended December 31, 2010, the Advisor voluntarily
Notes to Financial Statements
| 3. | TRANSACTIONS WITH AFFILIATES (continued) |
waived fees of $758, which is included as a reduction of expenses on the Statement of Operations. The Advisor is not eligible to recoup any expenses that have been waived or reimbursed in prior years.
Manning & Napier Investor Services, Inc., a registered broker-dealer affiliate of the Advisor, acts as distributor for the Fund’s shares. The services of Manning & Napier Investor Services, Inc. are provided at no additional cost to the Series.
The Advisor has agreements with PNC Global Investment Servicing (U.S.) Inc. (“PNCGIS”) under which PNCGIS serves as sub-accountant services agent and sub-transfer agent. The Fund pays the Advisor an annual fee related to fund accounting and administration of 0.0175% on the first $3 billion of average daily net assets (excluding Target Series); 0.015% on the next $3 billion of average daily net assets (excluding Target Series); and 0.01% of the average daily net assets in excess of $6 billion (excluding Target Series); plus a base fee of $25,500 per Series. Transfer Agent fees are charged to the Fund on a per account basis. Additionally, certain transaction- and cusip-based fees and out-of-pocket expenses, including charges for reporting relating to the Fund’s compliance program, are charged.
Effective July 1, 2010, PNCGIS was sold to The Bank of New York Mellon Corporation, the Series’ custodian. At the close of the sale, PNCGIS changed its name to BNY Mellon Investment Servicing (U.S.) Inc. (“BNY”).
Expenses not directly attributable to a Series are allocated based on each Series’ relative net assets or number of accounts, depending on the expense.
| 4. | PURCHASES AND SALES OF SECURITIES |
For the year ended December 31, 2010, purchases and sales of securities, other than U.S. Government securities and short-term securities, were $63,810,863 and $62,850,672, respectively. There were no purchases or sales of U.S. Government securities.
| 5. | CAPITAL STOCK TRANSACTIONS |
Transactions in shares of Financial Services Series were:
| | | | | | | | | | | | | | | | |
| | | For the Year | | | For the Year | |
| | | Ended 12/31/10 | | | Ended 12/31/09 | |
| | | Shares | | | Amount | | | Shares | | | Amount | |
Sold | | | 3,059,077 | | | $ | 17,083,766 | | | | 11,190,234 | | | $ | 55,137,124 | |
Reinvested | | | 298,746 | | | | 1,727,732 | | | | 534,460 | | | | 2,895,097 | |
Repurchased | | | (2,175,056 | ) | | | (12,138,805 | ) | | | (13,401,764 | ) | | | (71,946,223 | ) |
| | | | | | | | | | | | | | | | |
Total | | | 1,182,767 | | | $ | 6,672,693 | | | | (1,677,070 | ) | | $ | (13,914,002 | ) |
| | | | | | | | | | | | | | | | |
Substantially all of the Series’ shares represent investments by fiduciary accounts over which the Advisor has sole investment discretion.
The Series may trade in instruments including written and purchased options, forward foreign currency exchange contracts and futures contracts and other derivatives in the normal course of investing activities to assist in managing exposure to various market risks. Investments in these instruments may subject the Series to various elements of risk, which may involve, to a varying degree, elements of risk in excess of the amounts recognized for financial statement purposes. These risks include: the risk that changes in the value of a derivative may not correlate perfectly
Notes to Financial Statements
| 6. | FINANCIAL INSTRUMENTS (continued) |
with the underlying asset, rate or index, counterparty credit risk related to over the counter derivatives counterparties’ failure to perform under contract terms, liquidity risk related to the lack of a liquid market for these contracts allowing the fund to close out its position(s) and documentation risk relating to disagreement over contract terms. No such investments were held by the Series during the year ended December 31, 2010.
Investing in securities of foreign companies and foreign governments involves special risks and considerations not typically associated with investing in securities of domestic companies and the U.S. Government. These risks include revaluation of currencies and future adverse political and economic developments. Moreover, securities of foreign companies and foreign governments and their markets may be less liquid and their prices more volatile than those of comparable domestic companies and the U.S. Government.
| 8. | FINANCIAL SERVICES SECURITIES |
The Series may focus its investments in certain related financial services industries; hence, the Series may subject itself to a greater degree of risk than a series that is more diversified.
| 9. | FEDERAL INCOME TAX INFORMATION |
The amount and characterization of certain income and capital gains to be distributed are determined in accordance with federal income tax regulations, which may differ from accounting principles generally accepted in the United States of America. These differences are primarily due to differing book and tax treatments in the timing of the recognition of net investment income or gains and losses, including investments in real estate investment trusts (REITs), foreign currency gains and losses and post-October losses. The Series may periodically make reclassifications among its capital accounts to reflect income and gains available for distribution (or available capital loss carryovers) under income tax regulations without impacting the Series’ net asset value. Any such reclassifications are not reflected in the financial highlights.
The tax character of distributions paid were as follows:
| | | | | | |
| | | For the Year | | For the Year | | |
| | | Ended 12/31/10 | | Ended 12/31/09 | | |
Ordinary income | | $1,786,293 | | $2,990,961 | | |
At December 31, 2010, the tax basis of distributable earnings and the net unrealized appreciation based on identified cost of investments for federal income tax purposes were as follows:
| | | | | | |
Cost for federal income tax purposes | | $ | 138,419,949 | | | |
Unrealized appreciation | | $ | 9,659,996 | | | |
Unrealized depreciation | | | (3,912,861 | ) | | |
| | | | | | |
Net unrealized appreciation | | $ | 5,747,135 | | | |
| | | | | | |
Capital loss carryover | | | 107,605,337 | | | |
Notes to Financial Statements
| 9. | FEDERAL INCOME TAX INFORMATION (continued) |
At December 31, 2010, the capital loss carryover, disclosed above, available to the extent allowed by tax law to offset future net capital gain, if any, will expire as follows:
| | | | |
| Loss Carryover | | Expiration Date | | |
$50,750,210 | | December 31, 2016 | | |
$51,187,679 | | December 31, 2017 | | |
$ 5,667,448 | | December 31, 2018 | | |
Report of Independent Registered Public Accounting Firm
To the Board of Directors of Manning & Napier Fund, Inc. and Shareholders of Financial Services Series:
In our opinion, the accompanying statement of assets and liabilities, including the investment portfolio, and the related statements of operations and of changes in net assets and the financial highlights present fairly, in all material respects, the financial position of the Financial Services Series (a series of Manning & Napier Fund, Inc., hereafter referred to as the “Series”) at December 31, 2010, and the results of its operations for the year then ended, the changes in its net assets for each of the two years in the period then ended and the financial highlights for each of the five years in the period then ended, in conformity with accounting principles generally accepted in the United States of America. These financial statements and financial highlights (hereafter referred to as “financial statements”) are the responsibility of the Series’ management. Our responsibility is to express an opinion on these financial statements based on our audits. We conducted our audits of these financial statements in accordance with the standards of the Public Company Accounting Oversight Board (United States). Those standards require that we plan and perform the audit to obtain reasonable assurance about whether the financial statements are free of material misstatement. An audit includes examining, on a test basis, evidence supporting the amounts and disclosures in the financial statements, assessing the accounting principles used and significant estimates made by management, and evaluating the overall financial statement presentation. We believe that our audits, which included confirmation of securities at December 31, 2010 by correspondence with the custodian, provide a reasonable basis for our opinion.
New York, New York
February 22, 2011
Supplemental Tax Information (unaudited)
All designations are based on financial information available as of the date of this annual report and, accordingly are subject to change.
For federal income tax purposes, the Series designates for the current fiscal year $1,786,293 or, if different, the maximum amount allowable under the tax law as qualified dividend income.
For corporate shareholders, the percentage of investment income (dividend income plus short-term gains, if any) that qualifies for the dividends received deduction for the current fiscal year is 99.37%, or if different, the maximum allowable under tax law.
Renewal of Investment Advisory Agreement (unaudited)
At the Manning & Napier Fund, Inc. (the “Fund”) Board of Directors’ (the “Board”) meeting, held on November 17, 2010, the Investment Advisory Agreement (the “Agreement”) between the Fund and Manning & Napier Advisors, Inc. (the “Advisor”) was reviewed by the Board for renewal. In connection with the decision whether to renew the Agreement, a variety of material was prepared for and reviewed by the Board.
Representatives of the Advisor attended the meeting and presented additional oral and written information to the Board to assist the Board in its considerations. The discussion immediately below outlines the materials and information presented to the Board in connection with the Board’s 2010 Annual Review of the Agreement and the conclusions made by the Directors when determining to continue the Agreement.
| | • | | The Board considered the services provided by the Advisor under the Agreement including, among others: deciding what securities to purchase and sell for each Series; arranging for the purchase and sale of such securities by placing orders with broker-dealers; administering the affairs of the Fund (including the books and records of the Fund not maintained by third party service providers such as the custodian or sub-transfer agent); arranging for the insurance coverage for the Fund; and supervising the preparation of tax returns, SEC filings (including registration statements) and reports to shareholders for the Fund. The Board also considered the nature and quality of such services provided under the Agreement in light of the Advisor’s services provided to the Fund for 24 years. The Board discussed the quality of these services with representatives from the Advisor and concluded that the Advisor was performing its services to the Fund required under the Agreement in a reasonable manner. |
| | • | | The Board considered the investment performance of the various Series of the Fund. The investment performance for each Series was reviewed on a cumulative basis since inception and on a one year basis. In addition, annualized performance for the following time periods was considered: inception, three year, five year, ten year, and current market cycle. A market cycle includes periods of both rising and falling markets. Returns for established benchmark indices for each Series were provided for each time period. The Board noted that the various Series were competitive against their respective benchmarks and/or peer groups over various time periods, but in particular over the full market cycle period relevant for the Series. In addition, the Board considered at the meeting (and considers on a quarterly basis) a peer group performance analysis consisting of Morningstar universes of mutual funds with similar investment objectives. The Board discussed the performance with representatives from the Advisor and concluded that the investment performance of each of the Fund’s Series was reasonable based on the Fund’s actual performance and comparative performance, especially performance over the current market cycle. |
| | • | | The Board considered the costs of the Advisor’s services and the profits of the Advisor as they relate to the Advisor’s services to the Fund under the Agreement. In reviewing the Advisor’s costs and profits, the Board discussed the Advisor’s revenues generated from the Fund (on both an actual and adjusted basis) and its expenses associated with providing the services under the Agreement. In addition, the Board reviewed the Advisor’s expenses associated with Fund activities outside of the Agreement (such as expense reimbursements pursuant to expense caps and payments made by the Advisor to third party platforms on which shares of the Fund are available for purchase). It was noted by representatives of the Advisor that 11 of the 27 active Series of the Fund are currently experiencing expenses above the capped expense ratios. After discussing the above costs and profits, the Board concluded that the Advisor’s profitability relating to its services provided under the Agreement was reasonable. |
| | • | | The Board considered the fees and expenses of the various Series of the Fund. The Advisor presented the advisory fees and total expenses for each Series, including the advisory fee adjusted for any expense waivers or reimbursements (either contractual or voluntary) paid by the Advisor. The advisory fees and expense ratios of each Series were compared to an average (on both a mean and median basis) of similar funds as disclosed on the Morningstar database. Representatives of the Advisor discussed with the Board the levels of its advisory |
Renewal of Investment Advisory Agreement (unaudited)
| | fee for each Series of the Fund and as compared to the median and mean advisory fees for similar funds as listed on Morningstar. Expense ratios for every Series, except the Pro-Blend’s Class R and Class C, and Target Class R and Class C, are currently below the median and mean for similar funds as listed on Morningstar. Based on their review of the information provided, the Board concluded that the fees and expenses of each Series of the Fund were reasonable on a comparative basis. |
| | • | | The Board also considered the other benefits the Advisor derives from its relationship with the Fund. Such other benefits include certain research products provided by soft dollars. Given the level of soft dollar transactions involving the Fund, the Board concluded that these additional benefits to the Advisor were reasonable. |
| | • | | In addition to the factors described above, the Board considered the Advisor’s personnel, investment strategies, policies and procedures relating to compliance with personal securities transactions, and reputation, expertise and resources in domestic and foreign financial markets. The Board concluded that these factors support the conclusion that the Advisor performs its services in a reasonable manner. |
| | • | | The Board did not consider economies of scale at this time because of the multiple uses of the Fund (for the Advisor’s discretionary investment account clients in addition to direct investors), the current profitability of the Advisor’s services to the Fund under the Agreement, and the overall size of the Fund complex. |
Based on the Board’s deliberations and their evaluation of the information described above, the Board, including a majority of Directors that are not “interested persons” as defined in the Investment Company Act of 1940, concluded that the compensation under the Agreement was fair and reasonable in light of the services and expenses and such other matters as the Directors considered to be relevant in the exercise of their reasonable judgment. Accordingly, the Board approved the renewal of the Agreement. In the course of their deliberations, the Directors did not identify any particular information that was all important or controlling.
Directors’ and Officers’ Information (unaudited)
The Statement of Additional Information provides additional information about the Fund’s directors and officers and can be obtained without charge by calling 1-800-466-3863, at www.manningnapieradvisors.com, or on the EDGAR Database on the SEC Internet web site (http:// www.sec.gov). The following chart shows certain information about the Fund’s officers and directors, including their principal occupations during the last five years. Unless specific dates are provided, the individuals have held the listed positions for longer than five years.
INTERESTED DIRECTOR/OFFICER
| | |
Name: | | B. Reuben Auspitz* |
| Address: | | 290 Woodcliff Drive |
| | Fairport, NY 14450 |
| Age: | | 63 |
| Current Position(s) Held with Fund: | | Principal Executive Officer, President, Chairman & Director |
| Term of Office1 & Length of Time Served: | | Indefinite - Director since 1984; Vice President 1984 - 2003; President since 2004; Principal Executive Officer since 2002 |
| Principal Occupation(s) During Past 5 Years: | | Executive Vice President; Executive Group Member**; Chief Compliance Officer since 2004; Vice Chairman since June 2010; Co-Executive Director from 2003-2010 - Manning & Napier Advisors, Inc. President; Director - Manning & Napier Investor Services, Inc. Holds or has held one or more of the following titles for various subsidiaries and affiliates: President, Vice President, Director, Chairman, Treasurer, Chief Compliance Officer or Member. |
| Number of Portfolios Overseen within Fund Complex: | | 29 |
| Other Directorships Held Outside Fund Complex: | | N/A |
INDEPENDENT DIRECTORS | | |
| |
| Name: | | Paul A. Brooke |
| Address: | | 290 Woodcliff Drive |
| | Fairport, NY 14450 |
| Age: | | 65 |
| Current Position(s) Held with Fund: | | Director, Audit Committee Member, Governance & Nominating Committee Member |
| Term of Office & Length of Time Served: | | Indefinite - Since 2007 |
| Principal Occupation(s) During Past 5 Years: | | Chairman & CEO, Alsius Corp. (investments); Managing Member, PMSV Holdings LLC (investments) |
| Number of Portfolios Overseen within Fund Complex: | | 29 |
| Other Directorships Held Outside Fund Complex: | | Incyte Corp. (2000-present) ViroPharma, Inc. (2000-present) HLTH Corp. (2000-present) Cheyne Capital International (2000-present) MPM Bio-equities (2000-present) GMP Companies (2000-present) HoustonPharma (2000-present) |
Name: | | Richard M. Hurwitz |
| Address: | | 290 Woodcliff Drive |
| | Fairport, NY 14450 |
| Age: | | 47 |
| Current Position(s) Held with Fund: | | Director, Audit Committee Member, Governance & Nominating Committee Member |
| Term of Office & Length of Time Served: | | Indefinite - Since 2009 |
| Principal Occupation(s) During Past 5 Years: | | Chief Executive Officer, Pictometry International Corp. since August 2010 (provider of georeferenced, aerial image libraries and related software) Managing Partner (2006-July 2010) - Aegis Investment Partners, LLC (investments); Founder and Managing Partner (2004-2005) - Village Markets, LLC (groceries) |
| Number of Portfolios Overseen within Fund Complex: | | 29 |
| Other Directorships Held Outside Fund Complex: | | Pictometry International Corp. (2000-2010) Pioneering Technologies (2006-2009) Vensearch Capital Corp. (2003-2007) |
Directors’ and Officers’ Information (unaudited)
INDEPENDENT DIRECTORS (continued)
| | |
Name: | | Stephen B. Ashley |
| Address: | | 290 Woodcliff Drive |
| | Fairport, NY 14450 |
| Age: | | 70 |
| Current Position(s) Held with Fund: | | Director, Audit Committee Member, Governance & Nominating |
| | Committee Member |
| Term of Office & Length of Time Served: | | Indefinite - Since 1996 |
| Principal Occupation(s) During Past 5 Years: | | Chairman, Director, President & Chief Executive Officer, The Ashley Group (property management and investment). Chairman (non-executive) 2004-2008; Director 1995-2008 - Fannie Mae (mortgage) |
| Number of Portfolios Overseen within Fund Complex: | | 29 |
| Other Directorships Held Outside Fund Complex: | | The Ashley Group (1995-2008) |
| | | Genesee Corporation (1987-2007) |
Name: | | Peter L. Faber |
| Address: | | 290 Woodcliff Drive |
| | Fairport, NY 14450 |
| Age: | | 72 |
| Current Position(s) Held with Fund: | | Director, Governance & Nominating Committee Member |
| Term of Office & Length of Time Served: | | Indefinite - Since 1987 |
| Principal Occupation(s) During Past 5 Years: | | Senior Counsel since 2006, Partner (1995 - 2006) - McDermott, Will & Emery LLP (law firm) |
| Number of Portfolios Overseen within Fund Complex: | | 29 |
| Other Directorships Held Outside Fund Complex: | | Partnership for New York City, Inc. (non-profit) New York Collegium (non-profit) Boston Early Music Festival (non-profit) |
Name: | | Harris H. Rusitzky |
| Address: | | 290 Woodcliff Drive |
| | Fairport, NY 14450 |
| Age: | | 76 |
| Current Position(s) Held with Fund: | | Director, Audit Committee Member, Governance & Nominating Committee Member |
| Term of Office & Length of Time Served: | | Indefinite - Since 1985 |
| Principal Occupation(s) During Past 5 Years: | | President, The Greening Group (business consultants) since 1994; Partner, The Restaurant Group (restaurants) since 2006 |
| Number of Portfolios Overseen within Fund Complex: | | 29 |
| Other Directorships Held Outside Fund Complex: | | N/A |
OFFICERS | | |
| Name: | | Jeffrey S. Coons, Ph.D., CFA |
| Address: | | 290 Woodcliff Drive |
| | Fairport, NY 14450 |
| Age: | | 47 |
| Current Position(s) Held with Fund: | | Vice President |
| Term of Office1 & Length of Time Served: | | Since 2004 |
| Principal Occupation(s) During Past 5 Years: | | President since 2010, Co-Director of Research since 2002, Executive Group Member** since 2003, - Manning & Napier Advisors, Inc. Holds one or more of the following titles for various subsidiaries and affiliates: President, Director, Treasurer or Senior Trust Officer. |
| Number of Portfolios Overseen within Fund Complex: | | 29 |
Other Directorships Held Outside Fund Complex: | | N/A |
Directors’ and Officers’ Information (unaudited)
| | |
OFFICERS (continued) | | |
Name: | | Beth Galusha |
Address: | | 290 Woodcliff Drive |
| | Fairport, NY 14450 |
Age: | | 49 |
Current Position(s) Held with Fund: | | Assistant Chief Financial Officer |
Term of Office1 & Length of Time Served: | | Assistant Chief Financial Officer since 2010 |
Principal Occupation(s) During Past 5 Years: | | Chief Financial Officer and Treasurer, Manning & Napier Advisors, Inc. Holds one or more of the following titles for various affiliates: Chief Financial Officer, Director, or Treasurer |
Number of Portfolios Overseen within Fund Complex: | | 29 |
Other Directorships Held Outside Fund Complex: | | N/A |
Name: | | Christine Glavin |
Address: | | 290 Woodcliff Drive |
| | Fairport, NY 14450 |
Age: | | 44 |
Current Position(s) Held with Fund: | | Principal Financial Officer, Chief Financial Officer |
Term of Office1 & Length of Time Served: | | Principal Financial Officer since 2002; Chief Financial Officer since 2001 |
Principal Occupation(s) During Past 5 Years: | | Fund Reporting Manager, Manning & Napier Advisors, Inc. since 1997 |
Number of Portfolios Overseen within Fund Complex: | | 29 |
Other Directorships Held Outside Fund Complex: | | N/A |
Name: | | Jodi L. Hedberg |
Address: | | 290 Woodcliff Drive |
| | Fairport, NY 14450 |
Age: | | 43 |
Current Position(s) Held with Fund: | | Corporate Secretary, Chief Compliance Officer, Anti-Money Laundering Compliance Officer |
Term of Office1 & Length of Time Served: | | Corporate Secretary since 1997; Chief Compliance Officer since 2004 |
Principal Occupation(s) During Past 5 Years: | | Director of Compliance, Manning & Napier Advisors, Inc. and affiliates since 1990 (title change in 2005 from Compliance Manager to Director of Compliance); Corporate Secretary, Manning & Napier Investor Services, Inc. since 2006 |
Number of Portfolios Overseen within Fund Complex: | | 29 |
Other Directorships Held Outside Fund Complex: | | N/A |
Name: | | Richard Yates |
Address: | | 290 Woodcliff Drive |
| | Fairport, NY 14450 |
Age: | | 45 |
Current Position(s) Held with Fund: | | Chief Legal Officer |
Term of Office1 & Length of Time Served: | | Chief Legal Officer since 2004 |
Principal Occupation(s) During Past 5 Years: | | Counsel - Manning & Napier Advisors, Inc. & affiliates since 2000; Holds one or more of the following titles for various affiliates; Director or Corporate Secretary |
Number of Portfolios Overseen within Fund Complex: | | 29 |
Other Directorships Held Outside Fund Complex: | | N/A |
*Interested Director, within the meaning of the Investment Company Act of 1940 by reason of his position with the Fund’s investment advisor and distributor. Mr. Auspitz serves as the Executive Vice President and Director, Manning & Napier Advisors, Inc. and President and Director, Manning
& Napier Investor Services, Inc., the Fund’s distributor.
**Prior to June 2010, the Executive Group, consisting of senior executive employee-owners, performed the duties of the Office of the Chief Executive of the Advisor. Effective June 2010, the Executive Group serves as an advisory board to the Chief Executive Officer.
1The term of office for President, Vice President, Chief Financial Officer, Assistant Chief Financial Officer, Chief Legal Officer and Corporate Secretary is one year and until their respective successors are chosen and qualified. All other officers’ terms are indefinite.
This page Intentionally Left Blank
25
Literature Requests (unaudited)
Proxy Voting Policies and Procedures
A description of the policies and procedures that the Fund uses to determine how to vote proxies relating to portfolio securities is available, without charge, upon request:
| | |
By phone | | 1-800-466-3863 |
On the Securities and Exchange | | |
Commission’s (SEC) web site | | http://www.sec.gov |
Proxy Voting Record
Information regarding how the Fund voted proxies relating to portfolio securities during the most recent 12-month period ended June 30th is available, without charge, upon request:
| | |
By phone | | 1-800-466-3863 |
On the SEC’s web site | | http://www.sec.gov |
Quarterly Portfolio Holdings
The Series’ complete schedule of portfolio holdings for the 1st and 3rd quarters of each fiscal year are provided on Form N-Q, and are available, without charge, upon request:
| | |
By phone | | 1-800-466-3863 |
On the SEC’s web site | | http://www.sec.gov |
The Series’ Form N-Q may be reviewed and copied at the SEC’s Public Reference Room in Washington, D.C. Information on the operation of the Public Reference Room may be obtained by calling 1-800-SEC-0330.
Prospectus and Statement of Additional Information (SAI)
The prospectus and SAI provide additional information about each Series, including charges, expenses and risks. These documents are available, without charge, upon request:
| | |
By phone | | 1-800-466-3863 |
On the SEC’s web site | | http://www.sec.gov |
On the Advisor’s web site | | http://www.manning-napier.com |
Additional information available at www.manning-napier.com
1. Fund Holdings - Month-End
2. Fund Holdings - Quarter-End
3. Shareholder Report - Annual
4. Shareholder Report - Semi-Annual

Management Discussion and Analysis (unaudited)
Dear Shareholders:
Over the course of 2010, the markets experienced several ups and downs driven by well-defined swings in investor sentiment. Optimism fueled strong market returns early in the year, as positive economic releases led investors to believe in the potential for a robust U.S. recovery. However, sentiment shifted drastically in May and June as more negative economic news and issues related to Europe’s government debt problems led to notable market losses. In another swing, the markets rebounded in the fall amid better economic developments and prospects that the Federal Reserve would enact another round of quantitative easing. That rally generally continued through the end of the year as the markets reacted positively to the U.S. tax compromise, which extended the Bush-era tax cuts for all income brackets.
With solid gains in the third and fourth quarters, the choppy year ended on a fairly strong note, and broad market indices have now produced back-to-back years of positive results. For the twelve months ending December 31, 2010, the Morgan Stanley Capital International (MSCI) U.S. REIT Index returned 28.48%, noticeably outpacing the S&P 500 Total Return Index, which earned 15.07%. In its first full year of operations, the Real Estate Series had a 24.4% return, outperforming the broad market yet trailing the U.S. REIT Index.
Because of the Advisor’s outlook for a slow, uneven U.S. recovery, the Real Estate Series has maintained a conservative positioning since its inception in November 2009. At the end of 2010, the allocation breakdown of the Series included 26.5% of the portfolio in Multi-family Real Estate Investment Trusts (“REITs”), 21.6% in Office Property REITs, and 12.1% in Lodging (i.e., Hotel REITs and Hotels & Motels). Within the Office sector, the Advisor concentrated on niche property types that are more defensive in nature, such as data centers, life sciences office space, and government-focused office buildings. Meanwhile, the Series continued to have an underweight as compared to the benchmark to more economically sensitive areas, such as the Industrial and Retail sectors. The Industrial sector is linked more directly to economic activity and global trade, and while the Advisor sees potential in niche retailers that can benefit from a restructuring of the traditional mall structure, there is concern as the Retail sector is exposed to the debt-burdened U.S. consumer.
Overall, the Series’ relative underperformance was a result of its conservative bias throughout the year. While this conservative posture aided returns during the market correction in the second quarter, it detracted from relative results as the market rallied on more upbeat U.S. growth prospects. For example, during the latter half of the year, the Series’ underweight to the Retail and Industrial sectors versus the benchmark hurt relative returns. Over the last twelve months, specific selections within Specialized REITs and Residential REITs hurt relative performance, as did an overweight to Office REITs compared to the benchmark. In contrast, a higher allocation to Residential REITs than the benchmark helped relative results, and the Series also benefited from specific selections within the Hotels Resorts & Cruise Lines sub-sector.
While economic developments turned more optimistic toward the end of 2010, the U.S. economy still faces significant headwinds, including a struggling housing market, a stagnant job market, a difficult consumer rebalancing act, and high government debt burdens. Given these long-term structural issues, the slow growth environment in the U.S. will likely remain a reality. As the markets fluctuated around this slow growth trend in 2010, Manning & Napier earned strong absolute returns by staying focused on the fundamentals and maintaining our selective investment process. This investment approach has proved beneficial for the past 40 years, and we believe these qualities will remain important as the market environment unfolds in 2011.
As always, we appreciate your business.
Sincerely,
Manning & Napier Advisors, Inc.
Performance Update as of December 31, 2010 (unaudited)
| | | | |
| | | Average Annual Total Returns As of December 31, 2010 |
| | | One Year | | Since Inception1 |
Manning & Napier Fund, Inc. - Real Estate Series2 | | 24.40% | | 27.85% |
S&P 500 Total Return Index3 | | 15.07% | | 15.41% |
Morgan Stanley Capital International (MSCI) U.S. Real Estate Investment Trust (REIT) Index3,4 | | 28.48% | | 35.25% |
The following graph compares the value of a $10,000 investment in the Manning & Napier Fund, Inc. - Real Estate Series from its inception1 (11/10/09) to present (12/31/10) to the S&P 500 Total Return Index and the MSCI U.S. REIT Index.
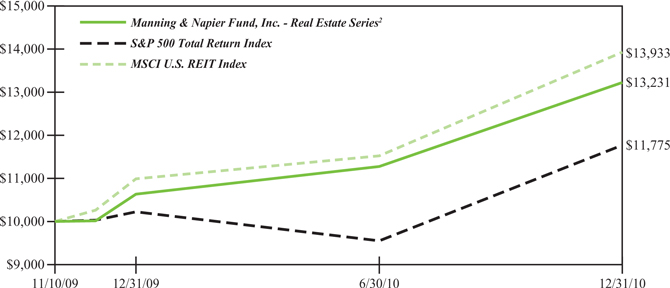
1 Performance numbers for the Series and Index are calculated from November 10, 2009, the Series’ inception date.
2 The Series’ performance does not reflect the deduction of taxes that a shareholder would pay on fund distributions or the redemption of shares. The Series’ performance is historical and may not be indicative of future results. The performance returns shown are inclusive of the net expense ratio of the Series. For the year ended December 31, 2010, this annualized net expense ratio was 1.20%. The annualized gross expense ratio, which does not account for any voluntary or contractual waivers currently in effect, was 1.21% for the year ended December 31, 2010.
3 The S&P 500 Total Return Index is an unmanaged capitalization-weighted measure of 500 widely held common stocks listed on the New York Stock Exchange, American Stock Exchange and the Over-the-Counter market. The Index returns assume daily reinvestment of dividends. The MSCI U.S. REIT Index is a free float-adjusted market capitalization weighted index that is comprised of equity REITs that are included in the MSCI U.S. Investable Market 2500 Index, with the exception of specialty equity REITs that do not generate a majority of their revenue and income from real estate rental and leasing operations. The Index represents approximately 85% of the U.S. REIT universe. Both Indices’ returns, unlike Series returns, do not reflect any fees or expenses.
4 The MSCI U.S. REIT Index returns are now assuming daily reinvestment of net dividends. Prior to December 31, 2010 the Index returns assumed daily reinvestment of gross dividends.
Shareholder Expense Example (unaudited)
As a shareholder of the Series, you may incur two types of costs: (1) transaction costs and (2) ongoing costs, including management fees and other Series expenses. This example is intended to help you understand your ongoing costs (in dollars) of investing in the Series and to compare these costs with the ongoing costs of investing in other mutual funds.
The example is based on an investment of $1,000 invested at the beginning of the period and held for the entire period (July 1, 2010 to December 31, 2010).
Actual Expenses
The first line of the table below provides information about actual account values and actual expenses. You may use the information in this line, together with the amount you invested, to estimate the expenses that you paid over the period. Simply divide your account value by $1,000 (for example, an $8,600 account value divided by $1,000 = 8.6), then multiply the result by the number in the first line under the heading entitled “Expenses Paid During Period” to estimate the expenses you paid on your account during this period.
Hypothetical Example for Comparison Purposes
The second line of the table below provides information about hypothetical account values and hypothetical expenses based on the Series’ actual expense ratio and an assumed rate of return of 5% per year before expenses, which is not the Series’ actual return. The hypothetical account values and expenses may not be used to estimate the actual ending account balance or expenses you paid during the period. You may use this information to compare the ongoing costs of investing in the Series and other funds. To do so, compare this 5% hypothetical example with the 5% hypothetical examples that appear in the shareholder reports of the other funds.
Please note that the expenses shown in the table are meant to highlight your ongoing costs only and do not reflect any transaction costs. Therefore, the second line of the table is useful in comparing ongoing costs only, and will not help you determine the relative total costs of owning different funds. In addition, if these transaction costs were included, your costs would have been higher.
| | | | | | |
| | | Beginning Account Value 7/1/10 | | Ending Account Value 12/31/10 | | Expenses Paid During Period* 7/1/10-12/31/10 |
Actual | | $1,000.00 | | $1,173.20 | | $6.57 |
Hypothetical (5% return before expenses) | | $1,000.00 | | $1,019.16 | | $6.11 |
*Expenses are equal to the Series’ annualized expense ratio (for the six-month period) of 1.20%, multiplied by the average account value over the period, multiplied by 184/365 (to reflect the one-half year period). Expenses are based on the most recent fiscal half year; therefore, the expense ratio stated above may differ from the expense ratio stated in the financial highlights, which is based on one-year data. The Series’ total return would have been lower had certain expenses not been waived during the period.
Portfolio Composition as of December 31, 2010 (unaudited)
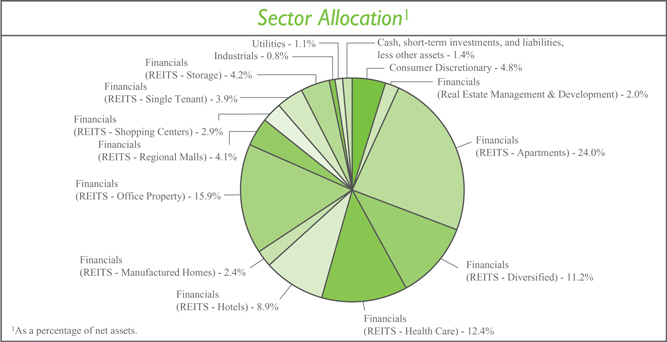
| | | | | | | | | | | | | | |
| TopTen Stock Holdings2 | |
BioMed Realty Trust, Inc. | | | 4.9 | % | | | | | | UDR, Inc. | | | 3.3 | % |
Digital Realty Trust, Inc. | | | 4.5 | % | | | | | | AvalonBay Communities, Inc. | | | 3.1 | % |
Apartment Investment & Management Co. - Class A | | | 3.8 | % | | | | | | Pebblebrook Hotel Trust | | | 3.1 | % |
Host Hotels & Resorts, Inc. | | | 3.6 | % | | | | | | Simon Property Group, Inc. | | | 3.1 | % |
Corporate Office Properties Trust | | | 3.6 | % | | | | | | Boston Properties, Inc. | | | 3.1 | % |
| | | | | |
2As a percentage of total investments. | | | | | | | | | | | | | | |
Investment Portfolio - December 31, 2010
| | | | | | | | |
| | |
| | | Shares | | | Value (Note 2) | |
| | |
COMMON STOCKS - 98.6% | | | | | | | | |
| | |
Consumer Discretionary - 4.8% | | | | | | | | |
Hotels, Restaurants & Leisure - 3.2% | | | | | | | | |
Accor S.A. (France)1 | | | 23,000 | | | $ | 1,025,053 | |
Hyatt Hotels Corp. - Class A* | | | 19,840 | | | | 907,878 | |
Intercontinental Hotels Group plc (United Kingdom)1 | | | 45,900 | | | | 896,605 | |
| | | | | | | | |
| | | | | | | 2,829,536 | |
| | | | | | | | |
Household Durables - 1.6% | | | | | | | | |
DR Horton, Inc. | | | 36,500 | | | | 435,445 | |
Lennar Corp. - Class A | | | 30,000 | | | | 562,500 | |
Toll Brothers, Inc.* | | | 22,800 | | | | 433,200 | |
| | | | | | | | |
| | | | | | | 1,431,145 | |
| | | | | | | | |
Total Consumer Discretionary | | | | | | | 4,260,681 | |
| | | | | | | | |
Financials - 91.9% | | | | | | | | |
Real Estate Management & Development - 2.0% | | | | | | | | |
CB Richard Ellis Group, Inc. - Class A* | | | 46,600 | | | | 954,368 | |
Renhe Commercial Holdings Co. Ltd. (China)1 | | | 1,900,000 | | | | 332,207 | |
Thomas Properties Group, Inc.* | | | 122,000 | | | | 514,840 | |
| | | | | | | | |
| | | | | | | 1,801,415 | |
| | | | | | | | |
REITS - Apartments - 24.0% | | | | | | | | |
American Campus Communities, Inc. | | | 71,210 | | | | 2,261,630 | |
Apartment Investment & Management Co. - Class A | | | 131,000 | | | | 3,385,040 | |
Associated Estates Realty Corp. | | | 57,000 | | | | 871,530 | |
AvalonBay Communities, Inc. | | | 25,070 | | | | 2,821,629 | |
Camden Property Trust | | | 49,710 | | | | 2,683,346 | |
Equity Residential | | | 52,000 | | | | 2,701,400 | |
Home Properties, Inc. | | | 43,540 | | | | 2,416,035 | |
Mid-America Apartment Communities, Inc. | | | 20,430 | | | | 1,297,101 | |
UDR, Inc. | | | 127,550 | | | | 2,999,976 | |
| | | | | | | | |
| | | | | | | 21,437,687 | |
| | | | | | | | |
REITS - Diversified - 11.2% | | | | | | | | |
British Land Co. plc (United Kingdom)1 | | | 108,000 | | | | 886,514 | |
Digital Realty Trust, Inc. | | | 79,200 | | | | 4,081,968 | |
DuPont Fabros Technology, Inc. | | | 113,500 | | | | 2,414,145 | |
Land Securities Group plc (United Kingdom)1 | | | 77,000 | | | | 812,235 | |
Lexington Realty Trust | | | 120,000 | | | | 954,000 | |
Morguard Real Estate Investment Trust (Canada) | | | 58,690 | | | | 868,279 | |
| | | | | | | | |
| | | | | | | 10,017,141 | |
| | | | | | | | |
REITS - Health Care - 12.4% | | | | | | | | |
Cogdell Spencer, Inc. | | | 422,210 | | | | 2,448,818 | |
HCP, Inc. | | | 70,790 | | | | 2,604,364 | |
Health Care REIT, Inc. | | | 49,520 | | | | 2,359,133 | |
| | |
| The accompanying notes are an integral part of the financial statements. | | 5 |
Investment Portfolio - December 31, 2010
| | | | | | | | |
| | |
| | | Shares | | | Value (Note 2) | |
| | |
COMMON STOCKS (continued) | | | | | | | | |
| | |
Financials (continued) | | | | | | | | |
REITS - Health Care (continued) | | | | | | | | |
Healthcare Realty Trust, Inc. | | | 79,580 | | | $ | 1,684,708 | |
National Health Investors, Inc. | | | 16,633 | | | | 748,818 | |
Omega Healthcare Investors, Inc. | | | 52,230 | | | | 1,172,041 | |
| | | | | | | | |
| | | | | | | 11,017,882 | |
| | | | | | | | |
REITS - Hotels - 8.9% | | | | | | | | |
DiamondRock Hospitality Co.* | | | 79,410 | | | | 952,920 | |
Host Hotels & Resorts, Inc. | | | 182,030 | | | | 3,252,876 | |
LaSalle Hotel Properties | | | 33,890 | | | | 894,696 | |
Pebblebrook Hotel Trust | | | 138,000 | | | | 2,804,160 | |
| | | | | | | | |
| | | | | | | 7,904,652 | |
| | | | | | | | |
REITS - Manufactured Homes - 2.4% | | | | | | | | |
Equity Lifestyle Properties, Inc. | | | 39,030 | | | | 2,182,948 | |
| | | | | | | | |
REITS - Office Property - 15.9% | | | | | | | | |
Alexandria Real Estate Equities, Inc. | | | 36,920 | | | | 2,704,759 | |
BioMed Realty Trust, Inc. | | | 235,710 | | | | 4,395,991 | |
Boston Properties, Inc. | | | 32,120 | | | | 2,765,532 | |
Corporate Office Properties Trust | | | 91,740 | | | | 3,206,313 | |
Mack-Cali Realty Corp. | | | 33,400 | | | | 1,104,204 | |
| | | | | | | | |
| | | | | | | 14,176,799 | |
| | | | | | | | |
REITS - Regional Malls - 4.1% | | | | | | | | |
General Growth Properties, Inc. | | | 54,370 | | | | 841,648 | |
Simon Property Group, Inc. | | | 28,000 | | | | 2,785,720 | |
| | | | | | | | |
| | | | | | | 3,627,368 | |
| | | | | | | | |
REITS - Shopping Centers - 2.9% | | | | | | | | |
Equity One, Inc. | | | 43,000 | | | | 781,740 | |
Tanger Factory Outlet Centers | | | 35,860 | | | | 1,835,673 | |
| | | | | | | | |
| | | | | | | 2,617,413 | |
| | | | | | | | |
REITS - Single Tenant - 3.9% | | | | | | | | |
National Retail Properties, Inc. | | | 65,070 | | | | 1,724,355 | |
Realty Income Corp. | | | 50,630 | | | | 1,731,546 | |
| | | | | | | | |
| | | | | | | 3,455,901 | |
| | | | | | | | |
REITS - Storage - 4.2% | | | | | | | | |
Public Storage | | | 24,700 | | | | 2,505,074 | |
Sovran Self Storage, Inc. | | | 33,000 | | | | 1,214,730 | |
| | | | | | | | |
| | | | | | | 3,719,804 | |
| | | | | | | | |
Total Financials | | | | | | | 81,959,010 | |
| | | | | | | | |
| | |
| 6 | | The accompanying notes are an integral part of the financial statements. |
Investment Portfolio - December 31, 2010
| | | | | | | | |
| | |
| | | Shares | | | Value (Note 2) | |
| | |
COMMON STOCKS (continued) | | | | | | | | |
| | |
Industrials - 0.8% | | | | | | | | |
Transportation Infrastructure - 0.8% | | | | | | | | |
Groupe Eurotunnel S.A. (France)1 | | | 83,000 | | | $ | 730,420 | |
| | | | | | | | |
Utilities - 1.1% | | | | | | | | |
Electric Utilities - 1.1% | | | | | | | | |
Brookfield Infrastructure Partners LP - ADR (Bermuda) | | | 45,600 | | | | 959,880 | |
AET&D Holdings No. 1 Ltd. (Australia)2 | | | 125,000 | | | | — | |
| | | | | | | | |
Total Utilities | | | | | | | 959,880 | |
| | | | | | | | |
TOTAL COMMON STOCKS | | | | | | | | |
(Identified Cost $72,141,203) | | | | | | | 87,909,991 | |
| | | | | | | | |
| | |
SHORT-TERM INVESTMENTS - 2.2% | | | | | | | | |
| | |
Dreyfus Cash Management, Inc. - Institutional Shares3, 0.14% | | | | | | | | |
(Identified Cost $1,926,259) | | | 1,926,259 | | | | 1,926,259 | |
| | | | | | | | |
| | |
TOTAL INVESTMENTS - 100.8% | | | | | | | | |
(Identified Cost $74,067,462) | | | | | | | 89,836,250 | |
LIABILITIES, LESS OTHER ASSETS - (0.8%) | | | | | | | (700,275 | ) |
| | | | | | | | |
NET ASSETS - 100% | | | | | | $ | 89,135,975 | |
| | | | | | | | |
No. - Number
REITS - Real Estate Investment Trusts
*Non-income producing security
1International Fair Value factor from pricing service was applied.
2Security has been valued at fair value (see Note 2 to the financial statements).
3Rate shown is the current yield as of December 31, 2010.
| | |
| The accompanying notes are an integral part of the financial statements. | | 7 |
Statement of Assets and Liabilities
December 31, 2010
| | | | |
ASSETS: | | | | |
| |
Investments, at value (identified cost $74,067,462) (Note 2) | | $ | 89,836,250 | |
Cash | | | 3,124 | |
Dividends receivable | | | 344,952 | |
Receivable for fund shares sold | | | 77,125 | |
| | | | |
| |
TOTAL ASSETS | | | 90,261,451 | |
| | | | |
| |
LIABILITIES: | | | | |
| |
Accrued management fees (Note 3) | | | 69,312 | |
Accrued fund accounting and administration fees (Note 3) | | | 4,387 | |
Accrued transfer agent fees (Note 3) | | | 1,941 | |
Accrued Chief Compliance Officer service fees (Note 3) | | | 241 | |
Payable for securities purchased | | | 854,558 | |
Payable for fund shares repurchased | | | 135,554 | |
Other payables and accrued expenses | | | 59,483 | |
| | | | |
| |
TOTAL LIABILITIES | | | 1,125,476 | |
| | | | |
| |
TOTAL NET ASSETS | | $ | 89,135,975 | |
| | | | |
| |
NET ASSETS CONSIST OF: | | | | |
| |
Capital stock | | $ | 70,883 | |
Additional paid-in-capital | | | 71,933,274 | |
Distributions in excess of net investment income | | | (6,678 | ) |
Accumulated net realized gain on investments, foreign currency and translation of other assets and liabilities | | | 1,369,605 | |
Net unrealized appreciation on investments, foreign currency and translation of other assets and liabilities | | | 15,768,891 | |
| | | | |
| |
TOTAL NET ASSETS | | $ | 89,135,975 | |
| | | | |
| |
NET ASSET VALUE, OFFERING PRICE AND REDEMPTION PRICE PER SHARE -
Class A ($89,135,975/7,088,339 shares) | | $ | 12.58 | |
| | | | |
| | |
| 8 | | The accompanying notes are an integral part of the financial statements. |
Statement of Operations
For the Year Ended December 31, 2010
| | | | |
INVESTMENT INCOME: | | | | |
| |
Dividends (net of foreign taxes withheld, $2,204) | | $ | 1,770,300 | |
| | | | |
| |
EXPENSES: | | | | |
| |
Management fees (Note 3) | | | 799,201 | |
Fund accounting and administration fees (Note 3) | | | 37,389 | |
Transfer agent fees (Note 3) | | | 14,682 | |
Chief Compliance Officer service fees (Note 3) | | | 2,741 | |
Directors’ fees (Note 3) | | | 1,305 | |
Custodian fees | | | 5,932 | |
Miscellaneous | | | 108,584 | |
| | | | |
| |
Total Expenses | | | 969,834 | |
Less reduction of expenses (Note 3) | | | (12,819 | ) |
| | | | |
| |
Net Expenses | | | 957,015 | |
| | | | |
| |
NET INVESTMENT INCOME | | | 813,285 | |
| | | | |
| |
REALIZED AND UNREALIZED GAIN ON INVESTMENTS AND FOREIGN CURRENCY: | | | | |
| |
Net realized gain on-Investments | | | 4,453,842 | |
Foreign currency and translation of other assets and liabilities | | | 1,672 | |
| | | | |
| |
| | | 4,455,514 | |
| | | | |
| |
Net change in unrealized appreciation on-Investments | | | 12,074,199 | |
Foreign currency and translation of other assets and liabilities | | | 103 | |
| | | | |
| |
| | | 12,074,302 | |
| | | | |
| |
NET REALIZED AND UNREALIZED GAIN ON INVESTMENTS AND FOREIGN CURRENCY | | | 16,529,816 | |
| | | | |
| |
NET INCREASE IN NET ASSETS RESULTING FROM OPERATIONS | | $ | 17,343,101 | |
| | | | |
| | |
| The accompanying notes are an integral part of the financial statements. | | 9 |
Statements of Changes in Net Assets
| | | | | | | | |
| | | For the Year Ended
12/31/10 | | | For the Period 11/10/091 to 12/31/09 | |
INCREASE (DECREASE) IN NET ASSETS: | | | | | | | | |
| | |
OPERATIONS: | | | | | | | | |
| | |
Net investment income | | $ | 813,285 | | | $ | 118,419 | |
Net realized gain on investments and foreign currency | | | 4,455,514 | | | | 112,303 | |
Net change in unrealized appreciation on investments and foreign currency | | | 12,074,302 | | | | 3,694,589 | |
| | | | | | | | |
| | |
Net increase from operations | | | 17,343,101 | | | | 3,925,311 | |
| | | | | | | | |
| | |
DISTRIBUTIONS TO SHAREHOLDERS (Note 9): | | | | | | | | |
| | |
From net investment income | | | (842,827 | ) | | | (103,993 | ) |
From net realized gain on investments | | | (3,149,000 | ) | | | (40,774 | ) |
| | | | | | | | |
| | |
Total distributions to shareholders | | | (3,991,827 | ) | | | (144,767 | ) |
| | | | | | | | |
| | |
CAPITAL STOCK ISSUED AND REPURCHASED: | | | | | | | | |
| | |
Net increase from capital share transactions (Note 5) | | | 6,606,115 | | | | 65,398,042 | |
| | | | | | | | |
| | |
Net increase in net assets | | | 19,957,389 | | | | 69,178,586 | |
| | |
NET ASSETS: | | | | | | | | |
| | |
Beginning of period | | | 69,178,586 | | | | — | |
| | | | | | | | |
| | |
End of period (including distributions in excess of net investment income of $6,678 and undistributed netinvestment income of $14,426, respectively) | | $ | 89,135,975 | | | $ | 69,178,586 | |
| | | | | | | | |
| | |
1 Commencement of operations. | | | | | | | | |
| | |
| 10 | | The accompanying notes are an integral part of the financial statements. |
Financial Highlights
| | | | | | | | |
| | | For the Year Ended 12/31/10 | | | For the Period 11/10/091 to 12/31/09 | |
Per share data (for a share outstanding throughout each period): | | | | | | | | |
Net asset value - Beginning of period | | | $10.61 | | | | $10.00 | |
| | | | | | | | |
| | |
Income from investment operations: | | | | | | | | |
Net investment income2 | | | 0.12 | | | | 0.02 | |
Net realized and unrealized gain on investments | | | 2.44 | | | | 0.62 | |
| | | | | | | | |
| | |
Total from investment operations | | | 2.56 | | | | 0.64 | |
| | | | | | | | |
| | |
Less distributions to shareholders: | | | | | | | | |
From net investment income | | | (0.12) | | | | (0.02) | |
From net realized gain on investments | | | (0.47) | | | | (0.01) | |
| | | | | | | | |
Total distributions to shareholders | | | (0.59) | | | | (0.03) | |
| | | | | | | | |
Net asset value - End of period | | | $12.58 | | | | $10.61 | |
| | | | | | | | |
| | |
Net assets - End of period
(000’s omitted) | | | $89,136 | | | | $69,179 | |
| | | | | | | | |
Total return3 | | | 24.40% | | | | 6.36% | |
Ratios (to average net assets)/Supplemental Data: | | | | | | | | |
Expenses* | | | 1.20% | | | | 1.20%4 | |
Net investment income | | | 1.02% | | | | 1.43%4 | |
Portfolio turnover | | | 34% | | | | 3% | |
|
*The investment advisor did not impose all or a portion of its management fees, and other fees in some periods and in some periods paid a portion of the series’ expenses. If these expenses had been incurred by the Series, the expense ratio (to average net assets) would have been increased by the following amounts: | |
| | | 0.01% | | | | 0.38%4 | |
1Commencement of operations.
2Calculated based on average shares outstanding during the periods.
3Represents aggregate total return for the periods indicated, and assumes reinvestment of all distributions. Total return would have been lower had certain expenses not been waived or reimbursed during the periods. Periods less than one year are not annualized.
4Annualized.
| | |
| The accompanying notes are an integral part of the financial statements. | | 11 |
Notes to Financial Statements
Real Estate Series (the “Series”) is a no-load non-diversified series of Manning & Napier Fund, Inc. (the “Fund”). The Fund is organized in Maryland and is registered under the Investment Company Act of 1940, as amended, as an open-end management investment company.
The Series’ investment objective is to provide long-term growth by investing principally in the common stocks of companies in real estate-based industries.
The Fund’s Advisor is Manning & Napier Advisors, Inc. (the “Advisor”). Shares of the Series are offered to investors, clients and employees of the Advisor and its affiliates. The total authorized capital stock of the Fund consists of 10.0 billion shares of common stock each having a par value of $0.01. As of December 31, 2010, 6.2 billion shares have been designated in total among 29 series, of which 100 million have been designated as Real Estate Series Class A common stock.
| 2. | SIGNIFICANT ACCOUNTING POLICIES |
Security Valuation
Portfolio securities, including domestic equities, foreign equities, warrants and options, listed on an exchange other than the NASDAQ National Market System are valued at the latest quoted sales price of the exchange on which the security is primarily traded. Securities not traded on valuation date or securities not listed on an exchange are valued at the latest quoted bid price provided by the Fund’s pricing service. Securities listed on the NASDAQ National Market System are valued in accordance with the NASDAQ Official Closing Price.
Short-term investments that mature in sixty days or less are valued at amortized cost, which approximates market value. Investments in open-end investment companies are valued at their net asset value per share on valuation date.
Volume and level of activity in established markets for an asset or liability are evaluated to determine whether recent transactions and quoted prices are determinative of fair value. Where there have been significant decreases in volume and level of activity, further analysis and adjustment may be necessary to estimate fair value. The Series measures fair value in these instances by the use of inputs and valuation techniques which may be based upon current market prices of securities that are comparable in coupon, rating, maturity and industry and/or expectation of future cash flows. As a result of trading in relatively thin markets and/or markets that experience significant volatility, the prices used by the Series to value these securities may differ from the value that would be realized if these securities were sold, and the differences could be material.
Securities for which representative valuations or prices are not available from the Fund’s pricing service may be valued at fair value. Due to the inherent uncertainty of valuations of such securities, the fair value may differ significantly from the values that would have been used had a ready market for such securities existed. If trading or events occurring after the close of the principal market in which securities are traded are expected to materially affect the value of those securities, then they may be valued at their fair value, taking this trading or these events into account. Fair value is determined in good faith by the Advisor under procedures approved by and under the general supervision and responsibility of the Fund’s Board of Directors (the “Board”). In accordance with the procedures approved by the Board, the Series applies fair value pricing on a daily basis except for North American, Central American, South American and Caribbean equity securities. Fair valuing of securities is determined with the assistance of a pricing service using calculations or factors based on indices of domestic securities and other appropriate indicators, such as prices of relevant American Depository Receipts and futures contracts, to adjust local market prices for subsequent movements through the time the Series calculates its net asset value. The value of securities used for the net asset value calculation under the procedures may differ from published prices for the same securities. It is the Fund’s
Notes to Financial Statements
| 2. | SIGNIFICANT ACCOUNTING POLICIES (continued) |
Security Valuation (continued)
policy to classify each foreign equity security, except for those in the regions noted above, as Level 2 securities due to the fact the pricing service evaluated what factor was applied to the calculated end of day market price.
Various inputs are used in determining the value of the Series’ assets or liabilities carried at market value. These inputs are summarized in three broad levels. Level 1 includes quoted prices in active markets for identical assets and liabilities. Level 2 includes other significant observable inputs (including quoted prices for similar securities, interest rates, prepayment speeds, credit risk, etc.). Level 3 includes significant unobservable inputs (including the Series’ own assumptions in determining the fair value of investments). The inputs or methodology used for valuing securities are not necessarily an indication of the risk associated with investing in those securities.
The following is a summary of the valuation levels used for major security types as of December 31, 2010 in valuing the Series’ assets or liabilities carried at market value:
| | | | | | | | | | | | | | | | |
| Description | | Total | | | Level 1 | | | Level 2 | | | Level 3 | |
Assets: | | | | | | | | | | | | | | | | |
Equity securities* | | $ | 87,909,991 | | | $ | 83,226,957 | | | $ | 4,683,034 | | | $ | — | *** |
Preferred securities | | | — | | | | — | | | | — | | | | — | |
Debt securities: | | | | | | | | | | | | | | | | |
Mutual funds | | | 1,926,259 | | | | 1,926,259 | | | | — | | | | — | |
Other financial instruments**: | | | — | | | | — | | | | — | | | | — | |
| | | | | | | | | | | | | | | | |
Total assets: | | | 89,836,250 | | | | 85,153,216 | | | | 4,683,034 | | | | — | |
| | | | | | | | | | | | | | | | |
Liabilities: | | | | | | | | | | | | | | | | |
Other financial instruments**: | | | — | | | | — | | | | — | | | | — | |
Total liabilities: | | | — | | | | — | | | | — | | | | — | |
| | | | | | | | | | | | | | | | |
Total | | $ | 89,836,250 | | | $ | 85,153,216 | | | $ | 4,683,034 | | | $ | — | |
| | | | | | | | | | | | | | | | |
*Includes common stock, warrants and rights. Please see the Investment Portfolio for industry classification and for securities where an International Fair Value factor from the pricing service was applied to value the security. Such securities are included in Level 2 in the table above.
**Other financial instruments are derivative instruments not reflected in the Investment Portfolio, such as futures, forwards and swap contracts, which are valued at the unrealized appreciation/depreciation on the instrument. As of December 31, 2010, the Series did not hold any derivative instruments.
***AET&D Holdings No.1 Ltd. is a Level 3 security as of December 31, 2010. However, there is no cost or market value for this security reported in the financial statements.
The Fund’s policy is to recognize transfers in and transfers out of the valuation levels as of the beginning of the reporting period. There were no transfers between Level 1 and Level 2 during the year ended December 31, 2010.
Additional disclosure surrounding the activity in Level 3 fair value measurement will be effective for fiscal years beginning after December 15, 2010. Management has concluded that this will not have a material impact on the Series’ financial statements.
Security Transactions, Investment Income and Expenses
Security transactions are accounted for on trade date. Dividend income is recorded on the ex-dividend date, except that if the ex-dividend date has passed, certain dividends from foreign securities are recorded as soon as the Fund is informed of the ex-dividend date. Non-cash dividends, if any, are recorded at the fair market value of the securities
Notes to Financial Statements
| 2. | SIGNIFICANT ACCOUNTING POLICIES (continued) |
Security Transactions, Investment Income and Expenses (continued)
received. Interest income, including amortization of premium and accretion of discounts using the effective interest method, is earned from settlement date and accrued daily.
Expenses are recorded on an accrual basis. Most expenses of the Fund can be attributed to a specific series. Expenses which cannot be directly attributed are apportioned among the series in the Fund in such a manner as deemed equitable by the Fund’s Board, taking into consideration, among other things, the nature and type of expense.
The Fund records distributions received in excess of income from underlying investments as a reduction of cost of investments and/or realized gain. Such amounts are based on estimates if actual amounts are not available and actual amounts of income, realized gain and return of capital may differ from the estimated amounts. The Fund adjusts the estimated amounts of components of distributions (and consequently its net investment income) as necessary once the issuers provide information about the actual composition of the distributions.
The Series uses the identified cost method for determining realized gain or loss on investments for both financial statement and federal income tax reporting purposes.
Foreign Currency Translation
The books and records of the Series are maintained in U.S. dollars. Foreign currencies, investments and other assets and liabilities are translated into U.S. dollars at the current exchange rates. Purchases and sales of investment securities and income and expenses are translated on the respective dates of such transactions. The Series does not isolate realized and unrealized gains and losses attributable to changes in the exchange rates from gains and losses that arise from changes in the market value of investments. Such fluctuations are included with net realized and unrealized gain or loss on investments. Net realized foreign currency gains and losses represent foreign currency gains and losses between trade date and settlement date on securities transactions, gains and losses on disposition of foreign currencies and the difference between the amount of income and foreign withholding taxes recorded on the books of the Series and the amounts actually received or paid.
Federal Taxes
The Series’ policy is to comply with the provisions of the Internal Revenue Code applicable to regulated investment companies. The Series is not subject to federal income tax or excise tax to the extent that the Series distributes to shareholders each year its taxable income, including any net realized gains on investments, in accordance with requirements of the Internal Revenue Code. Accordingly, no provision for federal income tax or excise tax has been made in the financial statements.
Management evaluates its tax positions to determine if the tax positions taken meet the minimum recognition threshold in connection with accounting for uncertainties in income tax positions taken or expected to be taken for the purposes of measuring and recognizing tax liabilities in the financial statements. Recognition of tax benefits of an uncertain tax position is required only when the position is “more likely than not” to be sustained assuming examination by taxing authorities. At December 31, 2010, the Series has recorded no liability for net unrecognized tax benefits relating to uncertain income tax positions taken or expected to be taken in future tax returns.
The Series files income tax returns in the U.S. federal jurisdiction, various states and foreign jurisdictions, as required. No income tax returns are currently under investigation. The statute of limitations on the Series’ tax returns remains open for the period ended December 31, 2009 and the year ended December 31, 2010. The Fund is not aware of any tax positions for which it is reasonably possible that the total amounts of unrecognized tax benefits will significantly change in the next twelve months.
Notes to Financial Statements
| 2. | SIGNIFICANT ACCOUNTING POLICIES (continued) |
Federal Taxes (continued)
Additionally, based on the Fund’s understanding of the tax rules and rates related to income, gains and transactions for foreign jurisdictions in which it invests, the Series will provide for foreign taxes, and where appropriate, deferred foreign tax.
Distributions of Income and Gains
Distributions to shareholders of net investment income and net realized gains are made annually. An additional distribution may be necessary to avoid taxation of the Series. Distributions are recorded on the ex-dividend date.
Indemnifications
The Fund’s organizational documents provide former and current directors and officers with a limited indemnification against liabilities arising in connection with the performance of their duties to the Fund. In the normal course of business, the Fund may also enter into contracts that provide general indemnifications. The Fund’s maximum exposure under these arrangements is unknown as this would be dependent on future claims that may be made against the Fund. The risk of material loss from such claims is considered remote.
Other
The preparation of financial statements in conformity with accounting principles generally accepted in the United States of America requires management to make estimates and assumptions that affect the reported amounts of assets and liabilities and the disclosure of contingent assets and liabilities at the date of the financial statements and the reported amounts of income and expenses during the reporting period. Actual results could differ from those estimates.
| 3. | TRANSACTIONS WITH AFFILIATES |
The Fund has an Investment Advisory Agreement (the “Agreement”) with the Advisor, for which the Series pays a fee, computed daily and payable monthly, at an annual rate of 1.00% of the Series’ average daily net assets.
Under the Agreement, personnel of the Advisor provide the Series with advice and assistance in the choice of investments and the execution of securities transactions, and otherwise maintain the Series’ organization. The Advisor also provides the Fund with necessary office space and fund administration and support services. The salaries of all officers of the Fund (except a percentage of the Fund’s Chief Compliance Officer’s salary, which is paid by the Fund), and of all Directors who are “affiliated persons” of the Fund, or of the Advisor, and all personnel of the Fund, or of the Advisor, performing services relating to research, statistical and investment activities, are paid by the Advisor. Each “non-affiliated” Director receives an annual stipend, which is allocated among all the active series of the Fund. In addition, these Directors also receive a fee per Board meeting attended plus a fee for each committee meeting attended.
The Advisor has contractually agreed, until at least April 30, 2012, to waive its fee and, if necessary, pay other operating expenses of the Series in order to maintain total direct annual fund operating expenses for the Series at no more than 1.20% of average daily net assets each year. Accordingly, the Advisor waived fees of $12,061 for the year ended December 31, 2010, which is included as a reduction of expenses on the Statement of Operations. For the year ended December 31, 2010, the Advisor voluntarily waived additional fees of $758, which is also included as a reduction of expenses on the Statement of Operations. The Advisor is not eligible to recoup any expense that has been waived or reimbursed in prior years.
Manning & Napier Investor Services, Inc., a registered broker-dealer affiliate of the Advisor, acts as distributor for the Fund’s shares. The services of Manning & Napier Investor Services, Inc. are provided at no additional cost to the Series.
Notes to Financial Statements
| 3. | TRANSACTIONS WITH AFFILIATES (continued) |
The Advisor has agreements with PNC Global Investment Servicing (U.S.) Inc. (“PNCGIS”) under which PNCGIS serves as sub-accountant services agent and sub-transfer agent. The Fund pays the Advisor an annual fee related to fund accounting and administration of 0.0175% on the first $3 billion of average daily net assets (excluding Target Series); 0.015% on the next $3 billion of average daily net assets (excluding Target Series); and 0.01% of the average daily net assets in excess of $6 billion (excluding Target Series); plus a base fee of $25,500 per Series. Transfer Agent fees are charged to the Fund on a per account basis. Additionally, certain transaction- and cusip-based fees and out-of-pocket expenses, including charges for reporting relating to the Fund’s compliance program, are charged.
Effective July 1, 2010, PNCGIS was sold to The Bank of New York Mellon Corporation, the Series’ custodian. At the close of the sale, PNCGIS changed its name to BNY Mellon Investment Servicing (U.S.) Inc. (“BNY”).
Expenses not directly attributable to a Series are allocated based on each Series’ relative net assets or number of accounts, depending on the expense.
| 4. | PURCHASES AND SALES OF SECURITIES |
For the year ended December 31, 2010, purchases and sales of securities, other than U.S. Government securities and short-term securities, were $30,723,037 and $26,832,796, respectively. There were no purchases or sales of U.S. Government securities.
| 5. | CAPITAL STOCK TRANSACTIONS |
Transactions in shares of Real Estate Series were:
| | | | | | | | | | | | | | | | |
| | | | | | For the period 11/10/09 | |
| | | For the Year Ended 12/31/10 | | | (commencement of operations) to 12/31/09 | |
| | | Shares | | | Amount | | | Shares | | | Amount | |
Sold | | | 938,366 | | | $ | 11,015,288 | | | | 6,617,571 | | | $ | 66,420,562 | |
Reinvested | | | 326,194 | | | | 3,931,823 | | | | 13,571 | | | | 139,922 | |
Repurchased | | | (694,124 | ) | | | (8,340,996 | ) | | | (113,239 | ) | | | (1,162,442 | ) |
| | | | | | | | | | | | | | | | |
Total | | | 570,436 | | | $ | 6,606,115 | | | | 6,517,903 | | | $ | 65,398,042 | |
| | | | | | | | | | | | | | | | |
Substantially all of the Series’ shares represent investments by fiduciary accounts over which the Advisor has sole investment discretion.
The Series may trade in instruments including written and purchased options, forward foreign currency exchange contracts and futures contracts and other derivatives in the normal course of investing activities to assist in managing exposure to various market risks. Investments in these instruments may subject the Series to various elements of risk, which may involve, to a varying degree, elements of risk in excess of the amounts recognized for financial statement purposes. These risks include: the risk that changes in the value of a derivative may not correlate perfectly with the underlying asset, rate or index, counterparty credit risk related to over the counter derivatives counterparties’ failure to perform under contract terms, liquidity risk related to the lack of a liquid market for these contracts allowing the fund to close out its position(s) and documentation risk relating to disagreement over contract terms. No such investments were held by the Series during the year ended December 31, 2010.
Notes to Financial Statements
Investing in securities of foreign companies and foreign governments involves special risks and considerations not typically associated with investing in securities of domestic companies and the U.S. Government. These risks include revaluation of currencies and future adverse political and economic developments. Moreover, securities of foreign companies and foreign governments and their markets may be less liquid and their prices more volatile than those of comparable domestic companies and the U.S. Government.
The Series may focus its investments in certain real estate related industries; hence, the Series may subject itself to a greater degree of risk than a series that is more diversified.
| 9. | FEDERAL INCOME TAX INFORMATION |
The amount and characterization of certain income and capital gains to be distributed are determined in accordance with federal income tax regulations, which may differ from accounting principles generally accepted in the United States of America. These differences are primarily due to differing book and tax treatments in the timing of the recognition of net investment income or gains and losses, including foreign currency gains and losses, losses deferred due to wash sales, post-October losses and investments in passive foreign investment companies (PFICs). The Series may periodically make reclassifications among its capital accounts to reflect income and gains available for distribution (or available capital loss carryovers) under income tax regulations without impacting the Series’ net asset value. Any such reclassifications are not reflected in the financial highlights.
The tax character of distributions paid were as follows:
| | | | | | | | |
| | | For the Year Ended 12/31/10 | | | For the Period Ended 12/31/09* | |
Ordinary income | | $ | 3,765,261 | | | $ | 103,993 | |
Long-term capital gains | | | 226,566 | | | | 40,774 | |
* The Fund commenced operations on November 10, 2009.
For the year ended December 31, 2010, the Series elected to defer $125 of currency losses, attributable to post-October losses.
At December 31, 2010, the tax basis of distributable earnings and the net unrealized appreciation based on the identified cost of investments for federal income tax purposes were as follows:
| | | | | | |
Cost for federal income tax purposes | | | $74,078,511 | | | |
Unrealized appreciation | | | $16,380,246 | | | |
Unrealized depreciation | | | (622,507) | | | |
| | | | | | |
Net unrealized appreciation | | | $15,757,739 | | | |
| | | | | | |
Undistributed ordinary income | | | 504,518 | | | |
Undistributed long-term gains | | | 869,583 | | | |
Report of Independent Registered Public Accounting Firm
To the Board of Directors of Manning & Napier Fund, Inc. and Shareholders of Real Estate Series:
In our opinion, the accompanying statement of assets and liabilities, including the investment portfolio, and the related statements of operations and of changes in net assets and the financial highlights present fairly, in all material respects, the financial position of the Real Estate Series (a series of Manning & Napier Fund, Inc., hereafter referred to as the “Series”) at December 31, 2010, and the results of its operations for the year then ended and the changes in its net assets and the financial highlights for the year then ended and for the period November 10, 2009 (commencement of operations) through December 31, 2009, in conformity with accounting principles generally accepted in the United States of America. These financial statements and financial highlights (hereafter referred to as “financial statements”) are the responsibility of the Series’ management. Our responsibility is to express an opinion on these financial statements based on our audits. We conducted our audits of these financial statements in accordance with the standards of the Public Company Accounting Oversight Board (United States). Those standards require that we plan and perform the audit to obtain reasonable assurance about whether the financial statements are free of material misstatement. An audit includes examining, on a test basis, evidence supporting the amounts and disclosures in the financial statements, assessing the accounting principles used and significant estimates made by management, and evaluating the overall financial statement presentation. We believe that our audits, which included confirmation of securities at December 31, 2010 by correspondence with the custodian and brokers, provide a reasonable basis for our opinion.
New York, New York
February 22, 2011
Supplemental Tax Information (unaudited)
All designations are based on financial information available as of the date of this annual report and, accordingly are subject to change.
For federal income tax purposes, the Series designates for the current fiscal year $66,924 or, if different, the maximum amount allowable under the tax law as qualified dividend income.
Pursuant to Section 852 of the Internal Revenue Code, as amended, the Series hereby designates $226,566 as capital gains for its taxable year ended December 31, 2010, or if different, the maximum allowable under tax law.
For corporate shareholders, the percentage of investment income (dividend income plus short-term gains, if any) that qualifies for the dividends received deduction for the current fiscal year is 0.86%, or if different, the maximum allowable under tax law.
Renewal of Investment Advisory Agreement (unaudited)
At the Manning & Napier Fund, Inc. (the “Fund”) Board of Directors’ (the “Board”) meeting, held on November 17, 2010, the Investment Advisory Agreement (the “Agreement”) between the Fund and Manning & Napier Advisors, Inc. (the “Advisor”) was reviewed by the Board for renewal. In connection with the decision whether to renew the Agreement, a variety of material was prepared for and reviewed by the Board.
Representatives of the Advisor attended the meeting and presented additional oral and written information to the Board to assist the Board in its considerations. The discussion immediately below outlines the materials and information presented to the Board in connection with the Board’s 2010 Annual Review of the Agreement and the conclusions made by the Directors when determining to continue the Agreement.
| | • | | The Board considered the services provided by the Advisor under the Agreement including, among others: deciding what securities to purchase and sell for each Series; arranging for the purchase and sale of such securities by placing orders with broker-dealers; administering the affairs of the Fund (including the books and records of the Fund not maintained by third party service providers such as the custodian or sub-transfer agent); arranging for the insurance coverage for the Fund; and supervising the preparation of tax returns, SEC filings (including registration statements) and reports to shareholders for the Fund. The Board also considered the nature and quality of such services provided under the Agreement in light of the Advisor’s services provided to the Fund for 24 years. The Board discussed the quality of these services with representatives from the Advisor and concluded that the Advisor was performing its services to the Fund required under the Agreement in a reasonable manner. |
| | • | | The Board considered the investment performance of the various Series of the Fund. The investment performance for each Series was reviewed on a cumulative basis since inception and on a one year basis. In addition, annualized performance for the following time periods was considered: inception, three year, five year, ten year, and current market cycle. A market cycle includes periods of both rising and falling markets. Returns for established benchmark indices for each Series were provided for each time period. The Board noted that the various Series were competitive against their respective benchmarks and/or peer groups over various time periods, but in particular over the full market cycle period relevant for the Series. In addition, the Board considered at the meeting (and considers on a quarterly basis) a peer group performance analysis consisting of Morningstar universes of mutual funds with similar investment objectives. The Board discussed the performance with representatives from the Advisor and concluded that the investment performance of each of the Fund’s Series was reasonable based on the Fund’s actual performance and comparative performance, especially performance over the current market cycle. |
| | • | | The Board considered the costs of the Advisor’s services and the profits of the Advisor as they relate to the Advisor’s services to the Fund under the Agreement. In reviewing the Advisor’s costs and profits, the Board discussed the Advisor’s revenues generated from the Fund (on both an actual and adjusted basis) and its expenses associated with providing the services under the Agreement. In addition, the Board reviewed the Advisor’s expenses associated with Fund activities outside of the Agreement (such as expense reimbursements pursuant to expense caps and payments made by the Advisor to third party platforms on which shares of the Fund are available for purchase). It was noted by representatives of the Advisor that 11 of the 27 active Series of the Fund are currently experiencing expenses above the capped expense ratios. After discussing the above costs and profits, the Board concluded that the Advisor’s profitability relating to its services provided under the Agreement was reasonable. |
| | • | | The Board considered the fees and expenses of the various Series of the Fund. The Advisor presented the advisory fees and total expenses for each Series, including the advisory fee adjusted for any expense waivers or reimbursements (either contractual or voluntary) paid by the Advisor. The advisory fees and expense ratios of each Series were compared to an average (on both a mean and median basis) of similar funds as disclosed on the Morningstar database. Representatives of the Advisor discussed with the Board the levels of its advisory |
Renewal of Investment Advisory Agreement (unaudited)
| | fee for each Series of the Fund and as compared to the median and mean advisory fees for similar funds as listed on Morningstar. Expense ratios for every Series, except the Pro-Blend’s Class R and Class C, and Target Class R and Class C, are currently below the median and mean for similar funds as listed on Morningstar. Based on their review of the information provided, the Board concluded that the fees and expenses of each Series of the Fund were reasonable on a comparative basis. |
| | • | | The Board also considered the other benefits the Advisor derives from its relationship with the Fund. Such other benefits include certain research products provided by soft dollars. Given the level of soft dollar transactions involving the Fund, the Board concluded that these additional benefits to the Advisor were reasonable. |
| | • | | In addition to the factors described above, the Board considered the Advisor’s personnel, investment strategies, policies and procedures relating to compliance with personal securities transactions, and reputation, expertise and resources in domestic and foreign financial markets. The Board concluded that these factors support the conclusion that the Advisor performs its services in a reasonable manner. |
| | • | | The Board did not consider economies of scale at this time because of the multiple uses of the Fund (for the Advisor’s discretionary investment account clients in addition to direct investors), the current profitability of the Advisor’s services to the Fund under the Agreement, and the overall size of the Fund complex. |
Based on the Board’s deliberations and their evaluation of the information described above, the Board, including a majority of Directors that are not “interested persons” as defined in the Investment Company Act of 1940, concluded that the compensation under the Agreement was fair and reasonable in light of the services and expenses and such other matters as the Directors considered to be relevant in the exercise of their reasonable judgment. Accordingly, the Board approved the renewal of the Agreement. In the course of their deliberations, the Directors did not identify any particular information that was all important or controlling.
Directors’ and Officers’ Information (unaudited)
The Statement of Additional Information provides additional information about the Fund’s directors and officers and can be obtained without charge by calling 1-800-466-3863, at www.manningnapieradvisors.com, or on the EDGAR Database on the SEC Internet web site (http:// www.sec.gov). The following chart shows certain information about the Fund’s officers and directors, including their principal occupations during the last five years. Unless specific dates are provided, the individuals have held the listed positions for longer than five years.
| | |
| INTERESTED DIRECTOR/OFFICER | | |
| |
| Name: | | B. Reuben Auspitz* |
| Address: | | 290 Woodcliff Drive |
| | Fairport, NY 14450 |
| Age: | | 63 |
| Current Position(s) Held with Fund: | | Principal Executive Officer, President, Chairman & Director |
| Term of Office1 & Length of Time Served: | | Indefinite - Director since 1984; Vice President 1984 - 2003; President since 2004; Principal Executive Officer since 2002 |
| Principal Occupation(s) During Past 5 Years: | | Executive Vice President; Executive Group Member**; Chief Compliance Officer since 2004; Vice Chairman since June 2010; Co-Executive Director from 2003-2010 - Manning & Napier Advisors, Inc. President; Director - Manning & Napier Investor Services, Inc. Holds or has held one or more of the following titles for various subsidiaries and affiliates: President, Vice President, Director, Chairman, Treasurer, Chief Compliance Officer or Member. |
| Number of Portfolios Overseen within Fund Complex: | | 29 |
| Other Directorships Held Outside Fund Complex: | | N/A |
| |
| INDEPENDENT DIRECTORS | | |
| |
| Name: | | Paul A. Brooke |
| Address: | | 290 Woodcliff Drive |
| | Fairport, NY 14450 |
| Age: | | 65 |
| Current Position(s) Held with Fund: | | Director, Audit Committee Member, Governance & Nominating Committee Member |
| Term of Office & Length of Time Served: | | Indefinite - Since 2007 |
| Principal Occupation(s) During Past 5 Years: | | Chairman & CEO, Alsius Corp. (investments); Managing Member, PMSV Holdings LLC (investments) |
| Number of Portfolios Overseen within Fund Complex: | | 29 |
| Other Directorships Held Outside Fund Complex: | | Incyte Corp. (2000-present) |
| | ViroPharma, Inc. (2000-present) |
| | HLTH Corp. (2000-present) |
| | Cheyne Capital International (2000-present) |
| | MPM Bio-equities (2000-present) |
| | GMP Companies (2000-present) |
| | | HoustonPharma (2000-present) |
| |
| Name: | | Richard M. Hurwitz |
| Address: | | 290 Woodcliff Drive |
| | Fairport, NY 14450 |
| Age: | | 47 |
| Current Position(s) Held with Fund: | | Director, Audit Committee Member, Governance & Nominating Committee Member |
| Term of Office & Length of Time Served: | | Indefinite - Since 2009 |
| Principal Occupation(s) During Past 5 Years: | | Chief Executive Officer, Pictometry International Corp. since August 2010 (provider of georeferenced, aerial image libraries and related software) Managing Partner (2006-July 2010) - Aegis Investment Partners, LLC (investments); Founder and Managing Partner (2004-2005) - Village Markets, LLC (groceries) |
| Number of Portfolios Overseen within Fund Complex: | | 29 |
| Other Directorships Held Outside Fund Complex: | | Pictometry International Corp. (2000-2010) |
| | Pioneering Technologies (2006-2009) |
| | | Vensearch Capital Corp. (2003-2007) |
Directors’ and Officers’ Information (unaudited)
| | |
| INDEPENDENT DIRECTORS (continued) | | |
| |
| Name: | | Stephen B. Ashley |
| Address: | | 290 Woodcliff Drive |
| | Fairport, NY 14450 |
| Age: | | 70 |
| Current Position(s) Held with Fund: | | Director, Audit Committee Member, Governance & Nominating Committee Member |
| Term of Office & Length of Time Served: | | Indefinite - Since 1996 |
| Principal Occupation(s) During Past 5 Years: | | Chairman, Director, President & Chief Executive Officer, The Ashley Group (property management and investment). Chairman (non-executive) 2004-2008; Director 1995-2008 - Fannie Mae (mortgage) |
| Number of Portfolios Overseen within Fund Complex: | | 29 |
| Other Directorships Held Outside Fund Complex: | | The Ashley Group (1995-2008) |
| | | Genesee Corporation (1987-2007) |
| |
| Name: | | Peter L. Faber |
| Address: | | 290 Woodcliff Drive |
| | Fairport, NY 14450 |
| Age: | | 72 |
| Current Position(s) Held with Fund: | | Director, Governance & Nominating Committee Member |
| Term of Office & Length of Time Served: | | Indefinite - Since 1987 |
| Principal Occupation(s) During Past 5 Years: | | Senior Counsel since 2006, Partner (1995 - 2006) - McDermott, Will & Emery LLP (law firm) |
| Number of Portfolios Overseen within Fund Complex: | | 29 |
| Other Directorships Held Outside Fund Complex: | | Partnership for New York City, Inc. (non-profit) |
| | New York Collegium (non-profit) |
| | | Boston Early Music Festival (non-profit) |
| |
| Name: | | Harris H. Rusitzky |
| Address: | | 290 Woodcliff Drive |
| | Fairport, NY 14450 |
| Age: | | 76 |
| Current Position(s) Held with Fund: | | Director, Audit Committee Member, Governance & Nominating Committee Member |
| Term of Office & Length of Time Served: | | Indefinite - Since 1985 |
| Principal Occupation(s) During Past 5 Years: | | President, The Greening Group (business consultants) since 1994; Partner, The Restaurant Group (restaurants) since 2006 |
| Number of Portfolios Overseen within Fund Complex: | | 29 |
| Other Directorships Held Outside Fund Complex: | | N/A |
| |
| OFFICERS | | |
| |
| Name: | | Jeffrey S. Coons, Ph.D., CFA |
| Address: | | 290 Woodcliff Drive |
| | Fairport, NY 14450 |
| Age: | | 47 |
| Current Position(s) Held with Fund: | | Vice President |
| Term of Office1 & Length of Time Served: | | Since 2004 |
| Principal Occupation(s) During Past 5 Years: | | President since 2010, Co-Director of Research since 2002, Executive Group Member** since 2003, - Manning & Napier Advisors, Inc. Holds one or more of the following titles for various subsidiaries and affiliates: President, Director, Treasurer or Senior Trust Officer. |
| Number of Portfolios Overseen within Fund Complex: | | 29 |
Other Directorships Held Outside Fund Complex: | | N/A |
Directors’ and Officers’ Information (unaudited)
| | |
| OFFICERS (continued) | | |
| |
| Name: | | Beth Galusha |
| Address: | | 290 Woodcliff Drive |
| | Fairport, NY 14450 |
| Age: | | 49 |
| Current Position(s) Held with Fund: | | Assistant Chief Financial Officer |
| Term of Office1 & Length of Time Served: | | Assistant Chief Financial Officer since 2010 |
| Principal Occupation(s) During Past 5 Years: | | Chief Financial Officer and Treasurer, Manning & Napier Advisors, Inc. |
| | Holds one or more of the following titles for various affiliates: Chief |
| | Financial Officer, Director, or Treasurer |
| Number of Portfolios Overseen within Fund Complex: | | 29 |
| Other Directorships Held Outside Fund Complex: | | N/A |
Name: | | Christine Glavin |
| Address: | | 290 Woodcliff Drive |
| | Fairport, NY 14450 |
| Age: | | 44 |
| Current Position(s) Held with Fund: | | Principal Financial Officer, Chief Financial Officer |
| Term of Office1 & Length of Time Served: | | Principal Financial Officer since 2002; Chief Financial Officer since 2001 |
| Principal Occupation(s) During Past 5 Years: | | Fund Reporting Manager, Manning & Napier Advisors, Inc. since 1997 |
| Number of Portfolios Overseen within Fund Complex: | | 29 |
| Other Directorships Held Outside Fund Complex: | | N/A |
| |
| Name: | | Jodi L. Hedberg |
| Address: | | 290 Woodcliff Drive |
| | Fairport, NY 14450 |
| Age: | | 43 |
| Current Position(s) Held with Fund: | | Corporate Secretary, Chief Compliance Officer, Anti-Money Laundering |
| | Compliance Officer |
| Term of Office1 & Length of Time Served: | | Corporate Secretary since 1997; Chief Compliance Officer since 2004 |
| Principal Occupation(s) During Past 5 Years: | | Director of Compliance, Manning & Napier Advisors, Inc. and affiliates |
| | since 1990 (title change in 2005 from Compliance Manager to Director of |
| | Compliance); Corporate Secretary, Manning & Napier Investor Services, |
| | Inc. since 2006 |
| Number of Portfolios Overseen within Fund Complex: | | 29 |
| Other Directorships Held Outside Fund Complex: | | N/A |
| |
| Name: | | Richard Yates |
| Address: | | 290 Woodcliff Drive |
| | Fairport, NY 14450 |
| Age: | | 45 |
| Current Position(s) Held with Fund: | | Chief Legal Officer |
| Term of Office1 & Length of Time Served: | | Chief Legal Officer since 2004 |
| Principal Occupation(s) During Past 5 Years: | | Counsel - Manning & Napier Advisors, Inc. & affiliates since 2000; Holds |
| | one or more of the following titles for various affiliates; Director or |
| | Corporate Secretary |
| Number of Portfolios Overseen within Fund Complex: | | 29 |
| Other Directorships Held Outside Fund Complex: | | N/A |
*Interested Director, within the meaning of the Investment Company Act of 1940 by reason of his position with the Fund’s investment advisor and distributor. Mr. Auspitz serves as the Executive Vice President and Director, Manning & Napier Advisors, Inc. and President and Director, Manning & Napier Investor Services, Inc., the Fund’s distributor.
**Prior to June 2010, the Executive Group, consisting of senior executive employee-owners, performed the duties of the Office of the Chief Executive of the Advisor. Effective June 2010, the Executive Group serves as an advisory board to the Chief Executive Officer.
1The term of office for President, Vice President, Chief Financial Officer, Assistant Chief Financial Officer, Chief Legal Officer and Corporate Secretary is one year and until their respective successors are chosen and qualified. All other officers’ terms are indefinite.
This Page Is Intentionally Left Blank
Literature Requests (unaudited)
Proxy Voting Policies and Procedures
A description of the policies and procedures that the Fund uses to determine how to vote proxies relating to portfolio securities is available, without charge, upon request:
| | | | |
By phone | | 1-800-466-3863 | | |
On the Securities and Exchange | | | | |
Commission’s (SEC) web site | | http://www.sec.gov | | |
Proxy Voting Record
Information regarding how the Fund voted proxies relating to portfolio securities during the most recent 12-month period ended June 30th is available, without charge, upon request:
| | | | |
By phone | | 1-800-466-3863 | | |
On the SEC’s web site | | http://www.sec.gov | | |
Quarterly Portfolio Holdings
The Series’ complete schedule of portfolio holdings for the 1st and 3rd quarters of each fiscal year are provided on Form N-Q, and are available, without charge, upon request:
| | | | |
By phone | | 1-800-466-3863 | | |
On the SEC’s web site | | http://www.sec.gov | | |
The Series’ Form N-Q may be reviewed and copied at the SEC’s Public Reference Room in Washington, D.C. Information on the operation of the Public Reference Room may be obtained by calling 1-800-SEC-0330.
Prospectus and Statement of Additional Information (SAI)
The prospectus and SAI provide additional information about each Series, including charges, expenses and risks. These documents are available, without charge, upon request:
| | | | |
By phone | | 1-800-466-3863 | | |
On the SEC’s web site | | http://www.sec.gov | | |
On the Advisor’s web site | | http://www.manning-napier.com | | |
Additional information available at www.manning-napier.com
1. Fund Holdings - Month-End
2. Fund Holdings - Quarter-End
3. Shareholder Report - Annual
4. Shareholder Report - Semi-Annual
MNRE-12/10-AR

Management Discussion and Analysis (unaudited)
Dear Shareholders:
Over the course of 2010, the international markets experienced several ups and downs driven by well-defined swings in investor sentiment. Optimism fueled strong market returns early in the year, as upbeat economic releases led investors to believe in the potential for a robust global recovery. However, sentiment shifted drastically in May and June as more negative economic news and issues related to Europe’s government debt problems led to notable stock market losses. In another swing, the markets rebounded in the fall amid better economic developments.
With foreign equities posting gains in the third and fourth quarters, the choppy year ended on a fairly strong note, and broad international equity indices have now produced back-to-back years of positive results. For the twelve months ending December 31, 2010, the Morgan Stanley Capital International (MSCI) All Country World Index excluding the U.S. (ACWIxUS) was up 11.15%.
The International Series had a 12.04% return during 2010, outpacing the MSCI ACWIxUS Index. More importantly, the Series continues to have a strong track record relative to the benchmark over the current international stock market cycle, April 1, 2003 through December 31, 2010, which includes both a bull and a bear market. Over this current cycle, the International Series has earned an annualized return of 14.68%, compared to the 13.75% return of the ACWIxUS Index.
Despite concerns about Europe’s sovereign debt crisis, the International Series maintained an overweight to Western Europe during the past year. We believe some of the healthier, core European countries have more favorable dynamics, and we have invested in what we consider to be top level companies that may benefit from sales outside the European area. In particular, throughout 2010 the International Series’ largest country weightings included Germany, France, and the United Kingdom. While the higher allocation to France versus the benchmark detracted from relative returns in 2010, selections in Germany were drivers of outperformance. Stock selections in Brazil, Norway, and India also contributed to positive relative results. However, an underweight to Japan versus the benchmark and a lack of exposure to Canada hurt relative returns.
In regards to exposure to Emerging Markets, the Series had a noticeable overweight to Brazil and a higher allocation to India versus the benchmark, as the Advisor sees attractive longer-term growth potential in these markets. In contrast, the Series had no direct exposure to China during 2010, which modestly aided relative returns. While China has experienced robust growth, we believe there are risks related to China’s bank lending boom, inflationary pressures, and policy direction.
While the markets were volatile during the past year, the slow growth outlook for the global economy remains intact. Many developed countries continue to struggle with high government debt problems, perhaps best epitomized by the 16-nation Eurozone, which recently had to bail out Ireland to try to prevent its debt and banking crisis from spreading to other vulnerable countries such as Spain, Italy, or Portugal. In contrast to the slower growth developed world, emerging markets such as Brazil, China, and India have better fundamentals for more robust growth. Yet such rapid expansion may present its own set of dilemmas. With low growth, low yields, and accommodative monetary policy in much of the rest of the world, money is flowing into these stronger areas in search of higher returns, thus introducing inflationary pressures. Many of these emerging markets have already enacted policies to address mounting inflation, and their actions imply they are prepared to take additional measures to control inflation and growth if needed, including tightening monetary policy and implementing capital restrictions. Ultimately, two distinct economic scenarios appear to be playing out: a muted growth and subdued inflationary environment in the developed world, and a stronger growth and rising inflationary environment in the emerging markets.
With noteworthy headwinds such as sovereign debt issues in Europe, high government debt burdens in the developed world, and inflationary pressures in the emerging markets, the global economy remains in an uneven, slow growth environment. As the markets fluctuated around this slow growth trend in 2010, Manning & Napier earned solid returns by staying
Management Discussion and Analysis (unaudited)
focused on country and industry fundamentals. We believe this investment approach will remain important as the market environment unfolds in 2011.
As always, we appreciate your business.
Sincerely,
Manning & Napier Advisors, Inc.
Performance Update as of December 31, 2010 (unaudited)
| | | | | | | | |
| | | | | Average Annual Total Returns As of December 31, 2010 | | |
| | | One Year | | Five Year | | Ten Year | | Since Inception1 |
Manning & Napier Fund, Inc. - International Series2 | | 12.04% | | 6.71% | | 6.04% | | 9.29% |
S&P 500 Total Return Index3 | | 15.07% | | 2.30% | | 1.42% | | 8.35% |
Morgan Stanley Capital International (MSCI) All Country | | | | | | | | |
World Index ex U.S.3 | | 11.15% | | 4.82% | | 5.54% | | 7.15% |
The following graph compares the value of a $10,000 investment in the Manning & Napier Fund, Inc. - International Series for the ten years ended December 31, 2010 to the S&P 500 Total Return Index and the MSCI All Country World Index ex U.S.
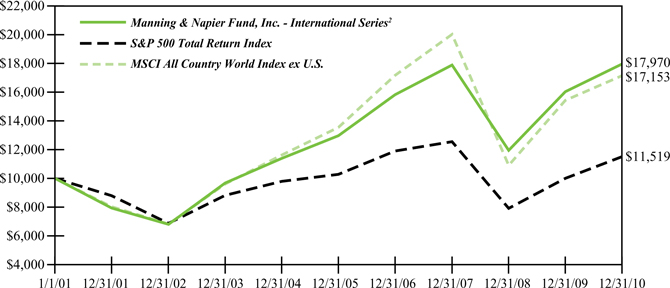
1 Performance numbers for the Series and the S&P 500 Total Return Index are calculated from August 27, 1992, the Series’ inception date. Prior to 2001, the MSCI All Country World Index ex U.S. only published month-end numbers; therefore, performance numbers for the Index are calculated from August 31, 1992.
2 The Series’ performance does not reflect the deduction of taxes that a shareholder would pay on fund distributions or the redemption of shares. The Series’ performance is historical and may not be indicative of future results. The performance returns shown are inclusive of the net expense ratio of the Series. For the year ended December 31, 2010, this net expense ratio was 1.15%. The gross expense ratio, which does not account for any voluntary or contractual waivers currently in effect, was 1.15% for the year ended December 31, 2010.
3 The S&P 500 Total Return Index is an unmanaged capitalization-weighted measure of 500 widely held common stocks listed on the New York Stock Exchange, American Stock Exchange and the Over-the-Counter market. The Index returns assume daily reinvestment of dividends. The MSCI All Country World Index ex U.S. is a free float-adjusted market capitalization weighted index that is designed to measure equity market performance in the global developed and emerging markets and consists of 47 developed and emerging market country indices outside the United States. The Index is denominated in U.S Dollars. The Index returns assume daily reinvestment of gross dividends (which do not account for foreign dividend taxation) from the inception of the Series (see Note 1 above) through December 31, 1998, as net returns were not available. Subsequent to December 31, 1998, the Index returns assume daily reinvestment of net dividends (thus accounting for foreign dividend taxation). Both Indices’ returns, unlike Series returns, do not reflect any fees or expenses.
Shareholder Expense Example (unaudited)
As a shareholder of the Series, you may incur two types of costs: (1) transaction costs and (2) ongoing costs, including management fees and other Series expenses. This example is intended to help you understand your ongoing costs (in dollars) of investing in the Series and to compare these costs with the ongoing costs of investing in other mutual funds.
The example is based on an investment of $1,000 invested at the beginning of the period and held for the entire period (July 1, 2010 to December 31, 2010).
Actual Expenses
The first line of the table below provides information about actual account values and actual expenses. You may use the information in this line, together with the amount you invested, to estimate the expenses that you paid over the period. Simply divide your account value by $1,000 (for example, an $8,600 account value divided by $1,000 = 8.6), then multiply the result by the number in the first line under the heading entitled “Expenses Paid During Period” to estimate the expenses you paid on your account during this period.
Hypothetical Example for Comparison Purposes
The second line of the table below provides information about hypothetical account values and hypothetical expenses based on the Series’ actual expense ratio and an assumed rate of return of 5% per year before expenses, which is not the Series’ actual return. The hypothetical account values and expenses may not be used to estimate the actual ending account balance or expenses you paid during the period. You may use this information to compare the ongoing costs of investing in the Series and other funds. To do so, compare this 5% hypothetical example with the 5% hypothetical examples that appear in the shareholder reports of the other funds.
Please note that the expenses shown in the table are meant to highlight your ongoing costs only and do not reflect any transaction costs. Therefore, the second line of the table is useful in comparing ongoing costs only, and will not help you determine the relative total costs of owning different funds. In addition, if these transaction costs were included, your costs would have been higher.
| | | | | | | | | | | | | | | |
| | | Beginning
Account Value
7/1/10 | | Ending
Account Value
12/31/10 | | Expenses Paid
During Period*
7/1/10-12/31/10 |
Actual | | | | $1,000.00 | | | | | $1,245.10 | | | | | $6.62 | |
Hypothetical | | | | | | | | | | | | | | | |
(5% return before expenses) | | | | $1,000.00 | | | | | $1,019.31 | | | | | $5.96 | |
*Expenses are equal to the Series’ annualized expense ratio (for the six-month period) of 1.17%, multiplied by the average account value over the period, multiplied by 184/365 (to reflect the one-half year period). Expenses are based on the most recent fiscal half year; therefore, the expense ratio stated above may differ from the expense ratio stated in the financial highlights, which is based on one-year data. The Series’ total return would have been lower had certain expenses not been waived during the period.
Portfolio Composition as of December 31, 2010 (unaudited)
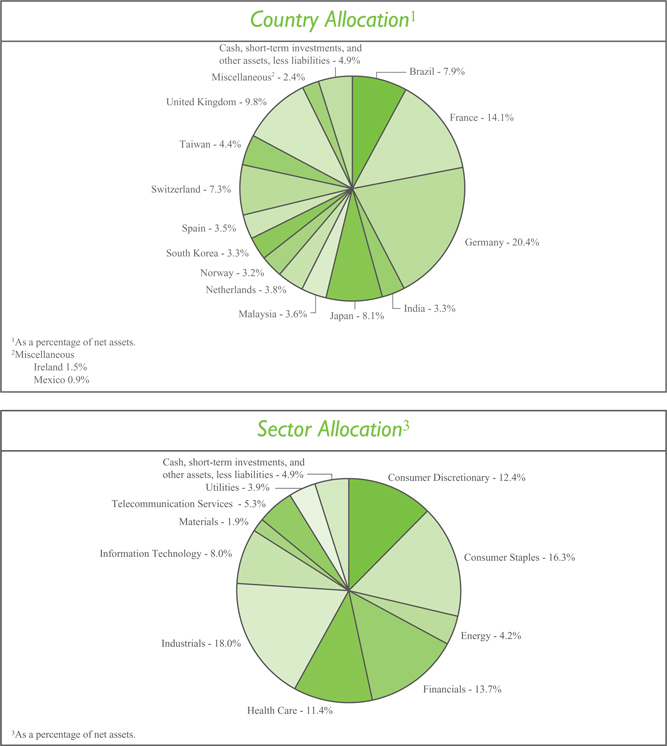
Investment Portfolio - December 31, 2010
| | | | | | | | |
| | |
| | | Shares | | | Value (Note 2) | |
| | |
COMMON STOCKS - 95.1% | | | | | | | | |
| | |
Consumer Discretionary - 12.4% | | | | | | | | |
Auto Components - 1.6% | | | | | | | | |
Hankook Tire Co. Ltd. (South Korea)1 | | | 178,870 | | | $ | 5,000,988 | |
| | | | | | | | |
| | |
Automobiles - 2.0% | | | | | | | | |
Hero Honda Motors Ltd. (India)1 | | | 42,450 | | | | 1,887,276 | |
Maruti Suzuki India Ltd. (India)1 | | | 44,940 | | | | 1,428,024 | |
Yamaha Motor Co. Ltd. (Japan)*1 | | | 196,000 | | | | 3,180,637 | |
| | | | | | | | |
| | | | | | | 6,495,937 | |
| | | | | | | | |
| | |
Hotels, Restaurants & Leisure - 0.1% | | | | | | | | |
Indian Hotels Co. Ltd. (India)1 | | | 86,954 | | | | 187,784 | |
| | | | | | | | |
| | |
Household Durables - 3.3% | | | | | | | | |
Corporacion Geo S.A.B. de C.V. - Class B (Mexico)* | | | 783,010 | | | | 2,872,093 | |
LG Electronics, Inc. (South Korea)1 | | | 32,640 | | | | 3,386,105 | |
PDG Realty S.A. Empreendimentos e Participacoes (Brazil) | | | 87,074 | | | | 532,935 | |
Rodobens Negocios Imobiliarios S.A. (Brazil) | | | 367,000 | | | | 3,689,898 | |
| | | | | | | | |
| | | | | | | 10,481,031 | |
| | | | | | | | |
| | |
Media - 3.7% | | | | | | | | |
Gestevision Telecinco S.A. (Spain)1 | | | 490,600 | | | | 5,404,095 | |
Reed Elsevier plc - ADR (United Kingdom) | | | 60,311 | | | | 2,024,037 | |
Societe Television Francaise 1 (France)1 | | | 108,530 | | | | 1,886,713 | |
Wolters Kluwer N.V. (Netherlands)1 | | | 114,447 | | | | 2,509,920 | |
| | | | | | | | |
| | | | | | | 11,824,765 | |
| | | | | | | | |
| | |
Multiline Retail - 1.2% | | | | | | | | |
PPR (France)1 | | | 22,930 | | | | 3,650,726 | |
| | | | | | | | |
Specialty Retail - 0.5% | | | | | | | | |
Komeri Co. Ltd. (Japan)1 | | | 67,000 | | | | 1,534,209 | |
| | | | | | | | |
Total Consumer Discretionary | | | | | | | 39,175,440 | |
| | | | | | | | |
Consumer Staples - 16.3% | | | | | | | | |
Beverages - 2.5% | | | | | | | | |
Diageo plc (United Kingdom)1 | | | 162,810 | | | | 3,016,542 | |
Kirin Holdings Co. Ltd. (Japan)1 | | | 215,000 | | | | 3,007,002 | |
United Spirits Ltd. (India)1 | | | 57,400 | | | | 1,878,791 | |
| | | | | | | | |
| | | | | | | 7,902,335 | |
| | | | | | | | |
| | |
Food & Staples Retailing - 5.1% | | | | | | | | |
Carrefour S.A. (France)1 | | | 165,082 | | | | 6,806,753 | |
Casino Guichard-Perrachon S.A. (France)1 | | | 34,170 | | | | 3,334,110 | |
President Chain Store Corp. (Taiwan)1 | | | 352,320 | | | | 1,624,414 | |
Tesco plc (United Kingdom)1 | | | 667,410 | | | | 4,425,605 | |
| | | | | | | | |
| | | | | | | 16,190,882 | |
| | | | | | | | |
| | |
| 6 | | The accompanying notes are an integral part of the financial statements. |
Investment Portfolio - December 31, 2010
| | | | | | | | |
| | |
| | | Shares | | | Value (Note 2) | |
| | |
COMMON STOCKS (continued) | | | | | | | | |
| | |
Consumer Staples (continued) | | | | | | | | |
Food Products - 6.4% | | | | | | | | |
Danone S.A. (France)1 | | | 40,012 | | | $ | 2,515,840 | |
IOI Corp. Berhad (Malaysia)1 | | | 560,800 | | | | 1,056,007 | |
Nestle S.A. (Switzerland)1 | | | 105,220 | | | | 6,164,174 | |
Suedzucker AG (Germany)1 | | | 90,690 | | | | 2,422,012 | |
Unilever plc - ADR (United Kingdom) | | | 261,230 | | | | 8,066,782 | |
| | | | | | | | |
| | | | | | | 20,224,815 | |
| | | | | | | | |
| | |
Household Products - 1.9% | | | | | | | | |
Hindustan Unilever Ltd. (India)1 | | | 250,540 | | | | 1,752,937 | |
Reckitt Benckiser Group plc (United Kingdom)1 | | | 78,270 | | | | 4,305,999 | |
| | | | | | | | |
| | | | | | | 6,058,936 | |
| | | | | | | | |
| | |
Personal Products - 0.4% | | | | | | | | |
Kao Corp. (Japan)1 | | | 47,000 | | | | 1,263,129 | |
| | | | | | | | |
Total Consumer Staples | | | | | | | 51,640,097 | |
| | | | | | | | |
| | |
Energy - 4.2% | | | | | | | | |
| | |
Oil, Gas & Consumable Fuels - 4.2% | | | | | | | | |
Repsol YPF S.A. (Spain)1 | | | 56,900 | | | | 1,593,406 | |
Royal Dutch Shell plc - Class B (Netherlands)1 | | | 88,430 | | | | 2,928,317 | |
Royal Dutch Shell plc - Class B - ADR (Netherlands) | | | 87,780 | | | | 5,852,293 | |
Total S.A. (France)1 | | | 56,580 | | | | 3,013,594 | |
| | | | | | | | |
| | |
Total Energy | | | | | | | 13,387,610 | |
| | | | | | | | |
| | |
Financials - 13.7% | | | | | | | | |
Capital Markets - 0.8% | | | | | | | | |
Daiwa Securities Group, Inc. (Japan)1 | | | 98,000 | | | | 502,702 | |
Nomura Holdings, Inc. (Japan)1 | | | 78,900 | | | | 500,626 | |
OSK Holdings Berhad (Malaysia)1 | | | 2,089,500 | | | | 1,330,878 | |
OSK Ventures International Berhad (Malaysia)*1 | | | 202,575 | | | | 26,279 | |
| | | | | | | | |
| | | | | | | 2,360,485 | |
| | | | | | | | |
| | |
Commercial Banks - 3.6% | | | | | | | | |
BNP Paribas (France)1 | | | 28,330 | | | | 1,804,242 | |
The Chugoku Bank Ltd. (Japan)1 | | | 137,000 | | | | 1,653,147 | |
Credit Agricole S.A. (France)1 | | | 63,090 | | | | 802,235 | |
The Hachijuni Bank Ltd. (Japan)1 | | | 244,000 | | | | 1,359,504 | |
Hong Leong Financial Group Berhad (Malaysia)1 | | | 816,800 | | | | 2,354,285 | |
Mitsubishi UFJ Financial Group, Inc. (Japan)1 | | | 170,000 | | | | 916,661 | |
Royal Bank of Scotland Group plc (United Kingdom)*1 | | | 277,092 | | | | 170,167 | |
Societe Generale (France)1 | | | 15,410 | | | | 829,163 | |
The Sumitomo Trust & Banking Co. Ltd. (Japan)1 | | | 247,000 | | | | 1,547,368 | |
| | | | | | | | |
| | | | | | | 11,436,772 | |
| | | | | | | | |
| | |
| The accompanying notes are an integral part of the financial statements. | | 7 |
Investment Portfolio - December 31, 2010
| | | | | | | | |
| | | Shares | | | Value (Note 2) | |
| | |
COMMON STOCKS (continued) | | | | | | | | |
| | |
Financials (continued) | | | | | | | | |
Diversified Financial Services - 0.2% | | | | | | | | |
ING Groep N.V. (Netherlands)*1 | | | 65,395 | | | $ | 637,977 | |
| | | | | | | | |
Insurance - 6.6% | | | | | | | | |
Allianz SE (Germany)1 | | | 40,870 | | | | 4,855,998 | |
Amil Participacoes S.A. (Brazil) | | | 350,000 | | | | 3,753,012 | |
AXA S.A. (France)1 | | | 56,372 | | | | 938,337 | |
Mapfre S.A. (Spain)1 | | | 885,000 | | | | 2,467,072 | |
Muenchener Rueckversicherungs-Gesellschaft AG (MunichRe) (Germany)1 | | | 40,610 | | | | 6,150,576 | |
Zurich Financial Services AG (Switzerland)1 | | | 10,500 | | | | 2,719,151 | |
| | | | | | | | |
| | | | | | | 20,884,146 | |
| | | | | | | | |
| | |
Real Estate Investment Trusts (REITS) - 1.4% | | | | | | | | |
Alstria Office REIT AG (Germany)1 | | | 313,480 | | | | 4,398,514 | |
| | | | | | | | |
Real Estate Management & Development - 0.0%** | | | | | | | | |
OSK Property Holdings Berhad (Malaysia)1 | | | 243,091 | | | | 52,820 | |
| | | | | | | | |
Thrifts & Mortgage Finance - 1.1% | | | | | | | | |
Aareal Bank AG (Germany)*1 | | | 115,790 | | | | 3,521,499 | |
| | | | | | | | |
Total Financials | | | | | | | 43,292,213 | |
| | | | | | | | |
Health Care - 11.4% | | | | | | | | |
Health Care Equipment & Supplies - 1.1% | | | | | | | | |
Straumann Holding AG (Switzerland)1 | | | 15,476 | | | | 3,544,085 | |
| | | | | | | | |
Health Care Providers & Services - 2.4% | | | | | | | | |
Odontoprev S.A. (Brazil) | | | 492,000 | | | | 7,436,313 | |
| | | | | | | | |
Pharmaceuticals - 7.9% | | | | | | | | |
AstraZeneca plc (United Kingdom)1 | | | 27,960 | | | | 1,274,259 | |
AstraZeneca plc - ADR (United Kingdom) | | | 46,350 | | | | 2,140,908 | |
Bayer AG (Germany)1 | | | 100,000 | | | | 7,412,735 | |
GlaxoSmithKline plc (United Kingdom)1 | | | 172,980 | | | | 3,354,567 | |
Novartis AG - ADR (Switzerland) | | | 49,000 | | | | 2,888,550 | |
Sanofi-Aventis S.A. (France)1 | | | 26,423 | | | | 1,694,000 | |
Shire plc (Ireland)1 | | | 195,160 | | | | 4,705,715 | |
Takeda Pharmaceutical Co. Ltd. (Japan)1 | | | 34,900 | | | | 1,714,491 | |
| | | | | | | | |
| | | | | | | 25,185,225 | |
| | | | | | | | |
| | |
Total Health Care | | | | | | | 36,165,623 | |
| | | | | | | | |
Industrials - 18.0% | | | | | | | | |
Airlines - 1.4% | | | | | | | | |
Deutsche Lufthansa AG (Germany)*1 | | | 206,580 | | | | 4,493,679 | |
| | | | | | | | |
Commercial Services & Supplies - 3.0% | | | | | | | | |
Taiwan Secom Co. Ltd. (Taiwan)1 | | | 777,210 | | | | 1,474,095 | |
| | |
| 8 | | The accompanying notes are an integral part of the financial statements. |
Investment Portfolio - December 31, 2010
| | | | | | | | |
| | | | | | | |
| | | Shares | | | Value (Note 2) | |
| | |
COMMON STOCKS (continued) | | | | | | | | |
| | |
Industrials (continued) | | | | | | | | |
Commercial Services & Supplies (continued) | | | | | | | | |
Tomra Systems ASA (Norway)1 | | | 1,189,080 | | | $ | 7,916,362 | |
| | | | | | | | |
| | | | | | | 9,390,457 | |
| | | | | | | | |
Construction & Engineering - 0.6% | | | | | | | | |
Larsen & Toubro Ltd. (India)1 | | | 41,270 | | | | 1,826,546 | |
| | | | | | | | |
Electrical Equipment - 5.1% | | | | | | | | |
ABB Ltd. (Asea Brown Boveri) - ADR (Switzerland)* | | | 138,000 | | | | 3,098,100 | |
Alstom S.A. (France)1 | | | 97,560 | | | | 4,676,167 | |
Bharat Heavy Electricals Ltd. (India)1 | | | 30,080 | | | | 1,562,897 | |
Schneider Electric S.A. (France)1 | | | 26,590 | | | | 3,986,800 | |
Teco Electric and Machinery Co. Ltd. (Taiwan)1 | | | 4,084,000 | | | | 2,730,155 | |
| | | | | | | | |
| | | | | | | 16,054,119 | |
| | | | | | | | |
Industrial Conglomerates - 3.6% | | | | | | | | |
Siemens AG (Germany)1 | | | 92,300 | | | | 11,433,629 | |
| | | | | | | | |
Machinery - 0.9% | | | | | | | | |
FANUC Corp. (Japan)1 | | | 19,400 | | | | 2,965,413 | |
| | | | | | | | |
Road & Rail - 2.0% | | | | | | | | |
All America Latina Logistica S.A. (Brazil) | | | 722,000 | | | | 6,524,096 | |
| | | | | | | | |
Transportation Infrastructure - 1.4% | | | | | | | | |
Malaysia Airports Holdings Berhad (Malaysia)1 | | | 2,148,700 | | | | 4,376,143 | |
| | | | | | | | |
Total Industrials | | | | | | | 57,064,082 | |
| | | | | | | | |
Information Technology - 8.0% | | | | | | | | |
Communications Equipment - 0.4% | | | | | | | | |
D-Link Corp. (Taiwan)1 | | | 1,120,606 | | | | 1,152,616 | |
| | | | | | | | |
Electronic Equipment, Instruments & Components - 2.2% | | | | | | | | |
Hitachi Ltd. (Japan)1 | | | 662,000 | | | | 3,514,670 | |
Keyence Corp. (Japan)1 | | | 6,845 | | | | 1,975,023 | |
Yageo Corp. (Taiwan)1 | | | 2,931,000 | | | | 1,441,394 | |
| | | | | | | | |
| | | | | | | 6,931,087 | |
| | | | | | | | |
IT Services - 0.8% | | | | | | | | |
Cap Gemini S.A. (France)1 | | | 56,320 | | | | 2,632,940 | |
| | | | | | | | |
Semiconductors & Semiconductor Equipment - 3.4% | | | | | | | | |
Infineon Technologies AG (Germany)*1 | | | 770,000 | | | | 7,177,394 | |
Taiwan Semiconductor Manufacturing Co. Ltd. - ADR (Taiwan) | | | 275,315 | | | | 3,452,450 | |
| | | | | | | | |
| | | | | | | 10,629,844 | |
| | | | | | | | |
Software - 1.2% | | | | | | | | |
SAP AG (Germany)1 | | | 76,970 | | | | 3,925,675 | |
| | | | | | | | |
Total Information Technology | | | | | | | 25,272,162 | |
| | | | | | | | |
| | |
| The accompanying notes are an integral part of the financial statements. | | 9 |
Investment Portfolio - December 31, 2010
| | | | | | | | |
| | | | | | | |
| | | Shares | | | Value (Note 2) | |
| | |
COMMON STOCKS (continued) | | | | | | | | |
| | |
Materials - 1.9% | | | | | | | | |
Chemicals - 1.2% | | | | | | | | |
Arkema S.A. (France)1 | | | 1,229 | | | $ | 88,627 | |
BASF SE (Germany)1 | | | 47,000 | | | | 3,750,740 | |
| | | | | | | | |
| | | | | | | 3,839,367 | |
| | | | | | | | |
Construction Materials - 0.7% | | | | | | | | |
Taiwan Cement Corp. (Taiwan)1 | | | 1,899,827 | | | | 2,136,661 | |
Taiwan Cement Corp. (Taiwan) - Rights2 | | | 184,663 | | | | 36,734 | |
| | | | | | | | |
| | | | | | | 2,173,395 | |
| | | | | | | | |
Total Materials | | | | | | | 6,012,762 | |
| | | | | | | | |
Telecommunication Services - 5.3% | | | | | | | | |
Diversified Telecommunication Services - 3.9% | | | | | | | | |
France Telecom S.A. (France)1 | | | 155,920 | | | | 3,262,760 | |
France Telecom S.A. - ADR (France) | | | 38,800 | | | | 817,904 | |
Swisscom AG - ADR (Switzerland)3 | | | 106,400 | | | | 4,686,920 | |
Telefonica S.A. - ADR (Spain) | | | 22,850 | | | | 1,563,397 | |
Telenor ASA - ADR (Norway)3 | | | 45,480 | | | | 2,223,972 | |
| | | | | | | | |
| | | | | | | 12,554,953 | |
| | | | | | | | |
Wireless Telecommunication Services - 1.4% | | | | | | | | |
Digi.Com Berhad (Malaysia)1 | | | 284,200 | | | | 2,267,333 | |
SK Telecom Co. Ltd. - ADR (South Korea) | | | 114,190 | | | | 2,127,360 | |
| | | | | | | | |
| | | | | | | 4,394,693 | |
| | | | | | | | |
Total Telecommunication Services | | | | | | | 16,949,646 | |
| | | | | | | | |
Utilities - 3.9% | | | | | | | | |
Electric Utilities - 1.6% | | | | | | | | |
E.ON AG (Germany)1 | | | 164,441 | | | | 5,021,838 | |
| | | | | | | | |
Multi-Utilities - 1.3% | | | | | | | | |
GDF Suez (France)1 | | | 51,850 | | | | 1,862,202 | |
National Grid plc (United Kingdom)1 | | | 286,530 | | | | 2,476,545 | |
| | | | | | | | |
| | | | | | | 4,338,747 | |
| | | | | | | | |
Water Utilities - 1.0% | | | | | | | | |
Cia de Saneamento de Minas Gerais - Copasa MG (Brazil) | | | 182,000 | | | | 3,146,627 | |
| | | | | | | | |
Total Utilities | | | | | | | 12,507,212 | |
| | | | | | | | |
TOTAL COMMON STOCKS
(Identified Cost $255,475,986) | | | | | | | 301,466,847 | |
| | | | | | | | |
| | |
| 10 | | The accompanying notes are an integral part of the financial statements. |
Investment Portfolio - December 31, 2010
| | | | | | | | |
| | | | | | | |
| | | Shares | | | Value (Note 2) | |
| | |
SHORT-TERM INVESTMENTS - 4.9% | | | | | | | | |
| | |
Dreyfus Cash Management, Inc. - Institutional Shares4, 0.14%, (Identified Cost $15,625,574) | | | 15,625,574 | | | $ | 15,625,574 | |
| | | | | | | | |
TOTAL INVESTMENTS - 100.0%
(Identified Cost $271,101,560) | | | | | | | 317,092,421 | |
OTHER ASSETS, LESS LIABILITIES - 0.0%** | | | | | | | 106,081 | |
| | | | | | | | |
NET ASSETS - 100% | | | | | | $ | 317,198,502 | |
| | | | | | | | |
ADR - American Depository Receipt
*Non-income producing security
**Less than 0.1%
1International Fair Value factor from pricing service was applied.
2Security has been valued at fair value (see Note 2 to the financial statements).
3Latest quoted sales price is not available and latest quoted bid price was used to value the security.
4Rate shown is the current yield as of December 31, 2010.
The Series’ portfolio holds, as a percentage of net assets, greater than 10% in the following countries: Germany - 20.4%; France - 14.1%.
| | |
| The accompanying notes are an integral part of the financial statements. | | 11 |
Statement of Assets & Liabilities
December 31, 2010
| | | | |
ASSETS: | | | | |
| |
Investments, at value (identified cost $271,101,560) (Note 2) | | | $317,092,421 | |
Foreign currency, at value (cost $41,729) | | | 41,810 | |
Foreign tax reclaims receivable | | | 361,651 | |
Receivable for fund shares sold | | | 306,281 | |
Dividends receivable | | | 145,768 | |
| | | | |
| |
TOTAL ASSETS | | | 317,947,931 | |
| | | | |
| |
LIABILITIES: | | | | |
| |
Accrued management fees (Note 3) | | | 263,429 | |
Accrued fund accounting and administration fees (Note 3) | | | 9,853 | |
Accrued transfer agent fees (Note 3) | | | 2,263 | |
Accrued Chief Compliance Officer service fees (Note 3) | | | 245 | |
Payable for fund shares repurchased | | | 371,959 | |
Accrued custodian fees | | | 43,120 | |
Accrued capital gains tax payable (Note 2) | | | 211 | |
Other payables and accrued expenses | | | 58,349 | |
| | | | |
| |
TOTAL LIABILITIES | | | 749,429 | |
| | | | |
| |
TOTAL NET ASSETS | | | $317,198,502 | |
| | | | |
| |
NET ASSETS CONSIST OF: | | | | |
| |
Capital stock | | | $ 358,418 | |
Additional paid-in-capital | | | 272,946,505 | |
Distributions in excess of net investment income | | | (2,564,313 | ) |
Accumulated net realized gain on investments, foreign currency and translation of other assets and liabilities | | | 446,977 | |
Net unrealized appreciation (depreciation) on investments (net of accrued capital gains tax of $211), foreign currency and translation of other assets and liabilities | | | 46,010,915 | |
| | | | |
| |
TOTAL NET ASSETS | | | $317,198,502 | |
| | | | |
| |
NET ASSET VALUE, OFFERING PRICE AND REDEMPTION PRICE PER SHARE - Class A ($317,198,502/35,841,758 shares) | | | $ 8.85 | |
| | | | |
| | |
| 12 | | The accompanying notes are an integral part of the financial statements. |
Statement of Operations
For the Year Ended December 31, 2010
| | | | |
INVESTMENT INCOME: | | | | |
| |
Dividends (net of foreign taxes withheld, $862,092) | | | $ 7,769,347 | |
| | | | |
| |
EXPENSES: | | | | |
| |
Management fees (Note 3) | | | 2,747,895 | |
Fund accounting and administration fees (Note 3) | | | 66,435 | |
Transfer agent fees (Note 3) | | | 13,498 | |
Directors’ fees (Note 3) | | | 11,355 | |
Chief Compliance Officer service fees (Note 3) | | | 2,631 | |
Custodian fees | | | 190,558 | |
Miscellaneous | | | 125,304 | |
| | | | |
| |
Total Expenses | | | 3,157,676 | |
Less reduction of expenses (Note 3) | | | (758 | ) |
| | | | |
| |
Net Expenses | | | 3,156,918 | |
| | | | |
| |
NET INVESTMENT INCOME | | | 4,612,429 | |
| | | | |
| |
REALIZED AND UNREALIZED GAIN (LOSS) ON INVESTMENTS AND FOREIGN CURRENCY: | | | | |
| |
Net realized gain (loss) on- | | | | |
Investments (net of foreign capital gains tax of $192,697) (Note 2) | | | 10,981,265 | |
Foreign currency, and translation of other assets and liabilities | | | (194,903 | ) |
| | | | |
| |
| | | 10,786,362 | |
| | | | |
| |
Net change in unrealized appreciation (depreciation) on- | | | | |
Investments (net of change in accrued capital gains tax of $(34,045)) | | | 18,846,538 | |
Foreign currency, and translation of other assets and liabilities | | | 14,719 | |
| | | | |
| |
| | | 18,861,257 | |
| | | | |
| |
NET REALIZED AND UNREALIZED GAIN ON INVESTMENTS AND FOREIGN CURRENCY | | | 29,647,619 | |
| | | | |
| |
NET INCREASE IN NET ASSETS RESULTING FROM OPERATIONS | | | $34,260,048 | |
| | | | |
| | |
| The accompanying notes are an integral part of the financial statements. | | 13 |
Statements of Changes in Net Assets
| | | | | | | | |
| | | For the Year Ended
12/31/10 | | | For the Year Ended
12/31/09 | |
INCREASE (DECREASE) IN NET ASSETS: | | | | | | | | |
| | |
OPERATIONS: | | | | | | | | |
| | |
Net investment income | | $ | 4,612,429 | | | $ | 3,790,908 | |
Net realized gain on investments and foreign currency | | | 10,786,362 | | | | 8,560,500 | |
Net change in unrealized appreciation (depreciation) on investments (net of change in accrued capital gains tax of $(34,045) and $34,256, respectively) and foreign currency | | | 18,861,257 | | | | 48,051,482 | |
| | | | | | | | |
| | |
Net increase from operations | | | 34,260,048 | | | | 60,402,890 | |
| | | | | | | | |
| | |
DISTRIBUTIONS TO SHAREHOLDERS (Note 8): | | | | | | | | |
| | |
From net investment income | | | (6,327,558 | ) | | | (4,479,987 | ) |
From net realized gain on investments | | | (11,801,674 | ) | | | (7,507,773 | ) |
| | | | | | | | |
| | |
Total distributions to shareholders | | | (18,129,232 | ) | | | (11,987,760 | ) |
| | | | | | | | |
| | |
CAPITAL STOCK ISSUED AND REPURCHASED: | | | | | | | | |
| | |
Net increase from capital share transactions (Note 5) | | | 33,967,286 | | | | 36,412,740 | |
| | | | | | | | |
| | |
Net increase in net assets | | | 50,098,102 | | | | 84,827,870 | |
| | |
NET ASSETS: | | | | | | | | |
| | |
Beginning of year | | | 267,100,400 | | | | 182,272,530 | |
| | | | | | | | |
| | |
End of year (including distributions in excess of net investment income of $2,564,313 and $461,584, respectively) | | $ | 317,198,502 | | | $ | 267,100,400 | |
| | | | | | | | |
| | |
| 14 | | The accompanying notes are an integral part of the financial statements. |
Financial Highlights
| | | | | | | | | | | | | | | | | | | | | | | | |
| | | | | | For the Years Ended | | | | | | | |
| | | 12/31/10 | | | 12/31/09 | | | 12/31/08 | | | 12/31/07 | | | 12/31/06 | | | | |
Per share data (for a share outstanding through out each year): | | | | | | | | | | | | | | | | | | | | | | | | |
Net asset value - Beginning of year | | | $8.39 | | | | $6.57 | | | | $10.87 | | | | $9.84 | | | | $9.90 | | | | | |
| | | | | | | | | | | | | | | | | | | | | | | | |
Income (loss) from investment operations: | | | | | | | | | | | | | | | | | | | | | | | | |
Net investment income | | | 0.141 | | | | 0.141 | | | | 0.22 | | | | 0.15 | | | | 0.15 | | | | | |
Net realized and unrealized gain (loss) on investments | | | 0.86 | | | | 2.10 | | | | (3.82) | | | | 1.12 | | | | 2.01 | | | | | |
| | | | | | | | | | | | | | | | | | | | | | | | |
Total from investment operations | | | 1.00 | | | | 2.24 | | | | (3.60) | | | | 1.27 | | | | 2.16 | | | | | |
| | | | | | | | | | | | | | | | | | | | | | | | |
Less distributions to shareholders: | | | | | | | | | | | | | | | | | | | | | | | | |
From net investment income | | | (0.19) | | | | (0.16) | | | | (0.21) | | | | (0.14) | | | | (0.15) | | | | | |
From net realized gain on investments | | | (0.35) | | | | (0.26) | | | | (0.49) | | | | (0.10) | | | | (2.07) | | | | | |
| | | | | | | | | | | | | | | | | | | | | | | | |
Total distributions to shareholders | | | (0.54) | | | | (0.42) | | | | (0.70) | | | | (0.24) | | | | (2.22) | | | | | |
| | | | | | | | | | | | | | | | | | | | | | | | |
Net asset value - End of year | | | $8.85 | | | | $8.39 | | | | $6.57 | | | | $10.87 | | | | $9.84 | | | | | |
| | | | | | | | | | | | | | | | | | | | | | | | |
Net assets - End of year (000’s omitted) | | | $317,199 | | | | $267,100 | | | | $182,273 | | | | $270,080 | | | | $215,981 | | | | | |
| | | | | | | | | | | | | | | | | | | | | | | | |
Total return2 | | | 12.04% | | | | 34.23% | | | | (33.25%) | | | | 13.01% | | | | 21.96% | | | | | |
Ratios (to average net assets)/ | | | | | | | | | | | | | | | | | | | | | | | | |
Supplemental Data: | | | | | | | | | | | | | | | | | | | | | | | | |
Expenses* | | | 1.15% | | | | 1.15% | | | | 1.15% | | | | 1.16% | | | | 1.18% | | | | | |
Net investment income | | | 1.68% | | | | 1.90% | | | | 2.49% | | | | 1.47% | | | | 1.39% | | | | | |
Portfolio turnover | | | 13% | | | | 17% | | | | 9% | | | | 20% | | | | 30% | | | | | |
| |
*The investment advisor did not impose all of its management fees, CCO fees and fund accounting and transfer agent fees, and other fees in some years and in some years paid a portion of the Series’ expenses. If these expenses had been incurred by the Series, the expense ratio (to average net assets) would have been increased by the following amounts: | | | | | |
| | | 0.00%3 | | | | 0.00%3 | | | | N/A | | | | N/A | | | | N/A | | | | | |
1Calculated based on average shares outstanding during the year.
2Represents aggregate total return for the periods indicated, and assumes reinvestment of all distributions. Total return would have been lower had certain expenses not been waived or reimbursed during the periods. Periods less than one year are not annualized.
3Less than 0.01%.
| | |
| The accompanying notes are an integral part of the financial statements. | | 15 |
Notes to Financial Statements
International Series (the “Series”) is a no-load diversified series of Manning & Napier Fund, Inc. (the “Fund”). The Fund is organized in Maryland and is registered under the Investment Company Act of 1940, as amended, as an open-end management investment company.
The Series’ investment objective is to provide long-term growth by investing principally in the common stocks of companies located outside the United States.
The Fund’s Advisor is Manning & Napier Advisors, Inc. (the “Advisor”). Shares of the Series are offered to investors, clients and employees of the Advisor and its affiliates. The Series resumed offering shares directly to investors on May 18, 2004, as it had done previously from time to time. The total authorized capital stock of the Fund consists of 10.0 billion shares of common stock each having a par value of $0.01. As of December 31, 2010, 6.2 billion shares have been designated in total among 29 series, of which 100 million have been designated as International Series Class A common stock.
| 2. | SIGNIFICANT ACCOUNTING POLICIES |
Security Valuation
Portfolio securities, including domestic equities, foreign equities, warrants and options, listed on an exchange other than the NASDAQ National Market System are valued at the latest quoted sales price of the exchange on which the security is primarily traded. Securities not traded on valuation date or securities not listed on an exchange are valued at the latest quoted bid price provided by the Fund’s pricing service. Securities listed on the NASDAQ National Market System are valued in accordance with the NASDAQ Official Closing Price.
Short-term investments that mature in sixty days or less are valued at amortized cost, which approximates market value. Investments in open-end investment companies are valued at their net asset value per share on valuation date.
Volume and level of activity in established markets for an asset or liability are evaluated to determine whether recent transactions and quoted prices are determinative of fair value. Where there have been significant decreases in volume and level of activity, further analysis and adjustment may be necessary to estimate fair value. The Series measures fair value in these instances by the use of inputs and valuation techniques which may be based upon current market prices of securities that are comparable in coupon, rating, maturity and industry and/or expectation of future cash flows. As a result of trading in relatively thin markets and/or markets that experience significant volatility, the prices used by the Series to value these securities may differ from the value that would be realized if these securities were sold, and the differences could be material.
Securities for which representative valuations or prices are not available from the Fund’s pricing service may be valued at fair value. Due to the inherent uncertainty of valuations of such securities, the fair value may differ significantly from the values that would have been used had a ready market for such securities existed. If trading or events occurring after the close of the principal market in which securities are traded are expected to materially affect the value of those securities, then they may be valued at their fair value, taking this trading or these events into account. Fair value is determined in good faith by the Advisor under procedures approved by and under the general supervision and responsibility of the Fund’s Board of Directors (the “Board”). In accordance with the procedures approved by the Board, the Series applies fair value pricing on a daily basis except for North American, Central American, South American and Caribbean equity securities. Fair valuing of securities is determined with the assistance of a pricing service using calculations or factors based on indices of domestic securities and other appropriate indicators, such as prices of relevant American Depository Receipts and futures contracts, to adjust local market prices for subsequent movements through the time the Series calculates its net asset value. The value of securities used for the net asset value calculation under the procedures may differ from published prices for the same securities. It is the Fund’s
Notes to Financial Statements
| 2. | SIGNIFICANT ACCOUNTING POLICIES (continued) |
Security Valuation (continued)
policy to classify each foreign equity security, except for those in the regions noted above, as Level 2 securities due to the fact the pricing service evaluated what factor was applied to the calculated end of day market price.
Various inputs are used in determining the value of the Series’ assets or liabilities carried at market value. These inputs are summarized in three broad levels. Level 1 includes quoted prices in active markets for identical assets and liabilities. Level 2 includes other significant observable inputs (including quoted prices for similar securities, interest rates, prepayment speeds, credit risk, etc.). Level 3 includes significant unobservable inputs (including the Series’ own assumptions in determining the fair value of investments.) The inputs or methodology used for valuing securities are not necessarily an indication of the risk associated with investing in those securities.
The following is a summary of the valuation levels used for major security types as of December 31, 2010 in valuing the Series’ assets or liabilities carried at market value:
| | | | | | | | | | | | | | | | |
| Description | | Total | | | Level 1 | | | Level 2 | | | Level 3 | |
Assets: | | | | | | | | | | | | | | | | |
Equity securities* | | $ | 301,466,847 | | | $ | 59,986,755 | | | $ | 241,443,358 | | | $ | 36,734 | |
Preferred securities | | | — | | | | — | | | | — | | | | — | |
Debt securities: | | | | | | | | | | | | | | | | |
Mutual funds | | | 15,625,574 | | | | 15,625,574 | | | | — | | | | — | |
Other financial instruments** | | | — | | | | — | | | | — | | | | — | |
| | | | | | | | | | | | | | | | |
Total assets | | | 317,092,421 | | | | 75,612,329 | | | | 241,443,358 | | | | 36,734 | |
| | | | | | | | | | | | | | | | |
Liabilities: | | | | | | | | | | | | | | | | |
Other financial instruments** | | | — | | | | — | | | | — | | | | — | |
| | | | | | | | | | | | | | | | |
Total liabilities: | | | — | | | | — | | | | — | | | | — | |
| | | | | | | | | | | | | | | | |
Total | | $ | 317,092,421 | | | $ | 75,612,329 | | | $ | 241,443,358 | | | $ | 36,734 | |
| | | | | | | | | | | | | | | | |
The following table is a reconciliation of Level 3 investments for which significant unobservable inputs were used to determine fair value:
| | | | |
| Level 3 Reconciliation | | Equity
Securities | |
Balance as of December 31, 2009 (market value) | | $ | — | |
Accrued discounts/premiums | | | — | |
Change in unrealized appreciation/depreciation *** | | | 36,734 | |
Net realized gain | | | — | |
Net purchases/sales | | | — | |
| | | | |
Balance as of December 31, 2010 (market value) | | $ | 36,734 | |
| | | | |
*Includes common stock, warrants and rights. Please see the Investment Portfolio for industry classification and for securities where a latest quoted sales price is not available and the latest quoted bid price was used to value the security or foreign securities that had an International Fair Value factor applied from the pricing service. Such securities are included in Level 2 in the table above.
**Other financial instruments are derivative instruments not reflected in the Investment Portfolio, such as futures, forwards and swap contracts, which are valued at the unrealized appreciation/depreciation on the instrument. As of December 31, 2010, the Series did not hold any derivative instruments.
Notes to Financial Statements
| 2. | SIGNIFICANT ACCOUNTING POLICIES (continued) |
Security Valuation (continued)
***The change in unrealized appreciation (depreciation) on securities still held at December 31, 2010 was $36,734, which is included in the related net change in unrealized appreciation/depreciation on the Statement of Operations.
The Fund’s policy is to recognize transfers in and transfers out of the valuation levels as of the beginning of the reporting period. During the year ended December 31, 2010, the Fund had a significant amount of foreign equity securities transfer from Level 1 to Level 2 due to the implementation of new international fair value pricing procedures. The following is a summary of the foreign equity securities that transferred from Level 1 to Level 2:
| | | | | | | | | | | | | | |
| | | Total # Securities Level 1 at beginning and Level 2 at end of period | | Total Market
Value
Beginning of
period | | | Total Market
Value End of period | | | Change in
Market Value | |
| | 74 | | $ | 187,697,217 | | | $ | 204,537,518 | | | $ | 16,840,301 | |
Additional disclosure surrounding the activity in Level 3 fair value measurement will be effective for fiscal years beginning after December 15, 2010. Management has concluded that this will not have a material impact on the Series’ financial statements.
Security Transactions, Investment Income and Expenses
Security transactions are accounted for on trade date. Dividend income is recorded on the ex-dividend date, except that if the ex-dividend date has passed, certain dividends from foreign securities are recorded as soon as the Fund is informed of the ex-dividend date. Non-cash dividends, if any, are recorded at the fair market value of the securities received. Interest income, including amortization of premium and accretion of discounts using the effective interest method, is earned from settlement date and accrued daily.
Expenses are recorded on an accrual basis. Most expenses of the Fund can be attributed to a specific series. Expenses which cannot be directly attributed are apportioned among the series in the Fund in such a manner as deemed equitable by the Fund’s Board, taking into consideration, among other things, the nature and type of expense.
The Series uses the identified cost method for determining realized gain or loss on investments for both financial statement and federal income tax reporting purposes.
Foreign Currency Translation
The books and records of the Series are maintained in U.S. dollars. Foreign currencies, investments and other assets and liabilities are translated into U.S. dollars at the current exchange rates. Purchases and sales of investment securities and income and expenses are translated on the respective dates of such transactions. The Series does not isolate realized and unrealized gains and losses attributable to changes in the exchange rates from gains and losses that arise from changes in the market value of investments. Such fluctuations are included with net realized and unrealized gain or loss on investments. Net realized foreign currency gains and losses represent foreign currency gains and losses between trade date and settlement date on securities transactions, gains and losses on disposition of foreign currencies and the difference between the amount of income and foreign withholding taxes recorded on the books of the Series and the amounts actually received or paid.
Federal Taxes
The Series’ policy is to comply with the provisions of the Internal Revenue Code applicable to regulated investment companies. The Series is not subject to federal income tax or excise tax to the extent that the Series distributes to
Notes to Financial Statements
| 2. | SIGNIFICANT ACCOUNTING POLICIES (continued) |
Federal Taxes (continued)
shareholders each year its taxable income, including any net realized gains on investments, in accordance with requirements of the Internal Revenue Code. Accordingly, no provision for federal income tax or excise tax has been made in the financial statements.
Management evaluates its tax positions to determine if the tax positions taken meet the minimum recognition threshold in connection with accounting for uncertainties in income tax positions taken or expected to be taken for the purposes of measuring and recognizing tax liabilities in the financial statements. Recognition of tax benefits of an uncertain tax position is required only when the position is “more likely than not” to be sustained assuming examination by taxing authorities. At December 31, 2010, the Series has recorded no liability for net unrecognized tax benefits relating to uncertain income tax positions taken or expected to be taken in future tax returns.
The Series files income tax returns in the U.S. federal jurisdiction, various states and foreign jurisdictions, as required. No income tax returns are currently under investigation. The statute of limitations on the Series’ tax returns remains open for the years ended December 31, 2007 through December 31, 2010. The Fund is not aware of any tax positions for which it is reasonably possible that the total amounts of unrecognized tax benefits will significantly change in the next twelve months.
Additionally, based on the Fund’s understanding of the tax rules and rates related to income, gains and transactions for foreign jurisdictions in which it invests, the Series will provide for foreign taxes, and where appropriate, deferred foreign tax.
Distributions of Income and Gains
Distributions to shareholders of net investment income and net realized gains are made annually. An additional distribution may be necessary to avoid taxation of the Series. Distributions are recorded on the ex-dividend date.
Indemnifications
The Fund’s organizational documents provide former and current directors and officers with a limited indemnification against liabilities arising in connection with the performance of their duties to the Fund. In the normal course of business, the Fund may also enter into contracts that provide general indemnifications. The Fund’s maximum exposure under these arrangements is unknown as this would be dependent on future claims that may be made against the Fund. The risk of material loss from such claims is considered remote.
Other
The preparation of financial statements in conformity with accounting principles generally accepted in the United States of America requires management to make estimates and assumptions that affect the reported amounts of assets and liabilities and the disclosure of contingent assets and liabilities at the date of the financial statements and the reported amounts of income and expenses during the reporting period. Actual results could differ from those estimates.
| 3. | TRANSACTIONS WITH AFFILIATES |
The Fund has an Investment Advisory Agreement (the “Agreement”) with the Advisor, for which the Series pays a fee, computed daily and payable monthly, at an annual rate of 1.00% of the Series’ average daily net assets.
Under the Agreement, personnel of the Advisor provide the Series with advice and assistance in the choice of investments and the execution of securities transactions, and otherwise maintain the Series’ organization. The Advisor also provides the Fund with necessary office space and fund administration and support services. The salaries of all officers of the Fund (except a percentage of the Fund’s Chief Compliance Officer’s salary, which is paid by the Fund), and of all Directors who are “affiliated persons” of the Fund, or of the Advisor, and all personnel of the Fund,
Notes to Financial Statements
| 3. | TRANSACTIONS WITH AFFILIATES (continued) |
or of the Advisor, performing services relating to research, statistical and investment activities, are paid by the Advisor. Each “non-affiliated” Director receives an annual stipend, which is allocated among all the active series of the Fund. In addition, these Directors also receive a fee per Board meeting attended plus a fee for each committee meeting attended.
For the year ended December 31, 2010, the Advisor voluntarily waived fees of $758, which is included as a reduction of expenses on the Statement of Operations. The Advisor is not eligible to recoup any expense that has been waived or reimbursed in prior years.
Manning & Napier Investor Services, Inc., a registered broker-dealer affiliate of the Advisor, acts as distributor for the Fund’s shares. The services of Manning & Napier Investor Services, Inc. are provided at no additional cost to the Series.
The Advisor has agreements with PNC Global Investment Servicing (U.S.) Inc. (“PNCGIS”) under which PNCGIS serves as sub-accountant services agent and sub-transfer agent. The Fund pays the Advisor an annual fee related to fund accounting and administration of 0.0175% on the first $3 billion of average daily net assets (excluding Target Series); 0.015% on the next $3 billion of average daily net assets (excluding Target Series); and 0.01% of the average daily net assets in excess of $6 billion (excluding Target Series); plus a base fee of $25,500 per Series. Transfer Agent fees are charged to the Fund on a per account basis. Additionally, certain transaction- and cusip-based fees and out-of-pocket expenses, including charges for reporting relating to the Fund’s compliance program, are charged.
Effective July 1, 2010, PNCGIS was sold to The Bank of New York Mellon Corporation, the Series’ custodian. At the close of the sale, PNCGIS changed its name to BNY Mellon Investment Servicing (U.S.) Inc. (“BNY”).
Expenses not directly attributable to a Series are allocated based on each Series’ relative net assets or number of accounts, depending on the expense.
| 4. | PURCHASES AND SALES OF SECURITIES |
For the year ended December 31, 2010, purchases and sales of securities, other than U.S. Government securities and short-term securities, were $47,150,818 and $34,149,837, respectively. There were no purchases or sales of U.S. Government securities.
| 5. | CAPITAL STOCK TRANSACTIONS |
Transactions in shares of International Series were:
| | | | | | | | | | | | | | | | |
| | | For the Year Ended 12/31/10 | | | For the Year Ended 12/31/09 | |
| | | Shares | | | Amount | | | Shares | | | Amount | |
Sold | | | 4,885,983 | | | $ | 40,773,050 | | | | 6,129,853 | | | $ | 48,093,794 | |
Reinvested | | | 2,043,894 | | | | 17,734,979 | | | | 1,415,130 | | | | 11,706,962 | |
Repurchased | | | (2,930,271 | ) | | | (24,540,743 | ) | | | (3,449,201 | ) | | | (23,388,016 | ) |
| | | | | | | | | | | | | | | | |
Total | | | 3,999,606 | | | $ | 33,967,286 | | | | 4,095,782 | | | $ | 36,412,740 | |
| | | | | | | | | | | | | | | | |
Substantially all of the Series’ shares represent investments by fiduciary accounts over which the Advisor has sole investment discretion.
Notes to Financial Statements
The Series may trade in instruments including written and purchased options, forward foreign currency exchange contracts and futures contracts and other derivatives in the normal course of investing activities to assist in managing exposure to various market risks. Investments in these instruments may subject the Series to various elements of risk, which may involve, to a varying degree, elements of risk in excess of the amounts recognized for financial statement purposes. These risks include: the risk that changes in the value of a derivative may not correlate perfectly with the underlying asset, rate or index, counterparty credit risk related to over the counter derivatives counterparties’ failure to perform under contract terms, liquidity risk related to the lack of a liquid market for these contracts allowing the fund to close out its position(s) and documentation risk relating to disagreement over contract terms. No such investments were held by the Series during the year ended December 31, 2010.
Investing in securities of foreign companies and foreign governments involves special risks and considerations not typically associated with investing in securities of domestic companies and the U.S. Government. These risks include revaluation of currencies and future adverse political and economic developments. Moreover, securities of foreign companies and foreign governments and their markets may be less liquid and their prices more volatile than those of comparable domestic companies and the U.S. Government.
| 8. | FEDERAL INCOME TAX INFORMATION |
The amount and characterization of certain income and capital gains to be distributed are determined in accordance with federal income tax regulations, which may differ from accounting principles generally accepted in the United States of America. These differences are primarily due to differing book and tax treatments in the timing of the recognition of net investment income or gains and losses, including foreign currency gains and losses, post-October losses, foreign capital gains taxes and investments in passive foreign investment companies (PFICs). The Series may periodically make reclassifications among its capital accounts to reflect income and gains available for distribution (or available capital loss carryovers) under income tax regulations without impacting the Series’ net asset value. Any such reclassifications are not reflected in the financial highlights.
The tax character of distributions paid were as follows:
| | | | | | | | | | |
| | | For the Year
Ended
12/31/10 | | | | | For the Year
Ended
12/31/09 | |
Ordinary income | | $ | 12,805,548 | | | | | $ | 11,987,760 | |
Long-term capital gains | | | 5,323,684 | | | | | | — | |
For the year ended December 31, 2010, the Series elected to defer $16,001 of currency losses, attributable to post-October losses.
At December 31, 2010, the tax basis of distributable earnings and the net unrealized appreciation based on the identified cost of investments for federal income tax purposes were as follows:
| | | | | | | | |
Cost for federal income tax purposes | | $ | 273,894,572 | | | | | |
Unrealized appreciation | | $ | 65,409,200 | | | | | |
Unrealized depreciation | | | (22,211,351 | ) | | | | |
| | | | | | | | |
Net unrealized appreciation | | $ | 43,197,849 | | | | | |
| | | | | | | | |
Undistributed ordinary income | | | 691,677 | | | | | |
Report of Independent Registered Public Accounting Firm
To the Board of Directors of Manning & Napier Fund, Inc. and Shareholders of International Series:
In our opinion, the accompanying statement of assets and liabilities, including the investment portfolio, and the related statements of operations and of changes in net assets and the financial highlights present fairly, in all material respects, the financial position of the International Series (a series of Manning & Napier Fund, Inc., hereafter referred to as the “Series”) at December 31, 2010, and the results of its operations for the year then ended, the changes in its net assets for each of the two years in the period then ended and the financial highlights for each of the five years in the period then ended, in conformity with accounting principles generally accepted in the United States of America. These financial statements and financial highlights (hereafter referred to as “financial statements”) are the responsibility of the Series’ management. Our responsibility is to express an opinion on these financial statements based on our audits. We conducted our audits of these financial statements in accordance with the standards of the Public Company Accounting Oversight Board (United States). Those standards require that we plan and perform the audit to obtain reasonable assurance about whether the financial statements are free of material misstatement. An audit includes examining, on a test basis, evidence supporting the amounts and disclosures in the financial statements, assessing the accounting principles used and significant estimates made by management, and evaluating the overall financial statement presentation. We believe that our audits, which included confirmation of securities at December 31, 2010 by correspondence with the custodian, provide a reasonable basis for our opinion.
New York, New York
February 22, 2011
Supplemental Tax Information (unaudited)
All designations are based on financial information available as of the date of this annual report and, accordingly are subject to change.
For federal income tax purposes, the Series designates for the current fiscal year $7,010,585 or, if different, the maximum amount allowable under the tax law as qualified dividend income.
Pursuant to Section 852 of the Internal Revenue Code, as amended, the Series hereby designates $5,323,684 as capital gains for its taxable year ended December 31, 2010, or if different, the maximum allowable under tax law.
Renewal of Investment Advisory Agreement (unaudited)
At the Manning & Napier Fund, Inc. (the “Fund”) Board of Directors’ (the “Board”) meeting, held on November 17, 2010, the Investment Advisory Agreement (the “Agreement”) between the Fund and Manning & Napier Advisors, Inc. (the “Advisor”) was reviewed by the Board for renewal. In connection with the decision whether to renew the Agreement, a variety of material was prepared for and reviewed by the Board.
Representatives of the Advisor attended the meeting and presented additional oral and written information to the Board to assist the Board in its considerations. The discussion immediately below outlines the materials and information presented to the Board in connection with the Board’s 2010 Annual Review of the Agreement and the conclusions made by the Directors when determining to continue the Agreement.
| | • | | The Board considered the services provided by the Advisor under the Agreement including, among others: deciding what securities to purchase and sell for each Series; arranging for the purchase and sale of such securities by placing orders with broker-dealers; administering the affairs of the Fund (including the books and records of the Fund not maintained by third party service providers such as the custodian or sub-transfer agent); arranging for the insurance coverage for the Fund; and supervising the preparation of tax returns, SEC filings (including registration statements) and reports to shareholders for the Fund. The Board also considered the nature and quality of such services provided under the Agreement in light of the Advisor’s services provided to the Fund for 24 years. The Board discussed the quality of these services with representatives from the Advisor and concluded that the Advisor was performing its services to the Fund required under the Agreement in a reasonable manner. |
| | • | | The Board considered the investment performance of the various Series of the Fund. The investment performance for each Series was reviewed on a cumulative basis since inception and on a one year basis. In addition, annualized performance for the following time periods was considered: inception, three year, five year, ten year, and current market cycle. A market cycle includes periods of both rising and falling markets. Returns for established benchmark indices for each Series were provided for each time period. The Board noted that the various Series were competitive against their respective benchmarks and/or peer groups over various time periods, but in particular over the full market cycle period relevant for the Series. In addition, the Board considered at the meeting (and considers on a quarterly basis) a peer group performance analysis consisting of Morningstar universes of mutual funds with similar investment objectives. The Board discussed the performance with representatives from the Advisor and concluded that the investment performance of each of the Fund’s Series was reasonable based on the Fund’s actual performance and comparative performance, especially performance over the current market cycle. |
| | • | | The Board considered the costs of the Advisor’s services and the profits of the Advisor as they relate to the Advisor’s services to the Fund under the Agreement. In reviewing the Advisor’s costs and profits, the Board discussed the Advisor’s revenues generated from the Fund (on both an actual and adjusted basis) and its expenses associated with providing the services under the Agreement. In addition, the Board reviewed the Advisor’s expenses associated with Fund activities outside of the Agreement (such as expense reimbursements pursuant to expense caps and payments made by the Advisor to third party platforms on which shares of the Fund are available for purchase). It was noted by representatives of the Advisor that 11 of the 27 active Series of the Fund are currently experiencing expenses above the capped expense ratios. After discussing the above costs and profits, the Board concluded that the Advisor’s profitability relating to its services provided under the Agreement was reasonable. |
| | • | | The Board considered the fees and expenses of the various Series of the Fund. The Advisor presented the advisory fees and total expenses for each Series, including the advisory fee adjusted for any expense waivers or reimbursements (either contractual or voluntary) paid by the Advisor. The advisory fees and expense ratios of each Series were compared to an average (on both a mean and median basis) of similar funds as disclosed on the Morningstar database. Representatives of the Advisor discussed with the Board the levels of its advisory |
Renewal of Investment Advisory Agreement (unaudited)
| | fee for each Series of the Fund and as compared to the median and mean advisory fees for similar funds as listed on Morningstar. Expense ratios for every Series, except the Pro-Blend’s Class R and Class C, and Target Class R and Class C, are currently below the median and mean for similar funds as listed on Morningstar. Based on their review of the information provided, the Board concluded that the fees and expenses of each Series of the Fund were reasonable on a comparative basis. |
| | • | | The Board also considered the other benefits the Advisor derives from its relationship with the Fund. Such other benefits include certain research products provided by soft dollars. Given the level of soft dollar transactions involving the Fund, the Board concluded that these additional benefits to the Advisor were reasonable. |
| | • | | In addition to the factors described above, the Board considered the Advisor’s personnel, investment strategies, policies and procedures relating to compliance with personal securities transactions, and reputation, expertise and resources in domestic and foreign financial markets. The Board concluded that these factors support the conclusion that the Advisor performs its services in a reasonable manner. |
| | • | | The Board did not consider economies of scale at this time because of the multiple uses of the Fund (for the Advisor’s discretionary investment account clients in addition to direct investors), the current profitability of the Advisor’s services to the Fund under the Agreement, and the overall size of the Fund complex. |
Based on the Board’s deliberations and their evaluation of the information described above, the Board, including a majority of Directors that are not “interested persons” as defined in the Investment Company Act of 1940, concluded that the compensation under the Agreement was fair and reasonable in light of the services and expenses and such other matters as the Directors considered to be relevant in the exercise of their reasonable judgment. Accordingly, the Board approved the renewal of the Agreement. In the course of their deliberations, the Directors did not identify any particular information that was all important or controlling.
Directors’ and Officers’ Information (unaudited)
The Statement of Additional Information provides additional information about the Fund’s directors and officers and can be obtained without charge by calling 1-800-466-3863, at www.manningnapieradvisors.com, or on the EDGAR Database on the SEC Internet web site (http:// www.sec.gov). The following chart shows certain information about the Fund’s officers and directors, including their principal occupations during the last five years. Unless specific dates are provided, the individuals have held the listed positions for longer than five years.
| | |
INTERESTED DIRECTOR/OFFICER | | |
| |
Name: Address: | | B. Reuben Auspitz* 290 Woodcliff Drive Fairport, NY 14450 |
Age: | | 63 |
Current Position(s) Held with Fund: | | Principal Executive Officer, President, Chairman & Director |
Term of Office1 & Length of Time Served: | | Indefinite - Director since 1984; Vice President 1984 - 2003; President |
| | since 2004; Principal Executive Officer since 2002 |
Principal Occupation(s) During Past 5 Years: | | Executive Vice President; Executive Group Member**; Chief Compliance Officer since 2004; Vice Chairman since June 2010; Co-Executive Director from 2003-2010 - Manning & Napier Advisors, Inc. President; Director - Manning & Napier Investor Services, Inc. Holds or has held one or more of the following titles for various subsidiaries and affiliates: President, Vice President, Director, Chairman, Treasurer, Chief Compliance Officer or Member. |
Number of Portfolios Overseen within Fund Complex: | | 29 |
Other Directorships Held Outside Fund Complex: | | N/A |
INDEPENDENT DIRECTORS | | |
| |
Name: | | Paul A. Brooke |
Address: | | 290 Woodcliff Drive Fairport, NY 14450 |
Age: | | 65 |
Current Position(s) Held with Fund: | | Director, Audit Committee Member, Governance & Nominating Committee Member |
Term of Office & Length of Time Served: | | Indefinite - Since 2007 |
Principal Occupation(s) During Past 5 Years: | | Chairman & CEO, Alsius Corp. (investments); Managing Member, PMSV Holdings LLC (investments) |
Number of Portfolios Overseen within Fund Complex: | | 29 |
Other Directorships Held Outside Fund Complex: | | Incyte Corp. (2000-present) ViroPharma, Inc. (2000-present) HLTH Corp. (2000-present) Cheyne Capital International (2000-present) MPM Bio-equities (2000-present) GMP Companies (2000-present) HoustonPharma (2000-present) |
Name: | | Richard M. Hurwitz |
Address: | | 290 Woodcliff Drive |
| | Fairport, NY 14450 |
Age: | | 47 |
Current Position(s) Held with Fund: | | Director, Audit Committee Member, Governance & Nominating Committee Member |
Term of Office & Length of Time Served: | | Indefinite - Since 2009 |
Principal Occupation(s) During Past 5 Years: | | Chief Executive Officer, Pictometry International Corp. since August 2010 (provider of georeferenced, aerial image libraries and related software) Managing Partner (2006-July 2010) - Aegis Investment Partners, LLC (investments); Founder and Managing Partner (2004-2005) - Village Markets, LLC (groceries) |
Number of Portfolios Overseen within Fund Complex: | | 29 |
Other Directorships Held Outside Fund Complex: | | Pictometry International Corp. (2000-2010) |
| | Pioneering Technologies (2006-2009) |
| | | Vensearch Capital Corp. (2003-2007) |
Directors’ and Officers’ Information (unaudited)
| | |
INDEPENDENT DIRECTORS (continued) | | |
Name: | | Stephen B. Ashley |
Address: | | 290 Woodcliff Drive |
| | Fairport, NY 14450 |
Age: | | 70 |
Current Position(s) Held with Fund: | | Director, Audit Committee Member, Governance & Nominating Committee Member |
Term of Office & Length of Time Served: | | Indefinite - Since 1996 |
Principal Occupation(s) During Past 5 Years: | | Chairman, Director, President & Chief Executive Officer, The Ashley Group (property management and investment). Chairman (non-executive) 2004-2008; Director 1995-2008 - Fannie Mae (mortgage) |
Number of Portfolios Overseen within Fund Complex: | | 29 |
Other Directorships Held Outside Fund Complex: | | The Ashley Group (1995-2008) |
| | | Genesee Corporation (1987-2007) |
Name: | | Peter L. Faber |
Address: | | 290 Woodcliff Drive |
| | Fairport, NY 14450 |
Age: | | 72 |
Current Position(s) Held with Fund: | | Director, Governance & Nominating Committee Member |
Term of Office & Length of Time Served: | | Indefinite - Since 1987 |
Principal Occupation(s) During Past 5 Years: | | Senior Counsel since 2006, Partner (1995 - 2006) - McDermott, Will & Emery LLP (law firm) |
Number of Portfolios Overseen within Fund Complex: | | 29 |
Other Directorships Held Outside Fund Complex: | | Partnership for New York City, Inc. (non-profit) New York Collegium (non-profit) Boston Early Music Festival (non-profit) |
Name: | | Harris H. Rusitzky |
Address: | | 290 Woodcliff Drive |
| | Fairport, NY 14450 |
Age: | | 76 |
Current Position(s) Held with Fund: | | Director, Audit Committee Member, Governance & Nominating Committee Member |
Term of Office & Length of Time Served: | | Indefinite - Since 1985 |
Principal Occupation(s) During Past 5 Years: | | President, The Greening Group (business consultants) since 1994; Partner, The Restaurant Group (restaurants) since 2006 |
Number of Portfolios Overseen within Fund Complex: | | 29 |
Other Directorships Held Outside Fund Complex: | | N/A |
OFFICERS | | |
| |
Name: | | Jeffrey S. Coons, Ph.D., CFA |
Address: | | 290 Woodcliff Drive |
| | Fairport, NY 14450 |
Age: | | 47 |
Current Position(s) Held with Fund: | | Vice President |
Term of Office1 & Length of Time Served: | | Since 2004 |
Principal Occupation(s) During Past 5 Years: | | President since 2010, Co-Director of Research since 2002, Executive Group Member** since 2003, - Manning & Napier Advisors, Inc. Holds one or more of the following titles for various subsidiaries and affiliates: President, Director, Treasurer or Senior Trust Officer. |
Number of Portfolios Overseen within Fund Complex: | | 29 |
Other Directorships Held Outside Fund Complex: | | N/A |
Directors’ and Officers’ Information (unaudited)
| | |
OFFICERS (continued) | | |
| |
Name: | | Beth Galusha |
Address: | | 290 Woodcliff Drive |
| | Fairport, NY 14450 |
Age: | | 49 |
Current Position(s) Held with Fund: | | Assistant Chief Financial Officer |
Term of Office1 & Length of Time Served: | | Assistant Chief Financial Officer since 2010 |
Principal Occupation(s) During Past 5 Years: | | Chief Financial Officer and Treasurer, Manning & Napier Advisors, Inc. Holds one or more of the following titles for various affiliates: Chief Financial Officer, Director, or Treasurer |
Number of Portfolios Overseen within Fund Complex: | | 29 |
Other Directorships Held Outside Fund Complex: | | N/A |
Name: | | Christine Glavin |
Address: | | 290 Woodcliff Drive |
| | Fairport, NY 14450 |
Age: | | 44 |
Current Position(s) Held with Fund: | | Principal Financial Officer, Chief Financial Officer |
Term of Office1 & Length of Time Served: | | Principal Financial Officer since 2002; Chief Financial Officer since 2001 |
Principal Occupation(s) During Past 5 Years: | | Fund Reporting Manager, Manning & Napier Advisors, Inc. since 1997 |
Number of Portfolios Overseen within Fund Complex: | | 29 |
Other Directorships Held Outside Fund Complex: | | N/A |
Name: | | Jodi L. Hedberg |
Address: | | 290 Woodcliff Drive |
| | Fairport, NY 14450 |
Age: | | 43 |
Current Position(s) Held with Fund: | | Corporate Secretary, Chief Compliance Officer, Anti-Money Laundering Compliance Officer |
Term of Office1 & Length of Time Served: | | Corporate Secretary since 1997; Chief Compliance Officer since 2004 |
Principal Occupation(s) During Past 5 Years: | | Director of Compliance, Manning & Napier Advisors, Inc. and affiliates since 1990 (title change in 2005 from Compliance Manager to Director of Compliance); Corporate Secretary, Manning & Napier Investor Services, Inc. since 2006 |
Number of Portfolios Overseen within Fund Complex: | | 29 |
Other Directorships Held Outside Fund Complex: | | N/A |
Name: | | Richard Yates |
Address: | | 290 Woodcliff Drive |
| | Fairport, NY 14450 |
Age: | | 45 |
Current Position(s) Held with Fund: | | Chief Legal Officer |
Term of Office1 & Length of Time Served: | | Chief Legal Officer since 2004 |
Principal Occupation(s) During Past 5 Years: | | Counsel - Manning & Napier Advisors, Inc. & affiliates since 2000; Holds one or more of the following titles for various affiliates; Director or Corporate Secretary |
Number of Portfolios Overseen within Fund Complex: | | 29 |
Other Directorships Held Outside Fund Complex: | | N/A |
*Interested Director, within the meaning of the Investment Company Act of 1940 by reason of his position with the Fund’s investment advisor and distributor. Mr. Auspitz serves as the Executive Vice President and Director, Manning & Napier Advisors, Inc. and President and Director, Manning & Napier Investor Services, Inc., the Fund’s distributor.
**Prior to June 2010, the Executive Group, consisting of senior executive employee-owners, performed the duties of the Office of the Chief Executive of the Advisor. Effective June 2010, the Executive Group serves as an advisory board to the Chief Executive Officer.
1The term of office for President, Vice President, Chief Financial Officer, Assistant Chief Financial Officer, Chief Legal Officer and Corporate Secretary is one year and until their respective successors are chosen and qualified. All other officers’ terms are indefinite.
This page intentionally Left Blank
29
Literature Requests (unaudited)
Proxy Voting Policies and Procedures
A description of the policies and procedures that the Fund uses to determine how to vote proxies relating to portfolio securities is available, without charge, upon request:
| | | | |
By phone | | 1-800-466-3863 | | |
On the Securities and Exchange | | | | |
Commission’s (SEC) web site | | http://www.sec.gov | | |
Proxy Voting Record
Information regarding how the Fund voted proxies relating to portfolio securities during the most recent 12-month period ended June 30th is available, without charge, upon request:
| | | | |
By phone | | 1-800-466-3863 | | |
On the SEC’s web site | | http://www.sec.gov | | |
Quarterly Portfolio Holdings
The Series’ complete schedule of portfolio holdings for the 1st and 3rd quarters of each fiscal year are provided on Form N-Q, and are available, without charge, upon request:
| | | | |
By phone | | 1-800-466-3863 | | |
On the SEC’s web site | | http://www.sec.gov | | |
The Series’ Form N-Q may be reviewed and copied at the SEC’s Public Reference Room in Washington, D.C. Information on the operation of the Public Reference Room may be obtained by calling 1-800-SEC-0330.
Prospectus and Statement of Additional Information (SAI)
The prospectus and SAI provide additional information about each Series, including charges, expenses and risks. These documents are available, without charge, upon request:
| | | | |
By phone | | 1-800-466-3863 | | |
On the SEC’s web site | | http://www.sec.gov | | |
On the Advisor’s web site | | http://www.manning-napier.com | | |
Additional information available at www.manning-napier.com
1. Fund Holdings - Month-End
2. Fund Holdings - Quarter-End
3. Shareholder Report - Annual
4. Shareholder Report - Semi-Annual
MNINT-12/10-AR

Management Discussion and Analysis (unaudited)
Dear Shareholders:
Over the course of 2010, the international markets experienced several ups and downs driven by well-defined swings in investor sentiment. Optimism fueled strong market returns early in the year, as upbeat economic releases led investors to believe in the potential for a robust global recovery. However, sentiment shifted drastically in May and June as more negative economic news and issues related to Europe’s government debt problems led to notable stock market losses. In another swing, the markets rebounded in the fall amid better economic developments.
With foreign equities posting gains in the third and fourth quarters, the choppy year ended on a fairly strong note, and broad international equity indices have now produced back-to-back years of positive results. For the twelve months ending December 31, 2010, the Morgan Stanley Capital International (MSCI) All Country World Index excluding the U.S. (ACWIxUS) was up 11.15%.
While the World Opportunities Series had a solid 9.23% return during 2010, the Series trailed the MSCI ACWIxUS Index. However, the Series continues to have a strong track record relative to the benchmark over the current international stock market cycle, April 1, 2003 through December 31, 2010, which includes both a bull and a bear market. Over this current cycle, the World Opportunities Series has earned an annualized return of 14.21%, compared to the 13.75% return of the ACWIxUS Index.
In the volatile market environment of 2010, Manning & Napier maintained a selective investment approach and focused on companies that we believe can grow market share. We continued to emphasize quality, targeting best-in-class companies expected to generate sales growth despite a muted economic backdrop, as well as “away game winners” expected to successfully compete in faster-growing markets overseas. Using our active stock selection strategies, our analysts also identified opportunities in certain cyclical industries that have experienced supply cutbacks. Specifically, we have looked for well-positioned companies that we believe can take market share and benefit from tight supply and demand dynamics.
During the last year, sector allocation decisions aided the World Opportunities Series’ relative results. In particular, a noteworthy underweight to Financials versus the benchmark and not owning stocks in the Utilities sector were drivers of outperformance. Meanwhile, a lower allocation to Materials than the benchmark detracted from relative returns over the past twelve months. Throughout 2010, the Series maintained a relatively high exposure to Information Technology, Consumer Staples, Health Care, and Industrials.
As for specific stock selections, individual investments in the Energy sector significantly boosted the Series’ relative results over the last twelve months. However, security selections in Information Technology and Consumer Staples hurt relative performance. From a country standpoint, stock selections in Canada, Germany, Brazil, Ireland, and the Netherlands helped the World Opportunities Series’ relative returns in the last twelve months. In contrast, an underweight to Japan compared to the benchmark detracted from relative returns in 2010, as did specific stock selections in this market.
Despite concerns about Europe’s sovereign debt crisis, the World Opportunities Series maintained an overweight to Developed Europe. We believe some of the healthier, core European countries have more favorable dynamics, and we have invested in what we consider to be top level companies that may benefit from sales outside the European area. Indeed, stock selections in Developed Europe were a primary contributor to relative performance in 2010. Selections in North America also aided returns.
With noteworthy headwinds such as sovereign debt issues in Europe, high government debt burdens in the developed world, and inflationary pressures in the emerging markets, the global economy remains in an uneven, slow growth environment. As the markets fluctuated around this slow growth trend in 2010, Manning & Napier earned solid returns by staying focused on the fundamentals and maintaining our selective investment process. This investment approach has proved beneficial over the past 40 years, and we believe these qualities will remain important as the market environment unfolds in 2011.
As always, we appreciate your business.
Sincerely,
Manning & Napier Advisors, Inc.
Performance Update as of December 31, 2010 (unaudited)
| | | | | | | | | | | | | | | | |
| | | | | | Average Annual Total Returns
As of December 31, 2010 | | | | |
| | | One
Year | | | Five Year | | | Ten Year | | | Since
Inception 1 | |
Manning & Napier Fund, Inc. - World Opportunities Series2 | | | 9.23% | | | | 7.02% | | | | 8.59% | | | | 9.75% | |
Morgan Stanley Capital International (MSCI) All Country World Index ex U.S.3 | | | 11.15% | | | | 4.82% | | | | 5.54% | | | | 5.86% | |
The following graph compares the value of a $10,000 investment in the Manning & Napier Fund, Inc. - World Opportunities Series for the ten years ended December 31, 2010 to the MSCI All Country World Index ex U.S.
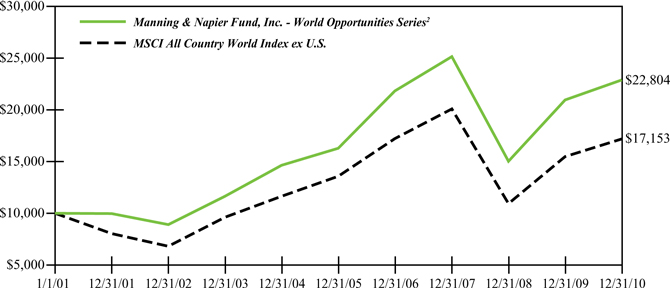
1Performance numbers for the Series are calculated from September 6, 1996, the Series’ inception date. Prior to 2001, the MSCI All Country World Index ex U.S. only published month-end numbers; therefore, performance numbers for the Index are calculated from September 30, 1996.
2The Series’ performance does not reflect the deduction of taxes that a shareholder would pay on fund distributions or the redemption of shares. The Series’ performance is historical and may not be indicative of future results. The performance returns shown are inclusive of the net expense ratio of the Series. For the year ended December 31, 2010, this net expense ratio was 1.11%. The gross expense ratio, which does not account for any voluntary or contractual waivers currently in effect, was 1.11% for the year ended December 31, 2010.
3The MSCI All Country World Index ex U.S. is a free float-adjusted market capitalization weighted index that is designed to measure equity market performance in the global developed and emerging markets and consists of 47 developed and emerging market country indices outside the United States. The Index is denominated in U.S. Dollars. The Index returns assume daily reinvestment of gross dividends (which do not account for foreign dividend taxation) from the inception of the Series (see Note 1 above) through December 31, 1998, as net returns were not available. Subsequent to December 31, 1998, the Index returns assume daily reinvestment of net dividends (thus accounting for foreign dividend taxation). Unlike Series returns, the Index returns do not reflect any fees or expenses.
Shareholder Expense Example (unaudited)
As a shareholder of the Series, you may incur two types of costs: (1) transaction costs and (2) ongoing costs, including management fees and other Series expenses. This example is intended to help you understand your ongoing costs (in dollars) of investing in the Series and to compare these costs with the ongoing costs of investing in other mutual funds.
The example is based on an investment of $1,000 invested at the beginning of the period and held for the entire period (July 1, 2010 to December 31, 2010).
Actual Expenses
The first line of the table below provides information about actual account values and actual expenses. You may use the information in this line, together with the amount you invested, to estimate the expenses that you paid over the period. Simply divide your account value by $1,000 (for example, an $8,600 account value divided by $1,000 = 8.6), then multiply the result by the number in the first line under the heading entitled “Expenses Paid During Period” to estimate the expenses you paid on your account during this period.
Hypothetical Example for Comparison Purposes
The second line of the table below provides information about hypothetical account values and hypothetical expenses based on the Series’ actual expense ratio and an assumed rate of return of 5% per year before expenses, which is not the Series’ actual return. The hypothetical account values and expenses may not be used to estimate the actual ending account balance or expenses you paid during the period. You may use this information to compare the ongoing costs of investing in the Series and other funds. To do so, compare this 5% hypothetical example with the 5% hypothetical examples that appear in the shareholder reports of the other funds.
Please note that the expenses shown in the table are meant to highlight your ongoing costs only and do not reflect any transaction costs. Therefore, the second line of the table is useful in comparing ongoing costs only, and will not help you determine the relative total costs of owning different funds. In addition, if these transaction costs were included, your costs would have been higher.
| | | | | | |
| | | Beginning
Account Value
7/1/10 | | Ending
Account Value
12/31/10 | | Expenses Paid
During Period*
7/1/10-12/31/10 |
Actual | | $1,000.00 | | $1,233.60 | | $6.19 |
Hypothetical
(5% return before expenses) | | $1,000.00 | | $1,019.66 | | $5.60 |
*Expenses are equal to the Series’ annualized expense ratio (for the six-month period) of 1.10%, multiplied by the average account value over the period, multiplied by 184/365 (to reflect the one-half year period). Expenses are based on the most recent fiscal half year; therefore, the expense ratio stated above may differ from the expense ratio stated in the financial highlights, which is based on one-year data. The Series’ total return would have been lower had certain expenses not been waived during the period.
Portfolio Composition as of December 31, 2010 (unaudited)
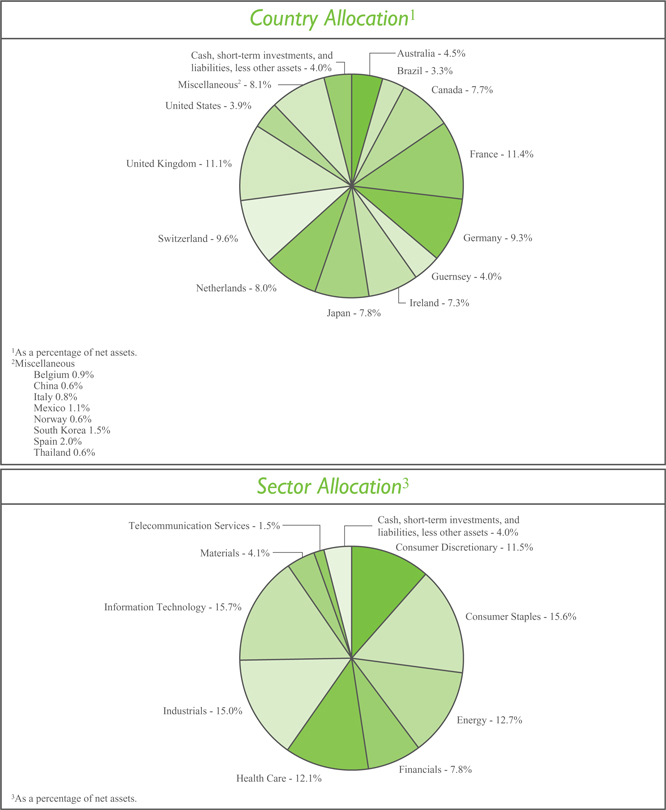
Investment Portfolio - December 31, 2010
| | | | | | | | |
| | |
| | | Shares | | | Value (Note 2) | |
| | |
COMMON STOCKS - 95.0% | | | | | | | | |
| | |
Consumer Discretionary - 11.5% | | | | | | | | |
Automobiles - 1.3% | | | | | | | | |
Bayerische Motoren Werke AG (BMW) (Germany)1 | | | 658,390 | | | $ | 51,872,596 | |
Suzuki Motor Corp. (Japan)1 | | | 1,290,200 | | | | 31,672,883 | |
| | | | | | | | |
| | | | | | | 83,545,479 | |
| | | | | | | | |
Hotels, Restaurants & Leisure - 0.8% | | | | | | | | |
Accor S.A. (France)1 | | | 772,010 | | | | 34,406,578 | |
Club Mediterranee S.A. (France)*1 | | | 852,070 | | | | 17,625,544 | |
| | | | | | | | |
| | | | | | | 52,032,122 | |
| | | | | | | | |
Leisure Equipment & Products - 0.5% | | | | | | | | |
Sankyo Co. Ltd. (Japan)1 | | | 576,000 | | | | 32,453,798 | |
| | | | | | | | |
Media - 6.5% | | | | | | | | |
Grupo Televisa S.A. - ADR (Mexico)* | | | 2,837,700 | | | | 73,581,561 | |
Liberty Global, Inc. - Class A (United States)* | | | 1,929,970 | | | | 68,282,339 | |
Mediaset S.p.A. (Italy)1 | | | 4,111,660 | | | | 24,901,045 | |
Reed Elsevier plc (United Kingdom)1 | | | 7,692,400 | | | | 64,977,565 | |
Societe Television Francaise 1 (France)1 | | | 8,726,180 | | | | 151,698,085 | |
Virgin Media, Inc. (United Kingdom) | | | 1,222,838 | | | | 33,310,107 | |
| | | | | | | | |
| | | | | | | 416,750,702 | |
| | | | | | | | |
Multiline Retail - 1.2% | | | | | | | | |
Marks & Spencer Group plc (United Kingdom)1 | | | 13,137,700 | | | | 75,758,378 | |
| | | | | | | | |
Textiles, Apparel & Luxury Goods - 1.2% | | | | | | | | |
Adidas AG (Germany)1 | | | 1,234,880 | | | | 80,327,899 | |
| | | | | | | | |
| | |
Total Consumer Discretionary | | | | | | | 740,868,378 | |
| | | | | | | | |
| | |
Consumer Staples - 14.6% | | | | | | | | |
Beverages - 2.9% | | | | | | | | |
Anheuser-Busch InBev N.V. (Belgium)1 | | | 1,050,370 | | | | 60,017,281 | |
Heineken N.V. (Netherlands)1 | | | 2,532,650 | | | | 124,218,172 | |
| | | | | | | | |
| | | | | | | 184,235,453 | |
| | | | | | | | |
Food & Staples Retailing - 5.1% | | | | | | | | |
Carrefour S.A. (France)1 | | | 3,017,720 | | | | 124,428,310 | |
Koninklijke Ahold N.V. (Netherlands)1 | | | 3,846,750 | | | | 50,816,507 | |
Tesco plc (United Kingdom)1 | | | 23,591,360 | | | | 156,434,649 | |
| | | | | | | | |
| | | | | | | 331,679,466 | |
| | | | | | | | |
Food Products - 5.8% | | | | | | | | |
Danone S.A. (France)1 | | | 2,129,470 | | | | 133,894,977 | |
Nestle S.A. (Switzerland)1 | | | 2,293,350 | | | | 134,352,863 | |
Unilever plc - ADR (United Kingdom) | | | 3,496,690 | | | | 107,977,787 | |
| | | | | | | | |
| | | | | | | 376,225,627 | |
| | | | | | | | |
| | |
| The accompanying notes are an integral part of the financial statements. | | 5 |
Investment Portfolio - December 31, 2010
| | | | | | | | |
| | |
| | | Shares | | | Value (Note 2) | |
| | |
COMMON STOCKS (continued) | | | | | | | | |
| | |
Consumer Staples (continued) | | | | | | | | |
Personal Products - 0.8% | | | | | | | | |
Beiersdorf AG (Germany)1 | | | 907,340 | | | $ | 50,348,501 | |
| | | | | | | | |
Total Consumer Staples | | | | | | | 942,489,047 | |
| | | | | | | | |
Energy - 12.7% | | | | | | | | |
Energy Equipment & Services - 8.7% | | | | | | | | |
Calfrac Well Services Ltd. (Canada) | | | 1,296,670 | | | | 44,652,500 | |
Compagnie Generale de Geophysique - Veritas (CGG - Veritas) (France)*1 | | | 4,993,170 | | | | 152,427,629 | |
Petroleum Geo-Services ASA (Norway)*1 | | | 2,306,650 | | | | 36,258,864 | |
Schlumberger Ltd. (United States) | | | 2,168,190 | | | | 181,043,865 | |
Trican Well Service Ltd. (Canada)2 | | | 7,415,430 | | | | 150,202,917 | |
| | | | | | | | |
| | | | | | | 564,585,775 | |
| | | | | | | | |
Oil, Gas & Consumable Fuels - 4.0% | | | | | | | | |
Cameco Corp. (Canada) | | | 2,735,540 | | | | 110,461,105 | |
Talisman Energy, Inc. (Canada) | | | 6,488,650 | | | | 144,351,743 | |
| | | | | | | | |
| | | | | | | 254,812,848 | |
| | | | | | | | |
Total Energy | | | | | | | 819,398,623 | |
| | | | | | | | |
Financials - 7.8% | | | | | | | | |
Commercial Banks - 3.1% | | | | | | | | |
Banco Santander S.A. (Spain)1 | | | 9,236,150 | | | | 98,418,804 | |
HSBC Holdings plc (United Kingdom)1 | | | 9,710,520 | | | | 99,242,573 | |
| | | | | | | | |
| | | | | | | 197,661,377 | |
| | | | | | | | |
Diversified Financial Services - 1.9% | | | | | | | | |
Deutsche Boerse AG (Germany)1 | | | 1,817,360 | | | | 125,563,363 | |
| | | | | | | | |
| | |
Insurance - 2.8% | | | | | | | | |
Allianz SE (Germany)1 | | | 981,230 | | | | 116,585,528 | |
Willis Group Holdings plc (United Kingdom) | | | 1,915,780 | | | | 66,343,461 | |
| | | | | | | | |
| | | | | | | 182,928,989 | |
| | | | | | | | |
Total Financials | | | | | | | 506,153,729 | |
| | | | | | | | |
Health Care - 12.1% | | | | | | | | |
Health Care Equipment & Supplies - 4.5% | | | | | | | | |
Cochlear Ltd. (Australia)1 | | | 1,173,920 | | | | 96,636,392 | |
Covidien plc (Ireland) | | | 2,238,820 | | | | 102,224,521 | |
Mindray Medical International Ltd. - ADR (China) | | | 891,100 | | | | 23,525,040 | |
Straumann Holding AG (Switzerland)1 | | | 295,300 | | | | 67,625,249 | |
| | | | | | | | |
| | | | | | | 290,011,202 | |
| | | | | | | | |
Health Care Providers & Services - 3.8% | | | | | | | | |
BML, Inc. (Japan)1 | | | 554,500 | | | | 15,520,454 | |
Bumrungrad Hospital Public Co. Ltd. - NVDR (Thailand)1 | | | 35,555,100 | | | | 37,395,125 | |
| | |
| 6 | | The accompanying notes are an integral part of the financial statements. |
Investment Portfolio - December 31, 2010
| | | | | | | | |
| | |
| | | Shares | | | Value (Note 2) | |
| | |
COMMON STOCKS (continued) | | | | | | | | |
| | |
Health Care (continued) | | | | | | | | |
Health Care Providers & Services (continued) | | | | | | | | |
Sonic Healthcare Ltd. (Australia)1 | | | 16,077,890 | | | $ | 191,125,859 | |
| | | | | | | | |
| | | | | | | 244,041,438 | |
| | | | | | | | |
| | |
Life Sciences Tools & Services - 3.0% | | | | | | | | |
Lonza Group AG (Switzerland)1 | | | 2,455,292 | | | | 196,804,090 | |
| | | | | | | | |
Pharmaceuticals - 0.8% | | | | | | | | |
Santen Pharmaceutical Co. Ltd. (Japan)1 | | | 1,432,500 | | | | 49,665,101 | |
| | | | | | | | |
Total Health Care | | | | | | | 780,521,831 | |
| | | | | | | | |
Industrials - 15.0% | | | | | | | | |
Aerospace & Defense - 1.0% | | | | | | | | |
Empresa Brasileira de Aeronautica S.A. (Embraer) - ADR (Brazil) | | | 2,227,150 | | | | 65,478,210 | |
| | | | | | | | |
Air Freight & Logistics - 3.1% | | | | | | | | |
TNT N.V. (Netherlands)1 | | | 7,487,480 | | | | 198,012,453 | |
| | | | | | | | |
Airlines - 2.4% | | | | | | | | |
Ryanair Holdings plc - ADR (Ireland) | | | 5,058,530 | | | | 155,600,383 | |
| | | | | | | | |
Electrical Equipment - 2.7% | | | | | | | | |
ABB Ltd. (Asea Brown Boveri) - ADR (Switzerland)* | | | 5,189,430 | | | | 116,502,704 | |
Nexans S.A. (France)1 | | | 412,730 | | | | 32,510,170 | |
Prysmian S.p.A. (Italy)1 | | | 1,621,590 | | | | 27,636,186 | |
| | | | | | | | |
| | | | | | | 176,649,060 | |
| | | | | | | | |
| | |
Industrial Conglomerates - 1.1% | | | | | | | | |
Siemens AG (Germany)1 | | | 550,520 | | | | 68,195,467 | |
| | | | | | | | |
Professional Services - 3.3% | | | | | | | | |
Adecco S.A. (Switzerland)1 | | | 1,607,430 | | | | 105,414,240 | |
Randstad Holding N.V. (Netherlands)*1 | | | 1,997,449 | | | | 105,563,315 | |
| | | | | | | | |
| | | | | | | 210,977,555 | |
| | | | | | | | |
Road & Rail - 1.4% | | | | | | | | |
All America Latina Logistica S.A. (Brazil) | | | 7,149,150 | | | | 64,600,753 | |
Canadian National Railway Co. (Canada) | | | 439,050 | | | | 29,183,653 | |
| | | | | | | | |
| | | | | | | 93,784,406 | |
| | | | | | | | |
Total Industrials | | | | | | | 968,697,534 | |
| | | | | | | | |
Information Technology - 15.7% | | | | | | | | |
Communications Equipment - 1.3% | | | | | | | | |
Alcatel-Lucent - ADR (France)* | | | 29,070,460 | | | | 86,048,562 | |
| | | | | | | | |
Internet Software & Services - 0.6% | | | | | | | | |
VistaPrint N.V. (Netherlands)* | | | 809,360 | | | | 37,230,560 | |
| | | | | | | | |
IT Services - 6.9% | | | | | | | | |
Accenture plc - Class A (Ireland) | | | 1,338,860 | | | | 64,921,321 | |
| | |
| The accompanying notes are an integral part of the financial statements. | | 7 |
Investment Portfolio - December 31, 2010
| | | | | | | | |
| | |
| | | Shares | | | Value (Note 2) | |
| | |
COMMON STOCKS (continued) | | | | | | | | |
| | |
Information Technology (continued) | | | | | | | | |
IT Services (continued) | | | | | | | | |
Amadeus IT Holding S.A. - Class A (Spain)*1 | | | 1,577,960 | | | $ | 33,161,321 | |
Amdocs Ltd. (Guernsey)* | | | 9,530,590 | | | | 261,805,307 | |
Cielo S.A. (Brazil) | | | 5,119,970 | | | | 41,484,094 | |
Redecard S.A. (Brazil) | | | 3,414,050 | | | | 43,292,622 | |
| | | | | | | | |
| | | | | | | 444,664,665 | |
| | | | | | | | |
Semiconductors & Semiconductor Equipment - 4.6% | | | | | | | | |
Advantest Corp. (Japan)1 | | | 6,568,600 | | | | 147,683,185 | |
Sumco Corp. (Japan)*1 | | | 5,038,920 | | | | 71,751,374 | |
Tokyo Electron Ltd. (Japan)1 | | | 1,041,080 | | | | 65,547,648 | |
Yingli Green Energy Holding Co. Ltd.- ADR (China)* | | | 1,439,780 | | | | 14,225,026 | |
| | | | | | | | |
| | | | | | | 299,207,233 | |
| | | | | | | | |
Software - 2.3% | | | | | | | | |
Misys plc (United Kingdom)*1 | | | 12,411,604 | | | | 66,258,594 | |
SAP AG - ADR (Germany) | | | 898,850 | | | | 45,490,799 | |
Square Enix Holdings Co. Ltd. (Japan)1 | | | 2,181,600 | | | | 38,587,780 | |
| | | | | | | | |
| | | | | | | 150,337,173 | |
| | | | | | | | |
Total Information Technology | | | | | | | 1,017,488,193 | |
| | | | | | | | |
Materials - 4.1% | | | | | | | | |
Chemicals - 1.6% | | | | | | | | |
Johnson Matthey plc (United Kingdom)1 | | | 1,554,500 | | | | 49,526,122 | |
Shin-Etsu Chemical Co. Ltd. (Japan)1 | | | 952,500 | | | | 51,336,477 | |
| | | | | | | | |
| | | | | | | 100,862,599 | |
| | | | | | | | |
Construction Materials - 2.3% | | | | | | | | |
CRH plc (Ireland)1 | | | 6,993,600 | | | | 145,914,497 | |
| | | | | | | | |
Paper & Forest Products - 0.2% | | | | | | | | |
Norbord, Inc. (Canada)* | | | 1,120,342 | | | | 16,495,833 | |
| | | | | | | | |
Total Materials | | | | | | | 263,272,929 | |
| | | | | | | | |
Telecommunication Services - 1.5% | | | | | | | | |
Wireless Telecommunication Services - 1.5% | | | | | | | | |
SK Telecom Co. Ltd. - ADR (South Korea) | | | 5,160,950 | | | | 96,148,499 | |
| | | | | | | | |
TOTAL COMMON STOCKS | | | | | | | | |
(Identified Cost $5,519,494,262) | | | | | | | 6,135,038,763 | |
| | | | | | | | |
| | |
| 8 | | The accompanying notes are an integral part of the financial statements. |
Investment Portfolio - December 31, 2010
| | | | | | | | | | | | |
| | | |
| | | Shares | | | Value (Note 2) | | | | |
| | | |
PREFERRED STOCKS - 1.0% | | | | | | | | | | | | |
| | | |
Consumer Staples - 1.0% | | | | | | | | | | | | |
Household Products - 1.0% | | | | | | | | | | | | |
Henkel AG & Co. KGaA (Germany)1 (Identified Cost $36,696,378) | | | 1,048,140 | | | $ | 64,986,480 | | | | | |
| | | | | | | | | | | | |
| | | |
SHORT-TERM INVESTMENTS - 5.3% | | | | | | | | | | | | |
| | | |
Dreyfus Cash Management, Inc. - Institutional Shares3, 0.14% (Identified Cost $339,413,268) | | | 339,413,268 | | | | 339,413,268 | | | | | |
| | | | | | | | | | | | |
TOTAL INVESTMENTS - 101.3% | | | | | | | | | | | | |
(Identified Cost $5,895,603,908) | | | | | | | 6,539,438,511 | | | | | |
LIABILITIES, LESS OTHER ASSETS - (1.3%) | | | | | | | (84,012,377 | ) | | | | |
| | | | | | | | | | | | |
NET ASSETS - 100% | | | | | | $ | 6,455,426,134 | | | | | |
| | | | | | | | | | | | |
ADR - American Depository Receipt
NVDR - Non-Voting Depository Receipt
*Non-income producing security
1International Fair Value factor from pricing service was applied.
2Affiliated company as defined by the Investment Company Act of 1940 (see Note 2 to the financial statements).
3Rate shown is the current yield as of December 31, 2010.
The Series’ portfolio holds, as a percentage of net assets, greater than 10% in the following countries:
France - 11.4%; United Kingdom - 11.1%.
| | |
| The accompanying notes are an integral part of the financial statements. | | 9 |
Statement of Assets and Liabilities
December 31, 2010
| | | | |
ASSETS: | | | | |
| |
Investments, at value (identified cost $5,895,603,908) (Note 2) | | $ | 6,539,438,511 | |
Receivable for fund shares sold | | | 15,981,280 | |
Receivable for securities sold | | | 5,054,544 | |
Foreign tax reclaims receivable | | | 4,888,301 | |
Dividends receivable | | | 4,551,961 | |
| | | | |
| |
TOTAL ASSETS | | | 6,569,914,597 | |
| | | | |
| |
LIABILITIES: | | | | |
| |
Accrued management fees (Note 3) | | | 5,352,489 | |
Accrued transfer agent fees (Note 3) | | | 407,945 | |
Accrued fund accounting and administration fees (Note 3) | | | 136,223 | |
Accrued directors’ fees (Note 3) | | | 2,261 | |
Accrued Chief Compliance Officer service fees (Note 3) | | | 245 | |
Payable for securities purchased | | | 104,105,563 | |
Payable for fund shares repurchased | | | 3,856,821 | |
Other payables and accrued expenses | | | 626,916 | |
| | | | |
| |
TOTAL LIABILITIES | | | 114,488,463 | |
| | | | |
| |
TOTAL NET ASSETS | | $ | 6,455,426,134 | |
| | | | |
| |
NET ASSETS CONSIST OF: | | | | |
| |
Capital stock | | $ | 7,500,565 | |
Additional paid-in-capital | | | 5,796,809,349 | |
Distributions in excess of net investment income | | | (493,000 | ) |
Accumulated net realized gain on investments, foreign currency and translation of other assets
and liabilities | | | 7,289,612 | |
Net unrealized appreciation on investments, foreign currency and translation of other assets
and liabilities | | | 644,319,608 | |
| | | | |
| |
TOTAL NET ASSETS | | $ | 6,455,426,134 | |
| | | | |
| |
NET ASSET VALUE, OFFERING PRICE AND REDEMPTION PRICE PER SHARE -
Class A ($6,455,426,134/750,056,522 shares) | | $ | 8.61 | |
| | | | |
| | |
| 10 | | The accompanying notes are an integral part of the financial statements. |
Statement of Operations
For the Year Ended December 31, 2010
| | | | |
INVESTMENT INCOME: | | | | |
| |
Dividends (net of foreign taxes withheld, $12,577,925) | | | $112,609,854 | |
| | | | |
| |
EXPENSES: | | | | |
| |
Management fees (Note 3) | | | 55,383,375 | |
Transfer agent fees (Note 3) | | | 2,927,156 | |
Fund accounting and administration fees (Note 3) | | | 743,077 | |
Directors’ fees (Note 3) | | | 103,078 | |
Chief Compliance Officer service fees (Note 3) | | | 2,631 | |
Custodian fees | | | 1,091,198 | |
Miscellaneous | | | 1,373,722 | |
| | | | |
| |
Total Expenses | | | 61,624,237 | |
Less reduction of expenses (Note 3) | | | (758 | ) |
| | | | |
| |
Net Expenses | | | 61,623,479 | |
| | | | |
| |
NET INVESTMENT INCOME | | | 50,986,375 | |
| | | | |
| |
REALIZED AND UNREALIZED GAIN (LOSS) ON INVESTMENTS AND FOREIGN CURRENCY: | | | | |
| |
Net realized gain (loss) on-
Investments | | | 145,345,736 | |
Foreign currency and translation of other assets and liabilities | | | (2,707,000 | ) |
| | | | |
| |
| | | 142,638,736 | |
| | | | |
| |
Net change in unrealized appreciation on-
Investments | | | 299,446,571 | |
Foreign currency and translation of other assets and liabilities | | | 387,847 | |
| | | | |
| | | 299,834,418 | |
| | | | |
| |
NET REALIZED AND UNREALIZED GAIN ON INVESTMENTS AND FOREIGN CURRENCY | | | 442,473,154 | |
| | | | |
| |
NET INCREASE IN NET ASSETS RESULTING FROM OPERATIONS | | | $493,459,529 | |
| | | | |
| | |
| The accompanying notes are an integral part of the financial statements. | | 11 |
Statements of Changes in Net Assets
| | | | | | | | |
| | | For the Year Ended 12/31/10 | | | For the Year Ended 12/31/09 | |
INCREASE (DECREASE) IN NET ASSETS: | | | | | | | | |
| | |
OPERATIONS: | | | | | | | | |
| | |
Net investment income | | | $ 50,986,375 | | | | $ 16,004,364 | |
Net realized gain on investments and foreign currency | | | 142,638,736 | | | | 32,401,977 | |
Net change in unrealized appreciation on investments and foreign currency | | | 299,834,418 | | | | 859,900,733 | |
| | | | | | | | |
| | |
Net increase from operations | | | 493,459,529 | | | | 908,307,074 | |
| | | | | | | | |
| | |
DISTRIBUTIONS TO SHAREHOLDERS (Note 8): | | | | | | | | |
| | |
From net investment income | | | (51,336,546 | ) | | | (30,333,272 | ) |
From net realized gain on investments | | | (128,844,230 | ) | | | — | |
| | | | | | | | |
| | |
Total distributions to shareholders | | | (180,180,776 | ) | | | (30,333,272 | ) |
| | | | | | | | |
| | |
CAPITAL STOCK ISSUED AND REPURCHASED: | | | | | | | | |
| | |
Net increase from capital share transactions (Note 5) | | | 1,224,687,957 | | | | 2,699,428,129 | |
| | | | | | | | |
| | |
Net increase in net assets | | | 1,537,966,710 | | | | 3,577,401,931 | |
| | |
NET ASSETS: | | | | | | | | |
| | |
Beginning of year | | | 4,917,459,424 | | | | 1,340,057,493 | |
| | | | | | | | |
| | |
End of year (including distributions in excess of net investment income of $493,000 and undistributed net investment income of $2,564,172, respectively) | | | $6,455,426,134 | | | | $4,917,459,424 | |
| | | | | | | | |
| | |
| 12 | | The accompanying notes are an integral part of the financial statements. |
Financial Highlights
| | | | | | | | | | | | | | | | | | | | | | | | |
| | | For the Years Ended | | | | |
| | | 12/31/10 | | | 12/31/09 | | | 12/31/08 | | | 12/31/07 | | | 12/31/06 | | | | |
| Per share data (for a share outstanding throughout each year): | | | | | | | | | | | | | | | | | | | | | | | | |
Net asset value - Beginning of year | | | $8.12 | | | | $5.88 | | | | $10.07 | | | | $9.58 | | | | $8.46 | | | | | |
| | | | | | | | | | | | | | | | | | | | | | | | |
| | | | | | |
Income (loss) from investment operations: | | | | | | | | | | | | | | | | | | | | | | | | |
Net investment income | | | 0.071 | | | | 0.041 | | | | 0.10 | | | | 0.05 | | | | 0.12 | | | | | |
Net realized and unrealized gain (loss) on investments | | | 0.67 | | | | 2.26 | | | | (4.08) | | | | 1.36 | | | | 2.71 | | | | | |
| | | | | | | | | | | | | | | | | | | | | | | | |
Total from investment operations | | | 0.74 | | | | 2.30 | | | | (3.98) | | | | 1.41 | | | | 2.83 | | | | | |
| | | | | | | | | | | | | | | | | | | | | | | | |
Less distributions to shareholders: | | | | | | | | | | | | | | | | | | | | | | | | |
From net investment income | | | (0.07) | | | | (0.06) | | | | (0.03) | | | | (0.05) | | | | (0.14) | | | | | |
From net realized gain on investments | | | (0.18) | | | | — | | | | (0.18) | | | | (0.87) | | | | (1.57) | | | | | |
| | | | | | | | | | | | | | | | | | | | | | | | |
Total distributions to shareholders | | | (0.25) | | | | (0.06) | | | | (0.21) | | | | (0.92) | | | | (1.71) | | | | | |
| | | | | | | | | | | | | | | | | | | | | | | | |
Net asset value - End of year | | | $8.61 | | | | $8.12 | | | | $5.88 | | | | $10.07 | | | | $9.58 | | | | | |
| | | | | | | | | | | | | | | | | | | | | | | | |
Net assets - End of year (000’s omitted) | | | $6,455,426 | | | | $4,917,459 | | | | $1,340,057 | | | | $841,864 | | | | $317,121 | | | | | |
| | | | | | | | | | | | | | | | | | | | | | | | |
Total return2 | | | 9.23% | | | | 39.12% | | | | (40.07%) | | | | 15.13% | | | | 33.88% | | | | | |
Ratios (to average net assets)/Supplemental Data: | | | | | | | | | | | | | | | | | | | | | | | | |
Expenses* | | | 1.11% | | | | 1.17% | | | | 1.16% | | | | 1.14% | | | | 1.16% | | | | | |
Net investment income | | | 0.92% | | | | 0.60% | | | | 2.17% | | | | 0.75% | | | | 1.35% | | | | | |
Portfolio turnover | | | 39% | | | | 42% | | | | 34% | | | | 49% | | | | 64% | | | | | |
|
*The investment advisor did not impose all of its management fees, CCO fees and fund accounting and transfer agent fees, and other fees in some years and in some years paid a portion of the series’ expenses. If these expenses had been incurred by the Series, the expense ratio (to average net assets) would have been increased by the following amounts: | |
| | | 0.00%3 | | | | 0.00%3 | | | | N/A | | | | N/A | | | | N/A | | | | | |
1Calculated based on average shares outstanding during the year.
2Represents aggregate total return for the periods indicated, and assumes reinvestment of all distributions. Total return would have been lower had certain expenses not been waived or reimbursed during the periods. Periods less than one year are not annualized.
3Less than 0.01%.
| | |
| The accompanying notes are an integral part of the financial statements. | | 13 |
Notes to Financial Statements
World Opportunities Series (the “Series”) is a no-load diversified series of Manning & Napier Fund, Inc. (the “Fund”). The Fund is organized in Maryland and is registered under the Investment Company Act of 1940, as amended, as an open-end management investment company.
The Series’ investment objective is to provide long-term growth by investing principally in the common stocks of companies from outside the United States.
The Series is authorized to issue five classes of shares (Class A, B, D, E and Z). Currently, only Class A shares have been issued. Each class of shares is substantially the same, except that class-specific distribution and shareholder servicing expenses are borne by the specific class of shares to which they relate.
The Fund’s Advisor is Manning & Napier Advisors, Inc. (the “Advisor”). Shares of the Series are offered to investors, clients and employees of the Advisor and its affiliates. The total authorized capital stock of the Fund consists of 10.0 billion shares of common stock each having a par value of $0.01. As of December 31, 2010, 6.2 billion shares have been designated in total among 29 series, of which 2.5 billion have been designated as World Opportunities Series Class A common stock.
| 2. | SIGNIFICANT ACCOUNTING POLICIES |
Security Valuation
Portfolio securities, including domestic equities, foreign equities, warrants and options, listed on an exchange other than the NASDAQ National Market System are valued at the latest quoted sales price of the exchange on which the security is primarily traded. Securities not traded on valuation date or securities not listed on an exchange are valued at the latest quoted bid price provided by the Fund’s pricing service. Securities listed on the NASDAQ National Market System are valued in accordance with the NASDAQ Official Closing Price.
Short-term investments that mature in sixty days or less are valued at amortized cost, which approximates market value. Investments in open-end investment companies are valued at their net asset value per share on valuation date.
Volume and level of activity in established markets for an asset or liability are evaluated to determine whether recent transactions and quoted prices are determinative of fair value. Where there have been significant decreases in volume and level of activity, further analysis and adjustment may be necessary to estimate fair value. The Series measures fair value in these instances by the use of inputs and valuation techniques which may be based upon current market prices of securities that are comparable in coupon, rating, maturity and industry and/or expectation of future cash flows. As a result of trading in relatively thin markets and/or markets that experience significant volatility, the prices used by the Series to value these securities may differ from the value that would be realized if these securities were sold, and the differences could be material.
Securities for which representative valuations or prices are not available from the Fund’s pricing service may be valued at fair value. Due to the inherent uncertainty of valuations of such securities, the fair value may differ significantly from the values that would have been used had a ready market for such securities existed. If trading or events occurring after the close of the principal market in which securities are traded are expected to materially affect the value of those securities, then they may be valued at their fair value, taking this trading or these events into account. Fair value is determined in good faith by the Advisor under procedures approved by and under the general supervision and responsibility of the Fund’s Board of Directors (the “Board”). In accordance with the procedures approved by the Board, the Series applies fair value pricing on a daily basis except for North American, Central American, South American and Caribbean equity securities. Fair valuing of securities is determined with the assistance of a pricing service using calculations or factors based on indices of domestic securities and other appropriate indicators, such as prices of relevant American Depository Receipts and futures contracts, to adjust local market prices for subsequent
Notes to Financial Statements
| 2. | SIGNIFICANT ACCOUNTING POLICIES (continued) |
Security Valuation (continued)
movements through the time the Series calculates its net asset value. The value of securities used for the net asset value calculation under the procedures may differ from published prices for the same securities. It is the Fund’s policy to classify each foreign equity security, except for those in the regions noted above, as Level 2 securities due to the fact the pricing service evaluated what factor was applied to the calculated end of day market price.
Various inputs are used in determining the value of the Series’ assets or liabilities carried at market value. These inputs are summarized in three broad levels. Level 1 includes quoted prices in active markets for identical assets and liabilities. Level 2 includes other significant observable inputs (including quoted prices for similar securities, interest rates, prepayment speeds, credit risk, etc.). Level 3 includes significant unobservable inputs (including the Series’ own assumptions in determining the fair value of investments.) The inputs or methodology used for valuing securities are not necessarily an indication of the risk associated with investing in those securities.
The following is a summary of the valuation levels used for major security types as of December 31, 2010 in valuing the Series’ assets or liabilities carried at market value:
| | | | | | | | | | | | | | | | |
| Description | | Total | | | Level 1 | | | Level 2 | | | Level 3 | |
Assets: | | | | | | | | | | | | | | | | |
Equity securities* | | | $ 6,135,038,763 | | | | $ 2,244,465,272 | | | | $ 3,890,573,491 | | | | $ — | |
Preferred securities | | | 64,986,480 | | | | | | | | 64,986,480 | | | | — | |
Debt securities | | | — | | | | — | | | | — | | | | — | |
Mutual funds | | | 339,413,268 | | | | 339,413,268 | | | | — | | | | — | |
Other financial instruments**: | | | — | | | | — | | | | — | | | | — | |
| | | | | | | | | | | | | | | | |
Total assets: | | | 6,539,438,511 | | | | 2,583,878,540 | | | | 3,955,559,971 | | | | — | |
| | | | | | | | | | | | | | | | |
Liabilities: | | | | | | | | | | | | | | | | |
Other financial instruments**: | | | — | | | | — | | | | — | | | | — | |
Total liabilities: | | | — | | | | — | | | | — | | | | — | |
| | | | | | | | | | | | | | | | |
Total | | | $ 6,539,438,511 | | | | $ 2,583,878,540 | | | | $ 3,955,559,971 | | | | $ — | |
| | | | | | | | | | | | | | | | |
*Includes common stock, warrants and rights. Please see the Investment Portfolio for industry classification and for securities where an International Fair Value factor from the pricing service was applied to value the security. Such securities are included in Level 2 in the table above.
**Other financial instruments are derivative instruments not reflected in the Investment Portfolio, such as futures, forwards and swap contracts, which are valued at the unrealized appreciation/depreciation on the instrument. As of December 31, 2010, the Series did not hold any derivative instruments.
There were no Level 3 securities held by the Series as of December 31, 2009 or December 31, 2010.
The Fund’s policy is to recognize transfers in and transfers out of the valuation levels as of the beginning of the reporting period. During the year ended December 31, 2010, the Fund had a significant amount of foreign equity securities transfer from Level 1 to Level 2 due to the implementation of new international fair value pricing procedures. The following is a summary of the foreign equity securities that transferred from Level 1 to Level 2:
Notes to Financial Statements
| 2. | SIGNIFICANT ACCOUNTING POLICIES (continued) |
Security Valuation (continued)
| | | | | | | | | | | | | | | | |
| | | Total # Securities Level 1 at beginning and Level 2 at end of period | | | Total Market Value Beginning of period | | | Total Market Value End of period | | | Change in Market Value | |
| | | 28 | | | | $ 2,196,289,659 | | | | $ 2,575,490,588 | | | $ | 379,200,929 | |
Additional disclosure surrounding the activity in Level 3 fair value measurement will be effective for fiscal years beginning after December 15, 2010. Management has concluded that this will not have a material impact on the Series’ financial statements.
Security Transactions, Investment Income and Expenses
Security transactions are accounted for on trade date. Dividend income is recorded on the ex-dividend date, except that if the ex-dividend date has passed, certain dividends from foreign securities are recorded as soon as the Fund is informed of the ex-dividend date. Non-cash dividends, if any, are recorded at the fair market value of the securities received. Interest income, including amortization of premium and accretion of discounts using the effective interest method, is earned from settlement date and accrued daily.
Expenses are recorded on an accrual basis. Most expenses of the Fund can be attributed to a specific series. Expenses which cannot be directly attributed are apportioned among the series in the Fund in such a manner as deemed equitable by the Fund’s Board, taking into consideration, among other things, the nature and type of expense.
The Series uses the identified cost method for determining realized gain or loss on investments for both financial statement and federal income tax reporting purposes.
Foreign Currency Translation
The books and records of the Series are maintained in U.S. dollars. Foreign currencies, investments and other assets and liabilities are translated into U.S. dollars at the current exchange rates. Purchases and sales of investment securities and income and expenses are translated on the respective dates of such transactions. The Series does not isolate realized and unrealized gains and losses attributable to changes in the exchange rates from gains and losses that arise from changes in the market value of investments. Such fluctuations are included with net realized and unrealized gain or loss on investments. Net realized foreign currency gains and losses represent foreign currency gains and losses between trade date and settlement date on securities transactions, gains and losses on disposition of foreign currencies and the difference between the amount of income and foreign withholding taxes recorded on the books of the Series and the amounts actually received or paid.
Affiliated Companies
The 1940 Act defines “affiliated companies” to include securities in which a series owns 5% or more of the outstanding voting securities of the issuer. The following transactions were effected in shares of Calfrac Well Services Ltd. (Canada) and Trican Well Service Ltd. (Canada) for the year ended December 31, 2010:
Notes to Financial Statements
| 2. | SIGNIFICANT ACCOUNTING POLICIES (continued) |
Affiliated Companies (continued)
| | | | | | | | | | | | | | | | | | | | | | |
| Name of Issuer | | Value at 12/31/09 | | | Purchase Cost | | Sales Proceeds | | | Value at 12/31/10 | | Shares Held at
12/31/10 | | Dividend Income 12/31/09 through 12/31/10 | | | Net Realized Gain 12/31/09 through 12/31/10 | |
Calfrac Well Service Ltd. (Canada)* | | | $67,286,779 | | | — | | | $27,870,894 | | | $44,652,500 | | 1,296,670 | | | $159,989 | | | | $6,107,092 | |
Trican Well Service Ltd. (Canada) | | | $99,690,152 | | | — | | | $ — | | | $150,202,917 | | 7,415,430 | | | $729,495 | | | | $ — | |
* Security was an affiliated company for the period December 31, 2009 through April 16, 2010.
Federal Taxes
The Series’ policy is to comply with the provisions of the Internal Revenue Code applicable to regulated investment companies. The Series is not subject to federal income tax or excise tax to the extent that the Series distributes to shareholders each year its taxable income, including any net realized gains on investments, in accordance with requirements of the Internal Revenue Code. Accordingly, no provision for federal income tax or excise tax has been made in the financial statements.
Management evaluates its tax positions to determine if the tax positions taken meet the minimum recognition threshold in connection with accounting for uncertainties in income tax positions taken or expected to be taken for the purposes of measuring and recognizing tax liabilities in the financial statements. Recognition of tax benefits of an uncertain tax position is required only when the position is “more likely than not” to be sustained assuming examination by taxing authorities. At December 31, 2010, the Series has recorded no liability for net unrecognized tax benefits relating to uncertain income tax positions taken or expected to be taken in future tax returns.
The Series files income tax returns in the U.S. federal jurisdiction, various states and foreign jurisdictions, as required. No income tax returns are currently under investigation. The statute of limitations on the Series’ tax returns remains open for the years ended December 31, 2007 through December 31, 2010. The Fund is not aware of any tax positions for which it is reasonably possible that the total amounts of unrecognized tax benefits will significantly change in the next twelve months.
Additionally, based on the Fund’s understanding of the tax rules and rates related to income, gains and transactions for foreign jurisdictions in which it invests, the Series will provide for foreign taxes, and where appropriate, deferred foreign tax.
Distributions of Income and Gains
Distributions to shareholders of net investment income and net realized gains are made annually. An additional distribution may be necessary to avoid taxation of the Series. Distributions are recorded on the ex-dividend date.
Indemnifications
The Fund’s organizational documents provide former and current directors and officers with a limited indemnification against liabilities arising in connection with the performance of their duties to the Fund. In the normal course of business, the Fund may also enter into contracts that provide general indemnifications. The Fund’s maximum exposure under these arrangements is unknown as this would be dependent on future claims that may be made against the Fund. The risk of material loss from such claims is considered remote.
Notes to Financial Statements
| 2. | SIGNIFICANT ACCOUNTING POLICIES (continued) |
Other
The preparation of financial statements in conformity with accounting principles generally accepted in the United States of America requires management to make estimates and assumptions that affect the reported amounts of assets and liabilities and the disclosure of contingent assets and liabilities at the date of the financial statements and the reported amounts of income and expenses during the reporting period. Actual results could differ from those estimates.
| 3. | TRANSACTIONS WITH AFFILIATES |
The Fund has an Investment Advisory Agreement (the “Agreement”) with the Advisor, for which the Series pays a fee, computed daily and payable monthly, at an annual rate of 1.00% of the Series’ average daily net assets.
Under the Agreement, personnel of the Advisor provide the Series with advice and assistance in the choice of investments and the execution of securities transactions, and otherwise maintain the Series’ organization. The Advisor also provides the Fund with necessary office space and fund administration and support services. The salaries of all officers of the Fund (except a percentage of the Fund’s Chief Compliance Officer’s salary, which is paid by the Fund), and of all Directors who are “affiliated persons” of the Fund, or of the Advisor, and all personnel of the Fund, or of the Advisor, performing services relating to research, statistical and investment activities, are paid by the Advisor. Each “non-affiliated” Director receives an annual stipend, which is allocated among all the active series of the Fund. In addition, these Directors also receive a fee per Board meeting attended plus a fee for each committee meeting attended.
For the year ended December 31, 2010, the Advisor voluntarily waived fees of $758, which is included as a reduction of expenses on the Statement of Operations. The Advisor is not eligible to recoup any expense that has been waived or reimbursed in prior years.
Manning & Napier Investor Services, Inc., a registered broker-dealer affiliate of the Advisor, acts as distributor for the Fund’s shares. The services of Manning & Napier Investor Services, Inc. are provided at no additional cost to the Series.
The Advisor has agreements with PNC Global Investment Servicing (U.S.) Inc. (“PNCGIS”) under which PNCGIS serves as sub-accountant services agent and sub-transfer agent. The Fund pays the Advisor an annual fee related to fund accounting and administration of 0.0175% on the first $3 billion of average daily net assets (excluding Target Series); 0.015% on the next $3 billion of average daily net assets (excluding Target Series); and 0.01% of the average daily net assets in excess of $6 billion (excluding Target Series); plus a base fee of $25,500 per Series. Transfer Agent fees are charged to the Fund on a per account basis. Additionally, certain transaction- and cusip-based fees and out-of-pocket expenses, including charges for reporting relating to the Fund’s compliance program, are charged.
Effective July 1, 2010, PNCGIS was sold to The Bank of New York Mellon Corporation, the Series’ custodian. At the close of the sale, PNCGIS changed its name to BNY Mellon Investment Servicing (U.S.) Inc. (“BNY”).
Expenses not directly attributable to a Series are allocated based on each Series’ relative net assets or number of accounts, depending on the expense.
| 4. | PURCHASES AND SALES OF SECURITIES |
For the year ended December 31, 2010, purchases and sales of securities, other than U.S. Government securities and short-term securities, were $3,163,930,092 and $2,047,901,465, respectively. There were no purchases or sales of U.S. Government securities.
Notes to Financial Statements
| 5. | CAPITAL STOCK TRANSACTIONS |
Transactions in Class A shares of World Opportunities Series were:
| | | | | | | | | | | | | | | | |
| | | For the Year Ended 12/31/10 | | | For the Year Ended 12/31/09 | |
| | | Shares | | | Amount | | | Shares | | | Amount | |
Sold | | | 380,543,895 | | | $ | 3,072,871,491 | | | | 473,021,745 | | | $ | 3,314,846,649 | |
Reinvested | | | 17,838,209 | | | | 148,727,024 | | | | 2,714,538 | | | | 21,626,348 | |
Repurchased | | | (253,809,235 | ) | | | (1,996,910,558 | ) | | | (98,321,062 | ) | | | (637,044,868 | ) |
| | | | | | | | | | | | | | | | |
Total | | | 144,572,869 | | | $ | 1,224,687,957 | | | | 377,415,221 | | | $ | 2,699,428,129 | |
| | | | | | | | | | | | | | | | |
Approximately 3% of the Series’ shares represent investments by fiduciary accounts over which the Advisor has sole investment discretion.
The Series may trade in instruments including written and purchased options, forward foreign currency exchange contracts and futures contracts and other derivatives in the normal course of investing activities to assist in managing exposure to various market risks. Investments in these instruments may subject the Series to various elements of risk, which may involve, to a varying degree, elements of risk in excess of the amounts recognized for financial statement purposes. These risks include: the risk that changes in the value of a derivative may not correlate perfectly with the underlying asset, rate or index, counterparty credit risk related to over the counter derivatives counterparties’ failure to perform under contract terms, liquidity risk related to the lack of a liquid market for these contracts allowing the fund to close out its position(s) and documentation risk relating to disagreement over contract terms. No such investments were held by the Series for the year ended December 31, 2010.
Investing in securities of foreign companies and foreign governments involves special risks and considerations not typically associated with investing in securities of domestic companies and the U.S. Government. These risks include revaluation of currencies and future adverse political and economic developments. Moreover, securities of foreign companies and foreign governments and their markets may be less liquid and their prices more volatile than those of comparable domestic companies and the U.S. Government.
| 8. | FEDERAL INCOME TAX INFORMATION |
The amount and characterization of certain income and capital gains to be distributed are determined in accordance with federal income tax regulations, which may differ from accounting principles generally accepted in the United States of America. These differences are primarily due to differing book and tax treatments in the timing of the recognition of net investment income or gains and losses, including foreign currency gains and losses, losses deferred due to wash sales, and post-October losses. The Series may periodically make reclassifications among its capital accounts to reflect income and gains available for distribution (or available capital loss carryovers) under income tax regulations without impacting the Series’ net asset value. Any such reclassifications are not reflected in the financial highlights.
Notes to Financial Statements
| 8. | FEDERAL INCOME TAX INFORMATION (continued) |
The tax character of distributions paid were as follows:
| | | | | | | | |
| | | For the Year Ended 12/31/10 | | | For the Year Ended 12/31/09 | |
Ordinary income | | $ | 115,460,480 | | | $ | 30,333,272 | |
Long-term capital gains | | | 64,720,296 | | | | — | |
For the year ended December 31, 2010, the Series elected to defer $492,999 of currency losses, attributable to Post-October losses.
At December 31, 2010, the tax basis of distributable earnings and the net unrealized appreciation based on the identified cost of investments for federal income tax purposes were as follows:
| | | | | | |
Cost for federal income tax purposes | | $ | 5,934,571,718 | | | |
Unrealized appreciation | | $ | 817,876,674 | | | |
Unrealized depreciation | | | (213,009,881 | ) | | |
| | | | | | |
Net unrealized appreciation | | $ | 604,866,793 | | | |
| | | | | | |
Undistributed ordinary income | | | 28,292,435 | | | |
Undistributed long-term gains | | | 17,964,985 | | | |
Report of Independent Registered Public Accounting Firm
To the Board of Directors of Manning & Napier Fund, Inc. and Shareholders of World Opportunities Series:
In our opinion, the accompanying statement of assets and liabilities, including the investment portfolio, and the related statements of operations and of changes in net assets and the financial highlights present fairly, in all material respects, the financial position of the World Opportunities Series (a series of Manning & Napier Fund, Inc., hereafter referred to as the “Series”) at December 31, 2010, and the results of its operations for the year then ended, the changes in its net assets for each of the two years in the period then ended and the financial highlights for each of the five years in the period then ended, in conformity with accounting principles generally accepted in the United States of America. These financial statements and financial highlights (hereafter referred to as “financial statements”) are the responsibility of the Series’ management. Our responsibility is to express an opinion on these financial statements based on our audits. We conducted our audits of these financial statements in accordance with the standards of the Public Company Accounting Oversight Board (United States). Those standards require that we plan and perform the audit to obtain reasonable assurance about whether the financial statements are free of material misstatement. An audit includes examining, on a test basis, evidence supporting the amounts and disclosures in the financial statements, assessing the accounting principles used and significant estimates made by management, and evaluating the overall financial statement presentation. We believe that our audits, which included confirmation of securities at December 31, 2010 by correspondence with the custodian and brokers, provide a reasonable basis for our opinion.
New York, New York
February 22, 2011
Supplemental Tax Information (unaudited)
All designations are based on financial information available as of the date of this annual report and, accordingly are subject to change.
For federal income tax purposes, the Series designates for the current fiscal year $111,683,383 or, if different, the maximum amount allowable under the tax law as qualified dividend income.
Pursuant to Section 852 of the Internal Revenue Code, as amended, the Series hereby designates $64,720,296 as capital gains for its taxable year ended December 31, 2010, or if different, the maximum allowable under tax law.
For corporate shareholders, the percentage of investment income (dividend income plus short-term gains, if any) that qualifies for the dividends received deduction for the current fiscal year is 0.11%.
Renewal of Investment Advisory Agreement (unaudited)
At the Manning & Napier Fund, Inc. (the “Fund”) Board of Directors’ (the “Board”) meeting, held on November 17, 2010, the Investment Advisory Agreement (the “Agreement”) between the Fund and Manning & Napier Advisors, Inc. (the “Advisor”) was reviewed by the Board for renewal. In connection with the decision whether to renew the Agreement, a variety of material was prepared for and reviewed by the Board.
Representatives of the Advisor attended the meeting and presented additional oral and written information to the Board to assist the Board in its considerations. The discussion immediately below outlines the materials and information presented to the Board in connection with the Board’s 2010 Annual Review of the Agreement and the conclusions made by the Directors when determining to continue the Agreement.
| | • | | The Board considered the services provided by the Advisor under the Agreement including, among others: deciding what securities to purchase and sell for each Series; arranging for the purchase and sale of such securities by placing orders with broker-dealers; administering the affairs of the Fund (including the books and records of the Fund not maintained by third party service providers such as the custodian or sub-transfer agent); arranging for the insurance coverage for the Fund; and supervising the preparation of tax returns, SEC filings (including registration statements) and reports to shareholders for the Fund. The Board also considered the nature and quality of such services provided under the Agreement in light of the Advisor’s services provided to the Fund for 24 years. The Board discussed the quality of these services with representatives from the Advisor and concluded that the Advisor was performing its services to the Fund required under the Agreement in a reasonable manner. |
| | • | | The Board considered the investment performance of the various Series of the Fund. The investment performance for each Series was reviewed on a cumulative basis since inception and on a one year basis. In addition, annualized performance for the following time periods was considered: inception, three year, five year, ten year, and current market cycle. A market cycle includes periods of both rising and falling markets. Returns for established benchmark indices for each Series were provided for each time period. The Board noted that the various Series were competitive against their respective benchmarks and/or peer groups over various time periods, but in particular over the full market cycle period relevant for the Series. In addition, the Board considered at the meeting (and considers on a quarterly basis) a peer group performance analysis consisting of Morningstar universes of mutual funds with similar investment objectives. The Board discussed the performance with representatives from the Advisor and concluded that the investment performance of each of the Fund’s Series was reasonable based on the Fund’s actual performance and comparative performance, especially performance over the current market cycle. |
| | • | | The Board considered the costs of the Advisor’s services and the profits of the Advisor as they relate to the Advisor’s services to the Fund under the Agreement. In reviewing the Advisor’s costs and profits, the Board discussed the Advisor’s revenues generated from the Fund (on both an actual and adjusted basis) and its expenses associated with providing the services under the Agreement. In addition, the Board reviewed the Advisor’s expenses associated with Fund activities outside of the Agreement (such as expense reimbursements pursuant to expense caps and payments made by the Advisor to third party platforms on which shares of the Fund are available for purchase). It was noted by representatives of the Advisor that 11 of the 27 active Series of the Fund are currently experiencing expenses above the capped expense ratios. After discussing the above costs and profits, the Board concluded that the Advisor’s profitability relating to its services provided under the Agreement was reasonable. |
| | • | | The Board considered the fees and expenses of the various Series of the Fund. The Advisor presented the advisory fees and total expenses for each Series, including the advisory fee adjusted for any expense waivers or reimbursements (either contractual or voluntary) paid by the Advisor. The advisory fees and expense ratios of each Series were compared to an average (on both a mean and median basis) of similar funds as disclosed on the Morningstar database. Representatives of the Advisor discussed with the Board the levels of its advisory |
Renewal of Investment Advisory Agreement (unaudited)
| | fee for each Series of the Fund and as compared to the median and mean advisory fees for similar funds as listed on Morningstar. Expense ratios for every Series, except the Pro-Blend’s Class R and Class C, and Target Class R and Class C, are currently below the median and mean for similar funds as listed on Morningstar. Based on their review of the information provided, the Board concluded that the fees and expenses of each Series of the Fund were reasonable on a comparative basis. |
| | • | | The Board also considered the other benefits the Advisor derives from its relationship with the Fund. Such other benefits include certain research products provided by soft dollars. Given the level of soft dollar transactions involving the Fund, the Board concluded that these additional benefits to the Advisor were reasonable. |
| | • | | In addition to the factors described above, the Board considered the Advisor’s personnel, investment strategies, policies and procedures relating to compliance with personal securities transactions, and reputation, expertise and resources in domestic and foreign financial markets. The Board concluded that these factors support the conclusion that the Advisor performs its services in a reasonable manner. |
| | • | | The Board did not consider economies of scale at this time because of the multiple uses of the Fund (for the Advisor’s discretionary investment account clients in addition to direct investors), the current profitability of the Advisor’s services to the Fund under the Agreement, and the overall size of the Fund complex. |
Based on the Board’s deliberations and their evaluation of the information described above, the Board, including a majority of Directors that are not “interested persons” as defined in the Investment Company Act of 1940, concluded that the compensation under the Agreement was fair and reasonable in light of the services and expenses and such other matters as the Directors considered to be relevant in the exercise of their reasonable judgment. Accordingly, the Board approved the renewal of the Agreement. In the course of their deliberations, the Directors did not identify any particular information that was all important or controlling.
Directors’ and Officers’ Information (unaudited)
The Statement of Additional Information provides additional information about the Fund’s directors and officers and can be obtained without charge by calling 1-800-466-3863, at www.manningnapieradvisors.com, or on the EDGAR Database on the SEC Internet web site (http:// www.sec.gov). The following chart shows certain information about the Fund’s officers and directors, including their principal occupations during the last five years. Unless specific dates are provided, the individuals have held the listed positions for longer than five years.
| | |
INTERESTED DIRECTOR/OFFICER | | |
| |
Name: | | B. Reuben Auspitz* |
Address: | | 290 Woodcliff Drive |
| | Fairport, NY 14450 |
Age: | | 63 |
Current Position(s) Held with Fund: | | Principal Executive Officer, President, Chairman & Director |
Term of Office1 & Length of Time Served: | | Indefinite - Director since 1984; Vice President 1984 - 2003; President since 2004; Principal Executive Officer since 2002 |
Principal Occupation(s) During Past 5 Years: | | Executive Vice President; Executive Group Member**; Chief Compliance Officer since 2004; Vice Chairman since June 2010; Co-Executive Director from 2003-2010 - Manning & Napier Advisors, Inc. President; Director - Manning & Napier Investor Services, Inc. Holds or has held one or more of the following titles for various subsidiaries and affiliates: President, Vice President, Director, Chairman, Treasurer, Chief Compliance Officer or Member. |
Number of Portfolios Overseen within Fund Complex: | | 29 |
Other Directorships Held Outside Fund Complex: | | N/A |
| |
INDEPENDENT DIRECTORS | | |
| |
Name: | | Paul A. Brooke |
Address: | | 290 Woodcliff Drive |
| | Fairport, NY 14450 |
Age: | | 65 |
Current Position(s) Held with Fund: | | Director, Audit Committee Member, Governance & Nominating |
| | Committee Member |
Term of Office & Length of Time Served: | | Indefinite - Since 2007 |
Principal Occupation(s) During Past 5 Years: | | Chairman & CEO, Alsius Corp. (investments); Managing Member, PMSV Holdings LLC (investments) |
Number of Portfolios Overseen within Fund Complex: | | 29 |
Other Directorships Held Outside Fund Complex: | | Incyte Corp. (2000-present) |
| | ViroPharma, Inc. (2000-present) |
| | HLTH Corp. (2000-present) |
| | Cheyne Capital International (2000-present) |
| | MPM Bio-equities (2000-present) |
| | GMP Companies (2000-present) |
| | | HoustonPharma (2000-present) |
| |
Name: | | Richard M. Hurwitz |
Address: | | 290 Woodcliff Drive |
| | Fairport, NY 14450 |
Age: | | 47 |
Current Position(s) Held with Fund: | | Director, Audit Committee Member, Governance & Nominating |
| | Committee Member |
Term of Office & Length of Time Served: | | Indefinite - Since 2009 |
Principal Occupation(s) During Past 5 Years: | | Chief Executive Officer, Pictometry International Corp. since August 2010 (provider of georeferenced, aerial image libraries and related software) Managing Partner (2006-July 2010) - Aegis Investment Partners, LLC (investments); Founder and Managing Partner (2004-2005) - Village Markets, LLC (groceries) |
Number of Portfolios Overseen within Fund Complex: | | 29 |
Other Directorships Held Outside Fund Complex: | | Pictometry International Corp. (2000-2010) |
| | Pioneering Technologies (2006-2009) |
| | | Vensearch Capital Corp. (2003-2007) |
25
Directors’ and Officers’ Information (unaudited)
| | |
| INDEPENDENT DIRECTORS (continued) | | |
Name: | | Stephen B. Ashley |
Address: | | 290 Woodcliff Drive |
| | Fairport, NY 14450 |
Age: | | 70 |
Current Position(s) Held with Fund: | | Director, Audit Committee Member, Governance & Nominating Committee Member |
Term of Office & Length of Time Served: | | Indefinite - Since 1996 |
Principal Occupation(s) During Past 5 Years: | | Chairman, Director, President & Chief Executive Officer, The Ashley Group (property management and investment). Chairman (non-executive) 2004-2008; Director 1995-2008 - Fannie Mae (mortgage) |
Number of Portfolios Overseen within Fund Complex: | | 29 |
Other Directorships Held Outside Fund Complex: | | The Ashley Group (1995-2008) |
| | | Genesee Corporation (1987-2007) |
| |
Name: | | Peter L. Faber |
Address: | | 290 Woodcliff Drive |
| | Fairport, NY 14450 |
Age: | | 72 |
Current Position(s) Held with Fund: | | Director, Governance & Nominating Committee Member |
Term of Office & Length of Time Served: | | Indefinite - Since 1987 |
Principal Occupation(s) During Past 5 Years: | | Senior Counsel since 2006, Partner (1995 - 2006) - McDermott, Will & Emery LLP (law firm) |
Number of Portfolios Overseen within Fund Complex: | | 29 |
Other Directorships Held Outside Fund Complex: | | Partnership for New York City, Inc. (non-profit) |
| | New York Collegium (non-profit) |
| | | Boston Early Music Festival (non-profit) |
| |
Name: | | Harris H. Rusitzky |
Address: | | 290 Woodcliff Drive |
| | Fairport, NY 14450 |
Age: | | 76 |
Current Position(s) Held with Fund: | | Director, Audit Committee Member, Governance & Nominating Committee Member |
Term of Office & Length of Time Served: | | Indefinite - Since 1985 |
Principal Occupation(s) During Past 5 Years: | | President, The Greening Group (business consultants) since 1994; Partner, The Restaurant Group (restaurants) since 2006 |
Number of Portfolios Overseen within Fund Complex: | | 29 |
Other Directorships Held Outside Fund Complex: | | N/A |
| |
OFFICERS | | |
Name: | | Jeffrey S. Coons, Ph.D., CFA |
Address: | | 290 Woodcliff Drive |
| | Fairport, NY 14450 |
Age: | | 47 |
Current Position(s) Held with Fund: | | Vice President |
Term of Office1 & Length of Time Served: | | Since 2004 |
Principal Occupation(s) During Past 5 Years: | | President since 2010, Co-Director of Research since 2002, Executive Group Member** since 2003, - Manning & Napier Advisors, Inc. Holds one or more of the following titles for various subsidiaries and affiliates: President, Director, Treasurer or Senior Trust Officer. |
Number of Portfolios Overseen within Fund Complex: | | 29 |
Other Directorships Held Outside Fund Complex: | | N/A |
26
Directors’ and Officers’ Information (unaudited)
| | |
| OFFICERS (continued) | | |
Name: | | Beth Galusha |
Address: | | 290 Woodcliff Drive |
| | Fairport, NY 14450 |
Age: | | 49 |
Current Position(s) Held with Fund: | | Assistant Chief Financial Officer |
Term of Office1 & Length of Time Served: | | Assistant Chief Financial Officer since 2010 |
Principal Occupation(s) During Past 5 Years: | | Chief Financial Officer and Treasurer, Manning & Napier Advisors, Inc. Holds one or more of the following titles for various affiliates: Chief Financial Officer, Director, or Treasurer |
Number of Portfolios Overseen within Fund Complex: | | 29 |
Other Directorships Held Outside Fund Complex: | | N/A |
| |
Name: | | Christine Glavin |
Address: | | 290 Woodcliff Drive |
| | Fairport, NY 14450 |
Age: | | 44 |
Current Position(s) Held with Fund: | | Principal Financial Officer, Chief Financial Officer |
Term of Office1 & Length of Time Served: | | Principal Financial Officer since 2002; Chief Financial Officer since 2001 |
Principal Occupation(s) During Past 5 Years: | | Fund Reporting Manager, Manning & Napier Advisors, Inc. since 1997 |
Number of Portfolios Overseen within Fund Complex: | | 29 |
Other Directorships Held Outside Fund Complex: | | N/A |
| |
Name: | | Jodi L. Hedberg |
Address: | | 290 Woodcliff Drive |
| | Fairport, NY 14450 |
Age: | | 43 |
Current Position(s) Held with Fund: | | Corporate Secretary, Chief Compliance Officer, Anti-Money Laundering Compliance Officer |
Term of Office1 & Length of Time Served: | | Corporate Secretary since 1997; Chief Compliance Officer since 2004 |
Principal Occupation(s) During Past 5 Years: | | Director of Compliance, Manning & Napier Advisors, Inc. and affiliates since 1990 (title change in 2005 from Compliance Manager to Director of Compliance); Corporate Secretary, Manning & Napier Investor Services, Inc. since 2006 |
Number of Portfolios Overseen within Fund Complex: | | 29 |
Other Directorships Held Outside Fund Complex: | | N/A |
| |
Name: | | Richard Yates |
Address: | | 290 Woodcliff Drive |
| | Fairport, NY 14450 |
Age: | | 45 |
Current Position(s) Held with Fund: | | Chief Legal Officer |
Term of Office1 & Length of Time Served: | | Chief Legal Officer since 2004 |
Principal Occupation(s) During Past 5 Years: | | Counsel - Manning & Napier Advisors, Inc. & affiliates since 2000; Holds one or more of the following titles for various affiliates; Director or Corporate Secretary |
Number of Portfolios Overseen within Fund Complex: | | 29 |
Other Directorships Held Outside Fund Complex: | | N/A |
*Interested Director, within the meaning of the Investment Company Act of 1940 by reason of his position with the Fund’s investment advisor and distributor. Mr. Auspitz serves as the Executive Vice President and Director, Manning & Napier Advisors, Inc. and President and Director, Manning
& Napier Investor Services, Inc., the Fund’s distributor.
**Prior to June 2010, the Executive Group, consisting of senior executive employee-owners, performed the duties of the Office of the Chief Executive of the Advisor. Effective June 2010, the Executive Group serves as an advisory board to the Chief Executive Officer.
1The term of office for President, Vice President, Chief Financial Officer, Assistant Chief Financial Officer, Chief Legal Officer and Corporate Secretary is one year and until their respective successors are chosen and qualified. All other officers’ terms are indefinite.
27
This Page Intentionally Left Blank
28
This Page Intentionally Left Blank
29
Literature Requests (unaudited)
Proxy Voting Policies and Procedures
A description of the policies and procedures that the Fund uses to determine how to vote proxies relating to portfolio securities is available, without charge, upon request:
| | | | |
By phone | | 1-800-466-3863 | | |
On the Securities and Exchange | | | | |
Commission’s (SEC) web site | | http://www.sec.gov | | |
Proxy Voting Record
Information regarding how the Fund voted proxies relating to portfolio securities during the most recent 12-month period ended June 30th is available, without charge, upon request:
| | | | |
By phone | | 1-800-466-3863 | | |
On the SEC’s web site | | http://www.sec.gov | | |
Quarterly Portfolio Holdings
The Series’ complete schedule of portfolio holdings for the 1st and 3rd quarters of each fiscal year are provided on Form N-Q, and are available, without charge, upon request:
| | | | |
By phone | | 1-800-466-3863 | | |
On the SEC’s web site | | http://www.sec.gov | | |
The Series’ Form N-Q may be reviewed and copied at the SEC’s Public Reference Room in Washington, D.C. Information on the operation of the Public Reference Room may be obtained by calling 1-800-SEC-0330.
Prospectus and Statement of Additional Information (SAI)
The prospectus and SAI provide additional information about each Series, including charges, expenses and risks. These documents are available, without charge, upon request:
| | | | |
By phone | | 1-800-466-3863 | | |
On the SEC’s web site | | http://www.sec.gov | | |
On the Advisor’s web site | | http://www.manning-napier.com | | |
Additional information available at www.manning-napier.com
1. Fund Holdings - Month-End
2. Fund Holdings - Quarter-End
3. Shareholder Report - Annual
4. Shareholder Report - Semi-Annual
MNWO-12/10-AR

Management Discussion and Analysis (unaudited)
Dear Shareholders:
As well-defined swings in sentiment drove market fluctuations in 2010, the fixed income markets generally had favorable results for the year. Returns were broadly positive throughout the first three quarters of the year. However, while equities finished the year with a strong rally, fixed income markets generally took a negative turn at the end of 2010. After eight consecutive quarters of positive performance, broad fixed income markets suffered losses in the fourth quarter.
While municipal securities posted gains for the year, the sector had the weakest fixed income returns in 2010, as credit concerns and supply and demand changes caused noteworthy losses during the last quarter. The Bank of America Merrill Lynch 1-12 Year Municipal Bond Index earned 3.04% during the year. With a return of 0.14%, the Ohio Tax Exempt Series trailed its benchmark over the last twelve months.
The municipal bond market generally performed well in the first three quarters of the year, a reflection of attractive supply and demand dynamics. During this time, the fundamentals in the tax-exempt marketplace remained strong, with demand rising because of the likelihood of higher taxes in the top tax brackets, and supply for longer-term tax-exempt issues declining because of the popularity of the alternative Build America Bond program. However, amid heightened concern about municipal defaults, the municipal bond market struggled during the fourth quarter.
While credit issues exist in certain areas of the municipal market, the Advisor does not believe the broad municipal credit environment has materially deteriorated. In fact, municipal defaults are rare, and municipalities typically pay their debts in full even if they are forced to restructure. Rather, much of the losses at the end of the year were likely due to supply and demand shifts within the sector. The recent tax compromise, which extended the Bush-era tax cuts for all income brackets, lessened the immediate demand for tax-shielding investments, and supply is expected to increase because of the expiration of the Build America Bond program, which had limited longer-term, tax-exempt supply, thus benefiting the municipal market. Given these factors, municipal yields increased during the fourth quarter. While rising yields equate to price declines, the Advisor believes this yield shift has enhanced the relative value of municipal bonds versus other sectors of the fixed income market.
Throughout 2010, the Series continued to focus on high quality bonds with an emphasis on the underlying credit quality, which provides additional security in the midst of a tough credit and economic environment. Specifically, during the past year the underlying credit quality of the bonds in the Series was rated investment grade or higher, and the types of holdings included general obligation debt, pre-refunded bonds, and revenue debt associated with necessary municipal services. While this higher quality bias leads to slightly lower relative yields than the overall municipal market, the Advisor believes the safety and liquidity of such issues justifies the quality bias.
Over the past year, the Series had a significant exposure to securities in the intermediate to longer-term maturity range as compared to the benchmark, which holds only minimal securities in this range. This intermediate to longer-term weighting was the primary driver of relative underperformance in 2010. While the current positioning helped relative results during several periods last year, particularly when municipal yields fell to historic lows during the third quarter, this positioning noticeably detracted from returns when yields rose during the fourth quarter, causing the Series to lag its benchmark for the year. However, given the slow growth economic environment, the Advisor believes the intermediate to longer-term maturity structure continues to be the most suitable strategy.
As the markets unfold in 2011, it will be important to monitor trends such as state and local budgets, monetary policy, and inflation expectations. With this mindset, Manning & Napier remains committed to our active and selective investment approach to fixed income. Staying focused on the fundamentals and maintaining our selective investment process helped us earn solid returns through the volatile markets of 2010, and we believe these qualities will remain important in the environment ahead.
As always, we appreciate your business.
Sincerely,
Manning & Napier Advisors, Inc.
Performance Update as of December 31, 2010 (unaudited)
| | | | | | | | | | | | | | | | |
| | | | | | Average Annual Total Returns
As of December 31, 2010 | |
| | | One
Year | | | Five
Year | | | Ten
Year | | | Since
Inception 1 | |
Manning & Napier Fund, Inc. - Ohio Tax Exempt Series2 | | | 0.14 | % | | | 3.47% | | | | 4.00% | | | | 4.29% | |
Bank of America (BofA) Merrill Lynch 1-12 Year Municipal Bond Index3 | | | 3.04 | % | | | 4.71% | | | | 4.91% | | | | 5.15% | |
| | | | | | | | | | | | | | | | | |
The following graph compares the value of a $10,000 investment in the Manning & Napier Fund, Inc. - Ohio Tax Exempt Series for the ten years ended December 31, 2010 to the BofA Merrill Lynch 1-12 Year Municipal Bond Index.
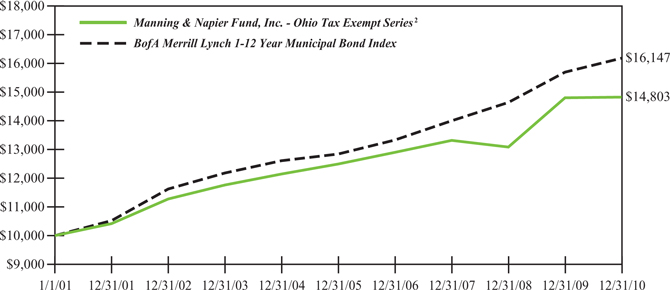
1Performance numbers for the Series and Index are calculated from February 14, 1994, the Series’ inception date.
2The Series’ performance does not reflect the deduction of taxes that a shareholder would pay on fund distributions or the redemption of shares. The Series’ performance is historical and may not be indicative of future results. The performance returns shown are inclusive of the net expense ratio of the Series. For the year ended December 31, 2010, this net expense ratio was 0.85%. The gross expense ratio, which does not account for any voluntary or contractual waivers currently in effect, was 0.85% for the year ended December 31, 2010.
3The BofA Merrill Lynch 1-12 Year Municipal Bond Index (formerly a Merrill Lynch Index) is an unmanaged, market weighted index comprised of investment-grade, fixed rate, coupon bearing municipal bonds with maturities greater than one year but less than twelve years. The Index returns assume reinvestment of coupons and, unlike Series returns, do not reflect any fees or expenses.
Shareholder Expense Example (unaudited)
As a shareholder of the Series, you may incur two types of costs: (1) transaction costs and (2) ongoing costs, including management fees and other Series expenses. This example is intended to help you understand your ongoing costs (in dollars) of investing in the Series and to compare these costs with the ongoing costs of investing in other mutual funds.
The example is based on an investment of $1,000 invested at the beginning of the period and held for the entire period (July 1, 2010 to December 31, 2010).
Actual Expenses
The first line of the table below provides information about actual account values and actual expenses. You may use the information in this line, together with the amount you invested, to estimate the expenses that you paid over the period. Simply divide your account value by $1,000 (for example, an $8,600 account value divided by $1,000 = 8.6), then multiply the result by the number in the first line under the heading entitled “Expenses Paid During Period” to estimate the expenses you paid on your account during this period.
Hypothetical Example for Comparison Purposes
The second line of the table below provides information about hypothetical account values and hypothetical expenses based on the Series’ actual expense ratio and an assumed rate of return of 5% per year before expenses, which is not the Series’ actual return. The hypothetical account values and expenses may not be used to estimate the actual ending account balance or expenses you paid during the period. You may use this information to compare the ongoing costs of investing in the Series and other funds. To do so, compare this 5% hypothetical example with the 5% hypothetical examples that appear in the shareholder reports of the other funds.
Please note that the expenses shown in the table are meant to highlight your ongoing costs only and do not reflect any transaction costs. Therefore, the second line of the table is useful in comparing ongoing costs only, and will not help you determine the relative total costs of owning different funds. In addition, if these transaction costs were included, your costs would have been higher.
| | | | | | | | | | | | |
| | | Beginning Account Value
7/1/10 | | | Ending Account Value 12/31/10 | | | Expenses Paid During Period* 7/1/10-12/31/10 | |
Actual | | | $1,000.00 | | | | $ 978.30 | | | | $4.24 | |
Hypothetical (5% return before expenses) | | | $1,000.00 | | | | $1,020.92 | | | | $4.33 | |
*Expenses are equal to the Series’ annualized expense ratio (for the six-month period) of 0.85%, multiplied by the average account value over the period, multiplied by 184/365 (to reflect the one-half year period). Expenses are based on the most recent fiscal half year; therefore, the expense ratio stated above may differ from the expense ratio stated in the financial highlights, which is based on one-year data. The Series’ total return would have been lower had certain expenses not been waived during the period.
Portfolio Composition as of December 31, 2010 (unaudited)
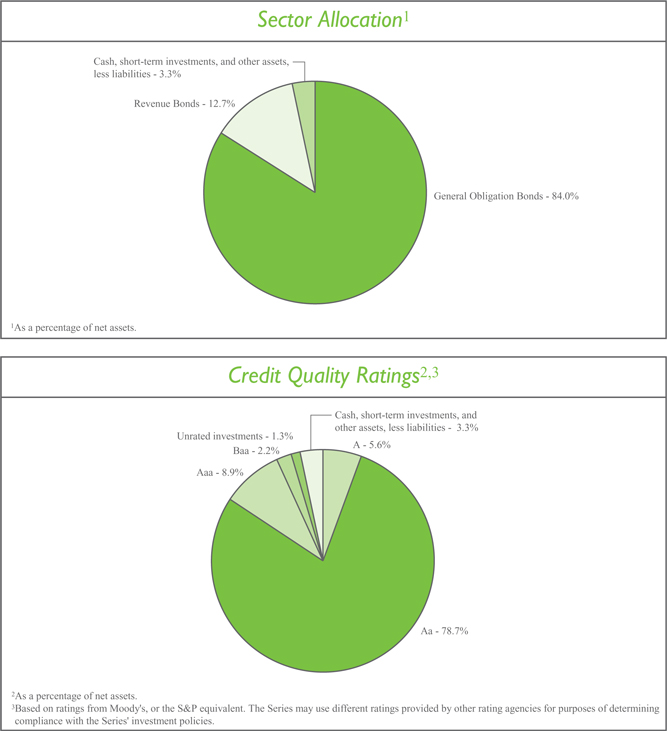
Investment Portfolio - December 31, 2010
| | | | | | | | | | | | | | | | | | | | |
| | | Coupon
Rate | | | Maturity
Date | | | Credit
Rating 1
(unaudited) | | | Principal
Amount | | | Value
(Note 2) | |
| | | | | |
OHIO MUNICIPAL SECURITIES - 96.7% | | | | | | | | | | | | | | | | | | | | |
| | | | | |
Akron, Various Purposes Impt., G.O. Bond | | | 4.250% | | | | 12/1/2028 | | | | AA2 | | | $ | 200,000 | | | $ | 179,376 | |
Akron, Various Purposes Impt., Series B, G.O. Bond | | | 5.000% | | | | 12/1/2031 | | | | AA2 | | | | 300,000 | | | | 292,392 | |
American Municipal Power-Ohio, Inc., Prairie State Energy Campus Project, Series A, Revenue Bond | | | 5.250% | | | | 2/15/2023 | | | | A1 | | | | 150,000 | | | | 156,143 | |
Avon, Public Impt., Series B, G.O. Bond | | | 5.000% | | | | 12/1/2023 | | | | Aa1 | | | | 100,000 | | | | 105,945 | |
Batavia Local School District, G.O. Bond, NATL | | | 5.625% | | | | 12/1/2022 | | | | A1 | | | | 200,000 | | | | 222,996 | |
Bedford Heights, Series A, G.O. Bond, AMBAC. | | | 5.650% | | | | 12/1/2014 | | | | Aa3 | | | | 20,000 | | | | 21,497 | |
Big Walnut Local School District, Delaware County, School Facilities Construction & Impt., G.O. Bond, AGM | | | 4.500% | | | | 12/1/2029 | | | | Aa2 | | | | 200,000 | | | | 194,284 | |
Brunswick, Limited Tax, Capital Impt., G.O. Bond | | | 4.000% | | | | 12/1/2025 | | | | Aa2 | | | | 100,000 | | | | 96,612 | |
Butler County, G.O. Bond, AMBAC | | | 5.000% | | | | 12/1/2016 | | | | Aa1 | | | | 110,000 | | | | 126,051 | |
Butler County, Water & Sewer, G.O. Bond | | | 2.500% | | | | 12/1/2014 | | | | Aa1 | | | | 100,000 | | | | 102,907 | |
Canal Winchester Local School District, G.O. Bond, AGM | | | 4.250% | | | | 12/1/2027 | | | | Aa3 | | | | 500,000 | | | | 460,515 | |
Canal Winchester Local School District, Prerefunded Balance, Series B, G.O. Bond, NATL | | | 5.000% | | | | 12/1/2025 | | | | A1 | | | | 355,000 | | | | 401,970 | |
Cincinnati City School District, Construction & Impt., G.O. Bond, FGRNA | | | 5.250% | | | | 12/1/2022 | | | | Aa2 | | | | 115,000 | | | | 129,857 | |
Cincinnati City School District, Construction & Impt., G.O. Bond, FGRNA | | | 5.250% | | | | 12/1/2025 | | | | Aa2 | | | | 600,000 | | | | 658,092 | |
Cincinnati City School District, G.O. Bond | | | 4.500% | | | | 6/1/2018 | | | | Aa2 | | | | 100,000 | | | | 110,670 | |
Cincinnati City School District, G.O. Bond | | | 5.000% | | | | 6/1/2031 | | | | Aa2 | | | | 265,000 | | | | 265,779 | |
Cincinnati Water Systems, Series B, Revenue Bond, NATL | | | 5.000% | | | | 12/1/2023 | | | | Aa1 | | | | 600,000 | | | | 637,968 | |
Cincinnati, Various Purposes Impt., Series A, G.O. Bond | | | 5.000% | | | | 12/1/2021 | | | | Aa1 | | | | 220,000 | | | | 241,025 | |
Cincinnati, Various Purposes Impt., Series B, G.O. Bond | | | 4.250% | | | | 12/1/2026 | | | | Aa1 | | | | 170,000 | | | | 164,263 | |
Cleveland Heights & University Heights City School District, G.O. Bond | | | 5.125% | | | | 12/1/2026 | | | | Aa2 | | | | 200,000 | | | | 204,178 | |
Cleveland, Income Tax, Revenue Bond | | | 5.250% | | | | 5/15/2024 | | | | AA2 | | | | 500,000 | | | | 520,730 | |
Cleveland, Water Utility Impt., Series O, Revenue Bond, NATL | | | 5.000% | | | | 1/1/2037 | | | | Aa1 | | | | 380,000 | | | | 369,759 | |
Columbus City School District, Facilities Construction & Impt., G.O. Bond | | | 4.500% | | | | 12/1/2029 | | | | Aa2 | | | | 500,000 | | | | 470,675 | |
Columbus City School District, Facilities Construction & Impt., G.O. Bond, AGM | | | 4.250% | | | | 12/1/2032 | | | | Aa2 | | | | 500,000 | | | | 441,270 | |
Columbus, Limited Tax, Series 2, G.O. Bond | | | 5.000% | | | | 7/1/2017 | | | | Aaa | | | | 250,000 | | | | 279,455 | |
| | |
| 5 | | The accompanying notes are an integral part of the financial statements. |
Investment Portfolio - December 31, 2010
| | | | | | | | | | | | | | | | | | | | |
| | | Coupon
Rate | | | Maturity
Date | | | Credit
Rating 1
(unaudited) | | | Principal
Amount | | | Value
(Note 2) | |
| | | | | |
OHIO MUNICIPAL SECURITIES (continued) | | | | | | | | | | | | | | | | | | | | |
| | | | | |
Columbus, Sewer Impt., Series A, Revenue Bond | | | 4.250% | | | | 6/1/2030 | | | | Aa1 | | | $ | 250,000 | | | $ | 226,575 | |
Cuyahoga Falls, G.O. Bond, NATL | | | 5.000% | | | | 12/1/2021 | | | | Aa2 | | | | 750,000 | | | | 795,330 | |
Delaware County, Capital Facilities, Series A, G.O. Bond | | | 4.250% | | | | 12/1/2023 | | | | Aa1 | | | | 100,000 | | | | 101,388 | |
Eaton Community City Schools, G.O. Bond, FGRNA | | | 4.125% | | | | 12/1/2026 | | | | Aa2 | | | | 500,000 | | | | 459,840 | |
Elyria City School District, G.O. Bond, XLCA | | | 4.750% | | | | 12/1/2027 | | | | A1 | | | | 100,000 | | | | 97,499 | |
Euclid, G.O. Bond, NATL | | | 4.250% | | | | 12/1/2023 | | | | Aa2 | | | | 465,000 | | | | 468,557 | |
Fairbanks Local School District, School Facilities Construction & Impt., G.O. Bond, AGM | | | 4.500% | | | | 12/1/2028 | | | | Aa3 | | | | 400,000 | | | | 374,380 | |
Fairborn School District, G.O. Bond, AGM | | | 5.000% | | | | 12/1/2021 | | | | Aa3 | | | | 400,000 | | | | 430,096 | |
Fairfield County, Building Impt., Prerefunded Balance, G.O. Bond | | | 5.000% | | | | 12/1/2018 | | | | Aa2 | | | | 250,000 | | | | 260,575 | |
Fairview Park City School District, G.O. Bond, NATL | | | 5.000% | | | | 12/1/2029 | | | | Aa3 | | | | 315,000 | | | | 316,969 | |
Franklin County, Various Purposes Impt., G.O. Bond | | | 5.000% | | | | 12/1/2027 | | | | Aaa | | | | 500,000 | | | | 524,390 | |
Geneva Area City School District, G.O. Bond, NATL | | | 4.500% | | | | 12/1/2030 | | | | Aa3 | | | | 120,000 | | | | 116,159 | |
Granville Exempt Village School District, G.O. Bond, AGM | | | 4.375% | | | | 12/1/2031 | | | | Aa1 | | | | 500,000 | | | | 454,890 | |
Greater Cleveland Regional Transit Authority, Capital Impt., G.O. Bond, FGRNA | | | 4.125% | | | | 12/1/2023 | | | | Aa2 | | | | 450,000 | | | | 433,080 | |
Greene County, Limited Tax, G.O. Bond | | | 4.500% | | | | 12/1/2035 | | | | Aa2 | | | | 250,000 | | | | 232,630 | |
Greene County, Revenue Bond | | | 3.500% | | | | 12/1/2026 | | | | Aa2 | | | | 300,000 | | | | 259,047 | |
Hamilton City School District, G.O. Bond, AGM | | | 4.250% | | | | 12/1/2030 | | | | Aa3 | | | | 500,000 | | | | 435,760 | |
Hamilton County, Sewer Impt., Series A, Revenue Bond | | | 5.000% | | | | 12/1/2032 | | | | Aa2 | | | | 100,000 | | | | 100,286 | |
Hamilton Electric System, Series A, Revenue Bond, AGC | | | 4.125% | | | | 10/1/2024 | | | | Aa3 | | | | 300,000 | | | | 286,170 | |
Hamilton Waterworks System, Series A, Revenue Bond, AGC | | | 4.625% | | | | 10/15/2029 | | | | Aa3 | | | | 100,000 | | | | 93,835 | |
Hamilton, Series A, Revenue Bond, AGC | | | 4.125% | | | | 10/15/2023 | | | | Aa3 | | | | 120,000 | | | | 116,918 | |
Hancock County, Various Purposes Impt., G.O. Bond, NATL | | | 4.000% | | | | 12/1/2016 | | | | Aa2 | | | | 200,000 | | | | 217,134 | |
Harrison, Various Purposes Impt., G.O. Bond, AGM | | | 5.250% | | | | 12/1/2038 | | | | Aa3 | | | | 275,000 | | | | 284,081 | |
Huber Heights City School District, School Impt., G.O. Bond | | | 5.000% | | | | 12/1/2036 | | | | Aa2 | | | | 450,000 | | | | 441,013 | |
Indian Hill Exempt Village School District, School Impt., G.O. Bond | | | 4.375% | | | | 12/1/2022 | | | | Aaa | | | | 250,000 | | | | 258,015 | |
| | |
| The accompanying notes are an integral part of the financial statements. | | 6 |
Investment Portfolio - December 31, 2010
| | | | | | | | | | | | | | | | | | | | |
| | | Coupon
Rate | | | Maturity
Date | | | Credit
Rating 1
(unaudited) | | | Principal Amount | | | Value
(Note 2) | |
| | | | | |
OHIO MUNICIPAL SECURITIES (continued) | | | | | | | | | | | | | | | | | | | | |
| | | | | |
Indian Lake Local School District, School Facilities Construction & Impt., G.O. Bond, NATL | | | 4.500% | | | | 12/1/2021 | | | | Aa3 | | | $ | 235,000 | | | $ | 240,755 | |
Ironton City School District, G.O. Bond, NATL | | | 4.250% | | | | 12/1/2028 | | | | Baa1 | | | | 500,000 | | | | 449,365 | |
Kettering City School District, G.O. Bond, AGM | | | 4.250% | | | | 12/1/2025 | | | | Aa2 | | | | 750,000 | | | | 722,648 | |
Lakewood, Water System, Revenue Bond, AMBAC | | | 4.500% | | | | 7/1/2028 | | | | WR3 | | | | 500,000 | | | | 446,750 | |
Lakota Local School District, Series A, G.O. Bond, FGRNA | | | 5.250% | | | | 12/1/2024 | | | | Aaa | | | | 210,000 | | | | 233,568 | |
Licking Heights Local School District, School Facilities Construction & Impt., Series A, G.O. Bond, NATL | | | 5.000% | | | | 12/1/2022 | | | | Aa2 | | | | 250,000 | | | | 260,250 | |
Lima, Revenue Bond, AGM | | | 3.750% | | | | 12/1/2023 | | | | Aa3 | | | | 225,000 | | | | 217,201 | |
Lima, Revenue Bond, AGM | | | 4.300% | | | | 12/1/2029 | | | | Aa3 | | | | 200,000 | | | | 193,598 | |
Lorain City School District, Unrefunded Balance, G.O. Bond, NATL | | | 4.750% | | | | 12/1/2025 | | | | Aa2 | | | | 335,000 | | | | 341,750 | |
Lorain County, Sewer System Impt., G.O. Bond | | | 5.000% | | | | 12/1/2039 | | | | Aa2 | | | | 200,000 | | | | 196,984 | |
Lucas County, Sewer & Water District Impt., G.O. Bond | | | 4.100% | | | | 12/1/2027 | | | | AA2 | | | | 100,000 | | | | 97,376 | |
Lucas County, Various Purposes Impt., G.O. Bond | | | 4.500% | | | | 10/1/2035 | | | | Aa2 | | | | 300,000 | | | | 268,623 | |
Mahoning County, Various Purposes Impt., Revenue Bond | | | 4.375% | | | | 12/1/2035 | | | | Aa3 | | | | 230,000 | | | | 214,291 | |
Mahoning County, Various Purposes Impt., Series B, G.O. Bond, AGC | | | 4.375% | | | | 12/1/2035 | | | | Aa3 | | | | 300,000 | | | | 285,765 | |
Mansfield, Limited Tax, Various Purposes Impt., G.O. Bond, AGC | | | 5.500% | | | | 12/1/2029 | | | | Aa3 | | | | 100,000 | | | | 98,952 | |
Marion, Limited Tax, Various Purposes Impt., Series A, G.O. Bond, AGM | | | 4.300% | | | | 12/1/2030 | | | | Aa3 | | | | 100,000 | | | | 95,508 | |
Marysville Exempt Village School District, G.O. Bond, AGM | | | 5.000% | | | | 12/1/2023 | | | | Aa3 | | | | 500,000 | | | | 515,850 | |
Marysville, Sewer & Wastewater, Revenue Bond, AGC, XLCA | | | 4.750% | | | | 12/1/2046 | | | | Aa3 | | | | 180,000 | | | | 159,966 | |
Mason, Limited Tax, Various Purposes Impt., G.O. Bond | | | 4.250% | | | | 12/1/2027 | | | | Aaa | | | | 925,000 | | | | 887,195 | |
Maumee City School District, G.O. Bond, AGM | | | 4.600% | | | | 12/1/2031 | | | | Aa3 | | | | 260,000 | | | | 252,171 | |
Maumee, Public Impt., G.O. Bond, NATL | | | 4.125% | | | | 12/1/2018 | | | | Aa2 | | | | 375,000 | | | | 396,926 | |
Miamisburg City School District, G.O. Bond | | | 5.000% | | | | 12/1/2033 | | | | Aa2 | | | | 250,000 | | | | 251,940 | |
Middletown, Various Purposes Impt., G.O. Bond, AGM | | | 4.500% | | | | 12/1/2018 | | | | Aa2 | | | | 100,000 | | | | 111,511 | |
Monroe Local School District, G.O. Bond, AMBAC | | | 5.500% | | | | 12/1/2024 | | | | Aa3 | | | | 500,000 | | | | 549,645 | |
| | |
| 7 | | The accompanying notes are an integral part of the financial statements. |
Investment Portfolio - December 31, 2010
| | | | | | | | | | | | | | | | | | | | |
| | | Coupon
Rate | | | Maturity
Date | | | Credit
Rating 1
(unaudited) | | | Principal
Amount | | | Value
(Note 2) | |
| | | | | |
OHIO MUNICIPAL SECURITIES (continued) | | | | | | | | | | | | | | | | | | | | |
| | | | | |
Montgomery County, Various Purposes Impt., G.O. Bond | | | 3.000% | | | | 12/1/2019 | | | | Aa1 | | | $ | 250,000 | | | $ | 248,833 | |
Mount Healthy City School District, G.O. Bond, AGM | | | 5.000% | | | | 12/1/2031 | | | | Aa3 | | | | 200,000 | | | | 198,708 | |
Muskingum County, Limited Tax, Various Purposes Impt., G.O. Bond, AGC | | | 4.300% | | | | 12/1/2028 | | | | Aa2 | | | | 145,000 | | | | 141,281 | |
New Albany Plain Local School District, G.O. Bond, FGRNA | | | 5.000% | | | | 12/1/2030 | | | | AA2 | | | | 140,000 | | | | 133,869 | |
New Albany Plain Local School District, Prerefunded Balance, G.O. Bond, FGIC | | | 5.000% | | | | 12/1/2025 | | | | Aa1 | | | | 45,000 | | | | 47,758 | |
New Albany Plain Local School District, Prerefunded Balance, G.O. Bond, FGIC | | | 5.000% | | | | 12/1/2025 | | | | Aa1 | | | | 85,000 | | | | 90,209 | |
New Albany Plain Local School District, Prerefunded Balance, G.O. Bond, FGIC | | | 5.000% | | | | 12/1/2029 | | | | Aa1 | | | | 95,000 | | | | 100,822 | |
New Albany Plain Local School District, Unrefunded Balance, G.O. Bond, FGIC | | | 5.000% | | | | 12/1/2025 | | | | Aa1 | | | | 185,000 | | | | 185,043 | |
New Albany Plain Local School District, Unrefunded Balance, G.O. Bond, FGRNA | | | 5.000% | | | | 12/1/2029 | | | | Aa1 | | | | 130,000 | | | | 125,070 | |
North Royalton, Various Purposes Impt., G.O. Bond | | | 5.250% | | | | 12/1/2028 | | | | Aa2 | | | | 1,025,000 | | | | 1,058,446 | |
Ohio State Water Development Authority, Pollution Control, Revenue Bond | | | 5.250% | | | | 12/1/2015 | | | | Aaa | | | | 200,000 | | | | 231,508 | |
Ohio State Water Development Authority, Pure Water, Series I, Revenue Bond, AMBAC | | | 6.000% | | | | 12/1/2016 | | | | Aaa | | | | 30,000 | | | | 33,691 | |
Ohio State, Infrastructure Impt., Series A, Prerefunded Balance, G.O. Bond | | | 5.000% | | | | 3/1/2017 | | | | Aa1 | | | | 250,000 | | | | 289,925 | |
Ohio State, School Services, Series A, G.O. Bond | | | 4.500% | | | | 9/15/2025 | | | | Aa1 | | | | 700,000 | | | | 701,554 | |
Ohio State, Series C, G.O. Bond | | | 5.000% | | | | 9/15/2020 | | | | Aa1 | | | | 100,000 | | | | 113,287 | |
Olentangy Local School District, Series A, G.O. Bond, AGM | | | 4.500% | | | | 12/1/2032 | | | | Aa1 | | | | 800,000 | | | | 743,048 | |
Orange City School District, G.O. Bond | | | 4.500% | | | | 12/1/2023 | | | | Aaa | | | | 500,000 | | | | 508,570 | |
Painesville City Local School District, G.O. Bond, FGRNA | | | 4.500% | | | | 12/1/2025 | | | | A1 | | | | 170,000 | | | | 168,536 | |
Pickerington Local School District, G.O. Bond, NATL | | | 4.300% | | | | 12/1/2024 | | | | Baa1 | | | | 300,000 | | | | 289,020 | |
Pickerington Local School District, G.O. Bond, NATL | | | 4.250% | | | | 12/1/2034 | | | | Aa2 | | | | 230,000 | | | | 196,910 | |
Portage County, Limited Tax, Various Purposes Impt., G.O. Bond | | | 4.000% | | | | 12/1/2020 | | | | AA2 | | | | 175,000 | | | | 180,133 | |
South Range Local School District, G.O. Bond, XLCA | | | 4.500% | | | | 12/1/2035 | | | | A2 | | | | 225,000 | | | | 201,973 | |
South-Western City School District, Franklin & Pickway County, G.O. Bond, AGM | | | 4.250% | | | | 12/1/2026 | | | | Aa2 | | | | 600,000 | | | | 574,500 | |
| | |
| The accompanying notes are an integral part of the financial statements. | | 8 |
Investment Portfolio - December 31, 2010
| | | | | | | | | | | | | | | | | | |
| | | Coupon
Rate | | Maturity
Date | | | Credit
Rating 1
(unaudited) | | | Principal
Amount/
Shares | | | Value (Note 2) | |
| | | | |
OHIO MUNICIPAL SECURITIES (continued) | | | | | | | | | | | | | | | | |
| | | | | |
Springboro Community City School District, G.O. Bond, AGM | | 5.250% | | | 12/1/2032 | | | | Aa3 | | | $ | 150,000 | | | $ | 150,771 | |
Sugarcreek Local School District, G.O. Bond, AGM | | 4.250% | | | 12/1/2031 | | | | Aa2 | | | | 750,000 | | | | 643,410 | |
Summit County, Various Purposes Impt., Series R, G.O. Bond, FGRNA | | 5.500% | | | 12/1/2019 | | | | Aa1 | | | | 100,000 | | | | 116,678 | |
Sylvania City School District, G.O. Bond, AGC | | 5.000% | | | 12/1/2025 | | | | Aa2 | | | | 270,000 | | | | 278,810 | |
Symmes Township, Limited Tax, Parkland Acquisition & Impt., G.O. Bond | | 5.250% | | | 12/1/2037 | | | | Aa1 | | | | 100,000 | | | | 103,434 | |
Tallmadge City School District, G.O. Bond, AGM | | 5.000% | | | 12/1/2031 | | | | AA2 | | | | 200,000 | | | | 202,280 | |
Tallmadge, G.O. Bond | | 4.250% | | | 12/1/2030 | | | | Aa2 | | | | 180,000 | | | | 172,060 | |
Tecumseh Local School District, G.O. Bond, FGRNA | | 4.750% | | | 12/1/2027 | | | | A1 | | | | 195,000 | | | | 192,317 | |
Toledo, Capital Impt., G.O. Bond, AGC | | 4.000% | | | 12/1/2024 | | | | Aa3 | | | | 100,000 | | | | 92,423 | |
Toledo, Waterworks, Revenue Bond, NATL | | 5.000% | | | 11/15/2023 | | | | Aa3 | | | | 100,000 | | | | 102,025 | |
Trotwood-Madison City School District, G.O. Bond, AGM | | 4.250% | | | 12/1/2022 | | | | Aa3 | | | | 250,000 | | | | 248,490 | |
Troy, Sewer Impt., G.O. Bond | | 4.750% | | | 12/1/2024 | | | | Aa1 | | | | 250,000 | | | | 255,940 | |
Van Buren Local School District, Prerefunded Balance, G.O. Bond, AGM | | 5.250% | | | 12/1/2016 | | | | Aa3 | | | | 300,000 | | | | 313,269 | |
Vandalia Butler City School District, G.O. Bond | | 5.000% | | | 12/1/2038 | | | | Aa2 | | | | 500,000 | | | | 510,145 | |
Vandalia, G.O. Bond, AMBAC | | 5.000% | | | 12/1/2015 | | | | Aa2 | | | | 235,000 | | | | 257,207 | |
Wadsworth City School District, G.O. Bond, AGC | | 5.000% | | | 12/1/2037 | | | | AA2 | | | | 180,000 | | | | 182,090 | |
Warren County, Highway Impt., G.O. Bond | | 4.000% | | | 12/1/2022 | | | | Aa1 | | | | 100,000 | | | | 101,249 | |
Washington Court House City School District, G.O. Bond, FGRNA | | 5.000% | | | 12/1/2029 | | | | A1 | | | | 500,000 | | | | 496,955 | |
West Chester Township, Various Purposes Impt., Series A, G.O. Bond | | 5.000% | | | 12/1/2020 | | | | Aaa | | | | 100,000 | | | | 110,245 | |
Wood County, G.O. Bond | | 5.400% | | | 12/1/2013 | | | | Aa2 | | | | 15,000 | | | | 15,045 | |
| | | | | | | | | | | | | | | | | | |
TOTAL MUNICIPAL BONDS
(Identified Cost $34,002,680) | | | | | | | | | | | | | | | | | 33,235,151 | |
| | | | | | | | | | | | | | | | | | |
| | | | | |
SHORT-TERM INVESTMENTS - 3.0% | | | | | | | | | | | | | | | | | | |
Dreyfus AMT - Free Municipal Reserves - Class R (Identified Cost $1,017,361) | | | | | | | | | | | | | 1,017,361 | | | | 1,017,361 | |
| | | | | | | | | | | | | | | | | | |
| | |
| 9 | | The accompanying notes are an integral part of the financial statements. |
Investment Portfolio - December 31, 2010
| | | | |
| | | | |
| | | Value (Note 2) | |
TOTAL INVESTMENTS - 99.7%
(Identified Cost $35,020,041) | | $ | 34,252,512 | |
OTHER ASSETS, LESS LIABILITIES - 0.3% | | | 117,243 | |
| | | | |
NET ASSETS - 100% | | $ | 34,369,755 | |
| | | | |
KEY:
G.O. Bond - General Obligation Bond
Impt. - Improvement
Scheduled principal and interest payments are guaranteed by:
AGC (Assured Guaranty Corp.)
AGM (Assurance Guaranty Municipal Corp.)
AMBAC (AMBAC Assurance Corp.)
FGIC (Financial Guaranty Insurance Co.)
FGRNA (FGIC reinsured by NATL)
NATL (National Public Finance Guarantee Corp.)
XLCA (XL Capital Assurance)
The insurance does not guarantee the market value of the municipal bonds.
1Credit ratings from Moody’s (unaudited).
2Credit ratings from S&P (unaudited).
3Credit rating has been withdrawn. As of December 31, 2010, there is no rating available (unaudited).
The Series’ portfolio holds, as a percentage of net assets, greater than 10% in bonds insured by the following companies:
NATL - 26.1%; AGM - 24.0%.
| | |
| The accompanying notes are an integral part of the financial statements. | | 10 |
Statement of Assets and Liabilities
December 31, 2010
| | | | |
ASSETS: | | | | |
Investments, at value (identified cost $35,020,041) (Note 2) | | $ | 34,252,512 | |
Interest receivable | | | 177,763 | |
| | | | |
| |
TOTAL ASSETS | | | 34,430,275 | |
| | | | |
| |
LIABILITIES: | | | | |
| |
Accrued management fees (Note 3) | | | 16,011 | |
Accrued fund accounting and administration fees (Note 3) | | | 5,520 | |
Accrued transfer agent fees (Note 3) | | | 477 | |
Accrued Chief Compliance Officer service fees (Note 3) | | | 245 | |
Audit fees payable | | | 29,616 | |
Printing fees payable | | | 4,234 | |
Other payables and accrued expenses | | | 4,417 | |
| | | | |
| |
TOTAL LIABILITIES | | | 60,520 | |
| | | | |
| |
TOTAL NET ASSETS | | $ | 34,369,755 | |
| | | | |
| |
NET ASSETS CONSIST OF: | | | | |
| |
Capital stock | | $ | 33,358 | |
Additional paid-in-capital | | | 35,067,396 | |
Undistributed net investment income | | | 36,178 | |
Accumulated net realized gain on investments | | | 352 | |
Net unrealized depreciation on investments | | | (767,529 | ) |
| | | | |
| |
TOTAL NET ASSETS | | $ | 34,369,755 | |
| | | | |
| |
NET ASSET VALUE, OFFERING PRICE AND REDEMPTION PRICE PER SHARE -
Class A ($34,369,755/3,335,822 shares) | | $ | 10.30 | |
| | | | |
| | |
| 11 | | The accompanying notes are an integral part of the financial statements. |
Statement of Operations
For the Year Ended December 31, 2010
| | | | |
INVESTMENT INCOME: | | | | |
| |
Interest | | $ | 1,235,268 | |
Dividends | | | 48 | |
| | | | |
| |
Total Investment Income | | | 1,235,316 | |
| | | | |
| |
EXPENSES: | | | | |
| |
Management fees (Note 3) | | | 150,692 | |
Fund accounting and administration fees (Note 3) | | | 45,687 | |
Directors’ fees (Note 3) | | | 6,973 | |
Chief Compliance Officer service fees (Note 3) | | | 2,630 | |
Transfer agent fees (Note 3) | | | 2,603 | |
Audit fees | | | 29,805 | |
Custodian fees | | | 1,702 | |
Miscellaneous | | | 16,410 | |
| | | | |
| |
Total Expenses | | | 256,502 | |
Less reduction of expenses (Note 3) | | | (758 | ) |
| | | | |
| |
Net Expenses | | | 255,744 | |
| | | | |
| |
NET INVESTMENT INCOME | | | 979,572 | |
| |
REALIZED AND UNREALIZED GAIN (LOSS) ON INVESTMENTS: | | | | |
| |
Net realized gain on investments | | | 286 | |
Net change in unrealized depreciation on investments | | | (1,217,584 | ) |
| | | | |
| |
NET REALIZED AND UNREALIZED (LOSS) ON INVESTMENTS | | | (1,217,298 | ) |
| | | | |
| |
NET DECREASE IN NET ASSETS RESULTING FROM OPERATIONS | | $ | (237,726 | ) |
| | | | |
| | |
| The accompanying notes are an integral part of the financial statements. | | 12 |
Statements of Changes in Net Assets
| | | | | | | | |
| | | For the
Year Ended
12/31/10 | | | For the
Year Ended
12/31/09 | |
INCREASE (DECREASE) IN NET ASSETS: | | | | | | | | |
| | |
OPERATIONS: | | | | | | | | |
| | |
Net investment income | | $ | 979,572 | | | $ | 749,727 | |
Net realized gain on investments | | | 286 | | | | 130,404 | |
Net change in unrealized appreciation (depreciation) on investments | | | (1,217,584 | ) | | | 1,786,693 | |
| | | | | | | | |
| | |
Net increase (decrease) from operations | | | (237,726 | ) | | | 2,666,824 | |
| | | | | | | | |
| | |
DISTRIBUTIONS TO SHAREHOLDERS (Note 8): | | | | | | | | |
| | |
From net investment income | | | (996,467 | ) | | | (774,410 | ) |
From net realized gain on investments | | | — | | | | (221,596 | ) |
| | | | | | | | |
| | |
Total distributions to shareholders | | | (996,467 | ) | | | (996,006 | ) |
| | | | | | | | |
| | |
CAPITAL STOCK ISSUED AND REPURCHASED: | | | | | | | | |
| | |
Net increase from capital share transactions (Note 5) | | | 10,728,881 | | | | 2,359,995 | |
| | | | | | | | |
| | |
Net increase in net assets | | | 9,494,688 | | | | 4,030,813 | |
| | |
NET ASSETS: | | | | | | | | |
| | |
Beginning of year | | | 24,875,067 | | | | 20,844,254 | |
| | | | | | | | |
| | |
End of year (including undistributed net investment income of $36,178 and $53,139, respectively) | | $ | 34,369,755 | | | $ | 24,875,067 | |
| | | | | | | | |
| | |
| 13 | | The accompanying notes are an integral part of the financial statements. |
Financial Highlights
| | | | | | | | | | | | | | | | | | | | |
| | | | | | For the Years Ended | | | | |
| | | 12/31/10 | | | 12/31/09 | | | 12/31/08 | | | 12/31/07 | | | 12/31/06 | |
Per share data (for a share outstanding throughout each year): | | | | | | | | | | | | | | | | | | | | |
Net asset value - Beginning of year | | | $10.62 | | | | $9.82 | | | | $10.43 | | | | $10.46 | | | | $10.52 | |
| | | | | | | | | | | | | | | | | | | | |
Income (loss) from investment operations: | | | | | | | | | | | | | | | | | | | | |
Net investment income | | | 0.351 | | | | 0.361 | | | | 0.38 | | | | 0.34 | | | | 0.38 | |
Net realized and unrealized gain (loss) on investments | | | (0.33) | | | | 0.91 | | | | (0.57) | | | | —2 | | | | (0.05) | |
| | | | | | | | | | | | | | | | | | | | |
Total from investment operations | | | 0.02 | | | | 1.27 | | | | (0.19) | | | | 0.34 | | | | 0.33 | |
| | | | | | | | | | | | | | | | | | | | |
Less distributions to shareholders: | | | | | | | | | | | | | | | | | | | | |
From net investment income | | | (0.34) | | | | (0.37) | | | | (0.36) | | | | (0.37) | | | | (0.38) | |
From net realized gain on investments | | | — | | | | (0.10) | | | | (0.06) | | | | — | | | | (0.01) | |
| | | | | | | | | | | | | | | | | | | | |
Total distributions to shareholders | | | (0.34) | | | | (0.47) | | | | (0.42) | | | | (0.37) | | | | (0.39) | |
| | | | | | | | | | | | | | | | | | | | |
Net asset value - End of year | | | $10.30 | | | | $10.62 | | | | $9.82 | | | | $10.43 | | | | $10.46 | |
| | | | | | | | | | | | | | | | | | | | |
Net assets - End of year (000’s omitted) | | | $34,370 | | | | $24,875 | | | | $20,844 | | | | $26,432 | | | | $20,612 | |
| | | | | | | | | | | | | | | | | | | | |
Total return3 | | | 0.14% | | | | 13.09% | | | | (1.74%) | | | | 3.28% | | | | 3.19% | |
Ratios (to average net assets)/ | | | | | | | | | | | | | | | | | | | | |
Supplemental Data: | | | | | | | | | | | | | | | | | | | | |
Expenses* | | | 0.85% | | | | 0.85% | | | | 0.85% | | | | 0.85% | | | | 0.85% | |
Net investment income | | | 3.25% | | | | 3.39% | | | | 3.58% | | | | 3.47% | | | | 3.81% | |
Portfolio turnover | | | 0%4 | | | | 11% | | | | 15% | | | | 3% | | | | 9% | |
*The investment advisor did not impose all or a portion of its management fees, CCO fees, fund accounting and transfer agent fees, and other fees in some years and in some years paid a portion of the Series’ expenses. If these expenses had been incurred by the Series, the expense ratio (to average net assets) would have been increased by the following amounts:
| | | | | | | | | | | | | | | | | | |
| | 0.00%5 | | | 0.03 | % | | | 0.01 | % | | | 0.00 | %5 | | | 0.07 | % |
1Calculated based on average shares outstanding during the year.
2Less than $0.01 per share.
3Represents aggregate total return for the periods indicated, and assumes reinvestment of all distributions. Total return would have been lower had certain expenses not been waived or reimbursed during the periods. Periods less than one year are not annualized.
4Less than 1%.
5Less than 0.01%.
| | |
| The accompanying notes are an integral part of the financial statements. | | 14 |
Notes to Financial Statements
Ohio Tax Exempt Series (the “Series”) is a no-load diversified series of Manning & Napier Fund, Inc. (the “Fund”). The Fund is organized in Maryland and is registered under the Investment Company Act of 1940, as amended, as an open-end management investment company.
The Series’ investment objective is to provide as high a level of current income exempt from federal income tax and Ohio State personal income tax as the Advisor believes is consistent with the preservation of capital.
The Fund’s Advisor is Manning & Napier Advisors, Inc. (the “Advisor”). Shares of the Series are offered to investors, clients and employees of the Advisor and its affiliates. The total authorized capital stock of the Fund consists of 10.0 billion shares of common stock each having a par value of $0.01. As of December 31, 2010, 6.2 billion shares have been designated in total among 29 series, of which 100 million have been designated as Ohio Tax Exempt Series Class A common stock.
| 2. | SIGNIFICANT ACCOUNTING POLICIES |
Security Valuation
Municipal securities will normally be valued on the basis of market valuations provided by an independent pricing service (the “Service”). The Service utilizes the latest price quotations and a matrix system (which considers such factors as security prices of similar securities, yields, maturities and ratings). The Service has been approved by the Fund’s Board of Directors (the “Board”).
Short-term investments that mature in sixty days or less are valued at amortized cost, which approximates market value. Investments in open-end investment companies are valued at their net asset value per share on valuation date.
Volume and level of activity in established markets for an asset or liability are evaluated to determine whether recent transactions and quoted prices are determinative of fair value. Where there have been significant decreases in volume and level of activity, further analysis and adjustment may be necessary to estimate fair value. The Series measures fair value in these instances by the use of inputs and valuation techniques which may be based upon current market prices of securities that are comparable in coupon, rating, maturity and industry and/or expectation of future cash flows. As a result of trading in relatively thin markets and/or markets that experience significant volatility, the prices used by the Series to value these securities may differ from the value that would be realized if these securities were sold, and the differences could be material.
Securities for which representative valuations or prices are not available from the Fund’s pricing service may be valued at fair value. Due to the inherent uncertainty of valuations of such securities, the fair value may differ significantly from the values that would have been used had a ready market for such securities existed. If trading or events occurring after the close of the principal market in which securities are traded are expected to materially affect the value of those securities, then they may be valued at their fair value, taking this trading or these events into account. Fair value is determined in good faith by the Advisor under procedures approved by and under the general supervision and responsibility of the Board.
Various inputs are used in determining the value of the Series’ assets or liabilities carried at market value. These inputs are summarized in three broad levels. Level 1 includes quoted prices in active markets for identical assets and liabilities. Level 2 includes other significant observable inputs (including quoted prices for similar securities, interest rates, prepayment speeds, credit risk, etc.). Level 3 includes significant unobservable inputs (including the Series’ own assumptions in determining the fair value of investments). The inputs or methodology used for valuing securities are not necessarily an indication of the risk associated with investing in those securities.
Notes to Financial Statements
| 2. | SIGNIFICANT ACCOUNTING POLICIES (continued) |
Security Valuation (continued)
The following is a summary of the valuation levels used for major security types as of December 31, 2010 in valuing the Series’ assets or liabilities carried at market value:
| | | | | | | | | | | | | | | | |
| Description | | Total | | | Level 1 | | | Level 2 | | | Level 3 | |
Assets: | | | | | | | | | | | | | | | | |
Equity securities* | | $ | — | | | $ | — | | | $ | — | | | $ | — | |
Preferred securities | | | — | | | | — | | | | — | | | | — | |
Debt securities: | | | | | | | | | | | | | | | | |
States and political subdivisions (municipals) | | | 33,235,151 | | | | — | | | | 33,235,151 | | | | — | |
Mutual funds | | | 1,017,361 | | | | 1,017,361 | | | | — | | | | — | |
Other financial instruments**: | | | — | | | | — | | | | — | | | | — | |
| | | | | | | | | | | | | | | | |
Total assets: | | | 34,252,512 | | | | 1,017,361 | | | | 33,235,151 | | | | — | |
| | | | | | | | | | | | | | | | |
Liabilities: | | | | | | | | | | | | | | | | |
Other financial instruments**: | | | — | | | | — | | | | — | | | | — | |
| | | | | | | | | | | | | | | | |
Total liabilities: | | | — | | | | — | | | | — | | | | — | |
| | | | | | | | | | | | | | | | |
Total | | $ | 34,252,512 | | | $ | 1,017,361 | | | $ | 33,235,151 | | | $ | — | |
| | | | | | | | | | | | | | | | |
*Includes common stock, warrants and rights. Please see the Investment Portfolio for industry classification.
**Other financial instruments are derivative instruments not reflected in the Investment Portfolio, such as futures, forwards and swap contracts, which are valued at the unrealized appreciation/depreciation on the instrument. As of December 31, 2010, the Series did not hold any derivative instruments.
There were no Level 3 securities held by the Series as of December 31, 2009 or December 31, 2010.
The Fund’s policy is to recognize transfers in and transfers out of the valuation levels as of the beginning of the reporting period. There were no significant transfers between Level 1 and Level 2 during the year ended December 31, 2010.
Additional disclosure surrounding the activity in Level 3 fair value measurement will be effective for fiscal years beginning after December 15, 2010. Management has concluded that this will not have a material impact on the Series’ financial statements.
Security Transactions, Investment Income and Expenses
Security transactions are accounted for on trade date. Dividend income is recorded on the ex-dividend date, except that if the ex-dividend date has passed, certain dividends from foreign securities are recorded as soon as the Fund is informed of the ex-dividend date. Non-cash dividends, if any, are recorded at the fair market value of the securities received. Interest income, including amortization of premium and accretion of discounts using the effective interest method, is earned from settlement date and accrued daily.
Expenses are recorded on an accrual basis. Most expenses of the Fund can be attributed to a specific series. Expenses which cannot be directly attributed are apportioned among the series in the Fund in such a manner as deemed equitable by the Fund’s Board, taking into consideration, among other things, the nature and type of expense.
The Series uses the identified cost method for determining realized gain or loss on investments for both financial statement and federal income tax reporting purposes.
Notes to Financial Statements
| 2. | SIGNIFICANT ACCOUNTING POLICIES (continued) |
Federal Taxes
The Series’ policy is to comply with the provisions of the Internal Revenue Code applicable to regulated investment companies. The Series is not subject to federal income tax or excise tax to the extent that the Series distributes to shareholders each year its taxable income, including any net realized gains on investments, in accordance with requirements of the Internal Revenue Code. Accordingly, no provision for federal income tax or excise tax has been made in the financial statements.
Management evaluates its tax positions to determine if the tax positions taken meet the minimum recognition threshold in connection with accounting for uncertainties in income tax positions taken or expected to be taken for the purposes of measuring and recognizing tax liabilities in the financial statements. Recognition of tax benefits of an uncertain tax position is required only when the position is “more likely than not” to be sustained assuming examination by taxing authorities. At December 31, 2010, the Series has recorded no liability for net unrecognized tax benefits relating to uncertain income tax positions taken or expected to be taken in future tax returns.
The Series files income tax returns in the U.S. federal jurisdiction and various states, as required. No income tax returns are currently under investigation. The statute of limitations on the Series’ tax returns remains open for the years ended December 31, 2007 through December 31, 2010. The Fund is not aware of any tax positions for which it is reasonably possible that the total amounts of unrecognized tax benefits will significantly change in the next twelve months.
Distributions of Income and Gains
Distributions to shareholders of net investment income are made quarterly. Distributions of net realized gains are made annually. An additional distribution may be necessary to avoid taxation of the Series. Distributions are recorded on the ex-dividend date.
Indemnifications
The Fund’s organizational documents provide former and current directors and officers with a limited indemnification against liabilities arising in connection with the performance of their duties to the Fund. In the normal course of business, the Fund may also enter into contracts that provide general indemnifications. The Fund’s maximum exposure under these arrangements is unknown as this would be dependent on future claims that may be made against the Fund. The risk of material loss from such claims is considered remote.
Other
The preparation of financial statements in conformity with accounting principles generally accepted in the United States of America requires management to make estimates and assumptions that affect the reported amounts of assets and liabilities and the disclosure of contingent assets and liabilities at the date of the financial statements and the reported amounts of income and expenses during the reporting period. Actual results could differ from those estimates.
| 3. | TRANSACTIONS WITH AFFILIATES |
The Fund has an Investment Advisory Agreement (the “Agreement”) with the Advisor, for which the Series pays a fee, computed daily and payable monthly, at an annual rate of 0.50% of the Series’ average daily net assets.
Under the Agreement, personnel of the Advisor provide the Series with advice and assistance in the choice of investments and the execution of securities transactions, and otherwise maintain the Series’ organization. The Advisor also provides the Fund with necessary office space and fund administration and support services. The salaries of all officers of the Fund (except a percentage of the Fund’s Chief Compliance Officer’s salary, which is paid by the Fund), and of all Directors who are “affiliated persons” of the Fund, or of the Advisor, and all personnel of the Fund, or of the Advisor, performing services relating to research, statistical and investment activities, are paid by the
Notes to Financial Statements
| 3. | TRANSACTIONS WITH AFFILIATES (continued) |
Advisor. Each “non-affiliated” Director receives an annual stipend, which is allocated among all the active series of the Fund. In addition, these Directors also receive a fee per Board meeting attended plus a fee for each committee meeting attended.
The Advisor has contractually agreed, until at least April 30, 2012, to waive its fee and, if necessary, pay other operating expenses of the Series in order to maintain total direct annual fund operating expenses for the Series at no more than 0.85% of average daily net assets each year. For the year ended December 31, 2010, the Advisor voluntarily waived fees of $758, which are included as a reduction of expenses on the Statement of Operations. The Advisor is not eligible to recoup any expenses that have been waived or reimbursed in prior years.
Manning & Napier Investor Services, Inc., a registered broker-dealer affiliate of the Advisor, acts as distributor for the Fund’s shares. The services of Manning & Napier Investor Services, Inc. are provided at no additional cost to the Series.
The Advisor has agreements with PNC Global Investment Servicing (U.S.) Inc. (“PNCGIS”) under which PNCGIS serves as sub-accountant services agent and sub-transfer agent. The Fund pays the Advisor an annual fee related to fund accounting and administration of 0.0175% on the first $3 billion of average daily net assets (excluding Target Series); 0.015% on the next $3 billion of average daily net assets (excluding Target Series); and 0.01% of the average daily net assets in excess of $6 billion (excluding Target Series); plus a base fee of $25,500 per Series. Transfer Agent fees are charged to the Fund on a per account basis. Additionally, certain transaction- and cusip-based fees and out-of-pocket expenses, including charges for reporting relating to the Fund’s compliance program, are charged.
Effective July 1, 2010, PNCGIS was sold to The Bank of New York Mellon Corporation, the Series’ custodian. At the close of the sale, PNCGIS changed its name to BNY Mellon Investment Servicing (U.S.) Inc. (“BNY”).
Expenses not directly attributable to a Series are allocated based on each Series’ relative net assets or number of accounts, depending on the expense.
| 4. | PURCHASES AND SALES OF SECURITIES |
For the year ended December 31, 2010, purchases and sales of securities, other than U.S. Government securities and short-term securities, were $10,731,463 and $20,000, respectively. There were no purchases or sales of U.S. Government securities.
| 5. | CAPITAL STOCK TRANSACTIONS |
Transactions in shares of Ohio Tax Exempt Series were:
| | | | | | | | | | | | | | | | |
| | | For the Year Ended 12/31/10 | | | For the Year Ended 12/31/09 | |
| | | Shares | | | Amount | | | Shares | | | Amount | |
Sold | | | 1,165,715 | | | $ | 12,625,181 | | | | 673,194 | | | $ | 7,080,565 | |
Reinvested | | | 89,722 | | | | 946,551 | | | | 91,022 | | | | 955,397 | |
Repurchased | | | (262,403 | ) | | | (2,842,851 | ) | | | (543,835 | ) | | | (5,675,967 | ) |
| | | | | | | | | | | | | | | | |
Total | | | 993,034 | | | $ | 10,728,881 | | | | 220,381 | | | | 2,359,995 | |
| | | | | | | | | | | | | | | | |
Substantially all of the Series’ shares represent investments by fiduciary accounts over which the Advisor has sole investment discretion.
Notes to Financial Statements
The Series may trade in instruments including written and purchased options, forward foreign currency exchange contracts and futures contracts and other derivatives in the normal course of investing activities to assist in managing exposure to various market risks. Investments in these instruments may subject the Series to various elements of risk, which may involve, to a varying degree, elements of risk in excess of the amounts recognized for financial statement purposes. These risks include: the risk that changes in the value of a derivative may not correlate perfectly with the underlying asset, rate or index, counterparty credit risk related to over the counter derivatives counterparties’ failure to perform under contract terms, liquidity risk related to the lack of a liquid market for these contracts allowing the fund to close out its position(s) and documentation risk relating to disagreement over contract terms. No such investments were held by the Series during the year ended December 31, 2010.
| 7. | CONCENTRATION OF CREDIT |
The Series primarily invests in debt obligations issued by the State of Ohio and its political subdivisions, agencies and public authorities to obtain funds for various public purposes. The Series is more susceptible to factors adversely affecting issues of Ohio municipal securities than is a municipal bond fund that is not concentrated in these issues to the same extent.
| 8. | FEDERAL INCOME TAX INFORMATION |
The amount and characterization of certain income and capital gains to be distributed are determined in accordance with federal income tax regulations, which may differ from accounting principles generally accepted in the United States of America. These differences are primarily due to differing book and tax treatments in the timing of the recognition of net investment income or gains and losses, including market discount. The Series may periodically make reclassifications among its capital accounts to reflect income and gains available for distribution (or available capital loss carryovers) under income tax regulations without impacting the Series’ net asset value. Any such reclassifications are not reflected in the financial highlights.
The tax character of distributions paid were as follows:
| | | | | | | | |
| | | For the Year
Ended
12/31/10 | | | For the Year
Ended
12/31/09 | |
Tax exempt income | | $ | 996,467 | | | $ | 774,419 | |
Long-term capital gains | | | — | | | | 221,587 | |
At December 31, 2010, the tax basis of distributable earnings and the net unrealized appreciation based on the identified cost of investments for federal income tax purposes were as follows:
| | | | | | |
| | Cost for federal income tax purposes | | $ | 35,017,120 | |
| | Unrealized appreciation | | $ | 312,179 | |
| | Unrealized depreciation | | | (1,076,787 | ) |
| | | | | | |
| | Net unrealized depreciation | | $ | (764,608 | ) |
| | | | | | |
| | Undistributed tax exempt income | | | 33,257 | |
| | Undistributed long-term gains | | | 352 | |
Report of Independent Registered Public Accounting Firm
To the Board of Directors of Manning & Napier Fund, Inc. and Shareholders of Ohio Tax Exempt Series:
In our opinion, the accompanying statement of assets and liabilities, including the investment portfolio (except for credit ratings), and the related statements of operations and of changes in net assets and the financial highlights present fairly, in all material respects, the financial position of the Ohio Tax Exempt Series (a series of Manning & Napier Fund, Inc., hereafter referred to as the “Series”) at December 31, 2010, and the results of its operations for the year then ended, the changes in its net assets for each of the two years in the period then ended and the financial highlights for each of the five years in the period then ended, in conformity with accounting principles generally accepted in the United States of America. These financial statements and financial highlights (hereafter referred to as “financial statements”) are the responsibility of the Series’ management. Our responsibility is to express an opinion on these financial statements based on our audits. We conducted our audits of these financial statements in accordance with the standards of the Public Company Accounting Oversight Board (United States). Those standards require that we plan and perform the audit to obtain reasonable assurance about whether the financial statements are free of material misstatement. An audit includes examining, on a test basis, evidence supporting the amounts and disclosures in the financial statements, assessing the accounting principles used and significant estimates made by management, and evaluating the overall financial statement presentation. We believe that our audits, which included confirmation of securities at December 31, 2010 by correspondence with the custodian, provide a reasonable basis for our opinion.
New York, New York
February 22, 2011
Supplemental Tax Information (unaudited)
All designations are based on financial information available as of the date of this annual report and, accordingly are subject to change.
Pursuant to Section 852 of the Internal Revenue Code, as amended, the Series hereby designates $0 as capital gains for its taxable year ended December 31, 2010. In addition, the Series hereby designates $996,467 as tax exempt dividends for the year ended December 31, 2010. For each item it is the intention of the Series to designate the maximum allowable under tax law.
Renewal of Investment Advisory Agreement (unaudited)
At the Manning & Napier Fund, Inc. (the “Fund”) Board of Directors’ (the “Board”) meeting, held on November 17, 2010, the Investment Advisory Agreement (the “Agreement”) between the Fund and Manning & Napier Advisors, Inc. (the “Advisor”) was reviewed by the Board for renewal. In connection with the decision whether to renew the Agreement, a variety of material was prepared for and reviewed by the Board.
Representatives of the Advisor attended the meeting and presented additional oral and written information to the Board to assist the Board in its considerations. The discussion immediately below outlines the materials and information presented to the Board in connection with the Board’s 2010 Annual Review of the Agreement and the conclusions made by the Directors when determining to continue the Agreement.
| | • | | The Board considered the services provided by the Advisor under the Agreement including, among others: deciding what securities to purchase and sell for each Series; arranging for the purchase and sale of such securities by placing orders with broker-dealers; administering the affairs of the Fund (including the books and records of the Fund not maintained by third party service providers such as the custodian or sub-transfer agent); arranging for the insurance coverage for the Fund; and supervising the preparation of tax returns, SEC filings (including registration statements) and reports to shareholders for the Fund. The Board also considered the nature and quality of such services provided under the Agreement in light of the Advisor’s services provided to the Fund for 24 years. The Board discussed the quality of these services with representatives from the Advisor and concluded that the Advisor was performing its services to the Fund required under the Agreement in a reasonable manner. |
| | • | | The Board considered the investment performance of the various Series of the Fund. The investment performance for each Series was reviewed on a cumulative basis since inception and on a one year basis. In addition, annualized performance for the following time periods was considered: inception, three year, five year, ten year, and current market cycle. A market cycle includes periods of both rising and falling markets. Returns for established benchmark indices for each Series were provided for each time period. The Board noted that the various Series were competitive against their respective benchmarks and/or peer groups over various time periods, but in particular over the full market cycle period relevant for the Series. In addition, the Board considered at the meeting (and considers on a quarterly basis) a peer group performance analysis consisting of Morningstar universes of mutual funds with similar investment objectives. The Board discussed the performance with representatives from the Advisor and concluded that the investment performance of each of the Fund’s Series was reasonable based on the Fund’s actual performance and comparative performance, especially performance over the current market cycle. |
| | • | | The Board considered the costs of the Advisor’s services and the profits of the Advisor as they relate to the Advisor’s services to the Fund under the Agreement. In reviewing the Advisor’s costs and profits, the Board discussed the Advisor’s revenues generated from the Fund (on both an actual and adjusted basis) and its expenses associated with providing the services under the Agreement. In addition, the Board reviewed the Advisor’s expenses associated with Fund activities outside of the Agreement (such as expense reimbursements pursuant to expense caps and payments made by the Advisor to third party platforms on which shares of the Fund are available for purchase). It was noted by representatives of the Advisor that 11 of the 27 active Series of the Fund are currently experiencing expenses above the capped expense ratios. After discussing the above costs and profits, the Board concluded that the Advisor’s profitability relating to its services provided under the Agreement was reasonable. |
| | • | | The Board considered the fees and expenses of the various Series of the Fund. The Advisor presented the advisory fees and total expenses for each Series, including the advisory fee adjusted for any expense waivers or reimbursements (either contractual or voluntary) paid by the Advisor. The advisory fees and expense ratios of each Series were compared to an average (on both a mean and median basis) of similar funds as disclosed on the Morningstar database. Representatives of the Advisor discussed with the Board the levels of its advisory |
Renewal of Investment Advisory Agreement (unaudited)
| | fee for each Series of the Fund and as compared to the median and mean advisory fees for similar funds as listed on Morningstar. Expense ratios for every Series, except the Pro-Blend’s Class R and Class C, and Target Class R and Class C, are currently below the median and mean for similar funds as listed on Morningstar. Based on their review of the information provided, the Board concluded that the fees and expenses of each Series of the Fund were reasonable on a comparative basis. |
| | • | | The Board also considered the other benefits the Advisor derives from its relationship with the Fund. Such other benefits include certain research products provided by soft dollars. Given the level of soft dollar transactions involving the Fund, the Board concluded that these additional benefits to the Advisor were reasonable. |
| | • | | In addition to the factors described above, the Board considered the Advisor’s personnel, investment strategies, policies and procedures relating to compliance with personal securities transactions, and reputation, expertise and resources in domestic and foreign financial markets. The Board concluded that these factors support the conclusion that the Advisor performs its services in a reasonable manner. |
| | • | | The Board did not consider economies of scale at this time because of the multiple uses of the Fund (for the Advisor’s discretionary investment account clients in addition to direct investors), the current profitability of the Advisor’s services to the Fund under the Agreement, and the overall size of the Fund complex. |
Based on the Board’s deliberations and their evaluation of the information described above, the Board, including a majority of Directors that are not “interested persons” as defined in the Investment Company Act of 1940, concluded that the compensation under the Agreement was fair and reasonable in light of the services and expenses and such other matters as the Directors considered to be relevant in the exercise of their reasonable judgment. Accordingly, the Board approved the renewal of the Agreement. In the course of their deliberations, the Directors did not identify any particular information that was all important or controlling.
Directors’ and Officers’ Information (unaudited)
The Statement of Additional Information provides additional information about the Fund’s directors and officers and can be obtained without charge by calling 1-800-466-3863, at www.manningnapieradvisors.com, or on the EDGAR Database on the SEC Internet web site (http:// www.sec.gov). The following chart shows certain information about the Fund’s officers and directors, including their principal occupations during the last five years. Unless specific dates are provided, the individuals have held the listed positions for longer than five years.
INTERESTED DIRECTOR/OFFICER
| | |
Name: | | B. Reuben Auspitz* |
Address: | | 290 Woodcliff Drive |
| | Fairport, NY 14450 |
Age: | | 63 |
Current Position(s) Held with Fund: | | Principal Executive Officer, President, Chairman & Director |
Term of Office1 & Length of Time Served: | | Indefinite - Director since 1984; Vice President 1984 - 2003; President since 2004; Principal Executive Officer since 2002 |
Principal Occupation(s) During Past 5 Years: | | Executive Vice President; Executive Group Member**; Chief Compliance Officer since 2004; Vice Chairman since June 2010; Co-Executive Director from 2003-2010 - Manning & Napier Advisors, Inc. President; |
| | Director - Manning & Napier Investor Services, Inc. |
| | Holds or has held one or more of the following titles for various subsidiaries and affiliates: President, Vice President, Director, Chairman, Treasurer, Chief Compliance Officer or Member. |
Number of Portfolios Overseen within Fund Complex: | | 29 |
Other Directorships Held Outside Fund Complex: | | N/A |
| | | |
INDEPENDENT DIRECTORS | | |
Name: | | Paul A. Brooke |
Address: | | 290 Woodcliff Drive |
| | Fairport, NY 14450 |
Age: | | 65 |
Current Position(s) Held with Fund: | | Director, Audit Committee Member, Governance & Nominating Committee Member |
Term of Office & Length of Time Served: | | Indefinite - Since 2007 |
Principal Occupation(s) During Past 5 Years: | | Chairman & CEO, Alsius Corp. (investments); Managing Member, PMSV |
| | Holdings LLC (investments) |
Number of Portfolios Overseen within Fund Complex: | | 29 |
Other Directorships Held Outside Fund Complex: | | Incyte Corp. (2000-present) |
| | ViroPharma, Inc. (2000-present) |
| | HLTH Corp. (2000-present) |
| | Cheyne Capital International (2000-present) |
| | MPM Bio-equities (2000-present) |
| | GMP Companies (2000-present) |
| | | HoustonPharma (2000-present) |
| | | |
Name: | | Richard M. Hurwitz |
Address: | | 290 Woodcliff Drive |
| | Fairport, NY 14450 |
Age: | | 47 |
Current Position(s) Held with Fund: | | Director, Audit Committee Member, Governance & |
| | Nominating Committee Member |
Term of Office & Length of Time Served: | | Indefinite - Since 2009 |
Principal Occupation(s) During Past 5 Years: | | Chief Executive Officer, Pictometry International Corp. since August 2010 (provider of georeferenced, aerial image libraries and related software) Managing Partner (2006-July 2010) - Aegis Investment Partners, LLC (investments); Founder and Managing Partner (2004-2005) - Village Markets, LLC (groceries) |
Number of Portfolios Overseen within Fund Complex: | | 29 |
Other Directorships Held Outside Fund Complex: | | Pictometry International Corp. (2000-2010) |
| | Pioneering Technologies (2006-2009) |
| | | Vensearch Capital Corp. (2003-2007) |
Directors’ and Officers’ Information (unaudited)
| | |
INDEPENDENT DIRECTORS (continued) | | |
Name: | | Stephen B. Ashley |
Address: | | 290 Woodcliff Drive |
| | Fairport, NY 14450 |
Age: | | 70 |
Current Position(s) Held with Fund: | | Director, Audit Committee Member, Governance & Nominating Committee Member |
| |
Term of Office & Length of Time Served: | | Indefinite - Since 1996 |
Principal Occupation(s) During Past 5 Years: | | Chairman, Director, President & Chief Executive Officer, The Ashley Group (property management and investment). Chairman (non-executive) 2004-2008; Director 1995-2008 - Fannie Mae (mortgage) |
| |
| |
Number of Portfolios Overseen within Fund Complex: | | 29 |
Other Directorships Held Outside Fund Complex: | | The Ashley Group (1995-2008) Genesee Corporation (1987-2007) |
| | | |
Name: | | Peter L. Faber |
Address: | | 290 Woodcliff Drive |
| | Fairport, NY 14450 |
Age: | | 72 |
Current Position(s) Held with Fund: | | Director, Governance & Nominating Committee Member |
Term of Office & Length of Time Served: | | Indefinite - Since 1987 |
Principal Occupation(s) During Past 5 Years: | | Senior Counsel since 2006, Partner (1995 - 2006) - McDermott, Will & Emery LLP (law firm) |
| |
Number of Portfolios Overseen within Fund Complex: | | 29 |
Other Directorships Held Outside Fund Complex: | | Partnership for New York City, Inc. (non-profit) New York Collegium (non-profit) Boston Early Music Festival (non-profit) |
| | | |
Name: | | Harris H. Rusitzky |
Address: | | 290 Woodcliff Drive |
| | Fairport, NY 14450 |
Age: | | 76 |
Current Position(s) Held with Fund: | | Director, Audit Committee Member, Governance & Nominating Committee Member |
Term of Office & Length of Time Served: | | Indefinite - Since 1985 |
Principal Occupation(s) During Past 5 Years: | | President, The Greening Group (business consultants) since 1994; Partner, The Restaurant Group (restaurants) since 2006 |
Number of Portfolios Overseen within Fund Complex: | | 29 |
Other Directorships Held Outside Fund Complex: | | N/A |
| | | |
OFFICERS | | |
Name: | | Jeffrey S. Coons, Ph.D., CFA |
Address: | | 290 Woodcliff Drive |
| | Fairport, NY 14450 |
Age: | | 47 |
Current Position(s) Held with Fund: | | Vice President |
Term of Office1 & Length of Time Served: | | Since 2004 |
Principal Occupation(s) During Past 5 Years: | | President since 2010, Co-Director of Research since 2002, Executive Group Member** since 2003, - Manning & Napier Advisors, Inc. Holds one or more of the following titles for various subsidiaries and affiliates: President, Director, Treasurer or Senior Trust Officer. |
| |
Number of Portfolios Overseen within Fund Complex: | | 29 |
Other Directorships Held Outside Fund Complex: | | N/A |
| | | |
Directors’ and Officers’ Information (unaudited)
OFFICERS (continued)
| | |
Name: | | Beth Galusha |
Address: | | 290 Woodcliff Drive |
| | Fairport, NY 14450 |
Age: | | 49 |
Current Position(s) Held with Fund: | | Assistant Chief Financial Officer |
Term of Office1 & Length of Time Served: | | Assistant Chief Financial Officer since 2010 |
Principal Occupation(s) During Past 5 Years: | | Chief Financial Officer and Treasurer, Manning & Napier Advisors, Inc. Holds one or more of the following titles for various affiliates: Chief Financial Officer, Director, or Treasurer |
Number of Portfolios Overseen within Fund Complex: | | 29 |
Other Directorships Held Outside Fund Complex: | | N/A |
Name: | | Christine Glavin |
Address: | | 290 Woodcliff Drive |
| | Fairport, NY 14450 |
Age: | | 44 |
Current Position(s) Held with Fund: | | Principal Financial Officer, Chief Financial Officer |
Term of Office1 & Length of Time Served: | | Principal Financial Officer since 2002; Chief Financial Officer since 2001 |
Principal Occupation(s) During Past 5 Years: | | Fund Reporting Manager, Manning & Napier Advisors, Inc. since 1997 |
Number of Portfolios Overseen within Fund Complex: | | 29 |
Other Directorships Held Outside Fund Complex: | | N/A |
Name: | | Jodi L. Hedberg |
Address: | | 290 Woodcliff Drive |
| | Fairport, NY 14450 |
Age: | | 43 |
Current Position(s) Held with Fund: | | Corporate Secretary, Chief Compliance Officer, Anti-Money Laundering Compliance Officer |
Term of Office1 & Length of Time Served: | | Corporate Secretary since 1997; Chief Compliance Officer since 2004 |
Principal Occupation(s) During Past 5 Years: | | Director of Compliance, Manning & Napier Advisors, Inc. and affiliates since 1990 (title change in 2005 from Compliance Manager to Director of Compliance); Corporate Secretary, Manning & Napier Investor Services, Inc. since 2006 |
Number of Portfolios Overseen within Fund Complex: | | 29 |
Other Directorships Held Outside Fund Complex: | | N/A |
Name: | | Richard Yates |
Address: | | 290 Woodcliff Drive |
| | Fairport, NY 14450 |
Age: | | 45 |
Current Position(s) Held with Fund: | | Chief Legal Officer |
Term of Office1 & Length of Time Served: | | Chief Legal Officer since 2004 |
Principal Occupation(s) During Past 5 Years: | | Counsel - Manning & Napier Advisors, Inc. & affiliates since 2000; Holds one or more of the following titles for various affiliates; Director or Corporate Secretary |
Number of Portfolios Overseen within Fund Complex: | | 29 |
Other Directorships Held Outside Fund Complex: | | N/A |
*Interested Director, within the meaning of the Investment Company Act of 1940 by reason of his position with the Fund’s investment advisor and distributor. Mr. Auspitz serves as the Executive Vice President and Director, Manning & Napier Advisors, Inc. and President and Director, Manning & Napier Investor Services, Inc., the Fund’s distributor.
**Prior to June 2010, the Executive Group, consisting of senior executive employee-owners, performed the duties of the Office of the Chief Executive of the Advisor. Effective June 2010, the Executive Group serves as an advisory board to the Chief Executive Officer.
1The term of office for President, Vice President, Chief Financial Officer, Assistant Chief Financial Officer, Chief Legal Officer and Corporate Secretary is one year and until their respective successors are chosen and qualified. All other officers’ terms are indefinite.
Literature Requests (unaudited)
Proxy Voting Policies and Procedures
A description of the policies and procedures that the Fund uses to determine how to vote proxies relating to portfolio securities is available, without charge, upon request:
| | |
By phone | | 1-800-466-3863 |
On the Securities and Exchange
Commission’s (SEC) web site | | http://www.sec.gov |
Proxy Voting Record
Information regarding how the Fund voted proxies relating to portfolio securities during the most recent 12-month period ended June 30th is available, without charge, upon request:
| | |
By phone | | 1-800-466-3863 |
On the SEC’s web site | | http://www.sec.gov |
Quarterly Portfolio Holdings
The Series’ complete schedule of portfolio holdings for the 1st and 3rd quarters of each fiscal year are provided on
Form N-Q, and are available, without charge, upon request:
| | |
By phone | | 1-800-466-3863 |
On the SEC’s web site | | http://www.sec.gov |
The Series’ Form N-Q may be reviewed and copied at the SEC’s Public Reference Room in Washington, D.C. Information on the operation of the Public Reference Room may be obtained by calling 1-800-SEC-0330.
Prospectus and Statement of Additional Information (SAI)
The prospectus and SAI provide additional information about each Series, including charges, expenses and risks. These documents are available, without charge, upon request:
| | |
By phone | | 1-800-466-3863 |
On the SEC’s web site | | http://www.sec.gov |
On the Advisor’s web site | | http://www.manning-napier.com |
Additional information available at www.manning-napier.com
1. Fund Holdings - Month-End
2. Fund Holdings - Quarter-End
3. Shareholder Report - Annual
4. Shareholder Report - Semi-Annual
MNOHTES-12/10-AR
Management Discussion and Analysis (unaudited)
Dear Shareholders:
As well-defined swings in sentiment drove market fluctuations in 2010, the fixed income markets generally had favorable results for the year. Returns were broadly positive throughout the first three quarters of the year. However, while equities finished the year with a strong rally, fixed income markets generally took a negative turn at the end of 2010. After eight consecutive quarters of positive performance, broad fixed income markets suffered losses in the fourth quarter.
While municipal securities posted gains for the year, the sector had the weakest fixed income returns in 2010, as credit concerns and supply and demand changes caused noteworthy losses during the last quarter. The Bank of America Merrill Lynch 1-12 Year Municipal Bond Index earned 3.04% during the year. With a return of 0.41%, the Diversified Tax Exempt Series trailed its benchmark over the last twelve months.
The municipal bond market generally performed well in the first three quarters of the year, a reflection of attractive supply and demand dynamics. During this time, the fundamentals in the tax-exempt marketplace remained strong, with demand rising because of the likelihood of higher taxes in the top tax brackets, and supply for longer-term tax-exempt issues declining because of the popularity of the alternative Build America Bond program. However, amid heightened concern about municipal defaults, the municipal bond market struggled during the fourth quarter.
While credit issues exist in certain areas of the municipal market, the Advisor does not believe the broad municipal credit environment has materially deteriorated. In fact, municipal defaults are rare, and municipalities typically pay their debts in full even if they are forced to restructure. Rather, much of the losses at the end of the year were likely due to supply and demand shifts within the sector. The recent tax compromise, which extended the Bush-era tax cuts for all income brackets, lessened the immediate demand for tax-shielding investments, and supply is expected to increase because of the expiration of the Build America Bond program, which had limited longer-term, tax-exempt supply, thus benefiting the municipal market. Given these factors, municipal yields increased during the fourth quarter. While rising yields equate to price declines, the Advisor believes this yield shift has enhanced the relative value of municipal bonds versus other sectors of the fixed income market.
Throughout 2010, the Series continued to focus on high quality bonds with an emphasis on the underlying credit quality, which provides additional security in the midst of a tough credit and economic environment. Specifically, during the past year the underlying credit quality of the bonds in the Series was rated investment grade or higher, and the types of holdings included general obligation debt, pre-refunded bonds, and revenue debt associated with necessary municipal services. While this higher quality bias leads to slightly lower relative yields than the overall municipal market, the Advisor believes the safety and liquidity of such issues justifies the quality bias.
Over the past year, the Series had a significant exposure to securities in the intermediate to longer-term maturity range as compared to the benchmark, which holds only minimal securities in this range. This intermediate to longer-term weighting was the primary driver of relative underperformance in 2010. While the current positioning helped relative results during several periods last year, particularly when municipal yields fell to historic lows during the third quarter, this positioning noticeably detracted from returns when yields rose during the fourth quarter, causing the Series to lag its benchmark for the year. However, given the slow growth economic environment, the Advisor believes the intermediate to longer-term maturity structure continues to be the most suitable strategy.
As the markets unfold in 2011, it will be important to monitor trends such as state and local budgets, monetary policy, and inflation expectations. With this mindset, Manning & Napier remains committed to our active and selective investment approach to fixed income. Staying focused on the fundamentals and maintaining our selective investment process helped us earn solid returns through the volatile markets of 2010, and we believe these qualities will remain important in the environment ahead.
As always, we appreciate your business.
Sincerely,
Manning & Napier Advisors, Inc.
1
Performance Update as of December 31, 2010 (unaudited)
| | | | | | | | | | | | | | | | |
| | | Average Annual Total Returns
As of December 31, 2010 | |
| | | One
Year | | | Five
Year | | | Ten
Year | | | Since
Inception 1 | |
Manning & Napier Fund, Inc. - Diversified Tax Exempt Series2 | | | 0.41 | % | | | 3.59 | % | | | 4.18 | % | | | 4.49% | |
Bank of America (BofA) Merrill Lynch 1-12 Year Municipal Bond Index3 | | | 3.04 | % | | | 4.71 | % | | | 4.91 | % | | | 5.15% | |
The following graph compares the value of a $10,000 investment in the Manning & Napier Fund, Inc. - Diversified Tax Exempt Series for the ten years ended December 31, 2010 to the BofA Merrill Lynch 1-12 Year Municipal Bond Index.
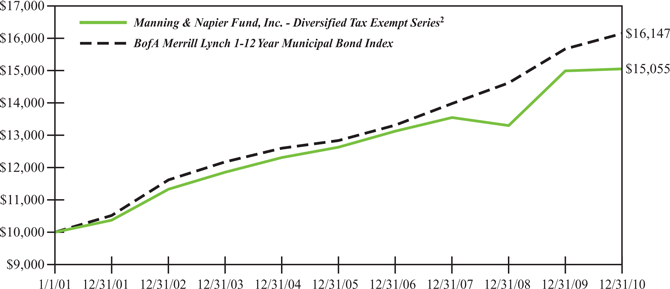
1Performance numbers for the Series and Index are calculated from February 14, 1994, the Series’ inception date.
2The Series’ performance does not reflect the deduction of taxes that a shareholder would pay on fund distributions or the redemption of shares. The Series’ performance is historical and may not be indicative of future results. The performance returns shown are inclusive of the net expense ratio of the Series. For the year ended December 31, 2010, this net expense ratio was 0.58%. The gross expense ratio, which does not account for any voluntary or contractual waivers currently in effect, was 0.58% for the year ended December 31, 2010.
3The BofA Merrill Lynch 1-12 Year Municipal Bond Index (formerly a Merrill Lynch Index) is an unmanaged, market weighted index comprised of investment-grade, fixed rate, coupon bearing municipal bonds with maturities greater than one year but less than twelve years. The Index returns assume reinvestment of coupons and, unlike Series returns, do not reflect any fees or expenses.
2
Shareholder Expense Example (unaudited)
As a shareholder of the Series, you may incur two types of costs: (1) transaction costs and (2) ongoing costs, including management fees and other Series expenses. This example is intended to help you understand your ongoing costs (in dollars) of investing in the Series and to compare these costs with the ongoing costs of investing in other mutual funds.
The example is based on an investment of $1,000 invested at the beginning of the period and held for the entire period (July 1, 2010 to December 31, 2010).
Actual Expenses
The first line of the table below provides information about actual account values and actual expenses. You may use the information in this line, together with the amount you invested, to estimate the expenses that you paid over the period. Simply divide your account value by $1,000 (for example, an $8,600 account value divided by $1,000 = 8.6), then multiply the result by the number in the first line under the heading entitled “Expenses Paid During Period” to estimate the expenses you paid on your account during this period.
Hypothetical Example for Comparison Purposes
The second line of the table below provides information about hypothetical account values and hypothetical expenses based on the Series’ actual expense ratio and an assumed rate of return of 5% per year before expenses, which is not the Series’ actual return. The hypothetical account values and expenses may not be used to estimate the actual ending account balance or expenses you paid during the period. You may use this information to compare the ongoing costs of investing in the Series and other funds. To do so, compare this 5% hypothetical example with the 5% hypothetical examples that appear in the shareholder reports of the other funds.
Please note that the expenses shown in the table are meant to highlight your ongoing costs only and do not reflect any transaction costs. Therefore, the second line of the table is useful in comparing ongoing costs only, and will not help you determine the relative total costs of owning different funds. In addition, if these transaction costs were included, your costs would have been higher.
| | | | | | |
| | | Beginning
Account Value
7/1/10 | | Ending
Account Value
12/31/10 | | Expenses Paid
During Period*
7/1/10-12/31/10 |
Actual | | $1,000.00 | | $ 978.50 | | $2.94 |
Hypothetical
(5% return before expenses) | | $1,000.00 | | $1,022.23 | | $3.01 |
*Expenses are equal to the Series’ annualized expense ratio (for the six-month period) of 0.59%, multiplied by the average account value over the period, multiplied by 184/365 (to reflect the one-half year period). Expenses are based on the most recent fiscal half year; therefore, the expense ratio stated above may differ from the expense ratio stated in the financial highlights, which is based on one-year data. The Series’ total return would have been lower had certain expenses not been waived during the period.
3
Portfolio Composition as of December 31, 2010 (unaudited)
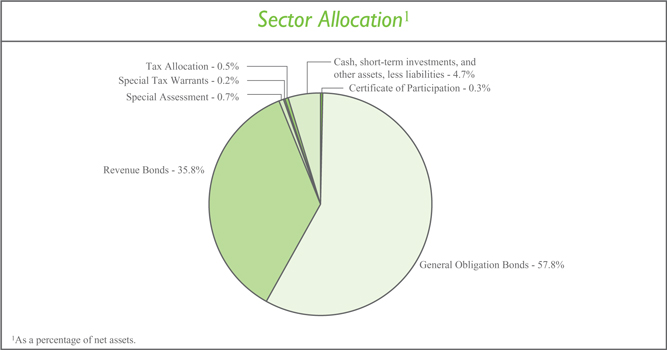
| | | | | | |
| | | Credit Quality Ratings2,3 | | | | |
| | | Aaa | | 19.9% | | |
| | | Aa | | 56.7% | | |
| | | A | | 13.2% | | |
| | | Baa | | 4.5% | | |
| | | Unrated investments | | 1.0% | | |
| | | Cash, short-term investments, and other assets, less liabilities | | 4.7% | | |
| | | | |
| | | 2As a percentage of net assets. 3Based on ratings from Moody’s, or the S&P equivalent. The Series may use different ratings provided by other rating agencies for purposes of determining compliance with the Series’ investment policies. | | | | |
| | | | | | | | |
| | | Top Ten States4 | | | |
| | | Florida | | | 4.9% | | | |
| | | Texas | | | 4.9% | | | |
| | | South Carolina | | | 4.7% | | | |
| | | Washington | | | 4.6% | | | |
| | | New York | | | 4.5% | | | |
| | | Indiana | | | 4.1% | | | |
| | | Massachusetts | | | 3.8% | | | |
| | | Pennsylvania | | | 3.5% | | | |
| | | Virginia | | | 3.4% | | | |
| | | Michigan | | | 3.4% | | | |
| | | | |
| | | 4As a percentage of total investments. | | | | | | |
4
Investment Portfolio - December 31, 2010
| | | | | | | | | | | | | | | | |
| | | Coupon
Rate | | Maturity
Date | | | Credit
Rating1
(unaudited) | | Principal
Amount | | | Value (Note 2) | |
| | | | | |
MUNICIPAL BONDS - 95.3% | | | | | | | | | | | | | | | | |
| | | | | |
ALABAMA - 1.1% | | | | | | | | | | | | | | | | |
| | | | | |
Alabama State, Series C, G.O. Bond | | 3.250% | | | 6/1/2021 | | | Aa1 | | $ | 1,500,000 | | | $ | 1,447,230 | |
Fort Payne Waterworks Board, Revenue Bond, AMBAC | | 3.500% | | | 7/1/2015 | | | WR2 | | | 665,000 | | | | 681,279 | |
Hoover Board of Education, Special Tax Warrants, NATL | | 5.250% | | | 2/15/2017 | | | Aa2 | | | 500,000 | | | | 503,005 | |
Odenville Utilities Board, Water, Revenue Bond, NATL | | 4.300% | | | 8/1/2028 | | | Baa1 | | | 500,000 | | | | 484,375 | |
| | | | | | | | | | | | | | | | |
| | | | | | | | | | | | | | | 3,115,889 | |
| | | | | | | | | | | | | | | | |
| | | | | |
ALASKA - 0.2% | | | | | | | | | | | | | | | | |
| | | | | |
Alaska Municipal Bond Bank Authority, Series 1, Revenue Bond, NATL | | 4.100% | | | 6/1/2017 | | | Aa2 | | | 455,000 | | | | 473,082 | |
| | | | | | | | | | | | | | | | |
| | | | | |
ARIZONA - 2.6% | | | | | | | | | | | | | | | | |
| | | | | |
Goodyear, G.O. Bond, NATL | | 4.375% | | | 7/1/2020 | | | Aa2 | | | 680,000 | | | | 702,134 | |
Mesa, G.O. Bond, FGRNA | | 4.125% | | | 7/1/2027 | | | Aa2 | | | 2,215,000 | | | | 2,056,672 | |
Phoenix, Series B, G.O. Bond | | 4.200% | | | 7/1/2021 | | | Aa1 | | | 1,500,000 | | | | 1,541,160 | |
Salt River Project Agricultural Impt. & Power District, Series A, Revenue Bond | | 5.000% | | | 1/1/2035 | | | Aa1 | | | 1,700,000 | | | | 1,700,000 | |
Yuma County Library District, Series A, G.O. Bond, AMBAC | | 4.500% | | | 7/1/2035 | | | Aa3 | | | 1,200,000 | | | | 1,064,640 | |
| | | | | | | | | | | | | | | | |
| | | | | | | | | | | | | | | 7,064,606 | |
| | | | | | | | | | | | | | | | |
| | | | | |
ARKANSAS - 0.8% | | | | | | | | | | | | | | | | |
| | | | | |
Arkansas State, Water Utility Impt., Series A, G.O. Bond | | 4.500% | | | 7/1/2044 | | | Aa1 | | | 1,000,000 | | | | 932,940 | |
Bentonville School District No. 6, Series A, G.O. Bond | | 4.500% | | | 6/1/2040 | | | Aa2 | | | 1,000,000 | | | | 921,910 | |
Hot Springs, Public Impt., Revenue Bond, AGC. | | 4.625% | | | 12/1/2037 | | | AA3 | | | 500,000 | | | | 476,670 | |
| | | | | | | | | | | | | | | | |
| | | | | | | | | | | | | | | 2,331,520 | |
| | | | | | | | | | | | | | | | |
| | | | | |
CALIFORNIA - 3.0% | | | | | | | | | | | | | | | | |
| | | | | |
California State, G.O. Bond | | 5.250% | | | 2/1/2023 | | | A1 | | | 500,000 | | | | 512,950 | |
California State, G.O. Bond | | 4.750% | | | 12/1/2028 | | | A1 | | | 795,000 | | | | 722,504 | |
California State, Various Purposes Impt., G.O. Bond, AMBAC | | 4.250% | | | 12/1/2035 | | | A1 | | | 1,140,000 | | | | 894,889 | |
Campbell Union School District, G.O. Bond, AGM | | 4.375% | | | 8/1/2027 | | | Aa2 | | | 1,810,000 | | | | 1,668,060 | |
| | |
| The accompanying notes are an integral part of the financial statements. | | 5 |
Investment Portfolio - December 31, 2010
| | | | | | | | | | | | | | | | | | | | |
| | | Coupon
Rate | | | Maturity
Date | | | Credit
Rating 1
(unaudited) | | | Principal
Amount | | | Value (Note 2) | |
| | | | | |
MUNICIPAL BONDS (continued) | | | | | | | | | | | | | | | | | | | | |
| | | | | |
CALIFORNIA (continued) | | | | | | | | | | | | | | | | | | | | |
| | | | | |
Chula Vista Elementary School District, Series F, G.O. Bond, NATL | | | 4.800% | | | | 8/1/2024 | | | | Baa1 | | | $ | 435,000 | | | $ | 434,382 | |
Chula Vista Elementary School District, Series F, G.O. Bond, NATL | | | 4.875% | | | | 8/1/2025 | | | | Baa1 | | | | 425,000 | | | | 422,573 | |
Los Angeles Unified School District, Series B, G.O. Bond, AMBAC | | | 4.500% | | | | 7/1/2027 | | | | Aa2 | | | | 840,000 | | | | 760,679 | |
Oak Valley Hospital District, G.O. Bond, FGRNA | | | 4.500% | | | | 7/1/2025 | | | | A1 | | | | 1,395,000 | | | | 1,251,692 | |
Richmond Joint Powers Financing Authority, Series A, Tax Allocation, NATL | | | 5.250% | | | | 9/1/2025 | | | | Baa1 | | | | 1,570,000 | | | | 1,515,395 | |
| | | | | | | | | | | | | | | | | | | | |
| | | | | | | | | | | | | | | | | | | 8,183,124 | |
| | | | | | | | | | | | | | | | | | | | |
| | | | | |
COLORADO - 0.8% | | | | | | | | | | | | | | | | | | | | |
| | | | | |
Colorado Water Resources & Power Development Authority, Water Resource, Series D, Revenue Bond, AGM | | | 4.375% | | | | 8/1/2035 | | | | Aa2 | | | | 1,420,000 | | | | 1,269,295 | |
Commerce City, Certificate of Participation, AMBAC | | | 4.750% | | | | 12/15/2032 | | | | A3 | | | | 1,000,000 | | | | 884,460 | |
| | | | | | | | | | | | | | | | | | | | |
| | | | | | | | | | | | | | | | | | | 2,153,755 | |
| | | | | | | | | | | | | | | | | | | | |
| | | | | |
CONNECTICUT - 0.6% | | | | | | | | | | | | | | | | | | | | |
| | | | | |
Stamford, G.O. Bond | | | 4.400% | | | | 2/15/2026 | | | | Aa1 | | | | 1,545,000 | | | | 1,553,698 | |
| | | | | | | | | | | | | | | | | | | | |
| | | | | |
DELAWARE - 1.0% | | | | | | | | | | | | | | | | | | | | |
| | | | | |
New Castle County, Series A, G.O. Bond | | | 4.250% | | | | 7/15/2025 | | | | Aaa | | | | 1,500,000 | | | | 1,515,405 | |
New Castle County, Series A, G.O. Bond | | | 4.250% | | | | 7/15/2026 | | | | Aaa | | | | 1,265,000 | | | | 1,271,730 | |
| | | | | | | | | | | | | | | | | | | | |
| | | | | | | | | | | | | | | | | | | 2,787,135 | |
| | | | | | | | | | | | | | | | | | | | |
| | | | | |
DISTRICT OF COLUMBIA - 0.8% | | | | | | | | | | | | | | | | | | | | |
| | | | | |
District of Columbia, Series A, G.O. Bond, FGRNA | | | 4.750% | | | | 6/1/2033 | | | | Aa2 | | | | 2,500,000 | | | | 2,345,700 | |
| | | | | | | | | | | | | | | | | | | | |
| | | | | |
FLORIDA - 4.8% | | | | | | | | | | | | | | | | | | | | |
| | | | | |
Cape Coral, Water Utility Impt., Special Assessment, NATL | | | 4.500% | | | | 7/1/2021 | | | | A2 | | | | 1,845,000 | | | | 1,820,701 | |
Florida State Board of Education, Capital Outlay, Public Education, Series A, G.O. Bond, AGM | | | 4.500% | | | | 6/1/2025 | | | | Aa1 | | | | 1,280,000 | | | | 1,285,555 | |
| | |
| 6 | | The accompanying notes are an integral part of the financial statements. |
Investment Portfolio - December 31, 2010
| | | | | | | | | | | | | | | | |
| | | Coupon
Rate | | Maturity
Date | | | Credit
Rating1
(unaudited) | | Principal
Amount | | | Value (Note 2) | |
| | | | | |
MUNICIPAL BONDS (continued) | | | | | | | | | | | | | | | | |
| | | | | |
FLORIDA (continued) | | | | | | | | | | | | | | | | |
| | | | | |
Florida State Board of Education, Capital Outlay, Public Education, Series D, G.O. Bond | | 5.000% | | | 6/1/2016 | | | Aa1 | | $ | 2,000,000 | | | $ | 2,257,380 | |
Florida State Department of Transportation, G.O. Bond | | 5.000% | | | 7/1/2027 | | | Aa1 | | | 1,000,000 | | | | 1,006,300 | |
Fort Lauderdale, Water Utility Impt., Revenue Bond | | 4.500% | | | 9/1/2038 | | | Aa1 | | | 1,000,000 | | | | 892,470 | |
Miami-Dade County, Water & Sewer Systems, Revenue Bond, AGM | | 5.000% | | | 10/1/2039 | | | Aa2 | | | 1,500,000 | | | | 1,455,375 | |
Palm Beach County, FPL Reclaimed Water Project, Revenue Bond | | 5.000% | | | 10/1/2040 | | | Aaa | | | 1,020,000 | | | | 1,015,226 | |
Panama City Beach, Water Utility Impt., Revenue Bond, AGC | | 5.000% | | | 6/1/2039 | | | AA3 | | | 1,000,000 | | | | 954,740 | |
Tampa Bay Water Utility System, Revenue Bond | | 5.000% | | | 10/1/2038 | | | Aa2 | | | 1,000,000 | | | | 985,160 | |
Tohopekaliga Water Authority, Utility System, Series A, Revenue Bond, AGM | | 5.000% | | | 10/1/2028 | | | Aa2 | | | 510,000 | | | | 513,606 | |
Winter Park, Electric Impt., Series A, Revenue Bond, AGM | | 5.000% | | | 10/1/2029 | | | Aa3 | | | 1,000,000 | | | | 1,001,330 | |
Winter Park, Impt., Revenue Bond | | 5.000% | | | 12/1/2034 | | | Aa2 | | | 250,000 | | | | 243,857 | |
| | | | | | | | | | | | | | | | |
| | | | | | | | | | | | | | | 13,431,700 | |
| | | | | | | | | | | | | | | | |
| | | | | |
GEORGIA - 3.1% | | | | | | | | | | | | | | | | |
| | | | | |
Atlanta, Prerefunded Balance, G.O. Bond | | 5.600% | | | 12/1/2018 | | | Aa2 | | | 350,000 | | | | 354,900 | |
Atlanta, Water & Wastewater, Revenue Bond, AGM | | 5.000% | | | 11/1/2043 | | | Aa3 | | | 1,500,000 | | | | 1,399,395 | |
Atlanta, Water & Wastewater, Series A, Revenue Bond, NATL | | 5.000% | | | 11/1/2033 | | | A1 | | | 310,000 | | | | 294,205 | |
Coweta County Water & Sewage Authority, Series A, Revenue Bond, AGM | | 4.250% | | | 6/1/2040 | | | Aa3 | | | 1,500,000 | | | | 1,290,465 | |
Dekalb County, Special Transportation Parks & Greenspace, G.O. Bond | | 4.375% | | | 12/1/2030 | | | Aa3 | | | 1,000,000 | | | | 970,820 | |
Dekalb County, Water & Sewer, Series A, Revenue Bond | | 5.000% | | | 10/1/2035 | | | Aa1 | | | 1,000,000 | | | | 995,700 | |
Fulton County, Water Utility Impt., Revenue Bond, FGRNA | | 5.000% | | | 1/1/2035 | | | Aa2 | | | 1,000,000 | | | | 983,530 | |
Georgia State, Prerefunded Balance, Series B, G.O. Bond | | 5.650% | | | 3/1/2012 | | | Aaa | | | 5,000 | | | | 5,298 | |
Georgia State, Series B, G.O. Bond | | 4.000% | | | 3/1/2022 | | | Aaa | | | 1,270,000 | | | | 1,289,596 | |
Georgia State, Unrefunded Balance, Series B, G.O. Bond | | 5.650% | | | 3/1/2012 | | | Aaa | | | 195,000 | | | | 206,747 | |
| | |
| The accompanying notes are an integral part of the financial statements. | | 7 |
Investment Portfolio - December 31, 2010
| | | | | | | | | | | | | | | | | | | | |
| | | Coupon
Rate | | | Maturity
Date | | | Credit
Rating 1
(unaudited) | | | Principal
Amount | | | Value (Note 2) | |
| | | | | |
MUNICIPAL BONDS (continued) | | | | | | | | | | | | | | | | | | | | |
| | | | | |
GEORGIA (continued) | | | | | | | | | | | | | | | | | | | | |
| | | | | |
Madison, Water & Sewer, Revenue Bond, AMBAC | | | 4.625% | | | | 7/1/2030 | | | | WR2 | | | $ | 1,000,000 | | | $ | 883,030 | |
| | | | | | | | | | | | | | | | | | | | |
| | | | | | | | | | | | | | | | | | | 8,673,686 | |
| | | | | | | | | | | | | | | | | | | | |
| | | | | |
HAWAII - 0.3% | | | | | | | | | | | | | | | | | | | | |
| | | | | |
Honolulu County, Public Impt., Series B, G.O. Bond | | | 4.750% | | | | 12/1/2035 | | | | Aa1 | | | | 1,000,000 | | | | 957,700 | |
| | | | | | | | | | | | | | | | | | | | |
| | | | | |
ILLINOIS - 2.3% | | | | | | | | | | | | | | | | | | | | |
| | | | | |
Chicago, Series A, G.O. Bond, AGM | | | 4.750% | | | | 1/1/2038 | | | | Aa3 | | | | 1,500,000 | | | | 1,304,820 | |
Chicago, Unrefunded Balance, Series A, G.O. Bond, NATL | | | 5.000% | | | | 1/1/2034 | | | | Aa3 | | | | 520,000 | | | | 461,505 | |
Illinois State, G.O. Bond | | | 5.000% | | | | 12/1/2027 | | | | A1 | | | | 600,000 | | | | 542,076 | |
Illinois State, G.O. Bond, NATL | | | 5.250% | | | | 10/1/2018 | | | | A1 | | | | 2,000,000 | | | | 2,007,020 | |
Springfield Metropolitan Sanitation District, Series A, G.O. Bond | | | 4.750% | | | | 1/1/2034 | | | | AA3 | | | | 1,115,000 | | | | 1,045,301 | |
Springfield, Electric Power & Light, Revenue Bond, NATL | | | 5.000% | | | | 3/1/2035 | | | | A1 | | | | 1,000,000 | | | | 959,310 | |
| | | | | | | | | | | | | | | | | | | | |
| | | | | | | | | | | | | | | | | | | 6,320,032 | |
| | | | | | | | | | | | | | | | | | | | |
| | | | | |
INDIANA - 4.0% | | | | | | | | | | | | | | | | | | | | |
| | | | | |
Avon Community School Building Corp., Revenue Bond, AMBAC | | | 4.250% | | | | 7/15/2018 | | | | A3 | | | | 1,450,000 | | | | 1,519,702 | |
Avon Community School Building Corp., Revenue Bond, AMBAC | | | 4.750% | | | | 1/15/2032 | | | | A3 | | | | 1,015,000 | | | | 923,122 | |
Frankfort High School Elementary School Building Corp., Revenue Bond, AGM | | | 4.750% | | | | 7/15/2025 | | | | Aa3 | | | | 1,500,000 | | | | 1,517,445 | |
Indiana Municipal Power Agency, Series A, Revenue Bond, NATL | | | 5.000% | | | | 1/1/2042 | | | | A1 | | | | 1,000,000 | | | | 921,830 | |
Indianapolis Local Public Impt. Bond Bank, Waterworks Project, Series A, Revenue Bond, AGC | | | 5.500% | | | | 1/1/2038 | | | | Aa3 | | | | 1,000,000 | | | | 1,032,640 | |
La Porte County, G.O. Bond, FGRNA | | | 5.200% | | | | 1/15/2018 | | | | A1 | | | | 300,000 | | | | 306,561 | |
Noblesville, Sewage Works, Revenue Bond, AMBAC | | | 5.000% | | | | 1/1/2024 | | | | Aa2 | | | | 550,000 | | | | 550,253 | |
North Lawrence Community Schools Building Corp., Revenue Bond, AGM | | | 5.000% | | | | 7/15/2020 | | | | Aa3 | | | | 450,000 | | | | 469,242 | |
Plainfield, Series A, Revenue Bond | | | 4.650% | | | | 1/1/2027 | | | | A3 | | | | 645,000 | | | | 623,096 | |
| | |
| 8 | | The accompanying notes are an integral part of the financial statements. |
Investment Portfolio - December 31, 2010
| | | | | | | | | | | | | | | | | | |
| | | Coupon
Rate | | | Maturity
Date | | | Credit
Rating1
(unaudited) | | Principal
Amount | | | Value (Note 2) | |
| | | | | |
MUNICIPAL BONDS (continued) | | | | | | | | | | | | | | | | | | |
| | | | | |
INDIANA (continued) | | | | | | | | | | | | | | | | | | |
| | | | | |
Shelbyville Central Renovation School Building Corp., Revenue Bond, NATL | | | 5.000% | | | | 7/15/2018 | | | Baa1 | | $ | 3,000,000 | | | $ | 3,265,020 | |
| | | | | | | | | | | | | | | | | | |
| | | | | | | | | | | | | | | | | 11,128,911 | |
| | | | | | | | | | | | | | | | | | |
| | | | | |
IOWA - 2.1% | | | | | | | | | | | | | | | | | | |
| | | | | |
Cedar Rapids, Public Impt., Series A, G.O. Bond | | | 4.000% | | | | 6/1/2030 | | | Aaa | | | 440,000 | | | | 387,715 | |
Dubuque Iowa, Series D, Revenue Bond | | | 4.000% | | | | 6/1/2030 | | | Aa2 | | | 470,000 | | | | 406,216 | |
Indianola Community School District, G.O. Bond, FGRNA | | | 5.200% | | | | 6/1/2021 | | | A1 | | | 425,000 | | | | 440,555 | |
Iowa City Community School District, G.O. Bond, AGM | | | 4.000% | | | | 6/1/2018 | | | Aaa | | | 425,000 | | | | 435,918 | |
Linn-Mar Community School District, Revenue Bond | | | 4.625% | | | | 7/1/2029 | | | A2 | | | 1,000,000 | | | | 958,580 | |
Polk County, Series C, G.O. Bond | | | 4.000% | | | | 6/1/2017 | | | Aaa | | | 995,000 | | | | 1,053,018 | |
Polk County, Series C, G.O. Bond | | | 4.125% | | | | 6/1/2025 | | | Aaa | | | 2,075,000 | | | | 2,076,577 | |
| | | | | | | | | | | | | | | | | | |
| | | | | | | | | | | | | | | | | 5,758,579 | |
| | | | | | | | | | | | | | | | | | |
| | | | | |
KANSAS - 3.0% | | | | | | | | | | | | | | | | | | |
| | | | | |
Johnson & Miami Counties Unified School District No. 230, G.O. Bond, FGRNA | | | 4.000% | | | | 9/1/2022 | | | Aa3 | | | 1,000,000 | | | | 976,510 | |
Johnson County Water District No. 1, Revenue Bond | | | 3.250% | | | | 12/1/2030 | | | Aaa | | | 1,000,000 | | | | 793,820 | |
Miami County Unified School District No. 416 Louisburg, G.O Bond, NATL | | | 5.000% | | | | 9/1/2018 | | | Baa1 | | | 2,000,000 | | | | 2,173,900 | |
Scott County, G.O. Bond | | | 4.750% | | | | 4/1/2040 | | | A3 | | | 1,000,000 | | | | 967,690 | |
Sedgwick County Unified School District No. 265, G.O. Bond, AGM | | | 5.000% | | | | 10/1/2025 | | | Aa3 | | | 1,090,000 | | | | 1,102,306 | |
Seward County, G.O. Bond, AGM | | | 5.000% | | | | 8/1/2040 | | | Aa3 | | | 1,000,000 | | | | 1,012,110 | |
Shawnee County Unified School District No. 450, Shawnee Heights, G.O. Bond, AGM | | | 4.200% | | | | 9/1/2020 | | | Aa3 | | | 700,000 | | | | 715,750 | |
Shawnee County Unified School District No. 450, Shawnee Heights, G.O. Bond, AGM | | | 4.250% | | | | 9/1/2021 | | | Aa3 | | | 580,000 | | | | 589,054 | |
| | | | | | | | | | | | | | | | | | |
| | | | | | | | | | | | | | | | | 8,331,140 | |
| | | | | | | | | | | | | | | | | | |
| | | | | |
KENTUCKY - 1.3% | | | | | | | | | | | | | | | | | | |
| | | | | |
Lexington-Fayette Urban County Government Public Facilities Corp., Revenue Bond, NATL | | | 4.000% | | | | 10/1/2018 | | | Aa2 | | | 1,655,000 | | | | 1,722,640 | |
Lexington-Fayette Urban County Government, Series A, Revenue Bond | | | 3.625% | | | | 7/1/2020 | | | Aa2 | | | 1,000,000 | | | | 1,016,920 | |
| | |
| The accompanying notes are an integral part of the financial statements. | | 9 |
Investment Portfolio - December 31, 2010
| | | | | | | | | | | | | | | | | | |
| | | Coupon
Rate | | | Maturity
Date | | | Credit
Rating1
(unaudited) | | Principal
Amount | | | Value (Note 2) | |
| | | | | |
MUNICIPAL BONDS (continued) | | | | | | | | | | | | | | | | | | |
| | | | | |
KENTUCKY (continued) | | | | | | | | | | | | | | | | | | |
| | | | | |
Louisville & Jefferson County Metropolitan Sewer District, Series A, Revenue Bond, AGC | | | 4.250% | | | | 5/15/2038 | | | Aa3 | | $ | 1,000,000 | | | $ | 873,940 | |
| | | | | | | | | | | | | | | | | | |
| | | | | | | | | | | | | | | | | 3,613,500 | |
| | | | | | | | | | | | | | | | | | |
| | | | | |
LOUISIANA - 0.7% | | | | | | | | | | | | | | | | | | |
| | | | | |
Caddo Parish Parishwide School District, G.O. Bond, NATL | �� | | 4.350% | | | | 3/1/2026 | | | Aa2 | | | 660,000 | | | | 654,898 | |
Caddo Parish Parishwide School District, G.O. Bond, NATL | | | 4.375% | | | | 3/1/2027 | | | Aa2 | | | 1,090,000 | | | | 1,073,792 | |
New Orleans, Sewage Service, Revenue Bond, FGIC | | | 5.250% | | | | 6/1/2012 | | | A3 | | | 300,000 | | | | 300,678 | |
| | | | | | | | | | | | | | | | | | |
| | | | | | | | | | | | | | | | | 2,029,368 | |
| | | | | | | | | | | | | | | | | | |
| | | | | |
MAINE - 0.3% | | | | | | | | | | | | | | | | | | |
| | | | | |
Maine Municipal Bond Bank, Series D, Revenue Bond | | | 4.000% | | | | 11/1/2033 | | | AAA3 | | | 1,000,000 | | | | 850,160 | |
| | | | | | | | | | | | | | | | | | |
| | | | | |
MARYLAND - 1.4% | | | | | | | | | | | | | | | | | | |
| | | | | |
Anne Arundel County, Water & Sewer, G.O. Bond | | | 4.125% | | | | 3/1/2024 | | | Aa1 | | | 345,000 | | | | 348,826 | |
Anne Arundel County, Water & Sewer, G.O. Bond | | | 4.200% | | | | 3/1/2025 | | | Aa1 | | | 1,770,000 | | | | 1,784,815 | |
Baltimore County, Metropolitan District, G.O. Bond | | | 4.250% | | | | 9/1/2029 | | | Aaa | | | 1,000,000 | | | | 972,290 | |
Maryland State, State and Local Facilities, G.O. Bond | | | 4.250% | | | | 8/1/2021 | | | Aaa | | | 750,000 | | | | 785,963 | |
| | | | | | | | | | | | | | | | | | |
| | | | | | | | | | | | | | | | | 3,891,894 | |
| | | | | | | | | | | | | | | | | | |
| | | | | |
MASSACHUSETTS - 3.7% | | | | | | | | | | | | | | | | | | |
| | | | | |
Beverly, Municipal Purpose Loan, G.O. Bond | | | 4.500% | | | | 1/15/2035 | | | AA3 | | | 695,000 | | | | 647,608 | |
Boston Water & Sewer Commission, Series A, Revenue Bond | | | 5.000% | | | | 11/1/2031 | | | Aa1 | | | 1,000,000 | | | | 1,034,580 | |
Boston, Series A, G.O. Bond, NATL | | | 4.125% | | | | 1/1/2021 | | | Aaa | | | 1,000,000 | | | | 1,022,230 | |
Boston, Series A, G.O. Bond, NATL | | | 4.125% | | | | 1/1/2022 | | | Aaa | | | 410,000 | | | | 416,654 | |
Cambridge, Series A, G.O. Bond | | | 4.000% | | | | 2/1/2026 | | | Aaa | | | 850,000 | | | | 836,629 | |
Cambridge, Series A, G.O. Bond | | | 4.000% | | | | 2/1/2027 | | | Aaa | | | 850,000 | | | | 825,401 | |
Commonwealth of Massachusetts, Series A, G.O. Bond | | | 4.750% | | | | 8/1/2038 | | | Aa1 | | | 500,000 | | | | 479,935 | |
| | |
| 10 | | The accompanying notes are an integral part of the financial statements. |
Investment Portfolio - December 31, 2010
| | | | | | | | | | | | | | | | | | | | |
| | | Coupon Rate | | | Maturity Date | | | Credit Rating1 (unaudited) | | | Principal Amount | | | Value (Note 2) | |
| | | | | |
MUNICIPAL BONDS (continued) | | | | | | | | | | | | | | | | | | | | |
| | | | | |
MASSACHUSETTS (continued) | | | | | | | | | | | | | | | | | | | | |
| | | | | |
Commonwealth of Massachusetts, Series C, G.O. Bond, AMBAC | | | 5.500% | | | | 12/1/2023 | | | | Aa1 | | | $ | 1,000,000 | | | $ | 1,153,740 | |
Commonwealth of Massachusetts, Series D, G.O. Bond | | | 5.250% | | | | 10/1/2014 | | | | Aa1 | | | | 1,000,000 | | | | 1,133,870 | |
Lowell, State Qualified, G.O. Bond, AMBAC | | | 5.000% | | | | 2/1/2020 | | | | Aa2 | | | | 500,000 | | | | 528,740 | |
Massachusetts Water Resources Authority, Series A, Revenue Bond, AGM | | | 4.375% | | | | 8/1/2032 | | | | Aa1 | | | | 2,000,000 | | | | 1,826,160 | |
Richmond, G.O. Bond, NATL | | | 5.000% | | | | 4/15/2021 | | | | Aa2 | | | | 400,000 | | | | 404,996 | |
| | | | | | | | | | | | | | | | | | | | |
| | | | | | | | | | | | | | | | | | | 10,310,543 | |
| | | | | | | | | | | | | | | | | | | | |
| | | | | |
MICHIGAN - 3.3% | | | | | | | | | | | | | | | | | | | | |
| | | | | |
Bendle Public School District, G.O. Bond, FGRNA | | | 4.500% | | | | 5/1/2028 | | | | Aa2 | | | | 640,000 | | | | 581,216 | |
Detroit City School District, Series B, G.O. Bond, FGIC | | | 5.000% | | | | 5/1/2033 | | | | Aa2 | | | | 750,000 | | | | 658,320 | |
Detroit Sewer Disposal System, Series B, Revenue Bond, FGRNA | | | 4.625% | | | | 7/1/2034 | | | | A2 | | | | 1,500,000 | | | | 1,265,235 | |
Detroit Water Supply System, Revenue Bond, NATL | | | 5.250% | | | | 7/1/2023 | | | | A1 | | | | 2,000,000 | | | | 2,022,820 | |
Grand Rapids Public Schools, G.O. Bond, NATL | | | 4.125% | | | | 5/1/2023 | | | | Aa3 | | | | 1,200,000 | | | | 1,169,016 | |
Muskegon Public Schools, G.O. Bond, AGM | | | 5.000% | | | | 5/1/2020 | | | | Aa2 | | | | 1,000,000 | | | | 1,034,850 | |
Saginaw City School District, G.O. Bond, AGM | | | 4.500% | | | | 5/1/2031 | | | | Aa2 | | | | 1,695,000 | | | | 1,502,245 | |
Warren Woods Public Schools, School Building & Site, G.O. Bond, AGM | | | 4.500% | | | | 5/1/2026 | | | | Aa2 | | | | 1,015,000 | | | | 952,750 | |
| | | | | | | | | | | | | | | | | | | | |
| | | | | | | | | | | | | | | | | | | 9,186,452 | |
| | | | | | | | | | | | | | | | | | | | |
| | | | | |
MINNESOTA - 2.0% | | | | | | | | | | | | | | | | | | | | |
| | | | | |
Brooklyn Center Independent School District No. 286, Series A, G.O. Bond, NATL | | | 4.375% | | | | 2/1/2026 | | | | Aa2 | | | | 1,105,000 | | | | 1,095,928 | |
Hennepin County, Series A, G.O. Bond | | | 4.500% | | | | 12/1/2025 | | | | Aaa | | | | 1,500,000 | | | | 1,531,800 | |
Minnesota State, G.O. Bond | | | 5.000% | | | | 8/1/2013 | | | | Aa1 | | | | 2,000,000 | | | | 2,200,100 | |
Pine County, Series A, G.O. Bond, FGRNA | | | 4.400% | | | | 2/1/2028 | | | | AAA3 | | | | 555,000 | | | | 539,643 | |
Western Minnesota Municipal Power Agency, Revenue Bond | | | 6.625% | | | | 1/1/2016 | | | | Aaa | | | | 175,000 | | | | 198,201 | |
| | | | | | | | | | | | | | | | | | | | |
| | | | | | | | | | | | | | | | | | | 5,565,672 | |
| | | | | | | | | | | | | | | | | | | | |
| | | | | |
MISSISSIPPI - 0.2% | | | | | | | | | | | | | | | | | | | | |
| | | | | |
Biloxi Public School District, Prerefunded Balance, Revenue Bond, NATL | | | 5.000% | | | | 4/1/2017 | | | | A1 | | | | 500,000 | | | | 505,740 | |
| | | | | | | | | | | | | | | | | | | | |
| | |
| The accompanying notes are an integral part of the financial statements. | | 11 |
Investment Portfolio - December 31, 2010
| | | | | | | | | | | | | | | | |
| | | Coupon Rate | | Maturity Date | | | Credit Rating1 (unaudited) | | Principal Amount | | | Value (Note 2) | |
| | | | | |
MUNICIPAL BONDS (continued) | | | | | | | | | | | | | | | | |
| | | | | |
MISSOURI - 1.7% | | | | | | | | | | | | | | | | |
| | | | | |
Columbia, Water & Electric, Series A, Revenue Bond | | 4.125% | | | 10/1/2033 | | | AA3 | | $ | 995,000 | | | $ | 928,703 | |
Missouri State, Water Pollution Control, Series A, G.O. Bond | | 4.500% | | | 12/1/2030 | | | Aaa | | | 2,375,000 | | | | 2,745,429 | |
Springfield, Electric Light & Power Impt., Revenue Bond, FGRNA | | 4.750% | | | 8/1/2031 | | | Aa3 | | | 1,015,000 | | | | 981,302 | |
| | | | | | | | | | | | | | | | |
| | | | | | | | | | | | | | | 4,655,434 | |
| | | | | | | | | | | | | | | | |
| | | | | |
NEBRASKA - 1.8% | | | | | | | | | | | | | | | | |
| | | | | |
Nebraska Public Power District, Series C, Revenue Bond | | 5.000% | | | 1/1/2026 | | | A1 | | | 840,000 | | | | 859,925 | |
Omaha Metropolitan Utilities District, Series A, Revenue Bond, AGM | | 4.375% | | | 12/1/2031 | | | A1 | | | 2,640,000 | | | | 2,375,393 | |
Omaha Public Power District, Series AA, Revenue Bonds, FGRNA | | 4.500% | | | 2/1/2034 | | | Aa2 | | | 1,950,000 | | | | 1,765,257 | |
| | | | | | | | | | | | | | | | |
| | | | | | | | | | | | | | | 5,000,575 | |
| | | | | | | | | | | | | | | | |
| | | | | |
NEVADA - 3.0% | | | | | | | | | | | | | | | | |
| | | | | |
Clark County, G.O. Bond, AGM | | 4.750% | | | 6/1/2027 | | | Aa1 | | | 3,000,000 | | | | 2,986,350 | |
Las Vegas Valley Water District, Water Impt., Series A, G.O. Bond, AGM | | 4.750% | | | 6/1/2033 | | | Aa1 | | | 1,500,000 | | | | 1,403,655 | |
Nevada State, Capital Impt., G.O. Bond | | 5.000% | | | 6/1/2019 | | | Aa1 | | | 2,040,000 | | | | 2,233,147 | |
Nevada State, Project Nos. 66 & 67, Unrefunded Balance, Series A, G.O. Bond, FGRNA | | 5.000% | | | 5/15/2028 | | | Aa1 | | | 125,000 | | | | 125,010 | |
North Las Vegas, G.O. Bond, NATL | | 5.000% | | | 5/1/2024 | | | Aa2 | | | 1,500,000 | | | | 1,515,975 | |
| | | | | | | | | | | | | | | | |
| | | | | | | | | | | | | | | 8,264,137 | |
| | | | | | | | | | | | | | | | |
| | | | | |
NEW HAMPSHIRE - 0.6% | | | | | | | | | | | | | | | | |
| | | | | |
Manchester, Series F, G.O. Bond | | 3.750% | | | 12/1/2025 | | | Aa1 | | | 1,005,000 | | | | 954,147 | |
New Hampshire Municipal Bond Bank, Series D, Revenue Bond | | 4.625% | | | 7/15/2039 | | | Aa3 | | | 835,000 | | | | 821,331 | |
| | | | | | | | | | | | | | | | |
| | | | | | | | | | | | | | | 1,775,478 | |
| | | | | | | | | | | | | | | | |
| | | | | |
NEW JERSEY - 1.5% | | | | | | | | | | | | | | | | |
| | | | | |
East Brunswick Township Board of Education, G.O. Bond, AGM | | 4.500% | | | 11/1/2028 | | | Aa2 | | | 835,000 | | | | 828,879 | |
East Brunswick Township Board of Education, G.O. Bond, AGM | | 4.500% | | | 11/1/2029 | | | Aa2 | | | 1,000,000 | | | | 981,260 | |
| | |
| 12 | | The accompanying notes are an integral part of the financial statements. |
Investment Portfolio - December 31, 2010
| | | | | | | | | | | | | | | | |
| | | Coupon
Rate | | Maturity
Date | | | Credit
Rating1
(unaudited) | | Principal Amount | | | Value (Note 2) | |
| | | | | |
MUNICIPAL BONDS (continued) | | | | | | | | | | | | | | | | |
| | | | | |
NEW JERSEY (continued) | | | | | | | | | | | | | | | | |
| | | | | |
Hudson County, G.O. Bond, CIFG | | 4.250% | | | 9/1/2021 | | | Aa3 | | $ | 930,000 | | | $ | 954,794 | |
Morris County Impt. Authority, School District, Morris Hills Regional District, Revenue Bond | | 3.700% | | | 10/1/2018 | | | Aaa | | | 540,000 | | | | 559,121 | |
Sparta Township Board of Education, G.O. Bond, AGM | | 4.300% | | | 2/15/2030 | | | Aa2 | | | 1,000,000 | | | | 916,020 | |
| | | | | | | | | | | | | | | | |
| | | | | | | | | | | | | | | 4,240,074 | |
| | | | | | | | | | | | | | | | |
| | | | | |
NEW MEXICO - 0.3% | | | | | | | | | | | | | | | | |
| | | | | |
New Mexico Finance Authority, Public Project Revolving Fund, Series A-1, Revenue Bond, NATL | | 3.250% | | | 6/1/2013 | | | Aa1 | | | 690,000 | | | | 725,501 | |
| | | | | | | | | | | | | | | | |
| | | | | |
NEW YORK - 4.4% | | | | | | | | | | | | | | | | |
| | | | | |
Hampton Bays Union Free School District, G.O. Bond, AGM | | 4.375% | | | 9/15/2029 | | | Aa3 | | | 2,225,000 | | | | 2,173,447 | |
New York City Municipal Water Finance Authority, Water & Sewer Systems, Series A, Revenue Bond | | 5.750% | | | 6/15/2040 | | | Aa1 | | | 2,590,000 | | | | 2,752,626 | |
New York City Municipal Water Finance Authority, Water & Sewer Systems, Series E, Revenue Bond, FGRNA | | 5.000% | | | 6/15/2026 | | | Aa1 | | | 750,000 | | | | 758,835 | |
New York State Dormitory Authority, University of Rochester, Series E, Revenue Bond | | 4.000% | | | 7/1/2022 | | | Aa3 | | | 930,000 | | | | 924,494 | |
New York State Power Authority, Series A, Revenue Bond, NATL | | 4.500% | | | 11/15/2047 | | | Aa2 | | | 1,000,000 | | | | 909,430 | |
New York State Urban Development Corp., Series B, Revenue Bond, NATL | | 5.000% | | | 1/1/2019 | | | WR2 | | | 1,000,000 | | | | 1,080,640 | |
Port Authority of New York & New Jersey, Revenue Bond | | 4.500% | | | 10/15/2037 | | | Aa2 | | | 1,000,000 | | | | 925,180 | |
Sachem Central School District of Holbrook, G.O. Bond, FGRNA | | 4.375% | | | 10/15/2030 | | | AA3 | | | 2,000,000 | | | | 1,882,300 | |
Saratoga County, Sewer Impt., Series B, G.O. Bond | | 4.375% | | | 7/15/2040 | | | AA3 | | | 855,000 | | | | 770,526 | |
| | | | | | | | | | | | | | | | |
| | | | | | | | | | | | | | | 12,177,478 | |
| | | | | | | | | | | | | | | | |
| | | | | |
NORTH CAROLINA - 2.1% | | | | | | | | | | | | | | | | |
| | | | | |
Charlotte, Series B, Revenue Bond | | 4.625% | | | 7/1/2039 | | | Aaa | | | 1,000,000 | | | | 965,450 | |
Charlotte, Water & Sewer, Revenue Bond | | 5.000% | | | 7/1/2038 | | | Aaa | | | 1,000,000 | | | | 1,016,250 | |
Mecklenburg County, Public Impt., Series A, G.O. Bond | | 4.125% | | | 2/1/2022 | | | Aaa | | | 1,455,000 | | | | 1,490,677 | |
| | |
| The accompanying notes are an integral part of the financial statements. | | 13 |
Investment Portfolio - December 31, 2010
| | | | | | | | | | | | | | | | |
| | | Coupon Rate | | Maturity Date | | | Credit Rating1 (unaudited) | | Principal Amount | | | Value (Note 2) | |
| | | | | |
MUNICIPAL BONDS (continued) | | | | | | | | | | | | | | | | |
| | | | | |
NORTH CAROLINA (continued) | | | | | | | | | | | | | | | | |
| | | | | |
North Carolina Municipal Power Agency No. 1 Catawba, Series A, Revenue Bond | | 5.000% | | | 1/1/2030 | | | A2 | | $ | 1,000,000 | | | $ | 969,000 | |
North Carolina State, Highway Impt., Revenue Bond, NATL | | 4.000% | | | 3/1/2018 | | | Aa2 | | | 1,355,000 | | | | 1,443,617 | |
| | | | | | | | | | | | | | | | |
| | | | | | | | | | | | | | | 5,884,994 | |
| | | | | | | | | | | | | | | | |
| | | | | |
NORTH DAKOTA - 0.7% | | | | | | | | | | | | | | | | |
| | | | | |
Fargo, Series A, G.O. Bond, NATL | | 4.700% | | | 5/1/2030 | | | Aa1 | | | 1,840,000 | | | | 1,805,960 | |
| | | | | | | | | | | | | | | | |
| | | | | |
OHIO - 3.0% | | | | | | | | | | | | | | | | |
| | | | | |
Brookville Local School District, G.O. Bond, AGM | | 4.125% | | | 12/1/2026 | | | Aa3 | | | 660,000 | | | | 610,790 | |
Columbus City School District, G.O. Bond, AGM | | 4.375% | | | 12/1/2032 | | | Aa2 | | | 1,000,000 | | | | 892,810 | |
Columbus, Limited Tax, Series 2, G.O. Bond | | 5.000% | | | 7/1/2017 | | | Aaa | | | 1,000,000 | | | | 1,117,820 | |
Licking Heights Local School District, School Facilities Construction & Impt., Series A, G.O. Bond, NATL | | 5.000% | | | 12/1/2022 | | | Aa2 | | | 1,450,000 | | | | 1,509,450 | |
Newark City School District, G.O. Bond, FGRNA | | 4.250% | | | 12/1/2027 | | | A1 | | | 500,000 | | | | 455,375 | |
Ohio State, Conservation Project, Series A, Prerefunded Balance, G.O. Bond | | 5.000% | | | 3/1/2015 | | | Aa1 | | | 1,000,000 | | | | 1,117,610 | |
Pickerington Local School District, G.O. Bond, NATL | | 4.250% | | | 12/1/2034 | | | Aa2 | | | 2,500,000 | | | | 2,140,325 | |
Springfield City School District, Prerefunded Balance, G.O. Bond, FGIC | | 5.200% | | | 12/1/2023 | | | A1 | | | 325,000 | | | | 345,439 | |
| | | | | | | | | | | | | | | | |
| | | | | | | | | | | | | | | 8,189,619 | |
| | | | | | | | | | | | | | | | |
| | | | | |
OKLAHOMA - 1.1% | | | | | | | | | | | | | | | | |
| | | | | |
Oklahoma City Water Utilities Trust, Series A, Revenue Bond | | 4.125% | | | 7/1/2039 | | | Aa1 | | | 1,000,000 | | | | 878,850 | |
Oklahoma City, G.O. Bond, NATL | | 4.250% | | | 3/1/2023 | | | Aaa | | | 2,000,000 | | | | 2,036,320 | |
| | | | | | | | | | | | | | | | |
| | | | | | | | | | | | | | | 2,915,170 | |
| | | | | | | | | | | | | | | | |
| | | | | |
OREGON - 2.3% | | | | | | | | | | | | | | | | |
| | | | | |
Clackamas County School District No. 12 North Clackamas, Series A, G.O. Bond, AGM | | 4.750% | | | 6/15/2031 | | | Aa1 | | | 870,000 | | | | 863,231 | |
Metro, G.O. Bond | | 5.000% | | | 6/1/2022 | | | Aaa | | | 3,000,000 | | | | 3,273,630 | |
| | |
| 14 | | The accompanying notes are an integral part of the financial statements. |
Investment Portfolio - December 31, 2010
| | | | | | | | | | | | | | | | | | | | |
| | | Coupon
Rate | | | Maturity
Date | | | Credit
Rating 1
(unaudited) | | | Principal
Amount | | | Value
(Note 2) | |
| | | | | |
MUNICIPAL BONDS (continued) | | | | | | | | | | | | | | | | | | | | |
| | | | | |
OREGON (continued) | | | | | | | | | | | | | | | | | | | | |
| | | | | |
Portland, Water Utility Impt., Series A, Revenue Bond, NATL | | | 4.500 | % | | | 10/1/2031 | | | | Aa1 | | | $ | 550,000 | | | $ | 528,435 | |
Salem, Water & Sewer, Revenue Bond, AGM | | | 5.000 | % | | | 5/1/2014 | | | | Aa3 | | | | 1,120,000 | | | | 1,244,141 | |
Washington County School District No. 15 Forest Grove, Prerefunded Balance, G.O. Bond, AGM | | | 5.500 | % | | | 6/15/2017 | | | | Aa1 | | | | 500,000 | | | | 511,645 | |
| | | | | | | | | | | | | | | | | | | | |
| | | | | | | | | | | | | | | | | | | 6,421,082 | |
| | | | | | | | | | | | | | | | | | | | |
| | | | | |
PENNSYLVANIA - 3.5% | | | | | | | | | | | | | | | | | | | | |
| | | | | |
Allegheny County, Series C-62B, G.O. Bond | | | 5.000 | % | | | 11/1/2029 | | | | A1 | | | | 750,000 | | | | 750,480 | |
Commonwealth of Pennsylvania, Second Series, G.O. Bond, CIFG | | | 4.250 | % | | | 3/1/2025 | | | | Aa1 | | | | 2,000,000 | | | | 1,970,600 | |
Erie Water Authority, Series 2006, Revenue Bond, AGM | | | 5.000 | % | | | 12/1/2036 | | | | AA3 | | | | 1,000,000 | | | | 964,770 | |
Jenkintown School District, Series A, G.O. Bond, FGRNA | | | 4.500 | % | | | 5/15/2032 | | | | A3 | | | | 1,000,000 | | | | 913,880 | |
Lancaster School District, G.O. Bond, AGM | | | 5.000 | % | | | 6/1/2019 | | | | Aa3 | | | | 1,200,000 | | | | 1,319,472 | |
Pennsylvania Turnpike Commission, Prerefunded Balance, Revenue Bond, AMBAC | | | 5.375 | % | | | 7/15/2019 | | | | Aa3 | | | | 530,000 | | | | 549,700 | |
Philadelphia, Water & Wastewater, Prerefunded Revenue Bond, NATL | | | 5.600 | % | | | 8/1/2018 | | | | BBB3 | | | | 20,000 | | | | 23,162 | |
Philadelphia, Water & Wastewater, Series A, Revenue Bond, AMRAG | | | 5.000 | % | | | 8/1/2021 | | | | Aa3 | | | | 1,000,000 | | | | 1,050,960 | |
Plum Boro School District, Series A, G.O. Bond, FGRNA | | | 4.500 | % | | | 9/15/2030 | | | | A3 | | | | 855,000 | | | | 796,672 | |
Uniontown Area School District, G.O. Bond, AGM | | | 4.350 | % | | | 10/1/2034 | | | | Aa3 | | | | 1,500,000 | | | | 1,303,170 | |
| | | | | | | | | | | | | | | | | | | | |
| | | | | | | | | | | | | | | | | | | 9,642,866 | |
| | | | | | | | | | | | | | | | | | | | |
| | | | | |
RHODE ISLAND - 1.1% | | | | | | | | | | | | | | | | | | | | |
| | | | | |
Narragansett Bay Commission, Series A, Revenue Bond, NATL | | | 5.000 | % | | | 8/1/2035 | | | | Baa1 | | | | 1,000,000 | | | | 976,450 | |
Rhode Island Clean Water Finance Agency, Series A, Revenue Bond, NATL | | | 5.000 | % | | | 10/1/2035 | | | | Baa1 | | | | 1,000,000 | | | | 893,080 | |
Rhode Island State, Series B, G.O. Bond | | | 5.000 | % | | | 4/1/2023 | | | | Aa2 | | | | 1,110,000 | | | | 1,182,239 | |
| | | | | | | | | | | | | | | | | | | | |
| | | | | | | | | | | | | | | | | | | 3,051,769 | |
| | | | | | | | | | | | | | | | | | | | |
| | |
| The accompanying notes are an integral part of the financial statements. | | 15 |
Investment Portfolio - December 31, 2010
| | | | | | | | | | | | | | | | | | | | |
| | | Coupon
Rate | | | Maturity
Date | | | Credit
Rating 1
(unaudited) | | | Principal
Amount | | | Value
(Note 2) | |
| | | | | |
MUNICIPAL BONDS (continued) | | | | | | | | | | | | | | | | | | | | |
| | | | | |
SOUTH CAROLINA - 4.7% | | | | | | | | | | | | | | | | | | | | |
| | | | | |
Beaufort County School District, Series B, G.O. Bond, SCSDE | | | 5.000 | % | | | 3/1/2017 | | | | Aa1 | | | $ | 1,000,000 | | | $ | 1,148,730 | |
Beaufort County, G.O. Bond, NATL | | | 4.250 | % | | | 3/1/2024 | | | | Aa1 | | | | 790,000 | | | | 787,203 | |
Charleston County, Transportation Sales Tax, G.O. Bond | | | 5.000 | % | | | 11/1/2017 | | | | Aaa | | | | 1,000,000 | | | | 1,140,750 | |
Columbia, Water Utility Impt., Revenue Bond | | | 5.000 | % | | | 2/1/2027 | | | | Aa1 | | | | 1,750,000 | | | | 1,835,873 | |
Lexington, Waterworks & Sewer System, Revenue Bond, AGC | | | 5.000 | % | | | 1/15/2039 | | | | Aa3 | | | | 1,565,000 | | | | 1,566,096 | |
Richland County School District No. 1, Series B, G.O. Bond, SCSDE | | | 4.450 | % | | | 3/1/2026 | | | | Aa1 | | | | 1,005,000 | | | | 1,005,804 | |
South Carolina Transportation Infrastructure Bank, Series B, Revenue Bond, AMBAC | | | 4.250 | % | | | 10/1/2027 | | | | A1 | | | | 2,000,000 | | | | 1,822,560 | |
South Carolina, State Institutional - South Carolina State University, Series D, G.O. Bond | | | 4.250 | % | | | 10/1/2026 | | | | Aaa | | | | 1,250,000 | | | | 1,256,263 | |
Spartanburg Sanitation Sewer District, Series B, Revenue Bond, NATL | | | 5.000 | % | | | 3/1/2032 | | | | A1 | | | | 1,500,000 | | | | 1,459,785 | |
Sumter, Water Utility Impt., Revenue Bond, XLCA | | | 4.500 | % | | | 12/1/2032 | | | | A1 | | | | 1,000,000 | | | | 901,780 | |
| | | | | | | | | | | | | | | | | | | | |
| | | | | | | | | | | | | | | | | | | 12,924,844 | |
| | | | | | | | | | | | | | | | | | | | |
| | | | | |
SOUTH DAKOTA - 0.2% | | | | | | | | | | | | | | | | | | | | |
| | | | | |
Rapid City, Revenue Bond | | | 5.250 | % | | | 11/1/2039 | | | | Aa3 | | | | 450,000 | | | | 454,401 | |
| | | | | | | | | | | | | | | | | | | | |
| | | | | |
TENNESSEE - 1.1% | | | | | | | | | | | | | | | | | | | | |
| | | | | |
Claiborne County, Series A, G.O. Bond | | | 4.125 | % | | | 4/1/2030 | | | | A3 | | | | 750,000 | | | | 694,373 | |
Maryville, Series B, G.O. Bond | | | 3.500 | % | | | 6/1/2030 | | | | Aa3 | | | | 1,280,000 | | | | 1,146,074 | |
Tennessee State, Series A, G.O. Bond | | | 3.625 | % | | | 5/1/2031 | | | | Aaa | | | | 1,500,000 | | | | 1,257,180 | |
| | | | | | | | | | | | | | | | | | | | |
| | | | | | | | | | | | | | | | | | | 3,097,627 | |
| | | | | | | | | | | | | | | | | | | | |
| | | | | |
TEXAS - 4.8% | | | | | | | | | | | | | | | | | | | | |
| | | | | |
Alamo Community College District, Series A, G.O. Bond, NATL | | | 5.000 | % | | | 8/15/2024 | | | | Aaa | | | | 1,020,000 | | | | 1,070,908 | |
Alvin Independent School District, G.O. Bond | | | 4.375 | % | | | 2/15/2024 | | | | Aaa | | | | 750,000 | | | | 755,483 | |
Canyon Independent School District, G.O. Bond | | | 4.700 | % | | | 2/15/2025 | | | | AAA3 | | | | 1,440,000 | | | | 1,472,990 | |
Clear Creek Independent School District, G.O. Bond, AGM | | | 4.000 | % | | | 2/15/2029 | | | | Aa2 | | | | 2,340,000 | | | | 2,060,581 | |
Del Valle Independent School District, School Building, G.O. Bond | | | 5.000 | % | | | 6/15/2019 | | | | AAA3 | | | | 1,845,000 | | | | 2,036,732 | |
| | |
| 16 | | The accompanying notes are an integral part of the financial statements. |
Investment Portfolio - December 31, 2010
| | | | | | | | | | | | | | | | | | | | |
| | | Coupon
Rate | | | Maturity
Date | | | Credit
Rating 1
(unaudited) | | | Principal
Amount | | | Value (Note 2) | |
| | | | | |
MUNICIPAL BONDS (continued) | | | | | | | | | | | | | | | | | | | | |
| | | | | |
TEXAS (continued) | | | | | | | | | | | | | | | | | | | | |
| | | | | |
Fort Bend County, G.O. Bond, NATL | | | 4.750 | % | | | 3/1/2031 | | | | Aa1 | | | $ | 1,000,000 | | | $ | 972,120 | |
Huntsville Independent School District, G.O. Bond | | | 4.500 | % | | | 2/15/2029 | | | | Aaa | | | | 1,220,000 | | | | 1,187,487 | |
McKinney, Waterworks & Sewer, Revenue Bond, FGRNA | | | 4.750 | % | | | 3/15/2024 | | | | Aa2 | | | | 1,000,000 | | | | 1,009,280 | |
San Antonio, Water, Revenue Bond, FGRNA | | | 4.375 | % | | | 5/15/2029 | | | | Aa1 | | | | 1,400,000 | | | | 1,306,732 | |
University of Texas, Financing System, Series F, Revenue Bond | | | 4.750 | % | | | 8/15/2028 | | | | Aaa | | | | 1,000,000 | | | | 1,009,470 | |
Waller Consolidated Independent School District, G.O. Bond | | | 4.750 | % | | | 2/15/2023 | | | | Aaa | | | | 500,000 | | | | 502,710 | |
| | | | | | | | | | | | | | | | | | | | |
| | | | | | | | | | | | | | | | | | | 13,384,493 | |
| | | | | | | | | | | | | | | | | | | | |
| | | | | |
UTAH - 2.0% | | | | | | | | | | | | | | | | | | | | |
| | | | | |
Mountain Regional Water Special Service District, Revenue Bond, NATL | | | 5.000 | % | | | 12/15/2030 | | | | Baa1 | | | | 1,240,000 | | | | 1,163,988 | |
Ogden City School District, G.O. Bond | | | 4.250 | % | | | 6/15/2025 | | | | Aaa | | | | 1,500,000 | | | | 1,483,995 | |
Ogden, Water Utility Impt., Revenue Bond, AGM | | | 4.500 | % | | | 6/15/2038 | | | | Aa3 | | | | 750,000 | | | | 658,785 | |
Provo City School District, Series B, G.O. Bond | | | 4.000 | % | | | 6/15/2014 | | | | Aaa | | | | 1,100,000 | | | | 1,194,743 | |
St. George, Parks and Recreation, G.O. Bond, AMBAC | | | 4.000 | % | | | 8/1/2019 | | | | Aa2 | | | | 795,000 | | | | 816,028 | |
Utah State Building Ownership Authority, Series C, Revenue Bond, AGM | | | 5.500 | % | | | 5/15/2011 | | | | Aa1 | | | | 300,000 | | | | 305,547 | |
| | | | | | | | | | | | | | | | | | | | |
| | | | | | | | | | | | | | | | | | | 5,623,086 | |
| | | | | | | | | | | | | | | | | | | | |
| | | | | |
VERMONT - 0.4% | | | | | | | | | | | | | | | | | | | | |
| | | | | |
Vermont State, Series D, G.O. Bond | | | 4.500 | % | | | 7/15/2025 | | | | Aaa | | | | 1,000,000 | | | | 1,029,660 | |
| | | | | | | | | | | | | | | | | | | | |
| | | | | |
VIRGINIA - 3.4% | | | | | | | | | | | | | | | | | | | | |
| | | | | |
Fairfax County Water Authority, Series B, Revenue Bond | | | 4.000 | % | | | 4/1/2032 | | | | Aaa | | | | 1,000,000 | | | | 911,530 | |
Fairfax County, Public Impt., Series A, G.O. Bond | | | 4.000 | % | | | 4/1/2017 | | | | Aaa | | | | 2,000,000 | | | | 2,154,180 | |
Fairfax County, Public Impt., Series A, G.O. Bond | | | 4.250 | % | | | 4/1/2027 | | | | Aaa | | | | 1,500,000 | | | | 1,498,170 | |
Norfolk, Capital Impt., G.O. Bond, FGRNA | | | 4.250 | % | | | 10/1/2024 | | | | Aa2 | | | | 2,500,000 | | | | 2,509,925 | |
Norfolk, Capital Impt., G.O. Bond, NATL | | | 4.375 | % | | | 3/1/2024 | | | | Aa2 | | | | 685,000 | | | | 691,720 | |
Norfolk, Water Utility Impt., Revenue Bond | | | 3.750 | % | | | 11/1/2040 | | | | Aa2 | | | | 1,000,000 | | | | 794,550 | |
Richmond, Series B, G.O. Bond, AGM | | | 4.750 | % | | | 7/15/2023 | | | | Aa2 | | | | 400,000 | | | | 409,332 | |
| | |
| The accompanying notes are an integral part of the financial statements. | | 17 |
Investment Portfolio - December 31, 2010
| | | | | | | | | | | | | | | | | | | | |
| | | Coupon
Rate | | | Maturity
Date | | | Credit
Rating 1
(unaudited) | | | Principal
Amount | | | Value (Note 2) | |
| | | | | |
MUNICIPAL BONDS (continued) | | | | | | | | | | | | | | | | | | | | |
| | | | | |
VIRGINIA (continued) | | | | | | | | | | | | | | | | | | | | |
| | | | | |
Upper Occoquan Sewage Authority,
Series B, Revenue Bond | | | 4.500 | % | | | 7/1/2038 | | | | Aa1 | | | $ | 470,000 | | | $ | 439,746 | |
| | | | | | | | | | | | | | | | | | | | |
| | | | | | | | | | | | | | | | | | | 9,409,153 | |
| | | | | | | | | | | | | | | | | | | | |
| | | | | |
WASHINGTON - 4.6% | | | | | | | | | | | | | | | | | | | | |
| | | | | |
Franklin County, G.O. Bond, FGRNA | | | 5.125 | % | | | 12/1/2022 | | | | BBB3 | | | | 1,000,000 | | | | 1,006,610 | |
Grant County Public Utility District No. 2 Priest Rapids, Series A, Revenue Bond, NATL | | | 5.000 | % | | | 1/1/2043 | | | | Aa3 | | | | 1,000,000 | | | | 933,640 | |
King County School District No. 411 Issaquah, Series A, G.O. Bond, AGM | | | 5.250 | % | | | 12/1/2018 | | | | Aaa | | | | 2,420,000 | | | | 2,677,270 | |
King County, Sewer Impt., G.O. Bond, FGRNA. | | | 5.000 | % | | | 1/1/2035 | | | | Aa1 | | | | 1,255,000 | | | | 1,258,150 | |
King County, Sewer Impt., Revenue Bond, AGM | | | 5.000 | % | | | 1/1/2024 | | | | Aa2 | | | | 1,460,000 | | | | 1,536,869 | |
King County, Sewer Impt., Series A, Revenue Bond, NATL | | | 4.500 | % | | | 1/1/2032 | | | | Aa2 | | | | 1,070,000 | | | | 999,615 | |
Seattle, Drain & Wastewater, Revenue Bond, NATL | | | 4.375 | % | | | 2/1/2026 | | | | Aa1 | | | | 2,000,000 | | | | 1,957,760 | |
Tacoma, Sewer Impt., Revenue Bond, FGRNA | | | 5.125 | % | | | 12/1/2036 | | | | Aa2 | | | | 1,275,000 | | | | 1,278,494 | |
Washington State, Motor Vehicle Fuel Tax, Series B, G.O. Bond, AMBAC | | | 5.000 | % | | | 1/1/2025 | | | | Aa1 | | | | 1,000,000 | | | | 1,045,820 | |
| | | | | | | | | | | | | | | | | | | | |
| | | | | | | | | | | | | | | | | | | 12,694,228 | |
| | | | | | | | | | | | | | | | | | | | |
| | | | | |
WEST VIRGINIA - 0.3% | | | | | | | | | | | | | | | | | | | | |
| | | | | |
West Virginia State Water Development Authority, Series A, Revenue Bond, FGRNA | | | 4.250 | % | | | 11/1/2026 | | | | A3 | | | | 820,000 | | | | 767,733 | |
| | | | | | | | | | | | | | | | | | | | |
| | | | | |
WISCONSIN - 3.0% | | | | | | | | | | | | | | | | | | | | |
| | | | | |
Central Brown County Water Authority, Water Systems, Revenue Bond, AMBAC | | | 5.000 | % | | | 12/1/2035 | | | | A3 | | | | 1,500,000 | | | | 1,412,400 | |
Eau Claire, Series B, G.O. Bond, NATL | | | 4.000 | % | | | 4/1/2015 | | | | Aa1 | | | | 1,195,000 | | | | 1,310,043 | |
Madison, Water Utility Impt., Series A, Revenue Bond | | | 4.250 | % | | | 1/1/2030 | | | | Aa1 | | | | 1,000,000 | | | | 907,550 | |
Milwaukee County Metropolitan Sewer District, Series F, G.O. Bond | | | 5.000 | % | | | 10/1/2018 | | | | Aaa | | | | 1,050,000 | | | | 1,214,241 | |
Milwaukee, Series B5, G.O. Bond | | | 5.000 | % | | | 5/1/2024 | | | | Aa1 | | | | 1,000,000 | | | | 1,074,780 | |
Oshkosh, Corporate Purposes, Series A, G.O. Bond, FGRNA | | | 5.050 | % | | | 12/1/2021 | | | | Aa2 | | | | 450,000 | | | | 469,242 | |
Stoughton Area School District, G.O. Bond, FGRNA | | | 4.875 | % | | | 4/1/2016 | | | | Aa2 | | | | 500,000 | | | | 504,835 | |
| | |
| 18 | | The accompanying notes are an integral part of the financial statements. |
Investment Portfolio - December 31, 2010
| | | | | | | | | | | | | | | | | | | | |
| | | Coupon
Rate | | | Maturity
Date | | | Credit
Rating 1
(unaudited) | | | Principal
Amount/
Shares | | | Value (Note 2) | |
| | | | | |
MUNICIPAL BONDS (continued) | | | | | | | | | | | | | | | | | | | | |
| | | | | |
WISCONSIN (continued) | | | | | | | | | | | | | | | | | | | | |
| | | | | |
Wisconsin Public Power, Inc., Series A, Revenue Bond, AMBAC | | | 5.000 | % | | | 7/1/2035 | | | | A1 | | | $ | 870,000 | | | $ | 815,173 | |
Wisconsin State, Transportation, Series A, Revenue Bond, AGM | | | 5.000 | % | | | 7/1/2025 | | | | Aa2 | | | | 700,000 | | | | 723,618 | |
| | | | | | | | | | | | | | | | | | | | |
| | | | | | | | | | | | | | | | | | | 8,431,882 | |
| | | | | | | | | | | | | | | | | | | | |
| | | | | |
WYOMING - 0.3% | | | | | | | | | | | | | | | | | | | | |
| | | | | |
Wyoming Municipal Power Agency, Series A, Revenue Bond | | | 5.375 | % | | | 1/1/2042 | | | | A2 | | | | 710,000 | | | | 709,467 | |
| | | | | | | | | | | | | | | | | | | | |
TOTAL MUNICIPAL BONDS
(Identified Cost $268,550,079) | | | | | | | | | | | | | | | | | | | 263,840,297 | |
| | | | | | | | | | | | | | | | | | | | |
| | | | | |
SHORT-TERM INVESTMENTS - 3.3% | | | | | | | | | | | | | | | | | | | | |
| | | | |
Dreyfus AMT - Free Municipal Reserves - Class R (Identified Cost $9,284,437) | | | | | | | | | | | | 9,284,437 | | | | 9,284,437 | |
| | | | | | | | | | | | | | | | | | | | |
TOTAL INVESTMENTS - 98.6%
(Identified Cost $277,834,516) | | | | | | | | | | | | | | | | | | | 273,124,734 | |
OTHER ASSETS, LESS LIABILITIES - 1.4% | | | | | | | | | | | | | | | | | | | 3,845,102 | |
| | | | | | | | | | | | | | | | | | | | |
NET ASSETS - 100% | | | | | | | | | | | | | | | | | | $ | 276,969,836 | |
| | | | | | | | | | | | | | | | | | | | |
KEY:
G.O. Bond - General Obligation Bond
Impt. - Improvement
No. - Number
Scheduled principal and interest payments are guaranteed by:
AGC (Assurance Guaranty Corp.)
AGM (Assurance Guaranty Municipal Corp.)
AMBAC (AMBAC Assurance Corp.)
AMRAG (AMBAC reinsured by AGC)
CIFG (CIFG North America, Inc.)
FGIC (Financial Guaranty Insurance Co.)
FGRNA (FGIC reinsured by NATL)
NATL (National Public Finance Guarantee Corp.)
XLCA (XL Capital Assurance)
The insurance does not guarantee the market value of the municipal bonds.
1Credit ratings from Moody’s (unaudited).
2Credit rating has been withdrawn. As of December 31, 2010, there is no rating available (unaudited).
3Credit ratings from S&P (unaudited).
The Series’ portfolio holds, as a percentage of net assets, greater than 10% in bonds insured by the following companies:
NATL - 29.6%; AGM - 18.1%.
| | |
| The accompanying notes are an integral part of the financial statements. | | 19 |
Statement of Assets and Liabilities
December 31, 2010
| | | | |
ASSETS: | | | | |
| |
Investments, at value (identified cost $277,834,516) (Note 2) | | $ | 273,124,734 | |
Interest receivable | | | 3,496,462 | |
Receivable for fund shares sold | | | 590,433 | |
| | | | |
| |
TOTAL ASSETS | | | 277,211,629 | |
| | | | |
| |
LIABILITIES: | | | | |
| |
Accrued management fees (Note 3) | | | 117,515 | |
Accrued fund accounting and administration fees (Note 3) | | | 14,597 | |
Accrued transfer agent fees (Note 3) | | | 689 | |
Accrued Chief Compliance Officer service fees (Note 3) | | | 245 | |
Accrued directors fees (Note 3) | | | 49 | |
Payable for fund shares repurchased | | | 57,359 | |
Audit fees payable | | | 30,269 | |
Other payables and accrued expenses | | | 21,070 | |
| | | | |
| |
TOTAL LIABILITIES | | | 241,793 | |
| | | | |
| |
TOTAL NET ASSETS | | $ | 276,969,836 | |
| | | | |
| |
NET ASSETS CONSIST OF: | | | | |
| |
Capital stock | | $ | 257,159 | |
Additional paid-in-capital | | | 281,150,952 | |
Undistributed net investment income | | | 271,507 | |
Net unrealized depreciation on investments | | | (4,709,782 | ) |
| | | | |
| |
TOTAL NET ASSETS | | $ | 276,969,836 | |
| | | | |
| |
NET ASSET VALUE, OFFERING PRICE AND REDEMPTION PRICE PER SHARE - Class A ($276,969,836/25,715,917 shares) | | $ | 10.77 | |
| | | | |
| | |
| 20 | | The accompanying notes are an integral part of the financial statements. |
Statement of Operations
For the Year Ended December 31, 2010
| | | | |
INVESTMENT INCOME: | | | | |
| |
Interest | | $ | 10,834,848 | |
Dividends | | | 506 | |
| | | | |
| |
Total Investment Income | | | 10,835,354 | |
| | | | |
| |
EXPENSES: | | | | |
| |
Management fees (Note 3) | | | 1,324,330 | |
Fund accounting and administration fees (Note 3) | | | 99,043 | |
Directors’ fees (Note 3) | | | 11,408 | |
Transfer agent fees (Note 3) | | | 4,074 | |
Chief Compliance Officer service fees (Note 3) | | | 2,631 | |
Custodian fees | | | 13,551 | |
Miscellaneous | | | 91,552 | |
| | | | |
| |
Total Expenses | | | 1,546,589 | |
Less reduction of expenses (Note 3) | | | (758 | ) |
| | | | |
| |
Net Expenses | | | 1,545,831 | |
| | | | |
| |
NET INVESTMENT INCOME | | | 9,289,523 | |
| | | | |
| |
REALIZED AND UNREALIZED GAIN (LOSS) ON INVESTMENTS: | | | | |
| |
Net realized gain on investments | | | 44,160 | |
Net change in unrealized depreciation on investments | | | (9,181,739 | ) |
| | | | |
| |
NET REALIZED AND UNREALIZED LOSS ON INVESTMENTS | | | (9,137,579 | ) |
| | | | |
| |
NET INCREASE IN NET ASSETS RESULTING FROM OPERATIONS | | $ | 151,944 | |
| | | | |
| | |
| The accompanying notes are an integral part of the financial statements. | | 21 |
Statement of Changes in Net Assets
| | | | | | | | |
| | | For the Year Ended
12/31/10 | | | For the Year Ended
12/31/09 | |
INCREASE (DECREASE) IN NET ASSETS: | | | | | | | | |
| | |
OPERATIONS: | | | | | | | | |
| | |
Net investment income | | $ | 9,289,523 | | | $ | 7,635,785 | |
Net realized gain on investments | | | 44,160 | | | | 243,778 | |
Net change in unrealized appreciation (depreciation) on investments | | | (9,181,739 | ) | | | 16,756,505 | |
| | | | | | | | |
| | |
Net increase from operations | | | 151,944 | | | | 24,636,068 | |
| | | | | | | | |
| | |
DISTRIBUTIONS TO SHAREHOLDERS (Note 7): | | | | | | | | |
| | |
From net investment income | | | (10,674,465 | ) | | | (8,260,550 | ) |
From net realized gain on investments | | | (50,263 | ) | | | (515,923 | ) |
| | | | | | | | |
| | |
Total distributions to shareholders | | | (10,724,728 | ) | | | (8,776,473 | ) |
| | | | | | | | |
| | |
CAPITAL STOCK ISSUED AND REPURCHASED: | | | | | | | | |
| | |
Net increase from capital share transactions (Note 5) | | | 53,056,589 | | | | 20,890,861 | |
| | | | | | | | |
| | |
Net increase in net assets | | | 42,483,805 | | | | 36,750,456 | |
| | |
NET ASSETS: | | | | | | | | |
| | |
Beginning of year | | | 234,486,031 | | | | 197,735,575 | |
| | | | | | | | |
| | |
End of year (including undistributed net investment income of $271,507 and $1,659,323, respectively) | | $ | 276,969,836 | | | $ | 234,486,031 | |
| | | | | | | | |
| | |
| 22 | | The accompanying notes are an integral part of the financial statements. |
Financial Highlights
| | | | | | | | | | | | | | | | | | | | | | | | | |
| | | | | For the Years Ended | | |
| | | 12/31/10 | | 12/31/09 | | 12/31/08 | | 12/31/07 | | 12/31/06 |
| Per share data (for a share outstanding throughout each year): | | | | | | | | | | | | | | | | | | | | | | | | | |
Net asset value - Beginning of year | | | | $11.17 | | | | | $10.34 | | | | | $10.92 | | | | | $10.95 | | | | | $10.90 | |
| | | | | | | | | | | | | | | | | | | | | | | | | |
Income (loss) from investment operations: | | | | | | | | | | | | | | | | | | | | | | | | | |
Net investment income | | | | 0.401 | | | | | 0.401 | | | | | 0.42 | | | | | 0.36 | | | | | 0.37 | |
Net realized and unrealized gain (loss) on investments | | | | (0.35) | | | | | 0.90 | | | | | (0.62) | | | | | (0.02) | | | | | 0.05 | |
| | | | | | | | | | | | | | | | | | | | | | | | | |
Total from investment operations | | | | 0.05 | | | | | 1.30 | | | | | (0.20) | | | | | 0.34 | | | | | 0.42 | |
| | | | | | | | | | | | | | | | | | | | | | | | | |
Less distributions to shareholders: | | | | | | | | | | | | | | | | | | | | | | | | | |
From net investment income | | | | (0.45) | | | | | (0.44) | | | | | (0.36) | | | | | (0.37) | | | | | (0.36) �� | |
From net realized gain on investments | | | | —2 | | | | | (0.03) | | | | | (0.02) | | | | | —2 | | | | | (0.01) | |
| | | | | | | | | | | | | | | | | | | | | | | | | |
Total distributions to shareholders | | | | (0.45) | | | | | (0.47) | | | | | (0.38) | | | | | (0.37) | | | | | (0.37) | |
| | | | | | | | | | | | | | | | | | | | | | | | | |
Net asset value - End of year | | | | $10.77 | | | | | $11.17 | | | | | $10.34 | | | | | $10.92 | | | | | $10.95 | |
| | | | | | | | | | | | | | | | | | | | | | | | | |
Net assets - End of year (000’s omitted) | | | | $276,970 | | | | | $234,486 | | | | | $197,736 | | | | | $235,709 | | | | | $167,689 | |
| | | | | | | | | | | | | | | | | | | | | | | | | |
Total return3 | | | | 0.41% | | | | | 12.75% | | | | | (1.79%) | | | | | 3.20% | | | | | 3.94% | |
| Ratios (to average net assets)/ Supplemental Data: | | | | | | | | | | | | | | | | | | | | | | | | | |
Expenses* | | | | 0.58% | | | | | 0.60% | | | | | 0.61% | | | | | 0.62% | | | | | 0.66% | |
Net investment income | | | | 3.51% | | | | | 3.65% | | | | | 3.75% | | | | | 3.65% | | | | | 3.71% | |
Portfolio turnover | | | | 3% | | | | | 8% | | | | | 7% | | | | | 3% | | | | | 5% | |
*The investment advisor did not impose all or a portion of its management fees, CCO fees, fund accounting and transfer agent fees, and other fees in some years and in some years paid a portion of the Series’ expenses. If these expenses had been incurred by the Series, the expense ratio (to average net assets) would have been increased by the following amounts:
1Calculated based on average shares outstanding during the year.
2Less than $0.01 per share.
3Represents aggregate total return for the periods indicated, and assumes reinvestment of all distributions. Total return would have been lower had certain expenses not been waived or reimbursed during the periods. Periods less than one year are not annualized.
4Less than 0.01%.
| | |
| The accompanying notes are an integral part of the financial statements. | | 23 |
Notes to Financial Statements
Diversified Tax Exempt Series (the “Series”) is a no-load diversified series of Manning & Napier Fund, Inc. (the “Fund”). The Fund is organized in Maryland and is registered under the Investment Company Act of 1940, as amended, as an open-end management investment company.
The Series’ investment objective is to provide as high a level of current income exempt from federal income tax as the Advisor believes is consistent with the preservation of capital.
The Fund’s Advisor is Manning & Napier Advisors, Inc. (the “Advisor”). Shares of the Series are offered to investors, clients and employees of the Advisor and its affiliates. The total authorized capital stock of the Fund consists of 10.0 billion shares of common stock each having a par value of $0.01. As of December 31, 2010, 6.2 billion shares have been designated in total among 29 series, of which 100 million have been designated as Diversified Tax Exempt Series Class A common stock.
| 2. | SIGNIFICANT ACCOUNTING POLICIES |
Security Valuation
Municipal securities will normally be valued on the basis of market valuations provided by an independent pricing service (the “Service”). The Service utilizes the latest price quotations and a matrix system (which considers such factors as security prices of similar securities, yields, maturities and ratings). The Service has been approved by the Fund’s Board of Directors (the “Board”).
Short-term investments that mature in sixty days or less are valued at amortized cost, which approximates market value. Investments in open-end investment companies are valued at their net asset value per share on valuation date.
Volume and level of activity in established markets for an asset or liability are evaluated to determine whether recent transactions and quoted prices are determinative of fair value. Where there have been significant decreases in volume and level of activity, further analysis and adjustment may be necessary to estimate fair value. The Series measures fair value in these instances by the use of inputs and valuation techniques which may be based upon current market prices of securities that are comparable in coupon, rating, maturity and industry and/or expectation of future cash flows. As a result of trading in relatively thin markets and/or markets that experience significant volatility, the prices used by the Series to value these securities may differ from the value that would be realized if these securities were sold, and the differences could be material.
Securities for which representative valuations or prices are not available from the Fund’s pricing service may be valued at fair value. Due to the inherent uncertainty of valuations of such securities, the fair value may differ significantly from the values that would have been used had a ready market for such securities existed. If trading or events occurring after the close of the principal market in which securities are traded are expected to materially affect the value of those securities, then they may be valued at their fair value, taking this trading or these events into account. Fair value is determined in good faith by the Advisor under procedures approved by and under the general supervision and responsibility of the Board.
Various inputs are used in determining the value of the Series’ assets or liabilities carried at market value. These inputs are summarized in three broad levels. Level 1 includes quoted prices in active markets for identical assets and liabilities. Level 2 includes other significant observable inputs (including quoted prices for similar securities, interest rates, prepayment speeds, credit risk, etc.). Level 3 includes significant unobservable inputs (including the Series’ own assumptions in determining the fair value of investments). The inputs or methodology used for valuing securities are not necessarily an indication of the risk associated with investing in those securities.
The following is a summary of the valuation levels used for major security types as of December 31, 2010 in valuing the Series’ assets or liabilities carried at market value:
Notes to Financial Statements
| 2. | SIGNIFICANT ACCOUNTING POLICIES (continued) |
Security Valuation (continued)
| | | | | | | | | | | | | | | | |
| Description | | Total | | | Level 1 | | | Level 2 | | | Level 3 | |
Assets: | | | | | | | | | | | | | | | | |
Equity securities* | | $ | — | | | $ | — | | | $ | — | | | $ | — | |
Preferred securities | | | — | | | | — | | | | — | | | | — | |
Debt securities: | | | | | | | | | | | | | | | | |
States and political subdivisions (municipals) | | | 263,840,297 | | | | — | | | | 263,840,297 | | | | — | |
Mutual funds | | | 9,284,437 | | | | 9,284,437 | | | | — | | | | — | |
Other financial instruments**: | | | — | | | | — | | | | — | | | | — | |
| | | | | | | | | | | | | | | | |
Total Assets: | | | 273,124,734 | | | | 9,284,437 | | | | 263,840,297 | | | | — | |
| | | | | | | | | | | | | | | | |
Liabilities: | | | | | | | | | | | | | | | | |
Other financial instruments**: | | | — | | | | — | | | | — | | | | — | |
| | | | | | | | | | | | | | | | |
Total liabilities: | | | — | | | | — | | | | — | | | | — | |
| | | | | | | | | | | | | | | | |
Total | | $ | 273,124,734 | | | $ | 9,284,437 | | | $ | 263,840,297 | | | $ | — | |
| | | | | | | | | | | | | | | | |
*Includes common stock, warrants and rights. Please see the Investment Portfolio for industry classification.
**Other financial instruments are derivative instruments not reflected in the Investment Portfolio, such as futures, forwards and swap contracts, which are valued at the unrealized appreciation/depreciation on the instrument. As of December 31, 2010, the Series did not hold any derivative instruments.
There were no Level 3 securities held by the Series as of December 31, 2009 or December 31, 2010.
The Fund’s policy is to recognize transfers in and transfers out of the valuation levels as of the beginning of the reporting period. There were no significant transfers between Level 1 and Level 2 during the year ended December 31, 2010.
Additional disclosure surrounding the activity in Level 3 fair value measurement will be effective for fiscal years beginning after December 15, 2010. Management has concluded that this will not have a material impact on the Series’ financial statements.
Security Transactions, Investment Income and Expenses
Security transactions are accounted for on trade date. Dividend income is recorded on the ex-dividend date, except that if the ex-dividend date has passed, certain dividends from foreign securities are recorded as soon as the Fund is informed of the ex-dividend date. Non-cash dividends, if any, are recorded at the fair market value of the securities received. Interest income, including amortization of premium and accretion of discounts using the effective interest method, is earned from settlement date and accrued daily.
Expenses are recorded on an accrual basis. Most expenses of the Fund can be attributed to a specific series. Expenses which cannot be directly attributed are apportioned among the series in the Fund in such a manner as deemed equitable by the Fund’s Board, taking into consideration, among other things, the nature and type of expense.
The Series uses the identified cost method for determining realized gain or loss on investments for both financial statement and federal income tax reporting purposes.
Notes to Financial Statements
| 2. | SIGNIFICANT ACCOUNTING POLICIES (continued) |
Federal Taxes
The Series’ policy is to comply with the provisions of the Internal Revenue Code applicable to regulated investment companies. The Series is not subject to federal income tax or excise tax to the extent that the Series distributes to shareholders each year its taxable income, including any net realized gains on investments, in accordance with requirements of the Internal Revenue Code. Accordingly, no provision for federal income tax or excise tax has been made in the financial statements.
Management evaluates its tax positions to determine if the tax positions taken meet the minimum recognition threshold in connection with accounting for uncertainties in income tax positions taken or expected to be taken for the purposes of measuring and recognizing tax liabilities in the financial statements. Recognition of tax benefits of an uncertain tax position is required only when the position is “more likely than not” to be sustained assuming examination by taxing authorities. At December 31, 2010, the Series has recorded no liability for net unrecognized tax benefits relating to uncertain income tax positions taken or expected to be taken in future tax returns.
The Series files income tax returns in the U.S. federal jurisdiction and various states, as required. No income tax returns are currently under investigation. The statute of limitations on the Series’ tax returns remains open for the years ended December 31, 2007 through December 31, 2010. The Fund is not aware of any tax positions for which it is reasonably possible that the total amounts of unrecognized tax benefits will significantly change in the next twelve months.
Distributions of Income and Gains
Distributions to shareholders of net investment income are made quarterly. Distributions of net realized gains are made annually. An additional distribution may be necessary to avoid taxation of the Series. Distributions are recorded on the ex-dividend date.
Indemnifications
The Fund’s organizational documents provide former and current directors and officers with a limited indemnification against liabilities arising in connection with the performance of their duties to the Fund. In the normal course of business, the Fund may also enter into contracts that provide general indemnifications. The Fund’s maximum exposure under these arrangements is unknown as this would be dependent on future claims that may be made against the Fund. The risk of material loss from such claims is considered remote.
Other
The preparation of financial statements in conformity with accounting principles generally accepted in the United States of America requires management to make estimates and assumptions that affect the reported amounts of assets and liabilities and the disclosure of contingent assets and liabilities at the date of the financial statements and the reported amounts of income and expenses during the reporting period. Actual results could differ from those estimates.
| 3. | TRANSACTIONS WITH AFFILIATES |
The Fund has an Investment Advisory Agreement (the “Agreement”) with the Advisor, for which the Series pays a fee, computed daily and payable monthly, at an annual rate of 0.50% of the Series’ average daily net assets.
Under the Agreement, personnel of the Advisor provide the Series with advice and assistance in the choice of investments and the execution of securities transactions, and otherwise maintain the Series’ organization. The Advisor also provides the Fund with necessary office space and fund administration and support services. The salaries of all officers of the Fund (except a percentage of the Fund’s Chief Compliance Officer’s salary, which is paid by the Fund), and of all Directors who are “affiliated persons” of the Fund, or of the Advisor, and all personnel of the Fund, or of the Advisor, performing services relating to research, statistical and investment activities, are paid by the
Notes to Financial Statements
| 3. | TRANSACTIONS WITH AFFILIATES (continued) |
Advisor. Each “non-affiliated” Director receives an annual stipend, which is allocated among all the active series of the Fund. In addition, these Directors also receive a fee per Board meeting attended plus a fee for each committee meeting attended.
The Advisor has contractually agreed, until at least April 30, 2012, to waive its fee and, if necessary, pay other operating expenses of the Series in order to maintain total direct annual fund operating expenses for the Series at no more than 0.85% of average daily net assets each year. For the year ended December 31, 2010, the Advisor voluntarily waived fees of $758, which are included as a reduction of expenses on the Statement of Operations. The Advisor is not eligible to recoup any expenses that have been waived or reimbursed in prior years.
Manning & Napier Investor Services, Inc., a registered broker-dealer affiliate of the Advisor, acts as distributor for the Fund’s shares. The services of Manning & Napier Investor Services, Inc. are provided at no additional cost to the Series.
The Advisor has agreements with PNC Global Investment Servicing (U.S.) Inc. (“PNCGIS”) under which PNCGIS serves as sub-accountant services agent and sub-transfer agent. The Fund pays the Advisor an annual fee related to fund accounting and administration of 0.0175% on the first $3 billion of average daily net assets (excluding Target Series); 0.015% on the next $3 billion of average daily net assets (excluding Target Series); and 0.01% of the average daily net assets in excess of $6 billion (excluding Target Series); plus a base fee of $25,500 per Series. Transfer Agent fees are charged to the Fund on a per account basis. Additionally, certain transaction- and cusip-based fees and out-of-pocket expenses, including charges for reporting relating to the Fund’s compliance program, are charged.
Effective July 1, 2010, PNCGIS was sold to The Bank of New York Mellon Corporation, the Series’ custodian. At the close of the sale, PNCGIS changed its name to BNY Mellon Investment Servicing (U.S.) Inc. (“BNY”).
Expenses not directly attributable to a Series are allocated based on each Series’ relative net assets or number of accounts, depending on the expense.
| 4. | PURCHASES AND SALES OF SECURITIES |
For the year ended December 31, 2010, purchases and sales of securities, other than U.S. Government securities and short-term securities, were $56,294,453 and $7,867,290, respectively. There were no purchases or sales of U.S. Government securities.
| 5. | CAPITAL STOCK TRANSACTIONS |
Transactions in shares of Diversified Tax Exempt Series were:
| | | | | | | | | | | | | | | | |
| | | For the Year Ended 12/31/10 | | | For the Year Ended 12/31/09 | |
| | | Shares | | | Amount | | | Shares | | | Amount | |
Sold | | | 7,011,303 | | | $ | 79,206,449 | | | | 4,637,961 | | | $ | 51,174,088 | |
Reinvested | | | 903,576 | | | | 10,015,744 | | | | 749,319 | | | | 8,166,096 | |
Repurchased | | | (3,196,428 | ) | | | (36,165,604 | ) | | | (3,520,939 | ) | | | (38,449,323 | ) |
| | | | | | | | | | | | | | | | |
Total | | | 4,718,451 | | | $ | 53,056,589 | | | | 1,866,341 | | | $ | 20,890,861 | |
| | | | | | | | | | | | | | | | |
Substantially all of the Series’ shares represent investments by fiduciary accounts over which the Advisor has sole investment discretion.
Notes to Financial Statements
The Series may trade in instruments including written and purchased options, forward foreign currency exchange contracts and futures contracts and other derivatives in the normal course of investing activities to assist in managing exposure to various market risks. Investments in these instruments may subject the Series to various elements of risk, which may involve, to a varying degree, elements of risk in excess of the amounts recognized for financial statement purposes. These risks include: the risk that changes in the value of a derivative may not correlate perfectly with the underlying asset, rate or index, counterparty credit risk related to over the counter derivatives counterparties’ failure to perform under contract terms, liquidity risk related to the lack of a liquid market for these contracts allowing the fund to close out its position(s) and documentation risk relating to disagreement over contract terms. No such investments were held by the Series during the year ended December 31, 2010.
| 7. | FEDERAL INCOME TAX INFORMATION |
The amount and characterization of certain income and capital gains to be distributed are determined in accordance with federal income tax regulations, which may differ from accounting principles generally accepted in the United States of America. These differences are primarily due to differing book and tax treatments in the timing of the recognition of net investment income or gains and losses, including market discount. The Series may periodically make reclassifications among its capital accounts to reflect income and gains available for distribution (or available capital loss carryovers) under income tax regulations without impacting the Series’ net asset value. Any such reclassifications are not reflected in the financial highlights.
The tax character of distributions paid were as follows:
| | | | | | | | |
| | | For the Year
Ended
12/31/10 | | | For the Year
Ended
12/31/09 | |
Ordinary income | | $ | — | | | $ | 42,152 | |
Tax exempt income | | | 10,676,650 | | | | 8,218,398 | |
Long-term capital gains | | | 48,078 | | | | 515,923 | |
At December 31, 2010, the tax basis of distributable earnings and the net unrealized appreciation based on the identified cost of investments for federal income tax purposes were as follows:
| | | | | | |
Cost for federal income tax purposes | | $ | 277,769,109 | | | |
Unrealized appreciation | | $ | 4,291,074 | | | |
Unrealized depreciation | | | (8,935,449) | | | |
| | | | | | |
Net unrealized depreciation | | $ | (4,644,375) | | | |
| | | | | | |
Undistributed tax exempt income | | | 206,100 | | | |
28
Report of Independent Registered Public Accounting Firm
To the Board of Directors of Manning & Napier Fund, Inc. and Shareholders of
Diversified Tax Exempt Series:
In our opinion, the accompanying statement of assets and liabilities, including the investment portfolio (except for credit ratings), and the related statements of operations and of changes in net assets and the financial highlights present fairly, in all material respects, the financial position of the Diversified Tax Exempt Series (a series of Manning & Napier Fund, Inc., hereafter referred to as the “Series”) at December 31, 2010, and the results of its operations for the year then ended, the changes in its net assets for each of the two years in the period then ended and the financial highlights for each of the five years in the period then ended, in conformity with accounting principles generally accepted in the United States of America. These financial statements and financial highlights (hereafter referred to as “financial statements”) are the responsibility of the Series’ management. Our responsibility is to express an opinion on these financial statements based on our audits. We conducted our audits of these financial statements in accordance with the standards of the Public Company Accounting Oversight Board (United States). Those standards require that we plan and perform the audit to obtain reasonable assurance about whether the financial statements are free of material misstatement. An audit includes examining, on a test basis, evidence supporting the amounts and disclosures in the financial statements, assessing the accounting principles used and significant estimates made by management, and evaluating the overall financial statement presentation. We believe that our audits, which included confirmation of securities at December 31, 2010 by correspondence with the custodian, provide a reasonable basis for our opinion.
New York, New York
February 22, 2011
Supplemental Tax Information (unaudited)
All designations are based on financial information available as of the date of this annual report and, accordingly are subject to change.
Pursuant to Section 852 of the Internal Revenue Code, as amended, the Series hereby designates $48,078 as capital gains for its taxable year ended December 31, 2010. In addition, the Series hereby designates $10,676,650 as tax exempt dividends for the year ended December 31, 2010. For each item it is the intention of the Series to designate the maximum allowable under tax law.
Renewal of Investment Advisory Agreement (unaudited)
At the Manning & Napier Fund, Inc. (the “Fund”) Board of Directors’ (the “Board”) meeting, held on November 17, 2010, the Investment Advisory Agreement (the “Agreement”) between the Fund and Manning & Napier Advisors, Inc. (the “Advisor”) was reviewed by the Board for renewal. In connection with the decision whether to renew the Agreement, a variety of material was prepared for and reviewed by the Board.
Representatives of the Advisor attended the meeting and presented additional oral and written information to the Board to assist the Board in its considerations. The discussion immediately below outlines the materials and information presented to the Board in connection with the Board’s 2010 Annual Review of the Agreement and the conclusions made by the Directors when determining to continue the Agreement.
| | • | | The Board considered the services provided by the Advisor under the Agreement including, among others: deciding what securities to purchase and sell for each Series; arranging for the purchase and sale of such securities by placing orders with broker-dealers; administering the affairs of the Fund (including the books and records of the Fund not maintained by third party service providers such as the custodian or sub-transfer agent); arranging for the insurance coverage for the Fund; and supervising the preparation of tax returns, SEC filings (including registration statements) and reports to shareholders for the Fund. The Board also considered the nature and quality of such services provided under the Agreement in light of the Advisor’s services provided to the Fund for 24 years. The Board discussed the quality of these services with representatives from the Advisor and concluded that the Advisor was performing its services to the Fund required under the Agreement in a reasonable manner. |
| | • | | The Board considered the investment performance of the various Series of the Fund. The investment performance for each Series was reviewed on a cumulative basis since inception and on a one year basis. In addition, annualized performance for the following time periods was considered: inception, three year, five year, ten year, and current market cycle. A market cycle includes periods of both rising and falling markets. Returns for established benchmark indices for each Series were provided for each time period. The Board noted that the various Series were competitive against their respective benchmarks and/or peer groups over various time periods, but in particular over the full market cycle period relevant for the Series. In addition, the Board considered at the meeting (and considers on a quarterly basis) a peer group performance analysis consisting of Morningstar universes of mutual funds with similar investment objectives. The Board discussed the performance with representatives from the Advisor and concluded that the investment performance of each of the Fund’s Series was reasonable based on the Fund’s actual performance and comparative performance, especially performance over the current market cycle. |
| | • | | The Board considered the costs of the Advisor’s services and the profits of the Advisor as they relate to the Advisor’s services to the Fund under the Agreement. In reviewing the Advisor’s costs and profits, the Board discussed the Advisor’s revenues generated from the Fund (on both an actual and adjusted basis) and its expenses associated with providing the services under the Agreement. In addition, the Board reviewed the Advisor’s expenses associated with Fund activities outside of the Agreement (such as expense reimbursements pursuant to expense caps and payments made by the Advisor to third party platforms on which shares of the Fund are available for purchase). It was noted by representatives of the Advisor that 11 of the 27 active Series of the Fund are currently experiencing expenses above the capped expense ratios. After discussing the above costs and profits, the Board concluded that the Advisor’s profitability relating to its services provided under the Agreement was reasonable. |
| | • | | The Board considered the fees and expenses of the various Series of the Fund. The Advisor presented the advisory fees and total expenses for each Series, including the advisory fee adjusted for any expense waivers or reimbursements (either contractual or voluntary) paid by the Advisor. The advisory fees and expense ratios of each Series were compared to an average (on both a mean and median basis) of similar funds as disclosed on the Morningstar database. Representatives of the Advisor discussed with the Board the levels of its advisory |
Renewal of Investment Advisory Agreement (unaudited)
| | fee for each Series of the Fund and as compared to the median and mean advisory fees for similar funds as listed on Morningstar. Expense ratios for every Series, except the Pro-Blend’s Class R and Class C, and Target Class R and Class C, are currently below the median and mean for similar funds as listed on Morningstar. Based on their review of the information provided, the Board concluded that the fees and expenses of each Series of the Fund were reasonable on a comparative basis. |
| | • | | The Board also considered the other benefits the Advisor derives from its relationship with the Fund. Such other benefits include certain research products provided by soft dollars. Given the level of soft dollar transactions involving the Fund, the Board concluded that these additional benefits to the Advisor were reasonable. |
| | • | | In addition to the factors described above, the Board considered the Advisor’s personnel, investment strategies, policies and procedures relating to compliance with personal securities transactions, and reputation, expertise and resources in domestic and foreign financial markets. The Board concluded that these factors support the conclusion that the Advisor performs its services in a reasonable manner. |
| | • | | The Board did not consider economies of scale at this time because of the multiple uses of the Fund (for the Advisor’s discretionary investment account clients in addition to direct investors), the current profitability of the Advisor’s services to the Fund under the Agreement, and the overall size of the Fund complex. |
Based on the Board’s deliberations and their evaluation of the information described above, the Board, including a majority of Directors that are not “interested persons” as defined in the Investment Company Act of 1940, concluded that the compensation under the Agreement was fair and reasonable in light of the services and expenses and such other matters as the Directors considered to be relevant in the exercise of their reasonable judgment. Accordingly, the Board approved the renewal of the Agreement. In the course of their deliberations, the Directors did not identify any particular information that was all important or controlling.
Directors’ and Officers’ Information (unaudited)
The Statement of Additional Information provides additional information about the Fund’s directors and officers and can be obtained without charge by calling 1-800-466-3863, at www.manningnapieradvisors.com, or on the EDGAR Database on the SEC Internet web site (http:// www.sec.gov). The following chart shows certain information about the Fund’s officers and directors, including their principal occupations during the last five years. Unless specific dates are provided, the individuals have held the listed positions for longer than five years.
INTERESTED DIRECTOR/OFFICER
| | |
Name: | | B. Reuben Auspitz* |
Address: | | 290 Woodcliff Drive |
| | Fairport, NY 14450 |
Age: | | 63 |
Current Position(s) Held with Fund: | | Principal Executive Officer, President, Chairman & Director |
Term of Office1 & Length of Time Served: | | Indefinite - Director since 1984; Vice President 1984 - 2003; President since 2004; Principal Executive Officer since 2002 |
Principal Occupation(s) During Past 5 Years: | | Executive Vice President; Executive Group Member**; Chief Compliance Officer since 2004; Vice Chairman since June 2010; Co-Executive Director from 2003-2010 - Manning & Napier Advisors, Inc. President; Director - Manning & Napier Investor Services, Inc. Holds or has held one or more of the following titles for various subsidiaries and affiliates: President, Vice President, Director, Chairman, Treasurer, Chief Compliance Officer or Member. |
Number of Portfolios Overseen within Fund Complex: | | 29 |
Other Directorships Held Outside Fund Complex: | | N/A |
INDEPENDENT DIRECTORS | | |
Name: | | Paul A. Brooke |
Address: | | 290 Woodcliff Drive |
| | Fairport, NY 14450 |
Age: | | 65 |
Current Position(s) Held with Fund: | | Director, Audit Committee Member, Governance & Nominating Committee Member |
Term of Office & Length of Time Served: | | Indefinite - Since 2007 |
Principal Occupation(s) During Past 5 Years: | | Chairman & CEO, Alsius Corp. (investments); Managing Member, PMSV Holdings LLC (investments) |
Number of Portfolios Overseen within Fund Complex: | | 29 |
Other Directorships Held Outside Fund Complex: | | Incyte Corp. (2000-present) ViroPharma, Inc. (2000-present) HLTH Corp. (2000-present) Cheyne Capital International (2000-present) MPM Bio-equities (2000-present) GMP Companies (2000-present) HoustonPharma (2000-present) |
Name: | | Richard M. Hurwitz |
Address: | | 290 Woodcliff Drive |
| | Fairport, NY 14450 |
Age: | | 47 |
Current Position(s) Held with Fund: | | Director, Audit Committee Member, Governance & Nominating Committee Member |
Term of Office & Length of Time Served: | | Indefinite - Since 2009 |
Principal Occupation(s) During Past 5 Years: | | Chief Executive Officer, Pictometry International Corp. since August 2010 (provider of georeferenced, aerial image libraries and related software) Managing Partner (2006-July 2010) - Aegis Investment Partners, LLC (investments); Founder and Managing Partner (2004-2005) - Village Markets, LLC (groceries) |
Number of Portfolios Overseen within Fund Complex: | | 29 |
Other Directorships Held Outside Fund Complex: | | Pictometry International Corp. (2000-2010) Pioneering Technologies (2006-2009) Vensearch Capital Corp. (2003-2007) |
| | |
Directors’ and Officers’ Information (unaudited)
INDEPENDENT DIRECTORS (continued)
| | |
Name: | | Stephen B. Ashley |
Address: | | 290 Woodcliff Drive |
| | Fairport, NY 14450 |
Age: | | 70 |
Current Position(s) Held with Fund: | | Director, Audit Committee Member, Governance & Nominating Committee Member |
Term of Office & Length of Time Served: | | Indefinite - Since 1996 |
Principal Occupation(s) During Past 5 Years: | | Chairman, Director, President & Chief Executive Officer, The Ashley Group (property management and investment). Chairman (non-executive) 2004-2008; Director 1995-2008 - Fannie Mae (mortgage) |
Number of Portfolios Overseen within Fund Complex: | | 29 |
Other Directorships Held Outside Fund Complex: | | The Ashley Group (1995-2008) Genesee Corporation (1987-2007) |
Name: | | Peter L. Faber |
Address: | | 290 Woodcliff Drive |
| | Fairport, NY 14450 |
Age: | | 72 |
Current Position(s) Held with Fund: | | Director, Governance & Nominating Committee Member |
Term of Office & Length of Time Served: | | Indefinite - Since 1987 |
Principal Occupation(s) During Past 5 Years: | | Senior Counsel since 2006, Partner (1995 - 2006) - McDermott, Will & Emery LLP (law firm) |
Number of Portfolios Overseen within Fund Complex: | | 29 |
Other Directorships Held Outside Fund Complex: | | Partnership for New York City, Inc. (non-profit) New York Collegium (non-profit) Boston Early Music Festival (non-profit) |
Name: | | Harris H. Rusitzky |
Address: | | 290 Woodcliff Drive |
| | Fairport, NY 14450 |
Age: | | 76 |
Current Position(s) Held with Fund: | | Director, Audit Committee Member, Governance & Nominating Committee Member |
Term of Office & Length of Time Served: | | Indefinite - Since 1985 |
Principal Occupation(s) During Past 5 Years: | | President, The Greening Group (business consultants) since 1994; Partner, The Restaurant Group (restaurants) since 2006 |
Number of Portfolios Overseen within Fund Complex: | | 29 |
Other Directorships Held Outside Fund Complex: | | N/A |
OFFICERS | | |
Name: | | Jeffrey S. Coons, Ph.D., CFA |
Address: | | 290 Woodcliff Drive |
| | Fairport, NY 14450 |
Age: | | 47 |
Current Position(s) Held with Fund: | | Vice President |
Term of Office1 & Length of Time Served: | | Since 2004 |
Principal Occupation(s) During Past 5 Years: | | President since 2010, Co-Director of Research since 2002, Executive Group Member** since 2003, - Manning & Napier Advisors, Inc. Holds one or more of the following titles for various subsidiaries and affiliates: President, Director, Treasurer or Senior Trust Officer. |
Number of Portfolios Overseen within Fund Complex: | | 29 |
Other Directorships Held Outside Fund Complex: | | N/A |
| | |
Directors’ and Officers’ Information (unaudited)
OFFICERS (continued)
| | |
Name: | | Beth Galusha |
Address: | | 290 Woodcliff Drive |
| | Fairport, NY 14450 |
Age: | | 49 |
Current Position(s) Held with Fund: | | Assistant Chief Financial Officer |
Term of Office1 & Length of Time Served: | | Assistant Chief Financial Officer since 2010 |
Principal Occupation(s) During Past 5 Years: | | Chief Financial Officer and Treasurer, Manning & Napier Advisors, Inc. Holds one or more of the following titles for various affiliates: Chief Financial Officer, Director, or Treasurer |
Number of Portfolios Overseen within Fund Complex: | | 29 |
Other Directorships Held Outside Fund Complex: | | N/A |
Name: | | Christine Glavin |
Address: | | 290 Woodcliff Drive |
| | Fairport, NY 14450 |
Age: | | 44 |
Current Position(s) Held with Fund: | | Principal Financial Officer, Chief Financial Officer |
Term of Office1 & Length of Time Served: | | Principal Financial Officer since 2002; Chief Financial Officer since 2001 |
Principal Occupation(s) During Past 5 Years: | | Fund Reporting Manager, Manning & Napier Advisors, Inc. since 1997 |
Number of Portfolios Overseen within Fund Complex: | | 29 |
Other Directorships Held Outside Fund Complex: | | N/A |
Name: | | Jodi L. Hedberg |
Address: | | 290 Woodcliff Drive |
| | Fairport, NY 14450 |
Age: | | 43 |
Current Position(s) Held with Fund: | | Corporate Secretary, Chief Compliance Officer, Anti-Money Laundering |
| | Compliance Officer |
Term of Office1 & Length of Time Served: | | Corporate Secretary since 1997; Chief Compliance Officer since 2004 |
Principal Occupation(s) During Past 5 Years: | | Director of Compliance, Manning & Napier Advisors, Inc. and affiliates since 1990 (title change in 2005 from Compliance Manager to Director of Compliance); Corporate Secretary, Manning & Napier Investor Services, Inc. since 2006 |
Number of Portfolios Overseen within Fund Complex: | | 29 |
Other Directorships Held Outside Fund Complex: | | N/A |
Name: | | Richard Yates |
Address: | | 290 Woodcliff Drive |
| | Fairport, NY 14450 |
Age: | | 45 |
Current Position(s) Held with Fund: | | Chief Legal Officer |
Term of Office1 & Length of Time Served: | | Chief Legal Officer since 2004 |
Principal Occupation(s) During Past 5 Years: | | Counsel - Manning & Napier Advisors, Inc. & affiliates since 2000; Holds one or more of the following titles for various affiliates; Director or Corporate Secretary |
Number of Portfolios Overseen within Fund Complex: | | 29 |
Other Directorships Held Outside Fund Complex: | | N/A |
*Interested Director, within the meaning of the Investment Company Act of 1940 by reason of his position with the Fund’s investment advisor and distributor. Mr. Auspitz serves as the Executive Vice President and Director, Manning & Napier Advisors, Inc. and President and Director, Manning & Napier Investor Services, Inc., the Fund’s distributor.
**Prior to June 2010, the Executive Group, consisting of senior executive employee-owners, performed the duties of the Office of the Chief Executive of the Advisor. Effective June 2010, the Executive Group serves as an advisory board to the Chief Executive Officer.
1The term of office for President, Vice President, Chief Financial Officer, Assistant Chief Financial Officer, Chief Legal Officer and Corporate Secretary is one year and until their respective successors are chosen and qualified. All other officers’ terms are indefinite.
This page intentionally Left Blank
36
This page intentionally Left Blank
37
Literature Requests (unaudited)
Proxy Voting Policies and Procedures
A description of the policies and procedures that the Fund uses to determine how to vote proxies relating to portfolio securities is available, without charge, upon request:
| | | | |
By phone | | 1-800-466-3863 | | |
On the Securities and Exchange Commission’s (SEC) web site | | http://www.sec.gov | | |
Proxy Voting Record
Information regarding how the Fund voted proxies relating to portfolio securities during the most recent 12-month period ended June 30th is available, without charge, upon request:
| | | | |
By phone | | 1-800-466-3863 | | |
On the SEC’s web site | | http://www.sec.gov | | |
Quarterly Portfolio Holdings
The Series’ complete schedule of portfolio holdings for the 1st and 3rd quarters of each fiscal year are provided on Form N-Q, and are available, without charge, upon request:
| | | | |
By phone | | 1-800-466-3863 | | |
On the SEC’s web site | | http://www.sec.gov | | |
The Series’ Form N-Q may be reviewed and copied at the SEC’s Public Reference Room in Washington, D.C. Information on the operation of the Public Reference Room may be obtained by calling 1-800-SEC-0330.
Prospectus and Statement of Additional Information (SAI)
The prospectus and SAI provide additional information about each Series, including charges, expenses and risks. These documents are available, without charge, upon request:
| | | | |
By phone | | 1-800-466-3863 | | |
On the SEC’s web site | | http://www.sec.gov | | |
On the Advisor’s web site | | http://www.manning-napier.com | | |
Additional information available at www.manning-napier.com
1. Fund Holdings - Month-End
2. Fund Holdings - Quarter-End
3. Shareholder Report - Annual
4. Shareholder Report - Semi-Annual
MNDTES-12/10-AR

Management Discussion and Analysis (unaudited)
Dear Shareholders:
As well-defined swings in sentiment drove market fluctuations in 2010, the fixed income markets generally had favorable results for the year. Returns were broadly positive throughout the first three quarters of the year. However, while equities finished the year with a strong rally, fixed income markets generally took a negative turn at the end of 2010. After eight consecutive quarters of positive performance, broad fixed income markets suffered losses in the fourth quarter.
While municipal securities posted gains for the year, the sector had the weakest fixed income returns in 2010, as credit concerns and supply and demand changes caused noteworthy losses during the last quarter. The Bank of America Merrill Lynch 1-12 Year Municipal Bond Index earned 3.04% during the year. With a return of 0.32%, the New York Tax Exempt Series trailed its benchmark over the last twelve months.
The municipal bond market generally performed well in the first three quarters of the year, a reflection of attractive supply and demand dynamics. During this time, the fundamentals in the tax-exempt marketplace remained strong, with demand rising because of the likelihood of higher taxes in the top tax brackets, and supply for longer-term tax-exempt issues declining because of the popularity of the alternative Build America Bond program. However, amid heightened concern about municipal defaults, the municipal bond market struggled during the fourth quarter.
While credit issues exist in certain areas of the municipal market, the Advisor does not believe the broad municipal credit environment has materially deteriorated. In fact, municipal defaults are rare, and municipalities typically pay their debts in full even if they are forced to restructure. Rather, much of the losses at the end of the year were likely due to supply and demand shifts within the sector. The recent tax compromise, which extended the Bush-era tax cuts for all income brackets, lessened the immediate demand for tax-shielding investments, and supply is expected to increase because of the expiration of the Build America Bond program, which had limited longer-term, tax-exempt supply, thus benefiting the municipal market. Given these factors, municipal yields increased during the fourth quarter. While rising yields equate to price declines, the Advisor believes this yield shift has enhanced the relative value of municipal bonds versus other sectors of the fixed income market.
Throughout 2010, the Series continued to focus on high quality bonds with an emphasis on the underlying credit quality, which provides additional security in the midst of a tough credit and economic environment. Specifically, during the past year the underlying credit quality of the bonds in the Series was rated investment grade or higher, and the types of holdings included general obligation debt, pre-refunded bonds, and revenue debt associated with necessary municipal services. While this higher quality bias leads to slightly lower relative yields than the overall municipal market, the Advisor believes the safety and liquidity of such issues justifies the quality bias.
Over the past year, the Series had a significant exposure to securities in the intermediate to longer-term maturity range as compared to the benchmark, which holds only minimal securities in this range. This intermediate to longer-term weighting was the primary driver of relative underperformance in 2010. While the current positioning helped relative results during several periods last year, particularly when municipal yields fell to historic lows during the third quarter, this positioning noticeably detracted from returns when yields rose during the fourth quarter, causing the Series to lag its benchmark for the year. However, given the slow growth economic environment, the Advisor believes the intermediate to longer-term maturity structure continues to be the most suitable strategy.
As the markets unfold in 2011, it will be important to monitor trends such as state and local budgets, monetary policy, and inflation expectations. With this mindset, Manning & Napier remains committed to our active and selective investment approach to fixed income. Staying focused on the fundamentals and maintaining our selective investment process helped us earn solid returns through the volatile markets of 2010, and we believe these qualities will remain important in the environment ahead.
As always, we appreciate your business.
Sincerely,
Manning & Napier Advisors, Inc.
Performance Update as of December 31, 2010 (unaudited)
| | | | | | | | | | | | |
| | | Average Annual Total Returns As of December 31, 2010 |
| | | One
Year | | | Five Year | | Ten Year | | | Since
Inception1 |
Manning & Napier Fund, Inc. - New York Tax Exempt Series2 | | | 0.32 | % | | 3.35% | | | 3.94 | % | | 4.29% |
Bank of America (BofA) Merrill Lynch 1-12 Year Municipal Bond Index3 | | | 3.04 | % | | 4.71% | | | 4.91 | % | | 5.13% |
| | | | | | | | | | | | | |
The following graph compares the value of a $10,000 investment in the Manning & Napier Fund, Inc. - New York Tax Exempt Series for the ten years ended December 31, 2010 to the BofA Merrill Lynch 1-12 Year Municipal Bond Index.
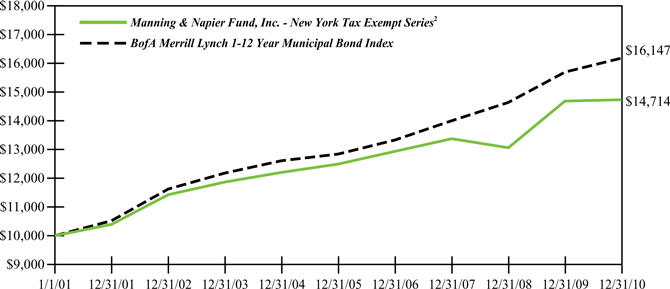
1 Performance numbers for the Series and Index are calculated from January 17, 1994, the Series’ inception date.
2The Series’ performance does not reflect the deduction of taxes that a shareholder would pay on fund distributions or the redemption of shares. The Series’ performance is historical and may not be indicative of future results. The performance returns shown are inclusive of the net expense ratio of the Series. For the year ended December 31, 2010, this net expense ratio was 0.61%. The gross expense ratio, which does not account for any voluntary or contractual waivers currently in effect, was 0.61% for the year ended December 31, 2010.
3The BofA Merrill Lynch 1-12 Year Municipal Bond Index (formerly a Merrill Lynch Index) is an unmanaged, market weighted index comprised of investment-grade, fixed rate, coupon bearing municipal bonds with maturities greater than one year but less than twelve years. The Index returns assume reinvestment of coupons and, unlike Series returns, do not reflect any fees or expenses.
Shareholder Expense Example (unaudited)
As a shareholder of the Series, you may incur two types of costs: (1) transaction costs and (2) ongoing costs, including management fees and other Series expenses. This example is intended to help you understand your ongoing costs (in dollars) of investing in the Series and to compare these costs with the ongoing costs of investing in other mutual funds.
The example is based on an investment of $1,000 invested at the beginning of the period and held for the entire period (July 1, 2010 to December 31, 2010).
Actual Expenses
The first line of the table below provides information about actual account values and actual expenses. You may use the information in this line, together with the amount you invested, to estimate the expenses that you paid over the period. Simply divide your account value by $1,000 (for example, an $8,600 account value divided by $1,000 = 8.6), then multiply the result by the number in the first line under the heading entitled “Expenses Paid During Period” to estimate the expenses you paid on your account during this period.
Hypothetical Example for Comparison Purposes
The second line of the table below provides information about hypothetical account values and hypothetical expenses based on the Series’ actual expense ratio and an assumed rate of return of 5% per year before expenses, which is not the Series’ actual return. The hypothetical account values and expenses may not be used to estimate the actual ending account balance or expenses you paid during the period. You may use this information to compare the ongoing costs of investing in the Series and other funds. To do so, compare this 5% hypothetical example with the 5% hypothetical examples that appear in the shareholder reports of the other funds.
Please note that the expenses shown in the table are meant to highlight your ongoing costs only and do not reflect any transaction costs. Therefore, the second line of the table is useful in comparing ongoing costs only, and will not help you determine the relative total costs of owning different funds. In addition, if these transaction costs were included, your costs would have been higher.
| | | | | | | | | | |
| | | Beginning
Account Value
7/1/10 | | | | Ending
Account Value
12/31/10 | | | | Expenses Paid
During Period*
7/1/10-12/31/10 |
Actual | | $1,000.00 | | | | $ 978.90 | | | | $3.04 |
Hypothetical
(5% return before expenses) | | $1,000.00 | | | | $ 1,022.13 | | | | $3.11 |
*Expenses are equal to the Series’ annualized expense ratio (for the six-month period) of 0.61%, multiplied by the average account value over the period, multiplied by 184/365 (to reflect the one-half year period). Expenses are based on the most recent fiscal half year; therefore, the expense ratio stated above may differ from the expense ratio stated in the financial highlights, which is based on one-year data. The Series’ total return would have been lower had certain expenses not been waived during the period.
Portfolio Composition as of December 31, 2010 (unaudited)
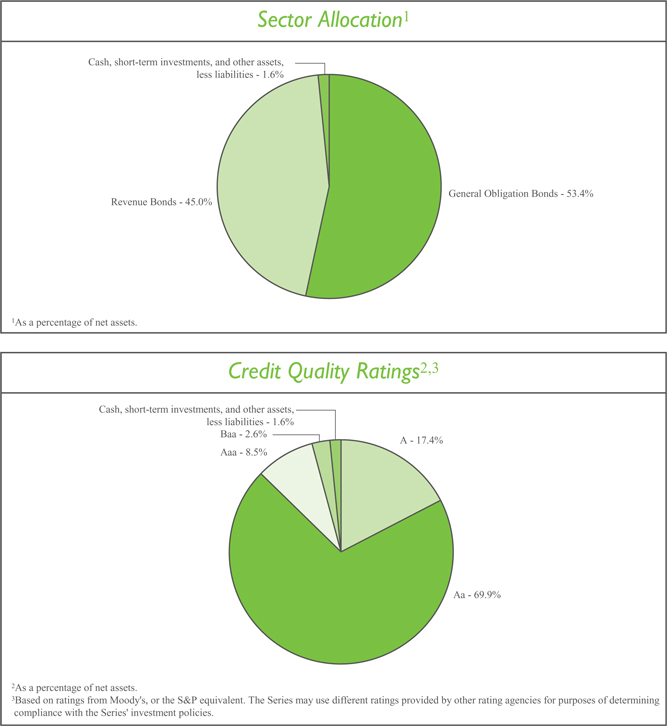
Investment Portfolio - December 31, 2010
| | | | | | | | | | | | | | | | | | |
| | | Coupon
Rate | | | Maturity
Date | | | Credit Rating1
(unaudited) | | Principal
Amount | | | Value (Note 2) | |
| | | | | |
NEW YORK MUNICIPAL BONDS - 98.4% | | | | | | | | | | | | | | | | | | |
| | | | | |
Albany County, Public Impt., G.O. Bond | | | 4.000% | | | | 6/1/2026 | | | Aa2 | | $ | 500,000 | | | $ | 474,005 | |
Arlington Central School District, G.O. Bond, NATL | | | 4.625% | | | | 12/15/2024 | | | Aa2 | | | 845,000 | | | | 858,419 | |
Arlington Central School District, G.O. Bond, NATL | | | 4.625% | | | | 12/15/2025 | | | Aa2 | | | 365,000 | | | | 369,566 | |
Bethlehem, Public Impt., G.O. Bond | | | 4.500% | | | | 12/1/2033 | | | AA2 | | | 335,000 | | | | 335,211 | |
Bethlehem, Public Impt., G.O. Bond | | | 4.500% | | | | 12/1/2035 | | | AA2 | | | 425,000 | | | | 421,838 | |
Briarcliff Manor, Public Impt., Series A, G.O. Bond, AMBAC | | | 4.000% | | | | 10/1/2025 | | | Aa2 | | | 280,000 | | | | 278,135 | |
Brookhaven, Public Impt., G.O. Bond, FGRNA | | | 4.000% | | | | 5/1/2023 | | | Aa2 | | | 900,000 | | | | 892,179 | |
Brookhaven, Public Impt., G.O. Bond, FGRNA | | | 4.000% | | | | 5/1/2024 | | | Aa2 | | | 815,000 | | | | 799,262 | |
Buffalo Fiscal Stability Authority, Sales Tax & State Aid, Series B, Revenue Bond, NATL | | | 5.000% | | | | 9/1/2016 | | | Aa1 | | | 525,000 | | | | 590,588 | |
Cayuga County, Public Impt., G.O. Bond, AGM | | | 3.250% | | | | 4/1/2026 | | | Aa3 | | | 670,000 | | | | 601,633 | |
Chautauqua County, Public Impt., G.O. Bond | | | 4.250% | | | | 1/15/2027 | | | A2 | | | 665,000 | | | | 652,099 | |
Chautauqua County, Public Impt., Series B, G.O. Bond, NATL | | | 4.500% | | | | 12/15/2018 | | | Aa3 | | | 485,000 | | | | 518,465 | |
Cleveland Hill Union Free School District, G.O. Bond, AGM | | | 3.750% | | | | 6/15/2025 | | | Aa3 | | | 475,000 | | | | 456,494 | |
Clifton Park Water Authority, Revenue Bond | | | 4.250% | | | | 10/1/2029 | | | AA2 | | | 250,000 | | | | 242,125 | |
Dryden Central School District, G.O. Bond, AGM | | | 5.500% | | | | 6/15/2011 | | | Aa3 | | | 200,000 | | | | 204,032 | |
Dutchess County, Public Impt., Prerefunded Balance, G.O. Bond, NATL | | | 4.000% | | | | 12/15/2016 | | | Aa1 | | | 315,000 | | | | 348,160 | |
Dutchess County, Public Impt., Unrefunded Balance, G.O. Bond, NATL | | | 4.000% | | | | 12/15/2016 | | | Aa1 | | | 360,000 | | | | 387,234 | |
East Rochester Union Free School District, G.O. Bond | | | 3.500% | | | | 3/15/2023 | | | AA2 | | | 380,000 | | | | 367,707 | |
Erie County Water Authority, Revenue Bond, NATL | | | 5.000% | | | | 12/1/2037 | | | Aa2 | | | 625,000 | | | | 623,138 | |
Franklin Square Union Free School District, G.O. Bond, FGRNA | | | 5.000% | | | | 1/15/2021 | | | Aa2 | | | 520,000 | | | | 530,093 | |
Gates Chili Central School District, G.O. Bond | | | 2.500% | | | | 6/15/2016 | | | Aa3 | | | 555,000 | | | | 566,067 | |
Gates Chili Central School District, G.O. Bond | | | 3.000% | | | | 6/15/2017 | | | Aa3 | | | 590,000 | | | | 608,868 | |
Geneva City, Public Impt., G.O. Bond, AGM | | | 3.250% | | | | 5/15/2018 | | | Aa3 | | | 590,000 | | | | 605,340 | |
Greece Central School District, G.O. Bond, AGM | | | 4.000% | | | | 6/15/2019 | | | Aa3 | | | 2,675,000 | | | | 2,817,738 | |
Hampton Bays Union Free School District, G.O. Bond, AGM | | | 4.250% | | | | 9/15/2026 | | | Aa3 | | | 1,140,000 | | | | 1,142,006 | |
Haverstraw-Stony Point Central School District, G.O. Bond, AGM | | | 4.500% | | | | 10/15/2032 | | | Aa2 | | | 2,000,000 | | | | 1,860,520 | |
Hempstead, Public Impt., Series A, G.O. Bond | | | 4.000% | | | | 4/15/2021 | | | Aaa | | | 1,500,000 | | | | 1,568,235 | |
Hyde Park Central School District, G.O. Bond, AGC | | | 3.500% | | | | 6/15/2018 | | | AA2 | | | 360,000 | | | | 374,926 | |
| | |
| 5 | | The accompanying notes are an integral part of the financial statements. |
Investment Portfolio - December 31, 2010
| | | | | | | | | | | | | | | | | | |
| | | Coupon
Rate | | | Maturity
Date | | | Credit
Rating1
(unaudited) | | Principal
Amount | | | Value
(Note 2) | |
| | | | | |
NEW YORK MUNICIPAL BONDS (continued) | | | | | | | | | | | | | | | | | | |
| | | | | |
Johnson City Central School District, G.O. Bond, FGRNA | | | 4.250% | | | | 6/15/2024 | | | A2 | | $ | 500,000 | | | $ | 487,970 | |
Johnson City Central School District, G.O. Bond, FGRNA | | | 4.375% | | | | 6/15/2028 | | | A2 | | | 1,000,000 | | | | 932,740 | |
Johnson City Central School District, G.O. Bond, FGRNA | | | 4.375% | | | | 6/15/2030 | | | A2 | | | 985,000 | | | | 896,951 | |
Lake George Central School District, G.O. Bond | | | 3.750% | | | | 7/15/2025 | | | AA2 | | | 335,000 | | | | 320,123 | |
Long Island Power Authority, Electric Systems, Series A, Revenue Bond | | | 5.750% | | | | 4/1/2039 | | | A3 | | | 675,000 | | | | 696,843 | |
Long Island Power Authority, Electric Systems, Series A, Revenue Bond, FGRNA | | | 5.000% | | | | 12/1/2019 | | | A3 | | | 1,000,000 | | | | 1,060,480 | |
Long Island Power Authority, Electric Systems, Series A, Revenue Bond, FGRNA | | | 5.000% | | | | 12/1/2025 | | | A3 | | | 1,690,000 | | | | 1,705,092 | |
Long Island Power Authority, Electric Systems, Series F, Revenue Bond, NATL | | | 4.500% | | | | 5/1/2028 | | | A3 | | | 1,880,000 | | | | 1,775,923 | |
Maine-Endwell Central School District, G.O. Bond, AGC | | | 4.000% | | | | 6/15/2025 | | | AA2 | | | 1,000,000 | | | | 966,890 | |
Mamaroneck Union Free School District, G.O. Bond | | | 3.500% | | | | 6/15/2025 | | | Aaa | | | 1,000,000 | | | | 944,450 | |
Marlboro Central School District, G.O. Bond, AGC | | | 4.000% | | | | 12/15/2026 | | | AA2 | | | 500,000 | | | | 486,745 | |
Metropolitan Transportation Authority, Dedicated Tax Fund, Series A, Revenue Bond, NATL | | | 5.000% | | | | 11/15/2030 | | | Aa3 | | | 750,000 | | | | 749,955 | |
Metropolitan Transportation Authority, Dedicated Tax Fund, Series B, Revenue Bond | | | 5.000% | | | | 11/15/2034 | | | AA2 | | | 1,000,000 | | | | 997,180 | |
Metropolitan Transportation Authority, Series A, Revenue Bond, AGM | | | 5.000% | | | | 11/15/2030 | | | Aa3 | | | 500,000 | | | | 493,770 | |
Metropolitan Transportation Authority, Series A, Revenue Bond, FGRNA | | | 5.000% | | | | 11/15/2025 | | | A2 | | | 1,500,000 | | | | 1,500,180 | |
Metropolitan Transportation Authority, Series B, Revenue Bond, AGM | | | 4.500% | | | | 11/15/2032 | | | Aa3 | | | 500,000 | | | | 444,680 | |
Metropolitan Transportation Authority, Series F, Revenue Bond | | | 5.000% | | | | 11/15/2030 | | | A2 | | | 640,000 | | | | 624,301 | |
Miller Place Union Free School District, G.O. Bond | | | 4.000% | | | | 2/15/2027 | | | Aa2 | | | 265,000 | | | | 248,061 | |
Minisink Valley Central School District, G.O. Bond | | | 3.500% | | | | 4/15/2025 | | | AA2 | | | 900,000 | | | | 841,077 | |
Monroe County Water Authority, Revenue Bond | | | 4.250% | | | | 8/1/2030 | | | Aa2 | | | 405,000 | | | | 373,519 | |
Monroe County Water Authority, Revenue Bond | | | 4.500% | | | | 8/1/2035 | | | Aa2 | | | 275,000 | | | | 257,876 | |
Monroe County, Public Impt., G.O. Bond, AMBAC | | | 4.125% | | | | 6/1/2020 | | | A3 | | | 1,000,000 | | | | 987,370 | |
| | |
| The accompanying notes are an integral part of the financial statements. | | 6 |
Investment Portfolio - December 31, 2010
| | | | | | | | | | | | | | | | | | |
| | | Coupon
Rate | | | Maturity
Date | | | Credit
Rating1
(unaudited) | | Principal
Amount | | | Value
(Note 2) | |
| | | | | |
NEW YORK MUNICIPAL BONDS (continued) | | | | | | | | | | | | | | | | | | |
| | | | | |
Nanuet Union Free School District, G.O. Bond, AGM | | | 4.300% | | | | 6/15/2029 | | | Aa2 | | $ | 505,000 | | | $ | 483,553 | |
Nassau County Interim Finance Authority, Sales Tax Secured, Series A, Revenue Bond, AMBAC | | | 4.750% | | | | 11/15/2023 | | | Aa1 | | | 1,000,000 | | | | 1,025,580 | |
Nassau County, Public Impt., Series A, G.O. Bond, AGC | | | 5.000% | | | | 5/1/2022 | | | Aa3 | | | 500,000 | | | | 541,895 | |
Nassau County, Public Impt., Series C, G.O. Bond | | | 4.000% | | | | 10/1/2026 | | | A1 | | | 1,000,000 | | | | 895,860 | |
Nassau County, Public Impt., Series C, G.O. Bond, AGC | | | 5.000% | | | | 10/1/2028 | | | Aa3 | | | 1,000,000 | | | | 1,033,570 | |
New Hyde Park & Garden City Park, Union Free School District, G.O. Bond, AGM | | | 4.125% | | | | 6/15/2023 | | | Aa2 | | | 200,000 | | | | 201,438 | |
New Hyde Park & Garden City Park, Union Free School District, G.O. Bond, AGM | | | 4.125% | | | | 6/15/2024 | | | Aa2 | | | 250,000 | | | | 251,043 | |
New York City Municipal Water Finance Authority, Water & Sewer Systems, Series A, Revenue Bond | | | 4.250% | | | | 6/15/2033 | | | Aa1 | | | 1,250,000 | | | | 1,126,675 | |
New York City Municipal Water Finance Authority, Water & Sewer Systems, Series A, Revenue Bond | | | 4.500% | | | | 6/15/2037 | | | Aa1 | | | 1,000,000 | | | | 927,050 | |
New York City Municipal Water Finance Authority, Water & Sewer Systems, Series A, Revenue Bond | | | 5.750% | | | | 6/15/2040 | | | Aa1 | | | 1,000,000 | | | | 1,062,790 | |
New York City Municipal Water Finance Authority, Water & Sewer Systems, Series A, Revenue Bond, AMBAC | | | 5.000% | | | | 6/15/2035 | | | Aa1 | | | 750,000 | | | | 743,708 | |
New York City Municipal Water Finance Authority, Water & Sewer Systems, Series D, Revenue Bond, AMBAC | | | 4.500% | | | | 6/15/2036 | | | Aa1 | | | 500,000 | | | | 464,210 | |
New York City Municipal Water Finance Authority, Water & Sewer Systems, Series E, Revenue Bond, FGRNA | | | 5.000% | | | | 6/15/2026 | | | Aa1 | | | 750,000 | | | | 758,835 | |
New York City, G.O. Bond, XLCA | | | 5.000% | | | | 9/1/2019 | | | Aa2 | | | 500,000 | | | | 536,555 | |
New York City, Series A, G.O. Bond, CIFG | | | 5.000% | | | | 8/1/2024 | | | Aa2 | | | 1,000,000 | | | | 1,031,860 | |
New York City, Series B, G.O. Bond | | | 4.250% | | | | 8/1/2037 | | | Aa2 | | | 1,000,000 | | | | 872,920 | |
New York City, Series G, G.O. Bond | | | 5.000% | | | | 8/1/2023 | | | Aa2 | | | 1,250,000 | | | | 1,307,900 | |
New York City, Series O, G.O. Bond | | | 5.000% | | | | 6/1/2033 | | | Aa2 | | | 1,050,000 | | | | 1,051,187 | |
New York Municipal Bond Bank Agency, Series A1, Revenue Bond, AGM | | | 5.000% | | | | 5/15/2017 | | | Aa3 | | | 215,000 | | | | 237,220 | |
New York Municipal Bond Bank Agency, Series B1, Revenue Bond, AGM | | | 5.000% | | | | 4/15/2018 | | | Aa3 | | | 1,000,000 | | | | 1,093,960 | |
New York State Dormitory Authority, Columbia University, Revenue Bond | | | 5.000% | | | | 7/1/2038 | | | Aaa | | | 900,000 | | | | 914,625 | |
| | |
| 7 | | The accompanying notes are an integral part of the financial statements. |
Investment Portfolio - December 31, 2010
| | | | | | | | | | | | | | | | |
| | | Coupon
Rate | | Maturity
Date | | | Credit
Rating1
(unaudited) | | Principal
Amount | | | Value
(Note 2) | |
| | | | |
NEW YORK MUNICIPAL BONDS (continued) | | | | | | | | | | | | | | |
| | | | | |
New York State Dormitory Authority, Columbia University, Series A, Revenue Bond | | 5.000% | | | 7/1/2025 | | | Aaa | | $ | 500,000 | | | $ | 507,745 | |
New York State Dormitory Authority, Cornell University, Series C, Revenue Bond | | 5.000% | | | 7/1/2037 | | | Aa1 | | | 1,000,000 | | | | 1,007,520 | |
New York State Dormitory Authority, Education, Series F, Revenue Bond | | 5.000% | | | 3/15/2023 | | | Aa3 | | | 1,475,000 | | | | 1,536,537 | |
New York State Dormitory Authority, New York University, Series A, Revenue Bond | | 5.000% | | | 7/1/2039 | | | Aa3 | | | 1,000,000 | | | | 995,480 | |
New York State Dormitory Authority, Series A, Revenue Bond, AGM | | 5.000% | | | 10/1/2018 | | | Aa3 | | | 250,000 | | | | 278,445 | |
New York State Dormitory Authority, Series A, Revenue Bond, AGM | | 5.000% | | | 10/1/2021 | | | Aa3 | | | 250,000 | | | | 268,647 | |
New York State Dormitory Authority, Series A, Revenue Bond, AGM | | 4.000% | | | 10/1/2025 | | | Aa3 | | | 1,500,000 | | | | 1,393,635 | |
New York State Dormitory Authority, Series A, Revenue Bond, AGM | | 4.375% | | | 10/1/2030 | | | Aa3 | | | 1,500,000 | | | | 1,387,530 | |
New York State Dormitory Authority, Series B, Revenue Bond, AGM | | 4.400% | | | 10/1/2030 | | | Aa3 | | | 140,000 | | | | 128,701 | |
New York State Dormitory Authority, Series B, Revenue Bond, AGM | | 4.750% | | | 10/1/2040 | | | Aa3 | | | 1,360,000 | | | | 1,239,082 | |
New York State Dormitory Authority, University of Rochester, Series A, Revenue Bond | | 5.125% | | | 7/1/2039 | | | Aa3 | | | 1,000,000 | | | | 991,850 | |
New York State Environmental Facilities Corp., Clean Water & Drinking, Revenue Bond | | 4.500% | | | 6/15/2022 | | | Aaa | | | 300,000 | | | | 305,982 | |
New York State Environmental Facilities Corp., Clean Water & Drinking, Revenue Bond, NATL | | 5.000% | | | 6/15/2021 | | | Aaa | | | 600,000 | | | | 632,916 | |
New York State Environmental Facilities Corp., Clean Water & Drinking, Series A, Revenue Bond | | 4.500% | | | 6/15/2036 | | | Aaa | | | 1,000,000 | | | | 940,770 | |
New York State Environmental Facilities Corp., Clean Water & Drinking, Series B, Revenue Bond | | 5.000% | | | 6/15/2027 | | | Aaa | | | 1,000,000 | | | | 1,003,450 | |
New York State Environmental Facilities Corp., Clean Water & Drinking, Series B, Revenue Bond | | 4.500% | | | 6/15/2036 | | | Aa1 | | | 1,500,000 | | | | 1,407,000 | |
New York State Environmental Facilities Corp., Personal Income Tax, Series A, Revenue Bond | | 5.000% | | | 12/15/2019 | | | AAA2 | | | 750,000 | | | | 808,478 | |
New York State Environmental Facilities Corp., Pollution Control, Unrefunded Balance, Series A, Revenue Bond | | 5.200% | | | 6/15/2015 | | | Aaa | | | 25,000 | | | | 25,089 | |
| | |
| The accompanying notes are an integral part of the financial statements. | | 8 |
Investment Portfolio - December 31, 2010
| | | | | | | | | | | | | | | | | | |
| | | Coupon
Rate | | | Maturity
Date | | | Credit
Rating1
(unaudited) | | Principal
Amount | | | Value
(Note 2) | |
| | | | | |
NEW YORK MUNICIPAL BONDS (continued) | | | | | | | | | | | | | | | | | | |
| | | | | |
New York State Environmental Facilities Corp., Pollution Control, Unrefunded Balance, Series B, Revenue Bond | | | 5.200% | | | | 5/15/2014 | | | Aaa | | $ | 440,000 | | | $ | 463,021 | |
New York State Housing Finance Agency, State University Construction, Series A, Revenue Bond | | | 8.000% | | | | 5/1/2011 | | | Aa3 | | | 30,000 | | | | 30,660 | |
New York State Municipal Bond Bank Agency, Series B1, Revenue Bond | | | 4.125% | | | | 12/15/2029 | | | A2 | | | 420,000 | | | | 373,657 | |
New York State Municipal Bond Bank Agency, Series B1, Revenue Bond | | | 4.500% | | | | 12/15/2034 | | | A2 | | | 215,000 | | | | 194,242 | |
New York State Power Authority, Series A, Revenue Bond, NATL | | | 4.500% | | | | 11/15/2047 | | | Aa2 | | | 2,000,000 | | | | 1,818,860 | |
New York State Thruway Authority, Highway & Bridge, Prerefunded Balance, Series A, Revenue Bond, FGIC | | | 5.500% | | | | 4/1/2015 | | | Aa2 | | | 320,000 | | | | 327,318 | |
New York State Thruway Authority, Highway & Bridge, Prerefunded Balance, Series B, Revenue Bond, NATL | | | 5.250% | | | | 4/1/2016 | | | AAA2 | | | 300,000 | | | | 310,977 | |
New York State Thruway Authority, Highway & Bridge, Series B, Revenue Bond, AMBAC | | | 5.000% | | | | 4/1/2021 | | | AA2 | | | 1,500,000 | | | | 1,572,255 | |
New York State Thruway Authority, Highway & Bridge, Series C, Revenue Bond, AMBAC | | | 5.000% | | | | 4/1/2020 | | | Aa3 | | | 750,000 | | | | 781,875 | |
New York State Thruway Authority, Highway & Bridge, Series C, Revenue Bond, NATL | | | 5.250% | | | | 4/1/2011 | | | Aa2 | | | 1,000,000 | | | | 1,012,330 | |
New York State Thruway Authority, Personal Income Tax, Prerefunded Balance, Series A, Revenue Bond, AGM | | | 5.000% | | | | 3/15/2014 | | | Aa3 | | | 500,000 | | | | 544,385 | |
New York State Thruway Authority, Personal Income Tax, Prerefunded Balance, Series A, Revenue Bond, NATL | | | 5.000% | | | | 3/15/2016 | | | AAA2 | | | 300,000 | | | | 326,631 | |
New York State Thruway Authority, Series F, Revenue Bond, AMBAC | | | 5.000% | | | | 1/1/2026 | | | A1 | | | 340,000 | | | | 340,731 | |
New York State Urban Development Corp., Correctional Capital Facilities, Series A, Revenue Bond, AGM | | | 5.250% | | | | 1/1/2014 | | | Aa3 | | | 500,000 | | | | 536,635 | |
New York State Urban Development Corp., Personal Income Tax, Series C, Revenue Bond, NATL | | | 4.250% | | | | 3/15/2024 | | | Baa1 | | | 1,000,000 | | | | 1,010,100 | |
New York State Urban Development Corp., Service Contract, Series B, Revenue Bond | | | 5.250% | | | | 1/1/2022 | | | AA2 | | | 2,350,000 | | | | 2,515,158 | |
New York State, Series A, G.O. Bond | | | 4.600% | | | | 3/15/2013 | | | Aa2 | | | 475,000 | | | | 483,208 | |
New York State, Series C, G.O. Bond | | | 4.000% | | | | 2/1/2027 | | | Aa2 | | | 600,000 | | | | 570,990 | |
New York State, Series C, G.O. Bond, AGM | | | 5.000% | | | | 4/15/2012 | | | Aa2 | | | 700,000 | | | | 740,404 | |
| | |
| 9 | | The accompanying notes are an integral part of the financial statements. |
Investment Portfolio - December 31, 2010
| | | | | | | | | | | | | | | | |
| | | Coupon
Rate | | Maturity
Date | | | Credit
Rating1
(unaudited) | | Principal
Amount | | | Value (Note 2) | |
| | | | |
NEW YORK MUNICIPAL BONDS (continued) | | | | | | | | | | | | | | |
| | | | | |
New York State, Transit Impt., Series A, G.O. Bond | | 4.500% | | | 3/1/2040 | | | Aa2 | | $ | 1,500,000 | | | $ | 1,400,685 | |
New York State, Water Utility Impt., Series A, G.O. Bond | | 4.500% | | | 3/15/2019 | | | Aa2 | | | 500,000 | | | | 528,675 | |
Niagara County, Series B, G.O. Bond, NATL | | 5.200% | | | 1/15/2011 | | | Baa1 | | | 400,000 | | | | 400,688 | |
Niagara Falls City School District, G.O. Bond, AGM | | 4.375% | | | 9/15/2029 | | | AA2 | | | 885,000 | | | | 856,910 | |
Niagara-Wheatfield Central School District, G.O. Bond, FGRNA | | 4.125% | | | 2/15/2019 | | | Aa3 | | | 610,000 | | | | 645,581 | |
Niagara-Wheatfield Central School District, G.O. Bond, FGRNA | | 4.125% | | | 2/15/2020 | | | Aa3 | | | 850,000 | | | | 883,677 | |
Niskayuna Central School District, G.O Bond, AGC | | 4.000% | | | 4/15/2022 | | | Aa2 | | | 400,000 | | | | 405,952 | |
Onondaga County, Series A, G.O. Bond | | 4.500% | | | 3/1/2028 | | | Aa1 | | | 365,000 | | | | 368,511 | |
Orangetown, Public Impt., G.O. Bond | | 3.000% | | | 9/15/2026 | | | Aa2 | | | 580,000 | | | | 507,987 | |
Otsego County, G.O. Bond | | 4.000% | | | 11/15/2027 | | | Aa3 | | | 790,000 | | | | 769,144 | |
Palmyra Macedon Central School District, G.O. Bond | | 3.750% | | | 6/15/2024 | | | Aa3 | | | 500,000 | | | | 487,845 | |
Pembroke Central School District, G.O. Bond | | 4.000% | | | 6/15/2023 | | | AA2 | | | 500,000 | | | | 506,325 | |
Penfield Central School District, G.O. Bond | | 4.000% | | | 6/15/2024 | | | Aa2 | | | 1,025,000 | | | | 1,021,290 | |
Perinton, Public Impt., G.O. Bond | | 4.250% | | | 12/15/2031 | | | AA2 | | | 175,000 | | | | 170,027 | |
Phelps-Clifton Springs Central School District, Series B, G.O. Bond, NATL | | 5.000% | | | 6/15/2021 | | | A1 | | | 850,000 | | | | 876,257 | |
Phelps-Clifton Springs Central School District, | | | | | | | | | | | | | | | | |
Series B, G.O. Bond, NATL | | 5.000% | | | 6/15/2022 | | | A1 | | | 450,000 | | | | 461,916 | |
Pleasantville Union Free School District, G.O. Bond | | 4.250% | | | 5/1/2038 | | | Aa2 | | | 500,000 | | | | 441,095 | |
Pleasantville Union Free School District, G.O. Bond | | 4.375% | | | 5/1/2039 | | | Aa2 | | | 500,000 | | | | 445,680 | |
Port Authority of New York & New Jersey, Revenue Bond | | 5.000% | | | 7/15/2024 | | | Aa2 | | | 3,000,000 | | | | 3,157,440 | |
Port Authority of New York & New Jersey, Revenue Bond | | 4.750% | | | 7/15/2030 | | | Aa2 | | | 495,000 | | | | 483,897 | |
Port Authority of New York & New Jersey, Revenue Bond | | 5.000% | | | 10/1/2030 | | | Aa2 | | | 1,000,000 | | | | 1,005,880 | |
Port Authority of New York & New Jersey, Revenue Bond | | 4.500% | | | 10/15/2037 | | | Aa2 | | | 400,000 | | | | 370,072 | |
Pulaski Central School District, Series A, G.O. Bond, FGRNA | | 4.500% | | | 6/15/2026 | | | A2 | | | 425,000 | | | | 426,828 | |
Ramapo, Public Impt., Series B, G.O. Bond, NATL | | 4.375% | | | 5/1/2031 | | | Aa2 | | | 435,000 | | | | 410,601 | |
Ramapo, Public Impt., Series B, G.O. Bond, NATL | | 4.375% | | | 5/1/2032 | | | Aa2 | | | 510,000 | | | | 477,345 | |
| | |
| The accompanying notes are an integral part of the financial statements. | | 10 |
Investment Portfolio - December 31, 2010
| | | | | | | | | | | | | | | | | | |
| | | Coupon
Rate | | | Maturity
Date | | | Credit
Rating1
(unaudited) | | Principal
Amount | | | Value (Note 2) | |
| | | | | |
NEW YORK MUNICIPAL BONDS (continued) | | | | | | | | | | | | | | | | | | |
| | | | | |
Ramapo, Public Impt., Series B, G.O. Bond, NATL | | | 4.500% | | | | 5/1/2033 | | | Aa2 | | $ | 410,000 | | | $ | 391,611 | |
Ravena Coeymans Selkirk Central School District, G.O. Bond, AGM | | | 4.250% | | | | 6/15/2014 | | | Aa3 | | | 1,180,000 | | | | 1,273,432 | |
Rochester City, Series A, G.O. Bond, AMBAC | | | 5.000% | | | | 8/15/2020 | | | Aa3 | | | 250,000 | | | | 281,447 | |
Rochester City, Series A, G.O. Bond, AMBAC | | | 5.000% | | | | 8/15/2022 | | | A2 | | | 95,000 | | | | 105,806 | |
Sachem Central School District of Holbrook, G.O. Bond, FGRNA | | | 4.250% | | | | 10/15/2028 | | | AA2 | | | 330,000 | | | | 317,255 | |
Sachem Central School District of Holbrook, G.O. Bond, FGRNA | | | 4.375% | | | | 10/15/2030 | | | AA2 | | | 1,000,000 | | | | 941,150 | |
Sachem Central School District of Holbrook, Series B, G.O. Bond, FGRNA | | | 4.250% | | | | 10/15/2026 | | | AA2 | | | 1,200,000 | | | | 1,189,572 | |
Saratoga County Water Authority, Water Utility Impt., Revenue Bond | | | 5.000% | | | | 9/1/2038 | | | AA2 | | | 950,000 | | | | 945,706 | |
Saratoga County, Public Impt., Series A, G.O. Bond | | | 4.750% | | | | 7/15/2036 | | | Aa1 | | | 820,000 | | | | 811,603 | |
Saratoga County, Sewer Impt., Series B, G.O. Bond | | | 4.200% | | | | 7/15/2032 | | | AA2 | | | 425,000 | | | | 383,371 | |
Saratoga County, Sewer Impt., Series B, G.O. Bond | | | 4.250% | | | | 7/15/2035 | | | AA2 | | | 700,000 | | | | 631,736 | |
Saratoga Springs City School District, G.O. Bond | | | 5.000% | | | | 6/15/2019 | | | AA2 | | | 245,000 | | | | 281,314 | |
Schenectady, G.O. Bond, NATL | | | 5.300% | | | | 2/1/2011 | | | A1 | | | 250,000 | | | | 250,877 | |
Schroon Lake Central School District, G.O. Bond, AGM | | | 4.000% | | | | 6/15/2027 | | | Aa3 | | | 490,000 | | | | 477,294 | |
Schuylerville Central School District, G.O. Bond, AGM | | | 4.000% | | | | 6/15/2025 | | | AA2 | | | 500,000 | | | | 496,735 | |
Somers Central School District, G.O. Bond, NATL | | | 4.000% | | | | 12/1/2023 | | | Aa2 | | | 400,000 | | | | 396,008 | |
South Country Central School District at Brookhaven, G.O. Bond, AGM | | | 4.000% | | | | 7/15/2027 | | | AA2 | | | 750,000 | | | | 694,493 | |
South Glens Falls Central School District, Unrefunded Balance, G.O. Bond, FGRNA | | | 5.375% | | | | 6/15/2018 | | | A1 | | | 95,000 | | | | 96,805 | |
Spencerport Fire District, G.O. Bond, AGC | | | 4.500% | | | | 11/15/2031 | | | AA2 | | | 290,000 | | | | 288,431 | |
Spencerport Fire District, G.O. Bond, AGC | | | 4.500% | | | | 11/15/2032 | | | AA2 | | | 250,000 | | | | 246,225 | |
St. Lawrence County, Public Impt., G.O. Bond, FGRNA | | | 4.500% | | | | 5/15/2031 | | | A2 | | | 1,185,000 | | | | 1,095,497 | |
St. Lawrence County, Public Impt., G.O. Bond, FGRNA | | | 4.500% | | | | 5/15/2032 | | | A2 | | | 1,000,000 | | | | 916,310 | |
Suffolk County Water Authority, Revenue Bond, NATL | | | 4.500% | | | | 6/1/2027 | | | Baa1 | | | 1,160,000 | | | | 1,136,220 | |
Suffolk County Water Authority, Series A, Revenue Bond | | | 4.500% | | | | 6/1/2030 | | | AA2 | | | 640,000 | | | | 608,602 | |
| | |
| 11 | | The accompanying notes are an integral part of the financial statements. |
Investment Portfolio - December 31, 2010
| | | | | | | | | | | | | | | | |
| | | Coupon
Rate | | Maturity
Date | | | Credit
Rating1
(unaudited) | | Principal
Amount | | | Value
(Note 2) | |
| | | | |
NEW YORK MUNICIPAL BONDS (continued) | | | | | | | | | | | | | | |
| | | | | |
Suffolk County Water Authority, Series A, Revenue Bond, NATL | | 4.500% | | | 6/1/2032 | | | Baa1 | | $ | 1,000,000 | | | $ | 933,440 | |
Suffolk County, Public Impt., Series A, G.O. Bond, NATL | | 4.250% | | | 5/1/2024 | | | Aa2 | | | 1,000,000 | | | | 1,005,640 | |
Syracuse, Public Impt., Series A, G.O. Bond, FGRNA | | 4.250% | | | 12/1/2028 | | | A1 | | | 600,000 | | | | 546,468 | |
Syracuse, Public Impt., Series A, G.O. Bond, FGRNA | | 4.250% | | | 12/1/2029 | | | A1 | | | 600,000 | | | | 539,226 | |
Syracuse, Public Impt., Series A, G.O. Bond, NATL | | 4.250% | | | 6/15/2023 | | | A1 | | | 690,000 | | | | 663,352 | |
Syracuse, Public Impt., Series A, G.O. Bond, NATL | | 4.375% | | | 6/15/2025 | | | A1 | | | 990,000 | | | | 934,144 | |
Tarrytowns Union Free School District, G.O. Bond, AMBAC | | 4.250% | | | 1/15/2030 | | | Aa2 | | | 215,000 | | | | 197,972 | |
Tarrytowns Union Free School District, G.O. Bond, AMBAC | | 4.375% | | | 1/15/2032 | | | Aa2 | | | 1,090,000 | | | | 1,004,599 | |
Tompkins County, Public Impt., G.O. Bond | | 4.250% | | | 12/15/2032 | | | Aa1 | | | 300,000 | | | | 292,464 | |
Triborough Bridge & Tunnel Authority, General Purposes, Prerefunded Balance, Series A, Revenue Bond, NATL | | 4.750% | | | 1/1/2019 | | | AA2 | | | 300,000 | | | | 341,367 | |
Triborough Bridge & Tunnel Authority, General Purposes, Prerefunded Balance, Series A, Revenue Bond, NATL | | 5.000% | | | 1/1/2032 | | | AAA2 | | | 1,695,000 | | | | 1,771,156 | |
Triborough Bridge & Tunnel Authority, General Purposes, Series B, Revenue Bond | | 5.000% | | | 11/15/2020 | | | Aa2 | | | 750,000 | | | | 782,018 | |
Triborough Bridge & Tunnel Authority, General Purposes, Unrefunded Balance, Series A, Revenue Bond, NATL | | 5.000% | | | 1/1/2032 | | | Aa2 | | | 305,000 | | | | 305,088 | |
Triborough Bridge & Tunnel Authority, Series C, Revenue Bond | | 5.000% | | | 11/15/2038 | | | Aa2 | | | 900,000 | | | | 901,107 | |
Triborough Bridge & Tunnel Authority, Subordinate Bonds, Revenue Bond, FGRNA . | | 5.000% | | | 11/15/2032 | | | Aa3 | | | 1,000,000 | | | | 1,000,740 | |
Ulster County, Public Impt., G.O. Bond, XLCA | | 4.500% | | | 11/15/2026 | | | AA2 | | | 560,000 | | | | 565,919 | |
Ulster County, Public Impt., Series A, G.O. Bond, FGRNA | | 4.250% | | | 11/15/2021 | | | AA2 | | | 200,000 | | | | 205,038 | |
Union Endicott Central School District, G.O. Bond, FGRNA | | 4.125% | | | 6/15/2014 | | | A2 | | | 605,000 | | | | 651,264 | |
Union Endicott Central School District, G.O. Bond, FGRNA | | 4.125% | | | 6/15/2015 | | | A2 | | | 865,000 | | | | 933,923 | |
Village of Fayetteville, Public Impt., Series A, G.O. Bond, AGM | | 4.000% | | | 6/15/2025 | | | Aa3 | | | 555,000 | | | | 548,384 | |
Wayne County, Public Impt., G.O. Bond, NATL | | 4.125% | | | 6/1/2024 | | | Aa2 | | | 500,000 | | | | 501,650 | |
West Seneca Central School District, G.O. Bond, AGM | | 5.000% | | | 5/1/2011 | | | Aa3 | | | 300,000 | | | | 304,716 | |
| | |
| The accompanying notes are an integral part of the financial statements. | | 12 |
Investment Portfolio - December 31, 2010
| | | | | | | | | | | | | | | | | | |
| | | Coupon Rate | | | Maturity Date | | | Credit Rating1 (unaudited) | | Principal Amount/ Shares | | | Value (Note 2) | |
| | | | | |
NEW YORK MUNICIPAL BONDS (continued) | | | | | | | | | | | | | | | | | | |
| | | | | |
Westchester County, Public Impt., Series B, G.O. Bond | | | 4.300% | | | | 12/15/2011 | | | Aaa | | $ | 15,000 | | | $ | 15,569 | |
Westchester County, Public Impt., Series B, G.O. Bond | | | 3.700% | | | | 12/15/2015 | | | Aaa | | | 1,000,000 | | | | 1,060,650 | |
Westhampton Beach Union Free School District, G.O. Bond, NATL | | | 4.000% | | | | 7/15/2018 | | | Aa2 | | | 726,000 | | | | 764,275 | |
White Plains City School District, Series B, G.O. Bond | | | 4.650% | | | | 5/15/2031 | | | Aa2 | | | 685,000 | | | | 702,680 | |
Yonkers City, Series B, G.O. Bond, NATL | | | 5.000% | | | | 8/1/2023 | | | A2 | | | 1,125,000 | | | | 1,127,183 | |
Yonkers City, Series B, G.O. Bond, NATL | | | 5.000% | | | | 8/1/2030 | | | A2 | | | 1,095,000 | | | | 1,006,907 | |
| | | | | | | | | | | | | | | | | | |
TOTAL MUNICIPAL BONDS
(Identified Cost $136,126,767) | | | | | | | | | | | | | | | | | 134,035,734 | |
| | | | | | | | | | | | | | | | | | |
| | | | | |
SHORT-TERM INVESTMENTS - 0.8% | | | | | | | | | | | | | | | | | | |
| | | | | |
Dreyfus BASIC New York Municipal Money Market Fund (Identified Cost $1,115,340) | | | | | | | | | | | | | 1,115,340 | | | | 1,115,340 | |
| | | | | | | | | | | | | | | | | | |
TOTAL INVESTMENTS - 99.2%
(Identified Cost $137,242,107) | | | | | | | | | | | | | | | | | 135,151,074 | |
OTHER ASSETS, LESS LIABILITIES - 0.8% | | | | | | | | | | | | | | | | | 1,074,296 | |
| | | | | | | | | | | | | | | | | | |
NET ASSETS - 100% | | | | | | | | | | | | | | | | $ | 136,225,370 | |
| | | | | | | | | | | | | | | | | | |
KEY:
G.O. Bond - General Obligation Bond
Impt. - Improvement
Scheduled principal and interest payments are guaranteed by:
AGC (Assured Guaranty Corp.)
AGM (Assurance Guaranty Municipal Corp.)
AMBAC (AMBAC Assurance Corp.)
CIFG (CIFG North America, Inc.)
FGIC (Financial Guaranty Insurance Co.)
FGRNA (FGIC reinsured by NATL)
NATL (National Public Finance Guarantee Corp.)
XLCA (XL Capital Assurance)
The insurance does not guarantee the market value of the municipal bonds.
1Credit ratings from Moody’s (unaudited).
2Credit ratings from S&P (unaudited).
The Series’ portfolio holds, as a percentage of net assets, greater than 10% in bonds insured by the following companies:
NATL - 33.4%; AGM - 16.2%.
| | |
| 13 | | The accompanying notes are an integral part of the financial statements. |
Statement of Assets and Liabilities
December 31, 2010
| | | | |
ASSETS: | | | | |
| |
Investments, at value (identified cost $137,242,107) (Note 2) | | | $135,151,074 | |
Interest receivable | | | 1,446,422 | |
Receivable for fund shares sold | | | 250,052 | |
Dividends receivable | | | 8 | |
| | | | |
| |
TOTAL ASSETS | | | 136,847,556 | |
| | | | |
| |
LIABILITIES: | | | | |
| |
Accrued management fees (Note 3) | | | 59,061 | |
Accrued fund accounting and administration fees (Note 3) | | | 9,584 | |
Accrued transfer agent fees (Note 3) | | | 770 | |
Accrued Chief Compliance Officer service fees (Note 3) | | | 245 | |
Payable for fund shares repurchased | | | 509,754 | |
Other payables and accrued expenses | | | 42,772 | |
| | | | |
| |
TOTAL LIABILITIES | | | 622,186 | |
| | | | |
| |
TOTAL NET ASSETS | | | $136,225,370 | |
| | | | |
| |
NET ASSETS CONSIST OF: | | | | |
| |
Capital stock | | | $ 133,648 | |
Additional paid-in-capital | | | 138,023,429 | |
Undistributed net investment income | | | 159,777 | |
Accumulated net realized loss on investments | | | (451 | ) |
Net unrealized depreciation on investments | | | (2,091,033 | ) |
| | | | |
| |
TOTAL NET ASSETS | | | $136,225,370 | |
| | | | |
| |
NET ASSET VALUE, OFFERING PRICE AND REDEMPTION PRICE PER SHARE -
Class A ($136,225,370/13,364,784 shares) | | | $ 10.19 | |
| | | | |
| | |
| The accompanying notes are an integral part of the financial statements. | | 14 |
Statement of Operations
For the Year Ended December 31, 2010
| | | | |
INVESTMENT INCOME: | | | | |
| |
Interest | | $ | 5,246,230 | |
Dividends | | | 195 | |
| | | | |
| |
Total Investment Income | | | 5,246,425 | |
| | | | |
| |
EXPENSES: | | | | |
| |
Management fees (Note 3) | | | 652,227 | |
Fund accounting and administration fees (Note 3) | | | 70,173 | |
Directors’ fees (Note 3) | | | 8,875 | |
Transfer agent fees (Note 3) | | | 4,398 | |
Chief Compliance Officer service fees (Note 3) | | | 2,630 | |
Custodian fees | | | 6,976 | |
Miscellaneous | | | 55,116 | |
| | | | |
| |
Total Expenses | | | 800,395 | |
Less reduction of expenses (Note 3) | | | (758 | ) |
| | | | |
| |
Net Expenses | | | 799,637 | |
| | | | |
| |
NET INVESTMENT INCOME | | | 4,446,788 | |
| | | | |
| |
REALIZED AND UNREALIZED GAIN (LOSS) ON INVESTMENTS: | | | | |
| |
Net realized gain on investments | | | 46,036 | |
Net change in unrealized appreciation (depreciation) on investments | | | (4,689,742 | ) |
| | | | |
| |
NET REALIZED AND UNREALIZED LOSS ON INVESTMENTS | | | (4,643,706 | ) |
| | | | |
| |
NET DECREASE IN NET ASSETS RESULTING FROM OPERATIONS | | $ | (196,918 | ) |
| | | | |
| | |
| 15 | | The accompanying notes are an integral part of the financial statements. |
Statements of Changes in Net Assets
| | | | | | | | |
| | | For the Year Ended
12/31/10 | | | For the Year Ended
12/31/09 | |
INCREASE (DECREASE) IN NET ASSETS: | | | | | | | | |
| | |
OPERATIONS: | | | | | | | | |
| | |
Net investment income | | | $ 4,446,788 | | | | $ 3,752,622 | |
Net realized gain on investments | | | 46,036 | | | | 236,539 | |
Net change in unrealized appreciation (depreciation) on investments | | | (4,689,742 | ) | | | 7,946,641 | |
| | | | | | | | |
| | |
Net increase (decrease) from operations | | | (196,918 | ) | | | 11,935,802 | |
| | | | | | | | |
| | |
DISTRIBUTIONS TO SHAREHOLDERS (Note 8): | | | | | | | | |
| | |
From net investment income | | | (4,857,125 | ) | | | (4,042,429 | ) |
From net realized gain on investments | | | (113,664 | ) | | | (341,360 | ) |
| | | | | | | | |
| | |
Total distributions to shareholders | | | (4,970,789 | ) | | | (4,383,789 | ) |
| | | | | | | | |
| | |
CAPITAL STOCK ISSUED AND REPURCHASED: | | | | | | | | |
| | |
Net increase from capital share transactions (Note 5) | | | 30,861,062 | | | | 5,778,371 | |
| | | | | | | | |
| | |
Net increase in net assets | | | 25,693,355 | | | | 13,330,384 | |
| | |
NET ASSETS: | | | | | | | | |
| | |
Beginning of year | | | 110,532,015 | | | | 97,201,631 | |
| | | | | | | | |
| | |
End of year (including undistributed net investment income of $159,777 and $577,775, respectively) | | | $136,225,370 | | | | $110,532,015 | |
| | | | | | | | |
| | |
| The accompanying notes are an integral part of the financial statements. | | 16 |
Financial Highlights
| | | | | | | | | | | | | | | | | | | | |
| | | |
| | | | | | For the Years Ended | | | | |
| | | 12/30/10 | | | 12/31/09 | | | 12/31/08 | | | 12/31/07 | | | 12/31/06 | |
Per share data (for a share outstanding throughout each year): | | | | | | | | | | | | | | | | | | | | |
Net asset value - Beginning of year | | | $10.55 | | | | $9.79 | | | | $10.41 | | | | $10.44 | | | | $10.45 | |
| | | | | | | | | | | | | | | | | | | | |
Income (loss) from investment operations: | | | | | | | | | | | | | | | | | | | | |
Net investment income | | | 0.361 | | | | 0.381 | | | | 0.38 | | | | 0.37 | | | | 0.38 | |
Net realized and unrealized gain (loss) on investments | | | (0.32) | | | | 0.82 | | | | (0.63) | | | | (0.01) | | | | (0.02) | |
| | | | | | | | | | | | | | | | | | | | |
Total from investment operations | | | 0.04 | | | | 1.20 | | | | (0.25) | | | | 0.36 | | | | 0.36 | |
| | | | | | | | | | | | | | | | | | | | |
Less distributions to shareholders: | | | | | | | | | | | | | | | | | | | | |
From net investment income | | | (0.39) | | | | (0.41) | | �� | | (0.36) | | | | (0.37) | | | | (0.36) | |
From net realized gain on investments | | | (0.01) | | | | (0.03) | | | | (0.01) | | | | (0.02) | | | | (0.01) | |
| | | | | | | | | | | | | | | | | | | | |
Total distributions to shareholders | | | (0.40) | | | | (0.44) | | | | (0.37) | | | | (0.39) | | | | (0.37) | |
| | | | | | | | | | | | | | | | | | | | |
Net asset value - End of year | | | $10.19 | | | | $10.55 | | | | $9.79 | | | | $10.41 | | | | $10.44 | |
| | | | | | | | | | | | | | | | | | | | |
Net assets - End of year (000’s omitted) | | | $136,225 | | | | $110,532 | | | | $97,202 | | | | $111,704 | | | | $92,910 | |
| | | | | | | | | | | | | | | | | | | | |
Total return2 | | | 0.32% | | | | 12.46% | | | | (2.37%) | | | | 3.44% | | | | 3.48% | |
Ratios (to average net assets)/ Supplemental Data: | | | | | | | | | | | | | | | | | | | | |
Expenses* | | | 0.61% | | | | 0.64% | | | | 0.64% | | | | 0.65% | | | | 0.68% | |
Net investment income | | | 3.41% | | | | 3.64% | | | | 3.71% | | | | 3.66% | | | | 3.68% | |
Portfolio turnover | | | 7% | | | | 10% | | | | 11% | | | | 7% | | | | 8% | |
|
*The investment advisor did not impose all or a portion of its management fees, CCO fees, fund accounting and transfer agent fees, and other fees in some years and in some years paid a portion of the Series’ expenses. If these expenses had been incurred by the Series, the expense ratio (to average net assets) would have been increased by the following amounts: | |
| | | 0.00%3 | | | | 0.00%3 | | | | N/A | | | | N/A | | | | N/A | |
1Calculated based on average shares outstanding during the year.
2Represents aggregate total return for the periods indicated, and assumes reinvestment of all distributions. Total return would have been lower had certain expenses not been waived or reimbursed during the periods. Periods less than one year are not annualized.
3Less than 0.01%.
| | |
| 17 | | The accompanying notes are an integral part of the financial statements. |
Notes to Financial Statements
New York Tax Exempt Series (the “Series”) is a no-load diversified series of Manning & Napier Fund, Inc. (the “Fund”). The Fund is organized in Maryland and is registered under the Investment Company Act of 1940, as amended, as an open-end management investment company.
The Series’ investment objective is to provide as high a level of current income exempt from federal income tax and New York State personal income tax as the Advisor believes is consistent with the preservation of capital.
The Fund’s Advisor is Manning & Napier Advisors, Inc. (the “Advisor”). Shares of the Series are offered to investors, clients and employees of the Advisor and its affiliates. The total authorized capital stock of the Fund consists of 10.0 billion shares of common stock each having a par value of $0.01. As of December 31, 2010, 6.2 billion shares have been designated in total among 29 series, of which 100 million have been designated as New York Tax Exempt Series Class A common stock.
| 2. | SIGNIFICANT ACCOUNTING POLICIES |
Security Valuation
Municipal securities will normally be valued on the basis of market valuations provided by an independent pricing service (the “Service”). The Service utilizes the latest price quotations and a matrix system (which considers such factors as security prices of similar securities, yields, maturities and ratings). The Service has been approved by the Fund’s Board of Directors (the “Board”).
Short-term investments that mature in sixty days or less are valued at amortized cost, which approximates market value. Investments in open-end investment companies are valued at their net asset value per share on valuation date.
Volume and level of activity in established markets for an asset or liability are evaluated to determine whether recent transactions and quoted prices are determinative of fair value. Where there have been significant decreases in volume and level of activity, further analysis and adjustment may be necessary to estimate fair value. The Series measures fair value in these instances by the use of inputs and valuation techniques which may be based upon current market prices of securities that are comparable in coupon, rating, maturity and industry and/or expectation of future cash flows. As a result of trading in relatively thin markets and/or markets that experience significant volatility, the prices used by the Series to value these securities may differ from the value that would be realized if these securities were sold, and the differences could be material.
Securities for which representative valuations or prices are not available from the Fund’s pricing service may be valued at fair value. Due to the inherent uncertainty of valuations of such securities, the fair value may differ significantly from the values that would have been used had a ready market for such securities existed. If trading or events occurring after the close of the principal market in which securities are traded are expected to materially affect the value of those securities, then they may be valued at their fair value, taking this trading or these events into account. Fair value is determined in good faith by the Advisor under procedures approved by and under the general supervision and responsibility of the Board.
Various inputs are used in determining the value of the Series’ assets or liabilities carried at market value. These inputs are summarized in three broad levels. Level 1 includes quoted prices in active markets for identical assets and liabilities. Level 2 includes other significant observable inputs (including quoted prices for similar securities, interest rates, prepayment speeds, credit risk, etc.). Level 3 includes significant unobservable inputs (including the Series’ own assumptions in determining the fair value of investments). The inputs or methodology used for valuing securities are not necessarily an indication of the risk associated with investing in those securities.
Notes to Financial Statements
| 2. | SIGNIFICANT ACCOUNTING POLICIES (continued) |
Security Valuation (continued)
The following is a summary of the valuation levels used for major security types as of December 31, 2010 in valuing the Series’ assets or liabilities carried at market value:
| | | | | | | | | | | | | | | | |
| Description | | Total | | | Level 1 | | | Level 2 | | | Level 3 | |
Assets: | | | | | | | | | | | | | | | | |
Equity securities* | | $ | — | | | $ | — | | | $ | — | | | $ | — | |
Preferred securities | | | — | | | | — | | | | — | | | | — | |
Debt securities: | | | | | | | | | | | | | | | | |
States and political subdivisions (municipals) | | | 134,035,734 | | | | — | | | | 134,035,734 | | | | — | |
Mutual funds | | | 1,115,340 | | | | 1,115,340 | | | | — | | | | — | |
Other finanical instruments**: | | | — | | | | — | | | | — | | | | — | |
| | | | | | | | | | | | | | | | |
Total assets: | | | 135,151,074 | | | | 1,115,340 | | | | 134,035,734 | | | | — | |
| | | | | | | | | | | | | | | | |
Liabilities: | | | | | | | | | | | | | | | | |
Other financial instruments**: | | | — | | | | — | | | | — | | | | — | |
| | | | | | | | | | | | | | | | |
Total liabilities: | | | — | | | | — | | | | — | | | | — | |
| | | | | | | | | | | | | | | | |
Total | | $ | 135,151,074 | | | $ | 1,115,340 | | | $ | 134,035,734 | | | $ | — | |
| | | | | | | | | | | | | | | | |
*Includes common stock, warrants and rights. Please see the Investment Portfolio for industry classification.
**Other financial instruments are derivative instruments not reflected in the Investment Portfolio, such as futures, forwards and swap contracts, which are valued at the unrealized appreciation/depreciation on the instrument. As of December 31, 2010, the Series did not hold any derivative instruments.
There were no Level 3 securities held by the Series as of December 31, 2009 or December 31, 2010.
The Fund’s policy is to recognize transfers in and transfers out of the valuation levels as of the beginning of the reporting period. There were no significant transfers between Level 1 and Level 2 during the year ended December 31, 2010.
Additional disclosure surrounding the activity in Level 3 fair value measurement will be effective for fiscal years beginning after December 15, 2010. Management has concluded that this will not have a material impact on the Series’ financial statements.
Security Transactions, Investment Income and Expenses
Security transactions are accounted for on trade date. Dividend income is recorded on the ex-dividend date, except that if the ex-dividend date has passed, certain dividends from foreign securities are recorded as soon as the Fund is informed of the ex-dividend date. Non-cash dividends, if any, are recorded at the fair market value of the securities received. Interest income, including amortization of premium and accretion of discounts using the effective interest method, is earned from settlement date and accrued daily.
Expenses are recorded on an accrual basis. Most expenses of the Fund can be attributed to a specific series. Expenses which cannot be directly attributed are apportioned among the series in the Fund in such a manner as deemed equitable by the Fund’s Board, taking into consideration, among other things, the nature and type of expense.
The Series uses the identified cost method for determining realized gain or loss on investments for both financial statement and federal income tax reporting purposes.
Notes to Financial Statements
| 2. | SIGNIFICANT ACCOUNTING POLICIES (continued) |
Federal Taxes
The Series’ policy is to comply with the provisions of the Internal Revenue Code applicable to regulated investment companies. The Series is not subject to federal income tax or excise tax to the extent that the Series distributes to shareholders each year its taxable income, including any net realized gains on investments, in accordance with requirements of the Internal Revenue Code. Accordingly, no provision for federal income tax or excise tax has been made in the financial statements.
Management evaluates its tax positions to determine if the tax positions taken meet the minimum recognition threshold in connection with accounting for uncertainties in income tax positions taken or expected to be taken for the purposes of measuring and recognizing tax liabilities in the financial statements. Recognition of tax benefits of an uncertain tax position is required only when the position is “more likely than not” to be sustained assuming examination by taxing authorities. At December 31, 2010, the Series has recorded no liability for net unrecognized tax benefits relating to uncertain income tax positions taken or expected to be taken in future tax returns.
The Series files income tax returns in the U.S. federal jurisdiction and various states, as required. No income tax returns are currently under investigation. The statute of limitations on the Series’ tax returns remains open for the years ended December 31, 2007 through December 31, 2010. The Fund is not aware of any tax positions for which it is reasonably possible that the total amounts of unrecognized tax benefits will significantly change in the next twelve months.
Distributions of Income and Gains
Distributions to shareholders of net investment income are made quarterly. Distributions of net realized gains are made annually. An additional distribution may be necessary to avoid taxation of the Series. Distributions are recorded on the ex-dividend date.
Indemnifications
The Fund’s organizational documents provide former and current directors and officers with a limited indemnification against liabilities arising in connection with the performance of their duties to the Fund. In the normal course of business, the Fund may also enter into contracts that provide general indemnifications. The Fund’s maximum exposure under these arrangements is unknown as this would be dependent on future claims that may be made against the Fund. The risk of material loss from such claims is considered remote.
Other
The preparation of financial statements in conformity with accounting principles generally accepted in the United States of America requires management to make estimates and assumptions that affect the reported amounts of assets and liabilities and the disclosure of contingent assets and liabilities at the date of the financial statements and the reported amounts of income and expenses during the reporting period. Actual results could differ from those estimates.
| 3. | TRANSACTIONS WITH AFFILIATES |
The Fund has an Investment Advisory Agreement (the “Agreement”) with the Advisor, for which the Series pays a fee, computed daily and payable monthly, at an annual rate of 0.50% of the Series’ average daily net assets.
Under the Agreement, personnel of the Advisor provide the Series with advice and assistance in the choice of investments and the execution of securities transactions, and otherwise maintain the Series’ organization. The Advisor also provides the Fund with necessary office space and fund administration and support services. The salaries of all officers of the Fund (except a percentage of the Fund’s Chief Compliance Officer’s salary, which is paid by the Fund), and of all Directors who are “affiliated persons” of the Fund, or of the Advisor, and all personnel of the Fund, or of the Advisor, performing services relating to research, statistical and investment activities, are paid by the
Notes to Financial Statements
| 3. | TRANSACTIONS WITH AFFILIATES (continued) |
Advisor. Each “non-affiliated” Director receives an annual stipend, which is allocated among all the active series of the Fund. In addition, these Directors also receive a fee per Board meeting attended plus a fee for each committee meeting attended.
The Advisor has contractually agreed, until at least April 30, 2012, to waive its fee and, if necessary, pay other operating expenses of the Series in order to maintain total direct annual fund operating expenses for the Series at no more than 0.85% of average daily net assets each year. For the year ended December 31, 2010, the Advisor voluntarily waived fees of $758, which is reflected as a reduction of expenses on the Statement of Operations. The Advisor is not eligible to recoup any expenses that have been waived or reimbursed in prior years.
Manning & Napier Investor Services, Inc., a registered broker-dealer affiliate of the Advisor, acts as distributor for the Fund’s shares. The services of Manning & Napier Investor Services, Inc. are provided at no additional cost to the Series.
The Advisor has agreements with PNC Global Investment Servicing (U.S.) Inc. (“PNCGIS”) under which PNCGIS serves as sub-accountant services agent and sub-transfer agent. The Fund pays the Advisor an annual fee related to fund accounting and administration of 0.0175% on the first $3 billion of average daily net assets (excluding Target Series); 0.015% on the next $3 billion of average daily net assets (excluding Target Series); and 0.01% of the average daily net assets in excess of $6 billion (excluding Target Series); plus a base fee of $25,500 per Series. Transfer Agent fees are charged to the Fund on a per account basis. Additionally, certain transaction- and cusip-based fees and out-of-pocket expenses, including charges for reporting relating to the Fund’s compliance program, are charged.
Effective July 1, 2010, PNCGIS was sold to The Bank of New York Mellon Corporation, the Series’ custodian. At the close of the sale, PNCGIS changed its name to BNY Mellon Investment Servicing (U.S.) Inc. (“BNY”).
Expenses not directly attributable to a Series are allocated based on each Series’ relative net assets or number of accounts, depending on the expense.
| 4. | PURCHASES AND SALES OF SECURITIES |
For the year ended December 31, 2010, purchases and sales of securities, other than U.S. Government securities and short-term securities, were $41,206,181 and $8,159,650, respectively. There were no purchases or sales of U.S. Government securities.
| 5. | CAPITAL STOCK TRANSACTIONS |
Transactions in shares of New York Tax Exempt Series were:
| | | | | | | | | | | | | | | | |
| | | For the Year Ended 12/31/10 | | | For the Year Ended 12/31/09 | |
| | | Shares | | | Amount | | | Shares | | | Amount | |
Sold | | | 3,733,646 | | | $ | 39,811,439 | | | | 1,541,814 | | | $ | 16,071,689 | |
Reinvested | | | 448,246 | | | | 4,689,832 | | | | 399,655 | | | | 4,143,970 | |
Repurchased | | | (1,293,178 | ) | | | (13,640,209 | ) | | | (1,396,044 | ) | | | (14,437,288 | ) |
| | | | | | | | | | | | | | | | |
Total | | | 2,888,714 | | | $ | 30,861,062 | | | | 545,425 | | | $ | 5,778,371 | |
| | | | | | | | | | | | | | | | |
Notes to Financial Statements
| 5. | CAPITAL STOCK TRANSACTIONS (continued) |
Substantially all of the Series’ shares represent investments by fiduciary accounts over which the Advisor has sole investment discretion.
The Series may trade in instruments including written and purchased options, forward foreign currency exchange contracts and futures contracts and other derivatives in the normal course of investing activities to assist in managing exposure to various market risks. Investments in these instruments may subject the Series to various elements of risk, which may involve, to a varying degree, elements of risk in excess of the amounts recognized for financial statement purposes. These risks include: the risk that changes in the value of a derivative may not correlate perfectly with the underlying asset, rate or index, counterparty credit risk related to over the counter derivatives counterparties’ failure to perform under contract terms, liquidity risk related to the lack of a liquid market for these contracts allowing the fund to close out its position(s) and documentation risk relating to disagreement over contract terms. No such investments were held by the Series during the year ended December 31, 2010.
| 7. | CONCENTRATION OF CREDIT |
The Series primarily invests in debt obligations issued by the State of New York and its political subdivisions, agencies and public authorities to obtain funds for various public purposes. The Series is more susceptible to factors adversely affecting issues of New York municipal securities than is a municipal bond fund that is not concentrated in these issues to the same extent.
| 8. | FEDERAL INCOME TAX INFORMATION |
The amount and characterization of certain income and capital gains to be distributed are determined in accordance with federal income tax regulations, which may differ from accounting principles generally accepted in the United States of America. These differences are primarily due to differing book and tax treatments in the timing of the recognition of net investment income or gains and losses, including market discount and post-October losses. The Series may periodically make reclassifications among its capital accounts to reflect income and gains available for distribution (or available capital loss carryovers) under income tax regulations without impacting the Series’ net asset value. Any such reclassifications are not reflected in the financial highlights.
The tax character of distributions paid were as follows:
| | | | | | | | |
| | | For the Year Ended 12/31/10 | | | For the Year Ended 12/31/09 | |
Ordinary income | | $ | — | | | $ | 6,320 | |
Tax exempt income | | | 4,858,448 | | | | 4,036,109 | |
Long-term capital gains | | | 112,341 | | | | 341,360 | |
For the year ended December 31, 2010, the Series elected to defer $451 of capital losses, attributable to post-October losses.
Notes to Financial Statements
| 8. | FEDERAL INCOME TAX INFORMATION |
(continued)
At December 31, 2010, the tax basis of distributable earnings and the net unrealized appreciation based on the identified cost of investments for federal income tax purposes were as follows:
| | | | | | |
Cost for federal income tax purposes | | $ | 137,209,517 | | | |
Unrealized appreciation | | $ | 1,682,337 | | |
Unrealized depreciation | | | (3,740,780 | ) | |
| | | | | |
Net unrealized depreciation | | $ | (2,058,443 | ) | |
| | | | | | |
Undistributed tax exempt income | | | 127,187 | | | |
Report of Independent Registered Public Accounting Firm
To the Board of Directors of Manning & Napier Fund, Inc. and Shareholders of New York Tax Exempt Series:
In our opinion, the accompanying statement of assets and liabilities, including the investment portfolio (except for credit ratings), and the related statements of operations and of changes in net assets and the financial highlights present fairly, in all material respects, the financial position of the New York Tax Exempt Series (a series of Manning & Napier Fund, Inc., hereafter referred to as the “Series”) at December 31, 2010, and the results of its operations for the year then ended, the changes in its net assets for each of the two years in the period then ended and the financial highlights for each of the five years in the period then ended, in conformity with accounting principles generally accepted in the United States of America. These financial statements and financial highlights (hereafter referred to as “financial statements”) are the responsibility of the Series’ management. Our responsibility is to express an opinion on these financial statements based on our audits. We conducted our audits of these financial statements in accordance with the standards of the Public Company Accounting Oversight Board (United States). Those standards require that we plan and perform the audit to obtain reasonable assurance about whether the financial statements are free of material misstatement. An audit includes examining, on a test basis, evidence supporting the amounts and disclosures in the financial statements, assessing the accounting principles used and significant estimates made by management, and evaluating the overall financial statement presentation. We believe that our audits, which included confirmation of securities at December 31, 2010 by correspondence with the custodian, provide a reasonable basis for our opinion.
New York, New York
February 22, 2011
Supplemental Tax Information (unaudited)
All designations are based on financial information available as of the date of this annual report and, accordingly are subject to change.
Pursuant to Section 852 of the Internal Revenue Code, as amended, the Series hereby designates $112,341 as capital gains for its taxable year ended December 31, 2010. In addition, the Series hereby designates $4,858,448 as tax exempt dividends for the year ended December 31, 2010. For each item it is the intention of the Series to designate the maximum allowable under tax law.
Renewal of Investment Advisory Agreement (unaudited)
At the Manning & Napier Fund, Inc. (the “Fund”) Board of Directors’ (the “Board”) meeting, held on November 17, 2010, the Investment Advisory Agreement (the “Agreement”) between the Fund and Manning & Napier Advisors, Inc. (the “Advisor”) was reviewed by the Board for renewal. In connection with the decision whether to renew the Agreement, a variety of material was prepared for and reviewed by the Board.
Representatives of the Advisor attended the meeting and presented additional oral and written information to the Board to assist the Board in its considerations. The discussion immediately below outlines the materials and information presented to the Board in connection with the Board’s 2010 Annual Review of the Agreement and the conclusions made by the Directors when determining to continue the Agreement.
| | • | | The Board considered the services provided by the Advisor under the Agreement including, among others: deciding what securities to purchase and sell for each Series; arranging for the purchase and sale of such securities by placing orders with broker-dealers; administering the affairs of the Fund (including the books and records of the Fund not maintained by third party service providers such as the custodian or sub-transfer agent); arranging for the insurance coverage for the Fund; and supervising the preparation of tax returns, SEC filings (including registration statements) and reports to shareholders for the Fund. The Board also considered the nature and quality of such services provided under the Agreement in light of the Advisor’s services provided to the Fund for 24 years. The Board discussed the quality of these services with representatives from the Advisor and concluded that the Advisor was performing its services to the Fund required under the Agreement in a reasonable manner. |
| | • | | The Board considered the investment performance of the various Series of the Fund. The investment performance for each Series was reviewed on a cumulative basis since inception and on a one year basis. In addition, annualized performance for the following time periods was considered: inception, three year, five year, ten year, and current market cycle. A market cycle includes periods of both rising and falling markets. Returns for established benchmark indices for each Series were provided for each time period. The Board noted that the various Series were competitive against their respective benchmarks and/or peer groups over various time periods, but in particular over the full market cycle period relevant for the Series. In addition, the Board considered at the meeting (and considers on a quarterly basis) a peer group performance analysis consisting of Morningstar universes of mutual funds with similar investment objectives. The Board discussed the performance with representatives from the Advisor and concluded that the investment performance of each of the Fund’s Series was reasonable based on the Fund’s actual performance and comparative performance, especially performance over the current market cycle. |
| | • | | The Board considered the costs of the Advisor’s services and the profits of the Advisor as they relate to the Advisor’s services to the Fund under the Agreement. In reviewing the Advisor’s costs and profits, the Board discussed the Advisor’s revenues generated from the Fund (on both an actual and adjusted basis) and its expenses associated with providing the services under the Agreement. In addition, the Board reviewed the Advisor’s expenses associated with Fund activities outside of the Agreement (such as expense reimbursements pursuant to expense caps and payments made by the Advisor to third party platforms on which shares of the Fund are available for purchase). It was noted by representatives of the Advisor that 11 of the 27 active Series of the Fund are currently experiencing expenses above the capped expense ratios. After discussing the above costs and profits, the Board concluded that the Advisor’s profitability relating to its services provided under the Agreement was reasonable. |
| | • | | The Board considered the fees and expenses of the various Series of the Fund. The Advisor presented the advisory fees and total expenses for each Series, including the advisory fee adjusted for any expense waivers or reimbursements (either contractual or voluntary) paid by the Advisor. The advisory fees and expense ratios of each Series were compared to an average (on both a mean and median basis) of similar funds as disclosed on the Morningstar database. Representatives of the Advisor discussed with the Board the levels of its advisory |
Renewal of Investment Advisory Agreement (unaudited)
| | fee for each Series of the Fund and as compared to the median and mean advisory fees for similar funds as listed on Morningstar. Expense ratios for every Series, except the Pro-Blend’s Class R and Class C, and Target Class R and Class C, are currently below the median and mean for similar funds as listed on Morningstar. Based on their review of the information provided, the Board concluded that the fees and expenses of each Series of the Fund were reasonable on a comparative basis. |
| | • | | The Board also considered the other benefits the Advisor derives from its relationship with the Fund. Such other benefits include certain research products provided by soft dollars. Given the level of soft dollar transactions involving the Fund, the Board concluded that these additional benefits to the Advisor were reasonable. |
| | • | | In addition to the factors described above, the Board considered the Advisor’s personnel, investment strategies, policies and procedures relating to compliance with personal securities transactions, and reputation, expertise and resources in domestic and foreign financial markets. The Board concluded that these factors support the conclusion that the Advisor performs its services in a reasonable manner. |
| | • | | The Board did not consider economies of scale at this time because of the multiple uses of the Fund (for the Advisor’s discretionary investment account clients in addition to direct investors), the current profitability of the Advisor’s services to the Fund under the Agreement, and the overall size of the Fund complex. |
Based on the Board’s deliberations and their evaluation of the information described above, the Board, including a majority of Directors that are not “interested persons” as defined in the Investment Company Act of 1940, concluded that the compensation under the Agreement was fair and reasonable in light of the services and expenses and such other matters as the Directors considered to be relevant in the exercise of their reasonable judgment. Accordingly, the Board approved the renewal of the Agreement. In the course of their deliberations, the Directors did not identify any particular information that was all important or controlling.
Directors’ and Officers’ Information (unaudited)
The Statement of Additional Information provides additional information about the Fund’s directors and officers and can be obtained without charge by calling 1-800-466-3863, at www.manningnapieradvisors.com, or on the EDGAR Database on the SEC Internet web site (http:// www.sec.gov). The following chart shows certain information about the Fund’s officers and directors, including their principal occupations during the last five years. Unless specific dates are provided, the individuals have held the listed positions for longer than five years.
| | |
INTERESTED DIRECTOR/OFFICER | | |
| |
Name: | | B. Reuben Auspitz* |
Address: | | 290 Woodcliff Drive |
| | Fairport, NY 14450 |
Age: | | 63 |
Current Position(s) Held with Fund: | | Principal Executive Officer, President, Chairman & Director |
Term of Office1 & Length of Time Served: | | Indefinite - Director since 1984; Vice President 1984 - 2003; President since 2004; Principal Executive Officer since 2002 |
Principal Occupation(s) During Past 5 Years: | | Executive Vice President; Executive Group Member**; Chief Compliance Officer since 2004; Vice Chairman since June 2010; Co-Executive Director from 2003-2010 - Manning & Napier Advisors, Inc. President; Director - Manning & Napier Investor Services, Inc. Holds or has held one or more of the following titles for various subsidiaries and affiliates: President, Vice President, Director, Chairman, Treasurer, Chief Compliance Officer or Member. |
Number of Portfolios Overseen within Fund Complex: | | 29 |
Other Directorships Held Outside Fund Complex: | | N/A |
INDEPENDENT DIRECTORS | | |
| |
Name: | | Paul A. Brooke |
Address: | | 290 Woodcliff Drive |
| | Fairport, NY 14450 |
Age: | | 65 |
Current Position(s) Held with Fund: | | Director, Audit Committee Member, Governance & Nominating |
| | Committee Member |
Term of Office & Length of Time Served: | | Indefinite - Since 2007 |
Principal Occupation(s) During Past 5 Years: | | Chairman & CEO, Alsius Corp. (investments); Managing Member, PMSV |
| | Holdings LLC (investments) |
Number of Portfolios Overseen within Fund Complex: | | 29 |
Other Directorships Held Outside Fund Complex: | | Incyte Corp. (2000-present) |
| | ViroPharma, Inc. (2000-present) |
| | HLTH Corp. (2000-present) |
| | Cheyne Capital International (2000-present) |
| | MPM Bio-equities (2000-present) |
| | GMP Companies (2000-present) |
| | | HoustonPharma (2000-present) |
Name: | | Richard M. Hurwitz |
Address: | | 290 Woodcliff Drive |
| | Fairport, NY 14450 |
Age: | | 47 |
Current Position(s) Held with Fund: | | Director, Audit Committee Member, Governance & Nominating |
| | Committee Member |
Term of Office & Length of Time Served: | | Indefinite - Since 2009 |
Principal Occupation(s) During Past 5 Years: | | Chief Executive Officer, Pictometry International Corp. since August 2010 (provider of georeferenced, aerial image libraries and related software) Managing Partner (2006-July 2010) - Aegis Investment Partners, LLC (investments); Founder and Managing Partner (2004-2005) - Village Markets, LLC (groceries) |
Number of Portfolios Overseen within Fund Complex: | | 29 |
Other Directorships Held Outside Fund Complex: | | Pictometry International Corp. (2000-2010) |
| | Pioneering Technologies (2006-2009) |
| | | Vensearch Capital Corp. (2003-2007) |
Directors’ and Officers’ Information (unaudited)
| | |
INDEPENDENT DIRECTORS (continued) | | |
Name: | | Stephen B. Ashley |
| Address: | | 290 Woodcliff Drive |
| | Fairport, NY 14450 |
| Age: | | 70 |
| Current Position(s) Held with Fund: | | Director, Audit Committee Member, Governance & Nominating |
| | Committee Member |
| Term of Office & Length of Time Served: | | Indefinite - Since 1996 |
| Principal Occupation(s) During Past 5 Years: | | Chairman, Director, President & Chief Executive Officer, The Ashley Group (property management and investment). Chairman (non-executive) 2004-2008; Director 1995-2008 - Fannie Mae (mortgage) |
| Number of Portfolios Overseen within Fund Complex: | | 29 |
| Other Directorships Held Outside Fund Complex: | | The Ashley Group (1995-2008) |
| | | Genesee Corporation (1987-2007) |
Name: | | Peter L. Faber |
| Address: | | 290 Woodcliff Drive |
| | Fairport, NY 14450 |
| Age: | | 72 |
| Current Position(s) Held with Fund: | | Director, Governance & Nominating Committee Member |
| Term of Office & Length of Time Served: | | Indefinite - Since 1987 |
| Principal Occupation(s) During Past 5 Years: | | Senior Counsel since 2006, Partner (1995 - 2006) - McDermott, Will & |
| | Emery LLP (law firm) |
| Number of Portfolios Overseen within Fund Complex: | | 29 |
| Other Directorships Held Outside Fund Complex: | | Partnership for New York City, Inc. (non-profit) |
| | New York Collegium (non-profit) |
| | | Boston Early Music Festival (non-profit) |
Name: | | Harris H. Rusitzky |
| Address: | | 290 Woodcliff Drive |
| | Fairport, NY 14450 |
| Age: | | 76 |
| Current Position(s) Held with Fund: | | Director, Audit Committee Member, Governance & Nominating |
| | Committee Member |
| Term of Office & Length of Time Served: | | Indefinite - Since 1985 |
| Principal Occupation(s) During Past 5 Years: | | President, The Greening Group (business consultants) since 1994; |
| | Partner, The Restaurant Group (restaurants) since 2006 |
| Number of Portfolios Overseen within Fund Complex: | | 29 |
| Other Directorships Held Outside Fund Complex: | | N/A |
OFFICERS | | |
Name: | | Jeffrey S. Coons, Ph.D., CFA |
| Address: | | 290 Woodcliff Drive |
| | Fairport, NY 14450 |
| Age: | | 47 |
| Current Position(s) Held with Fund: | | Vice President |
| Term of Office1 & Length of Time Served: | | Since 2004 |
| Principal Occupation(s) During Past 5 Years: | | President since 2010, Co-Director of Research since 2002, Executive Group Member** since 2003, - Manning & Napier Advisors, Inc. Holds one or more of the following titles for various subsidiaries and affiliates: President, Director, Treasurer or Senior Trust Officer. |
Number of Portfolios Overseen within Fund Complex: | | 29 |
Other Directorships Held Outside Fund Complex: | | N/A |
Directors’ and Officers’ Information (unaudited)
OFFICERS (continued)
| | |
Name: | | Beth Galusha |
Address: | | 290 Woodcliff Drive |
| | Fairport, NY 14450 |
Age: | | 49 |
Current Position(s) Held with Fund: | | Assistant Chief Financial Officer |
Term of Office1 & Length of Time Served: | | Assistant Chief Financial Officer since 2010 |
Principal Occupation(s) During Past 5 Years: | | Chief Financial Officer and Treasurer, Manning & Napier Advisors, Inc. Holds one or more of the following titles for various affiliates: Chief Financial Officer, Director, or Treasurer |
Number of Portfolios Overseen within Fund Complex: | | 29 |
Other Directorships Held Outside Fund Complex: | | N/A |
Name: | | Christine Glavin |
Address: | | 290 Woodcliff Drive |
| | Fairport, NY 14450 |
Age: | | 44 |
Current Position(s) Held with Fund: | | Principal Financial Officer, Chief Financial Officer |
Term of Office1 & Length of Time Served: | | Principal Financial Officer since 2002; Chief Financial Officer since 2001 |
Principal Occupation(s) During Past 5 Years: | | Fund Reporting Manager, Manning & Napier Advisors, Inc. since 1997 |
Number of Portfolios Overseen within Fund Complex: | | 29 |
Other Directorships Held Outside Fund Complex: | | N/A |
Name: | | Jodi L. Hedberg |
Address: | | 290 Woodcliff Drive |
| | Fairport, NY 14450 |
Age: | | 43 |
Current Position(s) Held with Fund: | | Corporate Secretary, Chief Compliance Officer, Anti-Money Laundering |
| | Compliance Officer |
Term of Office1 & Length of Time Served: | | Corporate Secretary since 1997; Chief Compliance Officer since 2004 |
Principal Occupation(s) During Past 5 Years: | | Director of Compliance, Manning & Napier Advisors, Inc. and affiliates since 1990 (title change in 2005 from Compliance Manager to Director of Compliance); Corporate Secretary, Manning & Napier Investor Services, Inc. since 2006 |
Number of Portfolios Overseen within Fund Complex: | | 29 |
Other Directorships Held Outside Fund Complex: | | N/A |
Name: | | Richard Yates |
Address: | | 290 Woodcliff Drive |
| | Fairport, NY 14450 |
Age: | | 45 |
Current Position(s) Held with Fund: | | Chief Legal Officer |
Term of Office1 & Length of Time Served: | | Chief Legal Officer since 2004 |
Principal Occupation(s) During Past 5 Years: | | Counsel - Manning & Napier Advisors, Inc. & affiliates since 2000; Holds one or more of the following titles for various affiliates; Director or Corporate Secretary |
Number of Portfolios Overseen within Fund Complex: | | 29 |
Other Directorships Held Outside Fund Complex: | | N/A |
*Interested Director, within the meaning of the Investment Company Act of 1940 by reason of his position with the Fund’s investment advisor and distributor. Mr. Auspitz serves as the Executive Vice President and Director, Manning & Napier Advisors, Inc. and President and Director, Manning & Napier Investor Services, Inc., the Fund’s distributor.
**Prior to June 2010, the Executive Group, consisting of senior executive employee-owners, performed the duties of the Office of the Chief Executive of the Advisor. Effective June 2010, the Executive Group serves as an advisory board to the Chief Executive Officer.
1The term of office for President, Vice President, Chief Financial Officer, Assistant Chief Financial Officer, Chief Legal Officer and Corporate Secretary is one year and until their respective successors are chosen and qualified. All other officers’ terms are indefinite.
Literature Requests (unaudited)
Proxy Voting Policies and Procedures
A description of the policies and procedures that the Fund uses to determine how to vote proxies relating to portfolio securities is available, without charge, upon request:
| | |
By phone | | 1-800-466-3863 |
On the Securities and Exchange
Commission’s (SEC) web site | | http://www.sec.gov |
Proxy Voting Record
Information regarding how the Fund voted proxies relating to portfolio securities during the most recent 12-month period ended June 30th is available, without charge, upon request:
| | |
By phone | | 1-800-466-3863 |
On the SEC’s web site | | http://www.sec.gov |
Quarterly Portfolio Holdings
The Series’ complete schedule of portfolio holdings for the 1st and 3rd quarters of each fiscal year are provided on Form N-Q, and are available, without charge, upon request:
| | |
By phone | | 1-800-466-3863 |
On the SEC’s web site | | http://www.sec.gov |
The Series’ Form N-Q may be reviewed and copied at the SEC’s Public Reference Room in Washington, D.C. Information on the operation of the Public Reference Room may be obtained by calling 1-800-SEC-0330.
Prospectus and Statement of Additional Information (SAI)
The prospectus and SAI provide additional information about each Series, including charges, expenses and risks. These documents are available, without charge, upon request:
| | |
By phone | | 1-800-466-3863 |
On the SEC’s web site | | http://www.sec.gov |
On the Advisor’s web site | | http://www.manning-napier.com |
Additional information available at www.manning-napier.com
1. Fund Holdings - Month-End
2. Fund Holdings - Quarter-End
3. Shareholder Report - Annual
4. Shareholder Report - Semi-Annual
MNNYTES-12/10-AR

Management Discussion and Analysis (unaudited)
Dear Shareholders:
As well-defined swings in sentiment drove market fluctuations in 2010, the fixed income markets had favorable results for the year. Returns were broadly positive throughout the first three quarters of the year, with higher gains during the stock market pullback in the second quarter. However, while equities finished the year with a strong rally, fixed income markets generally took a negative turn at the end of the year. After eight consecutive quarters of positive performance, broad fixed income markets suffered losses in the fourth quarter.
Overall, corporate bonds were the best performing sector during 2010, with below investment grade securities experiencing significant gains. Mortgage securities and U.S. Treasury securities also performed well, particularly intermediate and longer-term U.S. Treasuries. While municipal bonds posted positive results for the year, the sector had the weakest returns in 2010, as credit concerns and supply and demand changes caused noteworthy losses during the last quarter.
The Bank of America Merrill Lynch U.S. Corporate, Government and Mortgage Index earned a solid 6.43% during the year. With a return of 8.97%, the Core Bond Series noticeably outpaced its benchmark.
Throughout 2010, the Core Bond Series maintained a heavy weighting to corporate bonds because the Advisor believes the supply and demand dynamics within this sector remain attractive. As of the end of the year, the Series had 81.8% of its assets invested in corporate bonds and preferred stocks, and this significant allocation to corporate bonds was the primary driver of outperformance over the past year.
During the second quarter, the Series sold its taxable municipal bonds (i.e., Build America Bonds) and reinvested the proceeds into commercial mortgage-backed securities, which are a type of asset-backed securities. Accordingly, the Series’ exposure to asset-backed securities increased throughout the year. While the Series started the year with no mortgage-backed securities holdings, the Advisor added exposure to this sector toward the end of the year.
As the markets unfold in 2011, it will be important to monitor trends such as monetary policy and inflation expectations. With this mindset, Manning & Napier remains committed to our active investment approach to fixed income. With our fundamentals-based investment strategies, we will continue to use tools such as sector, maturity, quality, and issue selections to take advantage of market opportunities and manage risk throughout the full bond market cycle. Staying focused on the fundamentals and maintaining our selective investment process helped us earn strong returns through the volatile markets of 2010, and we believe these qualities will remain important in the environment ahead.
As always, we appreciate your business.
Sincerely,
Manning & Napier Advisors, Inc.
Performance Update as of December 31, 2010 (unaudited)
| | | | | | | | | | | | |
| | | Average Annual Total Returns
As of December 31, 2010 | |
| | | One
Year | | | Five
Year | | | Since
Inception 1 | |
Manning & Napier Fund, Inc. - Core Bond Series2 | | | 8.97 | % | | | 6.38% | | | | 5.76% | |
Bank of America (BofA) Merrill Lynch U.S. Corporate, | | | | | | | | | | | | |
Government & Mortgage Index3 | | | 6.43 | % | | | 5.87% | | | | 5.50% | |
The following graph compares the value of a $10,000 investment in the Manning & Napier Fund, Inc. - Core Bond Series from its inception1 (4/21/05) to present (12/31/10) to the BofA Merrill Lynch U.S. Corporate, Government & Mortgage Index.
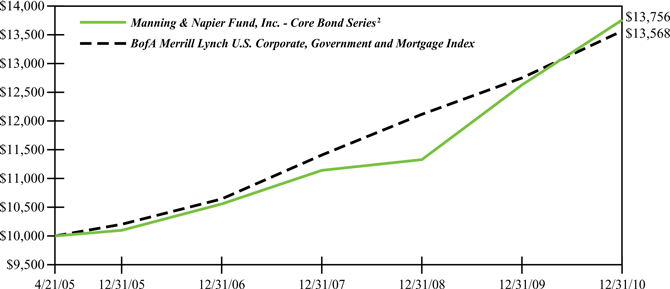
1Performance numbers for the Series and Index are calculated from April 21, 2005, the Series’ inception date.
2The Series’ performance does not reflect the deduction of taxes that a shareholder would pay on fund distributions or the redemption of shares. The Series’ performance is historical and may not be indicative of future results. The performance returns shown are inclusive of the net expense ratio of the Series. For the year ended December 31, 2010, this net expense ratio was 0.76%. The gross expense ratio, which does not account for any voluntary or contractual waivers currently in effect, was 0.76% for the year ended December 31, 2010.
3The unmanaged BofA Merrill Lynch U.S. Corporate, Government & Mortgage Index (formerly a Merrill Lynch Index) is a market value weighted measure that represents U.S. government, corporate, and pass-through securities issued by entities within the United States, by supranational entities, or by entities headquartered outside of the United States but who have issued dollar-denominated securities within the United States. The Index only includes investment-grade securities with maturities of greater than one year. The Index returns assume reinvestment of coupons and, unlike Series returns, do not reflect any fees or expenses.
Shareholder Expense Example (unaudited)
As a shareholder of the Series, you may incur two types of costs: (1) transaction costs and (2) ongoing costs, including management fees and other Series expenses. This example is intended to help you understand your ongoing costs (in dollars) of investing in the Series and to compare these costs with the ongoing costs of investing in other mutual funds.
The example is based on an investment of $1,000 invested at the beginning of the period and held for the entire period (July 1, 2010 to December 31, 2010).
Actual Expenses
The first line of the table below provides information about actual account values and actual expenses. You may use the information in this line, together with the amount you invested, to estimate the expenses that you paid over the period. Simply divide your account value by $1,000 (for example, an $8,600 account value divided by $1,000 = 8.6), then multiply the result by the number in the first line under the heading entitled “Expenses Paid During Period” to estimate the expenses you paid on your account during this period.
Hypothetical Example for Comparison Purposes
The second line of the table below provides information about hypothetical account values and hypothetical expenses based on the Series’ actual expense ratio and an assumed rate of return of 5% per year before expenses, which is not the Series’ actual return. The hypothetical account values and expenses may not be used to estimate the actual ending account balance or expenses you paid during the period. You may use this information to compare the ongoing costs of investing in the Series and other funds. To do so, compare this 5% hypothetical example with the 5% hypothetical examples that appear in the shareholder reports of the other funds.
Please note that the expenses shown in the table are meant to highlight your ongoing costs only and do not reflect any transaction costs. Therefore, the second line of the table is useful in comparing ongoing costs only, and will not help you determine the relative total costs of owning different funds. In addition, if these transaction costs were included, your costs would have been higher.
| | | | | | |
| | | Beginning
Account Value
7/1/10 | | Ending
Account Value
12/31/10 | | Expenses Paid
During Period*
7/1/10-12/31/10 |
Actual | | $1,000.00 | | $1,027.30 | | $3.88 |
Hypothetical | | | | | | |
(5% return before expenses) | | $1,000.00 | | $1,021.37 | | $3.87 |
*Expenses are equal to the Series’ annualized expense ratio (for the six-month period) of 0.76%, multiplied by the average account value over the period, multiplied by 184/365 (to reflect the one-half year period). Expenses are based on the most recent fiscal half year; therefore, the expense ratio stated above may differ from the expense ratio stated in the financial highlights, which is based on one-year data. The Series’ total return would have been lower had certain expenses not been waived during the period.
Portfolio Composition as of December 31, 2010 (unaudited)
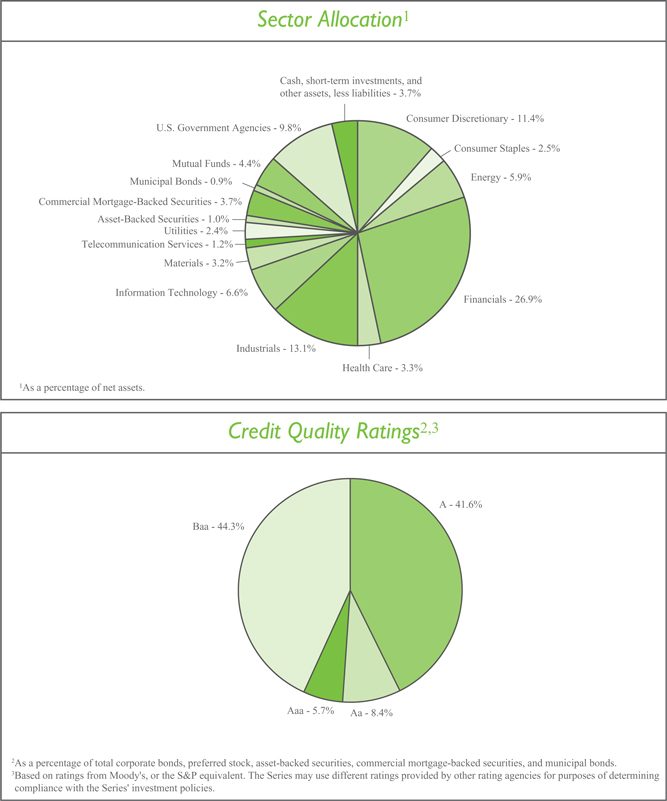
Investment Portfolio - December 31, 2010
| | | | | | | | | | | | |
| | | Credit
Rating 1
(unaudited) | | | Principal
Amount | | | Value (Note 2) | |
| | | |
CORPORATE BONDS - 74.4% | | | | | | | | | | | | |
| | | |
Convertible Corporate Bonds - 1.1% | | | | | | | | | | | | |
Health Care - 0.6% | | | | | | | | | | | | |
Biotechnology - 0.5% | | | | | | | | | | | | |
Amgen, Inc., 0.375%, 2/1/2013 | | | A3 | | | $ | 530,000 | | | $ | 530,000 | |
| | | | | | | | | | | | |
Health Care Equipment & Supplies - 0.1% | | | | | | | | | | | | |
Medtronic, Inc., 1.625%, 4/15/2013 | | | A1 | | | | 120,000 | | | | 120,750 | |
| | | | | | | | | | | | |
Total Health Care | | | | | | | | | | | 650,750 | |
| | | | | | | | | | | | |
| | | |
Information Technology - 0.5% | | | | | | | | | | | | |
Computers & Peripherals - 0.5% | | | | | | | | | | | | |
EMC Corp., 1.75%, 12/1/2013 | | | A2 | | | | 395,000 | | | | 594,969 | |
| | | | | | | | | | | | |
| | | |
Total Convertible Corporate Bonds
(Identified Cost $1,128,853) | | | | | | | | | | | 1,245,719 | |
| | | | | | | | | | | | |
| | | |
Non-Convertible Corporate Bonds - 73.3% | | | | | | | | | | | | |
Consumer Discretionary - 11.4% | | | | | | | | | | | | |
Hotels, Restaurants & Leisure - 2.1% | | | | | | | | | | | | |
International Game Technology, 7.50%, 6/15/2019 | | | Baa2 | | | | 1,095,000 | | | | 1,232,600 | |
Yum! Brands, Inc., 3.875%, 11/1/2020 | | | Baa3 | | | | 1,250,000 | | | | 1,194,109 | |
| | | | | | | | | | | | |
| | | | | | | | | | | 2,426,709 | |
| | | | | | | | | | | | |
Household Durables - 0.9% | | | | | | | | | | | | |
Newell Rubbermaid, Inc., 4.70%, 8/15/2020 | | | Baa3 | | | | 1,000,000 | | | | 991,949 | |
| | | | | | | | | | | | |
| | | |
Media - 4.7% | | | | | | | | | | | | |
Comcast Corp., 6.50%, 11/15/2035 | | | Baa1 | | | | 925,000 | | | | 994,162 | |
Comcast Corp., 6.95%, 8/15/2037 | | | Baa1 | | | | 665,000 | | | | 752,160 | |
DIRECTV Holdings LLC, 5.20%, 3/15/2020 | | | Baa2 | | | | 965,000 | | | | 1,000,399 | |
Discovery Communications LLC, 5.05%, 6/1/2020 | | | Baa2 | | | | 965,000 | | | | 1,020,453 | |
Time Warner, Inc., 7.625%, 4/15/2031 | | | Baa2 | | | | 850,000 | | | | 1,033,330 | |
The Walt Disney Co., 5.50%, 3/15/2019 | | | A2 | | | | 500,000 | | | | 567,687 | |
| | | | | | | | | | | | |
| | | | | | | | | | | 5,368,191 | |
| | | | | | | | | | | | |
| | | |
Multiline Retail - 0.7% | | | | | | | | | | | | |
Target Corp., 6.00%, 1/15/2018 | | | A2 | | | | 670,000 | | | | 775,677 | |
| | | | | | | | | | | | |
| | | |
Specialty Retail - 2.5% | | | | | | | | | | | | |
AutoZone, Inc., 4.00%, 11/15/2020 | | | Baa2 | | | | 850,000 | | | | 802,801 | |
The Home Depot, Inc., 5.40%, 3/1/2016 | | | Baa1 | | | | 1,065,000 | | | | 1,193,444 | |
Lowe’s Companies, Inc., 6.10%, 9/15/2017 | | | A1 | | | | 745,000 | | | | 861,657 | |
| | | | | | | | | | | | |
| | | | | | | | | | | 2,857,902 | |
| | | | | | | | | | | | |
| | | |
Textiles, Apparel & Luxury Goods - 0.5% | | | | | | | | | | | | |
VF Corp., 5.95%, 11/1/2017 | | | A3 | | | | 485,000 | | | | 541,000 | |
| | | | | | | | | | | | |
Total Consumer Discretionary | | | | | | | | | | | 12,961,428 | |
| | | | | | | | | | | | |
| | |
| The accompanying notes are an integral part of the financial statements. | | 5 |
Investment Portfolio - December 31, 2010
| | | | | | | | | | | | |
| | | Credit
Rating 1
(unaudited) | | | Principal
Amount | | | Value
(Note 2) | |
| | | |
CORPORATE BONDS (continued) | | | | | | | | | | | | |
| | | |
Non-Convertible Corporate Bonds (continued) | | | | | | | | | | | | |
Consumer Staples - 2.5% | | | | | | | | | | | | |
Beverages - 0.2% | | | | | | | | | | | | |
PepsiCo, Inc., 7.90%, 11/1/2018 | | | Aa3 | | | $ | 157,000 | | | $ | 201,998 | |
| | | | | | | | | | | | |
Food & Staples Retailing - 0.5% | | | | | | | | | | | | |
The Kroger Co., 5.50%, 2/1/2013 | | | Baa2 | | | | 230,000 | | | | 248,789 | |
The Kroger Co., 6.15%, 1/15/2020 | | | Baa2 | | | | 335,000 | | | | 379,609 | |
| | | | | | | | | | | | |
| | | | | | | | | | | 628,398 | |
| | | | | | | | | | | | |
| | | |
Food Products - 1.8% | | | | | | | | | | | | |
General Mills, Inc., 5.65%, 2/15/2019 | | | Baa1 | | | | 765,000 | | | | 851,640 | |
Grupo Bimbo SAB de CV (Mexico)3, 4.875%, 6/30/2020 | | | Baa2 | | | | 500,000 | | | | 501,957 | |
Kraft Foods, Inc., 6.125%, 2/1/2018 | | | Baa2 | | | | 565,000 | | | | 645,397 | |
| | | | | | | | | | | | |
| | | | | | | | | | | 1,998,994 | |
| | | | | | | | | | | | |
Total Consumer Staples | | | | | | | | | | | 2,829,390 | |
| | | | | | | | | | | | |
Energy - 5.9% | | | | | | | | | | | | |
Energy Equipment & Services - 3.4% | | | | | | | | | | | | |
Baker Hughes, Inc., 7.50%, 11/15/2018 | | | A2 | | | | 620,000 | | | | 777,446 | |
Baker Hughes, Inc., 5.125%, 9/15/2040 | | | A2 | | | | 1,000,000 | | | | 976,782 | |
Weatherford International Ltd. (Switzerland), 9.625%, 3/1/2019 | | | Baa2 | | | | 1,645,000 | | | | 2,110,843 | |
| | | | | | | | | | | | |
| | | | | | | | | | | 3,865,071 | |
| | | | | | | | | | | | |
| | | |
Oil, Gas & Consumable Fuels - 2.5% | | | | | | | | | | | | |
Apache Corp., 6.90%, 9/15/2018 | | | A3 | | | | 630,000 | | | | 769,220 | |
Hess Corp., 5.60%, 2/15/2041 | | | Baa2 | | | | 1,050,000 | | | | 1,042,370 | |
Shell International Finance B.V. (Netherlands), 4.30%, 9/22/2019. | | | Aa1 | | | | 1,000,000 | | | | 1,042,555 | |
| | | | | | | | | | | | |
| | | | | | | | | | | 2,854,145 | |
| | | | | | | | | | | | |
Total Energy | | | | | | | | | | | 6,719,216 | |
| | | | | | | | | | | | |
Financials - 24.8% | | | | | | | | | | | | |
Capital Markets - 5.9% | | | | | | | | | | | | |
The Charles Schwab Corp., 4.45%, 7/22/2020 | | | A2 | | | | 1,010,000 | | | | 1,006,096 | |
Goldman Sachs Capital I, 6.345%, 2/15/2034 | | | A3 | | | | 830,000 | | | | 790,865 | |
Goldman Sachs Capital II4, 5.793%, 12/29/2049 | | | Baa2 | | | | 1,285,000 | | | | 1,089,037 | |
The Goldman Sachs Group, Inc., 6.15%, 4/1/2018 | | | A1 | | | | 690,000 | | | | 759,823 | |
The Goldman Sachs Group, Inc., 5.375%, 3/15/2020 | | | A1 | | | | 500,000 | | | | 516,681 | |
Merrill Lynch & Co., Inc., 6.11%, 1/29/2037 | | | A3 | | | | 805,000 | | | | 726,654 | |
Morgan Stanley, 5.55%, 4/27/2017 | | | A2 | | | | 1,727,000 | | | | 1,799,189 | |
| | | | | | | | | | | | |
| | | | | | | | | | | 6,688,345 | |
| | | | | | | | | | | | |
| | | |
Commercial Banks - 6.6% | | | | | | | | | | | | |
Household Finance Co., 6.375%, 11/27/2012 | | | A3 | | | | 785,000 | | | | 851,069 | |
HSBC Finance Corp., 7.00%, 5/15/2012 | | | A3 | | | | 1,025,000 | | | | 1,099,769 | |
KeyBank National Association, 5.45%, 3/3/2016 | | | Baa1 | | | | 1,050,000 | | | | 1,104,968 | |
| | |
| 6 | | The accompanying notes are an integral part of the financial statements. |
Investment Portfolio - December 31, 2010
| | | | | | | | | | | | |
| | | Credit
Rating 1
(unaudited) | | | Principal
Amount | | | Value (Note 2) | |
| | | |
CORPORATE BONDS (continued) | | | | | | | | | | | | |
| | | |
Non-Convertible Corporate Bonds (continued) | | | | | | | | | | | | |
Financials (continued) | | | | | | | | | | | | |
Commercial Banks (continued) | | | | | | | | | | | | |
Manufacturers & Traders Trust Co., 6.625%, 12/4/2017 | | | A3 | | | $ | 1,135,000 | | | $ | 1,274,207 | |
National City Corp., 6.875%, 5/15/2019 | | | Baa1 | | | | 500,000 | | | | 561,379 | |
PNC Bank National Association, 5.25%, 1/15/2017 | | | A3 | | | | 880,000 | | | | 913,563 | |
USB Capital XIII Trust, 6.625%, 12/15/2039 | | | A2 | | | | 715,000 | | | | 730,323 | |
Wachovia Corp., 5.25%, 8/1/2014 | | | A2 | | | | 945,000 | | | | 1,007,837 | |
| | | | | | | | | | | | |
| | | | | | | | | | | 7,543,115 | |
| | | | | | | | | | | | |
Consumer Finance - 0.9% | | | | | | | | | | | | |
American Express Co., 8.125%, 5/20/2019 | | | A3 | | | | 795,000 | | | | 989,148 | |
| | | | | | | | | | | | |
Diversified Financial Services - 2.9% | | | | | | | | | | | | |
Bank of America Corp., 7.625%, 6/1/2019 | | | A2 | | | | 845,000 | | | | 972,963 | |
Citigroup, Inc., 8.50%, 5/22/2019 | | | A3 | | | | 1,190,000 | | | | 1,477,308 | |
JPMorgan Chase & Co., 6.30%, 4/23/2019 | | | Aa3 | | | | 785,000 | | | | 893,530 | |
| | | | | | | | | | | | |
| | | | | | | | | | | 3,343,801 | |
| | | | | | | | | | | | |
Insurance - 1.7% | | | | | | | | | | | | |
American International Group, Inc., 4.25%, 5/15/2013 | | | A3 | | | | 660,000 | | | | 683,000 | |
Fidelity National Financial, Inc., 6.60%, 5/15/2017 | | | Baa3 | | | | 1,260,000 | | | | 1,257,167 | |
| | | | | | | | | | | | |
| | | | | | | | | | | 1,940,167 | |
| | | | | | | | | | | | |
Real Estate Investment Trusts (REITS) - 6.8% | | | | | | | | | | | | |
AvalonBay Communities, Inc., 6.10%, 3/15/2020 | | | Baa1 | | | | 720,000 | | | | 805,178 | |
Boston Properties LP, 5.875%, 10/15/2019 | | | Baa2 | | | | 935,000 | | | | 1,013,959 | |
Camden Property Trust, 5.70%, 5/15/2017 | | | Baa1 | | | | 780,000 | | | | 823,113 | |
Digital Realty Trust LP, 5.875%, 2/1/2020 | | | Baa2 | | | | 500,000 | | | | 508,677 | |
HCP, Inc., 6.70%, 1/30/2018 | | | Baa3 | | | | 940,000 | | | | 1,008,504 | |
Health Care REIT, Inc., 6.20%, 6/1/2016 | | | Baa2 | | | | 375,000 | | | | 414,939 | |
Mack-Cali Realty LP, 7.75%, 8/15/2019 | | | Baa2 | | | | 735,000 | | | | 855,360 | |
National Retail Properties, Inc., 6.875%, 10/15/2017 | | | Baa2 | | | | 890,000 | | | | 958,852 | |
Simon Property Group LP, 10.35%, 4/1/2019 | | | A3 | | | | 990,000 | | | | 1,353,527 | |
| | | | | | | | | | | | |
| | | | | | | | | | | 7,742,109 | |
| | | | | | | | | | | | |
Total Financials | | | | | | | | | | | 28,246,685 | |
| | | | | | | | | | | | |
Health Care - 2.7% | | | | | | | | | | | | |
Biotechnology - 0.5% | | | | | | | | | | | | |
Amgen, Inc., 5.85%, 6/1/2017 | | | A3 | | | | 500,000 | | | | 570,749 | |
| | | | | | | | | | | | |
Health Care Equipment & Supplies - 0.7% | | | | | | | | | | | | |
Becton Dickinson and Co., 6.00%, 5/15/2039 | | | A2 | | | | 535,000 | | | | 604,117 | |
CR Bard, Inc., 4.40%, 1/15/2021 | | | A3 | | | | 200,000 | | | | 203,214 | |
| | | | | | | | | | | | |
| | | | | | | | | | | 807,331 | |
| | | | | | | | | | | | |
| | |
| The accompanying notes are an integral part of the financial statements. | | 7 |
Investment Portfolio - December 31, 2010
| | | | | | | | | | | | |
| | | Credit Rating1 (unaudited) | | | Principal Amount | | | Value (Note 2) | |
| | | |
CORPORATE BONDS (continued) | | | | | | | | | | | | |
| | | |
Non-Convertible Corporate Bonds (continued) | | | | | | | | | | | | |
Health Care (continued) | | | | | | | | | | | | |
Pharmaceuticals - 1.5% | | | | | | | | | | | | |
Abbott Laboratories, 5.60%, 11/30/2017 | | | A1 | | | $ | 675,000 | | | $ | 771,734 | |
Novartis Securities Investment Ltd. (Bermuda), 5.125%, 2/10/2019 | | | Aa2 | | | | 870,000 | | | | 962,250 | |
| | | | | | | | | | | | |
| | | | | | | | | | | 1,733,984 | |
| | | | | | | | | | | | |
Total Health Care | | | | | | | | | | | 3,112,064 | |
| | | | | | | | | | | | |
Industrials - 13.1% | | | | | | | | | | | | |
Aerospace & Defense - 1.2% | | | | | | | | | | | | |
The Boeing Co., 6.00%, 3/15/2019 | | | A2 | | | | 500,000 | | | | 575,259 | |
Honeywell International, Inc., 5.30%, 3/1/2018 | | | A2 | | | | 690,000 | | | | 767,848 | |
| | | | | | | | | | | | |
| | | | | | | | | | | 1,343,107 | |
| | | | | | | | | | | | |
Air Freight & Logistics - 0.9% | | | | | | | | | | | | |
FedEx Corp., 8.00%, 1/15/2019 | | | Baa2 | | | | 790,000 | | | | 974,509 | |
| | | | | | | | | | | | |
Airlines - 2.0% | | | | | | | | | | | | |
Continental Airlines Pass-Through Trust, Series 1997-4, Class A, 6.90%, 1/2/2018 | | | Baa2 | | | | 300,296 | | | | 319,065 | |
Delta Air Lines Pass-Through Trust, Series 2001-1, Class 1A2, 7.111%, 9/18/2011 | | | BBB | 2 | | | 295,000 | | | | 304,587 | |
Delta Air Lines Pass-Through Trust, Series 2007-1, Class A, 6.821%, 8/10/2022 | | | Baa1 | | | | 166,574 | | | | 176,569 | |
Delta Air Lines Pass-Through Trust, Series 2010-1, Class A, 6.20%, 7/2/2018 | | | Baa2 | | | | 500,000 | | | | 531,250 | |
Southwest Airlines Co., 5.25%, 10/1/2014 | | | Baa3 | | | | 910,000 | | | | 957,081 | |
| | | | | | | | | | | | |
| | | | | | | | | | | 2,288,552 | |
| | | | | | | | | | | | |
Commercial Services & Supplies - 0.9% | | | | | | | | | | | | |
Waste Management, Inc., 7.375%, 3/11/2019 | | | Baa3 | | | | 830,000 | | | | 1,004,384 | |
| | | | | | | | | | | | |
Industrial Conglomerates - 3.8% | | | | | | | | | | | | |
GE Capital Trust I4, 6.375%, 11/15/2067 | | | Aa3 | | | | 1,145,000 | | | | 1,130,687 | |
General Electric Capital Corp., 5.625%, 5/1/2018 | | | Aa2 | | | | 350,000 | | | | 381,680 | |
General Electric Capital Corp., Series A, 6.75%, 3/15/2032 | | | Aa2 | | | | 740,000 | | | | 837,767 | |
General Electric Co., 5.25%, 12/6/2017 | | | Aa2 | | | | 370,000 | | | | 399,635 | |
Textron, Inc., 7.25%, 10/1/2019 | | | Baa3 | | | | 1,245,000 | | | | 1,426,709 | |
Tyco Electronics Group S.A. (Luxembourg), 4.875%, 1/15/2021 | | | Baa2 | | | | 200,000 | | | | 202,244 | |
| | | | | | | | | | | | |
| | | | | | | | | | | 4,378,722 | |
| | | | | | | | | | | | |
Machinery - 1.6% | | | | | | | | | | | | |
Caterpillar Financial Services Corp., 7.05%, 10/1/2018 | | | A2 | | | | 660,000 | | | | 798,358 | |
John Deere Capital Corp., 5.50%, 4/13/2017 | | | A2 | | | | 225,000 | | | | 250,861 | |
John Deere Capital Corp., 5.75%, 9/10/2018 | | | A2 | | | | 700,000 | | | | 793,010 | |
| | | | | | | | | | | | |
| | | | | | | | | | | 1,842,229 | |
| | | | | | | | | | | | |
| | |
| 8 | | The accompanying notes are an integral part of the financial statements. |
Investment Portfolio - December 31, 2010
| | | | | | | | | | | | |
| | | Credit Rating1 (unaudited) | | | Principal Amount | | | Value (Note 2) | |
| | | |
CORPORATE BONDS (continued) | | | | | | | | | | | | |
| | | |
Non-Convertible Corporate Bonds (continued) | | | | | | | | | | | | |
Industrials (continued) | | | | | | | | | | | | |
Road & Rail - 2.7% | | | | | | | | | | | | |
CSX Corp., 6.00%, 10/1/2036 | | | Baa3 | | | $ | 730,000 | | | $ | 760,309 | |
JB Hunt Transport Services, Inc., 3.375%, 9/15/2015 | | | Baa3 | | | | 1,595,000 | | | | 1,575,514 | |
Union Pacific Corp., 5.65%, 5/1/2017 | | | Baa2 | | | | 705,000 | | | | 778,463 | |
| | | | | | | | | | | | |
| | | | | | | | | | | 3,114,286 | |
| | | | | | | | | | | | |
Total Industrials | | | | | | | | | | | 14,945,789 | |
| | | | | | | | | | | | |
Information Technology - 6.1% | | | | | | | | | | | | |
Communications Equipment - 1.0% | | | | | | | | | | | | |
Cisco Systems, Inc., 5.90%, 2/15/2039 | | | A1 | | | | 1,065,000 | | | | 1,179,493 | |
| | | | | | | | | | | | |
Computers & Peripherals - 2.6% | | | | | | | | | | | | |
Dell, Inc., 5.875%, 6/15/2019 | | | A2 | | | | 1,055,000 | | | | 1,154,367 | |
Hewlett-Packard Co., 5.50%, 3/1/2018 | | | A2 | | | | 680,000 | | | | 766,174 | |
International Business Machines Corp., 5.60%, 11/30/2039 | | | Aa3 | | | | 909,000 | | | | 990,382 | |
| | | | | | | | | | | | |
| | | | | | | | | | | 2,910,923 | |
| | | | | | | | | | | | |
Electronic Equipment, Instruments & Components - 0.4% | | | | | | | | | |
Corning, Inc., 4.25%, 8/15/2020 | | | Baa1 | | | | 500,000 | | | | 493,768 | |
| | | | | | | | | | | | |
IT Services - 0.8% | | | | | | | | | | | | |
The Western Union Co., 5.253%, 4/1/2020 | | | A3 | | | | 945,000 | | | | 970,884 | |
| | | | | | | | | | | | |
Software - 1.3% | | | | | | | | | | | | |
Oracle Corp., 5.00%, 7/8/2019 | | | A2 | | | | 700,000 | | | | 759,503 | |
Oracle Corp.3, 3.875%, 7/15/2020 | | | A2 | | | | 675,000 | | | | 671,008 | |
| | | | | | | | | | | | |
| | | | | | | | | | | 1,430,511 | |
| | | | | | | | | | | | |
Total Information Technology | | | | | | | | | | | 6,985,579 | |
| | | | | | | | | | | | |
Materials - 3.2% | | | | | | | | | | | | |
Chemicals - 0.7% | | | | | | | | | | | | |
E.I. du Pont de Nemours & Co., 6.00%, 7/15/2018 | | | A2 | | | | 670,000 | | | | 770,363 | |
| | | | | | | | | | | | |
Metals & Mining - 1.4% | | | | | | | | | | | | |
Alcoa, Inc., 5.87%, 2/23/2022 | | | Baa3 | | | | 660,000 | | | | 655,691 | |
BHP Billiton Finance (USA) Ltd. (Australia), 6.50%, 4/1/2019 | | | A1 | | | | 810,000 | | | | 963,207 | |
| | | | | | | | | | | | |
| | | | | | | | | | | 1,618,898 | |
| | | | | | | | | | | | |
Paper & Forest Products - 1.1% | | | | | | | | | | | | |
International Paper Co., 7.50%, 8/15/2021 | | | Baa3 | | | | 1,065,000 | | | | 1,257,940 | |
| | | | | | | | | | | | |
Total Materials | | | | | | | | | | | 3,647,201 | |
| | | | | | | | | | | | |
Telecommunication Services - 1.2% | | | | | | | | | | | | |
Wireless Telecommunication Services - 1.2% | | | | | | | | | | | | |
Crown Castle Towers LLC3, 6.113%, 1/15/2020 | | | A2 | | | | 745,000 | | | | 777,274 | |
Crown Castle Towers LLC3, 4.883%, 8/15/2020 | | | A2 | | | | 250,000 | | | | 240,270 | |
| | |
| The accompanying notes are an integral part of the financial statements. | | 9 |
Investment Portfolio - December 31, 2010
| | | | | | | | | | | | |
| | | Credit Rating1 (unaudited) | | | Principal Amount/ Shares | | | Value (Note 2) | |
| | | |
CORPORATE BONDS (continued) | | | | | | | | | | | | |
| | | |
Non-Convertible Corporate Bonds (continued) | | | | | | | | | | | | |
Telecommunication Services (continued) | | | | | | | | | | | | |
Wireless Telecommunication Services (continued) | | | | | | | | | | | | |
SBA Tower Trust3, 5.101%, 4/15/2017 | | | A2 | | | $ | 375,000 | | | $ | 389,869 | |
| | | | | | | | | | | | |
Total Telecommunication Services | | | | | | | | | | | 1,407,413 | |
| | | | | | | | | | | | |
Utilities - 2.4% | | | | | | | | | | | | |
Electric Utilities - 2.1% | | | | | | | | | | | | |
Exelon Generation Co. LLC, 5.35%, 1/15/2014 | | | A3 | | | | 580,000 | | | | 627,891 | |
Exelon Generation Co. LLC, 6.20%, 10/1/2017 | | | A3 | | | | 350,000 | | | | 391,711 | |
Exelon Generation Co. LLC, 4.00%, 10/1/2020 | | | A3 | | | | 500,000 | | | | 467,919 | |
Southwestern Electric Power Co., 6.45%, 1/15/2019 | | | Baa3 | | | | 855,000 | | | | 938,920 | |
| | | | | | | | | | | | |
| | | | | | | | | | | 2,426,441 | |
| | | | | | | | | | | | |
| | | |
Multi-Utilities - 0.3% | | | | | | | | | | | | |
CenterPoint Energy Resources Corp., Series B, 7.875%, 4/1/2013 | | | Baa3 | | | | 335,000 | | | | 378,696 | |
| | | | | | | | | | | | |
Total Utilities | | | | | | | | | | | 2,805,137 | |
| | | | | | | | | | | | |
Total Non-Convertible Corporate Bonds
(Identified Cost $77,969,198) | | | | | | | | | | | 83,659,902 | |
| | | | | | | | | | | | |
TOTAL CORPORATE BONDS
(Identified Cost $79,098,051) | | | | | | | | | | | 84,905,621 | |
| | | | | | | | | | | | |
| | | |
PREFERRED STOCKS - 2.1% | | | | | | | | | | | | |
Financials - 2.1% | | | | | | | | | | | | |
Commercial Banks - 1.2% | | | | | | | | | | | | |
PNC Financial Services Group, Inc., Series K6, 8.25% | | | Baa3 | | | | 290,000 | | | | 309,224 | |
Wells Fargo & Co., Series K6, 7.98% | | | Baa3 | | | | 1,000,000 | | | | 1,055,000 | |
| | | | | | | | | | | | |
| | | | | | | | | | | 1,364,224 | |
| | | | | | | | | | | | |
Diversified Financial Services - 0.9% | | | | | | | | | | | | |
JPMorgan Chase & Co., Series 16, 7.90% | | | Baa1 | | | | 965,000 | | | | 1,025,785 | |
| | | | | | | | | | | | |
TOTAL PREFERRED STOCKS
(Identified Cost $2,309,476) | | | | | | | | | | | 2,390,009 | |
| | | | | | | | | | | | |
| | | |
ASSET-BACKED SECURITIES - 1.0% | | | | | | | | | | | | |
Capital Auto Receivables Asset Trust, Series 2007-1, Class A4A, 5.010%, 4/16/2012 | | | Aaa | | | $ | 22,273 | | | | 22,483 | |
Capital Auto Receivables Asset Trust, Series 2007-3, Class A4, 5.210%, 3/17/2014 | | | Aaa | | | | 30,476 | | | | 31,158 | |
Ford Credit Auto Owner Trust, Series 2008-C, Class A4B4, 2.010%, 4/15/2013 | | | Aaa | | | | 50,000 | | | | 50,716 | |
Hertz Vehicle Financing LLC, Series 2009-2A, Class A23, 5.290%, 3/25/2016 | | | Aaa | | | | 370,000 | | | | 401,877 | |
| | |
| 10 | | The accompanying notes are an integral part of the financial statements. |
Investment Portfolio - December 31, 2010
| | | | | | | | | | | | |
| | | Credit
Rating 1
(unaudited) | | | Principal
Amount | | | Value (Note 2) | |
| | | |
ASSET-BACKED SECURITIES (continued) | | | | | | | | | | | | |
| | | |
Hertz Vehicle Financing LLC, Series 2010-1A, Class A23, 3.740%, 2/25/2017 | | | Aaa | | | $ | 595,000 | | | $ | 604,517 | |
| | | | | | | | | | | | |
TOTAL ASSET-BACKED SECURITIES
(Identified Cost $1,061,591) | | | | | | | | | | | 1,110,751 | |
| | | | | | | | | | | | |
| | | |
COMMERCIAL MORTGAGE-BACKED SECURITIES - 3.7% | | | | | | | | | | | | |
| | | |
American Tower Trust, Series 2007-1A, Class AFX3, 5.420%, 4/15/2037 | | | Aaa | | | | 400,000 | | | | 432,503 | |
Americold LLC Trust, Series 2010-ARTA, Class A13, 3.847%, 1/14/2029 | | | AAA | 2 | | | 100,000 | | | | 100,179 | |
Banc of America Commercial Mortgage, Inc., Series 2006-2, Class A44, 5.740%, 5/10/2045 | | | AAA | 2 | | | 200,000 | | | | 218,952 | |
Banc of America Commercial Mortgage, Inc., Series 2006-4, Class A4, 5.634%, 7/10/2046 | | | Aaa | | | | 100,000 | | | | 107,295 | |
Bear Stearns Commercial Mortgage Securities, Series 2005-PWR9, Class A4A, 4.871%, 9/11/2042 | | | Aaa | | | | 100,000 | | | | 105,345 | |
Bear Stearns Commercial Mortgage Securities, Series 2006-PW12, Class A44, 5.722%, 9/11/2038 | | | Aaa | | | | 150,000 | | | | 163,660 | |
Citigroup Commercial Mortgage Trust, Series 2006-C4, Class A34, 5.728%, 3/15/2049 | | | Aaa | | | | 110,000 | | | | 119,055 | |
Commercial Mortgage Pass-Through Certificates, Series 2006-C7, Class A44, 5.764%, 6/10/2046 | | | AAA | 2 | | | 155,000 | | | | 169,473 | |
Commercial Mortgage Pass-Through Certificates, Series 2010-C1, Class A13, 3.156%, 7/20/2046 | | | Aaa | | | | 264,528 | | | | 265,124 | |
Greenwich Capital Commercial Funding Corp., Series 2006-GG7, Class A44, 5.883%, 7/10/2038 | | | Aaa | | | | 415,000 | | | | 452,764 | |
JP Morgan Chase Commercial Mortgage Securities Corp., Series 2005-LDP5, Class A44, 5.205%, 12/15/2044 | | | Aaa | | | | 325,000 | | | | 349,883 | |
JP Morgan Chase Commercial Mortgage Securities Corp., Series 2006-LDP7, Class A44, 5.872%, 4/15/2045 | | | Aaa | | | | 100,000 | | | | 109,361 | |
JP Morgan Chase Commercial Mortgage Securities Corp., Series 2010-C2, Class A33, 4.070%, 11/15/2043 | | | AAA | 2 | | | 200,000 | | | | 190,183 | |
LB-UBS Commercial Mortgage Trust, Series 2006-C4, Class A44, 5.881%, 6/15/2038 | | | Aaa | | | | 150,000 | | | | 162,318 | |
Merrill Lynch - Countrywide Commercial Mortgage Trust, Series 2006-3, Class A44, 5.414%, 7/12/2046 | | | Aaa | | | | 125,000 | | | | 131,759 | |
Morgan Stanley Capital I, Series 2005-HQ7, Class A44, 5.204%, 11/14/2042 | | | Aaa | | | | 100,000 | | | | 107,652 | |
OBP Depositor LLC Trust, Series 2010-OBP, Class A3, 4.646%, 7/15/2045 | | | AAA | 2 | | | 100,000 | | | | 102,036 | |
Vornado DP LLC, Series 2010-VNO, Class A2FX3, 4.004%, 9/13/2028 | | | AAA | 2 | | | 245,000 | | | | 237,541 | |
| | |
| The accompanying notes are an integral part of the financial statements. | | 11 |
Investment Portfolio - December 31, 2010
| | | | | | | | | | | | |
| | | Credit
Rating 1
(unaudited) | | | Principal
Amount/
Shares | | | Value (Note 2) | |
| | | |
COMMERCIAL MORTGAGE-BACKED SECURITIES (continued) | | | | | | | | | | | | |
| | | |
Wachovia Bank Commercial Mortgage Trust, Series 2005-C21, Class A44, 5.203%, 10/15/2044 | | | Aaa | | | $ | 150,000 | | | $ | 162,118 | |
Wachovia Bank Commercial Mortgage Trust, Series 2006-C25, Class A44, 5.737%, 5/15/2043 | | | Aaa | | | | 115,000 | | | | 123,345 | |
Wachovia Bank Commercial Mortgage Trust, Series 2006-C26, Class A34, 6.011%, 6/15/2045 | | | Aaa | | | | 150,000 | | | | 162,790 | |
Wells Fargo Commercial Mortgage Trust, Series 2010-C1, Class A23, 4.393%, 11/18/2043 | | | Aaa | | | | 275,000 | | | | 271,905 | |
| | | | | | | | | | | | |
TOTAL COMMERCIAL MORTGAGE-BACKED SECURITIES
(Identified Cost $4,219,389) | | | | | | | | | | | 4,245,241 | |
| | | | | | | | | | | | |
| | | |
MUNICIPAL BONDS - 0.9% | | | | | | | | | | | | |
| | | |
Monroe County Water Authority, Revenue Bond, 6.339%, 8/1/2035 | | | Aa2 | | | | 500,000 | | | | 509,950 | |
New York City, G.O. Bond, 6.646%, 12/1/2031 | | | Aa2 | | | | 500,000 | | | | 511,840 | |
| | | | | | | | | | | | |
TOTAL MUNICIPAL BONDS
(Identified Cost $1,000,000) | | | | | | | | | | | 1,021,790 | |
| | | | | | | | | | | | |
| | | |
MUTUAL FUNDS - 4.4% | | | | | | | | | | | | |
| | | |
iShares iBoxx Investment Grade Corporate Bond Fund (Identified Cost $4,523,436) | | | | | | | 46,150 | | | | 5,004,506 | |
| | | | | | | | | | | | |
| | | |
U.S. GOVERNMENT AGENCIES - 9.8% | | | | | | | | | | | | |
| | | |
Mortgage-Backed Securities - 9.8% | | | | | | | | | | | | |
Fannie Mae, Pool #888468, 5.50%, 9/1/2021 | | | | | | $ | 2,054,275 | | | | 2,215,086 | |
Fannie Mae, Pool #995233, 5.50%, 10/1/2021 | | | | | | | 136,132 | | | | 146,959 | |
Fannie Mae, Pool #888017, 6.00%, 11/1/2021 | | | | | | | 156,364 | | | | 170,608 | |
Fannie Mae, Pool #995329, 5.50%, 12/1/2021 | | | | | | | 1,210,769 | | | | 1,305,549 | |
Fannie Mae, Pool #888136, 6.00%, 12/1/2021 | | | | | | | 205,685 | | | | 224,422 | |
Fannie Mae, Pool #888810, 5.50%, 11/1/2022 | | | | | | | 2,169,029 | | | | 2,338,823 | |
Fannie Mae, Pool #AD0462, 5.50%, 10/1/2024 | | | | | | | 129,863 | | | | 139,718 | |
Fannie Mae, Pool #889409, 6.00%, 5/1/2038 | | | | | | | 2,922,364 | | | | 3,179,102 | |
Freddie Mac, Pool #G11850, 5.50%, 7/1/2020 | | | | | | | 666,781 | | | | 719,186 | |
Freddie Mac, Pool #G12610, 6.00%, 3/1/2022 | | | | | | | 209,422 | | | | 228,695 | |
Freddie Mac, Pool #G12655, 6.00%, 5/1/2022 | | | | | | | 143,019 | | | | 156,181 | |
Freddie Mac, Pool #G12988, 6.00%, 1/1/2023 | | | | | | | 117,388 | | | | 127,971 | |
Freddie Mac, Pool #G13078, 6.00%, 3/1/2023 | | | | | | | 205,681 | | | | 224,610 | |
| | | | | | | | | | | | |
TOTAL U.S. GOVERNMENT AGENCIES
(Identified Cost $11,198,202) | | | | | | | | | | | 11,176,910 | |
| | | | | | | | | | | | |
| | |
| 12 | | The accompanying notes are an integral part of the financial statements. |
Investment Portfolio - December 31, 2010
| | | | | | | | |
| | | Shares | | | Value (Note 2) | |
| | |
SHORT-TERM INVESTMENTS - 2.6% | | | | | | | | |
| | |
Dreyfus Cash Management, Inc. - Institutional Shares5, 0.14%, (Identified Cost $2,990,144) | | | 2,990,144 | | | $ | 2,990,144 | |
| | | | | | | | |
TOTAL INVESTMENTS - 98.9%
(Identified Cost $106,400,289) | | | | | | | 112,844,972 | |
OTHER ASSETS, LESS LIABILITIES - 1.1% | | | | | | | 1,213,042 | |
| | | | | | | | |
NET ASSETS - 100% | | | | | | $ | 114,058,014 | |
| | | | | | | | |
G.O. Bond - General Obligation Bond
1Credit ratings from Moody’s (unaudited).
2Credit ratings from S&P (unaudited).
3Restricted securities - Investment in securities that are restricted as to public resale under the Securities Act of 1933, as amended. These securities have been sold under rule 144A and have been determined to be liquid under guidelines established by the Board of Directors. These securities amount to $5,186,243, or 4.5% of the Series’ net assets as of December 31, 2010.
4The coupon rate is floating and is the stated rate as of December 31, 2010.
5Rate shown is the current yield as of December 31, 2010.
6The rate shown is the fixed rate as of December 31, 2010; the rate becomes floating in 2049.
| | |
| The accompanying notes are an integral part of the financial statements. | | 13 |
Statement of Assets and Liabilities
December 31, 2010
| | | | |
ASSETS: | | | | |
| |
Investments, at value (identified cost $106,400,289) (Note 2) | | $ | 112,844,972 | |
Interest receivable | | | 1,305,102 | |
Dividends receivable | | | 20,202 | |
| | | | |
| |
TOTAL ASSETS | | | 114,170,276 | |
| | | | |
| |
LIABILITIES: | | | | |
| |
Accrued management fees (Note 3) | | | 56,977 | |
Accrued fund accounting and administration fees (Note 3) | | | 7,124 | |
Accrued transfer agent fees (Note 3) | | | 428 | |
Accrued Chief Compliance Officer service fees (Note 3) | | | 243 | |
Audit fees payable | | | 30,977 | |
Registration fees payable | | | 6,988 | |
Printing fees payable | | | 5,813 | |
Other payables and accrued expenses | | | 3,712 | |
| | | | |
| |
TOTAL LIABILITIES | | | 112,262 | |
| | | | |
| |
TOTAL NET ASSETS | | $ | 114,058,014 | |
| | | | |
| |
NET ASSETS CONSIST OF: | | | | |
| |
Capital stock | | $ | 104,226 | |
Additional paid-in-capital | | | 107,668,697 | |
Undistributed net investment income | | | 211,367 | |
Accumulated net realized loss on investments | | | (370,959 | ) |
Net unrealized appreciation on investments | | | 6,444,683 | |
| | | | |
| |
TOTAL NET ASSETS | | $ | 114,058,014 | |
| | | | |
| |
NET ASSET VALUE, OFFERING PRICE AND REDEMPTION PRICE PER SHARE -
Class A ($114,058,014/10,422,646 shares) | | $ | 10.94 | |
| | | | |
| | |
| 14 | | The accompanying notes are an integral part of the financial statements. |
Statement of Operations
For the Year Ended December 31, 2010
| | | | |
INVESTMENT INCOME: | | | | |
| |
Interest | | $ | 4,290,125 | |
Dividends | | | 309,634 | |
| | | | |
| |
Total Investment Income | | | 4,599,759 | |
| | | | |
| |
EXPENSES: | | | | |
| |
Management fees (Note 3) | | | 568,425 | |
Fund accounting and administration fees (Note 3) | | | 54,794 | |
Directors’ fees (Note 3) | | | 8,306 | |
Chief Compliance Officer service fees (Note 3) | | | 2,621 | |
Transfer agent fees (Note 3) | | | 2,554 | |
Custodian fees | | | 6,455 | |
Miscellaneous | | | 74,094 | |
| | | | |
| |
Total Expenses | | | 717,249 | |
Less reduction of expenses (Note 3) | | | (758 | ) |
| | | | |
| |
Net Expenses | | | 716,491 | |
| | | | |
| |
NET INVESTMENT INCOME | | | 3,883,268 | |
| | | | |
| |
REALIZED AND UNREALIZED GAIN ON INVESTMENTS: | | | | |
| |
Net realized gain on investments | | | 499,316 | |
Net change in unrealized appreciation on investments | | | 3,349,635 | |
| | | | |
| |
NET REALIZED AND UNREALIZED GAIN ON INVESTMENTS | | | 3,848,951 | |
| | | | |
| |
NET INCREASE IN NET ASSETS RESULTING FROM OPERATIONS | | $ | 7,732,219 | |
| | | | |
| | |
| The accompanying notes are an integral part of the financial statements. | | 15 |
Statement of Changes in Net Assets
| | | | | | | | |
| | | For the Year Ended
12/31/10 | | | For the
Year Ended
12/31/09 | |
INCREASE (DECREASE) IN NET ASSETS: | | | | | | | | |
| | |
OPERATIONS: | | | | | | | | |
| | |
Net investment income | | $ | 3,883,268 | | | $ | 2,981,016 | |
Net realized gain on investments | | | 499,316 | | | | 196,512 | |
Net change in unrealized appreciation on investments | | | 3,349,635 | | | | 3,411,672 | |
| | | | | | | | |
| | |
Net increase from operations | | | 7,732,219 | | | | 6,589,200 | |
| | | | | | | | |
| | |
DISTRIBUTIONS TO SHAREHOLDERS (Note 8): | | | | | | | | |
| | |
From net investment income | | | (3,683,326 | ) | | | (2,992,322 | ) |
| | | | | | | | |
| | |
CAPITAL STOCK ISSUED AND REPURCHASED: | | | | | | | | |
| | |
Net increase from capital share transactions (Note 5) | | | 33,408,300 | | | | 19,933,271 | |
| | | | | | | | |
| | |
Net increase in net assets | | | 37,457,193 | | | | 23,530,149 | |
| | |
NET ASSETS: | | | | | | | | |
| | |
Beginning of year | | | 76,600,821 | | | | 53,070,672 | |
| | | | | | | | |
End of year (including undistributed net investment income of $211,367 and $1,751, respectively) | | $ | 114,058,014 | | | $ | 76,600,821 | |
| | | | | | | | |
| | |
| 16 | | The accompanying notes are an integral part of the financial statements. |
Financial Highlights
| | | | | | | | | | | | | | | | | | | | |
| | | |
| | | | | | For the Years Ended | | | | |
| | | 12/31/10 | | | 12/31/09 | | | 12/31/08 | | | 12/31/07 | | | 12/31/06 | |
| Per share data (for a share outstanding throughout each year): | | | | | | | | | | | | | | | | | | | | |
Net asset value - Beginning of year | | | $10.38 | | | | $9.69 | | | | $10.05 | | | | $9.98 | | | | $9.89 | |
| | | | | | | | | | | | | | | | | | | | |
Income (loss) from investment operations: | | | | | | | | | | | | | | | | | | | | |
Net investment income | | | 0.451 | | | | 0.491 | | | | 0.45 | | | | 0.42 | | | | 0.36 | |
Net realized and unrealized gain (loss) on investments | | | 0.48 | | | | 0.62 | | | | (0.30) | | | | 0.13 | | | | 0.09 | |
| | | | | | | | | | | | | | | | | | | | |
Total from investment operations | | | 0.93 | | | | 1.11 | | | | 0.15 | | | | 0.55 | | | | 0.45 | |
| | | | | | | | | | | | | | | | | | | | |
Less distributions to shareholders: | | | | | | | | | | | | | | | | | | | | |
From net investment income | | | (0.37) | | | | (0.42) | | | | (0.46) | | | | (0.42) | | | | (0.36) | |
From net realized gain on investments | | | — | | | | — | | | | (0.05) | | | | (0.06) | | | | — | |
| | | | | | | | | | | | | | | | | | | | |
Total distributions to shareholders | | | (0.37) | | | | (0.42) | | | | (0.51) | | | | (0.48) | | | | (0.36) | |
| | | | | | | | | | | | | | | | | | | | |
Net asset value - End of year | | | $10.94 | | | | $10.38 | | | | $9.69 | | | | $10.05 | | | | $9.98 | |
| | | | | | | | | | | | | | | | | | | | |
Net assets - End of year
(000’s omitted) | | | $114,058 | | | | $76,601 | | | | $53,071 | | | | $49,909 | | | | $45,696 | |
| | | | | | | | | | | | | | | | | | | | |
Total return2 | | | 8.97% | | | | 11.46% | | | | 1.66% | | | | 5.58% | | | | 4.51% | |
Ratios (to average net assets)/ Supplemental Data: | | | | | | | | | | | | | | | | | | | | |
Expenses* | | | 0.76% | | | | 0.79% | | | | 0.80% | | | | 0.80% | | | | 0.80% | |
Net investment income | | | 4.10% | | | | 4.84% | | | | 4.73% | | | | 4.21% | | | | 3.87% | |
Portfolio turnover | | | 23% | | | | 67% | | | | 53% | | | | 346% | | | | 313% | |
|
*The investment advisor did not impose all or a portion of its management fees, CCO fees, fund accounting and transfer agent fees, and other fees in some years and in some years paid a portion of the Series’ expenses. If these expenses had been incurred by the Series, the expense ratio (to average net assets) would have been increased by the following amounts: | |
| | | 0.00%3 | | | | 0.00%3 | | | | 0.03% | | | | 0.04% | | | | 0.08% | |
1Calculated based on average shares outstanding during the year.
2Represents aggregate total return for the year indicated, and assumes reinvestment of all distributions. Total return would have been lower had certain expenses not been waived or reimbursed during the years.
3Less than 0.01%.
| | |
| The accompanying notes are an integral part of the financial statements. | | 17 |
Notes to Financial Statements
Core Bond Series (the “Series”) is a no-load diversified series of Manning & Napier Fund, Inc. (the “Fund”). The Fund is organized in Maryland and is registered under the Investment Company Act of 1940, as amended, as an open-end management investment company.
The Series’ investment objective is to provide long-term total return by investing primarily in investment-grade bonds and other financial instruments, including derivatives, with economic characteristics similar to bonds.
The Fund’s Advisor is Manning & Napier Advisors, Inc. (the “Advisor”). Shares of the Series are offered to investors, clients and employees of the Advisor and its affiliates. The total authorized capital stock of the Fund consists of 10.0 billion shares of common stock each having a par value of $0.01. As of December 31, 2010, 6.2 billion shares have been designated in total among 29 series, of which 125 million have been designated as Core Bond Series Class A common stock.
| 2. | SIGNIFICANT ACCOUNTING POLICIES |
Security Valuation
Portfolio securities, including domestic equities, foreign equities, warrants and options, listed on an exchange other than the NASDAQ National Market System are valued at the latest quoted sales price of the exchange on which the security is primarily traded. Securities not traded on valuation date or securities not listed on an exchange are valued at the latest quoted bid price provided by the Fund’s pricing service. Securities listed on the NASDAQ National Market System are valued in accordance with the NASDAQ Official Closing Price.
Debt securities, including government bonds, foreign bonds, asset-backed securities, structured notes, supranational obligations, sovereign bonds, corporate bonds and mortgage-backed securities will normally be valued on the basis of evaluated bid prices provided directly by an independent pricing service. The pricing services use multiple valuation techniques to determine fair value. In instances where sufficient market activity exists, the pricing services may utilize a market-based approach through which quotes from market makers are used to determine fair value. In instances where sufficient market activity may not exist or is limited, the pricing services also utilize proprietary valuation models which may consider market characteristics such as benchmark yield curves, option-adjusted spreads, credit spreads, estimated default rates, coupon rates, anticipated timing of principal repayments, underlying collateral, and other unique security features in order to estimate the relevant cash flows, which are then discounted to calculate the fair value. Certain investments in securities held by the Series may be valued on a basis of a price provided directly by a principal market maker. These prices may differ from the value that would have been used had a broader market for securities existed.
Municipal securities will normally be valued on the basis of market valuations provided by an independent pricing service that utilizes the latest price quotations and a matrix system (which considers such factors as security prices of similar securities, yields, maturities and ratings).
Short-term investments that mature in sixty days or less are valued at amortized cost, which approximates market value. Investments in open-end investment companies are valued at their net asset value per share on valuation date.
Volume and level of activity in established markets for an asset or liability are evaluated to determine whether recent transactions and quoted prices are determinative of fair value. Where there have been significant decreases in volume and level of activity, further analysis and adjustment may be necessary to estimate fair value. The Series measures fair value in these instances by the use of inputs and valuation techniques which may be based upon current market prices of securities that are comparable in coupon, rating, maturity and industry and/or expectation of future cash flows. As a result of trading in relatively thin markets and/or markets that experience significant volatility,
Notes to Financial Statements
| 2. | SIGNIFICANT ACCOUNTING POLICIES (continued) |
Security Valuation (continued)
the prices used by the Series to value these securities may differ from the value that would be realized if these securities were sold, and the differences could be material.
Securities for which representative valuations or prices are not available from the Fund’s pricing service may be valued at fair value. Due to the inherent uncertainty of valuations of such securities, the fair value may differ significantly from the values that would have been used had a ready market for such securities existed. If trading or events occurring after the close of the principal market in which securities are traded are expected to materially affect the value of those securities, then they may be valued at their fair value, taking this trading or these events into account. Fair value is determined in good faith by the Advisor under procedures approved by and under the general supervision and responsibility of the Fund’s Board of Directors (the “Board”).
Various inputs are used in determining the value of the Series’ assets or liabilities carried at market value. These inputs are summarized in three broad levels. Level 1 includes quoted prices in active markets for identical assets and liabilities. Level 2 includes other significant observable inputs (including quoted prices for similar securities, interest rates, prepayment speeds, credit risk, etc.). Level 3 includes significant unobservable inputs (including the Series’ own assumptions in determining the fair value of investments). The inputs or methodology used for valuing securities are not necessarily an indication of the risk associated with investing in those securities.
The following is a summary of the valuation levels used for major security types as of December 31, 2010 in valuing the Series’ assets or liabilities carried at market value:
| | | | | | | | | | | | | | | | | | |
| | | | | |
| | | Description | | Total | | | Level 1 | | | Level 2 | | | Level 3 | |
| | Assets: | | | | | | | | | | | | | | | | |
| | Equity securities* | | $ | — | | | $ | — | | | $ | — | | | $ | — | |
| | Preferred securities | | | 2,390,009 | | | | — | | | | 2,390,009 | | | | — | |
| | Debt securities: | | | | | | | | | | | | | | | | |
| | U.S. Treasury and other U.S. Government agencies | | | 11,176,910 | | | | — | | | | 11,176,910 | | | | — | |
| | States and political subdivisions (municipals) | | | 1,021,790 | | | | — | | | | 1,021,790 | | | | — | |
| | Corporate debt | | | 83,659,902 | | | | — | | | | 83,659,902 | | | | — | |
| | Convertible corporate debt | | | 1,245,719 | | | | — | | | | 1,245,719 | | | | — | |
| | Asset backed securities | | | 1,110,751 | | | | — | | | | 1,110,751 | | | | — | |
| | Commercial mortgage backed securities | | | 4,245,241 | | | | — | | | | 4,245,241 | | | | — | |
| | Mutual funds | | | 7,994,650 | | | | 7,994,650 | | | | — | | | | — | |
| | Other financial instruments**: | | | — | | | | — | | | | — | | | | — | |
| | | | | | | | | | | | | | | | | | |
| | Total assets: | | | 112,844,972 | | | | 7,994,650 | | | | 104,850,322 | | | | — | |
| | | | | | | | | | | | | | | | | | |
| | Liabilities: | | | | | | | | | | | | | | | | |
| | Other financial instruments**: | | | — | | | | — | | | | — | | | | — | |
| | Total liabilities: | | | — | | | | — | | | | — | | | | — | |
| | | | | | | | | | | | | | | | | | |
| | Total | | $ | 112,844,972 | | | $ | 7,994,650 | | | $ | 104,850,322 | | | $ | — | |
| | | | | | | | | | | | | | | | | | |
*Includes common stock, warrants and rights. Please see the Investment Portfolio for industry classification.
Notes to Financial Statements
| 2. | SIGNIFICANT ACCOUNTING POLICIES (continued) |
Security Valuation (continued)
**Other financial instruments are derivative instruments not reflected in the Investment Portfolio, such as futures, forwards and swap contracts, which are valued at the unrealized appreciation/depreciation on the instrument. As of December 31, 2010, the Series did not hold any derivative instruments.
There were no Level 3 securities held by the Series as of December 31, 2009 or December 31, 2010.
The Fund’s policy is to recognize transfers in and transfers out of the valuation levels as of the beginning of the reporting period. There were no significant transfers between Level 1 and Level 2 during the year ended December 31, 2010.
Additional disclosure surrounding the activity in Level 3 fair value measurement will be effective for fiscal years beginning after December 15, 2010. Management has concluded that this will not have a material impact on the Series’ financial statements.
Security Transactions, Investment Income and Expenses
Security transactions are accounted for on trade date. Dividend income is recorded on the ex-dividend date, except that if the ex-dividend date has passed, certain dividends from foreign securities are recorded as soon as the Fund is informed of the ex-dividend date. Non-cash dividends, if any, are recorded at the fair market value of the securities received. Interest income, including amortization of premium and accretion of discounts using the effective interest method, is earned from settlement date and accrued daily.
Expenses are recorded on an accrual basis. Most expenses of the Fund can be attributed to a specific series. Expenses which cannot be directly attributed are apportioned among the series in the Fund in such a manner as deemed equitable by the Fund’s Board, taking into consideration, among other things, the nature and type of expense.
The Series uses the identified cost method for determining realized gain or loss on investments for both financial statement and federal income tax reporting purposes.
Foreign Currency Translation
The books and records of the Series are maintained in U.S. dollars. Foreign currencies, investments and other assets and liabilities are translated into U.S. dollars at the current exchange rates. Purchases and sales of investment securities and income and expenses are translated on the respective dates of such transactions. The Series does not isolate realized and unrealized gains and losses attributable to changes in the exchange rates from gains and losses that arise from changes in the market value of investments. Such fluctuations are included with net realized and unrealized gain or loss on investments. Net realized foreign currency gains and losses represent foreign currency gains and losses between trade date and settlement date on securities transactions, gains and losses on disposition of foreign currencies and the difference between the amount of income and foreign withholding taxes recorded on the books of the Series and the amounts actually received or paid.
Securities Purchased on a When-Issued Basis or Forward Commitment
The Series may purchase securities on a when-issued basis or forward commitment. These transactions involve a commitment by the Series to purchase securities for a predetermined price with payment and delivery taking place beyond the customary settlement period. When such purchases are outstanding, the Series will designate liquid assets in an amount sufficient to meet the purchase price. When purchasing a security on a delayed delivery basis, the Series assumes the rights and risks of ownership of the security, including the risk of price and yield fluctuations, and takes such fluctuations into account when determining its net asset value. The Series may sell the when-issued securities before they are delivered, which may result in a capital gain or loss. No such investments were held by the Series as of December 31, 2010.
Notes to Financial Statements
| 2. | SIGNIFICANT ACCOUNTING POLICIES (continued) |
Securities Purchased on a When-Issued Basis or Forward Commitment (continued)
In connection with its ability to purchase or sell securities on a forward commitment basis, the Series may enter into forward roll transactions principally using To Be Announced (TBA) securities. Forward roll transactions require the sale of securities for delivery in the current month, and a simultaneous agreement to repurchase substantially similar (same type, coupon and maturity) securities on a specified future date. Risks of entering into forward roll transactions include the potential inability of the counterparty to meet the terms of the agreement; the potential of the Series to receive inferior securities at redelivery as compared to the securities sold to the counterparty; counterparty credit risk; and the potential pay down speed variance between the mortgage-backed pools. During the roll period, the Series forgoes principal and interest paid on the securities. The Series accounts for such dollar rolls as purchases and sales. Information regarding securities purchased on a when-issued basis is included in the Series’ Investment Portfolio. No such investments were held by the Series as of December 31, 2010.
Restricted Securities
Restricted securities are purchased in private placement transactions, are not registered under the Securities Act of 1933, as amended, and may have contractual restrictions on resale. Information regarding restricted securities is included at the end of the Series’ Investment Portfolio.
Illiquid Securities
A security may be considered illiquid if so deemed in good faith by the Advisor under procedures approved by and under the general supervision and responsibility of the Fund’s Board. Securities that are illiquid are marked with the applicable footnote on the Investment Portfolio. No such investments were held by the Series on December 31, 2010.
Federal Taxes
The Series’ policy is to comply with the provisions of the Internal Revenue Code applicable to regulated investment companies. The Series is not subject to federal income tax or excise tax to the extent that the Series distributes to shareholders each year its taxable income, including any net realized gains on investments, in accordance with requirements of the Internal Revenue Code. Accordingly, no provision for federal income tax or excise tax has been made in the financial statements.
Management evaluates its tax positions to determine if the tax positions taken meet the minimum recognition threshold in connection with accounting for uncertainties in income tax positions taken or expected to be taken for the purposes of measuring and recognizing tax liabilities in the financial statements. Recognition of tax benefits of an uncertain tax position is required only when the position is “more likely than not” to be sustained assuming examination by taxing authorities. At December 31, 2010, the Series has recorded no liability for net unrecognized tax benefits relating to uncertain income tax positions taken or expected to be taken in future tax returns.
The Series files income tax returns in the U.S. federal jurisdiction, various states and foreign jurisdictions, as required. No income tax returns are currently under investigation. The statute of limitations on the Series’ tax returns remains open for the years ended December 31, 2007 through December 31, 2010. The Fund is not aware of any tax positions for which it is reasonably possible that the total amounts of unrecognized tax benefits will significantly change in the next twelve months.
Additionally, based on the Fund’s understanding of the tax rules and rates related to income, gains and transactions for foreign jurisdictions in which it invests, the Series will provide for foreign taxes, and where appropriate, deferred foreign tax.
Notes to Financial Statements
| 2. | SIGNIFICANT ACCOUNTING POLICIES (continued) |
Distributions of Income and Gains
Distributions to shareholders of net investment income and net realized gains are made annually. An additional distribution may be necessary to avoid taxation of the Series. Distributions are recorded on the ex-dividend date.
Indemnifications
The Fund’s organizational documents provide former and current directors and officers with a limited indemnification against liabilities arising in connection with the performance of their duties to the Fund. In the normal course of business, the Fund may also enter into contracts that provide general indemnifications. The Fund’s maximum exposure under these arrangements is unknown as this would be dependent on future claims that may be made against the Fund. The risk of material loss from such claims is considered remote.
Other
The preparation of financial statements in conformity with accounting principles generally accepted in the United States of America requires management to make estimates and assumptions that affect the reported amounts of assets and liabilities and the disclosure of contingent assets and liabilities at the date of the financial statements and the reported amounts of income and expenses during the reporting period. Actual results could differ from those estimates.
| 3. | TRANSACTIONS WITH AFFILIATES |
The Fund has an Investment Advisory Agreement (the “Agreement”) with the Advisor, for which the Series pays a fee, computed daily and payable monthly, at an annual rate of 0.60% of the Series’ average daily net assets.
Under the Agreement, personnel of the Advisor provide the Series with advice and assistance in the choice of investments and the execution of securities transactions, and otherwise maintain the Series’ organization. The Advisor also provides the Fund with necessary office space and fund administration and support services. The salaries of all officers of the Fund (except a percentage of the Fund’s Chief Compliance Officer’s salary, which is paid by the Fund), and of all Directors who are “affiliated persons” of the Fund, or of the Advisor, and all personnel of the Fund, or of the Advisor, performing services relating to research, statistical and investment activities, are paid by the Advisor. Each “non-affiliated” Director receives an annual stipend, which is allocated among all the active series of the Fund. In addition, these Directors also receive a fee per Board meeting attended plus a fee for each committee meeting attended.
The Advisor has contractually agreed, until at least April 30, 2012, to waive its fee and, if necessary, pay other operating expenses of the Series in order to maintain total direct annual fund operating expenses for the Series at no more than 0.80% of average daily net assets each year. For the year ended December 31, 2010, the Advisor voluntarily waived fees of $758, which is included as a reduction of expenses on the Statement of Operations. The Advisor is not eligible to recoup any expenses that have been waived or reimbursed in prior years.
Manning & Napier Investor Services, Inc., a registered broker-dealer affiliate of the Advisor, acts as distributor for the Fund’s shares. The services of Manning & Napier Investor Services, Inc. are provided at no additional cost to the Series.
The Advisor has agreements with PNC Global Investment Servicing (U.S.) Inc. (“PNCGIS”) under which PNCGIS serves as sub-accountant services agent and sub- transfer agent. The Fund pays the Advisor an annual fee related to fund accounting and administration of 0.0175% on the first $3 billion of average daily net assets (excluding Target Series); 0.015% on the next $3 billion of average daily net assets (excluding Target Series); and 0.01% of the average daily net assets in excess of $6 billion (excluding Target Series); plus a base fee of $25,500 per Series.
Notes to Financial Statements
| 3. | TRANSACTIONS WITH AFFILIATES (continued) |
Transfer Agent fees are charged to the Fund on a per account basis. Additionally, certain transaction- and cusip-based fees and out-of-pocket expenses, including charges for reporting relating to the Fund’s compliance program, are charged.
Effective July 1, 2010, PNCGIS was sold to The Bank of New York Mellon Corporation, the Series’ custodian. At the close of the sale, PNCGIS changed its name to BNY Mellon Investment Servicing (U.S.) Inc. (“BNY”).
Expenses not directly attributable to a Series are allocated based on each Series’ relative net assets or number of accounts, depending on the expense.
| 4. | PURCHASES AND SALES OF SECURITIES |
For the year ended December 31, 2010, purchases and sales of securities, other than U.S. Government securities and short-term securities, were $41,886,293 and $9,417,688, respectively. Purchases and sales of U.S. Government securities, other than short-term securities, were $12,562,768 and $11,446,569, respectively.
| 5. | CAPITAL STOCK TRANSACTIONS |
Transactions in shares of Core Bond Series were:
| | | | | | | | | | | | | | | | |
| | | For the Year Ended 12/31/10 | | | For the Year Ended 12/31/09 | |
| | | Shares | | | Amount | | | Shares | | | Amount | |
Sold | | | 3,256,147 | | | $ | 35,669,098 | | | | 2,334,851 | | | $ | 24,190,684 | |
Reinvested | | | 338,001 | | | | 3,639,306 | | | | 282,320 | | | | 2,942,598 | |
Repurchased | | | (553,027 | ) | | | (5,900,104 | ) | | | (711,761 | ) | | | (7,200,011 | ) |
| | | | | | | | | | | | | | | | |
Total | | | 3,041,121 | | | | 33,408,300 | | | | 1,905,410 | | | | 19,933,271 | |
| | | | | | | | | | | | | | | | |
Substantially all of the Series’ shares represent investments by fiduciary accounts over which the Advisor has sole investment discretion.
The Series may trade in instruments including written and purchased options, forward foreign currency exchange contracts and futures contracts and other derivatives in the normal course of investing activities to assist in managing exposure to various market risks. Investments in these instruments may subject the Series to various elements of risk, which may involve, to a varying degree, elements of risk in excess of the amounts recognized for financial statement purposes. These risks include: the risk that changes in the value of a derivative may not correlate perfectly with the underlying asset, rate or index, counterparty credit risk related to over the counter derivatives counterparties’ failure to perform under contract terms, liquidity risk related to the lack of a liquid market for these contracts allowing the fund to close out its position(s) and documentation risk relating to disagreement over contract terms. No such investments were held by the Series during the year ended December 31, 2010.
Investing in securities of foreign companies and foreign governments involves special risks and considerations not typically associated with investing in securities of domestic companies and the U.S. Government. These risks include revaluation of currencies and future adverse political and economic developments. Moreover, securities of foreign companies and foreign governments and their markets may be less liquid and their prices more volatile than those of comparable domestic companies and the U.S. Government.
Notes to Financial Statements
| 8. | FEDERAL INCOME TAX INFORMATION |
The amount and characterization of certain income and capital gains to be distributed are determined in accordance with federal income tax regulations, which may differ from accounting principles generally accepted in the United States of America. These differences are primarily due to differing book and tax treatments in the timing of the recognition of net investment income or gains and losses, including investments in hybrid securities. The Series may periodically make reclassifications among its capital accounts to reflect income and gains available for distribution (or available capital loss carryovers) under income tax regulations without impacting the Series’ net asset value. Any such reclassifications are not reflected in the financial highlights.
The tax character of distributions paid were as follows:
| | | | | | | | |
| | | For the Year Ended
12/31/10 | | | For the Year Ended
12/31/09 | |
Ordinary income | | $ | 3,683,326 | | | $ | 2,992,322 | |
At December 31, 2010, the tax basis of distributable earnings and the net unrealized appreciation based on identified cost for federal income tax purposes were as follows:
| | | | | | |
Cost for federal income tax purposes | | $ | 106,472,401 | | | |
Unrealized appreciation | | $ | 6,690,312 | | | |
Unrealized depreciation | | | (317,741 | ) | | |
| | | | | | |
Net unrealized appreciation | | $ | 6,372,571 | | | |
| | | | | | |
Undistributed ordinary income | | | 234,229 | | | |
Capital loss carryover | | | 370,960 | | | |
At December 31, 2010, the capital loss carryover, disclosed above, available to the extent allowed by tax law to offset future net capital gain, if any, will expire as follows:
| | | | | | | | |
| | | | | Loss Carryover | | | Expiration Date |
| | | | | $350,661 | | | December 31, 2016 |
| | | | | 20,299 | | | December 31, 2017 |
The capital loss carryover utilized in the current year was $489,642.
Report of Independent Registered Public Accounting Firm
To the Board of Directors of Manning & Napier Fund, Inc. and Shareholders of Core Bond Series:
In our opinion, the accompanying statement of assets and liabilities, including the investment portfolio, and the related statements of operations and of changes in net assets and the financial highlights present fairly, in all material respects, the financial position of the Core Bond Series (a series of Manning & Napier Fund, Inc., hereafter referred to as the “Series”) at December 31, 2010, and the results of its operations for the year then ended, the changes in its net assets for each of the two years in the period then ended and the financial highlights for each of the five years in the period then ended, in conformity with accounting principles generally accepted in the United States of America. These financial statements and financial highlights (hereafter referred to as “financial statements”) are the responsibility of the Series’ management. Our responsibility is to express an opinion on these financial statements based on our audits. We conducted our audits of these financial statements in accordance with the standards of the Public Company Accounting Oversight Board (United States). Those standards require that we plan and perform the audit to obtain reasonable assurance about whether the financial statements are free of material misstatement. An audit includes examining, on a test basis, evidence supporting the amounts and disclosures in the financial statements, assessing the accounting principles used and significant estimates made by management, and evaluating the overall financial statement presentation. We believe that our audits, which included confirmation of securities at December 31, 2010 by correspondence with the custodian, provide a reasonable basis for our opinion.
New York, New York
February 22, 2011
Supplemental Tax Information (unaudited)
All designations are based on financial information available as of the date of this annual report and, accordingly are subject to change.
For federal income tax purposes, the Series designates for the current fiscal year $94,940 or, if different, the maximum amount allowable under the tax law as qualified dividend income.
For corporate shareholders, the percentage of investment income (dividend income plus short-term gain, if any) that qualifies for the dividends received deduction for the current fiscal year is 2.58%, or if different, the maximum allowable under tax law.
Renewal of Investment Advisory Agreement (unaudited)
At the Manning & Napier Fund, Inc. (the “Fund”) Board of Directors’ (the “Board”) meeting, held on November 17, 2010, the Investment Advisory Agreement (the “Agreement”) between the Fund and Manning & Napier Advisors, Inc. (the “Advisor”) was reviewed by the Board for renewal. In connection with the decision whether to renew the Agreement, a variety of material was prepared for and reviewed by the Board.
Representatives of the Advisor attended the meeting and presented additional oral and written information to the Board to assist the Board in its considerations. The discussion immediately below outlines the materials and information presented to the Board in connection with the Board’s 2010 Annual Review of the Agreement and the conclusions made by the Directors when determining to continue the Agreement.
| | • | | The Board considered the services provided by the Advisor under the Agreement including, among others: deciding what securities to purchase and sell for each Series; arranging for the purchase and sale of such securities by placing orders with broker-dealers; administering the affairs of the Fund (including the books and records of the Fund not maintained by third party service providers such as the custodian or sub-transfer agent); arranging for the insurance coverage for the Fund; and supervising the preparation of tax returns, SEC filings (including registration statements) and reports to shareholders for the Fund. The Board also considered the nature and quality of such services provided under the Agreement in light of the Advisor’s services provided to the Fund for 24 years. The Board discussed the quality of these services with representatives from the Advisor and concluded that the Advisor was performing its services to the Fund required under the Agreement in a reasonable manner. |
| | • | | The Board considered the investment performance of the various Series of the Fund. The investment performance for each Series was reviewed on a cumulative basis since inception and on a one year basis. In addition, annualized performance for the following time periods was considered: inception, three year, five year, ten year, and current market cycle. A market cycle includes periods of both rising and falling markets. Returns for established benchmark indices for each Series were provided for each time period. The Board noted that the various Series were competitive against their respective benchmarks and/or peer groups over various time periods, but in particular over the full market cycle period relevant for the Series. In addition, the Board considered at the meeting (and considers on a quarterly basis) a peer group performance analysis consisting of Morningstar universes of mutual funds with similar investment objectives. The Board discussed the performance with representatives from the Advisor and concluded that the investment performance of each of the Fund’s Series was reasonable based on the Fund’s actual performance and comparative performance, especially performance over the current market cycle. |
| | • | | The Board considered the costs of the Advisor’s services and the profits of the Advisor as they relate to the Advisor’s services to the Fund under the Agreement. In reviewing the Advisor’s costs and profits, the Board discussed the Advisor’s revenues generated from the Fund (on both an actual and adjusted basis) and its expenses associated with providing the services under the Agreement. In addition, the Board reviewed the Advisor’s expenses associated with Fund activities outside of the Agreement (such as expense reimbursements pursuant to expense caps and payments made by the Advisor to third party platforms on which shares of the Fund are available for purchase). It was noted by representatives of the Advisor that 11 of the 27 active Series of the Fund are currently experiencing expenses above the capped expense ratios. After discussing the above costs and profits, the Board concluded that the Advisor’s profitability relating to its services provided under the Agreement was reasonable. |
| | • | | The Board considered the fees and expenses of the various Series of the Fund. The Advisor presented the advisory fees and total expenses for each Series, including the advisory fee adjusted for any expense waivers or reimbursements (either contractual or voluntary) paid by the Advisor. The advisory fees and expense ratios of each Series were compared to an average (on both a mean and median basis) of similar funds as disclosed on the Morningstar database. Representatives of the Advisor discussed with the Board the levels of its advisory |
Renewal of Investment Advisory Agreement (unaudited)
fee for each Series of the Fund and as compared to the median and mean advisory fees for similar funds as listed on Morningstar. Expense ratios for every Series, except the Pro-Blend’s Class R and Class C, and Target Class R and Class C, are currently below the median and mean for similar funds as listed on Morningstar. Based on their review of the information provided, the Board concluded that the fees and expenses of each Series of the Fund were reasonable on a comparative basis.
| | • | | The Board also considered the other benefits the Advisor derives from its relationship with the Fund. Such other benefits include certain research products provided by soft dollars. Given the level of soft dollar transactions involving the Fund, the Board concluded that these additional benefits to the Advisor were reasonable. |
| | • | | In addition to the factors described above, the Board considered the Advisor’s personnel, investment strategies, policies and procedures relating to compliance with personal securities transactions, and reputation, expertise and resources in domestic and foreign financial markets. The Board concluded that these factors support the conclusion that the Advisor performs its services in a reasonable manner. |
| | • | | The Board did not consider economies of scale at this time because of the multiple uses of the Fund (for the Advisor’s discretionary investment account clients in addition to direct investors), the current profitability of the Advisor’s services to the Fund under the Agreement, and the overall size of the Fund complex. |
Based on the Board’s deliberations and their evaluation of the information described above, the Board, including a majority of Directors that are not “interested persons” as defined in the Investment Company Act of 1940, concluded that the compensation under the Agreement was fair and reasonable in light of the services and expenses and such other matters as the Directors considered to be relevant in the exercise of their reasonable judgment. Accordingly, the Board approved the renewal of the Agreement. In the course of their deliberations, the Directors did not identify any particular information that was all important or controlling.
Directors’ and Officers’ Information (unaudited)
The Statement of Additional Information provides additional information about the Fund’s directors and officers and can be obtained without charge by calling 1-800-466-3863, at www.manningnapieradvisors.com, or on the EDGAR Database on the SEC Internet web site (http:// www.sec.gov). The following chart shows certain information about the Fund’s officers and directors, including their principal occupations during the last five years. Unless specific dates are provided, the individuals have held the listed positions for longer than five years.
INTERESTED DIRECTOR/OFFICER
| | |
Name: | | B. Reuben Auspitz* |
Address: | | 290 Woodcliff Drive Fairport, NY 14450 |
Age: | | 63 |
Current Position(s) Held with Fund: | | Principal Executive Officer, President, Chairman & Director |
Term of Office1 & Length of Time Served: | | Indefinite - Director since 1984; Vice President 1984 - 2003; President since 2004; Principal Executive Officer since 2002 |
Principal Occupation(s) During Past 5 Years: | | Executive Vice President; Executive Group Member**; Chief Compliance Officer since 2004; Vice Chairman since June 2010; Co-Executive Director from 2003-2010 - Manning & Napier Advisors, Inc. President; Director - Manning & Napier Investor Services, Inc. Holds or has held one or more of the following titles for various subsidiaries and affiliates: President, Vice President, Director, Chairman, Treasurer, Chief Compliance Officer or Member. |
Number of Portfolios Overseen within Fund Complex: | | 29 |
Other Directorships Held Outside Fund Complex: | | N/A |
INDEPENDENT DIRECTORS | | |
| |
Name: | | Paul A. Brooke |
Address: | | 290 Woodcliff Drive Fairport, NY 14450 |
Age: | | 65 |
Current Position(s) Held with Fund: | | Director, Audit Committee Member, Governance & Nominating Committee Member |
Term of Office & Length of Time Served: | | Indefinite - Since 2007 |
Principal Occupation(s) During Past 5 Years: | | Chairman & CEO, Alsius Corp. (investments); Managing Member, PMSV Holdings LLC (investments) |
Number of Portfolios Overseen within Fund Complex: | | 29 |
Other Directorships Held Outside Fund Complex: | | Incyte Corp. (2000-present) ViroPharma, Inc. (2000-present) HLTH Corp. (2000-present) Cheyne Capital International (2000-present) MPM Bio-equities (2000-present) GMP Companies (2000-present) HoustonPharma (2000-present) |
Name: | | Richard M. Hurwitz |
Address: | | 290 Woodcliff Drive Fairport, NY 14450 |
Age: | | 47 |
Current Position(s) Held with Fund: | | Director, Audit Committee Member, Governance & Nominating Committee Member |
Term of Office & Length of Time Served: | | Indefinite - Since 2009 |
Principal Occupation(s) During Past 5 Years: | | Chief Executive Officer, Pictometry International Corp. since August 2010 (provider of georeferenced, aerial image libraries and related software) Managing Partner (2006-July 2010) - Aegis Investment Partners, LLC (investments); Founder and Managing Partner (2004-2005) - Village Markets, LLC (groceries) |
Number of Portfolios Overseen within Fund Complex: | | 29 |
Other Directorships Held Outside Fund Complex: | | Pictometry International Corp. (2000-2010) Pioneering Technologies (2006-2009) Vensearch Capital Corp. (2003-2007) |
Directors’ and Officers’ Information (unaudited)
INDEPENDENT DIRECTORS (continued)
| | |
| |
Name: | | Stephen B. Ashley |
Address: | | 290 Woodcliff Drive |
| | Fairport, NY 14450 |
Age: | | 70 |
Current Position(s) Held with Fund: | | Director, Audit Committee Member, Governance & Nominating Committee Member |
Term of Office & Length of Time Served: | | Indefinite - Since 1996 |
Principal Occupation(s) During Past 5 Years: | | Chairman, Director, President & Chief Executive Officer, The Ashley Group (property management and investment). Chairman (non-executive) 2004-2008; Director 1995-2008 - Fannie Mae (mortgage) |
Number of Portfolios Overseen within Fund Complex: | | 29 |
Other Directorships Held Outside Fund Complex: | | The Ashley Group (1995-2008) |
| | | Genesee Corporation (1987-2007) |
| | | |
Name: | | Peter L. Faber |
Address: | | 290 Woodcliff Drive |
| | Fairport, NY 14450 |
Age: | | 72 |
Current Position(s) Held with Fund: | | Director, Governance & Nominating Committee Member |
Term of Office & Length of Time Served: | | Indefinite - Since 1987 |
Principal Occupation(s) During Past 5 Years: | | Senior Counsel since 2006, Partner (1995 - 2006) - McDermott, Will & Emery LLP (law firm) |
Number of Portfolios Overseen within Fund Complex: | | 29 |
Other Directorships Held Outside Fund Complex: | | Partnership for New York City, Inc. (non-profit) |
| | New York Collegium (non-profit) |
| | | Boston Early Music Festival (non-profit) |
| | | |
Name: | | Harris H. Rusitzky |
Address: | | 290 Woodcliff Drive |
| | Fairport, NY 14450 |
Age: | | 76 |
Current Position(s) Held with Fund: | | Director, Audit Committee Member, Governance & Nominating Committee Member |
Term of Office & Length of Time Served: | | Indefinite - Since 1985 |
Principal Occupation(s) During Past 5 Years: | | President, The Greening Group (business consultants) since 1994; Partner, The Restaurant Group (restaurants) since 2006 |
Number of Portfolios Overseen within Fund Complex: | | 29 |
Other Directorships Held Outside Fund Complex: | | N/A |
| | | |
OFFICERS | | |
| |
Name: | | Jeffrey S. Coons, Ph.D., CFA |
Address: | | 290 Woodcliff Drive |
| | Fairport, NY 14450 |
Age: | | 47 |
Current Position(s) Held with Fund: | | Vice President |
Term of Office1 & Length of Time Served: | | Since 2004 |
Principal Occupation(s) During Past 5 Years: | | President since 2010, Co-Director of Research since 2002, Executive Group Member** since 2003, - Manning & Napier Advisors, Inc. Holds one or more of the following titles for various subsidiaries and |
| | affiliates: President, Director, Treasurer or Senior Trust Officer. |
Number of Portfolios Overseen within Fund Complex: | | 29 |
Other Directorships Held Outside Fund Complex: | | N/A |
Directors’ and Officers’ Information (unaudited)
OFFICERS (continued)
| | |
Name: | | Beth Galusha |
Address: | | 290 Woodcliff Drive |
| | Fairport, NY 14450 |
Age: | | 49 |
Current Position(s) Held with Fund: | | Assistant Chief Financial Officer |
Term of Office1 & Length of Time Served: | | Assistant Chief Financial Officer since 2010 |
Principal Occupation(s) During Past 5 Years: | | Chief Financial Officer and Treasurer, Manning & Napier Advisors, Inc. |
| | Holds one or more of the following titles for various affiliates: Chief Financial Officer, Director, or Treasurer |
Number of Portfolios Overseen within Fund Complex: | | 29 |
Other Directorships Held Outside Fund Complex: | | N/A |
Name: | | Christine Glavin |
Address: | | 290 Woodcliff Drive |
| | Fairport, NY 14450 |
Age: | | 44 |
Current Position(s) Held with Fund: | | Principal Financial Officer, Chief Financial Officer |
Term of Office1 & Length of Time Served: | | Principal Financial Officer since 2002; Chief Financial Officer since 2001 |
Principal Occupation(s) During Past 5 Years: | | Fund Reporting Manager, Manning & Napier Advisors, Inc. since 1997 |
Number of Portfolios Overseen within Fund Complex: | | 29 |
Other Directorships Held Outside Fund Complex: | | N/A |
Name: | | Jodi L. Hedberg |
Address: | | 290 Woodcliff Drive |
| | Fairport, NY 14450 |
Age: | | 43 |
Current Position(s) Held with Fund: | | Corporate Secretary, Chief Compliance Officer, Anti-Money Laundering Compliance Officer |
Term of Office1 & Length of Time Served: | | Corporate Secretary since 1997; Chief Compliance Officer since 2004 |
Principal Occupation(s) During Past 5 Years: | | Director of Compliance, Manning & Napier Advisors, Inc. and affiliates since 1990 (title change in 2005 from Compliance Manager to Director of Compliance); Corporate Secretary, Manning & Napier Investor Services, |
| | Inc. since 2006 |
Number of Portfolios Overseen within Fund Complex: | | 29 |
Other Directorships Held Outside Fund Complex: | | N/A |
Name: | | Richard Yates |
Address: | | 290 Woodcliff Drive |
| | Fairport, NY 14450 |
Age: | | 45 |
Current Position(s) Held with Fund: | | Chief Legal Officer |
Term of Office1 & Length of Time Served: | | Chief Legal Officer since 2004 |
Principal Occupation(s) During Past 5 Years: | | Counsel - Manning & Napier Advisors, Inc. & affiliates since 2000; Holds one or more of the following titles for various affiliates; Director or Corporate Secretary |
Number of Portfolios Overseen within Fund Complex: | | 29 |
Other Directorships Held Outside Fund Complex: | | N/A |
*Interested Director, within the meaning of the Investment Company Act of 1940 by reason of his position with the Fund’s investment advisor and distributor. Mr. Auspitz serves as the Executive Vice President and Director, Manning & Napier Advisors, Inc. and President and Director, Manning & Napier Investor Services, Inc., the Fund’s distributor.
**Prior to June 2010, the Executive Group, consisting of senior executive employee-owners, performed the duties of the Office of the Chief Executive of the Advisor. Effective June 2010, the Executive Group serves as an advisory board to the Chief Executive Officer.
1The term of office for President, Vice President, Chief Financial Officer, Assistant Chief Financial Officer, Chief Legal Officer and Corporate Secretary is one year and until their respective successors are chosen and qualified. All other officers’ terms are indefinite.
This page intentionally Left Blank
32
This page intentionally Left Blank
Literature Requests (unaudited)
Proxy Voting Policies and Procedures
A description of the policies and procedures that the Fund uses to determine how to vote proxies relating to portfolio securities is available, without charge, upon request:
| | |
By phone | | 1-800-466-3863 |
On the Securities and Exchange Commission’s (SEC) web site | | http://www.sec.gov |
Proxy Voting Record
Information regarding how the Fund voted proxies relating to portfolio securities during the most recent 12-month period ended June 30th is available, without charge, upon request:
| | |
By phone | | 1-800-466-3863 |
On the SEC’s web site | | http://www.sec.gov |
Quarterly Portfolio Holdings
The Series’ complete schedule of portfolio holdings for the 1st and 3rd quarters of each fiscal year are provided on Form N-Q, and are available, without charge, upon request:
| | |
By phone | | 1-800-466-3863 |
On the SEC’s web site | | http://www.sec.gov |
The Series’ Form N-Q may be reviewed and copied at the SEC’s Public Reference Room in Washington, D.C. Information on the operation of the Public Reference Room may be obtained by calling 1-800-SEC-0330.
Prospectus and Statement of Additional Information (SAI)
The prospectus and SAI provide additional information about each Series, including charges, expenses and risks. These documents are available, without charge, upon request:
| | |
By phone | | 1-800-466-3863 |
On the SEC’s web site | | http://www.sec.gov |
On the Advisor’s web site | | http://www.manning-napier.com |
Additional information available at www.manning-napier.com
1. Fund Holdings - Month-End
2. Fund Holdings - Quarter-End
3. Shareholder Report - Annual
4. Shareholder Report - Semi-Annual
MNCRBND-12/10-AR

Management Discussion and Analysis (unaudited)
Dear Shareholders:
As well-defined swings in sentiment drove market fluctuations in 2010, the fixed income markets had favorable results for the year. Returns were broadly positive throughout the first three quarters of the year, with higher gains during the stock market pullback in the second quarter. However, while equities finished the year with a strong rally, fixed income markets generally took a negative turn at the end of the year. After eight consecutive quarters of positive performance, broad fixed income markets suffered losses in the fourth quarter.
Overall, corporate bonds were the best performing sector during 2010, with below investment grade securities experiencing significant gains. Mortgage securities and U.S. Treasury securities also performed well, particularly intermediate and longer-term U.S. Treasuries. While municipal bonds posted positive results for the year, the sector had the weakest returns in 2010, as credit concerns and supply and demand changes caused noteworthy losses during the last quarter.
The Bank of America Merrill Lynch U.S. Corporate, Government and Mortgage Index earned a solid 6.43% during the year. With a return of 10.18%, the Core Plus Bond Series noticeably outpaced its benchmark.
Throughout 2010, the Core Plus Bond Series has maintained a heavy weighting to corporate bonds, including below investment grade corporate securities, because the Advisor believes the supply and demand dynamics within this sector remain attractive. As of the end of the year, the Series had 86.6% of its assets invested in corporate bonds and preferred stocks, and this significant allocation to corporate bonds was the primary driver of outperformance over the past year. Within that sector weighting, the Series had a 19.7% allocation to corporate bonds rated below investment grade, which is near the 20% limit for the Series.
As the markets unfold in 2011, it will be important to monitor trends such as monetary policy and inflation expectations. With this mindset, Manning & Napier remains committed to our active investment approach to fixed income. With our fundamentals-based investment strategies, we will continue to use tools such as sector, maturity, quality, and issue selections to take advantage of market opportunities and manage risk throughout the full bond market cycle. Staying focused on the fundamentals and maintaining our selective investment process helped us earn strong returns through the volatile markets of 2010, and we believe these qualities will remain important in the environment ahead.
As always, we appreciate your business.
Sincerely,
Manning & Napier Advisors, Inc.
Performance Update as of December 31, 2010 (unaudited)
| | | | | | |
| | | Average Annual Total Returns
As of December 31, 2010 |
| | | One Year | | Five Year | | Since Inception1 |
Manning & Napier Fund, Inc. - Core Plus Bond Series2 | | 10.18% | | 6.84% | | 6.17% |
Bank of America (BofA) Merrill Lynch U.S. Corporate, Government & Mortgage Index3 | | 6.43% | | 5.87% | | 5.50% |
The following graph compares the value of a $10,000 investment in the Manning & Napier Fund, Inc. - Core Plus Bond Series from its inception1 (4/21/05) to present (12/31/10) to the BofA Merrill Lynch U.S. Corporate, Government & Mortgage Index.
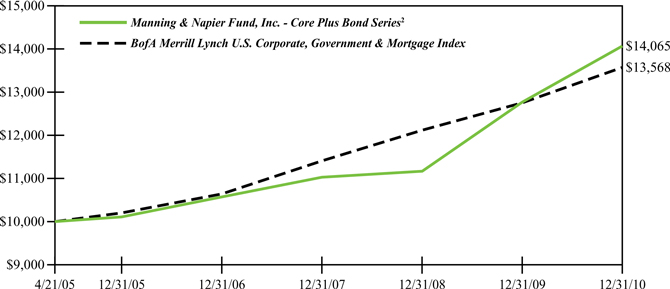
1Performance numbers for the Series and Index are calculated from April 21, 2005, the Series’ inception date.
2The Series’ performance does not reflect the deduction of taxes that a shareholder would pay on fund distributions or the redemption of shares. The Series’ performance is historical and may not be indicative of future results. The performance returns shown are inclusive of the net expense ratio of the Series. For the year ended December 31, 2010, this net expense ratio was 0.76%. The gross expense ratio, which does not account for any voluntary or contractual waivers currently in effect, was 0.76% for the year ended December 31, 2010.
3The unmanaged BofA Merrill Lynch U.S. Corporate, Government & Mortgage Index (formerly a Merrill Lynch Index) is a market value weighted measure that represents U.S. government, corporate, and pass-through securities issued by entities within the United States, by supranational entities, or by entities headquartered outside of the United States but who have issued dollar-denominated securities within the United States. The Index only includes investment-grade securities with maturities of greater than one year. The Index returns assume reinvestment of coupons and, unlike Series returns, do not reflect any fees or expenses.
Shareholder Expense Example (unaudited)
As a shareholder of the Series, you may incur two types of costs: (1) transaction costs and (2) ongoing costs, including management fees and other Series expenses. This example is intended to help you understand your ongoing costs (in dollars) of investing in the Series and to compare these costs with the ongoing costs of investing in other mutual funds.
The example is based on an investment of $1,000 invested at the beginning of the period and held for the entire period (July 1, 2010 to December 31, 2010).
Actual Expenses
The first line of the table below provides information about actual account values and actual expenses. You may use the information in this line, together with the amount you invested, to estimate the expenses that you paid over the period. Simply divide your account value by $1,000 (for example, an $8,600 account value divided by $1,000 = 8.6), then multiply the result by the number in the first line under the heading entitled “Expenses Paid During Period” to estimate the expenses you paid on your account during this period.
Hypothetical Example for Comparison Purposes
The second line of the table below provides information about hypothetical account values and hypothetical expenses based on the Series’ actual expense ratio and an assumed rate of return of 5% per year before expenses, which is not the Series’ actual return. The hypothetical account values and expenses may not be used to estimate the actual ending account balance or expenses you paid during the period. You may use this information to compare the ongoing costs of investing in the Series and other funds. To do so, compare this 5% hypothetical example with the 5% hypothetical examples that appear in the shareholder reports of the other funds.
Please note that the expenses shown in the table are meant to highlight your ongoing costs only and do not reflect any transaction costs. Therefore, the second line of the table is useful in comparing ongoing costs only, and will not help you determine the relative total costs of owning different funds. In addition, if these transaction costs were included, your costs would have been higher.
| | | | | | |
| | | Beginning Account Value 7/1/10 | | Ending Account Value 12/31/10 | | Expenses Paid During Period* 7/1/10-12/31/10 |
Actual | | $1,000.00 | | $1,042.20 | | $3.91 |
Hypothetical (5% return before expenses) | | $1,000.00 | | $1,021.37 | | $3.87 |
*Expenses are equal to the Series’ annualized expense ratio (for the six-month period) of 0.76%, multiplied by the average account value over the period, multiplied by 184/365 (to reflect the one-half year period). Expenses are based on the most recent fiscal half year; therefore, the expense ratio stated above may differ from the expense ratio stated in the financial highlights, which is based on one-year data. The Series’ total return would have been lower had certain expenses not been waived during the period.
Portfolio Composition as of December 31, 2010 (unaudited)
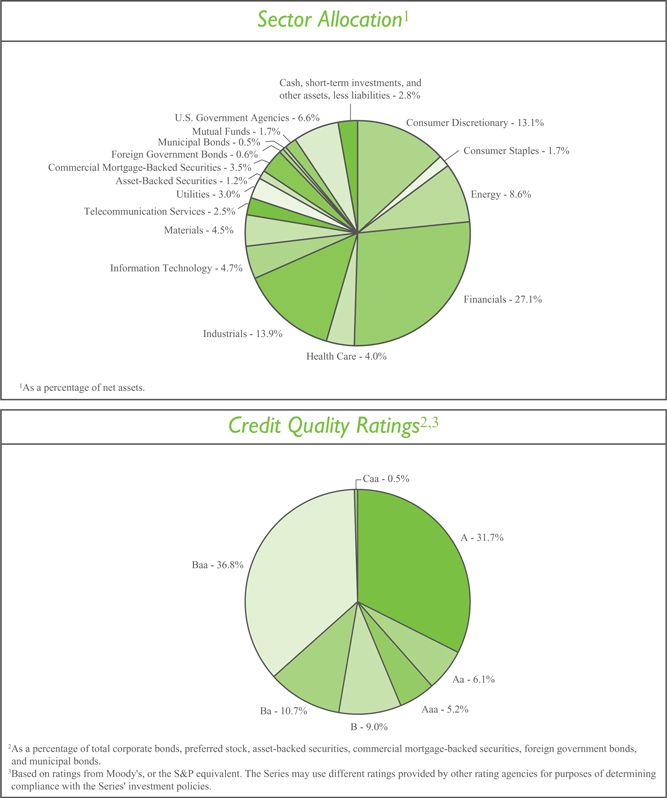
Investment Portfolio - December 31, 2010
| | | | | | | | | | | | |
| | | Credit Rating1 (unaudited) | | | Principal Amount | | | Value (Note 2) | |
| | | |
CORPORATE BONDS - 80.9% | | | | | | | | | | | | |
| | | |
Convertible Corporate Bonds - 1.2% | | | | | | | | | | | | |
Health Care - 0.7% | | | | | | | | | | | | |
Biotechnology - 0.6% | | | | | | | | | | | | |
Amgen, Inc., 0.375%, 2/1/2013 | | | A3 | | | $ | 3,270,000 | | | $ | 3,270,000 | |
| | | | | | | | | | | | |
Health Care Equipment & Supplies - 0.1% | | | | | | | | | | | | |
Medtronic, Inc., 1.625%, 4/15/2013 | | | A1 | | | | 665,000 | | | | 669,156 | |
| | | | | | | | | | | | |
Total Health Care | | | | | | | | | | | 3,939,156 | |
| | | | | | | | | | | | |
Information Technology - 0.5% | | | | | | | | | | | | |
Computers & Peripherals - 0.5% | | | | | | | | | | | | |
EMC Corp., 1.75%, 12/1/2013 | | | A | 2 | | | 1,685,000 | | | | 2,538,031 | |
| | | | | | | | | | | | |
Total Convertible Corporate Bonds | | | | | | | | | | | | |
(Identified Cost $5,940,689) | | | | | | | | | | | 6,477,187 | |
| | | | | | | | | | | | |
Non-Convertible Corporate Bonds - 79.7% | | | | | | | | | | | | |
Consumer Discretionary - 13.1% | | | | | | | | | | | | |
Hotels, Restaurants & Leisure - 1.8% | | | | | | | | | | | | |
Cedar Fair LP - Canada’s Wonderland Co. - Magnum Management Corp.3, 9.125%, 8/1/2018 | | | B2 | | | | 1,000,000 | | | | 1,076,250 | |
International Game Technology, 7.50%, 6/15/2019 | | | Baa2 | | | | 5,505,000 | | | | 6,196,769 | |
Wendy’s - Arby’s Restaurants LLC, 10.00%, 7/15/2016 | | | B3 | | | | 1,000,000 | | | | 1,085,000 | |
Wyndham Worldwide Corp., 9.875%, 5/1/2014 | | | Ba1 | | | | 405,000 | | | | 474,252 | |
Wyndham Worldwide Corp., 6.00%, 12/1/2016 | | | Ba1 | | | | 800,000 | | | | 837,148 | |
| | | | | | | | | | | | |
| | | | | | | | | | | 9,669,419 | |
| | | | | | | | | | | | |
Household Durables - 1.8% | | | | | | | | | | | | |
Fortune Brands, Inc., 5.375%, 1/15/2016 | | | Baa3 | | | | 4,485,000 | | | | 4,638,140 | |
Newell Rubbermaid, Inc., 4.70%, 8/15/2020 | | | Baa3 | | | | 5,000,000 | | | | 4,959,745 | |
| | | | | | | | | | | | |
| | | | | | | | | | | 9,597,885 | |
| | | | | | | | | | | | |
Media - 5.9% | | | | | | | | | | | | |
Cablevision Systems Corp., 8.625%, 9/15/2017 | | | B1 | | | | 1,965,000 | | | | 2,139,394 | |
Columbus International, Inc. (Barbados)3, 11.50%, 11/20/2014 | | | B2 | | | | 900,000 | | | | 999,000 | |
Comcast Corp., 6.50%, 11/15/2035 | | | Baa1 | | | | 4,540,000 | | | | 4,879,456 | |
Comcast Corp., 6.95%, 8/15/2037 | | | Baa1 | | | | 1,855,000 | | | | 2,098,131 | |
DIRECTV Holdings LLC, 5.20%, 3/15/2020 | | | Baa2 | | | | 4,710,000 | | | | 4,882,777 | |
Discovery Communications LLC, 5.05%, 6/1/2020 | | | Baa2 | | | | 4,875,000 | | | | 5,155,137 | |
MDC Partners, Inc. (Canada), 11.00%, 11/1/2016 | | | B2 | | | | 500,000 | | | | 551,250 | |
Sirius XM Radio, Inc.3, 9.75%, 9/1/2015 | | | Ba3 | | | | 1,405,000 | | | | 1,577,113 | |
Time Warner, Inc., 7.625%, 4/15/2031 | | | Baa2 | | | | 4,105,000 | | | | 4,990,379 | |
Unitymedia Hessen GmbH & Co. KG - Unitymedia NRW GmbH (Germany)3, 8.125%, 12/1/2017 | | | B1 | | | EUR | 600,000 | | | | 848,890 | |
UPC Holding B.V. (Netherlands)3, 9.875%, 4/15/2018 | | | B2 | | | $ | 1,405,000 | | | | 1,538,475 | |
Virgin Media Finance plc, Series 1 (United Kingdom), 9.50%, 8/15/2016 | | | Ba3 | | | | 1,000,000 | | | | 1,130,000 | |
| | |
| The accompanying notes are an integral part of the financial statements. | | 5 |
Investment Portfolio - December 31, 2010
| | | | | | | | | | | | |
| | | Credit Rating1 (unaudited) | | | Principal Amount | | | Value (Note 2) | |
| | | |
CORPORATE BONDS (continued) | | | | | | | | | | | | |
| | | |
Non-Convertible Corporate Bonds (continued) | | | | | | | | | | | | |
Consumer Discretionary (continued) | | | | | | | | | | | | |
Media (continued) | | | | | | | | | | | | |
WMG Acquisition Corp., 9.50%, 6/15/2016 | | | Ba2 | | | $ | 1,000,000 | | | $ | 1,072,500 | |
| | | | | | | | | | | | |
| | | | | | | | | | | 31,862,502 | |
| | | | | | | | | | | | |
Multiline Retail - 0.7% | | | | | | | | | | | | |
Target Corp., 6.00%, 1/15/2018 | | | A2 | | | | 3,225,000 | | | | 3,733,666 | |
| | | | | | | | | | | | |
Specialty Retail - 2.3% | | | | | | | | | | | | |
AutoZone, Inc., 4.00%, 11/15/2020 | | | Baa2 | | | | 1,650,000 | | | | 1,558,379 | |
The Home Depot, Inc., 5.40%, 3/1/2016 | | | Baa1 | | | | 4,325,000 | | | | 4,846,617 | |
Lowe’s Companies, Inc., 6.10%, 9/15/2017 | | | A1 | | | | 3,175,000 | | | | 3,672,164 | |
Rent-A-Center, Inc.3, 6.625%, 11/15/2020 | | | Ba3 | | | | 1,100,000 | | | | 1,094,500 | |
Toys R Us Property Co., LLC, 8.50%, 12/1/2017 | | | Ba1 | | | | 920,000 | | | | 989,000 | |
| | | | | | | | | | | | |
| | | | | | | | | | | 12,160,660 | |
| | | | | | | | | | | | |
Textiles, Apparel & Luxury Goods - 0.6% | | | | | | | | | | | | |
VF Corp., 5.95%, 11/1/2017 | | | A3 | | | | 2,815,000 | | | | 3,140,034 | |
| | | | | | | | | | | | |
Total Consumer Discretionary | | | | | | | | | | | 70,164,166 | |
| | | | | | | | | | | | |
Consumer Staples - 1.7% | | | | | | | | | | | | |
Beverages - 0.7% | | | | | | | | | | | | |
CEDC Finance Corp. International, Inc.3, 9.125%, 12/1/2016 | | | B1 | | | | 1,215,000 | | | | 1,290,937 | |
Constellation Brands, Inc., 8.375%, 12/15/2014 | | | Ba3 | | | | 1,205,000 | | | | 1,316,463 | |
PepsiCo, Inc., 7.90%, 11/1/2018 | | | Aa3 | | | | 713,000 | | | | 917,355 | |
| | | | | | | | | | | | |
| | | | | | | | | | | 3,524,755 | |
| | | | | | | | | | | | |
Food Products - 0.8% | | | | | | | | | | | | |
Kraft Foods, Inc., 6.125%, 2/1/2018 | | | Baa2 | | | | 3,610,000 | | | | 4,123,685 | |
| | | | | | | | | | | | |
Household Products - 0.0%* | | | | | | | | | | | | |
The Procter & Gamble Co., 4.85%, 12/15/2015 | | | Aa3 | | | | 25,000 | | | | 27,880 | |
| | | | | | | | | | | | |
Personal Products - 0.2% | | | | | | | | | | | | |
Revlon Consumer Products Corp., 9.75%, 11/15/2015 | | | B3 | | | | 1,215,000 | | | | 1,284,863 | |
| | | | | | | | | | | | |
Total Consumer Staples | | | | | | | | | | | 8,961,183 | |
| | | | | | | | | | | | |
Energy - 8.6% | | | | | | | | | | | | |
Energy Equipment & Services - 3.5% | | | | | | | | | | | | |
Baker Hughes, Inc., 7.50%, 11/15/2018 | | | A2 | | | | 3,155,000 | | | | 3,956,200 | |
Calfrac Holdings LP3, 7.50%, 12/1/2020 | | | B2 | | | | 1,000,000 | | | | 1,012,500 | |
Cie Generale de Geophysique - Veritas (France), 7.75%, 5/15/2017 | | | Ba3 | | | | 1,000,000 | | | | 1,025,000 | |
Complete Production Services, Inc., 8.00%, 12/15/2016 | | | B1 | | | | 1,155,000 | | | | 1,195,425 | |
Hornbeck Offshore Services, Inc., 8.00%, 9/1/2017 | | | Ba3 | | | | 500,000 | | | | 510,000 | |
Key Energy Services, Inc., 8.375%, 12/1/2014 | | | B1 | | | | 1,000,000 | | | | 1,055,000 | |
Thermon Industries, Inc.3, 9.50%, 5/1/2017 | | | B1 | | | | 830,000 | | | | 883,950 | |
Trinidad Drilling Ltd. (Canada)3, 7.875%, 1/15/2019 | | | B2 | | | | 1,000,000 | | | | 1,010,000 | |
| | |
| 6 | | The accompanying notes are an integral part of the financial statements. |
Investment Portfolio - December 31, 2010
| | | | | | | | | | | | |
| | | Credit Rating1 (unaudited) | | | Principal Amount | | | Value (Note 2) | |
| | | |
CORPORATE BONDS (continued) | | | | | | | | | | | | |
| | | |
Non-Convertible Corporate Bonds (continued) | | | | | | | | | | | | |
Energy (continued) | | | | | | | | | | | | |
Energy Equipment & Services (continued) | | | | | | | | | | | | |
Weatherford International Ltd. (Switzerland), 9.625%, 3/1/2019 | | | Baa2 | | | $ | 6,175,000 | | | $ | 7,923,680 | |
| | | | | | | | | | | | |
| | | | | | | | | | | 18,571,755 | |
| | | | | | | | | | | | |
Oil, Gas & Consumable Fuels - 5.1% | | | | | | | | | | | | |
Anadarko Petroleum Corp., 5.95%, 9/15/2016 | | | Ba1 | | | | 5,825,000 | | | | 6,257,733 | |
Apache Corp., 6.90%, 9/15/2018 | | | A3 | | | | 2,275,000 | | | | 2,777,739 | |
Aquilex Holdings LLC - Aquilex Finance Corp., 11.125%, 12/15/2016 | | | Caa1 | | | | 740,000 | | | | 749,250 | |
Arch Western Finance LLC, 6.75%, 7/1/2013 | | | B1 | | | | 694,000 | | | | 700,940 | |
Chaparral Energy, Inc., 8.875%, 2/1/2017 | | | Caa1 | | | | 1,055,000 | | | | 1,070,825 | |
Chesapeake Energy Corp., 9.50%, 2/15/2015 | | | Ba3 | | | | 1,500,000 | | | | 1,691,250 | |
Coffeyville Resources LLC - Coffeyville Finance, Inc.3, 9.00%, 4/1/2015 | | | Ba3 | | | | 373,000 | | | | 399,110 | |
Coffeyville Resources LLC - Coffeyville Finance, Inc.3, 10.875%, 4/1/2017 | | | B3 | | | | 395,000 | | | | 424,625 | |
Crosstex Energy LP - Crosstex Energy Finance Corp., 8.875%, 2/15/2018 | | | B3 | | | | 1,500,000 | | | | 1,606,875 | |
Hess Corp., 5.60%, 2/15/2041 | | | Baa2 | | | | 5,125,000 | | | | 5,087,757 | |
Linn Energy LLC - Linn Energy Finance Corp.3, 7.75%, 2/1/2021. | | | B2 | | | | 1,045,000 | | | | 1,071,125 | |
Martin Midstream Partners LP - Martin Midstream Finance Corp., 8.875%, 4/1/2018 | | | B | 2 | | | 840,000 | | | | 865,200 | |
Niska Gas Storage US LLC - Niska Gas Storage Canada ULC3, 8.875%, 3/15/2018 | | | B1 | | | | 605,000 | | | | 647,350 | |
Plains Exploration & Production Co., 8.625%, 10/15/2019 | | | B1 | | | | 1,000,000 | | | | 1,095,000 | |
Targa Resources Partners LP - Targa Resources Partners Finance Corp., 8.25%, 7/1/2016 | | | B1 | | | | 750,000 | | | | 791,250 | |
Tesoro Corp., 9.75%, 6/1/2019 | | | Ba1 | | | | 1,180,000 | | | | 1,306,850 | |
Whiting Petroleum Corp., 7.00%, 2/1/2014 | | | Ba3 | | | | 1,000,000 | | | | 1,050,000 | |
| | | | | | | | | | | | |
| | | | | | | | | | | 27,592,879 | |
| | | | | | | | | | | | |
Total Energy | | | | | | | | | | | 46,164,634 | |
| | | | | | | | | | | | |
Financials - 24.9% | | | | | | | | | | | | |
Capital Markets - 4.7% | | | | | | | | | | | | |
Goldman Sachs Capital I, 6.345%, 2/15/2034 | | | A3 | | | | 3,450,000 | | | | 3,287,333 | |
Goldman Sachs Capital II4, 5.793%, 12/29/2049 | | | Baa2 | | | | 4,205,000 | | | | 3,563,737 | |
The Goldman Sachs Group, Inc., 6.15%, 4/1/2018 | | | A1 | | | | 3,385,000 | | | | 3,727,538 | |
The Goldman Sachs Group, Inc., 5.375%, 3/15/2020 | | | A1 | | | | 4,510,000 | | | | 4,660,458 | |
Merrill Lynch & Co., Inc., 6.11%, 1/29/2037 | | | A3 | | | | 1,785,000 | | | | 1,611,277 | |
Morgan Stanley, 5.55%, 4/27/2017 | | | A2 | | | | 3,544,000 | | | | 3,692,139 | |
Morgan Stanley, 5.50%, 1/26/2020 | | | A2 | | | | 4,485,000 | | | | 4,520,992 | |
| | | | | | | | | | | | |
| | | | | | | | | | | 25,063,474 | |
| | | | | | | | | | | | |
| | |
| The accompanying notes are an integral part of the financial statements. | | 7 |
Investment Portfolio - December 31, 2010
| | | | | | | | | | | | |
| | | Credit Rating1 (unaudited) | | | Principal Amount | | | Value (Note 2) | |
| | | |
CORPORATE BONDS (continued) | | | | | | | | | | | | |
| | | |
Non-Convertible Corporate Bonds (continued) | | | | | | | | | | | | |
Financials (continued) | | | | | | | | | | | | |
Commercial Banks - 6.1% | | | | | | | | | | | | |
Household Finance Co., 6.375%, 11/27/2012 | | | A3 | | | $ | 4,335,000 | | | $ | 4,699,855 | |
KeyBank National Association, 5.45%, 3/3/2016 | | | Baa1 | | | | 4,640,000 | | | | 4,882,909 | |
Manufacturers & Traders Trust Co., 6.625%, 12/4/2017 | | | A3 | | | | 5,665,000 | | | | 6,359,807 | |
National City Corp., 6.875%, 5/15/2019 | | | Baa1 | | | | 1,920,000 | | | | 2,155,693 | |
PNC Bank National Association, 5.25%, 1/15/2017 | | | A3 | | | | 5,640,000 | | | | 5,855,110 | |
U.S. Bank National Association, 6.375%, 8/1/2011 | | | Aa3 | | | | 85,000 | | | | 87,826 | |
USB Capital XIII Trust, 6.625%, 12/15/2039 | | | A2 | | | | 3,580,000 | | | | 3,656,719 | |
Wachovia Corp., 5.25%, 8/1/2014 | | | A2 | | | | 4,500,000 | | | | 4,799,223 | |
| | | | | | | | | | | | |
| | | | | | | | | | | 32,497,142 | |
| | | | | | | | | | | | |
| | | |
Consumer Finance - 1.8% | | | | | | | | | | | | |
American Express Co., 8.125%, 5/20/2019 | | | A3 | | | | 3,935,000 | | | | 4,895,970 | |
American Express Co.4, 6.80%, 9/1/2066 | | | Baa2 | | | | 3,445,000 | | | | 3,410,550 | |
Credit Acceptance Corp.3, 9.125%, 2/1/2017 | | | B1 | | | | 1,500,000 | | | | 1,575,000 | |
| | | | | | | | | | | | |
| | | | | | | | | | | 9,881,520 | |
| | | | | | | | | | | | |
| | | |
Diversified Financial Services - 3.3% | | | | | | | | | | | | |
Bank of America Corp., 5.75%, 8/15/2016 | | | A3 | | | | 3,715,000 | | | | 3,794,642 | |
Bank of America Corp., 7.625%, 6/1/2019 | | | A2 | | | | 3,315,000 | | | | 3,817,007 | |
Citigroup, Inc., 8.50%, 5/22/2019 | | | A3 | | | | 4,110,000 | | | | 5,102,298 | |
JPMorgan Chase & Co., 6.30%, 4/23/2019 | | | Aa3 | | | | 4,300,000 | | | | 4,894,497 | |
| | | | | | | | | | | | |
| | | | | | | | | | | 17,608,444 | |
| | | | | | | | | | | | |
| | | |
Insurance - 1.6% | | | | | | | | | | | | |
American International Group, Inc., 4.25%, 5/15/2013 | | | A3 | | | | 1,840,000 | | | | 1,904,120 | |
Fidelity National Financial, Inc., 6.60%, 5/15/2017 | | | Baa3 | | | | 5,035,000 | | | | 5,023,681 | |
Hartford Financial Services Group, Inc.4, 8.125%, 6/15/2038 | | | Ba1 | | | | 1,615,000 | | | | 1,715,937 | |
| | | | | | | | | | | | |
| | | | | | | | | | | 8,643,738 | |
| | | | | | | | | | | | |
| | | |
Real Estate Investment Trusts (REITS) - 7.4% | | | | | | | | | | | | |
AvalonBay Communities, Inc., 6.10%, 3/15/2020 | | | Baa1 | | | | 4,380,000 | | | | 4,898,167 | |
Boston Properties LP, 5.875%, 10/15/2019 | | | Baa2 | | | | 4,455,000 | | | | 4,831,216 | |
Camden Property Trust, 5.70%, 5/15/2017 | | | Baa1 | | | | 4,025,000 | | | | 4,247,474 | |
Digital Realty Trust LP, 5.875%, 2/1/2020 | | | Baa2 | | | | 1,000,000 | | | | 1,017,353 | |
DuPont Fabros Technology LP, 8.50%, 12/15/2017 | | | Ba2 | | | | 1,475,000 | | | | 1,578,250 | |
Felcor Lodging LP, 10.00%, 10/1/2014 | | | B2 | | | | 1,000,000 | | | | 1,120,000 | |
HCP, Inc., 6.70%, 1/30/2018 | | | Baa3 | | | | 4,500,000 | | | | 4,827,947 | |
Health Care REIT, Inc., 6.20%, 6/1/2016 | | | Baa2 | | | | 4,390,000 | | | | 4,857,557 | |
Host Hotels & Resorts LP, 6.375%, 3/15/2015 | | | Ba1 | | | | 740,000 | | | | 751,100 | |
Mack-Cali Realty LP, 7.75%, 8/15/2019 | | | Baa2 | | | | 2,665,000 | | | | 3,101,407 | |
National Retail Properties, Inc., 6.875%, 10/15/2017 | | | Baa2 | | | | 2,365,000 | | | | 2,547,961 | |
Omega Healthcare Investors, Inc., 7.50%, 2/15/2020 | | | Ba2 | | | | 1,000,000 | | | | 1,051,250 | |
| | |
| 8 | | The accompanying notes are an integral part of the financial statements. |
Investment Portfolio - December 31, 2010
| | | | | | | | | | | | |
| | | Credit Rating1 (unaudited) | | | Principal Amount | | | Value (Note 2) | |
| | | |
CORPORATE BONDS (continued) | | | | | | | | | | | | |
| | | |
Non-Convertible Corporate Bonds (continued) | | | | | | | | | | | | |
Financials (continued) | | | | | | | | | | | | |
Real Estate Investment Trusts (REITS) (continued) | | | | | | | | | | | | |
Simon Property Group LP, 10.35%, 4/1/2019 | | | A3 | | | $ | 3,670,000 | | | $ | 5,017,620 | |
| | | | | | | | | | | | |
| | | | | | | | | | | 39,847,302 | |
| | | | | | | | | | | | |
Total Financials | | | | | | | | | | | 133,541,620 | |
| | | | | | | | | | | | |
Health Care - 3.3% | | | | | | | | | | | | |
Biotechnology - 0.9% | | | | | | | | | | | | |
Amgen, Inc., 3.45%, 10/1/2020 | | | A3 | | | | 5,000,000 | | | | 4,764,190 | |
| | | | | | | | | | | | |
Health Care Equipment & Supplies - 1.5% | | | | | | | | | | | | |
Alere, Inc., 9.00%, 5/15/2016 | | | B3 | | | | 2,000,000 | | | | 2,060,000 | |
Becton Dickinson and Co., 6.00%, 5/15/2039 | | | A2 | | | | 3,350,000 | | | | 3,782,787 | |
CR Bard, Inc., 4.40%, 1/15/2021 | | | A3 | | | | 800,000 | | | | 812,855 | |
Fresenius US Finance II, Inc.3, 9.00%, 7/15/2015 | | | Ba1 | | | | 1,320,000 | | | | 1,511,400 | |
| | | | | | | | | | | | |
| | | | | | | | | | | 8,167,042 | |
| | | | | | | | | | | | |
Health Care Providers & Services - 0.7% | | | | | | | | | | | | |
BioScrip, Inc., 10.25%, 10/1/2015 | | | B3 | | | | 795,000 | | | | 818,850 | |
HCA, Inc., 8.50%, 4/15/2019 | | | Ba3 | | | | 1,000,000 | | | | 1,095,000 | |
Health Management Associates, Inc., 6.125%, 4/15/2016 | | | BB | 2 | | | 1,050,000 | | | | 1,060,500 | |
LifePoint Hospitals, Inc.3, 6.625%, 10/1/2020 | | | Ba1 | | | | 1,000,000 | | | | 992,500 | |
| | | | | | | | | | | | |
| | | | | | | | | | | 3,966,850 | |
| | | | | | | | | | | | |
| | | |
Life Sciences Tools & Services - 0.2% | | | | | | | | | | | | |
PharmaNet Development Group, Inc.3, 10.875%, 4/15/2017 | | | B3 | | | | 825,000 | | | | 858,000 | |
| | | | | | | | | | | | |
Total Health Care | | | | | | | | | | | 17,756,082 | |
| | | | | | | | | | | | |
Industrials - 13.9% | | | | | | | | | | | | |
Aerospace & Defense - 1.1% | | | | | | | | | | | | |
BE Aerospace, Inc., 6.875%, 10/1/2020 | | | Ba3 | | | | 1,000,000 | | | | 1,032,500 | |
The Boeing Co., 6.00%, 3/15/2019 | | | A2 | | | | 3,465,000 | | | | 3,986,548 | |
Kratos Defense & Security Solutions, Inc., 10.00%, 6/1/2017 | | | B3 | | | | 525,000 | | | | 581,437 | |
| | | | | | | | | | | | |
| | | | | | | | | | | 5,600,485 | |
| | | | | | | | | | | | |
Air Freight & Logistics - 0.1% | | | | | | | | | | | | |
FedEx Corp., 8.00%, 1/15/2019 | | | Baa2 | | | | 435,000 | | | | 536,597 | |
| | | | | | | | | | | | |
Airlines - 1.7% | | | | | | | | | | | | |
Continental Airlines Pass-Through Trust, Series 1997-4, Class A, 6.90%, 1/2/2018 | | | Baa2 | | | | 351,290 | | | | 373,246 | |
Continental Airlines, Inc.3, 6.75%, 9/15/2015 | | | Ba2 | | | | 1,000,000 | | | | 1,030,000 | |
Delta Air Lines Pass-Through Trust, Series 2001-1, Class 1A2, 7.111%, 9/18/2011 | | | BBB | 2 | | | 1,245,000 | | | | 1,285,463 | |
Delta Air Lines Pass-Through Trust, Series 2007-1, Class A, 6.821%, 8/10/2022 | | | Baa1 | | | | 1,218,838 | | | | 1,291,968 | |
| | |
| The accompanying notes are an integral part of the financial statements. | | 9 |
Investment Portfolio - December 31, 2010
| | | | | | | | | | | | |
| | | Credit Rating1 (unaudited) | | | Principal Amount | | | Value (Note 2) | |
| | | |
CORPORATE BONDS (continued) | | | | | | | | | | | | |
| | | |
Non-Convertible Corporate Bonds (continued) | | | | | | | | | | | | |
Industrials (continued) | | | | | | | | | | | | |
Airlines (continued) | | | | | | | | | | | | |
Delta Air Lines, Inc.3, 9.50%, 9/15/2014 | | | Ba2 | | | $ | 898,000 | | | $ | 977,697 | |
Southwest Airlines Co., 5.25%, 10/1/2014 | | | Baa3 | | | | 3,925,000 | | | | 4,128,068 | |
| | | | | | | | | | | | |
| | | | | | | | | | | 9,086,442 | |
| | | | | | | | | | | | |
| | | |
Building Products - 0.4% | | | | | | | | | | | | |
Building Materials Corp. of America3, 6.875%, 8/15/2018 | | | B1 | | | | 630,000 | | | | 623,700 | |
Building Materials Corp. of America3, 7.50%, 3/15/2020 | | | B1 | | | | 400,000 | | | | 407,000 | |
Owens Corning, 9.00%, 6/15/2019 | | | Ba1 | | | | 1,095,000 | | | | 1,284,647 | |
| | | | | | | | | | | | |
| | | | | | | | | | | 2,315,347 | |
| | | | | | | | | | | | |
| | | |
Commercial Services & Supplies - 1.2% | | | | | | | | | | | | |
Clean Harbors, Inc., 7.625%, 8/15/2016 | | | Ba2 | | | | 900,000 | | | | 956,250 | |
Garda World Security Corp. (Canada)3, 9.75%, 3/15/2017 | | | B3 | | | | 800,000 | | | | 858,000 | |
Waste Management, Inc., 7.375%, 3/11/2019 | | | Baa3 | | | | 3,930,000 | | | | 4,755,697 | |
| | | | | | | | | | | | |
| | | | | | | | | | | 6,569,947 | |
| | | | | | | | | | | | |
| | | |
Industrial Conglomerates - 3.9% | | | | | | | | | | | | |
GE Capital Trust I4, 6.375%, 11/15/2067 | | | Aa3 | | | | 3,545,000 | | | | 3,500,687 | |
General Electric Capital Corp., 5.625%, 5/1/2018 | | | Aa2 | | | | 2,150,000 | | | | 2,344,605 | |
General Electric Capital Corp., 5.50%, 1/8/2020 | | | Aa2 | | | | 3,105,000 | | | | 3,320,757 | |
General Electric Capital Corp., Series A, 6.75%, 3/15/2032 | | | Aa2 | | | | 3,695,000 | | | | 4,183,176 | |
General Electric Co., 5.25%, 12/6/2017 | | | Aa2 | | | | 2,100,000 | | | | 2,268,197 | |
Textron, Inc., 7.25%, 10/1/2019 | | | Baa3 | | | | 3,790,000 | | | | 4,343,154 | |
Tyco Electronics Group S.A. (Luxembourg), 4.875%, 1/15/2021 | | | Baa2 | | | | 800,000 | | | | 808,975 | |
| | | | | | | | | | | | |
| | | | | | | | | | | 20,769,551 | |
| | | | | | | | | | | | |
| | | |
Machinery - 1.8% | | | | | | | | | | | | |
Caterpillar Financial Services Corp., 7.05%, 10/1/2018 | | | A2 | | | | 3,385,000 | | | | 4,094,608 | |
John Deere Capital Corp., 5.50%, 4/13/2017 | | | A2 | | | | 1,240,000 | | | | 1,382,526 | |
John Deere Capital Corp., 5.75%, 9/10/2018 | | | A2 | | | | 3,795,000 | | | | 4,299,246 | |
| | | | | | | | | | | | |
| | | | | | | | | | | 9,776,380 | |
| | | | | | | | | | | | |
| | | |
Marine - 0.5% | | | | | | | | | | | | |
Navios Maritime Holdings, Inc. - Navios Maritime Finance US, Inc. (Marshall Island), 8.875%, 11/1/2017 | | | Ba3 | | | | 1,530,000 | | | | 1,656,225 | |
United Maritime Group LLC - United Maritime Group Finance Corp., 11.75%, 6/15/2015 | | | B3 | | | | 740,000 | | | | 741,850 | |
| | | | | | | | | | | | |
| | | | | | | | | | | 2,398,075 | |
| | | | | | | | | | | | |
Road & Rail - 3.2% | | | | | | | | | | | | |
CSX Corp., 6.00%, 10/1/2036 | | | Baa3 | | | | 4,530,000 | | | | 4,718,081 | |
JB Hunt Transport Services, Inc., 3.375%, 9/15/2015 | | | Baa3 | | | | 7,865,000 | | | | 7,768,913 | |
RailAmerica, Inc., 9.25%, 7/1/2017 | | | B1 | | | | 710,000 | | | | 780,113 | |
| | |
| 10 | | The accompanying notes are an integral part of the financial statements. |
Investment Portfolio - December 31, 2010
| | | | | | | | | | | | |
| | | Credit Rating1 (unaudited) | | | Principal Amount | | | Value (Note 2) | |
| | | |
CORPORATE BONDS (continued) | | | | | | | | | | | | |
| | | |
Non-Convertible Corporate Bonds (continued) | | | | | | | | | | | | |
Industrials (continued) | | | | | | | | | | | | |
Road & Rail (continued) | | | | | | | | | | | | |
Union Pacific Corp., 5.65%, 5/1/2017 | | | Baa2 | | | $ | 3,675,000 | | | $ | 4,057,946 | |
| | | | | | | | | | | | |
| | | | | | | | | | | 17,325,053 | |
| | | | | | | | | | | | |
Total Industrials | | | | | | | | | | | 74,377,877 | |
| | | | | | | | | | | | |
Information Technology - 4.2% | | | | | | | | | | | | |
Communications Equipment - 1.2% | | | | | | | | | | | | |
Alcatel-Lucent USA, Inc., 6.50%, 1/15/2028 | | | B1 | | | | 1,000,000 | | | | 795,000 | |
Cisco Systems, Inc., 5.90%, 2/15/2039 | | | A1 | | | | 3,705,000 | | | | 4,103,306 | |
Hughes Network Systems LLC - HNS Finance Corp., 9.50%, 4/15/2014 | | | B1 | | | | 1,280,000 | | | | 1,320,000 | |
| | | | | | | | | | | | |
| | | | | | | | | | | 6,218,306 | |
| | | | | | | | | | | | |
Computers & Peripherals - 0.9% | | | | | | | | | | | | |
International Business Machines Corp., 5.60%, 11/30/2039 | | | Aa3 | | | | 4,506,000 | | | | 4,909,418 | |
| | | | | | | | | | | | |
Electronic Equipment, Instruments & Components - 0.5% | | | | | | | | | | | | |
Corning, Inc., 4.25%, 8/15/2020 | | | Baa1 | | | | 2,500,000 | | | | 2,468,840 | |
| �� | | | | | | | | | | | |
IT Services - 0.9% | | | | | | | | | | | | |
The Western Union Co., 5.253%, 4/1/2020 | | | A3 | | | | 4,810,000 | | | | 4,941,746 | |
| | | | | | | | | | | | |
Semiconductors & Semiconductor Equipment - 0.5% | | | | | | | | | | | | |
Advanced Micro Devices, Inc., 8.125%, 12/15/2017 | | | Ba3 | | | | 1,475,000 | | | | 1,563,500 | |
MagnaChip Semiconductor S.A. - MagnaChip Semiconductor Finance Co., 10.50%, 4/15/2018 | | | B2 | | | | 830,000 | | | | 875,650 | |
| | | | | | | | | | | | |
| | | | | | | | | | | 2,439,150 | |
| | | | | | | | | | | | |
Software - 0.2% | | | | | | | | | | | | |
Oracle Corp.3, 3.875%, 7/15/2020 | | | A2 | | | | 1,325,000 | | | | 1,317,164 | |
| | | | | | | | | | | | |
Total Information Technology | | | | | | | | | | | 22,294,624 | |
| | | | | | | | | | | | |
Materials - 4.5% | | | | | | | | | | | | |
Chemicals - 1.1% | | | | | | | | | | | | |
E.I. du Pont de Nemours & Co., 6.00%, 7/15/2018 | | | A2 | | | | 3,435,000 | | | | 3,949,546 | |
Ferro Corp., 7.875%, 8/15/2018 | | | B2 | | | | 1,030,000 | | | | 1,086,650 | |
Rhodia S.A. (France)3, 6.875%, 9/15/2020 | | | B1 | | | | 1,000,000 | | | | 1,013,750 | |
| | | | | | | | | | | | |
| | | | | | | | | | | 6,049,946 | |
| | | | | | | | | | | | |
Containers & Packaging - 0.1% | | | | | | | | | | | | |
Reynolds Group Issuer, Inc. - Reynolds Group Issuer LLC3, 9.00%, 4/15/2019 | | | Caa1 | | | | 500,000 | | | | 518,125 | |
| | | | | | | | | | | | |
Metals & Mining - 1.9% | | | | | | | | | | | | |
Alcoa, Inc., 5.87%, 2/23/2022 | | | Baa3 | | | | 2,185,000 | | | | 2,170,736 | |
BHP Billiton Finance (USA) Ltd. (Australia), 6.50%, 4/1/2019 | | | A1 | | | | 3,230,000 | | | | 3,840,935 | |
Cliffs Natural Resources, Inc., 5.90%, 3/15/2020 | | | Baa3 | | | | 1,000,000 | | | | 1,053,535 | |
| | |
| The accompanying notes are an integral part of the financial statements. | | 11 |
Investment Portfolio - December 31, 2010
| | | | | | | | | | | | |
| | | Credit
Rating 1
(unaudited) | | | Principal
Amount | | | Value (Note 2) | |
| | | |
CORPORATE BONDS (continued) | | | | | | | | | | | | |
| | | |
Non-Convertible Corporate Bonds (continued) | | | | | | | | | | | | |
Materials (continued) | | | | | | | | | | | | |
Metals & Mining (continued) | | | | | | | | | | | | |
Cliffs Natural Resources, Inc., 4.80%, 10/1/2020 | | | Baa3 | | | $ | 2,000,000 | | | $ | 1,954,218 | |
Steel Dynamics, Inc., 7.75%, 4/15/2016 | | | Ba2 | | | | 805,000 | | | | 847,263 | |
| | | | | | | | | | | | |
| | | | | | | | | | | 9,866,687 | |
| | | | | | | | | | | | |
Paper & Forest Products - 1.4% | | | | | | | | | | | | |
Georgia-Pacific LLC3, 8.25%, 5/1/2016 | | | Ba2 | | | | 1,100,000 | | | | 1,241,625 | |
International Paper Co., 7.50%, 8/15/2021 | | | Baa3 | | | | 5,330,000 | | | | 6,295,604 | |
| | | | | | | | | | | | |
| | | | | | | | | | | 7,537,229 | |
| | | | | | | | | | | | |
Total Materials | | | | | | | | | | | 23,971,987 | |
| | | | | | | | | | | | |
Telecommunication Services - 2.5% | | | | | | | | | | | | |
Diversified Telecommunication Services - 0.8% | | | | | | | | | | | | |
Clearwire Communications LLC - Clearwire Finance, Inc.3, 12.00%, 12/1/2015 | | | B2 | | | | 410,000 | | | | 442,800 | |
Clearwire Communications LLC - Clearwire Finance, Inc.3, 12.00%, 12/1/2015 | | | B2 | | | | 370,000 | | | | 398,675 | |
Inmarsat Finance plc (United Kingdom)3, 7.375%, 12/1/2017 | | | Ba2 | | | | 1,000,000 | | | | 1,050,000 | |
Intelsat Subsidiary Holding Co. S.A. (Bermuda)3, 8.875%, 1/15/2015 | | | B3 | | | | 995,000 | | | | 1,017,387 | |
Wind Acquisition Finance S.A. (Luxembourg)3, 11.75%, 7/15/2017 | | | B2 | | | | 1,080,000 | | | | 1,217,700 | |
| | | | | | | | | | | | |
| | | | | | | | | | | 4,126,562 | |
| | | | | | | | | | | | |
Wireless Telecommunication Services - 1.7% | | | | | | | | | | | | |
CC Holdings GS V LLC - Crown Castle GS III Corp.3, 7.75%, 5/1/2017 | | | Baa3 | | | | 1,000,000 | | | | 1,092,500 | |
Crown Castle Towers LLC3, 6.113%, 1/15/2020 | | | A2 | | | | 4,070,000 | | | | 4,246,316 | |
Crown Castle Towers LLC3, 4.883%, 8/15/2020 | | | A2 | | | | 610,000 | | | | 586,259 | |
NII Capital Corp., 10.00%, 8/15/2016 | | | B2 | | | | 1,000,000 | | | | 1,107,500 | |
SBA Tower Trust3, 5.101%, 4/15/2017 | | | A2 | | | | 2,095,000 | | | | 2,178,070 | |
| | | | | | | | | | | | |
| | | | | | | | | | | 9,210,645 | |
| | | | | | | | | | | | |
Total Telecommunication Services | | | | | | | | | | | 13,337,207 | |
| | | | | | | | | | | | |
Utilities - 3.0% | | | | | | | | | | | | |
Electric Utilities - 2.5% | | | | | | | | | | | | |
Allegheny Energy Supply Co. LLC3, 5.75%, 10/15/2019 | | | Baa3 | | | | 2,385,000 | | | | 2,400,600 | |
Exelon Generation Co. LLC, 5.35%, 1/15/2014 | | | A3 | | | | 3,355,000 | | | | 3,632,026 | |
Exelon Generation Co. LLC, 4.00%, 10/1/2020 | | | A3 | | | | 4,000,000 | | | | 3,743,352 | |
Southwestern Electric Power Co., 6.45%, 1/15/2019 | | | Baa3 | | | | 3,240,000 | | | | 3,558,013 | |
| | | | | | | | | | | | |
| | | | | | | | | | | 13,333,991 | |
| | | | | | | | | | | | |
Gas Utilities - 0.2% | | | | | | | | | | | | |
Ferrellgas LP - Ferrellgas Finance Corp.3, 6.50%, 5/1/2021 | | | Ba3 | | | | 1,000,000 | | | | 975,000 | |
| | | | | | | | | | | | |
| | |
| 12 | | The accompanying notes are an integral part of the financial statements. |
Investment Portfolio - December 31, 2010
| | | | | | | | | | | | |
| | | Credit
Rating 1
(unaudited) | | | Principal
Amount/
Shares | | | Value (Note 2) | |
| | | |
CORPORATE BONDS (continued) | | | | | | | | | | | | |
| | | |
Non-Convertible Corporate Bonds (continued) | | | | | | | | | | | | |
Utilities (continued) | | | | | | | | | | | | |
Independent Power Producers & Energy Traders - 0.2% | | | | | | | | | | | | |
Mirant Mid Atlantic Pass-Through Trust, Series B, 9.125%, 6/30/2017 | | | Ba1 | | | $ | 389,076 | | | $ | 418,257 | |
Mirant Mid Atlantic Pass-Through Trust, Series C, 10.06%, 12/30/2028 | | | Ba1 | | | | 487,147 | | | | 540,733 | |
| | | | | | | | | | | | |
| | | | | | | | | | | 958,990 | |
| | | | | | | | | | | | |
Multi-Utilities - 0.1% | | | | | | | | | | | | |
CenterPoint Energy Resources Corp., Series B, 7.875%, 4/1/2013 | | | Baa3 | | | | 770,000 | | | | 870,435 | |
| | | | | | | | | | | | |
Total Utilities | | | | | | | | | | | 16,138,416 | |
| | | | | | | | | | | | |
Total Non-Convertible Corporate Bonds
(Identified Cost $394,151,508) | | | | | | | | | | | 426,707,796 | |
| | | | | | | | | | | | |
TOTAL CORPORATE BONDS
(Identified Cost $400,092,197) | | | | | | | | | | | 433,184,983 | |
| | | | | | | | | | | | |
| | | |
PREFERRED STOCKS - 2.2% | | | | | | | | | | | | |
| | | |
Financials - 2.2% | | | | | | | | | | | | |
Commercial Banks - 1.0% | | | | | | | | | | | | |
PNC Financial Services Group, Inc., Series K7, 8.25% | | | Baa3 | | | | 1,850,000 | | | | 1,972,637 | |
Wells Fargo & Co., Series K7, 7.98% | | | Baa3 | | | | 3,145,000 | | | | 3,317,975 | |
| | | | | | | | | | | | |
| | | | | | | | | | | 5,290,612 | |
| | | | | | | | | | | | |
| | | |
Diversified Financial Services - 1.2% | | | | | | | | | | | | |
Bank of America Corp., Series K7, 8.00% | | | Ba3 | | | | 3,350,000 | | | | 3,376,130 | |
JPMorgan Chase & Co., Series 17, 7.90% | | | Baa1 | | | | 2,985,000 | | | | 3,173,025 | |
| | | | | | | | | | | | |
| | | | | | | | | | | 6,549,155 | |
| | | | | | | | | | | | |
| | | |
TOTAL PREFERRED STOCKS
(Identified Cost $10,896,014) | | | | | | | | | | | 11,839,767 | |
| | | | | | | | | | | | |
| | | |
ASSET-BACKED SECURITIES - 1.2% | | | | | | | | | | | | |
| | | |
Capital Auto Receivables Asset Trust, Series 2007-1, Class A4A, 5.010%, 4/16/2012 | | | Aaa | | | $ | 133,637 | | | | 134,898 | |
Capital Auto Receivables Asset Trust, Series 2007-3, Class A4, 5.210%, 3/17/2014 | | | Aaa | | | | 152,383 | | | | 155,790 | |
Ford Credit Auto Owner Trust, Series 2008-C, Class A4B4, 2.010%, 4/15/2013 | | | Aaa | | | | 300,000 | | | | 304,294 | |
Hertz Vehicle Financing LLC, Series 2009-2A, Class A23, 5.290%, 3/25/2016 | | | Aaa | | | | 2,585,000 | | | | 2,807,711 | |
| | |
| The accompanying notes are an integral part of the financial statements. | | 13 |
Investment Portfolio - December 31, 2010
| | | | | | | | | | | | |
| | | Credit
Rating 1
(unaudited) | | | Principal
Amount | | | Value (Note 2) | |
| | | |
ASSET-BACKED SECURITIES (continued) | | | | | | | | | | | | |
| | | |
Hertz Vehicle Financing LLC, Series 2010-1A, Class A23, 3.740%, 2/25/2017 | | | Aaa | | | $ | 2,360,000 | | | $ | 2,397,749 | |
SLM Student Loan Trust, Series 2002-4, Class A44, 0.442%, 3/15/2017 | | | Aaa | | | | 383,494 | | | | 383,163 | |
| | | | | | | | | | | | |
TOTAL ASSET-BACKED SECURITIES
(Identified Cost $5,872,535) | | | | | | | | | | | 6,183,605 | |
| | | | | | | | | | | | |
| | | |
COMMERCIAL MORTGAGE-BACKED SECURITIES - 3.5% | | | | | | | | | | | | |
| | | |
Americold LLC Trust, Series 2010-ARTA, Class A13, 3.847%, 1/14/2029 | | | AAA2 | | | | 435,000 | | | | 435,778 | |
Banc of America Commercial Mortgage, Inc., Series 2006-2, Class A44, 5.740%, 5/10/2045 | | | AAA2 | | | | 700,000 | | | | 766,334 | |
Banc of America Commercial Mortgage, Inc., Series 2006-4, Class A4, 5.634%, 7/10/2046 | | | Aaa | | | | 335,000 | | | | 359,438 | |
Bear Stearns Commercial Mortgage Securities, Series 2005-PWR9, Class A4A, 4.871%, 9/11/2042 | | | Aaa | | | | 375,000 | | | | 395,043 | |
Bear Stearns Commercial Mortgage Securities, Series 2006-PW12, Class A44, 5.722%, 9/11/2038 | | | Aaa | | | | 745,000 | | | | 812,843 | |
Bear Stearns Commercial Mortgage Securities, Series 2006-PW13, Class A4, 5.540%, 9/11/2041 | | | AAA2 | | | | 650,000 | | | | 697,580 | |
Citigroup Commercial Mortgage Trust, Series 2006-C4, Class A34, 5.728%, 3/15/2049 | | | Aaa | | | | 575,000 | | | | 622,332 | |
Commercial Mortgage Pass-Through Certificates, Series 2006-C7, Class A44, 5.764%, 6/10/2046 | | | AAA2 | | | | 900,000 | | | | 984,036 | |
Commercial Mortgage Pass-Through Certificates, Series 2010-C1, Class A13, 3.156%, 7/20/2046 | | | Aaa | | | | 1,302,678 | | | | 1,305,609 | |
Greenwich Capital Commercial Funding Corp., Series 2006-GG7, Class A44, 5.883%, 7/10/2038 | | | Aaa | | | | 1,695,000 | | | | 1,849,243 | |
JP Morgan Chase Commercial Mortgage Securities Corp., Series 2005-LDP5, Class A44, 5.205%, 12/15/2044 | | | Aaa | | | | 1,670,000 | | | | 1,797,861 | |
JP Morgan Chase Commercial Mortgage Securities Corp., Series 2006-LDP7, Class A44, 5.872%, 4/15/2045 | | | Aaa | | | | 330,000 | | | | 360,891 | |
JP Morgan Chase Commercial Mortgage Securities Corp., Series 2010-C2, Class A33, 4.070%, 11/15/2043 | | | AAA2 | | | | 750,000 | | | | 713,185 | |
LB-UBS Commercial Mortgage Trust, Series 2006-C4, Class A44, 5.881%, 6/15/2038 | | | Aaa | | | | 645,000 | | | | 697,974 | |
Merrill Lynch - Countrywide Commercial Mortgage Trust, Series 2006-3, Class A44, 5.414%, 7/12/2046 | | | Aaa | | | | 605,000 | | | | 637,713 | |
Morgan Stanley Capital I, Series 2005-HQ7, Class A44, 5.204%, 11/14/2042 | | | Aaa | | | | 385,000 | | | | 414,460 | |
OBP Depositor LLC Trust, Series 2010-OBP, Class A3, 4.646%, 7/15/2045 | | | AAA2 | | | | 420,000 | | | | 428,551 | |
| | |
| 14 | | The accompanying notes are an integral part of the financial statements. |
Investment Portfolio - December 31, 2010
| | | | | | | | | | | | |
| | | Credit
Rating 1
(unaudited) | | | Principal
Amount/ Shares | | | Value (Note 2) | |
| | | |
COMMERCIAL MORTGAGE-BACKED SECURITIES (continued) | | | | | | | | | | | | |
| | | |
Vornado DP LLC, Series 2010-VNO, Class A2FX3, 4.004%, 9/13/2028 | | | AAA2 | | | $ | 1,195,000 | | | $ | 1,158,618 | |
Wachovia Bank Commercial Mortgage Trust, Series 2005-C21, Class A44, 5.203%, 10/15/2044 | | | Aaa | | | | 820,000 | | | | 886,245 | |
Wachovia Bank Commercial Mortgage Trust, Series 2006-C25, Class A44, 5.737%, 5/15/2043 | | | Aaa | | | | 770,000 | | | | 825,873 | |
Wachovia Bank Commercial Mortgage Trust, Series 2006-C26, Class A34, 6.011%, 6/15/2045 | | | Aaa | | | | 900,000 | | | | 976,741 | |
Wells Fargo Commercial Mortgage Trust, Series 2010-C1, Class A23, 4.393%, 11/18/2043 | | | Aaa | | | | 1,350,000 | | | | 1,334,805 | |
| | | | | | | | | | | | |
TOTAL COMMERCIAL MORTGAGE-BACKED SECURITIES
(Identified Cost $18,381,578) | | | | | | | | | | | 18,461,153 | |
| | | | | | | | | | | | |
| | | |
FOREIGN GOVERNMENT BONDS - 0.6% | | | | | | | | | | | | |
| | | |
Hellenic Republic Government Bond (Greece), 6.00%, 7/19/2019 (Identified Cost $5,180,884) | | | Ba1 | | | EUR | 4,000,000 | | | | 3,432,175 | |
| | | | | | | | | | | | |
| | | |
MUNICIPAL BONDS - 0.5% | | | | | | | | | | | | |
| | | |
New York City, G.O. Bond, 6.646%, 12/1/2031 (Identified Cost $2,500,000) | | | Aa2 | | | $ | 2,500,000 | | | | 2,559,200 | |
| | | | | | | | | | | | |
| | | |
MUTUAL FUNDS - 1.7% | | | | | | | 81,330 | | | | 8,819,425 | |
| | | |
iShares iBoxx Investment Grade Corporate Bond Fund | | | | | | | | | | | | |
John Hancock Preferred Income Fund | | | | | | | 10,500 | | | | 196,140 | |
| | | | | | | | | | | | |
TOTAL MUTUAL FUNDS
(Identified Cost $7,604,479) | | | | | | | | | | | 9,015,565 | |
| | | | | | | | | | | | |
| | | |
U.S. GOVERNMENT AGENCIES - 6.6% | | | | | | | | | | | | |
| | | |
Mortgage-Backed Securities - 6.6% | | | | | | | | | | | | |
Fannie Mae, Pool #888468, 5.50%, 9/1/2021 | | | | | | $ | 4,982,518 | | | | 5,372,556 | |
Fannie Mae, Pool #995233, 5.50%, 10/1/2021 | | | | | | | 356,262 | | | | 384,595 | |
Fannie Mae, Pool #888017, 6.00%, 11/1/2021 | | | | | | | 380,032 | | | | 414,651 | |
Fannie Mae, Pool #995329, 5.50%, 12/1/2021 | | | | | | | 2,943,686 | | | | 3,174,122 | |
Fannie Mae, Pool #888136, 6.00%, 12/1/2021 | | | | | | | 498,143 | | | | 543,521 | |
Fannie Mae, Pool #888810, 5.50%, 11/1/2022 | | | | | | | 5,262,289 | | | | 5,674,228 | |
Fannie Mae, Pool #AD0462, 5.50%, 10/1/2024 | | | | | | | 315,419 | | | | 339,353 | |
Fannie Mae, Pool #889409, 6.00%, 5/1/2038 | | | | | | | 14,557,617 | | | | 15,836,545 | |
Freddie Mac, Pool #G11850, 5.50%, 7/1/2020 | | | | | | | 1,620,915 | | | | 1,748,309 | |
Freddie Mac, Pool #G12610, 6.00%, 3/1/2022 | | | | | | | 508,205 | | | | 554,975 | |
Freddie Mac, Pool #G12655, 6.00%, 5/1/2022 | | | | | | | 347,394 | | | | 379,365 | |
Freddie Mac, Pool #G12988, 6.00%, 1/1/2023 | | | | | | | 285,385 | | | | 311,114 | |
| | |
| The accompanying notes are an integral part of the financial statements. | | 15 |
Investment Portfolio - December 31, 2010
| | | | | | | | |
| | | Principal
Amount/
Shares | | | Value (Note 2) | |
| | |
U.S. GOVERNMENT AGENCIES (continued) | | | | | | | | |
| | |
Mortgage-Backed Securities (continued) | | | | | | | | |
Freddie Mac, Pool #G13078, 6.00%, 3/1/2023 | | $ | 498,562 | | | $ | 544,445 | |
Freddie Mac, Pool #G13331, 5.50%, 10/1/2023 | | | 262,803 | | | | 281,815 | |
| | | | | | | | |
TOTAL U.S. GOVERNMENT AGENCIES
(Identified Cost $35,643,752) | | | | | | | 35,559,594 | |
| | | | | | | | |
| | |
SHORT-TERM INVESTMENTS - 1.5% | | | | | | | | |
Dreyfus Cash Management, Inc. - Institutional Shares5, 0.14%, (Identified Cost $8,065,745) | | | 8,065,745 | | | | 8,065,745 | |
| | | | | | | | |
TOTAL INVESTMENTS - 98.7%
(Identified Cost $494,237,184) | | | | | | | 528,301,787 | |
OTHER ASSETS, LESS LIABILITIES - 1.3% | | | | | | | 7,053,560 | |
| | | | | | | | |
NET ASSETS - 100% | | | | | | $ | 535,355,347 | |
| | | | | | | | |
| | | | | | | | | | |
| FORWARD FOREIGN CURRENCY EXCHANGE CONTRACTS OPEN AT DECEMBER 31, 20106: |
| Settlement Date | | Contracts to Deliver | | In Exchange
For | | Contracts
At Value | | | Unrealized
Depreciation |
01/28/2011 | | EUR3,380,000 | | $4,440,813 | | $ | 4,516,504 | | | $(75,691) |
* Less than 0.1%
EUR - Euro currency
G.O. Bond - General Obligation Bond
1Credit ratings from Moody’s (unaudited).
2Credit ratings from S&P (unaudited).
3Restricted securities - Investment in securities that are restricted as to public resale under the Securities Act of 1933, as amended. These securities have been sold under rule 144A and have been determined to be liquid under guidelines established by the Board of Directors. These securities amount to $52,985,099, or 9.9%, of the Series’ net assets as of December 31, 2010.
4The coupon rate is floating and is the stated rate as of December 31, 2010.
5Rate shown is the current yield as of December 31, 2010.
6The counterparty for all forward foreign currency exchange contracts is the Bank of New York Mellon Corp.
7The rate shown is the fixed rate as of December 31, 2010; the rate becomes floating in 2049.
| | |
| 16 | | The accompanying notes are an integral part of the financial statements. |
Statement of Assets and Liabilities
December 31, 2010
| | | | |
ASSETS: | | | | |
| |
Investments, at value (identified cost $494,237,184) (Note 2) | | $ | 528,301,787 | |
Interest receivable | | | 7,159,221 | |
Receivable for fund shares sold | | | 804,739 | |
Dividends receivable | | | 35,598 | |
| | | | |
| |
TOTAL ASSETS | | | 536,301,345 | |
| | | | |
| |
LIABILITIES: | | | | |
| |
Accrued management fees (Note 3) | | | 315,128 | |
Accrued fund accounting and administration fees (Note 3) | | | 17,553 | |
Accrued transfer agent fees (Note 3) | | | 1,068 | |
Accrued Chief Compliance Officer service fees (Note 3) | | | 243 | |
Accrued directors’ fees (Note 3) | | | 91 | |
Payable for fund shares repurchased | | | 473,520 | |
Unrealized depreciation on foreign forward currency contracts (Note 2) | | | 75,691 | |
Other payables and accrued expenses | | | 62,704 | |
| | | | |
| |
TOTAL LIABILITIES | | | 945,998 | |
| | | | |
| |
TOTAL NET ASSETS | | $ | 535,355,347 | |
| | | | |
| |
NET ASSETS CONSIST OF: | | | | |
| |
Capital stock | | $ | 488,349 | |
Additional paid-in-capital | | | 497,599,318 | |
Distributions in excess of net investment income | | | (28,376 | ) |
Accumulated net realized gain on investments, foreign currency and translation of other assets and liabilities | | | 3,305,937 | |
Net unrealized appreciation on investments, foreign currency and translation of other assets and liabilities | | | 33,990,119 | |
| | | | |
| |
TOTAL NET ASSETS | | $ | 535,355,347 | |
| | | | |
| |
NET ASSET VALUE, OFFERING PRICE AND REDEMPTION PRICE PER SHARE - Class A ($535,355,347/48,834,882 shares) | | $ | 10.96 | |
| | | | |
| | |
| The accompanying notes are an integral part of the financial statements. | | 17 |
Statement of Operations
For the Year Ended December 31, 2010
| | | | |
INVESTMENT INCOME: | | | | |
| |
Interest | | $ | 25,311,539 | |
Dividends | | | 2,228,910 | |
| | | | |
| |
Total Investment Income | | | 27,540,449 | |
| | | | |
EXPENSES: | | | | |
| |
Management fees (Note 3) | | | 3,394,742 | |
Fund accounting and administration fees (Note 3) | | | 114,126 | |
Directors’ fees (Note 3) | | | 15,748 | |
Transfer agent fees (Note 3) | | | 6,026 | |
Chief Compliance Officer service fees (Note 3) | | | 2,621 | |
Custodian fees | | | 28,618 | |
Miscellaneous | | | 109,124 | |
| | | | |
| |
Total Expenses | | | 3,671,005 | |
Less reduction of expenses (Note 3) | | | (758 | ) |
| | | | |
| |
Net Expenses | | | 3,670,247 | |
| | | | |
| |
NET INVESTMENT INCOME | | | 23,870,202 | |
| | | | |
| |
REALIZED AND UNREALIZED GAIN (LOSS) ON INVESTMENTS AND FOREIGN CURRENCY: | | | | |
| |
Net realized gain (loss) on- | | | | |
Investments | | | 8,915,939 | |
Foreign currency and translation of other assets and liabilities | | | (347,168 | ) |
Forward foreign currency exchange contracts | | | 195,190 | |
| | | | |
| |
| | | 8,763,961 | |
| | | | |
| |
Net change in unrealized appreciation (depreciation) on-
Investments | | | 13,417,513 | |
Foreign currency and translation of other assets and liabilities | | | 10,688 | |
Forward foreign currency exchange contracts | | | (75,691 | ) |
| | | | |
| |
| | | 13,352,510 | |
| | | | |
| |
NET REALIZED AND UNREALIZED GAIN ON INVESTMENTS AND FOREIGN CURRENCY | | | 22,116,471 | |
| | | | |
| |
NET INCREASE IN NET ASSETS RESULTING FROM OPERATIONS | | $ | 45,986,673 | |
| | | | |
| | |
| 18 | | The accompanying notes are an integral part of the financial statements. |
Statements of Changes in Net Assets
| | | | | | | | |
| | | For the Year Ended
12/31/10 | | | For the Year Ended
12/31/09 | |
INCREASE (DECREASE) IN NET ASSETS: | | | | | | | | |
| | |
OPERATIONS: | | | | | | | | |
| | |
Net investment income | | $ | 23,870,202 | | | $ | 19,821,911 | |
Net realized gain on investments and foreign currency | | | 8,763,961 | | | | 2,769,225 | |
Net change in unrealized appreciation (depreciation) on investments and foreign currency | | | 13,352,510 | | | | 24,535,497 | |
| | | | | | | | |
| | |
Net increase from operations | | | 45,986,673 | | | | 47,126,633 | |
| | �� | | | | | | |
| | |
DISTRIBUTIONS TO SHAREHOLDERS (Note 8): | | | | | | | | |
| | |
From net investment income | | | (24,015,126 | ) | | | (19,892,958 | ) |
From net realized gain on investments | | | (3,214,343 | ) | | | — | |
| | | | | | | | |
| | |
Total distributions to shareholders | | | (27,229,469 | ) | | | (19,892,958 | ) |
| | | | | | | | |
| | |
CAPITAL STOCK ISSUED AND REPURCHASED: | | | | | | | | |
| | |
Net increase from capital share transactions (Note 5) | | | 121,289,798 | | | | 27,443,626 | |
| | | | | | | | |
| | |
Net increase in net assets | | | 140,047,002 | | | | 54,677,301 | |
| | |
NET ASSETS: | | | | | | | | |
| | |
Beginning of year | | | 395,308,345 | | | | 340,631,044 | |
| | | | | | | | |
| | |
End of year (including distributions in excess of net investment income of $28,376 and undistributed net investment income of $321,747, respectively) | | $ | 535,355,347 | | | $ | 395,308,345 | |
| | | | | | | | |
| | |
| The accompanying notes are an integral part of the financial statements. | | 19 |
Financial Highlights
| | | | | | | | | | | | | | | | | | | | |
| | | | | | For the Years Ended | | | | |
| | | 12/31/10 | | | 12/31/09 | | | 12/31/08 | | | 12/31/07 | | | 12/31/06 | |
Per share data (for a share outstanding throughout each year): | | | | | | | | | | | | | | | | | | | | |
Net asset value - Beginning of year | | | $10.49 | | | | $9.66 | | | | $10.02 | | | | $9.98 | | | | $9.89 | |
| | | | | | | | | | | | | | | | | | | | |
Income (loss) from investment operations: | | | | | | | | | | | | | | | | | | | | |
Net investment income | | | 0.55 | 1 | | | 0.57 | 1 | | | 0.42 | | | | 0.40 | | | | 0.37 | |
Net realized and unrealized gain (loss) on investments | | | 0.51 | | | | 0.82 | | | | (0.32 | ) | | | 0.03 | | | | 0.08 | |
| | | | | | | | | | | | | | | | | | | | |
Total from investment operations | | | 1.06 | | | | 1.39 | | | | 0.10 | | | | 0.43 | | | | 0.45 | |
| | | | | | | | | | | | | | | | | | | | |
Less distributions to shareholders: From net investment income | | | (0.52 | ) | | | (0.56 | ) | | | (0.45 | ) | | | (0.39 | ) | | | (0.36 | ) |
From net realized gain on investments | | | (0.07 | ) | | | — | | | | (0.01 | ) | | | — | | | | — | |
| | | | | | | | | | | | | | | | | | | | |
Total distributions to shareholders | | | (0.59 | ) | | | (0.56 | ) | | | (0.46 | ) | | | (0.39 | ) | | | (0.36 | ) |
| | | | | | | | | | | | | | | | | | | | |
Net asset value - End of year | | | $10.96 | | | | $10.49 | | | | $9.66 | | | | $10.02 | | | | $9.98 | |
| | | | | | | | | | | | | | | | | | | | |
Net assets - End of year (000’s omitted) | | | $535,355 | | | | $395,308 | | | | $340,631 | | | | $278,494 | | | | $224,145 | |
| | | | | | | | | | | | | | | | | | | | |
Total return2 | | | 10.18% | | | | 14.35% | | | | 1.24% | | | | 4.34% | | | | 4.59% | |
Ratios (to average net assets)/ Supplemental Data: | | | | | | | | | | | | | | | | | | | | |
Expenses* | | | 0.76% | | | | 0.78% | | | | 0.80% | | | | 0.81% | | | | 0.83% | |
Net investment income | | | 4.92% | | | | 5.60% | | | | 4.84% | | | | 4.20% | | | | 3.95% | |
Portfolio turnover | | | 31% | | | | 72% | | | | 63% | | | | 341% | | | | 315% | |
|
*The investment advisor did not impose all or a portion of its management fees, CCO fees, fund accounting and transfer agent fees and other fees in some years and in some years paid a portion of the Series’ expenses. If these expenses had been incurred by the Series, the expense ratio (to average net assets) would have been increased by the following amounts: | |
| | | 0.00% | 3 | | | 0.00% | 3 | | | N/A | | | | N/A | | | | N/A | |
1Calculated based on average shares outstanding during the year.
2Represents aggregate total return for the periods indicated, and assumes reinvestment of all distributions. Total return would have been lower had certain expenses not been waived or reimbursed during the periods. Periods less than one year are not annualized.
3Less than 0.01%.
| | |
| 20 | | The accompanying notes are an integral part of the financial statements. |
Notes to Financial Statements
Core Plus Bond Series (the “Series”) is a no-load diversified series of Manning & Napier Fund, Inc. (the “Fund”). The Fund is organized in Maryland and is registered under the Investment Company Act of 1940, as amended, as an open-end management investment company.
The Series’ investment objective is to provide long-term total return by investing primarily in bonds and other financial instruments, including derivatives, with economic characteristics similar to bonds.
The Fund’s Advisor is Manning & Napier Advisors, Inc. (the “Advisor”). Shares of the Series are offered to investors, clients and employees of the Advisor and its affiliates. The total authorized capital stock of the Fund consists of 10.0 billion shares of common stock each having a par value of $0.01. As of December 31, 2010, 6.2 billion shares have been designated in total among 29 series, of which 125 million have been designated as Core Plus Bond Series Class A common stock.
| 2. | SIGNIFICANT ACCOUNTING POLICIES |
Security Valuation
Portfolio securities, including domestic equities, foreign equities, warrants and options, listed on an exchange other than the NASDAQ National Market System are valued at the latest quoted sales price of the exchange on which the security is primarily traded. Securities not traded on valuation date or securities not listed on an exchange are valued at the latest quoted bid price provided by the Fund’s pricing service. Securities listed on the NASDAQ National Market System are valued in accordance with the NASDAQ Official Closing Price.
Debt securities, including government bonds, foreign bonds, asset-backed securities, structured notes, supranational obligations, sovereign bonds, corporate bonds and mortgage-backed securities will normally be valued on the basis of evaluated bid prices provided directly by an independent pricing service. The pricing services use multiple valuation techniques to determine fair value. In instances where sufficient market activity exists, the pricing services may utilize a market-based approach through which quotes from market makers are used to determine fair value. In instances where sufficient market activity may not exist or is limited, the pricing services also utilize proprietary valuation models which may consider market characteristics such as benchmark yield curves, option-adjusted spreads, credit spreads, estimated default rates, coupon rates, anticipated timing of principal repayments, underlying collateral, and other unique security features in order to estimate the relevant cash flows, which are then discounted to calculate the fair value. Certain investments in securities held by the Series may be valued on a basis of a price provided directly by a principal market maker. These prices may differ from the value that would have been used had a broader market for securities existed.
Municipal securities will normally be valued on the basis of market valuations provided by an independent pricing service that utilizes the latest price quotations and a matrix system (which considers such factors as security prices of similar securities, yields, maturities and ratings).
Short-term investments that mature in sixty days or less are valued at amortized cost, which approximates market value. Investments in open-end investment companies are valued at their net asset value per share on valuation date.
Volume and level of activity in established markets for an asset or liability are evaluated to determine whether recent transactions and quoted prices are determinative of fair value. Where there have been significant decreases in volume and level of activity, further analysis and adjustment may be necessary to estimate fair value. The Series measures fair value in these instances by the use of inputs and valuation techniques which may be based upon current market prices of securities that are comparable in coupon, rating, maturity and industry and/or expectation of future cash flows. As a result of trading in relatively thin markets and/or markets that experience significant volatility,
Notes to Financial Statements
| 2. | SIGNIFICANT ACCOUNTING POLICIES (continued) |
Security Valuation (continued)
the prices used by the Series to value these securities may differ from the value that would be realized if these securities were sold, and the differences could be material.
Securities for which representative valuations or prices are not available from the Fund’s pricing service may be valued at fair value. Due to the inherent uncertainty of valuations of such securities, the fair value may differ significantly from the values that would have been used had a ready market for such securities existed. If trading or events occurring after the close of the principal market in which securities are traded are expected to materially affect the value of those securities, then they may be valued at their fair value, taking this trading or these events into account. Fair value is determined in good faith by the Advisor under procedures approved by and under the general supervision and responsibility of the Fund’s Board of Directors (the “Board”).
Various inputs are used in determining the value of the Series’ assets or liabilities carried at market value. These inputs are summarized in three broad levels. Level 1 includes quoted prices in active markets for identical assets and liabilities. Level 2 includes other significant observable inputs (including quoted prices for similar securities, interest rates, prepayment speeds, credit risk, etc.). Level 3 includes significant unobservable inputs (including the Series’ own assumptions in determining the fair value of investments). The inputs or methodology used for valuing securities are not necessarily an indication of the risk associated with investing in those securities.
The following is a summary of the valuation levels used for major security types as of December 31, 2010 in valuing the Series’ assets or liabilities carried at market value:
| | | $00000,000,000 | | | | $00000,000,000 | | | | $00000,000,000 | | | | $00000,000,000 | |
Description | | Total | | | Level 1 | | | Level 2 | | | Level 3 | |
Assets: | | | | | | | | | | | | | | | | |
Equity securities* | | $ | — | | | $ | — | | | $ | — | | | $ | — | |
Preferred securities | | | 11,839,767 | | | | — | | | | 11,839,767 | | | | — | |
Debt securities: | | | | | | | | | | | | | | | | |
U.S. Treasury and other U.S. Government agencies | | | 35,559,594 | | | | — | | | | 35,559,594 | | | | — | |
States and political subdivisions (municipals) | | | 2,559,200 | | | | — | | | | 2,559,200 | | | | — | |
Corporate debt | | | 426,707,796 | | | | — | | | | 426,707,796 | | | | — | |
Convertible corporate debt | | | 6,477,187 | | | | — | | | | 6,477,187 | | | | — | |
Asset backed securities | | | 6,183,605 | | | | — | | | | 6,183,605 | | | | — | |
Commercial mortgage backed securities | | | 18,461,153 | | | | — | | | | 18,461,153 | | | | — | |
Foreign government bonds | | | 3,432,175 | | | | — | | | | 3,432,175 | | | | — | |
Mutual funds | | | 17,081,310 | | | | 17,081,310 | | | | — | | | | — | |
Other financial instruments**: | | | — | | | | — | | | | — | | | | — | |
| | | | | | | | | | | | | | | | |
Total assets: | | | 528,301,787 | | | | 17,081,310 | | | | 511,220,477 | | | | — | |
| | | | | | | | | | | | | | | | |
Liabilities: | | | | | | | | | | | | | | | | |
Other financial instruments**: Forward foreign currency exchange contracts | | | (75,691 | ) | | | — | | | | (75,691 | ) | | | — | |
| | | | | | | | | | | | | | | | |
Total liabilities: | | | (75,691 | ) | | | — | | | | (75,691 | ) | | | — | |
| | | | | | | | | | | | | | | | |
Total | | $ | 528,226,096 | | | $ | 17,081,310 | | | $ | 511,144,786 | | | $ | — | |
| | | | | | | | | | | | | | | | |
Notes to Financial Statements
| 2. | SIGNIFICANT ACCOUNTING POLICIES (continued) |
Security Valuation (continued)
The following table is a reconciliation of Level 3 investments for which significant unobservable inputs were used to determine fair value:
| | | | |
| Level 3 Reconciliation | | Corporate Debt | |
Balance as of December 31, 2009 (market value) | | $ | 244,111 | |
Accrued discounts/premiums | | | 2,483 | |
Change in unrealized appreciation/ depreciation | | | (1,848 | ) |
Net realized gain | | | 44,810 | |
Net purchases/sales | | | (289,556 | ) |
| | | | |
Balance as of December 31, 2010 (market value) | | $ | — | |
| | | | |
*Includes common stock, warrants and rights. Please see the Investment Portfolio for industry classification.
**Other financial instruments are derivative instruments not reflected in the Investment Portfolio, such as futures, forwards and swap contracts, which are valued at the unrealized appreciation/depreciation on the instrument.
There were no Level 3 securities held by the Series as of December 31, 2010.
The Fund’s policy is to recognize transfers in and transfers out of the valuation levels as of the beginning of the reporting period. There were no significant transfers between Level 1 and Level 2 during the year ended December 31, 2010.
Additional disclosure surrounding the activity in Level 3 fair value measurement will be effective for fiscal years beginning after December 15, 2010. Management has concluded that this will not have a material impact on the Series’ financial statements.
Security Transactions, Investment Income and Expenses
Security transactions are accounted for on trade date. Dividend income is recorded on the ex-dividend date, except that if the ex-dividend date has passed, certain dividends from foreign securities are recorded as soon as the Fund is informed of the ex-dividend date. Non-cash dividends, if any, are recorded at the fair market value of the securities received. Interest income, including amortization of premium and accretion of discounts using the effective interest method, is earned from settlement date and accrued daily.
Expenses are recorded on an accrual basis. Most expenses of the Fund can be attributed to a specific series. Expenses which cannot be directly attributed are apportioned among the series in the Fund in such a manner as deemed equitable by the Fund’s Board, taking into consideration, among other things, the nature and type of expense.
The Series uses the identified cost method for determining realized gain or loss on investments for both financial statement and federal income tax reporting purposes.
Foreign Currency Translation
The books and records of the Series are maintained in U.S. dollars. Foreign currencies, investments and other assets and liabilities are translated into U.S. dollars at the current exchange rates. Purchases and sales of investment securities and income and expenses are translated on the respective dates of such transactions. The Series does not isolate realized and unrealized gains and losses attributable to changes in the exchange rates from gains and losses that arise from changes in the market value of investments. Such fluctuations are included with net realized and unrealized gain or loss on investments. Net realized foreign currency gains and losses represent foreign currency
Notes to Financial Statements
| 2. | SIGNIFICANT ACCOUNTING POLICIES (continued) |
Foreign Currency Translation (continued)
gains and losses between trade date and settlement date on securities transactions, gains and losses on disposition of foreign currencies and the difference between the amount of income and foreign withholding taxes recorded on the books of the Series and the amounts actually received or paid.
Forward Foreign Currency Exchange Contracts
The Series may purchase or sell forward foreign currency exchange contracts in order to hedge a portfolio position or specific transaction. Risks may arise if the counterparties to a contract are unable to meet the terms of the contract or if the value of the foreign currency moves unfavorably.
All forward foreign currency exchange contracts are adjusted daily by the exchange rate of the underlying currency and, for financial statement purposes, any gain or loss is recorded as unrealized gain or loss until a contract has been closed. Realized and unrealized gain or loss arising from a transaction is included in net realized and unrealized gain (loss) on investments.
The Series may regularly trade forward foreign currency exchange contracts with off-balance sheet risk in the normal course of its investing activities to assist in managing exposure to changes in foreign currency exchange rates.
The notional or contractual amount of these instruments represents the investment the Series has in forward foreign currency exchange contracts and does not necessarily represent the amounts potentially at risk. The measurement of the risks associated with forward foreign currency exchange contracts is meaningful only when all related and offsetting transactions are considered. Investments in forward foreign currency exchange contacts held by the Series on December 31, 2010 are shown at the end of the Investment Portfolio, which is indicative of volume of derivative activity during the period.
Securities Purchased on a When-Issued Basis or Forward Commitment
The Series may purchase securities on a when-issued basis or forward commitment. These transactions involve a commitment by the Series to purchase securities for a predetermined price with payment and delivery taking place beyond the customary settlement period. When such purchases are outstanding, the Series will designate liquid assets in an amount sufficient to meet the purchase price. When purchasing a security on a delayed delivery basis, the Series assumes the rights and risks of ownership of the security, including the risk of price and yield fluctuations, and takes such fluctuations into account when determining its net asset value. The Series may sell the when-issued securities before they are delivered, which may result in a capital gain or loss. No such investments were held by the Series on December 31, 2010.
In connection with its ability to purchase or sell securities on a forward commitment basis, the Series may enter into forward roll transactions principally using To Be Announced (TBA) securities. Forward roll transactions require the sale of securities for delivery in the current month, and a simultaneous agreement to repurchase substantially similar (same type, coupon and maturity) securities on a specified future date. Risks of entering into forward roll transactions include the potential inability of the counterparty to meet the terms of the agreement; the potential of the Series to receive inferior securities at redelivery as compared to the securities sold to the counterparty; counterparty credit risk; and the potential pay down speed variance between the mortgage-backed pools. During the roll period, the Series forgoes principal and interest paid on the securities. The Series accounts for such dollar rolls as purchases and sales. Information regarding securities purchased on a when-issued basis is included in the Series’ Investment Portfolio. No such investments were held by the Series on December 31, 2010.
Notes to Financial Statements
| 2. | SIGNIFICANT ACCOUNTING POLICIES (continued) |
Restricted Securities
Restricted securities are purchased in private placement transactions, are not registered under the Securities Act of 1933, as amended, and may have contractual restrictions on resale. Information regarding restricted securities is included at the end of the Series’ Investment Portfolio.
Illiquid Securities
A security may be considered illiquid if so deemed in good faith by the Advisor under procedures approved by and under the general supervision and responsibility of the Fund’s Board. Securities that are illiquid are marked with the applicable footnote on the Investment Portfolio. No such investments were held by the Series on December 31, 2010.
Federal Taxes
The Series’ policy is to comply with the provisions of the Internal Revenue Code applicable to regulated investment companies. The Series is not subject to federal income tax or excise tax to the extent that the Series distributes to shareholders each year its taxable income, including any net realized gains on investments, in accordance with requirements of the Internal Revenue Code. Accordingly, no provision for federal income tax or excise tax has been made in the financial statements.
Management evaluates its tax positions to determine if the tax positions taken meet the minimum recognition threshold in connection with accounting for uncertainties in income tax positions taken or expected to be taken for the purposes of measuring and recognizing tax liabilities in the financial statements. Recognition of tax benefits of an uncertain tax position is required only when the position is “more likely than not” to be sustained assuming examination by taxing authorities. At December 31, 2010, the Series has recorded no liability for net unrecognized tax benefits relating to uncertain income tax positions taken or expected to be taken in future tax returns.
The Series files income tax returns in the U.S. federal jurisdiction, various states and foreign jurisdictions, as required. No income tax returns are currently under investigation. The statute of limitations on the Series’ tax returns remains open for the years ended December 31, 2007 through December 31, 2010. The Fund is not aware of any tax positions for which it is reasonably possible that the total amounts of unrecognized tax benefits will significantly change in the next twelve months.
Additionally, based on the Fund’s understanding of the tax rules and rates related to income, gains and transactions for foreign jurisdictions in which it invests, the Series will provide for foreign taxes, and where appropriate, deferred foreign tax.
Distributions of Income and Gains
Distributions to shareholders of net investment income and net realized gains are made annually. An additional distribution may be necessary to avoid taxation of the Series. Distributions are recorded on the ex-dividend date.
Indemnifications
The Fund’s organizational documents provide former and current directors and officers with a limited indemnification against liabilities arising in connection with the performance of their duties to the Fund. In the normal course of business, the Fund may also enter into contracts that provide general indemnifications. The Fund’s maximum exposure under these arrangements is unknown as this would be dependent on future claims that may be made against the Fund. The risk of material loss from such claims is considered remote.
Other
The preparation of financial statements in conformity with accounting principles generally accepted in the United States of America requires management to make estimates and assumptions that affect the reported amounts of
Notes to Financial Statements
| 2. | SIGNIFICANT ACCOUNTING POLICIES (continued) |
Other (continued)
assets and liabilities and the disclosure of contingent assets and liabilities at the date of the financial statements and the reported amounts of income and expenses during the reporting period. Actual results could differ from those estimates.
| 3. | TRANSACTIONS WITH AFFILIATES |
The Fund has an Investment Advisory Agreement (the “Agreement”) with the Advisor, for which the Series pays a fee, computed daily and payable monthly, at an annual rate of 0.70% of the Series’ average daily net assets.
Under the Agreement, personnel of the Advisor provide the Series with advice and assistance in the choice of investments and the execution of securities transactions, and otherwise maintain the Series’ organization. The Advisor also provides the Fund with necessary office space and fund administration and support services. The salaries of all officers of the Fund (except a percentage of the Fund’s Chief Compliance Officer’s salary, which is paid by the Fund), and of all Directors who are “affiliated persons” of the Fund, or of the Advisor, and all personnel of the Fund, or of the Advisor, performing services relating to research, statistical and investment activities, are paid by the Advisor. Each “non-affiliated” Director receives an annual stipend, which is allocated among all the active series of the Fund. In addition, these Directors also receive a fee per Board meeting attended plus a fee for each committee meeting attended.
The Advisor has contractually agreed, until at least April 30, 2012, to waive its fee and, if necessary, pay other operating expenses of the Series in order to maintain total direct annual fund operating expenses for the Series at no more than 0.90% of average daily net assets each year. For the year ended December 31, 2010, the Advisor voluntarily waived fees of $758, which is included as a reduction of expenses on the Statement of Operations. The Advisor is not eligible to recoup any expenses that have been waived or reimbursed in prior years.
Manning & Napier Investor Services, Inc., a registered broker-dealer affiliate of the Advisor, acts as distributor for the Fund’s shares. The services of Manning & Napier Investor Services, Inc. are provided at no additional cost to the Series.
The Advisor has agreements with PNC Global Investment Servicing (U.S.) Inc. (“PNCGIS”) under which PNCGIS serves as sub-accountant services agent and sub-transfer agent. The Fund pays the Advisor an annual fee related to fund accounting and administration of 0.0175% on the first $3 billion of average daily net assets (excluding Target Series); 0.015% on the next $3 billion of average daily net assets (excluding Target Series); and 0.01% of the average daily net assets in excess of $6 billion (excluding Target Series); plus a base fee of $25,500 per Series. Transfer Agent fees are charged to the Fund on a per account basis. Additionally, certain transaction- and cusip-based fees and out-of-pocket expenses, including charges for reporting relating to the Fund’s compliance program, are charged.
Effective July 1, 2010, PNCGIS was sold to The Bank of New York Mellon Corporation, the Series’ custodian. At the close of the sale, PNCGIS changed its name to BNY Mellon Investment Servicing (U.S.) Inc. (“BNY”).
Expenses not directly attributable to a Series are allocated based on each Series’ relative net assets or number of accounts, depending on the expense.
| 4. | PURCHASES AND SALES OF SECURITIES |
For the year ended December 31, 2010, purchases and sales of securities, other than U.S. Government securities and short-term securities, were $226,721,358 and $103,347,523, respectively. Purchases and sales of U.S. Government securities, other than short-term securities, were $39,274,428 and $44,027,767, respectively.
Notes to Financial Statements
| 5. | CAPITAL STOCK TRANSACTIONS |
Transactions in shares of Core Plus Bond Series were:
| | | | | | | | | | | | | | | | |
| | | For the Year Ended 12/31/10 | | | For the Year Ended 12/31/09 | |
| | | Shares | | | Amount | | | Shares | | | Amount | |
Sold | | | 12,957,005 | | | $ | 142,303,123 | | | | 5,159,453 | | | $ | 53,012,979 | |
Reinvested | | | 2,483,553 | | | | 26,822,714 | | | | 1,861,873 | | | | 19,585,357 | |
Repurchased | | | (4,296,032 | ) | | | (47,836,039 | ) | | | (4,577,661 | ) | | | (45,154,710 | ) |
| | | | | | | | | | | | | | | | |
Total | | | 11,144,526 | | | $ | 121,289,798 | | | | 2,443,665 | | | $ | 27,443,626 | |
| | | | | | | | | | | | | | | | |
Substantially all of the Series’ shares represent investments by fiduciary accounts over which the Advisor has sole investment discretion.
The Series may trade in instruments including written and purchased options, forward foreign currency exchange contracts and futures contracts and other derivatives in the normal course of investing activities to assist in managing exposure to various market risks. Investments in these instruments may subject the Series to various elements of risk, which may involve, to a varying degree, elements of risk in excess of the amounts recognized for financial statement purposes. These risks include: the risk that changes in the value of a derivative may not correlate perfectly with the underlying asset, rate or index, counterparty credit risk related to over the counter derivatives counterparties’ failure to perform under contract terms, liquidity risk related to the lack of a liquid market for these contracts allowing the fund to close out its position(s) and documentation risk relating to disagreement over contract terms. No such investments were held by the Series during the year ended December 31, 2010, except forward foreign currency exchange contracts, as shown at the end the Investment Portfolio.
Investing in securities of foreign companies and foreign governments involves special risks and considerations not typically associated with investing in securities of domestic companies and the U.S. Government. These risks include revaluation of currencies and future adverse political and economic developments. Moreover, securities of foreign companies and foreign governments and their markets may be less liquid and their prices more volatile than those of comparable domestic companies and the U.S. Government.
| 8. | FEDERAL INCOME TAX INFORMATION |
The amount and characterization of certain income and capital gains to be distributed are determined in accordance with federal income tax regulations, which may differ from accounting principles generally accepted in the United States of America. These differences are primarily due to differing book and tax treatments in the timing of the recognition of net investment income or gains and losses, including foreign currency gains and losses, investments in hybrid securities, foreign currency contracts and post-October losses. The Series may periodically make reclassifications among its capital accounts to reflect income and gains available for distribution (or available capital loss carryovers) under income tax regulations without impacting the Series’ net asset value. Any such reclassifications are not reflected in the financial highlights.
Notes to Financial Statements
| 8. | FEDERAL INCOME TAX INFORMATION (continued) |
The tax character of distributions paid were as follows:
| | | | | | | | |
| | | For the Year Ended 12/31/10 | | | For the Year Ended 12/31/09 | |
Ordinary income | | $ | 25,263,864 | | | $ | 19,892,958 | |
Long-term capital gains | | | 1,965,605 | | | | — | |
At December 31, 2010, the tax basis of distributable earnings and the net unrealized appreciation based on the identified cost of investments for federal income tax purposes:
| | | | |
Cost for federal income tax purposes | | $ | 494,545,149 | |
Unrealized appreciation | | $ | 37,215,210 | |
Unrealized depreciation | | | (3,458,572 | ) |
| | | | |
Net unrealized appreciation | | $ | 33,756,638 | |
| | | | |
Undistributed ordinary income | | | 41,690 | |
Undistributed long-term gains | | | 3,188,556 | |
The capital loss carryover utilized in the current year was $2,448,880.
Report of Independent Registered Public Accounting Firm
To the Board of Directors of Manning & Napier Fund, Inc. and Shareholders of Core Plus Bond Series:
In our opinion, the accompanying statement of assets and liabilities, including the investment portfolio (except for credit ratings), and the related statements of operations and of changes in net assets and the financial highlights present fairly, in all material respects, the financial position of the Core Plus Bond Series (a series of Manning & Napier Fund, Inc., hereafter referred to as the “Series”) at December 31, 2010, and the results of its operations for the year then ended, the changes in its net assets for each of the two years in the period then ended and the financial highlights for each of the five years in the period ended, in conformity with accounting principles generally accepted in the United States of America. These financial statements and financial highlights (hereafter referred to as “financial statements”) are the responsibility of the Series’ management. Our responsibility is to express an opinion on these financial statements based on our audits. We conducted our audits of these financial statements in accordance with the standards of the Public Company Accounting Oversight Board (United States). Those standards require that we plan and perform the audit to obtain reasonable assurance about whether the financial statements are free of material misstatement. An audit includes examining, on a test basis, evidence supporting the amounts and disclosures in the financial statements, assessing the accounting principles used and significant estimates made by management, and evaluating the overall financial statement presentation. We believe that our audits, which included confirmation of securities at December 31, 2010 by correspondence with the custodian and brokers, provide a reasonable basis for our opinion.
New York, New York
February 22, 2011
Supplemental Tax Information (unaudited)
All designations are based on financial information available as of the date of this annual report and, accordingly are subject to change.
For federal income tax purposes, the Series designates for the current fiscal year $911,632 or, if different, the maximum amount allowable under the tax law as qualified dividend income.
Pursuant to Section 852 of the Internal Revenue Code, as amended, the Series hereby designates $1,965,605 as capital gains for its taxable year ended December 31, 2010, or if different, the maximum allowable under tax law.
For corporate shareholders, the percentage of investment income (dividend income plus short-term gains, if any) that qualifies for the dividends received deduction for the current fiscal year is 3.63%, or if different, the maximum allowable under tax law.
Renewal of Investment Advisory Agreement (unaudited)
At the Manning & Napier Fund, Inc. (the “Fund”) Board of Directors’ (the “Board”) meeting, held on November 17, 2010, the Investment Advisory Agreement (the “Agreement”) between the Fund and Manning & Napier Advisors, Inc. (the “Advisor”) was reviewed by the Board for renewal. In connection with the decision whether to renew the Agreement, a variety of material was prepared for and reviewed by the Board.
Representatives of the Advisor attended the meeting and presented additional oral and written information to the Board to assist the Board in its considerations. The discussion immediately below outlines the materials and information presented to the Board in connection with the Board’s 2010 Annual Review of the Agreement and the conclusions made by the Directors when determining to continue the Agreement.
| | • | | The Board considered the services provided by the Advisor under the Agreement including, among others: deciding what securities to purchase and sell for each Series; arranging for the purchase and sale of such securities by placing orders with broker-dealers; administering the affairs of the Fund (including the books and records of the Fund not maintained by third party service providers such as the custodian or sub-transfer agent); arranging for the insurance coverage for the Fund; and supervising the preparation of tax returns, SEC filings (including registration statements) and reports to shareholders for the Fund. The Board also considered the nature and quality of such services provided under the Agreement in light of the Advisor’s services provided to the Fund for 24 years. The Board discussed the quality of these services with representatives from the Advisor and concluded that the Advisor was performing its services to the Fund required under the Agreement in a reasonable manner. |
| | • | | The Board considered the investment performance of the various Series of the Fund. The investment performance for each Series was reviewed on a cumulative basis since inception and on a one year basis. In addition, annualized performance for the following time periods was considered: inception, three year, five year, ten year, and current market cycle. A market cycle includes periods of both rising and falling markets. Returns for established benchmark indices for each Series were provided for each time period. The Board noted that the various Series were competitive against their respective benchmarks and/or peer groups over various time periods, but in particular over the full market cycle period relevant for the Series. In addition, the Board considered at the meeting (and considers on a quarterly basis) a peer group performance analysis consisting of Morningstar universes of mutual funds with similar investment objectives. The Board discussed the performance with representatives from the Advisor and concluded that the investment performance of each of the Fund’s Series was reasonable based on the Fund’s actual performance and comparative performance, especially performance over the current market cycle. |
| | • | | The Board considered the costs of the Advisor’s services and the profits of the Advisor as they relate to the Advisor’s services to the Fund under the Agreement. In reviewing the Advisor’s costs and profits, the Board discussed the Advisor’s revenues generated from the Fund (on both an actual and adjusted basis) and its expenses associated with providing the services under the Agreement. In addition, the Board reviewed the Advisor’s expenses associated with Fund activities outside of the Agreement (such as expense reimbursements pursuant to expense caps and payments made by the Advisor to third party platforms on which shares of the Fund are available for purchase). It was noted by representatives of the Advisor that 11 of the 27 active Series of the Fund are currently experiencing expenses above the capped expense ratios. After discussing the above costs and profits, the Board concluded that the Advisor’s profitability relating to its services provided under the Agreement was reasonable. |
| | • | | The Board considered the fees and expenses of the various Series of the Fund. The Advisor presented the advisory fees and total expenses for each Series, including the advisory fee adjusted for any expense waivers or reimbursements (either contractual or voluntary) paid by the Advisor. The advisory fees and expense ratios of each Series were compared to an average (on both a mean and median basis) of similar funds as disclosed on the Morningstar database. Representatives of the Advisor discussed with the Board the levels of its advisory |
Renewal of Investment Advisory Agreement (unaudited)
| | fee for each Series of the Fund and as compared to the median and mean advisory fees for similar funds as listed on Morningstar. Expense ratios for every Series, except the Pro-Blend’s Class R and Class C, and Target Class R and Class C, are currently below the median and mean for similar funds as listed on Morningstar. Based on their review of the information provided, the Board concluded that the fees and expenses of each Series of the Fund were reasonable on a comparative basis. |
| | • | | The Board also considered the other benefits the Advisor derives from its relationship with the Fund. Such other benefits include certain research products provided by soft dollars. Given the level of soft dollar transactions involving the Fund, the Board concluded that these additional benefits to the Advisor were reasonable. |
| | • | | In addition to the factors described above, the Board considered the Advisor’s personnel, investment strategies, policies and procedures relating to compliance with personal securities transactions, and reputation, expertise and resources in domestic and foreign financial markets. The Board concluded that these factors support the conclusion that the Advisor performs its services in a reasonable manner. |
| | • | | The Board did not consider economies of scale at this time because of the multiple uses of the Fund (for the Advisor’s discretionary investment account clients in addition to direct investors), the current profitability of the Advisor’s services to the Fund under the Agreement, and the overall size of the Fund complex. |
Based on the Board’s deliberations and their evaluation of the information described above, the Board, including a majority of Directors that are not “interested persons” as defined in the Investment Company Act of 1940, concluded that the compensation under the Agreement was fair and reasonable in light of the services and expenses and such other matters as the Directors considered to be relevant in the exercise of their reasonable judgment. Accordingly, the Board approved the renewal of the Agreement. In the course of their deliberations, the Directors did not identify any particular information that was all important or controlling.
Directors’ and Officers’ Information (unaudited)
The Statement of Additional Information provides additional information about the Fund’s directors and officers and can be obtained without charge by calling 1-800-466-3863, at www.manningnapieradvisors.com, or on the EDGAR Database on the SEC Internet web site (http:// www.sec.gov). The following chart shows certain information about the Fund’s officers and directors, including their principal occupations during the last five years. Unless specific dates are provided, the individuals have held the listed positions for longer than five years.
| | |
| INTERESTED DIRECTOR/OFFICER | | |
| |
Name: | | B. Reuben Auspitz* |
Address: | | 290 Woodcliff Drive Fairport, NY 14450 |
Age: | | 63 |
Current Position(s) Held with Fund: | | Principal Executive Officer, President, Chairman & Director |
Term of Office1 & Length of Time Served: | | Indefinite - Director since 1984; Vice President 1984 - 2003; President since 2004; Principal Executive Officer since 2002 |
Principal Occupation(s) During Past 5 Years: | | Executive Vice President; Executive Group Member**; Chief Compliance Officer since 2004; Vice Chairman since June 2010; Co-Executive Director from 2003-2010 - Manning & Napier Advisors, Inc. President; Director - Manning & Napier Investor Services, Inc. Holds or has held one or more of the following titles for various subsidiaries and affiliates: President, Vice President, Director, Chairman, Treasurer, Chief Compliance Officer or Member. |
Number of Portfolios Overseen within Fund Complex: | | 29 |
Other Directorships Held Outside Fund Complex: | | N/A |
INDEPENDENT DIRECTORS | | |
Name: | | Paul A. Brooke |
Address: | | 290 Woodcliff Drive Fairport, NY 14450 |
Age: | | 65 |
Current Position(s) Held with Fund: | | Director, Audit Committee Member, Governance & Nominating Committee Member |
Term of Office & Length of Time Served: | | Indefinite - Since 2007 |
Principal Occupation(s) During Past 5 Years: | | Chairman & CEO, Alsius Corp. (investments); Managing Member, PMSV Holdings LLC (investments) |
Number of Portfolios Overseen within Fund Complex: | | 29 |
Other Directorships Held Outside Fund Complex: | | Incyte Corp. (2000-present) ViroPharma, Inc. (2000-present) HLTH Corp. (2000-present) Cheyne Capital International (2000-present) MPM Bio-equities (2000-present) GMP Companies (2000-present) HoustonPharma (2000-present) |
Name: | | Richard M. Hurwitz |
Address: | | 290 Woodcliff Drive Fairport, NY 14450 |
Age: | | 47 |
Current Position(s) Held with Fund: | | Director, Audit Committee Member, Governance & Nominating Committee Member |
Term of Office & Length of Time Served: | | Indefinite - Since 2009 |
Principal Occupation(s) During Past 5 Years: | | Chief Executive Officer, Pictometry International Corp. since August 2010 (provider of georeferenced, aerial image libraries and related software) Managing Partner (2006-July 2010) - Aegis Investment Partners, LLC (investments); Founder and Managing Partner (2004-2005) - Village Markets, LLC (groceries) |
Number of Portfolios Overseen within Fund Complex: | | 29 |
Other Directorships Held Outside Fund Complex: | | Pictometry International Corp. (2000-2010) Pioneering Technologies (2006-2009) Vensearch Capital Corp. (2003-2007) |
Directors’ and Officers’ Information (unaudited)
| | |
| INDEPENDENT DIRECTORS (continued) | | |
| |
Name: | | Stephen B. Ashley |
Address: | | 290 Woodcliff Drive Fairport, NY 14450 |
Age: | | 70 |
Current Position(s) Held with Fund: | | Director, Audit Committee Member, Governance & Nominating Committee Member |
Term of Office & Length of Time Served: | | Indefinite - Since 1996 |
Principal Occupation(s) During Past 5 Years: | | Chairman, Director, President & Chief Executive Officer, The Ashley Group (property management and investment). Chairman (non-executive) 2004-2008; Director 1995-2008 - Fannie Mae (mortgage) |
Number of Portfolios Overseen within Fund Complex: | | 29 |
Other Directorships Held Outside Fund Complex: | | The Ashley Group (1995-2008) Genesee Corporation (1987-2007) |
Name: | | Peter L. Faber |
Address: | | 290 Woodcliff Drive Fairport, NY 14450 |
Age: | | 72 |
Current Position(s) Held with Fund: | | Director, Governance & Nominating Committee Member |
Term of Office & Length of Time Served: | | Indefinite - Since 1987 |
Principal Occupation(s) During Past 5 Years: | | Senior Counsel since 2006, Partner (1995 - 2006) - McDermott, Will & Emery LLP (law firm) |
Number of Portfolios Overseen within Fund Complex: | | 29 |
Other Directorships Held Outside Fund Complex: | | Partnership for New York City, Inc. (non-profit) New York Collegium (non-profit) Boston Early Music Festival (non-profit) |
Name: | | Harris H. Rusitzky |
Address: | | 290 Woodcliff Drive Fairport, NY 14450 |
Age: | | 76 |
Current Position(s) Held with Fund: | | Director, Audit Committee Member, Governance & Nominating Committee Member |
Term of Office & Length of Time Served: | | Indefinite - Since 1985 |
Principal Occupation(s) During Past 5 Years: | | President, The Greening Group (business consultants) since 1994; Partner, The Restaurant Group (restaurants) since 2006 |
Number of Portfolios Overseen within Fund Complex: | | 29 |
Other Directorships Held Outside Fund Complex: | | N/A |
OFFICERS | | |
| |
Name: | | Jeffrey S. Coons, Ph.D., CFA |
Address: | | 290 Woodcliff Drive Fairport, NY 14450 |
Age: | | 47 |
Current Position(s) Held with Fund: | | Vice President |
Term of Office1 & Length of Time Served: | | Since 2004 |
Principal Occupation(s) During Past 5 Years: | | President since 2010, Co-Director of Research since 2002, Executive Group Member** since 2003, - Manning & Napier Advisors, Inc. Holds one or more of the following titles for various subsidiaries and affiliates: President, Director, Treasurer or Senior Trust Officer. |
Number of Portfolios Overseen within Fund Complex: | | 29 |
Other Directorships Held Outside Fund Complex: | | N/A |
Directors’ and Officers’ Information (unaudited)
| | |
| OFFICERS (continued) | | |
Name: | | Beth Galusha |
Address: | | 290 Woodcliff Drive Fairport, NY 14450 |
Age: | | 49 |
Current Position(s) Held with Fund: | | Assistant Chief Financial Officer |
Term of Office1 & Length of Time Served: | | Assistant Chief Financial Officer since 2010 |
Principal Occupation(s) During Past 5 Years: | | Chief Financial Officer and Treasurer, Manning & Napier Advisors, Inc. Holds one or more of the following titles for various affiliates: Chief Financial Officer, Director, or Treasurer |
Number of Portfolios Overseen within Fund Complex: | | 29 |
Other Directorships Held Outside Fund Complex: | | N/A |
Name: | | Christine Glavin |
Address: | | 290 Woodcliff Drive Fairport, NY 14450 |
Age: | | 44 |
Current Position(s) Held with Fund: | | Principal Financial Officer, Chief Financial Officer |
Term of Office1 & Length of Time Served: | | Principal Financial Officer since 2002; Chief Financial Officer since 2001 |
Principal Occupation(s) During Past 5 Years: | | Fund Reporting Manager, Manning & Napier Advisors, Inc. since 1997 |
Number of Portfolios Overseen within Fund Complex: | | 29 |
Other Directorships Held Outside Fund Complex: | | N/A |
Name: | | Jodi L. Hedberg |
Address: | | 290 Woodcliff Drive Fairport, NY 14450 |
Age: | | 43 |
Current Position(s) Held with Fund: | | Corporate Secretary, Chief Compliance Officer, Anti-Money Laundering Compliance Officer |
Term of Office1 & Length of Time Served: | | Corporate Secretary since 1997; Chief Compliance Officer since 2004 |
Principal Occupation(s) During Past 5 Years: | | Director of Compliance, Manning & Napier Advisors, Inc. and affiliates since 1990 (title change in 2005 from Compliance Manager to Director of Compliance); Corporate Secretary, Manning & Napier Investor Services, Inc. since 2006 |
Number of Portfolios Overseen within Fund Complex: | | 29 |
Other Directorships Held Outside Fund Complex: | | N/A |
Name: | | Richard Yates |
Address: | | 290 Woodcliff Drive Fairport, NY 14450 |
Age: | | 45 |
Current Position(s) Held with Fund: | | Chief Legal Officer |
Term of Office1 & Length of Time Served: | | Chief Legal Officer since 2004 |
Principal Occupation(s) During Past 5 Years: | | Counsel - Manning & Napier Advisors, Inc. & affiliates since 2000; Holds one or more of the following titles for various affiliates; Director or Corporate Secretary |
Number of Portfolios Overseen within Fund Complex: | | 29 |
Other Directorships Held Outside Fund Complex: | | N/A |
*Interested Director, within the meaning of the Investment Company Act of 1940 by reason of his position with the Fund’s investment advisor and distributor. Mr. Auspitz serves as the Executive Vice President and Director, Manning & Napier Advisors, Inc. and President and Director, Manning & Napier Investor Services, Inc., the Fund’s distributor.
**Prior to June 2010, the Executive Group, consisting of senior executive employee-owners, performed the duties of the Office of the Chief Executive of the Advisor. Effective June 2010, the Executive Group serves as an advisory board to the Chief Executive Officer.
1The term of office for President, Vice President, Chief Financial Officer, Assistant Chief Financial Officer, Chief Legal Officer and Corporate Secretary is one year and until their respective successors are chosen and qualified. All other officers’ terms are indefinite.
This page intentionally Left Blank
36
This page intentionally Left Blank
37
Literature Requests (unaudited)
Proxy Voting Policies and Procedures
A description of the policies and procedures that the Fund uses to determine how to vote proxies relating to portfolio securities is available, without charge, upon request:
| | |
By phone | | 1-800-466-3863 |
On the Securities and Exchange
Commission’s (SEC) web site | | http://www.sec.gov |
Proxy Voting Record
Information regarding how the Fund voted proxies relating to portfolio securities during the most recent 12-month period ended June 30th is available, without charge, upon request:
| | |
By phone | | 1-800-466-3863 |
On the SEC’s web site | | http://www.sec.gov |
Quarterly Portfolio Holdings
The Series’ complete schedule of portfolio holdings for the 1st and 3rd quarters of each fiscal year are provided on Form N-Q, and are available, without charge, upon request:
| | |
By phone | | 1-800-466-3863 |
On the SEC’s web site | | http://www.sec.gov |
The Series’ Form N-Q may be reviewed and copied at the SEC’s Public Reference Room in Washington, D.C. Information on the operation of the Public Reference Room may be obtained by calling 1-800-SEC-0330.
Prospectus and Statement of Additional Information (SAI)
The prospectus and SAI provide additional information about each Series, including charges, expenses and risks. These documents are available, without charge, upon request:
| | |
By phone | | 1-800-466-3863 |
On the SEC’s web site | | http://www.sec.gov |
On the Advisor’s web site | | http://www.manning-napier.com |
Additional information available at www.manning-napier.com
1. Fund Holdings - Month-End
2. Fund Holdings - Quarter-End
3. Shareholder Report - Annual
4. Shareholder Report - Semi-Annual
MNCRPLBND-12/10-AR

Management Discussion and Analysis (unaudited)
Dear Shareholders:
As well-defined swings in sentiment drove market fluctuations in 2010, the fixed income markets had favorable results for the year. While returns were broadly positive across sectors, high yield securities were the best performing area of the fixed income market for the year. With returns resembling those of equities, high yield bonds experienced stronger performance at the end of the year than the rest of the fixed income markets, which suffered losses in the fourth quarter.
The Bank of America Merrill Lynch U.S. High Yield, Cash Pay, BB-B Rated Index earned 14.50% during the year. While the High Yield Bond Series returned a solid 13.59% and outpaced the broader Bank of America Merrill Lynch U.S. Corporate, Government and Mortgage Index in its first full year of its most recent activation, the Series slightly trailed its benchmark during 2010.
Historically, the high yield market has provided strong total and relative returns for several years following a recession, as defaults recede and credit spreads tighten. Such favorable conditions were a main reason Manning & Napier launched the High Yield Bond Series in September 2009. Following the 2008 credit crisis, yields on high yield bonds have indeed retreated from extremes, helping the high yield market generate outsized gains in both 2009 and 2010. Given attractive valuations, low defaults, and expectations for modest growth and inflation, we believe the high yield market continues to present opportunities. Yields on below investment grade bonds remain relatively high, particularly as compared to Treasury yields, and spreads between the two have the potential for further tightening over the next few years. As bond prices rise when yields fall, the Series continues to look to take advantage of this market environment.
As of the end of 2010, the High Yield Bond Series had a relatively high allocation to the Communications, Non-Cyclical Consumer, and Energy sectors versus the benchmark. In contrast, the Series was underweight to the Basic Materials, Consumer Cyclical, Financial, and Utilities sectors as compared to the benchmark. The lower exposure to Financials hurt the Series’ relative performance during the past year, particularly in the first and third quarters.
The Series was also impacted by market events over the last twelve months. For instance, when European sovereign debt concerns escalated during the second quarter, exposure to the Euro detracted from the Series’ relative results. Meanwhile, the Series benefited from merger and acquisition activity that involved several holdings last year.
As the markets unfold in 2011, it will be important to monitor trends such as the financial condition of corporations, monetary policy, and pricing in the marketplace. With this mindset, Manning & Napier remains committed to our active and selective investment approach to fixed income. Staying focused on the fundamentals and maintaining our selective investment process helped us earn solid returns through the volatile markets of 2010, and we believe these qualities will remain important in the environment ahead.
As always, we appreciate your business.
Sincerely,
Manning & Napier Advisors, Inc.
Performance Update as of December 31, 2010 (unaudited)
| | | | | | | | |
| | | Average Annual Total Returns As of December 31, 2010 | |
| | | One Year | | | Since Inception1 | |
Manning & Napier Fund, Inc. - High Yield Bond Series2 | | | 13.59% | | | | 14.38% | |
Bank of America (BofA) Merrill Lynch U.S. High Yield, Cash Pay, BB-B Rated Index3 | | | 14.50% | | | | 17.34% | |
| | | | | | | | | |
| | | | | | | | | |
The following graph compares the value of a $10,000 investment in the Manning & Napier Fund, Inc. - High Yield Bond Series from its current activation1 (9/14/09) to present (12/31/10) to the BofA Merrill Lynch U.S. High Yield, Cash Pay, BB-B Rated Index.
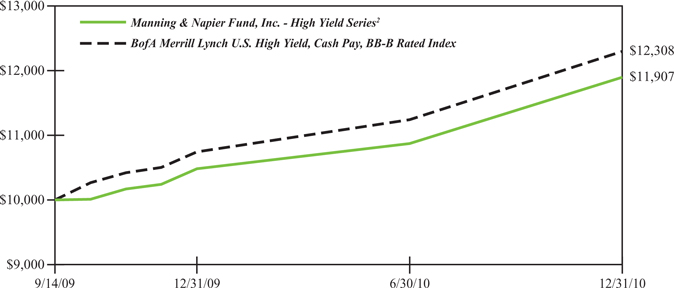
1Performance numbers for the Series and Index are calculated from September 14, 2009, the Series’ current activation date.
2The Series’ performance does not reflect the deduction of taxes that a shareholder would pay on fund distributions or the redemption of shares. The Series’ performance is historical and may not be indicative of future results. The performance returns shown are inclusive of the net expense ratio of the Series. For the year ended December 31, 2010, this annualized net expense ratio was 1.14%. The annualized gross expense ratio, which does not account for any voluntary or contractual waivers currently in effect, was 1.14% for the year ended December 31, 2010.
3The unmanaged BofA Merrill Lynch U.S. High Yield, Cash Pay, BB-B Rated Index (formerly a Merrill Lynch Index) is a market value weighted measure of BB and B rated corporate bonds with maturities of at least one-year. The Index returns assume reinvestment of coupons and, unlike Series returns, do not reflect any fees or expenses.
��
Shareholder Expense Example (unaudited)
As a shareholder of the Series, you may incur two types of costs: (1) transaction costs and (2) ongoing costs, including management fees and other Series expenses. This example is intended to help you understand your ongoing costs (in dollars) of investing in the Series and to compare these costs with the ongoing costs of investing in other mutual funds.
The example is based on an investment of $1,000 invested at the beginning of the period and held for the entire period (July 1, 2010 to December 31, 2010).
Actual Expenses
The first line of the table below provides information about actual account values and actual expenses. You may use the information in this line, together with the amount you invested, to estimate the expenses that you paid over the period. Simply divide your account value by $1,000 (for example, an $8,600 account value divided by $1,000 = 8.6), then multiply the result by the number in the first line under the heading entitled “Expenses Paid During Period” to estimate the expenses you paid on your account during this period.
Hypothetical Example for Comparison Purposes
The second line of the table below provides information about hypothetical account values and hypothetical expenses based on the Series’ actual expense ratio and an assumed rate of return of 5% per year before expenses, which is not the Series’ actual return. The hypothetical account values and expenses may not be used to estimate the actual ending account balance or expenses you paid during the period. You may use this information to compare the ongoing costs of investing in the Series and other funds. To do so, compare this 5% hypothetical example with the 5% hypothetical examples that appear in the shareholder reports of the other funds.
Please note that the expenses shown in the table are meant to highlight your ongoing costs only and do not reflect any transaction costs. Therefore, the second line of the table is useful in comparing ongoing costs only, and will not help you determine the relative total costs of owning different funds. In addition, if these transaction costs were included, your costs would have been higher.
| | | | | | |
| | | Beginning Account Value 7/1/10 | | Ending Account Value 12/31/10 | | Expenses Paid During Period* 7/1/10-12/31/10 |
Actual | | $1,000.00 | | $1,094.80 | | $6.18 |
Hypothetical
(5% return before expenses) | | $1,000.00 | | $1,019.31 | | $5.96 |
*Expenses are equal to the Series’ annualized expense ratio (for the six-month period) of 1.17%, multiplied by the average account value over the period, multiplied by 184/365 (to reflect the one-half year period). Expenses are based on the most recent fiscal half year; therefore, the expense ratio stated above may differ from the expense ratio stated in the financial highlights, which is based on one-year data. The Series’ total return would have been lower had certain expenses not been waived during the period.
Portfolio Composition as of December 31, 2010 (unaudited)
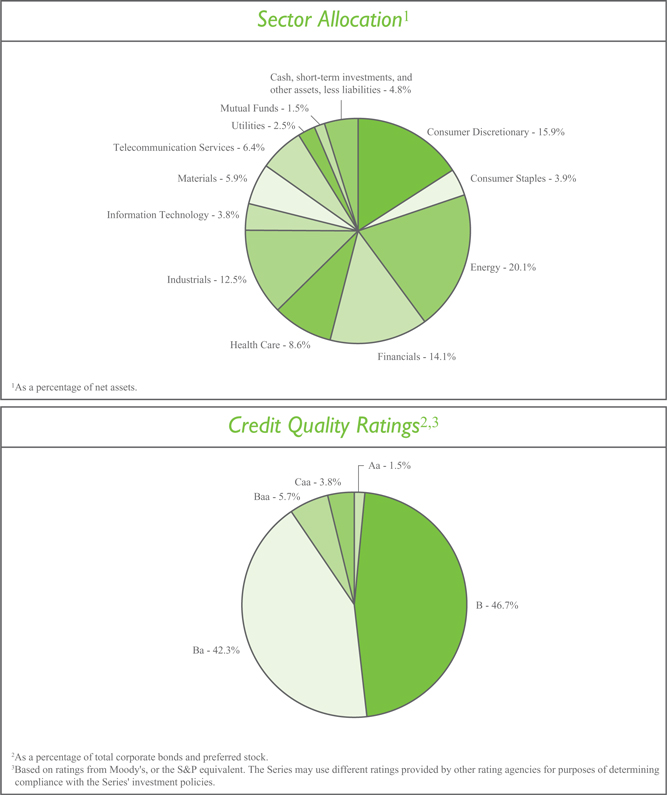
Investment Portfolio - December 31, 2010
| | | | | | | | | | | | |
| | | Credit Rating1 (unaudited) | | | Principal Amount | | | Value (Note 2) | |
CORPORATE BONDS - 91.1% | | | | | | | | | | | | |
| | | |
Non-Convertible Corporate Bonds - 91.1% | | | | | | | | | | | | |
Consumer Discretionary - 15.9% | | | | | | | | | | | | |
Hotels, Restaurants & Leisure - 4.5% | | | | | | | | | | | | |
Cedar Fair LP - Canada’s Wonderland Co. - Magnum Management Corp.2, 9.125%, 8/1/2018 | | | B2 | | | $ | 660,000 | | | $ | 710,325 | |
Scientific Games International, Inc.2, 7.875%, 6/15/2016 | | | B1 | | | | 1,450,000 | | | | 1,446,375 | |
Wendy’s - Arby’s Restaurants LLC, 10.00%, 7/15/2016 | | | B3 | | | | 1,700,000 | | | | 1,844,500 | |
Wyndham Worldwide Corp., 9.875%, 5/1/2014 | | | Ba1 | | | | 570,000 | | | | 667,466 | |
Wyndham Worldwide Corp., 6.00%, 12/1/2016 | | | Ba1 | | | | 2,260,000 | | | | 2,364,943 | |
| | | | | | | | | | | | |
| | | | | | | | | | | 7,033,609 | |
| | | | | | | | | | | | |
| | | |
Media - 9.1% | | | | | | | | | | | | |
Cablevision Systems Corp., 8.625%, 9/15/2017 | | | B1 | | | | 2,030,000 | | | | 2,210,163 | |
Columbus International, Inc. (Barbados)2, 11.50%, 11/20/2014 | | | B2 | | | | 1,770,000 | | | | 1,964,700 | |
Interactive Data Corp.2, 10.25%, 8/1/2018 | | | Caa1 | | | | 925,000 | | | | 1,012,875 | |
MDC Partners, Inc. (Canada), 11.00%, 11/1/2016 | | | B2 | | | | 955,000 | | | | 1,052,887 | |
Sirius XM Radio, Inc.2, 9.75%, 9/1/2015 | | | Ba3 | | | | 940,000 | | | | 1,055,150 | |
Unitymedia Hessen GmbH & Co. KG - Unitymedia NRW GmbH (Germany)2, 8.125%, 12/1/2017 | | | B1 | | | | 650,000 | | | | 679,250 | |
Unitymedia Hessen GmbH & Co. KG - Unitymedia NRW GmbH (Germany)2, 8.125%, 12/1/2017 | | | B1 | | | EUR | 525,000 | | | | 742,779 | |
UPC Holding B.V. (Netherlands)2, 9.875%, 4/15/2018 | | | B2 | | | $ | 1,935,000 | | | | 2,118,825 | |
Virgin Media Finance plc (United Kingdom), 8.375%, 10/15/2019 | | | Ba3 | | | | 935,000 | | | | 1,021,487 | |
WMG Acquisition Corp., 9.50%, 6/15/2016 | | | Ba2 | | | | 1,105,000 | | | | 1,185,113 | |
XM Satellite Radio, Inc.2, 7.625%, 11/1/2018 | | | B3 | | | | 1,315,000 | | | | 1,357,737 | |
| | | | | | | | | | | | |
| | | | | | | | | | | 14,400,966 | |
| | | | | | | | | | | | |
| | | |
Specialty Retail - 2.3% | | | | | | | | | | | | |
Rent-A-Center, Inc.2, 6.625%, 11/15/2020 | | | Ba3 | | | | 1,600,000 | | | | 1,592,000 | |
Toys R Us Property Co., LLC, 8.50%, 12/1/2017 | | | Ba1 | | | | 1,885,000 | | | | 2,026,375 | |
| | | | | | | | | | | | |
| | | | | | | | | | | 3,618,375 | |
| | | | | | | | | | | | |
| | | |
Total Consumer Discretionary | | | | | | | | | | | 25,052,950 | |
| | | | | | | | | | | | |
| | | |
Consumer Staples - 3.9% | | | | | | | | | | | | |
Beverages - 2.5% | | | | | | | | | | | | |
CEDC Finance Corp. International, Inc.2, 9.125%, 12/1/2016 | | | B1 | | | | 1,885,000 | | | | 2,002,813 | |
Constellation Brands, Inc., 8.375%, 12/15/2014 | | | Ba3 | | | | 1,830,000 | | | | 1,999,275 | |
| | | | | | | | | | | | |
| | | | | | | | | | | 4,002,088 | |
| | | | | | | | | | | | |
| | | |
Personal Products - 1.4% | | | | | | | | | | | | |
Revlon Consumer Products Corp., 9.75%, 11/15/2015 | | | B3 | | | | 2,055,000 | | | | 2,173,163 | |
| | | | | | | | | | | | |
Total Consumer Staples | | | | | | | | | | | 6,175,251 | |
| | | | | | | | | | | | |
| | | |
Energy - 20.1% | | | | | | | | | | | | |
Energy Equipment & Services - 7.3% | | | | | | | | | | | | |
Calfrac Holdings LP2, 7.50%, 12/1/2020 | | | B2 | | | | 1,595,000 | | | | 1,614,937 | |
| | |
| The accompanying notes are an integral part of the financial statements. | | 5 |
Investment Portfolio - December 31, 2010
| | | | | | | | | | | | |
| | | Credit Rating1 (unaudited) | | | Principal Amount | | | Value (Note 2) | |
CORPORATE BONDS (continued) | | | | | | | | | | | | |
| | | |
Non-Convertible Corporate Bonds (continued) | | | | | | | | | | | | |
Energy (continued) | | | | | | | | | | | | |
Energy Equipment & Services (continued) | | | | | | | | | | | | |
Cie Generale de Geophysique - Veritas (France), 7.50%, 5/15/2015 | | | Ba3 | | | $ | 2,000,000 | | | $ | 2,035,000 | |
Complete Production Services, Inc., 8.00%, 12/15/2016 | | | B1 | | | | 2,150,000 | | | | 2,225,250 | |
Hornbeck Offshore Services, Inc., 8.00%, 9/1/2017 | | | Ba3 | | | | 1,340,000 | | | | 1,366,800 | |
Key Energy Services, Inc., 8.375%, 12/1/2014 | | | B1 | | | | 1,150,000 | | | | 1,213,250 | |
Thermon Industries, Inc.2, 9.50%, 5/1/2017 | | | B1 | | | | 1,355,000 | | | | 1,443,075 | |
Trinidad Drilling Ltd. (Canada)2, 7.875%, 1/15/2019 | | | B2 | | | | 1,710,000 | | | | 1,727,100 | |
| | | | | | | | | | | | |
| | | | | | | | | | | 11,625,412 | |
| | | | | | | | | | | | |
| | | |
Oil, Gas & Consumable Fuels - 12.8% | | | | | | | | | | | | |
Aquilex Holdings LLC - Aquilex Finance Corp., 11.125%, 12/15/2016 | | | Caa1 | | | | 1,185,000 | | | | 1,199,813 | |
Arch Coal, Inc., 8.75%, 8/1/2016 | | | B1 | | | | 725,000 | | | | 790,250 | |
Arch Western Finance LLC, 6.75%, 7/1/2013 | | | B1 | | | | 611,000 | | | | 617,110 | |
Chaparral Energy, Inc., 8.875%, 2/1/2017 | | | Caa1 | | | | 1,495,000 | | | | 1,517,425 | |
Chesapeake Energy Corp., 9.50%, 2/15/2015 | | | Ba3 | | | | 2,075,000 | | | | 2,339,562 | |
Coffeyville Resources LLC - Coffeyville Finance, Inc.2, 9.00%, 4/1/2015 | | | Ba3 | | | | 604,000 | | | | 646,280 | |
Coffeyville Resources LLC - Coffeyville Finance, Inc.2, 10.875%, 4/1/2017 | | | B3 | | | | 640,000 | | | | 688,000 | |
Crosstex Energy LP - Crosstex Energy Finance Corp., 8.875%, 2/15/2018 | | | B3 | | | | 2,143,000 | | | | 2,295,689 | |
Linn Energy LLC - Linn Energy Finance Corp.2, 7.75%, 2/1/2021. | | | B2 | | | | 1,455,000 | | | | 1,491,375 | |
MarkWest Energy Partners LP - MarkWest Energy Finance Corp., 6.75%, 11/1/2020 | | | B1 | | | | 1,550,000 | | | | 1,550,000 | |
Martin Midstream Partners LP - Martin Midstream Finance Corp., 8.875%, 4/1/2018 | | | B | 3 | | | 1,360,000 | | | | 1,400,800 | |
Niska Gas Storage US LLC - Niska Gas Storage Canada ULC2, 8.875%, 3/15/2018 | | | B1 | | | | 970,000 | | | | 1,037,900 | |
Plains Exploration & Production Co., 8.625%, 10/15/2019 | | | B1 | | | | 440,000 | | | | 481,800 | |
Targa Resources Partners LP - Targa Resources Partners Finance Corp., 8.25%, 7/1/2016 | | | B1 | | | | 1,410,000 | | | | 1,487,550 | |
Tesoro Corp., 9.75%, 6/1/2019 | | | Ba1 | | | | 1,940,000 | | | | 2,148,550 | |
Whiting Petroleum Corp., 7.00%, 2/1/2014 | | | Ba3 | | | | 485,000 | | | | 509,250 | |
| | | | | | | | | | | | |
| | | | | | | | | | | 20,201,354 | |
| | | | | | | | | | | | |
Total Energy | | | | | | | | | | | 31,826,766 | |
| | | | | | | | | | | | |
Financials - 11.5% | | | | | | | | | | | | |
Capital Markets - 0.9% | | | | | | | | | | | | |
Goldman Sachs Capital II4, 5.793%, 12/29/2049 | | | Baa2 | | | | 1,650,000 | | | | 1,398,375 | |
| | | | | | | | | | | | |
| | |
| 6 | | The accompanying notes are an integral part of the financial statements. |
Investment Portfolio - December 31, 2010
| | | | | | | | | | | | |
| | | Credit Rating1 (unaudited) | | | Principal Amount | | | Value (Note 2) | |
| | | |
CORPORATE BONDS (continued) | | | | | | | | | | | | |
| | | |
Non-Convertible Corporate Bonds (continued) | | | | | | | | | | | | |
Financials (continued) | | | | | | | | | | | | |
Commercial Banks - 0.5% | | | | | | | | | | | | |
Wilmington Trust Corp., 8.50%, 4/2/2018 | | | Ba1 | | | $ | 755,000 | | | $ | 861,834 | |
| | | | | | | | | | | | |
| | | |
Consumer Finance - 3.3% | | | | | | | | | | | | |
American Express Co.4, 6.80%, 9/1/2066 | | | Baa2 | | | | 2,940,000 | | | | 2,910,600 | |
Credit Acceptance Corp.2, 9.125%, 2/1/2017 | | | B1 | | | | 2,185,000 | | | | 2,294,250 | |
| | | | | | | | | | | | |
| | | | | | | | | | | 5,204,850 | |
| | | | | | | | | | | | |
Insurance - 1.5% | | | | | | | | | | | | |
Hartford Financial Services Group, Inc.4, 8.125%, 6/15/2038 | | | Ba1 | | | | 2,250,000 | | | | 2,390,625 | |
| | | | | | | | | | | | |
Real Estate Investment Trusts (REITS) - 4.3% | | | | | | | | | | | | |
DuPont Fabros Technology LP, 8.50%, 12/15/2017 | | | Ba2 | | | | 2,495,000 | | | | 2,669,650 | |
Felcor Lodging LP, 10.00%, 10/1/2014 | | | B2 | | | | 1,370,000 | | | | 1,534,400 | |
Host Hotels & Resorts LP, 6.875%, 11/1/2014 | | | BB3 | | | | 665,000 | | | | 684,950 | |
Host Hotels & Resorts LP, 6.375%, 3/15/2015 | | | Ba1 | | | | 550,000 | | | | 558,250 | |
Omega Healthcare Investors, Inc., 7.50%, 2/15/2020 | | | Ba2 | | | | 1,335,000 | | | | 1,403,419 | |
| | | | | | | | | | | | |
| | | | | | | | | | | 6,850,669 | |
| | | | | | | | | | | | |
Real Estate Management & Development - 1.0% | | | | | | | | | | | | |
CB Richard Ellis Services, Inc.2, 6.625%, 10/15/2020 | | | Ba1 | | | | 1,500,000 | | | | 1,500,000 | |
| | | | | | | | | | | | |
Total Financials | | | | | | | | | | | 18,206,353 | |
| | | | | | | | | | | | |
Health Care - 8.6% | | | | | | | | | | | | |
Health Care Equipment & Supplies - 3.9% | | | | | | | | | | | | |
Alere, Inc., 7.875%, 2/1/2016 | | | B2 | | | | 1,725,000 | | | | 1,729,313 | |
Alere, Inc., 9.00%, 5/15/2016 | | | B3 | | | | 1,323,000 | | | | 1,362,690 | |
Fresenius Medical Care Capital Trust IV, 7.875%, 6/15/2011 | | | Ba3 | | | | 965,000 | | | | 981,887 | |
Fresenius US Finance II, Inc.2, 9.00%, 7/15/2015 | | | Ba1 | | | | 1,885,000 | | | | 2,158,325 | |
| | | | | | | | | | | | |
| | | | | | | | | | | 6,232,215 | |
| | | | | | | | | | | | |
Health Care Providers & Services - 3.8% | | | | | | | | | | | | |
BioScrip, Inc., 10.25%, 10/1/2015 | | | B3 | | | | 1,285,000 | | | | 1,323,550 | |
HCA, Inc., 7.875%, 2/15/2020 | | | Ba3 | | | | 1,170,000 | | | | 1,251,900 | |
Health Management Associates, Inc., 6.125%, 4/15/2016 | | | BB3 | | | | 1,935,000 | | | | 1,954,350 | |
LifePoint Hospitals, Inc.2, 6.625%, 10/1/2020 | | | Ba1 | | | | 1,500,000 | | | | 1,488,750 | |
| | | | | | | | | | | | |
| | | | | | | | | | | 6,018,550 | |
| | | | | | | | | | | | |
Life Sciences Tools & Services - 0.9% | | | | | | | | | | | | |
PharmaNet Development Group, Inc.2, 10.875%, 4/15/2017 | | | B3 | | | | 1,350,000 | | | | 1,404,000 | |
| | | | | | | | | | | | |
Total Health Care | | | | | | | | | | | 13,654,765 | |
| | | | | | | | | | | | |
Industrials - 12.5% | | | | | | | | | | | | |
Aerospace & Defense - 2.2% | | | | | | | | | | | | |
BE Aerospace, Inc., 6.875%, 10/1/2020 | | | Ba3 | | | | 1,500,000 | | | | 1,548,750 | |
GeoEye, Inc., 9.625%, 10/1/2015 | | | Ba3 | | | | 945,000 | | | | 1,067,850 | |
| | |
| The accompanying notes are an integral part of the financial statements. | | 7 |
Investment Portfolio - December 31, 2010
| | | | | | | | | | | | |
| | | Credit Rating1 (unaudited) | | | Principal Amount | | | Value (Note 2) | |
CORPORATE BONDS (continued) | | | | | | | | | | | | |
| | | |
Non-Convertible Corporate Bonds (continued) | | | | | | | | | | | | |
Industrials (continued) | | | | | | | | | | | | |
Aerospace & Defense (continued) | | | | | | | | | | | | |
Kratos Defense & Security Solutions, Inc., 10.00%, 6/1/2017 | | | B3 | | | $ | 750,000 | | | $ | 830,625 | |
| | | | | | | | | | | | |
| | | | | | | | | | | 3,447,225 | |
| | | | | | | | | | | | |
| | | |
Airlines - 1.8% | | | | | | | | | | | | |
Continental Airlines, Inc.2, 6.75%, 9/15/2015 | | | Ba2 | | | | 1,495,000 | | | | 1,539,850 | |
Delta Air Lines, Inc.2, 9.50%, 9/15/2014 | | | Ba2 | | | | 1,176,000 | | | | 1,280,370 | |
| | | | | | | | | | | | |
| | | | | | | | | | | 2,820,220 | |
| | | | | | | | | | | | |
| | | |
Building Products - 1.8% | | | | | | | | | | | | |
Building Materials Corp. of America2, 6.875%, 8/15/2018 | | | B1 | | | | 825,000 | | | | 816,750 | |
Building Materials Corp. of America2, 7.50%, 3/15/2020 | | | B1 | | | | 645,000 | | | | 656,287 | |
Owens Corning, 9.00%, 6/15/2019 | | | Ba1 | | | | 1,140,000 | | | | 1,337,441 | |
| | | | | | | | | | | | |
| | | | | | | | | | | 2,810,478 | |
| | | | | | | | | | | | |
| | | |
Commercial Services & Supplies - 2.2% | | | | | | | | | | | | |
ACCO Brands Corp., 10.625%, 3/15/2015 | | | B1 | | | | 910,000 | | | | 1,023,750 | |
Clean Harbors, Inc., 7.625%, 8/15/2016 | | | Ba2 | | | | 1,072,000 | | | | 1,139,000 | |
Garda World Security Corp. (Canada)2, 9.75%, 3/15/2017 | | | B3 | | | | 1,290,000 | | | | 1,383,525 | |
| | | | | | | | | | | | |
| | | | | | | | | | | 3,546,275 | |
| | | | | | | | | | | | |
| | | |
Industrial Conglomerates - 1.4% | | | | | | | | | | | | |
GE Capital Trust I4, 6.375%, 11/15/2067 | | | Aa3 | | | | 2,250,000 | | | | 2,221,875 | |
| | | | | | | | | | | | |
Marine - 2.2% | | | | | | | | | | | | |
Navios Maritime Holdings, Inc. - Navios Maritime Finance US, Inc. (Marshall Island), 8.875%, 11/1/2017 | | | Ba3 | | | | 2,195,000 | | | | 2,376,087 | |
United Maritime Group LLC - United Maritime Group Finance Corp., 11.75%, 6/15/2015 | | | B3 | | | | 1,185,000 | | | | 1,187,963 | |
| | | | | | | | | | | | |
| | | | | | | | | | | 3,564,050 | |
| | | | | | | | | | | | |
| | | |
Road & Rail - 0.9% | | | | | | | | | | | | |
RailAmerica, Inc., 9.25%, 7/1/2017 | | | B1 | | | | 773,000 | | | | 849,334 | |
Swift Services Holdings, Inc.2, 10.00%, 11/15/2018 | | | Caa1 | | | | 500,000 | | | | 523,750 | |
| | | | | | | | | | | | |
| | | | | | | | | | | 1,373,084 | |
| | | | | | | | | | | | |
| | | |
Total Industrials | | | | | | | | | | | 19,783,207 | |
| | | | | | | | | | | | |
Information Technology - 3.8% | | | | | | | | | | | | |
Communications Equipment - 2.0% | | | | | | | | | | | | |
Alcatel-Lucent USA, Inc., 6.45%, 3/15/2029 | | | B1 | | | | 1,580,000 | | | | 1,248,200 | |
Hughes Network Systems LLC - HNS Finance Corp., 9.50%, 4/15/2014 | | | B1 | | | | 1,775,000 | | | | 1,830,469 | |
| | | | | | | | | | | | |
| | | | | | | | | | | 3,078,669 | |
| | | | | | | | | | | | |
| | |
| 8 | | The accompanying notes are an integral part of the financial statements. |
Investment Portfolio - December 31, 2010
| | | | | | | | | | | | |
| | | Credit Rating1 (unaudited) | | | Principal Amount | | | Value (Note 2) | |
CORPORATE BONDS (continued) | | | | | | | | | | | | |
| | | |
Non-Convertible Corporate Bonds (continued) | | | | | | | | | | | | |
Information Technology (continued) | | | | | | | | | | | | |
Semiconductors & Semiconductor Equipment - 1.8% | | | | | | | | | | | | |
Advanced Micro Devices, Inc., 8.125%, 12/15/2017 | | | Ba3 | | | $ | 645,000 | | | $ | 683,700 | |
Advanced Micro Devices, Inc.2, 7.75%, 8/1/2020 | | | Ba3 | | | | 760,000 | | | | 788,500 | |
MagnaChip Semiconductor S.A. - MagnaChip Semiconductor Finance Co., 10.50%, 4/15/2018 | | | B2 | | | | 1,360,000 | | | | 1,434,800 | |
| | | | | | | | | | | | |
| | | | | | | | | | | 2,907,000 | |
| | | | | | | | | | | | |
| | | |
Total Information Technology | | | | | | | | | | | 5,985,669 | |
| | | | | | | | | | | | |
Materials - 5.9% | | | | | | | | | | | | |
Chemicals - 2.0% | | | | | | | | | | | | |
Ferro Corp., 7.875%, 8/15/2018 | | | B2 | | | | 1,470,000 | | | | 1,550,850 | |
Rhodia S.A. (France)2, 6.875%, 9/15/2020 | | | B1 | | | | 1,535,000 | | | | 1,556,106 | |
| | | | | | | | | | | | |
| | | | | | | | | | | 3,106,956 | |
| | | | | | | | | | | | |
| | | |
Containers & Packaging - 1.5% | | | | | | | | | | | | |
Reynolds Group Issuer, Inc. - Reynolds Group Issuer LLC2, 8.50%, 5/15/2018 | | | Caa1 | | | | 1,375,000 | | | | 1,381,875 | |
Reynolds Group Issuer, Inc. - Reynolds Group Issuer LLC2, 7.125%, 4/15/2019 | | | Ba3 | | | | 1,000,000 | | | | 1,017,500 | |
| | | | | | | | | | | | |
| | | | | | | | | | | 2,399,375 | |
| | | | | | | | | | | | |
| | | |
Metals & Mining - 0.9% | | | | | | | | | | | | |
Steel Dynamics, Inc., 7.75%, 4/15/2016 | | | Ba2 | | | | 1,300,000 | | | | 1,368,250 | |
| | | | | | | | | | | | |
Paper & Forest Products - 1.5% | | | | | | | | | | | | |
Georgia-Pacific LLC2, 8.25%, 5/1/2016 | | | Ba2 | | | | 2,115,000 | | | | 2,387,306 | |
| | | | | | | | | | | | |
Total Materials | | | | | | | | | | | 9,261,887 | |
| | | | | | | | | | | | |
Telecommunication Services - 6.4% | | | | | | | | | | | | |
Diversified Telecommunication Services - 4.2% | | | | | | | | | | | | |
Clearwire Communications LLC - Clearwire Finance, Inc.2, 12.00%, 12/1/2015 | | | B2 | | | | 1,000,000 | | | | 1,080,000 | |
Clearwire Communications LLC - Clearwire Finance, Inc.2, 12.00%, 12/1/2015 | | | B2 | | | | 275,000 | | | | 296,313 | |
Inmarsat Finance plc (United Kingdom)2, 7.375%, 12/1/2017 | | | Ba2 | | | | 1,500,000 | | | | 1,575,000 | |
Intelsat Subsidiary Holding Co. S.A. (Bermuda)2, 8.875%, 1/15/2015 | | | B3 | | | | 1,395,000 | | | | 1,426,387 | |
Wind Acquisition Finance S.A. (Luxembourg)2, 11.75%, 7/15/2017 | | | B2 | | | | 1,800,000 | | | | 2,029,500 | |
Wind Acquisition Finance S.A. (Luxembourg)2, 7.25%, 2/15/2018. | | | Ba2 | | | | 275,000 | | | | 279,813 | |
| | | | | | | | | | | | |
| | | | | | | | | | | 6,687,013 | |
| | | | | | | | | | | | |
| | | |
Wireless Telecommunication Services - 2.2% | | | | | | | | | | | | |
CC Holdings GS V LLC - Crown Castle GS III Corp.2, 7.75%, 5/1/2017 | | | Baa3 | | | | 1,315,000 | | | | 1,436,637 | |
| | |
| The accompanying notes are an integral part of the financial statements. | | 9 |
Investment Portfolio - December 31, 2010
| | | | | | | | | | | | |
| | | Credit
Rating
(unaudited) | | | Principal
Amount/
Shares | | | Value (Note 2) | |
| | | |
CORPORATE BONDS (continued) | | | | | | | | | | | | |
| | | |
Non-Convertible Corporate Bonds (continued) | | | | | | | | | | | | |
Telecommunication Services (continued) | | | | | | | | | | | | |
Wireless Telecommunication Services (continued) | | | | | | | | | | | | |
NII Capital Corp., 8.875%, 12/15/2019 | | | B2 | | | $ | 1,845,000 | | | $ | 1,987,987 | |
| | | | | | | | | | | | |
| | | | | | | | | | | 3,424,624 | |
| | | | | | | | | | | | |
Total Telecommunication Services | | | | | | | | | | | 10,111,637 | |
| | | | | | | | | | | | |
Utilities - 2.5% | | | | | | | | | | | | |
Gas Utilities - 1.0% | | | | | | | | | | | | |
Ferrellgas LP - Ferrellgas Finance Corp.2, 6.50%, 5/1/2021 | | | Ba3 | | | | 1,615,000 | | | | 1,574,625 | |
| | | | | | | | | | | | |
Independent Power Producers & Energy Traders - 1.5% | | | | | | | | | | | | |
Mirant Mid Atlantic Pass-Through Trust, Series B, 9.125%, 6/30/2017 | | | Ba1 | | | | 779,047 | | | | 837,476 | |
Mirant Mid Atlantic Pass-Through Trust, Series C, 10.06%, 12/30/2028 | | | Ba1 | | | | 477,404 | | | | 529,919 | |
North American Energy Alliance LLC - North American Energy Alliance Finance Corp.2, 10.875%, 6/1/2016 | | | Ba3 | | | | 945,000 | | | | 1,048,950 | |
| | | | | | | | | | | | |
| | | | | | | | | | | 2,416,345 | |
| | | | | | | | | | | | |
Total Utilities | | | | | | | | | | | 3,990,970 | |
| | | | | | | | | | | | |
TOTAL CORPORATE BONDS
(Identified Cost $137,487,774) | | | | | | | | | | | 144,049,455 | |
| | | | | | | | | | | | |
| | | |
PREFERRED STOCKS - 2.6% | | | | | | | | | | | | |
| | | |
Financials - 2.6% | | | | | | | | | | | | |
Commercial Banks - 0.9% | | | | | | | | | | | | |
Wells Fargo & Co., Series K6, 7.98% | | | Baa3 | | | | 1,335,000 | | | | 1,408,425 | |
| | | | | | | | | | | | |
Diversified Financial Services - 1.7% | | | | | | | | | | | | |
Bank of America Corp., Series K6, 8.00% | | | Ba3 | | | | 1,410,000 | | | | 1,420,998 | |
JPMorgan Chase & Co., Series 16, 7.90% | | | Baa1 | | | | 1,275,000 | | | | 1,355,312 | |
| | | | | | | | | | | | |
| | | | | | | | | | | 2,776,310 | |
| | | | | | | | | | | | |
TOTAL PREFERRED STOCKS
(Identified Cost $3,817,685) | | | | | | | | | | | 4,184,735 | |
| | | | | | | | | | | | |
MUTUAL FUNDS - 1.5% | | | | | | | | | | | | |
| | | |
iShares iBoxx High Yield Corporate Bond Fund
(Identified Cost $2,235,307) | | | | | | | 25,880 | | | | 2,336,705 | |
| | | | | | | | | | | | |
| | |
| 10 | | The accompanying notes are an integral part of the financial statements. |
Investment Portfolio - December 31, 2010
| | | | | | | | |
| | | Shares | | | Value (Note 2) | |
| | |
SHORT-TERM INVESTMENTS - 3.2% | | | | | | | | |
Dreyfus Cash Management, Inc. - Institutional Shares5, 0.14%,
(Identified Cost $5,143,661) | | | 5,143,661 | | | $ | 5,143,661 | |
| | | | | | | | |
TOTAL INVESTMENTS - 98.4%
Identified Cost $148,684,427) | | | | | | | 155,714,556 | |
OTHER ASSETS, LESS LIABILITIES - 1.6% | | | | | | | 2,466,755 | |
| | | | | | | | |
NET ASSETS - 100% | | | | | | $ | 158,181,311 | |
| | | | | | | | |
EUR - Euro currency
1Credit ratings from Moody’s (unaudited).
2Restricted securities - Investment in securities that are restricted as to public resale under the Securities Act of 1933, as amended. These securities have been sold under rule 144A and have been determined to be liquid under guidelines established by the Board of Directors. These securities amount to $56,255,865, or 35.6%, of the Series’ net assets as of December 31, 2010.
3Credit ratings from S&P (unaudited).
4The coupon rate is floating and is the stated rate as of December 31, 2010.
5Rate shown is the current yield as of December 31, 2010.
6The rate shown is the fixed rate as of December 31, 2010; the rate becomes floating in 2049.
| | |
| The accompanying notes are an integral part of the financial statements. | | 11 |
Statement of Assets and Liabilities
December 31, 2010
| | | | |
ASSETS: | | | | |
| |
Investments, at value (identified cost $148,684,427) (Note 2) | | $ | 155,714,556 | |
Interest receivable | | | 2,635,153 | |
Receivable for fund shares sold | | | 152,010 | |
Dividends receivable | | | 15,562 | |
| | | | |
| |
TOTAL ASSETS | | | 158,517,281 | |
| | | | |
| |
LIABILITIES: | | | | |
| |
Accrued management fees (Note 3) | | | 133,188 | |
Accrued fund accounting and administration fees (Note 3) | | | 7,725 | |
Accrued transfer agent fees (Note 3) | | | 1,510 | |
Accrued Chief Compliance Officer service fees (Note 3) | | | 243 | |
Accrued directors’ fees (Note 3) | | | 87 | |
Payable for fund shares repurchased | | | 133,941 | |
Audit fees payable | | | 34,834 | |
Other payables and accrued expenses | | | 24,442 | |
| | | | |
| |
TOTAL LIABILITIES | | | 335,970 | |
| | | | |
| |
TOTAL NET ASSETS | | $ | 158,181,311 | |
| | | | |
| |
NET ASSETS CONSIST OF: | | | | |
| |
Capital stock | | $ | 147,331 | |
Additional paid-in-capital | | | 150,540,151 | |
Undistributed net investment income | | | 21,255 | |
Accumulated net realized gain on investments, foreign currency and translation of other assets and liabilities | | | 442,370 | |
Net unrealized appreciation on investments, foreign currency and translation of other assets and liabilities | | | 7,030,204 | |
| | | | |
| |
TOTAL NET ASSETS | | $ | 158,181,311 | |
| | | | |
| |
NET ASSET VALUE, OFFERING PRICE AND REDEMPTION PRICE PER SHARE - Class A
($158,181,311/14,733,147 shares) | | $ | 10.74 | |
| | | | |
| | |
| 12 | | The accompanying notes are an integral part of the financial statements. |
Statement of Operations
For the Year Ended December 31, 2010
| | | | |
INVESTMENT INCOME: | | | | |
| |
Interest | | $ | 10,674,449 | |
Dividends | | | 744,228 | |
| | | | |
| |
Total Investment Income | | | 11,418,677 | |
| | | | |
| |
EXPENSES: | | | | |
| |
Management fees (Note 3) | | | 1,439,394 | |
Fund accounting and administration fees (Note 3) | | | 58,379 | |
Transfer agent fees (Note 3) | | | 10,384 | |
Directors’ fees (Note 3) | | | 9,336 | |
Chief Compliance Officer service fees (Note 3) | | | 2,675 | |
Custodian fees | | | 9,775 | |
Miscellaneous | | | 114,150 | |
| | | | |
| |
Total Expenses | | | 1,644,093 | |
Less reduction of expenses (Note 3) | | | (758 | ) |
| | | | |
| |
Net Expenses | | | 1,643,335 | |
| | | | |
| |
NET INVESTMENT INCOME | | | 9,775,342 | |
| | | | |
| |
REALIZED AND UNREALIZED GAIN (LOSS) ON INVESTMENTS AND FOREIGN CURRENCY: | | | | |
| |
Net realized gain (loss) on Investments | | | 3,928,488 | |
Foreign currency and translation of other assets and liabilities | | | (46,171 | ) |
| | | | |
| | | 3,882,317 | |
| | | | |
| |
Net change in unrealized appreciation on Investments | | | 4,695,592 | |
Foreign currency and translation of other assets and liabilities | | | 416 | |
| | | | |
| | | 4,696,008 | |
| | | | |
| |
NET REALIZED AND UNREALIZED GAIN ON INVESTMENTS AND FOREIGN CURRENCY | | | 8,578,325 | |
| | | | |
| |
NET INCREASE IN NET ASSETS RESULTING FROM OPERATIONS | | $ | 18,353,667 | |
| | | | |
| | |
| The accompanying notes are an integral part of the financial statements. | | 13 |
Statements of Changes in Net Assets
| | | | | | | | |
| | | For the Year Ended 12/31/10 | | | For the Period
9/14/091 to 12/31/09 | |
INCREASE (DECREASE) IN NET ASSETS: | | | | | | | | |
| | |
OPERATIONS: | | | | | | | | |
| | |
Net investment income | | | $ 9,775,342 | | | | $ 1,590,736 | |
Net realized gain on investments and foreign currency | | | 3,882,317 | | | | 450,110 | |
Net change in unrealized appreciation on investments and foreign Currency | | | 4,696,008 | | | | 2,334,196 | |
| | | | | | | | |
| | |
Net increase from operations | | | 18,353,667 | | | | 4,375,042 | |
| | | | | | | | |
| | |
DISTRIBUTIONS TO SHAREHOLDERS (Note 8): | | | | | | | | |
| | |
From net investment income | | | (10,050,478 | ) | | | (1,259,565 | ) |
From net realized gain on investments | | | (3,847,008 | ) | | | (88,925 | ) |
| | | | | | | | |
| | |
Total distributions to shareholders | | | (13,897,486 | ) | | | (1,348,490 | ) |
| | | | | | | | |
| | |
CAPITAL STOCK ISSUED AND REPURCHASED: | | | | | | | | |
| | |
Net increase from capital share transactions (Note 5) | | | 26,046,907 | | | | 124,651,671 | |
| | | | | | | | |
| | |
Net increase in net assets | | | 30,503,088 | | | | 127,678,223 | |
| | |
NET ASSETS: | | | | | | | | |
| | |
Beginning of period | | | 127,678,223 | | | | — | |
| | | | | | | | |
| | |
End of period (including undistributed net investment income of $21,255 and $325,982, respectively) | | | $158,181,311 | | | | $127,678,223 | |
| | | | | | | | |
| 1Commencement | of operations. |
| | |
| 14 | | The accompanying notes are an integral part of the financial statements. |
Financial Highlights
| | | | | | | | |
| | | For the Year
Ended
12/31/10 | | | For the Period
9/14/091to
12/31/09 | |
Per share data (for a share outstanding throughout each period): | | | | | | | | |
Net asset value - Beginning of period | | | $10.37 | | | | $10.00 | |
| | | | | | | | |
| | |
Income from investment operations: | | | | | | | | |
Net investment income2 | | | 0.75 | | | | 0.20 | |
Net realized and unrealized gain on investments | | | 0.66 | | | | 0.28 | |
| | | | | | | | |
| | |
Total from investment operations | | | 1.41 | | | | 0.48 | |
| | | | | | | | |
Less distributions to shareholders: | | | | | | | | |
From net investment income | | | (0.75) | | | | (0.10) | |
From net realized gain on investments | | | (0.29) | | | | (0.01) | |
| | | | | | | | |
Total distributions to shareholders | | | (1.04) | | | | (0.11) | |
| | | | | | | | |
Net asset value - End of period | | | $10.74 | | | | $10.37 | |
| | | | | | | | |
Net assets - End of period (000’s omitted) | | | $158,181 | | | | $127,678 | |
| | | | | | | | |
Total return3 | | | 13.59% | | | | 4.82% | |
Ratios (to average net assets)/ Supplemental Data: | | | | | | | | |
Expenses* | | | 1.14% | | | | 1.20%4 | |
Net investment income | | | 6.79% | | | | 6.51%4 | |
Portfolio turnover | | | 54% | | | | 22% | |
|
*The investment advisor did not impose all or a portion of its management fees, CCO fees, fund accounting and transfer agent fees and other fees in some periods and in some periods paid a portion of the Series’ expenses. If these expenses had been incurred by the Series, the expense ratio (to average net assets) would have been increased by the following amounts: | |
| | | 0.00%5 | | | | 0.02%4 | |
1Commencement of operations.
2Calculated based on average shares outstanding during the year.
3Represents aggregate total return for the periods indicated, and assumes reinvestment of all distributions. Total return would have been lower had certain expenses not been waived or reimbursed during the periods. Periods less than one year are not annualized.
4Annualized.
5Less than 0.01%.
| | |
| The accompanying notes are an integral part of the financial statements. | | 15 |
Notes to Financial Statements
High Yield Bond Series (the “Series”) is a no-load non-diversified series of Manning & Napier Fund, Inc. (the “Fund”). The Fund is organized in Maryland and is registered under the Investment Company Act of 1940, as amended, as an open-end management investment company.
The Series’ investment objective is to provide a high level of long-term total return by investing principally in non-investment grade fixed income securities that are issued by government and corporate entities.
The Fund’s Advisor is Manning & Napier Advisors, Inc. (the “Advisor”). On September 14, 2009 the Series resumed sales of shares to advisory clients and employees of the Advisor and its affiliates and directly to investors. The total authorized capital stock of the Fund consists of 10.0 billion shares of common stock each having a par value of $0.01. As of December 31, 2010, 6.2 billion shares have been designated in total among 29 series, of which 125 million have been designated as High Yield Bond Series Class A common stock.
| 2. | SIGNIFICANT ACCOUNTING POLICIES |
Security Valuation
Portfolio securities, including domestic equities, foreign equities, warrants and options, listed on an exchange other than the NASDAQ National Market System are valued at the latest quoted sales price of the exchange on which the security is primarily traded. Securities not traded on valuation date or securities not listed on an exchange are valued at the latest quoted bid price provided by the Fund’s pricing service. Securities listed on the NASDAQ National Market System are valued in accordance with the NASDAQ Official Closing Price.
Debt securities, including government bonds, foreign bonds, asset-backed securities, structured notes, supranational obligations, sovereign bonds, corporate bonds and mortgage-backed securities will normally be valued on the basis of evaluated bid prices provided directly by an independent pricing service. The pricing services use multiple valuation techniques to determine fair value. In instances where sufficient market activity exists, the pricing services may utilize a market-based approach through which quotes from market makers are used to determine fair value. In instances where sufficient market activity may not exist or is limited, the pricing services also utilize proprietary valuation models which may consider market characteristics such as benchmark yield curves, option-adjusted spreads, credit spreads, estimated default rates, coupon rates, anticipated timing of principal repayments, underlying collateral, and other unique security features in order to estimate the relevant cash flows, which are then discounted to calculate the fair value. Certain investments in securities held by the Series may be valued on a basis of a price provided directly by a principal market maker. These prices may differ from the value that would have been used had a broader market for securities existed.
Short-term investments that mature in sixty days or less are valued at amortized cost, which approximates market value. Investments in open-end investment companies are valued at their net asset value per share on valuation date.
Volume and level of activity in established markets for an asset or liability are evaluated to determine whether recent transactions and quoted prices are determinative of fair value. Where there have been significant decreases in volume and level of activity, further analysis and adjustment may be necessary to estimate fair value. The Series measures fair value in these instances by the use of inputs and valuation techniques which may be based upon current market prices of securities that are comparable in coupon, rating, maturity and industry and/or expectation of future cash flows. As a result of trading in relatively thin markets and/or markets that experience significant volatility, the prices used by the Series to value these securities may differ from the value that would be realized if these securities were sold, and the differences could be material.
Securities for which representative valuations or prices are not available from the Fund’s pricing service may be valued at fair value. Due to the inherent uncertainty of valuations of such securities, the fair value may differ significantly
Notes to Financial Statements
| 2. | SIGNIFICANT ACCOUNTING POLICIES (continued) |
Security Valuation (continued)
from the values that would have been used had a ready market for such securities existed. If trading or events occurring after the close of the principal market in which securities are traded are expected to materially affect the value of those securities, then they may be valued at their fair value, taking this trading or these events into account. Fair value is determined in good faith by the Advisor under procedures approved by and under the general supervision and responsibility of the Fund’s Board of Directors (the “Board”).
Various inputs are used in determining the value of the Series’ assets or liabilities carried at market value. These inputs are summarized in three broad levels. Level 1 includes quoted prices in active markets for identical assets and liabilities. Level 2 includes other significant observable inputs (including quoted prices for similar securities, interest rates, prepayment speeds, credit risk, etc.). Level 3 includes significant unobservable inputs (including the Series’ own assumptions in determining the fair value of investments). The inputs or methodology used for valuing securities are not necessarily an indication of the risk associated with investing in those securities.
The following is a summary of the valuation levels used for major security types as of December 31, 2010 in valuing the Series’ assets or liabilities carried at market value:
| | | | | | | | | | | | | | | | |
Description | | Total | | | Level 1 | | | Level 2 | | | Level 3 | |
Assets: | | | | | | | | | | | | | | | | |
Equity securities* | | $ | — | | | $ | — | | | $ | — | | | $ | — | |
Preferred securities | | | 4,184,735 | | | | — | | | | 4,184,735 | | | | — | |
Debt securities: | | | | | | | | | | | | | | | | |
U.S. Treasury and other U.S. Government agencies | | | — | | | | — | | | | — | | | | — | |
States and political subdivisions (municipals) | | | — | | | | — | | | | — | | | | — | |
Corporate debt | | | 144,049,455 | | | | | | | | 144,049,455 | | | | — | |
Convertible corporate debt | | | — | | | | — | | | | — | | | | — | |
Asset backed securities | | | — | | | | — | | | | — | | | | — | |
Commercial mortgage backed securities | | | — | | | | — | | | | — | | | | — | |
Mutual funds | | | 7,480,366 | | | | 7,480,366 | | | | — | | | | — | |
Other financial instruments**: | | | — | | | | — | | | | — | | | | — | |
| | | | | | | | | | | | | | | | |
Total assets | | | 155,714,556 | | | | 7,480,366 | | | | 148,234,190 | | | | — | |
| | | | | | | | | | | | | | | | |
Liabilities: | | | | | | | | | | | | | | | | |
Other financial instruments**: | | | — | | | | — | | | | — | | | | — | |
| | | | | | | | | | | | | | | | |
Total liabilities: | | | — | | | | — | | | | — | | | | — | |
| | | | | | | | | | | | | | | | |
Total: | | $ | 155,714,556 | | | $ | 7,480,366 | | | $ | 148,234,190 | | | $ | — | |
| | | | | | | | | | | | | | | | |
Notes to Financial Statements
| 2. | SIGNIFICANT ACCOUNTING POLICIES (continued) |
Security Valuation (continued)
The following table is a reconciliation of Level 3 investments for which significant unobservable inputs were used to determine fair value:
| | | | |
| Level 3 Reconciliation | | Corporate
Debt | |
Balance as of December 31, 2009 (market value) | | $ | 1,239,608 | |
Accrued discounts/premiums | | | 9,095 | |
Change in unrealized appreciation/depreciation | | | (14,603 | ) |
Net realized gain | | | 155,747 | |
Net purchases/sales | | | (1,389,847 | ) |
| | | | |
Balance as of December 31, 2010 (market value) | | $ | — | |
| | | | |
*Includes common stock, warrants and rights. Please see the Investment Portfoilio for industry classification.
**Other financial instruments are derivative instruments not reflected in the Investment Portfolio, such as futures, forwards and swap contracts, which are valued at the unrealized appreciation/depreciation on the instrument. As of December 31, 2010, the Series did not hold any derivative instruments.
There were no Level 3 securities held by the Series as of December 31, 2010.
The Fund’s policy is to recognize transfers in and transfers out of the valuation levels as of the beginning of the reporting period. There were no significant transfers between Level 1 and Level 2 during the year ended December 31, 2010.
Additional disclosure surrounding the activity in Level 3 fair value measurement will also be effective for fiscal years beginning after December 15, 2010. Management has concluded that this will not have a material impact on the Series’ financial statements.
Security Transactions, Investment Income and Expenses
Security transactions are accounted for on trade date. Dividend income is recorded on the ex-dividend date, except that if the ex-dividend date has passed, certain dividends from foreign securities are recorded as soon as the Fund is informed of the ex-dividend date. Non-cash dividends, if any, are recorded at the fair market value of the securities received. Interest income, including amortization of premium and accretion of discounts using the effective interest method, is earned from settlement date and accrued daily.
Expenses are recorded on an accrual basis. Most expenses of the Fund can be attributed to a specific series. Expenses which cannot be directly attributed are apportioned among the series in the Fund in such a manner as deemed equitable by the Fund’s Board, taking into consideration, among other things, the nature and type of expense.
The Series uses the identified cost method for determining realized gain or loss on investments for both financial statement and federal income tax reporting purposes.
Foreign Currency Translation
The books and records of the Series are maintained in U.S. dollars. Foreign currencies, investments and other assets and liabilities are translated into U.S. dollars at the current exchange rates. Purchases and sales of investment securities and income and expenses are translated on the respective dates of such transactions. The Series do not isolate realized and unrealized gains and losses attributable to changes in the exchange rates from gains and losses that arise from changes in the market value of investments. Such fluctuations are included with net realized and
Notes to Financial Statements
| 2. | SIGNIFICANT ACCOUNTING POLICIES (continued) |
Foreign Currency Translation (continued)
unrealized gain or loss on investments. Net realized foreign currency gains and losses represent foreign currency gains and losses between trade date and settlement date on securities transactions, gains and losses on disposition of foreign currencies and the difference between the amount of income and foreign withholding taxes recorded on the books of the Series and the amounts actually received or paid.
Restricted Securities
Restricted securities are purchased in private placement transactions, are not registered under the Securities Act of 1933, as amended, and may have contractual restrictions on resale. Information regarding restricted securities is included at the end of the Series’ Investment Portfolio.
Illiquid Securities
A security may be considered illiquid if so deemed in good faith by the Advisor under procedures approved by and under the general supervision and responsibility of the Fund’s Board. Securities that are illiquid are marked with the applicable footnote on the Investment Portfolio. No such investments were held by the Series on December 31, 2010.
Federal Taxes
The Series’ policy is to comply with the provisions of the Internal Revenue Code applicable to regulated investment companies. The Series is not subject to federal income tax or excise tax to the extent that the Series distributes to shareholders each year its taxable income, including any net realized gains on investments, in accordance with requirements of the Internal Revenue Code. Accordingly, no provision for federal income tax or excise tax has been made in the financial statements.
Management evaluates its tax positions to determine if the tax positions taken meet the minimum recognition threshold in connection with accounting for uncertainties in income tax positions taken or expected to be taken for the purposes of measuring and recognizing tax liabilities in the financial statements. Recognition of tax benefits of an uncertain tax position is required only when the position is “more likely than not” to be sustained assuming examination by taxing authorities. At December 31, 2010, the Series has recorded no liability for net unrecognized tax benefits relating to uncertain income tax positions taken or expected to be taken in future tax returns.
The Series files income tax returns in the U.S. federal jurisdiction, various states and foreign jurisdictions, as required. No income tax returns are currently under investigation. The statute of limitations on the Series’ tax returns remains open for the period ended December 31, 2009 through the year ended December 31, 2010. The Fund is not aware of any tax positions for which it is reasonably possible that the total amounts of unrecognized tax benefits will significantly change in the next twelve months.
Additionally, based on the Fund’s understanding of the tax rules and rates related to income, gains and transactions for foreign jurisdictions in which it invests, the Series will provide for foreign taxes, and where appropriate, deferred foreign tax.
Distributions of Income and Gains
Distributions to shareholders of net investment income and net realized gains are made annually. An additional distribution may be necessary to avoid taxation of the Series. Distributions are recorded on the ex-dividend date.
Indemnifications
The Fund’s organizational documents provide former and current directors and officers with a limited indemnification against liabilities arising in connection with the performance of their duties to the Fund. In the normal course of business, the Fund may also enter into contracts that provide general indemnifications. The Fund’s maximum exposure
Notes to Financial Statements
| 2. | SIGNIFICANT ACCOUNTING POLICIES (continued) |
Indemnifications (continued)
under these arrangements is unknown as this would be dependent on future claims that may be made against the Fund. The risk of material loss from such claims is considered remote.
Other
The preparation of financial statements in conformity with accounting principles generally accepted in the United States of America requires management to make estimates and assumptions that affect the reported amounts of assets and liabilities and the disclosure of contingent assets and liabilities at the date of the financial statements and the reported amounts of income and expenses during the reporting period. Actual results could differ from those estimates.
| 3. | TRANSACTIONS WITH AFFILIATES |
The Fund has an Investment Advisory Agreement (the “Agreement”) with the Advisor, for which the Series pays a fee, computed daily and payable monthly, at an annual rate of 1.00% of the Series’ average daily net assets.
Under the Agreement, personnel of the Advisor provide the Series with advice and assistance in the choice of investments and the execution of securities transactions, and otherwise maintain the Series’ organization. The Advisor also provides the Fund with necessary office space and fund administration and support services. The salaries of all officers of the Fund (except a percentage of the Fund’s Chief Compliance Officer’s salary, which is paid by the Fund), and of all Directors who are “affiliated persons” of the Fund, or of the Advisor, and all personnel of the Fund, or of the Advisor, performing services relating to research, statistical and investment activities, are paid by the Advisor. Each “non-affiliated” Director receives an annual stipend, which is allocated among all the active series of the Fund. In addition, these Directors also receive a fee per Board meeting attended plus a fee for each committee meeting attended.
The Advisor has contractually agreed, until at least April 30, 2012, to waive its fee and, if necessary, pay other operating expenses of the Series in order to maintain total direct annual fund operating expenses for the Series at no more than 1.20% of average daily net assets each year. For the year ended December 31, 2010, the Advisor voluntarily waived fees of $758, which is included as a reduction of expenses on the Statement of Operations. The Advisor is not eligible to recoup any expenses that have been waived or reimbursed in prior years.
Manning & Napier Investor Services, Inc., a registered broker-dealer affiliate of the Advisor, acts as distributor for the Fund’s shares. The services of Manning & Napier Investor Services, Inc. are provided at no additional cost to the Series.
The Advisor has agreements with PNC Global Investment Servicing (U.S.) Inc. (“PNCGIS”) under which PNCGIS serves as sub-accountant services agent and sub-transfer agent. The Fund pays the Advisor an annual fee related to fund accounting and administration of 0.0175% on the first $3 billion of average daily net assets (excluding Target Series); 0.015% on the next $3 billion of average daily net assets (excluding Target Series); and 0.01% of the average daily net assets in excess of $6 billion (excluding Target Series); plus a base fee of $25,500 per Series. Transfer Agent fees are charged to the Fund on a per account basis. Additionally, certain transaction- and cusip-based fees and out-of-pocket expenses, including charges for reporting relating to the Fund’s compliance program, are charged.
Effective July 1, 2010, PNCGIS was sold to The Bank of New York Mellon Corporation, the Series’ custodian. At the close of the sale, PNCGIS changed its name to BNY Mellon Investment Servicing (U.S.) Inc. (“BNY”).
Expenses not directly attributable to a Series are allocated based on each Series’ relative net assets or number of accounts, depending on the expense.
Notes to Financial Statements
| 4. | PURCHASES AND SALES OF SECURITIES |
For the year ended December 31, 2010, purchases and sales of securities, other than U.S. Government securities and short-term securities, were $93,215,114 and $74,388,312, respectively. There were no purchases or sales of U.S. Government securities.
| 5. | CAPITAL STOCK TRANSACTIONS |
Transactions in shares of High Yield Bond Series were:
| | | | | | | | | | | | | | | | |
| | | For the Year Ended 12/31/10 | | | For the period 9/14/09 (commencement of operations) to 12/31/09 | |
| | | Shares | | | Amount | | | Shares | | | Amount | |
Sold | | | 2,275,341 | | | $ | 24,816,656 | | | | 12,442,729 | | | $ | 125,933,491 | |
Reinvested | | | 1,258,376 | | | | 13,463,941 | | | | 126,129 | | | | 1,296,610 | |
Repurchased | | | (1,117,255 | ) | | | (12,233,690 | ) | | | (252,173 | ) | | | (2,578,430 | ) |
| | | | | | | | | | | | | | | | |
Total | | | 2,416,462 | | | $ | 26,046,907 | | | | 12,316,685 | | | $ | 124,651,671 | |
| | | | | | | | | | | | | | | | |
Substantially all of the Series’ shares represent investments by fiduciary accounts over which the Advisor has sole investment discretion.
The Series may trade in instruments including written and purchased options, forward foreign currency exchange contracts and futures contracts and other derivatives in the normal course of investing activities to assist in managing exposure to various market risks. Investments in these instruments may subject the Series to various elements of risk, which may involve, to a varying degree, elements of risk in excess of the amounts recognized for financial statement purposes. These risks include: the risk that changes in the value of a derivative may not correlate perfectly with the underlying asset, rate or index, counterparty credit risk related to over the counter derivatives counterparties’ failure to perform under contract terms, liquidity risk related to the lack of a liquid market for these contracts allowing the fund to close out its position(s) and documentation risk relating to disagreement over contract terms. No such investments were held by the Series during the year ended December 31, 2010.
Investing in securities of foreign companies and foreign governments involves special risks and considerations not typically associated with investing in securities of domestic companies and the U.S. Government. These risks include revaluation of currencies and future adverse political and economic developments. Moreover, securities of foreign companies and foreign governments and their markets may be less liquid and their prices more volatile than those of comparable domestic companies and the U.S. Government.
| 8. | FEDERAL INCOME TAX INFORMATION |
The amount and characterization of certain income and capital gains to be distributed are determined in accordance with federal income tax regulations, which may differ from accounting principles generally accepted in the United States of America. These differences are primarily due to differing book and tax treatments in the timing of the recognition of net investment income or gains and losses, including foreign currency gains, losses and investments in hybrid securities, disallowed expenses and post-October losses. The Series may periodically make reclassifications among its capital accounts to reflect income and gains available for distribution (or available capital loss carryovers)
Notes to Financial Statements
| 8. | FEDERAL INCOME TAX INFORMATION (continued) |
under income tax regulations without impacting the Series’ net asset value. Any such reclassifications are not reflected in the financial highlights.
The tax character of distributions paid were as follows:
| | | | | | | | |
| | | For the Year Ended 12/31/10 | | | For the Period Ended 12/31/09* | |
Ordinary income | | $ | 13,587,061 | | | $ | 1,348,490 | |
Long-term capital gains | | | 310,425 | | | | — | |
* The Series commenced operations on September 14, 2009.
At December 31, 2010, the tax basis of distributable earnings and the net unrealized appreciation based on identified cost for federal income tax purposes were as follows:
| | | | | | | | |
Cost for federal income tax purposes | | | $ 148,763,047 | | | | | |
Unrealized appreciation | | | $ 7,234,162 | | | | | |
Unrealized depreciation | | | (282,653 | ) | | | | |
| | | | | | | | |
Net unrealized appreciation | | | $ 6,951,509 | | | | | |
| | | | | | | | |
Undistributed ordinary income | | | 275,283 | | | | | |
Undistributed long-term gains | | | 167,087 | | | | | |
Report of Independent Registered Public Accounting Firm
To the Board of Directors of Manning & Napier Fund, Inc. and Shareholders of High Yield Bond Series:
In our opinion, the accompanying statement of assets and liabilities, including the investment portfolio, and the related statements of operations and of changes in net assets and the financial highlights present fairly, in all material respects, the financial position of the High Yield Bond Series (a series of Manning & Napier Fund, Inc., hereafter referred to as the “Series”) at December 31, 2010, and the results of its operations for the year then ended and the changes in its net assets and the financial highlights for the year ended and the period September 14, 2009 (commencement of operations) through December 31, 2009, in conformity with accounting principles generally accepted in the United States of America. These financial statements and financial highlights (hereafter referred to as “financial statements”) are the responsibility of the Series’ management. Our responsibility is to express an opinion on these financial statements based on our audits. We conducted our audits of these financial statements in accordance with the standards of the Public Company Accounting Oversight Board (United States). Those standards require that we plan and perform the audit to obtain reasonable assurance about whether the financial statements are free of material misstatement. An audit includes examining, on a test basis, evidence supporting the amounts and disclosures in the financial statements, assessing the accounting principles used and significant estimates made by management, and evaluating the overall financial statement presentation. We believe that our audits, which included confirmation of securities at December 31, 2010 by correspondence with the custodian, provide a reasonable basis for our opinion.
New York, New York
February 22, 2011
Supplemental Tax Information (unaudited)
All designations are based on financial information available as of the date of this annual report and, accordingly are subject to change.
For federal income tax purposes, the Series designates for the current fiscal period $322,621 or, if different, the maximum amount allowable under the tax law as qualified dividend income.
Pursuant to Section 852 of the Internal Revenue Code, as amended, the Series hereby designates $310,425 as capital gains for its taxable year ended December 31, 2010, or if different, the maximum allowable under tax law.
For corporate shareholders, the percentage of investment income (dividend income plus short-term gains, if any) that qualifies for the dividends received deduction for the current fiscal period is 2.37%, or if different, the maximum allowable under tax law.
Renewal of Investment Advisory Agreement (unaudited)
At the Manning & Napier Fund, Inc. (the “Fund”) Board of Directors’ (the “Board”) meeting, held on November 17, 2010, the Investment Advisory Agreement (the “Agreement”) between the Fund and Manning & Napier Advisors, Inc. (the “Advisor”) was reviewed by the Board for renewal. In connection with the decision whether to renew the Agreement, a variety of material was prepared for and reviewed by the Board.
Representatives of the Advisor attended the meeting and presented additional oral and written information to the Board to assist the Board in its considerations. The discussion immediately below outlines the materials and information presented to the Board in connection with the Board’s 2010 Annual Review of the Agreement and the conclusions made by the Directors when determining to continue the Agreement.
| | • | | The Board considered the services provided by the Advisor under the Agreement including, among others: deciding what securities to purchase and sell for each Series; arranging for the purchase and sale of such securities by placing orders with broker-dealers; administering the affairs of the Fund (including the books and records of the Fund not maintained by third party service providers such as the custodian or sub-transfer agent); arranging for the insurance coverage for the Fund; and supervising the preparation of tax returns, SEC filings (including registration statements) and reports to shareholders for the Fund. The Board also considered the nature and quality of such services provided under the Agreement in light of the Advisor’s services provided to the Fund for 24 years. The Board discussed the quality of these services with representatives from the Advisor and concluded that the Advisor was performing its services to the Fund required under the Agreement in a reasonable manner. |
| | • | | The Board considered the investment performance of the various Series of the Fund. The investment performance for each Series was reviewed on a cumulative basis since inception and on a one year basis. In addition, annualized performance for the following time periods was considered: inception, three year, five year, ten year, and current market cycle. A market cycle includes periods of both rising and falling markets. Returns for established benchmark indices for each Series were provided for each time period. The Board noted that the various Series were competitive against their respective benchmarks and/or peer groups over various time periods, but in particular over the full market cycle period relevant for the Series. In addition, the Board considered at the meeting (and considers on a quarterly basis) a peer group performance analysis consisting of Morningstar universes of mutual funds with similar investment objectives. The Board discussed the performance with representatives from the Advisor and concluded that the investment performance of each of the Fund’s Series was reasonable based on the Fund’s actual performance and comparative performance, especially performance over the current market cycle. |
| | • | | The Board considered the costs of the Advisor’s services and the profits of the Advisor as they relate to the Advisor’s services to the Fund under the Agreement. In reviewing the Advisor’s costs and profits, the Board discussed the Advisor’s revenues generated from the Fund (on both an actual and adjusted basis) and its expenses associated with providing the services under the Agreement. In addition, the Board reviewed the Advisor’s expenses associated with Fund activities outside of the Agreement (such as expense reimbursements pursuant to expense caps and payments made by the Advisor to third party platforms on which shares of the Fund are available for purchase). It was noted by representatives of the Advisor that 11 of the 27 active Series of the Fund are currently experiencing expenses above the capped expense ratios. After discussing the above costs and profits, the Board concluded that the Advisor’s profitability relating to its services provided under the Agreement was reasonable. |
| | • | | The Board considered the fees and expenses of the various Series of the Fund. The Advisor presented the advisory fees and total expenses for each Series, including the advisory fee adjusted for any expense waivers or reimbursements (either contractual or voluntary) paid by the Advisor. The advisory fees and expense ratios of each Series were compared to an average (on both a mean and median basis) of similar funds as disclosed on the Morningstar database. Representatives of the Advisor discussed with the Board the levels of its advisory |
Renewal of Investment Advisory Agreement (unaudited)
| | fee for each Series of the Fund and as compared to the median and mean advisory fees for similar funds as listed on Morningstar. Expense ratios for every Series, except the Pro-Blend’s Class R and Class C, and Target Class R and Class C, are currently below the median and mean for similar funds as listed on Morningstar. Based on their review of the information provided, the Board concluded that the fees and expenses of each Series of the Fund were reasonable on a comparative basis. |
| | • | | The Board also considered the other benefits the Advisor derives from its relationship with the Fund. Such other benefits include certain research products provided by soft dollars. Given the level of soft dollar transactions involving the Fund, the Board concluded that these additional benefits to the Advisor were reasonable. |
| | • | | In addition to the factors described above, the Board considered the Advisor’s personnel, investment strategies, policies and procedures relating to compliance with personal securities transactions, and reputation, expertise and resources in domestic and foreign financial markets. The Board concluded that these factors support the conclusion that the Advisor performs its services in a reasonable manner. |
| | • | | The Board did not consider economies of scale at this time because of the multiple uses of the Fund (for the Advisor’s discretionary investment account clients in addition to direct investors), the current profitability of the Advisor’s services to the Fund under the Agreement, and the overall size of the Fund complex. |
Based on the Board’s deliberations and their evaluation of the information described above, the Board, including a majority of Directors that are not “interested persons” as defined in the Investment Company Act of 1940, concluded that the compensation under the Agreement was fair and reasonable in light of the services and expenses and such other matters as the Directors considered to be relevant in the exercise of their reasonable judgment. Accordingly, the Board approved the renewal of the Agreement. In the course of their deliberations, the Directors did not identify any particular information that was all important or controlling.
Directors’ and Officers’ Information (unaudited)
The Statement of Additional Information provides additional information about the Fund’s directors and officers and can be obtained without charge by calling 1-800-466-3863, at www.manningnapieradvisors.com, or on the EDGAR Database on the SEC Internet web site (http:// www.sec.gov). The following chart shows certain information about the Fund’s officers and directors, including their principal occupations during the last five years. Unless specific dates are provided, the individuals have held the listed positions for longer than five years.
| | |
INTERESTED DIRECTOR/OFFICER | | |
Name: | | B. Reuben Auspitz* |
Address: | | 290 Woodcliff Drive |
| | Fairport, NY 14450 |
Age: | | 63 |
Current Position(s) Held with Fund: | | Principal Executive Officer, President, Chairman & Director |
Term of Office1 & Length of Time Served: | | Indefinite - Director since 1984; Vice President 1984 - 2003; President |
| | since 2004; Principal Executive Officer since 2002 |
Principal Occupation(s) During Past 5 Years: | | Executive Vice President; Executive Group Member**; Chief Compliance |
| | Officer since 2004; Vice Chairman since June 2010; Co-Executive |
| | Director from 2003-2010 - Manning & Napier Advisors, Inc. President; |
| | Director - Manning & Napier Investor Services, Inc. |
| | Holds or has held one or more of the following titles for various |
| | subsidiaries and affiliates: President, Vice President, Director, Chairman, |
| | Treasurer, Chief Compliance Officer or Member. |
Number of Portfolios Overseen within Fund Complex: | | 29 |
Other Directorships Held Outside Fund Complex: | | N/A |
INDEPENDENT DIRECTORS | | |
Name: | | Paul A. Brooke |
Address: | | 290 Woodcliff Drive |
| | Fairport, NY 14450 |
Age: | | 65 |
Current Position(s) Held with Fund: | | Director, Audit Committee Member, Governance & Nominating |
| | Committee Member |
Term of Office & Length of Time Served: | | Indefinite - Since 2007 |
Principal Occupation(s) During Past 5 Years: | | Chairman & CEO, Alsius Corp. (investments); Managing Member, PMSV |
| | Holdings LLC (investments) |
Number of Portfolios Overseen within Fund Complex: | | 29 |
Other Directorships Held Outside Fund Complex: | | Incyte Corp. (2000-present) |
| | ViroPharma, Inc. (2000-present) |
| | HLTH Corp. (2000-present) |
| | Cheyne Capital International (2000-present) |
| | MPM Bio-equities (2000-present) |
| | GMP Companies (2000-present) |
| | | HoustonPharma (2000-present) |
Name: | | Richard M. Hurwitz |
Address: | | 290 Woodcliff Drive |
| | Fairport, NY 14450 |
Age: | | 47 |
Current Position(s) Held with Fund: | | Director, Audit Committee Member, Governance & Nominating |
| | Committee Member |
Term of Office & Length of Time Served: | | Indefinite - Since 2009 |
Principal Occupation(s) During Past 5 Years: | | Chief Executive Officer, Pictometry International Corp. since August 2010 |
| | (provider of georeferenced, aerial image libraries and related software) |
| | Managing Partner (2006-July 2010) - Aegis Investment Partners, LLC |
| | (investments); Founder and Managing Partner (2004-2005) - Village |
| | Markets, LLC (groceries) |
Number of Portfolios Overseen within Fund Complex: | | 29 |
Other Directorships Held Outside Fund Complex: | | Pictometry International Corp. (2000-2010) |
| | Pioneering Technologies (2006-2009) |
| | | Vensearch Capital Corp. (2003-2007) |
Directors’ and Officers’ Information (unaudited)
| | |
| INDEPENDENT DIRECTORS (continued) |
Name: | | Stephen B. Ashley |
Address: | | 290 Woodcliff Drive |
| | Fairport, NY 14450 |
Age: | | 70 |
Current Position(s) Held with Fund: | | Director, Audit Committee Member, Governance & Nominating |
| | Committee Member |
Term of Office & Length of Time Served: | | Indefinite - Since 1996 |
Principal Occupation(s) During Past 5 Years: | | Chairman, Director, President & Chief Executive Officer, The Ashley |
| | Group (property management and investment). Chairman |
| | (non-executive) 2004-2008; Director 1995-2008 - Fannie Mae (mortgage) |
Number of Portfolios Overseen within Fund Complex: | | 29 |
Other Directorships Held Outside Fund Complex: | | The Ashley Group (1995-2008) |
| | | Genesee Corporation (1987-2007) |
Name: | | Peter L. Faber |
Address: | | 290 Woodcliff Drive |
| | Fairport, NY 14450 |
Age: | | 72 |
Current Position(s) Held with Fund: | | Director, Governance & Nominating Committee Member |
Term of Office & Length of Time Served: | | Indefinite - Since 1987 |
Principal Occupation(s) During Past 5 Years: | | Senior Counsel since 2006, Partner (1995 - 2006) - McDermott, Will & |
| | Emery LLP (law firm) |
Number of Portfolios Overseen within Fund Complex: | | 29 |
Other Directorships Held Outside Fund Complex: | | Partnership for New York City, Inc. (non-profit) |
| | New York Collegium (non-profit) |
| | | Boston Early Music Festival (non-profit) |
Name: | | Harris H. Rusitzky |
Address: | | 290 Woodcliff Drive |
| | Fairport, NY 14450 |
Age: | | 76 |
Current Position(s) Held with Fund: | | Director, Audit Committee Member, Governance & Nominating |
| | Committee Member |
Term of Office & Length of Time Served: | | Indefinite - Since 1985 |
Principal Occupation(s) During Past 5 Years: | | President, The Greening Group (business consultants) since 1994; |
| | Partner, The Restaurant Group (restaurants) since 2006 |
Number of Portfolios Overseen within Fund Complex: | | 29 |
Other Directorships Held Outside Fund Complex: | | N/A |
OFFICERS | | |
Name: | | Jeffrey S. Coons, Ph.D., CFA |
Address: | | 290 Woodcliff Drive |
| | Fairport, NY 14450 |
Age: | | 47 |
Current Position(s) Held with Fund: | | Vice President |
Term of Office1 & Length of Time Served: | | Since 2004 |
Principal Occupation(s) During Past 5 Years: | | President since 2010, Co-Director of Research since 2002, Executive |
| | Group Member** since 2003, - Manning & Napier Advisors, Inc. |
| | Holds one or more of the following titles for various subsidiaries and |
| | affiliates: President, Director, Treasurer or Senior Trust Officer. |
Number of Portfolios Overseen within Fund Complex: | | 29 |
Other Directorships Held Outside Fund Complex: | | N/A |
Directors’ and Officers’ Information (unaudited)
| | |
OFFICERS (continued) | | |
Name: | | Beth Galusha |
Address: | | 290 Woodcliff Drive |
| | Fairport, NY 14450 |
Age: | | 49 |
Current Position(s) Held with Fund: | | Assistant Chief Financial Officer |
Term of Office1 & Length of Time Served: | | Assistant Chief Financial Officer since 2010 |
Principal Occupation(s) During Past 5 Years: | | Chief Financial Officer and Treasurer, Manning & Napier Advisors, Inc. |
| | Holds one or more of the following titles for various affiliates: Chief |
| | Financial Officer, Director, or Treasurer |
Number of Portfolios Overseen within Fund Complex: | | 29 |
Other Directorships Held Outside Fund Complex: | | N/A |
Name: | | Christine Glavin |
Address: | | 290 Woodcliff Drive |
| | Fairport, NY 14450 |
Age: | | 44 |
Current Position(s) Held with Fund: | | Principal Financial Officer, Chief Financial Officer |
Term of Office1 & Length of Time Served: | | Principal Financial Officer since 2002; Chief Financial Officer since 2001 |
Principal Occupation(s) During Past 5 Years: | | Fund Reporting Manager, Manning & Napier Advisors, Inc. since 1997 |
Number of Portfolios Overseen within Fund Complex: | | 29 |
Other Directorships Held Outside Fund Complex: | | N/A |
Name: | | Jodi L. Hedberg |
Address: | | 290 Woodcliff Drive |
| | Fairport, NY 14450 |
Age: | | 43 |
Current Position(s) Held with Fund: | | Corporate Secretary, Chief Compliance Officer, Anti-Money Laundering |
| | Compliance Officer |
Term of Office1 & Length of Time Served: | | Corporate Secretary since 1997; Chief Compliance Officer since 2004 |
Principal Occupation(s) During Past 5 Years: | | Director of Compliance, Manning & Napier Advisors, Inc. and affiliates |
| | since 1990 (title change in 2005 from Compliance Manager to Director of |
| | Compliance); Corporate Secretary, Manning & Napier Investor Services, |
| | Inc. since 2006 |
Number of Portfolios Overseen within Fund Complex: | | 29 |
Other Directorships Held Outside Fund Complex: | | N/A |
Name: | | Richard Yates |
Address: | | 290 Woodcliff Drive |
| | Fairport, NY 14450 |
Age: | | 45 |
Current Position(s) Held with Fund: | | Chief Legal Officer |
Term of Office1 & Length of Time Served: | | Chief Legal Officer since 2004 |
Principal Occupation(s) During Past 5 Years: | | Counsel - Manning & Napier Advisors, Inc. & affiliates since 2000; Holds |
| | one or more of the following titles for various affiliates; Director or |
| | Corporate Secretary |
Number of Portfolios Overseen within Fund Complex: | | 29 |
Other Directorships Held Outside Fund Complex: | | N/A |
*Interested Director, within the meaning of the Investment Company Act of 1940 by reason of his position with the Fund’s investment advisor and
distributor. Mr. Auspitz serves as the Executive Vice President and Director, Manning & Napier Advisors, Inc. and President and Director, Manning & Napier Investor Services, Inc., the Fund’s distributor.
**Prior to June 2010, the Executive Group, consisting of senior executive employee-owners, performed the duties of the Office of the Chief
Executive of the Advisor. Effective June 2010, the Executive Group serves as an advisory board to the Chief Executive Officer.
1The term of office for President, Vice President, Chief Financial Officer, Assistant Chief Financial Officer, Chief Legal Officer and Corporate
Secretary is one year and until their respective successors are chosen and qualified. All other officers’ terms are indefinite.
Literature Requests (unaudited)
Proxy Voting Policies and Procedures
A description of the policies and procedures that the Fund uses to determine how to vote proxies relating to portfolio securities is available, without charge, upon request:
| | | | |
By phone | | 1-800-466-3863 | | |
On the Securities and Exchange Commission’s (SEC) web site | | http://www.sec.gov | | |
Proxy Voting Record
Information regarding how the Fund voted proxies relating to portfolio securities during the most recent 12-month period ended June 30th is available, without charge, upon request:
| | | | |
By phone | | 1-800-466-3863 | | |
On the SEC’s web site | | http://www.sec.gov | | |
Quarterly Portfolio Holdings
The Series’ complete schedule of portfolio holdings for the 1st and 3rd quarters of each fiscal year are provided on Form N-Q, and are available, without charge, upon request:
| | | | |
By phone | | 1-800-466-3863 | | |
On the SEC’s web site | | http://www.sec.gov | | |
The Series’ Form N-Q may be reviewed and copied at the SEC’s Public Reference Room in Washington, D.C. Information on the operation of the Public Reference Room may be obtained by calling 1-800-SEC-0330.
Prospectus and Statement of Additional Information (SAI)
The prospectus and SAI provide additional information about each Series, including charges, expenses and risks. These documents are available, without charge, upon request:
| | | | |
By phone | | 1-800-466-3863 | | |
On the SEC’s web site | | http://www.sec.gov | | |
On the Advisor’s web site | | http://www.manning-napier.com | | |
Additional information available at www.manning-napier.com
1. Fund Holdings - Month-End
2. Fund Holdings - Quarter-End
3. Shareholder Report - Annual
4. Shareholder Report - Semi-Annual
(a) The registrant has adopted a code of ethics that applies to its principal executive officer, principal financial officer and principal accounting officer. A copy of the registrant’s code of ethics is filed herewith as Exhibit 12(a)(1).
(b) During the period covered by this report, no amendments were made to the provisions of the code of ethics adopted in 2 (a) above.
(c) During the period covered by this report, no implicit or explicit waivers to the provisions of the code of ethics adopted in 2 (a) above were granted.
(d) Not applicable to the registrant due to the response given in 2 (c) above.
| ITEM 3: | AUDIT COMMITTEE FINANCIAL EXPERT |
All of the members of the Audit committee have been determined by the Registrant’s Board of Directors to be Audit Committee Financial Experts as defined in this item. The members of the Audit Committee are: Harris H. Rusitzky, Stephen B. Ashley, Paul A. Brooke and Richard M. Hurwitz. All Audit Committee members are independent under applicable rules. This designation will not increase the designee’s duties, obligations or liability as compared to their duties, obligations and liability as a member of the Audit Committee and of the Board.
| ITEM 4: | PRINCIPAL ACCOUNTANT FEES AND SERVICES |
Principal Accountant Fees and Services
Aggregate fees for professional services rendered for the Manning & Napier Fund, Inc. (Life Sciences Series, Small Cap Series, Technology Series, Financial Services Series, Real Estate Series, International Series, World Opportunities Series, Ohio Tax Exempt Series, Diversified Tax Exempt Series, New York Tax Exempt Series, Core Bond Series, Core Plus Bond Series, and High Yield Bond Series, collectively the “Fund”) by PricewaterhouseCoopers LLP (“PwC”) as of and for the years ended December 31, 2010 and 2009 were:
| | | | | | | | | | |
| | | 2010 | | 2009 |
Audit Fees (a) | | | | 337,183 | | | | | 336,557 | |
Audit Related Fees (b) | | | | — | | | | | 13,392 | |
Tax Fees (c) | | | | 74,400 | | | | | 87,780 | |
All Other Fees (d) | | | | — | | | | | — | |
| | | | | | | | | | |
| | | | 411,583 | | | | | 437,729 | |
| | | | | | | | | | |
(a) Audit Fees
These fees relate to professional services rendered by PwC for the audit of the Fund’s annual financial statements or services normally provided by the accountant in connection with statutory and regulatory filing or engagements. These services include the audits of the financial statements of the Fund, issuance of consents, income tax provision procedures and assistance with review of documents filed with the SEC.
(b) Audit-Related Fees
These fees relate to assurance and related services by PwC that are reasonably related to the performance of the audit of the Fund’s financial statements and are not reported under “Audit Fees” above. These fees relate to professional services provided by PwC in connection with service provider conversion.
(c) Tax Fees
These fees relate to professional services rendered by PwC for tax compliance, tax advice and tax planning. The tax services provided by PwC related to the preparation of the Fund’s federal and state income tax returns, excise tax calculations and returns, a review of the Fund’s calculations of capital gain and income distributions, and additional tax research for compliance purposes.
(d) All Other Fees
These fees relate to products and services provided by PwC other than those reported above under “Audit Fees,” “Audit-Related Fees,” and “Tax Fees” above.
There were no amounts that were approved by the Audit Committee pursuant to the de minimus exception (Rule 2-01(c)(7) of Regulation S-X) for the fiscal years ended December 31, 2010 and 2009.
Non-Audit Services to the Fund’s Service Affiliates that were Pre-Approved by the Fund’s Audit Committee
The Fund’s Audit Committee is required to pre-approve non-audit services which meet both the following criteria:
| i) | Directly relate to the Fund’s operations and financial reporting; and |
| ii) | Rendered by PwC to the Fund’s advisor, Manning & Napier Advisors, Inc., and entities in a control relationship with the advisor (“service affiliate”) that provide ongoing services to the Fund. For purposes of disclosure, Manning & Napier Investor Services, Inc. is considered to be a service affiliate. |
| | | | | | | | | | |
| | | 2010 | | 2009 |
Audit Related Fees | | | | 153,644 | | | | | 8,420 | |
Tax Fees | | | | — | | | | | 1,950 | |
| | | | | | | | | | |
| | | | 153,644 | | | | | 10,370 | |
| | | | | | | | | | |
The Audit Related fees for the years ended December 31, 2010 were for a license for proprietary authoritative financial reporting and assurance literature library software, a surprise examination pursuant to Rule 204-2(b) and 206(4)-2, and a Type II SAS 70 pursuant to Rule 206. In 2009, were for 17Ad-13 internal control examinations and the license for proprietary authoritative financial report and assurance literature library software.
The Tax fees for the year ended December 31, 2009 relate to research on the tax implications for various funds holding certain investment types.
There were no amounts that were approved by the Audit Committee pursuant to the de minimus exception (Rule 2-01(c)(7) of Regulation S-X) for the fiscal years ended December 31, 2010 and 2009.
Aggregate Fees
Aggregate fees billed to the Fund for non-audit services for 2010 and 2009 were $74,400 and $87,780, respectively. Aggregate fees billed to the Fund’s advisor and service affiliates for non-audit services were $153,644 and $10,370, respectively. These amounts include fees for non-audit services required to be pre-approved and fees for non-audit services that did not require pre-approval since they did not relate to the Fund’s operations and financial reporting.
The Fund’s Audit Committee has considered whether the provisions for non-audit services to the Fund’s advisor and service affiliates, which did not require pre-approval, are compatible with maintaining PwC’s independence.
| ITEM 5: | AUDIT COMMITTEE OF LISTED REGISTRANTS. |
Not applicable.
| (a) | See Investment Portfolios under Item 1 on this Form N-CSR. |
| ITEM 7: | DISCLOSURE OF PROXY VOTING POLICIES AND PROCEDURES FOR CLOSED- END MANAGEMENT INVESTMENT COMPANIES. |
Not applicable.
| ITEM 8: | PORTFOLIO MANAGERS OF CLOSED-END MANAGEMENT INVESTMENT COMPANIES. |
Not applicable.
| ITEM 9: | PURCHASES OF EQUITY SECURITIES BY CLOSED-END MANAGEMENT INVESTMENT COMPANY AND AFFILIATED PURCHASERS. |
Not applicable.
| ITEM 10: | SUBMISSION OF MATTERS TO A VOTE OF SECURITY HOLDERS. |
There have been no material changes to the procedure by which shareholders may recommend nominees to the registrant’s board of directors.
| ITEM 11: | CONTROLS AND PROCEDURES. |
| (a) | Based on their evaluation of the Funds’ disclosure controls and procedures, as of a date within 90 days of the filing date, the Funds’ Principal Executive Officer and Principal Financial Officer have concluded that the Funds’ disclosure controls and procedures are: (i) reasonably designed to ensure that information required to be disclosed in this report is appropriately communicated to the Funds’ officers to allow timely decisions regarding disclosures required in this report; (ii) reasonably designed to ensure that information required to be disclosed in this report is recorded, processed, summarized and reported in a timely manner; and (iii) are effective in achieving the goals described in (i) and (ii) above. |
| (b) | During the second fiscal quarter of the period covered by this report, there have been no changes in the Funds’ internal control over financial reporting that the above officers believe to have materially affected, or to be reasonably likely to materially affect, the Funds’ internal control over financial reporting. |
| | |
| |
| (a)(1) | | Code of ethics that is subject to the disclosure of Item 2 above. |
| |
| (a)(2) | | Separate certifications for the Registrant’s principal executive officer and principal financial officer, as required by Section 302 of the Sarbanes-Oxley Act of 2002 and Rule 30a-2(a) under the Investment Company Act of 1940, are attached as EX-99.CERT. |
| |
| (a)(3) | | Not applicable. |
| |
| (b) | | A certification of the Registrant’s principal executive officer and principal financial officer, as required by 18 U.S.C Section 1350, as adopted pursuant to Section 906 of the Sarbanes-Oxley Act of 2002, and Rule 30a-2(b) under the Investment Company Act of 1940, is attached as EX- 99.906CERT. The certification furnished pursuant to this paragraph is not deemed to be “filed” for purposes of Section 18 of the Securities Exchange Act of 1934, or otherwise subject to the liability of that section. Such certification is not deemed to be incorporated by reference into any filing under the Securities Act of 1933 or the Securities Exchange Act of 1934, except to the extent that the Registrant specifically incorporates them by reference. |
SIGNATURES
Pursuant to the requirements of the Securities Exchange Act of 1934 and the Investment Company Act of 1940, the registrant has duly caused this report to be signed on its behalf by the undersigned, thereunto duly authorized.
|
Manning & Napier Fund, Inc. |
|
| /s/ B. Reuben Auspitz |
| B. Reuben Auspitz |
President & Principal Executive Officer of
Manning & Napier Fund, Inc. |
|
| March 1, 2011 |
Pursuant to the requirements of the Securities Exchange Act of 1934 and the Investment Company Act of 1940, this report has been signed below by the following persons on behalf of the registrant and in the capacities and on the dates indicated.
|
|
| /s/ B. Reuben Auspitz |
| B. Reuben Auspitz |
President & Principal Executive Officer of
Manning & Napier Fund, Inc. |
|
| March 1, 2011 |
|
| /s/ Christine Glavin |
| Christine Glavin |
Chief Financial Officer & Principal Financial Officer
of Manning & Napier Fund, Inc. |
|
| March 1, 2011 |