UNITED STATES
SECURITIES AND EXCHANGE COMMISSION
Washington, D.C. 20549
FORM N-CSR
CERTIFIED SHAREHOLDER REPORT OF REGISTERED
MANAGEMENT INVESTMENT COMPANIES
Investment Company Act file number 811-04087
Manning & Napier Fund, Inc.
(Exact name of registrant as specified in charter)
290 Woodcliff Drive, Fairport, NY 14450
(Address of principal executive offices) (Zip Code)
B. Reuben Auspitz 290 Woodcliff Drive, Fairport, NY 14450
(Name and address of agent for service)
Registrant’s telephone number, including area code: 585-325-6880
Date of fiscal year end: December 31, 2009
Date of reporting period: January 1, 2009 through December 31, 2009
Form N-CSR is to be used by management investment companies to file reports with the Commission not later than 10 days after the transmission to stockholders of any report that is required to be transmitted to stockholders under Rule 30e-1 under the Investment Company Act of 1940 (17 CFR 270.30e-1). The Commission may use the information provided on Form N-CSR in its regulatory, disclosure review, inspection, and policymaking roles.
A registrant is required to disclose the information specified by Form N-CSR, and the Commission will make this information public. A registrant is not required to respond to the collection of information contained in Form N-CSR unless the Form displays a currently valid Office of Management and Budget (“OMB”) control number. Please direct comments concerning the accuracy of the information collection burden estimate and any suggestions for reducing the burden to Secretary, Securities and Exchange Commission, 100 F Street, NE, Washington, DC 20549. The OMB has reviewed this collection of information under the clearance requirements of 44 U.S.C. § 3507.
| ITEM 1. | REPORTS TO STOCKHOLDERS. |


Management Discussion and Analysis (unaudited)

Dear Shareholders:
Over the past twelve months, investor sentiment has moved rather quickly from extreme pessimism to guarded optimism. Volatility continued into the first quarter of 2009, with broad equity markets down more than 10%. After hitting a low point in late March, both domestic and foreign stock markets turned upwards rather dramatically, posting 40% to 60% returns off their lows through the end of the year.
While this turnaround has not been enough to fully offset losses experienced during the current bear market, recent returns indicate that market participants appear more confident in an economic rebound. For the twelve months ended December 31, 2009, the S&P 500 Total Return Index returned 26.50% while the S&P 500 Health Care Index earned 19.77%.
The Life Sciences Series significantly outpaced both the broad market and its sector-specific benchmark, with a total return of 51.79% during 2009. More importantly, the Series continues to have a strong track record relative to the broad market and the sector-specific benchmark over the current market cycle, which includes both a bull and a bear market. Over this current cycle, the Life Sciences Series has earned an annualized return of 9.24% relative to the 6.52% return of the S&P 500 Index and the 4.71% return of the S&P 500 Health Care Index.
As equity market volatility heightened during the last quarter of 2008 and first quarter of 2009, our Profile strategy identified several companies with strong competitive advantages and growth drivers that we believed to be largely unrelated to the health of the overall economy. Severe market declines had pushed the price of many of these companies to extremely low levels relative to our growth expectations. As a result, the Series shifted assets away from smaller capitalization companies and into mid and larger capitalization companies in the diagnostics, life science tools and health care information technology industries. This shift contributed materially to the Series’ out-performance relative to the broad market and the Health Care sector during 2009.
During the latter half of 2009, the Series initiated positions in managed care organizations, which also benefited returns as some of the uncertainty regarding health care reform waned towards the end of 2009. Overall, the Series continues to focus on companies whose products are likely to improve the quality of health care while increasing efficiency in the delivery of care. As of year end, the Series’ largest industry weightings were to health care equipment and supplies and health care providers and services.
From a macro perspective, the current environment remains challenging. On the one hand, more encouraging pockets of optimism have been found in the housing and manufacturing sectors, and while the unemployment rate continues to move higher, there are subtle signs of improvement in the U.S. labor markets. On the other hand, macro-economic challenges remain in the face of a growing government deficit, continued easy monetary policy, a debt-burdened U.S. consumer and widespread inflation concerns.
We recognize that solving yesterday’s problems may create new and different macro-economic challenges. Our approach has always been to remain cognizant of macro-economic conditions, but to allow company-specific factors to drive our investment decisions. In an environment like today, the very uncertainty that makes investors cautious can also create attractively priced investment opportunities for long-term investors. We will continue to seek out such opportunities as the next phase of this market and economic cycle unfolds.
As always, we appreciate your business.
Sincerely,
Manning & Napier Advisors, Inc.
Performance Update as of December 31, 2009 (unaudited)
| | | | | | | | | | |
| | | Average Annual Total Returns
As of December 31, 2009 | | |
| | | One
Year | | Five
Year | | Ten
Year | | Since
Inception1 | | |
Manning & Napier Fund, Inc. - Life Sciences Series2 | | 51.79% | | 5.72% | | 11.70% | | 12.36% | | |
Standard & Poor’s (S&P) 500 Total Return Index3 | | 26.50% | | 0.43% | | -0.94% | | -0.23% | | |
Standard & Poor’s (S&P) 500 Health Care Index3 | | 19.77% | | 2.58% | | 2.67% | | 1.55% | | |
The following graph compares the value of a $10,000 investment in the Manning & Napier Fund, Inc. - Life Sciences Series for the ten years ended December 31, 2009 to the S&P 500 Total Return Index and the S&P 500 Health Care Index.
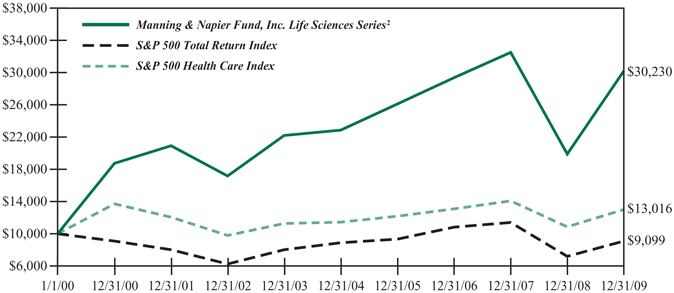
1Performance numbers for the Series and Indices are calculated from November 5, 1999, the Series’ current activation date.
2The Series’ performance does not reflect the deduction of taxes that a shareholder would pay on fund distributions or the redemption of shares. The Series’ performance is historical and may not be indicative of future results. The performance returns shown are inclusive of the net expense ratio of the Series. For the year ended December 31, 2009, this net expense ratio was 1.11%. The gross expense ratio, which does not account for any voluntary or contractual waivers currently in effect, was 1.12% for the year ended December 31, 2009.
3The S&P 500 Total Return Index is an unmanaged capitalization-weighted measure of 500 widely held common stocks listed on the New York Stock Exchange, American Stock Exchange and the Over-the-Counter market. The S&P 500 Health Care Index, a sub-index of the S&P 500 Total Return Index, includes the stocks of companies involved in the business of health care related products and services. Both Indices’ returns assume daily reinvestment of dividends and, unlike Series returns, do not reflect any fees or expenses.
Shareholder Expense Example (unaudited)
As a shareholder of the Series, you may incur two types of costs: (1) transaction costs, including potential wire charges on redemptions and (2) ongoing costs, including management fees and other Series expenses. This example is intended to help you understand your ongoing costs (in dollars) of investing in the Series and to compare these costs with the ongoing costs of investing in other mutual funds.
The example is based on an investment of $1,000 invested at the beginning of the period and held for the entire period (July 1, 2009 to December 31, 2009).
Actual Expenses
The first line of the table below provides information about actual account values and actual expenses. You may use the information in this line, together with the amount you invested, to estimate the expenses that you paid over the period. Simply divide your account value by $1,000 (for example, an $8,600 account value divided by $1,000 = 8.6), then multiply the result by the number in the first line under the heading entitled “Expenses Paid During Period” to estimate the expenses you paid on your account during this period.
Hypothetical Example for Comparison Purposes
The second line of the table below provides information about hypothetical account values and hypothetical expenses based on the Series’ actual expense ratio and an assumed rate of return of 5% per year before expenses, which is not the Series’ actual return. The hypothetical account values and expenses may not be used to estimate the actual ending account balance or expenses you paid during the period. You may use this information to compare the ongoing costs of investing in the Series and other funds. To do so, compare this 5% hypothetical example with the 5% hypothetical examples that appear in the shareholder reports of the other funds.
Please note that the expenses shown in the table are meant to highlight your ongoing costs only and do not reflect any transaction costs, such as potential wire charges on redemptions. Therefore, the second line of the table is useful in comparing ongoing costs only, and will not help you determine the relative total costs of owning different funds. In addition, if these transaction costs were included, your costs would have been higher.
| | | | | | | | | |
| | | Beginning
Account Value
7/1/09 | | Ending
Account Value
12/31/09 | | Expenses Paid
During Period*
7/1/09-12/31/09 |
Actual | | $ | 1,000.00 | | $ | 1,261.60 | | $ | 6.27 |
Hypothetical
(5% return before expenses) | | $ | 1,000.00 | | $ | 1,019.66 | | $ | 5.60 |
*Expenses are equal to the Series’ annualized expense ratio (for the six-month period) of 1.10%, multiplied by the average account value over the period, multiplied by 184/365 (to reflect the one-half year period). Expenses are based on the most recent fiscal half year; therefore, the expense ratio stated above may differ from the expense ratio stated in the financial highlights, which is based on one-year data. The Series’ total return would have been lower had certain expenses not been waived during the period.
Portfolio Composition as of December 31, 2009 (unaudited)
Sector Allocation1
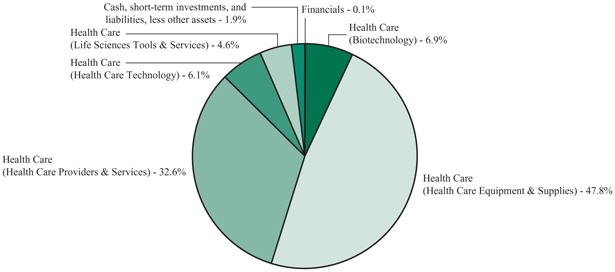
1As a percentage of net assets.
Top Ten Stock Holdings2
| | | | | | |
Inverness Medical Innovations, Inc. | | 5.1% | | Celera Corp. | | 4.4% |
WellPoint, Inc. | | 4.7% | | UnitedHealth Group, Inc. | | 4.3% |
Sonic Healthcare Ltd. (Australia) | | 4.6% | | Eclipsys Corp. | | 4.1% |
CIGNA Corp. | | 4.6% | | DENTSPLY International, Inc. | | 4.0% |
Aetna, Inc. | | 4.5% | | Gen-Probe, Inc. | | 3.9% |
2As a percentage of total investments.
Investment Portfolio - December 31, 2009
| | | | | |
| | | Shares | | Value
(Note 2) |
| | | | | |
| | |
COMMON STOCKS - 98.0% | | | | | |
| | |
Financials - 0.0%** | | | | | |
Insurance - 0.0%** | | | | | |
Avalon HealthCare Holdings, Inc.*1,2,3,4 | | 38,359 | | $ | 9,590 |
| | | | | |
| | |
Health Care - 98.0% | | | | | |
Biotechnology - 6.9% | | | | | |
Celera Corp.* | | 1,731,750 | | | 11,966,393 |
Emergent Biosolutions, Inc.* | | 338,000 | | | 4,593,420 |
Sinovac Biotech Ltd. (China)* | | 356,800 | | | 2,258,544 |
| | | | | |
| | | | | 18,818,357 |
| | | | | |
Health Care Equipment & Supplies - 47.8% | | | | | |
Abaxis, Inc.* | | 169,280 | | | 4,325,104 |
Cochlear Ltd. (Australia) | | 141,230 | | | 8,762,176 |
Covidien plc (Ireland) | | 148,601 | | | 7,116,502 |
DENTSPLY International, Inc. | | 307,000 | | | 10,797,190 |
Dexcom, Inc.* | | 575,000 | | | 4,646,000 |
Gen-Probe, Inc.* | | 246,000 | | | 10,553,400 |
Hologic, Inc.* | | 310,000 | | | 4,495,000 |
Inverness Medical Innovations, Inc.* | | 216,000 | | | 8,966,160 |
Inverness Medical Innovations, Inc.*3,5 | | 122,000 | | | 5,064,220 |
Micrus Endovascular Corp.* | | 199,194 | | | 2,989,902 |
Mindray Medical International Ltd. - ADR (China) | | 258,230 | | | 8,759,161 |
Nobel Biocare Holding AG (Switzerland) | | 242,000 | | | 8,136,459 |
OraSure Technologies, Inc.* | | 1,275,551 | | | 6,479,799 |
Shandong Weigao Group Medical Polymer Co. Ltd. - Class H (China) | | 1,708,000 | | | 5,705,523 |
Sirona Dental Systems, Inc.* | | 223,000 | | | 7,078,020 |
Straumann Holding AG (Switzerland) | | 32,717 | | | 9,251,025 |
Teleflex, Inc | | 98,100 | | | 5,286,609 |
Thoratec Corp.* | | 95,000 | | | 2,557,400 |
Zoll Medical Corp.* | | 355,000 | | | 9,485,600 |
| | | | | |
| | | | | 130,455,250 |
| | | | | |
Health Care Providers & Services - 32.6% | | | | | |
Aetna, Inc | | 387,000 | | | 12,267,900 |
AMN Healthcare Services, Inc.* | | 433,600 | | | 3,928,416 |
Bio-Reference Laboratories, Inc.* | | 140,000 | | | 5,486,600 |
CIGNA Corp. | | 354,000 | | | 12,485,580 |
Cross Country Healthcare, Inc.* | | 84,300 | | | 835,413 |
Diagnosticos da America S.A. (Brazil) | | 193,000 | | | 6,317,674 |
Sonic Healthcare Ltd. (Australia) | | 910,000 | | | 12,563,505 |
UnitedHealth Group, Inc. | | 389,000 | | | 11,856,720 |
VCA Antech, Inc.* | | 414,000 | | | 10,316,880 |
| | |
| 5 | | The accompanying notes are an integral part of the financial statements. |
Investment Portfolio - December 31, 2009
| | | | | |
| | | Shares | | Value
(Note 2) |
| | | | | |
| | |
COMMON STOCKS (continued) | | | | | |
| | |
Health Care (continued) | | | | | |
Health Care Providers & Services (continued) | | | | | |
WellPoint, Inc.* | | 220,000 | | $ | 12,823,800 |
| | | | | |
| | | | | 88,882,488 |
| | | | | |
Health Care Technology - 6.1% | | | | | |
Allscripts - Misys Healthcare Solutions, Inc.* | | 277,000 | | | 5,603,710 |
Eclipsys Corp.* | | 603,000 | | | 11,167,560 |
| | | | | |
| | | | | 16,771,270 |
| | | | | |
Life Sciences Tools & Services - 4.6% | | | | | |
Caliper Life Sciences, Inc.* | | 2,578,423 | | | 6,626,547 |
ICON plc - ADR (Ireland)* | | 277,880 | | | 6,038,333 |
| | | | | |
| | | | | 12,664,880 |
| | | | | |
Total Health Care | | | | | 267,592,245 |
| | | | | |
TOTAL COMMON STOCKS
(Identified Cost $233,586,947) | | | | | 267,601,835 |
| | | | | |
PREFERRED STOCKS - 0.1% | | | | | |
Financials - 0.1% | | | | | |
Insurance - 0.1% | | | | | |
Avalon HealthCare Holdings, Inc. - Series D*2,3,4,6 (Identified Cost $2,312,500) | | 925,000 | | | 231,250 |
| | | | | |
WARRANTS - 0.0%** | | | | | |
| | |
Financials - 0.0%** | | | | | |
Insurance - 0.0%** | | | | | |
Avalon HealthCare Holdings, Inc., 2/27/20142,3,4,7 | | 38,359 | | | 383 |
| | | | | |
Health Care - 0.0%** | | | | | |
Life Sciences Tools & Services - 0.0%** | | | | | |
Caliper Life Sciences, Inc., 8/15/20103,4,8 | | 285,000 | | | 27,766 |
Caliper Life Sciences, Inc., 8/10/2011 | | 401,109 | | | 16,446 |
| | | | | |
Total Health Care | | | | | 44,212 |
| | | | | |
TOTAL WARRANTS
(Identified Cost $560,760) | | | | | 44,595 |
| | | | | |
| | |
| The accompanying notes are an integral part of the financial statements. | | 6 |
Investment Portfolio - December 31, 2009
| | | | | | |
| | | Shares | | Value (Note 2) | |
| | | | | | |
| | |
SHORT-TERM INVESTMENTS - 2.0% | | | | | | |
Dreyfus Cash Management, Inc. - Institutional Shares9 , 0.07%,
(Identified Cost $5,319,436) | | 5,319,436 | | $ | 5,319,436 | |
| | | | | | |
TOTAL INVESTMENTS - 100.1%
(Identified Cost $241,779,643) | | | | | 273,197,116 | |
| | |
LIABILITIES, LESS OTHER ASSETS - (0.1%) | | | | | (253,153 | ) |
| | | | | | |
NET ASSETS - 100% | | | | $ | 272,943,963 | |
| | | | | | |
ADR - American Depository Receipt
*Non - income producing security
**Less than 0.1%
1This security was acquired on February 27, 2009 at a cost of $76,718 ($2.00 per share) and has been determined to be illiquid under guidelines established by the Board of Directors (see Note 2 to the financial statements).
2Affiliated company as defined by the Investment Company Act of 1940 (see Note 2 to the financial statements).
3Restricted securities - Investment in securities that are restricted as to public resale under the Securities Act of 1933, as amended. These securities amount to $5,333,209, or 2.0% of the Series’ net assets as of December 31, 2009 (see Note 2 to the financial statements).
4Security has been valued at fair value (see Note 2 to the financial statements).
5This security was acquired on February 3, 2006 at a cost of $2,978,020 ($24.41 per share) and has been determined to be liquid under guidelines established by the Board of Directors (see Note 2 to the financial statements).
6This security was acquired on June 22, 2007 at a cost of $2,312,500 ($2.50 per share) and has been determined to be illiquid under guidelines established by the Board of Directors (see Note 2 to the financial statements).
7This security was acquired on February 27, 2009 at a cost of $19,180 ($0.50 per warrant) and has been determined to be illiquid under guidelines established by the Board of Directors (see Note 2 to the financial statements).
8This security was acquired on August 11, 2005 at a cost of $365,484 ($1.28 per warrant) and has been determined to be illiquid under guidelines established by the Board of Directors (see Note 2 to the financial statements).
9Rate shown is the current yield as of December 31, 2009.
| | |
| 7 | | The accompanying notes are an integral part of the financial statements. |
Statement of Assets and Liabilities
December 31, 2009
| | | | |
ASSETS: | | | | |
| | | | |
| |
Investments, at value (identified cost $241,779,643) (Note 2) | | $ | 273,197,116 | |
Receivable for fund shares sold | | | 252,764 | |
Foreign tax reclaims receivable | | | 58,841 | |
Dividends receivable | | | 54,951 | |
| | | | |
TOTAL ASSETS | | | 273,563,672 | |
| | | | |
LIABILITIES: | | | | |
| |
Accrued management fees (Note 3) | | | 227,911 | |
Accrued fund accounting and transfer agent fees (Note 3) | | | 15,041 | |
Accrued directors’ fees (Note 3) | | | 3,142 | |
Accrued Chief Compliance Officer service fees (Note 3) | | | 476 | |
Payable for fund shares repurchased | | | 323,092 | |
Audit fees payable | | | 32,522 | |
Other payables and accrued expenses | | | 17,525 | |
| | | | |
TOTAL LIABILITIES | | | 619,709 | |
| | | | |
TOTAL NET ASSETS | | $ | 272,943,963 | |
| | | | |
NET ASSETS CONSIST OF: | | | | |
| |
Capital stock | | $ | 257,173 | |
Additional paid-in-capital | | | 280,487,746 | |
Accumulated net realized loss on investments, foreign currency, written options and translation of other assets and liabilities | | | (39,222,136 | ) |
Net unrealized appreciation on investments, foreign currency and translation of other assets and liabilities | | | 31,421,180 | |
| | | | |
TOTAL NET ASSETS | | $ | 272,943,963 | |
| | | | |
NET ASSET VALUE, OFFERING PRICE AND REDEMPTION
PRICE PER SHARE - CLASS A ($272,943,963/25,717,294 shares) | | $ | 10.61 | |
| | | | |
| | |
| The accompanying notes are an integral part of the financial statements. | | 8 |
Statement of Operations
For the Year Ended December 31, 2009
| | | | |
INVESTMENT INCOME: | | | | |
| | | | |
| |
Dividends (net of foreign taxes withheld, $91,832) | | $ | 1,219,505 | |
Interest | | | 7,624 | |
| | | | |
Total Investment Income | | | 1,227,129 | |
| | | | |
| EXPENSES: | | | | |
| |
Management fees (Note 3) | | | 2,180,949 | |
Fund accounting and transfer agent fees (Note 3) | | | 123,034 | |
Directors’ fees (Note 3) | | | 12,849 | |
Chief Compliance Officer service fees (Note 3) | | | 3,729 | |
Custodian fees | | | 31,650 | |
Miscellaneous | | | 80,483 | |
| | | | |
Total Expenses | | | 2,432,694 | |
Less reduction of expenses (Note 3) | | | (1,805 | ) |
| | | | |
Net Expenses | | | 2,430,889 | |
| | | | |
NET INVESTMENT LOSS | | | (1,203,760 | ) |
| | | | |
REALIZED AND UNREALIZED GAIN (LOSS) ON INVESTMENTS
AND FOREIGN CURRENCY: | | | | |
| |
Net realized gain (loss) on - | | | | |
Investments | | | (3,767,101 | ) |
Foreign currency, written options and translation of other assets and liabilities | | | 10,157 | |
| | | | |
| | | (3,756,944 | ) |
| | | | |
| |
Net change in unrealized appreciation (depreciation) on - | | | | |
Investments | | | 99,100,994 | |
Foreign currency and translation of other assets and liabilities | | | 4,599 | |
| | | | |
| | | 99,105,593 | |
| | | | |
| |
NET REALIZED AND UNREALIZED GAIN (LOSS) ON
INVESTMENTS AND FOREIGN CURRENCY | | | 95,348,649 | |
| | | | |
NET INCREASE IN NET ASSETS RESULTING FROM OPERATIONS | | $ | 94,144,889 | |
| | | | |
| | |
| 9 | | The accompanying notes are an integral part of the financial statements. |
Statements of Changes in Net Assets
| | | | | | | | |
| | | For the
Year Ended
12/31/09 | | | For the
Year Ended
12/31/08 | |
| | | | | | | | |
| INCREASE (DECREASE) IN NET ASSETS: | | | | | | | | |
| | |
| OPERATIONS: | | | | | | | | |
| | |
Net investment loss | | $ | (1,203,760 | ) | | $ | (1,595,292 | ) |
Net realized loss on investments, foreign currency and written options | | | (3,756,944 | ) | | | (34,579,191 | ) |
Net change in unrealized appreciation (depreciation) on investments and foreign currency | | | 99,105,593 | | | | (81,007,463 | ) |
| | | | | | | | |
Net increase (decrease) from operations | | | 94,144,889 | | | | (117,181,946 | ) |
| | | | | | | | |
DISTRIBUTIONS TO SHAREHOLDERS (Note 9): | | | | | | | | |
| | |
From net realized gain on investments | | | — | | | | (2,894,633 | ) |
| | | | | | | | |
| CAPITAL STOCK ISSUED AND REPURCHASED: | | | | | | | | |
| | |
Net increase (decrease) from capital share transactions (Note 5) | | | (3,905,204 | ) | | | 3,111,722 | |
| | | | | | | | |
Net increase (decrease) in net assets | | | 90,239,685 | | | | (116,964,857 | ) |
| | |
| NET ASSETS: | | | | | | | | |
| | |
Beginning of year | | | 182,704,278 | | | | 299,669,135 | |
| | | | | | | | |
End of year (including undistributed net investment income (loss) of $0 and $0, respectively) | | $ | 272,943,963 | | | $ | 182,704,278 | |
| | | | | | | | |
| | |
| The accompanying notes are an integral part of the financial statements. | | 10 |
Financial Highlights
| | | | | | | | | | |
| | | | | For the Years Ended | | |
| | | 12/31/09 | | 12/31/08 | | 12/31/07 | | 12/31/06 | | 12/31/05 |
| | | | | | | | | | |
| | | | | | | | | | |
| Per share data (for a share outstanding throughout each year): | | | | | | | | | | |
Net asset value - Beginning of year | | $6.99 | | $11.54 | | $11.41 | | $12.10 | | $11.89 |
| | | | | | | | | | |
Income (loss) from investment operations: | | | | | | | | | | |
Net investment loss | | (0.05)1 | | (0.06) | | (0.08) | | (0.05) | | (0.04) |
Net realized and unrealized gain (loss) on investments | | 3.67 | | (4.38) | | 1.25 | | 1.56 | | 1.71 |
| | | | | | | | | | |
Total from investment operations | | 3.62 | | (4.44) | | 1.17 | | 1.51 | | 1.67 |
| | | | | | | | | | |
Less distributions to shareholders: | | | | | | | | | | |
From net realized gain on investments | | — | | (0.11) | | (1.04) | | (2.20) | | (1.46) |
| | | | | | | | | | |
Net asset value - End of year | | $10.61 | | $6.99 | | $11.54 | | $11.41 | | $12.10 |
| | | | | | | | | | |
Net assets - End of year (000’s omitted) | | $272,944 | | $182,704 | | $299,669 | | $233,072 | | $221,302 |
| | | | | | | | | | |
Total return2 | | 51.79% | | (38.77%) | | 10.62% | | 12.52% | | 14.16% |
| Ratios (to average net assets)/ Supplemental Data: | | | | | | | | | | |
Expenses | | 1.11%* | | 1.12% | | 1.12% | | 1.14% | | 1.17% |
Net investment loss | | (0.55%) | | (0.65%) | | (0.75%) | | (0.51%) | | (0.32%) |
Portfolio turnover | | 95% | | 94% | | 95% | | 93% | | 110% |
|
*The investment advisor did not impose all or a portion of its CCO fees, fund accounting and transfer agent fees during the year ended 12/31/09. If these expenses had been incurred by the Series, the expense ratio (to average net assets) would have been increased by 0.01%. |
1Calculated based on average shares outstanding during the year.
2Represents aggregate total return for the year indicated, and assumes reinvestment of all distributions. Total return would have been lower had certain expenses not been waived during the year ended December 31, 2009.
| | |
| 11 | | The accompanying notes are an integral part of the financial statements. |
Notes to Financial Statements
Life Sciences Series (the “Series”) is a no-load diversified series of Manning & Napier Fund, Inc. (the “Fund”). The Fund is organized in Maryland and is registered under the Investment Company Act of 1940 (the “1940 Act”), as amended, as an open-end management investment company.
The Series’ investment objective is to provide long-term growth by investing principally in the common stocks of companies in the life sciences industry.
The Fund’s Advisor is Manning & Napier Advisors, Inc. (the “Advisor”). On November 5, 1999, the Series resumed sales of shares to advisory clients and employees of the Advisor and its affiliates. On May 1, 2001, the Series began offering shares directly to investors. Previously, the Series was available from time to time to advisory clients and employees of the Advisor. The total authorized capital stock of the Fund consists of 10.0 billion shares of common stock each having a par value of $0.01. As of December 31, 2009, 4.6 billion shares have been designated in total among 29 series, of which 100 million have been designated as Life Sciences Series Class A common stock.
| 2. | SIGNIFICANT ACCOUNTING POLICIES |
Security Valuation
Portfolio securities, including domestic equities, foreign equities, exchange-traded funds, warrants and options, listed on an exchange other than the NASDAQ National Market System are valued at the latest quoted sales price of the exchange on which the security is primarily traded. Securities not traded on valuation date or securities not listed on an exchange are valued at the latest quoted bid price provided by the Fund’s pricing service. Securities listed on the NASDAQ National Market System are valued in accordance with the NASDAQ Official Closing Price.
Short-term investments that mature in sixty days or less are valued at amortized cost, which approximates market value. Investments in open-end investment companies are valued at their net asset value per share on valuation date.
Volume and level of activity in established markets for an asset or liability are evaluated to determine whether recent transactions and quoted prices are determinative of fair value. Where there have been significant decreases in volume and level of activity, further analysis and adjustment may be necessary to estimate fair value. The Series measures fair value in these instances by the use of inputs and valuation techniques which may be based upon current market prices of securities that are comparable in coupon, rating, maturity and industry and/or expectation of future cash flows. As a result of trading in relatively thin markets and/or markets that experience significant volatility, the prices used by the Series to value these securities may differ from the value that would be realized if these securities were sold, and the differences could be material.
Securities for which representative valuations or prices are not available from the Fund’s pricing service may be valued at fair value. Due to the inherent uncertainty of valuations of such securities, the fair value may differ significantly from the values that would have been used had a ready market for such securities existed. If trading or events occurring after the close of the principal market in which securities are traded are expected to materially affect the value of those securities, then they may be valued at their fair value, taking this trading or these events into account. Fair value is determined in good faith by the Advisor under procedures approved by and under the general supervision and responsibility of the Fund’s Board of Directors (the “Board”).
Notes to Financial Statements
| 2. | SIGNIFICANT ACCOUNTING POLICIES (continued) |
Security Valuation (continued)
Various inputs are used in determining the value of the Series’ assets or liabilities carried at market value. These inputs are summarized in three broad levels. Level 1 includes quoted prices in active markets for identical assets and liabilities. Level 2 includes other significant observable inputs (including quoted prices for similar securities, interest rates, prepayment speeds, credit risk, etc.). Level 3 includes significant unobservable inputs (including the Series’ own assumptions in determining the fair value of investments). The inputs or methodology used for valuing securities are not necessarily an indication of the risk associated with investing in those securities.
The following is a summary of the valuation levels used for major security types as of December 31, 2009 in valuing the Series’ assets or liabilities carried at market value:
| | | | | | | | | | | | |
Description: | | 12/31/09 | | Level 1 | | Level 2 | | Level 3 |
| | | | | | | | | | | | |
Equity securities* | | $ | 267,646,430 | | $ | 267,608,691 | | $ | — | | $ | 37,739 |
Preferred securities | | | 231,250 | | | — | | | — | | | 231,250 |
Debt securities | | | — | | | — | | | | | | — |
Mutual funds | | | 5,319,436 | | | 5,319,436 | | | — | | | — |
Other financial instruments** | | | — | | | — | | | — | | | — |
| | | | | | | | | | | | |
Total | | $ | 273,197,116 | | $ | 272,928,127 | | $ | — | | $ | 268,989 |
| | | | | | | | | | | | |
*Includes common stock, warrants and rights. Please see the Investment Portfolio for industry classification.
**Other financial instruments are derivative instruments not reflected in the Investment Portfolio, such as futures, forwards and swap contracts, which are valued at the unrealized appreciation/ depreciation on the instrument. As of December 31, 2009, the Series did not hold any derivative instruments.
| | | | | | | | |
Level 3 reconciliation | | Equity
Securities | | | Preferred
Securities | |
| | | | | | | | |
Balance as of 12/31/08 | | $ | 61,387 | | | $ | 1,850,000 | |
Realized gain/loss | | | — | | | | — | |
Change in unrealized appreciation (depreciation)*** | | | (119,546 | ) | | | (1,618,750 | ) |
Net purchases (sales) | | | 95,898 | | | | — | |
Transfers in and/or out of Level 3 | | | — | | | | — | |
| | | | | | | | |
Balance as of 12/31/09 | | $ | 37,739 | | | $ | 231,250 | |
| | | | | | | | |
***The change in unrealized appreciation (depreciation) on securities still held at December 31, 2009 was $(1,738,296), which is included in the related net change in unrealized appreciation/depreciation on the Statement of Operations.
Interim and annual reporting periods beginning after December 15, 2009 will require additional disclosure regarding transfers in and/or out of Level 1 and 2. Additional disclosure surrounding the activity in Level 3 fair value measurement will also be effective for fiscal years beginning after December 15, 2010. Management has concluded that this will not have a material impact on the Series’ financial statements.
Notes to Financial Statements
| 2. | SIGNIFICANT ACCOUNTING POLICIES (continued) |
Security Transactions, Investment Income and Expenses
Security transactions are accounted for on trade date. Dividend income is recorded on the ex-dividend date, except that if the ex-dividend date has passed, certain dividends from foreign securities are recorded as soon as the Fund is informed of the ex-dividend date. Non-cash dividends, if any, are recorded at the fair market value of the securities received. Interest income, including amortization of premium and accretion of discounts using the effective interest method, is earned from settlement date and accrued daily.
Expenses are recorded on an accrual basis. Most expenses of the Fund can be attributed to a specific series. Expenses which cannot be directly attributed are apportioned among the series in the Fund in such a manner as deemed equitable by the Fund’s Board, taking into consideration, among other things, the nature and type of expense.
The Series uses the identified cost method for determining realized gain or loss on investments for both financial statement and federal income tax reporting purposes.
Foreign Currency Translation
The books and records of the Series are maintained in U.S. dollars. Foreign currencies, investments and other assets and liabilities are translated into U.S. dollars at the current exchange rates. Purchases and sales of investment securities and income and expenses are translated on the respective dates of such transactions. The Series does not isolate realized and unrealized gains and losses attributable to changes in the exchange rates from gains and losses that arise from changes in the market value of investments. Such fluctuations are included with net realized and unrealized gain or loss on investments. Net realized foreign currency gains and losses represent foreign currency gains and losses between trade date and settlement date on securities transactions, gains and losses on disposition of foreign currencies and the difference between the amount of income and foreign withholding taxes recorded on the books of the Series and the amounts actually received or paid.
Restricted Securities
Restricted securities are purchased in private placement transactions, are not registered under the Securities Act of 1933, as amended, and may have contractual restrictions on resale. Information regarding restricted securities is included at the end of the Series’ Investment Portfolio.
Illiquid Securities
A security may be considered illiquid if so deemed in good faith by the Advisor under procedures approved by and under the general supervision and responsibility of the Fund’s Board. Securities that are illiquid are marked with the applicable footnote on the Investment Portfolio. As of December 31, 2009, the aggregate value of securities deemed illiquid was $268,989, representing 0.10% of the Series’ net assets.
Affiliated Companies
The 1940 Act defines “affiliated companies” to include securities in which a series owns 5% or more of the outstanding voting securities of the issuer. The following transactions were effected in shares of Avalon HealthCare Holdings, Inc. - Series D, Avalon HealthCare Holdings, Inc., and Avalon HealthCare Holdings, Inc. - Warrants 2/27/2014 for the year ended December 31, 2009:
Notes to Financial Statements
| 2. | SIGNIFICANT ACCOUNTING POLICIES (continued) |
Affiliated Companies (continued)
| | | | | | | | | | | | | | | | | |
Name of Issuer | | Number of
Shares
Held as of
12/31/08 | | Gross
Additions | | Gross
Reductions | | Number of
Shares
Held as of
12/31/09 | | Value
as of
12/31/09 | | Investment
Income | | Realized
Gain |
Avalon HealthCare Holdings, Inc. - Series D | | 925,000 | | — | | — | | 925,000 | | $ | 231,250 | | $ | — | | $ | — |
Avalon HealthCare Holdings, Inc. | | — | | 38,359 | | — | | 38,359 | | $ | 9,590 | | $ | — | | $ | — |
Avalon HealthCare Holdings, Inc. - Warrants 2/27/2014 | | — | | 38,359 | | — | | 38,359 | | $ | 383 | | $ | — | | $ | — |
The Chairman and CEO of Alsius Corp. serves as a director of the Fund. Therefore, Alsius Corp. (formerly Ithaka Acquisition Corp.) is considered an “affiliated company”, as defined in the 1940 Act. The following transactions were effected in shares of Alsius Corp. for the year ended December 31, 2009:
| | | | | | | | | | | | | | | | | |
Name of Issuer | | Number of
Shares
Held as of
12/31/08 | | Gross
Additions | | Gross
Reductions | | Number of
Shares
Held as of
12/31/09 | | Value
as of
12/31/09 | | Investment
Income | | Realized
Loss |
Alsius Corp. | | 196,317 | | — | | 196,317 | | — | | $ | — | | $ | — | | $ | 480,592 |
Federal Taxes
The Series’ policy is to comply with the provisions of the Internal Revenue Code applicable to regulated investment companies. The Series is not subject to federal income tax or excise tax to the extent that the Series distributes to shareholders each year its taxable income, including any net realized gains on investments, in accordance with requirements of the Internal Revenue Code. Accordingly, no provision for federal income tax or excise tax has been made in the financial statements.
Management evaluates its tax positions to determine if the tax positions taken meet the minimum recognition threshold in connection with accounting for uncertainties in income tax positions taken or expected to be taken for the purposes of measuring and recognizing tax liabilities in the financial statements. Recognition of tax benefits of an uncertain tax position is required only when the position is “more likely than not” to be sustained assuming examination by taxing authorities. At December 31, 2009, the Series has recorded no liability for net unrecognized tax benefits relating to uncertain income tax positions taken or expected to be taken in future tax returns.
The Series files income tax returns in the U.S. federal jurisdiction, various states and foreign jurisdictions, as required. No income tax returns are currently under investigation. The statute of limitations on the Series’ tax returns remains open for the years ended December 31, 2006 through December 31, 2009. The Fund is not aware of any tax positions for which it is reasonably possible that the total amounts of unrecognized tax benefits will significantly change in the next twelve months.
Additionally, based on the Fund’s understanding of the tax rules and rates related to income, gains and transactions for foreign jurisdictions in which it invests, the Series will provide for foreign taxes, and where appropriate, deferred foreign tax.
Notes to Financial Statements
| 2. | SIGNIFICANT ACCOUNTING POLICIES (continued) |
Distributions of Income and Gains
Distributions to shareholders of net investment income and net realized gains are made annually. An additional distribution may be necessary to avoid taxation of the Series. Distributions are recorded on the ex-dividend date.
Indemnifications
The Fund’s organizational documents provide former and current directors and officers with a limited indemnification against liabilities arising in connection with the performance of their duties to the Fund. In the normal course of business, the Fund may also enter into contracts that provide general indemnifications. The Fund’s maximum exposure under these arrangements is unknown as this would be dependent on future claims that may be made against the Fund. The risk of material loss from such claims is considered remote.
Other
The preparation of financial statements in conformity with accounting principles generally accepted in the United States of America requires management to make estimates and assumptions that affect the reported amounts of assets and liabilities and the disclosure of contingent assets and liabilities at the date of the financial statements and the reported amounts of income and expenses during the reporting period. Actual results could differ from those estimates.
| 3. | TRANSACTIONS WITH AFFILIATES |
The Fund has an Investment Advisory Agreement (the “Agreement”) with the Advisor, for which the Series pays a fee, computed daily and payable monthly, at an annual rate of 1.00% of the Series’ average daily net assets.
Under the Agreement, personnel of the Advisor provide the Series with advice and assistance in the choice of investments and the execution of securities transactions, and otherwise maintain the Series’ organization. The Advisor also provides the Fund with necessary office space and fund administration and support services. The salaries of all officers of the Fund (except a percentage of the Fund’s Chief Compliance Officer’s salary, which is paid by the Fund), and of all Directors who are “affiliated persons” of the Fund, or of the Advisor, and all personnel of the Fund, or of the Advisor, performing services relating to research, statistical and investment activities, are paid by the Advisor. Each “non-affiliated” Director receives an annual stipend, which is allocated among all the active series of the Fund. In addition, these Directors also receive a fee per Board meeting attended for each active series of the Fund plus a fee for each committee meeting attended.
Manning & Napier Investor Services, Inc., a registered broker-dealer affiliate of the Advisor, acts as distributor for the Fund’s shares. The services of Manning & Napier Investor Services, Inc. are provided at no additional cost to the Series.
For fund accounting and transfer agent services through November 7, 2009, the Fund paid the Advisor an annual fee of 0.055% of the Fund’s average daily net assets up to $4.5 billion, 0.03% of the Fund’s average daily net assets between $4.5 billion and $7.5 billion, and 0.02% of the Fund’s average daily net assets over $7.5 billion. Additionally, certain transaction and account-based fees and out-of-pocket expenses, including charges for reporting relating to the Fund’s compliance program, were charged. Expenses not directly attributable to a Series are allocated based on each Series’ relative net assets or number of accounts, depending on the expense. Prior to October 12, 2009 (for sub-accountant) and November 9, 2009 (for sub-transfer agent) the Advisor had an agreement with Citi Fund Services Ohio, Inc. (“Citi”) under which Citi served as sub-accountant
Notes to Financial Statements
| 3. | TRANSACTIONS WITH AFFILIATES (continued) |
and sub-transfer agent. The Advisor voluntarily agreed to waive a portion of the fund accounting and transfer agent fees and the Chief Compliance Officer service fees for the period March 1, 2009 to April 30, 2009. Accordingly, the Advisor waived fees of $1,805, which is included as a reduction of expenses on the Statement of Operations.
The Advisor has entered into agreements dated October 12, 2009 and November 9, 2009 with PNC Global Investment Servicing (“PNCGIS”) under which PNCGIS serves as sub-accountant services agent and sub-transfer agent, respectively. Effective November 7, 2009 under the amended master services agreement, the Fund pays the Advisor an annual fee of 0.0175% on the first $3 billion of average daily net assets (excluding Target Series); 0.015% on the next $3 billion of average daily net assets (excluding Target Series); and 0.01% of the average daily net assets in excess of $6 billion (excluding Target Series); plus a base fee of $25,500 per Series. Additionally, certain transaction-, account-, and cusip-based fees and out-of-pocket expenses, including charges for reporting relating to the Fund’s compliance program, are charged.
| 4. | PURCHASES AND SALES OF SECURITIES |
For the year ended December 31, 2009, purchases and sales of securities, other than United States Government securities and short-term securities, were $196,069,318 and $203,514,833, respectively. There were no purchases or sales of United States Government securities.
| 5. | CAPITAL STOCK TRANSACTIONS |
Transactions in shares of Life Sciences Series were:
| | | | | | | | | | | | | | |
| | | For the Year
Ended 12/31/09 | | | For the Year
Ended 12/31/08 | |
| | | Shares | | | Amount | | | Shares | | | Amount | |
| | | | | | | | | | | | | | |
Sold | | 3,589,547 | | | $ | 27,786,051 | | | 2,823,006 | | | $ | 26,015,765 | |
Reinvested | | — | | | | — | | | 282,518 | | | | 2,867,564 | |
Repurchased | | (4,015,779 | ) | | | (31,691,255 | ) | | (2,924,235 | ) | | | (25,771,607 | ) |
| | | | | | | | | | | | | | |
Total | | (426,232 | ) | | $ | (3,905,204 | ) | | 181,289 | | | $ | 3,111,722 | |
| | | | | | | | | | | | | | |
Substantially all of the Series’ shares represent investments by fiduciary accounts over which the Advisor has sole investment discretion.
The Series may trade in instruments including written and purchased options, forward foreign currency exchange contracts and futures contracts and other derivatives in the normal course of investing activities to assist in managing exposure to various market risks. The Series may be subject to various elements of risk and may involve, to a varying degree, elements of risk in excess of the amounts recognized for financial statement purposes; the risk that changes in the value of a derivative may not correlate perfectly with the underlying asset, rate or index; counterparty credit risk related to over the counter derivatives counterparties failure to perform under contract terms; liquidity risk related to the lack of a liquid market for these contracts allowing the fund to close out its position(s); and documentation risk relating to disagreement over contract terms. No such investments were held by the Series during the year ended December 31, 2009, except for the options contracts as detailed below.
Notes to Financial Statements
| 6. | FINANCIAL INSTRUMENTS (continued) |
The Series may write (sell) or buy call or put options on securities and other financial instruments. When the Series writes a call, the Series gives the purchaser the right to buy the underlying security from the Series at the price specified in the option contract (the “exercise price”) at any time during the option period. The Series may write call options as a means of protecting its assets against market declines, and in an attempt to earn additional income. When the Series writes a put option, the Series gives the purchaser the right to sell to the Series the underlying security at the exercise price at any time during the option period. The Series may write put options on national securities exchanges to obtain, through the receipt of premiums, a greater return than would be realized on the underlying securities alone. The Series will only write options on a “covered basis.” This means that the Series will own the underlying security when the Series writes a call or the Series will put aside cash, U.S. Government securities, or other liquid assets in an amount not less than the exercise price at all times the put option is outstanding.
When the Series writes an option, an amount equal to the premium received is reflected as a liability and is subsequently marked-to-market to reflect the current market value of the option. The Series, as a writer of an option, has no control over whether the underlying security or financial instrument may be sold (call) or purchased (put) and, as a result, bears the market risk of an unfavorable change in the price of the security or financial instrument underlying the written option. There is a risk that the Series may not be able to enter into a closing transaction because of an illiquid market.
The Series may also purchase options in an attempt to hedge against fluctuations in the value of its portfolio and to protect against declines in the value of the securities. The premium paid by the Series for the purchase of an option is reflected as an investment and subsequently marked-to-market to reflect the current market value of the option. The risk associated with purchasing options is limited to the premium paid.
When a security is purchased or sold through an exercise of an option, the related premium paid (or received) is added to (or deducted from) the basis of the security acquired or deducted from (or added to) the proceeds of the security sold. When an option expires (or the Series enters into a closing transaction), the Series realizes a gain or loss on the option to the extent of the premium received or paid (or gain or loss to the extent the cost of the closing transaction exceeds the premium paid or received). Any realized gain or loss recognized and any change in unrealized appreciation or depreciation from options are reported separately on the Statement of Operations.
The measurement of the risks associated with option contracts is meaningful only when all related and offsetting transactions are considered.
Notes to Financial Statements
| 6. | FINANCIAL INSTRUMENTS (continued) |
A summary of obligations for written option contracts for the year ended December 31, 2009 is as follows:.
| | | | | | | | | | | | | | |
| | | Put Options | | | Call Options | |
| | | Number of
Contracts | | | Premiums
Received | | | Number of
Contracts | | | Premiums
Received | |
| | | | | | | | | | | | | | |
Balance at December 31, 2008 | | — | | | $ | — | | | — | | | $ | — | |
Options written during 2009 | | 3,247 | | | | 112,899 | | | 2,500 | | | | 551,889 | |
Options exercised during 2009 | | (3,247 | ) | | | (112,899 | ) | | (2,500 | ) | | | (551,889 | ) |
| | | | | | | | | | | | | | |
Balance at December 31, 2009 | | — | | | $ | — | | | — | | | $ | — | |
| | | | | | | | | | | | | | |
No options were held at the beginning of the year, and all options entered into during the year were subsequently exercised prior to December 31, 2009. Accordingly, due to the accounting treatment stated above, there is no impact to the Statement of Assets and Liabilities as of December 31, 2009 or to the Statement of Operations for the year ended December 31, 2009.
The Series’ options contracts held during the year ended December 31, 2009 are not accounted for as hedging instruments under accounting principles generally accepted in the United States of America.
Investing in securities of foreign companies and foreign governments involves special risks and considerations not typically associated with investing in securities of domestic companies and the U.S. Government. These risks include revaluation of currencies and future adverse political and economic developments. Moreover, securities of foreign companies and foreign governments and their markets may be less liquid and their prices more volatile than those of comparable domestic companies and the U.S. Government.
| 8. | LIFE SCIENCES SECURITIES |
The Series may focus its investments in certain related life sciences industries; hence, the Series may subject itself to a greater degree of risk than a series that is more diversified.
| 9. | FEDERAL INCOME TAX INFORMATION |
The amount and characterization of certain income and capital gains to be distributed are determined in accordance with federal income tax regulations, which may differ from accounting principles generally accepted in the United States of America. These differences are primarily due to differing book and tax treatments in the timing of the recognition of net investment income or gains and losses, including net operating losses, foreign currency gains and losses, losses deferred due to wash sales and Post-October losses. The Series may periodically make reclassifications among its capital accounts to reflect income and gains available for distribution (or available capital loss carryovers) under income tax regulations without impacting the Series’ net asset value. Any such reclassifications are not reflected in the financial highlights.
Notes to Financial Statements
| 9. | FEDERAL INCOME TAX INFORMATION (continued) |
The tax character of distributions paid were as follows:
| | | | | | |
| | | For the Year
Ended 12/31/09 | | For the Year
Ended 12/31/08 |
Ordinary income | | $ | — | | $ | 1,967,508 |
Long-term capital gains | | | — | | | 927,125 |
At December 31, 2009, the tax basis components of distributable earnings and the net unrealized appreciation based on identified cost for federal income tax purposes were as follows:
| | | | |
Cost for federal income tax purposes | | $ | 243,282,433 | |
Unrealized appreciation | | $ | 43,884,337 | |
Unrealized depreciation | | | (13,969,654 | ) |
| | | | |
Net unrealized appreciation | | $ | 29,914,683 | |
Capital loss carryover | | | 37,719,346 | |
The capital loss carryover, disclosed above, available to the extent allowed by tax law to offset future net capital gain, if any, will expire as follows:
| | | | | |
| | | Loss Carryover | | Expiration Date |
| | $ | 33,158,704 | | December 31, 2016 |
| | $ | 4,560,642 | | December 31, 2017 |
On February 2, 2010, The PNC Financial Services Group, Inc. (“PNC”), which serves as the Series’ sub-accountant services agent and sub-transfer agent, entered into a Stock Purchase Agreement (the “Stock Purchase Agreement”) with The Bank of New York Mellon Corporation (“BNY Mellon”), the Series’ custodian. Upon the terms and subject to the conditions set forth in the Stock Purchase Agreement, which has been approved by the board of directors of each company, PNC will sell to BNY Mellon (the “Stock Sale”) 100% of the issued and outstanding shares of PNC Global Investment Servicing Inc., an indirect, wholly-owned subsidiary of PNC. The Stock Sale is expected to close in the third quarter of 2010. Management has concluded that this will not have a material impact on the Series’ financial statements.
There were no other subsequent events that require recognition or disclosure. In preparing these financial statements, management of the Fund has evaluated events and transactions for potential recognition or disclosure through February 23, 2010, the date the financial statements were issued.
Report of Independent Registered Public Accounting Firm
To the Board of Directors of Manning & Napier Fund, Inc. and Shareholders of Life Sciences Series:
In our opinion, the accompanying statement of assets and liabilities, including the investment portfolio, and the related statements of operations and of changes in net assets and the financial highlights present fairly, in all material respects, the financial position of the Life Sciences Series (a series of Manning & Napier Fund, Inc., hereafter referred to as the “Series”) at December 31, 2009, and the results of its operations for the year then ended, the changes in its net assets for each of the two years in the period then ended and the financial highlights for each of the five years in the period then ended, in conformity with accounting principles generally accepted in the United States of America. These financial statements and financial highlights (hereafter referred to as “financial statements”) are the responsibility of the Series’ management; our responsibility is to express an opinion on these financial statements based on our audits. We conducted our audits of these financial statements in accordance with the standards of the Public Company Accounting Oversight Board (United States). Those standards require that we plan and perform the audit to obtain reasonable assurance about whether the financial statements are free of material misstatement. An audit includes examining, on a test basis, evidence supporting the amounts and disclosures in the financial statements, assessing the accounting principles used and significant estimates made by management, and evaluating the overall financial statement presentation. We believe that our audits, which included confirmation of securities at December 31, 2009 by correspondence with the custodian, provide a reasonable basis for our opinion.

Columbus, Ohio
February 23, 2010
Renewal of Investment Advisory Agreement (unaudited)
At the Manning & Napier Fund, Inc. (the “Fund”) Board of Directors’ (the “Board”) meeting, held on December 7, 2009, the Investment Advisory Agreement (the “Agreement”) between the Fund and Manning & Napier Advisors, Inc. (the “Advisor”) was reviewed by the Board for renewal. In connection with the decision whether to renew the Agreement, a variety of material was prepared for and reviewed by the Board.
Representatives of the Advisor attended the meeting and presented additional oral and written information to the Board to assist the Board in its considerations. The discussion immediately below outlines the materials and information presented to the Board in connection with the Board’s 2009 Annual Review of the Agreement and the conclusions made by the Directors when determining to continue the Agreement.
| | • | | The Board considered the services provided by the Advisor under the Agreement including, among others: deciding what securities to purchase and sell for each Series; arranging for the purchase and sale of such securities by placing orders with broker-dealers; administering the affairs of the Fund (including the books and records of the Fund not maintained by third party service providers such as the custodian or sub-transfer agent); arranging for the insurance coverage for the Fund; and supervising the preparation of tax returns, SEC filings (including registration statements) and reports to shareholders for the Fund. The Board also considered the nature and quality of such services provided under the Agreement in light of the Advisor’s services provided to the Fund for 23 years. The Board discussed the quality of these services with representatives from the Advisor and concluded that the Advisor was performing its services to the Fund required under the Agreement in a reasonable manner. |
| | • | | The Board considered the investment performance of the various Series of the Fund. The investment performance for each Series was reviewed on a cumulative basis since inception and on a one year basis. In addition, annualized performance for the following time periods was considered: inception, three year, five year, ten year, and current market cycle. A market cycle includes periods of both rising and falling markets. Returns for established benchmark indices for each Series were provided for each time period. The Board noted that the various Series were competitive against their respective benchmarks and/or peer groups over various time periods, but in particular over the full market cycle periods relevant for the Series. In addition, the Board considered at the meeting (and considers on a quarterly basis) a peer group performance analysis consisting of Morningstar universes of mutual funds with similar investment objectives. The Board discussed the performance with representatives from the Advisor and concluded that the investment performance of each of the Fund’s Series was reasonable based on the Fund’s actual performance and comparative performance, especially performance over the current market cycle. |
| | • | | The Board considered the costs of the Advisor’s services and the profits of the Advisor as they relate to the Advisor’s services to the Fund under the Agreement. In reviewing the Advisor’s costs and profits, the Board discussed the Advisor’s revenues generated from the Fund (on both an actual and adjusted basis) and its expenses associated with providing the services under the Agreement. In addition, the Board reviewed the Advisor’s expenses associated with Fund activities outside of the Agreement (such as expense reimbursements pursuant to expense caps and payments made by the Advisor to third party platforms on which shares of the Fund are available for purchase). It was noted by representatives of the Advisor that 13 of the 26 active Series of the Fund are currently experiencing expenses above the capped expense ratios. After discussing the above costs and profits, the Board concluded that the Advisor’s profitability relating to its services provided under the Agreement was reasonable. |
Renewal of Investment Advisory Agreement (unaudited)
| | • | | The Board considered the fees and expenses of the various Series of the Fund. The Advisor presented the advisory fees and total expenses for each Series, including the advisory fee adjusted for any expense waivers or reimbursements (either contractual or voluntary) paid by the Advisor. The advisory fees and expense ratios of each Series were compared to an average (on both a mean and median basis) of similar funds as disclosed on the Morningstar database. Representatives of the Advisor discussed with the Board the levels of its advisory fee for each Series of the Fund and as compared to the median and mean advisory fees for similar funds as listed on Morningstar. Expense ratios for every Series, except the Global Fixed Income Series and the Target Series Class R and Class C, are currently below the median and mean for similar funds as listed on Morningstar. Based on their review of the information provided, the Board concluded that the fees and expenses of each Series of the Fund were reasonable on a comparative basis. |
| | • | | The Board also considered the other benefits the Advisor derives from its relationship with the Fund. Such other benefits include certain research products provided by soft dollars. Given the level of soft dollar transactions involving the Fund, the Board concluded that these additional benefits to the Advisor were reasonable. |
| | • | | In addition to the factors described above, the Board considered the Advisor’s personnel, investment strategies, policies and procedures relating to compliance with personal securities transactions, and reputation, expertise and resources in domestic and foreign financial markets. The Board concluded that these factors support the conclusion that the Advisor performs its services in a reasonable manner. |
| | • | | The Board did not consider economies of scale at this time because of the multiple uses of the Fund (for the Advisor’s discretionary investment account clients in addition to direct investors), the current profitability of the Advisor’s services to the Fund under the Agreement, and the overall size of the Fund complex. |
Based on the Board’s deliberations and their evaluation of the information described above, the Board, including a majority of Directors that are not “interested persons” as defined in the Investment Company Act of 1940, concluded that the compensation under the Agreement was fair and reasonable in light of the services and expenses and such other matters as the Directors considered to be relevant in the exercise of their reasonable judgment. Accordingly, the Board approved the renewal of the Agreement. In the course of their deliberations, the Directors did not identify any particular information that was all important or controlling.
Directors’ and Officers’ Information (unaudited)
The Statement of Additional Information provides additional information about the Fund’s directors and officers and can be obtained without charge by calling 1-800-466-3863, at www.manningnapieradvisors.com, or on the EDGAR Database on the SEC Internet web site (http:// www.sec.gov). The following chart shows certain information about the Fund’s officers and directors, including their principal occupations during the last five years. Unless specific dates are provided, the individuals have held the listed positions for longer than five years.
INTERESTED DIRECTOR/OFFICER
| | |
| Name: | | B. Reuben Auspitz* |
| Address: | | 290 Woodcliff Drive |
| | Fairport, NY 14450 |
| Age: | | 62 |
| Current Position(s) Held with Fund: | | Principal Executive Officer, President, Chairman & Director |
| Term of Office1 & Length of Time Served: | | Indefinite - Director since 1984; Vice President 1984 - 2003; President since 2004; Principal Executive Officer since 2002 |
| Principal Occupation(s) During Past 5 Years: | | Executive Vice President; Co-Executive Director; Executive Group Member**; Chief Compliance Officer since 2004 - Manning & Napier Advisors, Inc. President; Director - Manning & Napier Investor Services, Inc. Holds or has held one or more of the following titles for various subsidiaries and affiliates: President, Vice President, Director, Chairman, Treasurer, Chief Compliance Officer or Member. |
| Number of Portfolios Overseen within Fund Complex: | | 29 |
| Other Directorships Held Outside Fund Complex: | | N/A |
| |
| INDEPENDENT DIRECTORS | | |
| |
| Name: | | Stephen B. Ashley |
| Address: | | 290 Woodcliff Drive |
| | Fairport, NY 14450 |
| Age: | | 69 |
| Current Position(s) Held with Fund: | | Director, Audit Committee Member, Governance & Nominating Committee Member |
| Term of Office & Length of Time Served: | | Indefinite - Since 1996 |
| Principal Occupation(s) During Past 5 Years: | | Chairman, Director, President & Chief Executive Officer, The Ashley Group (property management and investment). Chairman (non-executive) 2004 - 2008; Director 1995 - 2008 - Fannie Mae (mortgage) |
| Number of Portfolios Overseen within Fund Complex: | | 29 |
| Other Directorships Held Outside Fund Complex: | | The Ashley Group |
| Name: | | Peter L. Faber |
| Address: | | 290 Woodcliff Drive |
| | Fairport, NY 14450 |
| Age: | | 71 |
| Current Position(s) Held with Fund: | | Director, Governance & Nominating Committee Member |
| Term of Office & Length of Time Served: | | Indefinite - Since 1987 |
| Principal Occupation(s) During Past 5 Years: | | Senior Counsel since 2006, Partner (1995-2006) - McDermott, Will & Emery LLP (law firm) |
| Number of Portfolios Overseen within Fund Complex: | | 29 |
| Other Directorships Held Outside Fund Complex: | | Partnership for New York City, Inc. (non-profit) New York Collegium (non-profit) Boston Early Music Festival (non-profit) Amherst Early Music, Inc. (non-profit) Gotham Early Music Scene, Inc. (non-profit) |
Directors’ and Officers’ Information (unaudited)
| | |
| |
| INDEPENDENT DIRECTORS (continued) | | |
| |
| Name: | | Harris H. Rusitzky |
| Address: | | 290 Woodcliff Drive |
| | Fairport, NY 14450 |
| Age: | | 75 |
| Current Position(s) Held with Fund: | | Director, Audit Committee Member, Governance & Nominating |
| | Committee Member |
| Term of Office & Length of Time Served: | | Indefinite - Since 1985 |
| Principal Occupation(s) During Past 5 Years: | | President, The Greening Group (business consultants) since 1994; |
| | Partner, The Restaurant Group (restaurants) since 2006 |
| Number of Portfolios Overseen within Fund Complex: | | 29 |
| Other Directorships Held Outside Fund Complex: | | N/A |
| Name: | | Paul A. Brooke |
| Address: | | 290 Woodcliff Drive |
| | Fairport, NY 14450 |
| Age: | | 64 |
| Current Position(s) Held with Fund: | | Director, Audit Committee Member, Governance & Nominating |
| | Committee Member |
| Term of Office & Length of Time Served: | | Indefinite - Since 2007 |
| Principal Occupation(s) During Past 5 Years: | | Chairman & CEO, Alsius Corp. (investments); Managing Member, |
| | PMSV Holdings LLC (investments) |
| Number of Portfolios Overseen within Fund Complex: | | 29 |
| Other Directorships Held Outside Fund Complex: | | Incyte Corp. |
| | ViroPharma, Inc. |
| | WebMD |
| | Cheyne Capital International |
| | MPM Bio-equities |
| | GMP Companies |
| | | HoustonPharma |
| Name: | | Richard M. Hurwitz |
| Address: | | 290 Woodcliff Drive |
| | Fairport, NY 14450 |
| Age: | | 46 |
| Current Position(s) Held with Fund: | | Director, Audit Committee Member, Governance & Nominating |
| | Committee Member |
| Term of Office & Length of Time Served: | | Indefinite - Since 2009 |
| Principal Occupation(s) During Past 5 Years: | | Managing Partner, Aegis Investment Partners, LLC (investments) |
| | since 2006; Founder and Managing Partner (2004-2005) - Village |
| | Markets, LLC (groceries) |
| Number of Portfolios Overseen within Fund Complex: | | 29 |
| Other Directorships Held Outside Fund Complex: | | Pictometry International Corp. |
Directors’ and Officers’ Information (unaudited)
OFFICERS
| | |
| |
| Name: | | Jeffrey S. Coons, Ph.D., CFA |
| Address: | | 290 Woodcliff Drive |
| | Fairport, NY 14450 |
| Age: | | 46 |
| Current Position(s) Held with Fund: | | Vice President |
| Term of Office1 & Length of Time Served: | | Since 2004 |
| Principal Occupation(s) During Past 5 Years: | | Co-Director of Research since 2002 & Executive Group Member** since 2003, Manning & Napier Advisors, Inc. Holds one or more of the following titles for various subsidiaries and affiliates: President, Director, Treasurer or Senior Trust Officer. |
| Number of Portfolios Overseen within Fund Complex: | | 29 |
| Other Directorships Held Outside Fund Complex: | | N/A |
| Name: | | Christine Glavin |
| Address: | | 290 Woodcliff Drive |
| | Fairport, NY 14450 |
| Age: | | 43 |
| Current Position(s) Held with Fund: | | Principal Financial Officer, Chief Financial Officer |
| Term of Office1 & Length of Time Served: | | Principal Financial Officer since 2002; Chief Financial Officer since |
| | 2001 |
| Principal Occupation(s) During Past 5 Years: | | Fund Reporting Manager, Manning & Napier Advisors, Inc. since |
| | 1997 |
| Number of Portfolios Overseen within Fund Complex: | | 29 |
| Other Directorships Held Outside Fund Complex: | | N/A |
| Name: | | Jodi L. Hedberg |
| Address: | | 290 Woodcliff Drive |
| | Fairport, NY 14450 |
| Age: | | 42 |
| Current Position(s) Held with Fund: | | Corporate Secretary, Chief Compliance Officer, Anti-Money |
| | Laundering Compliance Officer |
| Term of Office1 & Length of Time Served: | | Corporate Secretary since 1997; Chief Compliance Officer since |
| | 2004 |
| Principal Occupation(s) During Past 5 Years: | | Director of Compliance, Manning & Napier Advisors, Inc. and affiliates since 1990 (title change in 2005 from Compliance Manager to Director of Compliance); Corporate Secretary, Manning & Napier Investor Services, Inc. since 2006 |
| Number of Portfolios Overseen within Fund Complex: | | 29 |
| Other Directorships Held Outside Fund Complex: | | N/A |
*Interested Director, within the meaning of the Investment Company Act of 1940 by reason of his position with the Fund’s investment advisor and distributor. Mr. Auspitz serves as the Executive Vice President and Director, Manning & Napier Advisors, Inc. and President and Director, Manning & Napier Investor Services, Inc., the Fund’s distributor.
**The Executive Group performs the duties of the Office of the Chief Executive of Manning & Napier Advisors, Inc.
1The term of office for President, Vice President, Chief Financial Officer, and Corporate Secretary is one year and until their respective successors are chosen and qualified. All other officers’ terms are indefinite.
Literature Requests (unaudited)
Proxy Voting Policies and Procedures
A description of the policies and procedures that the Fund uses to determine how to vote proxies relating to portfolio securities is available, without charge, upon request:
| | |
By phone | | 1-800-466-3863 |
On the Securities and Exchange Commission’s (SEC) web site | | http://www.sec.gov |
Proxy Voting Record
Information regarding how the Fund voted proxies relating to portfolio securities during the most recent 12-month period ended June 30th is available, without charge, upon request:
| | |
By phone | | 1-800-466-3863 |
On the SEC’s web site | | http://www.sec.gov |
Quarterly Portfolio Holdings
The Series’ complete schedule of portfolio holdings for the 1st and 3rd quarters of each fiscal year are provided on Form N-Q, and are available, without charge, upon request:
| | |
By phone | | 1-800-466-3863 |
On the SEC’s web site | | http://www.sec.gov |
The Series’ Form N-Q may be reviewed and copied at the SEC’s Public Reference Room in Washington, D.C. Information on the operation of the Public Reference Room may be obtained by calling 1-800-SEC-0330.
Prospectus and Statement of Additional Information (SAI)
The prospectus and SAI provide additional information about each Series, including charges, expenses and risks. These documents are available, without charge, upon request:
| | |
By phone | | 1-800-466-3863 |
On the SEC’s web site | | http://www.sec.gov |
On the Advisor’s web site | | http://www.manningnapieradvisors.com |
Additional information available at www.manningnapieradvisors.com
1. Fund Holdings - Month-End
2. Fund Holdings - Quarter-End
3. Shareholder Report - Annual
4. Shareholder Report - Semi-Annual


Management Discussion and Analysis (unaudited)

Dear Shareholders:
Over the past twelve months, investor sentiment has moved rather quickly from extreme pessimism to guarded optimism. Volatility continued into the first quarter of 2009, with small cap stocks down nearly 15%. After hitting a low point in late March, broad domestic and foreign stock markets turned upwards rather dramatically, and small cap stocks in particular rose nearly 50% off their lows through the end of the year.
While this turnaround has not been enough to fully offset losses experienced during the current bear market, recent returns indicate that market participants appear more confident in an economic rebound. The Russell 2000® Index earned a return of 27.17% during 2009. The Small Cap Series meaningfully out-performed the Russell 2000® Index, with a return of 48.39% during 2009.
As equity market volatility heightened during the last quarter of 2008 and first quarter of 2009, the Series made a number of portfolio adjustments. Specifically, the Series reduced the number of overall positions to focus on the most financially stable companies with strong competitive positions in an effort to reduce volatility. Also, the Series was able to take advantage of severe market volatility early in the year to invest in previously larger capitalization companies whose price declines pushed them into the small capitalization space.
The Series added to holdings in the Healthcare and Technology sectors, which contributed to the Series’ out-performance during 2009. During the year, the Series also invested in a number of industries that were suffering from weak demand and low returns, such as airlines, trucking and energy. Using our Hurdle Rate strategy, which seeks out the strongest positioned companies in cyclically declining industries, these investments paid off as investors began to sense the beginning of an economic rebound. Lastly, the Series also benefited from a small allocation to the Financial Services sector, which was the worst performing sector for the year.
From a macro perspective, the current environment remains challenging. On the one hand, more encouraging pockets of optimism have been found in the housing and manufacturing sectors, and while the unemployment rate continues to move higher, there are subtle signs of improvement in the U.S. labor markets. On the other hand, macro-economic challenges remain in the face of a growing government deficit, continued easy monetary policy, a debt-burdened U.S. consumer and widespread inflation concerns.
We recognize that solving yesterday’s problems may create new and different macro-economic challenges. Our approach has always been to remain cognizant of macro-economic conditions, but to allow company-specific factors to drive our investment decisions. In an environment like today, the very uncertainty that makes investors cautious can also create attractively priced investment opportunities for long-term investors. Over the past year, many of these opportunities have been represented by high quality growth companies and well-positioned companies in cyclical industries that are experiencing supply responses to lower demand. We will continue to seek out such opportunities as the next phase of this market and economic cycle unfolds.
As always, we appreciate your business.
Sincerely,
Manning & Napier Advisors, Inc.
Performance Update as of December 31, 2009 (unaudited)
| | | | | | | | | | |
| | | Average Annual Total Returns
As of December 31, 2009 | | |
| | | One
Year | | Five
Year | | Ten
Year | | Since
Inception1 | | |
Manning & Napier Fund, Inc. - Small Cap Series2 | | 48.39% | | -2.21% | | 5.03% | | 6.73% | | |
Standard & Poor’s (S&P) 500 Total Return Index3 | | 26.50% | | 0.43% | | -0.94% | | 7.88% | | |
Russell 2000® Index3 | | 27.17% | | 0.51% | | 3.51% | | 8.27% | | |
The following graph compares the value of a $10,000 investment in the Manning & Napier Fund, Inc. - Small Cap Series for the ten years ended December 31, 2009 to the S&P 500 Total Return Index and the Russell 2000® Index.
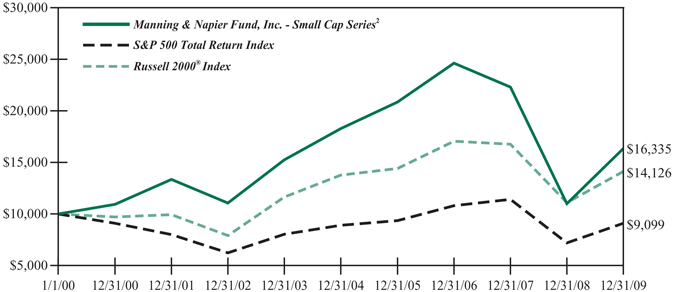
1Performance numbers for the Series and Indices are calculated from April 30, 1992, the Series’ current activation date.
2The Series’ performance does not reflect the deduction of taxes that a shareholder would pay on fund distributions or the redemption of shares. The Series’ performance is historical and may not be indicative of future results. The performance returns shown are inclusive of the net expense ratio of the Series. For the year ended December 31, 2009, this net expense ratio was 1.15%. The gross expense ratio, which does not account for any voluntary or contractual waivers currently in effect, was 1.15% for the year ended December 31, 2009.
3The S&P 500 Total Return Index is an unmanaged capitalization-weighted measure of 500 widely held common stocks listed on the New York Stock Exchange, American Stock Exchange and the Over-the-Counter market. The Index returns assume daily reinvestment of dividends. The Russell 2000® Index is an unmanaged index that consists of 2,000 U.S. small-capitalization stocks. The Index returns are based on a market capitalization-weighted average of relative price changes of the component stocks plus dividends whose reinvestments are compounded daily. Both Indices’ returns, unlike Series returns, do not reflect any fees or expenses.
Shareholder Expense Example (unaudited)
As a shareholder of the Series, you may incur two types of costs: (1) transaction costs, including potential wire charges on redemptions and (2) ongoing costs, including management fees and other Series expenses. This example is intended to help you understand your ongoing costs (in dollars) of investing in the Series and to compare these costs with the ongoing costs of investing in other mutual funds.
The example is based on an investment of $1,000 invested at the beginning of the period and held for the entire period (July 1, 2009 to December 31, 2009).
Actual Expenses
The first line of the table below provides information about actual account values and actual expenses. You may use the information in this line, together with the amount you invested, to estimate the expenses that you paid over the period. Simply divide your account value by $1,000 (for example, an $8,600 account value divided by $1,000 = 8.6), then multiply the result by the number in the first line under the heading entitled “Expenses Paid During Period” to estimate the expenses you paid on your account during this period.
Hypothetical Example for Comparison Purposes
The second line of the table below provides information about hypothetical account values and hypothetical expenses based on the Series’ actual expense ratio and an assumed rate of return of 5% per year before expenses, which is not the Series’ actual return. The hypothetical account values and expenses may not be used to estimate the actual ending account balance or expenses you paid during the period. You may use this information to compare the ongoing costs of investing in the Series and other funds. To do so, compare this 5% hypothetical example with the 5% hypothetical examples that appear in the shareholder reports of the other funds.
Please note that the expenses shown in the table are meant to highlight your ongoing costs only and do not reflect any transaction costs, such as potential wire charges on redemptions. Therefore, the second line of the table is useful in comparing ongoing costs only, and will not help you determine the relative total costs of owning different funds. In addition, if these transaction costs were included, your costs would have been higher.
| | | | | | | | | |
| | | Beginning
Account Value
7/1/09 | | Ending
Account Value
12/31/09 | | Expenses Paid
During Period*
7/1/09-12/31/09 |
Actual | | $ | 1,000.00 | | $ | 1,215.50 | | $ | 6.37 |
Hypothetical
(5% return before expenses) | | $ | 1,000.00 | | $ | 1,019.46 | | $ | 5.80 |
*Expenses are equal to the Series’ annualized expense ratio (for the six-month period) of 1.14%, multiplied by the average account value over the period, multiplied by 184/365 (to reflect the one-half year period). Expenses are based on the most recent fiscal half year; therefore, the expense ratio stated above may differ from the expense ratio stated in the financial highlights, which is based on one-year data. The Series’ total return would have been lower had certain expenses not been waived during the period.
Portfolio Composition as of December 31, 2009 (unaudited)
Sector Allocation1
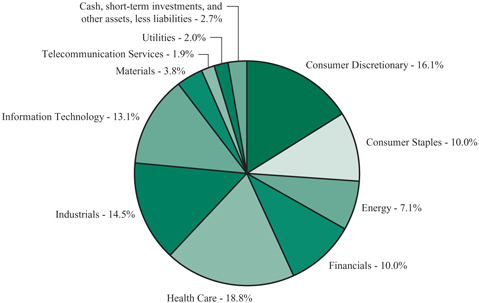
1As a percentage of net assets.
Market Capitalization
| | |
Average | | $1,833 Million |
Median | | 1,603 Million |
Weighted Average | | 1,804 Million |
Top Ten Stock Holdings2
| | |
Dick’s Sporting Goods, Inc. | | 3.2% |
Diagnosticos da America S.A. (Brazil) | | 3.0% |
Calgon Carbon Corp. | | 3.0% |
AirTran Holdings, Inc. | | 2.7% |
Tomra Systems ASA (Norway) | | 2.7% |
Blue Coat Systems, Inc. | | 2.7% |
Zoll Medical Corp. | | 2.5% |
PerkinElmer, Inc. | | 2.4% |
BJ’s Wholesale Club, Inc. | | 2.3% |
Inverness Medical Innovations, Inc. | | 2.3% |
2As a percentage of total investments.
Investment Portfolio - December 31, 2009
| | | | | |
| | | Shares | | Value
(Note 2) |
| | | | | |
| | |
COMMON STOCKS - 97.3% | | | | | |
| | |
Consumer Discretionary - 16.1% | | | | | |
Auto Components - 1.1% | | | | | |
WABCO Holdings, Inc. | | 75,790 | | $ | 1,954,624 |
| | | | | |
Hotels, Restaurants & Leisure - 2.4% | | | | | |
Choice Hotels International, Inc. | | 52,060 | | | 1,648,220 |
International Game Technology | | 135,130 | | | 2,536,390 |
| | | | | |
| | | | | 4,184,610 |
| | | | | |
Household Durables - 3.2% | | | | | |
NVR, Inc.* | | 4,180 | | | 2,970,768 |
Rodobens Negocios Imobiliarios S.A. (Brazil) | | 253,670 | | | 2,618,294 |
| | | | | |
| | | | | 5,589,062 |
| | | | | |
Media - 1.0% | | | | | |
Mediacom Communications Corp. - Class A* | | 372,920 | | | 1,666,952 |
| | | | | |
Multiline Retail - 1.5% | | | | | |
Nordstrom, Inc. | | 68,580 | | | 2,577,236 |
| | | | | |
Specialty Retail - 6.9% | | | | | |
Dick’s Sporting Goods, Inc.* | | 217,630 | | | 5,412,458 |
Dufry South America Ltd. - BDR (Bermuda) | | 81,910 | | | 1,693,716 |
The Finish Line, Inc. - Class A | | 235,030 | | | 2,949,627 |
Lumber Liquidators Holdings, Inc.* | | 64,430 | | | 1,726,724 |
| | | | | |
| | | | | 11,782,525 |
| | | | | |
Total Consumer Discretionary | | | | | 27,755,009 |
| | | | | |
Consumer Staples - 10.0% | | | | | |
Food & Staples Retailing - 3.2% | | | | | |
BJ’s Wholesale Club, Inc.* | | 120,500 | | | 3,941,555 |
SUPERVALU, Inc. | | 116,870 | | | 1,485,418 |
| | | | | |
| | | | | 5,426,973 |
| | | | | |
Food Products - 5.4% | | | | | |
Dean Foods Co.* | | 181,060 | | | 3,266,322 |
Flowers Foods, Inc. | | 128,450 | | | 3,051,972 |
Sanderson Farms, Inc. | | 43,020 | | | 1,813,723 |
Tootsie Roll Industries, Inc. | | 41,715 | | | 1,142,157 |
| | | | | |
| | | | | 9,274,174 |
| | | | | |
Personal Products - 1.4% | | | | | |
Alberto-Culver Co. | | 85,360 | | | 2,500,194 |
| | | | | |
Total Consumer Staples | | | | | 17,201,341 |
| | | | | |
Energy - 7.1% | | | | | |
Energy Equipment & Services - 4.8% | | | | | |
Calfrac Well Services Ltd. (Canada) | | 132,210 | | | 2,635,730 |
Dril-Quip, Inc.* | | 56,690 | | | 3,201,851 |
| | |
| 5 | | The accompanying notes are an integral part of the financial statements. |
Investment Portfolio - December 31, 2009
| | | | | |
| | | Shares | | Value
(Note 2) |
| | | | | |
| | |
COMMON STOCKS (continued) | | | | | |
| | |
Energy (continued) | | | | | |
Energy Equipment & Services (continued) | | | | | |
Trican Well Service Ltd. (Canada) | | 180,290 | | $ | 2,423,749 |
| | | | | |
| | | | | 8,261,330 |
| | | | | |
Oil, Gas & Consumable Fuels - 2.3% | | | | | |
Forest Oil Corp.* | | 50,270 | | | 1,118,507 |
Mariner Energy, Inc.* | | 76,770 | | | 891,300 |
Uranium One, Inc. (Canada)* | | 679,280 | | | 1,961,491 |
| | | | | |
| | | | | 3,971,298 |
| | | | | |
Total Energy | | | | | 12,232,628 |
| | | | | |
Financials - 10.0% | | | | | |
Capital Markets - 1.9% | | | | | |
Federated Investors, Inc. - Class B | | 117,940 | | | 3,243,350 |
| | | | | |
Commercial Banks - 1.6% | | | | | |
First Commonwealth Financial Corp. | | 223,150 | | | 1,037,648 |
Wilmington Trust Corp. | | 135,150 | | | 1,667,751 |
| | | | | |
| | | | | 2,705,399 |
| | | | | |
Real Estate Investment Trusts (REITS) - 3.9% | | | | | |
American Campus Communities, Inc. | | 63,600 | | | 1,787,160 |
Corporate Office Properties Trust | | 85,740 | | | 3,140,656 |
Home Properties, Inc. | | 37,670 | | | 1,797,236 |
| | | | | |
| | | | | 6,725,052 |
| | | | | |
Thrifts & Mortgage Finance - 2.6% | | | | | |
First Niagara Financial Group, Inc. | | 176,580 | | | 2,456,228 |
NewAlliance Bancshares, Inc. | | 175,460 | | | 2,107,274 |
| | | | | |
| | | | | 4,563,502 |
| | | | | |
Total Financials | | | | | 17,237,303 |
| | | | | |
Health Care - 18.8% | | | | | |
Biotechnology - 1.0% | | | | | |
Celera Corp.* | | 250,160 | | | 1,728,605 |
| | | | | |
Health Care Equipment & Supplies - 7.2% | | | | | |
Inverness Medical Innovations, Inc.* | | 93,350 | | | 3,874,959 |
OraSure Technologies, Inc.* | | 436,500 | | | 2,217,420 |
Teleflex, Inc. | | 35,760 | | | 1,927,106 |
Zoll Medical Corp.* | | 162,290 | | | 4,336,389 |
| | | | | |
| | | | | 12,355,874 |
| | | | | |
Health Care Providers & Services - 4.0% | | | | | |
Diagnosticos da America S.A. (Brazil) | | 157,250 | | | 5,147,431 |
| | |
| The accompanying notes are an integral part of the financial statements. | | 6 |
Investment Portfolio - December 31, 2009
| | | | | |
| | | Shares | | Value
(Note 2) |
| | | | | |
| | |
COMMON STOCKS (continued) | | | | | |
| | |
Health Care (continued) | | | | | |
Health Care Providers & Services (continued) | | | | | |
VCA Antech, Inc.* | | 68,630 | | $ | 1,710,260 |
| | | | | |
| | | | | 6,857,691 |
| | | | | |
Health Care Technology - 4.3% | | | | | |
Cerner Corp.* | | 46,280 | | | 3,815,323 |
Eclipsys Corp.* | | 194,290 | | | 3,598,251 |
| | | | | |
| | | | | 7,413,574 |
| | | | | |
Life Sciences Tools & Services - 2.3% | | | | | |
PerkinElmer, Inc. | | 195,580 | | | 4,026,992 |
| | | | | |
Total Health Care | | | | | 32,382,736 |
| | | | | |
Industrials - 14.5% | | | | | |
Airlines - 3.7% | | | | | |
AirTran Holdings, Inc.* | | 890,250 | | | 4,647,105 |
JetBlue Airways Corp.* | | 302,490 | | | 1,648,571 |
| | | | | |
| | | | | 6,295,676 |
| | | | | |
Building Products - 1.5% | | | | | |
Owens Corning, Inc.* | | 101,040 | | | 2,590,666 |
| | | | | |
Commercial Services & Supplies - 2.7% | | | | | |
Tomra Systems ASA (Norway) | | 962,570 | | | 4,605,200 |
| | | | | |
Machinery - 3.6% | | | | | |
Lindsay Corp. | | 47,870 | | | 1,907,620 |
Titan International, Inc. | | 195,550 | | | 1,585,910 |
Wabtec Corp. | | 67,360 | | | 2,750,982 |
| | | | | |
| | | | | 6,244,512 |
| | | | | |
Road & Rail - 3.0% | | | | | |
Heartland Express, Inc. | | 158,860 | | | 2,425,792 |
Knight Transportation, Inc. | | 145,450 | | | 2,805,731 |
| | | | | |
| | | | | 5,231,523 |
| | | | | |
Total Industrials | | | | | 24,967,577 |
| | | | | |
Information Technology - 13.1% | | | | | |
Communications Equipment - 6.5% | | | | | |
Blue Coat Systems, Inc.* | | 159,510 | | | 4,552,415 |
Infinera Corp.* | | 419,180 | | | 3,718,127 |
Riverbed Technology, Inc.* | | 122,240 | | | 2,807,853 |
| | | | | |
| | | | | 11,078,395 |
| | | | | |
Computers & Peripherals - 0.4% | | | | | |
Diebold, Inc. | | 25,200 | | | 716,940 |
| | | | | |
| | |
| 7 | | The accompanying notes are an integral part of the financial statements. |
Investment Portfolio - December 31, 2009
| | | | | |
| | | Shares | | Value
(Note 2) |
| | | | | |
| | |
COMMON STOCKS (continued) | | | | | |
| | |
Information Technology (continued) | | | | | |
Electronic Equipment, Instruments & Components - 1.1% | | | | | |
Cogent, Inc.* | | 185,410 | | $ | 1,926,410 |
| | | | | |
IT Services - 1.4% | | | | | |
Online Resources Corp.* | | 469,640 | | | 2,470,306 |
| | | | | |
Software - 3.7% | | | | | |
Net 1 UEPS Technologies, Inc. (South Africa)* | | 42,850 | | | 832,147 |
TIBCO Software, Inc.* | | 343,330 | | | 3,306,268 |
UbiSoft Entertainment S.A. (France)* | | 153,640 | | | 2,184,883 |
| | | | | |
| | | | | 6,323,298 |
| | | | | |
Total Information Technology | | | | | 22,515,349 |
| | | | | |
Materials - 3.8% | | | | | |
Chemicals - 3.8% | | | | | |
Calgon Carbon Corp.* | | 365,870 | | | 5,085,593 |
The Scotts Miracle-Gro Co. - Class A | | 35,400 | | | 1,391,574 |
| | | | | |
Total Materials | | | | | 6,477,167 |
| | | | | |
Telecommunication Services - 1.9% | | | | | |
Wireless Telecommunication Services - 1.9% | | | | | |
SBA Communications Corp. - Class A* | | 93,550 | | | 3,195,668 |
| | | | | |
Utilities - 2.0% | | | | | |
Independent Power Producers & Energy Traders - 2.0% | | | | | |
Mirant Corp.* | | 104,160 | | | 1,590,523 |
RRI Energy, Inc.* | | 312,670 | | | 1,788,473 |
| | | | | |
Total Utilities | | | | | 3,378,996 |
| | | | | |
TOTAL COMMON STOCKS
(Identified Cost $139,802,458) | | | | | 167,343,774 |
| | | | | |
| | |
| The accompanying notes are an integral part of the financial statements. | | 8 |
Investment Portfolio - December 31, 2009
| | | | | | |
| | | Shares/
Principal Amount | | Value
(Note 2) |
| | | | | | |
| | |
SHORT-TERM INVESTMENTS - 2.3% | | | | | | |
Dreyfus Cash Management, Inc. - Institutional Shares1, 0.07% | | | 1,938,987 | | $ | 1,938,987 |
Fannie Mae Discount Note2 , 0.09%, 1/12/2010 | | $ | 2,000,000 | | | 1,999,970 |
| | | | | | |
TOTAL SHORT-TERM INVESTMENTS
(Identified Cost $3,938,932) | | | | | | 3,938,957 |
| | | | | | |
TOTAL INVESTMENTS - 99.6%
(Identified Cost $143,741,390) | | | | | | 171,282,731 |
| | |
OTHER ASSETS, LESS LIABILITIES - 0.4% | | | | | | 627,258 |
| | | | | | |
NET ASSETS - 100% | | | | | $ | 171,909,989 |
| | | | | | |
BDR - Brazilian Depository Receipt
*Non-income producing security
1Rate shown is the current yield as of December 31, 2009.
2Rate shown reflects the annualized yield at time of purchase.
| | |
| 9 | | The accompanying notes are an integral part of the financial statements. |
Statement of Assets and Liabilities
December 31, 2009
| | | | |
ASSETS: | | | | |
| |
Investments, at value (identified cost $143,741,390) (Note 2) | | $ | 171,282,731 | |
Receivable for securities sold | | | 727,393 | |
Receivable for fund shares sold | | | 272,635 | |
Dividends receivable | | | 100,007 | |
| | | | |
TOTAL ASSETS | | | 172,382,766 | |
| | | | |
LIABILITIES: | | | | |
| |
Accrued management fees (Note 3) | | | 143,080 | |
Accrued fund accounting and transfer agent fees (Note 3) | | | 13,205 | |
Accrued directors’ fees (Note 3) | | | 3,141 | |
Accrued Chief Compliance Officer service fees (Note 3) | | | 476 | |
Payable for fund shares repurchased | | | 265,381 | |
Audit fees payable | | | 32,292 | |
Other payables and accrued expenses | | | 15,202 | |
| | | | |
TOTAL LIABILITIES | | | 472,777 | |
| | | | |
TOTAL NET ASSETS | | $ | 171,909,989 | |
| | | | |
NET ASSETS CONSIST OF: | | | | |
| |
Capital stock | | $ | 232,538 | |
Additional paid-in-capital | | | 237,590,085 | |
Accumulated net realized loss on investments, foreign currency and translation of other assets and liabilities | | | (93,454,184 | ) |
Net unrealized appreciation on investments and translation of other assets and liabilities | | | 27,541,550 | |
| | | | |
TOTAL NET ASSETS | | $ | 171,909,989 | |
| | | | |
NET ASSET VALUE, OFFERING PRICE AND REDEMPTION
PRICE PER SHARE - CLASS A ($171,909,989/23,253,752 shares) | | $ | 7.39 | |
| | | | |
| | |
| The accompanying notes are an integral part of the financial statements. | | 10 |
Statement of Operations
For the Year Ended December 31, 2009
| | | | |
INVESTMENT INCOME: | | | | |
| |
Dividends (net of foreign taxes withheld, $19,872) | | $ | 1,126,665 | |
Interest | | | 4,934 | |
| | | | |
Total Investment Income | | | 1,131,599 | |
| | | | |
| EXPENSES: | | | | |
| |
Management fees (Note 3) | | | 1,402,076 | |
Fund accounting and transfer agent fees (Note 3) | | | 90,607 | |
Directors’ fees (Note 3) | | | 12,849 | |
Chief Compliance Officer service fees (Note 3) | | | 3,729 | |
Custodian fees | | | 20,152 | |
Miscellaneous | | | 84,521 | |
| | | | |
Total Expenses | | | 1,613,934 | |
Less reduction of expenses (Note 3) | | | (1,237 | ) |
| | | | |
Net Expenses | | | 1,612,697 | |
| | | | |
NET INVESTMENT LOSS | | | (481,098 | ) |
| | | | |
| REALIZED AND UNREALIZED GAIN (LOSS) ON INVESTMENTS AND FOREIGN CURRENCY: | | | | |
| |
Net realized loss on - | | | | |
Investments | | | (22,201,147 | ) |
Foreign currency and translation of other assets and liabilities | | | (35,413 | ) |
| | | | |
| | | (22,236,560 | ) |
| | | | |
| |
Net change in unrealized appreciation (depreciation) on - | | | | |
Investments | | | 78,306,831 | |
Foreign currency and translation of other assets and liabilities | | | 918 | |
| | | | |
| | | 78,307,749 | |
| | | | |
NET REALIZED AND UNREALIZED GAIN (LOSS) ON
INVESTMENTS AND FOREIGN CURRENCY | | | 56,071,189 | |
| | | | |
NET INCREASE IN NET ASSETS RESULTING FROM
OPERATIONS | | $ | 55,590,091 | |
| | | | |
| | |
| 11 | | The accompanying notes are an integral part of the financial statements. |
Statements of Changes in Net Assets
| | | | | | | | |
| | | For the
Year Ended
12/31/09 | | | For the
Year Ended
12/31/08 | |
| | | | | | | | |
| INCREASE (DECREASE) IN NET ASSETS: | | | | | | | | |
| | |
| OPERATIONS: | | | | | | | | |
| | |
Net investment loss | | $ | (481,098 | ) | | $ | (590,551 | ) |
Net realized loss on investments and foreign currency | | | (22,236,560 | ) | | | (71,346,243 | ) |
Net change in unrealized appreciation (depreciation) on investments and foreign currency | | | 78,307,749 | | | | (26,249,635 | ) |
| | | | | | | | |
Net increase (decrease) from operations | | | 55,590,091 | | | | (98,186,429 | ) |
| | | | | | | | |
DISTRIBUTIONS TO SHAREHOLDERS (Note 8): | | | | | | | | |
| | |
From net realized gain on investments | | | — | | | | (1,696,201 | ) |
| | | | | | | | |
| CAPITAL STOCK ISSUED AND REPURCHASED: | | | | | | | | |
| | |
Net increase (decrease) from capital share transactions (Note 5) | | | (3,842,395 | ) | | | 35,046,424 | |
| | | | | | | | |
Net increase (decrease) in net assets | | | 51,747,696 | | | | (64,836,206 | ) |
| | |
| NET ASSETS: | | | | | | | | |
| | |
Beginning of year | | | 120,162,293 | | | | 184,998,499 | |
| | | | | | | | |
End of year (including undistributed net investment income (loss) of $0 and $(92,455), respectively) | | $ | 171,909,989 | | | $ | 120,162,293 | |
| | | | | | | | |
| | |
| The accompanying notes are an integral part of the financial statements. | | 12 |
Financial Highlights
| | | | | | | | | | |
| | | | | For the Years Ended | | |
| | | 12/31/09 | | 12/31/08 | | 12/31/07 | | 12/31/06 | | 12/31/05 |
| | | | | | | | | | |
| | | | | | | | | | |
Per share data (for a share outstanding throughout each year): | | | | | | | | | | |
Net asset value - Beginning of year | | $4.98 | | $10.21 | | $13.08 | | $13.66 | | $15.01 |
| | | | | | | | | | |
Income (loss) from investment operations: | | | | | | | | | | |
Net investment loss | | (0.02)1 | | (0.02) | | (0.01) | | (0.05) | | (0.07) |
Net realized and unrealized gain (loss) on investments | | 2.43 | | (5.12) | | (1.25) | | 2.55 | | 2.20 |
| | | | | | | | | | |
Total from investment operations | | 2.41 | | (5.14) | | (1.26) | | 2.50 | | 2.13 |
| | | | | | | | | | |
Less distributions to shareholders: | | | | | | | | | | |
From net realized gain on investments | | — | | (0.09) | | (1.61) | | (3.08) | | (3.48) |
| | | | | | | | | | |
Net asset value - End of year | | $7.39 | | $4.98 | | $10.21 | | $13.08 | | $13.66 |
| | | | | | | | | | |
Net assets - End of year (000’s omitted) | | $171,910 | | $120,162 | | $184,998 | | $175,491 | | $154,416 |
| | | | | | | | | | |
Total return2 | | 48.39% | | (50.68%) | | (9.32%) | | 18.06% | | 14.11% |
| Ratios (to average net assets)/ Supplemental Data: | | | | | | | | | | |
Expenses | | 1.15%* | | 1.15% | | 1.14% | | 1.16% | | 1.19% |
Net investment loss | | (0.34%) | | (0.39%) | | (0.08%) | | (0.40%) | | (0.51%) |
Portfolio turnover | | 76% | | 68% | | 64% | | 85% | | 55% |
|
*The investment advisor did not impose all or a portion of its CCO fees, fund accounting and transfer agent fees during the year ended 12/31/09. If these expenses had been incurred by the Series, the expense ratio (to average net assets) would have been increased by 0.00%3. |
1Calculated based on average shares outstanding during the year.
2Represents aggregate total return for the year indicated, and assumes reinvestment of all distributions. Total return would have been lower had certain expenses not been waived during the year.
3Less than 0.01%.
| | |
| 13 | | The accompanying notes are an integral part of the financial statements. |
Notes to Financial Statements
Small Cap Series (the “Series”) is a no-load diversified series of Manning & Napier Fund, Inc. (the “Fund”).The Fund is organized in Maryland and is registered under the Investment Company Act of 1940, as amended, as an open-end management investment company.
The Series’ investment objective is to provide long-term growth by investing principally in the common stocks of companies with small market capitalizations.
The Series is authorized to issue five classes of shares (Class A, B, D, E and Z). Currently, only Class A shares have been issued. Each class of shares is substantially the same, except that class-specific distribution and shareholder servicing expenses are borne by the specific class of shares to which they relate.
The Fund’s Advisor is Manning & Napier Advisors, Inc. (the “Advisor”). Shares of the Series are offered to investors, clients and employees of the Advisor and its affiliates. The total authorized capital stock of the Fund consists of 10.0 billion shares of common stock each having a par value of $0.01. As of December 31, 2009, 4.6 billion shares have been designated in total among 29 series, of which 87.5 million have been designated as Small Cap Series Class A common stock.
| 2. | SIGNIFICANT ACCOUNTING POLICIES |
Security Valuation
Portfolio securities, including domestic equities, foreign equities, exchange-traded funds and options, listed on an exchange other than the NASDAQ National Market System are valued at the latest quoted sales price of the exchange on which the security is primarily traded. Securities not traded on valuation date or securities not listed on an exchange are valued at the latest quoted bid price provided by the Fund’s pricing service. Securities listed on the NASDAQ National Market System are valued in accordance with the NASDAQ Official Closing Price.
Short-term investments that mature in sixty days or less are valued at amortized cost, which approximates market value. Investments in open-end investment companies are valued at their net asset value per share on valuation date.
Volume and level of activity in established markets for an asset or liability are evaluated to determine whether recent transactions and quoted prices are determinative of fair value. Where there have been significant decreases in volume and level of activity, further analysis and adjustment may be necessary to estimate fair value. The Series measures fair value in these instances by the use of inputs and valuation techniques which may be based upon current market prices of securities that are comparable in coupon, rating, maturity and industry and/or expectation of future cash flows. As a result of trading in relatively thin markets and/or markets that experience significant volatility, the prices used by the Series to value these securities may differ from the value that would be realized if these securities were sold, and the differences could be material.
Securities for which representative valuations or prices are not available from the Fund’s pricing service may be valued at fair value. Due to the inherent uncertainty of valuations of such securities, the fair value may differ significantly from the values that would have been used had a ready market for such securities existed. If trading or events occurring after the close of the principal market in which securities are traded are expected to materially affect the value of those securities, then they may be valued at their fair value, taking this trading or these events into account. Fair
Notes to Financial Statements
| 2. | SIGNIFICANT ACCOUNTING POLICIES (continued) |
Security Valuation (continued)
value is determined in good faith by the Advisor under procedures approved by and under the general supervision and responsibility of the Fund’s Board of Directors (the “Board”).
Various inputs are used in determining the value of the Series’ assets or liabilities carried at market value. These inputs are summarized in three broad levels. Level 1 includes quoted prices in active markets for identical assets and liabilities. Level 2 includes other significant observable inputs (including quoted prices for similar securities, interest rates, prepayment speeds, credit risk, etc.). Level 3 includes significant unobservable inputs (including the Series’ own assumptions in determining the fair value of investments). The inputs or methodology used for valuing securities are not necessarily an indication of the risk associated with investing in those securities.
The following is a summary of the valuation levels used for major security types as of December 31, 2009 in valuing the Series’ assets or liabilities carried at market value:
| | | | | | | | | | | | |
| Description: | | 12/31/09 | | Level 1 | | Level 2 | | Level 3 |
| | | | | | | | | | | | |
| | | | | | | | | | | | |
Equity securities* | | $ | 167,343,774 | | $ | 167,343,774 | | $ | — | | $ | — |
Preferred securities | | | — | | | — | | | — | | | — |
Debt securities: | | | | | | | | | | | | |
US Treasury and other US government agencies | | | 1,999,970 | | | — | | | 1,999,970 | | | — |
Mutual funds | | | 1,938,987 | | | 1,938,987 | | | — | | | — |
Other financial instruments** | | | — | | | — | | | — | | | — |
| | | | | | | | | | | | |
Total | | $ | 171,282,731 | | $ | 169,282,761 | | $ | 1,999,970 | | $ | — |
| | | | | | | | | | | | |
*Includes common stock, warrants and rights. Please see the Investment Portfolio for industry classification.
**Other financial instruments are derivative instruments not reflected in the Investment Portfolio, such as futures, forwards and swap contracts, which are valued at the unrealized appreciation/depreciation on the instrument. As of December 31, 2009, the Series did not hold any derivative instruments.
There were no Level 3 securities held by the Series as of December 31, 2008 or December 31, 2009.
Interim and annual reporting periods beginning after December 15, 2009 will require additional disclosure regarding transfers in and/or out of Level 1 and 2. Additional disclosure surrounding the activity in Level 3 fair value measurement will also be effective for fiscal years beginning after December 15, 2010. Management has concluded that this will not have a material impact on the Series’ financial statements.
Security Transactions, Investment Income and Expenses
Security transactions are accounted for on trade date. Dividend income is recorded on the ex-dividend date, except that if the ex-dividend date has passed, certain dividends from foreign securities are recorded as soon as the Fund is informed of the ex-dividend date. Non-cash dividends, if any, are recorded at the fair market value of the securities received. Interest income, including
Notes to Financial Statements
| 2. | SIGNIFICANT ACCOUNTING POLICIES (continued) |
Security Transactions, Investment Income and Expenses (continued)
amortization of premium and accretion of discounts using the effective interest method, is earned from settlement date and accrued daily.
Expenses are recorded on an accrual basis. Most expenses of the Fund can be attributed to a specific series. Expenses which cannot be directly attributed are apportioned among the series in the Fund in such a manner as deemed equitable by the Fund’s Board, taking into consideration, among other things, the nature and type of expense.
The Fund records distributions received in excess of income from underlying investments as a reduction of cost of investments and/or realized gain. Such amounts are based on estimates if actual amounts are not available and actual amounts of income, realized gain and return of capital may differ from the estimated amounts. The Fund adjusts the estimated amounts of components of distributions (and consequently its net investment income) as necessary once the issuers provide information about the actual composition of the distributions.
The Series uses the identified cost method for determining realized gain or loss on investments for both financial statement and federal income tax reporting purposes.
Foreign Currency Translation
The books and records of the Series are maintained in U.S. dollars. Foreign currencies, investments and other assets and liabilities are translated into U.S. dollars at the current exchange rates. Purchases and sales of investment securities and income and expenses are translated on the respective dates of such transactions. The Series does not isolate realized and unrealized gains and losses attributable to changes in the exchange rates from gains and losses that arise from changes in the market value of investments. Such fluctuations are included with net realized and unrealized gain or loss on investments. Net realized foreign currency gains and losses represent foreign currency gains and losses between trade date and settlement date on securities transactions, gains and losses on disposition of foreign currencies and the difference between the amount of income and foreign withholding taxes recorded on the books of the Series and the amounts actually received or paid.
Federal Taxes
The Series’ policy is to comply with the provisions of the Internal Revenue Code applicable to regulated investment companies. The Series is not subject to federal income tax or excise tax to the extent that the Series distributes to shareholders each year its taxable income, including any net realized gains on investments, in accordance with requirements of the Internal Revenue Code. Accordingly, no provision for federal income tax or excise tax has been made in the financial statements.
Management evaluates its tax positions to determine if the tax positions taken meet the minimum recognition threshold in connection with accounting for uncertainties in income tax positions taken or expected to be taken for the purposes of measuring and recognizing tax liabilities in the financial statements. Recognition of tax benefits of an uncertain tax position is required only when the position is “more likely than not” to be sustained assuming examination by taxing authorities. At December 31, 2009, the Series has recorded no liability for net unrecognized tax benefits relating to uncertain income tax positions taken or expected to be taken in future tax returns.
Notes to Financial Statements
| 2. | SIGNIFICANT ACCOUNTING POLICIES (continued) |
Federal Taxes (continued)
The Series files income tax returns in the U.S. federal jurisdiction, various states and foreign jurisdictions, as required. No income tax returns are currently under investigation. The statute of limitations on the Series’ tax returns remains open for the years ended December 31, 2006 through December 31, 2009. The Fund is not aware of any tax positions for which it is reasonably possible that the total amounts of unrecognized tax benefits will significantly change in the next twelve months.
Additionally, based on the Fund’s understanding of the tax rules and rates related to income, gains and transactions for foreign jurisdictions in which it invests, the Series will provide for foreign taxes, and where appropriate, deferred foreign tax.
Distributions of Income and Gains
Distributions to shareholders of net investment income and net realized gains are made annually. An additional distribution may be necessary to avoid taxation of the Series. Distributions are recorded on the ex-dividend date.
Indemnifications
The Fund’s organizational documents provide former and current directors and officers with a limited indemnification against liabilities arising in connection with the performance of their duties to the Fund. In the normal course of business, the Fund may also enter into contracts that provide general indemnifications. The Fund’s maximum exposure under these arrangements is unknown as this would be dependent on future claims that may be made against the Fund. The risk of material loss from such claims is considered remote.
Other
The preparation of financial statements in conformity with accounting principles generally accepted in the United States of America requires management to make estimates and assumptions that affect the reported amounts of assets and liabilities and the disclosure of contingent assets and liabilities at the date of the financial statements and the reported amounts of income and expenses during the reporting period. Actual results could differ from those estimates.
| 3. | TRANSACTIONS WITH AFFILIATES |
The Fund has an Investment Advisory Agreement (the “Agreement”) with the Advisor, for which the Series pays a fee, computed daily and payable monthly, at an annual rate of 1.00% of the Series’ average daily net assets.
Under the Agreement, personnel of the Advisor provide the Series with advice and assistance in the choice of investments and the execution of securities transactions, and otherwise maintain the Series’ organization. The Advisor also provides the Fund with necessary office space and fund administration and support services. The salaries of all officers of the Fund (except a percentage of the Fund’s Chief Compliance Officer’s salary, which is paid by the Fund), and of all Directors who are “affiliated persons” of the Fund, or of the Advisor, and all personnel of the Fund, or of the Advisor, performing services relating to research, statistical and investment activities, are paid by the Advisor. Each “non-affiliated” Director receives an annual stipend, which is allocated among all the active series of the Fund. In addition, these Directors also receive a fee per Board meeting attended for each active series of the Fund plus a fee for each committee meeting attended.
Notes to Financial Statements
| 3. | TRANSACTIONS WITH AFFILIATES (continued) |
Manning & Napier Investor Services, Inc., a registered broker-dealer affiliate of the Advisor, acts as distributor for the Fund’s shares. The services of Manning & Napier Investor Services, Inc. are provided at no additional cost to the Series.
For fund accounting and transfer agent services through November 7, 2009, the Fund paid the Advisor an annual fee of 0.055% of the Fund’s average daily net assets up to $4.5 billion, 0.03% of the Fund’s average daily net assets between $4.5 billion and $7.5 billion, and 0.02% of the Fund’s average daily net assets over $7.5 billion. Additionally, certain transaction and account-based fees and out-of-pocket expenses, including charges for reporting relating to the Fund’s compliance program, were charged. Expenses not directly attributable to a Series are allocated based on each Series’ relative net assets or number of accounts, depending on the expense. Prior to October 12, 2009 (for sub-accountant) and November 9, 2009 (for sub-transfer agent) the Advisor had an agreement with Citi Fund Services Ohio, Inc. (“Citi”) under which Citi served as sub-accountant and sub-transfer agent. The Advisor voluntarily agreed to waive a portion of the fund accounting and transfer agent fees and the Chief Compliance Officer service fees for the period March 1, 2009 to April 30, 2009. Accordingly, the Advisor waived fees of $1,237, which is included as a reduction of expenses on the Statement of Operations.
The Advisor has entered into agreements dated October 12, 2009 and November 9, 2009 with PNC Global Investment Servicing (“PNCGIS”) under which PNCGIS serves as sub-accountant services agent and sub-transfer agent, respectively. Effective November 7, 2009 under the amended master services agreement, the Fund pays the Advisor an annual fee of 0.0175% on the first $3 billion of average daily net assets (excluding Target Series); 0.015% on the next $3 billion of average daily net assets (excluding Target Series); and 0.01% of the average daily net assets in excess of $6 billion (excluding Target Series); plus a base fee of $25,500 per Series. Additionally, certain transaction-, account-, and cusip-based fees and out-of-pocket expenses, including charges for reporting relating to the Fund’s compliance program, are charged.
| 4. | PURCHASES AND SALES OF SECURITIES |
For the year ended December 31, 2009, purchases and sales of securities, other than United States Government securities and short-term securities, were $100,311,710 and $101,287,067, respectively. There were no purchases or sales of United States Government securities.
| 5. | CAPITAL STOCK TRANSACTIONS |
Transactions in Class A shares of Small Cap Series were:
| | | | | | | | | | | | | | |
| | | For the Year
Ended 12/31/09 | | | For the Year
Ended 12/31/08 | |
| | | Shares | | | Amount | | | Shares | | | Amount | |
| | | | | | | | | | | | | | |
Sold | | 3,622,635 | | | $ | 20,933,139 | | | 9,626,461 | | | $ | 62,628,594 | |
Reinvested | | — | | | | — | | | 210,004 | | | | 1,675,830 | |
Repurchased | | (4,476,178 | ) | | | (24,775,534 | ) | | (3,840,314 | ) | | | (29,258,000 | ) |
| | | | | | | | | | | | | | |
Total | | (853,543 | ) | | $ | (3,842,395 | ) | | 5,996,151 | | | $ | 35,046,424 | |
| | | | | | | | | | | | | | |
Approximately 89% of the Series’ shares represent investments by fiduciary accounts over which the Advisor has sole investment discretion.
Notes to Financial Statements
The Series may trade in instruments including written and purchased options, forward foreign currency exchange contracts and futures contracts and other derivatives in the normal course of investing activities to assist in managing exposure to various market risks. The Series may be subject to various elements of risk and may involve, to a varying degree, elements of risk in excess of the amounts recognized for financial statement purposes; the risk that changes in the value of a derivative may not correlate perfectly with the underlying asset, rate or index; counterparty credit risk related to over the counter derivatives counterparties failure to perform under contract terms; liquidity risk related to the lack of a liquid market for these contracts allowing the fund to close out its position(s); and documentation risk relating to disagreement over contract terms. No such investments were held by the Series during the year ended December 31, 2009.
Investing in securities of foreign companies and foreign governments involves special risks and considerations not typically associated with investing in securities of domestic companies and the U.S. Government. These risks include revaluation of currencies and future adverse political and economic developments. Moreover, securities of foreign companies and foreign governments and their markets may be less liquid and their prices more volatile than those of comparable domestic companies and the U.S. Government.
| 8. | FEDERAL INCOME TAX INFORMATION |
The amount and characterization of certain income and capital gains to be distributed are determined in accordance with federal income tax regulations, which may differ from accounting principles generally accepted in the United States of America. These differences are primarily due to differing book and tax treatments in the timing of the recognition of net investment income or gains and losses, including net operating losses, losses deferred due to wash sales, foreign currency gains and losses and Post-October losses. The Series may periodically make reclassifications among its capital accounts to reflect income and gains available for distribution (or available capital loss carryovers) under income tax regulations without impacting the Series’ net asset value. Any such reclassifications are not reflected in the financial highlights.
The tax character of distributions paid were as follows:
| | | | | | |
| | | For the Year
Ended 12/31/09 | | For the Year
Ended 12/31/08 |
Ordinary income | | $ | — | | $ | 242,042 |
Long-term capital gains | | | — | | | 1,454,159 |
At December 31, 2009, the tax basis components of distributable earnings and the net unrealized appreciation based on identified cost for federal income tax purposes were as follows:
| | | | |
Cost for federal income tax purposes | | $ | 143,754,703 | |
Unrealized appreciation | | $ | 33,504,685 | |
Unrealized depreciation | | | (5,976,657 | ) |
| | | | |
Net unrealized appreciation | | $ | 27,528,028 | |
Capital loss carryover | | | 93,440,871 | |
Notes to Financial Statements
| 8. | FEDERAL INCOME TAX INFORMATION (continued) |
The capital loss carryover, disclosed above, available to the extent allowed by tax law to offset future net capital gain, if any, will expire as follows:
| | | | | |
| | | Loss Carryover | | Expiration Date |
| | $ | 41,066,982 | | December 31, 2016 |
| | $ | 52,373,889 | | December 31, 2017 |
On February 2, 2010, the PNC Financial Services Group, Inc. (“PNC”), which serves as the Series’ sub-accountant services agent and sub-transfer agent, entered into a Stock Purchase Agreement (the “Stock Purchase Agreement”) with The Bank of New York Mellon Corporation (“BNY Mellon”), the Series’ custodian. Upon the terms and subject to the conditions set forth in the Stock Purchase Agreement, which has been approved by the board of directors of each company, PNC will sell to BNY Mellon (the “Stock Sale”) 100% of the issued and outstanding shares of PNC Global Investment Servicing, Inc., an indirect, wholly-owned subsidiary of PNC. The Stock Sale is expected to close in the third quarter of 2010. Management has concluded that this will not have a material impact on the Series’ financial statements.
There were no other subsequent events that require recognition or disclosure. In preparing these financial statements, management of the Fund has evaluated events and transactions for potential recognition or disclosure through February 23, 2010, the date the financial statements were issued.
Report of Independent Registered Public Accounting Firm
To the Board of Directors of Manning & Napier Fund, Inc. and Shareholders of Small Cap Series:
In our opinion, the accompanying statement of assets and liabilities, including the investment portfolio, and the related statements of operations and of changes in net assets and the financial highlights present fairly, in all material respects, the financial position of the Small Cap Series (a series of Manning & Napier Fund, Inc., hereafter referred to as the “Series”) at December 31, 2009, and the results of its operations for the year then ended, the changes in its net assets for each of the two years in the period then ended and the financial highlights for each of the five years in the period then ended, in conformity with accounting principles generally accepted in the United States of America. These financial statements and financial highlights (hereafter referred to as “financial statements”) are the responsibility of the Series’ management; our responsibility is to express an opinion on these financial statements based on our audits. We conducted our audits of these financial statements in accordance with the standards of the Public Company Accounting Oversight Board (United States). Those standards require that we plan and perform the audit to obtain reasonable assurance about whether the financial statements are free of material misstatement. An audit includes examining, on a test basis, evidence supporting the amounts and disclosures in the financial statements, assessing the accounting principles used and significant estimates made by management, and evaluating the overall financial statement presentation. We believe that our audits, which included confirmation of securities at December 31, 2009 by correspondence with the custodian, provide a reasonable basis for our opinion.

Columbus, Ohio
February 23, 2010
Renewal of Investment Advisory Agreement (unaudited)
At the Manning & Napier Fund, Inc. (the “Fund”) Board of Directors’ (the “Board”) meeting, held on December 7, 2009, the Investment Advisory Agreement (the “Agreement”) between the Fund and Manning & Napier Advisors, Inc. (the “Advisor”) was reviewed by the Board for renewal. In connection with the decision whether to renew the Agreement, a variety of material was prepared for and reviewed by the Board.
Representatives of the Advisor attended the meeting and presented additional oral and written information to the Board to assist the Board in its considerations. The discussion immediately below outlines the materials and information presented to the Board in connection with the Board’s 2009 Annual Review of the Agreement and the conclusions made by the Directors when determining to continue the Agreement.
| | • | | The Board considered the services provided by the Advisor under the Agreement including, among others: deciding what securities to purchase and sell for each Series; arranging for the purchase and sale of such securities by placing orders with broker-dealers; administering the affairs of the Fund (including the books and records of the Fund not maintained by third party service providers such as the custodian or sub-transfer agent); arranging for the insurance coverage for the Fund; and supervising the preparation of tax returns, SEC filings (including registration statements) and reports to shareholders for the Fund. The Board also considered the nature and quality of such services provided under the Agreement in light of the Advisor’s services provided to the Fund for 23 years. The Board discussed the quality of these services with representatives from the Advisor and concluded that the Advisor was performing its services to the Fund required under the Agreement in a reasonable manner. |
| | • | | The Board considered the investment performance of the various Series of the Fund. The investment performance for each Series was reviewed on a cumulative basis since inception and on a one year basis. In addition, annualized performance for the following time periods was considered: inception, three year, five year, ten year, and current market cycle. A market cycle includes periods of both rising and falling markets. Returns for established benchmark indices for each Series were provided for each time period. The Board noted that the various Series were competitive against their respective benchmarks and/or peer groups over various time periods, but in particular over the full market cycle periods relevant for the Series. In addition, the Board considered at the meeting (and considers on a quarterly basis) a peer group performance analysis consisting of Morningstar universes of mutual funds with similar investment objectives. The Board discussed the performance with representatives from the Advisor and concluded that the investment performance of each of the Fund’s Series was reasonable based on the Fund’s actual performance and comparative performance, especially performance over the current market cycle. |
| | • | | The Board considered the costs of the Advisor’s services and the profits of the Advisor as they relate to the Advisor’s services to the Fund under the Agreement. In reviewing the Advisor’s costs and profits, the Board discussed the Advisor’s revenues generated from the Fund (on both an actual and adjusted basis) and its expenses associated with providing the services under the Agreement. In addition, the Board reviewed the Advisor’s expenses associated with Fund activities outside of the Agreement (such as expense reimbursements pursuant to expense caps and payments made by the Advisor to third party platforms on which shares of the Fund are available for purchase). It was noted by representatives of the Advisor that 13 of the 26 active Series of the Fund are currently experiencing expenses above the capped expense ratios. After discussing the above costs and profits, the Board concluded that the Advisor’s profitability relating to its services provided under the Agreement was reasonable. |
Renewal of Investment Advisory Agreement (unaudited)
| | • | | The Board considered the fees and expenses of the various Series of the Fund. The Advisor presented the advisory fees and total expenses for each Series, including the advisory fee adjusted for any expense waivers or reimbursements (either contractual or voluntary) paid by the Advisor. The advisory fees and expense ratios of each Series were compared to an average (on both a mean and median basis) of similar funds as disclosed on the Morningstar database. Representatives of the Advisor discussed with the Board the levels of its advisory fee for each Series of the Fund and as compared to the median and mean advisory fees for similar funds as listed on Morningstar. Expense ratios for every Series, except the Global Fixed Income Series and the Target Series Class R and Class C, are currently below the median and mean for similar funds as listed on Morningstar. Based on their review of the information provided, the Board concluded that the fees and expenses of each Series of the Fund were reasonable on a comparative basis. |
| | • | | The Board also considered the other benefits the Advisor derives from its relationship with the Fund. Such other benefits include certain research products provided by soft dollars. Given the level of soft dollar transactions involving the Fund, the Board concluded that these additional benefits to the Advisor were reasonable. |
| | • | | In addition to the factors described above, the Board considered the Advisor’s personnel, investment strategies, policies and procedures relating to compliance with personal securities transactions, and reputation, expertise and resources in domestic and foreign financial markets. The Board concluded that these factors support the conclusion that the Advisor performs its services in a reasonable manner. |
| | • | | The Board did not consider economies of scale at this time because of the multiple uses of the Fund (for the Advisor’s discretionary investment account clients in addition to direct investors), the current profitability of the Advisor’s services to the Fund under the Agreement, and the overall size of the Fund complex. |
Based on the Board’s deliberations and their evaluation of the information described above, the Board, including a majority of Directors that are not “interested persons” as defined in the Investment Company Act of 1940, concluded that the compensation under the Agreement was fair and reasonable in light of the services and expenses and such other matters as the Directors considered to be relevant in the exercise of their reasonable judgment. Accordingly, the Board approved the renewal of the Agreement. In the course of their deliberations, the Directors did not identify any particular information that was all important or controlling.
Directors’ and Officers’ Information (unaudited)
The Statement of Additional Information provides additional information about the Fund’s directors and officers and can be obtained without charge by calling 1-800-466-3863, at www.manningnapieradvisors.com, or on the EDGAR Database on the SEC Internet web site (http:// www.sec.gov). The following chart shows certain information about the Fund’s officers and directors, including their principal occupations during the last five years. Unless specific dates are provided, the individuals have held the listed positions for longer than five years.
INTERESTED DIRECTOR/OFFICER
| | |
| Name: | | B. Reuben Auspitz* |
| Address: | | 290 Woodcliff Drive Fairport, NY 14450 |
| Age: | | 62 |
| Current Position(s) Held with Fund: | | Principal Executive Officer, President, Chairman & Director |
| Term of Office1 & Length of Time Served: | | Indefinite - Director since 1984; Vice President 1984 - 2003; President since 2004; Principal Executive Officer since 2002 |
| Principal Occupation(s) During Past 5 Years: | | Executive Vice President; Co-Executive Director; Executive Group Member**; Chief Compliance Officer since 2004 - Manning & Napier Advisors, Inc. President; Director - Manning & Napier Investor Services, Inc. Holds or has held one or more of the following titles for various subsidiaries and affiliates: President, Vice President, Director, Chairman, Treasurer, Chief Compliance Officer or Member. |
| Number of Portfolios Overseen within Fund Complex: | | 29 |
| Other Directorships Held Outside Fund Complex: | | N/A |
| |
| INDEPENDENT DIRECTORS | | |
| |
| Name: | | Stephen B. Ashley |
| Address: | | 290 Woodcliff Drive |
| | Fairport, NY 14450 |
| Age: | | 69 |
| Current Position(s) Held with Fund: | | Director, Audit Committee Member, Governance & Nominating Committee Member |
| Term of Office & Length of Time Served: | | Indefinite - Since 1996 |
| Principal Occupation(s) During Past 5 Years: | | Chairman, Director, President & Chief Executive Officer, The Ashley Group (property management and investment). Chairman (non-executive) 2004 - 2008; Director 1995 - 2008 - Fannie Mae (mortgage) |
| Number of Portfolios Overseen within Fund Complex: | | 29 |
| Other Directorships Held Outside Fund Complex: | | The Ashley Group |
| Name: | | Peter L. Faber |
| Address: | | 290 Woodcliff Drive |
| | Fairport, NY 14450 |
| Age: | | 71 |
| Current Position(s) Held with Fund: | | Director, Governance & Nominating Committee Member |
| Term of Office & Length of Time Served: | | Indefinite - Since 1987 |
| Principal Occupation(s) During Past 5 Years: | | Senior Counsel since 2006, Partner (1995-2006) - McDermott, Will & Emery LLP (law firm) |
| Number of Portfolios Overseen within Fund Complex: | | 29 |
| Other Directorships Held Outside Fund Complex: | | Partnership for New York City, Inc. (non-profit) New York Collegium (non-profit) Boston Early Music Festival (non-profit) Amherst Early Music, Inc. (non-profit) Gotham Early Music Scene, Inc. (non-profit) |
Directors’ and Officers’ Information (unaudited)
| | |
| INDEPENDENT DIRECTORS (continued) | | |
| |
| Name: | | Harris H. Rusitzky |
| Address: | | 290 Woodcliff Drive Fairport, NY 14450 |
| Age: | | 75 |
| Current Position(s) Held with Fund: | | Director, Audit Committee Member, Governance & Nominating Committee Member |
| Term of Office & Length of Time Served: | | Indefinite - Since 1985 |
| Principal Occupation(s) During Past 5 Years: | | President, The Greening Group (business consultants) since 1994; Partner, The Restaurant Group (restaurants) since 2006 |
| Number of Portfolios Overseen within Fund Complex: | | 29 |
| Other Directorships Held Outside Fund Complex: | | N/A |
| Name: | | Paul A. Brooke |
| Address: | | 290 Woodcliff Drive Fairport, NY 14450 |
| Age: | | 64 |
| Current Position(s) Held with Fund: | | Director, Audit Committee Member, Governance & Nominating Committee Member |
| Term of Office & Length of Time Served: | | Indefinite - Since 2007 |
| Principal Occupation(s) During Past 5 Years: | | Chairman & CEO, Alsius Corp. (investments); Managing Member, PMSV Holdings LLC (investments) |
| Number of Portfolios Overseen within Fund Complex: | | 29 |
| Other Directorships Held Outside Fund Complex: | | Incyte Corp. ViroPharma, Inc. WebMD Cheyne Capital International MPM Bio-equities GMP Companies HoustonPharma |
| Name: | | Richard M. Hurwitz |
| Address: | | 290 Woodcliff Drive Fairport, NY 14450 |
| Age: | | 46 |
| Current Position(s) Held with Fund: | | Director, Audit Committee Member, Governance & Nominating Committee Member |
| Term of Office & Length of Time Served: | | Indefinite - Since 2009 |
| Principal Occupation(s) During Past 5 Years: | | Managing Partner, Aegis Investment Partners, LLC (investments) since 2006; Founder and Managing Partner (2004-2005) - Village Markets, LLC (groceries) |
| Number of Portfolios Overseen within Fund Complex: | | 29 |
| Other Directorships Held Outside Fund Complex: | | Pictometry International Corp. |
Directors’ and Officers’ Information (unaudited)
| | |
| OFFICERS | | |
| |
| Name: | | Jeffrey S. Coons, Ph.D., CFA |
| Address: | | 290 Woodcliff Drive |
| | Fairport, NY 14450 |
| Age: | | 46 |
| Current Position(s) Held with Fund: | | Vice President |
| Term of Office1 & Length of Time Served: | | Since 2004 |
| Principal Occupation(s) During Past 5 Years: | | Co-Director of Research since 2002 & Executive Group Member** since 2003, Manning & Napier Advisors, Inc. Holds one or more of the following titles for various subsidiaries and affiliates: President, Director, Treasurer or Senior Trust Officer. |
| Number of Portfolios Overseen within Fund Complex: | | 29 |
| Other Directorships Held Outside Fund Complex: | | N/A |
| Name: | | Christine Glavin |
| Address: | | 290 Woodcliff Drive Fairport, NY 14450 |
| Age: | | 43 |
| Current Position(s) Held with Fund: | | Principal Financial Officer, Chief Financial Officer |
| Term of Office1 & Length of Time Served: | | Principal Financial Officer since 2002; Chief Financial Officer since 2001 |
| Principal Occupation(s) During Past 5 Years: | | Fund Reporting Manager, Manning & Napier Advisors, Inc. since 1997 |
| Number of Portfolios Overseen within Fund Complex: | | 29 |
| Other Directorships Held Outside Fund Complex: | | N/A |
| Name: | | Jodi L. Hedberg |
| Address: | | 290 Woodcliff Drive Fairport, NY 14450 |
| Age: | | 42 |
| Current Position(s) Held with Fund: | | Corporate Secretary, Chief Compliance Officer, Anti-Money Laundering Compliance Officer |
| Term of Office1 & Length of Time Served: | | Corporate Secretary since 1997; Chief Compliance Officer since 2004 |
| Principal Occupation(s) During Past 5 Years: | | Director of Compliance, Manning & Napier Advisors, Inc. and affiliates since 1990 (title change in 2005 from Compliance Manager to Director of Compliance); Corporate Secretary, Manning & Napier Investor Services, Inc. since 2006 |
| Number of Portfolios Overseen within Fund Complex: | | 29 |
| Other Directorships Held Outside Fund Complex: | | N/A |
*Interested Director, within the meaning of the Investment Company Act of 1940 by reason of his position with the Fund’s investment advisor and distributor. Mr. Auspitz serves as the Executive Vice President and Director, Manning & Napier Advisors, Inc. and President and Director, Manning & Napier Investor Services, Inc., the Fund’s distributor.
**The Executive Group performs the duties of the Office of the Chief Executive of Manning & Napier Advisors, Inc.
1The term of office for President, Vice President, Chief Financial Officer, and Corporate Secretary is one year and until their respective successors are chosen and qualified. All other officers’ terms are indefinite.
Literature Requests (unaudited)
Proxy Voting Policies and Procedures
A description of the policies and procedures that the Fund uses to determine how to vote proxies relating to portfolio securities is available, without charge, upon request:
| | |
By phone | | 1-800-466-3863 |
On the Securities and Exchange Commission’s (SEC) web site | | http://www.sec.gov |
Proxy Voting Record
Information regarding how the Fund voted proxies relating to portfolio securities during the most recent 12-month period ended June 30th is available, without charge, upon request:
| | |
By phone | | 1-800-466-3863 |
On the SEC’s web site | | http://www.sec.gov |
Quarterly Portfolio Holdings
The Series’ complete schedule of portfolio holdings for the 1st and 3rd quarters of each fiscal year are provided on Form N-Q, and are available, without charge, upon request:
| | |
By phone | | 1-800-466-3863 |
On the SEC’s web site | | http://www.sec.gov |
The Series’ Form N-Q may be reviewed and copied at the SEC’s Public Reference Room in Washington, D.C. Information on the operation of the Public Reference Room may be obtained by calling 1-800-SEC-0330.
Prospectus and Statement of Additional Information (SAI)
The prospectus and SAI provide additional information about each Series, including charges, expenses and risks. These documents are available, without charge, upon request:
| | |
By phone | | 1-800-466-3863 |
On the SEC’s web site | | http://www.sec.gov |
On the Advisor’s web site | | http://www.manningnapieradvisors.com |
Additional information available at www.manningnapieradvisors.com
1. Fund Holdings - Month-End
2. Fund Holdings - Quarter-End
3. Shareholder Report - Annual
4. Shareholder Report - Semi-Annual


Management Discussion and Analysis (unaudited)

Dear Shareholders:
Over the past twelve months, investor sentiment has moved rather quickly from extreme pessimism to guarded optimism. Volatility continued into the first quarter of 2009, with broad equity markets down more than 10%. After hitting a low point in late March, both domestic and foreign stock markets turned upwards rather dramatically, posting 40% to 60% returns off their lows through the end of the year.
While this turnaround has not been enough to fully offset losses experienced during the current bear market, recent returns indicate that market participants appear more confident in an economic rebound. For the twelve months ended December 31, 2009, the S&P 500 Total Return Index returned 26.50% while the S&P 500 Information Technology Index earned a remarkable 61.75% (i.e., the best performing market sector for 2009).
The Technology Series performed in line with the S&P 500 Information Technology Index, significantly outpacing the broad stock market with a 61.90% return during 2009. More importantly, the Series continues to have a strong track record relative to the broad market and the sector-specific benchmark over the current market cycle, which includes both a bull and a bear market. Over this current market cycle (10/1/02 to 12/31/09), the Technology Series has earned an annualized return of 20.57% relative to the 6.52% return of the S&P 500 Index and the 11.23% return of the S&P 500 Information Technology Index.
The Series began 2009 with a heavy weighting in the software industry, seeking to benefit from the secular (i.e., non-cyclical) growth drivers and strong recurring revenue that characterizes many companies in this industry. Communications equipment represented the second largest weighting in the Series, including investments exposed to growth in routing, switching, wide-area-network operation and bandwith management, all areas believed to benefit from the growth of wireless data and migration of communications over Internet Protocol-based networks. Both industries contributed to strong performance throughout 2009, and the Series trimmed holdings in each area to realize market gains during the year.
During 2009, the Series added to holdings in the wireless communications industry, including investments in a number of wireless tower operators, in response to rapid growth in the consumption of wireless data. Overall, the Series maintains a lower allocation to this industry relative to the benchmark, which also aided returns in 2009. In contrast, the Series’ much smaller allocation to IT hardware relative to the Information Technology benchmark detracted from relative returns during the year. While the Technology sector overall produced strong returns for investors during 2009, the Series’ strong stock selection in a number of industries, including semiconductor capital equipment, communications equipment, wireless telecommunications services and software, was a primary driver of returns.
From a macro perspective, the current environment remains challenging. On the one hand, more encouraging pockets of optimism have been found in the housing and manufacturing sectors, and while the unemployment rate continues to move higher, there are subtle signs of improvement in the U.S. labor markets. On the other hand, macro-economic challenges remain in the face of a growing government deficit, continued easy monetary policy, a debt-burdened U.S. consumer and widespread inflation concerns.
We recognize that solving yesterday’s problems may create new and different macro-economic challenges. Our approach has always been to remain cognizant of macro-economic conditions, but to allow company-specific factors to drive our investment decisions. In an environment like today, the very uncertainty that makes investors cautious can also create attractively priced investment opportunities for long-term investors. We will continue to seek out such opportunities as the next phase of this market and economic cycle unfolds.
As always, we appreciate your business.
Sincerely,
Manning & Napier Advisors, Inc.
Performance Update as of December 31, 2009 (unaudited)
| | | | | | | | |
| | | Average Annual Total Returns
As of December 31, 2009 | | |
| | | One
Year | | Five
Year | | Since
Inception1 | | |
Manning & Napier Fund, Inc. - Technology Series2 | | 61.90% | | 6.42% | | 1.20% | | |
Standard & Poor’s (S&P) 500 Total Return Index3 | | 26.50% | | 0.43% | | -1.18% | | |
Standard & Poor’s (S&P) 500 Information Technology Index3 | | 61.75% | | 3.21% | | -7.46% | | |
The following graph compares the value of a $10,000 investment in the Manning & Napier Fund, Inc. - Technology Series from its current activation1 (8/8/00) to present (12/31/09) to the S&P 500 Total Return Index and the S&P 500 Information Technology Index.
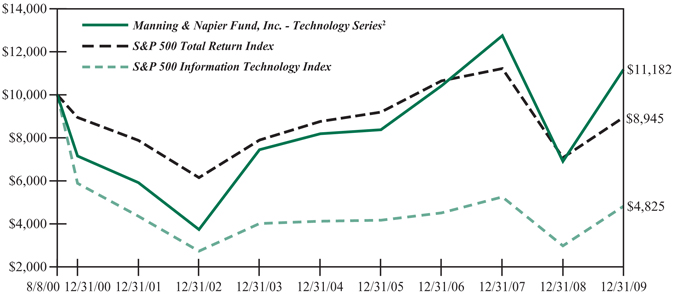
1Performance numbers for the Series and Indices are calculated from August 8, 2000, the Series’ current activation date.
2The Series’ performance does not reflect the deduction of taxes that a shareholder would pay on fund distributions or the redemption of shares. The Series’ performance is historical and may not be indicative of future results. The performance returns shown are inclusive of the net expense ratio of the Series. For the year ended December 31, 2009, this net expense ratio was 1.13%. The gross expense ratio, which does not account for any voluntary or contractual waivers currently in effect, was 1.13% for the year ended December 31, 2009.
3The S&P 500 Total Return Index is an unmanaged capitalization-weighted measure of 500 widely held common stocks listed on the New York Stock Exchange, American Stock Exchange and the Over-the-Counter market. The S&P 500 Information Technology Index, a sub-index of the S&P 500 Total Return Index, includes the stocks of companies involved in the business of technology related products and services. Both Indices’ returns assume daily reinvestment of dividends and, unlike Series returns, do not reflect any fees or expenses.
Shareholder Expense Example (unaudited)
As a shareholder of the Series, you may incur two types of costs: (1) transaction costs, including potential wire charges on redemptions and (2) ongoing costs, including management fees and other Series expenses. This example is intended to help you understand your ongoing costs (in dollars) of investing in the Series and to compare these costs with the ongoing costs of investing in other mutual funds.
The example is based on an investment of $1,000 invested at the beginning of the period and held for the entire period (July 1, 2009 to December 31, 2009).
Actual Expenses
The first line of the table below provides information about actual account values and actual expenses. You may use the information in this line, together with the amount you invested, to estimate the expenses that you paid over the period. Simply divide your account value by $1,000 (for example, an $8,600 account value divided by $1,000 = 8.6), then multiply the result by the number in the first line under the heading entitled “Expenses Paid During Period” to estimate the expenses you paid on your account during this period.
Hypothetical Example for Comparison Purposes
The second line of the table below provides information about hypothetical account values and hypothetical expenses based on the Series’ actual expense ratio and an assumed rate of return of 5% per year before expenses, which is not the Series’ actual return. The hypothetical account values and expenses may not be used to estimate the actual ending account balance or expenses you paid during the period. You may use this information to compare the ongoing costs of investing in the Series and other funds. To do so, compare this 5% hypothetical example with the 5% hypothetical examples that appear in the shareholder reports of the other funds.
Please note that the expenses shown in the table are meant to highlight your ongoing costs only and do not reflect any transaction costs, such as potential wire charges on redemptions. Therefore, the second line of the table is useful in comparing ongoing costs only, and will not help you determine the relative total costs of owning different funds. In addition, if these transaction costs were included, your costs would have been higher.
| | | | | | | | | |
| | | Beginning
Account Value
7/1/09 | | Ending
Account Value
12/31/09 | | Expenses Paid
During Period
7/1/09-12/31/09* |
Actual | | $ | 1,000.00 | | $ | 1,242.70 | | $ | 6.33 |
Hypothetical
(5% return before expenses) | | $ | 1,000.00 | | $ | 1,019.56 | | $ | 5.70 |
*Expenses are equal to the Series’ annualized expense ratio (for the six-month period) of 1.12%, multiplied by the average account value over the period, multiplied by 184/365 (to reflect the one-half year period). Expenses are based on the most recent fiscal half year; therefore, the expense ratio stated above may differ from the expense ratio stated in the financial highlights, which is based on one-year data. The Series’ total return would have been lower had certain expenses not been waived during the period.
Portfolio Composition as of December 31, 2009 (unaudited)
Sector Allocation1
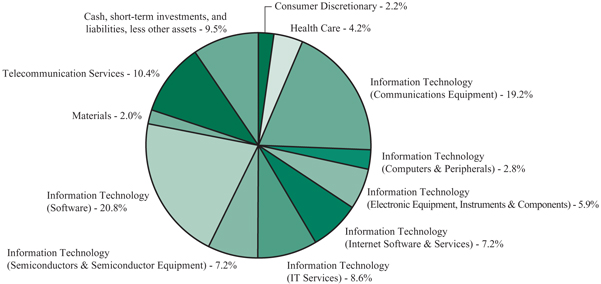
1As a percentage of net assets.
Top Ten Stock Holdings2
| | | | | | |
Blue Coat Systems, Inc. | | 4.1% | | Infinera Corp. | | 3.3% |
Crown Castle International Corp. | | 4.1% | | Cogent, Inc. | | 3.2% |
Autodesk, Inc. | | 3.9% | | Advantest Corp. (Japan) | | 3.2% |
Microsoft Corp. | | 3.6% | | Juniper Networks, Inc. | | 3.2% |
Google, Inc. - Class A | | 3.3% | | Tokyo Electron Ltd. (Japan) | | 3.1% |
2 As a percentage of total investments.
Investment Portfolio - December 31, 2009
| | | | | |
| | | Shares | | Value
(Note 2) |
| | | | | |
| | |
COMMON STOCKS - 88.9% | | | | | |
| | |
Consumer Discretionary - 2.2% | | | | | |
Hotels, Restaurants & Leisure - 2.2% | | | | | |
International Game Technology | | 184,000 | | $ | 3,453,680 |
| | | | | |
Health Care - 4.2% | | | | | |
Health Care Technology - 4.2% | | | | | |
Cerner Corp.* | | 46,980 | | | 3,873,031 |
Eclipsys Corp.* | | 151,000 | | | 2,796,520 |
| | | | | |
Total Health Care | | | | | 6,669,551 |
| | | | | |
Information Technology - 71.7% | | | | | |
Communications Equipment - 19.2% | | | | | |
Alcatel-Lucent - ADR (France)* | | 720,000 | | | 2,390,400 |
Blue Coat Systems, Inc.* | | 226,350 | | | 6,460,029 |
Cisco Systems, Inc.* | | 194,000 | | | 4,644,360 |
Infinera Corp.* | | 578,880 | | | 5,134,666 |
Juniper Networks, Inc.* | | 187,800 | | | 5,008,626 |
Nokia Corp. - ADR (Finland) | | 203,000 | | | 2,608,550 |
Riverbed Technology, Inc.* | | 179,000 | | | 4,111,630 |
| | | | | |
| | | | | 30,358,261 |
| | | | | |
Computers & Peripherals - 2.8% | | | | | |
EMC Corp.* | | 254,000 | | | 4,437,380 |
| | | | | |
Electronic Equipment, Instruments & Components - 5.9% | | | | | |
Cogent, Inc.* | | 490,000 | | | 5,091,100 |
LoJack Corp.* | | 1,038,430 | | | 4,195,257 |
| | | | | |
| | | | | 9,286,357 |
| | | | | |
Internet Software & Services - 7.2% | | | | | |
comScore, Inc.* | | 181,000 | | | 3,176,550 |
Google, Inc. - Class A* | | 8,300 | | | 5,145,834 |
Vocus, Inc.* | | 164,000 | | | 2,952,000 |
| | | | | |
| | | | | 11,274,384 |
| | | | | |
IT Services - 8.6% | | | | | |
Accenture plc - Class A (Ireland) | | 112,000 | | | 4,648,000 |
Amdocs Ltd. (Guernsey)* | | 168,000 | | | 4,793,040 |
Cap Gemini S.A. (France) | | 89,000 | | | 4,078,917 |
| | | | | |
| | | | | 13,519,957 |
| | | | | |
Semiconductors & Semiconductor Equipment - 7.2% | | | | | |
Advantest Corp. (Japan) | | 196,000 | | | 5,061,255 |
KLA-Tencor Corp | | 42,000 | | | 1,518,720 |
Tokyo Electron Ltd. (Japan) | | 76,000 | | | 4,830,837 |
| | | | | |
| | | | | 11,410,812 |
| | | | | |
| | |
| The accompanying notes are an integral part of the financial statements. | | 5 |
Investment Portfolio - December 31, 2009
| | | | | | |
| | | Shares/ Principal Amount | | Value
(Note 2) |
| | | | | | |
| | |
COMMON STOCKS (continued) | | | | | | |
| | |
Information Technology (continued) | | | | | | |
Software - 20.8% | | | | | | |
Autodesk, Inc.* | | | 243,000 | | $ | 6,174,630 |
DemandTec, Inc.* | | | 163,000 | | | 1,429,510 |
Electronic Arts, Inc.* | | | 228,000 | | | 4,047,000 |
Intuit, Inc.* | | | 120,000 | | | 3,685,200 |
Microsoft Corp | | | 185,000 | | | 5,640,650 |
Net 1 UEPS Technologies, Inc. (South Africa)* | | | 155,000 | | | 3,010,100 |
SAP AG - ADR (Germany) | | | 85,000 | | | 3,978,850 |
Shanda Interactive Entertainment Ltd. - ADR (China)* | | | 58,000 | | | 3,051,380 |
Sonic Solutions, Inc.* | | | 150,000 | | | 1,774,500 |
| | | | | | |
| | | | | | 32,791,820 |
| | | | | | |
Total Information Technology | | | | | | 113,078,971 |
| | | | | | |
Materials - 2.0% | | | | | | |
Chemicals - 2.0% | | | | | | |
Monsanto Co. | | | 39,200 | | | 3,204,600 |
| | | | | | |
Telecommunication Services - 8.8% | | | | | | |
Wireless Telecommunication Services - 8.8% | | | | | | |
American Tower Corp. - Class A* | | | 81,000 | | | 3,500,010 |
Crown Castle International Corp.* | | | 165,000 | | | 6,441,600 |
SBA Communications Corp. - Class A* | | | 114,000 | | | 3,894,240 |
| | | | | | |
Total Telecommunication Services | | | | | | 13,835,850 |
| | | | | | |
TOTAL COMMON STOCKS
(Identified Cost $123,738,800) | | | | | | 140,242,652 |
| | | | | | |
| | |
CORPORATE BONDS - 1.6% | | | | | | |
Non-Convertible Corporate Bonds - 1.6% | | | | | | |
Telecommunication Services - 1.6% | | | | | | |
Diversified Telecommunication Services - 1.6% | | | | | | |
Clearwire Communications LLC - Clearwire Finance,
Inc.1 , 12.00%, 12/1/2015
(Identified Cost $2,518,668) | | $ | 2,500,000 | | | 2,537,500 |
| | | | | | |
| | |
| 6 | | The accompanying notes are an integral part of the financial statements. |
Investment Portfolio - December 31, 2009
| | | | | | | |
| | | Shares/ Principal Amount | | Value
(Note 2) | |
| | | | | | | |
| | |
SHORT-TERM INVESTMENTS - 9.6% | | | | | | | |
Dreyfus Cash Management, Inc. - Institutional Shares2 , 0.07% | | | 9,035,379 | | $ | 9,035,379 | |
Fannie Mae Discount Note3 , 0.09%, 1/12/2010 | | $ | 3,000,000 | | | 2,999,954 | |
Federal Home Loan Bank Discount Note3 , 0.06%, 1/12/2010 | | | 3,000,000 | | | 2,999,955 | |
| | | | | | | |
TOTAL SHORT-TERM INVESTMENTS
(Identified Cost $15,035,241) | | | | | | 15,035,288 | |
| | | | | | | |
TOTAL INVESTMENTS - 100.1%
(Identified Cost $141,292,709) | | | | | | 157,815,440 | |
| | |
LIABILITIES, LESS OTHER ASSETS - (0.1%) | | | | | | (84,903 | ) |
| | | | | | | |
NET ASSETS - 100% | | | | | $ | 157,730,537 | |
| | | | | | | |
ADR - American Depository Receipt
*Non-income producing security
1 Restricted securities - Investment in securities that are restricted as to public resale under the Securities Act of 1933, as amended. This security has been sold under rule 144A and has been determined to be liquid under guidelines established by the Board of Directors. This security amounts to $2,537,500, or 1.6% of the Series’ net assets as of December 31, 2009 (see Note 2 to the financial statements).
2 Rate shown is the current yield as of December 31, 2009.
3 Rate shown reflects the annualized yield at time of purchase.
| | |
| The accompanying notes are an integral part of the financial statements. | | 7 |
Statement of Assets and Liabilities
December 31, 2009
| | | | |
ASSETS: | | | | |
| |
Investments, at value (identified cost $141,292,709) (Note 2) | | $ | 157,815,440 | |
Receivable for fund shares sold | | | 197,970 | |
Interest receivable | | | 18,989 | |
Dividends receivable | | | 11,829 | |
Foreign tax reclaims receivable | | | 953 | |
| | | | |
TOTAL ASSETS | | | 158,045,181 | |
| | | | |
LIABILITIES: | | | | |
| |
Accrued management fees (Note 3) | | | 131,303 | |
Accrued fund accounting and transfer agent fees (Note 3) | | | 12,494 | |
Accrued directors’ fees (Note 3) | | | 3,145 | |
Accrued Chief Compliance Officer service fees (Note 3) | | | 476 | |
Payable for fund shares repurchased | | | 117,955 | |
Audit fees payable | | | 32,392 | |
Due to custodian | | | 4,020 | |
Other payables and accrued expenses | | | 12,859 | |
| | | | |
TOTAL LIABILITIES | | | 314,644 | |
| | | | |
TOTAL NET ASSETS | | $ | 157,730,537 | |
| | | | |
NET ASSETS CONSIST OF: | | | | |
| |
Capital stock | | $ | 162,148 | |
Additional paid-in-capital | | | 172,513,612 | |
Accumulated net realized loss on investments, foreign currency and translation of other assets and liabilities | | | (31,467,954 | ) |
Net unrealized appreciation on investments, foreign currency and translation of other assets and liabilities | | | 16,522,731 | |
| | | | |
TOTAL NET ASSETS | | | $157,730,537 | |
| | | | |
NET ASSET VALUE, OFFERING PRICE AND REDEMPTION
PRICE PER SHARE - CLASS A ($157,730,537/16,214,783 shares) | | $ | 9.73 | |
| | | | |
| | |
| 8 | | The accompanying notes are an integral part of the financial statements. |
Statement of Operations
For the Year Ended December 31, 2009
| | | | |
INVESTMENT INCOME: | | | | |
| |
Dividends (net of foreign taxes withheld, $41,906) | | $ | 658,084 | |
Interest | | | 18,052 | |
| | | | |
Total Investment Income | | | 676,136 | |
| | | | |
| EXPENSES: | | | | |
| |
Management fees (Note 3) | | | 1,492,946 | |
Fund accounting and transfer agent fees (Note 3) | | | 91,899 | |
Directors’ fees (Note 3) | | | 12,849 | |
Chief Compliance Officer service fees (Note 3) | | | 3,729 | |
Custodian fees | | | 11,300 | |
Miscellaneous | | | 77,149 | |
| | | | |
Total Expenses | | | 1,689,872 | |
Less reduction of expenses (Note 3) | | | (1,307 | ) |
| | | | |
Net Expenses | | | 1,688,565 | |
| | | | |
NET INVESTMENT LOSS | | | (1,012,429 | ) |
| | | | |
| REALIZED AND UNREALIZED GAIN (LOSS) ON INVESTMENTS AND FOREIGN CURRENCY: | | | | |
| |
Net realized gain (loss) on - | | | | |
Investments | | | 4,677,742 | |
Foreign currency and translation of other assets and liabilities | | | (863 | ) |
| | | | |
| | | 4,676,879 | |
| | | | |
| |
Net change in unrealized appreciation (depreciation) on - | | | | |
Investments | | | 66,974,044 | |
Foreign currency and translation of other assets and liabilities | | | 499 | |
| | | | |
| | | 66,974,543 | |
| | | | |
NET REALIZED AND UNREALIZED GAIN (LOSS) ON
INVESTMENTS AND FOREIGN CURRENCY | | | 71,651,422 | |
| | | | |
NET INCREASE IN NET ASSETS RESULTING FROM
OPERATIONS | | $ | 70,638,993 | |
| | | | |
| | |
| The accompanying notes are an integral part of the financial statements. | | 9 |
Statements of Changes in Net Assets
| | | | | | | | |
| | | For the
Year Ended
12/31/09 | | | For the
Year Ended
12/31/08 | |
| | | | | | | | |
| INCREASE (DECREASE) IN NET ASSETS: | | | | | | | | |
| | |
| OPERATIONS: | | | | | | | | |
| | |
Net investment loss | | $ | (1,012,429 | ) | | $ | (918,003 | ) |
Net realized gain (loss) on investments and foreign currency | | | 4,676,879 | | | | (36,415,274 | ) |
Net change in unrealized appreciation (depreciation) on investments and foreign currency | | | 66,974,543 | | | | (67,539,469 | ) |
| | | | | | | | |
Net increase (decrease) from operations | | | 70,638,993 | | | | (104,872,746 | ) |
| | | | | | | | |
DISTRIBUTIONS TO SHAREHOLDERS (Note 9): | | | | | | | | |
| | |
From net realized gain on investments | | | — | | | | (2,835,785 | ) |
| | | | | | | | |
| CAPITAL STOCK ISSUED AND REPURCHASED: | | | | | | | | |
| | |
Net increase (decrease) from capital share transactions (Note 5) | | | (36,020,529 | ) | | | 3,141,958 | |
| | | | | | | | |
Net increase (decrease) in net assets | | | 34,618,464 | | | | (104,566,573 | ) |
| | |
| NET ASSETS: | | | | | | | | |
| | |
Beginning of year | | | 123,112,073 | | | | 227,678,646 | |
| | | | | | | | |
End of year (including undistributed net investment income (loss) of $0 and $(271,716), respectively) | | $ | 157,730,537 | | | $ | 123,112,073 | |
| | | | | | | | |
| | |
| 10 | | The accompanying notes are an integral part of the financial statements. |
Financial Highlights
| | | | | | | | | | |
| | | For the Years Ended |
| | | 12/31/09 | | 12/31/08 | | 12/31/07 | | 12/31/06 | | 12/31/05 |
| | | | | | | | | | |
| | | | | | | | | | |
| Per share data (for a share outstanding throughout each year): | | | | | | | | | | |
Net asset value - Beginning of year | | $6.01 | | $11.29 | | $10.41 | | $8.37 | | $8.19 |
| | | | | | | | | | |
Income (loss) from investment operations: | | | | | | | | | | |
Net investment loss | | (0.05)1 | | (0.05) | | (0.05) | | (0.01) | | (0.03) |
Net realized and unrealized gain (loss) on investments | | 3.77 | | (5.09) | | 2.34 | | 2.05 | | 0.21 |
| | | | | | | | | | |
Total from investment operations | | 3.72 | | (5.14) | | 2.29 | | 2.04 | | 0.18 |
| | | | | | | | | | |
Less distributions to shareholders: | | | | | | | | | | |
From net realized gain on investments | | — | | (0.14) | | (1.41) | | — | | — |
| | | | | | | | | | |
Net asset value - End of year | | $9.73 | | $6.01 | | $11.29 | | $10.41 | | $8.37 |
| | | | | | | | | | |
Net assets - End of year (000’s omitted) | | $157,731 | | $123,112 | | $227,679 | | $167,252 | | $110,656 |
| | | | | | | | | | |
Total return2 | | 61.90% | | (45.86%) | | 22.55% | | 24.37% | | 2.20% |
| Ratios (to average net assets)/Supplemental Data: | | | | | | | | | | |
Expenses* | | 1.13% | | 1.13% | | 1.13% | | 1.16% | | 1.20% |
Net investment loss | | (0.68%) | | (0.53%) | | (0.53%) | | (0.14%) | | (0.48%) |
Portfolio turnover | | 55% | | 65% | | 79% | | 83% | | 116% |
|
*The investment advisor did not impose all or a portion of its management fees, CCO fees and fund accounting and transfer agent fees in some years. If these expenses had been incurred by the Series, the expense ratio (to average net assets) |
would have been increased by the following amount: | | 0.00%3 | | N/A | | N/A | | N/A | | 0.03% |
1 Calculated based on average shares outstanding during the year.
2 Represents aggregate total return for the year indicated, and assumes reinvestment of all distributions. Total return would have been lower had certain expenses not been waived during certain years.
3 Less than 0.01%.
| | |
| The accompanying notes are an integral part of the financial statements. | | 11 |
Notes to Financial Statements
Technology Series (the “Series”) is a no-load diversified series of Manning & Napier Fund, Inc. (the “Fund”). The Fund is organized in Maryland and is registered under the Investment Company Act of 1940, as amended, as an open-end management investment company.
The Series’ investment objective is to provide long-term growth by investing principally in the common stocks of companies in technology-based industries.
The Fund’s Advisor is Manning & Napier Advisors, Inc. (the “Advisor”). On August 8, 2000, the Series resumed sales of shares to advisory clients and employees of the Advisor and its affiliates. The Series resumed offering shares directly to investors on May 18, 2004, as it had done previously from time to time. The total authorized capital stock of the Fund consists of 10.0 billion shares of common stock each having a par value of $0.01. As of December 31, 2009, 4.6 billion shares have been designated in total among 29 series, of which 100 million have been designated as Technology Series Class A common stock.
| 2. | SIGNIFICANT ACCOUNTING POLICIES |
Security Valuation
Portfolio securities, including domestic equities, foreign equities, exchange-traded funds and options, listed on an exchange other than the NASDAQ National Market System are valued at the latest quoted sales price of the exchange on which the security is primarily traded. Securities not traded on valuation date or securities not listed on an exchange are valued at the latest quoted bid price provided by the Fund’s pricing service. Securities listed on the NASDAQ National Market System are valued in accordance with the NASDAQ Official Closing Price.
Debt securities, including corporate bonds will normally be valued on the basis of evaluated bid prices provided by an independent pricing service. Certain investments in securities held by the Series may be valued on a basis of a price provided by a principal market maker. These prices may differ from the value that would have been used had a broader market for securities existed.
Short-term investments that mature in sixty days or less are valued at amortized cost, which approximates market value. Investments in open-end investment companies are valued at their net asset value per share on valuation date.
Volume and level of activity in established markets for an asset or liability are evaluated to determine whether recent transactions and quoted prices are determinative of fair value. Where there have been significant decreases in volume and level of activity, further analysis and adjustment may be necessary to estimate fair value. The Series measures fair value in these instances by the use of inputs and valuation techniques which may be based upon current market prices of securities that are comparable in coupon, rating, maturity and industry and/or expectation of future cash flows. As a result of trading in relatively thin markets and/or markets that experience significant volatility, the prices used by the Series to value these securities may differ from the value that would be realized if these securities were sold, and the differences could be material.
Securities for which representative valuations or prices are not available from the Fund’s pricing service may be valued at fair value. Due to the inherent uncertainty of valuations of such securities, the fair value may differ significantly from the values that would have been used had a ready market for such securities existed. If trading or events occurring after the close of the principal market in which securities are traded are expected to materially affect the value of those securities,
Notes to Financial Statements
| 2. | SIGNIFICANT ACCOUNTING POLICIES (continued) |
Security Valuation (continued)
then they may be valued at their fair value, taking this trading or these events into account. Fair value is determined in good faith by the Advisor under procedures approved by and under the general supervision and responsibility of the Fund’s Board of Directors (the “Board”).
Various inputs are used in determining the value of the Series’ assets or liabilities carried at market value. These inputs are summarized in three broad levels. Level 1 includes quoted prices in active markets for identical assets and liabilities. Level 2 includes other significant observable inputs (including quoted prices for similar securities, interest rates, prepayment speeds, credit risk, etc.). Level 3 includes significant unobservable inputs (including the Series’ own assumptions in determining the fair value of investments). The inputs or methodology used for valuing securities are not necessarily an indication of the risk associated with investing in those securities.
The following is a summary of the valuation levels used for major security types as of December 31, 2009 in valuing the Series’ assets or liabilities carried at market value:
| | | | | | | | | | | | |
Description: | | 12/31/09 | | Level 1 | | Level 2 | | Level 3 |
| | | | | | | | | | | | |
Equity securities* | | $ | 140,242,652 | | $ | 140,242,652 | | $ | — | | $ | — |
Preferred securities | | | — | | | — | | | — | | | — |
Debt securities | | | | | | | | | | | | |
US Treasury and other US government agencies | | | 5,999,909 | | | — | | | 5,999,909 | | | — |
Corporate debt | | | 2,537,500 | | | — | | | 2,537,500 | | | — |
Mutual funds | | | 9,035,379 | | | 9,035,379 | | | — | | | — |
Other financial instruments** | | | — | | | — | | | — | | | — |
| | | | | | | | | | | | |
Total | | $ | 157,815,440 | | $ | 149,278,031 | | $ | 8,537,409 | | $ | — |
| | | | | | | | | | | | |
*Includes common stock, warrants and rights. Please see the Investment Portfolio for industry classification.
**Other financial instruments are derivative instruments not reflected in the Investment Portfolio, such as futures, forwards and swap contracts, which are valued at the unrealized appreciation/ depreciation on the instrument. As of December 31, 2009, the Series did not hold any derivative instruments.
There were no Level 3 securities held by the Series as of December 31, 2008 or December 31, 2009.
Interim and annual reporting periods beginning after December 15, 2009 will require additional disclosure regarding transfers in and/or out of Level 1 and 2. Additional disclosure surrounding the activity in Level 3 fair value measurement will also be effective for fiscal years beginning after December 15, 2010. Management has concluded that this will not have a material impact on the Series’ financial statements.
Security Transactions, Investment Income and Expenses
Security transactions are accounted for on trade date. Dividend income is recorded on the ex-dividend date, except that if the ex-dividend date has passed, certain dividends from foreign securities
Notes to Financial Statements
| 2. | SIGNIFICANT ACCOUNTING POLICIES (continued) |
Security Transactions, Investment Income and Expenses (continued)
are recorded as soon as the Fund is informed of the ex-dividend date. Non-cash dividends, if any, are recorded at the fair market value of the securities received. Interest income, including amortization of premium and accretion of discounts using the effective interest method, is earned from settlement date and accrued daily.
Expenses are recorded on an accrual basis. Most expenses of the Fund can be attributed to a specific series. Expenses which cannot be directly attributed are apportioned among the series in the Fund in such a manner as deemed equitable by the Fund’s Board, taking into consideration, among other things, the nature and type of expense.
The Series uses the identified cost method for determining realized gain or loss on investments for both financial statement and federal income tax reporting purposes.
Foreign Currency Translation
The books and records of the Series are maintained in U.S. dollars. Foreign currencies, investments and other assets and liabilities are translated into U.S. dollars at the current exchange rates. Purchases and sales of investment securities and income and expenses are translated on the respective dates of such transactions. The Series does not isolate realized and unrealized gains and losses attributable to changes in the exchange rates from gains and losses that arise from changes in the market value of investments. Such fluctuations are included with net realized and unrealized gain or loss on investments. Net realized foreign currency gains and losses represent foreign currency gains and losses between trade date and settlement date on securities transactions, gains and losses on disposition of foreign currencies and the difference between the amount of income and foreign withholding taxes recorded on the books of the Series and the amounts actually received or paid.
Federal Taxes
The Series’ policy is to comply with the provisions of the Internal Revenue Code applicable to regulated investment companies. The Series is not subject to federal income tax or excise tax to the extent that the Series distributes to shareholders each year its taxable income, including any net realized gains on investments, in accordance with requirements of the Internal Revenue Code. Accordingly, no provision for federal income tax or excise tax has been made in the financial statements.
Management evaluates its tax positions to determine if the tax positions taken meet the minimum recognition threshold in connection with accounting for uncertainties in income tax positions taken or expected to be taken for the purposes of measuring and recognizing tax liabilities in the financial statements. Recognition of tax benefits of an uncertain tax position is required only when the position is “more likely than not” to be sustained assuming examination by taxing authorities. At December 31, 2009, the Series has recorded no liability for net unrecognized tax benefits relating to uncertain income tax positions taken or expected to be taken in future tax returns.
The Series files income tax returns in the U.S. federal jurisdiction, various states and foreign jurisdictions, as required. No income tax returns are currently under investigation. The statute of limitations on the Series’ tax returns remains open for the years ended December 31, 2006 through December 31, 2009. The Fund is not aware of any tax positions for which it is reasonably
Notes to Financial Statements
| 2. | SIGNIFICANT ACCOUNTING POLICIES (continued) |
Federal Taxes (continued)
possible that the total amounts of unrecognized tax benefits will significantly change in the next twelve months.
Additionally, based on the Fund’s understanding of the tax rules and rates related to income, gains and transactions for foreign jurisdictions in which it invests, the Series will provide for foreign taxes, and where appropriate, deferred foreign tax.
Distributions of Income and Gains
Distributions to shareholders of net investment income and net realized gains are made annually. An additional distribution may be necessary to avoid taxation of the Series. Distributions are recorded on the ex-dividend date.
Indemnifications
The Fund’s organizational documents provide former and current directors and officers with a limited indemnification against liabilities arising in connection with the performance of their duties to the Fund. In the normal course of business, the Fund may also enter into contracts that provide general indemnifications. The Fund’s maximum exposure under these arrangements is unknown as this would be dependent on future claims that may be made against the Fund. The risk of material loss from such claims is considered remote.
Other
The preparation of financial statements in conformity with accounting principles generally accepted in the United States of America requires management to make estimates and assumptions that affect the reported amounts of assets and liabilities and the disclosure of contingent assets and liabilities at the date of the financial statements and the reported amounts of income and expenses during the reporting period. Actual results could differ from those estimates.
| 3. | TRANSACTIONS WITH AFFILIATES |
The Fund has an Investment Advisory Agreement (the “Agreement”) with the Advisor, for which the Series pays a fee, computed daily and payable monthly, at an annual rate of 1.00% of the Series’ average daily net assets.
Under the Agreement, personnel of the Advisor provide the Series with advice and assistance in the choice of investments and the execution of securities transactions, and otherwise maintain the Series’ organization. The Advisor also provides the Fund with necessary office space and fund administration and support services. The salaries of all officers of the Fund (except a percentage of the Fund’s Chief Compliance Officer’s salary, which is paid by the Fund), and of all Directors who are “affiliated persons” of the Fund, or of the Advisor, and all personnel of the Fund, or of the Advisor, performing services relating to research, statistical and investment activities, are paid by the Advisor. Each “non-affiliated” Director receives an annual stipend, which is allocated among all the active series of the Fund. In addition, these Directors also receive a fee per Board meeting attended for each active series of the Fund plus a fee for each committee meeting attended.
The Advisor has contractually agreed, until at least April 30, 2011, to waive its fee and, if necessary, pay other operating expenses of the Series in order to maintain total direct annual fund operating expenses for the Series at no more than 1.20% of average daily net assets each year. For the year ended December 31, 2009, the Advisor did not waive its management fee or reimburse any
Notes to Financial Statements
| 3. | TRANSACTIONS WITH AFFILIATES (continued) |
expenses of the Series. The Advisor is not eligible to recoup any expenses that have been waived or reimbursed in prior years.
Manning & Napier Investor Services, Inc., a registered broker-dealer affiliate of the Advisor, acts as distributor for the Fund’s shares. The services of Manning & Napier Investor Services, Inc. are provided at no additional cost to the Series.
For fund accounting and transfer agent services through November 7, 2009, the Fund paid the Advisor an annual fee of 0.055% of the Fund’s average daily net assets up to $4.5 billion, 0.03% of the Fund’s average daily net assets between $4.5 billion and $7.5 billion, and 0.02% of the Fund’s average daily net assets over $7.5 billion. Additionally, certain transaction and account-based fees and out-of-pocket expenses, including charges for reporting relating to the Fund’s compliance program, were charged. Expenses not directly attributable to a Series are allocated based on each Series’ relative net assets or number of accounts, depending on the expense. Prior to October 12, 2009 (for sub-accountant) and November 9, 2009 (for sub-transfer agent) the Advisor had an agreement with Citi Fund Services Ohio, Inc. (“Citi”) under which Citi served as sub-accountant and sub-transfer agent. The Advisor voluntarily agreed to waive a portion of the fund accounting and transfer agent fees and the Chief Compliance Officer service fees for the period March 1, 2009 to April 30, 2009. Accordingly, the Advisor waived fees of $1,307, which is included as a reduction of expenses on the Statement of Operations.
The Advisor has entered into agreements dated October 12, 2009 and November 9, 2009 with PNC Global Investment Servicing (“PNCGIS”) under which PNCGIS serves as sub-accountant services agent and sub-transfer agent, respectively. Effective November 7, 2009 under the amended master services agreement, the Fund pays the Advisor an annual fee of 0.0175% on the first $3 billion of average daily net assets (excluding Target Series); 0.015% on the next $3 billion of average daily net assets (excluding Target Series); and 0.01% of the average daily net assets in excess of $6 billion (excluding Target Series); plus a base fee of $25,500 per Series. Additionally, certain transaction-, account-, and cusip-based fees and out-of-pocket expenses, including charges for reporting relating to the Fund’s compliance program, are charged.
| 4. | PURCHASES AND SALES OF SECURITIES |
For the year ended December 31, 2009, purchases and sales of securities, other than United States Government securities and short-term securities, were $75,539,738 and $125,820,012, respectively. There were no purchases or sales of United States Government securities.
| 5. | CAPITAL STOCK TRANSACTIONS |
Transactions in shares of Technology Series were:
| | | | | | | | | | | | | | |
| | | For the Year
Ended 12/31/09 | | | For the Year
Ended 12/31/08 | |
| | | Shares | | | Amount | | | Shares | | | Amount | |
| | | | | | | | | | | | | | |
Sold | | 1,678,722 | | | $ | 12,866,101 | | | 2,557,936 | | | $ | 21,273,855 | |
Reinvested | | — | | | | — | | | 341,587 | | | | 2,807,850 | |
Repurchased | | (5,953,766 | ) | | | (48,886,630 | ) | | (2,580,774 | ) | | | (20,939,747 | ) |
| | | | | | | | | | | | | | |
Total | | (4,275,044 | ) | | $ | (36,020,529 | ) | | 318,749 | | | $ | 3,141,958 | |
| | | | | | | | | | | | | | |
Notes to Financial Statements
| 5. | CAPITAL STOCK TRANSACTIONS (continued) |
Substantially all of the Series’ shares represent investments by fiduciary accounts over which the Advisor has sole investment discretion.
The Series may trade in instruments including written and purchased options, forward foreign currency exchange contracts and futures contracts and other derivatives in the normal course of investing activities to assist in managing exposure to various market risks. The Series may be subject to various elements of risk and may involve, to a varying degree, elements of risk in excess of the amounts recognized for financial statement purposes; the risk that changes in the value of a derivative may not correlate perfectly with the underlying asset, rate or index; counterparty credit risk related to over the counter derivatives counterparties failure to perform under contract terms; liquidity risk related to the lack of a liquid market for these contracts allowing the fund to close out its position(s); and documentation risk relating to disagreement over contract terms. No such investments were held by the Series during the year ended December 31, 2009.
In vesting in securities of foreign companies and foreign governments involves special risks and considerations not typically associated with investing in securities of domestic companies and the U.S. Government. These risks include revaluation of currencies and future adverse political and economic developments. Moreover, securities of foreign companies and foreign governments and their markets may be less liquid and their prices more volatile than those of comparable domestic companies and the U.S. Government.
The Series may focus its investments in certain related technology industries; hence, the Series may subject itself to a greater degree of risk than a series that is more diversified.
| 9. | FEDERAL INCOME TAX INFORMATION |
The amount and characterization of certain income and capital gains to be distributed are determined in accordance with federal income tax regulations, which may differ from accounting principles generally accepted in the United States of America. These differences are primarily due to differing book and tax treatments in the timing of the recognition of net investment income or gains and losses, including net operating losses, foreign currency gains and losses, losses deferred due to wash sales and Post-October losses. The Series may periodically make reclassifications among its capital accounts to reflect income and gains available for distribution (or available capital loss carryovers) under income tax regulations without impacting the Series’ net asset value. Any such reclassifications are not reflected in the financial highlights.
The tax character of distributions paid were as follows:
| | | | | | |
| | | For the Year
Ended 12/31/09 | | For the Year
Ended 12/31/08 |
Ordinary income | | $ | — | | $ | 2,835,785 |
For the year ended December 31, 2009, the Series elected to defer capital losses of $224,297, attributable to Post-October losses.
Notes to Financial Statements
| 9. | FEDERAL INCOME TAX INFORMATION (continued) |
At December 31, 2009, the tax basis components of distributable earnings and the net unrealized appreciation based on identified cost for federal income tax purposes were as follows:
| | | | | | | |
Cost for federal income tax purposes | | | | | $ | 141,542,337 | |
Unrealized appreciation | | | | | $ | 24,289,164 | |
Unrealized depreciation | | | | | | (8,016,061 | ) |
| | | | | | | |
Net unrealized appreciation | | | | | $ | 16,273,103 | |
Capital loss carryover | | | | | | 30,994,029 | |
|
The capital loss carryover, disclosed above, available to the extent allowed by tax law to offset future net capital gain, if any, will expire as follows: | |
| | | Loss Carryover | | Expiration Date | |
| | $ | 19,643,426 | | | December 31, 2016 | |
| | $ | 11,350,603 | | | December 31, 2017 | |
On February 2, 2010, the PNC Financial Services Group, Inc. (“PNC”), which serves as the Series’ sub-accountant services agent and sub-transfer agent, entered into a Stock Purchase Agreement (the “Stock Purchase Agreement”) with The Bank of New York Mellon Corporation (“BNY Mellon”), the Series’ custodian. Upon the terms and subject to the conditions set forth in the Stock Purchase Agreement, which has been approved by the board of directors of each company, PNC will sell to BNY Mellon (the “Stock Sale”) 100% of the issued and outstanding shares of PNC Global Investment Servicing, Inc., an indirect, wholly-owned subsidiary of PNC. The Stock Sale is expected to close in the third quarter of 2010. Management has concluded that this will not have a material impact on the Series’ financial statements.
There were no other subsequent events that require recognition or disclosure. In preparing these financial statements, management of the Fund has evaluated events and transactions for potential recognition or disclosure through February 23, 2010, the date the financial statements were issued.
Report of Independent Registered Public Accounting Firm
To the Board of Directors of Manning & Napier Fund, Inc. and Shareholders of Technology Series:
In our opinion, the accompanying statement of assets and liabilities, including the investment portfolio, and the related statements of operations and of changes in net assets and the financial highlights present fairly, in all material respects, the financial position of the Technology Series (a series of Manning & Napier Fund, Inc., hereafter referred to as the “Series”) at December 31, 2009, and the results of its operations for the year then ended, the changes in its net assets for each of the two years in the period then ended and the financial highlights for each of the five years in the period then ended, in conformity with accounting principles generally accepted in the United States of America. These financial statements and financial highlights (hereafter referred to as “financial statements”) are the responsibility of the Series’ management; our responsibility is to express an opinion on these financial statements based on our audits. We conducted our audits of these financial statements in accordance with the standards of the Public Company Accounting Oversight Board (United States). Those standards require that we plan and perform the audit to obtain reasonable assurance about whether the financial statements are free of material misstatement. An audit includes examining, on a test basis, evidence supporting the amounts and disclosures in the financial statements, assessing the accounting principles used and significant estimates made by management, and evaluating the overall financial statement presentation. We believe that our audits, which included confirmation of securities at December 31, 2009 by correspondence with the custodian, provide a reasonable basis for our opinion.

Columbus, Ohio
February 23, 2010
Renewal of Investment Advisory Agreement (unaudited)
At the Manning & Napier Fund, Inc. (the “Fund”) Board of Directors’ (the “Board”) meeting, held on December 7, 2009, the Investment Advisory Agreement (the “Agreement”) between the Fund and Manning & Napier Advisors, Inc. (the “Advisor”) was reviewed by the Board for renewal. In connection with the decision whether to renew the Agreement, a variety of material was prepared for and reviewed by the Board.
Representatives of the Advisor attended the meeting and presented additional oral and written information to the Board to assist the Board in its considerations. The discussion immediately below outlines the materials and information presented to the Board in connection with the Board’s 2009 Annual Review of the Agreement and the conclusions made by the Directors when determining to continue the Agreement.
| | • | | The Board considered the services provided by the Advisor under the Agreement including, among others: deciding what securities to purchase and sell for each Series; arranging for the purchase and sale of such securities by placing orders with broker-dealers; administering the affairs of the Fund (including the books and records of the Fund not maintained by third party service providers such as the custodian or sub-transfer agent); arranging for the insurance coverage for the Fund; and supervising the preparation of tax returns, SEC filings (including registration statements) and reports to shareholders for the Fund. The Board also considered the nature and quality of such services provided under the Agreement in light of the Advisor’s services provided to the Fund for 23 years. The Board discussed the quality of these services with representatives from the Advisor and concluded that the Advisor was performing its services to the Fund required under the Agreement in a reasonable manner. |
| | • | | The Board considered the investment performance of the various Series of the Fund. The investment performance for each Series was reviewed on a cumulative basis since inception and on a one year basis. In addition, annualized performance for the following time periods was considered: inception, three year, five year, ten year, and current market cycle. A market cycle includes periods of both rising and falling markets. Returns for established benchmark indices for each Series were provided for each time period. The Board noted that the various Series were competitive against their respective benchmarks and/or peer groups over various time periods, but in particular over the full market cycle periods relevant for the Series. In addition, the Board considered at the meeting (and considers on a quarterly basis) a peer group performance analysis consisting of Morningstar universes of mutual funds with similar investment objectives. The Board discussed the performance with representatives from the Advisor and concluded that the investment performance of each of the Fund’s Series was reasonable based on the Fund’s actual performance and comparative performance, especially performance over the current market cycle. |
| | • | | The Board considered the costs of the Advisor’s services and the profits of the Advisor as they relate to the Advisor’s services to the Fund under the Agreement. In reviewing the Advisor’s costs and profits, the Board discussed the Advisor’s revenues generated from the Fund (on both an actual and adjusted basis) and its expenses associated with providing the services under the Agreement. In addition, the Board reviewed the Advisor’s expenses associated with Fund activities outside of the Agreement (such as expense reimbursements pursuant to expense caps and payments made by the Advisor to third party platforms on which shares of the Fund are available for purchase). It was noted by representatives of the Advisor that 13 of the 26 active Series of the Fund are currently experiencing expenses above the capped expense ratios. After discussing the above costs and profits, the Board concluded that the Advisor’s profitability relating to its services provided under the Agreement was reasonable. |
Renewal of Investment Advisory Agreement (unaudited)
| | • | | The Board considered the fees and expenses of the various Series of the Fund. The Advisor presented the advisory fees and total expenses for each Series, including the advisory fee adjusted for any expense waivers or reimbursements (either contractual or voluntary) paid by the Advisor. The advisory fees and expense ratios of each Series were compared to an average (on both a mean and median basis) of similar funds as disclosed on the Morningstar database. Representatives of the Advisor discussed with the Board the levels of its advisory fee for each Series of the Fund and as compared to the median and mean advisory fees for similar funds as listed on Morningstar. Expense ratios for every Series, except the Global Fixed Income Series and the Target Series Class R and Class C, are currently below the median and mean for similar funds as listed on Morningstar. Based on their review of the information provided, the Board concluded that the fees and expenses of each Series of the Fund were reasonable on a comparative basis. |
| | • | | The Board also considered the other benefits the Advisor derives from its relationship with the Fund. Such other benefits include certain research products provided by soft dollars. Given the level of soft dollar transactions involving the Fund, the Board concluded that these additional benefits to the Advisor were reasonable. |
| | • | | In addition to the factors described above, the Board considered the Advisor’s personnel, investment strategies, policies and procedures relating to compliance with personal securities transactions, and reputation, expertise and resources in domestic and foreign financial markets. The Board concluded that these factors support the conclusion that the Advisor performs its services in a reasonable manner. |
| | • | | The Board did not consider economies of scale at this time because of the multiple uses of the Fund (for the Advisor’s discretionary investment account clients in addition to direct investors), the current profitability of the Advisor’s services to the Fund under the Agreement, and the overall size of the Fund complex. |
Based on the Board’s deliberations and their evaluation of the information described above, the Board, including a majority of Directors that are not “interested persons” as defined in the Investment Company Act of 1940, concluded that the compensation under the Agreement was fair and reasonable in light of the services and expenses and such other matters as the Directors considered to be relevant in the exercise of their reasonable judgment. Accordingly, the Board approved the renewal of the Agreement. In the course of their deliberations, the Directors did not identify any particular information that was all important or controlling.
Directors’ and Officers’ Information (unaudited)
The Statement of Additional Information provides additional information about the Fund’s directors and officers and can be obtained without charge by calling 1-800-466-3863, at www.manningnapieradvisors.com, or on the EDGAR Database on the SEC Internet web site (http:// www.sec.gov). The following chart shows certain information about the Fund’s officers and directors, including their principal occupations during the last five years. Unless specific dates are provided, the individuals have held the listed positions for longer than five years.
INTERESTED DIRECTOR/OFFICER
| | |
| Name: | | B. Reuben Auspitz* |
| Address: | | 290 Woodcliff Drive Fairport, NY 14450 |
| Age: | | 62 |
| Current Position(s) Held with Fund: | | Principal Executive Officer, President, Chairman & Director |
| Term of Office1 & Length of Time Served: | | Indefinite - Director since 1984; Vice President 1984 - 2003; President since 2004; Principal Executive Officer since 2002 |
| Principal Occupation(s) During Past 5 Years: | | Executive Vice President; Co-Executive Director; Executive Group Member**; Chief Compliance Officer since 2004 - Manning & Napier Advisors, Inc. President; Director - Manning & Napier Investor Services, Inc. Holds or has held one or more of the following titles for various subsidiaries and affiliates: President, Vice President, Director, Chairman, Treasurer, Chief Compliance Officer or Member. |
| Number of Portfolios Overseen within Fund Complex: | | 29 |
| Other Directorships Held Outside Fund Complex: | | N/A |
| |
| INDEPENDENT DIRECTORS | | |
| |
| Name: | | Stephen B. Ashley |
| Address: | | 290 Woodcliff Drive Fairport, NY 14450 |
| Age: | | 69 |
| Current Position(s) Held with Fund: | | Director, Audit Committee Member, Governance & Nominating Committee Member |
| Term of Office & Length of Time Served: | | Indefinite - Since 1996 |
| Principal Occupation(s) During Past 5 Years: | | Chairman, Director, President & Chief Executive Officer, The Ashley Group (property management and investment). Chairman (non-executive) 2004 - 2008; Director 1995 - 2008 - Fannie Mae (mortgage) |
| Number of Portfolios Overseen within Fund Complex: | | 29 |
| Other Directorships Held Outside Fund Complex: | | The Ashley Group |
| Name: | | Peter L. Faber |
| Address: | | 290 Woodcliff Drive Fairport, NY 14450 |
| Age: | | 71 |
| Current Position(s) Held with Fund: | | Director, Governance & Nominating Committee Member |
| Term of Office & Length of Time Served: | | Indefinite - Since 1987 |
| Principal Occupation(s) During Past 5 Years: | | Senior Counsel since 2006, Partner (1995-2006) - McDermott, Will & Emery LLP (law firm) |
| Number of Portfolios Overseen within Fund Complex: | | 29 |
| Other Directorships Held Outside Fund Complex: | | Partnership for New York City, Inc. (non-profit) New York Collegium (non-profit) Boston Early Music Festival (non-profit) Amherst Early Music, Inc. (non-profit) Gotham Early Music Scene, Inc. (non-profit) |
Directors’ and Officers’ Information (unaudited)
INDEPENDENT DIRECTORS (continued)
| | |
| Name: | | Harris H. Rusitzky |
| Address: | | 290 Woodcliff Drive Fairport, NY 14450 |
| Age: | | 75 |
| Current Position(s) Held with Fund: | | Director, Audit Committee Member, Governance & Nominating Committee Member |
| Term of Office & Length of Time Served: | | Indefinite - Since 1985 |
| Principal Occupation(s) During Past 5 Years: | | President, The Greening Group (business consultants) since 1994; Partner, The Restaurant Group (restaurants) since 2006 |
| Number of Portfolios Overseen within Fund Complex: | | 29 |
| Other Directorships Held Outside Fund Complex: | | N/A |
| Name: | | Paul A. Brooke |
| Address: | | 290 Woodcliff Drive |
| | Fairport, NY 14450 |
| Age: | | 64 |
| Current Position(s) Held with Fund: | | Director, Audit Committee Member, Governance & Nominating Committee Member |
| Term of Office & Length of Time Served: | | Indefinite - Since 2007 |
| Principal Occupation(s) During Past 5 Years: | | Chairman & CEO, Alsius Corp. (investments); Managing Member, PMSV Holdings LLC (investments) |
| Number of Portfolios Overseen within Fund Complex: | | 29 |
| Other Directorships Held Outside Fund Complex: | | Incyte Corp. ViroPharma, Inc. WebMD Cheyne Capital International MPM Bio-equities GMP Companies HoustonPharma |
| Name: | | Richard M. Hurwitz |
| Address: | | 290 Woodcliff Drive Fairport, NY 14450 |
| Age: | | 46 |
| Current Position(s) Held with Fund: | | Director, Audit Committee Member, Governance & Nominating Committee Member |
| Term of Office & Length of Time Served: | | Indefinite - Since 2009 |
| Principal Occupation(s) During Past 5 Years: | | Managing Partner, Aegis Investment Partners, LLC (investments) since 2006; Founder and Managing Partner (2004-2005) - Village Markets, LLC (groceries) |
| Number of Portfolios Overseen within Fund Complex: | | 29 |
| Other Directorships Held Outside Fund Complex: | | Pictometry International Corp. |
Directors’ and Officers’ Information (unaudited)
OFFICERS
| | |
| |
| Name: | | Jeffrey S. Coons, Ph.D., CFA |
| Address: | | 290 Woodcliff Drive Fairport, NY 14450 |
| Age: | | 46 |
| Current Position(s) Held with Fund: | | Vice President |
| Term of Office1 & Length of Time Served: | | Since 2004 |
| Principal Occupation(s) During Past 5 Years: | | Co-Director of Research since 2002 & Executive Group Member** since 2003, Manning & Napier Advisors, Inc. Holds one or more of the following titles for various subsidiaries and affiliates: President, Director, Treasurer or Senior Trust Officer. |
| Number of Portfolios Overseen within Fund Complex: | | 29 |
| Other Directorships Held Outside Fund Complex: | | N/A |
| Name: | | Christine Glavin |
| Address: | | 290 Woodcliff Drive Fairport, NY 14450 |
| Age: | | 43 |
| Current Position(s) Held with Fund: | | Principal Financial Officer, Chief Financial Officer |
| Term of Office1 & Length of Time Served: | | Principal Financial Officer since 2002; Chief Financial Officer since 2001 |
| Principal Occupation(s) During Past 5 Years: | | Fund Reporting Manager, Manning & Napier Advisors, Inc. since 1997 |
| Number of Portfolios Overseen within Fund Complex: | | 29 |
| Other Directorships Held Outside Fund Complex: | | N/A |
| Name: | | Jodi L. Hedberg |
| Address: | | 290 Woodcliff Drive Fairport, NY 14450 |
| Age: | | 42 |
| Current Position(s) Held with Fund: | | Corporate Secretary, Chief Compliance Officer, Anti-Money Laundering Compliance Officer |
| Term of Office1 & Length of Time Served: | | Corporate Secretary since 1997; Chief Compliance Officer since 2004 |
| Principal Occupation(s) During Past 5 Years: | | Director of Compliance, Manning & Napier Advisors, Inc. and affiliates since 1990 (title change in 2005 from Compliance Manager to Director of Compliance); Corporate Secretary, Manning & Napier Investor Services, Inc. since 2006 |
| Number of Portfolios Overseen within Fund Complex: | | 29 |
| Other Directorships Held Outside Fund Complex: | | N/A |
*Interested Director, within the meaning of the Investment Company Act of 1940 by reason of his position with the Fund’s investment advisor and distributor. Mr. Auspitz serves as the Executive Vice President and Director, Manning & Napier Advisors, Inc. and President and Director, Manning & Napier Investor Services, Inc., the Fund’s distributor.
**The Executive Group performs the duties of the Office of the Chief Executive of Manning & Napier Advisors, Inc.
1The term of office for President, Vice President, Chief Financial Officer, and Corporate Secretary is one year and until their respective successors are chosen and qualified. All other officers’ terms are indefinite.
This Page Intentionally Left Blank
Literature Requests (unaudited)
Proxy Voting Policies and Procedures
A description of the policies and procedures that the Fund uses to determine how to vote proxies relating to portfolio securities is available, without charge, upon request:
| | |
By phone | | 1-800-466-3863 |
On the Securities and Exchange Commission’s (SEC) web site | | http://www.sec.gov |
Proxy Voting Record
Information regarding how the Fund voted proxies relating to portfolio securities during the most recent 12-month period ended June 30th is available, without charge, upon request:
| | |
By phone | | 1-800-466-3863 |
On the SEC’s web site | | http://www.sec.gov |
Quarterly Portfolio Holdings
The Series’ complete schedule of portfolio holdings for the 1st and 3rd quarters of each fiscal year are provided on Form N-Q, and are available, without charge, upon request:
| | |
By phone | | 1-800-466-3863 |
On the SEC’s web site | | http://www.sec.gov |
The Series’ Form N-Q may be reviewed and copied at the SEC’s Public Reference Room in Washington, D.C. Information on the operation of the Public Reference Room may be obtained by calling 1-800-SEC-0330.
Prospectus and Statement of Additional Information (SAI)
The prospectus and SAI provide additional information about each Series, including charges, expenses and risks. These documents are available, without charge, upon request:
| | |
By phone | | 1-800-466-3863 |
On the SEC’s web site | | http://www.sec.gov |
On the Advisor’s web site | | http://www.manningnapieradvisors.com |
Additional information available at www.manningnapieradvisors.com
1. Fund Holdings - Month-End
2. Fund Holdings - Quarter-End
3. Shareholder Report - Annual
4. Shareholder Report - Semi-Annual


Management Discussion and Analysis (unaudited)

Dear Shareholders:
Over the past twelve months, investor sentiment has moved rather quickly from extreme pessimism to guarded optimism. Volatility continued into the first quarter of 2009, with broad equity markets down more than 10%. After hitting a low point in late March, both domestic and foreign stock markets turned upwards rather dramatically, posting 40% to 60% returns off their lows through the end of the year.
While this turnaround has not been enough to fully offset losses experienced during the current bear market, recent returns indicate that market participants appear more confident in an economic rebound. For the twelve months ended December 31, 2009, the S&P 500 Total Return Index returned 26.50% while the S&P 500 Financial Services Index earned 17.34%. The Financial Services Series earned a solid return during 2009, but lagged behind the broad market benchmark and the sector-specific benchmark with a return of 10.54%.
As equity market volatility heightened during the last quarter of 2008 and first quarter of 2009, the Series reduced holdings in the banking sector to limit credit risk. Proceeds were reinvested in areas such as data processing and service outsourcing. Our focus on data processing firms seeks to benefit from a global trend away from cash transactions and toward electronic payment methods, particularly in developing markets. We see service outsourcing as a secular (non-cyclical) trend that assists companies in cost cutting by eliminating cost-intensive back-office operations.
The main driver of the Series’ under-performance relative to the broad market and the financial services sector in particular was a small overall allocation to the banking, brokerage and investment banking industries, which were the strongest to rally once the overall market turned upward in March of 2009. While credit risk and balance sheet issues remained, government intervention to rescue such organizations from failure allowed investor sentiment to improve quickly, and the Series largely missed out on this low quality rally.
From a macro perspective, the current environment remains challenging. On the one hand, more encouraging pockets of optimism have been found in the housing and manufacturing sectors, and while the unemployment rate continues to move higher, there are subtle signs of improvement in the U.S. labor markets. On the other hand, macro-economic challenges remain in the face of a growing government deficit, continued easy monetary policy, a debt-burdened U.S. consumer and widespread inflation concerns.
We recognize that solving yesterday’s problems may create new and different macro-economic challenges. Our approach has always been to remain cognizant of macro-economic conditions, but to allow company-specific factors to drive our investment decisions. In an environment like today, the very uncertainty that makes investors cautious can also create attractively priced investment opportunities for long-term investors. We will continue to seek out such opportunities as the next phase of this market and economic cycle unfolds.
As always, we appreciate your business.
Sincerely,
Manning & Napier Advisors, Inc.
Performance Update as of December 31, 2009 (unaudited)
| | | | | | |
| | | Average Annual Total Returns
As of December 31, 2009 | | |
| | | One
Year | | Since
Inception1 | | |
Manning & Napier Fund, Inc. - Financial Services Series2 | | 10.54% | | -8.56% | | |
Standard & Poor’s (S&P) 500 Total Return Index3 | | 26.50% | | 0.66% | | |
Standard & Poor’s (S&P) 500 Financials Index3 | | 17.34% | | -12.23% | | |
The following graph compares the value of a $10,000 investment in the Manning & Napier Fund, Inc. - Financial Services Series from its inception1 (7/1/05) to present (12/31/09) to the S&P 500 Total Return Index and the S&P 500 Financials Index.
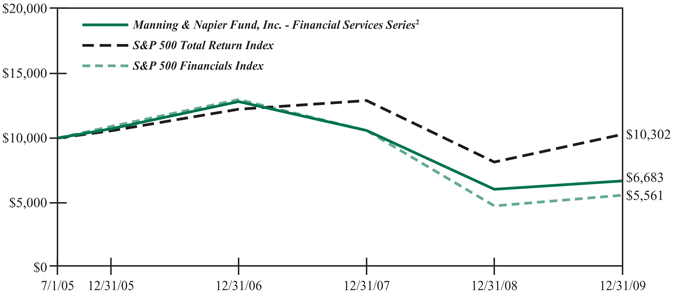
1Performance numbers for the Series and Indices are calculated from July 1, 2005, the Series’ inception date.
2The Series’ performance does not reflect the deduction of taxes that a shareholder would pay on fund distributions or the redemption of shares. The Series’ performance is historical and may not be indicative of future results. The performance returns shown are inclusive of the net expense ratio of the Series. For the year ended December 31, 2009, this net expense ratio was 1.14%. The gross expense ratio, which does not account for any voluntary or contractual waivers currently in effect, was 1.14% for the year ended December 31, 2009.
3The S&P 500 Total Return Index is an unmanaged capitalization-weighted measure of 500 widely held common stocks listed on the New York Stock Exchange, American Stock Exchange and the Over-the-Counter market. The S&P 500 Financials Index, a sub-index of the S&P 500 Total Return Index, includes the stocks of companies involved in the business of financial related products and services. Both Indices’ returns assume daily reinvestment of dividends and, unlike Series returns, do not reflect any fees or expenses.
Shareholder Expense Example (unaudited)
As a shareholder of the Series, you may incur two types of costs: (1) transaction costs, including potential wire charges on redemptions and (2) ongoing costs, including management fees and other Series expenses. This example is intended to help you understand your ongoing costs (in dollars) of investing in the Series and to compare these costs with the ongoing costs of investing in other mutual funds.
The example is based on an investment of $1,000 invested at the beginning of the period and held for the entire period (July 1, 2009 to December 31, 2009).
Actual Expenses
The first line of the table below provides information about actual account values and actual expenses. You may use the information in this line, together with the amount you invested, to estimate the expenses that you paid over the period. Simply divide your account value by $1,000 (for example, an $8,600 account value divided by $1,000 = 8.6), then multiply the result by the number in the first line under the heading entitled “Expenses Paid During Period” to estimate the expenses you paid on your account during this period.
Hypothetical Example for Comparison Purposes
The second line of the table below provides information about hypothetical account values and hypothetical expenses based on the Series’ actual expense ratio and an assumed rate of return of 5% per year before expenses, which is not the Series’ actual return. The hypothetical account values and expenses may not be used to estimate the actual ending account balance or expenses you paid during the period. You may use this information to compare the ongoing costs of investing in the Series and other funds. To do so, compare this 5% hypothetical example with the 5% hypothetical examples that appear in the shareholder reports of the other funds.
Please note that the expenses shown in the table are meant to highlight your ongoing costs only and do not reflect any transaction costs, such as potential wire charges on redemptions. Therefore, the second line of the table is useful in comparing ongoing costs only, and will not help you determine the relative total costs of owning different funds. In addition, if these transaction costs were included, your costs would have been higher.
| | | | | | | | | |
| | | Beginning
Account Value
7/1/09 | | Ending
Account Value
12/31/09 | | Expenses Paid
During Period*
7/1/09-12/31/09 |
Actual | | $ | 1,000.00 | | $ | 1,157.20 | | $ | 6.14 |
Hypothetical
(5% return before expenses) | | $ | 1,000.00 | | $ | 1,019.51 | | $ | 5.75 |
*Expenses are equal to the Series’ annualized expense ratio (for the six-month period) of 1.13%, multiplied by the average account value over the period, multiplied by 184/365 (to reflect the one-half year period). Expenses are based on the most recent fiscal half year; therefore, the expense ratio stated above may differ from the expense ratio stated in the financial highlights, which is based on one-year data. The Series’ total return would have been lower had certain expenses not been waived during the period.
Portfolio Composition as of December 31, 2009 (unaudited)
Sector Allocation1
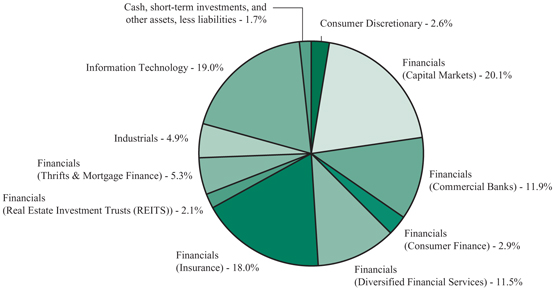
1As a percentage of net assets.
Top Ten Stock Holdings2
| | | | | | |
The Progressive Corp. | | 5.2% | | Moody’s Corp. | | 3.9% |
JPMorgan Chase & Co. | | 4.8% | | Automatic Data Processing, Inc. | | 3.9% |
Bank of New York Mellon Corp. | | 4.2% | | Redecard S.A. (Brazil) | | 3.4% |
Federated Investors, Inc. - Class B | | 4.1% | | Willis Group Holdings plc (United Kingdom) | | 3.3% |
Paychex, Inc. | | 4.0% | | Allianz SE (Germany) | | 3.1% |
2 As a percentage of total investments.
Investment Portfolio - December 31, 2009
| | | | | |
| | | Shares | | Value
(Note 2) |
| | | | | |
| | |
COMMON STOCKS - 98.3% | | | | | |
| | |
Consumer Discretionary - 2.6% | | | | | |
Media - 2.6% | | | | | |
The McGraw-Hill Companies, Inc. | | 101,000 | | $ | 3,384,510 |
| | | | | |
| | |
Financials - 71.8% | | | | | |
Capital Markets - 20.1% | | | | | |
Bank of New York Mellon Corp.1 | | 194,000 | | | 5,426,180 |
The Charles Schwab Corp. | | 141,000 | | | 2,653,620 |
Credit Suisse Group AG - ADR (Switzerland) | | 24,300 | | | 1,194,588 |
Federated Investors, Inc. - Class B | | 194,000 | | | 5,335,000 |
GAM Holding Ltd. (Switzerland) | | 188,000 | | | 2,288,095 |
The Goldman Sachs Group, Inc. | | 15,000 | | | 2,532,600 |
Legg Mason, Inc. | | 87,000 | | | 2,623,920 |
Northern Trust Corp. | | 54,000 | | | 2,829,600 |
State Street Corp. | | 31,000 | �� | | 1,349,740 |
| | | | | |
| | | | | 26,233,343 |
| | | | | |
Commercial Banks - 11.9% | | | | | |
Barclays plc - ADR (United Kingdom) | | 66,000 | | | 1,161,600 |
Community Bank System, Inc. | | 71,000 | | | 1,371,010 |
First Commonwealth Financial Corp. | | 334,000 | | | 1,553,100 |
HSBC Holdings plc - ADR (United Kingdom) | | 53,000 | | | 3,025,770 |
ICICI Bank Ltd. - ADR (India) | | 69,660 | | | 2,626,878 |
KeyCorp. | | 370,000 | | | 2,053,500 |
Societe Generale - ADR (France)2 | | 89,000 | | | 1,250,450 |
Wilmington Trust Corp. | | 199,000 | | | 2,455,660 |
| | | | | |
| | | | | 15,497,968 |
| | | | | |
Consumer Finance - 2.9% | | | | | |
American Express Co. | | 63,000 | | | 2,552,760 |
Discover Financial Services | | 83,000 | | | 1,220,930 |
| | | | | |
| | | | | 3,773,690 |
| | | | | |
Diversified Financial Services - 11.5% | | | | | |
Bank of America Corp. | | 82,000 | | | 1,234,920 |
Financiere Marc de Lacharriere S.A. (Fimalac) (France) | | 42,400 | | | 2,360,182 |
JPMorgan Chase & Co. | | 151,000 | | | 6,292,170 |
Moody’s Corp. | | 191,000 | | | 5,118,800 |
| | | | | |
| | | | | 15,006,072 |
| | | | | |
Insurance - 18.0% | | | | | |
Allianz SE (Germany) | | 32,500 | | | 4,060,345 |
The Allstate Corp. | | 82,000 | | | 2,463,280 |
Brown & Brown, Inc. | | 120,000 | | | 2,156,400 |
Principal Financial Group, Inc. | | 50,000 | | | 1,202,000 |
The Progressive Corp.* | | 373,000 | | | 6,710,270 |
| | |
| The accompanying notes are an integral part of the financial statements. | | 5 |
Investment Portfolio - December 31, 2009
| | | | | |
| | | Shares | | Value
(Note 2) |
| | | | | |
| | |
COMMON STOCKS (continued) | | | | | |
| | |
Financials (continued) | | | | | |
Insurance (continued) | | | | | |
Willis Group Holdings plc (United Kingdom) | | 164,000 | | $ | 4,326,320 |
Zurich Financial Services AG (Switzerland) | | 11,900 | | | 2,605,588 |
| | | | | |
| | | | | 23,524,203 |
| | | | | |
Real Estate Investment Trusts (REITS) - 2.1% | | | | | |
Corporate Office Properties Trust | | 76,000 | | | 2,783,880 |
| | | | | |
Thrifts & Mortgage Finance - 5.3% | | | | | |
First Niagara Financial Group, Inc. | | 198,000 | | | 2,754,180 |
NewAlliance Bancshares, Inc. | | 196,000 | | | 2,353,960 |
People’s United Financial, Inc. | | 106,000 | | | 1,770,200 |
| | | | | |
| | | | | 6,878,340 |
| | | | | |
Total Financials | | | | | 93,697,496 |
| | | | | |
Industrials - 4.9% | | | | | |
Professional Services - 4.9% | | | | | |
Equifax, Inc. | | 114,000 | | | 3,521,460 |
Experian plc (Ireland) | | 284,000 | | | 2,821,101 |
| | | | | |
Total Industrials | | | | | 6,342,561 |
| | | | | |
Information Technology - 19.0% | | | | | |
IT Services - 19.0% | | | | | |
Automatic Data Processing, Inc. | | 118,550 | | | 5,076,311 |
Cia Brasileira de Meios de Pagamento S.A. (Brazil) | | 455,000 | | | 4,009,018 |
Online Resources Corp.* | | 455,000 | | | 2,393,300 |
Paychex, Inc. | | 171,000 | | | 5,239,440 |
Redecard S.A. (Brazil) | | 268,000 | | | 4,464,101 |
The Western Union Co. | | 190,000 | | | 3,581,500 |
| | | | | |
Total Information Technology | | | | | 24,763,670 |
| | | | | |
TOTAL COMMON STOCKS
(Identified Cost $126,787,137) | | | | | 128,188,237 |
| | | | | |
| | |
| 6 | | The accompanying notes are an integral part of the financial statements. |
Investment Portfolio - December 31, 2009
| | | | | |
| | | Shares | | Value
(Note 2) |
| | | | | |
| | |
SHORT-TERM INVESTMENTS - 1.6% | | | | | |
Dreyfus Cash Management, Inc. - Institutional Shares3, 0.07%
(Identified Cost $2,048,892) | | 2,048,892 | | $ | 2,048,892 |
| | | | | |
TOTAL INVESTMENTS - 99.9%
(Identified Cost $128,836,029) | | | | | 130,237,129 |
| | |
OTHER ASSETS, LESS LIABILITIES - 0.1% | | | | | 177,845 |
| | | | | |
NET ASSETS - 100% | | | | $ | 130,414,974 |
| | | | | |
ADR - American Depository Receipt
*Non-income producing security
1Bank of New York Mellon Corp. is the Fund’s custodian.
2Latest quoted sales price is not available and the latest quoted bid price was used to value the security.
3Rate shown is the current yield as of December 31, 2009.
| | |
| The accompanying notes are an integral part of the financial statements. | | 7 |
Statement of Assets and Liabilities
December 31, 2009
| | | | |
ASSETS: | | | | |
| | | | |
| |
Investments, at value (identified cost $128,836,029) (Note 2) | | $ | 130,237,129 | |
Dividends receivable | | | 220,190 | |
Receivable for fund shares sold | | | 188,984 | |
Foreign tax reclaims receivable | | | 30,056 | |
| | | | |
TOTAL ASSETS | | | 130,676,359 | |
| | | | |
LIABILITIES: | | | | |
| |
Accrued management fees (Note 3) | | | 109,076 | |
Accrued fund accounting and transfer agent fees (Note 3) | | | 12,025 | |
Accrued directors’ fees (Note 3) | | | 3,144 | |
Accrued Chief Compliance Officer service fees (Note 3) | | | 485 | |
Payable for fund shares repurchased | | | 91,350 | |
Audit fees payable | | | 32,525 | |
Other payables and accrued expenses | | | 12,780 | |
| | | | |
TOTAL LIABILITIES | | | 261,385 | |
| | | | |
TOTAL NET ASSETS | | $ | 130,414,974 | |
| | | | |
NET ASSETS CONSIST OF: | | | | |
| |
Capital stock | | $ | 235,115 | |
Additional paid-in-capital | | | 239,176,059 | |
Undistributed net investment income | | | 43,192 | |
Accumulated net realized loss on investments, foreign currency and translation of other assets and liabilities | | | (110,441,137 | ) |
Net unrealized appreciation on investments, foreign currency and translation of other assets and liabilities | | | 1,401,745 | |
| | | | |
TOTAL NET ASSETS | | $ | 130,414,974 | |
| | | | |
NET ASSET VALUE, OFFERING PRICE AND REDEMPTION
PRICE PER SHARE - Class A ($130,414,974/23,511,546 shares) | | $ | 5.55 | |
| | | | |
| | |
| 8 | | The accompanying notes are an integral part of the financial statements. |
Statement of Operations
For the Year Ended December 31, 2009
| | | | |
INVESTMENT INCOME: | | | | |
| | | | |
| |
Dividends (net of foreign taxes withheld, $40,005) | | $ | 4,517,316 | |
Interest | | | 5,684 | |
| | | | |
Total Investment Income | | | 4,523,000 | |
| | | | |
EXPENSES: | | | | |
| |
Management fees (Note 3) | | | 1,437,076 | |
Fund accounting and transfer agent fees (Note 3) | | | 89,507 | |
Directors’ fees (Note 3) | | | 12,849 | |
Chief Compliance Officer service fees (Note 3) | | | 3,729 | |
Custodian fees | | | 15,499 | |
Miscellaneous | | | 80,475 | |
| | | | |
Total Expenses | | | 1,639,135 | |
Less reduction of expenses (Note 3) | | | (1,082 | ) |
| | | | |
Net Expenses | | | 1,638,053 | |
| | | | |
NET INVESTMENT INCOME | | | 2,884,947 | |
| | | | |
REALIZED AND UNREALIZED GAIN (LOSS) ON INVESTMENTS AND FOREIGN CURRENCY: | | | | |
| |
Net realized loss on- | | | | |
Investments | | | (42,361,807 | ) |
Foreign currency and translation of other assets and liabilities | | | (177 | ) |
| | | | |
| | | (42,361,984 | ) |
| | | | |
| |
Net change in unrealized appreciation (depreciation) on- | | | | |
Investments | | | 57,425,746 | |
Foreign currency and translation of other assets and liabilities | | | 1,951 | |
| | | | |
| | | 57,427,697 | |
| | | | |
| |
NET REALIZED AND UNREALIZED GAIN (LOSS) ON
INVESTMENTS AND FOREIGN CURRENCY | | | 15,065,713 | |
| | | | |
NET INCREASE IN NET ASSETS RESULTING
FROM OPERATIONS | | $ | 17,950,660 | |
| | | | |
| | |
| The accompanying notes are an integral part of the financial statements. | | 9 |
Statements of Changes in Net Assets
| | | | | | | | |
| | | For the
Year Ended
12/31/09 | | | For the
Year Ended
12/31/08 | |
| | | | | | | | |
| INCREASE (DECREASE) IN NET ASSETS: | | | | | | | | |
| | |
| OPERATIONS: | | | | | | | | |
| | |
Net investment income | | $ | 2,884,947 | | | $ | 4,282,274 | |
Net realized loss on investments and foreign currency | | | (42,361,984 | ) | | | (66,006,039 | ) |
Net change in unrealized appreciation (depreciation) on investments and foreign currency | | | 57,427,697 | | | | (36,958,193 | ) |
| | | | | | | | |
Net increase (decrease) from operations | | | 17,950,660 | | | | (98,681,958 | ) |
| | | | | | | | |
DISTRIBUTIONS TO SHAREHOLDERS (Note 9): | | | | | | | | |
| | |
From net investment income | | | (2,990,961 | ) | | | (4,382,210 | ) |
| | | | | | | | |
| CAPITAL STOCK ISSUED AND REPURCHASED: | | | | | | | | |
| | |
Net increase (decrease) from capital share transactions (Note 5) | | | (13,914,002 | ) | | | 12,336,743 | |
| | | | | | | | |
Net increase (decrease) in net assets | | | 1,045,697 | | | | (90,727,425 | ) |
| | |
| NET ASSETS: | | | | | | | | |
| | |
Beginning of year | | | 129,369,277 | | | | 220,096,702 | |
| | | | | | | | |
End of year (including undistributed net investment income of $43,192 and
$146,921, respectively) | | $ | 130,414,974 | | | $ | 129,369,277 | |
| | | | | | | | |
| | |
| 10 | | The accompanying notes are an integral part of the financial statements. |
Financial Highlights
| | | | | | | | | | |
| | | For the Years Ended | | For the Period 7/1/051 to
12/31/05 |
| | | 12/31/09 | | 12/31/08 | | 12/31/07 | | 12/31/06 | |
| | | | | | | | | | |
| | | | | | | | | | |
Per share data (for a share outstanding throughout each period): | | | | | | | | | | |
Net asset value - Beginning of period | | $5.14 | | $9.34 | | $12.51 | | $10.70 | | $10.00 |
| | | | | | | | | | |
Income (loss) from investment operations: | | | | | | | | | | |
Net investment income | | 0.102 | | 0.17 | | 0.19 | | 0.10 | | 0.05 |
Net realized and unrealized gain (loss) on investments | | 0.44 | | (4.19) | | (2.36) | | 2.00 | | 0.69 |
| | | | | | | | | | |
Total from investment operations | | 0.54 | | (4.02) | | (2.17) | | 2.10 | | 0.74 |
| | | | | | | | | | |
Less distributions to shareholders: | | | | | | | | | | |
From net investment income | | (0.13) | | (0.18) | | (0.18) | | (0.11) | | (0.04) |
From net realized gain on investments | | — | | — | | (0.82) | | (0.18) | | — |
| | | | | | | | | | |
Total distributions to shareholders | | (0.13) | | (0.18) | | (1.00) | | (0.29) | | (0.04) |
| | | | | | | | | | |
Net asset value - End of period | | $5.55 | | $5.14 | | $9.34 | | $12.51 | | $10.70 |
| | | | | | | | | | |
Net assets - End of period (000’s omitted) | | $130,415 | | $129,369 | | $220,097 | | $132,855 | | $49,674 |
| | | | | | | | | | |
Total return3 | | 10.54% | | (42.98%) | | (17.46%) | | 19.62% | | 7.39% |
| Ratios (to average net assets)/ Supplemental Data: | | | | | | | | | | |
Expenses* | | 1.14% | | 1.12% | | 1.15% | | 1.18% | | 1.20%4 |
Net investment income | | 2.01% | | 2.34% | | 1.72% | | 1.14% | | 0.95%4 |
Portfolio turnover | | 98% | | 41% | | 38% | | 30% | | 6% |
|
*The investment advisor did not impose all or a portion of its management fees, CCO fees and fund accounting and transfer agent fees in some periods. If these expenses had been incurred by the Series, the expense ratio (to average net assets) |
would have been increased by the following amount: | | 0.00%5 | | N/A | | N/A | | N/A | | 0.16%4 |
1Commencement of operations.
2Calculated based on average shares outstanding during the year.
3Represents aggregate total return for the period indicated, and assumes reinvestment of all distributions. Total return would have been lower had certain expenses not been waived during certain periods. Periods less than one year are not annualized.
4Annualized.
5Less than 0.01%.
| | |
| The accompanying notes are an integral part of the financial statements. | | 11 |
Notes to Financial Statements
Financial Services Series (the “Series”) is a no-load diversified series of Manning & Napier Fund, Inc. (the “Fund”). The Fund is organized in Maryland and is registered under the Investment Company Act of 1940, as amended, as an open-end management investment company.
The Series’ investment objective is to provide long-term growth by investing principally in the common stocks of companies in the financial services industry.
The Fund’s Advisor is Manning & Napier Advisors, Inc. (the “Advisor”). Shares of the Series are offered to investors, clients and employees of the Advisor and its affiliates. The total authorized capital stock of the Fund consists of 10.0 billion shares of common stock each having a par value of $0.01. As of December 31, 2009, 4.6 billion shares have been designated in total among 29 series, of which 100 million have been designated as Financial Services Series Class A common stock.
| 2. | SIGNIFICANT ACCOUNTING POLICIES |
Security Valuation
Portfolio securities, including domestic equities, foreign equities, exchange-traded funds and options, listed on an exchange other than the NASDAQ National Market System are valued at the latest quoted sales price of the exchange on which the security is primarily traded. Securities not traded on valuation date or securities not listed on an exchange are valued at the latest quoted bid price provided by the Fund’s pricing service. Securities listed on the NASDAQ National Market System are valued in accordance with the NASDAQ Official Closing Price.
Short-term investments that mature in sixty days or less are valued at amortized cost, which approximates market value. Investments in open-end investment companies are valued at their net asset value per share on valuation date.
Volume and level of activity in established markets for an asset or liability are evaluated to determine whether recent transactions and quoted prices are determinative of fair value. Where there have been significant decreases in volume and level of activity, further analysis and adjustment may be necessary to estimate fair value. The Series measures fair value in these instances by the use of inputs and valuation techniques which may be based upon current market prices of securities that are comparable in coupon, rating, maturity and industry and/or expectation of future cash flows. As a result of trading in relatively thin markets and/or markets that experience significant volatility, the prices used by the Series to value these securities may differ from the value that would be realized if these securities were sold, and the differences could be material.
Securities for which representative valuations or prices are not available from the Fund’s pricing service may be valued at fair value. Due to the inherent uncertainty of valuations of such securities, the fair value may differ significantly from the values that would have been used had a ready market for such securities existed. If trading or events occurring after the close of the principal market in which securities are traded are expected to materially affect the value of those securities, then they may be valued at their fair value, taking this trading or these events into account. Fair value is determined in good faith by the Advisor under procedures approved by and under the general supervision and responsibility of the Fund’s Board of Directors (the “Board”).
Various inputs are used in determining the value of the Series’ assets or liabilities carried at market value. These inputs are summarized in three broad levels. Level 1 includes quoted prices in active markets for identical assets and liabilities. Level 2 includes other significant observable
Notes to Financial Statements
| 2. | SIGNIFICANT ACCOUNTING POLICIES (continued) |
Security Valuation (continued)
inputs (including quoted prices for similar securities, interest rates, prepayment speeds, credit risk, etc.). Level 3 includes significant unobservable inputs (including the Series’ own assumptions in determining the fair value of investments). The inputs or methodology used for valuing securities are not necessarily an indication of the risk associated with investing in those securities.
The following is a summary of the valuation levels used for major security types as of December 31, 2009 in valuing the Series’ assets or liabilities carried at market value:
| | | | | | | | | | | | |
Description | | 12/31/09 | | Level 1 | | Level 2 | | Level 3 |
| | | | | | | | | | | | |
Equity securities* | | $ | 128,188,237 | | $ | 126,937,787 | | $ | 1,250,450 | | $ | — |
Preferred securities | | | — | | | — | | | — | | | — |
Debt securities | | | — | | | — | | | — | | | — |
Mutual funds | | | 2,048,892 | | | 2,048,892 | | | — | | | — |
Other financial instruments** | | | — | | | — | | | — | | | — |
| | | | | | | | | | | | |
Total | | $ | 130,237,129 | | $ | 128,986,679 | | $ | 1,250,450 | | $ | — |
| | | | | | | | | | | | |
*Includes common stock, warrants and rights. Please see the Investment Portfolio for industry classification.
**Other financial instruments are derivative instruments not reflected in the Investment Portfolio, such as futures, forwards and swap contracts, which are valued at the unrealized appreciation/ depreciation on the instrument. As of December 31, 2009, the Series did not hold any derivative instruments.
There were no Level 3 securities held by the Series as of December 31, 2008 or December 31, 2009.
Interim and annual reporting periods beginning after December 15, 2009 will require additional disclosure regarding transfers in and/or out of Level 1 and 2. Additional disclosure surrounding the activity in Level 3 fair value measurement will also be effective for fiscal years beginning after December 15, 2010. Management has concluded that this will not have a material impact on the Series’ financial statements.
Security Transactions, Investment Income and Expenses
Security transactions are accounted for on trade date. Dividend income is recorded on the ex-dividend date, except that if the ex-dividend date has passed, certain dividends from foreign securities are recorded as soon as the Fund is informed of the ex-dividend date. Non-cash dividends, if any, are recorded at the fair market value of the securities received. Interest income, including amortization of premium and accretion of discounts using the effective interest method, is earned from settlement date and accrued daily.
Expenses are recorded on an accrual basis. Most expenses of the Fund can be attributed to a specific series. Expenses which cannot be directly attributed are apportioned among the series in the Fund in such a manner as deemed equitable by the Fund’s Board, taking into consideration, among other things, the nature and type of expense.
Notes to Financial Statements
| 2. | SIGNIFICANT ACCOUNTING POLICIES (continued) |
Security Transactions, Investment Income and Expenses (continued)
The Fund records distributions received in excess of income from underlying investments as a reduction of cost of investments and/or realized gain. Such amounts are based on estimates if actual amounts are not available and actual amounts of income, realized gain and return of capital may differ from the estimated amounts. The Fund adjusts the estimated amounts of components of distributions (and consequently its net investment income) as necessary once the issuers provide information about the actual composition of the distributions.
The Series uses the identified cost method for determining realized gain or loss on investments for both financial statement and federal income tax reporting purposes.
Foreign Currency Translation
The books and records of the Series are maintained in U.S. dollars. Foreign currencies, investments and other assets and liabilities are translated into U.S. dollars at the current exchange rates. Purchases and sales of investment securities and income and expenses are translated on the respective dates of such transactions. The Series does not isolate realized and unrealized gains and losses attributable to changes in the exchange rates from gains and losses that arise from changes in the market value of investments. Such fluctuations are included with net realized and unrealized gain or loss on investments. Net realized foreign currency gains and losses represent foreign currency gains and losses between trade date and settlement date on securities transactions, gains and losses on disposition of foreign currencies and the difference between the amount of income and foreign withholding taxes recorded on the books of the Series and the amounts actually received or paid.
Federal Taxes
The Series’ policy is to comply with the provisions of the Internal Revenue Code applicable to regulated investment companies. The Series is not subject to federal income tax or excise tax to the extent that the Series distributes to shareholders each year its taxable income, including any net realized gains on investments, in accordance with requirements of the Internal Revenue Code. Accordingly, no provision for federal income tax or excise tax has been made in the financial statements.
Management evaluates its tax positions to determine if the tax positions taken meet the minimum recognition threshold in connection with accounting for uncertainties in income tax positions taken or expected to be taken for the purposes of measuring and recognizing tax liabilities in the financial statements. Recognition of tax benefits of an uncertain tax position is required only when the position is “more likely than not” to be sustained assuming examination by taxing authorities. At December 31, 2009, the Series has recorded no liability for net unrecognized tax benefits relating to uncertain income tax positions taken or expected to be taken in future tax returns.
The Series files income tax returns in the U.S. federal jurisdiction, various states and foreign jurisdictions, as required. No income tax returns are currently under investigation. The statute of limitations on the Series’ tax returns remains open for the years ended December 31, 2006 through December 31, 2009. The Fund is not aware of any tax positions for which it is reasonably possible that the total amounts of unrecognized tax benefits will significantly change in the next twelve months.
Notes to Financial Statements
| 2. | SIGNIFICANT ACCOUNTING POLICIES (continued) |
Federal Taxes (continued)
Additionally, based on the Fund’s understanding of the tax rules and rates related to income, gains and transactions for foreign jurisdictions in which it invests, the Series will provide for foreign taxes, and where appropriate, deferred foreign tax.
Distributions of Income and Gains
Distributions to shareholders of net investment income and net realized gains are made annually. An additional distribution may be necessary to avoid taxation of the Series. Distributions are recorded on the ex-dividend date.
Indemnifications
The Fund’s organizational documents provide former and current directors and officers with a limited indemnification against liabilities arising in connection with the performance of their duties to the Fund. In the normal course of business, the Fund may also enter into contracts that provide general indemnifications. The Fund’s maximum exposure under these arrangements is unknown as this would be dependent on future claims that may be made against the Fund. The risk of material loss from such claims is considered remote.
Other
The preparation of financial statements in conformity with accounting principles generally accepted in the United States of America requires management to make estimates and assumptions that affect the reported amounts of assets and liabilities and the disclosure of contingent assets and liabilities at the date of the financial statements and the reported amounts of income and expenses during the reporting period. Actual results could differ from those estimates.
| 3. | TRANSACTIONS WITH AFFILIATES |
The Fund has an Investment Advisory Agreement (the “Agreement”) with the Advisor, for which the Series pays a fee, computed daily and payable monthly, at an annual rate of 1.00% of the Series’ average daily net assets.
Under the Agreement, personnel of the Advisor provide the Series with advice and assistance in the choice of investments and the execution of securities transactions, and otherwise maintain the Series’ organization. The Advisor also provides the Fund with necessary office space and fund administration and support services. The salaries of all officers of the Fund (except a percentage of the Fund’s Chief Compliance Officer’s salary, which is paid by the Fund), and of all Directors who are “affiliated persons” of the Fund, or of the Advisor, and all personnel of the Fund, or of the Advisor, performing services relating to research, statistical and investment activities, are paid by the Advisor. Each “non-affiliated” Director receives an annual stipend, which is allocated among all the active series of the Fund. In addition, these Directors also receive a fee per Board meeting attended for each active series of the Fund plus a fee for each committee meeting attended.
The Advisor has contractually agreed, until at least April 30, 2011, to waive its fee and, if necessary, pay other operating expenses of the Series in order to maintain total direct annual fund operating expenses for the Series at no more than 1.20% of average daily net assets each year. For the year ended December 31, 2009, the Advisor did not waive its management fee or reimburse any expenses of the Series. The Advisor is not eligible to recoup any expenses that have been waived or reimbursed in prior years.
Notes to Financial Statements
| 3. | TRANSACTIONS WITH AFFILIATES (continued) |
Manning & Napier Investor Services, Inc., a registered broker-dealer affiliate of the Advisor, acts as distributor for the Fund’s shares. The services of Manning & Napier Investor Services, Inc. are provided at no additional cost to the Series.
For fund accounting and transfer agent services through November 7, 2009, the Fund paid the Advisor an annual fee of 0.055% of the Fund’s average daily net assets up to $4.5 billion, 0.03% of the Fund’s average daily net assets between $4.5 billion and $7.5 billion, and 0.02% of the Fund’s average daily net assets over $7.5 billion. Additionally, certain transaction and account-based fees and out-of-pocket expenses, including charges for reporting relating to the Fund’s compliance program, were charged. Expenses not directly attributable to a Series are allocated based on each Series’ relative net assets or number of accounts, depending on the expense. Prior to October 12, 2009 (for sub-accountant) and November 9, 2009 (for sub-transfer agent) the Advisor had an agreement with Citi Fund Services Ohio, Inc. (“Citi”) under which Citi served as sub-accountant and sub-transfer agent. The Advisor voluntarily agreed to waive a portion of the fund accounting and transfer agent fees and the Chief Compliance Officer service fees for the period March 1, 2009 to April 30, 2009. Accordingly, the Advisor waived fees of $1,082, which is included as a reduction of expenses on the Statement of Operations.
The Advisor has entered into agreements dated October 12, 2009 and November 9, 2009 with PNC Global Investment Servicing (“PNCGIS”) under which PNCGIS serves as sub-accountant services agent and sub-transfer agent, respectively. Effective November 7, 2009 under the amended master services agreement, the Fund pays the Advisor an annual fee of 0.0175% on the first $3 billion of average daily net assets (excluding Target Series); 0.015% on the next $3 billion of average daily net assets (excluding Target Series); and 0.01% of the average daily net assets in excess of $6 billion (excluding Target Series); plus a base fee of $25,500 per Series. Additionally, certain transaction-, account-, and cusip-based fees and out-of-pocket expenses, including charges for reporting relating to the Fund’s compliance program, are charged.
| 4. | PURCHASES AND SALES OF SECURITIES |
For the year ended December 31, 2009, purchases and sales of securities, other than United States Government securities and short-term securities, were $129,385,537 and $137,791,019, respectively. There were no purchases or sales of United States Government securities.
| 5. | CAPITAL STOCK TRANSACTIONS |
Transactions in shares of Financial Services Series were:
| | | | | | | | | | | | | | |
| | | For the Year
Ended 12/31/09 | | | For the Year
Ended 12/31/08 | |
| | | Shares | | | Amount | | | Shares | | | Amount | |
| | | | | | | | | | | | | | |
Sold | | 11,190,234 | | | $ | 55,137,124 | | | 3,484,154 | | | $ | 26,397,174 | |
Reinvested | | 534,460 | | | | 2,895,097 | | | 857,166 | | | | 4,243,277 | |
Repurchased | | (13,401,764 | ) | | | (71,946,223 | ) | | (2,707,152 | ) | | | (18,303,708 | ) |
| | | | | | | | | | | | | | |
Total | | (1,677,070 | ) | | $ | (13,914,002 | ) | | 1,634,168 | | | $ | 12,336,743 | |
| | | | | | | | | | | | | | |
Substantially all of the Series’ shares represent investments by fiduciary accounts over which the Advisor has sole investment discretion.
Notes to Financial Statements
The Series may trade in instruments including written and purchased options, forward foreign currency exchange contracts and futures contracts and other derivatives in the normal course of investing activities to assist in managing exposure to various market risks. The Series may be subject to various elements of risk and may involve, to a varying degree, elements of risk in excess of the amounts recognized for financial statement purposes; the risk that changes in the value of a derivative may not correlate perfectly with the underlying asset, rate or index; counterparty credit risk related to over the counter derivatives counterparties failure to perform under contract terms; liquidity risk related to the lack of a liquid market for these contracts allowing the fund to close out its position(s); and documentation risk relating to disagreement over contract terms. No such investments were held by the Series during the year ended December 31, 2009.
Investing in securities of foreign companies and foreign governments involves special risks and considerations not typically associated with investing in securities of domestic companies and the U.S. Government. These risks include revaluation of currencies and future adverse political and economic developments. Moreover, securities of foreign companies and foreign governments and their markets may be less liquid and their prices more volatile than those of comparable domestic companies and the U.S. Government.
| 8. | FINANCIAL SERVICES SECURITIES |
The Series may focus its investments in certain related financial services industries; hence, the Series may subject itself to a greater degree of risk than a series that is more diversified.
| 9. | FEDERAL INCOME TAX INFORMATION |
The amount and characterization of certain income and capital gains to be distributed are determined in accordance with federal income tax regulations, which may differ from accounting principles generally accepted in the United States of America. These differences are primarily due to differing book and tax treatments in the timing of the recognition of net investment income or gains and losses, including investments in Real Estate Investment Trusts (REITs), foreign currency gains and losses, losses deferred due to wash sales and Post-October losses. The Series may periodically make reclassifications among its capital accounts to reflect income and gains available for distribution (or available capital loss carryovers) under income tax regulations without impacting the Series’ net asset value. Any such reclassifications are not reflected in the financial highlights.
The tax character of distributions paid were as follows:
| | | | | | |
| | | For the Year
Ended 12/31/09 | | For the Year
Ended 12/31/08 |
Ordinary income | | $ | 2,990,961 | | $ | 4,382,210 |
For the year ended December 31, 2009, the Series elected to defer $8,331,249 of capital losses attributable to Post-October losses.
Notes to Financial Statements
| 9. | FEDERAL INCOME TAX INFORMATION (continued) |
At December 31, 2009, the tax basis components of distributable earnings and the net unrealized appreciation based on identified cost for federal income tax purposes were as follows:
| | | | | | | | | |
Cost for federal income tax purposes | | | | | | | $ | 129,004,301 | |
Unrealized appreciation | | | | | | | $ | 8,829,101 | |
Unrealized depreciation | | | | | | | | (7,596,273 | ) |
| | | | | | | | | |
Net unrealized appreciation | | | | | | | $ | 1,232,828 | |
Undistributed ordinary income | | | | | | | | 39,464 | |
Capital loss carryover | | | | | | | | 101,937,888 | |
The capital loss carryover, disclosed above, available to the extent allowed by tax law to offset future net capital gain, if any, will expire as follows: | |
| | | | | Loss Carryover | | Expiration Date | |
| | | | $ | 50,750,211 | | | December 31, 2016 | |
| | | | $ | 51,187,677 | | | December 31, 2017 | |
On February 2, 2010, The PNC Financial Services Group, Inc. (“PNC”), which serves as the Series’ sub-accountant services agent and sub-transfer agent, entered into a Stock Purchase Agreement (the “Stock Purchase Agreement”) with The Bank of New York Mellon Corporation (“BNY Mellon”), the Series’ custodian. Upon the terms and subject to the conditions set forth in the Stock Purchase Agreement, which has been approved by the board of directors of each company, PNC will sell to BNY Mellon (the “Stock Sale”) 100% of the issued and outstanding shares of PNC Global Investment Servicing Inc., an indirect, wholly-owned subsidiary of PNC. The Stock Sale is expected to close in the third quarter of 2010. Management has concluded that this will not have a material impact on the Series’ financial statements.
There were no other subsequent events that require recognition or disclosure. In preparing these financial statements, management of the Fund has evaluated events and transactions for potential recognition or disclosure through February 23, 2010, the date the financial statements were issued.
Report of Independent Registered Public Accounting Firm
To the Board of Directors of Manning & Napier Fund, Inc. and Shareholders of Financial Services Series:
In our opinion, the accompanying statement of assets and liabilities, including the investment portfolio, and the related statements of operations and of changes in net assets and the financial highlights present fairly, in all material respects, the financial position of the Financial Services Series (a series of Manning & Napier Fund, Inc., hereafter referred to as the “Series”) at December 31, 2009, and the results of its operations for the year then ended, the changes in its net assets for each of the two years in the period then ended and the financial highlights for each of the periods indicated, in conformity with accounting principles generally accepted in the United States of America. These financial statements and financial highlights (hereafter referred to as “financial statements”) are the responsibility of the Series’ management; our responsibility is to express an opinion on these financial statements based on our audits. We conducted our audits of these financial statements in accordance with the standards of the Public Company Accounting Oversight Board (United States). Those standards require that we plan and perform the audit to obtain reasonable assurance about whether the financial statements are free of material misstatement. An audit includes examining, on a test basis, evidence supporting the amounts and disclosures in the financial statements, assessing the accounting principles used and significant estimates made by management, and evaluating the overall financial statement presentation. We believe that our audits, which included confirmation of securities at December 31, 2009 by correspondence with the custodian, provide a reasonable basis for our opinion.

Columbus, Ohio
February 23, 2010
Supplemental Tax Information (unaudited)
All designations are based on financial information available as of the date of this annual report and, accordingly are subject to change.
For federal income tax purposes, the Series designates for the current fiscal year $2,990,961 or, if different, the maximum amount allowable under the tax law as qualified dividend income.
For corporate shareholders, the percentage of investment income (dividend income plus short-term gains, if any) that qualifies for the dividends received deduction for the current fiscal year is 72.93%, or if different, the maximum allowable under tax law.
Renewal of Investment Advisory Agreement (unaudited)
At the Manning & Napier Fund, Inc. (the “Fund”) Board of Directors’ (the “Board”) meeting, held on December 7, 2009, the Investment Advisory Agreement (the “Agreement”) between the Fund and Manning & Napier Advisors, Inc. (the “Advisor”) was reviewed by the Board for renewal. In connection with the decision whether to renew the Agreement, a variety of material was prepared for and reviewed by the Board.
Representatives of the Advisor attended the meeting and presented additional oral and written information to the Board to assist the Board in its considerations. The discussion immediately below outlines the materials and information presented to the Board in connection with the Board’s 2009 Annual Review of the Agreement and the conclusions made by the Directors when determining to continue the Agreement.
| | • | | The Board considered the services provided by the Advisor under the Agreement including, among others: deciding what securities to purchase and sell for each Series; arranging for the purchase and sale of such securities by placing orders with broker-dealers; administering the affairs of the Fund (including the books and records of the Fund not maintained by third party service providers such as the custodian or sub-transfer agent); arranging for the insurance coverage for the Fund; and supervising the preparation of tax returns, SEC filings (including registration statements) and reports to shareholders for the Fund. The Board also considered the nature and quality of such services provided under the Agreement in light of the Advisor’s services provided to the Fund for 23 years. The Board discussed the quality of these services with representatives from the Advisor and concluded that the Advisor was performing its services to the Fund required under the Agreement in a reasonable manner. |
| | • | | The Board considered the investment performance of the various Series of the Fund. The investment performance for each Series was reviewed on a cumulative basis since inception and on a one year basis. In addition, annualized performance for the following time periods was considered: inception, three year, five year, ten year, and current market cycle. A market cycle includes periods of both rising and falling markets. Returns for established benchmark indices for each Series were provided for each time period. The Board noted that the various Series were competitive against their respective benchmarks and/or peer groups over various time periods, but in particular over the full market cycle periods relevant for the Series. In addition, the Board considered at the meeting (and considers on a quarterly basis) a peer group performance analysis consisting of Morningstar universes of mutual funds with similar investment objectives. The Board discussed the performance with representatives from the Advisor and concluded that the investment performance of each of the Fund’s Series was reasonable based on the Fund’s actual performance and comparative performance, especially performance over the current market cycle. |
| | • | | The Board considered the costs of the Advisor’s services and the profits of the Advisor as they relate to the Advisor’s services to the Fund under the Agreement. In reviewing the Advisor’s costs and profits, the Board discussed the Advisor’s revenues generated from the Fund (on both an actual and adjusted basis) and its expenses associated with providing the services under the Agreement. In addition, the Board reviewed the Advisor’s expenses associated with Fund activities outside of the Agreement (such as expense reimbursements pursuant to expense caps and payments made by the Advisor to third party platforms on which shares of the Fund are available for purchase). It was noted by representatives of the Advisor that 13 of the 26 active Series of the Fund are currently experiencing expenses above the capped expense ratios. After discussing the above costs and profits, the Board |
Renewal of Investment Advisory Agreement (unaudited)
| | concluded that the Advisor’s profitability relating to its services provided under the Agreement was reasonable. |
| | • | | The Board considered the fees and expenses of the various Series of the Fund. The Advisor presented the advisory fees and total expenses for each Series, including the advisory fee adjusted for any expense waivers or reimbursements (either contractual or voluntary) paid by the Advisor. The advisory fees and expense ratios of each Series were compared to an average (on both a mean and median basis) of similar funds as disclosed on the Morningstar database. Representatives of the Advisor discussed with the Board the levels of its advisory fee for each Series of the Fund and as compared to the median and mean advisory fees for similar funds as listed on Morningstar. Expense ratios for every Series, except the Global Fixed Income Series and the Target Series Class R and Class C, are currently below the median and mean for similar funds as listed on Morningstar. Based on their review of the information provided, the Board concluded that the fees and expenses of each Series of the Fund were reasonable on a comparative basis. |
| | • | | The Board also considered the other benefits the Advisor derives from its relationship with the Fund. Such other benefits include certain research products provided by soft dollars. Given the level of soft dollar transactions involving the Fund, the Board concluded that these additional benefits to the Advisor were reasonable. |
| | • | | In addition to the factors described above, the Board considered the Advisor’s personnel, investment strategies, policies and procedures relating to compliance with personal securities transactions, and reputation, expertise and resources in domestic and foreign financial markets. The Board concluded that these factors support the conclusion that the Advisor performs its services in a reasonable manner. |
| | • | | The Board did not consider economies of scale at this time because of the multiple uses of the Fund (for the Advisor’s discretionary investment account clients in addition to direct investors), the current profitability of the Advisor’s services to the Fund under the Agreement, and the overall size of the Fund complex. |
Based on the Board’s deliberations and their evaluation of the information described above, the Board, including a majority of Directors that are not “interested persons” as defined in the Investment Company Act of 1940, concluded that the compensation under the Agreement was fair and reasonable in light of the services and expenses and such other matters as the Directors considered to be relevant in the exercise of their reasonable judgment. Accordingly, the Board approved the renewal of the Agreement. In the course of their deliberations, the Directors did not identify any particular information that was all important or controlling.
Directors’ and Officers’ Information (unaudited)
The Statement of Additional Information provides additional information about the Fund’s directors and officers and can be obtained without charge by calling 1-800-466-3863, at www.manningnapieradvisors.com, or on the EDGAR Database on the SEC Internet web site (http:// www.sec.gov). The following chart shows certain information about the Fund’s officers and directors, including their principal occupations during the last five years. Unless specific dates are provided, the individuals have held the listed positions for longer than five years.
INTERESTED DIRECTOR/OFFICER
| | |
| Name: | | B. Reuben Auspitz* |
| Address: | | 290 Woodcliff Drive Fairport, NY 14450 |
| Age: | | 62 |
| Current Position(s) Held with Fund: | | Principal Executive Officer, President, Chairman & Director |
| Term of Office1 & Length of Time Served: | | Indefinite - Director since 1984; Vice President 1984 - 2003; President since 2004; Principal Executive Officer since 2002 |
| Principal Occupation(s) During Past 5 Years: | | Executive Vice President; Co-Executive Director; Executive Group Member**; Chief Compliance Officer since 2004 - Manning & Napier Advisors, Inc. President; Director - Manning & Napier Investor Services, Inc. Holds or has held one or more of the following titles for various subsidiaries and affiliates: President, Vice President, Director, Chairman, Treasurer, Chief Compliance Officer or Member. |
| Number of Portfolios Overseen within Fund Complex: | | 29 |
| Other Directorships Held Outside Fund Complex: | | N/A |
| |
| INDEPENDENT DIRECTORS | | |
| |
| Name: | | Stephen B. Ashley |
| Address: | | 290 Woodcliff Drive Fairport, NY 14450 |
| Age: | | 69 |
| Current Position(s) Held with Fund: | | Director, Audit Committee Member, Governance & Nominating Committee Member |
| Term of Office & Length of Time Served: | | Indefinite - Since 1996 |
| Principal Occupation(s) During Past 5 Years: | | Chairman, Director, President & Chief Executive Officer, The Ashley Group (property management and investment). Chairman (non-executive) 2004 - 2008; Director 1995 - 2008 - Fannie Mae (mortgage) |
| Number of Portfolios Overseen within Fund Complex: | | 29 |
| Other Directorships Held Outside Fund Complex: | | The Ashley Group |
| Name: | | Peter L. Faber |
| Address: | | 290 Woodcliff Drive Fairport, NY 14450 |
| Age: | | 71 |
| Current Position(s) Held with Fund: | | Director, Governance & Nominating Committee Member |
| Term of Office & Length of Time Served: | | Indefinite - Since 1987 |
| Principal Occupation(s) During Past 5 Years: | | Senior Counsel since 2006, Partner (1995-2006) - McDermott, Will & Emery LLP (law firm) |
| Number of Portfolios Overseen within Fund Complex: | | 29 |
| Other Directorships Held Outside Fund Complex: | | Partnership for New York City, Inc. (non-profit) New York Collegium (non-profit) Boston Early Music Festival (non-profit) Amherst Early Music, Inc. (non-profit) Gotham Early Music Scene, Inc. (non-profit) |
Directors’ and Officers’ Information (unaudited)
INDEPENDENT DIRECTORS (continued)
| | |
| Name: | | Harris H. Rusitzky |
| Address: | | 290 Woodcliff Drive Fairport, NY 14450 |
| Age: | | 75 |
| Current Position(s) Held with Fund: | | Director, Audit Committee Member, Governance & Nominating Committee Member |
| Term of Office & Length of Time Served: | | Indefinite - Since 1985 |
| Principal Occupation(s) During Past 5 Years: | | President, The Greening Group (business consultants) since 1994; Partner, The Restaurant Group (restaurants) since 2006 |
| Number of Portfolios Overseen within Fund Complex: | | 29 |
| Other Directorships Held Outside Fund Complex: | | N/A |
| Name: | | Paul A. Brooke |
| Address: | | 290 Woodcliff Drive Fairport, NY 14450 |
| Age: | | 64 |
| Current Position(s) Held with Fund: | | Director, Audit Committee Member, Governance & Nominating Committee Member |
| Term of Office & Length of Time Served: | | Indefinite - Since 2007 |
| Principal Occupation(s) During Past 5 Years: | | Chairman & CEO, Alsius Corp. (investments); Managing Member, PMSV Holdings LLC (investments) |
| Number of Portfolios Overseen within Fund Complex: | | 29 |
| Other Directorships Held Outside Fund Complex: | | Incyte Corp. ViroPharma, Inc. WebMD Cheyne Capital International MPM Bio-equities GMP Companies HoustonPharma |
| Name: | | Richard M. Hurwitz |
| Address: | | 290 Woodcliff Drive Fairport, NY 14450 |
| Age: | | 46 |
| Current Position(s) Held with Fund: | | Director, Audit Committee Member, Governance & Nominating Committee Member |
| Term of Office & Length of Time Served: | | Indefinite - Since 2009 |
| Principal Occupation(s) During Past 5 Years: | | Managing Partner, Aegis Investment Partners, LLC (investments) since 2006; Founder and Managing Partner (2004-2005) - Village Markets, LLC (groceries) |
| Number of Portfolios Overseen within Fund Complex: | | 29 |
| Other Directorships Held Outside Fund Complex: | | Pictometry International Corp. |
Directors’ and Officers’ Information (unaudited)
OFFICERS
| | |
| Name: | | Jeffrey S. Coons, Ph.D., CFA |
| Address: | | 290 Woodcliff Drive Fairport, NY 14450 |
| Age: | | 46 |
| Current Position(s) Held with Fund: | | Vice President |
| Term of Office1 & Length of Time Served: | | Since 2004 |
| Principal Occupation(s) During Past 5 Years: | | Co-Director of Research since 2002 & Executive Group Member** since 2003, Manning & Napier Advisors, Inc. Holds one or more of the following titles for various subsidiaries and affiliates: President, Director, Treasurer or Senior Trust Officer. |
| Number of Portfolios Overseen within Fund Complex: | | 29 |
| Other Directorships Held Outside Fund Complex: | | N/A |
| Name: | | Christine Glavin |
| Address: | | 290 Woodcliff Drive Fairport, NY 14450 |
| Age: | | 43 |
| Current Position(s) Held with Fund: | | Principal Financial Officer, Chief Financial Officer |
| Term of Office1 & Length of Time Served: | | Principal Financial Officer since 2002; Chief Financial Officer since 2001 |
| Principal Occupation(s) During Past 5 Years: | | Fund Reporting Manager, Manning & Napier Advisors, Inc. since 1997 |
| Number of Portfolios Overseen within Fund Complex: | | 29 |
| Other Directorships Held Outside Fund Complex: | | N/A |
| Name: | | Jodi L. Hedberg |
| Address: | | 290 Woodcliff Drive Fairport, NY 14450 |
| Age: | | 42 |
| Current Position(s) Held with Fund: | | Corporate Secretary, Chief Compliance Officer, Anti-Money Laundering Compliance Officer |
| Term of Office1 & Length of Time Served: | | Corporate Secretary since 1997; Chief Compliance Officer since 2004 |
| Principal Occupation(s) During Past 5 Years: | | Director of Compliance, Manning & Napier Advisors, Inc. and affiliates since 1990 (title change in 2005 from Compliance Manager to Director of Compliance); Corporate Secretary, Manning & Napier Investor Services, Inc. since 2006 |
| Number of Portfolios Overseen within Fund Complex: | | 29 |
| Other Directorships Held Outside Fund Complex: | | N/A |
*Interested Director, within the meaning of the Investment Company Act of 1940 by reason of his position with the Fund’s investment advisor and distributor. Mr. Auspitz serves as the Executive Vice President and Director, Manning & Napier Advisors, Inc. and President and Director, Manning & Napier Investor Services, Inc., the Fund’s distributor.
**The Executive Group performs the duties of the Office of the Chief Executive of Manning & Napier Advisors, Inc.
1 The term of office for President, Vice President, Chief Financial Officer, and Corporate Secretary is one year and until their respective successors are chosen and qualified. All other officers’ terms are indefinite.
Literature Requests (unaudited)
Proxy Voting Policies and Procedures
A description of the policies and procedures that the Fund uses to determine how to vote proxies relating to portfolio securities is available, without charge, upon request:
| | |
By phone | | 1-800-466-3863 |
On the Securities and Exchange Commission’s (SEC) web site | | http://www.sec.gov |
Proxy Voting Record
Information regarding how the Fund voted proxies relating to portfolio securities during the most recent 12-month period ended June 30th is available, without charge, upon request:
| | |
By phone | | 1-800-466-3863 |
On the SEC’s web site | | http://www.sec.gov |
Quarterly Portfolio Holdings
The Series’ complete schedule of portfolio holdings for the 1st and 3rd quarters of each fiscal year are provided on Form N-Q, and are available, without charge, upon request:
| | |
By phone | | 1-800-466-3863 |
On the SEC’s web site | | http://www.sec.gov |
The Series’ Form N-Q may be reviewed and copied at the SEC’s Public Reference Room in Washington, D.C. Information on the operation of the Public Reference Room may be obtained by calling 1-800-SEC-0330.
Prospectus and Statement of Additional Information (SAI)
The prospectus and SAI provide additional information about each Series, including charges, expenses and risks. These documents are available, without charge, upon request:
| | |
By phone | | 1-800-466-3863 |
On the SEC’s web site | | http://www.sec.gov |
On the Advisor’s web site | | http://www.manningnapieradvisors.com |
Additional information available at www.manningnapieradvisors.com
1. Fund Holdings - Month-End
2. Fund Holdings - Quarter-End
3. Shareholder Report - Annual
4. Shareholder Report - Semi-Annual


Management Discussion and Analysis (unaudited)

Dear Shareholders:
The Real Estate Series was launched on November 10, 2009. Since that time, the Series has earned a return of 6.36%. In comparison, the S&P 500 Index has earned a return of 2.32% while the Morgan Stanley Capital International (MSCI) U.S. Real Estate Investment Trust (REIT) Index has posted a return of 9.90%.
The Series was opened to take advantage of the extreme negative sentiment that developed following the bursting of the housing bubble in the U.S. and many areas of the developed world. Following an extended period of significant price increases, residential real estate in particular began a dramatic cyclical downturn in 2006, which eventually led to a global credit crisis and severe economic recession. In the current environment, there is also a growing inventory of commercial properties that have debt greater than the worth of the property. These events have created opportunities in the real estate sector for long-term investors.
The initial focus of the Real Estate Series has been to identify opportunities that are believed to have less sensitivity to overall economic activity. Examples include health care real estate, senior housing, where demand for space should be driven by an aging population, and student housing, which should benefit from growth in the overall population of college students and a need to replace/renovate student housing.
The Series is less focused on retail real estate, given the debt-heavy state of the U.S. consumer, although we see potential in niche retailers that can benefit from a restructuring of the traditional mall structure. Given near record declines in the performance of hotels in this current downturn, the Series has also made a selective entry into this industry group.
Overall, the Series’ focus on more defensive investments that are less related to an economic recovery led to a drag on returns relative to the MSCI U.S. REIT Index over the short time it was active in 2009. Much of the 2009 rally in global markets favored lower quality securities, including those more sensitive to the viability of the recovery. In addition, the Series’ relative performance suffered slightly due to a higher than normal cash allocation in its first full weeks. The real estate market was particularly active during the initial stages of the Series’ positioning, and our initial cash position acted as a drag on returns during these early days.
From a macro perspective, the current environment remains challenging. On the one hand, more encouraging pockets of optimism have been found in the housing and manufacturing sectors, and while the unemployment rate continues to move higher, there are subtle signs of improvement in the U.S. labor markets. On the other hand, macro-economic challenges remain in the face of a growing government deficit, continued easy monetary policy, a debt-burdened U.S. consumer and widespread inflation concerns.
We recognize that solving yesterday’s problems may create new and different macro-economic challenges. Our approach has always been to remain cognizant of macro-economic conditions, but to allow company-specific factors to drive our investment decisions. In an environment like today, the very uncertainty that makes investors cautious can also create attractively priced investment opportunities for long-term investors. We will continue to seek out such opportunities as the next phase of this market and economic cycle unfolds.
As always, we appreciate your business.
Sincerely,
Manning & Napier Advisors, Inc.
Performance Update as of December 31, 2009 (unaudited)
| | | | |
| | | Total Return
Since Inception1
As of December 31, 2009 | | |
Manning & Napier Fund, Inc. - Real Estate Series2 | | 6.36% | | |
Standard & Poor’s (S&P) 500 Total Return Index3 | | 2.32% | | |
Morgan Stanley Capital International (MSCI) U.S. Real Estate Investment Trust (REIT) Index3 | | 9.90% | | |
The following graph compares the value of a $10,000 investment in the Manning & Napier Fund, Inc. - Real Estate Series from its inception1 (11/10/09) to present (12/31/09) to the S&P 500 Total Return Index and the MSCI U.S. REIT Index.
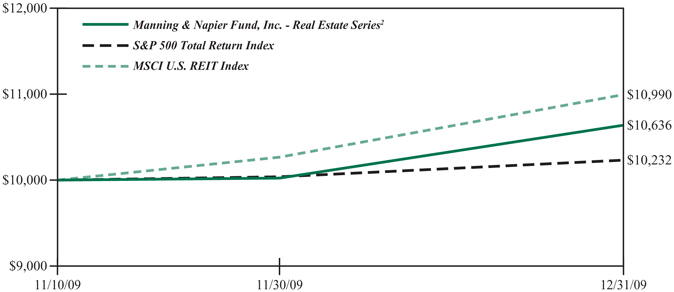
1Performance numbers for the Series and Index are calculated from November 10, 2009, the Series’ inception date.
2The Series’ performance does not reflect the deduction of taxes that a shareholder would pay on fund distributions or the redemption of shares. The Series’ performance is historical and may not be indicative of future results. The performance returns shown are inclusive of the net expense ratio of the Series. For the period ended December 31, 2009, this annualized net expense ratio was 1.20%. The annualized gross expense ratio, which does not account for any voluntary or contractual waivers currently in effect, was 1.58% for the period ended December 31, 2009.
3The S&P 500 Total Return Index is an unmanaged capitalization-weighted measure of 500 widely held common stocks listed on the New York Stock Exchange, American Stock Exchange and the Over-the-Counter market. The Index returns assume daily reinvestment of dividends. The MSCI U.S. REIT Index is a free float-adjusted market capitalization weighted index that is comprised of equity REITs that are included in the MSCI U.S. Investable Market 2500 Index, with the exception of specialty equity REITs that do not generate a majority of their revenue and income from real estate rental and leasing operations. The Index represents approximately 85% of the U.S. REIT universe. Both Indices’ returns, unlike Series returns, do not reflect any fees or expenses.
Shareholder Expense Example (unaudited)
As a shareholder of the Series, you may incur two types of costs: (1) transaction costs, including potential wire charges on redemptions and (2) ongoing costs, including management fees and other Series expenses. This example is intended to help you understand your ongoing costs (in dollars) of investing in the Series and to compare these costs with the ongoing costs of investing in other mutual funds.
The example is based on an investment of $1,000 invested at the beginning of the period and held for the entire period (November 10, 2009* to December 31, 2009).
Actual Expenses
The first line of the table below provides information about actual account values and actual expenses. You may use the information in this line, together with the amount you invested, to estimate the expenses that you paid over the period. Simply divide your account value by $1,000 (for example, an $8,600 account value divided by $1,000 = 8.6), then multiply the result by the number in the first line under the heading entitled “Expenses Paid During Period” to estimate the expenses you paid on your account during this period.
Hypothetical Example for Comparison Purposes
The second line of the table below provides information about hypothetical account values and hypothetical expenses based on the Series’ actual expense ratio and an assumed rate of return of 5% per year before expenses, which is not the Series’ actual return. The hypothetical account values and expenses may not be used to estimate the actual ending account balance or expenses you paid during the period. You may use this information to compare the ongoing costs of investing in the Series and other funds. To do so, compare this 5% hypothetical example with the 5% hypothetical examples that appear in the shareholder reports of the other funds.
Please note that the expenses shown in the table are meant to highlight your ongoing costs only and do not reflect any transaction costs, such as potential wire charges on redemptions. Therefore, the second line of the table is useful in comparing ongoing costs only, and will not help you determine the relative total costs of owning different funds. In addition, if these transaction costs were included, your costs would have been higher.
| | | | | | | | | |
| | | Beginning
Account Value
11/10/09* | | Ending
Account Value
12/31/09 | | Expenses Paid
During Period
11/10/09*-12/31/09 |
Actual | | $ | 1,000.00 | | $ | 1,063.60 | | $ | 1.731 |
Hypothetical
(5% return before expenses) | | $ | 1,000.00 | | $ | 1,019.16 | | $ | 6.112 |
*Commencement of Operations.
1Expenses are equal to the Series’ annualized expense ratio (for the period 11/10/09* to 12/31/09) of 1.20%, multiplied by the average account value over the period, multiplied by 51/365 (to reflect the period since inception). The Series’ total return would have been lower had certain expenses not been waived or reimbursed during the period.
2Expenses are equal to the Series’ annualized expense ratio (for the period 11/10/09* to 12/31/09), multiplied by the average account value over the period, multiplied by 184/365 (to reflect the one-half year period).
Portfolio Composition as of December 31, 2009 (unaudited)
Sector Allocation1
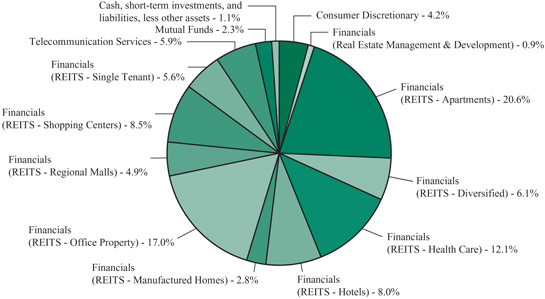
1As a percentage of net assets.
Top Ten Stock Holdings2
| | | | | | |
BioMed Realty Trust, Inc. | | 4.9% | | Host Hotels & Resorts, Inc. | | 3.0% |
Simon Property Group, Inc. | | 4.9% | | Camden Property Trust | | 3.0% |
HCP, Inc. | | 4.8% | | UDR, Inc. | | 3.0% |
Corporate Office Properties Trust | | 4.7% | | DuPont Fabros Technology, Inc. | | 3.0% |
Digital Realty Trust, Inc. | | 3.1% | | Healthcare Realty Trust, Inc. | | 3.0% |
2As a percentage of total investments.
Investment Portfolio - December 31, 2009
| | | | | |
| | | Shares | | Value
(Note 2) |
| | | | | |
| | |
COMMON STOCKS - 96.6% | | | | | |
| | |
Consumer Discretionary - 4.2% | | | | | |
Hotels, Restaurants & Leisure - 4.2% | | | | | |
Choice Hotels International, Inc. | | 61,460 | | $ | 1,945,824 |
Hyatt Hotels Corp. - Class A* | | 31,690 | | | 944,679 |
| | | | | |
Total Consumer Discretionary | | | | | 2,890,503 |
| | | | | |
Financials - 86.5% | | | | | |
Real Estate Management & Development - 0.9% | | | | | |
CB Richard Ellis Group, Inc.* | | 46,600 | | | 632,362 |
| | | | | |
REITS - Apartments - 20.6% | | | | | |
American Campus Communities, Inc. | | 71,210 | | | 2,001,001 |
Apartment Investment & Management Co. | | 128,870 | | | 2,051,610 |
AvalonBay Communities, Inc. | | 25,070 | | | 2,058,498 |
Camden Property Trust | | 49,710 | | | 2,106,213 |
Education Realty Trust, Inc. | | 179,810 | | | 870,280 |
Home Properties, Inc. | | 43,540 | | | 2,077,294 |
Mid-America Apartment Communities, Inc. | | 20,430 | | | 986,360 |
UDR, Inc. | | 127,550 | | | 2,096,922 |
| | | | | |
| | | | | 14,248,178 |
| | | | | |
REITS - Diversified - 6.1% | | | | | |
Digital Realty Trust, Inc. | | 42,940 | | | 2,159,023 |
DuPont Fabros Technology, Inc. | | 115,820 | | | 2,083,602 |
| | | | | |
| | | | | 4,242,625 |
| | | | | |
REITS - Health Care - 12.1% | | | | | |
HCP, Inc. | | 110,990 | | | 3,389,635 |
Health Care REIT, Inc. | | 42,020 | | | 1,862,326 |
Healthcare Realty Trust, Inc. | | 96,990 | | | 2,081,405 |
Omega Healthcare Investors, Inc. | | 52,230 | | | 1,015,874 |
| | | | | |
| | | | | 8,349,240 |
| | | | | |
REITS - Hotels - 8.0% | | | | | |
DiamondRock Hospitality Co. | | 79,410 | | | 672,603 |
Host Hotels & Resorts, Inc.* | | 182,030 | | | 2,124,290 |
LaSalle Hotel Properties | | 47,540 | | | 1,009,274 |
Pebblebrook Hotel Trust* | | 77,320 | | | 1,701,813 |
| | | | | |
| | | | | 5,507,980 |
| | | | | |
REITS - Manufactured Homes - 2.8% | | | | | |
Equity Lifestyle Properties, Inc. | | 39,030 | | | 1,969,844 |
| | | | | |
REITS - Office Property - 17.0% | | | | | |
Alexandria Real Estate Equities, Inc. | | 15,920 | | | 1,023,497 |
BioMed Realty Trust, Inc. | | 218,710 | | | 3,451,244 |
Boston Properties, Inc. | | 28,520 | | | 1,912,836 |
Corporate Office Properties Trust | | 90,740 | | | 3,323,806 |
| | |
| The accompanying notes are an integral part of the financial statements. | | 5 |
Investment Portfolio - December 31, 2009
| | | | | | |
| | | Shares | | Value (Note 2) | |
| | | | | | |
| | |
COMMON STOCKS (continued) | | | | | | |
| | |
Financials (continued) | | | | | | |
REITS - Office Property (continued) | | | | | | |
Douglas Emmett, Inc. | | 142,790 | | $ | 2,034,758 | |
| | | | | | |
| | | | | 11,746,141 | |
| | | | | | |
REITS - Regional Malls - 4.9% | | | | | | |
Simon Property Group, Inc. | | 42,860 | | | 3,420,228 | |
| | | | | | |
REITS - Shopping Centers - 8.5% | | | | | | |
Acadia Realty Trust | | 58,750 | | | 991,112 | |
Equity One, Inc. | | 119,250 | | | 1,928,273 | |
Tanger Factory Outlet Centers, Inc. | | 50,110 | | | 1,953,789 | |
Westfield Group (Australia) | | 87,740 | | | 988,304 | |
| | | | | | |
| | | | | 5,861,478 | |
| | | | | | |
REITS - Single Tenant - 5.6% | | | | | | |
National Retail Properties, Inc. | | 93,700 | | | 1,988,314 | |
Realty Income Corp. | | 73,920 | | | 1,915,267 | |
| | | | | | |
| | | | | 3,903,581 | |
| | | | | | |
Total Financials | | | | | 59,881,657 | |
| | | | | | |
Telecommunication Services - 5.9% | | | | | | |
Wireless Telecommunication Services - 5.9% | | | | | | |
American Tower Corp. - Class A* | | 31,490 | | | 1,360,683 | |
Crown Castle International Corp.* | | 35,040 | | | 1,367,962 | |
SBA Communications Corp. - Class A* | | 39,020 | | | 1,332,923 | |
| | | | | | |
Total Telecommunication Services | | | | | 4,061,568 | |
| | | | | | |
TOTAL COMMON STOCKS
(Identified Cost $63,219,243) | | | | | 66,833,728 | |
| | | | | | |
MUTUAL FUNDS - 2.3% | | | | | | |
iShares Dow Jones US Real Estate Index Fund
(Identified Cost $1,487,605) | | 34,140 | | | 1,567,709 | |
| | | | | | |
| | |
SHORT-TERM INVESTMENTS - 2.5% | | | | | | |
Dreyfus Cash Management, Inc. - Institutional Shares1, 0.07%
(Identified Cost $1,745,835) | | 1,745,835 | | $ | 1,745,835 | |
| | | | | | |
TOTAL INVESTMENTS - 101.4%
(Identified Cost $66,452,683) | | | | | 70,147,272 | |
| | |
LIABILITIES, LESS OTHER ASSETS - (1.4%) | | | | | (968,686 | ) |
| | | | | | |
NET ASSETS - 100% | | | | $ | 69,178,586 | |
| | | | | | |
REITS - Real Estate Investment Trusts
*Non-income producing security
1Rate shown is the current yield as of December 31, 2009.
| | |
| 6 | | The accompanying notes are an integral part of the financial statements. |
Statement of Assets and Liabilities
December 31, 2009
| | | |
ASSETS: | | | |
| | | |
| |
Investments, at value (identified cost $66,452,683) (Note 2) | | $ | 70,147,272 |
Dividends receivable | | | 219,177 |
Receivable for fund shares sold | | | 55,286 |
| | | |
TOTAL ASSETS | | | 70,421,735 |
| | | |
LIABILITIES: | | | |
| |
Accrued management fees (Note 3) | | | 35,518 |
Accrued fund accounting and transfer agent fees (Note 3) | | | 6,114 |
Accrued directors’ fees (Note 3) | | | 3,140 |
Accrued Chief Compliance Officer service fees (Note 3) | | | 362 |
Payable for securities purchased | | | 1,109,898 |
Payable for fund shares repurchased | | | 50,135 |
Audit fees payable | | | 31,300 |
Other payables and accrued expenses | | | 6,682 |
| | | |
TOTAL LIABILITIES | | | 1,243,149 |
| | | |
TOTAL NET ASSETS | | $ | 69,178,586 |
| | | |
NET ASSETS CONSIST OF: | | | |
| |
Capital stock | | $ | 65,179 |
Additional paid-in-capital | | | 65,332,863 |
Undistributed net investment income | | | 14,426 |
Accumulated net realized gain on investments | | | 71,529 |
Net unrealized appreciation on investments | | | 3,694,589 |
| | | |
TOTAL NET ASSETS | | $ | 69,178,586 |
| | | |
NET ASSET VALUE, OFFERING PRICE AND REDEMPTION
PRICE PER SHARE - Class A ($69,178,586/6,517,903 shares) | | $ | 10.61 |
| | | |
| | |
| The accompanying notes are an integral part of the financial statements. | | 7 |
Statement of Operations
For the Period November 10, 20091 to December 31, 2009
| | | | |
INVESTMENT INCOME: | | | | |
| | | | |
| |
Dividends | | $ | 217,556 | |
| | | | |
| EXPENSES: | | | | |
| |
Management fees (Note 3) | | | 82,614 | |
Fund accounting and transfer agent fees (Note 3) | | | 6,114 | |
Directors’ fees (Note 3) | | | 3,150 | |
Chief Compliance Officer service fees (Note 3) | | | 575 | |
Audit fees | | | 31,300 | |
Custodian fees | | | 1,350 | |
Miscellaneous | | | 5,425 | |
| | | | |
Total Expenses | | | 130,528 | |
Less reduction of expenses (Note 3) | | | (31,391 | ) |
| | | | |
Net Expenses | | | 99,137 | |
| | | | |
NET INVESTMENT INCOME | | | 118,419 | |
| | | | |
| REALIZED AND UNREALIZED GAIN ON INVESTMENTS: | | | | |
| |
Net realized gain on investments | | | 112,303 | |
Net change in unrealized appreciation on investments | | | 3,694,589 | |
| | | | |
| |
NET REALIZED AND UNREALIZED GAIN ON
INVESTMENTS | | | 3,806,892 | |
| | | | |
NET INCREASE IN NET ASSETS RESULTING
FROM OPERATIONS | | $ | 3,925,311 | |
| | | | |
1Commencement of operations.
| | |
| 8 | | The accompanying notes are an integral part of the financial statements. |
Statements of Changes in Net Assets
For the Period November 10, 20091 to December 31, 2009
| | | | |
| INCREASE (DECREASE) IN NET ASSETS: | | | | |
| |
| OPERATIONS: | | | | |
| |
Net investment income | | $ | 118,419 | |
Net realized gain on investments | | | 112,303 | |
Net change in unrealized appreciation on investments | | | 3,694,589 | |
| | | | |
Net increase from operations | | | 3,925,311 | |
| | | | |
DISTRIBUTIONS TO SHAREHOLDERS (Note 9): | | | | |
| |
From net investment income | | | (103,993 | ) |
From net realized gain on investments | | | (40,774 | ) |
| | | | |
Total distributions to shareholders | | | (144,767 | ) |
| | | | |
| CAPITAL STOCK ISSUED AND REPURCHASED: | | | | |
| |
Net increase from capital share transactions (Note 5) | | | 65,398,042 | |
| | | | |
Net increase in net assets | | | 69,178,586 | |
| |
| NET ASSETS: | | | | |
| |
Beginning of period | | | — | |
| | | | |
End of period (including undistributed net investment income of $14,426) | | $ | 69,178,586 | |
| | | | |
1Commencement of operations.
| | |
| The accompanying notes are an integral part of the financial statements. | | 9 |
Financial Highlights
For the Period November 10, 20091 to December 31, 2009
| | |
| Per share data (for a share outstanding throughout the period): | | |
Net asset value - Beginning of period | | $10.00 |
| | |
Income from investment operations: | | |
Net investment income | | 0.022 |
Net realized and unrealized gain on investments | | 0.62 |
| | |
Total from investment operations | | 0.64 |
| | |
Less distributions to shareholders: | | |
From net investment income | | (0.02) |
From net realized gain on investments | | (0.01) |
| | |
Total distributions to shareholders | | (0.03) |
| | |
Net asset value - End of period | | $10.61 |
| | |
Net assets - End of period (000’s omitted) | | $69,179 |
| | |
Total return3 | | 6.36% |
| Ratios (to average net assets)/ Supplemental Data: | | |
Expenses* | | 1.20%4 |
Net investment income | | 1.43%4 |
Portfolio turnover | | 3% |
|
*The investment advisor did not impose all of its management fees during the period. If these expenses had been incurred by the Series, the expense ratio (to average net assets) |
would have been increased by the following amount: | | 0.38%4 |
1Commencement of operations.
2Calculated based on average shares outstanding during the period.
3Represents aggregate total return for the period indicated, and assumes reinvestment of all distributions. Total return would have been lower had certain expenses not been waived during the period. Periods less than one year are not annualized.
4Annualized.
| | |
| 10 | | The accompanying notes are an integral part of the financial statements. |
Notes to Financial Statements
Real Estate Series (the “Series”) is a no-load non-diversified series of Manning & Napier Fund, Inc. (the “Fund”). The Fund is organized in Maryland and is registered under the Investment Company Act of 1940, as amended, as an open-end management investment company.
The Series’ investment objective is to provide long-term growth by investing principally in the common stocks of companies in real estate-based industries.
The Fund’s Advisor is Manning & Napier Advisors, Inc. (the “Advisor”). Shares of the Series are offered to investors, clients and employees of the Advisor and its affiliates. The total authorized capital stock of the Fund consists of 10.0 billion shares of common stock each having a par value of $0.01. As of December 31, 2009, 4.6 billion shares have been designated in total among 29 series, of which 100 million have been designated as Real Estate Series Class A common stock.
| 2. | SIGNIFICANT ACCOUNTING POLICIES |
Security Valuation
Portfolio securities, including domestic equities, foreign equities, exchange-traded funds and options, listed on an exchange other than the NASDAQ National Market System are valued at the latest quoted sales price of the exchange on which the security is primarily traded. Securities not traded on valuation date or securities not listed on an exchange are valued at the latest quoted bid price provided by the Fund’s pricing service. Securities listed on the NASDAQ National Market System are valued in accordance with the NASDAQ Official Closing Price.
Short-term investments that mature in sixty days or less are valued at amortized cost, which approximates market value. Investments in open-end investment companies are valued at their net asset value per share on valuation date.
Volume and level of activity in established markets for an asset or liability are evaluated to determine whether recent transactions and quoted prices are determinative of fair value. Where there have been significant decreases in volume and level of activity, further analysis and adjustment may be necessary to estimate fair value. The Series measures fair value in these instances by the use of inputs and valuation techniques which may be based upon current market prices of securities that are comparable in coupon, rating, maturity and industry and/or expectation of future cash flows. As a result of trading in relatively thin markets and/or markets that experience significant volatility, the prices used by the Series to value these securities may differ from the value that would be realized if these securities were sold, and the differences could be material.
Securities for which representative valuations or prices are not available from the Fund’s pricing service may be valued at fair value. Due to the inherent uncertainty of valuations of such securities, the fair value may differ significantly from the values that would have been used had a ready market for such securities existed. If trading or events occurring after the close of the principal market in which securities are traded are expected to materially affect the value of those securities, then they may be valued at their fair value, taking this trading or these events into account. Fair value is determined in good faith by the Advisor under procedures approved by and under the general supervision and responsibility of the Fund’s Board of Directors (the “Board”).
Various inputs are used in determining the value of the Series’ assets or liabilities carried at market value. These inputs are summarized in three broad levels. Level 1 includes quoted prices in active markets for identical assets and liabilities. Level 2 includes other significant
Notes to Financial Statements
| 2. | SIGNIFICANT ACCOUNTING POLICIES (continued) |
Security Valuation (continued)
observable inputs (including quoted prices for similar securities, interest rates, prepayment speeds, credit risk, etc.). Level 3 includes significant unobservable inputs (including the Series’ own assumptions in determining the fair value of investments). The inputs or methodology used for valuing securities are not necessarily an indication of the risk associated with investing in those securities.
The following is a summary of the valuation levels used for major security types as of December 31, 2009 in valuing the Series’ assets or liabilities carried at market value:
| | | | | | | | | | | | |
Description | | 12/31/09 | | Level 1 | | Level 2 | | Level 3 |
| | | | | | | | | | | | |
Equity securities* | | $ | 66,833,728 | | $ | 66,833,728 | | $ | — | | $ | — |
Preferred securities | | | — | | | — | | | — | | | — |
Debt securities | | | — | | | — | | | — | | | — |
Mutual funds | | | 3,313,544 | | | 3,313,544 | | | — | | | — |
Other financial instruments** | | | — | | | — | | | — | | | — |
| | | | | | | | | | | | |
Total | | $ | 70,147,272 | | $ | 70,147,272 | | $ | — | | $ | — |
| | | | | | | | | | | | |
*Includes common stock, warrants and rights. Please see the Investment Portfolio for industry classification.
**Other financial instruments are derivative instruments not reflected in the Investment Portfolio, such as futures, forwards and swap contracts, which are valued at the unrealized appreciation/depreciation on the instrument. As of December 31, 2009, the Series did not hold any derivative instruments.
There were no Level 3 securities held by the Series as of November 10, 2009 (commencement of operations) or December 31, 2009.
Interim and annual reporting periods beginning after December 15, 2009 will require additional disclosure regarding transfers in and/or out of Level 1 and 2.Additional disclosure surrounding the activity in Level 3 fair value measurement will also be effective for fiscal years beginning after December 15, 2010. Management has concluded that this will not have a material impact on the Series’ financial statements.
Security Transactions, Investment Income and Expenses
Security transactions are accounted for on trade date. Dividend income is recorded on the ex-dividend date, except that if the ex-dividend date has passed, certain dividends from foreign securities are recorded as soon as the Fund is informed of the ex-dividend date. Non-cash dividends, if any, are recorded at the fair market value of the securities received. Interest income, including amortization of premium and accretion of discounts using the effective interest method, is earned from settlement date and accrued daily.
Expenses are recorded on an accrual basis. Most expenses of the Fund can be attributed to a specific series. Expenses which cannot be directly attributed are apportioned among the series in the Fund in such a manner as deemed equitable by the Fund’s Board, taking into consideration, among other things, the nature and type of expense.
Notes to Financial Statements
| 2. | SIGNIFICANT ACCOUNTING POLICIES (continued) |
Security Transactions, Investment Income and Expenses (continued)
The Fund records distributions received in excess of income from underlying investments as a reduction of cost of investments and/or realized gain. Such amounts are based on estimates if actual amounts are not available and actual amounts of income, realized gain and return of capital may differ from the estimated amounts. The Fund adjusts the estimated amounts of components of distributions (and consequently its net investment income) as necessary once the issuers provide information about the actual composition of the distributions.
The Series uses the identified cost method for determining realized gain or loss on investments for both financial statement and federal income tax reporting purposes.
Foreign Currency Translation
The books and records of the Series are maintained in U.S. dollars. Foreign currencies, investments and other assets and liabilities are translated into U.S. dollars at the current exchange rates. Purchases and sales of investment securities and income and expenses are translated on the respective dates of such transactions. The Series does not isolate realized and unrealized gains and losses attributable to changes in the exchange rates from gains and losses that arise from changes in the market value of investments. Such fluctuations are included with net realized and unrealized gain or loss on investments. Net realized foreign currency gains and losses represent foreign currency gains and losses between trade date and settlement date on securities transactions, gains and losses on disposition of foreign currencies and the difference between the amount of income and foreign withholding taxes recorded on the books of the Series and the amounts actually received or paid.
Federal Taxes
The Series’ policy is to comply with the provisions of the Internal Revenue Code applicable to regulated investment companies. The Series is not subject to federal income tax or excise tax to the extent that the Series distributes to shareholders each year its taxable income, including any net realized gains on investments, in accordance with requirements of the Internal Revenue Code. Accordingly, no provision for federal income tax or excise tax has been made in the financial statements.
Management evaluates its tax positions to determine if the tax positions taken meet the minimum recognition threshold in connection with accounting for uncertainties in income tax positions taken or expected to be taken for the purposes of measuring and recognizing tax liabilities in the financial statements. Recognition of tax benefits of an uncertain tax position is required only when the position is “more likely than not” to be sustained assuming examination by taxing authorities. At December 31, 2009, the Series has recorded no liability for net unrecognized tax benefits relating to uncertain income tax positions taken or expected to be taken in future tax returns.
The Series files income tax returns in the U.S. federal jurisdiction, various states and foreign jurisdictions, as required. No income tax returns are currently under investigation, as this is the inception year for the Series and it has not yet filed any tax returns. The Fund is not aware of any tax positions for which it is reasonably possible that the total amounts of unrecognized tax benefits will significantly change in the next twelve months.
Notes to Financial Statements
| 2. | SIGNIFICANT ACCOUNTING POLICIES (continued) |
Federal Taxes (continued)
Additionally, based on the Fund’s understanding of the tax rules and rates related to income, gains and transactions for foreign jurisdictions in which it invests, the Series will provide for foreign taxes, and where appropriate, deferred foreign tax.
Distributions of Income and Gains
Distributions to shareholders of net investment income and net realized gains are made annually. An additional distribution may be necessary to avoid taxation of the Series. Distributions are recorded on the ex-dividend date.
Indemnifications
The Fund’s organizational documents provide former and current directors and officers with a limited indemnification against liabilities arising in connection with the performance of their duties to the Fund. In the normal course of business, the Fund may also enter into contracts that provide general indemnifications. The Fund’s maximum exposure under these arrangements is unknown as this would be dependent on future claims that may be made against the Fund. The risk of material loss from such claims is considered remote.
Other
The preparation of financial statements in conformity with accounting principles generally accepted in the United States of America requires management to make estimates and assumptions that affect the reported amounts of assets and liabilities and the disclosure of contingent assets and liabilities at the date of the financial statements and the reported amounts of income and expenses during the reporting period. Actual results could differ from those estimates.
| 3. | TRANSACTIONS WITH AFFILIATES |
The Fund has an Investment Advisory Agreement (the “Agreement”) with the Advisor, for which the Series pays a fee, computed daily and payable monthly, at an annual rate of 1.00% of the Series’ average daily net assets.
Under the Agreement, personnel of the Advisor provide the Series with advice and assistance in the choice of investments and the execution of securities transactions, and otherwise maintain the Series’ organization. The Advisor also provides the Fund with necessary office space and fund administration and support services. The salaries of all officers of the Fund (except a percentage of the Fund’s Chief Compliance Officer’s salary, which is paid by the Fund), and of all Directors who are “affiliated persons” of the Fund, or of the Advisor, and all personnel of the Fund, or of the Advisor, performing services relating to research, statistical and investment activities, are paid by the Advisor. Each “non-affiliated” Director receives an annual stipend, which is allocated among all the active series of the Fund. In addition, these Directors also receive a fee per Board meeting attended for each active series of the Fund plus a fee for each committee meeting attended.
The Advisor has contractually agreed, until at least April 30, 2011, to waive its fee and, if necessary, pay other operating expenses of the Series in order to maintain total direct annual fund operating expenses for the Series at no more than 1.20% of average daily net assets each year. Accordingly, the Advisor waived fees of $31,391 for the period November 10, 2009 (commencement of operations) to December 31, 2009, which is included as a reduction of expenses on the Statement of Operations. The Advisor is not eligible to recoup this amount.
Notes to Financial Statements
| 3. | TRANSACTIONS WITH AFFILIATES (continued) |
Manning & Napier Investor Services, Inc., a registered broker-dealer affiliate of the Advisor, acts as distributor for the Fund’s shares. The services of Manning & Napier Investor Services, Inc. are provided at no additional cost to the Series.
The Advisor has entered into agreements dated October 12, 2009 and November 9, 2009 with PNC Global Investment Servicing (U.S.) Inc. (“PNCGIS”) under which PNCGIS serves as sub-accountant services agent and sub-transfer agent, respectively. Effective November 7, 2009 under the amended master services agreement, the Fund pays the Advisor an annual fee of 0.0175% on the first $3 billion of average daily net assets (excluding Target Series); 0.015% on the next $3 billion of average daily net assets (excluding Target Series); and 0.01% of the average daily net assets in excess of $6 billion (excluding Target Series); plus a base fee of $25,500 per Series. Additionally, certain transaction-, account-, and cusip-based fees and out-of-pocket expenses, including charges for reporting relating to the Fund’s compliance program, are charged.
| 4. | PURCHASES AND SALES OF SECURITIES |
For the period November 10, 2009 (commencement of operations) to December 31, 2009, purchases and sales of securities, other than United States Government securities and short-term securities, were $66,426,476 and $1,736,947, respectively. There were no purchases or sales of United States Government securities.
| 5. | CAPITAL STOCK TRANSACTIONS |
Transactions in shares of Real Estate Series were:
| | | | | | | |
| | | For the period 11/10/09
(commencement of
operations) to 12/31/09 | |
| | | Shares | | | Amount | |
| | | | | | | |
Sold | | 6,617,571 | | | $ | 66,420,562 | |
Reinvested | | 13,571 | | | | 139,922 | |
Repurchased | | (113,239 | ) | | | (1,162,442 | ) |
| | | | | | | |
Total | | 6,517,903 | | | $ | 65,398,042 | |
| | | | | | | |
Substantially all of the Series’ shares represent investments by fiduciary accounts over which the Advisor has sole investment discretion.
The Series may trade in instruments including written and purchased options, forward foreign currency exchange contracts and futures contracts and other derivatives in the normal course of investing activities to assist in managing exposure to various market risks. The Series may be subject to various elements of risk and may involve, to a varying degree, elements of risk in excess of the amounts recognized for financial statement purposes; the risk that changes in the value of a derivative may not correlate perfectly with the underlying asset, rate or index; counterparty credit risk related to over the counter derivatives counterparties failure to perform under contract terms; liquidity risk related to the lack of a liquid market for these contracts allowing the fund
Notes to Financial Statements
| 6. | FINANCIAL INSTRUMENTS (continued) |
to close out its position(s); and documentation risk relating to disagreement over contract terms. No such investments were held by the Series during the period ended December 31, 2009.
Investing in securities of foreign companies and foreign governments involves special risks and considerations not typically associated with investing in securities of domestic companies and the U.S. Government. These risks include revaluation of currencies and future adverse political and economic developments. Moreover, securities of foreign companies and foreign governments and their markets may be less liquid and their prices more volatile than those of comparable domestic companies and the U.S. Government.
The Series may focus its investments in certain related real estate industries; hence, the Series may subject itself to a greater degree of risk than a series that is more diversified.
| 9. | FEDERAL INCOME TAX INFORMATION |
The amount and characterization of certain income and capital gains to be distributed are determined in accordance with federal income tax regulations, which may differ from accounting principles generally accepted in the United States of America. The Series may periodically make reclassifications among its capital accounts to reflect income and gains available for distribution (or available capital loss carryovers) under income tax regulations without impacting the Series’ net asset value. Any such reclassifications are not reflected in the financial highlights.
The tax character of distributions paid for the period November 10, 2009 (commencement of operations) to December 31, 2009 were as follows:
| | | |
Ordinary income | | $ | 103,993 |
Long-term capital gains | | | 40,774 |
At December 31, 2009, the tax basis components of distributable earnings and the net unrealized appreciation based on identified cost for federal income tax purposes were as follows:
| | | | |
Cost for federal income tax purposes | | $ | 66,452,683 | |
Unrealized appreciation | | $ | 3,827,908 | |
Unrealized depreciation | | | (133,319 | ) |
| | | | |
Net unrealized appreciation | | $ | 3,694,589 | |
Undistributed ordinary income | | | 85,955 | |
On February 2, 2010, the PNC Financial Services Group, Inc. (“PNC”), which serves as the Series’ sub-accountant services agent and sub-transfer agent, entered into a Stock Purchase Agreement (the “Stock Purchase Agreement”) with The Bank of New York Mellon Corporation (“BNY Mellon”), the Series’ custodian. Upon the terms and subject to the conditions set forth in the Stock Purchase Agreement, which has been approved by the board of directors of each company, PNC will sell to BNY Mellon (the “Stock Sale”) 100% of the issued and outstanding shares of PNC Global Investment Servicing, Inc., an indirect, wholly-owned subsidiary of PNC. The Stock Sale is expected to close in the third quarter of 2010. Management has concluded that this will not have a material impact on the Series’ financial statements.
Notes to Financial Statements
| 10. | SUBSEQUENT EVENTS (continued) |
There were no other subsequent events that require recognition or disclosure. In preparing these financial statements, management of the Fund has evaluated events and transactions for potential recognition or disclosure through February 23, 2010, the date the financial statements were issued.
Report of Independent Registered Public Accounting Firm
To the Board of Directors of Manning & Napier Fund, Inc. and Shareholders of Real Estate Series:
In our opinion, the accompanying statement of assets and liabilities, including the investment portfolio, and the related statements of operations and of changes in net assets and the financial highlights present fairly, in all material respects, the financial position of the Real Estate Series (a series of Manning & Napier Fund, Inc., hereafter referred to as the “Series”) at December 31, 2009, and the results of its operations, the changes in its net assets and the financial highlights for the period November 10, 2009 (commencement of operations) through December 31, 2009, in conformity with accounting principles generally accepted in the United States of America. These financial statements and financial highlights (hereafter referred to as “financial statements”) are the responsibility of the Series’ management; our responsibility is to express an opinion on these financial statements based on our audit. We conducted our audit of these financial statements in accordance with the standards of the Public Company Accounting Oversight Board (United States). Those standards require that we plan and perform the audit to obtain reasonable assurance about whether the financial statements are free of material misstatement. An audit includes examining, on a test basis, evidence supporting the amounts and disclosures in the financial statements, assessing the accounting principles used and significant estimates made by management, and evaluating the overall financial statement presentation. We believe that our audit, which included confirmation of securities at December 31, 2009 by correspondence with the custodian and brokers, provides a reasonable basis for our opinion.

Columbus, Ohio
February 23, 2010
Supplemental Tax Information (unaudited)
All designations are based on financial information available as of the date of this annual report and, accordingly are subject to change.
For federal income tax purposes, the Series designates for the current fiscal year $7,397 or, if different, the maximum amount allowable under the tax law as qualified dividend income.
Pursuant to Section 852 of the Internal Revenue Code, as amended, the Series hereby designates $40,774 as capital gains for its taxable year ended December 31, 2009, or if different, the maximum allowable under tax law.
For corporate shareholders, the percentage of investment income (dividend income plus short-term gains, if any) that qualifies for the dividends received deduction for the current fiscal year is 5.99%, or if different, the maximum allowable under tax law.
Renewal of Investment Advisory Agreement (unaudited)
At the Manning & Napier Fund, Inc. (the “Fund”) Board of Directors’ (the “Board”) meeting, held on December 7, 2009, the Investment Advisory Agreement (the “Agreement”) between the Fund and Manning & Napier Advisors, Inc. (the “Advisor”) was reviewed by the Board for renewal. In connection with the decision whether to renew the Agreement, a variety of material was prepared for and reviewed by the Board.
Representatives of the Advisor attended the meeting and presented additional oral and written information to the Board to assist the Board in its considerations. The discussion immediately below outlines the materials and information presented to the Board in connection with the Board’s 2009 Annual Review of the Agreement and the conclusions made by the Directors when determining to continue the Agreement.
| | • | | The Board considered the services provided by the Advisor under the Agreement including, among others: deciding what securities to purchase and sell for each Series; arranging for the purchase and sale of such securities by placing orders with broker-dealers; administering the affairs of the Fund (including the books and records of the Fund not maintained by third party service providers such as the custodian or sub-transfer agent); arranging for the insurance coverage for the Fund; and supervising the preparation of tax returns, SEC filings (including registration statements) and reports to shareholders for the Fund. The Board also considered the nature and quality of such services provided under the Agreement in light of the Advisor’s services provided to the Fund for 23 years. The Board discussed the quality of these services with representatives from the Advisor and concluded that the Advisor was performing its services to the Fund required under the Agreement in a reasonable manner. |
| | • | | The Board considered the investment performance of the various Series of the Fund. The investment performance for each Series was reviewed on a cumulative basis since inception and on a one year basis. In addition, annualized performance for the following time periods was considered: inception, three year, five year, ten year, and current market cycle. A market cycle includes periods of both rising and falling markets. Returns for established benchmark indices for each Series were provided for each time period. The Board noted that the various Series were competitive against their respective benchmarks and/or peer groups over various time periods, but in particular over the full market cycle periods relevant for the Series. In addition, the Board considered at the meeting (and considers on a quarterly basis) a peer group performance analysis consisting of Morningstar universes of mutual funds with similar investment objectives. The Board discussed the performance with representatives from the Advisor and concluded that the investment performance of each of the Fund’s Series was reasonable based on the Fund’s actual performance and comparative performance, especially performance over the current market cycle. |
| | • | | The Board considered the costs of the Advisor’s services and the profits of the Advisor as they relate to the Advisor’s services to the Fund under the Agreement. In reviewing the Advisor’s costs and profits, the Board discussed the Advisor’s revenues generated from the Fund (on both an actual and adjusted basis) and its expenses associated with providing the services under the Agreement. In addition, the Board reviewed the Advisor’s expenses associated with Fund activities outside of the Agreement (such as expense reimbursements pursuant to expense caps and payments made by the Advisor to third party platforms on which shares of the Fund are available for purchase). It was noted by representatives of the Advisor that 13 of the 26 active Series of the Fund are currently experiencing expenses above the capped expense ratios. After discussing the above costs and profits, the Board concluded that the Advisor’s profitability relating to its services provided under the Agreement was reasonable. |
Renewal of Investment Advisory Agreement (unaudited)
| | • | | The Board considered the fees and expenses of the various Series of the Fund. The Advisor presented the advisory fees and total expenses for each Series, including the advisory fee adjusted for any expense waivers or reimbursements (either contractual or voluntary) paid by the Advisor. The advisory fees and expense ratios of each Series were compared to an average (on both a mean and median basis) of similar funds as disclosed on the Morningstar database. Representatives of the Advisor discussed with the Board the levels of its advisory fee for each Series of the Fund and as compared to the median and mean advisory fees for similar funds as listed on Morningstar. Expense ratios for every Series, except the Global Fixed Income Series and the Target Series Class R and Class C, are currently below the median and mean for similar funds as listed on Morningstar. Based on their review of the information provided, the Board concluded that the fees and expenses of each Series of the Fund were reasonable on a comparative basis. |
| | • | | The Board also considered the other benefits the Advisor derives from its relationship with the Fund. Such other benefits include certain research products provided by soft dollars. Given the level of soft dollar transactions involving the Fund, the Board concluded that these additional benefits to the Advisor were reasonable. |
| | • | | In addition to the factors described above, the Board considered the Advisor’s personnel, investment strategies, policies and procedures relating to compliance with personal securities transactions, and reputation, expertise and resources in domestic and foreign financial markets. The Board concluded that these factors support the conclusion that the Advisor performs its services in a reasonable manner. |
| | • | | The Board did not consider economies of scale at this time because of the multiple uses of the Fund (for the Advisor’s discretionary investment account clients in addition to direct investors), the current profitability of the Advisor’s services to the Fund under the Agreement, and the overall size of the Fund complex. |
Based on the Board’s deliberations and their evaluation of the information described above, the Board, including a majority of Directors that are not “interested persons” as defined in the Investment Company Act of 1940, concluded that the compensation under the Agreement was fair and reasonable in light of the services and expenses and such other matters as the Directors considered to be relevant in the exercise of their reasonable judgment. Accordingly, the Board approved the renewal of the Agreement. In the course of their deliberations, the Directors did not identify any particular information that was all important or controlling.
Directors’ and Officers’ Information (unaudited)
The Statement of Additional Information provides additional information about the Fund’s directors and officers and can be obtained without charge by calling 1-800-466-3863, at www.manningnapieradvisors.com, or on the EDGAR Database on the SEC Internet web site (http:// www.sec.gov). The following chart shows certain information about the Fund’s officers and directors, including their principal occupations during the last five years. Unless specific dates are provided, the individuals have held the listed positions for longer than five years.
INTERESTED DIRECTOR/OFFICER
| | |
| Name: | | B. Reuben Auspitz* |
| Address: | | 290 Woodcliff Drive Fairport, NY 14450 |
| Age: | | 62 |
| Current Position(s) Held with Fund: | | Principal Executive Officer, President, Chairman & Director |
| Term of Office1 & Length of Time Served: | | Indefinite - Director since 1984; Vice President 1984 - 2003; President since 2004; Principal Executive Officer since 2002 |
| Principal Occupation(s) During Past 5 Years: | | Executive Vice President; Co-Executive Director; Executive Group Member**; Chief Compliance Officer since 2004 - Manning & Napier Advisors, Inc. President; Director - Manning & Napier Investor Services, Inc. Holds or has held one or more of the following titles for various subsidiaries and affiliates: President, Vice President, Director, Chairman, Treasurer, Chief Compliance Officer or Member. |
| Number of Portfolios Overseen within Fund Complex: | | 29 |
| Other Directorships Held Outside Fund Complex: | | N/A |
| |
| INDEPENDENT DIRECTORS | | |
| |
| Name: | | Stephen B. Ashley |
| Address: | | 290 Woodcliff Drive Fairport, NY 14450 |
| Age: | | 69 |
| Current Position(s) Held with Fund: | | Director, Audit Committee Member, Governance & Nominating Committee Member |
| Term of Office & Length of Time Served: | | Indefinite - Since 1996 |
| Principal Occupation(s) During Past 5 Years: | | Chairman, Director, President & Chief Executive Officer, The Ashley Group (property management and investment). Chairman (non-executive) 2004 - 2008; Director 1995 - 2008 - Fannie Mae (mortgage) |
| Number of Portfolios Overseen within Fund Complex: | | 29 |
| Other Directorships Held Outside Fund Complex: | | The Ashley Group |
| Name: | | Peter L. Faber |
| Address: | | 290 Woodcliff Drive Fairport, NY 14450 |
| Age: | | 71 |
| Current Position(s) Held with Fund: | | Director, Governance & Nominating Committee Member |
| Term of Office & Length of Time Served: | | Indefinite - Since 1987 |
| Principal Occupation(s) During Past 5 Years: | | Senior Counsel since 2006, Partner (1995-2006) - McDermott, Will & Emery LLP (law firm) |
| Number of Portfolios Overseen within Fund Complex: | | 29 |
| Other Directorships Held Outside Fund Complex: | | Partnership for New York City, Inc. (non-profit) New York Collegium (non-profit) Boston Early Music Festival (non-profit) Amherst Early Music, Inc. (non-profit) Gotham Early Music Scene, Inc. (non-profit) |
Directors’ and Officers’ Information (unaudited)
INDEPENDENT DIRECTORS (continued)
| | |
| |
| Name: | | Harris H. Rusitzky |
| Address: | | 290 Woodcliff Drive Fairport, NY 14450 |
| Age: | | 75 |
| Current Position(s) Held with Fund: | | Director, Audit Committee Member, Governance & Nominating Committee Member |
| Term of Office & Length of Time Served: | | Indefinite - Since 1985 |
| Principal Occupation(s) During Past 5 Years: | | President, The Greening Group (business consultants) since 1994; Partner, The Restaurant Group (restaurants) since 2006 |
| Number of Portfolios Overseen within Fund Complex: | | 29 |
| Other Directorships Held Outside Fund Complex: | | N/A |
| Name: | | Paul A. Brooke |
| Address: | | 290 Woodcliff Drive Fairport, NY 14450 |
| Age: | | 64 |
| Current Position(s) Held with Fund: | | Director, Audit Committee Member, Governance & Nominating Committee Member |
| Term of Office & Length of Time Served: | | Indefinite - Since 2007 |
| Principal Occupation(s) During Past 5 Years: | | Chairman & CEO, Alsius Corp. (investments); Managing Member, PMSV Holdings LLC (investments) |
| Number of Portfolios Overseen within Fund Complex: | | 29 |
| Other Directorships Held Outside Fund Complex: | | Incyte Corp. ViroPharma, Inc. WebMD Cheyne Capital International MPM Bio-equities GMP Companies HoustonPharma |
| Name: | | Richard M. Hurwitz |
| Address: | | 290 Woodcliff Drive Fairport, NY 14450 |
| Age: | | 46 |
| Current Position(s) Held with Fund: | | Director, Audit Committee Member, Governance & Nominating Committee Member |
| Term of Office & Length of Time Served: | | Indefinite - Since 2009 |
| Principal Occupation(s) During Past 5 Years: | | Managing Partner, Aegis Investment Partners, LLC (investments) since 2006; Founder and Managing Partner (2004-2005) - Village Markets, LLC (groceries) |
| Number of Portfolios Overseen within Fund Complex: | | 29 |
| Other Directorships Held Outside Fund Complex: | | Pictometry International Corp. |
Directors’ and Officers’ Information (unaudited)
OFFICERS
| | |
| |
| Name: | | Jeffrey S. Coons, Ph.D., CFA |
| Address: | | 290 Woodcliff Drive Fairport, NY 14450 |
| Age: | | 46 |
| Current Position(s) Held with Fund: | | Vice President |
| Term of Office1 & Length of Time Served: | | Since 2004 |
| Principal Occupation(s) During Past 5 Years: | | Co-Director of Research since 2002 & Executive Group Member** since 2003, Manning & Napier Advisors, Inc. Holds one or more of the following titles for various subsidiaries and affiliates: President, Director, Treasurer or Senior Trust Officer. |
| Number of Portfolios Overseen within Fund Complex: | | 29 |
| Other Directorships Held Outside Fund Complex: | | N/A |
| Name: | | Christine Glavin |
| Address: | | 290 Woodcliff Drive Fairport, NY 14450 |
| Age: | | 43 |
| Current Position(s) Held with Fund: | | Principal Financial Officer, Chief Financial Officer |
| Term of Office1 & Length of Time Served: | | Principal Financial Officer since 2002; Chief Financial Officer since 2001 |
| Principal Occupation(s) During Past 5 Years: | | Fund Reporting Manager, Manning & Napier Advisors, Inc. since 1997 |
| Number of Portfolios Overseen within Fund Complex: | | 29 |
| Other Directorships Held Outside Fund Complex: | | N/A |
| Name: | | Jodi L. Hedberg |
| Address: | | 290 Woodcliff Drive Fairport, NY 14450 |
| Age: | | 42 |
| Current Position(s) Held with Fund: | | Corporate Secretary, Chief Compliance Officer, Anti-Money Laundering Compliance Officer |
| Term of Office1 & Length of Time Served: | | Corporate Secretary since 1997; Chief Compliance Officer since 2004 |
| Principal Occupation(s) During Past 5 Years: | | Director of Compliance, Manning & Napier Advisors, Inc. and affiliates since 1990 (title change in 2005 from Compliance Manager to Director of Compliance); Corporate Secretary, Manning & Napier Investor Services, Inc. since 2006 |
| Number of Portfolios Overseen within Fund Complex: | | 29 |
| Other Directorships Held Outside Fund Complex: | | N/A |
*Interested Director, within the meaning of the Investment Company Act of 1940 by reason of his position with the Fund’s investment advisor and distributor. Mr. Auspitz serves as the Executive Vice President and Director, Manning & Napier Advisors, Inc. and President and Director, Manning & Napier Investor Services, Inc., the Fund’s distributor.
**The Executive Group performs the duties of the Office of the Chief Executive of Manning & Napier Advisors, Inc.
1The term of office for President, Vice President, Chief Financial Officer, and Corporate Secretary is one year and until their respective successors are chosen and qualified. All other officers’ terms are indefinite.
This Page Intentionally Left Blank
Literature Requests (unaudited)
Proxy Voting Policies and Procedures
A description of the policies and procedures that the Fund uses to determine how to vote proxies relating to portfolio securities is available, without charge, upon request:
| | |
By phone | | 1-800-466-3863 |
On the Securities and Exchange Commission’s (SEC) web site | | http://www.sec.gov |
Proxy Voting Record
Information regarding how the Fund voted proxies relating to portfolio securities during the most recent 12-month period ended June 30th is available, without charge, upon request:
| | |
By phone | | 1-800-466-3863 |
On the SEC’s web site | | http://www.sec.gov |
Quarterly Portfolio Holdings
The Series’ complete schedule of portfolio holdings for the 1st and 3rd quarters of each fiscal year are provided on Form N-Q, and are available, without charge, upon request:
| | |
By phone | | 1-800-466-3863 |
On the SEC’s web site | | http://www.sec.gov |
The Series’ Form N-Q may be reviewed and copied at the SEC’s Public Reference Room in Washington, D.C. Information on the operation of the Public Reference Room may be obtained by calling 1-800-SEC-0330.
Prospectus and Statement of Additional Information (SAI)
The prospectus and SAI provide additional information about each Series, including charges, expenses and risks. These documents are available, without charge, upon request:
| | |
By phone | | 1-800-466-3863 |
On the SEC’s web site | | http://www.sec.gov |
On the Advisor’s web site | | http://www.manningnapieradvisors.com |
Additional information available at www.manningnapieradvisors.com
1. Fund Holdings - Month-End
2. Fund Holdings - Quarter-End
3. Shareholder Report - Annual
4. Shareholder Report - Semi-Annual


Management Discussion and Analysis (unaudited)

Dear Shareholders:
Over the past twelve months, investor sentiment has moved rather quickly from extreme pessimism to guarded optimism. Volatility continued during the first quarter of 2009, with broad equity markets down more than 10%. After hitting a low point in late March, both domestic and foreign stock markets turned upwards rather dramatically, posting 40% to 60% returns off their lows through the end of the year.
While this turnaround has not been enough to fully offset losses experienced during the current bear market, recent returns indicate that market participants appear more confident in an economic rebound. During 2009, the Morgan Stanley Capital International (MSCI) All Country World Index excluding the U.S. (ACWIxUS) was up a remarkable 41.45%.
The International Series was also up significantly over the twelve months ended December 31, 2009, with a return of 34.23%. While the Series’ return during 2009 lagged that of its benchmark during this strong market rebound, the Series continues to outperform the MSCI ACWIxUS over the current international stock market cycle (4/1/03 to 12/31/09), which includes both a bull and a bear market. Over this current market cycle (4/1/03 to 12/31/09), the International Series has earned an annualized return of 15.08% relative to the 14.13% return of the MSCI ACWIxUS.
Throughout the year, the Series’ greatest country allocations included the United Kingdom, France and Germany. A higher allocation to France and Germany relative to the benchmark detracted from performance as these developed markets rebounded less than many developing markets following March lows. In contrast, the Series’ meaningful allocation to the United Kingdom aided returns, as did the specific holdings selected within this market. The Series’ modest allocation to Japan relative to the benchmark also contributed positively as this country’s market continued to struggle despite the emergence of a global economic recovery.
During 2009, the Series added to holdings in Brazil, including companies in oil, rail and health insurance industries. Our thesis that the current administration’s economic policies should support growth was recognized by the market as Brazil represented one of the strongest performers in 2009. In contrast, the Series did not participate in the strong rebound in the Materials sector in countries such as Canada and Australia.
Currently, Germany, France and the United Kingdom remain the Series’ largest country allocations, based on our view that Western Europe is in the midst of a long-term reform project in which several burdens within the corporate sector have been removed to increase the competitiveness of this region.
From a macro perspective, the current environment remains challenging. On the one hand, more encouraging pockets of optimism have been found in the housing and manufacturing sectors, and while the unemployment rate remains high in many developed countries, there are subtle signs of improvement in the U.S. labor markets. On the other hand, macro-economic challenges remain in the face of a growing government deficit, continued easy monetary policy, a debt-burdened U.S. consumer and widespread inflation concerns.
We recognize that solving yesterday’s problems may create new and different macro-economic challenges. In an environment like today, the very uncertainty that makes investors cautious can also create attractively priced investment opportunities for long-term investors. We will continue to seek out such opportunities as the next phase of this market and economic cycle unfolds
As always, we appreciate your business.
Sincerely,
Manning & Napier Advisors, Inc.
Performance Update as of December 31, 2009 (unaudited)
| | | | | | | | | | |
| | | Average Annual Total Returns
As of December 31, 2009 | | |
| | | One
Year | | Five
Year | | Ten
Year | | Since
Inception1 | | |
Manning & Napier Fund, Inc. - International Series2 | | 34.23% | | 7.08% | | 4.52% | | 9.13% | | |
Standard & Poor’s (S&P) 500 Total Return Index3 | | 26.50% | | 0.43% | | -0.94% | | 7.97% | | |
Morgan Stanley Capital International (MSCI) All Country World Index ex U.S.3 | | 41.45% | | 5.83% | | 2.71% | | 6.93% | | |
The following graph compares the value of a $10,000 investment in the Manning & Napier Fund, Inc. - International Series for the ten years ended December 31, 2009 to the S&P 500 Total Return Index and the MSCI All Country World Index ex U.S.
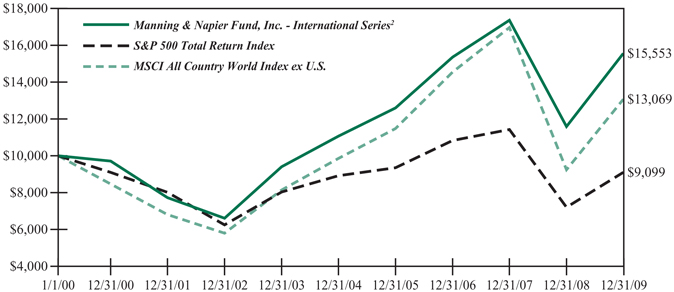
1Performance numbers for the Series and the S&P 500 Total Return Index are calculated from August 27, 1992, the Series’ inception date. Prior to 2001, the MSCI All Country World Index ex U.S. only published month-end numbers; therefore, performance numbers for the Index are calculated from August 31, 1992.
2The Series’ performance does not reflect the deduction of taxes that a shareholder would pay on fund distributions or the redemption of shares. The Series’ performance is historical and may not be indicative of future results. The performance returns shown are inclusive of the net expense ratio of the Series. For the year ended December 31, 2009, this net expense ratio was 1.15%. The gross expense ratio, which does not account for any voluntary or contractual waivers currently in effect, was 1.15% for the year ended December 31, 2009.
3The S&P 500 Total Return Index is an unmanaged capitalization-weighted measure of 500 widely held common stocks listed on the New York Stock Exchange, American Stock Exchange and the Over-the-Counter market. The Index returns assume daily reinvestment of dividends. The MSCI All Country World Index ex U.S. is a free float-adjusted market capitalization weighted index that is designed to measure equity market performance in the global developed and emerging markets and consists of 47 developed and emerging market country indices outside the United States. The Index is denominated in U.S Dollars. The Index returns assume daily reinvestment of gross dividends (which do not account for foreign dividend taxation) from the inception of the Series (see Note 1 above) through December 31, 1998, as net returns were not available. Subsequent to December 31, 1998, the Index returns assume daily reinvestment of net dividends (thus accounting for foreign dividend taxation). Both Indices’ returns, unlike Series returns, do not reflect any fees or expenses.
Shareholder Expense Example (unaudited)
As a shareholder of the Series, you may incur two types of costs: (1) transaction costs, including potential wire charges on redemptions and (2) ongoing costs, including management fees and other Series expenses. This example is intended to help you understand your ongoing costs (in dollars) of investing in the Series and to compare these costs with the ongoing costs of investing in other mutual funds.
The example is based on an investment of $1,000 invested at the beginning of the period and held for the entire period (July 1, 2009 to December 31, 2009).
Actual Expenses
The first line of the table below provides information about actual account values and actual expenses. You may use the information in this line, together with the amount you invested, to estimate the expenses that you paid over the period. Simply divide your account value by $1,000 (for example, an $8,600 account value divided by $1,000 = 8.6), then multiply the result by the number in the first line under the heading entitled “Expenses Paid During Period” to estimate the expenses you paid on your account during this period.
Hypothetical Example for Comparison Purposes
The second line of the table below provides information about hypothetical account values and hypothetical expenses based on the Series’ actual expense ratio and an assumed rate of return of 5% per year before expenses, which is not the Series’ actual return. The hypothetical account values and expenses may not be used to estimate the actual ending account balance or expenses you paid during the period. You may use this information to compare the ongoing costs of investing in the Series and other funds. To do so, compare this 5% hypothetical example with the 5% hypothetical examples that appear in the shareholder reports of the other funds.
Please note that the expenses shown in the table are meant to highlight your ongoing costs only and do not reflect any transaction costs, such as potential wire charges on redemptions. Therefore, the second line of the table is useful in comparing ongoing costs only, and will not help you determine the relative total costs of owning different funds. In addition, if these transaction costs were included, your costs would have been higher.
| | | | | | | | | |
| | | Beginning
Account Value
7/1/09 | | Ending
Account Value
12/31/09 | | Expenses Paid
During Period*
7/1/09-12/31/09 |
Actual | | $ | 1,000.00 | | $ | 1,250.90 | | $ | 6.41 |
Hypothetical
(5% return before expenses) | | $ | 1,000.00 | | $ | 1,019.51 | | $ | 5.75 |
*Expenses are equal to the Series’ annualized expense ratio (for the six-month period) of 1.13%, multiplied by the average account value over the period, multiplied by 184/365 (to reflect the one-half year period). Expenses are based on the most recent fiscal half year; therefore, the expense ratio stated above may differ from the expense ratio stated in the financial highlights, which is based on one-year data. The Series’ total return would have been lower had certain expenses not been waived during the period.
Portfolio Composition as of December 31, 2009 (unaudited)
Country Allocation1
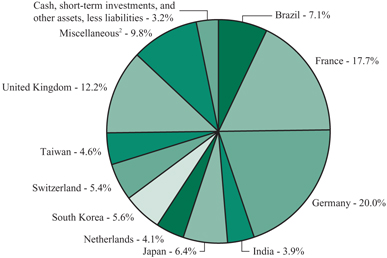
1As a percentage of net assets.
2Miscellaneous
Ireland 1.4%
Malaysia 3.0%
Mexico 0.8%
Norway 2.8%
Portugal 1.1%
Spain 0.7%
Sector Allocation3
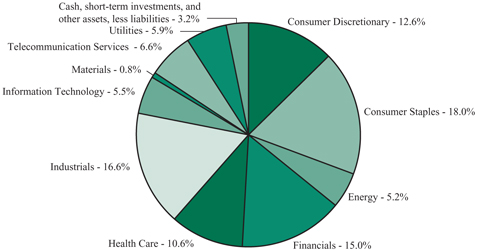
3As a percentage of net assets.
Investment Portfolio - December 31, 2009
| | | | | |
| | | Shares | | Value
(Note 2) |
| | | | | |
| | |
COMMON STOCKS - 96.8% | | | | | |
| | |
Consumer Discretionary - 12.6% | | | | | |
Auto Components - 1.4% | | | | | |
Hankook Tire Co. Ltd. (South Korea) | | 178,870 | | $ | 3,916,945 |
| | | | | |
Automobiles - 2.7% | | | | | |
Hero Honda Motors Ltd. (India) | | 42,450 | | | 1,566,914 |
Hyundai Motor Co. (South Korea) | | 39,610 | | | 4,115,855 |
Maruti Suzuki India Ltd. (India) | | 44,940 | | | 1,506,627 |
| | | | | |
| | | | | 7,189,396 |
| | | | | |
Household Durables - 3.2% | | | | | |
Corporacion Geo S.A.B. de C.V. - Class B (Mexico)* | | 783,010 | | | 2,079,328 |
Klabin Segall S.A. (Brazil)* | | 140,000 | | | 398,047 |
LG Electronics, Inc. (South Korea) | | 32,640 | | | 3,405,621 |
Rodobens Negocios Imobiliarios S.A. (Brazil) | | 259,000 | | | 2,673,308 |
| | | | | |
| | | | | 8,556,304 |
| | | | | |
Media - 2.8% | | | | | |
Impresa-Sociedade Gestora de Participacoes S.A. (Portugal)* | | 338,000 | | | 867,325 |
Reed Elsevier plc - ADR (United Kingdom) | | 60,311 | | | 1,977,598 |
Societe Television Francaise 1 (France) | | 108,530 | | | 2,005,464 |
Wolters Kluwer N.V. (Netherlands) | | 114,447 | | | 2,510,199 |
Zon Multimedia Servicos de Telecomunicacoes e Multimedia SGPS S.A. - ADR (Portugal)1,2 | | 13,275 | | | 82,622 |
| | | | | |
| | | | | 7,443,208 |
| | | | | |
Multiline Retail - 1.0% | | | | | |
PPR (France) | | 22,930 | | | 2,769,074 |
| | | | | |
Specialty Retail - 0.7% | | | | | |
Komeri Co. Ltd. (Japan) | | 67,000 | | | 1,787,674 |
| | | | | |
Textiles, Apparel & Luxury Goods - 0.8% | | | | | |
LVMH S.A. (Louis Vuitton Moet Hennessy) (France) | | 18,700 | | | 2,101,160 |
| | | | | |
Total Consumer Discretionary | | | | | 33,763,761 |
| | | | | |
Consumer Staples - 18.0% | | | | | |
Beverages - 2.9% | | | | | |
Diageo plc (United Kingdom) | | 162,810 | | | 2,850,595 |
Kirin Holdings Co. Ltd. (Japan) | | 215,000 | | | 3,439,630 |
United Spirits Ltd. (India) | | 57,400 | | | 1,554,555 |
| | | | | |
| | | | | 7,844,780 |
| | | | | |
Food & Staples Retailing - 6.5% | | | | | |
Carrefour S.A. (France) | | 165,082 | | | 7,942,073 |
Casino Guichard-Perrachon S.A. (France) | | 34,170 | | | 3,062,990 |
President Chain Store Corp. (Taiwan) | | 702,320 | | | 1,670,988 |
| | |
| The accompanying notes are an integral part of the financial statements. | | 5 |
Investment Portfolio - December 31, 2009
| | | | | |
| | | Shares | | Value
(Note 2) |
| | | | | |
| | |
COMMON STOCKS (continued) | | | | | |
| | |
Consumer Staples (continued) | | | | | |
Food & Staples Retailing (continued) | | | | | |
Tesco plc (United Kingdom) | | 667,410 | | $ | 4,613,831 |
| | | | | |
| | | | | 17,289,882 |
| | | | | |
Food Products - 6.1% | | | | | |
Danone S.A. (France) | | 40,012 | | | 2,456,691 |
IOI Corp. Berhad (Malaysia) | | 560,800 | | | 895,904 |
Nestle S.A. (Switzerland) | | 105,220 | | | 5,106,138 |
Suedzucker AG (Germany) | | 90,690 | | | 1,890,323 |
Unilever plc - ADR (United Kingdom) | | 185,230 | | | 5,908,837 |
| | | | | |
| | | | | 16,257,893 |
| | | | | |
Household Products - 2.5% | | | | | |
Hindustan Unilever Ltd. (India) | | 250,540 | | | 1,425,658 |
Kao Corp. (Japan) | | 47,000 | | | 1,097,600 |
Reckitt Benckiser Group plc (United Kingdom) | | 78,270 | | | 4,242,701 |
| | | | | |
| | | | | 6,765,959 |
| | | | | |
Total Consumer Staples | | | | | 48,158,514 |
| | | | | |
Energy - 5.2% | | | | | |
Oil, Gas & Consumable Fuels - 5.2% | | | | | |
BP plc (United Kingdom) | | 256,880 | | | 2,489,469 |
Royal Dutch Shell plc - Class B - ADR (Netherlands) | | 87,780 | | | 5,102,651 |
Royal Dutch Shell plc - Class B (Netherlands) | | 88,430 | | | 2,587,397 |
Total S.A. (France) | | 56,580 | | | 3,650,362 |
| | | | | |
Total Energy | | | | | 13,829,879 |
| | | | | |
Financials - 15.0% | | | | | |
Capital Markets - 0.7% | | | | | |
Daiwa Securities Group, Inc. (Japan) | | 98,000 | | | 489,290 |
Nomura Holdings, Inc. (Japan) | | 78,900 | | | 576,914 |
OSK Holdings Berhad (Malaysia) | | 1,671,600 | | | 834,824 |
OSK Ventures International Berhad (Malaysia)* | | 202,575 | | | 39,343 |
| | | | | |
| | | | | 1,940,371 |
| | | | | |
Commercial Banks - 5.1% | | | | | |
Axis Bank Ltd. (India) | | 67,600 | | | 1,436,981 |
BNP Paribas (France) | | 28,330 | | | 2,270,234 |
The Chugoku Bank Ltd. (Japan) | | 137,000 | | | 1,690,159 |
Commerzbank AG (Germany)* | | 62,500 | | | 527,277 |
Credit Agricole S.A. (France) | | 63,090 | | | 1,117,870 |
The Hachijuni Bank Ltd. (Japan) | | 244,000 | | | 1,414,721 |
Hong Leong Financial Group Berhad (Malaysia) | | 816,800 | | | 1,779,593 |
Mitsubishi UFJ Financial Group, Inc. (Japan) | | 170,000 | | | 825,039 |
Royal Bank of Scotland Group plc (United Kingdom)* | | 277,092 | | | 130,687 |
| | |
| 6 | | The accompanying notes are an integral part of the financial statements. |
Investment Portfolio - December 31, 2009
| | | | | |
| | | Shares | | Value
(Note 2) |
| | | | | |
| | |
COMMON STOCKS (continued) | | | | | |
| | |
Financials (continued) | | | | | |
Commercial Banks (continued) | | | | | |
Societe Generale (France) | | 15,410 | | $ | 1,081,353 |
The Sumitomo Trust & Banking Co. Ltd. (Japan) | | 247,000 | | | 1,201,385 |
| | | | | |
| | | | | 13,475,299 |
| | | | | |
Diversified Financial Services - 0.2% | | | | | |
ING Groep N.V. (Netherlands)* | | 65,395 | | | 646,853 |
| | | | | |
Insurance - 6.9% | | | | | |
Allianz SE (Germany) | | 40,870 | | | 5,106,040 |
Amil Participacoes S.A. (Brazil) | | 717,000 | | | 5,642,102 |
AXA S.A. (France) | | 56,372 | | | 1,336,630 |
Muenchener Rueckversicherungs-Gesellschaft AG (MunichRe) (Germany) | | 40,610 | | | 6,326,374 |
| | | | | |
| | | | | 18,411,146 |
| | | | | |
Real Estate Investment Trusts (REITS) - 1.3% | | | | | |
Alstria Office REIT AG (Germany) | | 313,480 | | | 3,370,415 |
| | | | | |
Real Estate Management & Development - 0.0%** | | | | | |
OSK Property Holdings Berhad (Malaysia) | | 243,091 | | | 36,918 |
| | | | | |
Thrifts & Mortgage Finance - 0.8% | | | | | |
Aareal Bank AG (Germany)* | | 115,790 | | | 2,201,034 |
| | | | | |
Total Financials | | | | | 40,082,036 |
| | | | | |
Health Care - 10.6% | | | | | |
Health Care Equipment & Supplies - 0.9% | | | | | |
Straumann Holding AG (Switzerland) | | 8,894 | | | 2,514,858 |
| | | | | |
Pharmaceuticals - 9.7% | | | | | |
AstraZeneca plc - ADR (United Kingdom) | | 46,350 | | | 2,175,669 |
AstraZeneca plc (United Kingdom) | | 27,960 | | | 1,314,407 |
Bayer AG (Germany) | | 107,350 | | | 8,611,761 |
GlaxoSmithKline plc (United Kingdom) | | 172,980 | | | 3,686,638 |
Novartis AG - ADR (Switzerland) | | 49,000 | | | 2,667,070 |
Sanofi-Aventis S.A. (France) | | 26,423 | | | 2,085,598 |
Shire plc (Ireland) | | 195,160 | | | 3,814,181 |
Takeda Pharmaceutical Co. Ltd. (Japan) | | 34,900 | | | 1,435,196 |
| | | | | |
| | | | | 25,790,520 |
| | | | | |
Total Health Care | | | | | 28,305,378 |
| | | | | |
Industrials - 16.6% | | | | | |
Airlines - 1.3% | | | | | |
Deutsche Lufthansa AG (Germany) | | 206,580 | | | 3,479,672 |
| | | | | |
Commercial Services & Supplies - 2.6% | | | | | |
Taiwan Secom Co. Ltd. (Taiwan) | | 777,210 | | | 1,307,297 |
| | |
| The accompanying notes are an integral part of the financial statements. | | 7 |
Investment Portfolio - December 31, 2009
| | | | | |
| | | Shares | | Value
(Note 2) |
| | | | | |
| | |
COMMON STOCKS (continued) | | | | | |
| | |
Industrials (continued) | | | | | |
Commercial Services & Supplies (continued) | | | | | |
Tomra Systems ASA (Norway) | | 1,189,080 | | $ | 5,688,887 |
| | | | | |
| | | | | 6,996,184 |
| | | | | |
Construction & Engineering - 0.6% | | | | | |
Larsen & Toubro Ltd. (India) | | 41,270 | | | 1,487,795 |
| | | | | |
Electrical Equipment - 3.4% | | | | | |
Alstom S.A. (France) | | 37,560 | | | 2,641,589 |
Bharat Heavy Electricals Ltd. (India) | | 30,080 | | | 1,553,482 |
Schneider Electric S.A. (France) | | 26,590 | | | 3,117,293 |
Teco Electric and Machinery Co. Ltd. (Taiwan) | | 4,084,000 | | | 1,787,588 |
| | | | | |
| | | | | 9,099,952 |
| | | | | |
Industrial Conglomerates - 3.5% | | | | | |
Siemens AG (Germany) | | 92,300 | | | 8,496,040 |
Sonae (Portugal) | | 669,100 | | | 834,493 |
Sonae Capital S.A. (SGPS) (Portugal)* | | 83,637 | | | 99,515 |
| | | | | |
| | | | | 9,430,048 |
| | | | | |
Machinery - 1.8% | | | | | |
FANUC Ltd. (Japan) | | 19,400 | | | 1,797,627 |
MAN SE (Germany) | | 36,380 | | | 2,839,181 |
| | | | | |
| | | | | 4,636,808 |
| | | | | |
Road & Rail - 2.5% | | | | | |
All America Latina Logistica S.A. (Brazil) | | 722,000 | | | 6,759,679 |
| | | | | |
Transportation Infrastructure - 0.9% | | | | | |
Malaysia Airports Holdings Berhad (Malaysia) | | 2,148,700 | | | 2,491,337 |
| | | | | |
Total Industrials | | | | | 44,381,475 |
| | | | | |
Information Technology - 5.5% | | | | | |
Communications Equipment - 0.4% | | | | | |
D-Link Corp. (Taiwan) | | 1,120,606 | | | 1,180,692 |
| | | | | |
Electronic Equipment, Instruments & Components - 0.9% | | | | | |
Keyence Corp. (Japan) | | 6,845 | | | 1,411,113 |
Yageo Corp. (Taiwan) | | 2,931,000 | | | 1,072,149 |
| | | | | |
| | | | | 2,483,262 |
| | | | | |
IT Services - 1.0% | | | | | |
Cap Gemini S.A. (France) | | 56,320 | | | 2,581,175 |
| | | | | |
Semiconductors & Semiconductor Equipment - 1.8% | | | | | |
Hynix Semiconductor, Inc. (South Korea)* | | 82,930 | | | 1,648,665 |
| | |
| 8 | | The accompanying notes are an integral part of the financial statements. |
Investment Portfolio - December 31, 2009
| | | | | |
| | | Shares | | Value
(Note 2) |
| | | | | |
| | |
COMMON STOCKS (continued) | | | | | |
| | |
Information Technology (continued) | | | | | |
Semiconductors & Semiconductor Equipment (continued) | | | | | |
Taiwan Semiconductor Manufacturing Co. Ltd. - ADR (Taiwan) | | 275,315 | | $ | 3,149,604 |
| | | | | |
| | | | | 4,798,269 |
| | | | | |
Software - 1.4% | | | | | |
SAP AG (Germany) | | 76,970 | | | 3,641,226 |
| | | | | |
Total Information Technology | | | | | 14,684,624 |
| | | | | |
Materials - 0.8% | | | | | |
Chemicals - 0.0%** | | | | | |
Arkema S.A. (France) | | 1,229 | | | 45,808 |
| | | | | |
Construction Materials - 0.8% | | | | | |
Taiwan Cement Corp. (Taiwan) | | 1,899,827 | | | 2,019,513 |
| | | | | |
Total Materials | | | | | 2,065,321 |
| | | | | |
Telecommunication Services - 6.6% | | | | | |
Diversified Telecommunication Services - 5.2% | | | | | |
France Telecom S.A. - ADR (France) | | 38,800 | | | 979,312 |
France Telecom S.A. (France) | | 155,920 | | | 3,895,932 |
Portugal Telecom S.A. (SGPS) - ADR (Portugal) | | 94,250 | | | 1,144,195 |
Swisscom AG - ADR (Switzerland)2 | | 106,400 | | | 4,038,944 |
Telefonica S.A. - ADR (Spain) | | 22,850 | | | 1,908,432 |
Telenor ASA - ADR (Norway)2 | | 45,480 | | | 1,901,064 |
| | | | | |
| | | | | 13,867,879 |
| | | | | |
Wireless Telecommunication Services - 1.4% | | | | | |
Digi.Com Berhad (Malaysia) | | 284,200 | | | 1,822,731 |
SK Telecom Co. Ltd. - ADR (South Korea) | | 114,190 | | | 1,856,730 |
| | | | | |
| | | | | 3,679,461 |
| | | | | |
Total Telecommunication Services | | | | | 17,547,340 |
| | | | | |
Utilities - 5.9% | | | | | |
Electric Utilities - 2.6% | | | | | |
E.ON AG (Germany) | | 164,441 | | | 6,890,506 |
| | | | | |
Multi-Utilities - 2.0% | | | | | |
GDF Suez (France) | | 51,850 | | | 2,251,068 |
National Grid plc (United Kingdom) | | 286,530 | | | 3,142,426 |
| | | | | |
| | | | | 5,393,494 |
| | | | | |
| | |
| The accompanying notes are an integral part of the financial statements. | | 9 |
Investment Portfolio - December 31, 2009
| | | | | |
| | | Shares | | Value
(Note 2) |
| | | | | |
| | |
COMMON STOCKS (continued) | | | | | |
| | |
Utilities (continued) | | | | | |
Water Utilities - 1.3% | | | | | |
Companhia de Saneamento de Minas Gerais - Copasa MG (Brazil) | | 182,000 | | $ | 3,475,876 |
| | | | | |
Total Utilities | | | | | 15,759,876 |
| | | | | |
TOTAL COMMON STOCKS
(Identified Cost $231,399,836) | | | | | 258,578,204 |
| | | | | |
| | |
SHORT-TERM INVESTMENTS - 3.0% | | | | | |
Dreyfus Cash Management, Inc. - Institutional Shares3, 0.07%,
(Identified Cost $8,013,342) | | 8,013,342 | | | 8,013,342 |
| | | | | |
TOTAL INVESTMENTS - 99.8%
(Identified Cost $239,413,178) | | | | | 266,591,546 |
| | |
OTHER ASSETS, LESS LIABILITIES - 0.2% | | | | | 508,854 |
| | | | | |
NET ASSETS - 100% | | | | $ | 267,100,400 |
| | | | | |
ADR - American Depository Receipt
*Non-income producing security
**Less than 0.1%.
1Restricted securities - Investment in securities that are restricted as to public resale under the Securities Act of 1933, as amended. This security has been sold under rule 144A and has been determined to be liquid under guidelines established by the Board of Directors. This security amounts to $82,622, or 0.0%** of the Series’ net assets as of December 31, 2009 (see Note 2 to the financial statements).
2Latest quoted sales price is not available and the latest quoted bid price was used to value the security.
3Rate shown is the current yield as of December 31, 2009.
The Series’ portfolio holds, as a percentage of net assets, greater than 10% in the following countries: Germany - 20.0%; France - 17.7%; United Kingdom - 12.2%.
| | |
| 10 | | The accompanying notes are an integral part of the financial statements. |
Statement of Assets & Liabilities
December 31, 2009
| | | | |
ASSETS: | | | | |
| |
Investments, at value (identified cost $239,413,178) (Note 2) | | $ | 266,591,546 | |
Cash | | | 437,468 | |
Foreign currency, at value (cost $340,402) | | | 336,542 | |
Receivable for fund shares sold | | | 402,040 | |
Foreign tax reclaims receivable | | | 297,989 | |
Dividends receivable | | | 122,795 | |
| | | | |
TOTAL ASSETS | | | 268,188,380 | |
| | | | |
LIABILITIES: | | | | |
| |
Accrued management fees (Note 3) | | | 216,245 | |
Accrued fund accounting and transfer agent fees (Note 3) | | | 14,635 | |
Accrued directors’ fees (Note 3) | | | 3,141 | |
Accrued Chief Compliance Officer service fees (Note 3) | | | 476 | |
Payable for securities purchased | | | 608,497 | |
Payable for fund shares repurchased | | | 145,580 | |
Audit fees payable | | | 37,971 | |
Accrued capital gains tax payable (Note 2) | | | 34,256 | |
Accrued custodian fees | | | 15,512 | |
Other payables and accrued expenses | | | 11,667 | |
| | | | |
TOTAL LIABILITIES | | | 1,087,980 | |
| | | | |
TOTAL NET ASSETS | | $ | 267,100,400 | |
| | | | |
NET ASSETS CONSIST OF: | | | | |
| |
Capital stock | | $ | 318,422 | |
Additional paid-in-capital | | | 239,019,215 | |
Accumulated net investment loss | | | (461,584 | ) |
Accumulated net realized gain on investments, foreign currency and translation of other assets and liabilities | | | 1,074,689 | |
Net unrealized appreciation on investments (net of accrued capital gains tax of $34,256), foreign currency and translation of other assets and liabilities | | | 27,149,658 | |
| | | | |
TOTAL NET ASSETS | | $ | 267,100,400 | |
| | | | |
NET ASSET VALUE, OFFERING PRICE AND REDEMPTION
PRICE PER SHARE - Class A ($267,100,400/31,842,152 shares) | | $ | 8.39 | |
| | | | |
| | |
| The accompanying notes are an integral part of the financial statements. | | 11 |
Statement of Operations
For the Year Ended December 31, 2009
| | | | |
INVESTMENT INCOME: | | | | |
| |
Dividends (net of foreign taxes withheld, $707,910) | | $ | 6,058,736 | |
Interest | | | 21,139 | |
| | | | |
Total Investment Income | | | 6,079,875 | |
| | | | |
| EXPENSES: | | | | |
| |
Management fees (Note 3) | | | 1,992,350 | |
Fund accounting and transfer agent fees (Note 3) | | | 113,492 | |
Directors’ fees (Note 3) | | | 12,849 | |
Chief Compliance Officer service fees (Note 3) | | | 3,729 | |
Custodian fees | | | 63,400 | |
Miscellaneous | | | 104,768 | |
| | | | |
Total Expenses | | | 2,290,588 | |
Less reduction of expenses (Note 3) | | | (1,621 | ) |
| | | | |
Net Expenses | | | 2,288,967 | |
| | | | |
NET INVESTMENT INCOME | | | 3,790,908 | |
| | | | |
| REALIZED AND UNREALIZED GAIN (LOSS) ON INVESTMENTS AND FOREIGN CURRENCY: | | | | |
| |
Net realized gain (loss) on- | | | | |
Investments | | | 8,575,066 | |
Foreign currency, and translation of other assets and liabilities | | | (14,566 | ) |
| | | | |
| | | 8,560,500 | |
| | | | |
| |
Net change in unrealized appreciation (depreciation) on- | | | | |
Investments (net of accrued capital gains tax of $34,256) | | | 48,029,117 | |
Foreign currency, and translation of other assets and liabilities | | | 22,365 | |
| | | | |
| | | 48,051,482 | |
| | | | |
| |
NET REALIZED AND UNREALIZED GAIN (LOSS) ON
INVESTMENTS AND FOREIGN CURRENCY | | | 56,611,982 | |
| | | | |
NET INCREASE IN NET ASSETS RESULTING FROM OPERATIONS | | $ | 60,402,890 | |
| | | | |
| | |
| 12 | | The accompanying notes are an integral part of the financial statements. |
Statements of Changes in Net Assets
| | | | | | | | |
| | | For the
Year Ended
12/31/09 | | | For the
Year Ended
12/31/08 | |
| | | | | | | | |
| INCREASE (DECREASE) IN NET ASSETS: | | | | | | | | |
| | |
| OPERATIONS: | | | | | | | | |
| | |
Net investment income | | $ | 3,790,908 | | | $ | 5,748,981 | |
Net realized gain on investments and foreign currency | | | 8,560,500 | | | | 7,829,032 | |
Net change in unrealized appreciation (depreciation) on investments (net of accrued capital gains tax of $34,256)and foreign currency | | | 48,051,482 | | | | (104,908,391 | ) |
| | | | | | | | |
Net increase (decrease) from operations | | | 60,402,890 | | | | (91,330,378 | ) |
| | | | | | | | |
DISTRIBUTIONS TO SHAREHOLDERS (Note 8): | | | | | | | | |
| | |
From net investment income | | | (4,479,987 | ) | | | (5,329,285 | ) |
From net realized gain on investments | | | (7,507,773 | ) | | | (12,640,693 | ) |
| | | | | | | | |
Total distributions to shareholders | | | (11,987,760 | ) | | | (17,969,978 | ) |
| | | | | | | | |
| CAPITAL STOCK ISSUED AND REPURCHASED: | | | | | | | | |
| | |
Net increase from capital share transactions (Note 5) | | | 36,412,740 | | | | 21,493,340 | |
| | | | | | | | |
Net increase (decrease) in net assets | | | 84,827,870 | | | | (87,807,016 | ) |
| | |
| NET ASSETS: | | | | | | | | |
| | |
Beginning of year | | | 182,272,530 | | | | 270,079,546 | |
| | | | | | | | |
End of year (including accumulated net investment loss of $461,584 and undistributed net investment income of $237,351, respectively) | | $ | 267,100,400 | | | $ | 182,272,530 | |
| | | | | | | | |
| | |
| The accompanying notes are an integral part of the financial statements. | | 13 |
Financial Highlights
| | | | | | | | | | |
| | | | | For the Years Ended | | |
| | | 12/31/09 | | 12/31/08 | | 12/31/07 | | 12/31/06 | | 12/31/05 |
| | | | | | | | | | |
| | | | | | | | | | |
Per share data (for a share outstanding throughout each year): | | | | | | | | | | |
Net asset value - Beginning of year | | $6.57 | | $10.87 | | $9.84 | | $9.90 | | $9.52 |
| | | | | | | | | | |
Income (loss) from investment operations: | | | | | | | | | | |
Net investment income | | 0.141 | | 0.22 | | 0.15 | | 0.15 | | 0.11 |
Net realized and unrealized gain (loss) on investments | | 2.10 | | (3.82) | | 1.12 | | 2.01 | | 1.21 |
| | | | | | | | | | |
Total from investment operations | | 2.24 | | (3.60) | | 1.27 | | 2.16 | | 1.32 |
| | | | | | | | | | |
Less distributions to shareholders: | | | | | | | | | | |
From net investment income | | (0.16) | | (0.21) | | (0.14) | | (0.15) | | (0.11) |
From net realized gain on investments | | (0.26) | | (0.49) | | (0.10) | | (2.07) | | (0.83) |
| | | | | | | | | | |
Total distributions to shareholders | | (0.42) | | (0.70) | | (0.24) | | (2.22) | | (0.94) |
| | | | | | | | | | |
Net asset value - End of year | | $8.39 | | $6.57 | | $10.87 | | $9.84 | | $9.90 |
| | | | | | | | | | |
Net assets - End of year (000’s omitted) | | $267,100 | | $182,273 | | $270,080 | | $215,981 | | $193,168 |
| | | | | | | | | | |
Total return2 | | 34.23% | | (33.25%) | | 13.01% | | 21.96% | | 13.99% |
| Ratios (to average net assets)/Supplemental Data: | | | | | | | | | | |
Expenses | | 1.15%* | | 1.15% | | 1.16% | | 1.18% | | 1.24% |
Net investment income | | 1.90% | | 2.49% | | 1.47% | | 1.39% | | 1.10% |
Portfolio turnover | | 17% | | 9% | | 20% | | 30% | | 35% |
*The investment advisor did not impose all of or a portion of its CCO fees, fund accounting and transfer agent fees during the year ended 12/31/09. If these expenses had been incurred by the Series, the expense ratio (to average net assets) would have been increased by 0.00%3.
1Calculated based on average shares outstanding during the year.
2Represents aggregate total return for the years indicated, and assumes reinvestment of all distributions. Total returns would have been lower had certain expenses not been waived during the year ended December 31, 2009.
3Less than 0.01%.
| | |
| 14 | | The accompanying notes are an integral part of the financial statements. |
Notes to Financial Statements
International Series (the “Series”) is a no-load diversified series of Manning & Napier Fund, Inc. (the “Fund”). The Fund is organized in Maryland and is registered under the Investment Company Act of 1940, as amended, as an open-end management investment company.
The Series’ investment objective is to provide long-term growth by investing principally in the common stocks of companies located outside the United States.
The Fund’s Advisor is Manning & Napier Advisors, Inc. (the “Advisor”). Shares of the Series are offered to investors, clients and employees of the Advisor and its affiliates. The Series resumed offering shares directly to investors on May 18, 2004, as it had done previously from time to time. The total authorized capital stock of the Fund consists of 10.0 billion shares of common stock each having a par value of $0.01. As of December 31, 2009, 4.6 billion shares have been designated in total among 29 series, of which 100 million have been designated as International Series Class A common stock.
| 2. | SIGNIFICANT ACCOUNTING POLICIES |
Security Valuation
Portfolio securities, including domestic equities, foreign equities, warrants and options, listed on an exchange other than the NASDAQ National Market System are valued at the latest quoted sales price of the exchange on which the security is primarily traded. Securities not traded on valuation date or securities not listed on an exchange are valued at the latest quoted bid price provided by the Fund’s pricing service. Securities listed on the NASDAQ National Market System are valued in accordance with the NASDAQ Official Closing Price.
Short-term investments that mature in sixty days or less are valued at amortized cost, which approximates market value. Investments in open-end investment companies are valued at their net asset value per share on valuation date.
Volume and level of activity in established markets for an asset or liability are evaluated to determine whether recent transactions and quoted prices are determinative of fair value. Where there have been significant decreases in volume and level of activity, further analysis and adjustment may be necessary to estimate fair value. The Series measures fair value in these instances by the use of inputs and valuation techniques which may be based upon current market prices of securities that are comparable in coupon, rating, maturity and industry and/or expectation of future cash flows. As a result of trading in relatively thin markets and/or markets that experience significant volatility, the prices used by the Series to value these securities may differ from the value that would be realized if these securities were sold, and the differences could be material.
Securities for which representative valuations or prices are not available from the Fund’s pricing service may be valued at fair value. Due to the inherent uncertainty of valuations of such securities, the fair value may differ significantly from the values that would have been used had a ready market for such securities existed. If trading or events occurring after the close of the principal market in which securities are traded are expected to materially affect the value of those securities, then they may be valued at their fair value, taking this trading or these events into account. Fair value is determined in good faith by the Advisor under procedures approved by and under the general supervision and responsibility of the Fund’s Board of Directors (the “Board”).
Notes to Financial Statements
| 2. | SIGNIFICANT ACCOUNTING POLICIES (continued) |
Security Valuation (continued)
Various inputs are used in determining the value of the Series’ assets or liabilities carried at market value. These inputs are summarized in three broad levels. Level 1 includes quoted prices in active markets for identical assets and liabilities. Level 2 includes other significant observable inputs (including quoted prices for similar securities, interest rates, prepayment speeds, credit risk, etc.). Level 3 includes significant unobservable inputs (including the Series’ own assumptions in determining the fair value of investments.) The inputs or methodology used for valuing securities are not necessarily an indication of the risk associated with investing in those securities.
The following is a summary of the valuation levels used for major security types as of December 31, 2009 in valuing the Series’ assets or liabilities carried at market value:
| | | | | | | | | | | | |
Description | | 12/31/09 | | Level 1 | | Level 2 | | Level 3 |
| | | | | | | | | | | | |
Equity securities* | | $ | 258,578,204 | | $ | 252,555,574 | | $ | 6,022,630 | | $ | — |
Preferred securities | | | — | | | — | | | — | | | — |
Debt securities | | | — | | | — | | | — | | | — |
Mutual funds | | | 8,013,342 | | | 8,013,342 | | | — | | | — |
Other financial instruments** | | | — | | | — | | | — | | | — |
| | | | | | | | | | | | |
Total | | $ | 266,591,546 | | $ | 260,568,916 | | $ | 6,022,630 | | $ | — |
| | | | | | | | | | | | |
* Includes common stock, warrants and rights. Please see the Investment Portfolio for industry classification and for securities where a latest quoted sales price is not available and the last quoted bid price was used to value the security. Such securities are included in Level 2 in the table above.
** Other financial instruments are derivative instruments not reflected in the Investment Portfolio, such as futures, forwards and swap contracts, which are valued at the unrealized appreciation/depreciation on the instrument. As of December 31, 2009, the Series did not hold any derivative instruments.
There were no Level 3 securities held by the Series as of December 31, 2008 or December 31, 2009.
Interim and annual reporting periods beginning after December 15, 2009 will require additional disclosure regarding transfers in and/or out of Level 1 and 2. Additional disclosure surrounding the activity in Level 3 fair value measurement will also be effective for fiscal years beginning after December 15, 2010. Management has concluded that this will not have a material impact on the Series’ financial statements.
Security Transactions, Investment Income and Expenses
Security transactions are accounted for on trade date. Dividend income is recorded on the ex-dividend date, except that if the ex-dividend date has passed, certain dividends from foreign securities are recorded as soon as the Fund is informed of the ex-dividend date. Non-cash dividends, if any, are recorded at the fair market value of the securities received. Interest income, including amortization of premium and accretion of discounts using the effective interest method, is earned from settlement date and accrued daily.
Notes to Financial Statements
| 2. | SIGNIFICANT ACCOUNTING POLICIES (continued) |
Security Transactions, Investment Income and Expenses (continued)
Expenses are recorded on an accrual basis. Most expenses of the Fund can be attributed to a specific series. Expenses which cannot be directly attributed are apportioned among the series in the Fund in such a manner as deemed equitable by the Fund’s Board, taking into consideration, among other things, the nature and type of expense.
The Series uses the identified cost method for determining realized gain or loss on investments for both financial statement and federal income tax reporting purposes.
Foreign Currency Translation
The books and records of the Series are maintained in U.S. dollars. Foreign currencies, investments and other assets and liabilities are translated into U.S. dollars at the current exchange rates. Purchases and sales of investment securities and income and expenses are translated on the respective dates of such transactions. The Series does not isolate realized and unrealized gains and losses attributable to changes in the exchange rates from gains and losses that arise from changes in the market value of investments. Such fluctuations are included with net realized and unrealized gain or loss on investments. Net realized foreign currency gains and losses represent foreign currency gains and losses between trade date and settlement date on securities transactions, gains and losses on disposition of foreign currencies and the difference between the amount of income and foreign withholding taxes recorded on the books of the Series and the amounts actually received or paid.
Federal Taxes
The Series’ policy is to comply with the provisions of the Internal Revenue Code applicable to regulated investment companies. The Series is not subject to federal income tax or excise tax to the extent that the Series distributes to shareholders each year its taxable income, including any net realized gains on investments, in accordance with requirements of the Internal Revenue Code. Accordingly, no provision for federal income tax or excise tax has been made in the financial statements.
Management evaluates its tax positions to determine if the tax positions taken meet the minimum recognition threshold in connection with accounting for uncertainties in income tax positions taken or expected to be taken for the purposes of measuring and recognizing tax liabilities in the financial statements. Recognition of tax benefits of an uncertain tax position is required only when the position is “more likely than not” to be sustained assuming examination by taxing authorities. At December 31, 2009, the Series has recorded no liability for net unrecognized tax benefits relating to uncertain income tax positions taken or expected to be taken in future tax returns.
The Series files income tax returns in the U.S. federal jurisdiction, various states and foreign jurisdictions, as required. No income tax returns are currently under investigation. The statute of limitations on the Series’ tax returns remains open for the years ended December 31, 2006 through December 31, 2009. The Fund is not aware of any tax positions for which it is reasonably possible that the total amounts of unrecognized tax benefits will significantly change in the next twelve months.
Additionally, based on the Fund’s understanding of the tax rules and rates related to income, gains and transactions for foreign jurisdictions in which it invests, the Series will provide for foreign taxes, and where appropriate, deferred foreign tax.
Notes to Financial Statements
| 2. | SIGNIFICANT ACCOUNTING POLICIES (continued) |
Distributions of Income and Gains
Distributions to shareholders of net investment income and net realized gains are made annually. An additional distribution may be necessary to avoid taxation of the Series. Distributions are recorded on the ex-dividend date.
Indemnifications
The Fund’s organizational documents provide former and current directors and officers with a limited indemnification against liabilities arising in connection with the performance of their duties to the Fund. In the normal course of business, the Fund may also enter into contracts that provide general indemnifications. The Fund’s maximum exposure under these arrangements is unknown as this would be dependent on future claims that may be made against the Fund. The risk of material loss from such claims is considered remote.
Other
The preparation of financial statements in conformity with accounting principles generally accepted in the United States of America requires management to make estimates and assumptions that affect the reported amounts of assets and liabilities and the disclosure of contingent assets and liabilities at the date of the financial statements and the reported amounts of income and expenses during the reporting period. Actual results could differ from those estimates.
| 3. | TRANSACTIONS WITH AFFILIATES |
The Fund has an Investment Advisory Agreement (the “Agreement”) with the Advisor, for which the Series pays a fee, computed daily and payable monthly, at an annual rate of 1.00% of the Series’ average daily net assets.
Under the Agreement, personnel of the Advisor provide the Series with advice and assistance in the choice of investments and the execution of securities transactions, and otherwise maintain the Series’ organization. The Advisor also provides the Fund with necessary office space and fund administration and support services. The salaries of all officers of the Fund (except a percentage of the Fund’s Chief Compliance Officer’s salary, which is paid by the Fund), and of all Directors who are “affiliated persons” of the Fund, or of the Advisor, and all personnel of the Fund, or of the Advisor, performing services relating to research, statistical and investment activities, are paid by the Advisor. Each “non-affiliated” Director receives an annual stipend, which is allocated among all the active series of the Fund. In addition, these Directors also receive a fee per Board meeting attended for each active series of the Fund plus a fee for each committee meeting attended.
Manning & Napier Investor Services, Inc., a registered broker-dealer affiliate of the Advisor, acts as distributor for the Fund’s shares. The services of Manning & Napier Investor Services, Inc. are provided at no additional cost to the Series.
For fund accounting and transfer agent services through November 7, 2009, the Fund paid the Advisor an annual fee of 0.055% of the Fund’s average daily net assets up to $4.5 billion, 0.03% of the Fund’s average daily net assets between $4.5 billion and $7.5 billion, and 0.02% of the Fund’s average daily net assets over $7.5 billion. Additionally, certain transaction and account-based fees and out-of-pocket expenses, including charges for reporting relating to the Fund’s compliance program, were charged. Expenses not directly attributable to a Series are allocated based on each Series’ relative net assets or number of accounts, depending on the expense. Prior to October 12, 2009 (for sub-accountant) and November 9, 2009 (for sub-transfer agent), the Advisor had an agreement with Citi Fund Services Ohio, Inc. (“Citi”) under which Citi served as sub-accountant
Notes to Financial Statements
| 3. | TRANSACTIONS WITH AFFILIATES (continued) |
and sub-transfer agent. The Advisor voluntarily agreed to waive a portion of the fund accounting and transfer agent fees and the Chief Compliance Officer service fees for the period March 1, 2009 to April 30, 2009. Accordingly, the Advisor waived fees of $1,621, which is included as a reduction of expenses on the Statement of Operations.
The Advisor has entered into agreements dated October 12, 2009 and November 9, 2009 with PNC Global Investment Servicing (U.S.) Inc. (“PNCGIS”) under which PNCGIS serves as sub-accountant services agent and sub-transfer agent, respectively. Effective November 7, 2009 under the amended master services agreement, the Fund pays the Advisor an annual fee of 0.0175% on the first $3 billion of average daily net assets (excluding Target Series); 0.015% on the next $3 billion of average daily net assets (excluding Target Series); and 0.01% of the average daily net assets in excess of $6 billion (excluding Target Series); plus a base fee of $25,500 per Series. Additionally, certain transaction-, account-, and cusip-based fees and out-of-pocket expenses, including charges for reporting relating to the Fund’s compliance program, are charged.
| 4. | PURCHASES AND SALES OF SECURITIES |
For the year ended December 31, 2009, purchases and sales of securities, other than United States Government securities and short-term securities, were $71,118,989 and $31,502,302, respectively. There were no purchases or sales of United States Government securities.
| 5. | CAPITAL STOCK TRANSACTIONS |
Transactions in shares of International Series were:
| | | | | | | | | | | | | | |
| | | For the Year
Ended 12/31/09 | | | For the Year
Ended 12/31/08 | |
| | | Shares | | | Amount | | | Shares | | | Amount | |
| | | | | | | | | | | | | | |
Sold | | 6,129,853 | | | $ | 48,093,794 | | | 3,218,386 | | | $ | 29,077,214 | |
Reinvested | | 1,415,130 | | | | 11,706,962 | | | 2,584,702 | | | | 17,625,216 | |
Repurchased | | (3,449,201 | ) | | | (23,388,016 | ) | | (2,903,240 | ) | | | (25,209,090 | ) |
| | | | | | | | | | | | | | |
Total | | 4,095,782 | | | $ | 36,412,740 | | | 2,899,848 | | | $ | 21,493,340 | |
| | | | | | | | | | | | | | |
Substantially all of the Series’ shares represent investments by fiduciary accounts over which the Advisor has sole investment discretion.
The Series may trade in instruments including written and purchased options, forward foreign currency exchange contracts and futures contracts and other derivatives in the normal course of investing activities to assist in managing exposure to various market risks. The Series may be subject to various elements of risk and may involve, to a varying degree, elements of risk in excess of the amounts recognized for financial statement purposes; the risk that changes in the value of a derivative may not correlate perfectly with the underlying asset, rate or index; counterparty credit risk related to over the counter derivatives counterparties failure to perform under contract terms; liquidity risk related to the lack of a liquid market for these contracts allowing the fund to close out its position(s); and documentation risk relating to disagreement over contract terms. No such investments were held by the Series during the year ended December 31, 2009.
Notes to Financial Statements
Investing in securities of foreign companies and foreign governments involves special risks and considerations not typically associated with investing in securities of domestic companies and the U.S. Government. These risks include revaluation of currencies and future adverse political and economic developments. Moreover, securities of foreign companies and foreign governments and their markets may be less liquid and their prices more volatile than those of comparable domestic companies and the U.S. Government.
| 8. | FEDERAL INCOME TAX INFORMATION |
The amount and characterization of certain income and capital gains to be distributed are determined in accordance with federal income tax regulations, which may differ from accounting principles generally accepted in the United States of America. These differences are primarily due to differing book and tax treatments in the timing of the recognition of net investment income or gains and losses, including investments in passive foreign investment companies, foreign currency gains and losses and Post-October losses. The Series may periodically make reclassifications among its capital accounts to reflect income and gains available for distribution (or available capital loss carryovers) under income tax regulations without impacting the Series’ net asset value. Any such reclassifications are not reflected in the financial highlights.
The tax character of distributions paid were as follows:
| | | | | | | |
| | | For the Year
Ended 12/31/09 | | For the Year
Ended 12/31/08 | |
Ordinary income | | $ | 11,987,760 | | $ | 8,571,250 | |
Long-term capital gains | | | — | | | 9,398,728 | |
For the year ended December 31, 2009, the Series elected to defer $146,329 and $22,282 of capital and currency losses, respectively, attributable to Post-October losses. | |
At December 31, 2009, the tax basis components of distributable earnings and the net unrealized appreciation based on identified cost for federal income tax purposes were as follows: | |
Cost for federal income tax purposes | | | | | $ | 240,160,537 | |
Unrealized appreciation | | | | | $ | 49,239,996 | |
Unrealized depreciation | | | | | | (22,808,987 | ) |
| | | | | | | |
Net unrealized appreciation | | | | | $ | 26,431,009 | |
Undistributed ordinary income | | | | | | 1,529,075 | |
On February 2, 2010, The PNC Financial Services Group, Inc. (“PNC”), which serves as the Series’ sub-accountant services agent and sub-transfer agent, entered into a Stock Purchase Agreement (the “Stock Purchase Agreement”) with The Bank of New York Mellon Corporation (“BNY Mellon”), the Series’ custodian. Upon the terms and subject to the conditions set forth in the Stock Purchase Agreement, which has been approved by the board of directors of each company, PNC will sell to BNY Mellon (the “Stock Sale”) 100% of the issued and outstanding shares of PNC Global Investment Servicing Inc., an indirect, wholly-owned subsidiary of PNC. The Stock Sale is expected to close in the third quarter of 2010. Management has concluded that this will not have a material impact on the Series’ financial statements.
Notes to Financial Statements
| 9. | SUBSEQUENT EVENTS (continued) |
There were no other subsequent events that require recognition or disclosure. In preparing these financial statements, management of the Fund has evaluated events and transactions for potential recognition or disclosure through February 23, 2010, the date the financial statements were issued.
Report of Independent Registered Public Accounting Firm
To the Board of Directors of Manning & Napier Fund, Inc. and Shareholders of International Series:
In our opinion, the accompanying statement of assets and liabilities, including the investment portfolio, and the related statements of operations and of changes in net assets and the financial highlights present fairly, in all material respects, the financial position of the International Series (a series of Manning & Napier Fund, Inc., hereafter referred to as the “Series”) at December 31, 2009, and the results of its operations for the year then ended, the changes in its net assets for each of the two years in the period then ended and the financial highlights for each of the five years in the period then ended, in conformity with accounting principles generally accepted in the United States of America. These financial statements and financial highlights (hereafter referred to as “financial statements”) are the responsibility of the Series’ management; our responsibility is to express an opinion on these financial statements based on our audits. We conducted our audits of these financial statements in accordance with the standards of the Public Company Accounting Oversight Board (United States). Those standards require that we plan and perform the audit to obtain reasonable assurance about whether the financial statements are free of material misstatement. An audit includes examining, on a test basis, evidence supporting the amounts and disclosures in the financial statements, assessing the accounting principles used and significant estimates made by management, and evaluating the overall financial statement presentation. We believe that our audits, which included confirmation of securities at December 31, 2009 by correspondence with the custodian and brokers, provide a reasonable basis for our opinion.

Columbus, Ohio
February 23, 2010
Supplemental Tax Information (unaudited)
All designations are based on financial information available as of the date of this annual report and, accordingly are subject to change.
For federal income tax purposes, the Series designates for the current fiscal year $4,912,099 or, if different, the maximum amount allowable under the tax law as qualified dividend income.
Renewal of Investment Advisory Agreement (unaudited)
At the Manning & Napier Fund, Inc. (the ��Fund”) Board of Directors’ (the “Board”) meeting, held on December 7, 2009, the Investment Advisory Agreement (the “Agreement”) between the Fund and Manning & Napier Advisors, Inc. (the “Advisor”) was reviewed by the Board for renewal. In connection with the decision whether to renew the Agreement, a variety of material was prepared for and reviewed by the Board.
Representatives of the Advisor attended the meeting and presented additional oral and written information to the Board to assist the Board in its considerations. The discussion immediately below outlines the materials and information presented to the Board in connection with the Board’s 2009 Annual Review of the Agreement and the conclusions made by the Directors when determining to continue the Agreement.
| | • | | The Board considered the services provided by the Advisor under the Agreement including, among others: deciding what securities to purchase and sell for each Series; arranging for the purchase and sale of such securities by placing orders with broker-dealers; administering the affairs of the Fund (including the books and records of the Fund not maintained by third party service providers such as the custodian or sub-transfer agent); arranging for the insurance coverage for the Fund; and supervising the preparation of tax returns, SEC filings (including registration statements) and reports to shareholders for the Fund. The Board also considered the nature and quality of such services provided under the Agreement in light of the Advisor’s services provided to the Fund for 23 years. The Board discussed the quality of these services with representatives from the Advisor and concluded that the Advisor was performing its services to the Fund required under the Agreement in a reasonable manner. |
| | • | | The Board considered the investment performance of the various Series of the Fund. The investment performance for each Series was reviewed on a cumulative basis since inception and on a one year basis. In addition, annualized performance for the following time periods was considered: inception, three year, five year, ten year, and current market cycle. A market cycle includes periods of both rising and falling markets. Returns for established benchmark indices for each Series were provided for each time period. The Board noted that the various Series were competitive against their respective benchmarks and/or peer groups over various time periods, but in particular over the full market cycle periods relevant for the Series. In addition, the Board considered at the meeting (and considers on a quarterly basis) a peer group performance analysis consisting of Morningstar universes of mutual funds with similar investment objectives. The Board discussed the performance with representatives from the Advisor and concluded that the investment performance of each of the Fund’s Series was reasonable based on the Fund’s actual performance and comparative performance, especially performance over the current market cycle. |
| | • | | The Board considered the costs of the Advisor’s services and the profits of the Advisor as they relate to the Advisor’s services to the Fund under the Agreement. In reviewing the Advisor’s costs and profits, the Board discussed the Advisor’s revenues generated from the Fund (on both an actual and adjusted basis) and its expenses associated with providing the services under the Agreement. In addition, the Board reviewed the Advisor’s expenses associated with Fund activities outside of the Agreement (such as expense reimbursements pursuant to expense caps and payments made by the Advisor to third party platforms on which shares of the Fund are available for purchase). It was noted by representatives of the Advisor that 13 of the 26 active Series of the Fund are currently experiencing expenses above the capped expense ratios. After discussing the above costs and profits, the Board concluded that the Advisor’s profitability relating to its services provided under the Agreement was reasonable. |
Renewal of Investment Advisory Agreement (unaudited)
| | • | | The Board considered the fees and expenses of the various Series of the Fund. The Advisor presented the advisory fees and total expenses for each Series, including the advisory fee adjusted for any expense waivers or reimbursements (either contractual or voluntary) paid by the Advisor. The advisory fees and expense ratios of each Series were compared to an average (on both a mean and median basis) of similar funds as disclosed on the Morningstar database. Representatives of the Advisor discussed with the Board the levels of its advisory fee for each Series of the Fund and as compared to the median and mean advisory fees for similar funds as listed on Morningstar. Expense ratios for every Series, except the Global Fixed Income Series and the Target Series Class R and Class C, are currently below the median and mean for similar funds as listed on Morningstar. Based on their review of the information provided, the Board concluded that the fees and expenses of each Series of the Fund were reasonable on a comparative basis. |
| | • | | The Board also considered the other benefits the Advisor derives from its relationship with the Fund. Such other benefits include certain research products provided by soft dollars. Given the level of soft dollar transactions involving the Fund, the Board concluded that these additional benefits to the Advisor were reasonable. |
| | • | | In addition to the factors described above, the Board considered the Advisor’s personnel, investment strategies, policies and procedures relating to compliance with personal securities transactions, and reputation, expertise and resources in domestic and foreign financial markets. The Board concluded that these factors support the conclusion that the Advisor performs its services in a reasonable manner. |
| | • | | The Board did not consider economies of scale at this time because of the multiple uses of the Fund (for the Advisor’s discretionary investment account clients in addition to direct investors), the current profitability of the Advisor’s services to the Fund under the Agreement, and the overall size of the Fund complex. |
Based on the Board’s deliberations and their evaluation of the information described above, the Board, including a majority of Directors that are not “interested persons” as defined in the Investment Company Act of 1940, concluded that the compensation under the Agreement was fair and reasonable in light of the services and expenses and such other matters as the Directors considered to be relevant in the exercise of their reasonable judgment. Accordingly, the Board approved the renewal of the Agreement. In the course of their deliberations, the Directors did not identify any particular information that was all important or controlling.
Directors’ and Officers’ Information (unaudited)
The Statement of Additional Information provides additional information about the Fund’s directors and officers and can be obtained without charge by calling 1-800-466-3863, at www.manningnapieradvisors.com, or on the EDGAR Database on the SEC Internet web site (http:// www.sec.gov). The following chart shows certain information about the Fund’s officers and directors, including their principal occupations during the last five years. Unless specific dates are provided, the individuals have held the listed positions for longer than five years.
INTERESTED DIRECTOR/OFFICER
| | |
| Name: | | B. Reuben Auspitz* |
| Address: | | 290 Woodcliff Drive |
| | Fairport, NY 14450 |
| Age: | | 62 |
| Current Position(s) Held with Fund: | | Principal Executive Officer, President, Chairman & Director |
| Term of Office1 & Length of Time Served: | | Indefinite - Director since 1984; Vice President 1984 - 2003; |
| | President since 2004; Principal Executive Officer since 2002 |
| Principal Occupation(s) During Past 5 Years: | | Executive Vice President; Co-Executive Director; Executive Group |
| | Member**; Chief Compliance Officer since 2004 - Manning & |
| | Napier Advisors, Inc. President; Director - Manning & Napier |
| | Investor Services, Inc. Holds or has held one or more of the |
| | following titles for various subsidiaries and affiliates: President, Vice |
| | President, Director, Chairman, Treasurer, Chief Compliance Officer |
| | or Member. |
| Number of Portfolios Overseen within Fund Complex: | | 29 |
| Other Directorships Held Outside Fund Complex: | | N/A |
| |
| INDEPENDENT DIRECTORS | | |
| |
| Name: | | Stephen B. Ashley |
| Address: | | 290 Woodcliff Drive |
| | Fairport, NY 14450 |
| Age: | | 69 |
| Current Position(s) Held with Fund: | | Director, Audit Committee Member, Governance & Nominating |
| | Committee Member |
| Term of Office & Length of Time Served: | | Indefinite - Since 1996 |
| Principal Occupation(s) During Past 5 Years: | | Chairman, Director, President & Chief Executive Officer, The Ashley |
| | Group (property management and investment). Chairman |
| | (non-executive) 2004 - 2008; Director 1995 - 2008 - Fannie Mae |
| | (mortgage) |
| Number of Portfolios Overseen within Fund Complex: | | 29 |
| Other Directorships Held Outside Fund Complex: | | The Ashley Group |
| Name: | | Peter L. Faber |
| Address: | | 290 Woodcliff Drive |
| | Fairport, NY 14450 |
| Age: | | 71 |
| Current Position(s) Held with Fund: | | Director, Governance & Nominating Committee Member |
| Term of Office & Length of Time Served: | | Indefinite - Since 1987 |
| Principal Occupation(s) During Past 5 Years: | | Senior Counsel since 2006, Partner (1995-2006) - McDermott, Will |
| | & Emery LLP (law firm) |
| Number of Portfolios Overseen within Fund Complex: | | 29 |
| Other Directorships Held Outside Fund Complex: | | Partnership for New York City, Inc. (non-profit) |
| | New York Collegium (non-profit) |
| | Boston Early Music Festival (non-profit) |
| | Amherst Early Music, Inc. (non-profit) |
| | | Gotham Early Music Scene, Inc. (non-profit) |
Directors’ and Officers’ Information (unaudited)
INDEPENDENT DIRECTORS (continued)
| | |
| Name: | | Harris H. Rusitzky |
| Address: | | 290 Woodcliff Drive |
| | Fairport, NY 14450 |
| Age: | | 75 |
| Current Position(s) Held with Fund: | | Director, Audit Committee Member, Governance & Nominating |
| | Committee Member |
| Term of Office & Length of Time Served: | | Indefinite - Since 1985 |
| Principal Occupation(s) During Past 5 Years: | | President, The Greening Group (business consultants) since 1994; |
| | Partner, The Restaurant Group (restaurants) since 2006 |
| Number of Portfolios Overseen within Fund Complex: | | 29 |
| Other Directorships Held Outside Fund Complex: | | N/A |
| Name: | | Paul A. Brooke |
| Address: | | 290 Woodcliff Drive |
| | Fairport, NY 14450 |
| Age: | | 64 |
| Current Position(s) Held with Fund: | | Director, Audit Committee Member, Governance & Nominating |
| | Committee Member |
| Term of Office & Length of Time Served: | | Indefinite - Since 2007 |
| Principal Occupation(s) During Past 5 Years: | | Chairman & CEO, Alsius Corp. (investments); Managing Member, |
| | PMSV Holdings LLC (investments) |
| Number of Portfolios Overseen within Fund Complex: | | 29 |
| Other Directorships Held Outside Fund Complex: | | Incyte Corp. |
| | ViroPharma, Inc. |
| | WebMD |
| | Cheyne Capital International |
| | MPM Bio-equities |
| | GMP Companies |
| | | HoustonPharma |
| Name: | | Richard M. Hurwitz |
| Address: | | 290 Woodcliff Drive |
| | Fairport, NY 14450 |
| Age: | | 46 |
| Current Position(s) Held with Fund: | | Director, Audit Committee Member, Governance & Nominating |
| | Committee Member |
| Term of Office & Length of Time Served: | | Indefinite - Since 2009 |
| Principal Occupation(s) During Past 5 Years: | | Managing Partner, Aegis Investment Partners, LLC (investments) |
| | since 2006; Founder and Managing Partner (2004-2005) - Village |
| | Markets, LLC (groceries) |
| Number of Portfolios Overseen within Fund Complex: | | 29 |
| Other Directorships Held Outside Fund Complex: | | Pictometry International Corp. |
Directors’ and Officers’ Information (unaudited)
OFFICERS
| | |
| Name: | | Jeffrey S. Coons, Ph.D., CFA |
| Address: | | 290 Woodcliff Drive |
| | Fairport, NY 14450 |
| Age: | | 46 |
| Current Position(s) Held with Fund: | | Vice President |
| Term of Office1 & Length of Time Served: | | Since 2004 |
| Principal Occupation(s) During Past 5 Years: | | Co-Director of Research since 2002 & Executive Group Member** |
| | since 2003, Manning & Napier Advisors, Inc. Holds one or more of |
| | the following titles for various subsidiaries and affiliates: President, |
| | Director, Treasurer or Senior Trust Officer. |
| Number of Portfolios Overseen within Fund Complex: | | 29 |
| Other Directorships Held Outside Fund Complex: | | N/A |
| Name: | | Christine Glavin |
| Address: | | 290 Woodcliff Drive |
| | Fairport, NY 14450 |
| Age: | | 43 |
| Current Position(s) Held with Fund: | | Principal Financial Officer, Chief Financial Officer |
| Term of Office1 & Length of Time Served: | | Principal Financial Officer since 2002; Chief Financial Officer since |
| | 2001 |
| Principal Occupation(s) During Past 5 Years: | | Fund Reporting Manager, Manning & Napier Advisors, Inc. since |
| | 1997 |
| Number of Portfolios Overseen within Fund Complex: | | 29 |
| Other Directorships Held Outside Fund Complex: | | N/A |
| Name: | | Jodi L. Hedberg |
| Address: | | 290 Woodcliff Drive |
| | Fairport, NY 14450 |
| Age: | | 42 |
| Current Position(s) Held with Fund: | | Corporate Secretary, Chief Compliance Officer, Anti-Money |
| | Laundering Compliance Officer |
| Term of Office1 & Length of Time Served: | | Corporate Secretary since 1997; Chief Compliance Officer since |
| | 2004 |
| Principal Occupation(s) During Past 5 Years: | | Director of Compliance, Manning & Napier Advisors, Inc. and |
| | affiliates since 1990 (title change in 2005 from Compliance Manager |
| | to Director of Compliance); Corporate Secretary, Manning & Napier |
| | Investor Services, Inc. since 2006 |
| Number of Portfolios Overseen within Fund Complex: | | 29 |
| Other Directorships Held Outside Fund Complex: | | N/A |
*Interested Director, within the meaning of the Investment Company Act of 1940 by reason of his position with the Fund’s investment advisor and distributor. Mr. Auspitz serves as the Executive Vice President and Director, Manning & Napier Advisors, Inc. and President and Director, Manning & Napier Investor Services, Inc., the Fund’s distributor.
**The Executive Group performs the duties of the Office of the Chief Executive of Manning & Napier Advisors, Inc.
1The term of office for President, Vice President, Chief Financial Officer, and Corporate Secretary is one year and until their respective successors are chosen and qualified. All other officers’ terms are indefinite.
This Page Intentionally Left Blank
Literature Requests (unaudited)
Proxy Voting Policies and Procedures
A description of the policies and procedures that the Fund uses to determine how to vote proxies relating to portfolio securities is available, without charge, upon request:
| | |
By phone | | 1-800-466-3863 |
On the Securities and Exchange Commission’s (SEC) web site | | http://www.sec.gov |
Proxy Voting Record
Information regarding how the Fund voted proxies relating to portfolio securities during the most recent 12-month period ended June 30th is available, without charge, upon request:
| | |
By phone | | 1-800-466-3863 |
On the SEC’s web site | | http://www.sec.gov |
Quarterly Portfolio Holdings
The Series’ complete schedule of portfolio holdings for the 1st and 3rd quarters of each fiscal year are provided on Form N-Q, and are available, without charge, upon request:
| | |
By phone | | 1-800-466-3863 |
On the SEC’s web site | | http://www.sec.gov |
The Series’ Form N-Q may be reviewed and copied at the SEC’s Public Reference Room in Washington, D.C. Information on the operation of the Public Reference Room may be obtained by calling 1-800-SEC-0330.
Prospectus and Statement of Additional Information (SAI)
The prospectus and SAI provide additional information about each Series, including charges, expenses and risks. These documents are available, without charge, upon request:
| | |
By phone | | 1-800-466-3863 |
On the SEC’s web site | | http://www.sec.gov |
On the Advisor’s web site | | http://www.manningnapieradvisors.com |
Additional information available at www.manningnapieradvisors.com
1. Fund Holdings - Month-End
2. Fund Holdings - Quarter-End
3. Shareholder Report - Annual
4. Shareholder Report - Semi-Annual


Management Discussion and Analysis (unaudited)

Dear Shareholders:
Over the past twelve months, investor sentiment has moved rather quickly from extreme pessimism to guarded optimism. Volatility continued into the first quarter of 2009, with broad equity markets down more than 10%. After hitting a low point in late March, both domestic and foreign stock markets turned upwards rather dramatically, posting 40% to 60% returns off their lows through the end of the year.
While this turnaround has not been enough to fully offset losses experienced during the current bear market, recent returns indicate that market participants appear more confident in an economic rebound. The Morgan Stanley Capital International (MSCI) All Country World Index excluding the U.S. (ACWIxUS) posted a strong positive return of 41.45% during 2009.
The World Opportunities Series was also up significantly for the year, earning a 39.12% return during 2009, nearly in line with the broad foreign stock market benchmark. More importantly, the Series continues to outperform the MSCIACWIxUS over the current international stock market cycle (4/1/03 to 12/31/09), which includes both a bull and a bear market. Over this current cycle, the World Opportunities Series has earned an annualized return of 14.97% relative to the 14.13% return of the MSCI ACWIxUS.
As equity market volatility heightened during the last quarter of 2008 and first quarter of 2009, we found meaningful investment opportunities in both the Information Technology and Health Care sectors. Using our Profile strategy for stock selection, we identified several companies with strong competitive advantages and growth drivers that we believed to be largely unrelated to the overall shape of the economy. Our allocations to both sectors detracted from performance at the beginning of 2009. In addition, our generally low allocation to Financials detracted from returns relative to the benchmark as this sector experienced quite strong returns once the markets began to rebound in late March 2009.
Country allocations have also been a driver of results. The Series’ generally low allocation to emerging market countries over the past twelve months detracted from performance relative to the benchmark, as such countries generally performed better than developed markets in the latter part of 2009. In contrast, the Series benefited from a relatively small position in Japan, whose stock market has not recovered as quickly as others, as well as from investments in France and the United Kingdom.
Currently, Information Technology and Health Care remain the Series’ largest sector weightings. Relative to the benchmark, we continue to have a relatively small position in Financials. The Series’ greatest country allocations are in France, United Kingdom and Switzerland.
From a macro perspective, the current environment remains challenging. On the one hand, more encouraging pockets of optimism have been found in the housing and manufacturing sectors, and while the unemployment rate remains high in many developed countries, there are subtle signs of improvement in the U.S. labor markets. On the other hand, macro-economic challenges remain in the face of a growing government deficit, continued easy monetary policy, a debt-burdened U.S. consumer and widespread inflation concerns.
We recognize that solving yesterday’s problems may create new and different macro-economic challenges. Our approach has always been to remain cognizant of macro-economic conditions, but to allow company-specific factors to drive our investment decisions. In an environment like today, the very uncertainty that makes investors cautious can also create attractively priced investment opportunities for long-term investors. Over the past year, many of these opportunities have been represented by high quality growth companies and well-positioned companies in cyclical industries that are experiencing supply responses to lower demand. We will continue to seek out such opportunities as the next phase of this market and economic cycle unfolds.
As always, we appreciate your business.
Sincerely,
Manning & Napier Advisors, Inc.
Performance Update as of December 31, 2009 (unaudited)
| | | | | | | | | | |
| | | Average Annual Total Returns
As of December 31, 2009 | | |
| | | One
Year | | Five
Year | | Ten
Year | | Since
Inception1 | | |
Manning & Napier Fund, Inc. - World Opportunities Series2 | | 39.12% | | 7.43% | | 8.47% | | 9.78% | | |
Morgan Stanley Capital International (MSCI) All Country World
Index ex U.S.3 | | 41.45% | | 5.83% | | 2.71% | | 5.47% | | |
The following graph compares the value of a $10,000 investment in the Manning & Napier Fund, Inc.-World Opportunities Series for the ten years ended December 31, 2009 to the MSCI All Country World Index ex U.S.
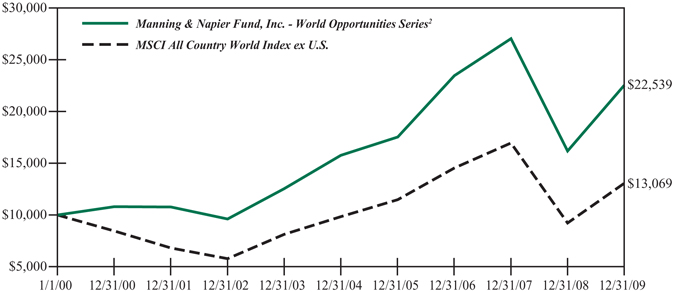
1Performance numbers for the Series are calculated from September 6, 1996, the Series’ inception date. Prior to 2001, the MSCI All Country World Index ex U.S. only published month-end numbers; therefore, performance numbers for the Index are calculated from September 30, 1996.
2The Series’ performance does not reflect the deduction of taxes that a shareholder would pay on fund distributions or the redemption of shares. The Series’ performance is historical and may not be indicative of future results. The performance returns shown are inclusive of the net expense ratio of the Series. For the year ended December 31, 2009, this net expense ratio was 1.17%. The gross expense ratio, which does not account for any voluntary or contractual waivers currently in effect, was 1.17% for the year ended December 31, 2009.
3The MSCI All Country World Index ex U.S. is a free float-adjusted market capitalization weighted index that is designed to measure equity market performance in the global developed and emerging markets and consists of 47 developed and emerging market country indices outside the United States. The Index is denominated in U.S. Dollars. The Index returns assume daily reinvestment of gross dividends (which do not account for foreign dividend taxation) from the inception of the Series (see Note 1 above) through December 31, 1998, as net returns were not available. Subsequent to December 31, 1998, the Index returns assume daily reinvestment of net dividends (thus accounting for foreign dividend taxation). Unlike Series returns, the Index returns do not reflect any fees or expenses.
Shareholder Expense Example (unaudited)
As a shareholder of the Series, you may incur two types of costs: (1) transaction costs, including potential wire charges on redemptions and (2) ongoing costs, including management fees and other Series expenses. This example is intended to help you understand your ongoing costs (in dollars) of investing in the Series and to compare these costs with the ongoing costs of investing in other mutual funds.
The example is based on an investment of $1,000 invested at the beginning of the period and held for the entire period (July 1, 2009 to December 31, 2009).
Actual Expenses
The first line of the table below provides information about actual account values and actual expenses. You may use the information in this line, together with the amount you invested, to estimate the expenses that you paid over the period. Simply divide your account value by $1,000 (for example, an $8,600 account value divided by $1,000 = 8.6), then multiply the result by the number in the first line under the heading entitled “Expenses Paid During Period” to estimate the expenses you paid on your account during this period.
Hypothetical Example for Comparison Purposes
The second line of the table below provides information about hypothetical account values and hypothetical expenses based on the Series’ actual expense ratio and an assumed rate of return of 5% per year before expenses, which is not the Series’ actual return. The hypothetical account values and expenses may not be used to estimate the actual ending account balance or expenses you paid during the period. You may use this information to compare the ongoing costs of investing in the Series and other funds. To do so, compare this 5% hypothetical example with the 5% hypothetical examples that appear in the shareholder reports of the other funds.
Please note that the expenses shown in the table are meant to highlight your ongoing costs only and do not reflect any transaction costs, such as potential wire charges on redemptions. Therefore, the second line of the table is useful in comparing ongoing costs only, and will not help you determine the relative total costs of owning different funds. In addition, if these transaction costs were included, your costs would have been higher.
| | | | | | | | | |
| | | Beginning
Account Value
7/1/09 | | Ending
Account Value
12/31/09 | | Expenses Paid
During Period*
7/1/09-12/31/09 |
Actual | | $ | 1,000.00 | | $ | 1,254.70 | | $ | 6.71 |
Hypothetical
(5% return before expenses) | | $ | 1,000.00 | | $ | 1,019.26 | | $ | 6.01 |
*Expenses are equal to the Series’ annualized expense ratio (for the six-month period) of 1.18%, multiplied by the average account value over the period, multiplied by 184/365 (to reflect the one-half year period). Expenses are based on the most recent fiscal half year; therefore, the expense ratio stated above may differ from the expense ratio stated in the financial highlights, which is based on one-year data. The Series’ total return would have been lower had certain expenses not been waived during the period.
Portfolio Composition as of December 31, 2009 (unaudited)
Country Allocation1

1As a percentage of net assets.
2Miscellaneous
China 2.5%
Finland 2.1%
Hong Kong 0.2%
Mexico 2.1%
Singapore 0.8%
South Korea 1.5%
Spain 1.0%
Thailand 0.6%
United States 1.4%
Sector Allocation3
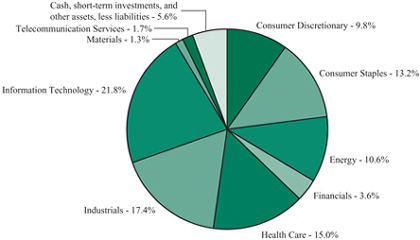
3As a percentage of net assets.
Investment Portfolio - December 31, 2009
| | | | | |
| | | Shares | | Value
(Note 2) |
| | | | | |
| | |
COMMON STOCKS - 93.4% | | | | | |
| | |
Consumer Discretionary - 9.8% | | | | | |
Automobiles - 1.5% | | | | | |
Bayerische Motoren Werke AG (BMW) (Germany) | | 1,098,140 | | $ | 50,060,713 |
Suzuki Motor Corp. (Japan) | | 836,600 | | | 20,480,464 |
| | | | | |
| | | | | 70,541,177 |
| | | | | |
Hotels, Restaurants & Leisure - 0.3% | | | | | |
Club Mediterranee S.A. (France)* | | 852,070 | | | 15,696,059 |
| | | | | |
Leisure Equipment & Products - 0.4% | | | | | |
Sankyo Co. Ltd. (Japan) | | 403,700 | | | 20,112,396 |
| | | | | |
Media - 6.6% | | | | | |
Grupo Televisa S.A. - ADR (Mexico) | | 4,883,370 | | | 101,378,761 |
Pearson plc (United Kingdom) | | 3,561,000 | | | 51,247,753 |
Reed Elsevier plc (United Kingdom) | | 6,300,500 | | | 52,053,005 |
Societe Television Francaise 1 (France) | | 6,560,230 | | | 121,222,766 |
| | | | | |
| | | | | 325,902,285 |
| | | | | |
Textiles, Apparel & Luxury Goods - 1.0% | | | | | |
Adidas AG (Germany) | | 939,060 | | | 50,845,501 |
| | | | | |
Total Consumer Discretionary | | | | | 483,097,418 |
| | | | | |
Consumer Staples - 12.2% | | | | | |
Beverages - 1.6% | | | | | |
Heineken N.V. (Netherlands) | | 1,690,420 | | | 80,611,009 |
| | | | | |
Food & Staples Retailing - 4.7% | | | | | |
Carrefour S.A. (France) | | 2,662,170 | | | 128,076,645 |
Tesco plc (United Kingdom) | | 15,020,300 | | | 103,835,898 |
| | | | | |
| | | | | 231,912,543 |
| | | | | |
Food Products - 5.9% | | | | | |
Cadbury plc (United Kingdom) | | 2,301,389 | | | 29,644,619 |
Nestle S.A. (Switzerland) | | 2,034,760 | | | 98,743,247 |
Unilever plc - ADR (United Kingdom) | | 4,981,320 | | | 158,904,108 |
| | | | | |
| | | | | 287,291,974 |
| | | | | |
Total Consumer Staples | | | | | 599,815,526 |
| | | | | |
Energy - 10.6% | | | | | |
Energy Equipment & Services - 6.8% | | | | | |
Calfrac Well Services Ltd. (Canada)1 | | 3,375,150 | | | 67,286,779 |
Compagnie Generale de Geophysique - Veritas (CGG - Veritas) (France)* | | 4,693,170 | | | 100,447,307 |
Schlumberger Ltd. (United States) | | 1,036,760 | | | 67,482,709 |
Trican Well Service Ltd. (Canada) | | 7,415,430 | | | 99,690,152 |
| | | | | |
| | | | | 334,906,947 |
| | | | | |
| | |
| 5 | | The accompanying notes are an integral part of the financial statements. |
Investment Portfolio - December 31, 2009
| | | | | |
| | | Shares | | Value (Note 2) |
| | | | | |
| | |
COMMON STOCKS (continued) | | | | | |
Energy (continued) | | | | | |
Oil, Gas & Consumable Fuels - 3.8% | | | | | |
Cameco Corp. (Canada) | | 1,659,360 | | $ | 53,381,611 |
Talisman Energy, Inc. (Canada) | | 5,883,070 | | | 110,759,333 |
Uranium One, Inc. (Canada)* | | 8,114,760 | | | 23,432,208 |
| | | | | |
| | | | | 187,573,152 |
| | | | | |
Total Energy | | | | | 522,480,099 |
| | | | | |
Financials - 3.6% | | | | | |
Diversified Financial Services - 0.8% | | | | | |
Financiere Marc de Lacharriere S.A. (Fimalac) (France) | | 703,807 | | | 39,177,181 |
| | | | | |
Insurance - 2.8% | | | | | |
Allianz SE (Germany) | | 692,450 | | | 86,510,339 |
Willis Group Holdings plc (United Kingdom) | | 1,921,100 | | | 50,678,618 |
| | | | | |
| | | | | 137,188,957 |
| | | | | |
Total Financials | | | | | 176,366,138 |
| | | | | |
Health Care - 15.0% | | | | | |
Health Care Equipment & Supplies - 6.6% | | | | | |
Cochlear Ltd. (Australia) | | 846,160 | | | 52,497,368 |
Covidien plc (Ireland) | | 1,503,000 | | | 71,978,670 |
Mindray Medical International Ltd. - ADR (China) | | 2,467,220 | | | 83,688,102 |
Nobel Biocare Holding AG (Switzerland) | | 1,772,500 | | | 59,594,519 |
Straumann Holding AG (Switzerland) | | 204,380 | | | 57,790,275 |
| | | | | |
| | | | | 325,548,934 |
| | | | | |
Health Care Providers & Services - 5.6% | | | | | |
BML, Inc. (Japan) | | 901,300 | | | 24,580,469 |
Bumrungrad Hospital Public Co. Ltd. - NVDR (Thailand) | | 33,365,600 | | | 29,522,651 |
Diagnosticos da America S.A. (Brazil) | | 1,172,450 | | | 38,379,050 |
Sonic Healthcare Ltd. (Australia) | | 13,082,040 | | | 180,611,302 |
| | | | | |
| | | | | 273,093,472 |
| | | | | |
Life Sciences Tools & Services - 2.8% | | | | | |
Lonza Group AG (Switzerland) | | 1,977,802 | | | 139,571,314 |
| | | | | |
Total Health Care | | | | | 738,213,720 |
| | | | | |
Industrials - 17.4% | | | | | |
Aerospace & Defense - 2.1% | | | | | |
Empresa Brasileira de Aeronautica S.A. (Embraer) - ADR (Brazil) | | 4,572,240 | | | 101,092,226 |
| | | | | |
Air Freight & Logistics - 3.2% | | | | | |
TNT N.V. (Netherlands) | | 5,128,090 | | | 158,054,296 |
| | | | | |
| | |
| The accompanying notes are an integral part of the financial statements. | | 6 |
Investment Portfolio - December 31, 2009
| | | | | |
| | | Shares | | Value
(Note 2) |
| | | | | |
| | |
COMMON STOCKS (continued) | | | | | |
| | |
Industrials (continued) | | | | | |
Airlines - 2.8% | | | | | |
Ryanair Holdings plc - ADR (Ireland)* | | 3,637,400 | | $ | 97,555,068 |
Singapore Airlines Ltd. (Singapore) | | 3,879,000 | | | 41,251,564 |
| | | | | |
| | | | | 138,806,632 |
| | | | | |
Electrical Equipment - 5.3% | | | | | |
ABB Ltd. (Asea Brown Boveri) - ADR (Switzerland) | | 7,013,120 | | | 133,950,592 |
Gamesa Corporacion Tecnologica S.A. (Spain) | | 2,900,330 | | | 48,999,224 |
Nexans S.A. (France) | | 937,490 | | | 75,018,553 |
| | | | | |
| | | | | 257,968,369 |
| | | | | |
Industrial Conglomerates - 3.0% | | | | | |
Siemens AG (Germany) | | 1,591,810 | | | 146,523,102 |
| | | | | |
Road & Rail - 1.0% | | | | | |
Canadian National Railway Co. (Canada) | | 939,960 | | | 51,096,226 |
| | | | | |
Total Industrials | | | | | 853,540,851 |
| | | | | |
Information Technology - 21.8% | | | | | |
Communications Equipment - 4.4% | | | | | |
Alcatel-Lucent - ADR (France)* | | 35,057,160 | | | 116,389,771 |
Nokia Corp. - ADR (Finland) | | 7,832,600 | | | 100,648,910 |
| | | | | |
| | | | | 217,038,681 |
| | | | | |
IT Services - 7.3% | | | | | |
Accenture plc - Class A (Ireland) | | 575,880 | | | 23,899,020 |
Amdocs Ltd. (Guernsey)* | | 7,464,620 | | | 212,965,608 |
Cielo S.A. (Brazil) | | 6,253,170 | | | 55,096,857 |
Redecard S.A. (Brazil) | | 4,065,020 | | | 67,711,419 |
| | | | | |
| | | | | 359,672,904 |
| | | | | |
Semiconductors & Semiconductor Equipment - 3.8% | | | | | |
Advantest Corp. (Japan) | | 4,318,800 | | | 111,523,209 |
Tokyo Electron Ltd. (Japan) | | 1,151,200 | | | 73,174,467 |
| | | | | |
| | | | | 184,697,676 |
| | | | | |
Software - 6.3% | | | | | |
Misys plc (United Kingdom)* | | 19,220,320 | | | 67,056,289 |
SAP AG - ADR (Germany) | | 1,587,980 | | | 74,333,344 |
Shanda Interactive Entertainment Ltd. - ADR (China)* | | 758,540 | | | 39,906,789 |
Square Enix Holdings Co. Ltd. (Japan) | | 2,393,100 | | | 50,207,950 |
UbiSoft Entertainment S.A. (France)* | | 5,387,650 | | | 76,616,666 |
| | | | | |
| | | | | 308,121,038 |
| | | | | |
Total Information Technology | | | | | 1,069,530,299 |
| | | | | |
| | |
| 7 | | The accompanying notes are an integral part of the financial statements. |
Investment Portfolio - December 31, 2009
| | | | | |
| | | Shares | | Value
(Note 2) |
| | | | | |
| | |
COMMON STOCKS (continued) | | | | | |
| | |
Materials - 1.3% | | | | | |
Chemicals - 1.1% | | | | | |
Johnson Matthey plc (United Kingdom) | | 2,087,070 | | $ | 51,610,415 |
| | | | | |
Paper & Forest Products - 0.2% | | | | | |
Norbord, Inc. (Canada)* | | 810,552 | | | 11,361,756 |
| | | | | |
Total Materials | | | | | 62,972,171 |
| | | | | |
Telecommunication Services - 1.7% | | | | | |
Wireless Telecommunication Services - 1.7% | | | | | |
Hutchison Telecommunications International Ltd. - ADR (Hong Kong)* | | 135,670 | | | 408,367 |
Hutchison Telecommunications International Ltd. (Hong Kong)* | | 56,251,000 | | | 11,680,567 |
SK Telecom Co. Ltd. - ADR (South Korea) | | 4,545,050 | | | 73,902,513 |
| | | | | |
Total Telecommunication Services | | | | | 85,991,447 |
| | | | | |
TOTAL COMMON STOCKS
(Identified Cost $4,265,583,315) | | | | | 4,592,007,669 |
| | | | | |
PREFERRED STOCKS - 1.0% | | | | | |
| | |
Consumer Staples - 1.0% | | | | | |
Household Products - 1.0% | | | | | |
Henkel AG & Co. KGaA (Germany)
(Identified Cost $31,888,973) | | 954,590 | | | 49,852,651 |
| | | | | |
SHORT-TERM INVESTMENTS - 5.3% | | | | | |
Dreyfus Cash Management, Inc. - Institutional Shares2, 0.07%
(Identified Cost $259,736,243) | | 259,736,243 | | | 259,736,243 |
| | | | | |
TOTAL INVESTMENTS - 99.7%
(Identified Cost $4,557,208,531) | | | | | 4,901,596,563 |
OTHER ASSETS, LESS LIABILITIES - 0.3% | | | | | 15,862,861 |
| | | | | |
NET ASSETS - 100% | | | | | $4,917,459,424 |
| | | | | |
ADR - American Depository Receipt
NVDR - Non-Voting Depository Receipt
*Non-income producing security
1Affiliated company as defined by the Investment Company Act of 1940 (see Note 2 to the financial statements).
2Rate shown is the current yield as of December 31, 2009.
The Series’ portfolio holds, as a percentage of net assets, greater than 10% in the following countries: France - 13.7%; United Kingdom - 11.5%.
| | |
| The accompanying notes are an integral part of the financial statements. | | 8 |
Statement of Assets and Liabilities
December 31, 2009
| | | | |
ASSETS: | | | | |
| | | | |
| |
Investments, at value (identified cost $4,557,208,531) (Note 2) | | $ | 4,901,596,563 | |
Cash | | | 17,867,278 | |
Receivable for fund shares sold | | | 19,203,530 | |
Dividends receivable | | | 4,033,562 | |
Foreign tax reclaims receivable | | | 1,612,071 | |
| | | | |
TOTAL ASSETS | | | 4,944,313,004 | |
| | | | |
LIABILITIES: | | | | |
| |
Accrued management fees (Note 3) | | | 4,021,307 | |
Accrued fund accounting and transfer agent fees (Note 3) | | | 778,213 | |
Accrued directors’ fees (Note 3) | | | 3,143 | |
Accrued Chief Compliance Officer service fees (Note 3) | | | 476 | |
Payable for securities purchased | | | 19,369,485 | |
Payable for fund shares repurchased | | | 2,186,525 | |
Other payables and accrued expenses | | | 494,431 | |
| | | | |
TOTAL LIABILITIES | | | 26,853,580 | |
| | | | |
TOTAL NET ASSETS | | $ | 4,917,459,424 | |
| | | | |
NET ASSETS CONSIST OF: | | | | |
| |
Capital stock | | $ | 6,054,837 | |
Additional paid-in-capital | | | 4,573,567,120 | |
Undistributed net investment income | | | 2,564,172 | |
Accumulated net realized loss on investments, foreign currency and translation of other assets and liabilities | | | (9,211,895 | ) |
Net unrealized appreciation on investments and translation of other assets and liabilities | | | 344,485,190 | |
| | | | |
TOTAL NET ASSETS | | $ | 4,917,459,424 | |
| | | | |
NET ASSET VALUE, OFFERING PRICE AND REDEMPTION | | | | |
PRICE PER SHARE - Class A ($4,917,459,424/605,483,653 shares) | | $ | 8.12 | |
| | | | |
| | |
| 9 | | The accompanying notes are an integral part of the financial statements. |
Statement of Operations
For the Year Ended December 31, 2009
| | | | |
INVESTMENT INCOME: | | | | |
| | | | |
| |
Dividends (net of foreign taxes withheld, $4,533,401) | | $ | 47,042,050 | |
Interest | | | 130,965 | |
| | | | |
Total Investment Income | | | 47,173,015 | |
| | | | |
| EXPENSES: | | | | |
| |
Management fees (Note 3) | | | 26,584,493 | |
Fund accounting and transfer agent fees (Note 3) | | | 3,119,852 | |
Directors’ fees (Note 3) | | | 12,849 | |
Chief Compliance Officer service fees (Note 3) | | | 3,729 | |
Custodian fees | | | 537,501 | |
Miscellaneous | | | 938,648 | |
| | | | |
Total Expenses | | | 31,197,072 | |
Less reduction of expenses (Note 3) | | | (28,421 | ) |
| | | | |
Net Expenses | | | 31,168,651 | |
| | | | |
NET INVESTMENT INCOME | | | 16,004,364 | |
| | | | |
| REALIZED AND UNREALIZED GAIN ON INVESTMENTS AND FOREIGN CURRENCY: | | | | |
| |
Net realized gain on- | | | | |
Investments | | | 32,268,069 | |
Foreign currency and translation of other assets and liabilities | | | 133,908 | |
| | | | |
| | | 32,401,977 | |
| | | | |
| |
Net change in unrealized appreciation (depreciation) on- | | | | |
Investments | | | 859,782,104 | |
Foreign currency and translation of other assets and liabilities | | | 118,629 | |
| | | | |
| | | 859,900,733 | |
| | | | |
| |
NET REALIZED AND UNREALIZED GAIN ON INVESTMENTS AND FOREIGN CURRENCY | | | 892,302,710 | |
| | | | |
NET INCREASE IN NET ASSETS RESULTING FROM OPERATIONS | | $ | 908,307,074 | |
| | | | |
| | |
| The accompanying notes are an integral part of the financial statements. | | 10 |
Statements of Changes in Net Assets
| | | | | | | | |
| | | For the
Year Ended
12/31/09 | | | For the
Year Ended
12/31/08 | |
| | | | | | | | |
| INCREASE (DECREASE) IN NET ASSETS: | | | | | | | | |
| | |
| OPERATIONS: | | | | | | | | |
| | |
Net investment income | | $ | 16,004,364 | | | $ | 22,557,806 | |
Net realized gain (loss) on investments and foreign currency | | | 32,401,977 | | | | (42,209,203 | ) |
Net change in unrealized appreciation (depreciation) on investments and foreign currency | | | 859,900,733 | | | | (557,735,908 | ) |
| | | | | | | | |
Net increase (decrease) from operations | | | 908,307,074 | | | | (577,387,305 | ) |
| | | | | | | | |
DISTRIBUTIONS TO SHAREHOLDERS (Note 8): | | | | | | | | |
| | |
From net investment income | | | (30,333,272 | ) | | | (5,302,658 | ) |
From net realized gain on investments | | | — | | | | (25,379,417 | ) |
| | | | | | | | |
Total distributions to shareholders | | | (30,333,272 | ) | | | (30,682,075 | ) |
| | | | | | | | |
| CAPITAL STOCK ISSUED AND REPURCHASED: | | | | | | | | |
| | |
Net increase from capital share transactions (Note 5) | | | 2,699,428,129 | | | | 1,106,263,251 | |
| | | | | | | | |
Net increase in net assets | | | 3,577,401,931 | | | | 498,193,871 | |
| | |
| NET ASSETS: | | | | | | | | |
| | |
Beginning of year | | | 1,340,057,493 | | | | 841,863,622 | |
| | | | | | | | |
End of year (including undistributed net investment income of $2,564,172 and $16,759,172, respectively) | | $ | 4,917,459,424 | | | $ | 1,340,057,493 | |
| | | | | | | | |
| | |
| 11 | | The accompanying notes are an integral part of the financial statements. |
Financial Highlights
| | | | | | | | | | |
| | | For the Years Ended |
| | | 12/31/09 | | 12/31/08 | | 12/31/07 | | 12/31/06 | | 12/31/05 |
| | | | | | | | | | |
| | | | | | | | | | |
Per share data (for a share outstanding throughout each year): | | | | | | | | | | |
Net asset value - Beginning of year | | $5.88 | | $10.07 | | $9.58 | | $8.46 | | $8.33 |
| | | | | | | | | | |
Income (loss) from investment operations: | | | | | | | | | | |
Net investment income | | 0.041 | | 0.10 | | 0.05 | | 0.12 | | 0.07 |
Net realized and unrealized gain (loss) on investments | | 2.26 | | (4.08) | | 1.36 | | 2.71 | | 0.87 |
| | | | | | | | | | |
Total from investment operations | | 2.30 | | (3.98) | | 1.41 | | 2.83 | | 0.94 |
| | | | | | | | | | |
Less distributions to shareholders: | | | | | | | | | | |
From net investment income | | (0.06) | | (0.03) | | (0.05) | | (0.14) | | (0.07) |
From net realized gain on investments | | — | | (0.18) | | (0.87) | | (1.57) | | (0.74) |
| | | | | | | | | | |
Total distributions to shareholders | | (0.06) | | (0.21) | | (0.92) | | (1.71) | | (0.81) |
| | | | | | | | | | |
Net asset value - End of year | | $8.12 | | $5.88 | | $10.07 | | $9.58 | | $8.46 |
| | | | | | | | | | |
Net assets - End of year (000’s omitted) | | $4,917,459 | | $1,340,057 | | $841,864 | | $317,121 | | $206,636 |
| | | | | | | | | | |
Total return2 | | 39.12% | | (40.07%) | | 15.13% | | 33.88% | | 11.33% |
| Ratios (to average net assets)/ Supplemental Data: | | | | | | | | | | |
Expenses | | 1.17%* | | 1.16% | | 1.14% | | 1.16% | | 1.21% |
Net investment income | | 0.60% | | 2.17% | | 0.75% | | 1.35% | | 0.95% |
Portfolio turnover | | 42% | | 34% | | 49% | | 64% | | 46% |
|
*The investment advisor did not impose all of or a portion of its CCO fees, fund accounting and transfer agent fees during the year ended 12/31/09. If these expenses had been incurred by the Series, the expense ratio (to average net assets) would have been increased by 0.00%3. |
1Calculated based on average shares outstanding during the year.
2Represents aggregate total return for the year indicated, and assumes reinvestment of all distributions. Total return would have been lower had certain expenses not been waived during certain years.
3Less than 0.01%.
| | |
| The accompanying notes are an integral part of the financial statements. | | 12 |
Notes to Financial Statements
World Opportunities Series (the “Series”) is a no-load diversified series of Manning & Napier Fund, Inc. (the “Fund”). The Fund is organized in Maryland and is registered under the Investment Company Act of 1940, as amended, as an open-end management investment company.
The Series’ investment objective is to provide long-term growth by investing principally in the common stocks of companies located around the world.
The Series is authorized to issue five classes of shares (Class A, B, D, E and Z). Currently, only Class A shares have been issued. Each class of shares is substantially the same, except that class-specific distribution and shareholder servicing expenses are borne by the specific class of shares to which they relate.
The Fund’s Advisor is Manning & Napier Advisors, Inc. (the “Advisor”). Shares of the Series are offered to investors, clients and employees of the Advisor and its affiliates. The total authorized capital stock of the Fund consists of 10.0 billion shares of common stock each having a par value of $0.01. As of December 31, 2009, 4.6 billion shares have been designated in total among 29 series, of which 1.2 billion have been designated as World Opportunities Series Class A common stock.
| 2. | SIGNIFICANT ACCOUNTING POLICIES |
Security Valuation
Portfolio securities, including domestic equities, foreign equities, warrants and options, listed on an exchange other than the NASDAQ National Market System are valued at the latest quoted sales price of the exchange on which the security is primarily traded. Securities not traded on valuation date or securities not listed on an exchange are valued at the latest quoted bid price provided by the Fund’s pricing service. Securities listed on the NASDAQ National Market System are valued in accordance with the NASDAQ Official Closing Price.
Short-term investments that mature in sixty days or less are valued at amortized cost, which approximates market value. Investments in open-end investment companies are valued at their net asset value per share on valuation date.
Volume and level of activity in established markets for an asset or liability are evaluated to determine whether recent transactions and quoted prices are determinative of fair value. Where there have been significant decreases in volume and level of activity, further analysis and adjustment may be necessary to estimate fair value. The Series measures fair value in these instances by the use of inputs and valuation techniques which may be based upon current market prices of securities that are comparable in coupon, rating, maturity and industry and/or expectation of future cash flows. As a result of trading in relatively thin markets and/or markets that experience significant volatility, the prices used by the Series to value these securities may differ from the value that would be realized if these securities were sold, and the differences could be material.
Securities for which representative valuations or prices are not available from the Fund’s pricing service may be valued at fair value. Due to the inherent uncertainty of valuations of such securities, the fair value may differ significantly from the values that would have been used had a ready market for such securities existed. If trading or events occurring after the close of the principal market in which securities are traded are expected to materially affect the value of those securities, then they may be valued at their fair value, taking this trading or these events into account. Fair
Notes to Financial Statements
| 2. | SIGNIFICANT ACCOUNTING POLICIES (continued) |
Security Valuation (continued)
value is determined in good faith by the Advisor under procedures approved by and under the general supervision and responsibility of the Fund’s Board of Directors (the “Board”).
Various inputs are used in determining the value of the Series’ assets or liabilities carried at market value. These inputs are summarized in three broad levels. Level 1 includes quoted prices in active markets for identical assets and liabilities. Level 2 includes other significant observable inputs (including quoted prices for similar securities, interest rates, prepayment speeds, credit risk, etc.). Level 3 includes significant unobservable inputs (including the Series’ own assumptions in determining the fair value of investments.) The inputs or methodology used for valuing securities are not necessarily an indication of the risk associated with investing in those securities.
The following is a summary of the valuation levels used for major security types as of December 31, 2009 in valuing the Series’ assets or liabilities carried at market value:
| | | | | | | | | | | | |
Description | | 12/31/09 | | Level 1 | | Level 2 | | Level 3 |
| | | | | | | | | | | | |
Equity securities* | | $ | 4,592,007,669 | | $ | 4,592,007,669 | | $ | — | | $ | — |
Preferred securities | | | 49,852,651 | | | 49,852,651 | | | — | | | — |
Debt securities | | | — | | | — | | | — | | | — |
Mutual funds | | | 259,736,243 | | | 259,736,243 | | | — | | | — |
Other financial instruments** | | | — | | | — | | | — | | | — |
| | | | | | | | | | | | |
Total | | $ | 4,901,596,563 | | $ | 4,901,596,563 | | $ | — | | $ | — |
| | | | | | | | | | | | |
* Includes common stock, warrants and rights. Please see the Investment Portfolio for industry classification.
** Other financial instruments are derivative instruments not reflected in the Investment Portfolio, such as futures, forwards and swap contracts, which are valued at the unrealized appreciation/ depreciation on the instrument. As of December 31, 2009, the Series did not hold any derivative instruments.
There were no Level 3 securities held by the Series as of December 31, 2008 or December 31, 2009.
Interim and annual reporting periods beginning after December 15, 2009 will require additional disclosure regarding transfers in and/or out of Level 1 and 2. Additional disclosure surrounding the activity in Level 3 fair value measurement will also be effective for fiscal years beginning after December 15, 2010. Management has concluded that this will not have a material impact on the Series’ financial statements.
Security Transactions, Investment Income and Expenses
Security transactions are accounted for on trade date. Dividend income is recorded on the ex-dividend date, except that if the ex-dividend date has passed, certain dividends from foreign securities are recorded as soon as the Fund is informed of the ex-dividend date. Non-cash dividends, if any, are recorded at the fair market value of the securities received. Interest income, including
Notes to Financial Statements
| 2. | SIGNIFICANT ACCOUNTING POLICIES (continued) |
Security Transactions, Investment Income and Expenses (continued)
amortization of premium and accretion of discounts using the effective interest method, is earned from settlement date and accrued daily.
Expenses are recorded on an accrual basis. Most expenses of the Fund can be attributed to a specific series. Expenses which cannot be directly attributed are apportioned among the series in the Fund in such a manner as deemed equitable by the Fund’s Board, taking into consideration, among other things, the nature and type of expense.
The Series uses the identified cost method for determining realized gain or loss on investments for both financial statement and federal income tax reporting purposes.
Foreign Currency Translation
The books and records of the Series are maintained in U.S. dollars. Foreign currencies, investments and other assets and liabilities are translated into U.S. dollars at the current exchange rates. Purchases and sales of investment securities and income and expenses are translated on the respective dates of such transactions. The Series does not isolate realized and unrealized gains and losses attributable to changes in the exchange rates from gains and losses that arise from changes in the market value of investments. Such fluctuations are included with net realized and unrealized gain or loss on investments. Net realized foreign currency gains and losses represent foreign currency gains and losses between trade date and settlement date on securities transactions, gains and losses on disposition of foreign currencies and the difference between the amount of income and foreign withholding taxes recorded on the books of the Series and the amounts actually received or paid.
Affiliated Companies
The 1940 Act defines “affiliated companies” to include securities in which a series owns 5% or more of the outstanding voting securities of the issuer. The following transactions were effected in shares of Calfrac Well Services Ltd. (Canada) for the year ended December 31, 2009:
| | | | | | | | | | | | | | | | | |
Name of Issuer | | Number of
Shares
Held as of
12/31/08 | | Gross
Additions | | Gross
Reductions | | Number of
Shares
Held as of
12/31/09 | | Value
as of
12/31/09 | | Investment
Income | | Realized
Gain |
Calfrac Well Services Ltd. (Canada) | | 2,339,700 | | 1,035,450 | | — | | 3,375,150 | | $ | 67,286,779 | | $ | — | | $ | — |
Federal Taxes
The Series’ policy is to comply with the provisions of the Internal Revenue Code applicable to regulated investment companies. The Series is not subject to federal income tax or excise tax to the extent that the Series distributes to shareholders each year its taxable income, including any net realized gains on investments, in accordance with requirements of the Internal Revenue Code. Accordingly, no provision for federal income tax or excise tax has been made in the financial statements.
Management evaluates its tax positions to determine if the tax positions taken meet the minimum recognition threshold in connection with accounting for uncertainties in income tax positions taken or expected to be taken for the purposes of measuring and recognizing tax liabilities in the financial statements. Recognition of tax benefits of an uncertain tax position is required only when the position is “more likely than not” to be sustained assuming examination by taxing
Notes to Financial Statements
| 2. | SIGNIFICANT ACCOUNTING POLICIES (continued) |
Federal Taxes (continued)
authorities. At December 31, 2009, the Series has recorded no liability for net unrecognized tax benefits relating to uncertain income tax positions taken or expected to be taken in future tax returns.
The Series files income tax returns in the U.S. federal jurisdiction, various states and foreign jurisdictions, as required. No income tax returns are currently under investigation. The statute of limitations on the Series’ tax returns remains open for the years ended December 31, 2006 through December 31, 2009. The Fund is not aware of any tax positions for which it is reasonably possible that the total amounts of unrecognized tax benefits will significantly change in the next twelve months.
Additionally, based on the Fund’s understanding of the tax rules and rates related to income, gains and transactions for foreign jurisdictions in which it invests, the Series will provide for foreign taxes, and where appropriate, deferred foreign tax.
Distributions of Income and Gains
Distributions to shareholders of net investment income and net realized gains are made annually. An additional distribution may be necessary to avoid taxation of the Series. Distributions are recorded on the ex-dividend date.
Indemnifications
The Fund’s organizational documents provide former and current directors and officers with a limited indemnification against liabilities arising in connection with the performance of their duties to the Fund. In the normal course of business, the Fund may also enter into contracts that provide general indemnifications. The Fund’s maximum exposure under these arrangements is unknown as this would be dependent on future claims that may be made against the Fund. The risk of material loss from such claims is considered remote.
Other
The preparation of financial statements in conformity with accounting principles generally accepted in the United States of America requires management to make estimates and assumptions that affect the reported amounts of assets and liabilities and the disclosure of contingent assets and liabilities at the date of the financial statements and the reported amounts of income and expenses during the reporting period. Actual results could differ from those estimates.
| 3. | TRANSACTIONS WITH AFFILIATES |
The Fund has an Investment Advisory Agreement (the “Agreement”) with the Advisor, for which the Series pays a fee, computed daily and payable monthly, at an annual rate of 1.00% of the Series’ average daily net assets.
Under the Agreement, personnel of the Advisor provide the Series with advice and assistance in the choice of investments and the execution of securities transactions, and otherwise maintain the Series’ organization. The Advisor also provides the Fund with necessary office space and fund administration and support services. The salaries of all officers of the Fund (except a percentage of the Fund’s Chief Compliance Officer’s salary, which is paid by the Fund), and of all Directors who are “affiliated persons” of the Fund, or of the Advisor, and all personnel of the Fund, or of the Advisor, performing services relating to research, statistical and investment activities, are paid by the Advisor. Each “non-affiliated” Director receives an annual stipend, which is allocated among all the active series of the Fund. In addition, these Directors also receive a fee per Board meeting attended for each active series of the Fund plus a fee for each committee meeting attended.
Notes to Financial Statements
| 3. | TRANSACTIONS WITH AFFILIATES (continued) |
Manning & Napier Investor Services, Inc., a registered broker-dealer affiliate of the Advisor, acts as distributor for the Fund’s shares. The services of Manning & Napier Investor Services, Inc. are provided at no additional cost to the Series.
For fund accounting and transfer agent services through November 7, 2009, the Fund paid the Advisor an annual fee of 0.055% of the Fund’s average daily net assets up to $4.5 billion, 0.03% of the Fund’s average daily net assets between $4.5 billion and $7.5 billion, and 0.02% of the Fund’s average daily net assets over $7.5 billion. Additionally, certain transaction and account-based fees and out-of-pocket expenses, including charges for reporting relating to the Fund’s compliance program, were charged. Expenses not directly attributable to a Series are allocated based on each Series’ relative net assets or number of accounts, depending on the expense. Prior to October 12, 2009 (for sub-accountant) and November 9, 2009 (for sub-transfer agent), the Advisor had an agreement with Citi Fund Services Ohio, Inc. (“Citi”) under which Citi served as sub-accountant and sub-transfer agent. The Advisor voluntarily agreed to waive a portion of the fund accounting and transfer agent fees and the Chief Compliance Officer service fees for the period March 1, 2009 to April 30, 2009. Accordingly, the Advisor waived fees of $28,421, which is included as a reduction of expenses on the Statement of Operations.
The Advisor has entered into agreements dated October 12, 2009 and November 9, 2009 with PNC Global Investment Servicing (U.S.) Inc. (“PNCGIS”) under which PNCGIS serves as sub-accountant services agent and sub-transfer agent, respectively. Effective November 7, 2009 under the amended master services agreement, the Fund pays the Advisor an annual fee of 0.0175% on the first $3 billion of average daily net assets (excluding Target Series); 0.015% on the next $3 billion of average daily net assets (excluding Target Series); and 0.01% of the average daily net assets in excess of $6 billion (excluding Target Series); plus a base fee of $25,500 per Series. Additionally, certain transaction-, account-, and cusip-based fees and out-of-pocket expenses, including charges for reporting relating to the Fund’s compliance program, are charged.
| 4. | PURCHASES AND SALES OF SECURITIES |
For the six months ended December 31, 2009, purchases and sales of securities, other than United States Government securities and short-term securities, were $3,546,961,614 and $1,045,540,097, respectively. There were no purchases or sales of United States Government securities.
| 5. | CAPITAL STOCK TRANSACTIONS |
Transactions in Class A shares of World Opportunities Series were:
| | | | | | | | | | | | | | |
| | | For the Year
Ended 12/31/09 | | | For the Year
Ended 12/31/08 | |
| | | Shares | | | Amount | | | Shares | | | Amount | |
| | | | | | | | | | | | | | |
Sold | | 473,021,745 | | | $ | 3,314,846,649 | | | 205,450,755 | | | $ | 1,542,940,375 | |
Reinvested | | 2,714,538 | | | | 21,626,348 | | | 3,218,909 | | | | 24,925,839 | |
Repurchased | | (98,321,062 | ) | | | (637,044,868 | ) | | (64,232,889 | ) | | | (461,602,963 | ) |
| | | | | | | | | | | | | | |
Total | | 377,415,221 | | | $ | 2,699,428,129 | | | 144,436,775 | | | $ | 1,106,263,251 | |
| | | | | | | | | | | | | | |
Notes to Financial Statements
| 5. | CAPITAL STOCK TRANSACTIONS (continued) |
Approximately 4% of the Series’ shares represent investments by fiduciary accounts over which the Advisor has sole investment discretion.
The Series may trade in instruments including written and purchased options, forward foreign currency exchange contracts and futures contracts and other derivatives in the normal course of investing activities to assist in managing exposure to various market risks. The Series may be subject to various elements of risk and may involve, to a varying degree, elements of risk in excess of the amounts recognized for financial statement purposes; the risk that changes in the value of a derivative may not correlate perfectly with the underlying asset, rate or index; counterparty credit risk related to over the counter derivatives counterparties failure to perform under contract terms; liquidity risk related to the lack of a liquid market for these contracts allowing the fund to close out its position(s); and documentation risk relating to disagreement over contract terms. No such investments were held by the Series during the year ended December 31, 2009.
Investing in securities of foreign companies and foreign governments involves special risks and considerations not typically associated with investing in securities of domestic companies and the U.S. Government. These risks include revaluation of currencies and future adverse political and economic developments. Moreover, securities of foreign companies and foreign governments and their markets may be less liquid and their prices more volatile than those of comparable domestic companies and the U.S. Government.
| 8. | FEDERAL INCOME TAX INFORMATION |
The amount and characterization of certain income and capital gains to be distributed are determined in accordance with federal income tax regulations, which may differ from accounting principles generally accepted in the United States of America. These differences are primarily due to differing book and tax treatments in the timing of the recognition of net investment income or gains and losses, including losses deferred due to wash sales, foreign currency gains and losses and Post-October losses. The Series may periodically make reclassifications among its capital accounts to reflect income and gains available for distribution (or available capital loss carryovers) under income tax regulations without impacting the Series’ net asset value. Any such reclassifications are not reflected in the financial highlights.
The tax character of distributions paid were as follows:
| | | | | | |
| | | For the Year
Ended 12/31/09 | | For the Year
Ended 12/31/08 |
Ordinary income | | $ | 30,333,272 | | $ | 9,943,598 |
Long-term capital gains | | | — | | | 20,738,477 |
Notes to Financial Statements
| 8. | FEDERAL INCOME TAX INFORMATION (continued) |
At December 31, 2009, the tax basis components of distributable earnings and the net unrealized appreciation based on identified cost for federal income tax purposes were as follows:
| | | | |
Cost for federal income tax purposes | | $ | 4,596,822,188 | |
Unrealized appreciation | | $ | 521,364,571 | |
Unrealized depreciation | | | (216,590,196 | ) |
| | | | |
Net unrealized appreciation | | $ | 304,774,375 | |
| | | | |
Undistributed ordinary income | | | 32,965,934 | |
On February 2, 2010, The PNC Financial Services Group, Inc. (“PNC”), which serves as the Series’ sub-accountant services agent and sub-transfer agent, entered into a Stock Purchase Agreement (the “Stock Purchase Agreement”) with The Bank of NewYork Mellon Corporation (“BNY Mellon”), the Series’ custodian. Upon the terms and subject to the conditions set forth in the Stock Purchase Agreement, which has been approved by the board of directors of each company, PNC will sell to BNY Mellon (the “Stock Sale”) 100% of the issued and outstanding shares of PNC Global Investment Servicing Inc., an indirect, wholly-owned subsidiary of PNC. The Stock Sale is expected to close in the third quarter of 2010. Management has concluded that this will not have a material impact on the Series’ financial statements.
There were no other subsequent events that require recognition or disclosure. In preparing these financial statements, management of the Fund has evaluated events and transactions for potential recognition or disclosure through February 23, 2010, the date the financial statements were issued.
Report of Independent Registered Public Accounting Firm
To the Board of Directors of Manning & Napier Fund, Inc. and Shareholders of World Opportunities Series:
In our opinion, the accompanying statement of assets and liabilities, including the investment portfolio, and the related statements of operations and of changes in net assets and the financial highlights present fairly, in all material respects, the financial position of the World Opportunities Series (a series of Manning & Napier Fund, Inc., hereafter referred to as the “Series”) at December 31, 2009, and the results of its operations for the year then ended, the changes in its net assets for each of the two years in the period then ended and the financial highlights for each of the five years in the period then ended, in conformity with accounting principles generally accepted in the United States of America. These financial statements and financial highlights (hereafter referred to as “financial statements”) are the responsibility of the Series’ management; our responsibility is to express an opinion on these financial statements based on our audits. We conducted our audits of these financial statements in accordance with the standards of the Public Company Accounting Oversight Board (United States). Those standards require that we plan and perform the audit to obtain reasonable assurance about whether the financial statements are free of material misstatement. An audit includes examining, on a test basis, evidence supporting the amounts and disclosures in the financial statements, assessing the accounting principles used and significant estimates made by management, and evaluating the overall financial statement presentation. We believe that our audits, which included confirmation of securities at December 31, 2009 by correspondence with the custodian and brokers, provide a reasonable basis for our opinion.

Columbus, Ohio
February 23, 2010
Supplemental Tax Information (unaudited)
All designations are based on financial information available as of the date of this annual report and, accordingly are subject to change.
For federal income tax purposes, the Series designates for the current fiscal year $28,616,618 or, if different, the maximum amount allowable under the tax law as qualified dividend income.
Renewal of Investment Advisory Agreement (unaudited)
At the Manning & Napier Fund, Inc. (the “Fund”) Board of Directors’ (the “Board”) meeting, held on December 7, 2009, the Investment Advisory Agreement (the “Agreement”) between the Fund and Manning & Napier Advisors, Inc. (the “Advisor”) was reviewed by the Board for renewal. In connection with the decision whether to renew the Agreement, a variety of material was prepared for and reviewed by the Board.
Representatives of the Advisor attended the meeting and presented additional oral and written information to the Board to assist the Board in its considerations. The discussion immediately below outlines the materials and information presented to the Board in connection with the Board’s 2009 Annual Review of the Agreement and the conclusions made by the Directors when determining to continue the Agreement.
| | • | | The Board considered the services provided by the Advisor under the Agreement including, among others: deciding what securities to purchase and sell for each Series; arranging for the purchase and sale of such securities by placing orders with broker-dealers; administering the affairs of the Fund (including the books and records of the Fund not maintained by third party service providers such as the custodian or sub-transfer agent); arranging for the insurance coverage for the Fund; and supervising the preparation of tax returns, SEC filings (including registration statements) and reports to shareholders for the Fund. The Board also considered the nature and quality of such services provided under the Agreement in light of the Advisor’s services provided to the Fund for 23 years. The Board discussed the quality of these services with representatives from the Advisor and concluded that the Advisor was performing its services to the Fund required under the Agreement in a reasonable manner. |
| | • | | The Board considered the investment performance of the various Series of the Fund. The investment performance for each Series was reviewed on a cumulative basis since inception and on a one year basis. In addition, annualized performance for the following time periods was considered: inception, three year, five year, ten year, and current market cycle. A market cycle includes periods of both rising and falling markets. Returns for established benchmark indices for each Series were provided for each time period. The Board noted that the various Series were competitive against their respective benchmarks and/or peer groups over various time periods, but in particular over the full market cycle periods relevant for the Series. In addition, the Board considered at the meeting (and considers on a quarterly basis) a peer group performance analysis consisting of Morningstar universes of mutual funds with similar investment objectives. The Board discussed the performance with representatives from the Advisor and concluded that the investment performance of each of the Fund’s Series was reasonable based on the Fund’s actual performance and comparative performance, especially performance over the current market cycle. |
| | • | | The Board considered the costs of the Advisor’s services and the profits of the Advisor as they relate to the Advisor’s services to the Fund under the Agreement. In reviewing the Advisor’s costs and profits, the Board discussed the Advisor’s revenues generated from the Fund (on both an actual and adjusted basis) and its expenses associated with providing the services under the Agreement. In addition, the Board reviewed the Advisor’s expenses associated with Fund activities outside of the Agreement (such as expense reimbursements pursuant to expense caps and payments made by the Advisor to third party platforms on which shares of the Fund are available for purchase). It was noted by representatives of the Advisor that 13 of the 26 active Series of the Fund are currently experiencing expenses above the capped expense ratios. After discussing the above costs and profits, the Board concluded that the Advisor’s profitability relating to its services provided under the Agreement was reasonable. |
Renewal of Investment Advisory Agreement (unaudited)
| | • | | The Board considered the fees and expenses of the various Series of the Fund. The Advisor presented the advisory fees and total expenses for each Series, including the advisory fee adjusted for any expense waivers or reimbursements (either contractual or voluntary) paid by the Advisor. The advisory fees and expense ratios of each Series were compared to an average (on both a mean and median basis) of similar funds as disclosed on the Morningstar database. Representatives of the Advisor discussed with the Board the levels of its advisory fee for each Series of the Fund and as compared to the median and mean advisory fees for similar funds as listed on Morningstar. Expense ratios for every Series, except the Global Fixed Income Series and the Target Series Class R and Class C, are currently below the median and mean for similar funds as listed on Morningstar. Based on their review of the information provided, the Board concluded that the fees and expenses of each Series of the Fund were reasonable on a comparative basis. |
| | • | | The Board also considered the other benefits the Advisor derives from its relationship with the Fund. Such other benefits include certain research products provided by soft dollars. Given the level of soft dollar transactions involving the Fund, the Board concluded that these additional benefits to the Advisor were reasonable. |
| | • | | In addition to the factors described above, the Board considered the Advisor’s personnel, investment strategies, policies and procedures relating to compliance with personal securities transactions, and reputation, expertise and resources in domestic and foreign financial markets. The Board concluded that these factors support the conclusion that the Advisor performs its services in a reasonable manner. |
| | • | | The Board did not consider economies of scale at this time because of the multiple uses of the Fund (for the Advisor’s discretionary investment account clients in addition to direct investors), the current profitability of the Advisor’s services to the Fund under the Agreement, and the overall size of the Fund complex. |
Based on the Board’s deliberations and their evaluation of the information described above, the Board, including a majority of Directors that are not “interested persons” as defined in the Investment Company Act of 1940, concluded that the compensation under the Agreement was fair and reasonable in light of the services and expenses and such other matters as the Directors considered to be relevant in the exercise of their reasonable judgment. Accordingly, the Board approved the renewal of the Agreement. In the course of their deliberations, the Directors did not identify any particular information that was all important or controlling.
Directors’ and Officers’ Information (unaudited)
The Statement of Additional Information provides additional information about the Fund’s directors and officers and can be obtained without charge by calling 1-800-466-3863, at www.manningnapieradvisors.com, or on the EDGAR Database on the SEC Internet web site (http:// www.sec.gov). The following chart shows certain information about the Fund’s officers and directors, including their principal occupations during the last five years. Unless specific dates are provided, the individuals have held the listed positions for longer than five years.
INTERESTED DIRECTOR/OFFICER
| | |
| Name: | | B. Reuben Auspitz* |
| Address: | | 290 Woodcliff Drive |
| | Fairport, NY 14450 |
| Age: | | 62 |
| Current Position(s) Held with Fund: | | Principal Executive Officer, President, Chairman & Director |
| Term of Office1 & Length of Time Served: | | Indefinite - Director since 1984; Vice President 1984 - 2003; |
| | President since 2004; Principal Executive Officer since 2002 |
| Principal Occupation(s) During Past 5 Years: | | Executive Vice President; Co-Executive Director; Executive Group |
| | Member**; Chief Compliance Officer since 2004 - Manning & |
| | Napier Advisors, Inc. President; Director - Manning & Napier |
| | Investor Services, Inc. Holds or has held one or more of the |
| | following titles for various subsidiaries and affiliates: President, Vice |
| | President, Director, Chairman, Treasurer, Chief Compliance Officer |
| | or Member. |
| Number of Portfolios Overseen within Fund Complex: | | 29 |
| Other Directorships Held Outside Fund Complex: | | N/A |
| |
| INDEPENDENT DIRECTORS | | |
| |
| Name: | | Stephen B. Ashley |
| Address: | | 290 Woodcliff Drive |
| | Fairport, NY 14450 |
| Age: | | 69 |
| Current Position(s) Held with Fund: | | Director, Audit Committee Member, Governance & Nominating |
| | Committee Member |
| Term of Office & Length of Time Served: | | Indefinite - Since 1996 |
| Principal Occupation(s) During Past 5 Years: | | Chairman, Director, President & Chief Executive Officer, The Ashley |
| | Group (property management and investment). Chairman |
| | (non-executive) 2004 - 2008; Director 1995 - 2008 - Fannie Mae |
| | (mortgage) |
| Number of Portfolios Overseen within Fund Complex: | | 29 |
| Other Directorships Held Outside Fund Complex: | | The Ashley Group |
| Name: | | Peter L. Faber |
| Address: | | 290 Woodcliff Drive |
| | Fairport, NY 14450 |
| Age: | | 71 |
| Current Position(s) Held with Fund: | | Director, Governance & Nominating Committee Member |
| Term of Office & Length of Time Served: | | Indefinite - Since 1987 |
| Principal Occupation(s) During Past 5 Years: | | Senior Counsel since 2006, Partner (1995-2006) - McDermott, Will |
| | & Emery LLP (law firm) |
| Number of Portfolios Overseen within Fund Complex: | | 29 |
| Other Directorships Held Outside Fund Complex: | | Partnership for New York City, Inc. (non-profit) New York Collegium (non-profit) Boston Early Music Festival (non-profit) Amherst Early Music, Inc. (non-profit) Gotham Early Music Scene, Inc. (non-profit) |
Directors’ and Officers’ Information (unaudited)
| | |
| |
| INDEPENDENT DIRECTORS (continued) | | |
| |
| Name: | | Harris H. Rusitzky |
| Address: | | 290 Woodcliff Drive |
| | Fairport, NY 14450 |
| Age: | | 75 |
| Current Position(s) Held with Fund: | | Director, Audit Committee Member, Governance & Nominating |
| | Committee Member |
| Term of Office & Length of Time Served: | | Indefinite - Since 1985 |
| Principal Occupation(s) During Past 5 Years: | | President, The Greening Group (business consultants) since 1994; |
| | Partner, The Restaurant Group (restaurants) since 2006 |
| Number of Portfolios Overseen within Fund Complex: | | 29 |
| Other Directorships Held Outside Fund Complex: | | N/A |
| Name: | | Paul A. Brooke |
| Address: | | 290 Woodcliff Drive |
| | Fairport, NY 14450 |
| Age: | | 64 |
| Current Position(s) Held with Fund: | | Director, Audit Committee Member, Governance & Nominating |
| | Committee Member |
| Term of Office & Length of Time Served: | | Indefinite - Since 2007 |
| Principal Occupation(s) During Past 5 Years: | | Chairman & CEO, Alsius Corp. (investments); Managing Member, |
| | PMSV Holdings LLC (investments) |
| Number of Portfolios Overseen within Fund Complex: | | 29 |
| Other Directorships Held Outside Fund Complex: | | Incyte Corp. |
| | ViroPharma, Inc. |
| | WebMD |
| | Cheyne Capital International |
| | MPM Bio-equities |
| | GMP Companies |
| | | HoustonPharma |
| Name: | | Richard M. Hurwitz |
| Address: | | 290 Woodcliff Drive |
| | Fairport, NY 14450 |
| Age: | | 46 |
| Current Position(s) Held with Fund: | | Director, Audit Committee Member, Governance & Nominating |
| | Committee Member |
| Term of Office & Length of Time Served: | | Indefinite - Since 2009 |
| Principal Occupation(s) During Past 5 Years: | | Managing Partner, Aegis Investment Partners, LLC (investments) |
| | since 2006; Founder and Managing Partner (2004-2005) - Village |
| | Markets, LLC (groceries) |
| Number of Portfolios Overseen within Fund Complex: | | 29 |
| Other Directorships Held Outside Fund Complex: | | Pictometry International Corp. |
Directors’ and Officers’ Information (unaudited)
| | |
| |
| OFFICERS | | |
| |
| Name: | | Jeffrey S. Coons, Ph.D., CFA |
| Address: | | 290 Woodcliff Drive |
| | Fairport, NY 14450 |
| Age: | | 46 |
| Current Position(s) Held with Fund: | | Vice President |
| Term of Office1 & Length of Time Served: | | Since 2004 |
| Principal Occupation(s) During Past 5 Years: | | Co-Director of Research since 2002 & Executive Group Member** |
| | since 2003, Manning & Napier Advisors, Inc. Holds one or more of |
| | the following titles for various subsidiaries and affiliates: President, |
| | Director, Treasurer or Senior Trust Officer. |
| Number of Portfolios Overseen within Fund Complex: | | 29 |
| Other Directorships Held Outside Fund Complex: | | N/A |
| Name: | | Christine Glavin |
| Address: | | 290 Woodcliff Drive |
| | Fairport, NY 14450 |
| Age: | | 43 |
| Current Position(s) Held with Fund: | | Principal Financial Officer, Chief Financial Officer |
| Term of Office1 & Length of Time Served: | | Principal Financial Officer since 2002; Chief Financial Officer since |
| | 2001 |
| Principal Occupation(s) During Past 5 Years: | | Fund Reporting Manager, Manning & Napier Advisors, Inc. since |
| | 1997 |
| Number of Portfolios Overseen within Fund Complex: | | 29 |
| Other Directorships Held Outside Fund Complex: | | N/A |
| Name: | | Jodi L. Hedberg |
| Address: | | 290 Woodcliff Drive |
| | Fairport, NY 14450 |
| Age: | | 42 |
| Current Position(s) Held with Fund: | | Corporate Secretary, Chief Compliance Officer, Anti-Money |
| | Laundering Compliance Officer |
| Term of Office1 & Length of Time Served: | | Corporate Secretary since 1997; Chief Compliance Officer since |
| | 2004 |
| Principal Occupation(s) During Past 5 Years: | | Director of Compliance, Manning & Napier Advisors, Inc. and |
| | affiliates since 1990 (title change in 2005 from Compliance Manager |
| | to Director of Compliance); Corporate Secretary, Manning & Napier |
| | Investor Services, Inc. since 2006 |
| Number of Portfolios Overseen within Fund Complex: | | 29 |
| Other Directorships Held Outside Fund Complex: | | N/A |
*Interested Director, within the meaning of the Investment Company Act of 1940 by reason of his position with the Fund’s investment advisor and distributor. Mr. Auspitz serves as the Executive Vice President and Director, Manning & Napier Advisors, Inc. and President and Director, Manning & Napier Investor Services, Inc., the Fund’s distributor.
**The Executive Group performs the duties of the Office of the Chief Executive of Manning & Napier Advisors, Inc.
1The term of office for President, Vice President, Chief Financial Officer, and Corporate Secretary is one year and until their respective successors are chosen and qualified. All other officers’ terms are indefinite.
Literature Requests (unaudited)
Proxy Voting Policies and Procedures
A description of the policies and procedures that the Fund uses to determine how to vote proxies relating to portfolio securities is available, without charge, upon request:
| | |
By phone | | 1-800-466-3863 |
On the Securities and Exchange Commission’s (SEC) web site | | http://www.sec.gov |
Proxy Voting Record
Information regarding how the Fund voted proxies relating to portfolio securities during the most recent 12-month period ended June 30th is available, without charge, upon request:
| | |
By phone | | 1-800-466-3863 |
On the SEC’s web site | | http://www.sec.gov |
Quarterly Portfolio Holdings
The Series’ complete schedule of portfolio holdings for the 1st and 3rd quarters of each fiscal year are provided on Form N-Q, and are available, without charge, upon request:
| | |
By phone | | 1-800-466-3863 |
On the SEC’s web site | | http://www.sec.gov |
The Series’ Form N-Q may be reviewed and copied at the SEC’s Public Reference Room in Washington, D.C. Information on the operation of the Public Reference Room may be obtained by calling 1-800-SEC-0330.
Prospectus and Statement of Additional Information (SAI)
The prospectus and SAI provide additional information about each Series, including charges, expenses and risks. These documents are available, without charge, upon request:
| | |
By phone | | 1-800-466-3863 |
On the SEC’s web site | | http://www.sec.gov |
On the Advisor’s web site | | http://www.manningnapieradvisors.com |
Additional information available at www.manningnapieradvisors.com
1. Fund Holdings - Month-End
2. Fund Holdings - Quarter-End
3. Shareholder Report - Annual
4. Shareholder Report - Semi-Annual


Management Discussion and Analysis (unaudited)

Dear Shareholders:
Fixed income returns varied greatly in 2009 across market sectors and quality ratings. As 2009 unfolded, the credit crisis maintained a strong hold on the markets, with short-term securities and U.S. Treasuries representing the only safe havens in global markets. Following stock market lows in late March 2009, investor sentiment shifted to modest optimism, and lower quality securities, both stocks and bonds, rallied strongly.
Overall, municipal securities posted strong returns during 2009, with lower quality and longer maturity issues faring the best. The Bank of America (BofA) Merrill Lynch 1-12 Year Municipal Bond Index (formerly a Merrill Lynch Index) earned a strong 7.18% during the year. The 13.09% return of the Ohio Tax Exempt Series during 2009 dramatically outpaced that of its benchmark.
A unique aspect of the municipal bond market in 2009 was the general supply/demand imbalance that developed. As credit crisis fears abated in mid-2009, investors began to predict that government stimulus would provide help to state and local municipalities. This led to a strong revival in demand for municipal securities relative to weak demand during 2008’s recession and credit crunch. However, this demand was met with less supply as issuers chose to forego traditional tax-exempt issuance in favor of the Build America Bond subsidy program offered by the federal government. This supply/demand imbalance created a generally falling yield environment for municipal bonds throughout most of 2009. Because falling yields lead to higher bond prices, this situation benefited the Series’ return.
The Series’ intermediate-to-long-term maturity focus contributed to strong returns during most of the year as yields on municipal bonds generally fell. The Series also maintained a generally high quality bias, with the underlying credit rating of all issues in the Series being rated investment grade or higher, and only a small percentage rated below A. This quality bias likely detracted from returns in the second half of the year as lower quality securities outperformed, but the longer-term orientation of the portfolio more than offset this drag on returns.
As the global recovery continues to unfold, it will be important to monitor changes in factors such as state and local budgets, monetary policy, inflation expectations and other cyclical or secular trends. We will continue to employ an active approach to fixed income, considering maturity, quality and issue selections as key tools for seeking out return potential and managing risk over full bond market cycles.
As always, we appreciate your business.
Sincerely,
Manning & Napier Advisors, Inc.
Performance Update as of December 31, 2009 (unaudited)
| | | | | | | | | | |
| | | Average Annual Total Returns
As of December 31, 2009 | | |
| | | One
Year | | Five
Year | | Ten
Year | | Since
Inception1 | | |
Manning & Napier Fund, Inc. - Ohio Tax Exempt Series2 | | 13.09% | | 4.02% | | 5.19% | | 4.55% | | |
Bank of America (BofA) Merrill Lynch 1-12 Year Municipal Bond Index3 | | 7.18% | | 4.47% | | 5.56% | | 5.28% | | |
The following graph compares the value of a $10,000 investment in the Manning & Napier Fund, Inc. - Ohio Tax Exempt Series for the ten years ended December 31, 2009 to the BofA Merrill Lynch 1-12 Year Municipal Bond Index.
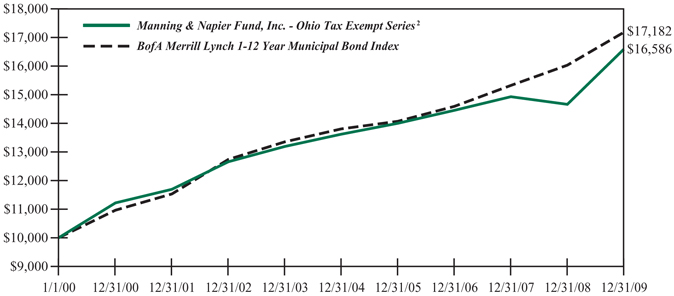
1Performance numbers for the Series and Index are calculated from February 14, 1994, the Series’ inception date.
2The Series’ performance does not reflect the deduction of taxes that a shareholder would pay on fund distributions or the redemption of shares. The Series’ performance is historical and may not be indicative of future results. The performance returns shown are inclusive of the net expense ratio of the Series. For the year ended December 31, 2009, this net expense ratio was 0.85%. The gross expense ratio, which does not account for any voluntary or contractual waivers currently in effect, was 0.88% for the year ended December 31, 2009.
3The BofA Merrill Lynch 1-12 Year Municipal Bond Index (formerly a Merrill Lynch Index) is an unmanaged, market weighted index comprised of investment-grade, fixed rate, coupon bearing municipal bonds with maturities greater than one year but less than twelve years. The Index returns assume reinvestment of coupons and, unlike Series returns, do not reflect any fees or expenses.
Shareholder Expense Example (unaudited)
As a shareholder of the Series, you may incur two types of costs: (1) transaction costs, including potential wire charges on redemptions and (2) ongoing costs, including management fees and other Series expenses. This example is intended to help you understand your ongoing costs (in dollars) of investing in the Series and to compare these costs with the ongoing costs of investing in other mutual funds.
The example is based on an investment of $1,000 invested at the beginning of the period and held for the entire period (July 1, 2009 to December 31, 2009).
Actual Expenses
The first line of the table below provides information about actual account values and actual expenses. You may use the information in this line, together with the amount you invested, to estimate the expenses that you paid over the period. Simply divide your account value by $1,000 (for example, an $8,600 account value divided by $1,000 = 8.6), then multiply the result by the number in the first line under the heading entitled “Expenses Paid During Period” to estimate the expenses you paid on your account during this period.
Hypothetical Example for Comparison Purposes
The second line of the table below provides information about hypothetical account values and hypothetical expenses based on the Series’ actual expense ratio and an assumed rate of return of 5% per year before expenses, which is not the Series’ actual return. The hypothetical account values and expenses may not be used to estimate the actual ending account balance or expenses you paid during the period. You may use this information to compare the ongoing costs of investing in the Series and other funds. To do so, compare this 5% hypothetical example with the 5% hypothetical examples that appear in the shareholder reports of the other funds.
Please note that the expenses shown in the table are meant to highlight your ongoing costs only and do not reflect any transaction costs, such as potential wire charges on redemptions. Therefore, the second line of the table is useful in comparing ongoing costs only, and will not help you determine the relative total costs of owning different funds. In addition, if these transaction costs were included, your costs would have been higher.
| | | | | | | | | |
| | | Beginning
Account Value
7/1/09 | | Ending
Account Value
12/31/09 | | Expenses Paid
During Period*
7/1/09-12/31/09 |
Actual | | $ | 1,000.00 | | $ | 1,058.30 | | $ | 4.41 |
Hypothetical
(5% return before expenses) | | $ | 1,000.00 | | $ | 1,020.92 | | $ | 4.33 |
*Expenses are equal to the Series’ annualized expense ratio (for the six-month period) of 0.85%, multiplied by the average account value over the period, multiplied by 184/365 (to reflect the one-half year period). Expenses are based on the most recent fiscal half year; therefore, the expense ratio stated above may differ from the expense ratio stated in the financial highlights, which is based on one-year data. The Series’ total return would have been lower had certain expenses not been waived during the period.
Portfolio Composition as of December 31, 2009 (unaudited)
Sector Allocation1
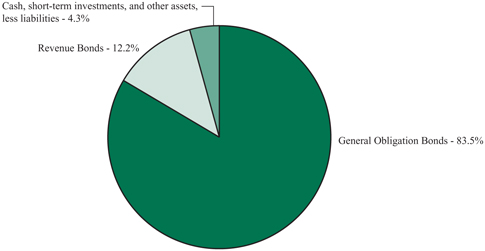
1As a percentage of net assets.
Credit Quality Ratings2,3

2As a percentage of net assets.
3Based on ratings from Moody’s, or the S&P equivalent. The Series may use different ratings provided by other rating agencies for purposes of determining compliance with the Series’ investment policies.
Investment Portfolio - December 31, 2009
| | | | | | | | | | | | | | |
| | | Coupon
Rate | | | Maturity
Date | | Credit
Rating1
(unaudited) | | | Principal
Amount | | Value
(Note 2) |
| | | | | | | | | | | | | | |
| | |
OHIO MUNICIPAL SECURITIES - 95.7% | | | | | | | |
Akron, Various Purposes, G.O. Bond | | 4.250 | % | | 12/1/2028 | | AA | 2 | | $ | 200,000 | | $ | 193,176 |
American Municipal Power-Ohio, Inc., Prairie State Energy Campus Project, Series A, Revenue Bond | | 5.250 | % | | 2/15/2023 | | A1 | | | | 150,000 | | | 161,808 |
Bedford Heights, Series A, G.O. Bond, AMBAC | | 5.650 | % | | 12/1/2014 | | A2 | | | | 25,000 | | | 27,346 |
Big Walnut Local School District, Delaware County, School Facilities Construction & Impt., G.O. Bond, AGM | | 4.500 | % | | 12/1/2029 | | Aa3 | | | | 200,000 | | | 202,456 |
Brunswick Ohio Limited Tax, Capital Impt., G.O. Bond | | 4.000 | % | | 12/1/2025 | | Aa3 | | | | 100,000 | | | 96,812 |
Canal Winchester Local School District, G.O. Bond, AGM | | 4.250 | % | | 12/1/2027 | | Aa3 | | | | 500,000 | | | 491,365 |
Canal Winchester Local School District, Prerefunded Balance, Series B, G.O. Bond, NATL | | 5.000 | % | | 12/1/2025 | | A3 | | | | 355,000 | | | 411,047 |
Cincinnati Water Systems, Series B, Revenue Bond, NATL | | 5.000 | % | | 12/1/2023 | | Aa2 | | | | 600,000 | | | 655,950 |
Cleveland Heights & University Heights City School District, Library Impt., G.O. Bond | | 5.125 | % | | 12/1/2026 | | Aa3 | | | | 200,000 | | | 207,772 |
Cleveland, Income Tax, Revenue Bond | | 5.250 | % | | 5/15/2024 | | AA | 2 | | | 500,000 | | | 545,560 |
Columbus City School District, School Facilities Construction & Impt., G.O. Bond | | 4.500 | % | | 12/1/2029 | | Aa3 | | | | 500,000 | | | 504,570 |
Columbus City School District, School Facilities Construction & Impt., G.O. Bond, AGM | | 4.250 | % | | 12/1/2032 | | Aa3 | | | | 500,000 | | | 471,300 |
Columbus, Limited Tax, Series 2, G.O. Bond | | 5.000 | % | | 7/1/2017 | | Aaa | | | | 250,000 | | | 284,745 |
Columbus, Sewer Impt., Series A, Revenue Bond | | 4.250 | % | | 6/1/2030 | | Aa2 | | | | 250,000 | | | 248,878 |
Cuyahoga Falls, G.O. Bond, NATL | | 5.000 | % | | 12/1/2021 | | Aa3 | | | | 750,000 | | | 806,505 |
Eaton Community City Schools, School Impt., G.O. Bond, FGRNA | | 4.125 | % | | 12/1/2026 | | A1 | | | | 500,000 | | | 482,830 |
Euclid, G.O. Bond, NATL | | 4.250 | % | | 12/1/2023 | | A1 | | | | 465,000 | | | 474,123 |
Fairbanks Local School District, School Facilities Construction & Impt., G.O. Bond, AGM | | 4.500 | % | | 12/1/2028 | | Aa3 | | | | 400,000 | | | 401,756 |
Fairfield County, Building Impt., G.O. Bond | | 5.000 | % | | 12/1/2018 | | Aa3 | | | | 250,000 | | | 265,060 |
Fairview Park City School District, School Impt., G.O. Bond, NATL | | 5.000 | % | | 12/1/2029 | | A2 | | | | 315,000 | | | 322,028 |
Franklin County, Various Purposes, G.O. Bond | | 5.000 | % | | 12/1/2027 | | Aaa | | | | 500,000 | | | 548,195 |
Geneva Area City School District, School Impt., G.O. Bond, NATL | | 4.500 | % | | 12/1/2030 | | A2 | | | | 120,000 | | | 121,327 |
Granville Exempt Village School District, G.O. Bond, AGM | | 4.375 | % | | 12/1/2031 | | Aa2 | | | | 500,000 | | | 500,890 |
| | |
| The accompanying notes are an integral part of the financial statements. | | 5 |
Investment Portfolio - December 31, 2009
| | | | | | | | | | | | | | |
| | | Coupon
Rate | | | Maturity
Date | | Credit
Rating1
(unaudited) | | | Principal
Amount | | Value
(Note 2) |
| | | | | | | | | | | | | | |
| | |
OHIO MUNICIPAL SECURITIES (continued) | | | | | | | |
Greater Cleveland Regional Transit Authority, Capital Impt., G.O. Bond, FGRNA | | 4.125 | % | | 12/1/2023 | | Aa3 | | | $ | 450,000 | | $ | 445,617 |
Hamilton City School District, School Impt., G.O. Bond, AGM | | 4.250 | % | | 12/1/2030 | | Aa3 | | | | 500,000 | | | 500,050 |
Hamilton Electric System, Series A, Revenue Bond, AGC | | 4.125 | % | | 10/1/2024 | | Aa3 | | | | 300,000 | | | 298,998 |
Hamilton Waterworks System, Series A, Revenue Bond, AGC | | 4.625 | % | | 10/15/2029 | | Aa3 | | | | 100,000 | | | 100,424 |
Hancock County, Various Purposes, G.O. Bond, NATL | | 4.000 | % | | 12/1/2016 | | Aa3 | | | | 200,000 | | | 214,818 |
Harrison, Various Purposes, G.O. Bond, AGM | | 5.250 | % | | 12/1/2038 | | Aa3 | | | | 275,000 | | | 287,535 |
Huber Heights City School District, School Impt., G.O. Bond | | 5.000 | % | | 12/1/2036 | | Aa3 | | | | 450,000 | | | 464,188 |
Indian Hill Exempt Village School District, Hamilton County, School Impt., G.O. Bond | | 4.375 | % | | 12/1/2022 | | Aaa | | | | 250,000 | | | 261,685 |
Ironton City School District, G.O. Bond, NATL | | 4.250 | % | | 12/1/2028 | | Baa1 | | | | 500,000 | | | 475,000 |
Kettering City School District, School Impt., G.O. Bond, AGM | | 4.250 | % | | 12/1/2025 | | Aa3 | | | | 750,000 | | | 752,865 |
Lakewood, Water System, Revenue Bond, AMBAC | | 4.500 | % | | 7/1/2028 | | WR | 3 | | | 500,000 | | | 470,630 |
Licking Heights Local School District, School Facilities Construction & Impt., Series A, G.O. Bond, NATL | | 5.000 | % | | 12/1/2022 | | A1 | | | | 250,000 | | | 264,650 |
Lorain City School District, Classroom Facilities Impt., Unrefunded Balance, G.O. Bond, NATL | | 4.750 | % | | 12/1/2025 | | Aa3 | | | | 335,000 | | | 346,802 |
Lorain County, Sewer System Impt., G.O. Bond | | 5.000 | % | | 12/1/2039 | | Aa3 | | | | 200,000 | | | 198,762 |
Mansfield Limited Tax, Various Purposes Impt., G.O. Bond, AGC | | 5.500 | % | | 12/1/2029 | | Aa3 | | | | 100,000 | | | 101,522 |
Marysville Exempt Village School District, G.O. Bond, AGM | | 5.000 | % | | 12/1/2023 | | Aa3 | | | | 500,000 | | | 528,850 |
Marysville, Sewer & Wastewater, Revenue Bond, XLCA | | 4.750 | % | | 12/1/2046 | | Aa3 | | | | 180,000 | | | 174,598 |
Maumee City School District, School Facilities Construction & Impt., G.O. Bond, AGM | | 4.600 | % | | 12/1/2031 | | Aa3 | | | | 260,000 | | | 262,701 |
Maumee Public Impt., G.O. Bond, NATL | | 4.125 | % | | 12/1/2018 | | Aa3 | | | | 375,000 | | | 394,920 |
Muskingum County Limited Tax, Various Purposes, G.O. Bond, AGC | | 4.300 | % | | 12/1/2028 | | Aa3 | | | | 145,000 | | | 143,147 |
New Albany Plain Local School District, G.O. Bond, FGRNA | | 5.000 | % | | 12/1/2030 | | A | 2 | | | 140,000 | | | 140,911 |
New Albany Plain Local School District, Prerefunded Balance, G.O. Bond, FGIC | | 5.000 | % | | 12/1/2025 | | Aa2 | | | | 45,000 | | | 49,529 |
| | |
| 6 | | The accompanying notes are an integral part of the financial statements. |
Investment Portfolio - December 31, 2009
| | | | | | | | | | | | | | |
| | | Coupon
Rate | | | Maturity
Date | | Credit
Rating1
(unaudited) | | | Principal Amount | | Value (Note 2) |
| | | | | | | | | | | | | | |
| | | | | |
OHIO MUNICIPAL SECURITIES (continued) | | | | | | | | | | | | | | |
New Albany Plain Local School District, Prerefunded Balance, G.O. Bond, FGIC | | 5.000 | % | | 12/1/2025 | | Aa2 | | | $ | 85,000 | | $ | 93,555 |
New Albany Plain Local School District, Prerefunded Balance, G.O. Bond, FGIC | | 5.000 | % | | 12/1/2029 | | Aa2 | | | | 95,000 | | | 104,562 |
New Albany Plain Local School District, Unrefunded Balance, G.O. Bond, FGIC | | 5.000 | % | | 12/1/2025 | | Aa2 | | | | 185,000 | | | 187,009 |
New Albany Plain Local School District, Unrefunded Balance, G.O. Bond, FGRNA | | 5.000 | % | | 12/1/2029 | | Aa2 | | | | 130,000 | | | 130,788 |
North Royalton, Various Purposes, G.O. Bond | | 5.250 | % | | 12/1/2028 | | Aa3 | | | | 1,025,000 | | | 1,110,670 |
Ohio State Water Development Authority, Pollution Control, Revenue Bond | | 5.250 | % | | 12/1/2015 | | Aaa | | | | 200,000 | | | 233,676 |
Ohio State Water Development Authority, Pure Water, Series I, Revenue Bond, AMBAC | | 6.000 | % | | 12/1/2016 | | Aaa | | | | 40,000 | | | 45,498 |
Ohio State, Infrastructure Impt., Series A, G.O. Bond | | 5.000 | % | | 3/1/2017 | | Aa2 | | | | 250,000 | | | 281,908 |
Ohio State, School Services, Series A, G.O. Bond | | 4.500 | % | | 9/15/2025 | | Aa2 | | | | 700,000 | | | 713,398 |
Olentangy Local School District, Series A, G.O. Bond, AGM | | 4.500 | % | | 12/1/2032 | | Aa2 | | | | 800,000 | | | 785,488 |
Orange City School District, School Impt., G.O. Bond | | 4.500 | % | | 12/1/2023 | | Aaa | | | | 500,000 | | | 518,560 |
Painesville City School District, School Impt., G.O. Bond, FGRNA | | 4.500 | % | | 12/1/2025 | | A2 | | | | 170,000 | | | 172,390 |
Pickerington Local School District, G.O. Bond, NATL | | 4.300 | % | | 12/1/2024 | | Baa1 | | | | 300,000 | | | 301,488 |
South-Western City School District, Franklin & Pickway County, G.O. Bond, AGM | | 4.250 | % | | 12/1/2026 | | Aa3 | | | | 600,000 | | | 594,264 |
Sugarcreek Local School District, School Impt., G.O. Bond, AGM | | 4.250 | % | | 12/1/2031 | | Aa3 | | | | 750,000 | | | 704,108 |
Sylvania City School District, School Impt., G.O. Bond, AGC | | 5.000 | % | | 12/1/2025 | | Aa3 | | | | 270,000 | | | 287,188 |
Tallmadge City School District, School Facilities, G.O. Bond, AGM | | 5.000 | % | | 12/1/2031 | | AAA | 2 | | | 200,000 | | | 209,250 |
Tecumseh Local School District, School Impt., G.O. Bond, FGRNA | | 4.750 | % | | 12/1/2027 | | A3 | | | | 195,000 | | | 197,982 |
Toledo Waterworks, Revenue Bond, NATL | | 5.000 | % | | 11/15/2023 | | A2 | | | | 100,000 | | | 103,962 |
Toledo, Capital Impt., G.O. Bond, AGC | | 4.000 | % | | 12/1/2024 | | Aa3 | | | | 100,000 | | | 95,445 |
Trotwood-Madison City School District, School Impt., G.O. Bond, AGM | | 4.250 | % | | 12/1/2022 | | Aa3 | | | | 250,000 | | | 251,257 |
Troy, G.O. Bond | | 4.750 | % | | 12/1/2024 | | Aa2 | | | | 250,000 | | | 260,515 |
Van Buren Local School District, School Facilities Construction & Impt., G.O. Bond, AGM | | 5.250 | % | | 12/1/2016 | | Aa3 | | | | 300,000 | | | 323,166 |
Vandalia, G.O. Bond, AMBAC | | 5.000 | % | | 12/1/2015 | | WR | 3 | | | 235,000 | | | 257,231 |
| | |
| The accompanying notes are an integral part of the financial statements. | | 7 |
Investment Portfolio - December 31, 2009
| | | | | | | | | | | | | |
| | | Coupon
Rate | | | Maturity
Date | | Credit
Rating1
(unaudited) | | Principal
Amount/
Shares | | Value
(Note 2) |
| | | | | | | | | | | | | |
| | |
OHIO MUNICIPAL SECURITIES (continued) | | | | | | |
Washington Court House City School District, School Impt., G.O. Bond, FGRNA | | 5.000 | % | | 12/1/2029 | | A3 | | $ | 500,000 | | $ | 512,060 |
Wood County, G.O. Bond | | 5.400 | % | | 12/1/2013 | | Aa3 | | | 20,000 | | | 20,056 |
| | | | | | | | | | | | | |
TOTAL MUNICIPAL BONDS
(Identified Cost $23,349,120) | | | | | | | | | | | | | 23,799,175 |
| | | | | | | | | | | | | |
SHORT-TERM INVESTMENTS - 3.0% | | | | | | | | | | | | | |
Dreyfus AMT - Free Municipal Reserves - Class R
(Identified Cost $753,288) | | | | | | | | | | 753,288 | | | 753,288 |
| | | | | | | | | | | | | |
TOTAL INVESTMENTS - 98.7%
(Identified Cost $24,102,408) | | | | | | | | | | | | | 24,552,463 |
| | | | | |
OTHER ASSETS, LESS LIABILITIES - 1.3% | | | | | | | | | | | | | 322,604 |
| | | | | | | | | | | | | |
NET ASSETS - 100% | | | | | | | | | | | | $ | 24,875,067 |
| | | | | | | | | | | | | |
KEY:
G.O. Bond - General Obligation Bond
Impt. - Improvement
Scheduled principal and interest payments are guaranteed by:
AGC (Assured Guaranty Corp.)
AGM (Assurance Guaranty Municipal Corp.) (formerly known as FSA (Financial Security Assurance, Inc.))
AMBAC (AMBAC Assurance Corp.)
FGIC (Financial Guaranty Insurance Co.)
FGRNA (FGIC reinsured by NATL)
NATL (National Public Finance Guarantee Corp.)
XLCA (XL Capital Assurance)
The insurance does not guarantee the market value of the municipal bonds.
1Credit ratings from Moody’s (unaudited).
2Credit ratings from S&P (unaudited).
3Credit rating has been withdrawn. As of December 31, 2009, there is no rating available.
The Series’ portfolio holds, as a percentage of net assets, greater than 10% in bonds insured by the following companies: AGM - 29.2%; NATL -28.0%.
| | |
| 8 | | The accompanying notes are an integral part of the financial statements. |
Statement of Assets and Liabilities
December 31, 2009
| | | |
ASSETS: | | | |
| |
Investments, at value (identified cost $24,102,408) (Note 2) | | $ | 24,552,463 |
Receivable for fund shares sold | | | 253,159 |
Interest receivable | | | 124,364 |
Dividends receivable | | | 2 |
| | | |
TOTAL ASSETS | | | 24,929,988 |
| | | |
LIABILITIES: | | | |
| |
Accrued management fees (Note 3) | | | 10,245 |
Accrued fund accounting and transfer agent fees (Note 3) | | | 6,933 |
Accrued directors’ fees (Note 3) | | | 3,146 |
Accrued Chief Compliance Officer service fees (Note 3) | | | 476 |
Audit fees payable | | | 30,738 |
Other payables and accrued expenses | | | 3,383 |
| | | |
TOTAL LIABILITIES | | | 54,921 |
| | | |
TOTAL NET ASSETS | | $ | 24,875,067 |
| | | |
NET ASSETS CONSIST OF: | | | |
| |
Capital stock | | $ | 23,428 |
Additional paid-in-capital | | | 24,348,445 |
Undistributed net investment income | | | 53,139 |
Net unrealized appreciation on investments | | | 450,055 |
| | | |
TOTAL NET ASSETS | | $ | 24,875,067 |
| | | |
NET ASSET VALUE, OFFERING PRICE AND REDEMPTION
PRICE PER SHARE - Class A ($24,875,067/2,342,788 shares) | | $ | 10.62 |
| | | |
| | | | |
| | The accompanying notes are an integral part of the financial statements. | | 9 |
Statement of Operations
For the Year Ended December 31, 2009
| | | | |
INVESTMENT INCOME: | | | | |
| | | | |
| |
Interest | | $ | 934,287 | |
Dividends | | | 3,105 | |
| | | | |
Total Investment Income | | | 937,392 | |
| | | | |
| EXPENSES: | | | | |
| |
Management fees (Note 3) | | | 110,570 | |
Fund accounting and transfer agent fees (Note 3) | | | 25,813 | |
Directors’ fees (Note 3) | | | 12,849 | |
Chief Compliance Officer service fees (Note 3) | | | 3,729 | |
Audit fees | | | 30,602 | |
Custodian fees | | | 1,551 | |
Miscellaneous | | | 9,314 | |
| | | | |
Total Expenses | | | 194,428 | |
Less reduction of expenses (Note 3) | | | (6,763 | ) |
| | | | |
Net Expenses | | | 187,665 | |
| | | | |
NET INVESTMENT INCOME | | | 749,727 | |
| | | | |
| REALIZED AND UNREALIZED GAIN ON INVESTMENTS: | | | | |
| |
Net realized gain on investments | | | 130,404 | |
Net change in unrealized appreciation (depreciation) on investments | | | 1,786,693 | |
| | | | |
| |
NET REALIZED AND UNREALIZED GAIN ON
INVESTMENTS | | | 1,917,097 | |
| | | | |
NET INCREASE IN NET ASSETS RESULTING
FROM OPERATIONS | | $ | 2,666,824 | |
| | | | |
| | |
| 10 | | The accompanying notes are an integral part of the financial statements. |
Statements of Changes in Net Assets
| | | | | | | | |
| | | For the
Year Ended
12/31/09 | | | For the
Year Ended
12/31/08 | |
| | | | | | | | |
| INCREASE (DECREASE) IN NET ASSETS: | | | | | | | | |
| | |
| OPERATIONS: | | | | | | | | |
| | |
Net investment income | | $ | 749,727 | | | $ | 860,632 | |
Net realized gain on investments | | | 130,404 | | | | 184,021 | |
Net change in unrealized appreciation (depreciation) on investments | | | 1,786,693 | | | | (1,700,851 | ) |
| | | | | | | | |
Net increase (decrease) from operations | | | 2,666,824 | | | | (656,198 | ) |
| | | | | | | | |
DISTRIBUTIONS TO SHAREHOLDERS (Note 8): | | | | | | | | |
| | |
From net investment income | | | (774,410 | ) | | | (849,459 | ) |
From net realized gain on investments | | | (221,596 | ) | | | (119,985 | ) |
| | | | | | | | |
Total distributions to shareholders | | | (996,006 | ) | | | (969,444 | ) |
| | | | | | | | |
| CAPITAL STOCK ISSUED AND REPURCHASED: | | | | | | | | |
| | |
Net increase (decrease) from capital share transactions (Note 5) | | | 2,359,995 | | | | (3,962,597 | ) |
| | | | | | | | |
Net increase (decrease) in net assets | | | 4,030,813 | | | | (5,588,239 | ) |
| | |
| NET ASSETS: | | | | | | | | |
| | |
Beginning of year | | | 20,844,254 | | | | 26,432,493 | |
| | | | | | | | |
End of year (including undistributed net investment income of
$53,139 and $77,536, respectively) | | $ | 24,875,067 | | | $ | 20,844,254 | |
| | | | | | | | |
| | |
| The accompanying notes are an integral part of the financial statements. | | 11 |
Financial Highlights
| | | | | | | | | | |
| | | For the Years Ended |
| | | 12/31/09 | | 12/31/08 | | 12/31/07 | | 12/31/06 | | 12/31/05 |
| | | | | | | | | | |
| | | | | | | | | | |
| Per share data (for a share outstanding throughout each year): | | | | | | | | | | |
Net asset value - Beginning of year | | $9.82 | | $10.43 | | $10.46 | | $10.52 | | $10.59 |
| | | | | | | | | | |
Income (loss) from investment operations: | | | | | | | | | | |
Net investment income | | 0.361 | | 0.38 | | 0.34 | | 0.38 | | 0.38 |
Net realized and unrealized gain (loss) on investments | | 0.91 | | (0.57) | | —2 | | (0.05) | | (0.08) |
| | | | | | | | | | |
Total from investment operations | | 1.27 | | (0.19) | | 0.34 | | 0.33 | | 0.30 |
| | | | | | | | | | |
Less distributions to shareholders: | | | | | | | | | | |
From net investment income | | (0.37) | | (0.36) | | (0.37) | | (0.38) | | (0.36) |
From net realized gain on investments | | (0.10) | | (0.06) | | — | | (0.01) | | (0.01) |
| | | | | | | | | | |
Total distributions to shareholders | | (0.47) | | (0.42) | | (0.37) | | (0.39) | | (0.37) |
| | | | | | | | | | |
Net asset value - End of year | | $10.62 | | $9.82 | | $10.43 | | $10.46 | | $10.52 |
| | | | | | | | | | |
Net assets - End of year (000’s omitted) | | $24,875 | | $20,844 | | $26,432 | | $20,612 | | $15,988 |
| | | | | | | | | | |
Total return3 | | 13.09% | | (1.74%) | | 3.28% | | 3.19% | | 2.85% |
Ratios (to average net assets)/Supplemental Data: | | | | | | | | | | |
Expenses* | | 0.85% | | 0.85% | | 0.85% | | 0.85% | | 0.85% |
Net investment income | | 3.39% | | 3.58% | | 3.47% | | 3.81% | | 3.65% |
Portfolio turnover | | 11% | | 15% | | 3% | | 9% | | 9% |
|
*The investment advisor did not impose all or a portion of its management fees, CCO fees and fund accounting and transfer agent fees in some years. If these expenses had been incurred by the Series, the expense ratio (to average net assets) would have been increased by the following amount: |
| | 0.03% | | 0.01% | | 0.00%4 | | 0.07% | | 0.15% |
1Calculated based on average shares outstanding during the year.
2Less than $0.01 per share.
3Represents aggregate total return for the years indicated, and assumes reinvestment of all distributions. Total return would have been lower had certain expenses not been waived during the year.
4Less than 0.01%.
| | |
| 12 | | The accompanying notes are an integral part of the financial statements. |
Notes to Financial Statements
Ohio Tax Exempt Series (the “Series”) is a no-load diversified series of Manning & Napier Fund, Inc. (the “Fund”). The Fund is organized in Maryland and is registered under the Investment Company Act of 1940, as amended, as an open-end management investment company.
The Series’ investment objective is to provide as high a level of current income exempt from federal income tax and Ohio State personal income tax as the Advisor believes is consistent with the preservation of capital.
The Fund’s Advisor is Manning & Napier Advisors, Inc. (the “Advisor”). Shares of the Series are offered to investors, clients and employees of the Advisor and its affiliates. The total authorized capital stock of the Fund consists of 10.0 billion shares of common stock each having a par value of $0.01. As of December 31, 2009, 4.6 billion shares have been designated in total among 29 series, of which 100 million have been designated as Ohio Tax Exempt Series Class A common stock.
| 2. | SIGNIFICANT ACCOUNTING POLICIES |
Security Valuation
Municipal securities will normally be valued on the basis of market valuations provided by an independent pricing service (the “Service”). The Service utilizes the latest price quotations and a matrix system (which considers such factors as security prices of similar securities, yields, maturities and ratings). The Service has been approved by the Fund’s Board of Directors (the “Board”).
Short-term investments that mature in sixty days or less are valued at amortized cost, which approximates market value. Investments in open-end investment companies are valued at their net asset value per share on valuation date.
Volume and level of activity in established markets for an asset or liability are evaluated to determine whether recent transactions and quoted prices are determinative of fair value. Where there have been significant decreases in volume and level of activity, further analysis and adjustment may be necessary to estimate fair value. The Series measures fair value in these instances by the use of inputs and valuation techniques which may be based upon current market prices of securities that are comparable in coupon, rating, maturity and industry and/or expectation of future cash flows. As a result of trading in relatively thin markets and/or markets that experience significant volatility, the prices used by the Series to value these securities may differ from the value that would be realized if these securities were sold, and the differences could be material.
Securities for which representative valuations or prices are not available from the Fund’s pricing service may be valued at fair value. Due to the inherent uncertainty of valuations of such securities, the fair value may differ significantly from the values that would have been used had a ready market for such securities existed. If trading or events occurring after the close of the principal market in which securities are traded are expected to materially affect the value of those securities, then they may be valued at their fair value, taking this trading or these events into account. Fair value is determined in good faith by the Advisor under procedures approved by and under the general supervision and responsibility of the Board.
Various inputs are used in determining the value of the Series’ assets or liabilities carried at market value. These inputs are summarized in three broad levels. Level 1 includes quoted prices in active markets for identical assets and liabilities. Level 2 includes other significant observable inputs (including quoted prices for similar securities, interest rates, prepayment speeds, credit
Notes to Financial Statements
| 2. | SIGNIFICANT ACCOUNTING POLICIES (continued) |
Security Valuation (continued)
risk, etc.). Level 3 includes significant unobservable inputs (including the Series’ own assumptions in determining the fair value of investments). The inputs or methodology used for valuing securities are not necessarily an indication of the risk associated with investing in those securities.
The following is a summary of the valuation levels used for major security types as of December 31, 2009 in valuing the Series’ assets or liabilities carried at market value:
| | | | | | | | | | | | |
| Description: | | 12/31/09 | | Level 1 | | Level 2 | | Level 3 |
| | | | | | | | | | | | |
Equity securities* | | $ | — | | $ | — | | $ | — | | $ | — |
Preferred securities | | | — | | | — | | | — | | | — |
Debt securities: | | | | | | | | | | | | |
States and political subdivisions | | | | | | | | | | | | |
(municipals) | | | 23,799,175 | | | — | | | 23,799,175 | | | — |
Mutual funds | | | 753,288 | | | 753,288 | | | — | | | — |
Other financial instruments** | | | — | | | — | | | — | | | — |
| | | | | | | | | | | | |
Total | | $ | 24,552,463 | | $ | 753,288 | | $ | 23,799,175 | | $ | — |
| | | | | | | | | | | | |
*Includes common stock, warrants and rights. Please see the Investment Portfolio for industry classification.
**Other financial instruments are derivative instruments not reflected in the Investment Portfolio, such as futures, forwards and swap contracts, which are valued at the unrealized appreciation/ depreciation on the instrument. As of December 31, 2009, the Series did not hold any derivative instruments.
There were no Level 3 securities held by the Series as of December 31, 2008 or December 31, 2009.
Interim and annual reporting periods beginning after December 15, 2009 will require additional disclosure regarding transfers in and/or out of Level 1 and 2. Additional disclosure surrounding the activity in Level 3 fair value measurement will also be effective for fiscal years beginning after December 15, 2010. Management has concluded that this will not have a material impact on the Series’ financial statements.
Security Transactions, Investment Income and Expenses
Security transactions are accounted for on trade date. Dividend income is recorded on the ex-dividend date, except that if the ex-dividend date has passed, certain dividends from foreign securities are recorded as soon as the Fund is informed of the ex-dividend date. Non-cash dividends, if any, are recorded at the fair market value of the securities received. Interest income, including amortization of premium and accretion of discounts using the effective interest method, is earned from settlement date and accrued daily.
Expenses are recorded on an accrual basis. Most expenses of the Fund can be attributed to a specific series. Expenses which cannot be directly attributed are apportioned among the series in the Fund in such a manner as deemed equitable by the Fund’s Board, taking into consideration, among other things, the nature and type of expense.
Notes to Financial Statements
| 2. | SIGNIFICANT ACCOUNTING POLICIES (continued) |
Security Transactions, Investment Income and Expenses (continued)
The Series uses the identified cost method for determining realized gain or loss on investments for both financial statement and federal income tax reporting purposes.
Federal Taxes
The Series’ policy is to comply with the provisions of the Internal Revenue Code applicable to regulated investment companies. The Series is not subject to federal income tax or excise tax to the extent that the Series distributes to shareholders each year its taxable income, including any net realized gains on investments, in accordance with requirements of the Internal Revenue Code. Accordingly, no provision for federal income tax or excise tax has been made in the financial statements.
Management evaluates its tax positions to determine if the tax positions taken meet the minimum recognition threshold in connection with accounting for uncertainties in income tax positions taken or expected to be taken for the purposes of measuring and recognizing tax liabilities in the financial statements. Recognition of tax benefits of an uncertain tax position is required only when the position is “more likely than not” to be sustained assuming examination by taxing authorities. At December 31, 2009, the Series has recorded no liability for net unrecognized tax benefits relating to uncertain income tax positions taken or expected to be taken in future tax returns.
The Series files income tax returns in the U.S. federal jurisdiction and various states, as required. No income tax returns are currently under investigation. The statute of limitations on the Series’ tax returns remains open for the years ended December 31, 2006 through December 31, 2009. The Fund is not aware of any tax positions for which it is reasonably possible that the total amounts of unrecognized tax benefits will significantly change in the next twelve months.
Distributions of Income and Gains
Distributions to shareholders of net investment income are made quarterly. Distributions of net realized gains are made annually. An additional distribution may be necessary to avoid taxation of the Series. Distributions are recorded on the ex-dividend date.
Indemnifications
The Fund’s organizational documents provide former and current directors and officers with a limited indemnification against liabilities arising in connection with the performance of their duties to the Fund. In the normal course of business, the Fund may also enter into contracts that provide general indemnifications. The Fund’s maximum exposure under these arrangements is unknown as this would be dependent on future claims that may be made against the Fund. The risk of material loss from such claims is considered remote.
Other
The preparation of financial statements in conformity with accounting principles generally accepted in the United States of America requires management to make estimates and assumptions that affect the reported amounts of assets and liabilities and the disclosure of contingent assets and liabilities at the date of the financial statements and the reported amounts of income and expenses during the reporting period. Actual results could differ from those estimates.
Notes to Financial Statements
| 3. | TRANSACTIONS WITH AFFILIATES |
The Fund has an Investment Advisory Agreement (the “Agreement”) with the Advisor, for which the Series pays a fee, computed daily and payable monthly, at an annual rate of 0.50% of the Series’ average daily net assets.
Under the Agreement, personnel of the Advisor provide the Series with advice and assistance in the choice of investments and the execution of securities transactions, and otherwise maintain the Series’ organization. The Advisor also provides the Fund with necessary office space and fund administration and support services. The salaries of all officers of the Fund (except a percentage of the Fund’s Chief Compliance Officer’s salary, which is paid by the Fund), and of all Directors who are “affiliated persons” of the Fund, or of the Advisor, and all personnel of the Fund, or of the Advisor, performing services relating to research, statistical and investment activities, are paid by the Advisor. Each “non-affiliated” Director receives an annual stipend, which is allocated among all the active series of the Fund. In addition, these Directors also receive a fee per Board meeting attended for each active series of the Fund plus a fee for each committee meeting attended.
The Advisor has contractually agreed, until at least April 30, 2011, to waive its fee and, if necessary, pay other operating expenses of the Series in order to maintain total direct annual fund operating expenses for the Series at no more than 0.85% of average daily net assets each year. Accordingly, the Advisor waived fees of $6,528 for the year ended December 31, 2009, which is reflected as a reduction of expenses on the Statement of Operations. The Advisor is not eligible to recoup any expenses that have been waived or reimbursed in prior years.
Manning & Napier Investor Services, Inc., a registered broker-dealer affiliate of the Advisor, acts as distributor for the Fund’s shares. The services of Manning & Napier Investor Services, Inc. are provided at no additional cost to the Series.
For fund accounting and transfer agent services through November 7, 2009, the Fund paid the Advisor an annual fee of 0.055% of the Fund’s average daily net assets up to $4.5 billion, 0.03% of the Fund’s average daily net assets between $4.5 billion and $7.5 billion, and 0.02% of the Fund’s average daily net assets over $7.5 billion. Additionally, certain transaction and account-based fees and out-of-pocket expenses, including charges for reporting relating to the Fund’s compliance program, were charged. Expenses not directly attributable to a Series are allocated based on each Series’ relative net assets or number of accounts, depending on the expense. Prior to October 12, 2009 (for sub-accountant) and November 9, 2009 (for sub-transfer agent), the Advisor had an agreement with Citi Fund Services Ohio, Inc. (“Citi”) under which Citi served as sub-accountant and sub-transfer agent. The Advisor voluntarily agreed to waive a portion of the fund accounting and transfer agent fees and the Chief Compliance Officer service fees for the period March 1, 2009 to April 30, 2009. Accordingly, the Advisor waived fees of $235, which is included as a reduction of expenses on the Statement of Operations.
The Advisor has entered into agreements dated October 12, 2009 and November 9, 2009 with PNC Global Investment Servicing (U.S.) Inc. (“PNCGIS”) under which PNCGIS serves as sub-accountant services agent and sub-transfer agent, respectively. Effective November 7, 2009 under the amended master services agreement, the Fund pays the Advisor an annual fee of 0.0175% on the first $3 billion of average daily net assets (excluding Target Series); 0.015% on the next $3 billion of average daily net assets (excluding Target Series); and 0.01% of the average daily net assets in excess of $6 billion (excluding Target Series); plus a base fee of $25,500 per Series. Additionally, certain transaction-, account-, and cusip-based fees and out-of-pocket expenses, including charges for reporting relating to the Fund’s compliance program, are charged.
Notes to Financial Statements
| 4. | PURCHASES AND SALES OF SECURITIES |
For the year ended December 31, 2009, purchases and sales of securities, other than United States Government securities and short-term securities, were $4,254,141 and $2,312,775, respectively. There were no purchases or sales of United States Government securities.
| 5. | CAPITAL STOCK TRANSACTIONS |
Transactions in shares of Ohio Tax Exempt Series were:
| | | | | | | | | | | | | | |
| | | For the Year
Ended 12/31/09 | | | For the Year
Ended 12/31/08 | |
| | | Shares | | | Amount | | | Shares | | | Amount | |
| | | | | | | | | | | | | | |
Sold | | 673,194 | | | $ | 7,080,565 | | | 656,301 | | | $ | 6,716,037 | |
Reinvested | | 91,022 | | | | 955,397 | | | 95,854 | | | | 945,265 | |
Repurchased | | (543,835 | ) | | | (5,675,967 | ) | | (1,163,289 | ) | | | (11,623,899 | ) |
| | | | | | | | | | | | | | |
Total | | 220,381 | | | $ | 2,359,995 | | | (411,134 | ) | | $ | (3,962,597 | ) |
| | | | | | | | | | | | | | |
Substantially all of the Series’ shares represent investments by fiduciary accounts over which the Advisor has sole investment discretion.
The Series may trade in instruments including written and purchased options, forward foreign currency exchange contracts and futures contracts and other derivatives in the normal course of investing activities to assist in managing exposure to various market risks. The Series may be subject to various elements of risk and may involve, to a varying degree, elements of risk in excess of the amounts recognized for financial statement purposes; the risk that changes in the value of a derivative may not correlate perfectly with the underlying asset, rate or index; counterparty credit risk related to over the counter derivatives counterparties failure to perform under contract terms; liquidity risk related to the lack of a liquid market for these contracts allowing the fund to close out its position(s); and documentation risk relating to disagreement over contract terms. No such investments were held by the Series during the year ended December 31, 2009.
| 7. | CONCENTRATION OF CREDIT |
The Series primarily invests in debt obligations issued by the State of Ohio and its political subdivisions, agencies and public authorities to obtain funds for various public purposes. The Series is more susceptible to factors adversely affecting issues of Ohio municipal securities than is a municipal bond fund that is not concentrated in these issues to the same extent.
| 8. | FEDERAL INCOME TAX INFORMATION |
The amount and characterization of certain income and capital gains to be distributed are determined in accordance with federal income tax regulations, which may differ from accounting principles generally accepted in the United States of America. These differences are primarily due to differing book and tax treatments in the timing of the recognition of net investment income or gains and losses, including market discount. The Series may periodically make reclassifications among its capital accounts to reflect income and gains available for distribution (or available capital loss carryovers) under income tax regulations without impacting the Series’ net asset value. Any such reclassifications are not reflected in the financial highlights.
Notes to Financial Statements
| 8. | FEDERAL INCOME TAX INFORMATION (continued) |
The tax character of distributions paid were as follows:
| | | | | | |
| | | For the Year
Ended 12/31/09 | | For the Year
Ended 12/31/08 |
Ordinary income | | $ | — | | $ | 6,865 |
Tax exempt income | | | 774,419 | | | 842,594 |
Long-term capital gains | | | 221,587 | | | 119,985 |
At December 31, 2009, the tax basis components of distributable earnings and the net unrealized appreciation based on identified cost for federal income tax purposes were as follows:
| | | | |
Cost for federal income tax purposes | | $ | 24,101,585 | |
Unrealized appreciation | | $ | 587,734 | |
Unrealized depreciation | | | (136,856 | ) |
| | | | |
Net unrealized appreciation | | $ | 450,878 | |
Undistributed tax exempt income | | | 52,316 | |
On February 2, 2010, The PNC Financial Services Group, Inc. (“PNC”), which serves as the Series’ sub-accountant services agent and sub-transfer agent, entered into a Stock Purchase Agreement (the “Stock Purchase Agreement”) with The Bank of New York Mellon Corporation (“BNY Mellon”), the Series’ custodian. Upon the terms and subject to the conditions set forth in the Stock Purchase Agreement, which has been approved by the board of directors of each company, PNC will sell to BNY Mellon (the “Stock Sale”) 100% of the issued and outstanding shares of PNC Global Investment Servicing Inc., an indirect, wholly-owned subsidiary of PNC. The Stock Sale is expected to close in the third quarter of 2010. Management has concluded that this will not have a material impact on the Series’ financial statements.
There were no other subsequent events that require recognition or disclosure. In preparing these financial statements, management of the Fund has evaluated events and transactions for potential recognition or disclosure through February 23, 2010, the date the financial statements were issued.
Report of Independent Registered Public Accounting Firm
To the Board of Directors of Manning & Napier Fund, Inc. and Shareholders of Ohio Tax Exempt Series:
In our opinion, the accompanying statement of assets and liabilities, including the investment portfolio (except for credit ratings), and the related statements of operations and of changes in net assets and the financial highlights present fairly, in all material respects, the financial position of the Ohio Tax Exempt Series (a series of Manning & Napier Fund, Inc., hereafter referred to as the “Series”) at December 31, 2009, and the results of its operations for the year then ended, the changes in its net assets for each of the two years in the period then ended and the financial highlights for each of the five years in the period then ended, in conformity with accounting principles generally accepted in the United States of America. These financial statements and financial highlights (hereafter referred to as “financial statements”) are the responsibility of the Series’ management; our responsibility is to express an opinion on these financial statements based on our audits. We conducted our audits of these financial statements in accordance with the standards of the Public Company Accounting Oversight Board (United States). Those standards require that we plan and perform the audit to obtain reasonable assurance about whether the financial statements are free of material misstatement. An audit includes examining, on a test basis, evidence supporting the amounts and disclosures in the financial statements, assessing the accounting principles used and significant estimates made by management, and evaluating the overall financial statement presentation. We believe that our audits, which included confirmation of securities at December 31, 2009 by correspondence with the custodian, provide a reasonable basis for our opinion.

Columbus, Ohio
February 23, 2010
Supplemental Tax Information (unaudited)
All designations are based on financial information available as of the date of this annual report and, accordingly are subject to change.
Pursuant to Section 852 of the Internal Revenue Code, as amended, the Series hereby designates $221,587 as capital gains for its taxable year ended December 31, 2009. In addition, the Series hereby designates $774,419 as tax exempt dividends for the year ended December 31, 2009. For each item it is the intention of the Series to designate the maximum allowable under tax law.
Renewal of Investment Advisory Agreement (unaudited)
At the Manning & Napier Fund, Inc. (the “Fund”) Board of Directors’ (the “Board”) meeting, held on December 7, 2009, the Investment Advisory Agreement (the “Agreement”) between the Fund and Manning & Napier Advisors, Inc. (the “Advisor”) was reviewed by the Board for renewal. In connection with the decision whether to renew the Agreement, a variety of material was prepared for and reviewed by the Board.
Representatives of the Advisor attended the meeting and presented additional oral and written information to the Board to assist the Board in its considerations. The discussion immediately below outlines the materials and information presented to the Board in connection with the Board’s 2009 Annual Review of the Agreement and the conclusions made by the Directors when determining to continue the Agreement.
| | • | | The Board considered the services provided by the Advisor under the Agreement including, among others: deciding what securities to purchase and sell for each Series; arranging for the purchase and sale of such securities by placing orders with broker-dealers; administering the affairs of the Fund (including the books and records of the Fund not maintained by third party service providers such as the custodian or sub-transfer agent); arranging for the insurance coverage for the Fund; and supervising the preparation of tax returns, SEC filings (including registration statements) and reports to shareholders for the Fund. The Board also considered the nature and quality of such services provided under the Agreement in light of the Advisor’s services provided to the Fund for 23 years. The Board discussed the quality of these services with representatives from the Advisor and concluded that the Advisor was performing its services to the Fund required under the Agreement in a reasonable manner. |
| | • | | The Board considered the investment performance of the various Series of the Fund. The investment performance for each Series was reviewed on a cumulative basis since inception and on a one year basis. In addition, annualized performance for the following time periods was considered: inception, three year, five year, ten year, and current market cycle. A market cycle includes periods of both rising and falling markets. Returns for established benchmark indices for each Series were provided for each time period. The Board noted that the various Series were competitive against their respective benchmarks and/or peer groups over various time periods, but in particular over the full market cycle periods relevant for the Series. In addition, the Board considered at the meeting (and considers on a quarterly basis) a peer group performance analysis consisting of Morningstar universes of mutual funds with similar investment objectives. The Board discussed the performance with representatives from the Advisor and concluded that the investment performance of each of the Fund’s Series was reasonable based on the Fund’s actual performance and comparative performance, especially performance over the current market cycle. |
| | • | | The Board considered the costs of the Advisor’s services and the profits of the Advisor as they relate to the Advisor’s services to the Fund under the Agreement. In reviewing the Advisor’s costs and profits, the Board discussed the Advisor’s revenues generated from the Fund (on both an actual and adjusted basis) and its expenses associated with providing the services under the Agreement. In addition, the Board reviewed the Advisor’s expenses associated with Fund activities outside of the Agreement (such as expense reimbursements pursuant to expense caps and payments made by the Advisor to third party platforms on which shares of the Fund are available for purchase). It was noted by representatives of the Advisor that 13 of the 26 active Series of the Fund are currently experiencing expenses above the capped expense ratios. After discussing the above costs and profits, the Board concluded that the Advisor’s profitability relating to its services provided under the Agreement was reasonable. |
Renewal of Investment Advisory Agreement (unaudited)
| | • | | The Board considered the fees and expenses of the various Series of the Fund. The Advisor presented the advisory fees and total expenses for each Series, including the advisory fee adjusted for any expense waivers or reimbursements (either contractual or voluntary) paid by the Advisor. The advisory fees and expense ratios of each Series were compared to an average (on both a mean and median basis) of similar funds as disclosed on the Morningstar database. Representatives of the Advisor discussed with the Board the levels of its advisory fee for each Series of the Fund and as compared to the median and mean advisory fees for similar funds as listed on Morningstar. Expense ratios for every Series, except the Global Fixed Income Series and the Target Series Class R and Class C, are currently below the median and mean for similar funds as listed on Morningstar. Based on their review of the information provided, the Board concluded that the fees and expenses of each Series of the Fund were reasonable on a comparative basis. |
| | • | | The Board also considered the other benefits the Advisor derives from its relationship with the Fund. Such other benefits include certain research products provided by soft dollars. Given the level of soft dollar transactions involving the Fund, the Board concluded that these additional benefits to the Advisor were reasonable. |
| | • | | In addition to the factors described above, the Board considered the Advisor’s personnel, investment strategies, policies and procedures relating to compliance with personal securities transactions, and reputation, expertise and resources in domestic and foreign financial markets. The Board concluded that these factors support the conclusion that the Advisor performs its services in a reasonable manner. |
| | • | | The Board did not consider economies of scale at this time because of the multiple uses of the Fund (for the Advisor’s discretionary investment account clients in addition to direct investors), the current profitability of the Advisor’s services to the Fund under the Agreement, and the overall size of the Fund complex. |
Based on the Board’s deliberations and their evaluation of the information described above, the Board, including a majority of Directors that are not “interested persons” as defined in the Investment Company Act of 1940, concluded that the compensation under the Agreement was fair and reasonable in light of the services and expenses and such other matters as the Directors considered to be relevant in the exercise of their reasonable judgment. Accordingly, the Board approved the renewal of the Agreement. In the course of their deliberations, the Directors did not identify any particular information that was all important or controlling.
Directors’ and Officers’ Information (unaudited)
The Statement of Additional Information provides additional information about the Fund’s directors and officers and can be obtained without charge by calling 1-800-466-3863, at www.manningnapieradvisors.com, or on the EDGAR Database on the SEC Internet web site (http:// www.sec.gov). The following chart shows certain information about the Fund’s officers and directors, including their principal occupations during the last five years. Unless specific dates are provided, the individuals have held the listed positions for longer than five years.
INTERESTED DIRECTOR/OFFICER
| | |
| Name: | | B. Reuben Auspitz* |
| Address: | | 290 Woodcliff Drive |
| | Fairport, NY 14450 |
| Age: | | 62 |
| Current Position(s) Held with Fund: | | Principal Executive Officer, President, Chairman & Director |
| Term of Office1 & Length of Time Served: | | Indefinite - Director since 1984; Vice President 1984 - 2003; President since 2004; Principal Executive Officer since 2002 |
| Principal Occupation(s) During Past 5 Years: | | Executive Vice President; Co-Executive Director; Executive Group Member**; Chief Compliance Officer since 2004 - Manning & Napier Advisors, Inc. President; Director - Manning & Napier Investor Services, Inc. Holds or has held one or more of the following titles for various subsidiaries and affiliates: President, Vice President, Director, Chairman, Treasurer, Chief Compliance Officer or Member. |
| Number of Portfolios Overseen within Fund Complex: | | 29 |
| Other Directorships Held Outside Fund Complex: | | N/A |
| |
| INDEPENDENT DIRECTORS | | |
| |
| Name: | | Stephen B. Ashley |
| Address: | | 290 Woodcliff Drive |
| | Fairport, NY 14450 |
| Age: | | 69 |
| Current Position(s) Held with Fund: | | Director, Audit Committee Member, Governance & Nominating Committee Member |
| Term of Office & Length of Time Served: | | Indefinite - Since 1996 |
| Principal Occupation(s) During Past 5 Years: | | Chairman, Director, President & Chief Executive Officer, The Ashley Group (property management and investment). Chairman (non-executive) 2004 - 2008; Director 1995 - 2008 - Fannie Mae (mortgage) |
| Number of Portfolios Overseen within Fund Complex: | | 29 |
| Other Directorships Held Outside Fund Complex: | | The Ashley Group |
| Name: | | Peter L. Faber |
| Address: | | 290 Woodcliff Drive |
| | Fairport, NY 14450 |
| Age: | | 71 |
| Current Position(s) Held with Fund: | | Director, Governance & Nominating Committee Member |
| Term of Office & Length of Time Served: | | Indefinite - Since 1987 |
| Principal Occupation(s) During Past 5 Years: | | Senior Counsel since 2006, Partner (1995-2006) - McDermott, Will & Emery LLP (law firm) |
| Number of Portfolios Overseen within Fund Complex: | | 29 |
| Other Directorships Held Outside Fund Complex: | | Partnership for New York City, Inc. (non-profit) |
| | New York Collegium (non-profit) |
| | Boston Early Music Festival (non-profit) |
| | Amherst Early Music, Inc. (non-profit) |
| | | Gotham Early Music Scene, Inc. (non-profit) |
Directors’ and Officers’ Information (unaudited)
| | |
| INDEPENDENT DIRECTORS (continued) | | |
| |
| Name: | | Harris H. Rusitzky |
| Address: | | 290 Woodcliff Drive |
| | Fairport, NY 14450 |
| Age: | | 75 |
| Current Position(s) Held with Fund: | | Director, Audit Committee Member, Governance & Nominating Committee Member |
| Term of Office & Length of Time Served: | | Indefinite - Since 1985 |
| Principal Occupation(s) During Past 5 Years: | | President, The Greening Group (business consultants) since 1994; Partner, The Restaurant Group (restaurants) since 2006 |
| Number of Portfolios Overseen within Fund Complex: | | 29 |
| Other Directorships Held Outside Fund Complex: | | N/A |
| Name: | | Paul A. Brooke |
| Address: | | 290 Woodcliff Drive |
| | Fairport, NY 14450 |
| Age: | | 64 |
| Current Position(s) Held with Fund: | | Director, Audit Committee Member, Governance & Nominating Committee Member |
| Term of Office & Length of Time Served: | | Indefinite - Since 2007 |
| Principal Occupation(s) During Past 5 Years: | | Chairman & CEO, Alsius Corp. (investments); Managing Member, PMSV Holdings LLC (investments) |
| Number of Portfolios Overseen within Fund Complex: | | 29 |
| Other Directorships Held Outside Fund Complex: | | Incyte Corp. |
| | ViroPharma, Inc. |
| | WebMD |
| | Cheyne Capital International |
| | MPM Bio-equities |
| | GMP Companies |
| | | HoustonPharma |
| Name: | | Richard M. Hurwitz |
| Address: | | 290 Woodcliff Drive |
| | Fairport, NY 14450 |
| Age: | | 46 |
| Current Position(s) Held with Fund: | | Director, Audit Committee Member, Governance & Nominating Committee Member |
| Term of Office & Length of Time Served: | | Indefinite - Since 2009 |
| Principal Occupation(s) During Past 5 Years: | | Managing Partner, Aegis Investment Partners, LLC (investments) since 2006; Founder and Managing Partner (2004-2005) - Village Markets, LLC (groceries) |
| Number of Portfolios Overseen within Fund Complex: | | 29 |
| Other Directorships Held Outside Fund Complex: | | Pictometry International Corp. |
Directors’ and Officers’ Information (unaudited)
OFFICERS
| | |
| |
| Name: | | Jeffrey S. Coons, Ph.D., CFA |
| Address: | | 290 Woodcliff Drive Fairport, NY 14450 |
| Age: | | 46 |
| Current Position(s) Held with Fund: | | Vice President |
| Term of Office1 & Length of Time Served: | | Since 2004 |
| Principal Occupation(s) During Past 5 Years: | | Co-Director of Research since 2002 & Executive Group Member** since 2003, Manning & Napier Advisors, Inc. Holds one or more of the following titles for various subsidiaries and affiliates: President, Director, Treasurer or Senior Trust Officer. |
| Number of Portfolios Overseen within Fund Complex: | | 29 |
| Other Directorships Held Outside Fund Complex: | | N/A |
| Name: | | Christine Glavin |
| Address: | | 290 Woodcliff Drive Fairport, NY 14450 |
| Age: | | 43 |
| Current Position(s) Held with Fund: | | Principal Financial Officer, Chief Financial Officer |
| Term of Office1 & Length of Time Served: | | Principal Financial Officer since 2002; Chief Financial Officer since 2001 |
| Principal Occupation(s) During Past 5 Years: | | Fund Reporting Manager, Manning & Napier Advisors, Inc. since 1997 |
| Number of Portfolios Overseen within Fund Complex: | | 29 |
| Other Directorships Held Outside Fund Complex: | | N/A |
| Name: | | Jodi L. Hedberg |
| Address: | | 290 Woodcliff Drive Fairport, NY 14450 |
| Age: | | 42 |
| Current Position(s) Held with Fund: | | Corporate Secretary, Chief Compliance Officer, Anti-Money Laundering Compliance Officer |
| Term of Office1 & Length of Time Served: | | Corporate Secretary since 1997; Chief Compliance Officer since 2004 |
| Principal Occupation(s) During Past 5 Years: | | Director of Compliance, Manning & Napier Advisors, Inc. and affiliates since 1990 (title change in 2005 from Compliance Manager to Director of Compliance); Corporate Secretary, Manning & Napier Investor Services, Inc. since 2006 |
| Number of Portfolios Overseen within Fund Complex: | | 29 |
| Other Directorships Held Outside Fund Complex: | | N/A |
*Interested Director, within the meaning of the Investment Company Act of 1940 by reason of his position with the Fund’s investment advisor and distributor. Mr. Auspitz serves as the Executive Vice President and Director, Manning & Napier Advisors, Inc. and President and Director, Manning & Napier Investor Services, Inc., the Fund’s distributor.
**The Executive Group performs the duties of the Office of the Chief Executive of Manning & Napier Advisors, Inc.
1The term of office for President, Vice President, Chief Financial Officer, and Corporate Secretary is one year and until their respective successors are chosen and qualified. All other officers’ terms are indefinite.
Literature Requests (unaudited)
Proxy Voting Policies and Procedures
A description of the policies and procedures that the Fund uses to determine how to vote proxies relating to portfolio securities is available, without charge, upon request:
| | |
By phone | | 1-800-466-3863 |
On the Securities and Exchange Commission’s (SEC) web site | | http://www.sec.gov |
Proxy Voting Record
Information regarding how the Fund voted proxies relating to portfolio securities during the most recent 12-month period ended June 30th is available, without charge, upon request:
| | |
By phone | | 1-800-466-3863 |
On the SEC’s web site | | http://www.sec.gov |
Quarterly Portfolio Holdings
The Series’ complete schedule of portfolio holdings for the 1st and 3rd quarters of each fiscal year are provided on Form N-Q, and are available, without charge, upon request:
| | |
By phone | | 1-800-466-3863 |
On the SEC’s web site | | http://www.sec.gov |
The Series’ Form N-Q may be reviewed and copied at the SEC’s Public Reference Room in Washington, D.C. Information on the operation of the Public Reference Room may be obtained by calling 1-800-SEC-0330.
Prospectus and Statement of Additional Information (SAI)
The prospectus and SAI provide additional information about each Series, including charges, expenses and risks. These documents are available, without charge, upon request:
| | |
By phone | | 1-800-466-3863 |
On the SEC’s web site | | http://www.sec.gov |
On the Advisor’s web site | | http://www.manningnapieradvisors.com |
Additional information available at www.manningnapieradvisors.com
1. Fund Holdings - Month-End
2. Fund Holdings - Quarter-End
3. Shareholder Report - Annual
4. Shareholder Report - Semi-Annual


Management Discussion and Analysis (unaudited)

Dear Shareholders:
Fixed income returns varied greatly in 2009 across market sectors and quality ratings. As 2009 unfolded, the credit crisis maintained a strong hold on the markets, with short-term securities and U.S. Treasuries representing the only safe havens in global markets. Following stock market lows in late March 2009, investor sentiment shifted to modest optimism, and lower quality securities, both stocks and bonds, rallied strongly.
Overall, municipal securities posted strong returns during 2009, with lower quality and longer maturity issues faring the best. The Bank of America (BofA) Merrill Lynch 1-12Year Municipal Bond Index (formerly a Merrill Lynch Index) earned a strong 7.18% during the year. The 12.75% return of the Diversified Tax Exempt Series during 2009 dramatically outpaced that of its benchmark.
A unique aspect of the municipal bond market in 2009 was the general supply/demand imbalance that developed. As credit crisis fears abated in mid-2009, investors began to predict that government stimulus would provide help to state and local municipalities. This led to a strong revival in demand for municipal securities relative to weak demand during 2008’s recession and credit crunch. However, this demand was met with less supply as issuers chose to forego traditional tax-exempt issuance in favor of the Build America Bond subsidy program offered by the federal government. This supply/demand imbalance created a generally falling yield environment for municipal bonds throughout most of 2009. Because falling yields lead to higher bond prices, this situation benefited the Series’ return.
The Series’ intermediate-to-long-term maturity focus contributed to strong returns during most of the year as yields on municipal bonds generally fell. The Series also maintained a generally high quality bias, with the underlying credit rating of all issues in the Series being rated investment grade or higher, and only a small percentage rated below A. This quality bias likely detracted from returns in the second half of the year as lower quality securities outperformed, but the longer-term orientation of the portfolio more than offset this drag on returns.
As the global recovery continues to unfold, it will be important to monitor changes in factors such as state and local budgets, monetary policy, inflation expectations and other cyclical or secular trends. We will continue to employ an active approach to fixed income, considering maturity, quality and issue selections as key tools for seeking out return potential and managing risk over full bond market cycles.
As always, we appreciate your business.
Sincerely,
Manning & Napier Advisors, Inc.
Performance Update as of December 31, 2009 (unaudited)
| | | | | | | | | | |
| | | Average Annual Total Returns
As of December 31, 2009 | | |
| | | One
Year | | Five
Year | | Ten
Year | | Since
Inception1 | | |
Manning & Napier Fund, Inc. - Diversified Tax Exempt Series2 | | 12.75% | | 4.03% | | 5.41% | | 4.75% | | |
Bank of America (BofA) Merrill Lynch 1-12Year Municipal Bond Index3 | | 7.18% | | 4.47% | | 5.56% | | 5.28% | | |
The following graph compares the value of a $10,000 investment in the Manning & Napier Fund, Inc. - Diversified Tax Exempt Series for the ten years ended December 31, 2009 to the BofA Merrill Lynch 1-12 Year Municipal Bond Index.
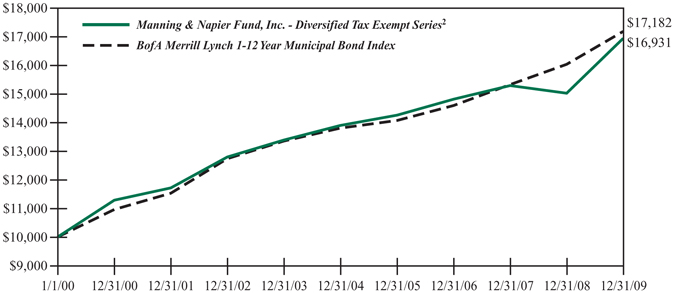
1Performance numbers for the Series and Index are calculated from February 14, 1994, the Series’ inception date.
2The Series’ performance does not reflect the deduction of taxes that a shareholder would pay on fund distributions or the redemption of shares. The Series’ performance is historical and may not be indicative of future results. The performance returns shown are inclusive of the net expense ratio of the Series. For the year ended December 31, 2009, this net expense ratio was 0.60%. The gross expense ratio, which does not account for any voluntary or contractual waivers currently in effect, was 0.61% for the year ended December 31, 2009.
3The BofA Merrill Lynch 1-12 Year Municipal Bond Index (formerly a Merrill Lynch Index) is an unmanaged, market weighted index comprised of investment-grade, fixed rate, coupon bearing municipal bonds with maturities greater than one year but less than twelve years. The Index returns assume reinvestment of coupons and, unlike Series returns, do not reflect any fees or expenses.
Shareholder Expense Example (unaudited)
As a shareholder of the Series, you may incur two types of costs: (1) transaction costs, including potential wire charges on redemptions and (2) ongoing costs, including management fees and other Series expenses. This example is intended to help you understand your ongoing costs (in dollars) of investing in the Series and to compare these costs with the ongoing costs of investing in other mutual funds.
The example is based on an investment of $1,000 invested at the beginning of the period and held for the entire period (July 1, 2009 to December 31, 2009).
Actual Expenses
The first line of the table below provides information about actual account values and actual expenses. You may use the information in this line, together with the amount you invested, to estimate the expenses that you paid over the period. Simply divide your account value by $1,000 (for example, an $8,600 account value divided by $1,000 = 8.6), then multiply the result by the number in the first line under the heading entitled “Expenses Paid During Period” to estimate the expenses you paid on your account during this period.
Hypothetical Example for Comparison Purposes
The second line of the table below provides information about hypothetical account values and hypothetical expenses based on the Series’ actual expense ratio and an assumed rate of return of 5% per year before expenses, which is not the Series’ actual return. The hypothetical account values and expenses may not be used to estimate the actual ending account balance or expenses you paid during the period. You may use this information to compare the ongoing costs of investing in the Series and other funds. To do so, compare this 5% hypothetical example with the 5% hypothetical examples that appear in the shareholder reports of the other funds.
Please note that the expenses shown in the table are meant to highlight your ongoing costs only and do not reflect any transaction costs, such as potential wire charges on redemptions. Therefore, the second line of the table is useful in comparing ongoing costs only, and will not help you determine the relative total costs of owning different funds. In addition, if these transaction costs were included, your costs would have been higher.
| | | | | | | | | |
| | | Beginning
Account Value
7/1/09 | | Ending
Account Value
12/31/09 | | Expenses Paid
During Period*
7/1/09-12/31/09 |
Actual | | $ | 1,000.00 | | $ | 1,057.40 | | $ | 3.06 |
Hypothetical
(5% return before expenses) | | $ | 1,000.00 | | $ | 1,022.23 | | $ | 3.01 |
*Expenses are equal to the Series’ annualized expense ratio (for the six-month period) of 0.59%, multiplied by the average account value over the period, multiplied by 184/365 (to reflect the one-half year period). Expenses are based on the most recent fiscal half year; therefore, the expense ratio stated above may differ from the expense ratio stated in the financial highlights, which is based on one-year data. The Series’ total return would have been lower had certain expenses not been waived during the period.
Portfolio Composition as of December 31, 2009 (unaudited)
Sector Allocation1
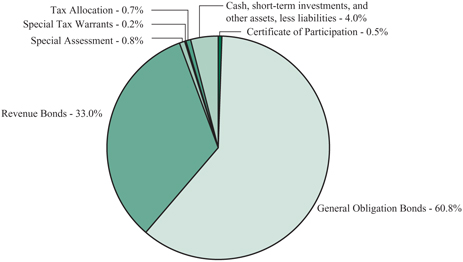
1As a percentage of net assets.
Credit Quality Ratings2,3
| | |
Aaa | | 16.4% |
Aa | | 51.7% |
A | | 20.0% |
Baa | | 6.5% |
Ba | | 0.1% |
Unrated investments | | 1.3% |
Cash, short-term investments, and other assets, less liabilities | | 4.0% |
2As a percentage of net assets.
3Based on ratings from Moody’s, or the S&P equivalent. The Series may use different ratings provided by other rating agencies for purposes of determining compliance with the Series’ investment policies.
Top Ten States4
| | |
Texas | | 6.0% |
Washington | | 5.1% |
New York | | 4.7% |
Indiana | | 4.5% |
Florida | | 4.4% |
Michigan | | 4.4% |
South Carolina | | 4.0% |
Nevada | | 3.9% |
Ohio | | 3.8% |
California | | 3.7% |
4As a percentage of total investments.
Investment Portfolio - December 31, 2009
| | | | | | | | | | | | | | |
| | | Coupon
Rate | | | Maturity
Date | | Credit
Rating1
(unaudited) | | | Principal
Amount | | Value
(Note 2) |
| | | | | | | | | | | | | | |
| | | | | |
MUNICIPAL BONDS - 96.0% | | | | | | | | | | | | | | |
| | | | | |
ALABAMA - 0.7% | | | | | | | | | | | | | | |
Fort Payne Waterworks Board, Revenue Bond, AMBAC | | 3.500 | % | | 7/1/2015 | | WR | 3 | | $ | 665,000 | | $ | 679,324 |
Hoover Board of Education, Capital Outlay Warrants, Special Tax Warrants, NATL | | 5.250 | % | | 2/15/2017 | | A1 | | | | 500,000 | | | 522,710 |
Odenville Utilities Board Water, Revenue Bond, NATL | | 4.300 | % | | 8/1/2028 | | Baa1 | | | | 500,000 | | | 498,715 |
| | | | | | | | | | | | | | |
| | | | | | | | | | | | | | 1,700,749 |
| | | | | | | | | | | | | | |
ALASKA - 0.2% | | | | | | | | | | | | | | |
Alaska Municipal Bond Banking Authority, Revenue Bond, NATL | | 4.100 | % | | 6/1/2017 | | A1 | | | | 455,000 | | | 467,290 |
| | | | | | | | | | | | | | |
ARIZONA - 3.1% | | | | | | | | | | | | | | |
Goodyear, G.O. Bond, NATL | | 4.375 | % | | 7/1/2020 | | A1 | | | | 680,000 | | | 705,309 |
Mesa, G.O. Bond, FGRNA | | 4.125 | % | | 7/1/2027 | | A1 | | | | 2,215,000 | | | 2,165,805 |
Phoenix, Series B, G.O. Bond | | 4.200 | % | | 7/1/2021 | | Aa1 | | | | 1,500,000 | | | 1,560,885 |
Salt River Project Agricultural Impt. & Power District, Series A, Revenue Bond | | 5.000 | % | | 1/1/2035 | | Aa1 | | | | 1,700,000 | | | 1,747,855 |
Yuma County Library District, Series A, G.O. Bond, AMBAC | | 4.500 | % | | 7/1/2035 | | A2 | | | | 1,200,000 | | | 1,125,564 |
| | | | | | | | | | | | | | |
| | | | | | | | | | | | | | 7,305,418 |
| | | | | | | | | | | | | | |
CALIFORNIA - 3.6% | | | | | | | | | | | | | | |
California State, G.O. Bond | | 5.250 | % | | 2/1/2023 | | Baa1 | | | | 500,000 | | | 517,030 |
California State, G.O. Bond | | 4.750 | % | | 12/1/2028 | | Baa1 | | | | 795,000 | | | 733,491 |
California State, Various Purposes, G.O. Bond, AMBAC | | 4.250 | % | | 12/1/2035 | | Baa1 | | | | 1,140,000 | | | 891,526 |
Campbell Union School District, G.O. Bond, AGM | | 4.375 | % | | 8/1/2027 | | Aa3 | | | | 1,810,000 | | | 1,776,189 |
Chula Vista Elementary School District, Series F, G.O. Bond, NATL | | 4.800 | % | | 8/1/2024 | | Baa1 | | | | 435,000 | | | 436,936 |
Chula Vista Elementary School District, Series F, G.O. Bond, NATL | | 4.875 | % | | 8/1/2025 | | Baa1 | | | | 425,000 | | | 427,146 |
Los Angeles Unified School District, Series B, G.O. Bond, AMBAC | | 4.500 | % | | 7/1/2027 | | Aa3 | | | | 840,000 | | | 798,924 |
Oak Valley Hospital District, G.O. Bond, FGRNA | | 4.500 | % | | 7/1/2025 | | A3 | | | | 1,395,000 | | | 1,310,337 |
Richmond Joint Powers Financing Authority, Series A, Tax Allocation, NATL | | 5.250 | % | | 9/1/2025 | | Baa1 | | | | 1,570,000 | | | 1,563,249 |
| | | | | | | | | | | | | | |
| | | | | | | | | | | | | | 8,454,828 |
| | | | | | | | | | | | | | |
| | |
| 5 | | The accompanying notes are an integral part of the financial statements. |
Investment Portfolio - December 31, 2009
| | | | | | | | | | | | | | |
| | | Coupon
Rate | | | Maturity
Date | | Credit
Rating1
(unaudited) | | | Principal
Amount | | Value
(Note 2) |
| | | | | | | | | | | | | | |
| | | | | |
MUNICIPAL BONDS (continued) | | | | | | | | | | | | | | |
| | | | | |
COLORADO - 1.0% | | | | | | | | | | | | | | |
Colorado Water Resources & Power Development Authority, Water Resource, Series D, Revenue Bond, AGM | | 4.375 | % | | 8/1/2035 | | Aa3 | | | $ | 1,420,000 | | $ | 1,329,589 |
Commerce City, Certificate of Participation, AMBAC | | 4.750 | % | | 12/15/2032 | | A | 2 | | | 1,000,000 | | | 958,170 |
| | | | | | | | | | | | | | |
| | | | | | | | | | | | | | 2,287,759 |
| | | | | | | | | | | | | | |
CONNECTICUT - 0.7% | | | | | | | | | | | | | | |
Stamford, G.O. Bond | | 4.400 | % | | 2/15/2026 | | Aaa | | | | 1,545,000 | | | 1,581,879 |
| | | | | | | | | | | | | | |
DELAWARE - 1.2% | | | | | | | | | | | | | | |
New Castle County, Series A, G.O. Bond | | 4.250 | % | | 7/15/2025 | | Aaa | | | | 1,500,000 | | | 1,545,435 |
New Castle County, Series A, G.O. Bond | | 4.250 | % | | 7/15/2026 | | Aaa | | | | 1,265,000 | | | 1,301,457 |
| | | | | | | | | | | | | | |
| | | | | | | | | | | | | | 2,846,892 |
| | | | | | | | | | | | | | |
DISTRICT OF COLUMBIA - 1.1% | | | | | | | | | | | | | | |
District of Columbia, Series A, G.O. Bond, FGRNA | | 4.750 | % | | 6/1/2033 | | A1 | | | | 2,500,000 | | | 2,468,575 |
| | | | | | | | | | | | | | |
FLORIDA - 4.4% | | | | | | | | | | | | | | |
Cape Coral Utility Impt. Assessment, Special Assessment, NATL | | 4.500 | % | | 7/1/2021 | | Baa1 | | | | 1,855,000 | | | 1,819,903 |
Florida State Board of Education, Capital Outlay, Public Education, Series A, G.O. Bond, AGM | | 4.500 | % | | 6/1/2025 | | Aa1 | | | | 1,280,000 | | | 1,311,859 |
Florida State Board of Education, Capital Outlay, Public Education, Series D, G.O. Bond | | 5.000 | % | | 6/1/2016 | | Aa1 | | | | 2,000,000 | | | 2,263,400 |
Florida State Department of Transportation, G.O. Bond | | 5.000 | % | | 7/1/2027 | | Aa1 | | | | 1,000,000 | | | 1,031,700 |
Palm Beach County, FPL Reclaimed Water Project, Revenue Bond | | 5.000 | % | | 10/1/2040 | | Aaa | | | | 1,020,000 | | | 1,037,493 |
Panama City Beach Utility, Revenue Bond, AGC | | 5.000 | % | | 6/1/2039 | | AAA | 2 | | | 1,000,000 | | | 1,002,940 |
Tohopekaliga Water Authority, Utility System, Series A, Revenue Bond, AGM | | 5.000 | % | | 10/1/2028 | | Aa3 | | | | 510,000 | | | 517,619 |
Winter Park Electric Impt., Series A, Revenue Bond, AGM | | 5.000 | % | | 10/1/2029 | | Aa3 | | | | 1,000,000 | | | 1,027,910 |
| | |
| The accompanying notes are an integral part of the financial statements. | | 6 |
Investment Portfolio - December 31, 2009
| | | | | | | | | | | | | | |
| | | Coupon
Rate | | | Maturity
Date | | Credit
Rating1
(unaudited) | | | Principal
Amount | | Value
(Note 2) |
| | | | | | | | | | | | | | |
| | | | | |
MUNICIPAL BONDS (continued) | | | | | | | | | | | | | | |
| | | | | |
FLORIDA (continued) | | | | | | | | | | | | | | |
Winter Park, Impt., Revenue Bond | | 5.000 | % | | 12/1/2034 | | Aa3 | | | $ | 250,000 | | $ | 254,768 |
| | | | | | | | | | | | | | |
| | | | | | | | | | | | | | 10,267,592 |
| | | | | | | | | | | | | | |
GEORGIA - 2.0% | | | | | | | | | | | | | | |
Atlanta, Prerefunded Balance, G.O. Bond | | 5.600 | % | | 12/1/2018 | | A1 | | | | 350,000 | | | 354,914 |
Atlanta, Water & Wastewater, Revenue Bond, AGM | | 5.000 | % | | 11/1/2043 | | Aa3 | | | | 1,500,000 | | | 1,495,035 |
Atlanta, Water & Wastewater, Series A, Revenue Bond, NATL | | 5.000 | % | | 11/1/2033 | | Baa1 | | | | 310,000 | | | 299,510 |
Georgia State, Prerefunded Balance, Series B, G.O. Bond | | 5.650 | % | | 3/1/2012 | | Aaa | | | | 5,000 | | | 5,531 |
Georgia State, Series B, G.O. Bond | | 4.000 | % | | 3/1/2022 | | Aaa | | | | 1,270,000 | | | 1,301,813 |
Georgia State, Unrefunded Balance, Series B, G.O. Bond | | 5.650 | % | | 3/1/2012 | | Aaa | | | | 195,000 | | | 215,705 |
Madison Water & Sewer, Revenue Bond, AMBAC | | 4.625 | % | | 7/1/2030 | | WR | 3 | | | 1,000,000 | | | 945,750 |
| | | | | | | | | | | | | | |
| | | | | | | | | | | | | | 4,618,258 |
| | | | | | | | | | | | | | |
ILLINOIS - 3.5% | | | | | | | | | | | | | | |
Chicago, Series A, G.O. Bond, AGM | | 4.750 | % | | 1/1/2038 | | Aa3 | | | | 1,500,000 | | | 1,479,420 |
Chicago, Series D, G.O. Bond, FGRNA | | 5.500 | % | | 1/1/2035 | | Aa3 | | | | 1,000,000 | | | 1,011,840 |
Chicago, Unrefunded Balance, Series A, G.O. Bond, NATL | | 5.000 | % | | 1/1/2034 | | Aa3 | | | | 520,000 | | | 523,593 |
Cook County, Series A, G.O. Bond, FGRNA | | 5.000 | % | | 11/15/2022 | | Aa3 | | | | 265,000 | | | 267,157 |
Illinois State, G.O. Bond | | 5.000 | % | | 12/1/2027 | | A2 | | | | 600,000 | | | 609,894 |
Illinois State, G.O. Bond, NATL | | 5.250 | % | | 10/1/2018 | | A2 | | | | 2,000,000 | | | 2,182,300 |
Illinois State, Series 1995 A, Certificate of Participation, NATL | | 5.600 | % | | 7/1/2010 | | Baa1 | | | | 100,000 | | | 100,353 |
Springfield Electric, Revenue Bond, NATL | | 5.000 | % | | 3/1/2035 | | Aa3 | | | | 1,000,000 | | | 1,008,910 |
Springfield Metropolitan Sanitation District, Series A, G.O. Bond | | 4.750 | % | | 1/1/2034 | | AA | 2 | | | 1,115,000 | | | 1,120,676 |
| | | | | | | | | | | | | | |
| | | | | | | | | | | | | | 8,304,143 |
| | | | | | | | | | | | | | |
INDIANA - 4.5% | | | | | | | | | | | | | | |
Avon Community School Building Corp., Revenue Bond, AMBAC | | 4.250 | % | | 7/15/2018 | | A | 2 | | | 1,450,000 | | | 1,518,368 |
Avon Community School Building Corp., Revenue Bond, AMBAC | | 4.750 | % | | 1/15/2032 | | A | 2 | | | 1,015,000 | | | 1,022,653 |
Frankfort High School Elementary School Building Corp., Revenue Bond, AGM | | 4.750 | % | | 7/15/2025 | | Aa3 | | | | 1,500,000 | | | 1,558,455 |
| | |
| 7 | | The accompanying notes are an integral part of the financial statements. |
Investment Portfolio - December 31, 2009
| | | | | | | | | | | | | | |
| | | | | | | | | | | | | | |
| | | Coupon
Rate | | | Maturity
Date | | Credit
Rating1
(unaudited) | | | Principal
Amount | | Value
(Note 2) |
| | | | | | | | | | | | | | |
| | | | | |
MUNICIPAL BONDS (continued) | | | | | | | | | | | | | | |
| | | | | |
INDIANA (continued) | | | | | | | | | | | | | | |
Indianapolis Local Public Impt. Bond Bank, Waterworks Project, Series A, Revenue Bond, AGC | | 5.500 | % | | 1/1/2038 | | Aa3 | | | $ | 1,000,000 | | $ | 1,081,020 |
La Porte County, G.O. Bond, FGRNA | | 5.200 | % | | 1/15/2018 | | A3 | | | | 300,000 | | | 315,486 |
Noblesville Sewage Works, Revenue Bond, AMBAC | | 5.000 | % | | 1/1/2024 | | A1 | | | | 550,000 | | | 552,629 |
North Lawrence Community Schools Building Corp., Revenue Bond, AGM | | 5.000 | % | | 7/15/2020 | | Aa3 | | | | 450,000 | | | 474,376 |
Plainfield, Series A, Revenue Bond | | 4.650 | % | | 1/1/2027 | | A | 2 | | | 645,000 | | | 639,021 |
Shelbyville Central Renovation School Building Corp., Revenue Bond, NATL | | 5.000 | % | | 7/15/2018 | | Baa1 | | | | 3,000,000 | | | 3,260,490 |
| | | | | | | | | | | | | | |
| | | | | | | | | | | | | | 10,422,498 |
| | | | | | | | | | | | | | |
IOWA - 1.7% | | | | | | | | | | | | | | |
Indianola Community School District, G.O. Bond, FGRNA | | 5.200 | % | | 6/1/2021 | | A3 | | | | 425,000 | | | 449,370 |
Iowa City Community School District, G.O. Bond, AGM | | 4.000 | % | | 6/1/2018 | | Aa1 | | | | 425,000 | | | 435,400 |
Polk County, Series C, G.O. Bond | | 4.000 | % | | 6/1/2017 | | Aa1 | | | | 995,000 | | | 1,055,018 |
Polk County, Series C, G.O. Bond | | 4.125 | % | | 6/1/2025 | | Aa1 | | | | 2,075,000 | | | 2,107,370 |
| | | | | | | | | | | | | | |
| | | | | | | | | | | | | | 4,047,158 |
| | | | | | | | | | | | | | |
KANSAS - 2.4% | | | | | | | | | | | | | | |
Johnson & Miami Counties Unified School District No. 230, G.O. Bond, FGRNA | | 4.000 | % | | 9/1/2022 | | A2 | | | | 1,000,000 | | | 995,730 |
Miami County Unified School District No. 416 Louisburg, G.O Bond, NATL | | 5.000 | % | | 9/1/2018 | | Baa1 | | | | 2,000,000 | | | 2,127,100 |
Sedgwick County Unified School District No. 265, G.O. Bond, AGM | | 5.000 | % | | 10/1/2025 | | Aa3 | | | | 1,090,000 | | | 1,168,742 |
Shawnee County Unified School District No. 450, Shawnee Heights, G.O. Bond, AGM | | 4.200 | % | | 9/1/2020 | | Aa3 | | | | 700,000 | | | 718,942 |
Shawnee County Unified School District No. 450, Shawnee Heights, G.O. Bond, AGM | | 4.250 | % | | 9/1/2021 | | Aa3 | | | | 580,000 | | | 593,554 |
Wyandotte County School District No. 204 Bonner Springs, Unrefunded Balance, Series A, G.O. Bond, AGM | | 5.375 | % | | 9/1/2015 | | Aa3 | | | | 110,000 | | | 113,180 |
| | | | | | | | | | | | | | |
| | | | | | | | | | | | | | 5,717,248 |
| | | | | | | | | | | | | | |
| | |
| The accompanying notes are an integral part of the financial statements. | | 8 |
Investment Portfolio - December 31, 2009
| | | | | | | | | | | | | | |
| | | Coupon
Rate | | | Maturity
Date | | Credit
Rating1
(unaudited) | | | Principal
Amount | | Value
(Note 2) |
| | | | | | | | | | | | | | |
| | | | | |
MUNICIPAL BONDS (continued) | | | | | | | | | | | | | | |
| | | | | |
KENTUCKY - 0.7% | | | | | | | | | | | | | | |
Lexington-Fayette Urban County Government, Public Facilities Corp., Revenue Bond, NATL | | 4.000 | % | | 10/1/2018 | | Aa3 | | | $ | 1,655,000 | | $ | 1,719,744 |
| | | | | | | | | | | | | | |
LOUISIANA - 1.1% | | | | | | | | | | | | | | |
Caddo Parish Parishwide School District, G.O. Bond, NATL | | 4.350 | % | | 3/1/2026 | | Aa3 | | | | 660,000 | | | 672,078 |
Caddo Parish Parishwide School District, G.O. Bond, NATL | | 4.375 | % | | 3/1/2027 | | Aa3 | | | | 1,090,000 | | | 1,106,928 |
New Orleans Sewage Service, Revenue Bond, FGIC | | 5.250 | % | | 6/1/2012 | | Ba2 | | | | 300,000 | | | 300,018 |
Orleans Parish Parishwide School District, Series A, G.O. Bond, FGIC | | 5.125 | % | | 9/1/2016 | | WR | 3 | | | 400,000 | | | 400,012 |
| | | | | | | | | | | | | | |
| | | | | | | | | | | | | | 2,479,036 |
| | | | | | | | | | | | | | |
MARYLAND - 1.7% | | | | | | | | | | | | | | |
Anne Arundel County, Water & Sewer, G.O. Bond | | 4.125 | % | | 3/1/2024 | | Aa1 | | | | 345,000 | | | 354,287 |
Anne Arundel County, Water & Sewer, G.O. Bond | | 4.200 | % | | 3/1/2025 | | Aa1 | | | | 1,770,000 | | | 1,820,781 |
Baltimore County, Metropolitan District, G.O. Bond | | 4.250 | % | | 9/1/2029 | | Aaa | | | | 1,000,000 | | | 1,022,100 |
Maryland State, State and Local Facilities, G.O. Bond | | 4.250 | % | | 8/1/2021 | | Aaa | | | | 750,000 | | | 795,713 |
| | | | | | | | | | | | | | |
| | | | | | | | | | | | | | 3,992,881 |
| | | | | | | | | | | | | | |
MASSACHUSETTS - 3.3% | | | | | | | | | | | | | | |
Boston, Series A, G.O. Bond, NATL | | 4.125 | % | | 1/1/2021 | | Aa1 | | | | 1,000,000 | | | 1,031,810 |
Boston, Series A, G.O. Bond, NATL | | 4.125 | % | | 1/1/2022 | | Aa1 | | | | 410,000 | | | 421,185 |
Cambridge, Series A, G.O. Bond | | 4.000 | % | | 2/1/2026 | | Aaa | | | | 850,000 | | | 864,152 |
Cambridge, Series A, G.O. Bond | | 4.000 | % | | 2/1/2027 | | Aaa | | | | 850,000 | | | 862,036 |
Lowell, State Qualified, G.O. Bond, AMBAC | | 5.000 | % | | 2/1/2020 | | Aa3 | | | | 500,000 | | | 530,475 |
Massachusetts State, Series C, G.O. Bond, AMBAC | | 5.750 | % | | 8/1/2010 | | Aa2 | | | | 400,000 | | | 412,656 |
Massachusetts State, Series D, G.O. Bond | | 5.250 | % | | 10/1/2014 | | Aa2 | | | | 1,000,000 | | | 1,162,500 |
Massachusetts Water Resources Authority, Series A, Revenue Bond, AGM | | 4.375 | % | | 8/1/2032 | | Aa2 | | | | 2,000,000 | | | 1,950,020 |
Plymouth, Prerefunded, G.O. Bond, NATL | | 5.250 | % | | 10/15/2020 | | Aa2 | | | | 100,000 | | | 104,888 |
Richmond, G.O. Bond, NATL | | 5.000 | % | | 4/15/2021 | | Aa3 | | | | 400,000 | | | 407,316 |
| | | | | | | | | | | | | | |
| | | | | | | | | | | | | | 7,747,038 |
| | | | | | | | | | | | | | |
| | |
| 9 | | The accompanying notes are an integral part of the financial statements. |
Investment Portfolio - December 31, 2009
| | | | | | | | | | | | | | |
| | | Coupon
Rate | | | Maturity
Date | | Credit
Rating1
(unaudited) | | | Principal
Amount | | Value
(Note 2) |
| | | | | | | | | | | | | | |
| | | | | |
MUNICIPAL BONDS (continued) | | | | | | | | | | | | | | |
| | | | | |
MICHIGAN - 4.3% | | | | | | | | | | | | | | |
Bendle Public School District, School Building & Site, G.O. Bond, FGRNA | | 4.500 | % | | 5/1/2028 | | Aa3 | | | $ | 640,000 | | $ | 626,662 |
Detroit City School District, School Building & Site Impt., Series B, G.O. Bond, FGIC | | 5.000 | % | | 5/1/2033 | | Aa3 | | | | 750,000 | | | 693,570 |
Detroit Sewer Disposal System, Series B, Revenue Bond, FGRNA | | 4.625 | % | | 7/1/2034 | | A3 | | | | 1,500,000 | | | 1,279,695 |
Detroit Water Supply System, Revenue Bond, NATL | | 5.250 | % | | 7/1/2023 | | A3 | | | | 2,000,000 | | | 2,016,420 |
Grand Rapids Public Schools, G.O. Bond, NATL | | 4.125 | % | | 5/1/2023 | | Aa3 | | | | 1,200,000 | | | 1,207,116 |
Muskegon Public Schools, G.O. Bond, AGM | | 5.000 | % | | 5/1/2020 | | Aa3 | | | | 1,000,000 | | | 1,055,280 |
Muskegon Water, Revenue Bond, AGM | | 4.750 | % | | 5/1/2019 | | Aa3 | | | | 565,000 | | | 566,367 |
Saginaw City School District, School Building & Site, G.O. Bond, AGM | | 4.500 | % | | 5/1/2031 | | Aa3 | | | | 1,695,000 | | | 1,614,420 |
Warren Woods Public Schools, School Building & Site, G.O. Bond, AGM | | 4.500 | % | | 5/1/2026 | | Aa3 | | | | 1,015,000 | | | 1,016,604 |
| | | | | | | | | | | | | | |
| | | | | | | | | | | | | | 10,076,134 |
| | | | | | | | | | | | | | |
MINNESOTA - 2.5% | | | | | | | | | | | | | | |
Brooklyn Center Independent School District No. 286, School Building, Series A, G.O. Bond, NATL | | 4.375 | % | | 2/1/2026 | | Aa2 | | | | 1,105,000 | | | 1,136,161 |
Hennepin County, Series A, G.O. Bond | | 4.500 | % | | 12/1/2025 | | Aaa | | | | 1,500,000 | | | 1,561,125 |
Minnesota, G.O. Bond | | 5.000 | % | | 8/1/2013 | | Aa1 | | | | 2,000,000 | | | 2,276,180 |
Pine County, Series A, G.O. Bond, FGRNA | | 4.400 | % | | 2/1/2028 | | AAA | 2 | | | 555,000 | | | 564,407 |
Western Minnesota Municipal Power Agency, Revenue Bond | | 6.625 | % | | 1/1/2016 | | Aaa | | | | 175,000 | | | 203,292 |
| | | | | | | | | | | | | | |
| | | | | | | | | | | | | | 5,741,165 |
| | | | | | | | | | | | | | |
MISSISSIPPI - 0.2% | | | | | | | | | | | | | | |
Biloxi Public School District, Revenue Bond, NATL | | 5.000 | % | | 4/1/2017 | | A3 | | | | 500,000 | | | 510,350 |
| | | | | | | | | | | | | | |
MISSOURI - 1.5% | | | | | | | | | | | | | | |
Columbia Water & Electric, Series A, Revenue Bond | | 4.125 | % | | 10/1/2033 | | AA | 2 | | | 995,000 | | | 931,459 |
Missouri Water Pollution Control, Series A, G.O. bond | | 4.500 | % | | 12/1/2030 | | Aaa | | | | 2,375,000 | | | 2,472,826 |
| | | | | | | | | | | | | | |
| | | | | | | | | | | | | | 3,404,285 |
| | | | | | | | | | | | | | |
| | |
| The accompanying notes are an integral part of the financial statements. | | 10 |
Investment Portfolio - December 31, 2009
| | | | | | | | | | | | | |
| | | Coupon
Rate | | | Maturity
Date | | Credit
Rating1
(unaudited) | | Principal
Amount | | Value
(Note 2) |
| | | | | | | | | | | | | |
| | | | | |
MUNICIPAL BONDS (continued) | | | | | | | | | | | | | |
| | | | | |
NEBRASKA - 1.4% | | | | | | | | | | | | | |
Omaha Metropolitan Utilities District, Series A, Revenue Bond, AGM | | 4.375 | % | | 12/1/2031 | | Aa3 | | $ | 2,640,000 | | $ | 2,547,838 |
Omaha Public Power District, Series AA, Revenue Bonds, FGRNA | | 4.500 | % | | 2/1/2034 | | Aa2 | | | 810,000 | | | 783,359 |
| | | | | | | | | | | | | |
| | | | | | | | | | | | | 3,331,197 |
| | | | | | | | | | | | | |
NEVADA - 3.8% | | | | | | | | | | | | | |
Clark County Transportation, Series A, G.O. Bond, FGRNA | | 4.500 | % | | 12/1/2019 | | Aa1 | | | 500,000 | | | 500,405 |
Clark County, G.O. Bond, AGM | | 4.750 | % | | 6/1/2027 | | Aa1 | | | 3,000,000 | | | 3,046,290 |
Las Vegas Valley Water District, Water Impt., Series A, G.O. Bond, AGM | | 4.750 | % | | 6/1/2033 | | Aa2 | | | 1,500,000 | | | 1,481,145 |
Nevada State, Capital Impt., G.O. Bond | | 5.000 | % | | 6/1/2019 | | Aa2 | | | 2,040,000 | | | 2,224,069 |
Nevada State, Project Nos. 66 & 67, Unrefunded Balance, Series A, G.O. Bond, FGRNA | | 5.000 | % | | 5/15/2028 | | Aa2 | | | 125,000 | | | 125,068 |
North Las Vegas, G.O. Bond, NATL | | 5.000 | % | | 5/1/2024 | | A1 | | | 1,500,000 | | | 1,545,015 |
| | | | | | | | | | | | | |
| | | | | | | | | | | | | 8,921,992 |
| | | | | | | | | | | | | |
NEW HAMPSHIRE - 0.4% | | | | | | | | | | | | | |
New Hampshire Municipal Bond Bank, Series D, Revenue Bond | | 4.625 | % | | 7/15/2039 | | Aa2 | | | 835,000 | | | 835,301 |
| | | | | | | | | | | | | |
NEW JERSEY - 2.7% | | | | | | | | | | | | | |
East Brunswick Township Board of Education, G.O. Bond, AGM | | 4.500 | % | | 11/1/2028 | | Aa2 | | | 835,000 | | | 856,050 |
East Brunswick Township Board of Education, G.O. Bond, AGM | | 4.500 | % | | 11/1/2029 | | Aa2 | | | 1,000,000 | | | 1,018,440 |
Hudson County, G.O. Bond, CIFG | | 4.250 | % | | 9/1/2021 | | A3 | | | 930,000 | | | 959,937 |
Morris County Impt. Authority, School District, Morris Hills Regional District, Revenue Bond | | 3.700 | % | | 10/1/2018 | | Aaa | | | 540,000 | | | 558,004 |
New Jersey Transportation Trust Fund Authority, Transportation System, Series A, Revenue Bond, AGM | | 4.250 | % | | 12/15/2022 | | Aa3 | | | 2,000,000 | | | 2,000,720 |
Sparta Township School District, G.O. Bond, AGM | | 4.300 | % | | 2/15/2030 | | Aa2 | | | 1,000,000 | | | 990,910 |
| | | | | | | | | | | | | |
| | | | | | | | | | | | | 6,384,061 |
| | | | | | | | | | | | | |
| | |
| 11 | | The accompanying notes are an integral part of the financial statements. |
Investment Portfolio - December 31, 2009
| | | | | | | | | | | | | | |
| | | Coupon
Rate | | | Maturity
Date | | Credit
Rating1
(unaudited) | | | Principal
Amount | | Value
(Note 2) |
| | | | | | | | | | | | | | |
| | | | | |
MUNICIPAL BONDS (continued) | | | | | | | | | | | | | | |
| | | | | |
NEW MEXICO - 0.3% | | | | | | | | | | | | | | |
New Mexico Finance Authority, Public Project Revolving Fund, Series A-1, Revenue Bond, NATL | | 3.250 | % | | 6/1/2013 | | Aa2 | | | $ | 700,000 | | $ | 742,014 |
| | | | | | | | | | | | | | |
NEW YORK - 4.7% | | | | | | | | | | | | | | |
Hampton Bays Union Free School District, G.O. Bond, AGM | | 4.375 | % | | 9/15/2029 | | Aa3 | | | | 2,225,000 | | | 2,247,428 |
New York City Municipal Water Finance Authority, Water & Sewer Systems, Series A, Revenue Bond | | 5.750 | % | | 6/15/2040 | | Aa2 | | | | 2,590,000 | | | 2,891,735 |
New York City Municipal Water Finance Authority, Water & Sewer Systems, Series E, Revenue Bond, FGRNA | | 5.000 | % | | 6/15/2026 | | Aa2 | | | | 750,000 | | | 761,978 |
New York State Dormitory Authority, University of Rochester, Series E, Revenue Bond | | 4.000 | % | | 7/1/2022 | | Aa3 | | | | 930,000 | | | 925,024 |
New York State Urban Development Corp., Series B, Revenue Bond, NATL | | 5.000 | % | | 1/1/2019 | | WR | 3 | | | 1,000,000 | | | 1,093,560 |
Port Authority of New York & New Jersey, Revenue Bond | | 4.500 | % | | 10/15/2037 | | Aa3 | | | | 1,000,000 | | | 973,630 |
Sachem Central School District of Holbrook, G.O. Bond, FGRNA | | 4.375 | % | | 10/15/2030 | | AA | 2 | | | 2,000,000 | | | 1,998,520 |
| | | | | | | | | | | | | | |
| | | | | | | | | | | | | | 10,891,875 |
| | | | | | | | | | | | | | |
NORTH CAROLINA - 2.3% | | | | | | | | | | | | | | |
Charlotte, Series B, Revenue Bond | | 4.625 | % | | 7/1/2039 | | Aa1 | | | | 1,000,000 | | | 1,009,530 |
Mecklenburg County, Public Impt., Series A, G.O. Bond | | 4.125 | % | | 2/1/2022 | | Aaa | | | | 1,455,000 | | | 1,508,995 |
North Carolina Grant Anticipation, Revenue Bond, NATL | | 4.000 | % | | 3/1/2018 | | Aa3 | | | | 1,355,000 | | | 1,427,086 |
North Carolina Municipal Power Agency No. 1 Catawba, Series A, Revenue Bond | | 5.000 | % | | 1/1/2030 | | A2 | | | | 1,000,000 | | | 1,021,070 |
Wilson, Prerefunded Balance, G.O. Bond, AMBAC | | 5.100 | % | | 6/1/2019 | | A1 | | | | 400,000 | | | 415,948 |
| | | | | | | | | | | | | | |
| | | | | | | | | | | | | | 5,382,629 |
| | | | | | | | | | | | | | |
NORTH DAKOTA - 0.8% | | | | | | | | | | | | | | |
Fargo, Series A, G.O. Bond, NATL | | 4.700 | % | | 5/1/2030 | | Aa2 | | | | 1,840,000 | | | 1,880,811 |
| | | | | | | | | | | | | | |
| | |
| The accompanying notes are an integral part of the financial statements. | | 12 |
Investment Portfolio - December 31, 2009
| | | | | | | | | | | | | | |
| | | Coupon
Rate | | | Maturity
Date | | Credit
Rating1
(unaudited) | | | Principal
Amount | | Value
(Note 2) |
| | | | | | | | | | | | | | |
| | | | | |
MUNICIPAL BONDS (continued) | | | | | | | | | | | | | | |
| | | | | |
OHIO - 3.7% | | | | | | | | | | | | | | |
Brookville Local School District, School Impt., G.O. Bond, AGM | | 4.125 | % | | 12/1/2026 | | Aa3 | | | $ | 660,000 | | $ | 650,885 |
Columbus City School District, Facilities Construction & Impt., G.O. Bond, AGM | | 4.375 | % | | 12/1/2032 | | Aa3 | | | | 1,000,000 | | | 956,010 |
Columbus, Limited Tax, Series 2, G.O. Bond | | 5.000 | % | | 7/1/2017 | | Aaa | | | | 1,000,000 | | | 1,138,980 |
Licking Heights Local School District, School Facilities Construction & Impt., Series A, G.O. Bond, NATL | | 5.000 | % | | 12/1/2022 | | A1 | | | | 1,450,000 | | | 1,534,970 |
Newark City School District, School Impt., G.O. Bond, FGRNA | | 4.250 | % | | 12/1/2027 | | A3 | | | | 500,000 | | | 486,520 |
Ohio State Conservation Project, Series A, G.O. Bond | | 5.000 | % | | 3/1/2015 | | Aa2 | | | | 1,000,000 | | | 1,147,690 |
Pickerington Local School District, School Facilities Construction & Impt., G.O. Bond, NATL | | 4.250 | % | | 12/1/2034 | | A1 | | | | 2,500,000 | | | 2,432,425 |
Springfield City School District, Prerefunded Balance, G.O. Bond, FGIC | | 5.200 | % | | 12/1/2023 | | Baa1 | | | | 325,000 | | | 358,742 |
| | | | | | | | | | | | | | |
| | | | | | | | | | | | | | 8,706,222 |
| | | | | | | | | | | | | | |
OKLAHOMA - 1.3% | | | | | | | | | | | | | | |
Oklahoma City Water Utilities Trust, Series A, Revenue Bond | | 4.125 | % | | 7/1/2039 | | Aa2 | | | | 1,000,000 | | | 943,770 |
Oklahoma City, G.O. Bond, NATL | | 4.250 | % | | 3/1/2023 | | Aa1 | | | | 2,000,000 | | | 2,066,420 |
| | | | | | | | | | | | | | |
| | | | | | | | | | | | | | 3,010,190 |
| | | | | | | | | | | | | | |
OREGON - 2.2% | | | | | | | | | | | | | | |
Metro, G.O. Bond | | 5.000 | % | | 6/1/2022 | | Aaa | | | | 3,000,000 | | | 3,344,490 |
Salem Water & Sewer, Revenue Bond, AGM | | 5.000 | % | | 5/1/2014 | | Aa3 | | | | 1,120,000 | | | 1,270,786 |
Washington County School District No. 15 Forest Grove, Prerefunded Balance, G.O. Bond, AGM | | 5.500 | % | | 6/15/2017 | | Aa2 | | | | 500,000 | | | 535,575 |
| | | | | | | | | | | | | | |
| | | | | | | | | | | | | | 5,150,851 |
| | | | | | | | | | | | | | |
PENNSYLVANIA - 3.4% | | | | | | | | | | | | | | |
Allegheny County, Series C-62B, G.O. Bond | | 5.000 | % | | 11/1/2029 | | A3 | | | | 750,000 | | | 780,697 |
Erie Water Authority, Series 2006, Revenue Bond, AGM | | 5.000 | % | | 12/1/2036 | | AAA | 2 | | | 1,000,000 | | | 1,022,730 |
Jenkintown School District, Series A, G.O. Bond, FGRNA | | 4.500 | % | | 5/15/2032 | | A | 2 | | | 1,000,000 | | | 979,230 |
Lancaster School District, G.O. Bond, AGM | | 5.000 | % | | 6/1/2019 | | Aa3 | | | | 1,200,000 | | | 1,320,684 |
| | |
| 13 | | The accompanying notes are an integral part of the financial statements. |
Investment Portfolio - December 31, 2009
| | | | | | | | | | | | | | |
| | | Coupon
Rate | | | Maturity
Date | | Credit
Rating1
(unaudited) | | | Principal
Amount | | Value
(Note 2) |
| | | | | | | | | | | | | | |
| | | | | |
MUNICIPAL BONDS (continued) | | | | | | | | | | | | | | |
| | | | | |
PENNSYLVANIA (continued) | | | | | | | | | | | | | | |
Pennsylvania Turnpike Commission, Prerefunded Balance, Revenue Bond, AMBAC | | 5.375 | % | | 7/15/2019 | | A1 | | | $ | 530,000 | | $ | 573,879 |
Philadelphia, Water & Wastewater, Prerefunded Balance, Revenue Bond, NATL | | 5.600 | % | | 8/1/2018 | | A | 2 | | | 20,000 | | | 23,202 |
Philadelphia, Water & Wastewater, Series A, Revenue Bond, AMRAG | | 5.000 | % | | 8/1/2021 | | Aa3 | | | | 1,000,000 | | | 1,069,480 |
Plum Boro School District, Series A, G.O. Bond, FGRNA | | 4.500 | % | | 9/15/2030 | | A | 2 | | | 855,000 | | | 851,529 |
Uniontown Area School District, G.O. Bond, AGM | | 4.350 | % | | 10/1/2034 | | Aa3 | | | | 1,500,000 | | | 1,394,130 |
| | | | | | | | | | | | | | |
| | | | | | | | | | | | | | 8,015,561 |
| | | | | | | | | | | | | | |
RHODE ISLAND - 0.4% | | | | | | | | | | | | | | |
Rhode Island Clean Water Finance Agency, Series A, Revenue Bond, NATL | | 5.000 | % | | 10/1/2035 | | Baa1 | | | | 1,000,000 | | | 944,630 |
| | | | | | | | | | | | | | |
SOUTH CAROLINA - 3.9% | | | | | | | | | | | | | | |
Beaufort County, G.O. Bond, NATL | | 4.250 | % | | 3/1/2024 | | Aa2 | | | | 790,000 | | | 807,901 |
Charleston County, Transportation Sales Tax, G.O. Bond | | 5.000 | % | | 11/1/2017 | | Aa1 | | | | 1,000,000 | | | 1,139,180 |
Lexington Waterworks & Sewer System, Revenue Bond, AGC | | 5.000 | % | | 1/15/2039 | | Aa3 | | | | 1,565,000 | | | 1,585,940 |
South Carolina Transportation Infrastructure Bank, Series B, Revenue Bond, AMBAC | | 4.250 | % | | 10/1/2027 | | A1 | | | | 2,000,000 | | | 1,907,180 |
South Carolina, State Institutional - South Carolina State University, Series D, G.O. Bond | | 4.250 | % | | 10/1/2026 | | Aaa | | | | 1,250,000 | | | 1,287,663 |
Spartanburg Sanitation Sewer District, Series B, Revenue Bond, NATL | | 5.000 | % | | 3/1/2032 | | A3 | | | | 1,500,000 | | | 1,519,590 |
Sumter, Water Utility Impt., Revenue Bond, XLCA | | 4.500 | % | | 12/1/2032 | | A3 | | | | 1,000,000 | | | 962,580 |
| | | | | | | | | | | | | | |
| | | | | | | | | | | | | | 9,210,034 |
| | | | | | | | | | | | | | |
TEXAS - 5.9% | | | | | | | | | | | | | | |
Alamo Community College District, Series A, G.O. Bond, NATL | | 5.000 | % | | 8/15/2024 | | Aa2 | | | | 1,020,000 | | | 1,079,874 |
Alvin Independent School District, G.O. Bond | | 4.375 | % | | 2/15/2024 | | Aaa | | | | 750,000 | | | 773,662 |
Canyon Independent School District, School Building, G.O. Bond | | 4.700 | % | | 2/15/2025 | | AAA | 2 | | | 1,440,000 | | | 1,520,050 |
| | |
| The accompanying notes are an integral part of the financial statements. | | 14 |
Investment Portfolio - December 31, 2009
| | | | | | | | | | | | | | |
| | | Coupon
Rate | | | Maturity
Date | | Credit
Rating1
(unaudited) | | | Principal
Amount | | Value
(Note 2) |
| | | | | | | | | | | | | | |
| | | | | |
MUNICIPAL BONDS (continued) | | | | | | | | | | | | | | |
| | | | | |
TEXAS (continued) | | | | | | | | | | | | | | |
Clear Creek Independent School District, G.O. Bond, AGM | | 4.000 | % | | 2/15/2029 | | Aa3 | | | $ | 2,340,000 | | $ | 2,211,043 |
Del Valle Independent School District, School Building, G.O. Bond | | 5.000 | % | | 6/15/2019 | | AAA | 2 | | | 1,845,000 | | | 2,048,300 |
Fort Bend County, G.O. Bond, NATL | | 4.750 | % | | 3/1/2031 | | Aa2 | | | | 1,000,000 | | | 1,012,670 |
Huntsville Independent School District, G.O. Bond | | 4.500 | % | | 2/15/2029 | | Aaa | | | | 1,220,000 | | | 1,237,214 |
McKinney Waterworks & Sewer, Revenue Bond, FGRNA | | 4.750 | % | | 3/15/2024 | | Aa3 | | | | 1,000,000 | | | 1,024,710 |
San Antonio Water, Revenue Bond, FRGNA | | 4.375 | % | | 5/15/2029 | | Aa2 | | | | 1,400,000 | | | 1,368,612 |
University of Texas Financing System, Series F, Revenue Bond | | 4.750 | % | | 8/15/2028 | | Aaa | | | | 1,000,000 | | | 1,046,670 |
Waller Consolidated Independent School District, G.O. Bond | | 4.750 | % | | 2/15/2023 | | Aaa | | | | 500,000 | | | 506,240 |
| | | | | | | | | | | | | | |
| | | | | | | | | | | | | | 13,829,045 |
| | | | | | | | | | | | | | |
UTAH - 1.5% | | | | | | | | | | | | | | |
Mountain Regional Water Special Service District, Revenue Bond, NATL | | 5.000 | % | | 12/15/2030 | | Baa1 | | | | 1,240,000 | | | 1,196,278 |
Provo City School District, Series B, G.O. Bond | | 4.000 | % | | 6/15/2014 | | Aaa | | | | 1,100,000 | | | 1,217,788 |
St. George, Parks and Recreation, G.O. Bond, AMBAC | | 4.000 | % | | 8/1/2019 | | Aa3 | | | | 795,000 | | | 816,425 |
Utah State Building Ownership Authority, Series C, Revenue Bond, AGM | | 5.500 | % | | 5/15/2011 | | Aa1 | | | | 300,000 | | | 320,019 |
| | | | | | | | | | | | | | |
| | | | | | | | | | | | | | 3,550,510 |
| | | | | | | | | | | | | | |
VERMONT - 0.5% | | | | | | | | | | | | | | |
Vermont, Series D, G.O. Bond | | 4.500 | % | | 7/15/2025 | | Aaa | | | | 1,000,000 | | | 1,060,240 |
| | | | | | | | | | | | | | |
VIRGINIA - 3.1% | | | | | | | | | | | | | | |
Fairfax County, Public Impt., Series A, G.O. Bond | | 4.000 | % | | 4/1/2017 | | Aaa | | | | 2,000,000 | | | 2,154,660 |
Fairfax County, Public Impt., Series A, G.O. Bond | | 4.250 | % | | 4/1/2027 | | Aaa | | | | 1,500,000 | | | 1,537,530 |
Norfolk, Capital Impt., G.O. Bond, FGRNA | | 4.250 | % | | 10/1/2024 | | A1 | | | | 2,500,000 | | | 2,545,625 |
Norfolk, Capital Impt., G.O. Bond, NATL | | 4.375 | % | | 3/1/2024 | | A1 | | | | 685,000 | | | 702,865 |
Richmond, Series B, G.O. Bond, AGM | | 4.750 | % | | 7/15/2023 | | Aa3 | | | | 400,000 | | | 415,948 |
| | | | | | | | | | | | | | |
| | | | | | | | | | | | | | 7,356,628 |
| | | | | | | | | | | | | | |
| | |
| 15 | | The accompanying notes are an integral part of the financial statements. |
Investment Portfolio - December 31, 2009
| | | | | | | | | | | | | | |
| | | Coupon
Rate | | | Maturity
Date | | Credit
Rating1
(unaudited) | | | Principal
Amount | | Value
(Note 2) |
| | | | | | | | | | | | | | |
| | | | | |
MUNICIPAL BONDS (continued) | | | | | | | | | | | | | | |
| | | | | |
WASHINGTON - 5.0% | | | | | | | | | | | | | | |
Franklin County, G.O. Bond, FGRNA | | 5.125 | % | | 12/1/2022 | | A | 2 | | $ | 1,000,000 | | $ | 1,010,600 |
Grant County Public Utility District No. 2 Priest Rapids, Series A, Revenue Bond, NATL | | 5.000 | % | | 1/1/2043 | | Aa2 | | | | 1,000,000 | | | 1,009,400 |
King County School District No. 411 Issaquah, Series A, G.O. Bond, AGM | | 5.250 | % | | 12/1/2018 | | Aa1 | | | | 2,420,000 | | | 2,671,656 |
King County Sewer, G.O. Bond, FGRNA | | 5.000 | % | | 1/1/2035 | | Aa1 | | | | 1,255,000 | | | 1,295,863 |
King County Sewer, Revenue Bond, AGM | | 5.000 | % | | 1/1/2024 | | Aa3 | | | | 1,460,000 | | | 1,572,420 |
King County Sewer, Series A, Revenue Bond, NATL | | 4.500 | % | | 1/1/2032 | | Aa3 | | | | 1,070,000 | | | 1,053,832 |
Seattle, Drain & Wastewater, Revenue Bond, NATL | | 4.375 | % | | 2/1/2026 | | Aa2 | | | | 2,000,000 | | | 2,009,020 |
Washington State, Motor Vehicle Fuel Tax, G.O. Bond, AMBAC | | 5.000 | % | | 1/1/2025 | | Aa1 | | | | 1,000,000 | | | 1,078,250 |
| | | | | | | | | | | | | | |
| | | | | | | | | | | | | | 11,701,041 |
| | | | | | | | | | | | | | |
WEST VIRGINIA - 0.3% | | | | | | | | | | | | | | |
West Virginia State Water Development Authority, Series A, Revenue Bond, FGRNA. | | 4.250 | % | | 11/1/2026 | | A | 2 | | | 820,000 | | | 806,396 |
| | | | | | | | | | | | | | |
WISCONSIN - 2.7% | | | | | | | | | | | | | | |
Central Brown County Water Authority, Water Systems, Revenue Bond, AMBAC | | 5.000 | % | | 12/1/2035 | | A | 2 | | | 1,500,000 | | | 1,507,560 |
Eau Claire, Series B, G.O. Bond, NATL | | 4.000 | % | | 4/1/2015 | | Aa2 | | | | 1,195,000 | | | 1,319,543 |
Madison, Water Utility Impt., Series A, Revenue Bond | | 4.250 | % | | 1/1/2030 | | Aa2 | | | | 1,000,000 | | | 979,400 |
Oshkosh, Corporate Purposes, Series A, G.O. Bond, FGRNA | | 5.050 | % | | 12/1/2021 | | Aa3 | | | | 450,000 | | | 477,265 |
Stoughton Area School District, G.O. Bond, FGRNA | | 4.875 | % | | 4/1/2016 | | A1 | | | | 500,000 | | | 523,125 |
Wisconsin Public Power, Inc., Series A, Revenue Bond, AMBAC | | 5.000 | % | | 7/1/2035 | | A1 | | | | 870,000 | | | 858,890 |
Wisconsin State Transportation, Series A, Revenue Bond, AGM | | 5.000 | % | | 7/1/2025 | | Aa3 | | | | 700,000 | | | 736,197 |
| | | | | | | | | | | | | | |
| | | | | | | | | | | | | | 6,401,980 |
| | | | | | | | | | | | | | |
| | |
| The accompanying notes are an integral part of the financial statements. | | 16 |
Investment Portfolio - December 31, 2009
| | | | | | | | | | | | | |
| | | Coupon
Rate | | | Maturity
Date | | Credit
Rating1
(unaudited) | | Principal
Amount/ Shares | | Value
(Note 2) |
| | | | | | | | | | | | | |
| | | | | |
MUNICIPAL BONDS (continued) | | | | | | | | | | | | | |
| | | | | |
WYOMING - 0.3% | | | | | | | | | | | | | |
Wyoming Municipal Power Agency, Series A, Revenue Bond | | 5.375 | % | | 1/1/2042 | | A2 | | $ | 710,000 | | $ | 718,513 |
| | | | | | | | | | | | | |
TOTAL MUNICIPAL BONDS
(Identified Cost $220,520,684) | | | | | | | | | | | | | 224,992,641 |
| | | | | | | | | | | | | |
SHORT-TERM INVESTMENTS - 2.7% | | | | | | | | | | | | | |
Dreyfus AMT - Free Municipal Reserves - Class R
(Identified Cost $6,448,170) | | | | | | | | | | 6,448,170 | | | 6,448,170 |
| | | | | | | | | | | | | |
TOTAL INVESTMENTS - 98.7%
(Identified Cost $226,968,854) | | | | | | | | | | | | | 231,440,811 |
| | | | | |
OTHER ASSETS, LESS LIABILITIES - 1.3% | | | | | | | | | | | | | 3,045,220 |
| | | | | | | | | | | | | |
NET ASSETS - 100% | | | | | | | | | | | | $ | 234,486,031 |
| | | | | | | | | | | | | |
KEY:
G.O. Bond - General Obligation Bond
Impt. - Improvement
No. - Number
Scheduled principal and interest payments are guaranteed by:
AGC (Assurance Guaranty Corp.)
AGM (Assurance Guaranty Municipal Corp.) (formerly known as FSA (Financial Security Assurance, Inc.))
AMBAC (AMBAC Assurance Corp.)
AMRAG (AMBAC reinsured by AGC)
CIFG (CIFG North America, Inc.)
FGIC (Financial Guaranty Insurance Co.)
FGRNA (FGIC reinsured by NATL)
NATL (National Public Finance Guarantee Corp.)
XLCA (XL Capital Assurance)
The insurance does not guarantee the market value of the municipal bonds.
1Credit ratings from Moody’s (unaudited).
2Credit ratings from S&P (unaudited).
3Credit rating has been withdrawn. As of December 31, 2009, there is no rating available.
The Series’ portfolio holds, as a percentage of net assets, greater than 10% in bonds insured by the following companies: NATL - 33.6%; AGM - 21.1%.
| | |
| 17 | | The accompanying notes are an integral part of the financial statements. |
Statement of Assets and Liabilities
December 31, 2009
| | | |
ASSETS: | | | |
| | | |
| |
Investments, at value (identified cost $226,968,854) (Note 2) | | $ | 231,440,811 |
Interest receivable | | | 2,810,978 |
Receivable for fund shares sold | | | 557,102 |
| | | |
TOTAL ASSETS | | | 234,808,891 |
| | | |
LIABILITIES: | | | |
| |
Accrued management fees (Note 3) | | | 97,708 |
Accrued fund accounting and transfer agent fees (Note 3) | | | 14,740 |
Accrued directors fees (Note 3) | | | 3,143 |
Accrued Chief Compliance Officer service fees (Note 3) | | | 476 |
Payable for fund shares repurchased | | | 166,501 |
Audit fees payable | | | 31,227 |
Other payables and accrued expenses | | | 9,065 |
| | | |
TOTAL LIABILITIES | | | 322,860 |
| | | |
TOTAL NET ASSETS | | | $234,486,031 |
| | | |
NET ASSETS CONSIST OF: | | | |
| |
Capital stock | | $ | 209,975 |
Additional paid-in-capital | | | 228,141,547 |
Undistributed net investment income | | | 1,659,323 |
Accumulated net realized gain on investments | | | 3,229 |
Net unrealized appreciation on investments | | | 4,471,957 |
| | | |
TOTAL NET ASSETS | | $ | 234,486,031 |
| | | |
NET ASSET VALUE, OFFERING PRICE AND REDEMPTION
PRICE PER SHARE - Class A ($234,486,031/20,997,466 shares) | | $ | 11.17 |
| | | |
| | |
| The accompanying notes are an integral part of the financial statements. | | 18 |
Statement of Operations
For the Year Ended December 31, 2009
| | | | |
INVESTMENT INCOME: | | | | |
| | | | |
| |
Interest | | $ | 8,880,430 | |
Dividends | | | 19,056 | |
| | | | |
Total Investment Income | | | 8,899,486 | |
| | | | |
| EXPENSES: | | | | |
| |
Management fees (Note 3) | | | 1,045,097 | |
Fund accounting and transfer agent fees (Note 3) | | | 125,098 | |
Directors’ fees (Note 3) | | | 12,850 | |
Chief Compliance Officer service fees (Note 3) | | | 3,729 | |
Custodian fees | | | 11,799 | |
Miscellaneous | | | 66,966 | |
| | | | |
Total Expenses | | | 1,265,539 | |
Less reduction of expenses (Note 3) | | | (1,838 | ) |
| | | | |
Net Expenses | | | 1,263,701 | |
| | | | |
NET INVESTMENT INCOME | | | 7,635,785 | |
| | | | |
| REALIZED AND UNREALIZED GAIN ON INVESTMENTS: | | | | |
| |
Net realized gain on investments | | | 243,778 | |
| |
Net change in unrealized appreciation (depreciation) on investments | | | 16,756,505 | |
| | | | |
| |
NET REALIZED AND UNREALIZED GAIN ON
INVESTMENTS | | | 17,000,283 | |
| | | | |
NET INCREASE IN NET ASSETS RESULTING FROM
OPERATIONS | | $ | 24,636,068 | |
| | | | |
| | |
| 19 | | The accompanying notes are an integral part of the financial statements. |
Statement of Changes in Net Assets
| | | | | | | | |
| | | For the
Year Ended
12/31/09 | | | For the
Year Ended
12/31/08 | |
| | | | | | | | |
| INCREASE (DECREASE) IN NET ASSETS: | | | | | | | | |
| | |
| OPERATIONS: | | | | | | | | |
| | |
Net investment income | | $ | 7,635,785 | | | $ | 8,422,128 | |
Net realized gain on investments | | | 243,778 | | | | 670,931 | |
Net change in unrealized appreciation (depreciation) on investments | | | 16,756,505 | | | | (14,523,593 | ) |
| | | | | | | | |
Net increase (decrease) from operations | | | 24,636,068 | | | | (5,430,534 | ) |
| | | | | | | | |
DISTRIBUTIONS TO SHAREHOLDERS (Note 7): | | | | | | | | |
| | |
From net investment income | | | (8,260,550 | ) | | | (7,556,016 | ) |
From net realized gain on investments | | | (515,923 | ) | | | (368,882 | ) |
| | | | | | | | |
Total distributions to shareholders | | | (8,776,473 | ) | | | (7,924,898 | ) |
| | | | | | | | |
| CAPITAL STOCK ISSUED AND REPURCHASED: | | | | | | | | |
| | |
Net increase (decrease) from capital share transactions (Note 5) | | | 20,890,861 | | | | (24,617,544 | ) |
| | | | | | | | |
Net increase (decrease) in net assets | | | 36,750,456 | | | | (37,972,976 | ) |
| | |
| NET ASSETS: | | | | | | | | |
| | |
Beginning of year | | | 197,735,575 | | | | 235,708,551 | |
| | | | | | | | |
End of year (including undistributed net investment income of $1,659,323 and $2,267,915, respectively) | | $ | 234,486,031 | | | $ | 197,735,575 | |
| | | | | | | | |
| | |
| The accompanying notes are an integral part of the financial statements. | | 20 |
Financial Highlights
| | | | | | | | | | |
| | | | | For the Years Ended | | |
| | | 12/31/09 | | 12/31/08 | | 12/31/07 | | 12/31/06 | | 12/31/05 |
| | | | | | | | | | |
| | | | | | | | | | |
| Per share data (for a share outstanding throughout each year): | | | | | | | | | | |
Net asset value - Beginning of year | | $10.34 | | $10.92 | | $10.95 | | $10.90 | | $10.99 |
| | | | | | | | | | |
Income (loss) from investment operations: | | | | | | | | | | |
Net investment income | | 0.401 | | 0.42 | | 0.36 | | 0.37 | | 0.37 |
Net realized and unrealized gain (loss) on investments | | 0.90 | | (0.62) | | (0.02) | | 0.05 | | (0.09) |
| | | | | | | | | | |
Total from investment operations | | 1.30 | | (0.20) | | 0.34 | | 0.42 | | 0.28 |
| | | | | | | | | | |
Less distributions to shareholders: | | | | | | | | | | |
From net investment income | | (0.44) | | (0.36) | | (0.37) | | (0.36) | | (0.36) |
From net realized gain on investments | | (0.03) | | (0.02) | | —2 | | (0.01) | | (0.01) |
| | | | | | | | | | |
Total distributions to shareholders | | (0.47) | | (0.38) | | (0.37) | | (0.37) | | (0.37) |
| | | | | | | | | | |
Net asset value - End of year | | $11.17 | | $10.34 | | $10.92 | | $10.95 | | $10.90 |
| | | | | | | | | | |
Net assets - End of year (000’s omitted) | | $234,486 | | $197,736 | | $235,709 | | $167,689 | | $112,965 |
| | | | | | | | | | |
Total return3 | | 12.75% | | (1.79%) | | 3.20% | | 3.94% | | 2.60% |
| Ratios (to average net assets)/Supplemental Data: | | | | | | | | | | |
Expenses | | 0.60%* | | 0.61% | | 0.62% | | 0.66% | | 0.71% |
Net investment income | | 3.65% | | 3.75% | | 3.65% | | 3.71% | | 3.58% |
Portfolio turnover | | 8% | | 7% | | 3% | | 5% | | 2% |
*The investment advisor did not impose all of or a portion of its CCO fees, fund accounting and transfer agent fees during the year ended 12/31/09. If these expenses had been incurred by the Series, the expense ratio (to average net assets) would have been increased by 0.01%.
1Calculated based on average shares outstanding during the year.
2Less than $0.01 per share.
3Represents aggregate total return for the years indicated, and assumes reinvestment of all distributions. Total return would have been lower had certain expenses not been waived during the year ended December 31, 2009.
| | |
| 21 | | The accompanying notes are an integral part of the financial statements. |
Notes to Financial Statements
Diversified Tax Exempt Series (the “Series”) is a no-load diversified series of Manning & Napier Fund, Inc. (the “Fund”). The Fund is organized in Maryland and is registered under the Investment Company Act of 1940, as amended, as an open-end management investment company.
The Series’ investment objective is to provide as high a level of current income exempt from federal income tax as the Advisor believes is consistent with the preservation of capital.
The Fund’s Advisor is Manning & Napier Advisors, Inc. (the “Advisor”). Shares of the Series are offered to investors, clients and employees of the Advisor and its affiliates. The total authorized capital stock of the Fund consists of 10.0 billion shares of common stock each having a par value of $0.01. As of December 31, 2009, 4.6 billion shares have been designated in total among 29 series, of which 100 million have been designated as Diversified Tax Exempt Series Class A common stock.
| 2. | SIGNIFICANT ACCOUNTING POLICIES |
Security Valuation
Municipal securities will normally be valued on the basis of market valuations provided by an independent pricing service (the “Service”). The Service utilizes the latest price quotations and a matrix system (which considers such factors as security prices of similar securities, yields, maturities and ratings). The Service has been approved by the Fund’s Board of Directors (the “Board”).
Short-term investments that mature in sixty days or less are valued at amortized cost, which approximates market value. Investments in open-end investment companies are valued at their net asset value per share on valuation date.
Volume and level of activity in established markets for an asset or liability are evaluated to determine whether recent transactions and quoted prices are determinative of fair value. Where there have been significant decreases in volume and level of activity, further analysis and adjustment may be necessary to estimate fair value. The Series measures fair value in these instances by the use of inputs and valuation techniques which may be based upon current market prices of securities that are comparable in coupon, rating, maturity and industry and/or expectation of future cash flows. As a result of trading in relatively thin markets and/or markets that experience significant volatility, the prices used by the Series to value these securities may differ from the value that would be realized if these securities were sold, and the differences could be material.
Securities for which representative valuations or prices are not available from the Fund’s pricing service may be valued at fair value. Due to the inherent uncertainty of valuations of such securities, the fair value may differ significantly from the values that would have been used had a ready market for such securities existed. If trading or events occurring after the close of the principal market in which securities are traded are expected to materially affect the value of those securities, then they may be valued at their fair value, taking this trading or these events into account. Fair value is determined in good faith by the Advisor under procedures approved by and under the general supervision and responsibility of the Board.
Various inputs are used in determining the value of the Series’ assets or liabilities carried at market value. These inputs are summarized in three broad levels. Level 1 includes quoted prices in active markets for identical assets and liabilities. Level 2 includes other significant observable inputs (including quoted prices for similar securities, interest rates, prepayment speeds, credit risk, etc.). Level 3 includes significant unobservable inputs (including the Series’ own assumptions
Notes to Financial Statements
| 2. | SIGNIFICANT ACCOUNTING POLICIES (continued) |
Security Valuation (continued)
in determining the fair value of investments). The inputs or methodology used for valuing securities are not necessarily an indication of the risk associated with investing in those securities.
The following is a summary of the valuation levels used for major security types as of December 31, 2009 in valuing the Series’ assets or liabilities carried at market value:
| | | | | | | | | | | | |
Description: | | 12/31/09 | | Level 1 | | Level 2 | | Level 3 |
| | | | | | | | | | | | |
Equity securities* | | $ | — | | $ | — | | $ | — | | $ | — |
Preferred securities | | | — | | | — | | | — | | | — |
Debt securities: | | | | | | | | | | | | |
States and political subdivisions (municipals) | | | 224,992,641 | | | — | | | 224,992,641 | | | — |
Mutual funds | | | 6,448,170 | | | 6,448,170 | | | — | | | — |
Other financial instruments** | | | — | | | — | | | — | | | — |
| | | | | | | | | | | | |
Total | | $ | 231,440,811 | | $ | 6,448,170 | | $ | 224,992,641 | | $ | — |
| | | | | | | | | | | | |
*Includes common stock, warrants and rights. Please see the Investment Portfolio for industry classification.
**Other financial instruments are derivative instruments not reflected in the Investment Portfolio, such as futures, forwards and swap contracts, which are valued at the unrealized appreciation/depreciation on the instrument. As of December 31, 2009, the Series did not hold any derivative instruments.
There were no Level 3 securities held by the Series as of December 31, 2008 or December 31, 2009.
Interim and annual reporting periods beginning after December 15, 2009 will require additional disclosure regarding transfers in and/or out of Level 1 and 2. Additional disclosure surrounding the activity in Level 3 fair value measurement will also be effective for fiscal years beginning after December 15, 2010. Management has concluded that this will not have a material impact on the Series’ financial statements.
Security Transactions, Investment Income and Expenses
Security transactions are accounted for on trade date. Dividend income is recorded on the ex-dividend date, except that if the ex-dividend date has passed, certain dividends from foreign securities are recorded as soon as the Fund is informed of the ex-dividend date. Non-cash dividends, if any, are recorded at the fair market value of the securities received. Interest income, including amortization of premium and accretion of discounts using the effective interest method, is earned from settlement date and accrued daily.
Expenses are recorded on an accrual basis. Most expenses of the Fund can be attributed to a specific series. Expenses which cannot be directly attributed are apportioned among the series in the Fund in such a manner as deemed equitable by the Fund’s Board, taking into consideration, among other things, the nature and type of expense.
Notes to Financial Statements
| 2. | SIGNIFICANT ACCOUNTING POLICIES (continued) |
Security Transactions, Investment Income and Expenses (continued)
The Series uses the identified cost method for determining realized gain or loss on investments for both financial statement and federal income tax reporting purposes.
Federal Taxes
The Series’ policy is to comply with the provisions of the Internal Revenue Code applicable to regulated investment companies. The Series is not subject to federal income tax or excise tax to the extent that the Series distributes to shareholders each year its taxable income, including any net realized gains on investments, in accordance with requirements of the Internal Revenue Code. Accordingly, no provision for federal income tax or excise tax has been made in the financial statements.
Management evaluates its tax positions to determine if the tax positions taken meet the minimum recognition threshold in connection with accounting for uncertainties in income tax positions taken or expected to be taken for the purposes of measuring and recognizing tax liabilities in the financial statements. Recognition of tax benefits of an uncertain tax position is required only when the position is “more likely than not” to be sustained assuming examination by taxing authorities. At December 31, 2009, the Series has recorded no liability for net unrecognized tax benefits relating to uncertain income tax positions taken or expected to be taken in future tax returns.
The Series files income tax returns in the U.S. federal jurisdiction and various states, as required. No income tax returns are currently under investigation. The statute of limitations on the Series’ tax returns remains open for the years ended December 31, 2006 through December 31, 2009. The Fund is not aware of any tax positions for which it is reasonably possible that the total amounts of unrecognized tax benefits will significantly change in the next twelve months.
Distributions of Income and Gains
Distributions to shareholders of net investment income are made quarterly. Distributions of net realized gains are made annually. An additional distribution may be necessary to avoid taxation of the Series. Distributions are recorded on the ex-dividend date.
Indemnifications
The Fund’s organizational documents provide former and current directors and officers with a limited indemnification against liabilities arising in connection with the performance of their duties to the Fund. In the normal course of business, the Fund may also enter into contracts that provide general indemnifications. The Fund’s maximum exposure under these arrangements is unknown as this would be dependent on future claims that may be made against the Fund. The risk of material loss from such claims is considered remote.
Other
The preparation of financial statements in conformity with accounting principles generally accepted in the United States of America requires management to make estimates and assumptions that affect the reported amounts of assets and liabilities and the disclosure of contingent assets and liabilities at the date of the financial statements and the reported amounts of income and expenses during the reporting period. Actual results could differ from those estimates.
Notes to Financial Statements
| 3. | TRANSACTIONS WITH AFFILIATES |
The Fund has an Investment Advisory Agreement (the “Agreement”) with the Advisor, for which the Series pays a fee, computed daily and payable monthly, at an annual rate of 0.50% of the Series’ average daily net assets.
Under the Agreement, personnel of the Advisor provide the Series with advice and assistance in the choice of investments and the execution of securities transactions, and otherwise maintain the Series’ organization. The Advisor also provides the Fund with necessary office space and fund administration and support services. The salaries of all officers of the Fund (except a percentage of the Fund’s Chief Compliance Officer’s salary, which is paid by the Fund), and of all Directors who are “affiliated persons” of the Fund, or of the Advisor, and all personnel of the Fund, or of the Advisor, performing services relating to research, statistical and investment activities, are paid by the Advisor. Each “non-affiliated” Director receives an annual stipend, which is allocated among all the active series of the Fund. In addition, these Directors also receive a fee per Board meeting attended for each active series of the Fund plus a fee for each committee meeting attended.
The Advisor has contractually agreed, until at least April 30, 2011, to waive its fee and, if necessary, pay other operating expenses of the Series in order to maintain total direct annual fund operating expenses for the Series at no more than 0.85% of average daily net assets each year. For the year ended December 31, 2009, the Advisor did not waive its management fee or reimburse any expenses of the Series. The Advisor is not eligible to recoup any expenses that have been waived or reimbursed in prior years.
Manning & Napier Investor Services, Inc., a registered broker-dealer affiliate of the Advisor, acts as distributor for the Fund’s shares. The services of Manning & Napier Investor Services, Inc. are provided at no additional cost to the Series.
For fund accounting and transfer agent services through November 7, 2009, the Fund paid the Advisor an annual fee of 0.055% of the Fund’s average daily net assets up to $4.5 billion, 0.03% of the Fund’s average daily net assets between $4.5 billion and $7.5 billion, and 0.02% of the Fund’s average daily net assets over $7.5 billion. Additionally, certain transaction and account-based fees and out-of-pocket expenses, including charges for reporting relating to the Fund’s compliance program, were charged. Expenses not directly attributable to a Series are allocated based on each Series’ relative net assets or number of accounts, depending on the expense. Prior to October 12, 2009 (for sub-accountant) and November 9, 2009 (for sub-transfer agent), the Advisor had an agreement with Citi Fund Services Ohio, Inc. (“Citi”) under which Citi served as sub-accountant and sub-transfer agent. The Advisor voluntarily agreed to waive a portion of the fund accounting and transfer agent fees and the Chief Compliance Officer service fees for the period March 1, 2009 to April 30, 2009. Accordingly, the Advisor waived fees of $1,838, which is included as a reduction of expenses on the Statement of Operations.
The Advisor has entered into agreements dated October 12, 2009 and November 9, 2009 with PNC Global Investment Servicing (U.S.) Inc. (“PNCGIS”) under which PNCGIS serves as sub-accountant services agent and sub-transfer agent, respectively. Effective November 7, 2009 under the amended master services agreement, the Fund pays the Advisor an annual fee of 0.0175% on the first $3 billion of average daily net assets (excluding Target Series); 0.015% on the next $3 billion of average daily net assets (excluding Target Series); and 0.01% of the average daily net assets in excess of $6 billion (excluding Target Series); plus a base fee of $25,500 per Series. Additionally, certain transaction-, account-, and cusip-based fees and out-of-pocket expenses, including charges for reporting relating to the Fund’s compliance program, are charged.
Notes to Financial Statements
| 4. | PURCHASES AND SALES OF SECURITIES |
For the year ended December 31, 2009, purchases and sales of securities, other than United States Government securities and short-term securities, were $30,151,587 and $15,981,092, respectively. There were no purchases or sales of United States Government securities.
| 5. | CAPITAL STOCK TRANSACTIONS |
Transactions in shares of Diversified Tax Exempt Series were:
| | | | | | | | | | | | | | |
| | | For the Year
Ended 12/31/09 | | | For the Year
Ended 12/31/08 | |
| | | Shares | | | Amount | | | Shares | | | Amount | |
| |
|
| |
|
|
| |
|
| | | | |
Sold | | 4,637,961 | | | $ | 51,174,088 | | | 3,614,800 | | | $ | 38,536,015 | |
Reinvested | | 749,319 | | | | 8,166,096 | | | 708,211 | | | | 7,370,140 | |
Repurchased | | (3,520,939 | ) | | | (38,449,323 | ) | | (6,773,780 | ) | | | (70,523,699 | ) |
| | | | | | | | | | | | | | |
Total | | 1,866,341 | | | $ | 20,890,861 | | | (2,450,769 | ) | | $ | (24,617,544 | ) |
| | | | | | | | | | | | | | |
Substantially all of the Series’ shares represent investments by fiduciary accounts over which the Advisor has sole investment discretion.
The Series may trade in instruments including written and purchased options, forward foreign currency exchange contracts and futures contracts and other derivatives in the normal course of investing activities to assist in managing exposure to various market risks. The Series may be subject to various elements of risk and may involve, to a varying degree, elements of risk in excess of the amounts recognized for financial statement purposes; the risk that changes in the value of a derivative may not correlate perfectly with the underlying asset, rate or index; counterparty credit risk related to over the counter derivatives counterparties failure to perform under contract terms; liquidity risk related to the lack of a liquid market for these contracts allowing the fund to close out its position(s); and documentation risk relating to disagreement over contract terms. No such investments were held by the Series during the year ended December 31, 2009.
| 7. | FEDERAL INCOME TAX INFORMATION |
The amount and characterization of certain income and capital gains to be distributed are determined in accordance with federal income tax regulations, which may differ from accounting principles generally accepted in the United States of America. These differences are primarily due to differing book and tax treatments in the timing of the recognition of net investment income or gains and losses, including market discount. The Series may periodically make reclassifications among its capital accounts to reflect income and gains available for distribution (or available capital loss carryovers) under income tax regulations without impacting the Series’ net asset value. Any such reclassifications are not reflected in the financial highlights.
Notes to Financial Statements
| 7. | FEDERAL INCOME TAX INFORMATION (continued) |
The tax character of distributions paid were as follows:
| | | | | | | |
| | | For the Year
Ended 12/31/09 | | For the Year
Ended 12/31/08 | |
Ordinary income | | $ | 42,152 | | $ | 50,039 | |
Tax exempt income | | | 8,218,398 | | | 7,521,726 | |
Long-term capital gains | | | 515,923 | | | 353,133 | |
At December 31, 2009, the tax basis components of distributable earnings and the net unrealized appreciation based on identified cost for federal income tax purposes were as follows: | |
Cost for federal income tax purposes | | | | | $ | 226,931,968 | |
Unrealized appreciation | | | | | $ | 6,483,769 | |
Unrealized depreciation | | | | | | (1,974,926 | ) |
| | | | | | | |
Net unrealized appreciation | | | | | $ | 4,508,843 | |
Undistributed tax exempt income | | | | | | 1,622,437 | |
Undistributed long-term capital gains | | | | | | 3,229 | |
On February 2, 2010, the PNC Financial Services Group, Inc. (“PNC”), which serves as the Series’ sub-accountant services agent and sub-transfer agent, entered into a Stock Purchase Agreement (the “Stock Purchase Agreement”) with The Bank of New York Mellon Corporation (“BNY Mellon”), the Series’ custodian. Upon the terms and subject to the conditions set forth in the Stock Purchase Agreement, which has been approved by the board of directors of each company, PNC will sell to BNY Mellon (the “Stock Sale”) 100% of the issued and outstanding shares of PNC Global Investment Servicing, Inc., an indirect, wholly-owned subsidiary of PNC. The Stock Sale is expected to close in the third quarter of 2010. Management has concluded that this will not have a material impact on the Series’ financial statements.
There were no other subsequent events that require recognition or disclosure. In preparing these financial statements, management of the Fund has evaluated events and transactions for potential recognition or disclosure through February 23, 2010, the date the financial statements were issued.
Report of Independent Registered Public Accounting Firm
To the Board of Directors of Manning & Napier Fund, Inc. and Shareholders of Diversified Tax Exempt Series:
In our opinion, the accompanying statement of assets and liabilities, including the investment portfolio (except for credit ratings), and the related statements of operations and of changes in net assets and the financial highlights present fairly, in all material respects, the financial position of the Diversified Tax Exempt Series (a series of Manning & Napier Fund, Inc., hereafter referred to as the “Series”) at December 31, 2009, and the results of its operations for the year then ended, the changes in its net assets for each of the two years in the period then ended and the financial highlights for each of the five years in the period then ended, in conformity with accounting principles generally accepted in the United States of America. These financial statements and financial highlights (hereafter referred to as “financial statements”) are the responsibility of the Series’ management; our responsibility is to express an opinion on these financial statements based on our audits. We conducted our audits of these financial statements in accordance with the standards of the Public Company Accounting Oversight Board (United States).Those standards require that we plan and perform the audit to obtain reasonable assurance about whether the financial statements are free of material misstatement. An audit includes examining, on a test basis, evidence supporting the amounts and disclosures in the financial statements, assessing the accounting principles used and significant estimates made by management, and evaluating the overall financial statement presentation. We believe that our audits, which included confirmation of securities at December 31, 2009 by correspondence with the custodian, provide a reasonable basis for our opinion.

Columbus, Ohio
February 23, 2010
Supplemental Tax Information (unaudited)
All designations are based on financial information available as of the date of this annual report and, accordingly are subject to change.
Pursuant to Section 852 of the Internal Revenue Code, as amended, the Series hereby designates $515,923 as capital gains for its taxable year ended December 31, 2009. In addition, the Series hereby designates $8,218,398 as tax exempt dividends for the
year ended December 31, 2009. For each item it is the intention of the Series to designate the maximum allowable under tax law.
Renewal of Investment Advisory Agreement (unaudited)
At the Manning & Napier Fund, Inc. (the “Fund”) Board of Directors’ (the “Board”) meeting, held on December 7, 2009, the Investment Advisory Agreement (the “Agreement”) between the Fund and Manning & Napier Advisors, Inc. (the “Advisor”) was reviewed by the Board for renewal. In connection with the decision whether to renew the Agreement, a variety of material was prepared for and reviewed by the Board.
Representatives of the Advisor attended the meeting and presented additional oral and written information to the Board to assist the Board in its considerations. The discussion immediately below outlines the materials and information presented to the Board in connection with the Board’s 2009 Annual Review of the Agreement and the conclusions made by the Directors when determining to continue the Agreement.
| | • | | The Board considered the services provided by the Advisor under the Agreement including, among others: deciding what securities to purchase and sell for each Series; arranging for the purchase and sale of such securities by placing orders with broker-dealers; administering the affairs of the Fund (including the books and records of the Fund not maintained by third party service providers such as the custodian or sub-transfer agent); arranging for the insurance coverage for the Fund; and supervising the preparation of tax returns, SEC filings (including registration statements) and reports to shareholders for the Fund. The Board also considered the nature and quality of such services provided under the Agreement in light of the Advisor’s services provided to the Fund for 23 years. The Board discussed the quality of these services with representatives from the Advisor and concluded that the Advisor was performing its services to the Fund required under the Agreement in a reasonable manner. |
| | • | | The Board considered the investment performance of the various Series of the Fund. The investment performance for each Series was reviewed on a cumulative basis since inception and on a one year basis. In addition, annualized performance for the following time periods was considered: inception, three year, five year, ten year, and current market cycle. A market cycle includes periods of both rising and falling markets. Returns for established benchmark indices for each Series were provided for each time period. The Board noted that the various Series were competitive against their respective benchmarks and/or peer groups over various time periods, but in particular over the full market cycle periods relevant for the Series. In addition, the Board considered at the meeting (and considers on a quarterly basis) a peer group performance analysis consisting of Morningstar universes of mutual funds with similar investment objectives. The Board discussed the performance with representatives from the Advisor and concluded that the investment performance of each of the Fund’s Series was reasonable based on the Fund’s actual performance and comparative performance, especially performance over the current market cycle. |
| | • | | The Board considered the costs of the Advisor’s services and the profits of the Advisor as they relate to the Advisor’s services to the Fund under the Agreement. In reviewing the Advisor’s costs and profits, the Board discussed the Advisor’s revenues generated from the Fund (on both an actual and adjusted basis) and its expenses associated with providing the services under the Agreement. In addition, the Board reviewed the Advisor’s expenses associated with Fund activities outside of the Agreement (such as expense reimbursements pursuant to expense caps and payments made by the Advisor to third party platforms on which shares of the Fund are available for purchase). It was noted by representatives of the Advisor that 13 of the 26 active Series of the Fund are currently experiencing expenses above the capped expense ratios. After discussing the above costs and profits, the Board |
Renewal of Investment Advisory Agreement (unaudited)
| | concluded that the Advisor’s profitability relating to its services provided under the Agreement was reasonable. |
| | • | | The Board considered the fees and expenses of the various Series of the Fund. The Advisor presented the advisory fees and total expenses for each Series, including the advisory fee adjusted for any expense waivers or reimbursements (either contractual or voluntary) paid by the Advisor. The advisory fees and expense ratios of each Series were compared to an average (on both a mean and median basis) of similar funds as disclosed on the Morningstar database. Representatives of the Advisor discussed with the Board the levels of its advisory fee for each Series of the Fund and as compared to the median and mean advisory fees for similar funds as listed on Morningstar. Expense ratios for every Series, except the Global Fixed Income Series and the Target Series Class R and Class C, are currently below the median and mean for similar funds as listed on Morningstar. Based on their review of the information provided, the Board concluded that the fees and expenses of each Series of the Fund were reasonable on a comparative basis. |
| | • | | The Board also considered the other benefits the Advisor derives from its relationship with the Fund. Such other benefits include certain research products provided by soft dollars. Given the level of soft dollar transactions involving the Fund, the Board concluded that these additional benefits to the Advisor were reasonable. |
| | • | | In addition to the factors described above, the Board considered the Advisor’s personnel, investment strategies, policies and procedures relating to compliance with personal securities transactions, and reputation, expertise and resources in domestic and foreign financial markets. The Board concluded that these factors support the conclusion that the Advisor performs its services in a reasonable manner. |
| | • | | The Board did not consider economies of scale at this time because of the multiple uses of the Fund (for the Advisor’s discretionary investment account clients in addition to direct investors), the current profitability of the Advisor’s services to the Fund under the Agreement, and the overall size of the Fund complex. |
Based on the Board’s deliberations and their evaluation of the information described above, the Board, including a majority of Directors that are not “interested persons” as defined in the Investment Company Act of 1940, concluded that the compensation under the Agreement was fair and reasonable in light of the services and expenses and such other matters as the Directors considered to be relevant in the exercise of their reasonable judgment. Accordingly, the Board approved the renewal of the Agreement. In the course of their deliberations, the Directors did not identify any particular information that was all important or controlling.
Directors’ and Officers’ Information (unaudited)
The Statement of Additional Information provides additional information about the Fund’s directors and officers and can be obtained without charge by calling 1-800-466-3863, at www.manningnapieradvisors.com, or on the EDGAR Database on the SEC Internet web site (http:// www.sec.gov). The following chart shows certain information about the Fund’s officers and directors, including their principal occupations during the last five years. Unless specific dates are provided, the individuals have held the listed positions for longer than five years.
INTERESTED DIRECTOR/OFFICER
| | |
| Name: | | B. Reuben Auspitz* |
| Address: | | 290 Woodcliff Drive |
| | Fairport, NY 14450 |
| Age: | | 62 |
| Current Position(s) Held with Fund: | | Principal Executive Officer, President, Chairman & Director |
| Term of Office1 & Length of Time Served: | | Indefinite - Director since 1984; Vice President 1984 - 2003; President since 2004; Principal Executive Officer since 2002 |
| Principal Occupation(s) During Past 5 Years: | | Executive Vice President; Co-Executive Director; Executive Group Member**; Chief Compliance Officer since 2004 - Manning & Napier Advisors, Inc. President; Director - Manning & Napier Investor Services, Inc. Holds or has held one or more of the following titles for various subsidiaries and affiliates: President, Vice President, Director, Chairman, Treasurer, Chief Compliance Officer or Member. |
| Number of Portfolios Overseen within Fund Complex: | | 29 |
| Other Directorships Held Outside Fund Complex: | | N/A |
| |
| INDEPENDENT DIRECTORS | | |
| |
| Name: | | Stephen B. Ashley |
| Address: | | 290 Woodcliff Drive |
| | Fairport, NY 14450 |
| Age: | | 69 |
| Current Position(s) Held with Fund: | | Director, Audit Committee Member, Governance & Nominating Committee Member |
| Term of Office & Length of Time Served: | | Indefinite - Since 1996 |
| Principal Occupation(s) During Past 5 Years: | | Chairman, Director, President & Chief Executive Officer, The Ashley Group (property management and investment). Chairman (non-executive) 2004 - 2008; Director 1995 - 2008 - Fannie Mae (mortgage) |
| Number of Portfolios Overseen within Fund Complex: | | 29 |
| Other Directorships Held Outside Fund Complex: | | The Ashley Group |
| Name: | | Peter L. Faber |
| Address: | | 290 Woodcliff Drive |
| | Fairport, NY 14450 |
| Age: | | 71 |
| Current Position(s) Held with Fund: | | Director, Governance & Nominating Committee Member |
| Term of Office & Length of Time Served: | | Indefinite - Since 1987 |
| Principal Occupation(s) During Past 5 Years: | | Senior Counsel since 2006, Partner (1995-2006) - McDermott, Will & Emery LLP (law firm) |
| Number of Portfolios Overseen within Fund Complex: | | 29 |
| Other Directorships Held Outside Fund Complex: | | Partnership for New York City, Inc. (non-profit) New York Collegium (non-profit) Boston Early Music Festival (non-profit) Amherst Early Music, Inc. (non-profit) Gotham Early Music Scene, Inc. (non-profit) |
Directors’ and Officers’ Information (unaudited)
| | |
INDEPENDENT DIRECTORS (continued) | | |
| Name: | | Harris H. Rusitzky |
| Address: | | 290 Woodcliff Drive |
| | Fairport, NY 14450 |
| Age: | | 75 |
| Current Position(s) Held with Fund: | | Director, Audit Committee Member, Governance & Nominating Committee Member |
| Term of Office & Length of Time Served: | | Indefinite - Since 1985 |
| Principal Occupation(s) During Past 5 Years: | | President, The Greening Group (business consultants) since 1994; Partner, The Restaurant Group (restaurants) since 2006 |
| Number of Portfolios Overseen within Fund Complex: | | 29 |
| Other Directorships Held Outside Fund Complex: | | N/A |
| Name: | | Paul A. Brooke |
| Address: | | 290 Woodcliff Drive |
| | Fairport, NY 14450 |
| Age: | | 64 |
| Current Position(s) Held with Fund: | | Director, Audit Committee Member, Governance & Nominating Committee Member |
| Term of Office & Length of Time Served: | | Indefinite - Since 2007 |
| Principal Occupation(s) During Past 5 Years: | | Chairman & CEO, Alsius Corp. (investments); Managing Member, PMSV Holdings LLC (investments) |
| Number of Portfolios Overseen within Fund Complex: | | 29 |
| Other Directorships Held Outside Fund Complex: | | Incyte Corp. |
| | ViroPharma, Inc. |
| | WebMD |
| | Cheyne Capital International |
| | MPM Bio-equities |
| | GMP Companies |
| | | HoustonPharma |
| Name: | | Richard M. Hurwitz |
| Address: | | 290 Woodcliff Drive |
| | Fairport, NY 14450 |
| Age: | | 46 |
| Current Position(s) Held with Fund: | | Director, Audit Committee Member, Governance & Nominating Committee Member |
| Term of Office & Length of Time Served: | | Indefinite - Since 2009 |
| Principal Occupation(s) During Past 5 Years: | | Managing Partner, Aegis Investment Partners, LLC (investments) since 2006; Founder and Managing Partner (2004-2005) - Village Markets, LLC (groceries) |
| Number of Portfolios Overseen within Fund Complex: | | 29 |
| Other Directorships Held Outside Fund Complex: | | Pictometry International Corp. |
Directors’ and Officers’ Information (unaudited)
| | |
| OFFICERS | | |
| |
| Name: | | Jeffrey S. Coons, Ph.D., CFA |
| Address: | | 290 Woodcliff Drive |
| | Fairport, NY 14450 |
| Age: | | 46 |
| Current Position(s) Held with Fund: | | Vice President |
| Term of Office1 & Length of Time Served: | | Since 2004 |
| Principal Occupation(s) During Past 5 Years: | | Co-Director of Research since 2002 & Executive Group Member** since 2003, Manning & Napier Advisors, Inc. Holds one or more of the following titles for various subsidiaries and affiliates: President, Director, Treasurer or Senior Trust Officer. |
| Number of Portfolios Overseen within Fund Complex: | | 29 |
| Other Directorships Held Outside Fund Complex: | | N/A |
| Name: | | Christine Glavin |
| Address: | | 290 Woodcliff Drive |
| | Fairport, NY 14450 |
| Age: | | 43 |
| Current Position(s) Held with Fund: | | Principal Financial Officer, Chief Financial Officer |
| Term of Office1 & Length of Time Served: | | Principal Financial Officer since 2002; Chief Financial Officer since 2001 |
| Principal Occupation(s) During Past 5 Years: | | Fund Reporting Manager, Manning & Napier Advisors, Inc. since 1997 |
| Number of Portfolios Overseen within Fund Complex: | | 29 |
| Other Directorships Held Outside Fund Complex: | | N/A |
| Name: | | Jodi L. Hedberg |
| Address: | | 290 Woodcliff Drive |
| | Fairport, NY 14450 |
| Age: | | 42 |
| Current Position(s) Held with Fund: | | Corporate Secretary, Chief Compliance Officer, Anti-Money Laundering Compliance Officer |
| Term of Office1 & Length of Time Served: | | Corporate Secretary since 1997; Chief Compliance Officer since 2004 |
| Principal Occupation(s) During Past 5 Years: | | Director of Compliance, Manning & Napier Advisors, Inc. and affiliates since 1990 (title change in 2005 from Compliance Manager to Director of Compliance); Corporate Secretary, Manning & Napier Investor Services, Inc. since 2006 |
| Number of Portfolios Overseen within Fund Complex: | | 29 |
| Other Directorships Held Outside Fund Complex: | | N/A |
*Interested Director, within the meaning of the Investment Company Act of 1940 by reason of his position with the Fund’s investment advisor and distributor. Mr. Auspitz serves as the Executive Vice President and Director, Manning & Napier Advisors, Inc. and President and Director, Manning & Napier Investor Services, Inc., the Fund’s distributor.
**The Executive Group performs the duties of the Office of the Chief Executive of Manning & Napier Advisors, Inc.
1The term of office for President, Vice President, Chief Financial Officer, and Corporate Secretary is one year and until their respective successors are chosen and qualified. All other officers’ terms are indefinite.
Literature Requests (unaudited)
Proxy Voting Policies and Procedures
A description of the policies and procedures that the Fund uses to determine how to vote proxies relating to portfolio securities is available, without charge, upon request:
| | |
By phone | | 1-800-466-3863 |
On the Securities and Exchange Commission’s (SEC) web site | | http://www.sec.gov |
Proxy Voting Record
Information regarding how the Fund voted proxies relating to portfolio securities during the most recent 12-month period ended June 30th is available, without charge, upon request:
| | |
By phone | | 1-800-466-3863 |
On the SEC’s web site | | http://www.sec.gov |
Quarterly Portfolio Holdings
The Series’ complete schedule of portfolio holdings for the 1st and 3rd quarters of each fiscal year are provided on Form N-Q, and are available, without charge, upon request:
| | |
By phone | | 1-800-466-3863 |
On the SEC’s web site | | http://www.sec.gov |
The Series’ Form N-Q may be reviewed and copied at the SEC’s Public Reference Room in Washington, D.C. Information on the operation of the Public Reference Room may be obtained by calling 1-800-SEC-0330.
Prospectus and Statement of Additional Information (SAI)
The prospectus and SAI provide additional information about each Series, including charges, expenses and risks. These documents are available, without charge, upon request:
| | |
By phone | | 1-800-466-3863 |
On the SEC’s web site | | http://www.sec.gov |
On the Advisor’s web site | | http://www.manningnapieradvisors.com |
Additional information available at www.manningnapieradvisors.com
1. Fund Holdings - Month-End
2. Fund Holdings - Quarter-End
3. Shareholder Report - Annual
4. Shareholder Report - Semi-Annual


Management Discussion and Analysis (unaudited)

Dear Shareholders:
Fixed income returns varied greatly in 2009 across market sectors and quality ratings. As 2009 unfolded, the credit crisis maintained a strong hold on the markets, with short-term securities and U.S. Treasuries representing the only safe havens in global markets. Following stock market lows in late March 2009, investor sentiment shifted to modest optimism, and lower quality securities, both stocks and bonds, rallied strongly.
Overall, municipal securities posted strong returns during 2009, with lower quality and longer maturity issues faring the best. The Bank of America (BofA) Merrill Lynch 1-12 Year Municipal Bond Index (formerly a Merrill Lynch Index) earned a strong 7.18% during the year. The 12.46% return of the New York Tax Exempt Series during 2009 dramatically outpaced that of its benchmark.
A unique aspect of the municipal bond market in 2009 was the general supply/demand imbalance that developed. As credit crisis fears abated in mid-2009, investors began to predict that government stimulus would provide help to state and local municipalities. This led to a strong revival in demand for municipal securities relative to weak demand during 2008’s recession and credit crunch. However, this demand was met with less supply as issuers chose to forego traditional tax-exempt issuance in favor of the Build America Bond subsidy program offered by the federal government. This supply/demand imbalance created a generally falling yield environment for municipal bonds throughout most of 2009. Because falling yields lead to higher bond prices, this situation benefited the Series’ return.
The Series’ intermediate-to-long-term maturity focus contributed to strong returns during most of the year as yields on municipal bonds generally fell. The Series also maintained a generally high quality bias, with the underlying credit rating of all issues in the Series being rated investment grade or higher, and only a small percentage rated below A. This quality bias likely detracted from returns in the second half of the year as lower quality securities outperformed, but the longer-term orientation of the portfolio more than offset this drag on returns.
As the global recovery continues to unfold, it will be important to monitor changes in factors such as state and local budgets, monetary policy, inflation expectations and other cyclical or secular trends. We will continue to employ an active approach to fixed income, considering maturity, quality and issue selections as key tools for seeking out return potential and managing risk over full bond market cycles.
As always, we appreciate your business.
Sincerely,
Manning & Napier Advisors, Inc.
Performance Update as of December 31, 2009 (unaudited)
| | | | | | | | | | |
| | | Average Annual Total Returns
As of December 31, 2009 | | |
| | | One
Year | | Five
Year | | Ten
Year | | Since
Inception1 | | |
Manning & Napier Fund, Inc. - New York Tax Exempt Series2 | | 12.46% | | 3.76% | | 5.11% | | 4.55% | | |
Bank of America (BofA) Merrill Lynch 1-12 Year Municipal Bond Index3 | | 7.18% | | 4.47% | | 5.56% | | 5.26% | | |
The following graph compares the value of a $10,000 investment in the Manning & Napier Fund, Inc. - New York Tax Exempt Series for the ten years ended December 31, 2009 to the BofA Merrill Lynch 1-12 Year Municipal Bond Index.

1Performance numbers for the Series and Index are calculated from January 17, 1994, the Series’ inception date.
2The Series’ performance does not reflect the deduction of taxes that a shareholder would pay on fund distributions or the redemption of shares. The Series’ performance is historical and may not be indicative of future results. The performance returns shown are inclusive of the net expense ratio of the Series. For the year ended December 31, 2009, this net expense ratio was 0.64%. The gross expense ratio, which does not account for any voluntary or contractual waivers currently in effect, was 0.64% for the year ended December 31, 2009.
3The BofA Merrill Lynch 1-12 Year Municipal Bond Index (formerly a Merrill Lynch Index) is an unmanaged, market weighted index comprised of investment-grade, fixed rate, coupon bearing municipal bonds with maturities greater than one year but less than twelve years. The Index returns assume reinvestment of coupons and, unlike Series returns, do not reflect any fees or expenses.
Shareholder Expense Example (unaudited)
As a shareholder of the Series, you may incur two types of costs: (1) transaction costs, including potential wire charges on redemptions and (2) ongoing costs, including management fees and other Series expenses. This example is intended to help you understand your ongoing costs (in dollars) of investing in the Series and to compare these costs with the ongoing costs of investing in other mutual funds.
The example is based on an investment of $1,000 invested at the beginning of the period and held for the entire period (July 1, 2009 to December 31, 2009).
Actual Expenses
The first line of the table below provides information about actual account values and actual expenses. You may use the information in this line, together with the amount you invested, to estimate the expenses that you paid over the period. Simply divide your account value by $1,000 (for example, an $8,600 account value divided by $1,000 = 8.6), then multiply the result by the number in the first line under the heading entitled “Expenses Paid During Period” to estimate the expenses you paid on your account during this period.
Hypothetical Example for Comparison Purposes
The second line of the table below provides information about hypothetical account values and hypothetical expenses based on the Series’ actual expense ratio and an assumed rate of return of 5% per year before expenses, which is not the Series’ actual return. The hypothetical account values and expenses may not be used to estimate the actual ending account balance or expenses you paid during the period. You may use this information to compare the ongoing costs of investing in the Series and other funds. To do so, compare this 5% hypothetical example with the 5% hypothetical examples that appear in the shareholder reports of the other funds.
Please note that the expenses shown in the table are meant to highlight your ongoing costs only and do not reflect any transaction costs, such as potential wire charges on redemptions. Therefore, the second line of the table is useful in comparing ongoing costs only, and will not help you determine the relative total costs of owning different funds. In addition, if these transaction costs were included, your costs would have been higher.
| | | | | | | | | |
| | | Beginning
Account Value
7/1/09 | | Ending
Account Value
12/31/09 | | Expenses Paid
During Period*
7/1/09-12/31/09 |
Actual | | $ | 1,000.00 | | $ | 1,053.20 | | $ | 3.26 |
Hypothetical
(5% return before expenses) | | $ | 1,000.00 | | $ | 1,022.03 | | $ | 3.21 |
*Expenses are equal to the Series’ annualized expense ratio (for the six-month period) of 0.63%, multiplied by the average account value over the period, multiplied by 184/365 (to reflect the one-half year period). Expenses are based on the most recent fiscal half year; therefore, the expense ratio stated above may differ from the expense ratio stated in the financial highlights, which is based on one-year data. The Series’ total return would have been lower had certain expenses not been waived during the period.
Portfolio Composition as of December 31, 2009 (unaudited)
Sector Allocation1
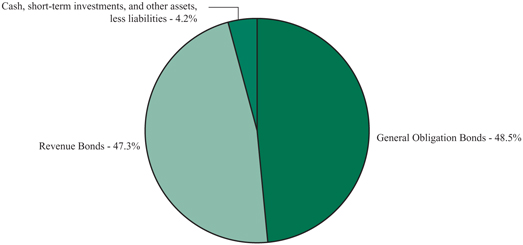
1As a percentage of net assets.
Credit Quality Ratings2,3
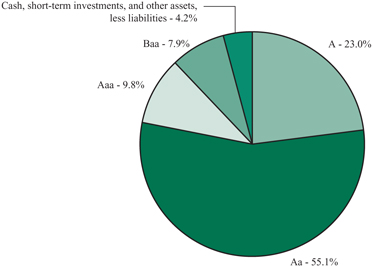
2As a percentage of net assets.
3Based on ratings from Moody’s, or the S&P equivalent. The Series may use different ratings provided by other rating agencies for purposes of determining compliance with the Series’ investment policies.
Investment Portfolio - December 31, 2009
| | | | | | | | | | | | | | |
| | | Coupon
Rate | | | Maturity
Date | | Credit
Rating1
(unaudited) | | | Principal
Amount | | Value
(Note 2) |
| | | | | | | | | | | | | | |
NEW YORK MUNICIPAL BONDS - 95.8% | | | | | | | |
Arlington Central School District, G.O. Bond, NATL | | 4.625 | % | | 12/15/2024 | | A1 | | | $ | 845,000 | | $ | 866,962 |
Arlington Central School District, G.O. Bond, NATL | | 4.625 | % | | 12/15/2025 | | A1 | | | | 365,000 | | | 374,070 |
Bethlehem, Public Impt., G.O. Bond | | 4.500 | % | | 12/1/2033 | | AA | 2 | | | 335,000 | | | 340,903 |
Bethlehem, Public Impt., G.O. Bond | | 4.500 | % | | 12/1/2035 | | AA | 2 | | | 425,000 | | | 430,912 |
Brookhaven, Public Impt., G.O. Bond, FGRNA | | 4.000 | % | | 5/1/2023 | | Aa3 | | | | 900,000 | | | 904,689 |
Brookhaven, Public Impt., G.O. Bond, FGRNA | | 4.000 | % | | 5/1/2024 | | Aa3 | | | | 815,000 | | | 817,021 |
Buffalo Fiscal Stability Authority, Sales Tax & State Aid, Series B, Revenue Bond, NATL | | 5.000 | % | | 9/1/2016 | | Aa2 | | | | 525,000 | | | 587,155 |
Chautauqua County, Public Impt., Series B, G.O. Bond, NATL | | 4.500 | % | | 12/15/2018 | | A2 | | | | 485,000 | | | 516,831 |
Clifton Park Water Authority, Revenue Bond | | 4.250 | % | | 10/1/2029 | | AA | 2 | | | 250,000 | | | 246,045 |
Dryden Central School District, G.O. Bond, AGM | | 5.500 | % | | 6/15/2011 | | Aa3 | | | | 200,000 | | | 212,158 |
Dutchess County, Public Impt., Prerefunded Balance, G.O. Bond, NATL | | 4.000 | % | | 12/15/2016 | | Aa2 | | | | 315,000 | | | 352,857 |
Dutchess County, Public Impt., Unrefunded Balance, G.O. Bond, NATL | | 4.000 | % | | 12/15/2016 | | Aa2 | | | | 360,000 | | | 383,825 |
Ellenville Central School District, G.O. Bond, AMBAC | | 5.700 | % | | 5/1/2011 | | A2 | | | | 700,000 | | | 710,976 |
Fairport Central School District, G.O. Bond, AGM | | 5.000 | % | | 6/1/2019 | | Aa3 | | | | 500,000 | | | 518,155 |
Franklin Square Union Free School District, G.O. Bond, FGRNA | | 5.000 | % | | 1/15/2021 | | A1 | | | | 520,000 | | | 536,172 |
Greece Central School District, G.O. Bond, AGM | | 4.000 | % | | 6/15/2019 | | Aa3 | | | | 2,675,000 | | | 2,804,684 |
Hampton Bays Union Free School District, G.O. Bond, AGM | | 4.250 | % | | 9/15/2026 | | Aa3 | | | | 1,140,000 | | | 1,161,261 |
Haverstraw-Stony Point Central School District, G.O. Bond, AGM | | 4.500 | % | | 10/15/2032 | | Aa3 | | | | 2,000,000 | | | 1,991,400 |
Islip, Public Impt., G.O. Bond, FGRNA | | 5.375 | % | | 6/15/2015 | | Aa2 | | | | 1,555,000 | | | 1,603,500 |
Johnson City Central School District, G.O. Bond, FGRNA | | 4.250 | % | | 6/15/2024 | | A | 2 | | | 500,000 | | | 504,660 |
Johnson City Central School District, G.O. Bond, FGRNA | | 4.375 | % | | 6/15/2028 | | A | 2 | | | 1,000,000 | | | 1,005,410 |
Johnson City Central School District, G.O. Bond, FGRNA | | 4.375 | % | | 6/15/2030 | | A | 2 | | | 985,000 | | | 973,820 |
Long Island Power Authority, Electric Systems, Series A, Revenue Bond, FGRNA | | 5.000 | % | | 12/1/2019 | | A3 | | | | 1,000,000 | | | 1,061,300 |
Long Island Power Authority, Electric Systems, Series A, Revenue Bond, FGRNA | | 5.000 | % | | 12/1/2025 | | A3 | | | | 1,690,000 | | | 1,748,964 |
| | |
| The accompanying notes are an integral part of the financial statements. | | 5 |
Investment Portfolio - December 31, 2009
| | | | | | | | | | | | | | |
| | | Coupon
Rate | | | Maturity
Date | | Credit
Rating1
(unaudited) | | | Principal
Amount | | Value
(Note 2) |
| | | | | | | | | | | | | | |
NEW YORK MUNICIPAL BONDS (continued) | | | | | | | |
Long Island Power Authority, Electric Systems, Series F, Revenue Bond, NATL | | 4.500 | % | | 5/1/2028 | | A3 | | | $ | 1,880,000 | | $ | 1,887,576 |
Metropolitan Transportation Authority, Dedicated Tax Fund, Series A, Revenue Bond, NATL | | 5.000 | % | | 11/15/2030 | | A1 | | | | 750,000 | | | 756,742 |
Metropolitan Transportation Authority, Dedicated Tax Fund, Series B, Revenue Bond | | 5.000 | % | | 11/15/2034 | | AA | 2 | | | 1,000,000 | | | 1,034,610 |
Metropolitan Transportation Authority, Series A, Revenue Bond, AGM | | 5.000 | % | | 11/15/2030 | | Aa3 | | | | 500,000 | | | 505,165 |
Metropolitan Transportation Authority, Series A, Revenue Bond, FGRNA | | 5.000 | % | | 11/15/2025 | | A2 | | | | 1,500,000 | | | 1,546,830 |
Metropolitan Transportation Authority, Series B, Revenue Bond, AGM | | 4.500 | % | | 11/15/2032 | | Aa3 | | | | 500,000 | | | 489,485 |
Minisink Valley Central School District, G.O. Bond | | 3.500 | % | | 4/15/2025 | | AA | 2 | | | 900,000 | | | 858,195 |
Monroe County Water Authority, Revenue Bond | | 5.000 | % | | 8/1/2019 | | Aa3 | | | | 1,700,000 | | | 1,713,753 |
Monroe County, Public Impt., G.O. Bond, AMBAC | | 4.125 | % | | 6/1/2020 | | Baa2 | | | | 1,000,000 | | | 982,520 |
Nassau County Interim Finance Authority, Sales Tax Secured, Series A, Revenue Bond, AMBAC | | 4.750 | % | | 11/15/2023 | | Aa2 | | | | 1,000,000 | | | 1,039,130 |
Nassau County, General Impt., Series C, G.O. Bond, AGC | | 5.000 | % | | 10/1/2028 | | Aa3 | | | | 1,000,000 | | | 1,081,700 |
Nassau County, General Impt., Series C, G.O. Bond, AGM | | 5.125 | % | | 1/1/2014 | | Aa3 | | | | 500,000 | | | 511,620 |
New Hyde Park & Garden City Park, Union Free School District, G.O. Bond, AGM | | 4.125 | % | | 6/15/2023 | | Aa3 | | | | 200,000 | | | 202,442 |
New Hyde Park & Garden City Park, Union Free School District, G.O. Bond, AGM | | 4.125 | % | | 6/15/2024 | | Aa3 | | | | 250,000 | | | 252,440 |
New York City Municipal Water Finance Authority, Water & Sewer Systems, Series A, Revenue Bond | | 4.250 | % | | 6/15/2033 | | Aa2 | | | | 1,250,000 | | | 1,187,600 |
New York City Municipal Water Finance Authority, Water & Sewer Systems, Series A, Revenue Bond | | 4.500 | % | | 6/15/2037 | | Aa2 | | | | 1,000,000 | | | 972,320 |
New York City Municipal Water Finance Authority, Water & Sewer Systems, Series A, Revenue Bond | | 5.750 | % | | 6/15/2040 | | Aa2 | | | | 1,000,000 | | | 1,116,500 |
New York City Municipal Water Finance Authority, Water & Sewer Systems, Series A, Revenue Bond, AMBAC | | 5.000 | % | | 6/15/2035 | | Aa2 | | | | 750,000 | | | 760,905 |
| | |
| 6 | | The accompanying notes are an integral part of the financial statements. |
Investment Portfolio - December 31, 2009
| | | | | | | | | | | | | | |
| | | Coupon
Rate | | | Maturity
Date | | Credit
Rating1
(unaudited) | | | Principal
Amount | | Value
(Note 2) |
| | | | | | | | | | | | | | |
NEW YORK MUNICIPAL BONDS (continued) | | | | | | | |
New York City Municipal Water Finance Authority, Water & Sewer Systems, Series D, Revenue Bond, AMBAC | | 4.500 | % | | 6/15/2036 | | Aa2 | | | $ | 500,000 | | $ | 489,160 |
New York City Municipal Water Finance Authority, Water & Sewer Systems, Series E, Revenue Bond, FGRNA | | 5.000 | % | | 6/15/2026 | | Aa2 | | | | 750,000 | | | 761,978 |
New York City, G.O. Bond, XLCA | | 5.000 | % | | 9/1/2019 | | Aa3 | | | | 500,000 | | | 530,665 |
New York City, Series A, G.O. Bond, CIFG | | 5.000 | % | | 8/1/2024 | | Aa3 | | | | 1,000,000 | | | 1,041,940 |
New York City, Unrefunded Balance, Series I, G.O. Bond, NATL | | 5.000 | % | | 5/15/2028 | | AA | 2 | | | 1,020,000 | | | 1,022,438 |
New York State Dormitory Authority, Columbia University, Revenue Bond | | 5.000 | % | | 7/1/2038 | | Aaa | | | | 900,000 | | | 956,979 |
New York State Dormitory Authority, Columbia University, Series A, Revenue Bond | | 5.000 | % | | 7/1/2025 | | Aaa | | | | 500,000 | | | 516,355 |
New York State Dormitory Authority, Education, Series F, Revenue Bond | | 5.000 | % | | 3/15/2023 | | Aa3 | | | | 1,475,000 | | | 1,567,394 |
New York State Dormitory Authority, New York University, Series A, Revenue Bond | | 5.000 | % | | 7/1/2039 | | Aa3 | | | | 1,000,000 | | | 1,024,320 |
New York State Dormitory Authority, University of Rochester, Series A, Revenue Bond | | 5.125 | % | | 7/1/2039 | | Aa3 | | | | 1,000,000 | | | 1,029,950 |
New York State Environmental Facilities Corp., Clean Water & Drinking, Revenue Bond | | 4.500 | % | | 6/15/2022 | | Aaa | | | | 300,000 | | | 308,664 |
New York State Environmental Facilities Corp., Clean Water & Drinking, Revenue Bond, NATL | | 5.000 | % | | 6/15/2021 | | Aaa | | | | 600,000 | | | 650,304 |
New York State Environmental Facilities Corp., Clean Water & Drinking, Series A, Revenue Bond | | 4.500 | % | | 6/15/2036 | | Aaa | | | | 1,000,000 | | | 990,810 |
New York State Environmental Facilities Corp., Clean Water & Drinking, Series B, Revenue Bond | | 5.000 | % | | 6/15/2027 | | Aaa | | | | 1,000,000 | | | 1,036,660 |
New York State Environmental Facilities Corp., Clean Water & Drinking, Series B, Revenue Bond | | 4.500 | % | | 6/15/2036 | | Aa1 | | | | 1,500,000 | | | 1,463,685 |
New York State Environmental Facilities Corp., Personal Income Tax, Series A, Revenue Bond | | 5.000 | % | | 12/15/2019 | | AAA | 2 | | | 750,000 | | | 816,848 |
New York State Environmental Facilities Corp., Pollution Control, Unrefunded Balance, Series A, Revenue Bond | | 5.200 | % | | 6/15/2015 | | Aaa | | | | 25,000 | | | 25,089 |
| | |
| The accompanying notes are an integral part of the financial statements. | | 7 |
Investment Portfolio - December 31, 2009
| | | | | | | | | | | | | | |
| | | Coupon
Rate | | | Maturity
Date | | Credit
Rating1
(unaudited) | | | Principal
Amount | | Value
(Note 2) |
| | | | | | | | | | | | | | |
NEW YORK MUNICIPAL BONDS (continued) | | | | | | | |
New York State Environmental Facilities Corp., Pollution Control, Unrefunded Balance, Series B, Revenue Bond | | 5.200 | % | | 5/15/2014 | | Aaa | | | $ | 440,000 | | $ | 475,666 |
New York State Housing Finance Agency, State University Construction, Series A, Revenue Bond | | 8.000 | % | | 5/1/2011 | | A1 | | | | 95,000 | | | 100,689 |
New York State Municipal Bond Bank Agency, Series B1, Revenue Bond | | 4.125 | % | | 12/15/2029 | | A | 2 | | | 420,000 | | | 409,664 |
New York State Municipal Bond Bank Agency, Series B1, Revenue Bond | | 4.500 | % | | 12/15/2034 | | A | 2 | | | 215,000 | | | 210,573 |
New York State Thruway Authority, Highway & Bridge, Prerefunded Balance, Series A, Revenue Bond, FGIC | | 5.500 | % | | 4/1/2015 | | Aa3 | | | | 320,000 | | | 343,469 |
New York State Thruway Authority, Highway & Bridge, Prerefunded Balance, Series B, Revenue Bond, NATL | | 5.250 | % | | 4/1/2016 | | AAA | 2 | | | 300,000 | | | 324,357 |
New York State Thruway Authority, Highway & Bridge, Series B, Revenue Bond, AMBAC | | 5.000 | % | | 4/1/2021 | | AA | 2 | | | 1,500,000 | | | 1,605,945 |
New York State Thruway Authority, Highway & Bridge, Series C, Revenue Bond, AMBAC | | 5.000 | % | | 4/1/2020 | | Aa3 | | | | 750,000 | | | 796,298 |
New York State Thruway Authority, Highway & Bridge, Series C, Revenue Bond, NATL | | 5.250 | % | | 4/1/2011 | | Aa3 | | | | 1,000,000 | | | 1,057,620 |
New York State Thruway Authority, Personal Income Tax, Prerefunded Balance, Series A, Revenue Bond, AGM | | 5.000 | % | | 3/15/2014 | | Aa3 | | | | 500,000 | | | 562,815 |
New York State Thruway Authority, Personal Income Tax, Prerefunded Balance, Series A, Revenue Bond, NATL | | 5.000 | % | | 3/15/2016 | | AAA | 2 | | | 300,000 | | | 337,689 |
New York State Thruway Authority, Series F, Revenue Bond, AMBAC | | 5.000 | % | | 1/1/2026 | | A1 | | | | 340,000 | | | 352,774 |
New York State Urban Development Corp., Correctional Capital Facilities, Series A, Revenue Bond, AGM | | 5.250 | % | | 1/1/2014 | | Aa3 | | | | 500,000 | | | 536,695 |
New York State Urban Development Corp., Personal Income Tax, Series C, Revenue Bond, NATL | | 4.250 | % | | 3/15/2024 | | Baa1 | | | | 1,000,000 | | | 1,021,930 |
New York State Urban Development Corp., Service Contract, Series B, Revenue Bond | | 5.250 | % | | 1/1/2022 | | AA | 2 | | | 2,350,000 | | | 2,556,377 |
New York State, Series A, G.O. Bond | | 4.600 | % | | 3/15/2013 | | Aa3 | | | | 475,000 | | | 499,182 |
New York State, Series A, G.O. Bond | | 4.500 | % | | 3/15/2019 | | Aa3 | | | | 500,000 | | | 528,855 |
New York State, Series C, G.O. Bond, AGM | | 5.000 | % | | 4/15/2012 | | Aa3 | | | | 700,000 | | | 765,604 |
Niagara County, Series B, G.O. Bond, NATL | | 5.200 | % | | 1/15/2011 | | Baa1 | | | | 400,000 | | | 409,780 |
Niagara Falls City School District, G.O. Bond, AGM | | 4.375 | % | | 9/15/2029 | | AAA | 2 | | | 885,000 | | | 889,620 |
| | |
| 8 | | The accompanying notes are an integral part of the financial statements. |
Investment Portfolio - December 31, 2009
| | | | | | | | | | | | | | |
| | | Coupon
Rate | | | Maturity
Date | | Credit
Rating1
(unaudited) | | | Principal
Amount | | Value
(Note 2) |
| | | | | | | | | | | | | | |
NEW YORK MUNICIPAL BONDS (continued) | | | | | | | | | | | | | | |
Niagara-Wheatfield Central School District, G.O. Bond, FGRNA | | 4.125 | % | | 2/15/2019 | | A2 | | | $ | 610,000 | | $ | 641,732 |
Niagara-Wheatfield Central School District, G.O. Bond, FGRNA | | 4.125 | % | | 2/15/2020 | | A2 | | | | 850,000 | | | 885,385 |
Perinton, Public Impt., G.O. Bond | | 4.250 | % | | 12/15/2031 | | AA | 2 | | | 175,000 | | | 174,254 |
Phelps-Clifton Springs Central School District, Series B, G.O. Bond, NATL | | 5.000 | % | | 6/15/2021 | | A2 | | | | 850,000 | | | 885,080 |
Phelps-Clifton Springs Central School District, Series B, G.O. Bond, NATL | | 5.000 | % | | 6/15/2022 | | A2 | | | | 450,000 | | | 467,374 |
Port Authority of New York & New Jersey, Revenue Bond | | 5.000 | % | | 7/15/2024 | | Aa3 | | | | 3,000,000 | | | 3,287,640 |
Port Authority of New York & New Jersey, Revenue Bond | | 4.750 | % | | 7/15/2030 | | Aa3 | | | | 495,000 | | | 510,771 |
Port Authority of New York & New Jersey, Revenue Bond | | 5.000 | % | | 10/1/2030 | | Aa3 | | | | 1,000,000 | | | 1,051,330 |
Port Authority of New York & New Jersey, Revenue Bond | | 4.500 | % | | 10/15/2037 | | Aa3 | | | | 400,000 | | | 389,452 |
Pulaski Central School District, Series A, G.O. Bond, FGRNA | | 4.500 | % | | 6/15/2026 | | A | 2 | | | 425,000 | | | 434,550 |
Ramapo, Public Impt., Series B, G.O. Bond, NATL | | 4.375 | % | | 5/1/2031 | | Aa3 | | | | 435,000 | | | 432,290 |
Ramapo, Public Impt., Series B, G.O. Bond, NATL | | 4.375 | % | | 5/1/2032 | | Aa3 | | | | 510,000 | | | 505,808 |
Ramapo, Public Impt., Series B, G.O. Bond, NATL | | 4.500 | % | | 5/1/2033 | | Aa3 | | | | 410,000 | | | 411,234 |
Ravena Coeymans Selkirk Central School District, G.O. Bond, AGM | | 4.250 | % | | 6/15/2014 | | Aa3 | | | | 1,180,000 | | | 1,295,333 |
Rochester, Series A, G.O. Bond, AMBAC | | 5.000 | % | | 8/15/2020 | | A2 | | | | 250,000 | | | 285,165 |
Rochester, Series A, G.O. Bond, AMBAC | | 5.000 | % | | 8/15/2022 | | A2 | | | | 95,000 | | | 108,485 |
Rondout Valley Central School District, G.O. Bond, AGM | | 5.375 | % | | 3/1/2020 | | Aa3 | | | | 500,000 | | | 509,265 |
Sachem Central School District of Holbrook, G.O. Bond, FGRNA | | 4.250 | % | | 10/15/2028 | | AA | 2 | | | 330,000 | | | 331,917 |
Sachem Central School District of Holbrook, G.O. Bond, FGRNA | | 4.375 | % | | 10/15/2030 | | AA | 2 | | | 1,000,000 | | | 999,260 |
Sachem Central School District of Holbrook, Series B, G.O. Bond, FGRNA | | 4.250 | % | | 10/15/2026 | | AA | 2 | | | 1,200,000 | | | 1,214,772 |
Saratoga County Water Authority, Water Utility Impt., Revenue Bond | | 5.000 | % | | 9/1/2038 | | AA | 2 | | | 950,000 | | | 977,531 |
Saratoga County, Public Impt., Series A, G.O. Bond | | 4.750 | % | | 7/15/2036 | | Aa2 | | | | 820,000 | | | 832,062 |
Schenectady, G.O. Bond, NATL | | 5.300 | % | | 2/1/2011 | | Baa1 | | | | 250,000 | | | 250,900 |
South Glens Falls Central School District, Unrefunded Balance, G.O. Bond, FGIC | | 5.375 | % | | 6/15/2018 | | A3 | | | | 95,000 | | | 97,269 |
| | |
| The accompanying notes are an integral part of the financial statements. | | 9 |
Investment Portfolio - December 31, 2009
| | | | | | | | | | | | | | |
| | | Coupon
Rate | | | Maturity
Date | | Credit
Rating1
(unaudited) | | | Principal
Amount | | Value
(Note 2) |
| | | | | | | | | | | | | | |
NEW YORK MUNICIPAL BONDS (continued) | | | | | | | |
Spencerport Fire District, G.O. Bond, AGC | | 4.500 | % | | 11/15/2031 | | AAA | 2 | | $ | 290,000 | | $ | 294,614 |
Spencerport Fire District, G.O. Bond, AGC | | 4.500 | % | | 11/15/2032 | | AAA | 2 | | | 250,000 | | | 252,172 |
St. Lawrence County, Public Impt., G.O. Bond, FGRNA | | 4.500 | % | | 5/15/2031 | | A | 2 | | | 1,185,000 | | | 1,172,107 |
St. Lawrence County, Public Impt., G.O. Bond, FGRNA | | 4.500 | % | | 5/15/2032 | | A | 2 | | | 1,000,000 | | | 979,230 |
Suffolk County Water Authority, Revenue Bond, NATL | | 4.500 | % | | 6/1/2027 | | Baa1 | | | | 1,160,000 | | | 1,180,045 |
Suffolk County Water Authority, Series A, Revenue Bond | | 4.500 | % | | 6/1/2030 | | AA | 2 | | | 640,000 | | | 643,398 |
Suffolk County Water Authority, Series A, Revenue Bond, NATL | | 4.500 | % | | 6/1/2032 | | Baa1 | | | | 1,000,000 | | | 995,770 |
Suffolk County, Public Impt., Series A, G.O. Bond, NATL | | 4.250 | % | | 5/1/2024 | | Aa3 | | | | 1,000,000 | | | 1,012,870 |
Syracuse, Public Impt., Series A, G.O. Bond, FGRNA | | 4.250 | % | | 12/1/2028 | | A2 | | | | 600,000 | | | 566,388 |
Syracuse, Public Impt., Series A, G.O. Bond, FGRNA | | 4.250 | % | | 12/1/2029 | | A2 | | | | 600,000 | | | 560,148 |
Syracuse, Public Impt., Series A, G.O. Bond, NATL | | 4.250 | % | | 6/15/2023 | | Baa1 | | | | 690,000 | | | 676,131 |
Syracuse, Public Impt., Series A, G.O. Bond, NATL | | 4.375 | % | | 6/15/2025 | | Baa1 | | | | 990,000 | | | 965,537 |
Syracuse, Public Impt., Series C, G.O. Bond, AMBAC | | 5.400 | % | | 8/1/2017 | | A2 | | | | 700,000 | | | 728,119 |
Syracuse, Public Impt., Series C, G.O. Bond, AMBAC | | 5.500 | % | | 8/1/2018 | | A2 | | | | 850,000 | | | 884,638 |
Tarrytown Union Free School District, G.O. Bond, AMBAC | | 4.375 | % | | 1/15/2032 | | A1 | | | | 1,090,000 | | | 1,066,587 |
Triborough Bridge & Tunnel Authority, General Purposes, Prerefunded Balance, | | | | | | | | | | | | | | |
Series A, Revenue Bond, NATL | | 4.750 | % | | 1/1/2019 | | AA | 2 | | | 300,000 | | | 337,374 |
Triborough Bridge & Tunnel Authority, General Purposes, Prerefunded Balance, Series A, Revenue Bond, NATL | | 5.000 | % | | 1/1/2032 | | AAA | 2 | | | 1,695,000 | | | 1,841,634 |
Triborough Bridge & Tunnel Authority, General Purposes, Series B, Revenue Bond | | 5.000 | % | | 11/15/2020 | | Aa2 | | | | 750,000 | | | 798,532 |
Triborough Bridge & Tunnel Authority, General Purposes, Unrefunded Balance, Series A, Revenue Bond, NATL | | 5.000 | % | | 1/1/2032 | | Aa2 | | | | 305,000 | | | 308,584 |
Triborough Bridge & Tunnel Authority, Subordinate Bonds, Revenue Bond, FGRNA. | | 5.000 | % | | 11/15/2032 | | Aa3 | | | | 1,000,000 | | | 1,021,100 |
Ulster County, Public Impt., G.O. Bond, XLCA | | 4.500 | % | | 11/15/2026 | | AA | 2 | | | 560,000 | | | 578,021 |
| | |
| 10 | | The accompanying notes are an integral part of the financial statements. |
Investment Portfolio - December 31, 2009
| | | | | | | | | | | | | | |
| | | Coupon
Rate | | | Maturity
Date | | Credit
Rating1
(unaudited) | | | Principal
Amount/
Shares | | Value
(Note 2) |
| | | | | | | | | | | | | | |
NEW YORK MUNICIPAL BONDS (continued) | | | | | | | |
Union Endicott Central School District, G.O. Bond, FGRNA | | 4.125 | % | | 6/15/2014 | | A | 2 | | $ | 605,000 | | $ | 657,139 |
Union Endicott Central School District, G.O. Bond, FGRNA | | 4.125 | % | | 6/15/2015 | | A | 2 | | | 865,000 | | | 934,745 |
Wayne County, Public Impt., G.O. Bond, NATL | | 4.125 | % | | 6/1/2024 | | A1 | | | | 500,000 | | | 504,385 |
West Seneca Central School District, G.O. Bond, AGM | | 5.000 | % | | 5/1/2011 | | Aa3 | | | | 300,000 | | | 318,168 |
Westchester County, Series B, G.O. Bond | | 4.300 | % | | 12/15/2011 | | Aaa | | | | 15,000 | | | 16,079 |
Westchester County, Series B, G.O. Bond | | 3.700 | % | | 12/15/2015 | | Aaa | | | | 1,000,000 | | | 1,064,220 |
Westhampton Beach Union Free School District, G.O. Bond, NATL | | 4.000 | % | | 7/15/2018 | | Aa3 | | | | 726,000 | | | 758,263 |
Yonkers, Series B, G.O. Bond, NATL | | 5.000 | % | | 8/1/2023 | | Baa1 | | | | 1,125,000 | | | 1,134,765 |
Yonkers, Series B, G.O. Bond, NATL | | 5.000 | % | | 8/1/2030 | | Baa1 | | | | 1,095,000 | | | 1,076,987 |
| | | | | | | | | | | | | | |
TOTAL MUNICIPAL BONDS
(Identified Cost $103,280,004) | | | | | | | | | | | | | | 105,878,713 |
| | | | | | | | | | | | | | |
| | | | | |
SHORT-TERM INVESTMENTS - 3.0% | | | | | | | | | | | | | | |
Dreyfus BASIC New York Municipal Money Market Fund
(Identified Cost $3,340,413) | | | | | | 3,340,413 | | | 3,340,413 |
| | | | | | | | | | | | | | |
TOTAL INVESTMENTS - 98.8%
(Identified Cost $106,620,417) | | | | | | | | | | | | | | 109,219,126 |
| | | | | |
OTHER ASSETS, LESS LIABILITIES - 1.2% | | | | | | | | | | | | | | 1,312,889 |
| | | | | | | | | | | | | | |
NET ASSETS - 100% | | | | | | | | | | | | | $ | 110,532,015 |
| | | | | | | | | | | | | | |
KEY:
G.O. Bond - General Obligation Bond
Impt. - Improvement
Scheduled principal and interest payments are guaranteed by:
AGC (Assured Guaranty Corp.)
AGM (Assurance Guaranty Municipal Corp.) (formerly known as FSA (Financial Security Assurance, Inc.))
AMBAC (AMBAC Assurance Corp.)
CIFG (CIFG North America, Inc.)
FGIC (Financial Guaranty Insurance Co.)
FGRNA (FGIC reinsured by NATL)
NATL (National Public Finance Guarantee Corp.)
XLCA (XL Capital Assurance)
The insurance does not guarantee the market value of the municipal bonds.
1Credit ratings from Moody’s (unaudited).
2Credit ratings from S&P (unaudited).
The Series’ portfolio holds, as a percentage of net assets, greater than 10% in bonds insured by the following companies: NATL - 41.8%; AGM -12.2%.
| | |
| The accompanying notes are an integral part of the financial statements. | | 11 |
Statement of Assets and Liabilities
December 31, 2009
| | | |
ASSETS: | | | |
| | | |
| |
Investments, at value (identified cost $106,620,417) (Note 2) | | $ | 109,219,126 |
Interest receivable | | | 1,039,504 |
Receivable for fund shares sold | | | 389,991 |
Dividends receivable | | | 10 |
| | | |
TOTAL ASSETS | | | 110,648,631 |
| | | |
LIABILITIES: | | | |
| |
Accrued management fees (Note 3) | | | 46,675 |
Accrued fund accounting and transfer agent fees (Note 3) | | | 10,644 |
Accrued directors’ fees (Note 3) | | | 3,144 |
Accrued Chief Compliance Officer service fees (Note 3) | | | 475 |
Audit fees payable | | | 30,541 |
Payable for fund shares repurchased | | | 19,961 |
Other payables and accrued expenses | | | 5,176 |
| | | |
TOTAL LIABILITIES | | | 116,616 |
| | | |
TOTAL NET ASSETS | | $ | 110,532,015 |
| | | |
NET ASSETS CONSIST OF: | | | |
| |
Capital stock | | $ | 104,761 |
Additional paid-in-capital | | | 107,191,254 |
Undistributed net investment income | | | 577,775 |
Accumulated net realized gain on investments | | | 59,516 |
Net unrealized appreciation on investments | | | 2,598,709 |
| | | |
TOTAL NET ASSETS | | $ | 110,532,015 |
| | | |
NET ASSET VALUE, OFFERING PRICE AND REDEMPTION
PRICE PER SHARE - Class A ($110,532,015/10,476,070 shares) | | $ | 10.55 |
| | | |
| | |
| 12 | | The accompanying notes are an integral part of the financial statements. |
Statement of Operations
For the Year Ended December 31, 2009
| | | | |
INVESTMENT INCOME: | | | | |
| |
| | | | |
| |
Interest | | $ | 4,397,398 | |
Dividends | | | 9,474 | |
| | | | |
Total Investment Income | | | 4,406,872 | |
| | | | |
| EXPENSES: | | | | |
| |
Management fees (Note 3) | | | 514,984 | |
Fund accounting and transfer agent fees (Note 3) | | | 72,389 | |
Directors’ fees (Note 3) | | | 12,850 | |
Chief Compliance Officer service fees (Note 3) | | | 3,729 | |
Custodian fees | | | 5,900 | |
Miscellaneous | | | 45,348 | |
| | | | |
Total Expenses | | | 655,200 | |
Less reduction of expenses (Note 3) | | | (950 | ) |
| | | | |
Net Expenses | | | 654,250 | |
| | | | |
NET INVESTMENT INCOME | | | 3,752,622 | |
| | | | |
REALIZED AND UNREALIZED GAIN ON INVESTMENTS: | | | | |
| |
Net realized gain on investments | | | 236,539 | |
Net change in unrealized appreciation (depreciation) on investments | | | 7,946,641 | |
| | | | |
| |
NET REALIZED AND UNREALIZED GAIN ON
INVESTMENTS | | | 8,183,180 | |
| | | | |
NET INCREASE IN NET ASSETS RESULTING
FROM OPERATIONS | | $ | 11,935,802 | |
| | | | |
| | |
| The accompanying notes are an integral part of the financial statements. | | 13 |
Statements of Changes in Net Assets
| | | | | | | | |
| | | For the
Year Ended
12/31/09 | | | For the
Year Ended
12/31/08 | |
| | | | | | | | |
| INCREASE (DECREASE) IN NET ASSETS: | | | | | | | | |
| | |
| OPERATIONS: | | | | | | | | |
| | |
Net investment income | | $ | 3,752,622 | | | $ | 3,974,266 | |
Net realized gain on investments | | | 236,539 | | | | 274,551 | |
Net change in unrealized appreciation (depreciation) on investments | | | 7,946,641 | | | | (7,134,417 | ) |
| | | | | | | | |
Net increase (decrease) from operations | | | 11,935,802 | | | | (2,885,600 | ) |
| | | | | | | | |
DISTRIBUTIONS TO SHAREHOLDERS (Note 8): | | | | | | | | |
| | |
From net investment income | | | (4,042,429 | ) | | | (3,812,340 | ) |
From net realized gain on investments | | | (341,360 | ) | | | (101,616 | ) |
| | | | | | | | |
Total distributions to shareholders | | | (4,383,789 | ) | | | (3,913,956 | ) |
| | | | | | | | |
| CAPITAL STOCK ISSUED AND REPURCHASED: | | | | | | | | |
| | |
Net increase (decrease) from capital share transactions (Note 5) | | | 5,778,371 | | | | (7,702,651 | ) |
| | | | | | | | |
Net increase (decrease) in net assets | | | 13,330,384 | | | | (14,502,207 | ) |
| | |
| NET ASSETS: | | | | | | | | |
| | |
Beginning of year | | | 97,201,631 | | | | 111,703,838 | |
| | | | | | | | |
| | |
End of year (including undistributed net investment income of
$577,775 and $862,405, respectively) | | $ | 110,532,015 | | | $ | 97,201,631 | |
| | | | | | | | |
| | |
| 14 | | The accompanying notes are an integral part of the financial statements. |
Financial Highlights
| | | | | | | | | | |
| | | For the Years Ended |
| | | 12/31/09 | | 12/31/08 | | 12/31/07 | | 12/31/06 | | 12/31/05 |
Per share data (for a share outstanding throughout each year): | | | | | | | | | | |
Net asset value - Beginning of year | | $9.79 | | $10.41 | | $10.44 | | $10.45 | | $10.58 |
| | | | | | | | | | |
Income (loss) from investment operations: | | | | | | | | | | |
Net investment income | | 0.381 | | 0.38 | | 0.37 | | 0.38 | | 0.37 |
Net realized and unrealized gain (loss) on investments | | 0.82 | | (0.63) | | (0.01) | | (0.02) | | (0.13) |
| | | | | | | | | | |
Total from investment operations | | 1.20 | | (0.25) | | 0.36 | | 0.36 | | 0.24 |
| | | | | | | | | | |
Less distributions to shareholders: | | | | | | | | | | |
From net investment income | | (0.41) | | (0.36) | | (0.37) | | (0.36) | | (0.36) |
From net realized gain on investments | | (0.03) | | (0.01) | | (0.02) | | (0.01) | | (0.01) |
| | | | | | | | | | |
Total distributions to shareholders | | (0.44) | | (0.37) | | (0.39) | | (0.37) | | (0.37) |
| | | | | | | | | | |
Net asset value - End of year | | $10.55 | | $9.79 | | $10.41 | | $10.44 | | $10.45 |
| | | | | | | | | | |
Net assets - End of year (000’s omitted) | | $110,532 | | $97,202 | | $111,704 | | $92,910 | | $82,405 |
| | | | | | | | | | |
Total return2 | | 12.46% | | (2.37%) | | 3.44% | | 3.48% | | 2.33% |
| Ratios (to average net assets)/Supplemental Data: | | | | | | | | | | |
Expenses | | 0.64%* | | 0.64% | | 0.65% | | 0.68% | | 0.72% |
Net investment income | | 3.64% | | 3.71% | | 3.66% | | 3.68% | | 3.55% |
Portfolio turnover | | 10% | | 11% | | 7% | | 8% | | 6% |
*The investment advisor did not impose all of or a portion of its CCO fees, fund accounting and transfer agent fees during the year ended 12/31/09. If these expenses had been incurred by the Series, the expense ratio (to average net assets) would have been increased by 0.00%.3
1Calculated based on average shares outstanding during the year.
2Represents aggregate total return for the years indicated, and assumes reinvestment of all distributions. Total return would have been lower had certain expenses not been waived during the year ended December 31, 2009.
3Less than 0.01%.
| | |
| The accompanying notes are an integral part of the financial statements. | | 15 |
Notes to Financial Statements
New York Tax Exempt Series (the “Series”) is a no-load diversified series of Manning & Napier Fund, Inc. (the “Fund”). The Fund is organized in Maryland and is registered under the Investment Company Act of 1940, as amended, as an open-end management investment company.
The Series’ investment objective is to provide as high a level of current income exempt from federal income tax and New York State personal income tax as the Advisor believes is consistent with the preservation of capital.
The Fund’s Advisor is Manning & Napier Advisors, Inc. (the “Advisor”). Shares of the Series are offered to investors, clients and employees of the Advisor and its affiliates. The total authorized capital stock of the Fund consists of 10.0 billion shares of common stock each having a par value of $0. 01. As of December 31, 2009, 4.6 billion shares have been designated in total among 29 series, of which 100 million have been designated as New York Tax Exempt Series Class A common stock.
| 2. | SIGNIFICANT ACCOUNTING POLICIES |
Security Valuation
Municipal securities will normally be valued on the basis of market valuations provided by an independent pricing service (the “Service”). The Service utilizes the latest price quotations and a matrix system (which considers such factors as security prices of similar securities, yields, maturities and ratings). The Service has been approved by the Fund’s Board of Directors (the “Board”).
Short-term investments that mature in sixty days or less are valued at amortized cost, which approximates market value. Investments in open-end investment companies are valued at their net asset value per share on valuation date.
Volume and level of activity in established markets for an asset or liability are evaluated to determine whether recent transactions and quoted prices are determinative of fair value. Where there have been significant decreases in volume and level of activity, further analysis and adjustment may be necessary to estimate fair value. The Series measures fair value in these instances by the use of inputs and valuation techniques which may be based upon current market prices of securities that are comparable in coupon, rating, maturity and industry and/or expectation of future cash flows. As a result of trading in relatively thin markets and/or markets that experience significant volatility, the prices used by the Series to value these securities may differ from the value that would be realized if these securities were sold, and the differences could be material.
Securities for which representative valuations or prices are not available from the Fund’s pricing service may be valued at fair value. Due to the inherent uncertainty of valuations of such securities, the fair value may differ significantly from the values that would have been used had a ready market for such securities existed. If trading or events occurring after the close of the principal market in which securities are traded are expected to materially affect the value of those securities, then they may be valued at their fair value, taking this trading or these events into account. Fair value is determined in good faith by the Advisor under procedures approved by and under the general supervision and responsibility of the Board.
Various inputs are used in determining the value of the Series’ assets or liabilities carried at market value. These inputs are summarized in three broad levels. Level 1 includes quoted prices in active markets for identical assets and liabilities. Level 2 includes other significant observable inputs (including quoted prices for similar securities, interest rates, prepayment speeds, credit
Notes to Financial Statements
| 2. | SIGNIFICANT ACCOUNTING POLICIES (continued) |
Security Valuation (continued)
risk, etc.). Level 3 includes significant unobservable inputs (including the Series’ own assumptions in determining the fair value of investments). The inputs or methodology used for valuing securities are not necessarily an indication of the risk associated with investing in those securities.
The following is a summary of the valuation levels used for major security types as of December 31, 2009 in valuing the Series’ assets or liabilities carried at market value:
| | | | | | | | | | | | |
Description: | | 12/31/09 | | Level 1 | | Level 2 | | Level 3 |
| | | | | | | | | | | | |
Equity securities* | | $ | — | | $ | — | | $ | — | | $ | — |
Preferred securities | | | — | | | — | | | — | | | — |
Debt securities: | | | | | | | | | | | | |
States and political subdivisions (municipals) | | | 105,878,713 | | | — | | | 105,878,713 | | | — |
Mutual funds | | | 3,340,413 | | | 3,340,413 | | | — | | | — |
Other financial instruments** | | | — | | | — | | | — | | | — |
| | | | | | | | | | | | |
Total | | $ | 109,219,126 | | $ | 3,340,413 | | $ | 105,878,713 | | $ | — |
| | | | | | | | | | | | |
*Includes common stock, warrants and rights. Please see the Investment Portfolio for industry classification.
**Other financial instruments are derivative instruments not reflected in the Investment Portfolio, such as futures, forwards and swap contracts, which are valued at the unrealized appreciation/ depreciation on the instrument. As of December 31, 2009, the Series did not hold any derivative instruments.
There were no Level 3 securities held by the Series as of December 31, 2008 or December 31, 2009.
Interim and annual reporting periods beginning after December 15, 2009 will require additional disclosure regarding transfers in and/or out of Level 1 and 2. Additional disclosure surrounding the activity in Level 3 fair value measurement will also be effective for fiscal years beginning after December 15, 2010. Management has concluded that this will not have a material impact on the Series’ financial statements.
Security Transactions, Investment Income and Expenses
Security transactions are accounted for on trade date. Dividend income is recorded on the ex-dividend date, except that if the ex-dividend date has passed, certain dividends from foreign securities are recorded as soon as the Fund is informed of the ex-dividend date. Non-cash dividends, if any, are recorded at the fair market value of the securities received. Interest income, including amortization of premium and accretion of discounts using the effective interest method, is earned from settlement date and accrued daily.
Expenses are recorded on an accrual basis. Most expenses of the Fund can be attributed to a specific series. Expenses which cannot be directly attributed are apportioned among the series in the Fund in such a manner as deemed equitable by the Fund’s Board, taking into consideration, among other things, the nature and type of expense.
Notes to Financial Statements
| 2. | SIGNIFICANT ACCOUNTING POLICIES (continued) |
Security Transactions, Investment Income and Expenses (continued)
The Series uses the identified cost method for determining realized gain or loss on investments for both financial statement and federal income tax reporting purposes.
Federal Taxes
The Series’ policy is to comply with the provisions of the Internal Revenue Code applicable to regulated investment companies. The Series is not subject to federal income tax or excise tax to the extent that the Series distributes to shareholders each year its taxable income, including any net realized gains on investments, in accordance with requirements of the Internal Revenue Code. Accordingly, no provision for federal income tax or excise tax has been made in the financial statements.
Management evaluates its tax positions to determine if the tax positions taken meet the minimum recognition threshold in connection with accounting for uncertainties in income tax positions taken or expected to be taken for the purposes of measuring and recognizing tax liabilities in the financial statements. Recognition of tax benefits of an uncertain tax position is required only when the position is “more likely than not” to be sustained assuming examination by taxing authorities. At December 31, 2009, the Series has recorded no liability for net unrecognized tax benefits relating to uncertain income tax positions taken or expected to be taken in future tax returns.
The Series files income tax returns in the U.S. federal jurisdiction and various states, as required. No income tax returns are currently under investigation. The statute of limitations on the Series’ tax returns remains open for the years ended December 31, 2006 through December 31, 2009. The Fund is not aware of any tax positions for which it is reasonably possible that the total amounts of unrecognized tax benefits will significantly change in the next twelve months.
Distributions of Income and Gains
Distributions to shareholders of net investment income are made quarterly. Distributions of net realized gains are made annually. An additional distribution may be necessary to avoid taxation of the Series. Distributions are recorded on the ex-dividend date.
Indemnifications
The Fund’s organizational documents provide former and current directors and officers with a limited indemnification against liabilities arising in connection with the performance of their duties to the Fund. In the normal course of business, the Fund may also enter into contracts that provide general indemnifications. The Fund’s maximum exposure under these arrangements is unknown as this would be dependent on future claims that may be made against the Fund. The risk of material loss from such claims is considered remote.
Other
The preparation of financial statements in conformity with accounting principles generally accepted in the United States of America requires management to make estimates and assumptions that affect the reported amounts of assets and liabilities and the disclosure of contingent assets and liabilities at the date of the financial statements and the reported amounts of income and expenses during the reporting period. Actual results could differ from those estimates.
Notes to Financial Statements
| 3. | TRANSACTIONS WITH AFFILIATES |
The Fund has an Investment Advisory Agreement (the “Agreement”) with the Advisor, for which the Series pays a fee, computed daily and payable monthly, at an annual rate of 0.50% of the Series’ average daily net assets.
Under the Agreement, personnel of the Advisor provide the Series with advice and assistance in the choice of investments and the execution of securities transactions, and otherwise maintain the Series’ organization. The Advisor also provides the Fund with necessary office space and fund administration and support services. The salaries of all officers of the Fund (except a percentage of the Fund’s Chief Compliance Officer’s salary, which is paid by the Fund), and of all Directors who are “affiliated persons” of the Fund, or of the Advisor, and all personnel of the Fund, or of the Advisor, performing services relating to research, statistical and investment activities, are paid by the Advisor. Each “non-affiliated” Director receives an annual stipend, which is allocated among all the active series of the Fund. In addition, these Directors also receive a fee per Board meeting attended for each active series of the Fund plus a fee for each committee meeting attended.
The Advisor has contractually agreed, until at least April 30, 2011, to waive its fee and, if necessary, pay other operating expenses of the Series in order to maintain total direct annual fund operating expenses for the Series at no more than 0.85% of average daily net assets each year. For the year ended December 31, 2009, the Advisor did not waive its management fee or reimburse any expenses of the Series. The Advisor is not eligible to recoup any expenses that have been waived or reimbursed in prior years.
Manning & Napier Investor Services, Inc., a registered broker-dealer affiliate of the Advisor, acts as distributor for the Fund’s shares. The services of Manning & Napier Investor Services, Inc. are provided at no additional cost to the Series.
For fund accounting and transfer agent services through November 7, 2009, the Fund paid the Advisor an annual fee of 0.055% of the Fund’s average daily net assets up to $4.5 billion, 0.03% of the Fund’s average daily net assets between $4.5 billion and $7.5 billion, and 0.02% of the Fund’s average daily net assets over $7.5 billion. Additionally, certain transaction and account-based fees and out-of-pocket expenses, including charges for reporting relating to the Fund’s compliance program, were charged. Expenses not directly attributable to a Series are allocated based on each Series’ relative net assets or number of accounts, depending on the expense. Prior to October 12, 2009 (for sub-accountant) and November 9, 2009 (for sub-transfer agent), the Advisor had an agreement with Citi Fund Services Ohio, Inc. (“Citi”) under which Citi served as sub-accountant and sub-transfer agent. The Advisor voluntarily agreed to waive a portion of the fund accounting and transfer agent fees and the Chief Compliance Officer service fees for the period March 1, 2009 to April 30, 2009. Accordingly, the Advisor waived fees of $950, which is included as a reduction of expenses on the Statement of Operations.
The Advisor has entered into agreements dated October 12, 2009 and November 9, 2009 with PNC Global Investment Servicing (U.S.) Inc. (“PNCGIS”) under which PNCGIS serves as sub-accountant services agent and sub-transfer agent, respectively. Effective November 7, 2009 under the amended master services agreement, the Fund pays the Advisor an annual fee of 0.0175% on the first $3 billion of average daily net assets (excluding Target Series); 0.015% on the next $3 billion of average daily net assets (excluding Target Series); and 0.01% of the average daily net assets in excess of $6 billion (excluding Target Series); plus a base fee of $25,500 per Series. Additionally, certain transaction-, account-, and cusip-based fees and out-of-pocket expenses, including charges for reporting relating to the Fund’s compliance program, are charged.
Notes to Financial Statements
| 4. | PURCHASES AND SALES OF SECURITIES |
For the year ended December 31, 2009, purchases and sales of securities, other than United States Government securities and short-term securities, were $11,933,544 and $10,005,211, respectively. There were no purchases or sales of United States Government securities.
| 5. | CAPITAL STOCK TRANSACTIONS |
Transactions in shares of New York Tax Exempt Series were:
| | | | | | | | | | | | | | |
| | | For the Year
Ended 12/31/09 | | | For the Year
Ended 12/31/08 | |
| | | Shares | | | Amount | | | Shares | | | Amount | |
| | | | | | | | | | | | | | |
Sold | | 1,541,814 | | | $ | 16,071,689 | | | 1,676,685 | | | $ | 16,976,063 | |
Reinvested | | 399,655 | | | | 4,143,970 | | | 378,913 | | | | 3,768,555 | |
Repurchased | | (1,396,044 | ) | | | (14,437,288 | ) | | (2,858,275 | ) | | | (28,447,269 | ) |
| | | | | | | | | | | | | | |
Total | | 545,425 | | | $ | 5,778,371 | | | (802,677 | ) | | $ | (7,702,651 | ) |
| | | | | | | | | | | | | | |
Substantially all of the Series’ shares represent investments by fiduciary accounts over which the Advisor has sole investment discretion.
The Series may trade in instruments including written and purchased options, forward foreign currency exchange contracts and futures contracts and other derivatives in the normal course of investing activities to assist in managing exposure to various market risks. The Series may be subject to various elements of risk and may involve, to a varying degree, elements of risk in excess of the amounts recognized for financial statement purposes; the risk that changes in the value of a derivative may not correlate perfectly with the underlying asset, rate or index; counterparty credit risk related to over the counter derivatives counterparties failure to perform under contract terms; liquidity risk related to the lack of a liquid market for these contracts allowing the fund to close out its position(s); and documentation risk relating to disagreement over contract terms. No such investments were held by the Series during the year ended December 31, 2009.
| 7. | CONCENTRATION OF CREDIT |
The Series primarily invests in debt obligations issued by the State of New York and its political subdivisions, agencies and public authorities to obtain funds for various public purposes. The Series is more susceptible to factors adversely affecting issues of New York municipal securities than is a municipal bond fund that is not concentrated in these issues to the same extent.
| 8. | FEDERAL INCOME TAX INFORMATION |
The amount and characterization of certain income and capital gains to be distributed are determined in accordance with federal income tax regulations, which may differ from accounting principles generally accepted in the United States of America. These differences are primarily due to differing book and tax treatments in the timing of the recognition of net investment income or gains and losses, including market discount. The Series may periodically make reclassifications among its capital accounts to reflect income and gains available for distribution (or available capital loss carryovers) under income tax regulations without impacting the Series’ net asset value. Any such reclassifications are not reflected in the financial highlights.
Notes to Financial Statements
| 8. | FEDERAL INCOME TAX INFORMATION (continued) |
The tax character of distributions paid were as follows:
| | | | | | | |
| | | For the Year
Ended 12/31/09 | | For the Year
Ended 12/31/08 | |
Ordinary income | | $ | 6,320 | | $ | 25,021 | |
Tax exempt income | | | 4,036,109 | | | 3,787,319 | |
Long-term capital gains | | | 341,360 | | | 101,616 | |
At December 31, 2009, the tax basis components of distributable earnings and the net unrealized appreciation based on identified cost for federal income tax purposes were as follows: | |
Cost for federal income tax purposes | | | | | $ | 106,595,379 | |
Unrealized appreciation | | | | | $ | 2,976,664 | |
Unrealized depreciation | | | | | | (352,917 | ) |
| | | | | | | |
Net unrealized appreciation | | | | | $ | 2,623,747 | |
Undistributed tax exempt income | | | | | | 552,737 | |
Undistributed long-term capital gains | | | | | | 59,516 | |
On February 2, 2010, The PNC Financial Services Group, Inc. (“PNC”), which serves as the Series’ sub-accountant services agent and sub-transfer agent, entered into a Stock Purchase Agreement (the “Stock Purchase Agreement”) with The Bank of New York Mellon Corporation (“BNY Mellon”), the Series’ custodian. Upon the terms and subject to the conditions set forth in the Stock Purchase Agreement, which has been approved by the board of directors of each company, PNC will sell to BNY Mellon (the “Stock Sale”) 100% of the issued and outstanding shares of PNC Global Investment Servicing Inc., an indirect, wholly-owned subsidiary of PNC. The Stock Sale is expected to close in the third quarter of 2010. Management has concluded that this will not have a material impact on the Series’ financial statements.
There were no other subsequent events that require recognition or disclosure. In preparing these financial statements, management of the Fund has evaluated events and transactions for potential recognition or disclosure through February 23, 2010, the date the financial statements were issued.
Report of Independent Registered Public Accounting Firm
To the Board of Directors of Manning & Napier Fund, Inc. and Shareholders of New York Tax Exempt Series:
In our opinion, the accompanying statement of assets and liabilities, including the investment portfolio (except for credit ratings), and the related statements of operations and of changes in net assets and the financial highlights present fairly, in all material respects, the financial position of the New York Tax Exempt Series (a series of Manning & Napier Fund, Inc., hereafter referred to as the “Series”) at December 31, 2009, and the results of its operations for the year then ended, the changes in its net assets for each of the two years in the period then ended and the financial highlights for each of the five years in the period then ended, in conformity with accounting principles generally accepted in the United States of America. These financial statements and financial highlights (hereafter referred to as “financial statements”) are the responsibility of the Series’ management; our responsibility is to express an opinion on these financial statements based on our audits. We conducted our audits of these financial statements in accordance with the standards of the Public Company Accounting Oversight Board (United States). Those standards require that we plan and perform the audit to obtain reasonable assurance about whether the financial statements are free of material misstatement. An audit includes examining, on a test basis, evidence supporting the amounts and disclosures in the financial statements, assessing the accounting principles used and significant estimates made by management, and evaluating the overall financial statement presentation. We believe that our audits, which included confirmation of securities at December 31, 2009 by correspondence with the custodian, provide a reasonable basis for our opinion.
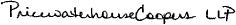
Columbus, Ohio
February 23, 2010
Supplemental Tax Information (unaudited)
All designations are based on financial information available as of the date of this annual report and, accordingly are subject to change.
Pursuant to Section 852 of the Internal Revenue Code, as amended, the Series hereby designates $341,360 as capital gains for its taxable year ended December 31, 2009. In addition, the Series hereby designates $4,036,109 as tax exempt dividends for the year ended December 31, 2009. For each item it is the intention of the Series to designate the maximum allowable under tax law.
Renewal of Investment Advisory Agreement (unaudited)
At the Manning & Napier Fund, Inc. (the “Fund”) Board of Directors’ (the “Board”) meeting, held on December 7, 2009, the Investment Advisory Agreement (the “Agreement”) between the Fund and Manning & Napier Advisors, Inc. (the “Advisor”) was reviewed by the Board for renewal. In connection with the decision whether to renew the Agreement, a variety of material was prepared for and reviewed by the Board.
Representatives of the Advisor attended the meeting and presented additional oral and written information to the Board to assist the Board in its considerations. The discussion immediately below outlines the materials and information presented to the Board in connection with the Board’s 2009 Annual Review of the Agreement and the conclusions made by the Directors when determining to continue the Agreement.
| | • | | The Board considered the services provided by the Advisor under the Agreement including, among others: deciding what securities to purchase and sell for each Series; arranging for the purchase and sale of such securities by placing orders with broker-dealers; administering the affairs of the Fund (including the books and records of the Fund not maintained by third party service providers such as the custodian or sub-transfer agent); arranging for the insurance coverage for the Fund; and supervising the preparation of tax returns, SEC filings (including registration statements) and reports to shareholders for the Fund. The Board also considered the nature and quality of such services provided under the Agreement in light of the Advisor’s services provided to the Fund for 23 years. The Board discussed the quality of these services with representatives from the Advisor and concluded that the Advisor was performing its services to the Fund required under the Agreement in a reasonable manner. |
| | • | | The Board considered the investment performance of the various Series of the Fund. The investment performance for each Series was reviewed on a cumulative basis since inception and on a one year basis. In addition, annualized performance for the following time periods was considered: inception, three year, five year, ten year, and current market cycle. A market cycle includes periods of both rising and falling markets. Returns for established benchmark indices for each Series were provided for each time period. The Board noted that the various Series were competitive against their respective benchmarks and/or peer groups over various time periods, but in particular over the full market cycle periods relevant for the Series. In addition, the Board considered at the meeting (and considers on a quarterly basis) a peer group performance analysis consisting of Morningstar universes of mutual funds with similar investment objectives. The Board discussed the performance with representatives from the Advisor and concluded that the investment performance of each of the Fund’s Series was reasonable based on the Fund’s actual performance and comparative performance, especially performance over the current market cycle. |
| | • | | The Board considered the costs of the Advisor’s services and the profits of the Advisor as they relate to the Advisor’s services to the Fund under the Agreement. In reviewing the Advisor’s costs and profits, the Board discussed the Advisor’s revenues generated from the Fund (on both an actual and adjusted basis) and its expenses associated with providing the services under the Agreement. In addition, the Board reviewed the Advisor’s expenses associated with Fund activities outside of the Agreement (such as expense reimbursements pursuant to expense caps and payments made by the Advisor to third party platforms on which shares of the Fund are available for purchase). It was noted by representatives of the Advisor that 13 of the 26 active Series of the Fund are currently experiencing expenses above the capped expense ratios. After discussing the above costs and profits, the Board concluded that the Advisor’s profitability relating to its services provided under the Agreement was reasonable. |
Renewal of Investment Advisory Agreement (unaudited)
| | • | | The Board considered the fees and expenses of the various Series of the Fund. The Advisor presented the advisory fees and total expenses for each Series, including the advisory fee adjusted for any expense waivers or reimbursements (either contractual or voluntary) paid by the Advisor. The advisory fees and expense ratios of each Series were compared to an average (on both a mean and median basis) of similar funds as disclosed on the Morningstar database. Representatives of the Advisor discussed with the Board the levels of its advisory fee for each Series of the Fund and as compared to the median and mean advisory fees for similar funds as listed on Morningstar. Expense ratios for every Series, except the Global Fixed Income Series and the Target Series Class R and Class C, are currently below the median and mean for similar funds as listed on Morningstar. Based on their review of the information provided, the Board concluded that the fees and expenses of each Series of the Fund were reasonable on a comparative basis. |
| | • | | The Board also considered the other benefits the Advisor derives from its relationship with the Fund. Such other benefits include certain research products provided by soft dollars. Given the level of soft dollar transactions involving the Fund, the Board concluded that these additional benefits to the Advisor were reasonable. |
| | • | | In addition to the factors described above, the Board considered the Advisor’s personnel, investment strategies, policies and procedures relating to compliance with personal securities transactions, and reputation, expertise and resources in domestic and foreign financial markets. The Board concluded that these factors support the conclusion that the Advisor performs its services in a reasonable manner. |
| | • | | The Board did not consider economies of scale at this time because of the multiple uses of the Fund (for the Advisor’s discretionary investment account clients in addition to direct investors), the current profitability of the Advisor’s services to the Fund under the Agreement, and the overall size of the Fund complex. |
Based on the Board’s deliberations and their evaluation of the information described above, the Board, including a majority of Directors that are not “interested persons” as defined in the Investment Company Act of 1940, concluded that the compensation under the Agreement was fair and reasonable in light of the services and expenses and such other matters as the Directors considered to be relevant in the exercise of their reasonable judgment. Accordingly, the Board approved the renewal of the Agreement. In the course of their deliberations, the Directors did not identify any particular information that was all important or controlling.
Directors’ and Officers’ Information (unaudited)
The Statement of Additional Information provides additional information about the Fund’s directors and officers and can be obtained without charge by calling 1-800-466-3863, at www.manningnapieradvisors.com, or on the EDGAR Database on the SEC Internet web site (http:// www.sec.gov). The following chart shows certain information about the Fund’s officers and directors, including their principal occupations during the last five years. Unless specific dates are provided, the individuals have held the listed positions for longer than five years.
| | |
INTERESTED DIRECTOR/OFFICER | | |
| Name: | | B. Reuben Auspitz* |
| Address: | | 290 Woodcliff Drive Fairport, NY 14450 |
| Age: | | 62 |
| Current Position(s) Held with Fund: | | Principal Executive Officer, President, Chairman & Director |
| Term of Office1 & Length of Time Served: | | Indefinite - Director since 1984; Vice President 1984 - 2003; President since 2004; Principal Executive Officer since 2002 |
| Principal Occupation(s) During Past 5 Years: | | Executive Vice President; Co-Executive Director; Executive Group Member**; Chief Compliance Officer since 2004 - Manning & Napier Advisors, Inc. President; Director - Manning & Napier Investor Services, Inc. Holds or has held one or more of the following titles for various subsidiaries and affiliates: President, Vice President, Director, Chairman, Treasurer, Chief Compliance Officer or Member. |
| Number of Portfolios Overseen within Fund Complex: | | 29 |
| Other Directorships Held Outside Fund Complex: | | N/A |
| |
| INDEPENDENT DIRECTORS | | |
| |
| Name: | | Stephen B. Ashley |
| Address: | | 290 Woodcliff Drive Fairport, NY 14450 |
| Age: | | 69 |
| Current Position(s) Held with Fund: | | Director, Audit Committee Member, Governance & Nominating Committee Member |
| Term of Office & Length of Time Served: | | Indefinite - Since 1996 |
| Principal Occupation(s) During Past 5 Years: | | Chairman, Director, President & Chief Executive Officer, The Ashley Group (property management and investment). Chairman (non-executive) 2004 - 2008; Director 1995 - 2008 - Fannie Mae (mortgage) |
| Number of Portfolios Overseen within Fund Complex: | | 29 |
| Other Directorships Held Outside Fund Complex: | | The Ashley Group |
| Name: | | Peter L. Faber |
| Address: | | 290 Woodcliff Drive Fairport, NY 14450 |
| Age: | | 71 |
| Current Position(s) Held with Fund: | | Director, Governance & Nominating Committee Member |
| Term of Office & Length of Time Served: | | Indefinite - Since 1987 |
| Principal Occupation(s) During Past 5 Years: | | Senior Counsel since 2006, Partner (1995-2006) - McDermott, Will & Emery LLP (law firm) |
| Number of Portfolios Overseen within Fund Complex: | | 29 |
| Other Directorships Held Outside Fund Complex: | | Partnership for New York City, Inc. (non-profit) New York Collegium (non-profit) Boston Early Music Festival (non-profit) Amherst Early Music, Inc. (non-profit) Gotham Early Music Scene, Inc. (non-profit) |
Directors’ and Officers’ Information (unaudited)
| | |
INDEPENDENT DIRECTORS (continued) | | |
| Name: | | Harris H. Rusitzky |
| Address: | | 290 Woodcliff Drive Fairport, NY 14450 |
| Age: | | 75 |
| Current Position(s) Held with Fund: | | Director, Audit Committee Member, Governance & Nominating Committee Member |
| Term of Office & Length of Time Served: | | Indefinite - Since 1985 |
| Principal Occupation(s) During Past 5 Years: | | President, The Greening Group (business consultants) since 1994; Partner, The Restaurant Group (restaurants) since 2006 |
| Number of Portfolios Overseen within Fund Complex: | | 29 |
| Other Directorships Held Outside Fund Complex: | | N/A |
| Name: | | Paul A. Brooke |
| Address: | | 290 Woodcliff Drive Fairport, NY 14450 |
| Age: | | 64 |
| Current Position(s) Held with Fund: | | Director, Audit Committee Member, Governance & Nominating Committee Member |
| Term of Office & Length of Time Served: | | Indefinite - Since 2007 |
| Principal Occupation(s) During Past 5 Years: | | Chairman & CEO, Alsius Corp. (investments); Managing Member, PMSV Holdings LLC (investments) |
| Number of Portfolios Overseen within Fund Complex: | | 29 |
| Other Directorships Held Outside Fund Complex: | | Incyte Corp. ViroPharma, Inc. WebMD Cheyne Capital International MPM Bio-equities GMP Companies HoustonPharma |
| Name: | | Richard M. Hurwitz |
| Address: | | 290 Woodcliff Drive Fairport, NY 14450 |
| Age: | | 46 |
| Current Position(s) Held with Fund: | | Director, Audit Committee Member, Governance & Nominating Committee Member |
| Term of Office & Length of Time Served: | | Indefinite - Since 2009 |
| Principal Occupation(s) During Past 5 Years: | | Managing Partner, Aegis Investment Partners, LLC (investments) since 2006; Founder and Managing Partner (2004-2005) - Village Markets, LLC (groceries) |
| Number of Portfolios Overseen within Fund Complex: | | 29 |
| Other Directorships Held Outside Fund Complex: | | Pictometry International Corp. |
Directors’ and Officers’ Information (unaudited)
| | |
| OFFICERS | | |
| |
| Name: | | Jeffrey S. Coons, Ph.D., CFA |
| Address: | | 290 Woodcliff Drive Fairport, NY 14450 |
| Age: | | 46 |
| Current Position(s) Held with Fund: | | Vice President |
| Term of Office1 & Length of Time Served: | | Since 2004 |
| Principal Occupation(s) During Past 5 Years: | | Co-Director of Research since 2002 & Executive Group Member** since 2003, Manning & Napier Advisors, Inc. Holds one or more of the following titles for various subsidiaries and affiliates: President, Director, Treasurer or Senior Trust Officer. |
| Number of Portfolios Overseen within Fund Complex: | | 29 |
| Other Directorships Held Outside Fund Complex: | | N/A |
| Name: | | Christine Glavin |
| Address: | | 290 Woodcliff Drive Fairport, NY 14450 |
| Age: | | 43 |
| Current Position(s) Held with Fund: | | Principal Financial Officer, Chief Financial Officer |
| Term of Office1 & Length of Time Served: | | Principal Financial Officer since 2002; Chief Financial Officer since 2001 |
| Principal Occupation(s) During Past 5 Years: | | Fund Reporting Manager, Manning & Napier Advisors, Inc. since 1997 |
| Number of Portfolios Overseen within Fund Complex: | | 29 |
| Other Directorships Held Outside Fund Complex: | | N/A |
| Name: | | Jodi L. Hedberg |
| Address: | | 290 Woodcliff Drive Fairport, NY 14450 |
| Age: | | 42 |
| Current Position(s) Held with Fund: | | Corporate Secretary, Chief Compliance Officer, Anti-Money Laundering Compliance Officer |
| Term of Office1 & Length of Time Served: | | Corporate Secretary since 1997; Chief Compliance Officer since 2004 |
| Principal Occupation(s) During Past 5 Years: | | Director of Compliance, Manning & Napier Advisors, Inc. and affiliates since 1990 (title change in 2005 from Compliance Manager to Director of Compliance); Corporate Secretary, Manning & Napier Investor Services, Inc. since 2006 |
| Number of Portfolios Overseen within Fund Complex: | | 29 |
| Other Directorships Held Outside Fund Complex: | | N/A |
*Interested Director, within the meaning of the Investment Company Act of 1940 by reason of his position with the Fund’s investment advisor and distributor. Mr. Auspitz serves as the Executive Vice President and Director, Manning & Napier Advisors, Inc. and President and Director, Manning & Napier Investor Services, Inc., the Fund’s distributor.
**The Executive Group performs the duties of the Office of the Chief Executive of Manning & Napier Advisors, Inc.
1The term of office for President, Vice President, Chief Financial Officer, and Corporate Secretary is one year and until their respective successors are chosen and qualified. All other officers’ terms are indefinite.
This Page Intentionally Left Blank
Literature Requests (unaudited)
Proxy Voting Policies and Procedures
A description of the policies and procedures that the Fund uses to determine how to vote proxies relating to portfolio securities is available, without charge, upon request:
| | |
By phone | | 1-800-466-3863 |
On the Securities and Exchange Commission’s (SEC) web site | | http://www.sec.gov |
Proxy Voting Record
Information regarding how the Fund voted proxies relating to portfolio securities during the most recent 12-month period ended June 30th is available, without charge, upon request:
| | |
By phone | | 1-800-466-3863 |
On the SEC’s web site | | http://www.sec.gov |
Quarterly Portfolio Holdings
The Series’ complete schedule of portfolio holdings for the 1st and 3rd quarters of each fiscal year are provided on Form N-Q, and are available, without charge, upon request:
| | |
By phone | | 1-800-466-3863 |
On the SEC’s web site | | http://www.sec.gov |
The Series’ Form N-Q may be reviewed and copied at the SEC’s Public Reference Room in Washington, D.C. Information on the operation of the Public Reference Room may be obtained by calling 1-800-SEC-0330.
Prospectus and Statement of Additional Information (SAI)
The prospectus and SAI provide additional information about each Series, including charges, expenses and risks. These documents are available, without charge, upon request:
| | |
By phone | | 1-800-466-3863 |
On the SEC’s web site | | http://www.sec.gov |
On the Advisor’s web site | | http://www.manningnapieradvisors.com |
Additional information available at www.manningnapieradvisors.com
1. Fund Holdings - Month-End
2. Fund Holdings - Quarter-End
3. Shareholder Report - Annual
4. Shareholder Report - Semi-Annual


Management Discussion and Analysis (unaudited)

Dear Shareholders:
Fixed income returns varied greatly in 2009 across market sectors and quality ratings. As 2009 unfolded, the credit crisis maintained a strong hold on the markets, with short-term securities and U.S. Treasuries representing the only safe havens in global markets. Following stock market lows in late March 2009, investor sentiment shifted to modest optimism, and lower quality securities, both stocks and bonds, rallied strongly.
Overall, corporate and municipal securities posted strong returns during 2009, with below investment grade securities experiencing significant gains. In contrast, U.S. Treasury securities largely suffered losses. Mortgage securities returned solid gains, though meaningfully below those of even investment grade corporate securities. Clearly, sector and quality selection were important factors during 2009.
The Bank of America (BofA) Merrill Lynch U.S. Corporate, Government and Mortgage Index (formerly a Merrill Lynch Index) earned a solid 5.24% during the year. The 11.46% return of the Core Bond Series during 2009 dramatically outpaced that of its benchmark.
The Core Bond Series made a substantial shift out of AAA-rated mortgage backed securities and into slightly lesser rated corporate bonds in late 2008 and early 2009. This move detracted from performance early in the year, but provided a meaningful advantage during the second and third quarters as market sentiment recovered and credit crisis fears eased. During the fourth quarter, the Series sold its mortgage-backed securities and reinvested the proceeds into U.S. Agency debentures. As of the end of the year, the Series had 72.1% of assets invested in corporate bonds.
As the global recovery continues to unfold, it will be important to monitor changes in factors such as monetary policy, inflation expectations and other cyclical or secular trends. We will continue to employ an active approach to fixed income, considering sector, maturity, quality and issue selections as key tools for seeking out return potential and managing risk over full bond market cycles.
As always, we appreciate your business.
Sincerely,
Manning & Napier Advisors, Inc.
Performance Update as of December 31, 2009 (unaudited)
| | | | | | |
| | | Average Annual Total Returns
As of December 31, 2009 | | |
| | | One
Year | | Since
Inception1 | | |
Manning & Napier Fund, Inc. - Core Bond Series2 | | 11.46% | | 5.08% | | |
Bank of America (BofA) Merrill Lynch U.S. Corporate, | | | | | | |
Government & Mortgage Index3 | | 5.24% | | 5.30% | | |
The following graph compares the value of a $10,000 investment in the Manning & Napier Fund, Inc. - Core Bond Series from its inception1 (4/21/05) to present (12/31/09) to the BofA Merrill Lynch U.S. Corporate, Government & Mortgage Index.
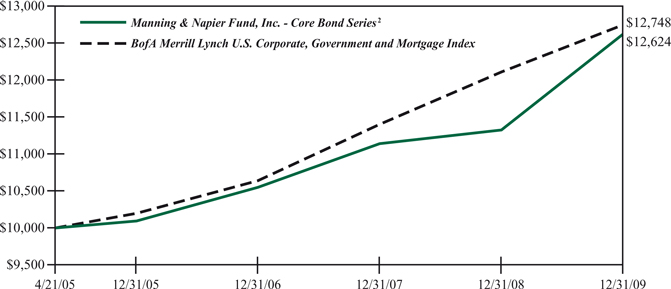
1Performance numbers for the Series and Index are calculated from April 21, 2005, the Series’ inception date.
2The Series’ performance does not reflect the deduction of taxes that a shareholder would pay on fund distributions or the redemption of shares. The Series’ performance is historical and may not be indicative of future results. The performance returns shown are inclusive of the net expense ratio of the Series. For the year ended December 31, 2009, this net expense ratio was 0.79%. The gross expense ratio, which does not account for any voluntary or contractual waivers currently in effect, was 0.79% for the year ended December 31, 2009.
3The unmanaged BofA Merrill Lynch U.S. Corporate, Government & Mortgage Index (formerly a Merrill Lynch Index) is a market value weighted measure that represents U.S. government, corporate, and pass-through securities issued by entities within the United States, by supranational entities, or by entities headquartered outside of the United States but who have issued dollar-denominated securities within the United States. The Index only includes investment-grade securities with maturities of greater than one year. The Index returns assume reinvestment of coupons and, unlike Series returns, do not reflect any fees or expenses.
Shareholder Expense Example (unaudited)
As a shareholder of the Series, you may incur two types of costs: (1) transaction costs, including potential wire charges on redemptions and (2) ongoing costs, including management fees and other Series expenses. This example is intended to help you understand your ongoing costs (in dollars) of investing in the Series and to compare these costs with the ongoing costs of investing in other mutual funds.
The example is based on an investment of $1,000 invested at the beginning of the period and held for the entire period (July 1, 2009 to December 31, 2009).
Actual Expenses
The first line of the table below provides information about actual account values and actual expenses. You may use the information in this line, together with the amount you invested, to estimate the expenses that you paid over the period. Simply divide your account value by $1,000 (for example, an $8,600 account value divided by $1,000 = 8.6), then multiply the result by the number in the first line under the heading entitled “Expenses Paid During Period” to estimate the expenses you paid on your account during this period.
Hypothetical Example for Comparison Purposes
The second line of the table below provides information about hypothetical account values and hypothetical expenses based on the Series’ actual expense ratio and an assumed rate of return of 5% per year before expenses, which is not the Series’ actual return. The hypothetical account values and expenses may not be used to estimate the actual ending account balance or expenses you paid during the period. You may use this information to compare the ongoing costs of investing in the Series and other funds. To do so, compare this 5% hypothetical example with the 5% hypothetical examples that appear in the shareholder reports of the other funds.
Please note that the expenses shown in the table are meant to highlight your ongoing costs only and do not reflect any transaction costs, such as potential wire charges on redemptions. Therefore, the second line of the table is useful in comparing ongoing costs only, and will not help you determine the relative total costs of owning different funds. In addition, if these transaction costs were included, your costs would have been higher.
| | | | | | | | | |
| | | Beginning
Account Value
7/1/09 | | Ending
Account Value
12/31/09 | | Expenses Paid
During Period*
7/1/09-12/31/09 |
Actual | | $ | 1,000.00 | | $ | 1,071.50 | | $ | 4.12 |
Hypothetical
(5% return before expenses) | | $ | 1,000.00 | | $ | 1,021.22 | | $ | 4.02 |
*Expenses are equal to the Series’ annualized expense ratio (for the six-month period) of 0.79%, multiplied by the average account value over the period, multiplied by 184/365 (to reflect the one-half year period). Expenses are based on the most recent fiscal half year; therefore, the expense ratio stated above may differ from the expense ratio stated in the financial highlights, which is based on one-year data. The Series’ total return would have been lower had certain expenses not been waived during the period..
Portfolio Composition as of December 31, 2009 (unaudited)
Sector Allocation1
1As a percentage of net assets.
Credit Quality Ratings2,3
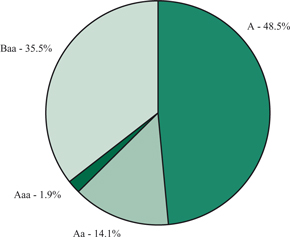
2As a percentage of total corporate bonds, preferred stock, asset-backed securities, commercial mortgage-backed securities, and municipal bonds.
3Based on ratings from Moody’s, or the S&P equivalent. The Series may use different ratings provided by other rating agencies for purposes of determining compliance with the Series’ investment policies.
Investment Portfolio - December 31, 2009
| | | | | | | | |
| | | Credit Rating1
(unaudited) | | Principal
Amount | | Value (Note 2) |
| | | | | | | | |
| | | |
CORPORATE BONDS - 72.1% | | | | | | | | |
| | | |
Convertible Corporate Bonds - 1.9% | | | | | | | | |
Consumer Discretionary - 0.4% | | | | | | | | |
Hotels, Restaurants & Leisure - 0.4% | | | | | | | | |
Carnival Corp., 2.00%, 4/15/2021 | | A3 | | $ | 305,000 | | $ | 314,531 |
| | | | | | | | |
| | | |
Health Care - 0.9% | | | | | | | | |
Biotechnology - 0.7% | | | | | | | | |
Amgen, Inc., 0.375%, 2/1/2013 | | A3 | | | 530,000 | | | 533,312 |
| | | | | | | | |
Health Care Equipment & Supplies - 0.2% | | | | | | | | |
Medtronic, Inc., 1.625%, 4/15/2013 | | A1 | | | 120,000 | | | 125,250 |
| | | | | | | | |
Total Health Care | | | | | | | | 658,562 |
| | | | | | | | |
| | | |
Information Technology - 0.6% | | | | | | | | |
Computers & Peripherals - 0.6% | | | | | | | | |
EMC Corp., 1.75%, 12/1/2013 | | A2 | | | 395,000 | | | 494,244 |
| | | | | | | | |
Total Convertible Corporate Bonds | | | | | | | | |
(Identified Cost $1,495,694) | | | | | | | | 1,467,337 |
| | | | | | | | |
Non-Convertible Corporate Bonds - 70.2% | | | | | | | | |
Consumer Discretionary - 11.1% | | | | | | | | |
Hotels, Restaurants & Leisure - 1.4% | | | | | | | | |
International Game Technology, 7.50%, 6/15/2019 | | Baa2 | | | 1,025,000 | | | 1,110,721 |
| | | | | | | | |
Media - 3.2% | | | | | | | | |
Comcast Corp., 6.50%, 11/15/2035 | | Baa1 | | | 570,000 | | | 591,011 |
Comcast Corp., 6.95%, 8/15/2037 | | Baa1 | | | 665,000 | | | 724,779 |
Time Warner, Inc., 7.625%, 4/15/2031 | | Baa2 | | | 510,000 | | | 592,430 |
The Walt Disney Co., 5.50%, 3/15/2019 | | A2 | | | 500,000 | | | 535,709 |
| | | | | | | | |
| | | | | | | | 2,443,929 |
| | | | | | | | |
Multiline Retail - 1.0% | | | | | | | | |
Target Corp., 6.00%, 1/15/2018 | | A2 | | | 670,000 | | | 739,471 |
| | | | | | | | |
Oil, Gas & Consumable Fuels - 1.3% | | | | | | | | |
Shell International Finance B.V. (Netherlands), 4.30%, 9/22/2019 | | Aa1 | | | 1,000,000 | | | 987,986 |
| | | | | | | | |
Real Estate Investment Trusts (REITS) - 1.0% | | | | | | | | |
Simon Property Group LP, 10.35%, 4/1/2019 | | A3 | | | 590,000 | | | 741,080 |
| | | | | | | | |
Specialty Retail - 2.5% | | | | | | | | |
Home Depot, Inc., 5.40%, 3/1/2016 | | Baa1 | | | 1,065,000 | | | 1,114,906 |
Lowe’s Companies, Inc., 6.10%, 9/15/2017 | | A1 | | | 745,000 | | | 824,214 |
| | | | | | | | |
| | | | | | | | 1,939,120 |
| | | | | | | | |
| | |
| The accompanying notes are an integral part of the financial statements. | | 5 |
Investment Portfolio - December 31, 2009
| | | | | | | | |
| | | Credit Rating1 (unaudited) | | Principal Amount | | Value (Note 2) |
| | | | | | | | |
| | | |
CORPORATE BONDS (continued) | | | | | | | | |
| | | |
Non-Convertible Corporate Bonds (continued) | | | | | | | | |
| | | |
Consumer Discretionary (continued) | | | | | | | | |
Textiles, Apparel & Luxury Goods - 0.7% | | | | | | | | |
VF Corp., 5.95%, 11/1/2017 | | A3 | | $ | 485,000 | | $ | 523,613 |
| | | | | | | | |
| | | |
Total Consumer Discretionary | | | | | | | | 8,485,920 |
| | | | | | | | |
Consumer Staples - 4.7% | | | | | | | | |
Beverages - 2.1% | | | | | | | | |
The Coca-Cola Co., 5.35%, 11/15/2017 | | Aa3 | | | 680,000 | | | 732,512 |
PepsiCo, Inc., 7.90%, 11/1/2018 | | Aa2 | | | 730,000 | | | 895,896 |
| | | | | | | | |
| | | | | | | | 1,628,408 |
| | | | | | | | |
Food & Staples Retailing - 0.8% | | | | | | | | |
The Kroger Co., 5.50%, 2/1/2013 | | Baa2 | | | 230,000 | | | 245,629 |
The Kroger Co., 6.15%, 1/15/2020 | | Baa2 | | | 335,000 | | | 358,533 |
| | | | | | | | |
| | | | | | | | 604,162 |
| | | | | | | | |
Food Products - 1.8% | | | | | | | | |
General Mills, Inc., 5.65%, 2/15/2019 | | Baa1 | | | 765,000 | | | 811,321 |
Kraft Foods, Inc., 6.125%, 2/1/2018 | | Baa2 | | | 565,000 | | | 594,121 |
| | | | | | | | |
| | | | | | | | 1,405,442 |
| | | | | | | | |
Total Consumer Staples | | | | | | | | 3,638,012 |
| | | | | | | | |
Energy - 5.3% | | | | | | | | |
Energy Equipment & Services - 2.9% | | | | | | | | |
Baker Hughes, Inc., 7.50%, 11/15/2018 | | A2 | | | 620,000 | | | 740,084 |
Weatherford International Ltd. (Switzerland), 9.625%, 3/1/2019 | | Baa1 | | | 1,210,000 | | | 1,508,511 |
| | | | | | | | |
| | | | | | | | 2,248,595 |
| | | | | | | | |
Oil, Gas & Consumable Fuels - 2.4% | | | | | | | | |
Anadarko Petroleum Corp., 5.95%, 9/15/2016 | | Baa3 | | | 455,000 | | | 492,172 |
Anadarko Petroleum Corp., 6.95%, 6/15/2019 | | Baa3 | | | 500,000 | | | 567,008 |
Apache Corp., 6.90%, 9/15/2018 | | A3 | | | 630,000 | | | 738,215 |
| | | | | | | | |
| | | | | | | | 1,797,395 |
| | | | | | | | |
Total Energy | | | | | | | | 4,045,990 |
| | | | | | | | |
Financials - 19.5% | | | | | | | | |
Capital Markets - 5.5% | | | | | | | | |
Goldman Sachs Capital I, 6.345%, 2/15/2034 | | A2 | | | 830,000 | | | 777,095 |
Goldman Sachs Capital II3, 5.793%, 12/29/2049 | | A3 | | | 1,285,000 | | | 995,875 |
| | |
| 6 | | The accompanying notes are an integral part of the financial statements. |
Investment Portfolio - December 31, 2009
| | | | | | | | |
| | | Credit Rating1
(unaudited) | | Principal
Amount | | Value (Note 2) |
| | | | | | | | |
| | | |
CORPORATE BONDS (continued) | | | | | | | | |
| | | |
Non-Convertible Corporate Bonds (continued) | | | | | | | | |
Financials (continued) | | | | | | | | |
Capital Markets (continued) | | | | | | | | |
The Goldman Sachs Group, Inc., 6.15%, 4/1/2018 | | A1 | | $ | 690,000 | | $ | 738,644 |
Merrill Lynch & Co., Inc., 6.11%, 1/29/2037 | | A3 | | | 665,000 | | | 613,078 |
Morgan Stanley, 5.55%, 4/27/2017 | | A2 | | | 1,077,000 | | | 1,081,768 |
| | | | | | | | |
| | | | | | | | 4,206,460 |
| | | | | | | | |
Commercial Banks - 5.2% | | | | | | | | |
Household Finance Co. (now known as HSBC Finance Corp.), 6.375%, 11/27/2012 | | A3 | | | 95,000 | | | 103,458 |
HSBC Finance Corp., 7.00%, 5/15/2012 | | A3 | | | 1,025,000 | | | 1,114,545 |
Manufacturers & Traders Trust Co., 6.625%, 12/4/2017 | | A3 | | | 1,110,000 | | | 1,138,338 |
PNC Bank National Association6 , 5.25%, 1/15/2017 | | A2 | | | 880,000 | | | 876,412 |
Wachovia Corp., 5.25%, 8/1/2014 | | A2 | | | 710,000 | | | 735,035 |
| | | | | | | | |
| | | | | | | | 3,967,788 |
| | | | | | | | |
Consumer Finance - 0.8% | | | | | | | | |
American Express Co., 8.125%, 5/20/2019 | | A3 | | | 540,000 | | | 639,933 |
| | | | | | | | |
Diversified Financial Services - 3.3% | | | | | | | | |
Bank of America Corp., 7.625%, 6/1/2019 | | A2 | | | 845,000 | | | 977,536 |
Citigroup, Inc., 8.50%, 5/22/2019 | | A3 | | | 690,000 | | | 796,779 |
JPMorgan Chase & Co., 6.30%, 4/23/2019 | | Aa3 | | | 700,000 | | | 770,054 |
| | | | | | | | |
| | | | | | | | 2,544,369 |
| | | | | | | | |
Insurance - 0.8% | | | | | | | | |
American International Group, Inc., 4.25%, 5/15/2013 | | A3 | | | 660,000 | | | 609,647 |
| | | | | | | | |
Real Estate Investment Trusts (REITS) - 3.9% | | | | | | | | |
AvalonBay Communities, Inc., 6.10%, 3/15/2020 | | Baa1 | | | 720,000 | | | 735,234 |
Boston Properties LP, 5.875%, 10/15/2019 | | Baa2 | | | 745,000 | | | 747,333 |
Camden Property Trust, 5.70%, 5/15/2017 | | Baa1 | | | 780,000 | | | 735,705 |
| | |
| The accompanying notes are an integral part of the financial statements. | | 7 |
Investment Portfolio - December 31, 2009
| | | | | | | | |
| | | Credit
Rating1
(unaudited) | | Principal
Amount | | Value
(Note 2) |
| | | | | | | | |
| | | |
CORPORATE BONDS (continued) | | | | | | | | |
| | | |
Non-Convertible Corporate Bonds (continued) | | | | | | | | |
Financials (continued) | | | | | | | | |
Real Estate Investment Trusts (REITS) (continued) | | | | | | | | |
HCP, Inc., 6.70%, 1/30/2018 | | Baa3 | | $ | 750,000 | | $ | 727,600 |
| | | | | | | | |
| | | | | | | | 2,945,872 |
| | | | | | | | |
Total Financials | | | | | | | | 14,914,069 |
| | | | | | | | |
Health Care - 2.9% | | | | | | | | |
Health Care Equipment & Supplies - 0.7% | | | | | | | | |
Becton Dickinson and Co., 6.00%, 5/15/2039 | | A2 | | | 535,000 | | | 562,432 |
| | | | | | | | |
Pharmaceuticals - 2.2% | | | | | | | | |
Abbott Laboratories, 5.60%, 11/30/2017 | | A1 | | | 675,000 | | | 733,054 |
Novartis Securities Investment Ltd.
(Bermuda), 5.125%, 2/10/2019 | | Aa2 | | | 870,000 | | | 913,958 |
| | | | | | | | |
| | | | | | | | 1,647,012 |
| | | | | | | | |
Total Health Care | | | | | | | | 2,209,444 |
| | | | | | | | |
Industrials - 13.3% | | | | | | | | |
Aerospace & Defense - 1.7% | | | | | | | | |
The Boeing Co., 6.00%, 3/15/2019 | | A2 | | | 500,000 | | | 542,582 |
Honeywell International, Inc., 5.30%, 3/1/2018 | | A2 | | | 690,000 | | | 727,764 |
| | | | | | | | |
| | | | | | | | 1,270,346 |
| | | | | | | | |
Air Freight & Logistics - 1.2% | | | | | | | | |
FedEx Corp., 8.00%, 1/15/2019 | | Baa2 | | | 790,000 | | | 951,509 |
| | | | | | | | |
Airlines - 1.2% | | | | | | | | |
Southwest Airlines Co., 5.25%, 10/1/2014 | | Baa3 | | | 910,000 | | | 921,712 |
| | | | | | | | |
Commercial Services & Supplies - 0.8% | | | | | | | | |
Waste Management, Inc., 7.375%, 3/11/2019 | | Baa3 | | | 505,000 | | | 582,728 |
| | | | | | | | |
Industrial Conglomerates - 4.2% | | | | | | | | |
General Electric Capital Corp., 5.625%, 5/1/2018 | | Aa2 | | | 350,000 | | | 358,659 |
General Electric Capital Corp.3, 6.375%, 11/15/2067 | | Aa3 | | | 1,145,000 | | | 993,288 |
General Electric Capital Corp., Series A, 6.75%, 3/15/2032 | | Aa2 | | | 740,000 | | | 754,478 |
General Electric Co., 5.25%, 12/6/2017 | | Aa2 | | | 370,000 | | | 378,090 |
Textron, Inc., 7.25%, 10/1/2019 | | Baa3 | | | 745,000 | | | 771,127 |
| | | | | | | | |
| | | | | | | | 3,255,642 |
| | | | | | | | |
| | |
| 8 | | The accompanying notes are an integral part of the financial statements. |
Investment Portfolio - December 31, 2009
| | | | | | | | |
| | | Credit
Rating1
(unaudited) | | Principal
Amount | | Value
(Note 2) |
| | | | | | | | |
| | | |
CORPORATE BONDS (continued) | | | | | | | | |
| | | |
Non-Convertible Corporate Bonds (continued) | | | | | | | | |
Industrials (continued) | | | | | | | | |
Machinery - 2.3% | | | | | | | | |
Caterpillar Financial Services Corp., 7.05%, 10/1/2018 | | A2 | | $ | 660,000 | | $ | 755,507 |
John Deere Capital Corp., 5.50%, 4/13/2017 | | A2 | | | 225,000 | | | 238,509 |
John Deere Capital Corp., 5.75%, 9/10/2018 | | A2 | | | 700,000 | | | 759,019 |
| | | | | | | | |
| | | | | | | | 1,753,035 |
| | | | | | | | |
Road & Rail - 1.9% | | | | | | | | |
CSX Corp., 6.00%, 10/1/2036 | | Baa3 | | | 730,000 | | | 721,299 |
Union Pacific Corp., 5.65%, 5/1/2017 | | Baa2 | | | 705,000 | | | 745,453 |
| | | | | | | | |
| | | | | | | | 1,466,752 |
| | | | | | | | |
Total Industrials | | | | | | | | 10,201,724 |
| | | | | | | | |
Information Technology - 6.4% | | | | | | | | |
Communications Equipment - 1.4% | | | | | | | | |
Cisco Systems, Inc., 5.90%, 2/15/2039 | | A1 | | | 1,065,000 | | | 1,076,806 |
| | | | | | | | |
Computers & Peripherals - 3.2% | | | | | | | | |
Dell, Inc., 5.875%, 6/15/2019 | | A2 | | | 1,055,000 | | | 1,116,438 |
Hewlett-Packard Co., 5.50%, 3/1/2018 | | A2 | | | 680,000 | | | 723,073 |
International Business Machines Corp., 5.60%, 11/30/2039 | | A1 | | | 599,000 | | | 602,437 |
| | | | | | | | |
| | | | | | | | 2,441,948 |
| | | | | | | | |
Electronic Equipment, Instruments & Components - 0.9% | | | | | | |
Corning, Inc., 6.20%, 3/15/2016 | | Baa1 | | | 610,000 | | | 647,394 |
| | | | | | | | |
Software - 0.9% | | | | | | | | |
Oracle Corp., 5.00%, 7/8/2019 | | A2 | | | 700,000 | | | 721,906 |
| | | | | | | | |
Total Information Technology | | | | | | | | 4,888,054 |
| | | | | | | | |
Materials - 4.0% | | | | | | | | |
Chemicals - 0.9% | | | | | | | | |
E.I. du Pont de Nemours & Co., 6.00%, 7/15/2018 | | A2 | | | 670,000 | | | 731,083 |
| | | | | | | | |
Metals & Mining - 2.0% | | | | | | | | |
Alcoa, Inc., 5.87%, 2/23/2022 | | Baa3 | | | 660,000 | | | 612,867 |
BHP Billiton Finance (USA) Ltd. (Australia), 6.50%, 4/1/2019 | | A1 | | | 810,000 | | | 929,116 |
| | | | | | | | |
| | | | | | | | 1,541,983 |
| | | | | | | | |
| | |
| The accompanying notes are an integral part of the financial statements. | | 9 |
Investment Portfolio - December 31, 2009
| | | | | | | | |
| | | Credit
Rating1
(unaudited) | | Principal
Amount/
Shares | | Value
(Note 2) |
| | | | | | | | |
| | | |
CORPORATE BONDS (continued) | | | | | | | | |
| | | |
Non-Convertible Corporate Bonds (continued) | | | | | | | | |
Materials (continued) | | | | | | | | |
Paper & Forest Products - 1.1% | | | | | | | | |
International Paper Co., 7.50%, 8/15/2021 | | Baa3 | | $ | 735,000 | | $ | 823,546 |
| | | | | | | | |
Total Materials | | | | | | | | 3,096,612 |
| | | | | | | | |
Utilities - 3.0% | | | | | | | | |
Electric Utilities - 2.5% | | | | | | | | |
Exelon Generation Co. LLC, 5.35%, 1/15/2014 | | A3 | | | 580,000 | | | 612,302 |
Exelon Generation Co. LLC, 6.20%, 10/1/2017 | | A3 | | | 350,000 | | | 375,179 |
Southwestern Electric Power Co., 6.45%, 1/15/2019 | | Baa3 | | | 855,000 | | | 915,739 |
| | | | | | | | |
| | | | | | | | 1,903,220 |
| | | | | | | | |
Multi-Utilities - 0.5% | | | | | | | | |
CenterPoint Energy Resources Corp.,
Series B, 7.875%, 4/1/2013 | | Baa3 | | | 335,000 | | | 377,336 |
| | | | | | | | |
Total Utilities | | | | | | | | 2,280,556 |
| | | | | | | | |
Total Non-Convertible Corporate Bonds
(Identified Cost $50,953,624) | | | | | | | | 53,760,381 |
| | | | | | | | |
TOTAL CORPORATE BONDS
(Identified Cost $52,449,318) | | | | | | | | 55,227,718 |
| | | | | | | | |
| | | |
PREFERRED STOCKS - 1.7% | | | | | | | | |
Financials - 1.7% | | | | | | | | |
Commercial Banks - 0.4% | | | | | | | | |
PNC Financial Services Group, Inc.6, Series K | | Baa2 | | | 290,000 | | | 293,039 |
| | | | | | | | |
Diversified Financial Services - 1.3% | | | | | | | | |
JPMorgan Chase & Co., Series 1 | | Baa1 | | | 965,000 | | | 995,359 |
| | | | | | | | |
TOTAL PREFERRED STOCKS
(Identified Cost $1,252,711) | | | | | | | | 1,288,398 |
| | | | | | | | |
| | |
| 10 | | The accompanying notes are an integral part of the financial statements. |
Investment Portfolio - December 31, 2009
| | | | | | | | |
| | | Credit
Rating1
(unaudited) | | Principal
Amount | | Value
(Note 2) |
| | | | | | | | |
| | | |
ASSET-BACKED SECURITIES - 0.7% | | | | | | | | |
Capital Auto Receivables Asset Trust, Series 2007-1, Class A4A, 5.01%, 4/16/2012 | | Aaa | | $ | 50,000 | | $ | 51,825 |
Capital Auto Receivables Asset Trust, Series 2007-3, Class A4, 5.21%, 3/17/2014 | | Aaa | | | 40,000 | | | 41,915 |
Ford Credit Auto Owner Trust, Series 2008-C,
Class A4B3, 1.983%, 4/15/2013 | | Aaa | | | 50,000 | | | 50,829 |
Hertz Vehicle Financing LLC, Series 2009-2A,
Class A24, 5.29%, 3/25/2016 | | Aaa | | | 370,000 | | | 369,164 |
| | | | | | | | |
TOTAL ASSET-BACKED SECURITIES
(Identified Cost $500,058) | | | | | | | | 513,733 |
| | | | | | | | |
| | | |
COMMERCIAL MORTGAGE-BACKED SECURITIES - 0.7% | | | | | | | | |
American Tower Trust, Series 2007-1A, Class AFX4, 5.42%, 4/15/2037 | | Aaa | | | 400,000 | | | 411,000 |
Crown Castle Towers LLC, Series 2006-1A, Class AFX4, 5.245%, 11/15/2036 | | Aaa | | | 115,000 | | | 118,450 |
| | | | | | | | |
TOTAL COMMERCIAL MORTGAGE-BACKED SECURITIES (Identified Cost $532,657) | | | | | | | | 529,450 |
| | | | | | | | |
| | | |
MUNICIPAL BONDS - 2.5% | | | | | | | | |
City of Cincinnati, OH, Water Utility Improvements, Revenue Bond, 6.458%, 12/1/2034 | | Aa1 | | | 250,000 | | | 251,217 |
City of New York, NY, Public Improvements, G.O. Bond, 6.385%, 12/1/2029 | | Aa3 | | | 250,000 | | | 249,565 |
Dallas Area Rapid Transit, Transit Improvements, Revenue Bond, 6.249%, 12/1/2034 | | Aa3 | | | 100,000 | | | 101,263 |
Illinois State Toll Highway Authority, Highway Improvements, Revenue Bond, 6.184%,
1/1/2034 | | Aa3 | | | 200,000 | | | 202,862 |
Metropolitan Transportation Authority, Transit Improvements, Revenue Bond, 7.336%,
11/15/2039 | | AA2 | | | 200,000 | | | 223,330 |
| | |
| The accompanying notes are an integral part of the financial statements. | | 11 |
Investment Portfolio - December 31, 2009
| | | | | | | | |
| | | Credit
Rating1
(unaudited) | | Principal
Amount/
Shares | | Value
(Note 2) |
| | | | | | | | |
| | | |
MUNICIPAL BONDS (continued) | | | | | | | | |
Nebraska Public Power District, Electric Light & Power Improvements, Revenue Bond, 7.399%, 1/1/2035 | | A1 | | $ | 100,000 | | $ | 108,463 |
State of California, School Improvements, G.O. Bond, 7.55%, 4/1/2039 | | Baa1 | | | 100,000 | | | 98,248 |
State of Wisconsin, Public Improvements, G.O. Bond, 5.90%, 5/1/2040 | | Aa3 | | | 250,000 | | | 251,900 |
University of Texas, Refunding Notes, Revenue Bond, 6.276%, 8/15/2041 | | Aaa | | | 100,000 | | | 100,938 |
Utah Transit Authority, Transit Improvements, Revenue Bond, 5.937%, 6/15/2039 | | Aa3 | | | 200,000 | | | 202,310 |
Will Grundy Etc. Counties Community College District No. 525, IL, University & College Improvements, G.O. Bond, 7.00%, 1/1/2029 | | AA2 | | | 100,000 | | | 106,234 |
| | | | | | | | |
TOTAL MUNICIPAL BONDS
(Identified Cost $1,888,782) | | | | | | | | 1,896,330 |
| | | | | | | | |
| | | |
MUTUAL FUNDS - 3.8% | | | | | | | | |
iShares iBoxx Investment Grade Corporate Bond Fund (Identified Cost $2,537,042) | | | | | 27,760 | | | 2,891,204 |
| | | | | | | | |
| | | |
U.S. GOVERNMENT AGENCIES - 14.7% | | | | | | | | |
| | | |
Other Agencies - 14.7% | | | | | | | | |
Fannie Mae, 1.875%, 4/20/2012 | | | | $ | 3,214,000 | | | 3,247,471 |
Fannie Mae, 1.75%, 8/10/2012 | | | | | 3,265,000 | | | 3,264,344 |
Federal Home Loan Bank, 4.50%, 11/15/2012 | | | | | 545,000 | | | 584,741 |
Federal Home Loan Bank, 3.375%, 2/27/2013 | | | | | 530,000 | | | 551,772 |
Freddie Mac, 1.75%, 6/15/2012 | | | | | 1,830,000 | | | 1,838,105 |
Freddie Mac, 5.50%, 8/20/2012 | | | | | 1,660,000 | | | 1,821,481 |
| | | | | | | | |
TOTAL U.S. GOVERNMENT AGENCIES
(Identified Cost $11,399,131) | | | | | | | | 11,307,914 |
| | | | | | | | |
| | |
| 12 | | The accompanying notes are an integral part of the financial statements. |
Investment Portfolio - December 31, 2009
| | | | | |
| | | Shares | | Value (Note 2) |
| | | | | |
| | |
SHORT-TERM INVESTMENTS - 1.8% | | | | | |
Dreyfus Cash Management, Inc. - Institutional Shares5, 0.07%
(Identified Cost $1,405,781) | | 1,405,781 | | $ | 1,405,781 |
| | | | | |
TOTAL INVESTMENTS - 98.0%
(Identified Cost $71,965,480) | | | | | 75,060,528 |
| | |
OTHER ASSETS, LESS LIABILITIES - 2.0% | | | | | 1,540,293 |
| | | | | |
NET ASSETS - 100% | | | | $ | 76,600,821 |
| | | | | |
G.O. Bond - General Obligation Bond
1Credit ratings from Moody’s (unaudited).
2Credit ratings from S&P (unaudited).
3The coupon rate is floating and is the stated rate as of December 31, 2009.
4Restricted securities - Investment in securities that are restricted as to public resale under the Securities Act of 1933, as amended. These securities have been sold under rule 144A and have been determined to be liquid under guidelines established by the Board of Directors. These securities amount to $898,614, or 1.2%, of the Series’ net assets as of December 31, 2009 (see Note 2 to the financial statements).
5Rate shown is the current yield as of December 31, 2009.
6PNC Global Investment Servicing (U.S.) Inc. serves as sub-accountant services agent and sub-transfer agent to the Fund.
| | |
| The accompanying notes are an integral part of the financial statements. | | 13 |
Statement of Assets and Liabilities
December 31, 2009
| | | | |
ASSETS: | | | | |
| | | | |
| |
Investments, at value (identified cost $71,965,480) (Note 2) | | $ | 75,060,528 | |
Interest receivable | | | 957,699 | |
Receivable for fund shares sold | | | 658,134 | |
Dividends receivable | | | 12,244 | |
| | | | |
TOTAL ASSETS | | | 76,688,605 | |
| | | | |
LIABILITIES: | | | | |
| |
Accrued management fees (Note 3) | | | 38,766 | |
Accrued fund accounting and transfer agent fees (Note 3) | | | 7,543 | |
Accrued directors’ fees (Note 3) | | | 3,145 | |
Accrued Chief Compliance Officer service fees (Note 3) | | | 483 | |
Audit fees payable | | | 32,069 | |
Other payables and accrued expenses | | | 5,778 | |
| | | | |
TOTAL LIABILITIES | | | 87,784 | |
| | | | |
TOTAL NET ASSETS | | $ | 76,600,821 | |
| | | | |
NET ASSETS CONSIST OF: | | | | |
| |
Capital stock | | $ | 73,815 | |
Additional paid-in-capital | | | 74,290,808 | |
Undistributed net investment income | | | 1,751 | |
Accumulated net realized loss on investments | | | (860,601 | ) |
Net unrealized appreciation on investments | | | 3,095,048 | |
| | | | |
TOTAL NET ASSETS | | $ | 76,600,821 | |
| | | | |
NET ASSET VALUE, OFFERING PRICE AND REDEMPTION
PRICE PER SHARE - Class A ($76,600,821/7,381,525 shares) | | $ | 10.38 | |
| | | | |
| | |
| 14 | | The accompanying notes are an integral part of the financial statements. |
Statement of Operations
For the Year Ended December 31, 2009
| | | | |
INVESTMENT INCOME: | | | | |
| | | | |
| |
Interest | | $ | 3,249,265 | |
Dividends | | | 220,169 | |
| | | | |
Total Investment Income | | | 3,469,434 | |
| | | | |
| EXPENSES: | | | | |
| |
Management fees (Note 3) | | | 369,487 | |
Fund accounting and transfer agent fees (Note 3) | | | 40,005 | |
Directors’ fees (Note 3) | | | 12,850 | |
Chief Compliance Officer service fees (Note 3) | | | 3,729 | |
Audit fees | | | 33,201 | |
Custodian fees | | | 5,650 | |
Miscellaneous | | | 24,015 | |
| | | | |
Total Expenses | | | 488,937 | |
Less reduction of expenses (Note 3) | | | (519 | ) |
| | | | |
Net Expenses | | | 488,418 | |
| | | | |
NET INVESTMENT INCOME | | | 2,981,016 | |
| | | | |
| REALIZED AND UNREALIZED GAIN ON INVESTMENTS: | | | | |
| |
Net realized gain on investments | | | 196,512 | |
| |
Net change in unrealized appreciation (depreciation) on investments | | | 3,411,672 | |
| | | | |
| |
NET REALIZED AND UNREALIZED GAIN ON
INVESTMENTS | | | 3,608,184 | |
| | | | |
| |
NET INCREASE IN NET ASSETS RESULTING
FROM OPERATIONS | | $ | 6,589,200 | |
| | | | |
| | |
| The accompanying notes are an integral part of the financial statements. | | 15 |
Statement of Changes in Net Assets
| | | | | | | | |
| | | For the
Year Ended
12/31/09 | | | For the
Year Ended
12/31/08 | |
| | | | | | | | |
| INCREASE (DECREASE) IN NET ASSETS: | | | | | | | | |
| | |
| OPERATIONS: | | | | | | | | |
| | |
Net investment income | | $ | 2,981,016 | | | $ | 2,368,992 | |
Net realized gain (loss) on investments | | | 196,512 | | | | (1,063,114 | ) |
Net change in unrealized appreciation (depreciation) on investments | | | 3,411,672 | | | | (377,532 | ) |
| | | | | | | | |
Net increase from operations | | | 6,589,200 | | | | 928,346 | |
| | | | | | | | |
DISTRIBUTIONS TO SHAREHOLDERS (Note 8): | | | | | | | | |
| | |
From net investment income | | | (2,992,322 | ) | | | (2,422,528 | ) |
From net realized gain on investments | | | — | | | | (247,034 | ) |
| | | | | | | | |
Total distributions to shareholders | | | (2,992,322 | ) | | | (2,669,562 | ) |
| | | | | | | | |
| CAPITAL STOCK ISSUED AND REPURCHASED: | | | | | | | | |
| | |
Net increase from capital share transactions (Note 5) | | | 19,933,271 | | | | 4,903,137 | |
| | | | | | | | |
Net increase in net assets | | | 23,530,149 | | | | 3,161,921 | |
| | |
| NET ASSETS: | | | | | | | | |
| | |
Beginning of year | | | 53,070,672 | | | | 49,908,751 | |
| | | | | | | | |
End of year (including undistributed net investment income of $1,751 and $9,911, respectively) | | $ | 76,600,821 | | | $ | 53,070,672 | |
| | | | | | | | |
| | |
| 16 | | The accompanying notes are an integral part of the financial statements. |
Financial Highlights
| | | | | | | | | | |
| | | | | For the Years Ended | | | | For the
Period
4/21/051 to
12/31/05 |
| | | 12/31/09 | | 12/31/08 | | 12/31/07 | | 12/31/06 | |
| | | | | | | | | | |
| | | | | | | | | | |
Per share data (for a share outstanding
throughout each period): | | | | | | | | | | |
Net asset value - Beginning of period | | $9.69 | | $10.05 | | $9.98 | | $9.89 | | $10.00 |
| | | | | | | | | | |
Income (loss) from investment operations: | | | | | | | | | | |
Net investment income | | 0.492 | | 0.45 | | 0.42 | | 0.36 | | 0.21 |
Net realized and unrealized gain (loss) on investments | | 0.62 | | (0.30) | | 0.13 | | 0.09 | | (0.11) |
| | | | | | | | | | |
Total from investment operations | | 1.11 | | 0.15 | | 0.55 | | 0.45 | | 0.10 |
| | | | | | | | | | |
Less distributions to shareholders: | | | | | | | | | | |
From net investment income | | (0.42) | | (0.46) | | (0.42) | | (0.36) | | (0.21) |
From net realized gain on investments | | — | | (0.05) | | (0.06) | | — | | — |
| | | | | | | | | | |
Total distributions to shareholders | | (0.42) | | (0.51) | | (0.48) | | (0.36) | | (0.21) |
| | | | | | | | | | |
Net asset value - End of period | | $10.38 | | $9.69 | | $10.05 | | $9.98 | | $9.89 |
| | | | | | | | | | |
Net assets - End of period (000’s omitted) | | $76,601 | | $53,071 | | $49,909 | | $45,696 | | $28,578 |
| | | | | | | | | | |
Total return3 | | 11.46% | | 1.66% | | 5.58% | | 4.51% | | 0.98% |
| Ratios (to average net assets)/ Supplemental Data: | | | | | | | | | | |
Expenses* | | 0.79% | | 0.80% | | 0.80% | | 0.80% | | 0.80%4 |
Net investment income | | 4.84% | | 4.73% | | 4.21% | | 3.87% | | 3.08%4 |
Portfolio turnover | | 67% | | 53% | | 346% | | 313% | | 293% |
|
*The investment advisor did not impose all or a portion of its management fees, CCO fees and fund accounting and transfer agent fees in some periods. If these expenses had been incurred by the Series, the expense ratio (to average net assets) |
would have been increased by the following amount: | | 0.00%5 | | 0.03% | | 0.04% | | 0.08% | | 0.20%4 |
1Commencement of operations.
2Calculated based on average shares outstanding during the year.
3Represents aggregate total return for the period indicated, and assumes reinvestment of all distributions. Total return would have been lower had certain expenses not been waived during certain periods. Periods less than one year are not annualized.
4Annualized.
5Less than 0.01%.
| | |
| The accompanying notes are an integral part of the financial statements. | | 17 |
Notes to Financial Statements
Core Bond Series (the “Series”) is a no-load diversified series of Manning & Napier Fund, Inc. (the “Fund”). The Fund is organized in Maryland and is registered under the Investment Company Act of 1940, as amended, as an open-end management investment company.
The Series’ investment objective is to provide long-term total return by investing primarily in investment-grade bonds and other financial instruments, including derivatives, with economic characteristics similar to bonds.
The Fund’s Advisor is Manning & Napier Advisors, Inc. (the “Advisor”). Shares of the Series are offered to investors, clients and employees of the Advisor and its affiliates. The total authorized capital stock of the Fund consists of 10.0 billion shares of common stock each having a par value of $0.01. As of December 31, 2009, 4.6 billion shares have been designated in total among 29 series, of which 125 million have been designated as Core Bond Series Class A common stock.
| 2. | SIGNIFICANT ACCOUNTING POLICIES |
Security Valuation
Portfolio securities, including domestic equities, foreign equities, warrants and options, listed on an exchange other than the NASDAQ National Market System are valued at the latest quoted sales price of the exchange on which the security is primarily traded. Securities not traded on valuation date or securities not listed on an exchange are valued at the latest quoted bid price provided by the Fund’s pricing service. Securities listed on the NASDAQ National Market System are valued in accordance with the NASDAQ Official Closing Price.
Debt securities, including government bonds, foreign bonds, asset-backed securities, structured notes, supranational obligations, sovereign bonds, corporate bonds and mortgage-backed securities will normally be valued on the basis of evaluated bid prices provided by an independent pricing service. Certain investments in securities held by the Series may be valued on a basis of a price provided by a principal market maker. These prices may differ from the value that would have been used had a broader market for securities existed.
Municipal securities will normally be valued on the basis of market valuations provided by an independent pricing service that utilizes the latest price quotations and a matrix system (which considers such factors as security prices of similar securities, yields, maturities and ratings).
Short-term investments that mature in sixty days or less are valued at amortized cost, which approximates market value. Investments in open-end investment companies are valued at their net asset value per share on valuation date.
Volume and level of activity in established markets for an asset or liability are evaluated to determine whether recent transactions and quoted prices are determinative of fair value. Where there have been significant decreases in volume and level of activity, further analysis and adjustment may be necessary to estimate fair value. The Series measures fair value in these instances by the use of inputs and valuation techniques which may be based upon current market prices of securities that are comparable in coupon, rating, maturity and industry and/or expectation of future cash flows. As a result of trading in relatively thin markets and/or markets that experience significant volatility, the prices used by the Series to value these securities may differ from the value that would be realized if these securities were sold, and the differences could be material.
Notes to Financial Statements
| 2. | SIGNIFICANT ACCOUNTING POLICIES (continued) |
Security Valuation (continued)
Securities for which representative valuations or prices are not available from the Fund’s pricing service may be valued at fair value. Due to the inherent uncertainty of valuations of such securities, the fair value may differ significantly from the values that would have been used had a ready market for such securities existed. If trading or events occurring after the close of the principal market in which securities are traded are expected to materially affect the value of those securities, then they may be valued at their fair value, taking this trading or these events into account. Fair value is determined in good faith by the Advisor under procedures approved by and under the general supervision and responsibility of the Fund’s Board of Directors (the “Board”).
Various inputs are used in determining the value of the Series’ assets or liabilities carried at market value. These inputs are summarized in three broad levels. Level 1 includes quoted prices in active markets for identical assets and liabilities. Level 2 includes other significant observable inputs (including quoted prices for similar securities, interest rates, prepayment speeds, credit risk, etc.). Level 3 includes significant unobservable inputs (including the Series’ own assumptions in determining the fair value of investments). The inputs or methodology used for valuing securities are not necessarily an indication of the risk associated with investing in those securities.
The following is a summary of the valuation levels used for major security types as of December 31, 2009 in valuing the Series’ assets or liabilities carried at market value:
| | | | | | | | | | | | |
Description | | 12/31/09 | | Level 1 | | Level 2 | | Level 3 |
Equity securities* | | $ | — | | $ | — | | $ | — | | $ | — |
Preferred securities | | | 1,288,398 | | | — | | | 1,288,398 | | | — |
Debt securities: | | | | | | | | | | | | |
U.S. Treasury and other U.S. Government agencies | | | 11,307,914 | | | — | | | 11,307,914 | | | — |
States and political subdivisions (municipals) | | | 1,896,330 | | | — | | | 1,896,330 | | | — |
Corporate debt | | | 53,760,381 | | | — | | | 53,760,381 | | | — |
Convertible corporate debt | | | 1,467,337 | | | — | | | 1,467,337 | | | — |
Asset backed securities | | | 513,733 | | | — | | | 513,733 | | | — |
Commercial mortgage backed securities | | | 529,450 | | | — | | | 529,450 | | | — |
Mutual funds | | | 4,296,985 | | | 4,296,985 | | | — | | | — |
Other financial instruments** | | | — | | | — | | | — | | | — |
| | | | | | | | | | | | |
Total | | $ | 75,060,528 | | $ | 4,296,985 | | $ | 70,763,543 | | $ | — |
| | | | | | | | | | | | |
*Includes common stock, warrants and rights. Please see the Investment Portfolio for industry classification.
**Other financial instruments are derivative instruments not reflected in the Investment Portfolio, such as futures, forwards and swap contracts, which are valued at the unrealized appreciation/ depreciation on the instrument. As of December 31, 2009, the Series did not hold any derivative instruments.
Notes to Financial Statements
| 2. | SIGNIFICANT ACCOUNTING POLICIES (continued) |
Security Valuation (continued)
There were no Level 3 securities held by the Series as of December 31, 2008 or December 31, 2009.
Interim and annual reporting periods beginning after December 15, 2009 will require additional disclosure regarding transfers in and/or out of Level 1 and 2. Additional disclosure surrounding the activity in Level 3 fair value measurement will also be effective for fiscal years beginning after December 15, 2010. Management has concluded that this will not have a material impact on the Series’ financial statements.
Security Transactions, Investment Income and Expenses
Security transactions are accounted for on trade date. Dividend income is recorded on the ex-dividend date, except that if the ex-dividend date has passed, certain dividends from foreign securities are recorded as soon as the Fund is informed of the ex-dividend date. Non-cash dividends, if any, are recorded at the fair market value of the securities received. Interest income, including amortization of premium and accretion of discounts using the effective interest method, is earned from settlement date and accrued daily.
Expenses are recorded on an accrual basis. Most expenses of the Fund can be attributed to a specific series. Expenses which cannot be directly attributed are apportioned among the series in the Fund in such a manner as deemed equitable by the Fund’s Board, taking into consideration, among other things, the nature and type of expense.
The Series uses the identified cost method for determining realized gain or loss on investments for both financial statement and federal income tax reporting purposes.
Foreign Currency Translation
The books and records of the Series are maintained in U.S. dollars. Foreign currencies, investments and other assets and liabilities are translated into U.S. dollars at the current exchange rates. Purchases and sales of investment securities and income and expenses are translated on the respective dates of such transactions. The Series does not isolate realized and unrealized gains and losses attributable to changes in the exchange rates from gains and losses that arise from changes in the market value of investments. Such fluctuations are included with net realized and unrealized gain or loss on investments. Net realized foreign currency gains and losses represent foreign currency gains and losses between trade date and settlement date on securities transactions, gains and losses on disposition of foreign currencies and the difference between the amount of income and foreign withholding taxes recorded on the books of the Series and the amounts actually received or paid.
Securities Purchased on a When-Issued Basis or Forward Commitment
The Series may purchase securities on a when-issued basis or forward commitment. These transactions involve a commitment by the Series to purchase securities for a predetermined price with payment and delivery taking place beyond the customary settlement period. When such purchases are outstanding, the Series will designate liquid assets in an amount sufficient to meet the purchase price. When purchasing a security on a delayed delivery basis, the Series assumes the rights and risks of ownership of the security, including the risk of price and yield fluctuations, and takes such fluctuations into account when determining its net asset value. The Series may sell the when-issued securities before they are delivered, which may result in a capital gain or loss. No such investments were held by the Series on December 31, 2009.
Notes to Financial Statements
| 2. | SIGNIFICANT ACCOUNTING POLICIES (continued) |
Securities Purchased on a When-Issued Basis or Forward Commitment (continued)
In connection with its ability to purchase or sell securities on a forward commitment basis, the Series may enter into forward roll transactions principally using To Be Announced (TBA) securities. Forward roll transactions require the sale of securities for delivery in the current month, and a simultaneous agreement to repurchase substantially similar (same type, coupon and maturity) securities on a specified future date. Risks of entering into forward roll transactions include the potential inability of the counterparty to meet the terms of the agreement; the potential of the Series to receive inferior securities at redelivery as compared to the securities sold to the counterparty; counterparty credit risk; and the potential pay down speed variance between the mortgage-backed pools. During the roll period, the Series forgoes principal and interest paid on the securities. The Series accounts for such dollar rolls as purchases and sales. No such investments were held by the Series on December 31, 2009.
Restricted Securities
Restricted securities are purchased in private placement transactions, are not registered under the Securities Act of 1933, as amended, and may have contractual restrictions on resale. Information regarding restricted securities is included at the end of the Series’ Investment Portfolio.
Illiquid Securities
A security may be considered illiquid if so deemed in good faith by the Advisor under procedures approved by and under the general supervision and responsibility of the Fund’s Board. No such investments were held by the Series on December 31, 2009.
Federal Taxes
The Series’ policy is to comply with the provisions of the Internal Revenue Code applicable to regulated investment companies. The Series is not subject to federal income tax or excise tax to the extent that the Series distributes to shareholders each year its taxable income, including any net realized gains on investments, in accordance with requirements of the Internal Revenue Code. Accordingly, no provision for federal income tax or excise tax has been made in the financial statements.
Management evaluates its tax positions to determine if the tax positions taken meet the minimum recognition threshold in connection with accounting for uncertainties in income tax positions taken or expected to be taken for the purposes of measuring and recognizing tax liabilities in the financial statements. Recognition of tax benefits of an uncertain tax position is required only when the position is “more likely than not” to be sustained assuming examination by taxing authorities. At December 31, 2009, the Series has recorded no liability for net unrecognized tax benefits relating to uncertain income tax positions taken or expected to be taken in future tax returns.
The Series files income tax returns in the U.S. federal jurisdiction, various states and foreign jurisdictions, as required. No income tax returns are currently under investigation. The statute of limitations on the Series’ tax returns remains open for the years ended December 31, 2006 through December 31, 2009. The Fund is not aware of any tax positions for which it is reasonably possible that the total amounts of unrecognized tax benefits will significantly change in the next twelve months.
Notes to Financial Statements
| 2. | SIGNIFICANT ACCOUNTING POLICIES (continued) |
Federal Taxes (continued)
Additionally, based on the Fund’s understanding of the tax rules and rates related to income, gains and transactions for foreign jurisdictions in which it invests, the Series will provide for foreign taxes, and where appropriate, deferred foreign tax.
Distributions of Income and Gains
Distributions to shareholders of net investment income and net realized gains are made annually. An additional distribution may be necessary to avoid taxation of the Series. Distributions are recorded on the ex-dividend date.
Indemnifications
The Fund’s organizational documents provide former and current directors and officers with a limited indemnification against liabilities arising in connection with the performance of their duties to the Fund. In the normal course of business, the Fund may also enter into contracts that provide general indemnifications. The Fund’s maximum exposure under these arrangements is unknown as this would be dependent on future claims that may be made against the Fund. The risk of material loss from such claims is considered remote.
Other
The preparation of financial statements in conformity with accounting principles generally accepted in the United States of America requires management to make estimates and assumptions that affect the reported amounts of assets and liabilities and the disclosure of contingent assets and liabilities at the date of the financial statements and the reported amounts of income and expenses during the reporting period. Actual results could differ from those estimates.
| 3. | TRANSACTIONS WITH AFFILIATES |
The Fund has an Investment Advisory Agreement (the “Agreement”) with the Advisor, for which the Series pays a fee, computed daily and payable monthly, at an annual rate of 0.60% of the Series’ average daily net assets.
Under the Agreement, personnel of the Advisor provide the Series with advice and assistance in the choice of investments and the execution of securities transactions, and otherwise maintain the Series’ organization. The Advisor also provides the Fund with necessary office space and fund administration and support services. The salaries of all officers of the Fund (except a percentage of the Fund’s Chief Compliance Officer’s salary, which is paid by the Fund), and of all Directors who are “affiliated persons” of the Fund, or of the Advisor, and all personnel of the Fund, or of the Advisor, performing services relating to research, statistical and investment activities, are paid by the Advisor. Each “non-affiliated” Director receives an annual stipend, which is allocated among all the active series of the Fund. In addition, these Directors also receive a fee per Board meeting attended for each active series of the Fund plus a fee for each committee meeting attended.
The Advisor has contractually agreed, until at least April 30, 2011, to waive its fee and, if necessary, pay other operating expenses of the Series in order to maintain total direct annual fund operating expenses for the Series at no more than 0.80% of average daily net assets each year. For the year ended December 31, 2009, the Advisor did not waive its management fee or reimburse any expenses of the Series. The Advisor is not eligible to recoup any expenses that have been waived or reimbursed in prior years.
Notes to Financial Statements
| 3. | TRANSACTIONS WITH AFFILIATES (continued) |
Manning & Napier Investor Services, Inc., a registered broker-dealer affiliate of the Advisor, acts as distributor for the Fund’s shares. The services of Manning & Napier Investor Services, Inc. are provided at no additional cost to the Series.
For fund accounting and transfer agent services through November 7, 2009, the Fund paid the Advisor an annual fee of 0.055% of the Fund’s average daily net assets up to $4.5 billion, 0.03% of the Fund’s average daily net assets between $4.5 billion and $7.5 billion, and 0.02% of the Fund’s average daily net assets over $7.5 billion. Additionally, certain transaction and account-based fees and out-of-pocket expenses, including charges for reporting relating to the Fund’s compliance program, were charged. Expenses not directly attributable to a Series are allocated based on each Series’ relative net assets or number of accounts, depending on the expense. Prior to October 12, 2009 (for sub-accountant) and November 9, 2009 (for sub-transfer agent) the Advisor had an agreement with Citi Fund Services Ohio, Inc. (“Citi”) under which Citi served as sub-accountant and sub-transfer agent. The Advisor voluntarily agreed to waive a portion of the fund accounting and transfer agent fees and the Chief Compliance Officer service fees for the period March 1, 2009 to April 30, 2009. Accordingly, the Advisor waived fees of $519 which is included as a reduction of expenses on the Statement of Operations.
The Advisor has entered into agreements dated October 12, 2009 and November 9, 2009 with PNC Global Investment Servicing (“PNCGIS”) under which PNCGIS serves as sub-accountant services agent and sub-transfer agent, respectively. Effective November 7, 2009 under the amended master services agreement, the Fund pays the Advisor an annual fee of 0.0175% on the first $3 billion of average daily net assets (excluding Target Series); 0.015% on the next $3 billion of average daily net assets (excluding Target Series); and 0.01% of the average daily net assets in excess of $6 billion (excluding Target Series); plus a base fee of $25,500 per Series. Additionally, certain transaction-, account-, and cusip-based fees and out-of-pocket expenses, including charges for reporting relating to the Fund’s compliance program, are charged.
| 4. | PURCHASES AND SALES OF SECURITIES |
For the year ended December 31, 2009, purchases and sales of securities, other than United States Government securities and short-term securities, were $41,501,374 and $22,723,404, respectively. Purchases and sales of United States Government securities, other than short-term securities, were $17,398,612 and $17,185,105, respectively.
| 5. | CAPITAL STOCK TRANSACTIONS |
Transactions in shares of Core Bond Series were:
| | | | | | | | | | | | | | |
| | | For the Year
Ended 12/31/09 | | | For the Year
Ended 12/31/08 | |
| | | Shares | | | Amount | | | Shares | | | Amount | |
| | | | | | | | | | | | | | |
Sold | | 2,334,851 | | | $ | 24,190,684 | | | 938,735 | | | $ | 9,172,442 | |
Reinvested | | 282,320 | | | | 2,942,598 | | | 280,365 | | | | 2,638,138 | |
Repurchased | | (711,761 | ) | | | (7,200,011 | ) | | (708,923 | ) | | | (6,907,443 | ) |
| | | | | | | | | | | | | | |
Total | | 1,905,410 | | | | 19,933,271 | | | 510,177 | | | | 4,903,137 | |
| | | | | | | | | | | | | | |
Substantially all of the Series’ shares represent investments by fiduciary accounts over which the Advisor has sole investment discretion.
Notes to Financial Statements
The Series may trade in instruments including written and purchased options, forward foreign currency exchange contracts and futures contracts and other derivatives in the normal course of investing activities to assist in managing exposure to various market risks. The Series may be subject to various elements of risk and may involve, to a varying degree, elements of risk in excess of the amounts recognized for financial statement purposes; the risk that changes in the value of a derivative may not correlate perfectly with the underlying asset, rate or index; counterparty credit risk related to over the counter derivatives counterparties’ failure to perform under contract terms; liquidity risk related to the lack of a liquid market for these contracts allowing the fund to close out its position(s); and documentation risk relating to disagreement over contract terms. No such investments were held by the Series during the year ended December 31, 2009.
Investing in securities of foreign companies and foreign governments involves special risks and considerations not typically associated with investing in securities of domestic companies and the U.S. Government. These risks include revaluation of currencies and future adverse political and economic developments. Moreover, securities of foreign companies and foreign governments and their markets may be less liquid and their prices more volatile than those of comparable domestic companies and the U.S. Government.
| 8. | FEDERAL INCOME TAX INFORMATION |
The amount and characterization of certain income and capital gains to be distributed are determined in accordance with federal income tax regulations, which may differ from accounting principles generally accepted in the United States of America. These differences are primarily due to differing book and tax treatments in the timing of the recognition of net investment income or gains and losses, including investments in hybrid securities and Post-October losses. The Series may periodically make reclassifications among its capital accounts to reflect income and gains available for distribution (or available capital loss carryovers) under income tax regulations without impacting the Series’ net asset value. Any such reclassifications are not reflected in the financial highlights.
The tax character of distributions paid were as follows:
| | | | | | |
| | | For the Year
Ended 12/31/09 | | For the Year
Ended 12/31/08 |
Ordinary income | | $ | 2,992,322 | | $ | 2,576,550 |
Long-term capital gains | | | — | | | 93,012 |
At December 31, 2009, the tax basis components of distributable earnings and the net unrealized appreciation based on identified cost for federal income tax purposes were as follows:
| | | | |
Cost for federal income tax purposes | | $ | 72,026,429 | |
Unrealized appreciation | | | 3,468,921 | |
Unrealized depreciation | | | (434,822 | ) |
| | | | |
Net unrealized appreciation | | $ | 3,034,099 | |
Undistributed ordinary income | | | 37,660 | |
Capital loss carryover | | | 860,601 | |
Notes to Financial Statements
| 8. | FEDERAL INCOME TAX INFORMATION (continued) |
The capital loss carryover, disclosed above, available to the extent allowed by tax law to offset future net capital gain, if any, will expire as follows:
| | | | | |
| | | Loss Carryover | | Expiration Date |
| | $ | 840,304 | | December 31, 2016 |
| | | 20,297 | | December 31, 2017 |
On February 2, 2010, the PNC Financial Services Group, Inc. (“PNC”), which serves as the Series’ sub-accountant services agent and sub-transfer agent, entered into a Stock Purchase Agreement (the “Stock Purchase Agreement”) with The Bank of New York Mellon Corporation (“BNY Mellon”), the Series’ custodian. Upon the terms and subject to the conditions set forth in the Stock Purchase Agreement, which has been approved by the board of directors of each company, PNC will sell to BNY Mellon (the “Stock Sale”) 100% of the issued and outstanding shares of PNC Global Investment Servicing, Inc., an indirect, wholly-owned subsidiary of PNC. The Stock Sale is expected to close in the third quarter of 2010. Management has concluded that this will not have a material impact on the Series’ financial statements.
There were no other subsequent events that require recognition or disclosure. In preparing these financial statements, management of the Fund has evaluated events and transactions for potential recognition or disclosure through February 23, 2010, the date the financial statements were issued.
Report of Independent Registered Public Accounting Firm
To the Board of Directors of Manning & Napier Fund, Inc. and Shareholders of Core Bond Series:
In our opinion, the accompanying statement of assets and liabilities, including the investment portfolio (except for credit ratings), and the related statements of operations and of changes in net assets and the financial highlights present fairly, in all material respects, the financial position of the Core Bond Series (a series of Manning & Napier Fund, Inc., hereafter referred to as the “Series”) at December 31, 2009, and the results of its operations for the year then ended, the changes in its net assets for each of the two years in the period then ended, and the financial highlights for each of the periods indicated, in conformity with accounting principles generally accepted in the United States of America. These financial statements and financial highlights (hereafter referred to as “financial statements”) are the responsibility of the Series’ management; our responsibility is to express an opinion on these financial statements based on our audits. We conducted our audits of these financial statements in accordance with the standards of the Public Company Accounting Oversight Board (United States). Those standards require that we plan and perform the audit to obtain reasonable assurance about whether the financial statements are free of material misstatement. An audit includes examining, on a test basis, evidence supporting the amounts and disclosures in the financial statements, assessing the accounting principles used and significant estimates made by management, and evaluating the overall financial statement presentation. We believe that our audits, which included confirmation of securities at December 31, 2009 by correspondence with the custodian, provide a reasonable basis for our opinion.

Columbus, Ohio
February 23, 2010
Supplemental Tax Information (unaudited)
All designations are based on financial information available as of the date of this annual report and, accordingly are subject to change.
For federal income tax purposes, the Series designates for the current fiscal year $65,107 or, if different, the maximum amount allowable under the tax law as qualified dividend income.
For corporate shareholders, the percentage of investment income (dividend income plus short-term gain, if any) that qualifies for the dividends received deduction for the current fiscal year is 2.19%, or if different, the maximum allowable under tax law.
Renewal of Investment Advisory Agreement (unaudited)
At the Manning & Napier Fund, Inc. (the “Fund”) Board of Directors’ (the “Board”) meeting, held on December 7, 2009, the Investment Advisory Agreement (the “Agreement”) between the Fund and Manning & Napier Advisors, Inc. (the “Advisor”) was reviewed by the Board for renewal. In connection with the decision whether to renew the Agreement, a variety of material was prepared for and reviewed by the Board.
Representatives of the Advisor attended the meeting and presented additional oral and written information to the Board to assist the Board in its considerations. The discussion immediately below outlines the materials and information presented to the Board in connection with the Board’s 2009 Annual Review of the Agreement and the conclusions made by the Directors when determining to continue the Agreement.
| | • | | The Board considered the services provided by the Advisor under the Agreement including, among others: deciding what securities to purchase and sell for each Series; arranging for the purchase and sale of such securities by placing orders with broker-dealers; administering the affairs of the Fund (including the books and records of the Fund not maintained by third party service providers such as the custodian or sub-transfer agent); arranging for the insurance coverage for the Fund; and supervising the preparation of tax returns, SEC filings (including registration statements) and reports to shareholders for the Fund. The Board also considered the nature and quality of such services provided under the Agreement in light of the Advisor’s services provided to the Fund for 23 years. The Board discussed the quality of these services with representatives from the Advisor and concluded that the Advisor was performing its services to the Fund required under the Agreement in a reasonable manner. |
| | • | | The Board considered the investment performance of the various Series of the Fund. The investment performance for each Series was reviewed on a cumulative basis since inception and on a one year basis. In addition, annualized performance for the following time periods was considered: inception, three year, five year, ten year, and current market cycle. A market cycle includes periods of both rising and falling markets. Returns for established benchmark indices for each Series were provided for each time period. The Board noted that the various Series were competitive against their respective benchmarks and/or peer groups over various time periods, but in particular over the full market cycle periods relevant for the Series. In addition, the Board considered at the meeting (and considers on a quarterly basis) a peer group performance analysis consisting of Morningstar universes of mutual funds with similar investment objectives. The Board discussed the performance with representatives from the Advisor and concluded that the investment performance of each of the Fund’s Series was reasonable based on the Fund’s actual performance and comparative performance, especially performance over the current market cycle. |
| | • | | The Board considered the costs of the Advisor’s services and the profits of the Advisor as they relate to the Advisor’s services to the Fund under the Agreement. In reviewing the Advisor’s costs and profits, the Board discussed the Advisor’s revenues generated from the Fund (on both an actual and adjusted basis) and its expenses associated with providing the services under the Agreement. In addition, the Board reviewed the Advisor’s expenses associated with Fund activities outside of the Agreement (such as expense reimbursements pursuant to expense caps and payments made by the Advisor to third party platforms on which shares of the Fund are available for purchase). It was noted by representatives of the Advisor that 13 of the 26 active Series of the Fund are currently experiencing expenses above the capped expense ratios. After discussing the above costs and profits, the Board concluded that the Advisor’s profitability relating to its services provided under the Agreement was reasonable. |
Renewal of Investment Advisory Agreement (unaudited)
| | • | | The Board considered the fees and expenses of the various Series of the Fund. The Advisor presented the advisory fees and total expenses for each Series, including the advisory fee adjusted for any expense waivers or reimbursements (either contractual or voluntary) paid by the Advisor. The advisory fees and expense ratios of each Series were compared to an average (on both a mean and median basis) of similar funds as disclosed on the Morningstar database. Representatives of the Advisor discussed with the Board the levels of its advisory fee for each Series of the Fund and as compared to the median and mean advisory fees for similar funds as listed on Morningstar. Expense ratios for every Series, except the Global Fixed Income Series and the Target Series Class R and Class C, are currently below the median and mean for similar funds as listed on Morningstar. Based on their review of the information provided, the Board concluded that the fees and expenses of each Series of the Fund were reasonable on a comparative basis. |
| | • | | The Board also considered the other benefits the Advisor derives from its relationship with the Fund. Such other benefits include certain research products provided by soft dollars. Given the level of soft dollar transactions involving the Fund, the Board concluded that these additional benefits to the Advisor were reasonable. |
| | • | | In addition to the factors described above, the Board considered the Advisor’s personnel, investment strategies, policies and procedures relating to compliance with personal securities transactions, and reputation, expertise and resources in domestic and foreign financial markets. The Board concluded that these factors support the conclusion that the Advisor performs its services in a reasonable manner. |
| | • | | The Board did not consider economies of scale at this time because of the multiple uses of the Fund (for the Advisor’s discretionary investment account clients in addition to direct investors), the current profitability of the Advisor’s services to the Fund under the Agreement, and the overall size of the Fund complex. |
Based on the Board’s deliberations and their evaluation of the information described above, the Board, including a majority of Directors that are not “interested persons” as defined in the Investment Company Act of 1940, concluded that the compensation under the Agreement was fair and reasonable in light of the services and expenses and such other matters as the Directors considered to be relevant in the exercise of their reasonable judgment. Accordingly, the Board approved the renewal of the Agreement. In the course of their deliberations, the Directors did not identify any particular information that was all important or controlling.
Directors’ and Officers’ Information (unaudited)
The Statement of Additional Information provides additional information about the Fund’s directors and officers and can be obtained without charge by calling 1-800-466-3863, at www.manningnapieradvisors.com, or on the EDGAR Database on the SEC Internet web site (http:// www.sec.gov). The following chart shows certain information about the Fund’s officers and directors, including their principal occupations during the last five years. Unless specific dates are provided, the individuals have held the listed positions for longer than five years.
INTERESTED DIRECTOR/OFFICER
| | |
| Name: | | B. Reuben Auspitz* |
| Address: | | 290 Woodcliff Drive Fairport, NY 14450 |
| Age: | | 62 |
| Current Position(s) Held with Fund: | | Principal Executive Officer, President, Chairman & Director |
| Term of Office1 & Length of Time Served: | | Indefinite - Director since 1984; Vice President 1984 - 2003; President since 2004; Principal Executive Officer since 2002 |
| Principal Occupation(s) During Past 5 Years: | | Executive Vice President; Co-Executive Director; Executive Group Member**; Chief Compliance Officer since 2004 - Manning & Napier Advisors, Inc. President; Director - Manning & Napier Investor Services, Inc. Holds or has held one or more of the following titles for various subsidiaries and affiliates: President, Vice President, Director, Chairman, Treasurer, Chief Compliance Officer or Member. |
| Number of Portfolios Overseen within Fund Complex: | | 29 |
| Other Directorships Held Outside Fund Complex: | | N/A |
| |
| INDEPENDENT DIRECTORS | | |
| |
| Name: | | Stephen B. Ashley |
| Address: | | 290 Woodcliff Drive Fairport, NY 14450 |
| Age: | | 69 |
| Current Position(s) Held with Fund: | | Director, Audit Committee Member, Governance & Nominating Committee Member |
| Term of Office & Length of Time Served: | | Indefinite - Since 1996 |
| Principal Occupation(s) During Past 5 Years: | | Chairman, Director, President & Chief Executive Officer, The Ashley Group (property management and investment). Chairman (non-executive) 2004 - 2008; Director 1995 - 2008 - Fannie Mae (mortgage) |
| Number of Portfolios Overseen within Fund Complex: | | 29 |
| Other Directorships Held Outside Fund Complex: | | The Ashley Group |
| Name: | | Peter L. Faber |
| Address: | | 290 Woodcliff Drive Fairport, NY 14450 |
| Age: | | 71 |
| Current Position(s) Held with Fund: | | Director, Governance & Nominating Committee Member |
| Term of Office & Length of Time Served: | | Indefinite - Since 1987 |
| Principal Occupation(s) During Past 5 Years: | | Senior Counsel since 2006, Partner (1995-2006) - McDermott, Will & Emery LLP (law firm) |
| Number of Portfolios Overseen within Fund Complex: | | 29 |
| Other Directorships Held Outside Fund Complex: | | Partnership for New York City, Inc. (non-profit) New York Collegium (non-profit) Boston Early Music Festival (non-profit) Amherst Early Music, Inc. (non-profit) Gotham Early Music Scene, Inc. (non-profit) |
Directors’ and Officers’ Information (unaudited)
| | |
| INDEPENDENT DIRECTORS (continued) |
| |
| Name: | | Harris H. Rusitzky |
| Address: | | 290 Woodcliff Drive Fairport, NY 14450 |
| Age: | | 75 |
| Current Position(s) Held with Fund: | | Director, Audit Committee Member, Governance & Nominating Committee Member |
| Term of Office & Length of Time Served: | | Indefinite - Since 1985 |
| Principal Occupation(s) During Past 5 Years: | | President, The Greening Group (business consultants) since 1994; Partner, The Restaurant Group (restaurants) since 2006 |
| Number of Portfolios Overseen within Fund Complex: | | 29 |
| Other Directorships Held Outside Fund Complex: | | N/A |
| Name: | | Paul A. Brooke |
| Address: | | 290 Woodcliff Drive Fairport, NY 14450 |
| Age: | | 64 |
| Current Position(s) Held with Fund: | | Director, Audit Committee Member, Governance & Nominating Committee Member |
| Term of Office & Length of Time Served: | | Indefinite - Since 2007 |
| Principal Occupation(s) During Past 5 Years: | | Chairman & CEO, Alsius Corp. (investments); Managing Member, PMSV Holdings LLC (investments) |
| Number of Portfolios Overseen within Fund Complex: | | 29 |
| Other Directorships Held Outside Fund Complex: | | Incyte Corp. ViroPharma, Inc. WebMD Cheyne Capital International MPM Bio-equities GMP Companies HoustonPharma |
| Name: | | Richard M. Hurwitz |
| Address: | | 290 Woodcliff Drive Fairport, NY 14450 |
| Age: | | 46 |
| Current Position(s) Held with Fund: | | Director, Audit Committee Member, Governance & Nominating Committee Member |
| Term of Office & Length of Time Served: | | Indefinite - Since 2009 |
| Principal Occupation(s) During Past 5 Years: | | Managing Partner, Aegis Investment Partners, LLC (investments) since 2006; Founder and Managing Partner (2004-2005) - Village Markets, LLC (groceries) |
| Number of Portfolios Overseen within Fund Complex: | | 29 |
| Other Directorships Held Outside Fund Complex: | | Pictometry International Corp. |
Directors’ and Officers’ Information (unaudited)
| | |
| OFFICERS | | |
| |
| Name: | | Jeffrey S. Coons, Ph.D., CFA |
| Address: | | 290 Woodcliff Drive Fairport, NY 14450 |
| Age: | | 46 |
| Current Position(s) Held with Fund: | | Vice President |
| Term of Office1 & Length of Time Served: | | Since 2004 |
| Principal Occupation(s) During Past 5 Years: | | Co-Director of Research since 2002 & Executive Group Member** since 2003, Manning & Napier Advisors, Inc. Holds one or more of the following titles for various subsidiaries and affiliates: President, Director, Treasurer or Senior Trust Officer. |
| Number of Portfolios Overseen within Fund Complex: | | 29 |
| Other Directorships Held Outside Fund Complex: | | N/A |
| Name: | | Christine Glavin |
| Address: | | 290 Woodcliff Drive Fairport, NY 14450 |
| Age: | | 43 |
| Current Position(s) Held with Fund: | | Principal Financial Officer, Chief Financial Officer |
| Term of Office1 & Length of Time Served: | | Principal Financial Officer since 2002; Chief Financial Officer since 2001 |
| Principal Occupation(s) During Past 5 Years: | | Fund Reporting Manager, Manning & Napier Advisors, Inc. since 1997 |
| Number of Portfolios Overseen within Fund Complex: | | 29 |
| Other Directorships Held Outside Fund Complex: | | N/A |
| Name: | | Jodi L. Hedberg |
| Address: | | 290 Woodcliff Drive Fairport, NY 14450 |
| Age: | | 42 |
| Current Position(s) Held with Fund: | | Corporate Secretary, Chief Compliance Officer, Anti-Money Laundering Compliance Officer |
| Term of Office1 & Length of Time Served: | | Corporate Secretary since 1997; Chief Compliance Officer since 2004 |
| Principal Occupation(s) During Past 5 Years: | | Director of Compliance, Manning & Napier Advisors, Inc. and affiliates since 1990 (title change in 2005 from Compliance Manager to Director of Compliance); Corporate Secretary, Manning & Napier Investor Services, Inc. since 2006 |
| Number of Portfolios Overseen within Fund Complex: | | 29 |
| Other Directorships Held Outside Fund Complex: | | N/A |
*Interested Director, within the meaning of the Investment Company Act of 1940 by reason of his position with the Fund’s investment advisor and distributor. Mr. Auspitz serves as the Executive Vice President and Director, Manning & Napier Advisors, Inc. and President and Director, Manning & Napier Investor Services, Inc., the Fund’s distributor.
**The Executive Group performs the duties of the Office of the Chief Executive of Manning & Napier Advisors, Inc.
1The term of office for President, Vice President, Chief Financial Officer, and Corporate Secretary is one year and until their respective successors are chosen and qualified. All other officers’ terms are indefinite.
This Page Intentionally Left Blank
Literature Requests (unaudited)
Proxy Voting Policies and Procedures
A description of the policies and procedures that the Fund uses to determine how to vote proxies relating to portfolio securities is available, without charge, upon request:
| | |
By phone | | 1-800-466-3863 |
On the Securities and Exchange Commission’s (SEC) web site | | http://www.sec.gov |
Proxy Voting Record
Information regarding how the Fund voted proxies relating to portfolio securities during the most recent 12-month period ended June 30th is available, without charge, upon request:
| | |
By phone | | 1-800-466-3863 |
On the SEC’s web site | | http://www.sec.gov |
Quarterly Portfolio Holdings
The Series’ complete schedule of portfolio holdings for the 1st and 3rd quarters of each fiscal year are provided on Form N-Q, and are available, without charge, upon request:
| | |
By phone | | 1-800-466-3863 |
On the SEC’s web site | | http://www.sec.gov |
The Series’ Form N-Q may be reviewed and copied at the SEC’s Public Reference Room in Washington, D.C. Information on the operation of the Public Reference Room may be obtained by calling 1-800-SEC-0330.
Prospectus and Statement of Additional Information (SAI)
The prospectus and SAI provide additional information about each Series, including charges, expenses and risks. These documents are available, without charge, upon request:
| | |
By phone | | 1-800-466-3863 |
On the SEC’s web site | | http://www.sec.gov |
On the Advisor’s web site | | http://www.manningnapieradvisors.com |
Additional information available at www.manningnapieradvisors.com
1. Fund Holdings - Month-End
2. Fund Holdings - Quarter-End
3. Shareholder Report - Annual
4. Shareholder Report - Semi-Annual


Management Discussion and Analysis (unaudited)

Dear Shareholders:
Fixed income returns varied greatly in 2009 across market sectors and quality ratings. As 2009 unfolded, the credit crisis maintained a strong hold on the markets, with short-term securities and U.S. Treasuries representing the only safe havens in global markets. Following stock market lows in late March 2009, investor sentiment shifted to modest optimism, and lower quality securities, both stocks and bonds, rallied strongly.
Overall, corporate and municipal securities posted strong returns during 2009, with below investment grade securities experiencing significant gains. In contrast, U.S. Treasury securities largely suffered losses. Mortgage securities returned solid gains, though meaningfully below those of even investment grade corporate securities. Clearly, sector and quality selection were important factors during 2009.
Overall, the Bank of America (BofA) Merrill Lynch U.S. Corporate, Government and Mortgage Index (formerly a Merrill Lynch Index) earned a solid 5.24% during the year. The 14.35% return of the Core Plus Bond Series during 2009 dramatically outpaced that of its benchmark.
The Core Plus Bond Series made a substantial shift out of AAA-rated mortgage backed securities and into slightly lesser rated corporate bonds in late 2008 and early 2009. The Series also increased its allocation to below investment grade rated securities throughout the year. These moves detracted from performance early in the year, but provided a meaningful advantage during the second and third quarters as market sentiment recovered and credit crisis fears eased. During the fourth quarter, the Series sold its mortgage-backed securities and reinvested the proceeds into U.S. Agency debentures. As of the end of the year, the Series had a 19.8% allocation to corporate bonds rated below investment grade, which is near the 20% limit for the Series. As for sector allocation, the Series had 72.0% of assets invested in corporate bonds as of year end.
As the global recovery continues to unfold, it will be important to monitor changes in factors such as monetary policy, inflation expectations and other cyclical or secular trends. We will continue to employ an active approach to fixed income, considering sector, maturity, quality and issue selections as key tools for seeking out return potential and managing risk over full bond market cycles.
As always, we appreciate your business.
Sincerely,
Manning & Napier Advisors, Inc.
Performance Update as of December 31, 2009 (unaudited)
| | | | | | |
| | | Average Annual Total Returns
As of December 31, 2009 | | |
| | | One Year | | Since
Inception1 | | |
| | | | | | | |
Manning & Napier Fund, Inc. - Core Plus Bond Series2 | | 14.35% | | 5.33% | | |
Bank of America (BofA) Merrill Lynch U.S. Corporate, Government & Mortgage Index3 | | 5.24% | | 5.30% | | |
The following graph compares the value of a $10,000 investment in the Manning & Napier Fund, Inc. - Core Plus Bond Series from its inception1 (4/21/05) to present (12/31/09) to the BofA Merrill Lynch U.S. Corporate, Government & Mortgage Index.
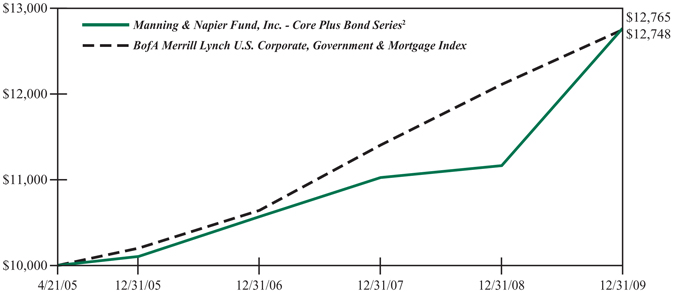
1Performance numbers for the Series and Index are calculated from April 21, 2005, the Series’ inception date.
2The Series’ performance does not reflect the deduction of taxes that a shareholder would pay on fund distributions or the redemption of shares. The Series’ performance is historical and may not be indicative of future results. The performance returns shown are inclusive of the net expense ratio of the Series. For the year ended December 31, 2009, this net expense ratio was 0.78%. The gross expense ratio, which does not account for any voluntary or contractual waivers currently in effect, was 0.78% for the year ended December 31, 2009.
3The unmanaged BofA Merrill Lynch U.S. Corporate, Government & Mortgage Index (formerly a Merrill Lynch Index) is a market value weighted measure that represents U.S. government, corporate, and pass-through securities issued by entities within the United States, by supranational entities, or by entities headquartered outside of the United States but who have issued dollar-denominated securities within the United States. The Index only includes investment-grade securities with maturities of greater than one year. The Index returns assume reinvestment of coupons and, unlike Series returns, do not reflect any fees or expenses.
Shareholder Expense Example (unaudited)
As a shareholder of the Series, you may incur two types of costs: (1) transaction costs, including potential wire charges on redemptions and (2) ongoing costs, including management fees and other Series expenses. This example is intended to help you understand your ongoing costs (in dollars) of investing in the Series and to compare these costs with the ongoing costs of investing in other mutual funds.
The example is based on an investment of $1,000 invested at the beginning of the period and held for the entire period (July 1, 2009 to December 31, 2009).
Actual Expenses
The first line of the table below provides information about actual account values and actual expenses. You may use the information in this line, together with the amount you invested, to estimate the expenses that you paid over the period. Simply divide your account value by $1,000 (for example, an $8,600 account value divided by $1,000 = 8.6), then multiply the result by the number in the first line under the heading entitled “Expenses Paid During Period” to estimate the expenses you paid on your account during this period.
Hypothetical Example for Comparison Purposes
The second line of the table below provides information about hypothetical account values and hypothetical expenses based on the Series’ actual expense ratio and an assumed rate of return of 5% per year before expenses, which is not the Series’ actual return. The hypothetical account values and expenses may not be used to estimate the actual ending account balance or expenses you paid during the period. You may use this information to compare the ongoing costs of investing in the Series and other funds. To do so, compare this 5% hypothetical example with the 5% hypothetical examples that appear in the shareholder reports of the other funds.
Please note that the expenses shown in the table are meant to highlight your ongoing costs only and do not reflect any transaction costs, such as potential wire charges on redemptions. Therefore, the second line of the table is useful in comparing ongoing costs only, and will not help you determine the relative total costs of owning different funds. In addition, if these transaction costs were included, your costs would have been higher.
| | | | | | | | | |
| | | Beginning
Account Value
7/1/09 | | Ending
Account Value
12/31/09 | | Expenses Paid
During Period*
7/1/09-12/31/09 |
Actual | | $ | 1,000.00 | | $ | 1,086.20 | | $ | 4.05 |
Hypothetical
(5% return before expenses) | | $ | 1,000.00 | | $ | 1,021.32 | | $ | 3.92 |
*Expenses are equal to the Series’ annualized expense ratio (for the six-month period) of 0.77%, multiplied by the average account value over the period, multiplied by 184/365 (to reflect the one-half year period). Expenses are based on the most recent fiscal half year; therefore, the expense ratio stated above may differ from the expense ratio stated in the financial highlights, which is based on one-year data. The Series’ total return would have been lower had certain expenses not been waived during the period.
Portfolio Composition as of December 31, 2009 (unaudited)
Sector Allocation1
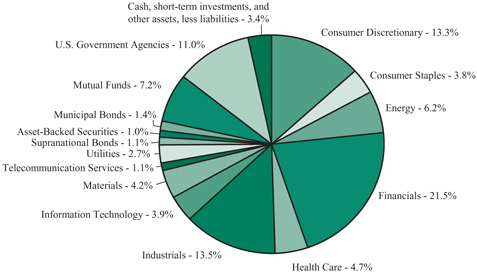
1As a percentage of net assets.
Credit Quality Ratings2,3
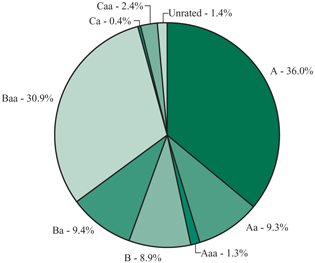
2As a percentage of total corporate bonds, supranational bonds, preferred stock, asset-backed securities, and municipal bonds.
3Based on ratings from Moody’s, or the S&P equivalent. The Series may use different ratings provided by other rating agencies for purposes of determining compliance with the Series’ investment policies.
Investment Portfolio - December 31, 2009
| | | | | | | | |
| | | Credit
Rating1
(unaudited) | | Principal
Amount | | Value
(Note 2) |
| | | | | | | | |
| | | |
CORPORATE BONDS - 72.0% | | | | | | | | |
| | | |
Convertible Corporate Bonds - 2.4% | | | | | | | | |
Consumer Discretionary - 0.5% | | | | | | | | |
Hotels, Restaurants & Leisure - 0.5% | | | | | | | | |
Carnival Corp., 2.00%, 4/15/2021 | | A3 | | $ | 1,680,000 | | $ | 1,732,500 |
| | | | | | | | |
Financials - 0.1% | | | | | | | | |
Real Estate Investment Trusts (REITS) - 0.1% | | | | | | | | |
Host Hotels & Resorts LP4 , 2.50%, 10/15/2029 | | BB2 | | | 370,000 | | | 395,438 |
| | | | | | | | |
Health Care - 1.0% | | | | | | | | |
Biotechnology - 0.8% | | | | | | | | |
Amgen, Inc., 0.375%, 2/1/2013 | | A3 | | | 3,270,000 | | | 3,290,437 |
| | | | | | | | |
Health Care Equipment & Supplies - 0.2% | | | | | | | | |
Medtronic, Inc., 1.625%, 4/15/2013 | | A1 | | | 665,000 | | | 694,094 |
| | | | | | | | |
Total Health Care | | | | | | | | 3,984,531 |
| | | | | | | | |
Industrials - 0.3% | | | | | | | | |
Airlines - 0.3% | | | | | | | | |
AirTran Holdings, Inc., 5.25%, 11/1/2016 | | CCC2 | | | 1,000,000 | | | 1,086,250 |
| | | | | | | | |
Information Technology - 0.5% | | | | | | | | |
Computers & Peripherals - 0.5% | | | | | | | | |
EMC Corp., 1.75%, 12/1/2013 | | A2 | | | 1,685,000 | | | 2,108,356 |
| | | | | | | | |
Total Convertible Corporate Bonds
(Identified Cost $9,194,725) | | | | | | | | 9,307,075 |
| | | | | | | | |
Non-Convertible Corporate Bonds - 69.6% | | | | | | | | |
Consumer Discretionary - 12.8% | | | | | | | | |
Diversified Consumer Services - 0.2% | | | | | | | | |
Affinion Group, Inc., 11.50%, 10/15/2015 | | Caa1 | | | 850,000 | | | 890,375 |
| | | | | | | | |
Hotels, Restaurants & Leisure - 1.9% | | | | | | | | |
International Game Technology, 7.50%, 6/15/2019 | | Baa2 | | | 3,320,000 | | | 3,597,652 |
Pinnacle Entertainment, Inc., 7.50%, 6/15/2015 | | Caa1 | | | 1,000,000 | | | 920,000 |
Scientific Games International, Inc., 9.25%, 6/15/2019 | | Ba3 | | | 1,000,000 | | | 1,050,000 |
Wendy’s - Arby’s Restaurants LLC, 10.00%, 7/15/2016 | | B2 | | | 1,000,000 | | | 1,090,000 |
Yonkers Racing Corp.4 , 11.375%, 7/15/2016 | | B1 | | | 1,000,000 | | | 1,050,000 |
| | | | | | | | |
| | | | | | | | 7,707,652 |
| | | | | | | | |
| | |
| The accompanying notes are an integral part of the financial statements. | | 5 |
Investment Portfolio - December 31, 2009
| | | | | | | | |
| | | Credit
Rating1
(unaudited) | | Principal
Amount | | Value
(Note 2) |
| | | | | | | | |
| | | |
CORPORATE BONDS (continued) | | | | | | | | |
| | | |
Non-Convertible Corporate Bonds (continued) | | | | | | | | |
Consumer Discretionary (continued) | | | | | | | | |
Household Durables - 1.0% | | | | | | | | |
Fortune Brands, Inc., 5.375%, 1/15/2016 | | Baa3 | | $ | 4,160,000 | | $ | 4,140,656 |
| | | | | | | | |
Media - 3.7% | | | | | | | | |
Cablevision Systems Corp.4 , 8.625%, 9/15/2017 | | B1 | | | 1,000,000 | | | 1,041,250 |
Columbus International, Inc. | | | | | | | | |
(Barbados)4 , 11.50%, 11/20/2014 | | B2 | | | 900,000 | | | 945,000 |
Comcast Corp., 6.50%, 11/15/2035 | | Baa1 | | | 3,105,000 | | | 3,219,453 |
Comcast Corp., 6.95%, 8/15/2037 | | Baa1 | | | 1,855,000 | | | 2,021,752 |
Sirius XM Radio, Inc.4 , 9.75%, 9/1/2015 | | Caa2 | | | 1,125,000 | | | 1,184,062 |
Time Warner, Inc., 7.625%, 4/15/2031 | | Baa2 | | | 2,725,000 | | | 3,165,436 |
UPC Germany GmbH (Germany)4 , 8.125%, 12/1/2017 | | B1 | | | 600,000 | | | 873,031 |
UPC Holding B.V. (Netherlands)4 , 9.875%, 4/15/2018 | | B2 | | | 1,000,000 | | | 1,055,000 |
Virgin Media Finance plc, Series 1 (United Kingdom), 9.50%, 8/15/2016 | | B2 | | | 1,000,000 | | | 1,073,750 |
| | | | | | | | |
| | | | | | | | 14,578,734 |
| | | | | | | | |
Multiline Retail - 0.9% | | | | | | | | |
Target Corp., 6.00%, 1/15/2018 | | A2 | | | 3,225,000 | | | 3,559,394 |
| | | | | | | | |
Real Estate Investment Trusts (REITS) - 1.0% | | | | | | | | |
Simon Property Group LP, 10.35%, 4/1/2019 | | A3 | | | 3,040,000 | | | 3,818,444 |
| | | | | | | | |
Specialty Retail - 2.5% | | | | | | | | |
General Nutrition Centers, Inc., 10.75%, 3/15/2015 | | Caa2 | | | 1,000,000 | | | 1,017,500 |
Home Depot, Inc., 5.40%, 3/1/2016 | | Baa1 | | | 4,065,000 | | | 4,255,486 |
Lowe’s Companies, Inc., 6.10%, 9/15/2017 | | A1 | | | 3,175,000 | | | 3,512,591 |
Toys R Us Property Co. LLC4 , 8.50%, 12/1/2017 | | Ba2 | | | 920,000 | | | 936,100 |
| | | | | | | | |
| | | | | | | | 9,721,677 |
| | | | | | | | |
Textiles, Apparel & Luxury Goods - 1.6% | | | | | | | | |
Levi Strauss & Co., 8.625%, 4/1/2013 | | B2 | | | 600,000 | | | 860,129 |
Phillips-Van Heusen Corp., 7.75%, 11/15/2023 | | Baa3 | | | 2,500,000 | | | 2,302,937 |
VF Corp., 5.95%, 11/1/2017 | | A3 | | | 2,815,000 | | | 3,039,116 |
| | | | | | | | |
| | | | | | | | 6,202,182 |
| | | | | | | | |
Total Consumer Discretionary | | | | | | | | 50,619,114 |
| | | | | | | | |
| | |
| 6 | | The accompanying notes are an integral part of the financial statements. |
Investment Portfolio - December 31, 2009
| | | | | | | | |
| | | Credit
Rating1
(unaudited) | | Principal
Amount | | Value
(Note 2) |
| | | | | | | | |
| | | |
CORPORATE BONDS (continued) | | | | | | | | |
| | | |
Non-Convertible Corporate Bonds (continued) | | | | | | | | |
Consumer Staples - 3.8% | | | | | | | | |
Beverages - 1.7% | | | | | | | | |
CEDC Finance Corp. International, Inc.4 , 9.125%, 12/1/2016 | | B1 | | $ | 1,215,000 | | $ | 1,251,450 |
Constellation Brands, Inc., 8.375%, 12/15/2014 | | Ba3 | | | 1,205,000 | | | 1,283,325 |
PepsiCo, Inc., 7.90%, 11/1/2018 | | Aa2 | | | 3,330,000 | | | 4,086,759 |
| | | | | | | | |
| | | | | | | | 6,621,534 |
| | | | | | | | |
Food Products - 1.8% | | | | | | | | |
General Mills, Inc., 5.65%, 2/15/2019 | | Baa1 | | | 3,260,000 | | | 3,457,396 |
Kraft Foods, Inc., 6.125%, 2/1/2018 | | Baa2 | | | 3,610,000 | | | 3,796,067 |
| | | | | | | | |
| | | | | | | | 7,253,463 |
| | | | | | | | |
Household Products - 0.0%* | | | | | | | | |
The Procter & Gamble Co., 4.85%, 12/15/2015 | | Aa3 | | | 25,000 | | | 27,241 |
| | | | | | | | |
Personal Products - 0.3% | | | | | | | | |
Revlon Consumer Products Corp.4 , 9.75%, 11/15/2015 | | B3 | | | 1,215,000 | | | 1,254,488 |
| | | | | | | | |
Total Consumer Staples | | | | | | | | 15,156,726 |
| | | | | | | | |
Energy - 6.2% | | | | | | | | |
Energy Equipment & Services - 2.5% | | | | | | | | |
Baker Hughes, Inc., 7.50%, 11/15/2018 | | A2 | | | 3,155,000 | | | 3,766,073 |
Cie Generale de Geophysique - Veritas (France), 7.75%, 5/15/2017 | | Ba3 | | | 1,000,000 | | | 992,500 |
Hornbeck Offshore Services, Inc.4 , 8.00%, 9/1/2017 | | Ba3 | | | 500,000 | | | 500,000 |
Key Energy Services, Inc., 8.375%, 12/1/2014 | | B1 | | | 1,000,000 | | | 1,002,500 |
Weatherford International Ltd. (Switzerland), 9.625%, 3/1/2019 | | Baa1 | | | 3,050,000 | | | 3,802,444 |
| | | | | | | | |
| | | | | | | | 10,063,517 |
| | | | | | | | |
Oil, Gas & Consumable Fuels - 3.7% | | | | | | | | |
Alon Refining Krotz Springs, Inc.4 , 13.50%, 10/15/2014 | | B2 | | | 1,000,000 | | | 932,500 |
Anadarko Petroleum Corp., 5.95%, 9/15/2016 | | Baa3 | | | 1,875,000 | | | 2,028,182 |
Apache Corp., 6.90%, 9/15/2018 | | A3 | | | 2,275,000 | | | 2,665,777 |
Aquilex Holdings LLC - Aquilex Finance Corp.4 , 11.125%, 12/15/2016 | | B3 | | | 740,000 | | | 738,150 |
| | |
| The accompanying notes are an integral part of the financial statements. | | 7 |
Investment Portfolio - December 31, 2009
| | | | | | | | |
| | | Credit
Rating1
(unaudited) | | Principal
Amount | | Value
(Note 2) |
| | | | | | | | |
| | | |
CORPORATE BONDS (continued) | | | | | | | | |
| | | |
Non-Convertible Corporate Bonds (continued) | | | | | | | | |
Energy (continued) | | | | | | | | |
Oil, Gas & Consumable Fuels (continued) | | | | | | | | |
Arch Western Finance LLC, 6.75%, 7/1/2013 | | B1 | | $ | 1,515,000 | | $ | 1,503,637 |
Chesapeake Energy Corp., 9.50%, 2/15/2015 | | Ba3 | | | 1,000,000 | | | 1,097,500 |
Gibson Energy ULC - GEP Midstream Finance Corp. (Canada)4 , 11.75%, 5/27/2014 | | Ba3 | | | 2,000,000 | | | 2,170,000 |
Plains Exploration & Production Co., 8.625%, 10/15/2019 | | B1 | | | 1,000,000 | | | 1,027,500 |
Tesoro Corp., 9.75%, 6/1/2019 | | Ba1 | | | 1,250,000 | | | 1,293,750 |
Whiting Petroleum Corp., 7.00%, 2/1/2014 | | B1 | | | 1,000,000 | | | 1,003,750 |
| | | | | | | | |
| | | | | | | | 14,460,746 |
| | | | | | | | |
Total Energy | | | | | | | | 24,524,263 |
| | | | | | | | |
Financials - 18.5% | | | | | | | | |
Capital Markets - 3.7% | | | | | | | | |
Goldman Sachs Capital I, 6.345%, 2/15/2034 | | A2 | | | 3,450,000 | | | 3,230,094 |
Goldman Sachs Capital II5 , 5.793%, 12/29/2049 | | A3 | | | 3,970,000 | | | 3,076,750 |
The Goldman Sachs Group, Inc., 6.15%, 4/1/2018 | | A1 | | | 3,385,000 | | | 3,623,639 |
Merrill Lynch & Co., Inc., 6.11%, 1/29/2037 | | A3 | | | 1,145,000 | | | 1,055,601 |
Morgan Stanley, 5.55%, 4/27/2017 | | A2 | | | 3,544,000 | | | 3,559,689 |
| | | | | | | | |
| | | | | | | | 14,545,773 |
| | | | | | | | |
Commercial Banks - 3.8% | | | | | | | | |
Household Finance Co. (now known as HSBC Finance Corp.), 6.375%, 11/27/2012 | | A3 | | | 815,000 | | | 887,562 |
Manufacturers & Traders Trust Co., 6.625%, 12/4/2017 | | A3 | | | 4,605,000 | | | 4,722,566 |
PNC Bank National Association9 , 5.25%, 1/15/2017 | | A2 | | | 5,640,000 | | | 5,617,000 |
U.S. Bank National Association, 6.375%, 8/1/2011 | | Aa2 | | | 85,000 | | | 91,373 |
Wachovia Corp., 5.25%, 8/1/2014 | | A2 | | | 3,490,000 | | | 3,613,061 |
| | | | | | | | |
| | | | | | | | 14,931,562 |
| | | | | | | | |
| | |
| 8 | | The accompanying notes are an integral part of the financial statements. |
Investment Portfolio - December 31, 2009
| | | | | | | | |
| | | Credit
Rating1
(unaudited) | | Principal
Amount | | Value
(Note 2) |
| | | | | | | | |
| | | |
CORPORATE BONDS (continued) | | | | | | | | |
| | | |
Non-Convertible Corporate Bonds (continued) | | | | | | | | |
Financials (continued) | | | | | | | | |
Consumer Finance - 1.8% | | | | | | | | |
American Express Co., 8.125%, 5/20/2019 | | A3 | | $ | 3,340,000 | | $ | 3,958,104 |
American Express Co.5 , 6.80%, 9/1/2066 | | Baa2 | | | 3,445,000 | | | 3,083,275 |
| | | | | | | | |
| | | | | | | | 7,041,379 |
| | | | | | | | |
Diversified Financial Services - 4.3% | | | | | | | | |
Bank of America Corp., 5.75%, 8/15/2016 | | A3 | | | 3,715,000 | | | 3,739,240 |
Bank of America Corp., 7.625%, 6/1/2019 | | A2 | | | 3,315,000 | | | 3,834,948 |
Citigroup, Inc., 8.50%, 5/22/2019 | | A3 | | | 4,000,000 | | | 4,619,012 |
JPMorgan Chase & Co., 6.30%, 4/23/2019 | | Aa3 | | | 4,300,000 | | | 4,730,331 |
| | | | | | | | |
| | | | | | | | 16,923,531 |
| | | | | | | | |
Insurance - 0.7% | | | | | | | | |
Ambac Financial Group, Inc., 5.95%, 12/5/2035 | | Ca | | | 4,755,000 | | | 1,308,595 |
American International Group, Inc., 4.25%, 5/15/2013 | | A3 | | | 1,840,000 | | | 1,699,621 |
| | | | | | | | |
| | | | | | | | 3,008,216 |
| | | | | | | | |
Real Estate Investment Trusts (REITS) - 4.2% | | | | | | | | |
AvalonBay Communities, Inc., 6.10%, 3/15/2020 | | Baa1 | | | 3,700,000 | | | 3,778,284 |
Boston Properties LP, 5.875%, 10/15/2019 | | Baa2 | | | 3,830,000 | | | 3,841,992 |
Camden Property Trust, 5.70%, 5/15/2017 | | Baa1 | | | 4,025,000 | | | 3,796,424 |
DuPont Fabros Technology LP4 , 8.50%, 12/15/2017 | | Ba2 | | | 1,475,000 | | | 1,498,969 |
HCP, Inc., 6.70%, 1/30/2018 | | Baa3 | | | 3,850,000 | | | 3,735,016 |
| | | | | | | | |
| | | | | | | | 16,650,685 |
| | | | | | | | |
Total Financials | | | | | | | | 73,101,146 |
| | | | | | | | |
Health Care - 3.7% | | | | | | | | |
Health Care Equipment & Supplies - 1.9% | | | | | | | | |
Becton Dickinson and Co., 6.00%, 5/15/2039 | | A2 | | | 3,350,000 | | | 3,521,771 |
Fresenius Medical Care Capital Trust IV, 7.875%, 6/15/2011 | | Ba3 | | | 2,000,000 | | | 2,072,500 |
| | |
| The accompanying notes are an integral part of the financial statements. | | 9 |
Investment Portfolio - December 31, 2009
| | | | | | | | |
| | | Credit
Rating1
(unaudited) | | Principal
Amount | | Value
(Note 2) |
| | | | | | | | |
| | | |
CORPORATE BONDS (continued) | | | | | | | | |
| | | |
Non-Convertible Corporate Bonds (continued) | | | | | | | | |
Health Care (continued) | | | | | | | | |
Health Care Equipment & Supplies (continued) | | | | | | | | |
Inverness Medical Innovations, Inc., 9.00%, 5/15/2016 | | B3 | | $ | 2,000,000 | | $ | 2,050,000 |
| | | | | | | | |
| | | | | | | | 7,644,271 |
| | | | | | | | |
Health Care Providers & Services - 0.5% | | | | | | | | |
HCA, Inc.4 , 8.50%, 4/15/2019 | | Ba3 | | | 1,000,000 | | | 1,077,500 |
Health Management Associates, Inc., 6.125%, 4/15/2016 | | BB2 | | | 1,050,000 | | | 984,375 |
| | | | | | | | |
| | | | | | | | 2,061,875 |
| | | | | | | | |
Pharmaceuticals - 1.3% | | | | | | | | |
Abbott Laboratories, 5.875%, 5/15/2016 | | A1 | | | 500,000 | | | 551,495 |
Novartis Securities Investment Ltd. (Bermuda), 5.125%, 2/10/2019 | | Aa2 | | | 4,350,000 | | | 4,569,788 |
| | | | | | | | |
| | | | | | | | 5,121,283 |
| | | | | | | | |
Total Health Care | | | | | | | | 14,827,429 |
| | | | | | | | |
Industrials - 13.2% | | | | | | | | |
Aerospace & Defense - 0.8% | | | | | | | | |
The Boeing Co., 6.00%, 3/15/2019 | | A2 | | | 3,085,000 | | | 3,347,731 |
| | | | | | | | |
Air Freight & Logistics - 0.1% | | | | | | | | |
FedEx Corp., 8.00%, 1/15/2019 | | Baa2 | | | 435,000 | | | 523,932 |
| | | | | | | | |
Airlines - 1.3% | | | | | | | | |
AirTran Airways, Inc.6,7 , 10.41%, 4/1/2017 | | B1 | | | 275,055 | | | 244,111 |
Delta Air Lines, Inc.4 , 9.50%, 9/15/2014 | | Ba2 | | | 1,000,000 | | | 1,038,750 |
Southwest Airlines Co., 5.25%, 10/1/2014 | | Baa3 | | | 3,925,000 | | | 3,975,515 |
| | | | | | | | |
| | | | | | | | 5,258,376 |
| | | | | | | | |
Building Products - 0.6% | | | | | | | | |
Owens Corning, 9.00%, 6/15/2019 | | Ba1 | | | 1,095,000 | | | 1,221,121 |
USG Corp.4 , 9.75%, 8/1/2014 | | B1 | | | 1,000,000 | | | 1,067,500 |
| | | | | | | | |
| | | | | | | | 2,288,621 |
| | | | | | | | |
Commercial Services & Supplies - 1.2% | | | | | | | | |
Clean Harbors, Inc., 7.625%, 8/15/2016 | | Ba2 | | | 1,000,000 | | | 1,013,750 |
Waste Management, Inc., 7.375%, 3/11/2019 | | Baa3 | | | 3,130,000 | | | 3,611,757 |
| | | | | | | | |
| | | | | | | | 4,625,507 |
| | | | | | | | |
| | |
| 10 | | The accompanying notes are an integral part of the financial statements. |
Investment Portfolio - December 31, 2009
| | | | | | | | |
| | | Credit
Rating1
(unaudited) | | Principal
Amount | | Value
(Note 2) |
| | | | | | | | |
| | | |
CORPORATE BONDS (continued) | | | | | | | | |
| | | |
Non-Convertible Corporate Bonds (continued) | | | | | | | | |
Industrials (continued) | | | | | | | | |
Industrial Conglomerates - 3.8% | | | | | | | | |
General Electric Capital Corp., 5.625%, 5/1/2018 | | Aa2 | | $ | 2,150,000 | | $ | 2,203,193 |
General Electric Capital Corp.5 , 6.375%, 11/15/2067 | | Aa3 | | | 3,545,000 | | | 3,075,288 |
General Electric Capital Corp., Series A, 6.75%, 3/15/2032 | | Aa2 | | | 3,695,000 | | | 3,767,293 |
General Electric Co., 5.25%, 12/6/2017 | | Aa2 | | | 2,100,000 | | | 2,145,916 |
Textron, Inc., 7.25%, 10/1/2019 | | Baa3 | | | 3,790,000 | | | 3,922,915 |
| | | | | | | | |
| | | | | | | | 15,114,605 |
| | | | | | | | |
Machinery - 2.4% | | | | | | | | |
Caterpillar Financial Services Corp., 7.05%, 10/1/2018 | | A2 | | | 3,385,000 | | | 3,874,833 |
John Deere Capital Corp., 5.50%, 4/13/2017 | | A2 | | | 1,240,000 | | | 1,314,452 |
John Deere Capital Corp., 5.75%, 9/10/2018 | | A2 | | | 3,795,000 | | | 4,114,968 |
| | | | | | | | |
| | | | | | | | 9,304,253 |
| | | | | | | | |
Marine - 0.4% | | | | | | | | |
Navios Maritime Holdings, Inc. - Navios Maritime Finance (US), Inc. (Marshall Island)4 , 8.875%, 11/1/2017 | | Ba3 | | | 615,000 | | | 638,831 |
United Maritime Group LLC - United Maritime Group Finance Corp.4 , 11.75%, 6/15/2015 | | B3 | | | 740,000 | | | 741,850 |
| | | | | | | | |
| | | | | | | | 1,380,681 |
| | | | | | | | |
Road & Rail - 2.6% | | | | | | | | |
CSX Corp., 6.00%, 10/1/2036 | | Baa3 | | | 4,530,000 | | | 4,476,007 |
RailAmerica, Inc., 9.25%, 7/1/2017 | | B1 | | | 1,800,000 | | | 1,914,750 |
Union Pacific Corp., 5.65%, 5/1/2017 | | Baa2 | | | 3,675,000 | | | 3,885,872 |
| | | | | | | | |
| | | | | | | | 10,276,629 |
| | | | | | | | |
Total Industrials | | | | | | | | 52,120,335 |
| | | | | | | | |
Information Technology - 3.4% | | | | | | | | |
Communications Equipment - 1.5% | | | | | | | | |
Alcatel-Lucent (USA), Inc., 6.50%, 1/15/2028 | | B1 | | | 1,000,000 | | | 711,250 |
Cisco Systems, Inc., 5.90%, 2/15/2039 | | A1 | | | 3,310,000 | | | 3,346,695 |
Hughes Network Systems LLC - HNS Finance Corp., 9.50%, 4/15/2014 | | B1 | | | 1,000,000 | | | 1,032,500 |
| | |
| The accompanying notes are an integral part of the financial statements. | | 11 |
Investment Portfolio - December 31, 2009
| | | | | | | | |
| | | Credit
Rating1
(unaudited) | | Principal
Amount | | Value
(Note 2) |
| | | | | | | | |
| | | |
CORPORATE BONDS (continued) | | | | | | | | |
| | | |
Non-Convertible Corporate Bonds (continued) | | | | | | | | |
Information Technology (continued) | | | | | | | | |
Communications Equipment (continued) | | | | | | | | |
Nokia Corp. (Finland), 5.375%, 5/15/2019 | | A2 | | $ | 1,000,000 | | $ | 1,020,942 |
| | | | | | | | |
| | | | | | | | 6,111,387 |
| | | | | | | | |
Computers & Peripherals - 0.8% | | | | | | | | |
International Business Machines Corp., 5.60%, 11/30/2039 | | A1 | | | 2,981,000 | | | 2,998,102 |
| | | | | | | | |
Electronic Equipment, Instruments & Components - 1.1% | | | | | | |
Corning, Inc., 6.20%, 3/15/2016 | | Baa1 | | | 3,915,000 | | | 4,154,993 |
| | | | | | | | |
Total Information Technology | | | | | | | | 13,264,482 |
| | | | | | | | |
Materials - 4.2% | | | | | | | | |
Chemicals - 1.0% | | | | | | | | |
E.I. du Pont de Nemours & Co., 6.00%, 7/15/2018 | | A2 | | | 3,435,000 | | | 3,748,166 |
| | | | | | | | |
Containers & Packaging - 0.5% | | | | | | | | |
BWAY Corp.4 , 10.00%, 4/15/2014 | | B3 | | | 1,000,000 | | | 1,057,500 |
Reynolds Group Issuer, Inc. - Reynolds Group Issuer LLC - Reynolds Group Issuer Lu4 , 7.75%, 10/15/2016 | | B1 | | | 1,000,000 | | | 1,022,500 |
| | | | | | | | |
| | | | | | | | 2,080,000 |
| | | | | | | | |
Metals & Mining - 1.6% | | | | | | | | |
Alcoa, Inc., 5.87%, 2/23/2022 | | Baa3 | | | 2,185,000 | | | 2,028,960 |
BHP Billiton Finance (USA) Ltd. (Australia), 6.50%, 4/1/2019 | | A1 | | | 3,230,000 | | | 3,704,994 |
Teck Resources Ltd. (Canada), 10.75%, 5/15/2019 | | Ba2 | | | 500,000 | | | 597,500 |
| | | | | | | | |
| | | | | | | | 6,331,454 |
| | | | | | | | |
Paper & Forest Products - 1.1% | | | | | | | | |
Georgia-Pacific LLC4 , 8.25%, 5/1/2016 | | Ba3 | | | 1,100,000 | | | 1,166,000 |
International Paper Co., 7.50%, 8/15/2021 | | Baa3 | | | 3,000,000 | | | 3,361,413 |
| | | | | | | | |
| | | | | | | | 4,527,413 |
| | | | | | | | |
Total Materials | | | | | | | | 16,687,033 |
| | | | | | | | |
Telecommunication Services - 1.1% | | | | | | | | |
Diversified Telecommunication Services - 0.6% | | | | | | | | |
Clearwire Communications LLC - Clearwire Finance, Inc.4 , 12.00%, 12/1/2015 | | Caa1 | | | 410,000 | | | 416,150 |
| | |
| 12 | | The accompanying notes are an integral part of the financial statements. |
Investment Portfolio - December 31, 2009
| | | | | | | | |
| | | Credit
Rating1
(unaudited) | | Principal
Amount | | Value
(Note 2) |
| | | | | | | | |
| | | |
CORPORATE BONDS (continued) | | | | | | | | |
| | | |
Non-Convertible Corporate Bonds (continued) | | | | | | | | |
Telecommunication Services (continued) | | | | | | | | |
Diversified Telecommunication Services (continued) | | | | | | | | |
Clearwire Communications LLC - Clearwire Finance, Inc.4 , 12.00%, 12/1/2015 | | Caa1 | | $ | 760,000 | | $ | 771,400 |
Telesat - Telesat LLC (Canada), 11.00%, 11/1/2015 | | Caa1 | | | 1,000,000 | | | 1,085,000 |
| | | | | | | | |
| | | | | | | | 2,272,550 |
| | | | | | | | |
Wireless Telecommunication Services - 0.5% | | | | | | | | |
CC Holdings GS V LLC - Crown Castle GS III Corp.4 , 7.75%, 5/1/2017 | | Baa3 | | | 1,000,000 | | | 1,065,000 |
NII Capital Corp.4 , 10.00%, 8/15/2016 | | B1 | | | 1,000,000 | | | 1,047,500 |
| | | | | | | | |
| | | | | | | | 2,112,500 |
| | | | | | | | |
Total Telecommunication Services | | | | | | | | 4,385,050 |
| | | | | | | | |
Utilities - 2.7% | | | | | | | | |
Electric Utilities - 2.0% | | | | | | | | |
Allegheny Energy Supply Co. LLC4 , 5.75%, 10/15/2019 | | Baa3 | | | 1,000,000 | | | 971,329 |
Exelon Generation Co. LLC, 5.35%, 1/15/2014 | | A3 | | | 3,355,000 | | | 3,541,850 |
Southwestern Electric Power Co., 6.45%, 1/15/2019 | | Baa3 | | | 3,240,000 | | | 3,470,170 |
| | | | | | | | |
| | | | | | | | 7,983,349 |
| | | | | | | | |
Gas Utilities - 0.3% | | | | | | | | |
Ferrellgas Partners LP4 , 9.125%, 10/1/2017 | | Ba3 | | | 1,000,000 | | | 1,057,500 |
| | | | | | | | |
Independent Power Producers & Energy Traders - 0.1% | | | | | | |
Mirant Mid Atlantic Pass Through Trust, Series C, 10.06%, 12/30/2028 | | Ba1 | | | 487,147 | | | 513,940 |
| | | | | | | | |
Multi-Utilities - 0.3% | | | | | | | | |
CenterPoint Energy Resources Corp., Series B, 7.875%, 4/1/2013 | | Baa3 | | | 770,000 | | | 867,308 |
DCP Midstream LLC, 7.875%, 8/16/2010 | | Baa2 | | | 30,000 | | | 31,189 |
| | |
| The accompanying notes are an integral part of the financial statements. | | 13 |
Investment Portfolio - December 31, 2009
| | | | | | | | |
| | | Credit
Rating1
(unaudited) | | Principal
Amount/
Shares | | Value
(Note 2) |
| | | | | | | | |
| | | |
CORPORATE BONDS (continued) | | | | | | | | |
| | | |
Non-Convertible Corporate Bonds (continued) | | | | | | | | |
Utilities (continued) | | | | | | | | |
Multi-Utilities (continued) | | | | | | | | |
Sempra Energy, 7.95%, 3/1/2010 | | Baa1 | | $ | 30,000 | | $ | 30,330 |
| | | | | | | | |
| | | | | | | | 928,827 |
| | | | | | | | |
Total Utilities | | | | | | | | 10,483,616 |
| | | | | | | | |
Total Non-Convertible Corporate Bonds
(Identified Cost $259,038,953) | | | | | | | | 275,169,194 |
| | | | | | | | |
TOTAL CORPORATE BONDS
(Identified Cost $268,233,678) | | | | | | | | 284,476,269 |
| | | | | | | | |
| | | |
SUPRANATIONAL BONDS - 1.1% | | | | | | | | |
Kreditanstalt fuer Wiederaufbau (Germany), 5.25%, 1/4/2010
(Identified Cost $4,485,726) | | WR3 | | | 3,000,000 | | | 4,300,644 |
| | | | | | | | |
| | | |
PREFERRED STOCKS - 2.9% | | | | | | | | |
| | | |
Financials - 2.9% | | | | | | | | |
Commercial Banks - 1.3% | | | | | | | | |
PNC Financial Services Group, Inc.9 , Series K | | Baa2 | | | 1,850,000 | | | 1,869,386 |
Wells Fargo & Co., Series K | | Ba1 | | | 3,145,000 | | | 3,152,863 |
| | | | | | | | |
| | | | | | | | 5,022,249 |
| | | | | | | | |
Diversified Financial Services - 1.6% | | | | | | | | |
Bank of America Corp., Series K | | Ba3 | | | 3,350,000 | | | 3,225,179 |
JPMorgan Chase & Co., Series 1 | | Baa1 | | | 2,985,000 | | | 3,078,908 |
| | | | | | | | |
| | | | | | | | 6,304,087 |
| | | | | | | | |
TOTAL PREFERRED STOCKS
(Identified Cost $10,893,917) | | | | | | | | 11,326,336 |
| | | | | | | | |
| | | |
ASSET-BACKED SECURITIES - 1.0% | | | | | | | | |
Capital Auto Receivables Asset Trust, Series 2007-1, Class A4A, 5.01%, 4/16/2012 | | Aaa | | $ | 300,000 | | | 310,949 |
Capital Auto Receivables Asset Trust, Series 2007-3, Class A4, 5.21%, 3/17/2014 | | Aaa | | | 200,000 | | | 209,573 |
Ford Credit Auto Owner Trust, Series 2008-C, Class A4B5 , 1.983%, 4/15/2013 | | Aaa | | | 300,000 | | | 304,975 |
| | |
| 14 | | The accompanying notes are an integral part of the financial statements. |
Investment Portfolio - December 31, 2009
| | | | | | | | |
| | | Credit
Rating1
(unaudited) | | Principal
Amount/
Shares | | Value
(Note 2) |
| | | | | | | | |
| | | |
ASSET-BACKED SECURITIES (continued) | | | | | | | | |
Hertz Vehicle Financing LLC, Series 2009-2A, Class A24 , 5.29%, 3/25/2016 | | Aaa | | $ | 2,585,000 | | $ | 2,579,163 |
SLM Student Loan Trust, Series 2002-4, Class A45 , 0.39363%, 3/15/2017 | | Aaa | | | 563,731 | | | 560,766 |
| | | | | | | | |
TOTAL ASSET-BACKED SECURITIES
(Identified Cost $3,879,776) | | | | | | | | 3,965,426 |
| | | | | | | | |
| | | |
MUNICIPAL BONDS - 1.4% | | | | | | | | |
City of Mesa, AZ, Multiple Utility Improvements, Revenue Bond, 6.375%, 7/1/2033 | | A1 | | | 500,000 | | | 516,720 |
City of New York, NY, Public Improvements, G.O. Bond, 6.385%, 12/1/2029 | | Aa3 | | | 1,000,000 | | | 998,260 |
Illinois State Toll Highway Authority, Highway Improvements, Revenue Bond, 6.184%, 1/1/2034 | | Aa3 | | | 1,000,000 | | | 1,014,310 |
Metropolitan Transportation Authority, Transit Improvements, Revenue Bond, 7.336%, 11/15/2039 | | AA2 | | | 1,000,000 | | | 1,116,650 |
Nebraska Public Power District, Electric Light & Power Improvements, Revenue Bond, 7.399%, 1/1/2035 | | A1 | | | 500,000 | | | 542,315 |
State of California, School Improvements, G.O. Bond, 7.55%, 4/1/2039 | | Baa1 | | | 500,000 | | | 491,240 |
Utah Transit Authority, Transit Improvements, Revenue Bond, 5.937%, 6/15/2039 | | Aa3 | | | 1,000,000 | | | 1,011,550 |
| | | | | | | | |
TOTAL MUNICIPAL BONDS
(Identified Cost $5,687,318) | | | | | | | | 5,691,045 |
| | | | | | | | |
| | | |
MUTUAL FUNDS - 7.2% | | | | | | | | |
iShares iBoxx High Yield Corporate Bond Fund | | | | | 111,270 | | | 9,773,957 |
iShares iBoxx Investment Grade Corporate Bond Fund | | | | | 178,200 | | | 18,559,530 |
John Hancock Preferred Income Fund | | | | | 10,500 | | | 179,550 |
| | | | | | | | |
TOTAL MUTUAL FUNDS
(Identified Cost $24,093,033) | | | | | | | | 28,513,037 |
| | | | | | | | |
| | |
| The accompanying notes are an integral part of the financial statements. | | 15 |
Investment Portfolio - December 31, 2009
| | | | | | |
| | | Principal
Amount/
Shares | | Value
(Note 2) |
| | | | | | |
| | |
U.S. GOVERNMENT AGENCIES - 11.0% | | | | | | |
| | |
Other Agencies - 11.0% | | | | | | |
Fannie Mae, 1.875%, 4/20/2012 | | $ | 2,570,000 | | $ | 2,596,764 |
Fannie Mae, 1.75%, 8/10/2012 | | | 2,611,000 | | | 2,610,475 |
Federal Home Loan Bank, 4.50%, 11/15/2012 | | | 655,000 | | | 702,762 |
Federal Home Loan Bank, 3.375%, 2/27/2013 | | | 640,000 | | | 666,291 |
Freddie Mac, 1.75%, 6/15/2012 | | | 16,160,000 | | | 16,231,573 |
Freddie Mac, 5.50%, 8/20/2012 | | | 19,000,000 | | | 20,848,282 |
| | | | | | |
TOTAL U.S. GOVERNMENT AGENCIES
(Identified Cost $44,008,366) | | | | | | 43,656,147 |
| | | | | | |
| | |
SHORT-TERM INVESTMENTS - 1.7% | | | | | | |
Dreyfus Cash Management, Inc. - Institutional Shares8 , 0.07%,
(Identified Cost $6,630,338) | | | 6,630,338 | | | 6,630,338 |
| | | | | | |
TOTAL INVESTMENTS - 98.3%
(Identified Cost $367,912,152) | | | | | | 388,559,242 |
| | |
OTHER ASSETS, LESS LIABILITIES - 1.7% | | | | | | 6,749,103 |
| | | | | | |
NET ASSETS - 100% | | | | | | $395,308,345 |
| | | | | | |
G.O. Bond - General Obligation Bond
* - Less than 0.1%
1Credit ratings from Moody’s (unaudited).
2Credit ratings from S&P (unaudited).
3Credit rating has been withdrawn. As of December 31, 2009, there is no rating available.
4Restricted securities - Investment in securities that are restricted as to public resale under the Securities Act of 1933, as amended. These securities have been sold under rule 144A and have been determined to be liquid under guidelines established by the Board of Directors. These securities amount to $31,543,910, or 8.0%, of the Series’ net assets as of December 31, 2009 (see Note 2 to the financial statements).
5The coupon rate is floating and is the stated rate as of December 31, 2009.
6Security has been valued at fair value (see Note 2 to the financial statements).
7Restricted securities - Investment in securities that are restricted as to public resale under the Securities Act of 1933, as amended. This security was acquired on December 2, 2009 at a cost of $242,048 ($88.00 per share). This security has been sold under rule 144A and has been determined to be illiquid under guidelines established by the Board of Directors. This security amounts to $244,111, or 0.1%, of the Series’ net assets as of December 31, 2009 (see Note 2 to the financial statements).
8Rate shown is the current yield as of December 31, 2009.
9PNC Global Investment Servicing (U.S.) Inc. serves as sub-accountant services agent and sub-transfer agent to the Fund.
| | |
| 16 | | The accompanying notes are an integral part of the financial statements. |
Statement of Assets and Liabilities
December 31, 2009
| | | | |
ASSETS: | | | | |
| | | | |
| |
Investments, at value (identified cost $367,912,152) (Note 2) | | $ | 388,559,242 | |
Interest receivable | | | 5,643,177 | |
Receivable for fund shares sold | | | 1,586,519 | |
Dividends receivable | | | 142,756 | |
| | | | |
TOTAL ASSETS | | | 395,931,694 | |
| | | | |
LIABILITIES: | | | | |
| |
Accrued management fees (Note 3) | | | 234,183 | |
Accrued fund accounting and transfer agent fees (Note 3) | | | 16,080 | |
Accrued directors’ fees (Note 3) | | | 3,144 | |
Accrued Chief Compliance Officer service fees (Note 3) | | | 483 | |
Payable for fund shares repurchased | | | 323,682 | |
Audit fees payable | | | 33,610 | |
Other payables and accrued expenses | | | 12,167 | |
| | | | |
TOTAL LIABILITIES | | | 623,349 | |
| | | | |
TOTAL NET ASSETS | | $ | 395,308,345 | |
| | | | |
NET ASSETS CONSIST OF: | | | | |
| |
Capital stock | | $ | 376,904 | |
Additional paid-in-capital | | | 376,420,965 | |
Undistributed net investment income | | | 321,747 | |
Accumulated net realized loss on investments, foreign currency and translation of other assets and liabilities | | | (2,448,880 | ) |
Net unrealized appreciation on investments, foreign currency and translation of other assets and liabilities | | | 20,637,609 | |
| | | | |
TOTAL NET ASSETS | | $ | 395,308,345 | |
| | | | |
NET ASSET VALUE, OFFERING PRICE AND REDEMPTION
PRICE PER SHARE - Class A ($395,308,345/37,690,356 shares) | | $ | 10.49 | |
| | | | |
| | |
| The accompanying notes are an integral part of the financial statements. | | 17 |
Statement of Operations
For the Year Ended December 31, 2009
| | | | |
INVESTMENT INCOME: | | | | |
| | | | |
| |
Interest | | $ | 19,956,903 | |
Dividends | | | 2,636,249 | |
| | | | |
Total Investment Income | | | 22,593,152 | |
| | | | |
| EXPENSES: | | | | |
| |
Management fees (Note 3) | | | 2,477,361 | |
Fund accounting and transfer agent fees (Note 3) | | | 176,420 | |
Directors’ fees (Note 3) | | | 12,849 | |
Chief Compliance Officer service fees (Note 3) | | | 3,729 | |
Custodian fees | | | 23,999 | |
Miscellaneous | | | 79,889 | |
| | | | |
Total Expenses | | | 2,774,247 | |
Less reduction of expenses (Note 3) | | | (3,006 | ) |
| | | | |
Net Expenses | | | 2,771,241 | |
| | | | |
NET INVESTMENT INCOME | | | 19,821,911 | |
| | | | |
REALIZED AND UNREALIZED GAIN (LOSS) ON INVESTMENTS AND FOREIGN CURRENCY: | | | | |
| |
Net realized gain (loss) on- | | | | |
Investments | | | 2,808,088 | |
Foreign currency and translation of other assets and liabilities | | | (38,863 | ) |
| | | | |
| | | 2,769,225 | |
| | | | |
| |
Net change in unrealized appreciation (depreciation) on- | | | | |
Investments | | | 24,544,978 | |
Foreign currency and translation of other assets and liabilities | | | (9,481 | ) |
| | | | |
| | | 24,535,497 | |
| | | | |
| |
NET REALIZED AND UNREALIZED GAIN (LOSS) ON
INVESTMENTS AND FOREIGN CURRENCY | | | 27,304,722 | |
| | | | |
NET INCREASE IN NET ASSETS RESULTING FROM
OPERATIONS | | $ | 47,126,633 | |
| | | | |
| | |
| 18 | | The accompanying notes are an integral part of the financial statements. |
Statements of Changes in Net Assets
| | | | | | | | |
| | | For the
Year Ended
12/31/09 | | | For the
Year Ended
12/31/08 | |
| | | | | | | | |
| INCREASE (DECREASE) IN NET ASSETS: | | | | | | | | |
| | |
| OPERATIONS: | | | | | | | | |
| | |
Net investment income | | $ | 19,821,911 | | | $ | 14,055,676 | |
Net realized gain (loss) on investments and foreign currency | | | 2,769,225 | | | | (4,023,381 | ) |
Net change in unrealized appreciation (depreciation) on investments and foreign currency | | | 24,535,497 | | | | (3,472,848 | ) |
| | | | | | | | |
Net increase from operations | | | 47,126,633 | | | | 6,559,447 | |
| | | | | | | | |
DISTRIBUTIONS TO SHAREHOLDERS (Note 8): | | | | | | | | |
| | |
From net investment income | | | (19,892,958 | ) | | | (15,280,303 | ) |
From net realized gain on investments | | | — | | | | (372,027 | ) |
| | | | | | | | |
Total distributions to shareholders | | | (19,892,958 | ) | | | (15,652,330 | ) |
| | | | | | | | |
| CAPITAL STOCK ISSUED AND REPURCHASED: | | | | | | | | |
| | |
Net increase from capital share transactions (Note 5) | | | 27,443,626 | | | | 71,229,591 | |
| | | | | | | | |
Net increase in net assets | | | 54,677,301 | | | | 62,136,708 | |
| | |
| NET ASSETS: | | | | | | | | |
| | |
Beginning of year | | | 340,631,044 | | | | 278,494,336 | |
| | | | | | | | |
End of year (including undistributed net investment income of $321,747 and $296,651, respectively) | | $ | 395,308,345 | | | $ | 340,631,044 | |
| | | | | | | | |
| | |
| The accompanying notes are an integral part of the financial statements. | | 19 |
Financial Highlights
| | | | | | | | | | |
| | | | | For the Years Ended | | | | For the
Period 4/21/051 to 12/31/05 |
| | | 12/31/09 | | 12/31/08 | | 12/31/07 | | 12/31/06 | |
| | | | | | | | | | |
| | | | | | | | | | |
| Per share data (for a share outstanding throughout each period): | | | | | | | | | | |
Net asset value - Beginning of period | | $9.66 | | $10.02 | | $9.98 | | $9.89 | | $10.00 |
| | | | | | | | | | |
Income (loss) from investment operations: | | | | | | | | | | |
Net investment income | | 0.572 | | 0.42 | | 0.40 | | 0.37 | | 0.22 |
Net realized and unrealized gain (loss) on investments | | 0.82 | | (0.32) | | 0.03 | | 0.08 | | (0.12) |
| | | | | | | | | | |
Total from investment operations | | 1.39 | | 0.10 | | 0.43 | | 0.45 | | 0.10 |
| | | | | | | | | | |
Less distributions to shareholders: | | | | | | | | | | |
From net investment income | | (0.56) | | (0.45) | | (0.39) | | (0.36) | | (0.21) |
From net realized gain on investments | | — | | (0.01) | | — | | — | | — |
| | | | | | | | | | |
Total distributions to shareholders | | (0.56) | | (0.46) | | (0.39) | | (0.36) | | (0.21) |
| | | | | | | | | | |
Net asset value - End of period | | $10.49 | | $9.66 | | $10.02 | | $9.98 | | $9.89 |
| | | | | | | | | | |
Net assets - End of period (000’s omitted) | | $395,308 | | $340,631 | | $278,494 | | $224,145 | | $175,594 |
| | | | | | | | | | |
Total return3 | | 14.35% | | 1.24% | | 4.34% | | 4.59% | | 1.04% |
| Ratios (to average net assets)/ Supplemental Data: | | | | | | | | | | |
Expenses | | 0.78%* | | 0.80% | | 0.81% | | 0.83% | | 0.88%4 |
Net investment income | | 5.60% | | 4.84% | | 4.20% | | 3.95% | | 3.12%4 |
Portfolio turnover | | 72% | | 63% | | 341% | | 315% | | 290% |
|
*The investment advisor did not impose all or a portion of its CCO fees and fund accounting and transfer agent fees during the year ended 12/31/09. If these expenses had been incurred by the Series, the expense ratio (to average net assets) would have been increased by 0.00%5. |
1Commencement of operations.
2Calculated based on average shares outstanding during the year.
3Represents aggregate total return for the period indicated, and assumes reinvestment of all distributions. Total return would have been lower had certain expenses not been waived during certain periods. Periods less than one year are not annualized.
4Annualized.
5Less than 0.01%.
| | |
| 20 | | The accompanying notes are an integral part of the financial statements. |
Notes to Financial Statements
Core Plus Bond Series (the “Series”) is a no-load diversified series of Manning & Napier Fund, Inc. (the “Fund”). The Fund is organized in Maryland and is registered under the Investment Company Act of 1940, as amended, as an open-end management investment company.
The Series’ investment objective is to provide long-term total return by investing primarily in bonds and other financial instruments, including derivatives, with economic characteristics similar to bonds.
The Fund’s Advisor is Manning & Napier Advisors, Inc. (the “Advisor”). Shares of the Series are offered to investors, clients and employees of the Advisor and its affiliates. The total authorized capital stock of the Fund consists of 10.0 billion shares of common stock each having a par value of $0.01. As of December 31, 2009, 4.6 billion shares have been designated in total among 29 series, of which 125 million have been designated as Core Plus Bond Series Class A common stock.
| 2. | SIGNIFICANT ACCOUNTING POLICIES |
Security Valuation
Portfolio securities, including domestic equities, foreign equities, warrants and options, listed on an exchange other than the NASDAQ National Market System are valued at the latest quoted sales price of the exchange on which the security is primarily traded. Securities not traded on valuation date or securities not listed on an exchange are valued at the latest quoted bid price provided by the Fund’s pricing service. Securities listed on the NASDAQ National Market System are valued in accordance with the NASDAQ Official Closing Price.
Debt securities, including government bonds, foreign bonds, asset-backed securities, structured notes, supranational obligations, sovereign bonds, corporate bonds and mortgage-backed securities will normally be valued on the basis of evaluated bid prices provided by an independent pricing service. Certain investments in securities held by the Series may be valued on a basis of a price provided by a principal market maker. These prices may differ from the value that would have been used had a broader market for securities existed.
Municipal securities will normally be valued on the basis of market valuations provided by an independent pricing service that utilizes the latest price quotations and a matrix system (which considers such factors as security prices of similar securities, yields, maturities and ratings).
Short-term investments that mature in sixty days or less are valued at amortized cost, which approximates market value. Investments in open-end investment companies are valued at their net asset value per share on valuation date.
Volume and level of activity in established markets for an asset or liability are evaluated to determine whether recent transactions and quoted prices are determinative of fair value. Where there have been significant decreases in volume and level of activity, further analysis and adjustment may be necessary to estimate fair value. The Series measures fair value in these instances by the use of inputs and valuation techniques which may be based upon current market prices of securities that are comparable in coupon, rating, maturity and industry and/or expectation of future cash flows. As a result of trading in relatively thin markets and/or markets that experience significant volatility, the prices used by the Series to value these securities may differ from the value that would be realized if these securities were sold, and the differences could be material.
Notes to Financial Statements
| 2. | SIGNIFICANT ACCOUNTING POLICIES (continued) |
Security Valuation (continued)
Securities for which representative valuations or prices are not available from the Fund’s pricing service may be valued at fair value. Due to the inherent uncertainty of valuations of such securities, the fair value may differ significantly from the values that would have been used had a ready market for such securities existed. If trading or events occurring after the close of the principal market in which securities are traded are expected to materially affect the value of those securities, then they may be valued at their fair value, taking this trading or these events into account. Fair value is determined in good faith by the Advisor under procedures approved by and under the general supervision and responsibility of the Fund’s Board of Directors (the “Board”).
Various inputs are used in determining the value of the Series’ assets or liabilities carried at market value. These inputs are summarized in three broad levels. Level 1 includes quoted prices in active markets for identical assets and liabilities. Level 2 includes other significant observable inputs (including quoted prices for similar securities, interest rates, prepayment speeds, credit risk, etc.). Level 3 includes significant unobservable inputs (including the Series’ own assumptions in determining the fair value of investments). The inputs or methodology used for valuing securities are not necessarily an indication of the risk associated with investing in those securities.
The following is a summary of the valuation levels used for major security types as of December 31, 2009 in valuing the Series’ assets or liabilities carried at market value:
| | | | | | | | | | | | |
Description | | 12/31/09 | | Level 1 | | Level 2 | | Level 3 |
| | | | | | | | | | | | |
| | | | | | | | | | | | |
Equity securities* | | $ | — | | $ | — | | $ | — | | $ | — |
Preferred securities | | | 11,326,336 | | | — | | | 11,326,336 | | | — |
Debt securities: | | | | | | | | | | | | |
U.S. Treasury and other U.S. Government agencies | | | 43,656,147 | | | — | | | 43,656,147 | | | — |
States and political subdivisions (municipals) | | | 5,691,045 | | | — | | | 5,691,045 | | | — |
Corporate debt | | | 275,169,194 | | | — | | | 274,925,083 | | | 244,111 |
Convertible corporate debt | | | 9,307,075 | | | — | | | 9,307,075 | | | — |
Supranational bonds | | | 4,300,644 | | | — | | | 4,300,644 | | | — |
Asset backed securities | | | 3,965,426 | | | — | | | 3,965,426 | | | — |
Mutual funds | | | 35,143,375 | | | 35,143,375 | | | — | | | — |
Other financial instruments** | | | — | | | — | | | — | | | — |
| | | | | | | | | | | | |
Total | | $ | 388,559,242 | | $ | 35,143,375 | | $ | 353,171,756 | | $ | 244,111 |
| | | | | | | | | | | | |
Notes to Financial Statements
| 2. | SIGNIFICANT ACCOUNTING POLICIES (continued) |
Security Valuation (continued)
The following table is a reconciliation of Level 3 investments for which significant unobservable inputs were used to determine fair value:
| | | | | | | |
Level 3 Reconciliation | | Asset-Backed
Securities | | | Corporate Debt |
| | | | | | | |
Balance as of December 31, | | | | | | | |
2008 (market value) | | $ | 108,900 | | | $ | — |
Accrued discounts/premiums | | | — | | | | 215 |
Change in unrealized appreciation/depreciation *** | | | 678,600 | | | | 1,848 |
Net realized loss | | | (893,750 | ) | | | — |
Net purchases/sales | | | 106,250 | | | | 242,048 |
| | | | | | | |
Balance as of December 31, 2009 (market value) | | $ | — | | | $ | 244,111 |
| | | | | | | |
*Includes common stock, warrants and rights. Please see the Investment Portfolio for industry classification.
**Other financial instruments are derivative instruments not reflected in the Investment Portfolio, such as futures, forwards and swap contracts, which are valued at the unrealized appreciation/ depreciation on the instrument. As of December 31, 2009, the Series did not hold any derivative instruments.
***The change in unrealized appreciation (depreciation) on securities still held at December 31, 2009 was $1,848, which is included in the related net change in unrealized appreciation/ depreciation on the Statement of Operations.
Interim and annual reporting periods beginning after December 15, 2009 will require additional disclosure regarding transfers in and/or out of Level 1 and 2.Additional disclosure surrounding the activity in Level 3 fair value measurement will also be effective for fiscal years beginning after December 15, 2010. Management has concluded that this will not have a material impact on the Series’ financial statements.
Security Transactions, Investment Income and Expenses
Security transactions are accounted for on trade date. Dividend income is recorded on the ex-dividend date, except that if the ex-dividend date has passed, certain dividends from foreign securities are recorded as soon as the Fund is informed of the ex-dividend date. Non-cash dividends, if any, are recorded at the fair market value of the securities received. Interest income, including amortization of premium and accretion of discounts using the effective interest method, is earned from settlement date and accrued daily.
Expenses are recorded on an accrual basis. Most expenses of the Fund can be attributed to a specific series. Expenses which cannot be directly attributed are apportioned among the series in the Fund in such a manner as deemed equitable by the Fund’s Board, taking into consideration, among other things, the nature and type of expense.
The Series uses the identified cost method for determining realized gain or loss on investments for both financial statement and federal income tax reporting purposes.
Notes to Financial Statements
| 2. | SIGNIFICANT ACCOUNTING POLICIES (continued) |
Foreign Currency Translation
The books and records of the Series are maintained in U.S. dollars. Foreign currencies, investments and other assets and liabilities are translated into U.S. dollars at the current exchange rates. Purchases and sales of investment securities and income and expenses are translated on the respective dates of such transactions. The Series does not isolate realized and unrealized gains and losses attributable to changes in the exchange rates from gains and losses that arise from changes in the market value of investments. Such fluctuations are included with net realized and unrealized gain or loss on investments. Net realized foreign currency gains and losses represent foreign currency gains and losses between trade date and settlement date on securities transactions, gains and losses on disposition of foreign currencies and the difference between the amount of income and foreign withholding taxes recorded on the books of the Series and the amounts actually received or paid.
Securities Purchased on a When-Issued Basis or Forward Commitment
The Series may purchase securities on a when-issued basis or forward commitment. These transactions involve a commitment by the Series to purchase securities for a predetermined price with payment and delivery taking place beyond the customary settlement period. When such purchases are outstanding, the Series will designate liquid assets in an amount sufficient to meet the purchase price. When purchasing a security on a delayed delivery basis, the Series assumes the rights and risks of ownership of the security, including the risk of price and yield fluctuations, and takes such fluctuations into account when determining its net asset value. The Series may sell the when-issued securities before they are delivered, which may result in a capital gain or loss. No such investments were held by the Series on December 31, 2009.
In connection with its ability to purchase or sell securities on a forward commitment basis, the Series may enter into forward roll transactions principally using To Be Announced (TBA) securities. Forward roll transactions require the sale of securities for delivery in the current month, and a simultaneous agreement to repurchase substantially similar (same type, coupon and maturity) securities on a specified future date. Risks of entering into forward roll transactions include the potential inability of the counterparty to meet the terms of the agreement; the potential of the Series to receive inferior securities at redelivery as compared to the securities sold to the counterparty; counterparty credit risk; and the potential pay down speed variance between the mortgage-backed pools. During the roll period, the Series forgoes principal and interest paid on the securities. The Series accounts for such dollar rolls as purchases and sales. No such investments were held by the Series on December 31, 2009.
Restricted Securities
Restricted securities are purchased in private placement transactions, are not registered under the Securities Act of 1933, as amended, and may have contractual restrictions on resale. Information regarding restricted securities is included at the end of the Series’ Investment Portfolio.
Illiquid Securities
A security may be considered illiquid if so deemed in good faith by the Advisor under procedures approved by and under the general supervision and responsibility of the Fund’s Board. Securities that are illiquid are marked with the applicable footnote on the Investment Portfolio. As of December 31, 2009, the aggregate value of securities deemed illiquid was $244,111, representing 0.1% of the Series’ net assets.
Notes to Financial Statements
| 2. | SIGNIFICANT ACCOUNTING POLICIES (continued) |
Federal Taxes
The Series’ policy is to comply with the provisions of the Internal Revenue Code applicable to regulated investment companies. The Series is not subject to federal income tax or excise tax to the extent that the Series distributes to shareholders each year its taxable income, including any net realized gains on investments, in accordance with requirements of the Internal Revenue Code.Accordingly, no provision for federal income tax or excise tax has been made in the financial statements.
Management evaluates its tax positions to determine if the tax positions taken meet the minimum recognition threshold in connection with accounting for uncertainties in income tax positions taken or expected to be taken for the purposes of measuring and recognizing tax liabilities in the financial statements. Recognition of tax benefits of an uncertain tax position is required only when the position is “more likely than not” to be sustained assuming examination by taxing authorities. At December 31, 2009, the Series has recorded no liability for net unrecognized tax benefits relating to uncertain income tax positions taken or expected to be taken in future tax returns.
The Series files income tax returns in the U.S. federal jurisdiction, various states and foreign jurisdictions, as required. No income tax returns are currently under investigation. The statute of limitations on the Series’ tax returns remains open for the years ended December 31, 2006 through December 31, 2009.The Fund is not aware of any tax positions for which it is reasonably possible that the total amounts of unrecognized tax benefits will significantly change in the next twelve months.
Additionally, based on the Fund’s understanding of the tax rules and rates related to income, gains and transactions for foreign jurisdictions in which it invests, the Series will provide for foreign taxes, and where appropriate, deferred foreign tax.
Distributions of Income and Gains
Distributions to shareholders of net investment income and net realized gains are made annually. An additional distribution may be necessary to avoid taxation of the Series. Distributions are recorded on the ex-dividend date.
Indemnifications
The Fund’s organizational documents provide former and current directors and officers with a limited indemnification against liabilities arising in connection with the performance of their duties to the Fund. In the normal course of business, the Fund may also enter into contracts that provide general indemnifications. The Fund’s maximum exposure under these arrangements is unknown as this would be dependent on future claims that may be made against the Fund. The risk of material loss from such claims is considered remote.
Other
The preparation of financial statements in conformity with accounting principles generally accepted in the United States of America requires management to make estimates and assumptions that affect the reported amounts of assets and liabilities and the disclosure of contingent assets and liabilities at the date of the financial statements and the reported amounts of income and expenses during the reporting period. Actual results could differ from those estimates.
Notes to Financial Statements
| 3. | TRANSACTIONS WITH AFFILIATES |
The Fund has an Investment Advisory Agreement (the “Agreement”) with the Advisor, for which the Series pays a fee, computed daily and payable monthly, at an annual rate of 0.70% of the Series’ average daily net assets.
Under the Agreement, personnel of the Advisor provide the Series with advice and assistance in the choice of investments and the execution of securities transactions, and otherwise maintain the Series’ organization. The Advisor also provides the Fund with necessary office space and fund administration and support services. The salaries of all officers of the Fund (except a percentage of the Fund’s Chief Compliance Officer’s salary, which is paid by the Fund), and of all Directors who are “affiliated persons” of the Fund, or of the Advisor, and all personnel of the Fund, or of the Advisor, performing services relating to research, statistical and investment activities, are paid by the Advisor. Each “non-affiliated” Director receives an annual stipend, which is allocated among all the active series of the Fund. In addition, these Directors also receive a fee per Board meeting attended for each active series of the Fund plus a fee for each committee meeting attended.
The Advisor has contractually agreed, until at least April 30, 2011, to waive its fee and, if necessary, pay other operating expenses of the Series in order to maintain total direct annual fund operating expenses for the Series at no more than 0.90% of average daily net assets each year. For the year ended December 31, 2009, the Advisor did not waive its management fee or reimburse any expenses of the Series. The Advisor is not eligible to recoup any expenses that have been waived or reimbursed in prior years.
Manning & Napier Investor Services, Inc., a registered broker-dealer affiliate of the Advisor, acts as distributor for the Fund’s shares. The services of Manning & Napier Investor Services, Inc. are provided at no additional cost to the Series.
For fund accounting and transfer agent services through November 7, 2009, the Fund paid the Advisor an annual fee of 0.055% of the Fund’s average daily net assets up to $4.5 billion, 0.03% of the Fund’s average daily net assets between $4.5 billion and $7.5 billion, and 0.02% of the Fund’s average daily net assets over $7.5 billion. Additionally, certain transaction and account-based fees and out-of-pocket expenses, including charges for reporting relating to the Fund’s compliance program, were charged. Expenses not directly attributable to a Series are allocated based on each Series’ relative net assets or number of accounts, depending on the expense. Prior to October 12, 2009 (for sub-accountant) and November 9, 2009 (for sub-transfer agent) the Advisor had an agreement with Citi Fund Services Ohio, Inc. (“Citi”) under which Citi served as sub-accountant and sub-transfer agent. The Advisor voluntarily agreed to waive a portion of the fund accounting and transfer agent fees and the Chief Compliance Officer service fees for the period March 1, 2009 to April 30, 2009. Accordingly, the Advisor waived fees of $3,006 which is included as a reduction of expenses on the Statement of Operations.
The Advisor has entered into agreements dated October 12, 2009 and November 9, 2009 with PNC Global Investment Servicing (“PNCGIS”) under which PNCGIS serves as sub-accountant services agent and sub-transfer agent, respectively. Effective November 7, 2009 under the amended master services agreement, the Fund pays the Advisor an annual fee of 0.0175% on the first $3 billion of average daily net assets (excluding Target Series); 0.015% on the next $3 billion of average daily net assets (excluding Target Series); and 0.01% of the average daily net assets in excess of $6 billion (excluding Target Series); plus a base fee of $25,500 per Series. Additionally, certain transaction-, account-, and cusip-based fees and out-of-pocket expenses, including charges for reporting relating to the Fund’s compliance program, are charged.
Notes to Financial Statements
| 4. | PURCHASES AND SALES OF SECURITIES |
For the year ended December 31, 2009, purchases and sales of securities, other than United States Government securities and short-term securities, were $220,452,972 and $177,331,810, respectively. Purchases and sales of United States Government securities, other than short-term securities, were $48,898,348 and $71,079,425, respectively.
| 5. | CAPITAL STOCK TRANSACTIONS |
Transactions in shares of Core Plus Bond Series were:
| | | | | | | | | | | | | | |
| | | For the Year
Ended 12/31/09 | | | For the Year
Ended 12/31/08 | |
| | | Shares | | | Amount | | | Shares | | | Amount | |
| | | | | | | | | | | | | | |
Sold | | 5,159,453 | | | $ | 53,012,979 | | | 9,178,936 | | | $ | 88,460,649 | |
Reinvested | | 1,861,873 | | | | 19,585,357 | | | 1,654,229 | | | | 15,379,707 | |
Repurchased | | (4,577,661 | ) | | | (45,154,710 | ) | | (3,371,107 | ) | | | (32,610,765 | ) |
| | | | | | | | | | | | | | |
Total | | 2,443,665 | | | $ | 27,443,626 | | | 7,462,058 | | | $ | 71,229,591 | |
| | | | | | | | | | | | | | |
Substantially all of the Series’ shares represent investments by fiduciary accounts over which the Advisor has sole investment discretion.
The Series may trade in instruments including written and purchased options, forward foreign currency exchange contracts and futures contracts and other derivatives in the normal course of investing activities to assist in managing exposure to various market risks. The Series may be subject to various elements of risk and may involve, to a varying degree, elements of risk in excess of the amounts recognized for financial statement purposes; the risk that changes in the value of a derivative may not correlate perfectly with the underlying asset, rate or index; counterparty credit risk related to over the counter derivatives counterparties’ failure to perform under contract terms; liquidity risk related to the lack of a liquid market for these contracts allowing the fund to close out its position(s); and documentation risk relating to disagreement over contract terms. No such investments were held by the Series during the year ended December 31, 2009.
Investing in securities of foreign companies and foreign governments involves special risks and considerations not typically associated with investing in securities of domestic companies and the U.S. Government. These risks include revaluation of currencies and future adverse political and economic developments. Moreover, securities of foreign companies and foreign governments and their markets may be less liquid and their prices more volatile than those of comparable domestic companies and the U.S. Government.
| 8. | FEDERAL INCOME TAX INFORMATION |
The amount and characterization of certain income and capital gains to be distributed are determined in accordance with federal income tax regulations, which may differ from accounting principles generally accepted in the United States of America. These differences are primarily due to differing book and tax treatments in the timing of the recognition of net investment income or gains and losses, including foreign currency gains and losses, Post-October losses and investments in hybrid securities. The Series may periodically make reclassifications among its capital accounts to reflect income and gains available for distribution (or available capital loss carryovers) under income tax regulations without impacting the Series’ net asset value. Any such reclassifications are not reflected in the financial highlights.
Notes to Financial Statements
| 8. | FEDERAL INCOME TAX INFORMATION (continued) |
The tax character of distributions paid were as follows:
| | | | | | |
| | | For the Year
Ended 12/31/09 | | For the Year
Ended 12/31/08 |
Ordinary income | | $ | 19,892,958 | | $ | 15,281,692 |
Long-term capital gains | | | — | | | 370,638 |
For the year ended December 31, 2009, the Series elected to defer $12,216 of currency losses attributable to Post-October losses.
At December 31, 2009, the tax basis components of distributable earnings and the net unrealized appreciation based on identified cost for federal income tax purposes were as follows:
| | | | |
Cost for federal income tax purposes | | $ | 368,251,903 | |
Unrealized appreciation | | $ | 24,510,651 | |
Unrealized depreciation | | | (4,203,312 | ) |
| | | | |
Net unrealized appreciation | | $ | 20,307,339 | |
Undistributed ordinary income | | | 368,924 | |
Capital loss carryover | | | 2,448,880 | |
The capital loss carryover, disclosed above, available to the extent allowed by tax law to offset future net capital gain, if any, will expire on December 31, 2016.
On February 2, 2010, The PNC Financial Services Group, Inc. (“PNC”), which serves as the Series’ sub-accountant services agent and sub-transfer agent, entered into a Stock Purchase Agreement (the “Stock Purchase Agreement”) with The Bank of New York Mellon Corporation (“BNY Mellon”), the Series’ custodian. Upon the terms and subject to the conditions set forth in the Stock Purchase Agreement, which has been approved by the board of directors of each company, PNC will sell to BNY Mellon (the “Stock Sale”) 100% of the issued and outstanding shares of PNC Global Investment Servicing Inc., an indirect, wholly-owned subsidiary of PNC. The Stock Sale is expected to close in the third quarter of 2010. Management has concluded that this will not have a material impact on the Series’ financial statements.
There were no other subsequent events that require recognition or disclosure. In preparing these financial statements, management of the Fund has evaluated events and transactions for potential recognition or disclosure through February 23, 2010, the date the financial statements were issued.
Report of Independent Registered Public Accounting Firm
To the Board of Directors of Manning & Napier Fund, Inc. and Shareholders of Core Plus Bond Series:
In our opinion, the accompanying statement of assets and liabilities, including the investment portfolio (except for credit ratings), and the related statements of operations and of changes in net assets and the financial highlights present fairly, in all material respects, the financial position of the Core Plus Bond Series (a series of Manning & Napier Fund, Inc., hereafter referred to as the “Series”) at December 31, 2009, and the results of its operations for the year then ended, the changes in its net assets for each of the two years in the period then ended and the financial highlights for each of the periods indicated, in conformity with accounting principles generally accepted in the United States of America. These financial statements and financial highlights (hereafter referred to as “financial statements”) are the responsibility of the Series’ management; our responsibility is to express an opinion on these financial statements based on our audits. We conducted our audits of these financial statements in accordance with the standards of the Public Company Accounting Oversight Board (United States). Those standards require that we plan and perform the audit to obtain reasonable assurance about whether the financial statements are free of material misstatement. An audit includes examining, on a test basis, evidence supporting the amounts and disclosures in the financial statements, assessing the accounting principles used and significant estimates made by management, and evaluating the overall financial statement presentation. We believe that our audits, which included confirmation of securities at December 31, 2009 by correspondence with the custodian, provide a reasonable basis for our opinion.

Columbus, Ohio
February 23, 2010
Supplemental Tax Information (unaudited)
All designations are based on financial information available as of the date of this annual report and, accordingly are subject to change.
For federal income tax purposes, the Series designates for the current fiscal year $308,263 or, if different, the maximum amount allowable under the tax law as qualified dividend income.
For corporate shareholders, the percentage of investment income (dividend income plus short-term gains, if any) that qualifies for the dividends received deduction for the current fiscal year is 1.55%, or if different, the maximum allowable under tax law.
Renewal of Investment Advisory Agreement (unaudited)
At the Manning & Napier Fund, Inc. (the “Fund”) Board of Directors’ (the “Board”) meeting, held on December 7, 2009, the Investment Advisory Agreement (the “Agreement”) between the Fund and Manning & Napier Advisors, Inc. (the “Advisor”) was reviewed by the Board for renewal. In connection with the decision whether to renew the Agreement, a variety of material was prepared for and reviewed by the Board.
Representatives of the Advisor attended the meeting and presented additional oral and written information to the Board to assist the Board in its considerations. The discussion immediately below outlines the materials and information presented to the Board in connection with the Board’s 2009 Annual Review of the Agreement and the conclusions made by the Directors when determining to continue the Agreement.
| | • | | The Board considered the services provided by the Advisor under the Agreement including, among others: deciding what securities to purchase and sell for each Series; arranging for the purchase and sale of such securities by placing orders with broker-dealers; administering the affairs of the Fund (including the books and records of the Fund not maintained by third party service providers such as the custodian or sub-transfer agent); arranging for the insurance coverage for the Fund; and supervising the preparation of tax returns, SEC filings (including registration statements) and reports to shareholders for the Fund. The Board also considered the nature and quality of such services provided under the Agreement in light of the Advisor’s services provided to the Fund for 23 years. The Board discussed the quality of these services with representatives from the Advisor and concluded that the Advisor was performing its services to the Fund required under the Agreement in a reasonable manner. |
| | • | | The Board considered the investment performance of the various Series of the Fund. The investment performance for each Series was reviewed on a cumulative basis since inception and on a one year basis. In addition, annualized performance for the following time periods was considered: inception, three year, five year, ten year, and current market cycle. A market cycle includes periods of both rising and falling markets. Returns for established benchmark indices for each Series were provided for each time period. The Board noted that the various Series were competitive against their respective benchmarks and/or peer groups over various time periods, but in particular over the full market cycle periods relevant for the Series. In addition, the Board considered at the meeting (and considers on a quarterly basis) a peer group performance analysis consisting of Morningstar universes of mutual funds with similar investment objectives. The Board discussed the performance with representatives from the Advisor and concluded that the investment performance of each of the Fund’s Series was reasonable based on the Fund’s actual performance and comparative performance, especially performance over the current market cycle. |
| | • | | The Board considered the costs of the Advisor’s services and the profits of the Advisor as they relate to the Advisor’s services to the Fund under the Agreement. In reviewing the Advisor’s costs and profits, the Board discussed the Advisor’s revenues generated from the Fund (on both an actual and adjusted basis) and its expenses associated with providing the services under the Agreement. In addition, the Board reviewed the Advisor’s expenses associated with Fund activities outside of the Agreement (such as expense reimbursements pursuant to expense caps and payments made by the Advisor to third party platforms on which shares of the Fund are available for purchase). It was noted by representatives of the Advisor that 13 of the 26 active Series of the Fund are currently experiencing expenses above the capped expense ratios. After discussing the above costs and profits, the Board concluded that the Advisor’s profitability relating to its services provided under the Agreement was reasonable. |
Renewal of Investment Advisory Agreement (unaudited)
| | • | | The Board considered the fees and expenses of the various Series of the Fund. The Advisor presented the advisory fees and total expenses for each Series, including the advisory fee adjusted for any expense waivers or reimbursements (either contractual or voluntary) paid by the Advisor. The advisory fees and expense ratios of each Series were compared to an average (on both a mean and median basis) of similar funds as disclosed on the Morningstar database. Representatives of the Advisor discussed with the Board the levels of its advisory fee for each Series of the Fund and as compared to the median and mean advisory fees for similar funds as listed on Morningstar. Expense ratios for every Series, except the Global Fixed Income Series and the Target Series Class R and Class C, are currently below the median and mean for similar funds as listed on Morningstar. Based on their review of the information provided, the Board concluded that the fees and expenses of each Series of the Fund were reasonable on a comparative basis. |
| | • | | The Board also considered the other benefits the Advisor derives from its relationship with the Fund. Such other benefits include certain research products provided by soft dollars. Given the level of soft dollar transactions involving the Fund, the Board concluded that these additional benefits to the Advisor were reasonable. |
| | • | | In addition to the factors described above, the Board considered the Advisor’s personnel, investment strategies, policies and procedures relating to compliance with personal securities transactions, and reputation, expertise and resources in domestic and foreign financial markets. The Board concluded that these factors support the conclusion that the Advisor performs its services in a reasonable manner. |
| | • | | The Board did not consider economies of scale at this time because of the multiple uses of the Fund (for the Advisor’s discretionary investment account clients in addition to direct investors), the current profitability of the Advisor’s services to the Fund under the Agreement, and the overall size of the Fund complex. |
Based on the Board’s deliberations and their evaluation of the information described above, the Board, including a majority of Directors that are not “interested persons” as defined in the Investment Company Act of 1940, concluded that the compensation under the Agreement was fair and reasonable in light of the services and expenses and such other matters as the Directors considered to be relevant in the exercise of their reasonable judgment. Accordingly, the Board approved the renewal of the Agreement. In the course of their deliberations, the Directors did not identify any particular information that was all important or controlling.
Directors’ and Officers’ Information (unaudited)
The Statement of Additional Information provides additional information about the Fund’s directors and officers and can be obtained without charge by calling 1-800-466-3863, at www.manningnapieradvisors.com, or on the EDGAR Database on the SEC Internet web site (http:// www.sec.gov). The following chart shows certain information about the Fund’s officers and directors, including their principal occupations during the last five years. Unless specific dates are provided, the individuals have held the listed positions for longer than five years.
INTERESTED DIRECTOR/OFFICER
| | |
| Name: | | B. Reuben Auspitz* |
| Address: | | 290 Woodcliff Drive Fairport, NY 14450 |
| Age: | | 62 |
| Current Position(s) Held with Fund: | | Principal Executive Officer, President, Chairman & Director |
| Term of Office1 & Length of Time Served: | | Indefinite - Director since 1984; Vice President 1984 - 2003; President since 2004; Principal Executive Officer since 2002 |
| Principal Occupation(s) During Past 5 Years: | | Executive Vice President; Co-Executive Director; Executive Group Member**; Chief Compliance Officer since 2004 - Manning & Napier Advisors, Inc. President; Director - Manning & Napier Investor Services, Inc. Holds or has held one or more of the following titles for various subsidiaries and affiliates: President, Vice President, Director, Chairman, Treasurer, Chief Compliance Officer or Member. |
| Number of Portfolios Overseen within Fund Complex: | | 29 |
| Other Directorships Held Outside Fund Complex: | | N/A |
| |
| INDEPENDENT DIRECTORS | | |
| |
| Name: | | Stephen B. Ashley |
| Address: | | 290 Woodcliff Drive Fairport, NY 14450 |
| Age: | | 69 |
| Current Position(s) Held with Fund: | | Director, Audit Committee Member, Governance & Nominating Committee Member |
| Term of Office & Length of Time Served: | | Indefinite - Since 1996 |
| Principal Occupation(s) During Past 5 Years: | | Chairman, Director, President & Chief Executive Officer, The Ashley Group (property management and investment). Chairman (non-executive) 2004 - 2008; Director 1995 - 2008 - Fannie Mae (mortgage) |
| Number of Portfolios Overseen within Fund Complex: | | 29 |
| Other Directorships Held Outside Fund Complex: | | The Ashley Group |
| Name: | | Peter L. Faber |
| Address: | | 290 Woodcliff Drive Fairport, NY 14450 |
| Age: | | 71 |
| Current Position(s) Held with Fund: | | Director, Governance & Nominating Committee Member |
| Term of Office & Length of Time Served: | | Indefinite - Since 1987 |
| Principal Occupation(s) During Past 5 Years: | | Senior Counsel since 2006, Partner (1995-2006) - McDermott, Will & Emery LLP (law firm) |
| Number of Portfolios Overseen within Fund Complex: | | 29 |
| Other Directorships Held Outside Fund Complex: | | Partnership for New York City, Inc. (non-profit) New York Collegium (non-profit) Boston Early Music Festival (non-profit) Amherst Early Music, Inc. (non-profit) Gotham Early Music Scene, Inc. (non-profit) |
Directors’ and Officers’ Information (unaudited)
INDEPENDENT DIRECTORS (continued)
| | |
| Name: | | Harris H. Rusitzky |
| Address: | | 290 Woodcliff Drive Fairport, NY 14450 |
| Age: | | 75 |
| Current Position(s) Held with Fund: | | Director, Audit Committee Member, Governance & Nominating Committee Member |
| Term of Office & Length of Time Served: | | Indefinite - Since 1985 |
| Principal Occupation(s) During Past 5 Years: | | President, The Greening Group (business consultants) since 1994; Partner, The Restaurant Group (restaurants) since 2006 |
| Number of Portfolios Overseen within Fund Complex: | | 29 |
| Other Directorships Held Outside Fund Complex: | | N/A |
| |
| Name: | | Paul A. Brooke |
| Address: | | 290 Woodcliff Drive Fairport, NY 14450 |
| Age: | | 64 |
| Current Position(s) Held with Fund: | | Director, Audit Committee Member, Governance & Nominating Committee Member |
| Term of Office & Length of Time Served: | | Indefinite - Since 2007 |
| Principal Occupation(s) During Past 5 Years: | | Chairman & CEO, Alsius Corp. (investments); Managing Member, PMSV Holdings LLC (investments) |
| Number of Portfolios Overseen within Fund Complex: | | 29 |
| Other Directorships Held Outside Fund Complex: | | Incyte Corp. ViroPharma, Inc. WebMD Cheyne Capital International MPM Bio-equities GMP Companies HoustonPharma |
| Name: | | Richard M. Hurwitz |
| Address: | | 290 Woodcliff Drive Fairport, NY 14450 |
| Age: | | 46 |
| Current Position(s) Held with Fund: | | Director, Audit Committee Member, Governance & Nominating Committee Member |
| Term of Office & Length of Time Served: | | Indefinite - Since 2009 |
| Principal Occupation(s) During Past 5 Years: | | Managing Partner, Aegis Investment Partners, LLC (investments) since 2006; Founder and Managing Partner (2004-2005) - Village Markets, LLC (groceries) |
| Number of Portfolios Overseen within Fund Complex: | | 29 |
| Other Directorships Held Outside Fund Complex: | | Pictometry International Corp. |
Directors’ and Officers’ Information (unaudited)
OFFICERS
| | |
| |
| Name: | | Jeffrey S. Coons, Ph.D., CFA |
| Address: | | 290 Woodcliff Drive Fairport, NY 14450 |
| Age: | | 46 |
| Current Position(s) Held with Fund: | | Vice President |
| Term of Office1 & Length of Time Served: | | Since 2004 |
| Principal Occupation(s) During Past 5 Years: | | Co-Director of Research since 2002 & Executive Group Member** since 2003, Manning & Napier Advisors, Inc. Holds one or more of the following titles for various subsidiaries and affiliates: President, Director, Treasurer or Senior Trust Officer. |
| Number of Portfolios Overseen within Fund Complex: | | 29 |
| Other Directorships Held Outside Fund Complex: | | N/A |
| Name: | | Christine Glavin |
| Address: | | 290 Woodcliff Drive Fairport, NY 14450 |
| Age: | | 43 |
| Current Position(s) Held with Fund: | | Principal Financial Officer, Chief Financial Officer |
| Term of Office1 & Length of Time Served: | | Principal Financial Officer since 2002; Chief Financial Officer since 2001 |
| Principal Occupation(s) During Past 5 Years: | | Fund Reporting Manager, Manning & Napier Advisors, Inc. since 1997 |
| Number of Portfolios Overseen within Fund Complex: | | 29 |
| Other Directorships Held Outside Fund Complex: | | N/A |
| Name: | | Jodi L. Hedberg |
| Address: | | 290 Woodcliff Drive Fairport, NY 14450 |
| Age: | | 42 |
| Current Position(s) Held with Fund: | | Corporate Secretary, Chief Compliance Officer, Anti-Money Laundering Compliance Officer |
| Term of Office1 & Length of Time Served: | | Corporate Secretary since 1997; Chief Compliance Officer since 2004 |
| Principal Occupation(s) During Past 5 Years: | | Director of Compliance, Manning & Napier Advisors, Inc. and affiliates since 1990 (title change in 2005 from Compliance Manager to Director of Compliance); Corporate Secretary, Manning & Napier Investor Services, Inc. since 2006 |
| Number of Portfolios Overseen within Fund Complex: | | 29 |
| Other Directorships Held Outside Fund Complex: | | N/A |
*Interested Director, within the meaning of the Investment Company Act of 1940 by reason of his position with the Fund’s investment advisor and distributor. Mr. Auspitz serves as the Executive Vice President and Director, Manning & Napier Advisors, Inc. and President and Director, Manning & Napier Investor Services, Inc., the Fund’s distributor.
**The Executive Group performs the duties of the Office of the Chief Executive of Manning & Napier Advisors, Inc.
1The term of office for President, Vice President, Chief Financial Officer, and Corporate Secretary is one year and until their respective successors are chosen and qualified. All other officers’ terms are indefinite.
This Page Intentionally Left Blank
This Page Intentionally Left Blank
Literature Requests (unaudited)
Proxy Voting Policies and Procedures
A description of the policies and procedures that the Fund uses to determine how to vote proxies relating to portfolio securities is available, without charge, upon request:
| | |
By phone | | 1-800-466-3863 |
On the Securities and Exchange Commission’s (SEC) web site | | http://www.sec.gov |
Proxy Voting Record
Information regarding how the Fund voted proxies relating to portfolio securities during the most recent 12-month period ended June 30th is available, without charge, upon request:
| | |
By phone | | 1-800-466-3863 |
On the SEC’s web site | | http://www.sec.gov |
Quarterly Portfolio Holdings
The Series’ complete schedule of portfolio holdings for the 1st and 3rd quarters of each fiscal year are provided on Form N-Q, and are available, without charge, upon request:
| | |
By phone | | 1-800-466-3863 |
On the SEC’s web site | | http://www.sec.gov |
The Series’ Form N-Q may be reviewed and copied at the SEC’s Public Reference Room in Washington, D.C. Information on the operation of the Public Reference Room may be obtained by calling 1-800-SEC-0330.
Prospectus and Statement of Additional Information (SAI)
The prospectus and SAI provide additional information about each Series, including charges, expenses and risks. These documents are available, without charge, upon request:
| | |
By phone | | 1-800-466-3863 |
On the SEC’s web site | | http://www.sec.gov |
On the Advisor’s web site | | http://www.manningnapieradvisors.com |
Additional information available at www.manningnapieradvisors.com
1. Fund Holdings - Month-End
2. Fund Holdings - Quarter-End
3. Shareholder Report - Annual
4. Shareholder Report - Semi-Annual


Management Discussion and Analysis (unaudited)

Dear Shareholders:
The High Yield Bond Series was launched on September 14, 2009. Since that time, the Series has earned a return of 4.82%. In comparison, the Bank of America (BofA) Merrill Lynch U.S. High Yield, Cash Pay, BB-B Rated Index (formerly a Merrill Lynch Index) has posted a return of 7.50%.
The Series was opened to take advantage of a strong dislocation in yields on below investment grade corporate bonds during the height of the credit crisis in 2008. Extreme negative sentiment had pushed up yields on below investment grade corporate bonds to historic levels during 2008. In fact, 2008 was the worst year on record in terms of returns for high yield bonds. While panic conditions abated during 2009 as economic and credit market conditions improved, yields on below investment grade securities remained well above long-term averages. These events created opportunities for long-term investors to capture attractive yields in an environment where risk was waning and yields were falling back to more normal levels. Because bonds prices rise when yields fall, the Series sought to take advantage of this return to norm.
Generally speaking, fixed income returns varied greatly in 2009 across market sectors and quality ratings. As 2009 unfolded, the credit crisis maintained a strong hold on the markets, and lower quality securities suffered meaningful price declines. Following stock market lows in late March 2009, investor sentiment shifted to modest optimism, and lower quality securities, including both stocks and bonds, rallied strongly.
While the Series performed in line with its benchmark during the fourth quarter of 2009, its results since its inception in September lag that of the benchmark because of the Series’ higher allocation to cash in its first full weeks. The high yield bond market was particularly active during the initial stages of the Series’ positioning, and our initial cash position acted as a drag on returns during these early days. During the fourth quarter, the Series posted a return of 4.71%, in line with the 4.67% return of its benchmark.
Historically, the high yield bond market has provided attractive total returns for several years following a recession. As the global recovery continues to unfold, it will be important to monitor changes in factors such as the financial condition of corporations, monetary policy, pricing in he marketplace, and other cyclical or secular trends. We will continue to employ an active approach to issue selection, relying on our time-tested security selection strategies to seek out return potential and managing risk as the economic recovery unfolds.
As always, we appreciate your business.
Sincerely,
Manning & Napier Advisors, Inc.
Performance Update as of December 31, 2009 (unaudited)
| | |
| | | Total Return
Since Inception1
As of December 31, 2009 |
Manning & Napier Fund, Inc. - High Yield Bond Series2 | | 4.82% |
Bank of America (BofA) Merrill Lynch U.S. High Yield, Cash Pay, BB-B Rated Index3 | | 7.50% |
The following graph compares the value of a $10,000 investment in the Manning & Napier Fund, Inc. - High Yield Bond Series from its current activation1 (9/14/09) to present (12/31/09) to the BofA Merrill Lynch U.S. High Yield, Cash Pay, BB-B Rated Index.
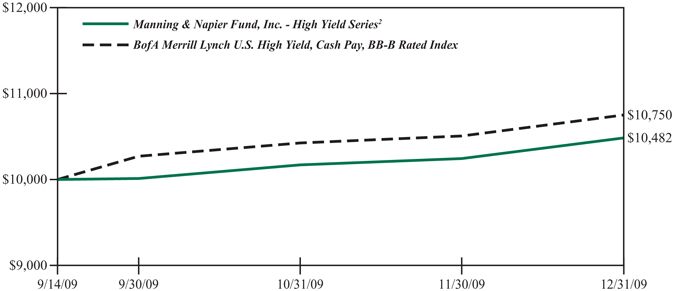
1Performance numbers for the Series and Index are calculated from September 14, 2009, the Series’ current activation date.
2The Series’ performance does not reflect the deduction of taxes that a shareholder would pay on fund distributions or the redemption of shares. The Series’ performance is historical and may not be indicative of future results. The performance returns shown are inclusive of the net expense ratio of the Series. For the period ended December 31, 2009, this annualized net expense ratio was 1.20%. The annualized gross expense ratio, which does not account for any voluntary or contractual waivers currently in effect, was 1.22% for the period ended December 31, 2009.
3The unmanaged BofA Merrill Lynch U.S. High Yield, Cash Pay, BB-B Rated Index (formerly a Merrill Lynch Index) is a market value weighted measure of BB and B rated corporate bonds with maturities of at least one-year. The Index returns assume reinvestment of coupons and, unlike Series returns, do not reflect any fees or expenses.
Shareholder Expense Example (unaudited)
As a shareholder of the Series, you may incur two types of costs: (1) transaction costs, including potential wire charges on redemptions and (2) ongoing costs, including management fees and other Series expenses. This example is intended to help you understand your ongoing costs (in dollars) of investing in the Series and to compare these costs with the ongoing costs of investing in other mutual funds.
The example is based on an investment of $1,000 invested at the beginning of the period and held for the entire period (September 14, 2009* to December 31, 2009).
Actual Expenses
The first line of the table below provides information about actual account values and actual expenses. You may use the information in this line, together with the amount you invested, to estimate the expenses that you paid over the period. Simply divide your account value by $1,000 (for example, an $8,600 account value divided by $1,000 = 8.6), then multiply the result by the number in the first line under the heading entitled “Expenses Paid During Period” to estimate the expenses you paid on your account during this period.
Hypothetical Example for Comparison Purposes
The second line of the table below provides information about hypothetical account values and hypothetical expenses based on the Series’ actual expense ratio and an assumed rate of return of 5% per year before expenses, which is not the Series’ actual return. The hypothetical account values and expenses may not be used to estimate the actual ending account balance or expenses you paid during the period. You may use this information to compare the ongoing costs of investing in the Series and other funds. To do so, compare this 5% hypothetical example with the 5% hypothetical examples that appear in the shareholder reports of the other funds.
Please note that the expenses shown in the table are meant to highlight your ongoing costs only and do not reflect any transaction costs, such as potential wire charges on redemptions. Therefore, the second line of the table is useful in comparing ongoing costs only, and will not help you determine the relative total costs of owning different funds. In addition, if these transaction costs were included, your costs would have been higher.
| | | | | | | | | | |
| | | Beginning
Account Value
9/14/09* | | Ending
Account Value
12/31/09 | | Expenses Paid
During Period
9/14/09*-12/31/09 | |
Actual | | $ | 1,000.00 | | $ | 1,048.20 | | $ | 3.64 | 1 |
Hypothetical
(5% return before expenses) | | $ | 1,000.00 | | $ | 1,019.16 | | $ | 6.11 | 2 |
*Commencement of Operations.
1Expenses are equal to the Series’ annualized expense ratio (for the period 9/14/09* to 12/31/09) of 1.20%, multiplied by the average account value over the period, multiplied by 108/365 (to reflect the period since inception). Expenses are based on the most recent fiscal period. The Series’ total return would have been lower had certain expenses not been waived during the period.
2Expenses are equal to the Series’ annualized expense ratio (for the period 9/14/09* to 12/31/09), multiplied by the average account value over the period, multiplied by 184/365 (to reflect the one-half year period).
Portfolio Composition as of December 31, 2009 (unaudited)
Sector Allocation1
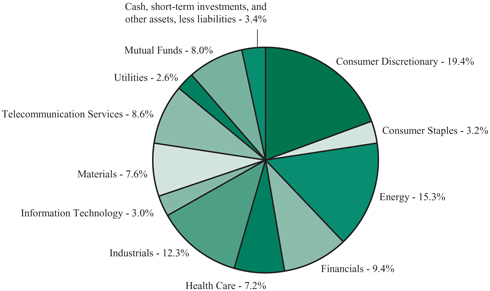
1As a percentage of net assets.
Credit Quality Ratings2,3

2As a percentage of total corporate bonds and preferred stock.
3Based on ratings from Moody’s, or the S&P equivalent. The Series may use different ratings provided by other rating agencies for purposes of determining compliance with the Series’ investment policies.
Investment Portfolio - December 31, 2009
| | | | | | | | | |
| | | Credit Rating1
(unaudited) | | | Principal
Amount | | Value (Note 2) |
| | | | | | | |
|
|
| | | |
CORPORATE BONDS - 85.4% | | | | | | | | | |
| | | |
Convertible Corporate Bonds - 0.9% | | | | | | | | | |
Financials - 0.5% | | | | | | | | | |
Real Estate Investment Trusts (REITS) - 0.5% | | | | | | | | | |
Host Hotels & Resorts LP3, 2.50%, 10/15/2029 | | BB | 2 | | $ | 590,000 | | $ | 630,562 |
| | | | | | | | | |
Industrials - 0.4% | | | | | | | | | |
Airlines - 0.4% | | | | | | | | | |
AirTran Holdings, Inc., 5.25%, 11/1/2016 | | CCC | 2 | | | 460,000 | | | 499,675 |
| | | | | | | | | |
Total Convertible Corporate Bonds
(Identified Cost $1,077,098) | | | | | | | | | 1,130,237 |
| | | | | | | | | |
Non-Convertible Corporate Bonds - 84.5% | | | | | | | | | |
Consumer Discretionary - 19.4% | | | | | | | | | |
Diversified Consumer Services - 1.0% | | | | | | | | | |
Affinion Group, Inc., 11.50%, 10/15/2015 | | Caa1 | | | | 1,275,000 | | | 1,335,562 |
| | | | | | | | | |
Hotels, Restaurants & Leisure - 5.9% | | | | | | | | | |
Pinnacle Entertainment, Inc., 7.50%, 6/15/2015 | | Caa1 | | | | 1,450,000 | | | 1,334,000 |
Scientific Games Corp.3, 7.875%, 6/15/2016 | | Ba3 | | | | 1,450,000 | | | 1,457,250 |
Scientific Games International, Inc.3, 9.25%, 6/15/2019 | | BB | 2 | | | 1,000,000 | | | 1,050,000 |
Wendy’s - Arby’s Restaurants LLC, 10.00%, 7/15/2016 | | B2 | | | | 1,700,000 | | | 1,853,000 |
Yonkers Racing Corp.3, 11.375%, 7/15/2016 | | B1 | | | | 1,715,000 | | | 1,800,750 |
| | | | | | | | | |
| | | | | | | | | 7,495,000 |
| | | | | | | | | |
Media - 10.4% | | | | | | | | | |
Cablevision Systems Corp.3, 8.625%, 9/15/2017 | | B1 | | | | 2,450,000 | | | 2,551,062 |
Columbus International, Inc. (Barbados)3 , 11.50%, 11/20/2014 | | B2 | | | | 1,770,000 | | | 1,858,500 |
MDC Partners, Inc. (Canada)3, 11.00%, 11/1/2016 | | B2 | | | | 705,000 | | | 733,200 |
Sirius XM Radio, Inc.3, 9.75%, 9/1/2015. | | Caa2 | | | | 820,000 | | | 863,050 |
UPC Germany GmbH (Germany)3, 8.125%, 12/1/2017 | | B1 | | | | 1,250,000 | | | 1,264,063 |
UPC Germany GmbH (Germany)3, 8.125%, 12/1/2017 | | B1 | | | | 525,000 | | | 763,902 |
UPC Holding B.V. (Netherlands)3, 9.875%, 4/15/2018 | | B2 | | | | 460,000 | | | 485,300 |
| | |
| 5 | | The accompanying notes are an integral part of the financial statements. |
Investment Portfolio - December 31, 2009
| | | | | | | | |
| | | Credit Rating1
(unaudited) | | Principal
Amount | | Value (Note 2) |
| | | | | | | | |
| | | |
CORPORATE BONDS (continued) | | | | | | | | |
| | | |
Non-Convertible Corporate Bonds (continued) | | | | | | | | |
Consumer Discretionary (continued) | | | | | | | | |
Media (continued) | | | | | | | | |
Virgin Media Finance plc (United Kingdom), 8.375%, 10/15/2019 | | B2 | | $ | 935,000 | | $ | 961,881 |
Virgin Media Finance plc, Series 1 (United Kingdom), 9.50%, 8/15/2016 | | B2 | | | 1,450,000 | | | 1,556,938 |
WMG Acquisition Corp.3, 9.50%, 6/15/2016 | | Ba2 | | | 1,105,000 | | | 1,183,731 |
XM Satellite Radio, Inc.3, 11.25%, 6/15/2013 | | Caa2 | | | 965,000 | | | 1,037,375 |
| | | | | | | | |
| | | | | | | | 13,259,002 |
| | | | | | | | |
Specialty Retail - 1.5% | | | | | | | | |
Toys R Us Property Co. LLC3, 8.50%, 12/1/2017 | | Ba2 | | | 1,885,000 | | | 1,917,988 |
| | | | | | | | |
Textiles, Apparel & Luxury Goods - 0.6% | | | | | | | | |
Levi Strauss & Co., 8.625%, 4/1/2013 | | B2 | | | 200,000 | | | 286,709 |
Levi Strauss & Co., 8.875%, 4/1/2016 | | B2 | | | 455,000 | | | 476,044 |
| | | | | | | | |
| | | | | | | | 762,753 |
| | | | | | | | |
Total Consumer Discretionary | | | | | | | | 24,770,305 |
| | | | | | | | |
Consumer Staples - 3.2% | | | | | | | | |
Beverages - 2.3% | | | | | | | | |
CEDC Finance Corp. International, Inc.3, 9.125%, 12/1/2016 | | B1 | | | 1,370,000 | | | 1,411,100 |
Constellation Brands, Inc., 8.375%, 12/15/2014 | | Ba3 | | | 1,450,000 | | | 1,544,250 |
| | | | | | | | |
| | | | | | | | 2,955,350 |
| | | | | | | | |
Personal Products - 0.9% | | | | | | | | |
Revlon Consumer Products Corp.3, 9.75%, 11/15/2015 | | B3 | | | 1,055,000 | | | 1,089,288 |
| | | | | | | | |
Total Consumer Staples | | | | | | | | 4,044,638 |
| | | | | | | | |
Energy - 15.3% | | | | | | | | |
Energy Equipment & Services - 4.8% | | | | | | | | |
Cie Generale de Geophysique - Veritas (France), 7.50%, 5/15/2015 | | Ba3 | | | 2,000,000 | | | 1,985,000 |
Complete Production Services, Inc., 8.00%, 12/15/2016 | | B1 | | | 680,000 | | | 670,650 |
Hercules Offshore, Inc.3, 10.50%, 10/15/2017 | | B2 | | | 460,000 | | | 485,300 |
Hornbeck Offshore Services, Inc.3, 8.00%, 9/1/2017 | | Ba3 | | | 1,840,000 | | | 1,840,000 |
| | |
| The accompanying notes are an integral part of the financial statements. | | 6 |
Investment Portfolio - December 31, 2009
| | | | | | | | |
| | | Credit
Rating1
(unaudited) | | Principal
Amount | | Value
(Note 2) |
| | | | | | | | |
| | | |
CORPORATE BONDS (continued) | | | | | | | | |
| | | |
Non-Convertible Corporate Bonds (continued) | | | | | | | | |
Energy (continued) | | | | | | | | |
Energy Equipment & Services (continued) | | | | | | | | |
Key Energy Services, Inc., 8.375%, 12/1/2014 | | B1 | | $ | 1,150,000 | | $ | 1,152,875 |
| | | | | | | | |
| | | | | | | | 6,133,825 |
| | | | | | | | |
Oil, Gas & Consumable Fuels - 10.5% | | | | | | | | |
Alon Refining Krotz Springs, Inc.3, 13.50%, 10/15/2014 | | B2 | | | 920,000 | | | 857,900 |
Aquilex Holdings LLC - Aquilex Finance Corp.3, 11.125%, 12/15/2016 | | B3 | | | 1,185,000 | | | 1,182,038 |
Arch Coal, Inc.3, 8.75%, 8/1/2016 | | B1 | | | 725,000 | | | 766,688 |
Arch Western Finance LLC, 6.75%, 7/1/2013 | | B1 | | | 1,000,000 | | | 992,500 |
Chesapeake Energy Corp., 9.50%, 2/15/2015 | | Ba3 | | | 1,115,000 | | | 1,223,712 |
Chesapeake Energy Corp., 6.875%, 1/15/2016 | | Ba3 | | | 725,000 | | | 725,000 |
Encore Acquisition Co., 7.25%, 12/1/2017 | | B1 | | | 965,000 | | | 965,000 |
Gibson Energy ULC - GEP Midstream | | | | | | | | |
Finance Corp. (Canada)3, 11.75%, 5/27/2014 | | Ba3 | | | 1,570,000 | | | 1,703,450 |
Plains Exploration & Production Co., 8.625%, 10/15/2019 | | B1 | | | 1,965,000 | | | 2,019,037 |
Tesoro Corp., 9.75%, 6/1/2019 | | Ba1 | | | 2,450,000 | | | 2,535,750 |
Whiting Petroleum Corp., 7.00%, 2/1/2014 | | B1 | | | 485,000 | | | 486,819 |
| | | | | | | | |
| | | | | | | | 13,457,894 |
| | | | | | | | |
Total Energy | | | | | | | | 19,591,719 |
| | | | | | | | |
Financials - 5.7% | | | | | | | | |
Capital Markets - 1.0% | | | | | | | | |
Goldman Sachs Capital II4, 5.793%, 12/29/2049 | | A3 | | | 1,650,000 | | | 1,278,750 |
| | | | | | | | |
Consumer Finance - 2.1% | | | | | | | | |
American Express Co.4, 6.80%, 9/1/2066 | | Baa2 | | | 2,940,000 | | | 2,631,300 |
| | | | | | | | |
Real Estate Investment Trusts (REITS) - 2.6% | | | | | | | | |
DuPont Fabros Technology LP3, 8.50%, 12/15/2017 | | Ba2 | | | 2,365,000 | | | 2,403,431 |
| | |
| 7 | | The accompanying notes are an integral part of the financial statements. |
Investment Portfolio - December 31, 2009
| | | | | | | | | |
| | | Credit
Rating1
(unaudited) | | | Principal
Amount | | Value
(Note 2) |
| | | | | | | | | |
| | | |
CORPORATE BONDS (continued) | | | | | | | | | |
| | | |
Non-Convertible Corporate Bonds (continued) | | | | | | | | | |
Financials (continued) | | | | | | | | | |
Real Estate Investment Trusts (REITS) (continued) | | | | | | | | | |
Felcor Lodging LP3, 10.00%, 10/1/2014 | | B2 | | | $ | 965,000 | | $ | 973,444 |
| | | | | | | | | |
| | | | | | | | | 3,376,875 |
| | | | | | | | | |
Total Financials | | | | | | | | | 7,286,925 |
| | | | | | | | | |
| | | |
Health Care - 7.2% | | | | | | | | | |
Health Care Equipment & Supplies - 3.8% | | | | | | | | | |
Fresenius Medical Care Capital Trust IV, 7.875%, 6/15/2011 | | Ba3 | | | | 965,000 | | | 999,981 |
Inverness Medical Innovations, Inc., 7.875%, 2/1/2016 | | B2 | | | | 1,725,000 | | | 1,690,500 |
Inverness Medical Innovations, Inc., 9.00%, 5/15/2016 | | B3 | | | | 2,138,000 | | | 2,191,450 |
| | | | | | | | | |
| | | | | | | | | 4,881,931 |
| | | | | | | | | |
Health Care Providers & Services - 3.4% | | | | | | | | | |
HCA, Inc.3, 7.875%, 2/15/2020 | | Ba3 | | | | 2,450,000 | | | 2,551,062 |
Health Management Associates, Inc., 6.125%, 4/15/2016 | | BB | 2 | | | 1,935,000 | | | 1,814,063 |
| | | | | | | | | |
| | | | | | | | | 4,365,125 |
| | | | | | | | | |
Total Health Care | | | | | | | | | 9,247,056 |
| | | | | | | | | |
Industrials - 11.9% | | | | | | | | | |
Aerospace & Defense - 0.8% | | | | | | | | | |
GeoEye, Inc.3, 9.625%, 10/1/2015 | | B1 | | | | 945,000 | | | 972,169 |
| | | | | | | | | |
Airlines - 2.9% | | | | | | | | | |
AirTran Airways, Inc.5,6, 10.41%, 4/1/2017 | | B1 | | | | 1,396,741 | | | 1,239,608 |
Delta Air Lines, Inc.3, 9.50%, 9/15/2014 | | Ba2 | | | | 2,420,000 | | | 2,513,775 |
| | | | | | | | | |
| | | | | | | | | 3,753,383 |
| | | | | | | | | |
Building Products - 2.1% | | | | | | | | | |
Owens Corning, 9.00%, 6/15/2019 | | Ba1 | | | | 940,000 | | | 1,048,268 |
USG Corp.3, 9.75%, 8/1/2014 | | B1 | | | | 1,525,000 | | | 1,627,938 |
| | | | | | | | | |
| | | | | | | | | 2,676,206 |
| | | | | | | | | |
Commercial Services & Supplies - 2.5% | | | | | | | | | |
ACCO Brands Corp.3, 10.625%, 3/15/2015 | | B2 | | | | 910,000 | | | 1,001,000 |
Clean Harbors, Inc., 7.625%, 8/15/2016 | | Ba2 | | | | 1,190,000 | | | 1,206,362 |
Corrections Corp. of America, 6.25%, 3/15/2013 | | Ba2 | | | | 965,000 | | | 969,825 |
| | | | | | | | | |
| | | | | | | | | 3,177,187 |
| | | | | | | | | |
| | |
| The accompanying notes are an integral part of the financial statements. | | 8 |
Investment Portfolio - December 31, 2009
| | | | | | | | |
| | | Credit Rating1
(unaudited) | | Principal
Amount | | Value (Note 2) |
| | | | | | | | |
| | | |
CORPORATE BONDS (continued) | | | | | | | | |
| | | |
Non-Convertible Corporate Bonds (continued) | | | | | | | | |
Industrials (continued) | | | | | | | | |
Industrial Conglomerates - 1.5% | | | | | | | | |
General Electric Capital Corp.4, 6.375%, 11/15/2067 | | Aa3 | | $ | 2,250,000 | | $ | 1,951,875 |
| | | | | | | | |
Marine - 1.4% | | | | | | | | |
Navios Maritime Holdings, Inc. - Navios | | | | | | | | |
Maritime Finance (US), Inc. (Marshall Island)3, 8.875%, 11/1/2017 | | Ba3 | | | 530,000 | | | 550,538 |
United Maritime Group LLC - United Maritime Group Finance Corp.3, 11.75%, 6/15/2015 | | B3 | | | 1,185,000 | | | 1,187,962 |
| | | | | | | | |
| | | | | | | | 1,738,500 |
| | | | | | | | |
Road & Rail - 0.7% | | | | | | | | |
RailAmerica, Inc., 9.25%, 7/1/2017 | | B1 | | | 869,000 | | | 924,399 |
| | | | | | | | |
Total Industrials | | | | | | | | 15,193,719 |
| | | | | | | | |
Information Technology - 3.0% | | | | | | | | |
Communications Equipment - 2.1% | | | | | | | | |
Alcatel-Lucent (USA), Inc., 6.45%, 3/15/2029 | | B1 | | | 1,580,000 | | | 1,131,675 |
Hughes Network Systems LLC - HNS Finance Corp., 9.50%, 4/15/2014 | | B1 | | | 1,450,000 | | | 1,497,125 |
| | | | | | | | |
| | | | | | | | 2,628,800 |
| | | | | | | | |
Software - 0.9% | | | | | | | | |
JDA Software Group, Inc.3, 8.00%, 12/15/2014 | | B1 | | | 1,195,000 | | | 1,218,900 |
| | | | | | | | |
Total Information Technology | | | | | | | | 3,847,700 |
| | | | | | | | |
Materials - 7.6% | | | | | | | | |
Containers & Packaging - 1.7% | | | | | | | | |
Ball Corp., 6.625%, 3/15/2018 | | Ba1 | | | 965,000 | | | 955,350 |
BWAY Corp.3, 10.00%, 4/15/2014 | | B3 | | | 770,000 | | | 814,275 |
Reynolds Group Issuer, Inc. - Reynolds Group Issuer LLC - Reynolds Group Issuer Lu3, 7.75%, 10/15/2016 | | B1 | | | 450,000 | | | 460,125 |
| | | | | | | | |
| | | | | | | | 2,229,750 |
| | | | | | | | |
Metals & Mining - 4.3% | | | | | | | | |
Essar Steel Algoma, Inc. (Canada)3, 9.375%, 3/15/2015 | | B3 | | | 1,585,000 | | | 1,563,206 |
Steel Dynamics, Inc.3, 7.75%, 4/15/2016 | | Ba2 | | | 1,000,000 | | | 1,041,250 |
| | |
| 9 | | The accompanying notes are an integral part of the financial statements. |
Investment Portfolio - December 31, 2009
| | | | | | | | |
| | | Credit
Rating1
(unaudited) | | Principal
Amount | | Value
(Note 2) |
| | | | | | | | |
| | | |
CORPORATE BONDS (continued) | | | | | | | | |
| | | |
Non-Convertible Corporate Bonds (continued) | | | | | | | | |
Materials (continued) | | | | | | | | |
Metals & Mining (continued) | | | | | | | | |
Teck Resources Ltd. (Canada), 10.25%, 5/15/2016 | | Ba2 | | $ | 2,450,000 | | $ | 2,854,250 |
| | | | | | | | |
| | | | | | | | 5,458,706 |
| | | | | | | | |
Paper & Forest Products - 1.6% | | | | | | | | |
Georgia-Pacific LLC3, 8.25%, 5/1/2016 | | Ba3 | | | 1,000,000 | | | 1,060,000 |
Georgia-Pacific LLC3, 7.125%, 1/15/2017 | | Ba3 | | | 950,000 | | | 961,875 |
| | | | | | | | |
| | | | | | | | 2,021,875 |
| | | | | | | | |
Total Materials | | | | | | | | 9,710,331 |
| | | | | | | | |
Telecommunication Services - 8.6% | | | | | | | | |
Diversified Telecommunication Services - 4.8% | | | | | | | | |
Clearwire Communications LLC - Clearwire Finance, Inc.3, 12.00%, 12/1/2015 | | Caa1 | | | 1,000,000 | | | 1,015,000 |
Clearwire Communications LLC - Clearwire Finance, Inc.3, 12.00%, 12/1/2015 | | Caa1 | | | 655,000 | | | 664,825 |
Intelsat Subsidiary Holding Co. Ltd. (Bermuda)3, 8.875%, 1/15/2015 | | B3 | | | 725,000 | | | 746,750 |
Telesat - Telesat LLC (Canada), 11.00%, 11/1/2015 | | Caa1 | | | 2,380,000 | | | 2,582,300 |
Wind Acquisition Finance S.A. (Luxembourg)3, 11.75%, 7/15/2017 | | B2 | | | 965,000 | | | 1,054,262 |
| | | | | | | | |
| | | | | | | | 6,063,137 |
| | | | | | | | |
Wireless Telecommunication Services - 3.8% | | | | | | | | |
CC Holdings GS V LLC - Crown Castle GS III Corp.3, 7.75%, 5/1/2017 | | Baa3 | | | 470,000 | | | 500,550 |
NII Capital Corp.3, 8.875%, 12/15/2019 | | B1 | | | 1,845,000 | | | 1,796,569 |
SBA Telecommunications, Inc.3, 8.00%, 8/15/2016 | | Ba2 | | | 2,450,000 | | | 2,560,250 |
| | | | | | | | |
| | | | | | | | 4,857,369 |
| | | | | | | | |
Total Telecommunication Services | | | | | | | | 10,920,506 |
| | | | | | | | |
Utilities - 2.6% | | | | | | | | |
Gas Utilities - 0.8% | | | | | | | | |
Ferrellgas Partners LP3, 9.125%, 10/1/2017 | | Ba3 | | | 965,000 | | | 1,020,488 |
| | | | | | | | |
| | |
| The accompanying notes are an integral part of the financial statements. | | 10 |
Investment Portfolio - December 31, 2009
| | | | | | | | |
| | | Credit Rating1
(unaudited) | | Principal
Amount/ Shares | | Value (Note 2) |
| | | | | | | | |
| | | |
CORPORATE BONDS (continued) | | | | | | | | |
| | | |
Non-Convertible Corporate Bonds (continued) | | | | | | | | |
Utilities (continued) | | | | | | | | |
Independent Power Producers & Energy Traders - 1.8% | | | | | | | | |
Mirant Americas Generation LLC, 9.125%, 5/1/2031 | | B3 | | $ | 1,450,000 | | $ | 1,305,000 |
North American Energy Alliance LLC - North American Energy Alliance Finance Corp.3, 10.875%, 6/1/2016 | | Ba3 | | | 945,000 | | | 1,004,062 |
| | | | | | | | |
| | | | | | | | 2,309,062 |
| | | | | | | | |
Total Utilities | | | | | | | | 3,329,550 |
| | | | | | | | |
Total Non-Convertible Corporate Bonds | | | | | | | | |
(Identified Cost $106,044,906) | | | | | | | | 107,942,449 |
| | | | | | | | |
TOTAL CORPORATE BONDS | | | | | | | | |
(Identified Cost $107,122,004) | | | | | | | | 109,072,686 |
| | | | | | | | |
PREFERRED STOCKS - 3.2% | | | | | | | | |
| | | |
Financials - 3.2% | | | | | | | | |
Commercial Banks - 1.1% | | | | | | | | |
Wells Fargo & Co., Series K | | Ba1 | | | 1,335,000 | | | 1,338,338 |
| | | | | | | | |
Diversified Financial Services - 2.1% | | | | | | | | |
Bank of America Corp., Series K | | Ba3 | | | 1,410,000 | | | 1,357,463 |
JPMorgan Chase & Co., Series 1 | | Baa1 | | | 1,275,000 | | | 1,315,112 |
| | | | | | | | |
| | | | | | | | 2,672,575 |
| | | | | | | | |
TOTAL PREFERRED STOCKS | | | | | | | | |
(Identified Cost $3,816,702) | | | | | | | | 4,010,913 |
| | | | | | | | |
| | | |
MUTUAL FUNDS - 8.0% | | | | | | | | |
iShares iBoxx High Yield Corporate Bond Fund | | | | | 58,390 | | | 5,128,978 |
SPDR Barclays Capital High Yield Bond ETF | | | | | 131,620 | | | 5,118,702 |
| | | | | | | | |
TOTAL MUTUAL FUNDS | | | | | | | | |
(Identified Cost $10,058,036) | | | | | | | | 10,247,680 |
| | | | | | | | |
| | |
| 11 | | The accompanying notes are an integral part of the financial statements. |
Investment Portfolio - December 31, 2009
| | | | | |
| | | Shares | | Value (Note 2) |
| | | | | |
| | |
SHORT-TERM INVESTMENTS - 1.8% | | | | | |
Dreyfus Cash Management, Inc. - Institutional Shares7, 0.07%,
(Identified Cost $2,273,717) | | 2,273,717 | | $ | 2,273,717 |
| | | | | |
TOTAL INVESTMENTS - 98.4%
(Identified Cost $123,270,459) | | | | | 125,604,996 |
| | |
OTHER ASSETS, LESS LIABILITIES - 1.6% | | | | | 2,073,227 |
| | | | | |
NET ASSETS - 100% | | | | $ | 127,678,223 |
| | | | | |
1Credit ratings from Moody’s (unaudited).
2Credit ratings from S&P (unaudited).
3Restricted securities - Investment in securities that are restricted as to public resale under the Securities Act of 1933, as amended. These securities have been sold under rule 144A and have been determined to be liquid under guidelines established by the Board of Directors. These securities amount to $58,196,203, or 45.6%, of the Series’ net assets as of December 31, 2009 (see Note 2 to the financial statements).
4The coupon rate is floating and is the stated rate as of December 31, 2009.
5Security has been valued at fair value (see Note 2 to the financial statements).
6Restricted securities - Investment in securities that are restricted as to public resale under the Securities Act of 1933, as amended. This security was acquired on October 13, 2009 at a cost of $536,961 ($87.00 per share) and on December 2, 2009 at a cost of $686,000 ($88.00 per share). This security has been sold under rule 144A and has been determined to be illiquid under guidelines established by the Board of Directors. This security amounts to $1,239,608, or 1.0%, of the Series’ net assets as of December 31, 2009 (see Note 2 to the financial statements).
7Rate shown is the current yield as of December 31, 2009.
| | |
| The accompanying notes are an integral part of the financial statements. | | 12 |
Statement of Assets and Liabilities
December 31, 2009
| | | |
ASSETS: | | | |
| | | |
| |
Investments, at value (identified cost $123,270,459) (Note 2) | | $ | 125,604,996 |
Interest receivable | | | 2,124,724 |
Receivable for fund shares sold | | | 82,908 |
Dividends receivable | | | 82,218 |
| | | |
TOTAL ASSETS | | | 127,894,846 |
| | | |
LIABILITIES: | | | |
| |
Accrued management fees (Note 3) | | | 104,662 |
Accrued fund accounting and transfer agent fees (Note 3) | | | 8,217 |
Accrued directors’ fees (Note 3) | | | 2,990 |
Accrued Chief Compliance Officer service fees (Note 3) | | | 429 |
Payable for fund shares repurchased | | | 65,304 |
Audit fees payable | | | 27,300 |
Other payables and accrued expenses | | | 7,721 |
| | | |
TOTAL LIABILITIES | | | 216,623 |
| | | |
TOTAL NET ASSETS | | $ | 127,678,223 |
| | | |
NET ASSETS CONSIST OF: | | | |
| |
Capital stock | | $ | 123,167 |
Additional paid-in-capital | | | 124,528,504 |
Undistributed net investment income | | | 325,982 |
Accumulated net realized gain on investments, foreign currency and translation of other assets and liabilities | | | 366,374 |
Net unrealized appreciation on investments, foreign currency and translation of other assets and liabilities | | | 2,334,196 |
| | | |
TOTAL NET ASSETS | | $ | 127,678,223 |
| | | |
NET ASSET VALUE, OFFERING PRICE AND REDEMPTION
PRICE PER SHARE - Class A ($127,678,223/12,316,685 shares) | | $ | 10.37 |
| | | |
| | |
| 13 | | The accompanying notes are an integral part of the financial statements. |
Statement of Operations
For the Period September 14, 20091 to December 31, 2009
| | | | |
INVESTMENT INCOME: | | | | |
| | | | |
Interest | | $ | 1,663,835 | |
Dividends | | | 220,074 | |
| | | | |
Total Investment Income | | | 1,883,909 | |
| | | | |
EXPENSES: | | | | |
| |
Management fees (Note 3) | | | 242,506 | |
Fund accounting and transfer agent fees (Note 3) | | | 14,505 | |
Directors’ fees (Note 3) | | | 3,000 | |
Chief Compliance Officer service fees (Note 3) | | | 1,236 | |
Audit fees | | | 27,300 | |
Custodian fees | | | 1,900 | |
Miscellaneous | | | 6,910 | |
| | | | |
Total Expenses | | | 297,357 | |
Less reduction of expenses (Note 3) | | | (4,184 | ) |
| | | | |
Net Expenses | | | 293,173 | |
| | | | |
NET INVESTMENT INCOME | | | 1,590,736 | |
| | | | |
REALIZED AND UNREALIZED GAIN (LOSS) ON INVESTMENTS AND FOREIGN CURRENCY: | | | | |
| |
Net realized gain (loss) on - | | | | |
Investments | | | 455,299 | |
Foreign currency and translation of other assets and liabilities | | | (5,189 | ) |
| | | | |
| | | 450,110 | |
| | | | |
| |
Net change in unrealized appreciation (depreciation) on - | | | | |
Investments | | | 2,334,537 | |
Foreign currency and translation of other assets and liabilities | | | (341 | ) |
| | | | |
| | | 2,334,196 | |
| | | | |
NET REALIZED AND UNREALIZED GAIN (LOSS) ON INVESTMENTS AND FOREIGN CURRENCY | | | 2,784,306 | |
| | | | |
NET INCREASE IN NET ASSETS RESULTING FROM OPERATIONS | | $ | 4,375,042 | |
| | | | |
1Commencement of operations.
| | |
| The accompanying notes are an integral part of the financial statements. | | 14 |
Statements of Changes in Net Assets
For the Period September 14, 20091 to December 31, 2009
| | | | |
INCREASE IN NET ASSETS: | | | | |
| | | | |
OPERATIONS: | | | | |
| |
Net investment income | | $ | 1,590,736 | |
Net realized gain on investments and foreign currency | | | 450,110 | |
Net change in unrealized appreciation on investments and foreign currency | | | 2,334,196 | |
| | | | |
Net increase from operations | | | 4,375,042 | |
| | | | |
DISTRIBUTIONS TO SHAREHOLDERS (Note 8): | | | | |
| |
From net investment income | | | (1,259,565 | ) |
From net realized gain on investments | | | (88,925 | ) |
| | | | |
Total distributions to shareholders | | | (1,348,490 | ) |
| | | | |
CAPITAL STOCK ISSUED AND REPURCHASED: | | | | |
| |
Net increase from capital share transactions (Note 5) | | | 124,651,671 | |
| | | | |
Net increase in net assets | | | 127,678,223 | |
NET ASSETS: | | | | |
| |
Beginning of period | | | — | |
| | | | |
End of period (including undistributed net investment income of $325,982) | | $ | 127,678,223 | |
| | | | |
1Commencement of operations.
| | |
| 15 | | The accompanying notes are an integral part of the financial statements. |
Financial Highlights
For the Period September 14, 20091 to December 31, 2009
| | |
| Per share data (for a share outstanding throughout the period): | | |
Net asset value - Beginning of period | | $10.00 |
| | |
Income from investment operations: | | |
Net investment income | | 0.202 |
Net realized and unrealized gain on investments | | 0.28 |
| | |
Total from investment operations | | 0.48 |
| | |
Less distributions to shareholders: | | |
From net investment income | | (0.10) |
From net realized gain on investments | | (0.01) |
| | |
Total distributions to shareholders | | (0.11) |
| | |
Net asset value - End of period | | $10.37 |
| | |
Net assets - End of period (000’s omitted) | | $127,678 |
| | |
Total return3 | | 4.82% |
| Ratios (to average net assets)/ Supplemental Data: | | |
Expenses* | | 1.20%4 |
Net investment income | | 6.51%4 |
Portfolio turnover | | 22% |
|
*The investment advisor did not impose all or a portion of its management fees during the period. If these expenses had been incurred by the Series, the expense ratio (to average net assets) would have been increased by the following amount: |
| | 0.02%4 |
1Commencement of operations.
2Calculated based on average shares outstanding during the period.
3Represents aggregate total return for the period indicated, and assumes reinvestment of all distributions. Total return would have been lower had certain expenses not been waived during the period. Periods less than one year are not annualized.
4Annualized.
| | |
| The accompanying notes are an integral part of the financial statements. | | 16 |
Notes to Financial Statements
High Yield Bond Series (the “Series”) is a no-load non-diversified series of Manning & Napier Fund, Inc. (the “Fund”). The Fund is organized in Maryland and is registered under the Investment Company Act of 1940, as amended, as an open-end management investment company.
The Series’ investment objective is to provide a high level of long-term total return by investing principally in non-investment grade fixed income securities that are issued by government and corporate entities.
The Fund’s Advisor is Manning & Napier Advisors, Inc. (the “Advisor”). On September 14, 2009 the Series resumed sales of shares to advisory clients and employees of the Advisor and its affiliates and directly to investors. The total authorized capital stock of the Fund consists of 10.0 billion shares of common stock each having a par value of $0.01. As of December 31, 2009, 4.6 billion shares have been designated in total among 29 series, of which 20 million have been designated as High Yield Bond Series Class A common stock.
| 2. | SIGNIFICANT ACCOUNTING POLICIES |
Security Valuation
Portfolio securities, including domestic equities, foreign equities, warrants and options, listed on an exchange other than the NASDAQ National Market System are valued at the latest quoted sales price of the exchange on which the security is primarily traded. Securities not traded on valuation date or securities not listed on an exchange are valued at the latest quoted bid price provided by the Fund’s pricing service. Securities listed on the NASDAQ National Market System are valued in accordance with the NASDAQ Official Closing Price.
Debt securities, including government bonds, foreign bonds, asset-backed securities, structured notes, supranational obligations, sovereign bonds, corporate bonds and mortgage-backed securities will normally be valued on the basis of evaluated bid prices provided by an independent pricing service. Certain investments in securities held by the Series may be valued on a basis of a price provided by a principal market maker. These prices may differ from the value that would have been used had a broader market for securities existed.
Short-term investments that mature in sixty days or less are valued at amortized cost, which approximates market value. Investments in open-end investment companies are valued at their net asset value per share on valuation date.
Volume and level of activity in established markets for an asset or liability are evaluated to determine whether recent transactions and quoted prices are determinative of fair value. Where there have been significant decreases in volume and level of activity, further analysis and adjustment may be necessary to estimate fair value. The Series measures fair value in these instances by the use of inputs and valuation techniques which may be based upon current market prices of securities that are comparable in coupon, rating, maturity and industry and/or expectation of future cash flows. As a result of trading in relatively thin markets and/or markets that experience significant volatility, the prices used by the Series to value these securities may differ from the value that would be realized if these securities were sold, and the differences could be material.
Securities for which representative valuations or prices are not available from the Fund’s pricing service may be valued at fair value. Due to the inherent uncertainty of valuations of such securities, the fair value may differ significantly from the values that would have been used had a ready market for such securities existed. If trading or events occurring after the close of the principal
Notes to Financial Statements
| 2. | SIGNIFICANT ACCOUNTING POLICIES (continued) |
Security Valuation (continued)
market in which securities are traded are expected to materially affect the value of those securities, then they may be valued at their fair value, taking this trading or these events into account. Fair value is determined in good faith by the Advisor under procedures approved by and under the general supervision and responsibility of the Fund’s Board of Directors (the “Board”).
Various inputs are used in determining the value of the Series’ assets or liabilities carried at market value. These inputs are summarized in three broad levels. Level 1 includes quoted prices in active markets for identical assets and liabilities. Level 2 includes other significant observable inputs (including quoted prices for similar securities, interest rates, prepayment speeds, credit risk, etc.). Level 3 includes significant unobservable inputs (including the Series’ own assumptions in determining the fair value of investments). The inputs or methodology used for valuing securities are not necessarily an indication of the risk associated with investing in those securities.
The following is a summary of the valuation levels used for major security types as of December 31, 2009 in valuing the Series’ assets or liabilities carried at market value:
| | | | | | | | | | | | |
Description | | 12/31/09 | | Level 1 | | Level 2 | | Level 3 |
| | | | | | | | | | | | |
Equity securities* | | $ | — | | $ | — | | $ | — | | $ | — |
Preferred securities | | | 4,010,913 | | | — | | | 4,010,913 | | | — |
Debt securities: | | | | | | | | | | | | |
Corporate debt | | | 107,942,449 | | | — | | | 106,702,841 | | | 1,239,608 |
Convertible corporate debt | | | 1,130,237 | | | — | | | 1,130,237 | | | — |
Mutual funds | | | 12,521,397 | | | 12,521,397 | | | — | | | — |
Other financial instruments** | | | — | | | — | | | — | | | — |
| | | | | | | | | | | | |
Total | | $ | 125,604,996 | | $ | 12,521,397 | | $ | 111,843,991 | | $ | 1,239,608 |
| | | | | | | | | | | | |
The following table is a reconciliation of Level 3 investments for which significant unobservable inputs were used to determine fair value:
| | | |
Level 3 Reconciliation | | Corporate Debt |
| | | |
Balance as of September 14, 2009 (market value) | | $ | — |
Accrued discounts/premiums | | | 2,044 |
Change in unrealized appreciation/depreciation *** | | | 14,604 |
Net purchases/sales | | | 1,222,960 |
| | | |
Balance as of December 31, 2009 (market value) | | $ | 1,239,608 |
| | | |
*Includes common stock, warrants and rights. Please see the Investment Portfolio for industry classification.
Notes to Financial Statements
| 2. | SIGNIFICANT ACCOUNTING POLICIES (continued) |
Security Valuation (continued)
**Other financial instruments are derivative instruments not reflected in the Investment Portfolio, such as futures, forwards and swap contracts, which are valued at the unrealized appreciation/ depreciation on the instrument. As of December 31, 2009, the Series did not hold any derivative instruments.
***The change in unrealized appreciation (depreciation) on securities still held at December 31, 2009 was $14,604, which is included in the related net change in unrealized appreciation/ depreciation on the Statement of Operations.
Interim and annual reporting periods beginning after December 15, 2009 will require additional disclosure regarding transfers in and/or out of Level 1 and 2. Additional disclosure surrounding the activity in Level 3 fair value measurement will also be effective for fiscal years beginning after December 15, 2010. Management has concluded that this will not have a material impact on the Series’ financial statements.
Security Transactions, Investment Income and Expenses
Security transactions are accounted for on trade date. Dividend income is recorded on the ex-dividend date, except that if the ex-dividend date has passed, certain dividends from foreign securities are recorded as soon as the Fund is informed of the ex-dividend date. Non-cash dividends, if any, are recorded at the fair market value of the securities received. Interest income, including amortization of premium and accretion of discounts using the effective interest method, is earned from settlement date and accrued daily.
Expenses are recorded on an accrual basis. Most expenses of the Fund can be attributed to a specific series. Expenses which cannot be directly attributed are apportioned among the series in the Fund in such a manner as deemed equitable by the Fund’s Board, taking into consideration, among other things, the nature and type of expense.
The Series uses the identified cost method for determining realized gain or loss on investments for both financial statement and federal income tax reporting purposes.
Foreign Currency Translation
The books and records of the Series are maintained in U.S. dollars. Foreign currencies, investments and other assets and liabilities are translated into U.S. dollars at the current exchange rates. Purchases and sales of investment securities and income and expenses are translated on the respective dates of such transactions. The Series do not isolate realized and unrealized gains and losses attributable to changes in the exchange rates from gains and losses that arise from changes in the market value of investments. Such fluctuations are included with net realized and unrealized gain or loss on investments. Net realized foreign currency gains and losses represent foreign currency gains and losses between trade date and settlement date on securities transactions, gains and losses on disposition of foreign currencies and the difference between the amount of income and foreign withholding taxes recorded on the books of the Series and the amounts actually received or paid.
Restricted Securities
Restricted securities are purchased in private placement transactions, are not registered under the Securities Act of 1933, as amended, and may have contractual restrictions on resale. Information regarding restricted securities is included at the end of the Series’ Investment Portfolio.
Notes to Financial Statements
| 2. | SIGNIFICANT ACCOUNTING POLICIES (continued) |
Illiquid Securities
A security may be considered illiquid if so deemed in good faith by the Advisor under procedures approved by and under the general supervision and responsibility of the Fund’s Board. Securities that are illiquid are marked with the applicable footnote on the Investment Portfolio. As of December 31, 2009, the aggregate value of securities deemed illiquid was $1,239,608, representing 1.0% of the Series’ net assets.
Federal Taxes
The Series’ policy is to comply with the provisions of the Internal Revenue Code applicable to regulated investment companies. The Series is not subject to federal income tax or excise tax to the extent that the Series distributes to shareholders each year its taxable income, including any net realized gains on investments, in accordance with requirements of the Internal Revenue Code. Accordingly, no provision for federal income tax or excise tax has been made in the financial statements.
Management evaluates its tax positions to determine if the tax positions taken meet the minimum recognition threshold in connection with accounting for uncertainties in income tax positions taken or expected to be taken for the purposes of measuring and recognizing tax liabilities in the financial statements. Recognition of tax benefits of an uncertain tax position is required only when the position is “more likely than not” to be sustained assuming examination by taxing authorities. At December 31, 2009, the Series has recorded no liability for net unrecognized tax benefits relating to uncertain income tax positions taken or expected to be taken in future tax returns.
The Series files income tax returns in the U.S. federal jurisdiction, various states and foreign jurisdictions, as required. No income tax returns are currently under investigation, as this is the inception year for the Series and it has not yet filed any tax returns. The Fund is not aware of any tax positions for which it is reasonably possible that the total amounts of unrecognized tax benefits will significantly change in the next twelve months.
Additionally, based on the Fund’s understanding of the tax rules and rates related to income, gains and transactions for foreign jurisdictions in which it invests, the Series will provide for foreign taxes, and where appropriate, deferred foreign tax.
Distributions of Income and Gains
Distributions to shareholders of net investment income and net realized gains are made annually. An additional distribution may be necessary to avoid taxation of the Series. Distributions are recorded on the ex-dividend date.
Indemnifications
The Fund’s organizational documents provide former and current directors and officers with a limited indemnification against liabilities arising in connection with the performance of their duties to the Fund. In the normal course of business, the Fund may also enter into contracts that provide general indemnifications. The Fund’s maximum exposure under these arrangements is unknown as this would be dependent on future claims that may be made against the Fund. The risk of material loss from such claims is considered remote.
Other
The preparation of financial statements in conformity with accounting principles generally accepted in the United States of America requires management to make estimates and assumptions that
Notes to Financial Statements
| 2. | SIGNIFICANT ACCOUNTING POLICIES (continued) |
Other (continued)
affect the reported amounts of assets and liabilities and the disclosure of contingent assets and liabilities at the date of the financial statements and the reported amounts of income and expenses during the reporting period. Actual results could differ from those estimates.
| 3. | TRANSACTIONS WITH AFFILIATES |
The Fund has an Investment Advisory Agreement (the “Agreement”) with the Advisor, for which the Series pays a fee, computed daily and payable monthly, at an annual rate of 1.00% of the Series’ average daily net assets.
Under the Agreement, personnel of the Advisor provide the Series with advice and assistance in the choice of investments and the execution of securities transactions, and otherwise maintain the Series’ organization. The Advisor also provides the Fund with necessary office space and fund administration and support services. The salaries of all officers of the Fund (except a percentage of the Fund’s Chief Compliance Officer’s salary, which is paid by the Fund), and of all Directors who are “affiliated persons” of the Fund, or of the Advisor, and all personnel of the Fund, or of the Advisor, performing services relating to research, statistical and investment activities, are paid by the Advisor. Each “non-affiliated” Director receives an annual stipend, which is allocated among all the active series of the Fund. In addition, these Directors also receive a fee per Board meeting attended for each active series of the Fund plus a fee for each committee meeting attended.
The Advisor has contractually agreed, until at least April 30, 2011, to waive its fee and, if necessary, pay other operating expenses of the Series in order to maintain total direct annual fund operating expenses for the Series at no more than 1.20% of average daily net assets each year. Accordingly, the Advisor waived fees of $4,184 for the period ended December 31, 2009, which is included as a reduction of expenses on the Statement of Operations. The Advisor is not eligible to recoup this amount.
Manning & Napier Investor Services, Inc., a registered broker-dealer affiliate of the Advisor, acts as distributor for the Fund’s shares. The services of Manning & Napier Investor Services, Inc. are provided at no additional cost to the Series.
For fund accounting and transfer agent services through November 7, 2009, the Fund paid the Advisor an annual fee of 0.055% of the Fund’s average daily net assets up to $4.5 billion, 0.03% of the Fund’s average daily net assets between $4.5 billion and $7.5 billion, and 0.02% of the Fund’s average daily net assets over $7.5 billion. Additionally, certain transaction and account-based fees and out-of-pocket expenses, including charges for reporting relating to the Fund’s compliance program, were charged. Expenses not directly attributable to a Series are allocated based on each Series’ relative net assets or number of accounts, depending on the expense. Prior to October 12, 2009 (for sub-accountant) and November 9, 2009 (for sub-transfer agent) the Advisor had an agreement with Citi Fund Services Ohio, Inc. (“Citi”) under which Citi served as sub-accountant and sub-transfer agent.
The Advisor has entered into agreements dated October 12, 2009 and November 9, 2009 with PNC Global Investment Servicing (“PNCGIS”) under which PNCGIS serves as sub-accountant services agent and sub-transfer agent, respectively. Effective November 7, 2009 under the amended master services agreement, the Fund pays the Advisor an annual fee of 0.0175% on the first $3 billion of average daily net assets (excluding Target Series); 0.015% on the next $3 billion of average daily net assets (excluding Target Series); and 0.01% of the average daily net assets in
Notes to Financial Statements
| 3. | TRANSACTIONS WITH AFFILIATES (continued) |
excess of $6 billion (excluding Target Series); plus a base fee of $25,500 per Series. Additionally, certain transaction-, account-, and cusip-based fees and out-of-pocket expenses, including charges for reporting relating to the Fund’s compliance program, are charged.
| 4. | PURCHASES AND SALES OF SECURITIES |
For the period September 14, 2009 (commencement of operations) to December 31, 2009, purchases and sales of securities, other than United States Government securities and short-term securities, were $138,122,674 and $17,566,667, respectively. There were no purchases or sales of United States Government securities.
| 5. | CAPITAL STOCK TRANSACTIONS |
Transactions in shares of High Yield Bond Series were:
| | | | | | | |
| | | For the period 9/14/09
(commencement of
operations) to 12/31/09 | |
| | | Shares | | | Amount | |
| | | | | | | |
Sold | | 12,442,729 | | | $ | 125,933,491 | |
Reinvested | | 126,129 | | | | 1,296,610 | |
Repurchased | | (252,173 | ) | | | (2,578,430 | ) |
| | | | | | | |
Total | | 12,316,685 | | | $ | 124,651,671 | |
| | | | | | | |
Substantially all of the Series’ shares represent investments by fiduciary accounts over which the Advisor has sole investment discretion.
The Series may trade in instruments including written and purchased options, forward foreign currency exchange contracts and futures contracts and other derivatives in the normal course of investing activities to assist in managing exposure to various market risks. The Series may be subject to various elements of risk and may involve, to a varying degree, elements of risk in excess of the amounts recognized for financial statement purposes; the risk that changes in the value of a derivative may not correlate perfectly with the underlying asset, rate or index; counterparty credit risk related to over the counter derivatives counterparties’ failure to perform under contract terms; liquidity risk related to the lack of a liquid market for these contracts allowing the fund to close out its position(s); and documentation risk relating to disagreement over contract terms. No such investments were held by the Series during the period ended December 31, 2009.
Investing in securities of foreign companies and foreign governments involves special risks and considerations not typically associated with investing in securities of domestic companies and the U.S. Government. These risks include revaluation of currencies and future adverse political and economic developments. Moreover, securities of foreign companies and foreign governments and their markets may be less liquid and their prices more volatile than those of comparable domestic companies and the U.S. Government.
Notes to Financial Statements
| 8. | FEDERAL INCOME TAX INFORMATION |
The amount and characterization of certain income and capital gains to be distributed are determined in accordance with federal income tax regulations, which may differ from accounting principles generally accepted in the United States of America. These differences are primarily due to differing book and tax treatments in the timing of the recognition of net investment income or gains and losses, including Post-October losses and investments in hybrid securities. The Series may periodically make reclassifications among its capital accounts to reflect income and gains available for distribution (or available capital loss carryovers) under income tax regulations without impacting the Series’ net asset value. Any such reclassifications are not reflected in the financial highlights.
The tax character of distributions paid for the period September 14, 2009 (commencement of operations) to December 31, 2009 were as follows:
| | | | |
Ordinary income | | $ | 1,348,490 | |
| | | | |
|
For the period ended December 31, 2009, the Series elected to defer $5,189 of currency losses attributable to Post-October losses. | |
|
At December 31, 2009, the tax basis components of distributable earnings and the net unrealized appreciation based on identified cost for federal income tax purposes were as follows: | |
| |
Cost for federal income tax purposes | | $ | 123,346,970 | |
Unrealized appreciation | | $ | 2,532,773 | |
Unrealized depreciation | | | (274,747 | ) |
| | | | |
Net unrealized appreciation | | $ | 2,258,026 | |
Undistributed ordinary income | | | 677,443 | |
On February 2, 2010, The PNC Financial Services Group, Inc. (“PNC”), which serves as the Series’ sub-accountant services agent and sub-transfer agent, entered into a Stock Purchase Agreement (the “Stock Purchase Agreement”) with The Bank of New York Mellon Corporation (“BNY Mellon”), the Series’ custodian. Upon the terms and subject to the conditions set forth in the Stock Purchase Agreement, which has been approved by the board of directors of each company, PNC will sell to BNY Mellon (the “Stock Sale”) 100% of the issued and outstanding shares of PNC Global Investment Servicing Inc., an indirect, wholly-owned subsidiary of PNC. The Stock Sale is expected to close in the third quarter of 2010. Management has concluded that this will not have a material impact on the Series’ financial statements.
There were no other subsequent events that require recognition or disclosure. In preparing these financial statements, management of the Fund has evaluated events and transactions for potential recognition or disclosure through February 23, 2010, the date the financial statements were issued.
Report of Independent Registered Public Accounting Firm
To the Board of Directors of Manning & Napier Fund, Inc. and Shareholders of High Yield Bond Series:
In our opinion, the accompanying statement of assets and liabilities, including the investment portfolio (except for credit ratings), and the related statements of operations and of changes in net assets and the financial highlights present fairly, in all material respects, the financial position of the High Yield Bond Series (a series of Manning & Napier Fund, Inc., hereafter referred to as the “Series”) at December 31, 2009, and the results of its operations, the changes in its net assets and the financial highlights for the period September 14, 2009 (commencement of operations) through December 31, 2009, in conformity with accounting principles generally accepted in the United States of America. These financial statements and financial highlights (hereafter referred to as “financial statements”) are the responsibility of the Series’ management; our responsibility is to express an opinion on these financial statements based on our audit. We conducted our audit of these financial statements in accordance with the standards of the Public Company Accounting Oversight Board (United States). Those standards require that we plan and perform the audit to obtain reasonable assurance about whether the financial statements are free of material misstatement. An audit includes examining, on a test basis, evidence supporting the amounts and disclosures in the financial statements, assessing the accounting principles used and significant estimates made by management, and evaluating the overall financial statement presentation. We believe that our audit, which included confirmation of securities at December 31, 2009 by correspondence with the custodian, provides a reasonable basis for our opinion.

Columbus, Ohio
February 23, 2010
Supplemental Tax Information (unaudited)
All designations are based on financial information available as of the date of this annual report and, accordingly are subject to change.
For federal income tax purposes, the Series designates for the current fiscal period $18,404 or, if different, the maximum amount allowable under the tax law as qualified dividend income.
For corporate shareholders, the percentage of investment income (dividend income plus short-term gains, if any) that qualifies for the dividends received deduction for the current fiscal period is 1.36%, or if different, the maximum allowable under tax law.
Renewal of Investment Advisory Agreement (unaudited)
At the Manning & Napier Fund, Inc. (the “Fund”) Board of Directors’ (the “Board”) meeting, held on December 7, 2009, the Investment Advisory Agreement (the “Agreement”) between the Fund and Manning & Napier Advisors, Inc. (the “Advisor”) was reviewed by the Board for renewal. In connection with the decision whether to renew the Agreement, a variety of material was prepared for and reviewed by the Board.
Representatives of the Advisor attended the meeting and presented additional oral and written information to the Board to assist the Board in its considerations. The discussion immediately below outlines the materials and information presented to the Board in connection with the Board’s 2009 Annual Review of the Agreement and the conclusions made by the Directors when determining to continue the Agreement.
| | • | | The Board considered the services provided by the Advisor under the Agreement including, among others: deciding what securities to purchase and sell for each Series; arranging for the purchase and sale of such securities by placing orders with broker-dealers; administering the affairs of the Fund (including the books and records of the Fund not maintained by third party service providers such as the custodian or sub-transfer agent); arranging for the insurance coverage for the Fund; and supervising the preparation of tax returns, SEC filings (including registration statements) and reports to shareholders for the Fund. The Board also considered the nature and quality of such services provided under the Agreement in light of the Advisor’s services provided to the Fund for 23 years. The Board discussed the quality of these services with representatives from the Advisor and concluded that the Advisor was performing its services to the Fund required under the Agreement in a reasonable manner. |
| | • | | The Board considered the investment performance of the various Series of the Fund. The investment performance for each Series was reviewed on a cumulative basis since inception and on a one year basis. In addition, annualized performance for the following time periods was considered: inception, three year, five year, ten year, and current market cycle. A market cycle includes periods of both rising and falling markets. Returns for established benchmark indices for each Series were provided for each time period. The Board noted that the various Series were competitive against their respective benchmarks and/or peer groups over various time periods, but in particular over the full market cycle periods relevant for the Series. In addition, the Board considered at the meeting (and considers on a quarterly basis) a peer group performance analysis consisting of Morningstar universes of mutual funds with similar investment objectives. The Board discussed the performance with representatives from the Advisor and concluded that the investment performance of each of the Fund’s Series was reasonable based on the Fund’s actual performance and comparative performance, especially performance over the current market cycle. |
| | • | | The Board considered the costs of the Advisor’s services and the profits of the Advisor as they relate to the Advisor’s services to the Fund under the Agreement. In reviewing the Advisor’s costs and profits, the Board discussed the Advisor’s revenues generated from the Fund (on both an actual and adjusted basis) and its expenses associated with providing the services under the Agreement. In addition, the Board reviewed the Advisor’s expenses associated with Fund activities outside of the Agreement (such as expense reimbursements pursuant to expense caps and payments made by the Advisor to third party platforms on which shares of the Fund are available for purchase). It was noted by representatives of the Advisor that 13 of the 26 active Series of the Fund are currently experiencing expenses above the capped expense ratios. After discussing the above costs and profits, the Board concluded that the Advisor’s profitability relating to its services provided under the Agreement was reasonable. |
Renewal of Investment Advisory Agreement (unaudited)
| | • | | The Board considered the fees and expenses of the various Series of the Fund. The Advisor presented the advisory fees and total expenses for each Series, including the advisory fee adjusted for any expense waivers or reimbursements (either contractual or voluntary) paid by the Advisor. The advisory fees and expense ratios of each Series were compared to an average (on both a mean and median basis) of similar funds as disclosed on the Morningstar database. Representatives of the Advisor discussed with the Board the levels of its advisory fee for each Series of the Fund and as compared to the median and mean advisory fees for similar funds as listed on Morningstar. Expense ratios for every Series, except the Global Fixed Income Series and the Target Series Class R and Class C, are currently below the median and mean for similar funds as listed on Morningstar. Based on their review of the information provided, the Board concluded that the fees and expenses of each Series of the Fund were reasonable on a comparative basis. |
| | • | | The Board also considered the other benefits the Advisor derives from its relationship with the Fund. Such other benefits include certain research products provided by soft dollars. Given the level of soft dollar transactions involving the Fund, the Board concluded that these additional benefits to the Advisor were reasonable. |
| | • | | In addition to the factors described above, the Board considered the Advisor’s personnel, investment strategies, policies and procedures relating to compliance with personal securities transactions, and reputation, expertise and resources in domestic and foreign financial markets. The Board concluded that these factors support the conclusion that the Advisor performs its services in a reasonable manner. |
| | • | | The Board did not consider economies of scale at this time because of the multiple uses of the Fund (for the Advisor’s discretionary investment account clients in addition to direct investors), the current profitability of the Advisor’s services to the Fund under the Agreement, and the overall size of the Fund complex. |
Based on the Board’s deliberations and their evaluation of the information described above, the Board, including a majority of Directors that are not “interested persons” as defined in the Investment Company Act of 1940, concluded that the compensation under the Agreement was fair and reasonable in light of the services and expenses and such other matters as the Directors considered to be relevant in the exercise of their reasonable judgment. Accordingly, the Board approved the renewal of the Agreement. In the course of their deliberations, the Directors did not identify any particular information that was all important or controlling.
Directors’ and Officers’ Information (unaudited)
The Statement of Additional Information provides additional information about the Fund’s directors and officers and can be obtained without charge by calling 1-800-466-3863, at www.manningnapieradvisors.com, or on the EDGAR Database on the SEC Internet web site (http:// www.sec.gov). The following chart shows certain information about the Fund’s officers and directors, including their principal occupations during the last five years. Unless specific dates are provided, the individuals have held the listed positions for longer than five years.
INTERESTED DIRECTOR/OFFICER
| | |
| Name: | | B. Reuben Auspitz* |
| Address: | | 290 Woodcliff Drive |
| | Fairport, NY 14450 |
| Age: | | 62 |
| Current Position(s) Held with Fund: | | Principal Executive Officer, President, Chairman & Director |
| Term of Office1 & Length of Time Served: | | Indefinite - Director since 1984; Vice President 1984 - 2003; President since 2004; Principal Executive Officer since 2002 |
| Principal Occupation(s) During Past 5 Years: | | Executive Vice President; Co-Executive Director; Executive Group Member**; Chief Compliance Officer since 2004 - Manning & Napier Advisors, Inc. President; Director - Manning & Napier Investor Services, Inc. Holds or has held one or more of the following titles for various subsidiaries and affiliates: President, Vice President, Director, Chairman, Treasurer, Chief Compliance Officer or Member. |
| Number of Portfolios Overseen within Fund Complex: | | 29 |
| Other Directorships Held Outside Fund Complex: | | N/A |
| |
| INDEPENDENT DIRECTORS | | |
| |
| Name: | | Stephen B. Ashley |
| Address: | | 290 Woodcliff Drive |
| | Fairport, NY 14450 |
| Age: | | 69 |
| Current Position(s) Held with Fund: | | Director, Audit Committee Member, Governance & Nominating Committee Member |
| Term of Office & Length of Time Served: | | Indefinite - Since 1996 |
| Principal Occupation(s) During Past 5 Years: | | Chairman, Director, President & Chief Executive Officer, The Ashley Group (property management and investment). Chairman (non-executive) 2004 - 2008; Director 1995 - 2008 - Fannie Mae (mortgage) |
| Number of Portfolios Overseen within Fund Complex: | | 29 |
| Other Directorships Held Outside Fund Complex: | | The Ashley Group |
| Name: | | Peter L. Faber |
| Address: | | 290 Woodcliff Drive |
| | Fairport, NY 14450 |
| Age: | | 71 |
| Current Position(s) Held with Fund: | | Director, Governance & Nominating Committee Member |
| Term of Office & Length of Time Served: | | Indefinite - Since 1987 |
| Principal Occupation(s) During Past 5 Years: | | Senior Counsel since 2006, Partner (1995-2006) - McDermott, Will & Emery LLP (law firm) |
| Number of Portfolios Overseen within Fund Complex: | | 29 |
| Other Directorships Held Outside Fund Complex: | | Partnership for New York City, Inc. (non-profit) New York Collegium (non-profit) Boston Early Music Festival (non-profit) Amherst Early Music, Inc. (non-profit) Gotham Early Music Scene, Inc. (non-profit) |
Directors’ and Officers’ Information (unaudited)
INDEPENDENT DIRECTORS (continued)
| | |
| Name: | | Harris H. Rusitzky |
| Address: | | 290 Woodcliff Drive |
| | Fairport, NY 14450 |
| Age: | | 75 |
| Current Position(s) Held with Fund: | | Director, Audit Committee Member, Governance & Nominating Committee Member |
| Term of Office & Length of Time Served: | | Indefinite - Since 1985 |
| Principal Occupation(s) During Past 5 Years: | | President, The Greening Group (business consultants) since 1994; Partner, The Restaurant Group (restaurants) since 2006 |
| Number of Portfolios Overseen within Fund Complex: | | 29 |
| Other Directorships Held Outside Fund Complex: | | N/A |
| Name: | | Paul A. Brooke |
| Address: | | 290 Woodcliff Drive |
| | Fairport, NY 14450 |
| Age: | | 64 |
| Current Position(s) Held with Fund: | | Director, Audit Committee Member, Governance & Nominating Committee Member |
| Term of Office & Length of Time Served: | | Indefinite - Since 2007 |
| Principal Occupation(s) During Past 5 Years: | | Chairman & CEO, Alsius Corp. (investments); Managing Member, PMSV Holdings LLC (investments) |
| Number of Portfolios Overseen within Fund Complex: | | 29 |
| Other Directorships Held Outside Fund Complex: | | Incyte Corp. ViroPharma, Inc. WebMD Cheyne Capital International MPM Bio-equities GMP Companies HoustonPharma |
| Name: | | Richard M. Hurwitz |
| Address: | | 290 Woodcliff Drive |
| | Fairport, NY 14450 |
| Age: | | 46 |
| Current Position(s) Held with Fund: | | Director, Audit Committee Member, Governance & Nominating |
| | Committee Member |
| Term of Office & Length of Time Served: | | Indefinite - Since 2009 |
| Principal Occupation(s) During Past 5 Years: | | Managing Partner, Aegis Investment Partners, LLC (investments) since 2006; Founder and Managing Partner (2004-2005) - Village Markets, LLC (groceries) |
| Number of Portfolios Overseen within Fund Complex: | | 29 |
| Other Directorships Held Outside Fund Complex: | | Pictometry International Corp. |
Directors’ and Officers’ Information (unaudited)
| | |
OFFICERS |
| Name: | | Jeffrey S. Coons, Ph.D., CFA |
| Address: | | 290 Woodcliff Drive |
| | Fairport, NY 14450 |
| Age: | | 46 |
| Current Position(s) Held with Fund: | | Vice President |
| Term of Office1 & Length of Time Served: | | Since 2004 |
| Principal Occupation(s) During Past 5 Years: | | Co-Director of Research since 2002 & Executive Group Member** since 2003, Manning & Napier Advisors, Inc. Holds one or more of the following titles for various subsidiaries and affiliates: President, Director, Treasurer or Senior Trust Officer. |
| Number of Portfolios Overseen within Fund Complex: | | 29 |
| Other Directorships Held Outside Fund Complex: | | N/A |
| Name: | | Christine Glavin |
| Address: | | 290 Woodcliff Drive |
| | Fairport, NY 14450 |
| Age: | | 43 |
| Current Position(s) Held with Fund: | | Principal Financial Officer, Chief Financial Officer |
| Term of Office1 & Length of Time Served: | | Principal Financial Officer since 2002; Chief Financial Officer since 2001 |
| Principal Occupation(s) During Past 5 Years: | | Fund Reporting Manager, Manning & Napier Advisors, Inc. since 1997 |
| Number of Portfolios Overseen within Fund Complex: | | 29 |
| Other Directorships Held Outside Fund Complex: | | N/A |
| Name: | | Jodi L. Hedberg |
| Address: | | 290 Woodcliff Drive |
| | Fairport, NY 14450 |
| Age: | | 42 |
| Current Position(s) Held with Fund: | | Corporate Secretary, Chief Compliance Officer, Anti-Money Laundering Compliance Officer |
| Term of Office1 & Length of Time Served: | | Corporate Secretary since 1997; Chief Compliance Officer since 2004 |
| Principal Occupation(s) During Past 5 Years: | | Director of Compliance, Manning & Napier Advisors, Inc. and affiliates since 1990 (title change in 2005 from Compliance Manager to Director of Compliance); Corporate Secretary, Manning & Napier Investor Services, Inc. since 2006 |
| Number of Portfolios Overseen within Fund Complex: | | 29 |
| Other Directorships Held Outside Fund Complex: | | N/A |
*Interested Director, within the meaning of the Investment Company Act of 1940 by reason of his position with the Fund’s investment advisor and distributor. Mr. Auspitz serves as the Executive Vice President and Director, Manning & Napier Advisors, Inc. and President and Director, Manning & Napier Investor Services, Inc., the Fund’s distributor.
**The Executive Group performs the duties of the Office of the Chief Executive of Manning & Napier Advisors, Inc.
1The term of office for President, Vice President, Chief Financial Officer, and Corporate Secretary is one year and until their respective successors are chosen and qualified. All other officers’ terms are indefinite.
Literature Requests (unaudited)
Proxy Voting Policies and Procedures
A description of the policies and procedures that the Fund uses to determine how to vote proxies relating to portfolio securities is available, without charge, upon request:
| | |
By phone | | 1-800-466-3863 |
On the Securities and Exchange Commission’s (SEC) web site | | http://www.sec.gov |
Proxy Voting Record
Information regarding how the Fund voted proxies relating to portfolio securities during the most recent 12-month period ended June 30th is available, without charge, upon request:
| | |
By phone | | 1-800-466-3863 |
On the SEC’s web site | | http://www.sec.gov |
Quarterly Portfolio Holdings
The Series’ complete schedule of portfolio holdings for the 1st and 3rd quarters of each fiscal year are provided on Form N-Q, and are available, without charge, upon request:
| | |
By phone | | 1-800-466-3863 |
On the SEC’s web site | | http://www.sec.gov |
The Series’ Form N-Q may be reviewed and copied at the SEC’s Public Reference Room in Washington, D.C. Information on the operation of the Public Reference Room may be obtained by calling 1-800-SEC-0330.
Prospectus and Statement of Additional Information (SAI)
The prospectus and SAI provide additional information about each Series, including charges, expenses and risks. These documents are available, without charge, upon request:
| | |
By phone | | 1-800-466-3863 |
On the SEC’s web site | | http://www.sec.gov |
On the Advisor’s web site | | http://www.manningnapieradvisors.com |
Additional information available at www.manningnapieradvisors.com
1. Fund Holdings - Month-End
2. Fund Holdings - Quarter-End
3. Shareholder Report - Annual
4. Shareholder Report - Semi-Annual
(a) The registrant has adopted a code of ethics that applies to its principal executive officer, principal financial officer and principal accounting officer. A copy of the registrant’s code of ethics is filed herewith as Exhibit 12(a)(1).
(b) During the period covered by this report, no amendments were made to the provisions of the code of ethics adopted in 2 (a) above.
(c) During the period covered by this report, no implicit or explicit waivers to the provisions of the code of ethics adopted in 2 (a) above were granted.
(d) Not applicable to the registrant due to the response given in 2 (c) above.
| ITEM 3: | AUDIT COMMITTEE FINANCIAL EXPERT |
All of the members of the Audit committee have been determined by the Registrant’s Board of Directors to be Audit Committee Financial Experts as defined in this item. The members of the Audit Committee are: Harris H. Rusitzky, Stephen B. Ashley, Paul A. Brooke and Richard M. Hurwitz. All Audit Committee members are independent under applicable rules. This designation will not increase the designee’s duties, obligations or liability as compared to their duties, obligations and liability as a member of the Audit Committee and of the Board.
| ITEM 4: | PRINCIPAL ACCOUNTANT FEES AND SERVICES. |
Principal Accountant Fees and Services
Aggregate fees for professional services rendered for the Manning & Napier Fund, Inc. (Life Sciences Series, Small Cap Series, Technology Series, Financial Services Series, Real Estate Series, International Series, World Opportunities Series, Ohio Tax Exempt Series, Diversified Tax Exempt Series, New York Tax Exempt Series, Core Bond Series, Core Plus Bond Series, and High Yield Bond Series, collectively the “Fund”) by PricewaterhouseCoopers LLP (“PwC”) as of and for the years ended December 31, 2009 and 2008 were:
| | | | | | |
| | | 2009 | | 2008 |
Audit Fees (a) | | $ | 326,451 | | $ | 286,101 |
Audit Related Fees (b) | | | 13,392 | | | — |
Tax Fees (c) | | | 87,780 | | | 71,830 |
All Other Fees (d) | | | — | | | — |
| | | | | | |
| | $ | 427,623 | | $ | 357,931 |
| | | | | | |
(a) Audit Fees
These fees relate to professional services rendered by PwC for the audit of the Fund’s annual financial statements or services normally provided by the accountant in connection with statutory and regulatory filing or engagements. These services include the audits of the financial statements of the Fund, issuance of consents, income tax provision procedures and assistance with review of documents filed with the SEC.
(b) Audit-Related Fees
These fees relate to assurance and related services by PwC that are reasonably related to the performance of the audit of the Fund’s financial statements and are not reported under “Audit Fees” above. These fees relate to professional services provided by PwC in connection with service provider conversion.
(c) Tax Fees
These fees relate to professional services rendered by PwC for tax compliance, tax advice and tax planning. The tax services provided by PwC related to the preparation of the Fund’s federal and state income tax returns, excise tax calculations and returns, a review of the Fund’s calculations of capital gain and income distributions, and additional tax research for compliance purposes.
(d) All Other Fees
These fees relate to products and services provided by PwC other than those reported above under “Audit Fees,” “Audit-Related Fees,” and “Tax Fees” above.
There were no amounts that were approved by the Audit Committee pursuant to the de minimus exception (Rule 2-01(c)(7) of Regulation S-X) for the fiscal years ended December 31, 2009 and 2008.
Non-Audit Services to the Fund’s Service Affiliates that were Pre-Approved by the Fund’s Audit Committee
The Fund’s Audit Committee is required to pre-approve non-audit services which meet both the following criteria:
| i) | Directly relate to the Fund’s operations and financial reporting; and |
| ii) | Rendered by PwC to the Fund’s advisor, Manning & Napier Advisors, Inc., and entities in a control relationship with the advisor (“service affiliate”) that provide ongoing services to the Fund. For purposes of disclosure, Manning & Napier Investor Services, Inc. is considered to be a service affiliate. |
| | | | | | |
| | | 2009 | | 2008 |
Audit Related Fees | | $ | 8,420 | | $ | 9,392 |
Tax Fees | | | 1,950 | | | 5,000 |
| | | | | | |
| | $ | 10,370 | | $ | 14,392 |
| | | | | | |
The Audit Related fees for the years ended December 31, 2009 and 2008 were for 17Ad-13 internal control examinations, a license for proprietary automated financial statement disclosure software (2008 only) and a license for proprietary authoritative financial reporting and assurance literature library software.
The Tax fees for the years ended December 31, 2009 and 2008 relate to research on the tax implications for various funds holding certain investment types.
There were no amounts that were approved by the Audit Committee pursuant to the de minimus exception (Rule 2-01(c)(7) of Regulation S-X) for the fiscal years ended December 31, 2009 and 2008.
Aggregate Fees
Aggregate fees billed to the Fund for non-audit services for 2009 and 2008 were $87,780 and $71,830, respectively. Aggregate fees billed to the Fund’s advisor and service affiliates for non-audit services were $10,370 and $14,392, respectively. These amounts include fees for non-audit services required to be pre-approved and fees for non-audit services that did not require pre-approval since they did not relate to the Fund’s operations and financial reporting.
The Fund’s Audit Committee has considered whether the provisions for non-audit services to the Fund’s advisor and service affiliates, which did not require pre-approval, are compatible with maintaining PwC’s independence.
| ITEM 5: | AUDIT COMMITTEE OF LISTED REGISTRANTS. |
Not applicable.
| (a) | See Investment Portfolios under Item 1 on this Form N-CSR. |
| ITEM 7: | DISCLOSURE OF PROXY VOTING POLICIES AND PROCEDURES FOR CLOSED- END MANAGEMENT INVESTMENT COMPANIES. |
Not applicable.
| ITEM 8: | PORTFOLIO MANAGERS OF CLOSED-END MANAGEMENT INVESTMENT COMPANIES. |
Not applicable.
| ITEM 9: | PURCHASES OF EQUITY SECURITIES BY CLOSED-END MANAGEMENT INVESTMENT COMPANY AND AFFILIATED PURCHASERS. |
Not applicable.
| ITEM 10: | SUBMISSION OF MATTERS TO A VOTE OF SECURITY HOLDERS. |
There have been no material changes to the procedure by which shareholders may recommend nominees to the registrant’s board of directors.
| ITEM 11: | CONTROLS AND PROCEDURES. |
(a) Based on their evaluation of the Funds’ disclosure controls and procedures, as of a date within 90 days of the filing date, the Funds’ Principal Executive Officer and Principal Financial Officer have concluded that the Funds’ disclosure controls and procedures are: (i) reasonably designed to ensure that information required to be disclosed in this report is appropriately communicated to the Funds’ officers to allow timely decisions regarding disclosures required in this report; (ii) reasonably designed to ensure that information required to be disclosed in this report is recorded, processed, summarized and reported in a timely manner; and (iii) are effective in achieving the goals described in (i) and (ii) above.
(b) During the second fiscal quarter of the period covered by this report, there have been no changes in the Funds’ internal control over financial reporting that the above officers believe to have materially affected, or to be reasonably likely to materially affect, the Funds’ internal control over financial reporting.
| | |
| |
| (a)(1) | | Code of ethics that is subject to the disclosure of Item 2 above. |
| |
| (a)(2) | | Separate certifications for the Registrant’s principal executive officer and principal financial officer, as required by Section 302 of the Sarbanes-Oxley Act of 2002 and Rule 30a-2(a) under the Investment Company Act of 1940, are attached as EX-99.CERT. |
| |
| (a)(3) | | Not applicable. |
| |
| (b) | | A certification of the Registrant’s principal executive officer and principal financial officer, as required by 18 U.S.C Section 1350, as adopted pursuant to Section 906 of the Sarbanes-Oxley Act of 2002, and Rule 30a-2(b) under the Investment Company Act of 1940, is attached as EX- 99.906CERT. The certification furnished pursuant to this paragraph is not deemed to be “filed” for purposes of Section 18 of the Securities Exchange Act of 1934, or otherwise subject to the liability of that section. Such certification is not deemed to be incorporated by reference into any filing under the Securities Act of 1933 or the Securities Exchange Act of 1934, except to the extent that the Registrant specifically incorporates them by reference. |
SIGNATURES
Pursuant to the requirements of the Securities Exchange Act of 1934 and the Investment Company Act of 1940, the registrant has duly caused this report to be signed on its behalf by the undersigned, thereunto duly authorized.
Manning & Napier Fund, Inc.
|
|
| /s/ B. Reuben Auspitz |
| B. Reuben Auspitz |
President & Principal Executive Officer of Manning & Napier Fund, Inc. |
March 1, 2010
Pursuant to the requirements of the Securities Exchange Act of 1934 and the Investment Company Act of 1940, this report has been signed below by the following persons on behalf of the registrant and in the capacities and on the dates indicated.
|
|
| /s/ B. Reuben Auspitz |
| B. Reuben Auspitz |
President & Principal Executive Officer of Manning & Napier Fund, Inc. |
March 1, 2010
|
|
| /s/ Christine Glavin |
| Christine Glavin |
| Chief Financial Officer & Principal Financial Officer of Manning & Napier Fund, Inc. |
March 1, 2010